Granbury, TX Map & Demographics
Granbury Map
Granbury Overview
$45,255
PER CAPITA INCOME
$95,592
AVG FAMILY INCOME
$65,015
AVG HOUSEHOLD INCOME
54.4%
WAGE / INCOME GAP [ % ]
45.6¢/ $1
WAGE / INCOME GAP [ $ ]
$8,486
FAMILY INCOME DEFICIT
0.50
INEQUALITY / GINI INDEX
11,218
TOTAL POPULATION
5,054
MALE POPULATION
6,164
FEMALE POPULATION
81.99
MALES / 100 FEMALES
121.96
FEMALES / 100 MALES
52.0
MEDIAN AGE
2.5
AVG FAMILY SIZE
2.0
AVG HOUSEHOLD SIZE
4,766
LABOR FORCE [ PEOPLE ]
49.0%
PERCENT IN LABOR FORCE
3.4%
UNEMPLOYMENT RATE
Income in Granbury
Income Overview in Granbury
Per Capita Income in Granbury is $45,255, while median incomes of families and households are $95,592 and $65,015 respectively.
| Characteristic | Number | Measure |
| Per Capita Income | 11,218 | $45,255 |
| Median Family Income | 3,179 | $95,592 |
| Mean Family Income | 3,179 | $126,025 |
| Median Household Income | 5,165 | $65,015 |
| Mean Household Income | 5,165 | $96,807 |
| Income Deficit | 3,179 | $8,486 |
| Wage / Income Gap (%) | 11,218 | 54.44% |
| Wage / Income Gap ($) | 11,218 | 45.56¢ per $1 |
| Gini / Inequality Index | 11,218 | 0.50 |
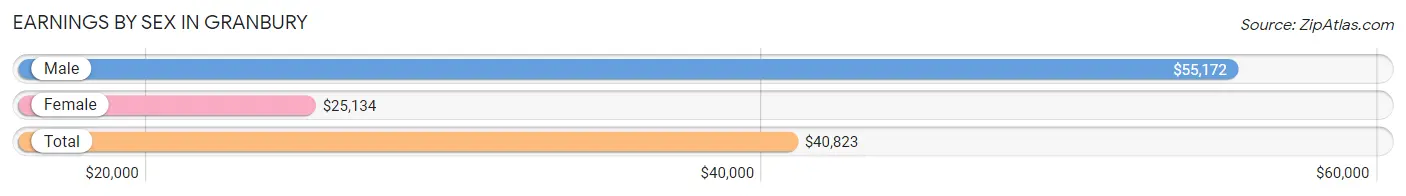
Earnings by Sex in Granbury
Average Earnings in Granbury are $40,823, $55,172 for men and $25,134 for women, a difference of 54.4%.
| Sex | Number | Average Earnings |
| Male | 2,595 (51.9%) | $55,172 |
| Female | 2,407 (48.1%) | $25,134 |
| Total | 5,002 (100.0%) | $40,823 |
Earnings by Sex by Income Bracket in Granbury
The most common earnings brackets in Granbury are $100,000+ for men (665 | 25.6%) and $100,000+ for women (308 | 12.8%).
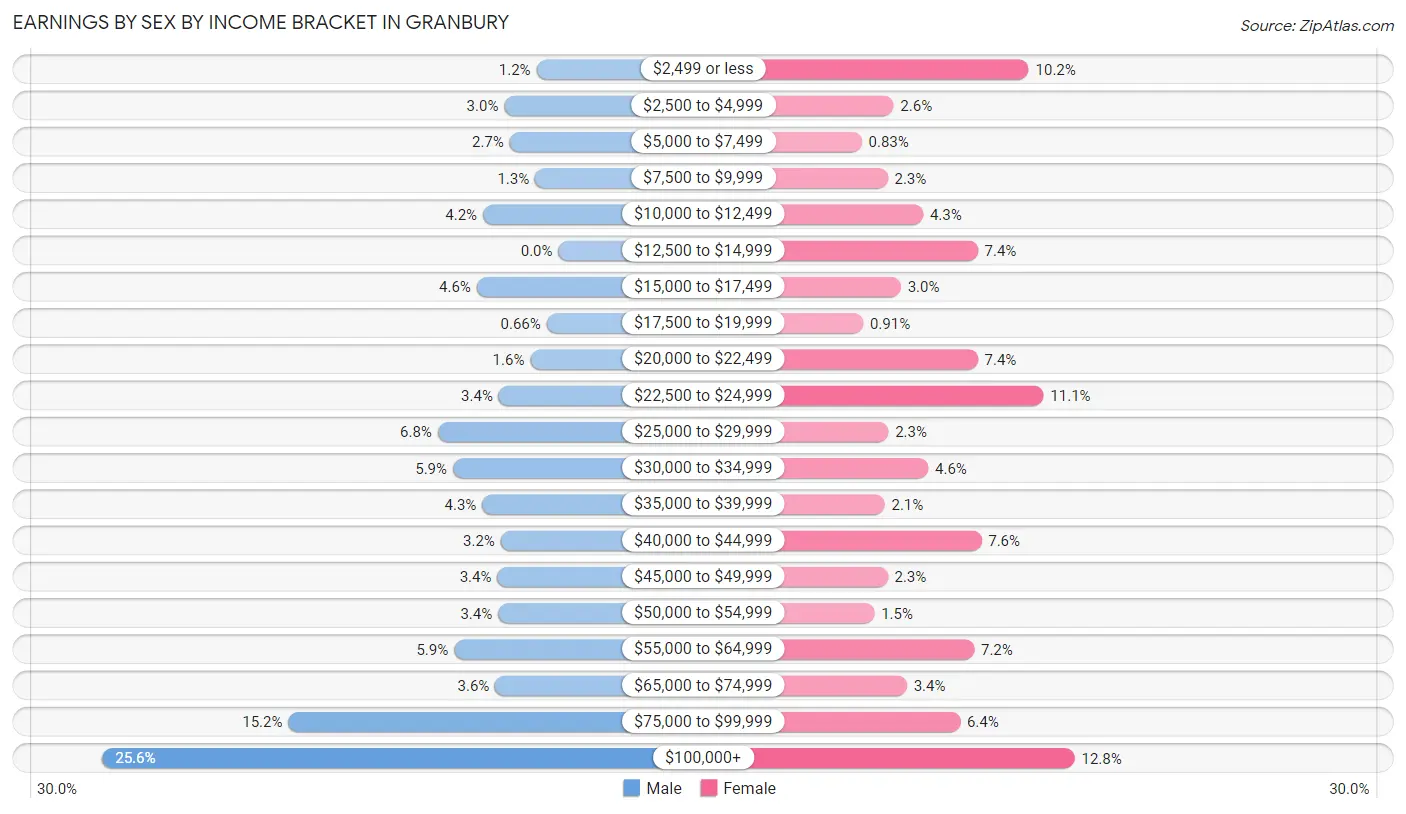
| Income | Male | Female |
| $2,499 or less | 32 (1.2%) | 246 (10.2%) |
| $2,500 to $4,999 | 79 (3.0%) | 63 (2.6%) |
| $5,000 to $7,499 | 71 (2.7%) | 20 (0.8%) |
| $7,500 to $9,999 | 34 (1.3%) | 55 (2.3%) |
| $10,000 to $12,499 | 110 (4.2%) | 103 (4.3%) |
| $12,500 to $14,999 | 0 (0.0%) | 177 (7.3%) |
| $15,000 to $17,499 | 119 (4.6%) | 73 (3.0%) |
| $17,500 to $19,999 | 17 (0.7%) | 22 (0.9%) |
| $20,000 to $22,499 | 41 (1.6%) | 177 (7.3%) |
| $22,500 to $24,999 | 87 (3.4%) | 266 (11.1%) |
| $25,000 to $29,999 | 176 (6.8%) | 56 (2.3%) |
| $30,000 to $34,999 | 154 (5.9%) | 110 (4.6%) |
| $35,000 to $39,999 | 111 (4.3%) | 51 (2.1%) |
| $40,000 to $44,999 | 84 (3.2%) | 182 (7.6%) |
| $45,000 to $49,999 | 89 (3.4%) | 55 (2.3%) |
| $50,000 to $54,999 | 88 (3.4%) | 37 (1.5%) |
| $55,000 to $64,999 | 152 (5.9%) | 172 (7.1%) |
| $65,000 to $74,999 | 92 (3.5%) | 81 (3.4%) |
| $75,000 to $99,999 | 394 (15.2%) | 153 (6.4%) |
| $100,000+ | 665 (25.6%) | 308 (12.8%) |
| Total | 2,595 (100.0%) | 2,407 (100.0%) |
Earnings by Sex by Educational Attainment in Granbury
Average earnings in Granbury are $59,745 for men and $37,143 for women, a difference of 37.8%. Men with an educational attainment of bachelor's degree enjoy the highest average annual earnings of $142,864, while those with less than high school education earn the least with $24,325. Women with an educational attainment of graduate degree earn the most with the average annual earnings of $89,063, while those with high school diploma education have the smallest earnings of $14,561.
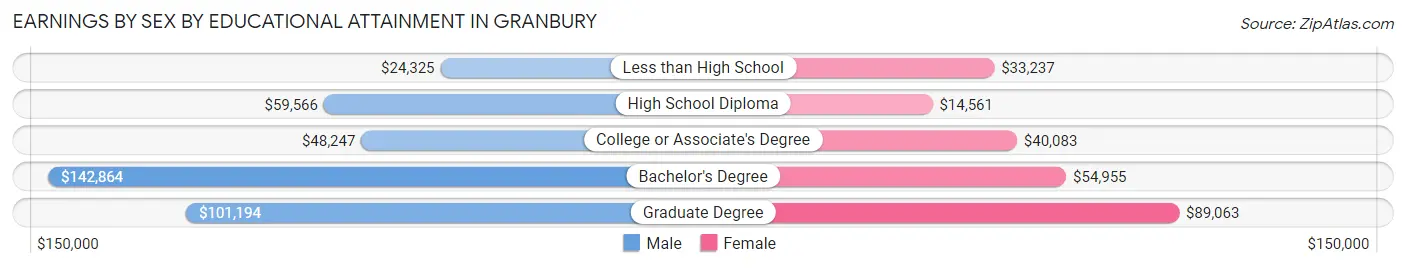
| Educational Attainment | Male Income | Female Income |
| Less than High School | $24,325 | $33,237 |
| High School Diploma | $59,566 | $14,561 |
| College or Associate's Degree | $48,247 | $40,083 |
| Bachelor's Degree | $142,864 | $54,955 |
| Graduate Degree | $101,194 | $89,063 |
| Total | $59,745 | $37,143 |
Family Income in Granbury
Family Income Brackets in Granbury
According to the Granbury family income data, there are 836 families falling into the $100,000 to $149,999 income range, which is the most common income bracket and makes up 26.3% of all families. Conversely, the less than $10,000 income bracket is the least frequent group with only 32 families (1.0%) belonging to this category.
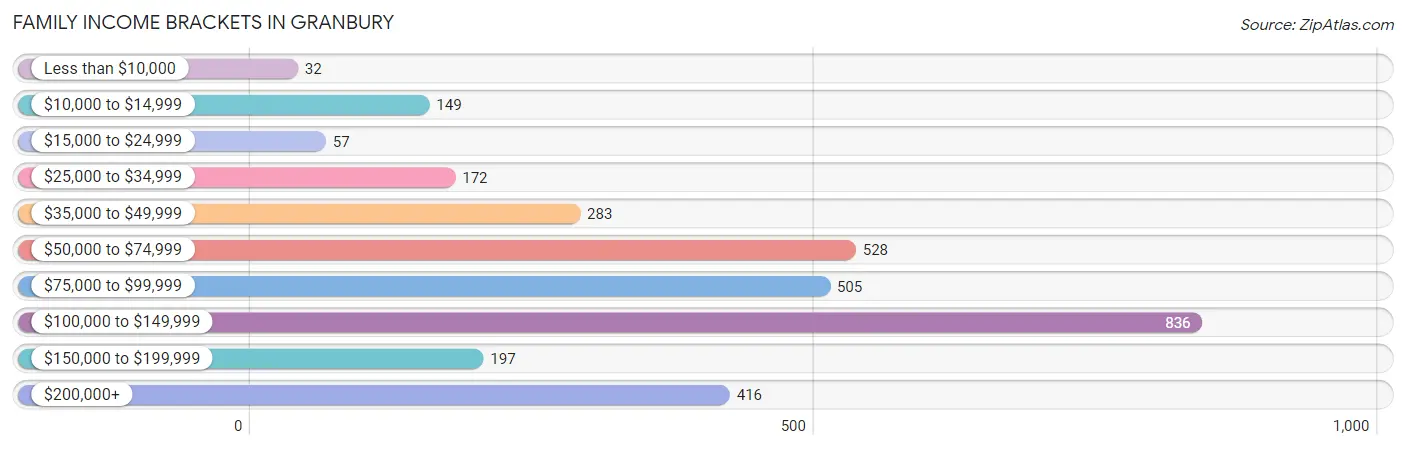
| Income Bracket | # Families | % Families |
| Less than $10,000 | 32 | 1.0% |
| $10,000 to $14,999 | 149 | 4.7% |
| $15,000 to $24,999 | 57 | 1.8% |
| $25,000 to $34,999 | 172 | 5.4% |
| $35,000 to $49,999 | 283 | 8.9% |
| $50,000 to $74,999 | 528 | 16.6% |
| $75,000 to $99,999 | 505 | 15.9% |
| $100,000 to $149,999 | 836 | 26.3% |
| $150,000 to $199,999 | 197 | 6.2% |
| $200,000+ | 416 | 13.1% |
Family Income by Famaliy Size in Granbury
5-person families (77 | 2.4%) account for the highest median family income in Granbury with $128,267 per family, while 2-person families (2,134 | 67.1%) have the highest median income of $42,188 per family member.
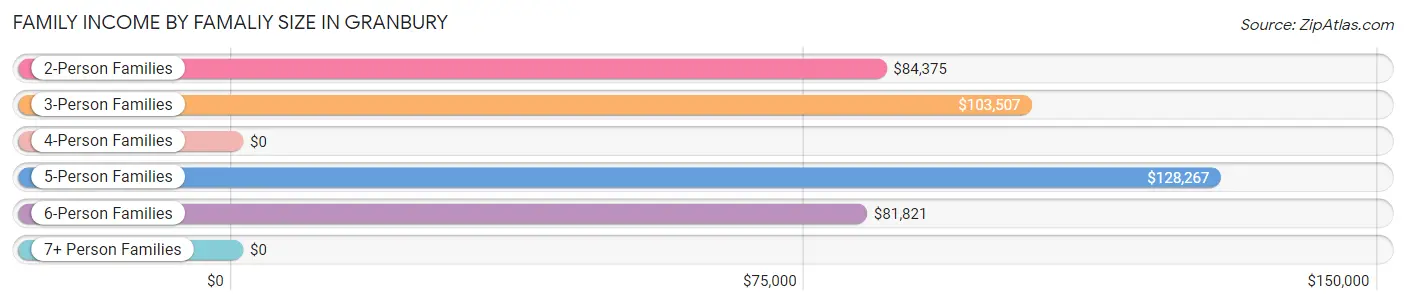
| Income Bracket | # Families | Median Income |
| 2-Person Families | 2,134 (67.1%) | $84,375 |
| 3-Person Families | 708 (22.3%) | $103,507 |
| 4-Person Families | 209 (6.6%) | $0 |
| 5-Person Families | 77 (2.4%) | $128,267 |
| 6-Person Families | 51 (1.6%) | $81,821 |
| 7+ Person Families | 0 (0.0%) | $0 |
| Total | 3,179 (100.0%) | $95,592 |
Family Income by Number of Earners in Granbury
The median family income in Granbury is $95,592, with families comprising 3+ earners (103) having the highest median family income of $172,656, while families with 1 earner (1,200) have the lowest median family income of $72,500, accounting for 3.2% and 37.8% of families, respectively.
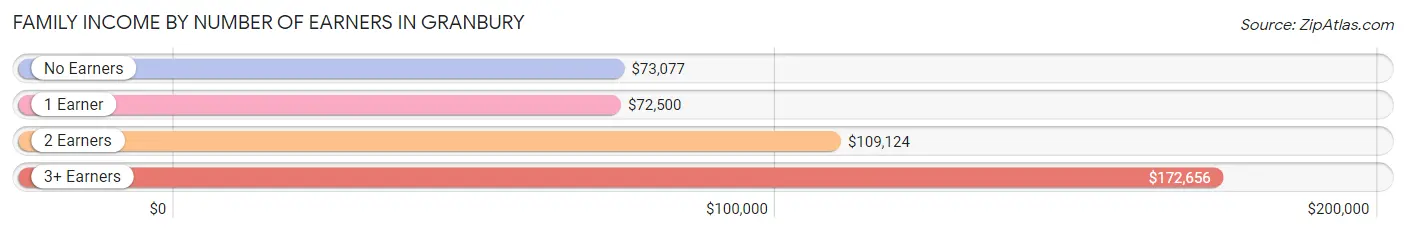
| Number of Earners | # Families | Median Income |
| No Earners | 840 (26.4%) | $73,077 |
| 1 Earner | 1,200 (37.8%) | $72,500 |
| 2 Earners | 1,036 (32.6%) | $109,124 |
| 3+ Earners | 103 (3.2%) | $172,656 |
| Total | 3,179 (100.0%) | $95,592 |
Household Income in Granbury
Household Income Brackets in Granbury
With 1,002 households falling in the category, the $100,000 to $149,999 income range is the most frequent in Granbury, accounting for 19.4% of all households. In contrast, only 83 households (1.6%) fall into the less than $10,000 income bracket, making it the least populous group.
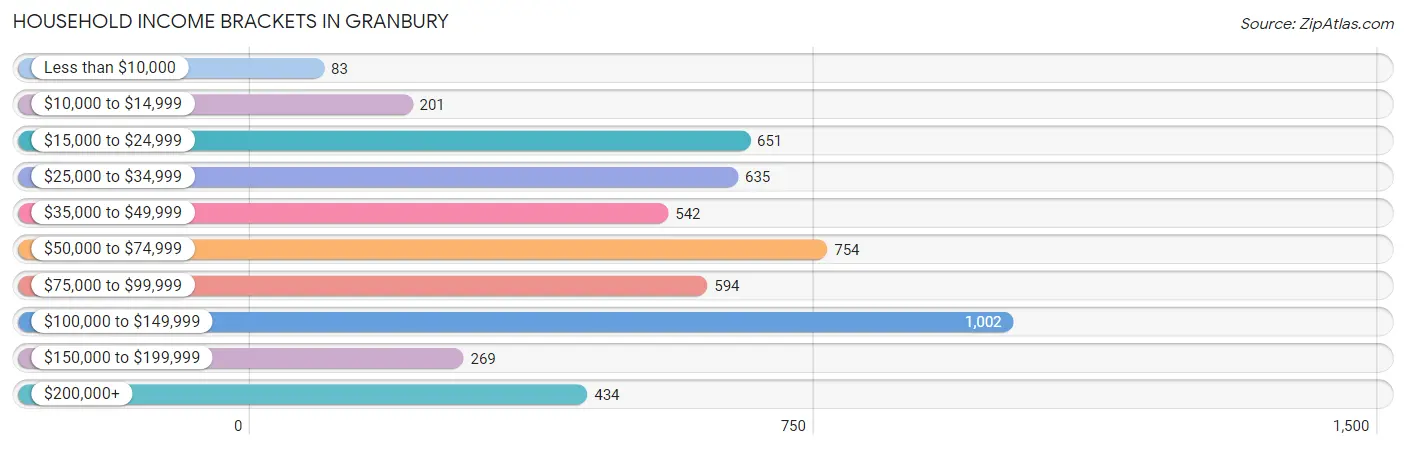
| Income Bracket | # Households | % Households |
| Less than $10,000 | 83 | 1.6% |
| $10,000 to $14,999 | 201 | 3.9% |
| $15,000 to $24,999 | 651 | 12.6% |
| $25,000 to $34,999 | 635 | 12.3% |
| $35,000 to $49,999 | 542 | 10.5% |
| $50,000 to $74,999 | 754 | 14.6% |
| $75,000 to $99,999 | 594 | 11.5% |
| $100,000 to $149,999 | 1,002 | 19.4% |
| $150,000 to $199,999 | 269 | 5.2% |
| $200,000+ | 434 | 8.4% |
Household Income by Householder Age in Granbury
The median household income in Granbury is $65,015, with the highest median household income of $105,208 found in the 25 to 44 years age bracket for the primary householder. A total of 1,125 households (21.8%) fall into this category. Meanwhile, the 15 to 24 years age bracket for the primary householder has the lowest median household income of $33,917, with 293 households (5.7%) in this group.
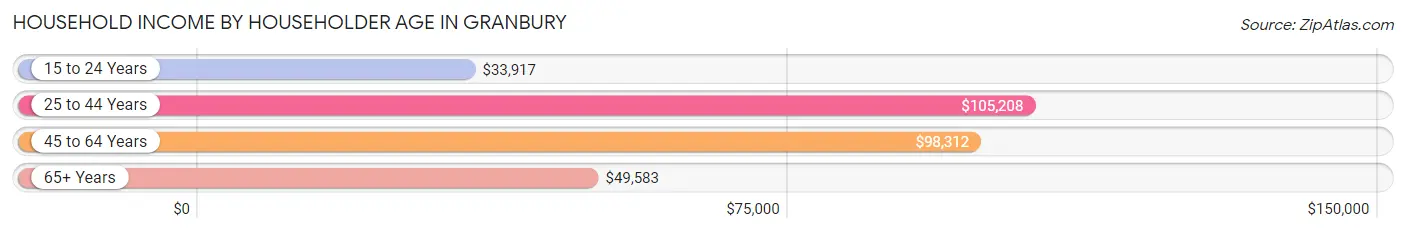
| Income Bracket | # Households | Median Income |
| 15 to 24 Years | 293 (5.7%) | $33,917 |
| 25 to 44 Years | 1,125 (21.8%) | $105,208 |
| 45 to 64 Years | 1,501 (29.1%) | $98,312 |
| 65+ Years | 2,246 (43.5%) | $49,583 |
| Total | 5,165 (100.0%) | $65,015 |
Poverty in Granbury
Income Below Poverty by Sex and Age in Granbury
With 11.1% poverty level for males and 11.1% for females among the residents of Granbury, 12 to 14 year old males and 18 to 24 year old females are the most vulnerable to poverty, with 17 males (42.5%) and 182 females (43.9%) in their respective age groups living below the poverty level.
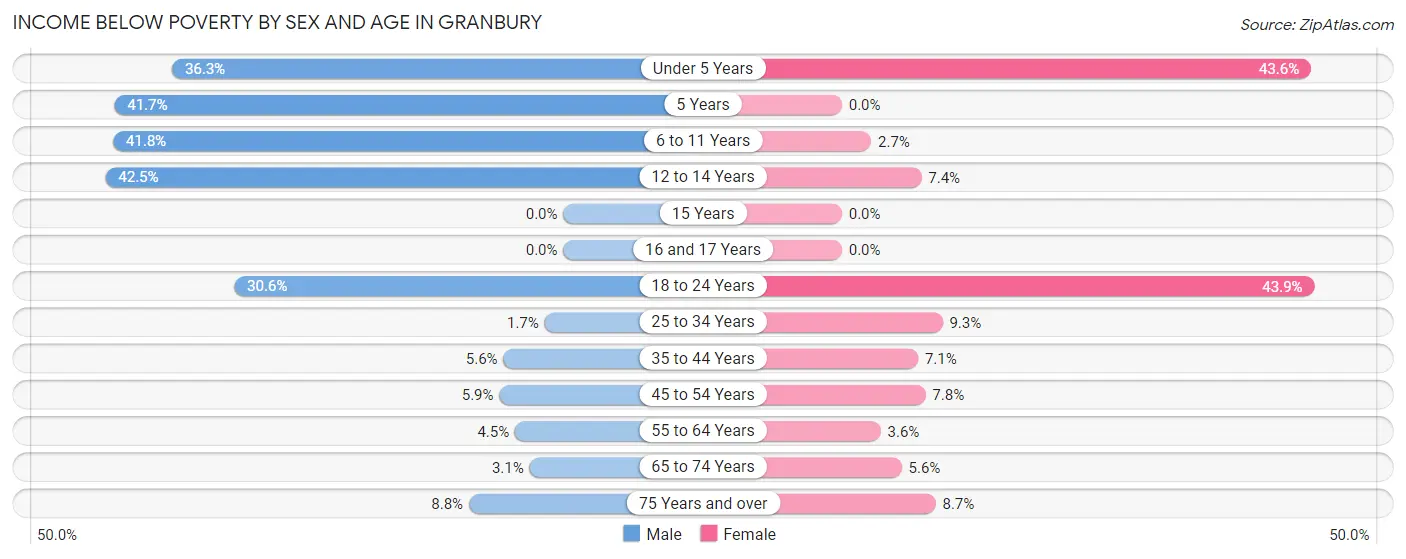
| Age Bracket | Male | Female |
| Under 5 Years | 154 (36.3%) | 135 (43.5%) |
| 5 Years | 10 (41.7%) | 0 (0.0%) |
| 6 to 11 Years | 51 (41.8%) | 8 (2.7%) |
| 12 to 14 Years | 17 (42.5%) | 9 (7.4%) |
| 15 Years | 0 (0.0%) | 0 (0.0%) |
| 16 and 17 Years | 0 (0.0%) | 0 (0.0%) |
| 18 to 24 Years | 110 (30.6%) | 182 (43.9%) |
| 25 to 34 Years | 16 (1.7%) | 76 (9.3%) |
| 35 to 44 Years | 12 (5.6%) | 27 (7.1%) |
| 45 to 54 Years | 25 (5.9%) | 42 (7.8%) |
| 55 to 64 Years | 26 (4.5%) | 31 (3.6%) |
| 65 to 74 Years | 20 (3.1%) | 47 (5.6%) |
| 75 Years and over | 66 (8.8%) | 88 (8.7%) |
| Total | 507 (11.1%) | 645 (11.1%) |
Income Above Poverty by Sex and Age in Granbury
According to the poverty statistics in Granbury, males aged 15 years and females aged 5 years are the age groups that are most secure financially, with 100.0% of males and 100.0% of females in these age groups living above the poverty line.
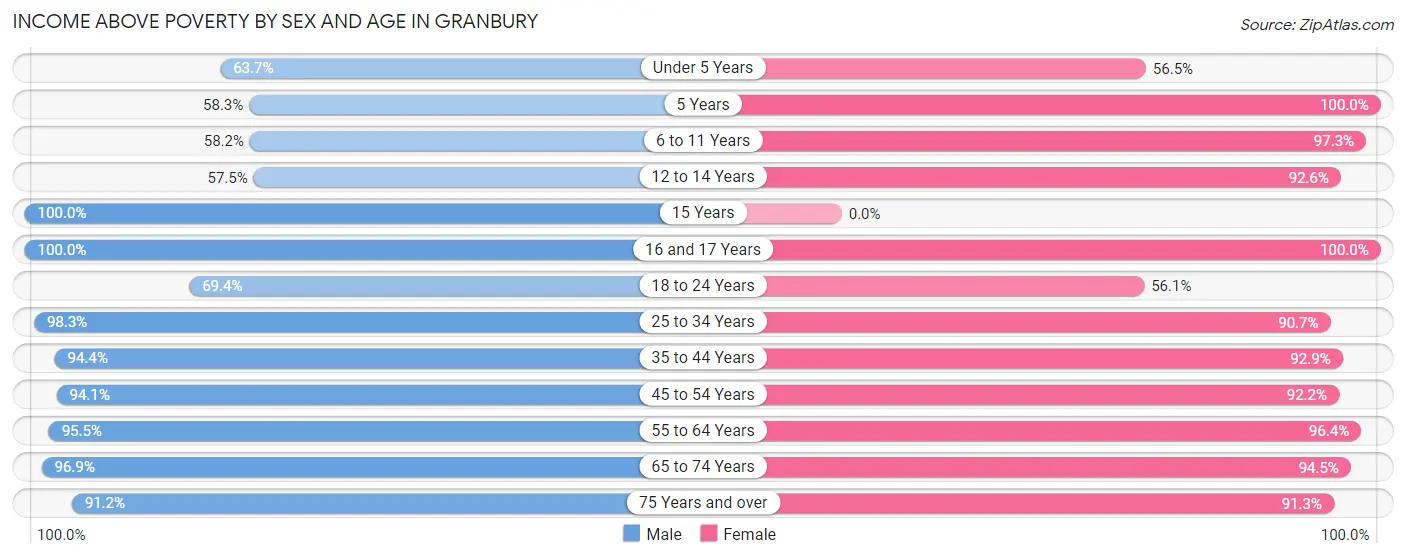
| Age Bracket | Male | Female |
| Under 5 Years | 270 (63.7%) | 175 (56.5%) |
| 5 Years | 14 (58.3%) | 53 (100.0%) |
| 6 to 11 Years | 71 (58.2%) | 286 (97.3%) |
| 12 to 14 Years | 23 (57.5%) | 113 (92.6%) |
| 15 Years | 79 (100.0%) | 0 (0.0%) |
| 16 and 17 Years | 11 (100.0%) | 187 (100.0%) |
| 18 to 24 Years | 250 (69.4%) | 233 (56.1%) |
| 25 to 34 Years | 906 (98.3%) | 738 (90.7%) |
| 35 to 44 Years | 204 (94.4%) | 355 (92.9%) |
| 45 to 54 Years | 396 (94.1%) | 499 (92.2%) |
| 55 to 64 Years | 555 (95.5%) | 830 (96.4%) |
| 65 to 74 Years | 617 (96.9%) | 800 (94.5%) |
| 75 Years and over | 687 (91.2%) | 923 (91.3%) |
| Total | 4,083 (88.9%) | 5,192 (88.9%) |
Income Below Poverty Among Married-Couple Families in Granbury
The poverty statistics for married-couple families in Granbury show that 4.1% or 107 of the total 2,615 families live below the poverty line. Families with 3 or 4 children have the highest poverty rate of 8.6%, comprising of 9 families. On the other hand, families with no children have the lowest poverty rate of 3.7%, which includes 71 families.
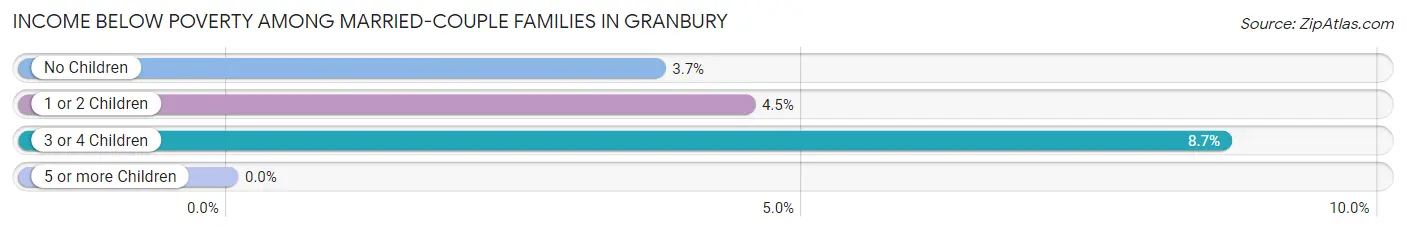
| Children | Above Poverty | Below Poverty |
| No Children | 1,840 (96.3%) | 71 (3.7%) |
| 1 or 2 Children | 573 (95.5%) | 27 (4.5%) |
| 3 or 4 Children | 95 (91.3%) | 9 (8.6%) |
| 5 or more Children | 0 (0.0%) | 0 (0.0%) |
| Total | 2,508 (95.9%) | 107 (4.1%) |
Income Below Poverty Among Single-Parent Households in Granbury
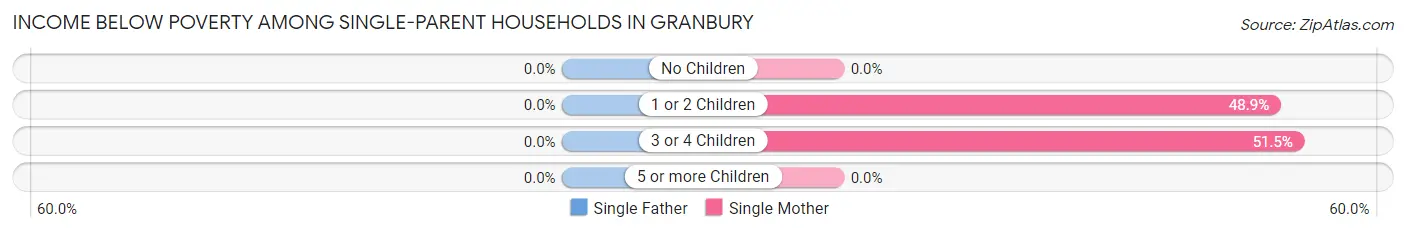
| Children | Single Father | Single Mother |
| No Children | 0 (0.0%) | 0 (0.0%) |
| 1 or 2 Children | 0 (0.0%) | 130 (48.9%) |
| 3 or 4 Children | 0 (0.0%) | 17 (51.5%) |
| 5 or more Children | 0 (0.0%) | 0 (0.0%) |
| Total | 0 (0.0%) | 147 (35.4%) |
Income Below Poverty Among Married-Couple vs Single-Parent Households in Granbury
The poverty data for Granbury shows that 107 of the married-couple family households (4.1%) and 147 of the single-parent households (26.1%) are living below the poverty level. Within the married-couple family households, those with 3 or 4 children have the highest poverty rate, with 9 households (8.6%) falling below the poverty line. Among the single-parent households, those with 3 or 4 children have the highest poverty rate, with 17 household (51.5%) living below poverty.
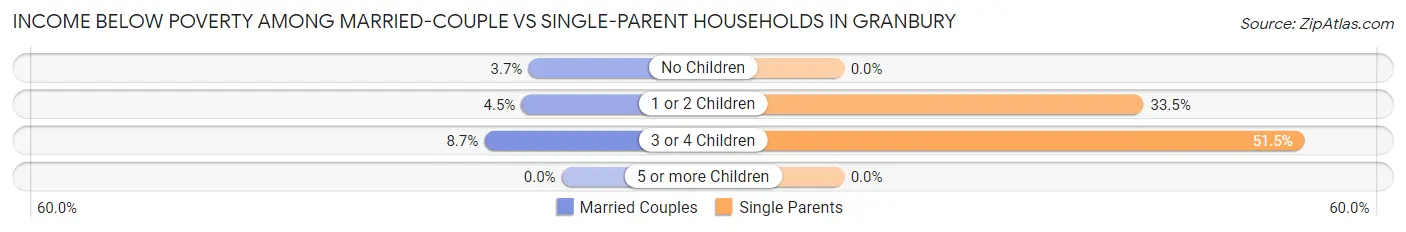
| Children | Married-Couple Families | Single-Parent Households |
| No Children | 71 (3.7%) | 0 (0.0%) |
| 1 or 2 Children | 27 (4.5%) | 130 (33.5%) |
| 3 or 4 Children | 9 (8.6%) | 17 (51.5%) |
| 5 or more Children | 0 (0.0%) | 0 (0.0%) |
| Total | 107 (4.1%) | 147 (26.1%) |
Race in Granbury
The most populous races in Granbury are White / Caucasian (10,202 | 90.9%), Hispanic or Latino (1,095 | 9.8%), and Two or more Races (686 | 6.1%).
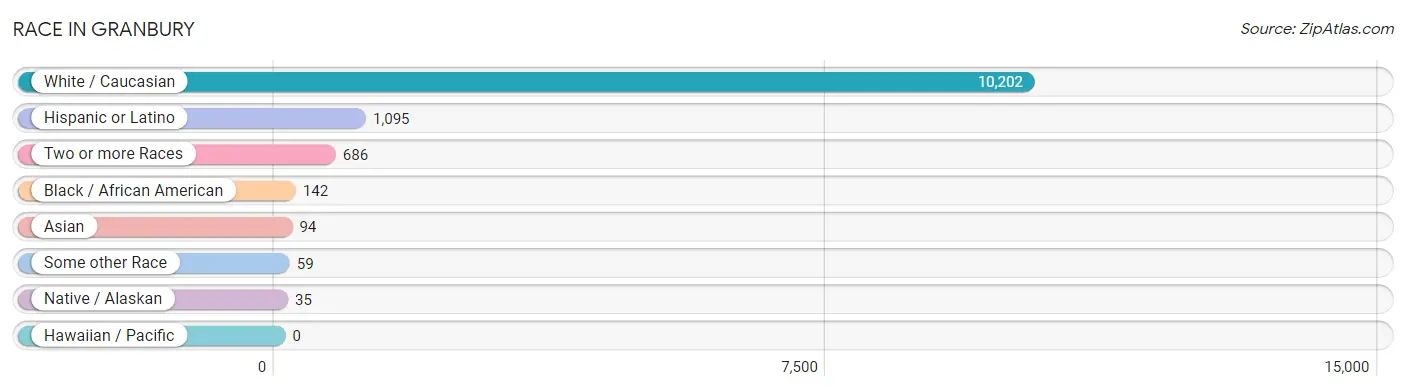
| Race | # Population | % Population |
| Asian | 94 | 0.8% |
| Black / African American | 142 | 1.3% |
| Hawaiian / Pacific | 0 | 0.0% |
| Hispanic or Latino | 1,095 | 9.8% |
| Native / Alaskan | 35 | 0.3% |
| White / Caucasian | 10,202 | 90.9% |
| Two or more Races | 686 | 6.1% |
| Some other Race | 59 | 0.5% |
| Total | 11,218 | 100.0% |
Ancestry in Granbury
The most populous ancestries reported in Granbury are German (1,507 | 13.4%), American (1,479 | 13.2%), English (1,077 | 9.6%), Mexican (1,020 | 9.1%), and Irish (924 | 8.2%), together accounting for 53.5% of all Granbury residents.
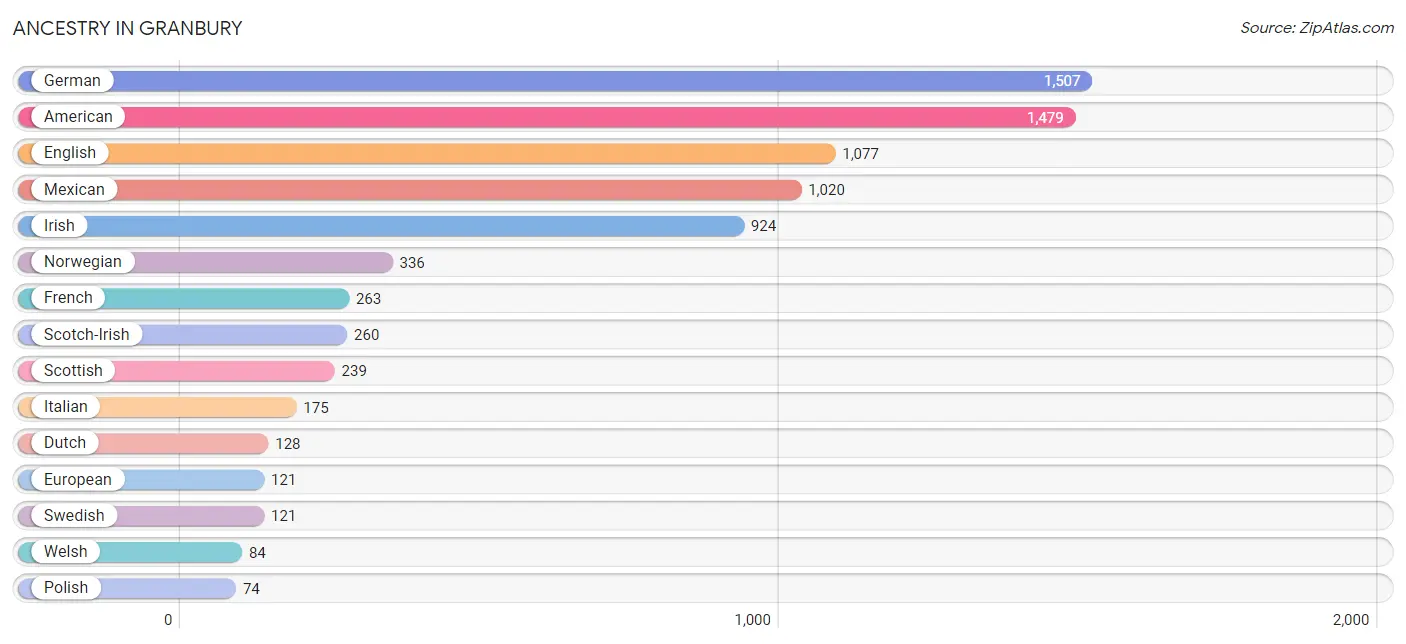
| Ancestry | # Population | % Population |
| African | 6 | 0.1% |
| American | 1,479 | 13.2% |
| Bhutanese | 14 | 0.1% |
| British | 25 | 0.2% |
| Central American | 32 | 0.3% |
| Central American Indian | 19 | 0.2% |
| Cherokee | 60 | 0.5% |
| Comanche | 22 | 0.2% |
| Czech | 69 | 0.6% |
| Danish | 17 | 0.2% |
| Dutch | 128 | 1.1% |
| Eastern European | 18 | 0.2% |
| English | 1,077 | 9.6% |
| European | 121 | 1.1% |
| French | 263 | 2.3% |
| French Canadian | 34 | 0.3% |
| German | 1,507 | 13.4% |
| Greek | 7 | 0.1% |
| Guamanian / Chamorro | 20 | 0.2% |
| Indian (Asian) | 26 | 0.2% |
| Irish | 924 | 8.2% |
| Italian | 175 | 1.6% |
| Korean | 19 | 0.2% |
| Mexican | 1,020 | 9.1% |
| Nicaraguan | 27 | 0.2% |
| Norwegian | 336 | 3.0% |
| Pakistani | 13 | 0.1% |
| Polish | 74 | 0.7% |
| Puerto Rican | 15 | 0.1% |
| Romanian | 15 | 0.1% |
| Russian | 5 | 0.0% |
| Salvadoran | 5 | 0.0% |
| Scotch-Irish | 260 | 2.3% |
| Scottish | 239 | 2.1% |
| Spaniard | 11 | 0.1% |
| Sri Lankan | 30 | 0.3% |
| Subsaharan African | 6 | 0.1% |
| Swedish | 121 | 1.1% |
| Welsh | 84 | 0.7% | View All 39 Rows |
Immigrants in Granbury
The most numerous immigrant groups reported in Granbury came from Central America (152 | 1.3%), Latin America (152 | 1.3%), Mexico (152 | 1.3%), Asia (60 | 0.5%), and South Eastern Asia (54 | 0.5%), together accounting for 5.1% of all Granbury residents.
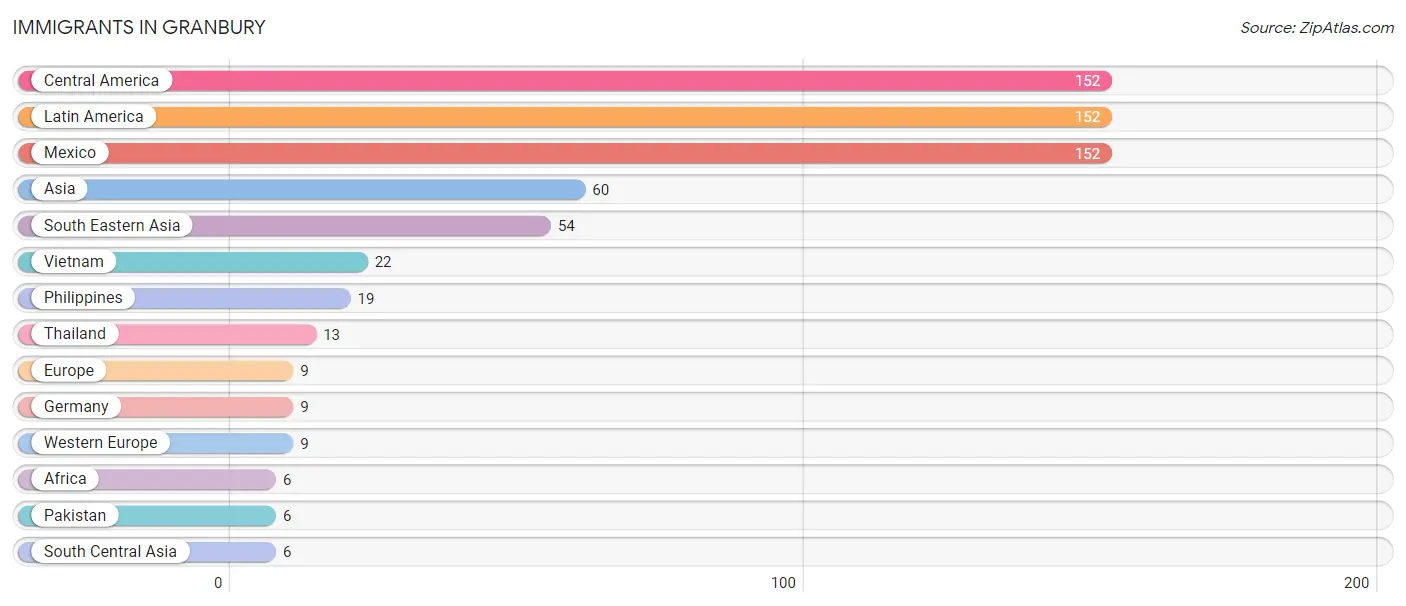
| Immigration Origin | # Population | % Population |
| Africa | 6 | 0.1% |
| Asia | 60 | 0.5% |
| Central America | 152 | 1.3% |
| Europe | 9 | 0.1% |
| Germany | 9 | 0.1% |
| Latin America | 152 | 1.3% |
| Mexico | 152 | 1.3% |
| Pakistan | 6 | 0.1% |
| Philippines | 19 | 0.2% |
| South Central Asia | 6 | 0.1% |
| South Eastern Asia | 54 | 0.5% |
| Thailand | 13 | 0.1% |
| Vietnam | 22 | 0.2% |
| Western Europe | 9 | 0.1% | View All 14 Rows |
Sex and Age in Granbury
Sex and Age in Granbury
The most populous age groups in Granbury are 30 to 34 Years (533 | 10.5%) for men and 25 to 29 Years (560 | 9.1%) for women.
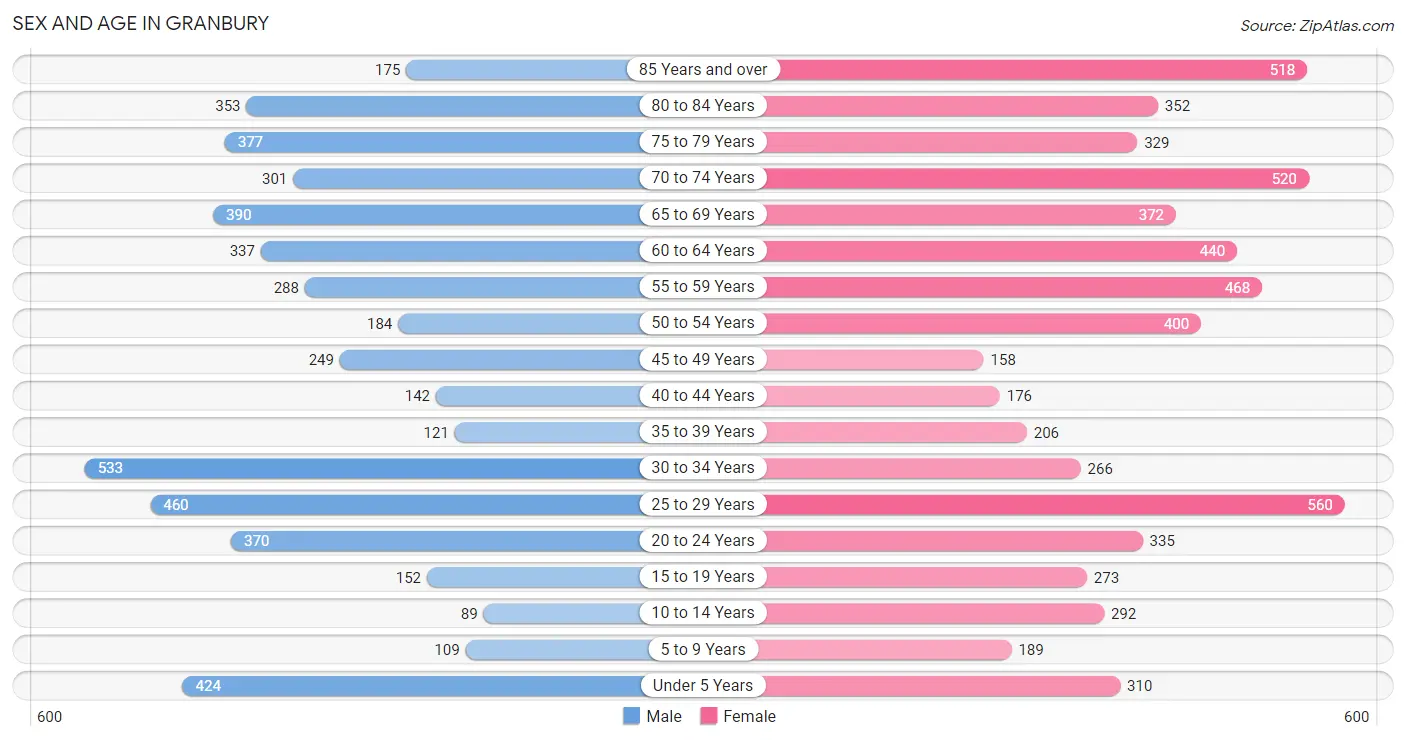
| Age Bracket | Male | Female |
| Under 5 Years | 424 (8.4%) | 310 (5.0%) |
| 5 to 9 Years | 109 (2.2%) | 189 (3.1%) |
| 10 to 14 Years | 89 (1.8%) | 292 (4.7%) |
| 15 to 19 Years | 152 (3.0%) | 273 (4.4%) |
| 20 to 24 Years | 370 (7.3%) | 335 (5.4%) |
| 25 to 29 Years | 460 (9.1%) | 560 (9.1%) |
| 30 to 34 Years | 533 (10.5%) | 266 (4.3%) |
| 35 to 39 Years | 121 (2.4%) | 206 (3.3%) |
| 40 to 44 Years | 142 (2.8%) | 176 (2.9%) |
| 45 to 49 Years | 249 (4.9%) | 158 (2.6%) |
| 50 to 54 Years | 184 (3.6%) | 400 (6.5%) |
| 55 to 59 Years | 288 (5.7%) | 468 (7.6%) |
| 60 to 64 Years | 337 (6.7%) | 440 (7.1%) |
| 65 to 69 Years | 390 (7.7%) | 372 (6.0%) |
| 70 to 74 Years | 301 (6.0%) | 520 (8.4%) |
| 75 to 79 Years | 377 (7.5%) | 329 (5.3%) |
| 80 to 84 Years | 353 (7.0%) | 352 (5.7%) |
| 85 Years and over | 175 (3.5%) | 518 (8.4%) |
| Total | 5,054 (100.0%) | 6,164 (100.0%) |
Families and Households in Granbury
Median Family Size in Granbury
The median family size in Granbury is 2.51 persons per family, with single male/father families (149 | 4.7%) accounting for the largest median family size of 2.55 persons per family. On the other hand, married-couple families (2,615 | 82.3%) represent the smallest median family size with 2.50 persons per family.
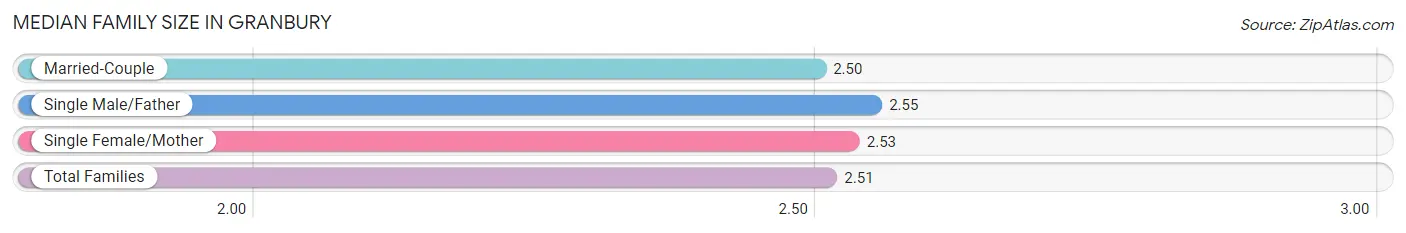
| Family Type | # Families | Family Size |
| Married-Couple | 2,615 (82.3%) | 2.50 |
| Single Male/Father | 149 (4.7%) | 2.55 |
| Single Female/Mother | 415 (13.1%) | 2.53 |
| Total Families | 3,179 (100.0%) | 2.51 |
Median Household Size in Granbury
The median household size in Granbury is 2.02 persons per household, with single male/father households (149 | 2.9%) accounting for the largest median household size of 2.97 persons per household. non-family households (1,986 | 38.5%) represent the smallest median household size with 1.11 persons per household.
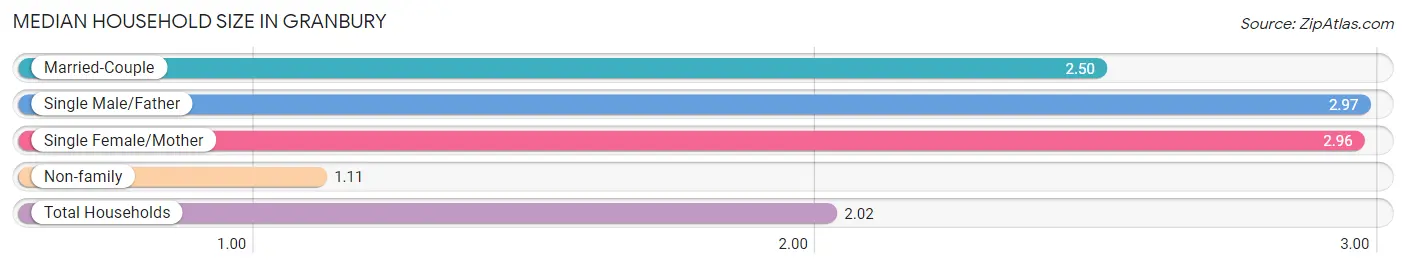
| Household Type | # Households | Household Size |
| Married-Couple | 2,615 (50.6%) | 2.50 |
| Single Male/Father | 149 (2.9%) | 2.97 |
| Single Female/Mother | 415 (8.0%) | 2.96 |
| Non-family | 1,986 (38.5%) | 1.11 |
| Total Households | 5,165 (100.0%) | 2.02 |
Household Size by Marriage Status in Granbury
Out of a total of 5,165 households in Granbury, 3,179 (61.6%) are family households, while 1,986 (38.5%) are nonfamily households. The most numerous type of family households are 2-person households, comprising 2,064, and the most common type of nonfamily households are 1-person households, comprising 1,786.
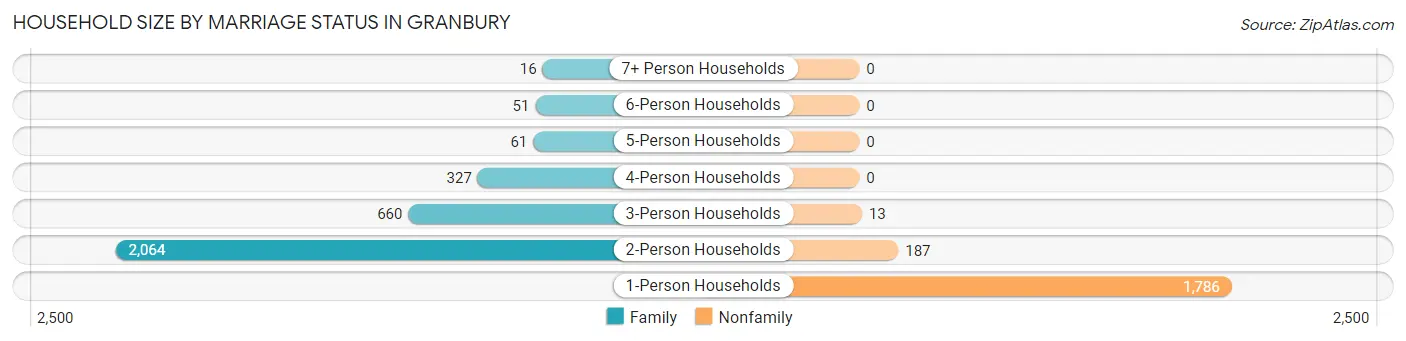
| Household Size | Family Households | Nonfamily Households |
| 1-Person Households | - | 1,786 (34.6%) |
| 2-Person Households | 2,064 (40.0%) | 187 (3.6%) |
| 3-Person Households | 660 (12.8%) | 13 (0.3%) |
| 4-Person Households | 327 (6.3%) | 0 (0.0%) |
| 5-Person Households | 61 (1.2%) | 0 (0.0%) |
| 6-Person Households | 51 (1.0%) | 0 (0.0%) |
| 7+ Person Households | 16 (0.3%) | 0 (0.0%) |
| Total | 3,179 (61.6%) | 1,986 (38.5%) |
Female Fertility in Granbury
Fertility by Age in Granbury
Average fertility rate in Granbury is 102.0 births per 1,000 women. Women in the age bracket of 20 to 34 years have the highest fertility rate with 180.0 births per 1,000 women. Women in the age bracket of 20 to 34 years acount for 100.0% of all women with births.
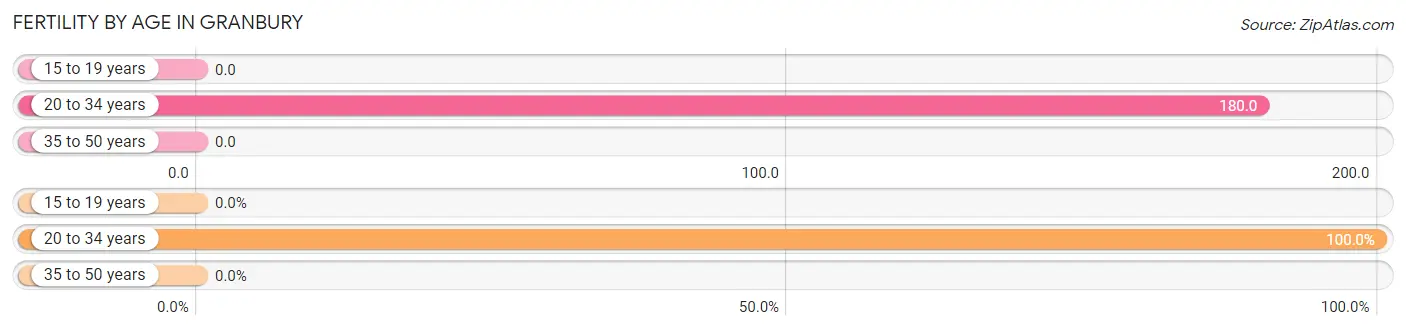
| Age Bracket | Women with Births | Births / 1,000 Women |
| 15 to 19 years | 0 (0.0%) | 0.0 |
| 20 to 34 years | 209 (100.0%) | 180.0 |
| 35 to 50 years | 0 (0.0%) | 0.0 |
| Total | 209 (100.0%) | 102.0 |
Fertility by Age by Marriage Status in Granbury
43.5% of women with births (209) in Granbury are married. The highest percentage of unmarried women with births falls into 20 to 34 years age bracket with 56.5% of them unmarried at the time of birth, while the lowest percentage of unmarried women with births belong to 20 to 34 years age bracket with 56.5% of them unmarried.
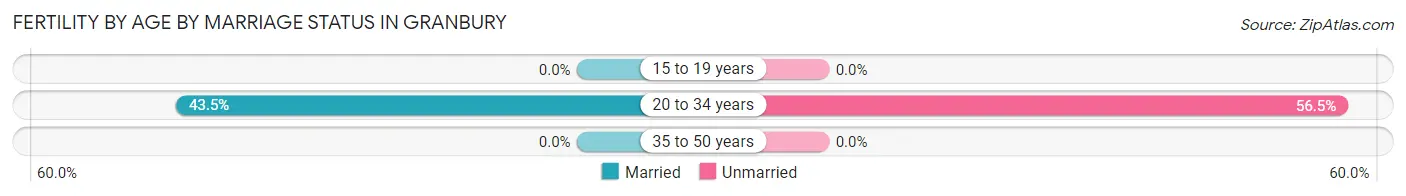
| Age Bracket | Married | Unmarried |
| 15 to 19 years | 0 (0.0%) | 0 (0.0%) |
| 20 to 34 years | 91 (43.5%) | 118 (56.5%) |
| 35 to 50 years | 0 (0.0%) | 0 (0.0%) |
| Total | 91 (43.5%) | 118 (56.5%) |
Fertility by Education in Granbury
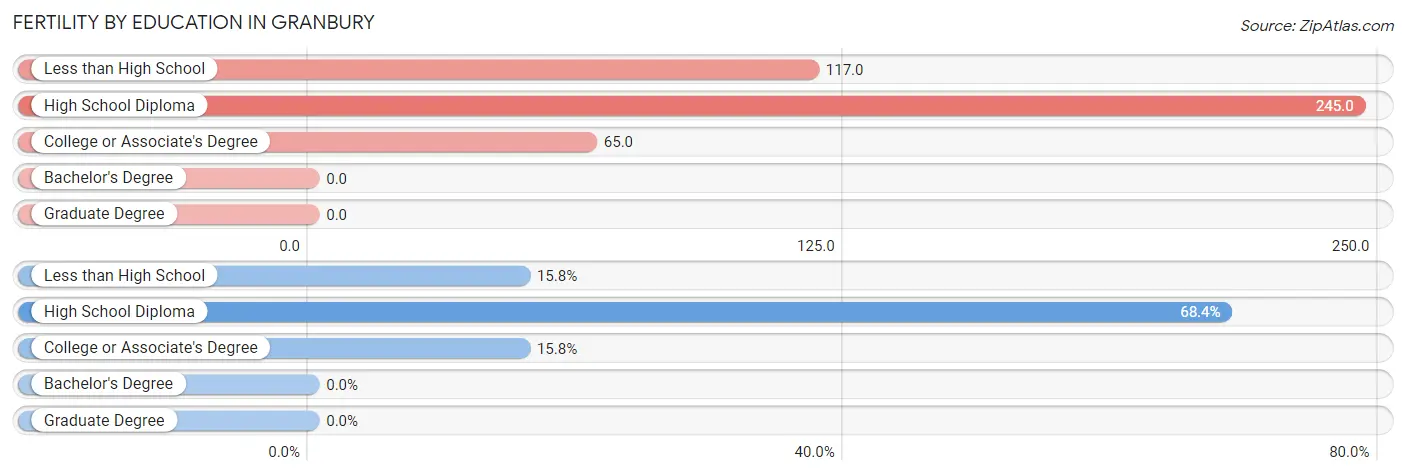
| Educational Attainment | Women with Births | Births / 1,000 Women |
| Less than High School | 33 (15.8%) | 117.0 |
| High School Diploma | 143 (68.4%) | 245.0 |
| College or Associate's Degree | 33 (15.8%) | 65.0 |
| Bachelor's Degree | 0 (0.0%) | 0.0 |
| Graduate Degree | 0 (0.0%) | 0.0 |
| Total | 209 (100.0%) | 102.0 |
Fertility by Education by Marriage Status in Granbury
56.5% of women with births in Granbury are unmarried. Women with the educational attainment of college or associate's degree are most likely to be married with 100.0% of them married at childbirth, while women with the educational attainment of less than high school are least likely to be married with 100.0% of them unmarried at childbirth.
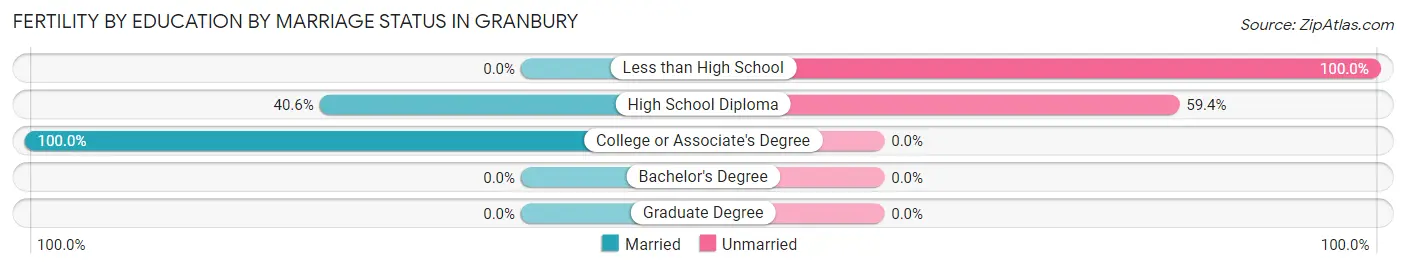
| Educational Attainment | Married | Unmarried |
| Less than High School | 0 (0.0%) | 33 (100.0%) |
| High School Diploma | 58 (40.6%) | 85 (59.4%) |
| College or Associate's Degree | 33 (100.0%) | 0 (0.0%) |
| Bachelor's Degree | 0 (0.0%) | 0 (0.0%) |
| Graduate Degree | 0 (0.0%) | 0 (0.0%) |
| Total | 91 (43.5%) | 118 (56.5%) |
Employment Characteristics in Granbury
Employment by Class of Employer in Granbury
Among the 4,511 employed individuals in Granbury, private company employees (3,435 | 76.1%), self-employed (not incorporated) (352 | 7.8%), and local government employees (270 | 6.0%) make up the most common classes of employment.
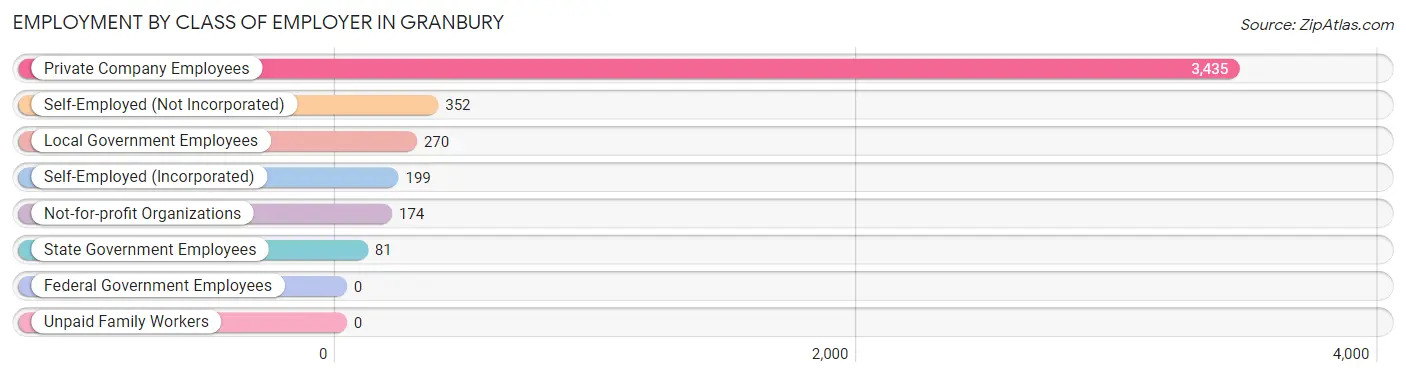
| Employer Class | # Employees | % Employees |
| Private Company Employees | 3,435 | 76.1% |
| Self-Employed (Incorporated) | 199 | 4.4% |
| Self-Employed (Not Incorporated) | 352 | 7.8% |
| Not-for-profit Organizations | 174 | 3.9% |
| Local Government Employees | 270 | 6.0% |
| State Government Employees | 81 | 1.8% |
| Federal Government Employees | 0 | 0.0% |
| Unpaid Family Workers | 0 | 0.0% |
| Total | 4,511 | 100.0% |
Employment Status by Age in Granbury
According to the labor force statistics for Granbury, out of the total population over 16 years of age (9,726), 49.0% or 4,766 individuals are in the labor force, with 3.4% or 162 of them unemployed. The age group with the highest labor force participation rate is 45 to 54 years, with 84.1% or 833 individuals in the labor force. Within the labor force, the 20 to 24 years age range has the highest percentage of unemployed individuals, with 18.0% or 104 of them being unemployed.
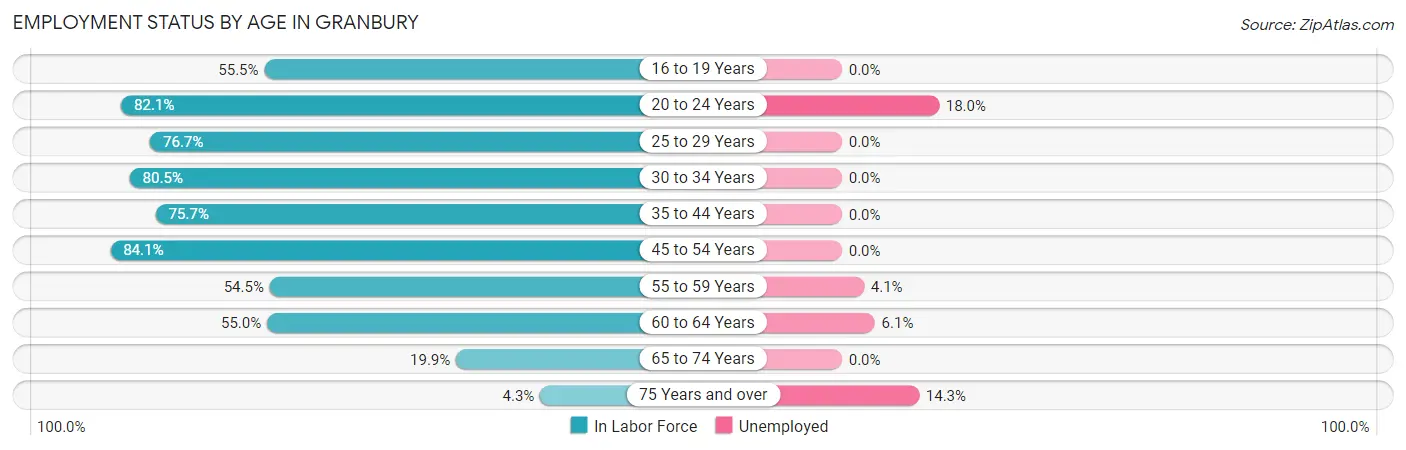
| Age Bracket | In Labor Force | Unemployed |
| 16 to 19 Years | 192 (55.5%) | 0 (0.0%) |
| 20 to 24 Years | 579 (82.1%) | 104 (18.0%) |
| 25 to 29 Years | 782 (76.7%) | 0 (0.0%) |
| 30 to 34 Years | 643 (80.5%) | 0 (0.0%) |
| 35 to 44 Years | 488 (75.7%) | 0 (0.0%) |
| 45 to 54 Years | 833 (84.1%) | 0 (0.0%) |
| 55 to 59 Years | 412 (54.5%) | 17 (4.1%) |
| 60 to 64 Years | 427 (55.0%) | 26 (6.1%) |
| 65 to 74 Years | 315 (19.9%) | 0 (0.0%) |
| 75 Years and over | 90 (4.3%) | 13 (14.3%) |
| Total | 4,766 (49.0%) | 162 (3.4%) |
Employment Status by Educational Attainment in Granbury
According to labor force statistics for Granbury, 71.9% of individuals (3,586) out of the total population between 25 and 64 years of age (4,988) are in the labor force, with 1.2% or 43 of them being unemployed. The group with the highest labor force participation rate are those with the educational attainment of bachelor's degree or higher, with 78.0% or 1,384 individuals in the labor force. Within the labor force, individuals with bachelor's degree or higher education have the highest percentage of unemployment, with 1.9% or 26 of them being unemployed.
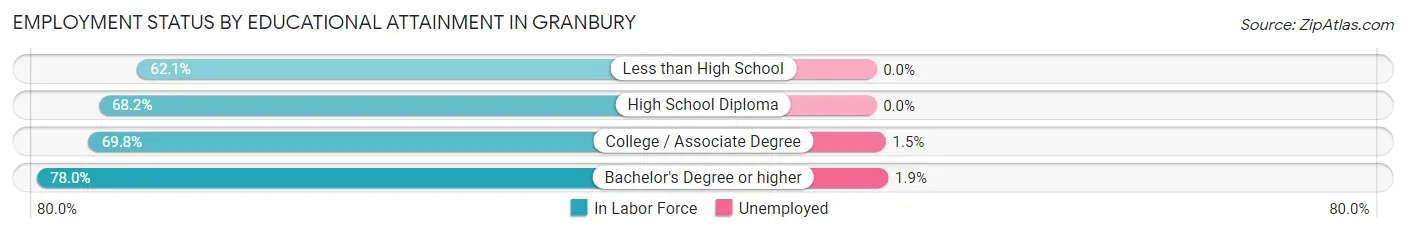
| Educational Attainment | In Labor Force | Unemployed |
| Less than High School | 177 (62.1%) | 0 (0.0%) |
| High School Diploma | 895 (68.2%) | 0 (0.0%) |
| College / Associate Degree | 1,129 (69.8%) | 24 (1.5%) |
| Bachelor's Degree or higher | 1,384 (78.0%) | 34 (1.9%) |
| Total | 3,586 (71.9%) | 60 (1.2%) |
Employment Occupations by Sex in Granbury
Management, Business, Science and Arts Occupations
The most common Management, Business, Science and Arts occupations in Granbury are Management (640 | 13.9%), Community & Social Service (417 | 9.1%), Health Diagnosing & Treating (334 | 7.3%), Business & Financial (239 | 5.2%), and Education, Arts & Media (214 | 4.6%).
Management, Business, Science and Arts Occupations by Sex
Within the Management, Business, Science and Arts occupations in Granbury, the most male-oriented occupations are Computers & Mathematics (100.0%), Life, Physical & Social Science (100.0%), and Legal Services & Support (100.0%), while the most female-oriented occupations are Health Technologists (91.3%), Education Instruction & Library (90.0%), and Health Diagnosing & Treating (74.6%).
| Occupation | Male | Female |
| Management | 295 (46.1%) | 345 (53.9%) |
| Business & Financial | 206 (86.2%) | 33 (13.8%) |
| Computers, Engineering & Science | 88 (74.0%) | 31 (26.1%) |
| Computers & Mathematics | 58 (100.0%) | 0 (0.0%) |
| Architecture & Engineering | 13 (29.5%) | 31 (70.5%) |
| Life, Physical & Social Science | 17 (100.0%) | 0 (0.0%) |
| Community & Social Service | 147 (35.2%) | 270 (64.7%) |
| Education, Arts & Media | 88 (41.1%) | 126 (58.9%) |
| Legal Services & Support | 43 (100.0%) | 0 (0.0%) |
| Education Instruction & Library | 16 (10.0%) | 144 (90.0%) |
| Arts, Media & Entertainment | 0 (0.0%) | 0 (0.0%) |
| Health Diagnosing & Treating | 85 (25.5%) | 249 (74.6%) |
| Health Technologists | 14 (8.7%) | 147 (91.3%) |
| Total (Category) | 821 (46.9%) | 928 (53.1%) |
| Total (Overall) | 2,439 (53.0%) | 2,163 (47.0%) |
Services Occupations
The most common Services occupations in Granbury are Healthcare Support (185 | 4.0%), Cleaning & Maintenance (161 | 3.5%), Food Preparation & Serving (122 | 2.6%), Security & Protection (106 | 2.3%), and Personal Care & Service (83 | 1.8%).
Services Occupations by Sex
Within the Services occupations in Granbury, the most male-oriented occupations are Firefighting & Prevention (100.0%), Security & Protection (88.7%), and Law Enforcement (80.6%), while the most female-oriented occupations are Personal Care & Service (100.0%), Healthcare Support (88.1%), and Cleaning & Maintenance (63.3%).
| Occupation | Male | Female |
| Healthcare Support | 22 (11.9%) | 163 (88.1%) |
| Security & Protection | 94 (88.7%) | 12 (11.3%) |
| Firefighting & Prevention | 44 (100.0%) | 0 (0.0%) |
| Law Enforcement | 50 (80.6%) | 12 (19.4%) |
| Food Preparation & Serving | 54 (44.3%) | 68 (55.7%) |
| Cleaning & Maintenance | 59 (36.6%) | 102 (63.3%) |
| Personal Care & Service | 0 (0.0%) | 83 (100.0%) |
| Total (Category) | 229 (34.9%) | 428 (65.1%) |
| Total (Overall) | 2,439 (53.0%) | 2,163 (47.0%) |
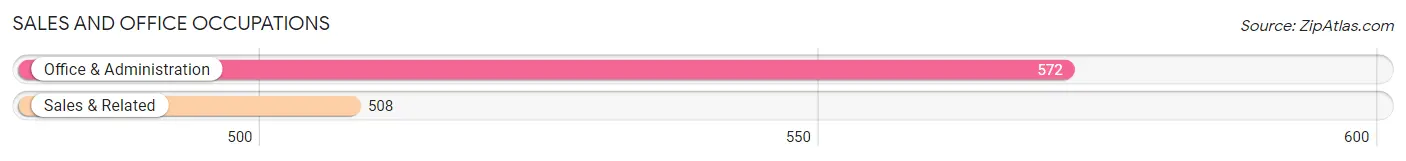
Sales and Office Occupations
The most common Sales and Office occupations in Granbury are Office & Administration (572 | 12.4%), and Sales & Related (508 | 11.0%).
Sales and Office Occupations by Sex
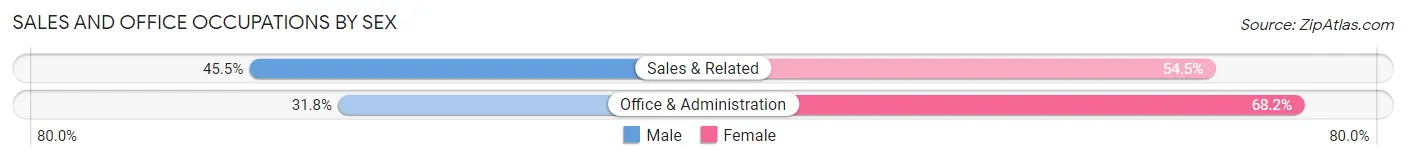
| Occupation | Male | Female |
| Sales & Related | 231 (45.5%) | 277 (54.5%) |
| Office & Administration | 182 (31.8%) | 390 (68.2%) |
| Total (Category) | 413 (38.2%) | 667 (61.8%) |
| Total (Overall) | 2,439 (53.0%) | 2,163 (47.0%) |
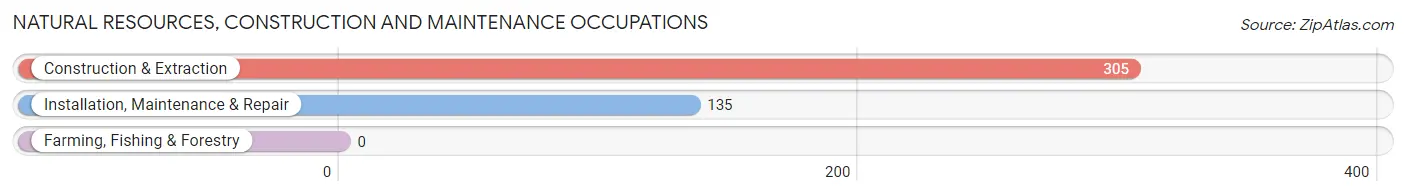
Natural Resources, Construction and Maintenance Occupations
The most common Natural Resources, Construction and Maintenance occupations in Granbury are Construction & Extraction (305 | 6.6%), and Installation, Maintenance & Repair (135 | 2.9%).
Natural Resources, Construction and Maintenance Occupations by Sex
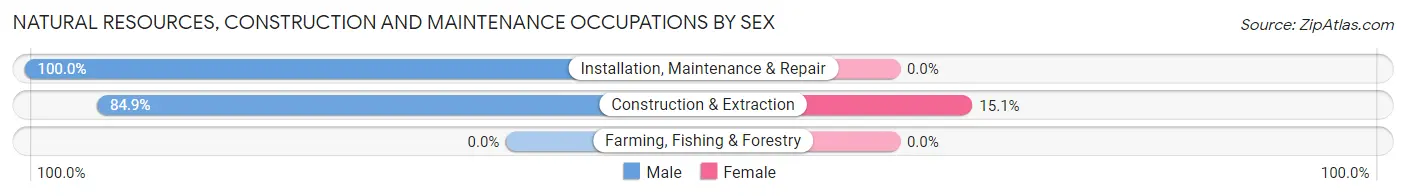
| Occupation | Male | Female |
| Farming, Fishing & Forestry | 0 (0.0%) | 0 (0.0%) |
| Construction & Extraction | 259 (84.9%) | 46 (15.1%) |
| Installation, Maintenance & Repair | 135 (100.0%) | 0 (0.0%) |
| Total (Category) | 394 (89.5%) | 46 (10.4%) |
| Total (Overall) | 2,439 (53.0%) | 2,163 (47.0%) |
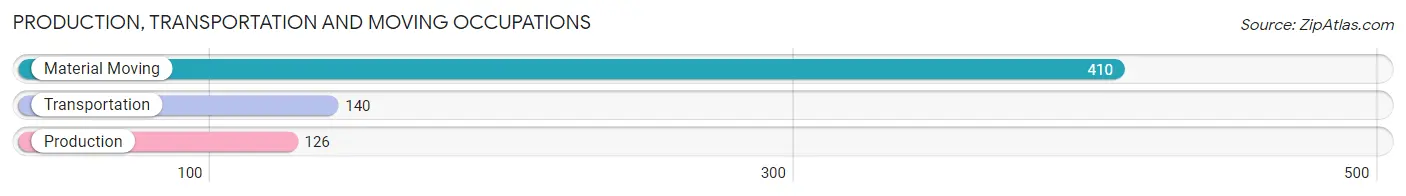
Production, Transportation and Moving Occupations
The most common Production, Transportation and Moving occupations in Granbury are Material Moving (410 | 8.9%), Transportation (140 | 3.0%), and Production (126 | 2.7%).
Production, Transportation and Moving Occupations by Sex
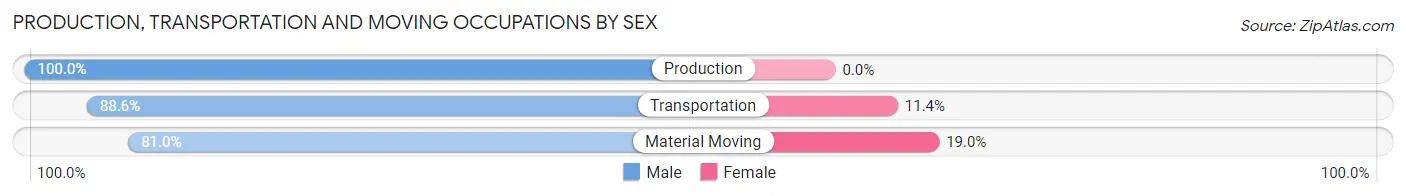
| Occupation | Male | Female |
| Production | 126 (100.0%) | 0 (0.0%) |
| Transportation | 124 (88.6%) | 16 (11.4%) |
| Material Moving | 332 (81.0%) | 78 (19.0%) |
| Total (Category) | 582 (86.1%) | 94 (13.9%) |
| Total (Overall) | 2,439 (53.0%) | 2,163 (47.0%) |
Employment Industries by Sex in Granbury
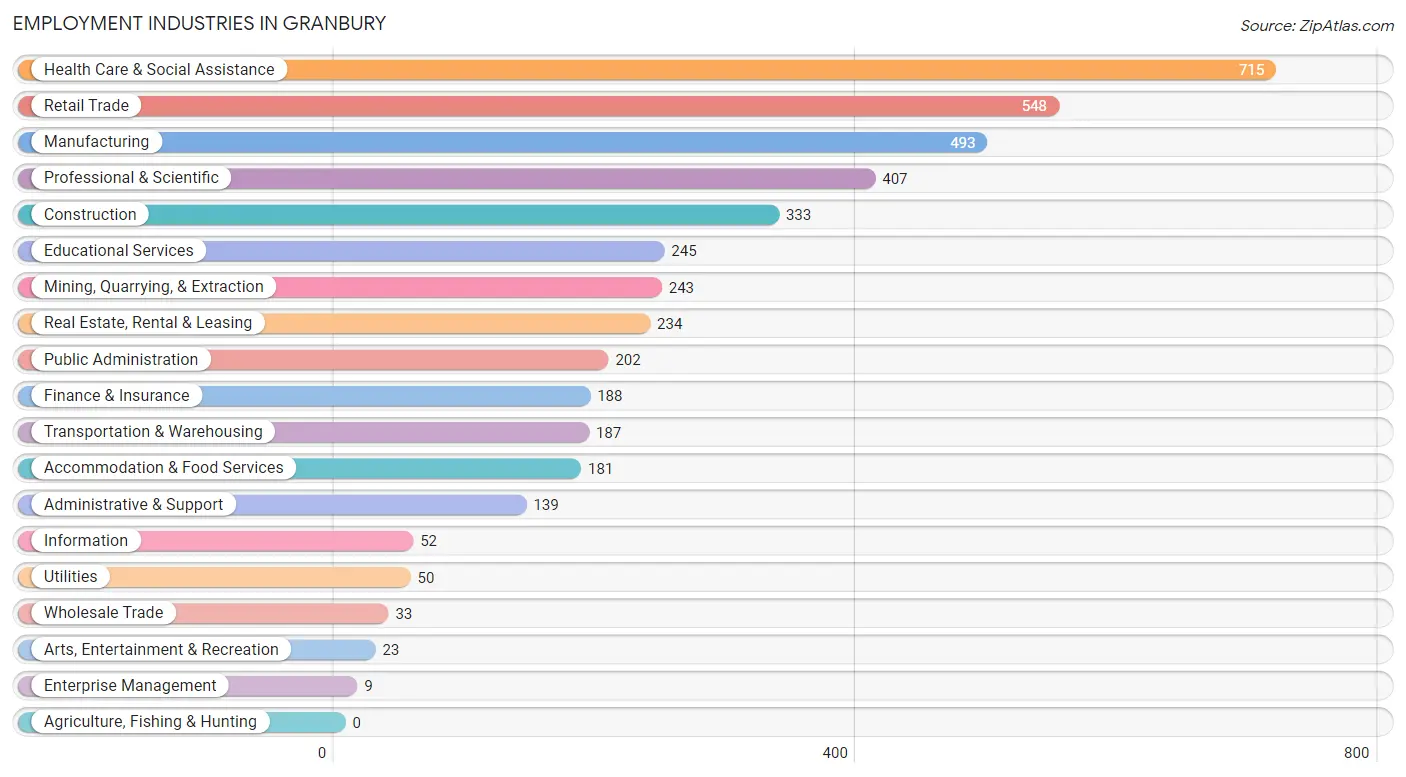
Employment Industries in Granbury
The major employment industries in Granbury include Health Care & Social Assistance (715 | 15.5%), Retail Trade (548 | 11.9%), Manufacturing (493 | 10.7%), Professional & Scientific (407 | 8.8%), and Construction (333 | 7.2%).
Employment Industries by Sex in Granbury
The Granbury industries that see more men than women are Mining, Quarrying, & Extraction (100.0%), Utilities (100.0%), and Transportation & Warehousing (95.7%), whereas the industries that tend to have a higher number of women are Wholesale Trade (100.0%), Enterprise Management (100.0%), and Arts, Entertainment & Recreation (100.0%).
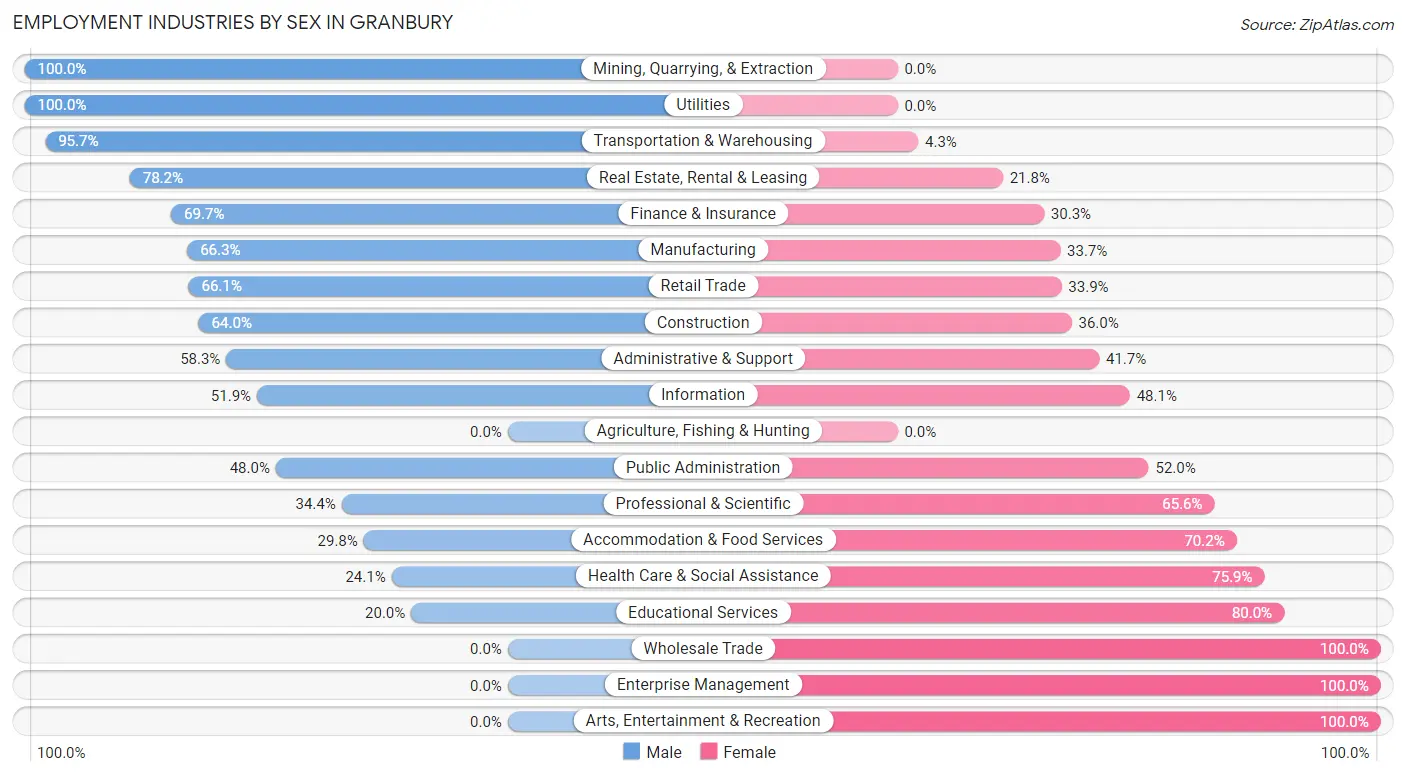
| Industry | Male | Female |
| Agriculture, Fishing & Hunting | 0 (0.0%) | 0 (0.0%) |
| Mining, Quarrying, & Extraction | 243 (100.0%) | 0 (0.0%) |
| Construction | 213 (64.0%) | 120 (36.0%) |
| Manufacturing | 327 (66.3%) | 166 (33.7%) |
| Wholesale Trade | 0 (0.0%) | 33 (100.0%) |
| Retail Trade | 362 (66.1%) | 186 (33.9%) |
| Transportation & Warehousing | 179 (95.7%) | 8 (4.3%) |
| Utilities | 50 (100.0%) | 0 (0.0%) |
| Information | 27 (51.9%) | 25 (48.1%) |
| Finance & Insurance | 131 (69.7%) | 57 (30.3%) |
| Real Estate, Rental & Leasing | 183 (78.2%) | 51 (21.8%) |
| Professional & Scientific | 140 (34.4%) | 267 (65.6%) |
| Enterprise Management | 0 (0.0%) | 9 (100.0%) |
| Administrative & Support | 81 (58.3%) | 58 (41.7%) |
| Educational Services | 49 (20.0%) | 196 (80.0%) |
| Health Care & Social Assistance | 172 (24.1%) | 543 (75.9%) |
| Arts, Entertainment & Recreation | 0 (0.0%) | 23 (100.0%) |
| Accommodation & Food Services | 54 (29.8%) | 127 (70.2%) |
| Public Administration | 97 (48.0%) | 105 (52.0%) |
| Total | 2,439 (53.0%) | 2,163 (47.0%) |
Education in Granbury
School Enrollment in Granbury
The most common levels of schooling among the 1,612 students in Granbury are college / undergraduate (538 | 33.4%), high school (412 | 25.6%), and middle school (204 | 12.7%).
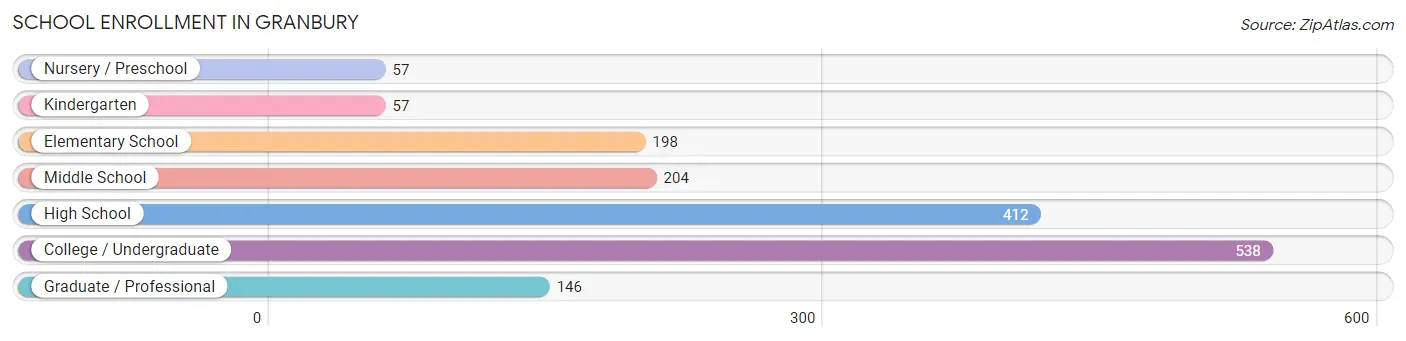
| School Level | # Students | % Students |
| Nursery / Preschool | 57 | 3.5% |
| Kindergarten | 57 | 3.5% |
| Elementary School | 198 | 12.3% |
| Middle School | 204 | 12.7% |
| High School | 412 | 25.6% |
| College / Undergraduate | 538 | 33.4% |
| Graduate / Professional | 146 | 9.1% |
| Total | 1,612 | 100.0% |
School Enrollment by Age by Funding Source in Granbury
Out of a total of 1,612 students who are enrolled in schools in Granbury, 139 (8.6%) attend a private institution, while the remaining 1,473 (91.4%) are enrolled in public schools. The age group of 35 years and over has the highest likelihood of being enrolled in private schools, with 16 (48.5% in the age bracket) enrolled. Conversely, the age group of 10 to 14 year olds has the lowest likelihood of being enrolled in a private school, with 252 (100.0% in the age bracket) attending a public institution.
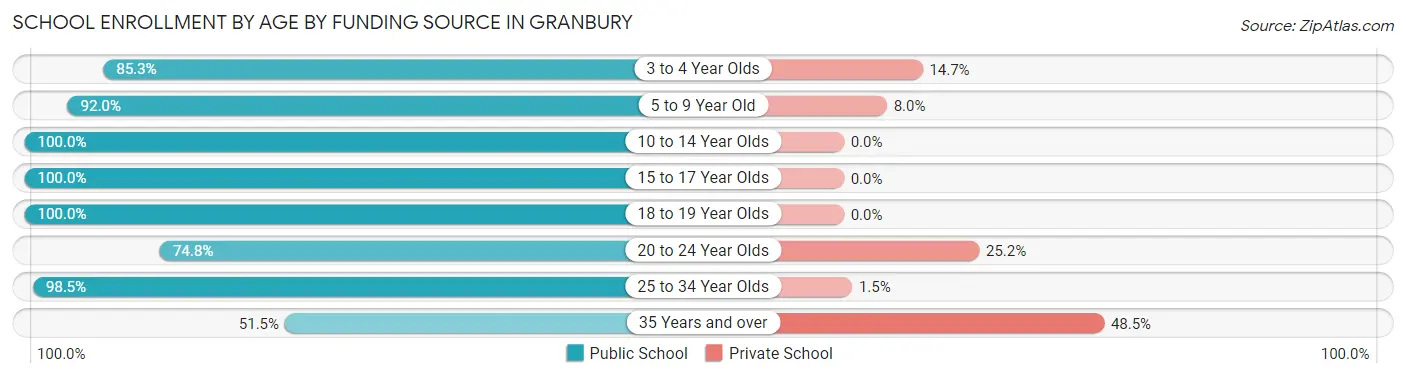
| Age Bracket | Public School | Private School |
| 3 to 4 Year Olds | 64 (85.3%) | 11 (14.7%) |
| 5 to 9 Year Old | 218 (92.0%) | 19 (8.0%) |
| 10 to 14 Year Olds | 252 (100.0%) | 0 (0.0%) |
| 15 to 17 Year Olds | 286 (100.0%) | 0 (0.0%) |
| 18 to 19 Year Olds | 60 (100.0%) | 0 (0.0%) |
| 20 to 24 Year Olds | 258 (74.8%) | 87 (25.2%) |
| 25 to 34 Year Olds | 319 (98.5%) | 5 (1.5%) |
| 35 Years and over | 17 (51.5%) | 16 (48.5%) |
| Total | 1,473 (91.4%) | 139 (8.6%) |
Educational Attainment by Field of Study in Granbury
Business (739 | 24.5%), education (708 | 23.5%), science & technology (365 | 12.1%), computers & mathematics (207 | 6.9%), and engineering (198 | 6.6%) are the most common fields of study among 3,014 individuals in Granbury who have obtained a bachelor's degree or higher.
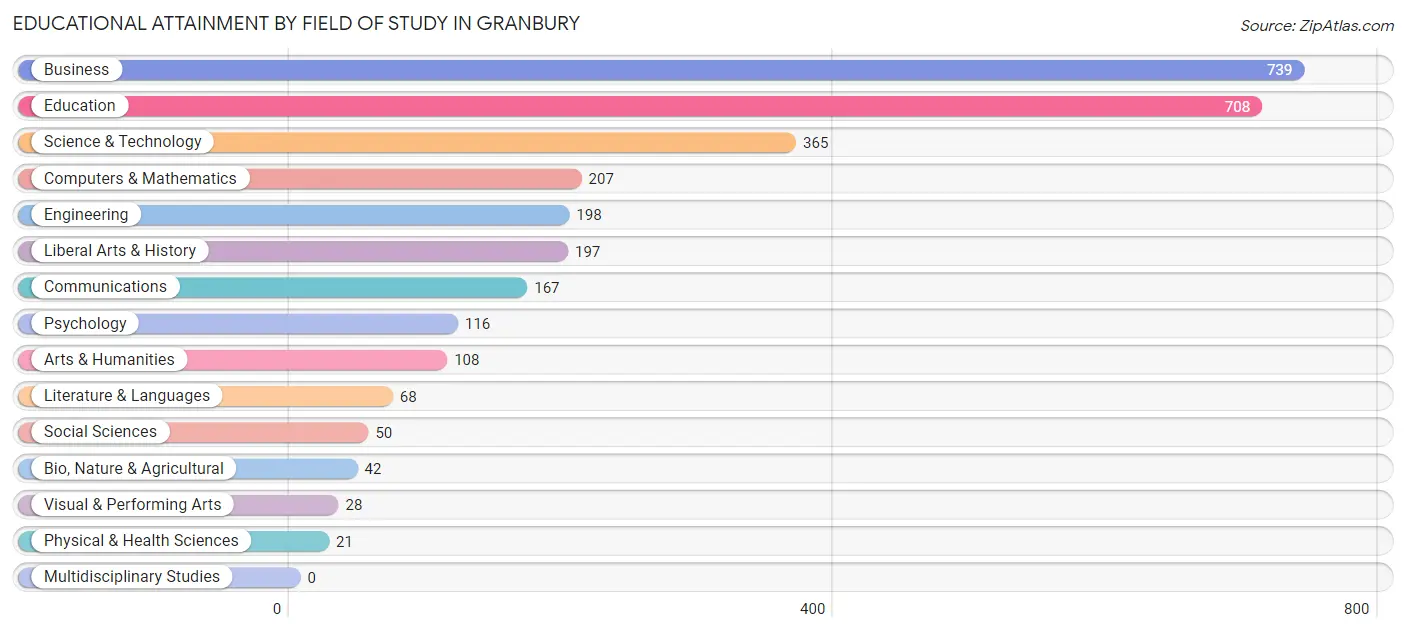
| Field of Study | # Graduates | % Graduates |
| Computers & Mathematics | 207 | 6.9% |
| Bio, Nature & Agricultural | 42 | 1.4% |
| Physical & Health Sciences | 21 | 0.7% |
| Psychology | 116 | 3.8% |
| Social Sciences | 50 | 1.7% |
| Engineering | 198 | 6.6% |
| Multidisciplinary Studies | 0 | 0.0% |
| Science & Technology | 365 | 12.1% |
| Business | 739 | 24.5% |
| Education | 708 | 23.5% |
| Literature & Languages | 68 | 2.3% |
| Liberal Arts & History | 197 | 6.5% |
| Visual & Performing Arts | 28 | 0.9% |
| Communications | 167 | 5.5% |
| Arts & Humanities | 108 | 3.6% |
| Total | 3,014 | 100.0% |
Transportation & Commute in Granbury
Vehicle Availability by Sex in Granbury
The most prevalent vehicle ownership categories in Granbury are males with 2 vehicles (1,288, accounting for 54.1%) and females with 2 vehicles (989, making up 60.5%).
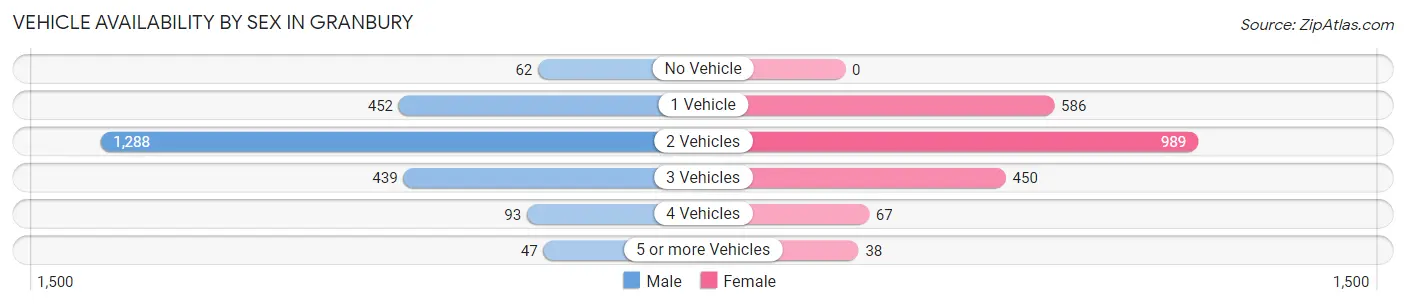
| Vehicles Available | Male | Female |
| No Vehicle | 62 (2.6%) | 0 (0.0%) |
| 1 Vehicle | 452 (19.0%) | 586 (27.5%) |
| 2 Vehicles | 1,288 (54.1%) | 989 (46.4%) |
| 3 Vehicles | 439 (18.4%) | 450 (21.1%) |
| 4 Vehicles | 93 (3.9%) | 67 (3.2%) |
| 5 or more Vehicles | 47 (2.0%) | 38 (1.8%) |
| Total | 2,381 (100.0%) | 2,130 (100.0%) |
Commute Time in Granbury
The most frequently occuring commute durations in Granbury are 5 to 9 minutes (693 commuters, 16.7%), 15 to 19 minutes (581 commuters, 14.0%), and 45 to 59 minutes (521 commuters, 12.6%).
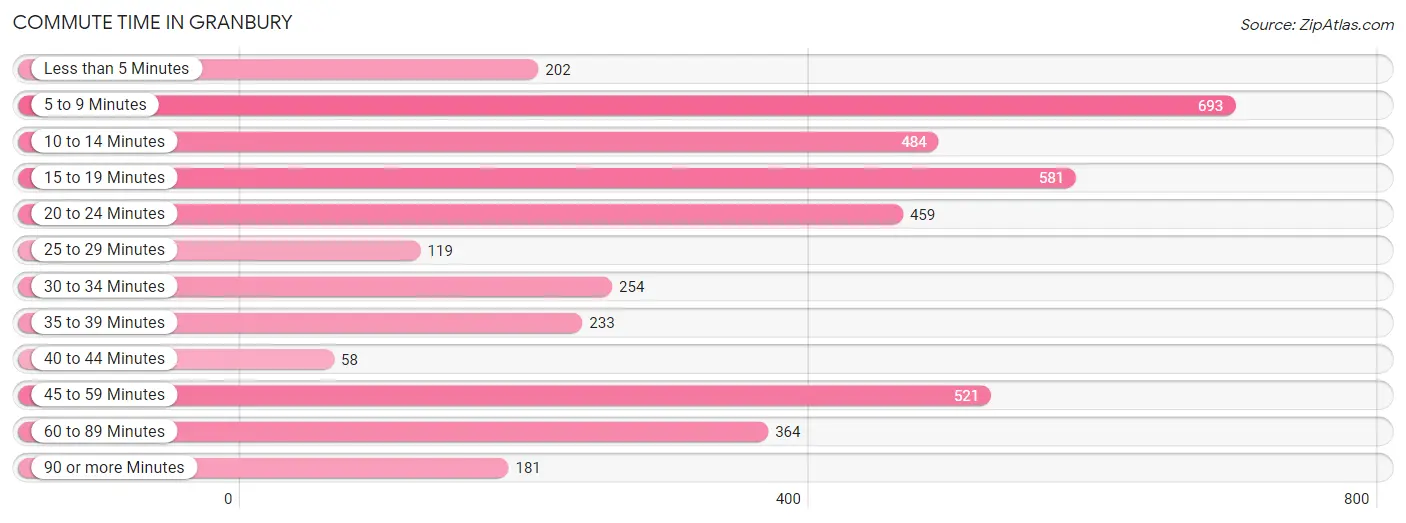
| Commute Time | # Commuters | % Commuters |
| Less than 5 Minutes | 202 | 4.9% |
| 5 to 9 Minutes | 693 | 16.7% |
| 10 to 14 Minutes | 484 | 11.7% |
| 15 to 19 Minutes | 581 | 14.0% |
| 20 to 24 Minutes | 459 | 11.1% |
| 25 to 29 Minutes | 119 | 2.9% |
| 30 to 34 Minutes | 254 | 6.1% |
| 35 to 39 Minutes | 233 | 5.6% |
| 40 to 44 Minutes | 58 | 1.4% |
| 45 to 59 Minutes | 521 | 12.6% |
| 60 to 89 Minutes | 364 | 8.8% |
| 90 or more Minutes | 181 | 4.4% |
Commute Time by Sex in Granbury
The most common commute times in Granbury are 5 to 9 minutes (378 commuters, 17.4%) for males and 15 to 19 minutes (436 commuters, 22.0%) for females.
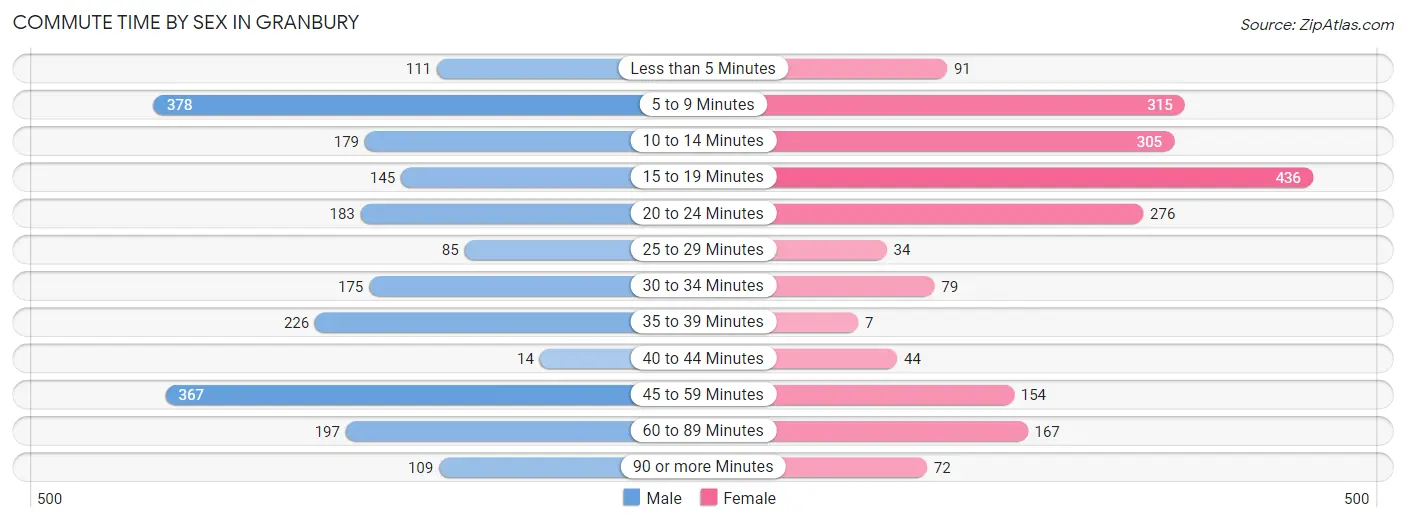
| Commute Time | Male | Female |
| Less than 5 Minutes | 111 (5.1%) | 91 (4.6%) |
| 5 to 9 Minutes | 378 (17.4%) | 315 (15.9%) |
| 10 to 14 Minutes | 179 (8.3%) | 305 (15.4%) |
| 15 to 19 Minutes | 145 (6.7%) | 436 (22.0%) |
| 20 to 24 Minutes | 183 (8.4%) | 276 (13.9%) |
| 25 to 29 Minutes | 85 (3.9%) | 34 (1.7%) |
| 30 to 34 Minutes | 175 (8.1%) | 79 (4.0%) |
| 35 to 39 Minutes | 226 (10.4%) | 7 (0.4%) |
| 40 to 44 Minutes | 14 (0.6%) | 44 (2.2%) |
| 45 to 59 Minutes | 367 (16.9%) | 154 (7.8%) |
| 60 to 89 Minutes | 197 (9.1%) | 167 (8.4%) |
| 90 or more Minutes | 109 (5.0%) | 72 (3.6%) |
Time of Departure to Work by Sex in Granbury
The most frequent times of departure to work in Granbury are 7:00 AM to 7:29 AM (591, 27.3%) for males and 7:30 AM to 7:59 AM (473, 23.9%) for females.
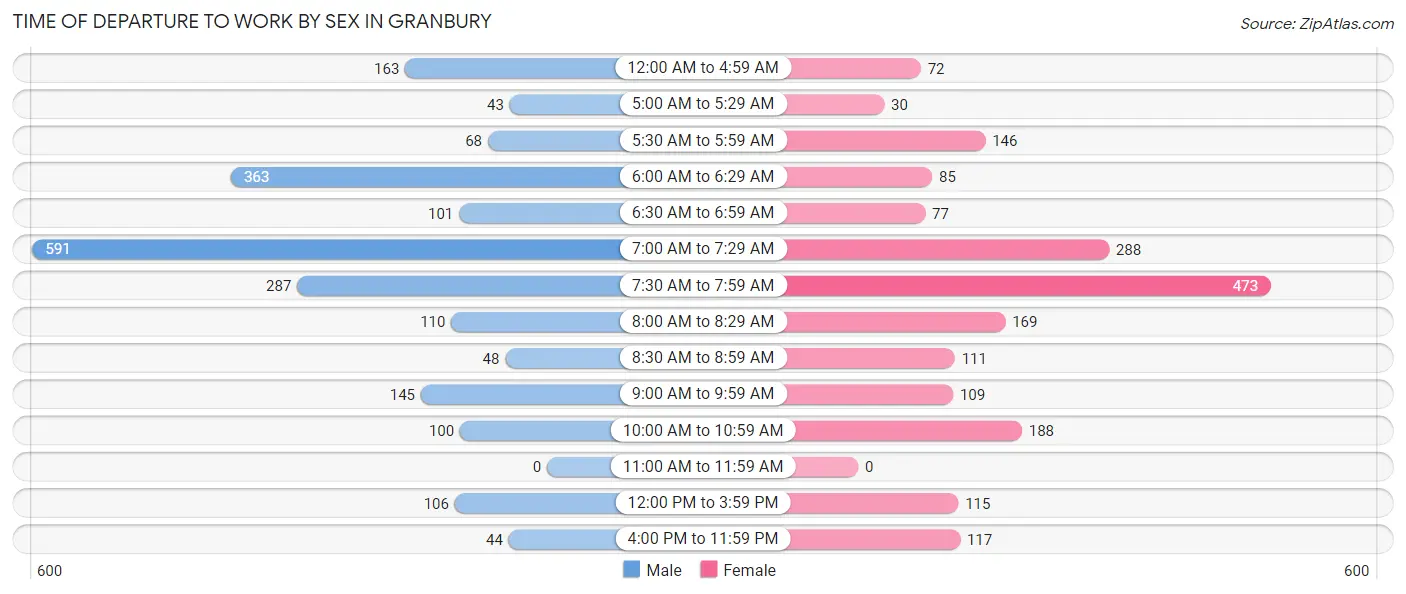
| Time of Departure | Male | Female |
| 12:00 AM to 4:59 AM | 163 (7.5%) | 72 (3.6%) |
| 5:00 AM to 5:29 AM | 43 (2.0%) | 30 (1.5%) |
| 5:30 AM to 5:59 AM | 68 (3.1%) | 146 (7.4%) |
| 6:00 AM to 6:29 AM | 363 (16.7%) | 85 (4.3%) |
| 6:30 AM to 6:59 AM | 101 (4.7%) | 77 (3.9%) |
| 7:00 AM to 7:29 AM | 591 (27.3%) | 288 (14.5%) |
| 7:30 AM to 7:59 AM | 287 (13.2%) | 473 (23.9%) |
| 8:00 AM to 8:29 AM | 110 (5.1%) | 169 (8.5%) |
| 8:30 AM to 8:59 AM | 48 (2.2%) | 111 (5.6%) |
| 9:00 AM to 9:59 AM | 145 (6.7%) | 109 (5.5%) |
| 10:00 AM to 10:59 AM | 100 (4.6%) | 188 (9.5%) |
| 11:00 AM to 11:59 AM | 0 (0.0%) | 0 (0.0%) |
| 12:00 PM to 3:59 PM | 106 (4.9%) | 115 (5.8%) |
| 4:00 PM to 11:59 PM | 44 (2.0%) | 117 (5.9%) |
| Total | 2,169 (100.0%) | 1,980 (100.0%) |
Housing Occupancy in Granbury
Occupancy by Ownership in Granbury
Of the total 5,165 dwellings in Granbury, owner-occupied units account for 3,009 (58.3%), while renter-occupied units make up 2,156 (41.7%).
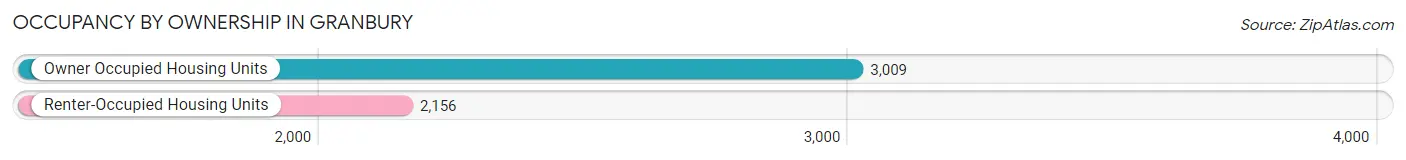
| Occupancy | # Housing Units | % Housing Units |
| Owner Occupied Housing Units | 3,009 | 58.3% |
| Renter-Occupied Housing Units | 2,156 | 41.7% |
| Total Occupied Housing Units | 5,165 | 100.0% |
Occupancy by Household Size in Granbury
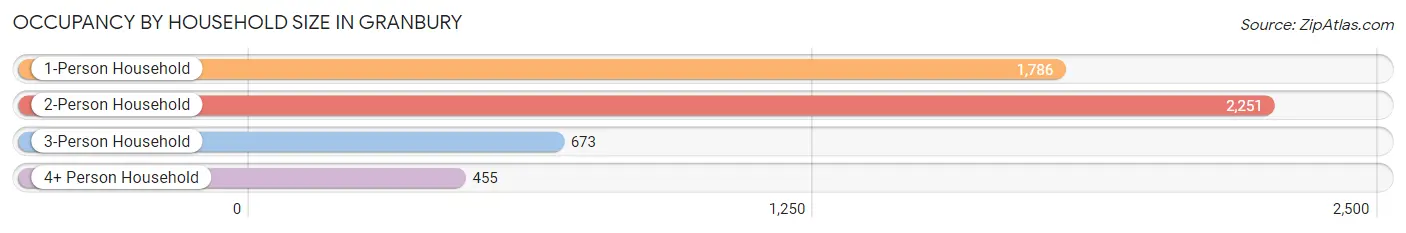
| Household Size | # Housing Units | % Housing Units |
| 1-Person Household | 1,786 | 34.6% |
| 2-Person Household | 2,251 | 43.6% |
| 3-Person Household | 673 | 13.0% |
| 4+ Person Household | 455 | 8.8% |
| Total Housing Units | 5,165 | 100.0% |
Occupancy by Ownership by Household Size in Granbury
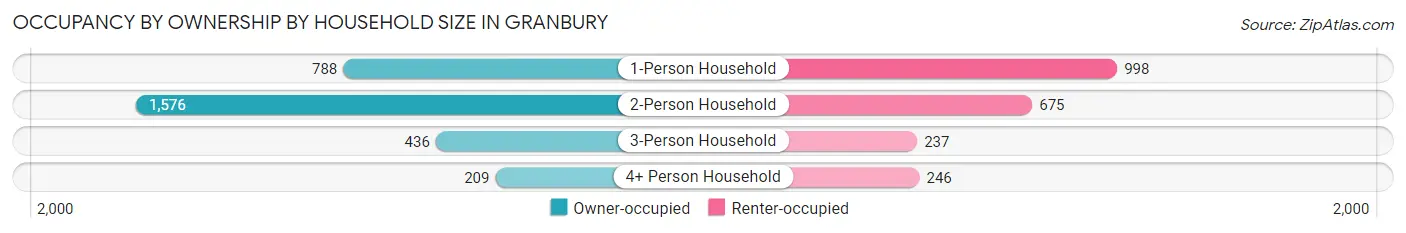
| Household Size | Owner-occupied | Renter-occupied |
| 1-Person Household | 788 (44.1%) | 998 (55.9%) |
| 2-Person Household | 1,576 (70.0%) | 675 (30.0%) |
| 3-Person Household | 436 (64.8%) | 237 (35.2%) |
| 4+ Person Household | 209 (45.9%) | 246 (54.1%) |
| Total Housing Units | 3,009 (58.3%) | 2,156 (41.7%) |
Occupancy by Educational Attainment in Granbury
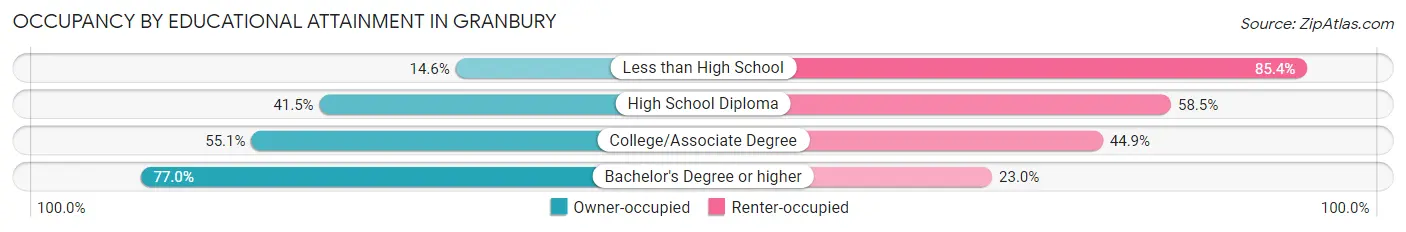
| Household Size | Owner-occupied | Renter-occupied |
| Less than High School | 23 (14.6%) | 135 (85.4%) |
| High School Diploma | 572 (41.5%) | 805 (58.5%) |
| College/Associate Degree | 957 (55.1%) | 781 (44.9%) |
| Bachelor's Degree or higher | 1,457 (77.0%) | 435 (23.0%) |
Occupancy by Age of Householder in Granbury
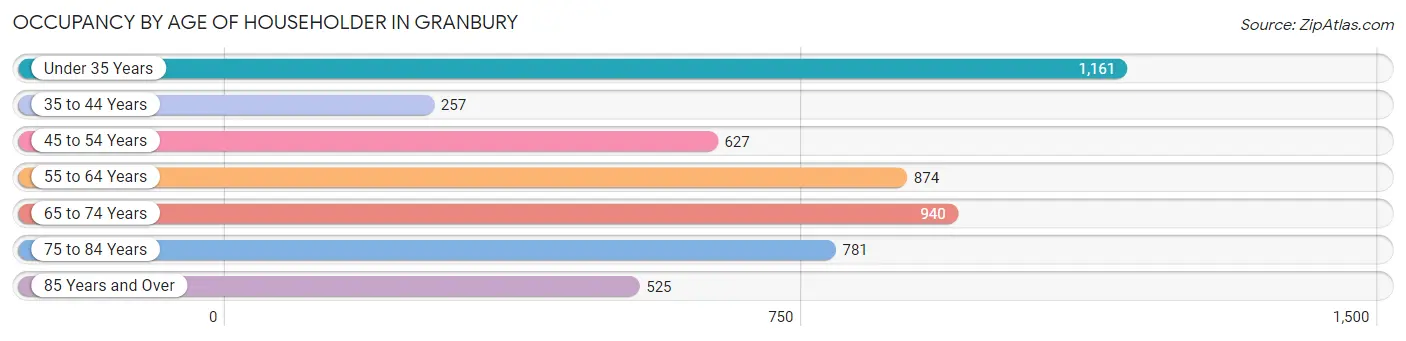
| Age Bracket | # Households | % Households |
| Under 35 Years | 1,161 | 22.5% |
| 35 to 44 Years | 257 | 5.0% |
| 45 to 54 Years | 627 | 12.1% |
| 55 to 64 Years | 874 | 16.9% |
| 65 to 74 Years | 940 | 18.2% |
| 75 to 84 Years | 781 | 15.1% |
| 85 Years and Over | 525 | 10.2% |
| Total | 5,165 | 100.0% |
Housing Finances in Granbury
Median Income by Occupancy in Granbury
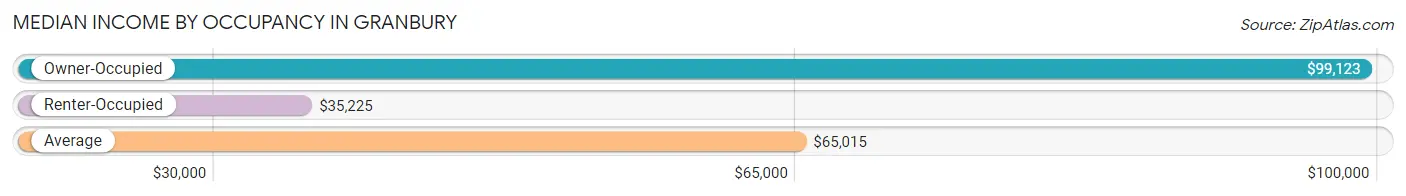
| Occupancy Type | # Households | Median Income |
| Owner-Occupied | 3,009 (58.3%) | $99,123 |
| Renter-Occupied | 2,156 (41.7%) | $35,225 |
| Average | 5,165 (100.0%) | $65,015 |
Occupancy by Householder Income Bracket in Granbury
| Income Bracket | Owner-occupied | Renter-occupied |
| Less than $5,000 | 10 (0.3%) | 43 (2.0%) |
| $5,000 to $9,999 | 7 (0.2%) | 23 (1.1%) |
| $10,000 to $14,999 | 103 (3.4%) | 96 (4.4%) |
| $15,000 to $19,999 | 167 (5.6%) | 116 (5.4%) |
| $20,000 to $24,999 | 78 (2.6%) | 292 (13.5%) |
| $25,000 to $34,999 | 136 (4.5%) | 500 (23.2%) |
| $35,000 to $49,999 | 230 (7.6%) | 312 (14.5%) |
| $50,000 to $74,999 | 402 (13.4%) | 350 (16.2%) |
| $75,000 to $99,999 | 415 (13.8%) | 177 (8.2%) |
| $100,000 to $149,999 | 837 (27.8%) | 167 (7.7%) |
| $150,000 or more | 624 (20.7%) | 80 (3.7%) |
| Total | 3,009 (100.0%) | 2,156 (100.0%) |
Monthly Housing Cost Tiers in Granbury
| Monthly Cost | Owner-occupied | Renter-occupied |
| Less than $300 | 46 (1.5%) | 34 (1.6%) |
| $300 to $499 | 284 (9.4%) | 110 (5.1%) |
| $500 to $799 | 359 (11.9%) | 175 (8.1%) |
| $800 to $999 | 167 (5.6%) | 235 (10.9%) |
| $1,000 to $1,499 | 784 (26.1%) | 714 (33.1%) |
| $1,500 to $1,999 | 788 (26.2%) | 544 (25.2%) |
| $2,000 to $2,499 | 153 (5.1%) | 19 (0.9%) |
| $2,500 to $2,999 | 101 (3.4%) | 123 (5.7%) |
| $3,000 or more | 327 (10.9%) | 88 (4.1%) |
| Total | 3,009 (100.0%) | 2,156 (100.0%) |
Physical Housing Characteristics in Granbury
Housing Structures in Granbury
| Structure Type | # Housing Units | % Housing Units |
| Single Unit, Detached | 3,066 | 59.4% |
| Single Unit, Attached | 210 | 4.1% |
| 2 Unit Apartments | 101 | 2.0% |
| 3 or 4 Unit Apartments | 345 | 6.7% |
| 5 to 9 Unit Apartments | 266 | 5.1% |
| 10 or more Apartments | 972 | 18.8% |
| Mobile Home / Other | 205 | 4.0% |
| Total | 5,165 | 100.0% |
Housing Structures by Occupancy in Granbury
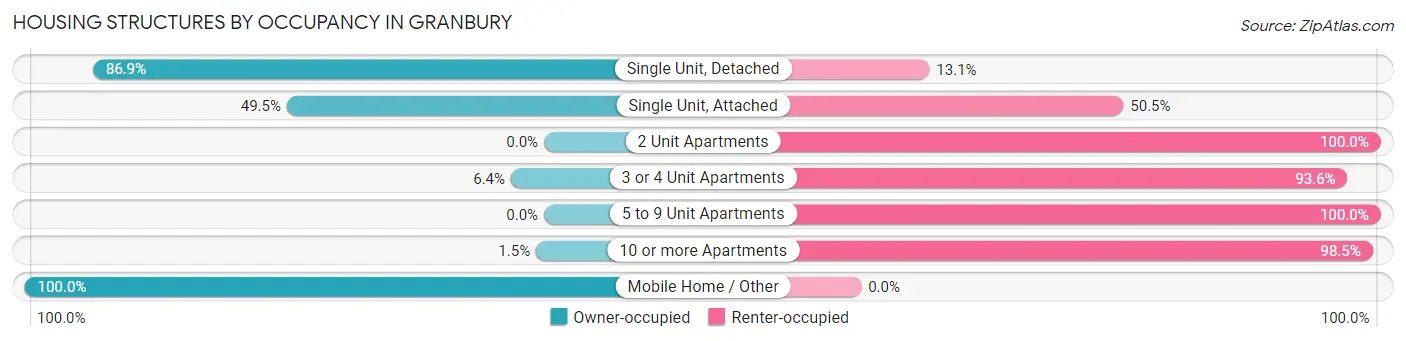
| Structure Type | Owner-occupied | Renter-occupied |
| Single Unit, Detached | 2,663 (86.9%) | 403 (13.1%) |
| Single Unit, Attached | 104 (49.5%) | 106 (50.5%) |
| 2 Unit Apartments | 0 (0.0%) | 101 (100.0%) |
| 3 or 4 Unit Apartments | 22 (6.4%) | 323 (93.6%) |
| 5 to 9 Unit Apartments | 0 (0.0%) | 266 (100.0%) |
| 10 or more Apartments | 15 (1.5%) | 957 (98.5%) |
| Mobile Home / Other | 205 (100.0%) | 0 (0.0%) |
| Total | 3,009 (58.3%) | 2,156 (41.7%) |
Housing Structures by Number of Rooms in Granbury
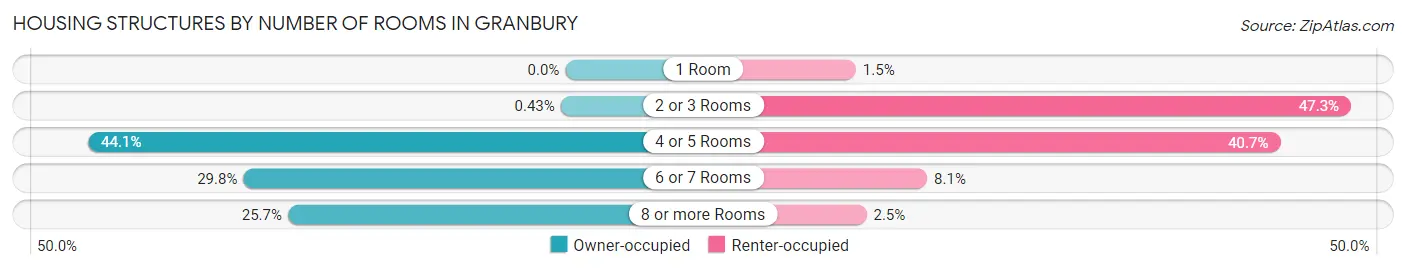
| Number of Rooms | Owner-occupied | Renter-occupied |
| 1 Room | 0 (0.0%) | 32 (1.5%) |
| 2 or 3 Rooms | 13 (0.4%) | 1,019 (47.3%) |
| 4 or 5 Rooms | 1,328 (44.1%) | 878 (40.7%) |
| 6 or 7 Rooms | 896 (29.8%) | 174 (8.1%) |
| 8 or more Rooms | 772 (25.7%) | 53 (2.5%) |
| Total | 3,009 (100.0%) | 2,156 (100.0%) |
Housing Structure by Heating Type in Granbury
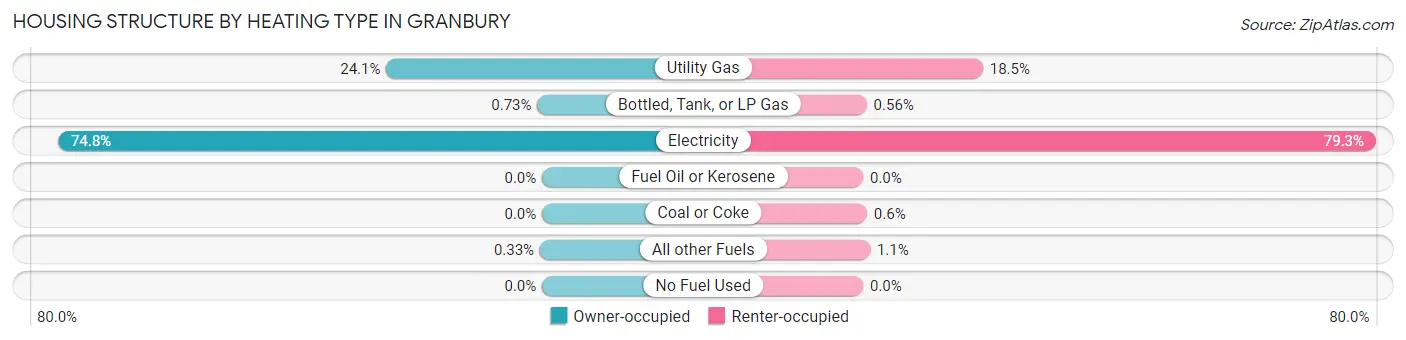
| Heating Type | Owner-occupied | Renter-occupied |
| Utility Gas | 725 (24.1%) | 399 (18.5%) |
| Bottled, Tank, or LP Gas | 22 (0.7%) | 12 (0.6%) |
| Electricity | 2,252 (74.8%) | 1,709 (79.3%) |
| Fuel Oil or Kerosene | 0 (0.0%) | 0 (0.0%) |
| Coal or Coke | 0 (0.0%) | 13 (0.6%) |
| All other Fuels | 10 (0.3%) | 23 (1.1%) |
| No Fuel Used | 0 (0.0%) | 0 (0.0%) |
| Total | 3,009 (100.0%) | 2,156 (100.0%) |
Household Vehicle Usage in Granbury
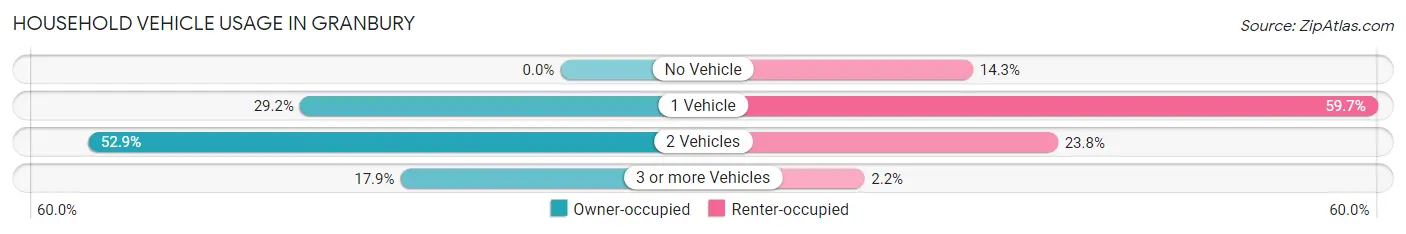
| Vehicles per Household | Owner-occupied | Renter-occupied |
| No Vehicle | 0 (0.0%) | 309 (14.3%) |
| 1 Vehicle | 878 (29.2%) | 1,286 (59.7%) |
| 2 Vehicles | 1,592 (52.9%) | 514 (23.8%) |
| 3 or more Vehicles | 539 (17.9%) | 47 (2.2%) |
| Total | 3,009 (100.0%) | 2,156 (100.0%) |
Real Estate & Mortgages in Granbury
Real Estate and Mortgage Overview in Granbury
| Characteristic | Without Mortgage | With Mortgage |
| Housing Units | 1,189 | 1,820 |
| Median Property Value | $251,700 | $248,500 |
| Median Household Income | $70,146 | $457 |
| Monthly Housing Costs | $707 | $327 |
| Real Estate Taxes | $3,420 | $97 |
Property Value by Mortgage Status in Granbury
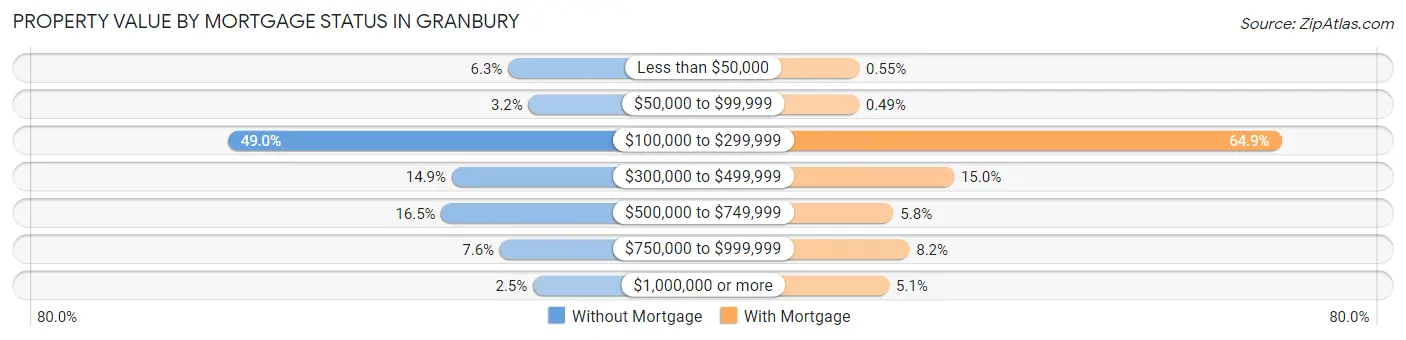
| Property Value | Without Mortgage | With Mortgage |
| Less than $50,000 | 75 (6.3%) | 10 (0.5%) |
| $50,000 to $99,999 | 38 (3.2%) | 9 (0.5%) |
| $100,000 to $299,999 | 583 (49.0%) | 1,181 (64.9%) |
| $300,000 to $499,999 | 177 (14.9%) | 273 (15.0%) |
| $500,000 to $749,999 | 196 (16.5%) | 105 (5.8%) |
| $750,000 to $999,999 | 90 (7.6%) | 149 (8.2%) |
| $1,000,000 or more | 30 (2.5%) | 93 (5.1%) |
| Total | 1,189 (100.0%) | 1,820 (100.0%) |
Household Income by Mortgage Status in Granbury
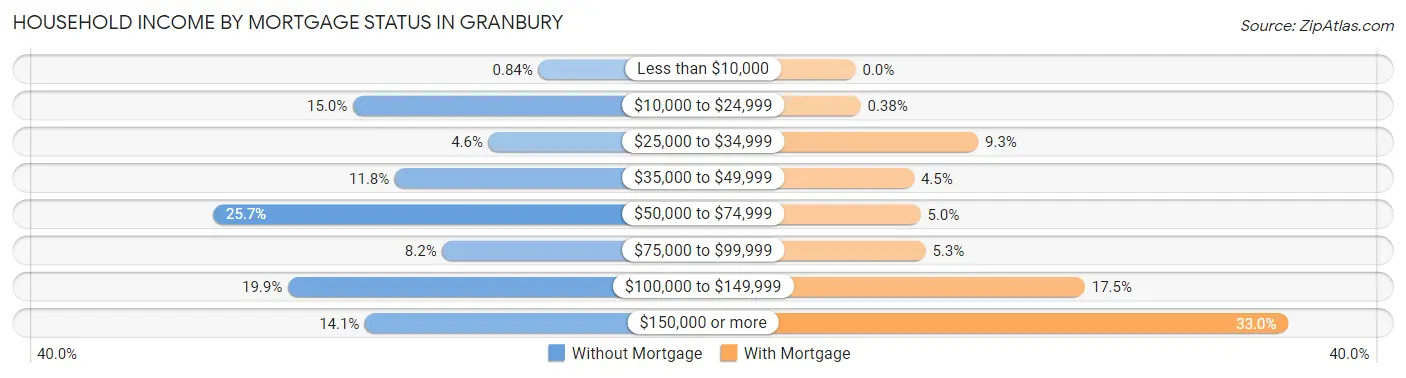
| Household Income | Without Mortgage | With Mortgage |
| Less than $10,000 | 10 (0.8%) | 0 (0.0%) |
| $10,000 to $24,999 | 178 (15.0%) | 7 (0.4%) |
| $25,000 to $34,999 | 55 (4.6%) | 170 (9.3%) |
| $35,000 to $49,999 | 140 (11.8%) | 81 (4.4%) |
| $50,000 to $74,999 | 305 (25.7%) | 90 (5.0%) |
| $75,000 to $99,999 | 97 (8.2%) | 97 (5.3%) |
| $100,000 to $149,999 | 237 (19.9%) | 318 (17.5%) |
| $150,000 or more | 167 (14.1%) | 600 (33.0%) |
| Total | 1,189 (100.0%) | 1,820 (100.0%) |
Property Value to Household Income Ratio in Granbury
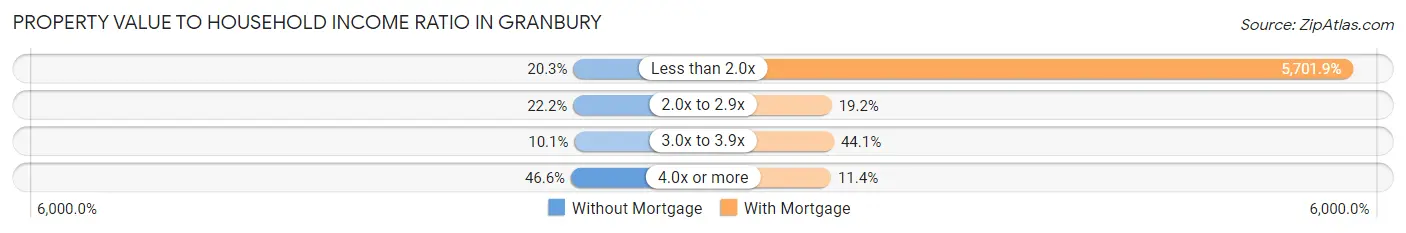
| Value-to-Income Ratio | Without Mortgage | With Mortgage |
| Less than 2.0x | 241 (20.3%) | 103,775 (5,701.9%) |
| 2.0x to 2.9x | 264 (22.2%) | 349 (19.2%) |
| 3.0x to 3.9x | 120 (10.1%) | 802 (44.1%) |
| 4.0x or more | 554 (46.6%) | 208 (11.4%) |
| Total | 1,189 (100.0%) | 1,820 (100.0%) |
Real Estate Taxes by Mortgage Status in Granbury
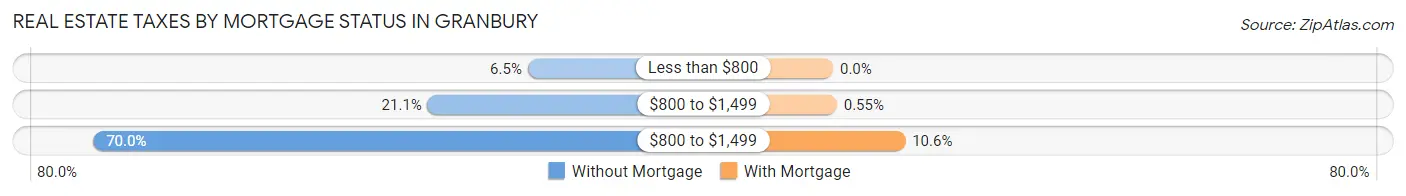
| Property Taxes | Without Mortgage | With Mortgage |
| Less than $800 | 77 (6.5%) | 0 (0.0%) |
| $800 to $1,499 | 251 (21.1%) | 10 (0.5%) |
| $800 to $1,499 | 832 (70.0%) | 192 (10.5%) |
| Total | 1,189 (100.0%) | 1,820 (100.0%) |
Health & Disability in Granbury
Health Insurance Coverage by Age in Granbury
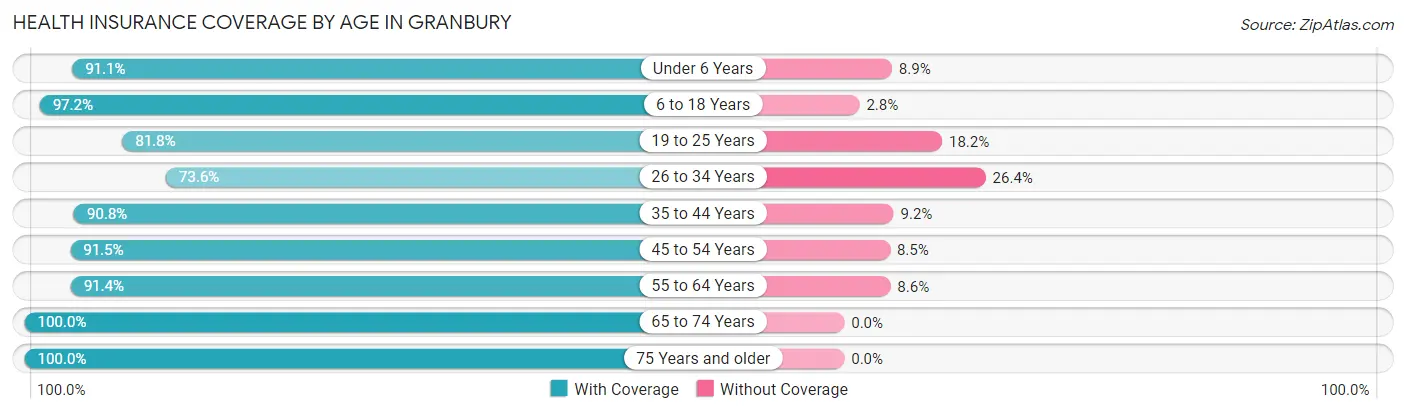
| Age Bracket | With Coverage | Without Coverage |
| Under 6 Years | 739 (91.1%) | 72 (8.9%) |
| 6 to 18 Years | 892 (97.2%) | 26 (2.8%) |
| 19 to 25 Years | 870 (81.8%) | 194 (18.2%) |
| 26 to 34 Years | 1,028 (73.6%) | 368 (26.4%) |
| 35 to 44 Years | 543 (90.8%) | 55 (9.2%) |
| 45 to 54 Years | 880 (91.5%) | 82 (8.5%) |
| 55 to 64 Years | 1,318 (91.4%) | 124 (8.6%) |
| 65 to 74 Years | 1,484 (100.0%) | 0 (0.0%) |
| 75 Years and older | 1,764 (100.0%) | 0 (0.0%) |
| Total | 9,518 (91.2%) | 921 (8.8%) |
Health Insurance Coverage by Citizenship Status in Granbury
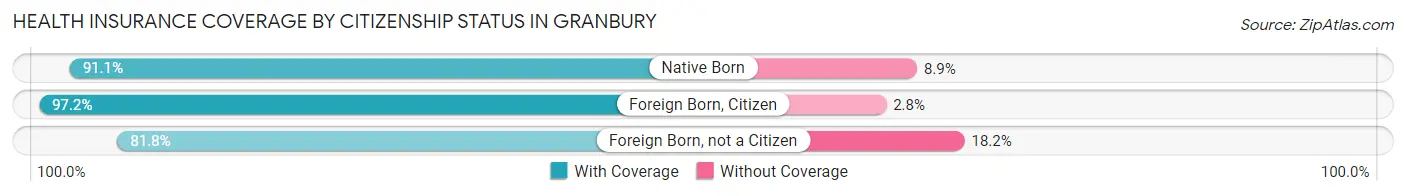
| Citizenship Status | With Coverage | Without Coverage |
| Native Born | 739 (91.1%) | 72 (8.9%) |
| Foreign Born, Citizen | 892 (97.2%) | 26 (2.8%) |
| Foreign Born, not a Citizen | 870 (81.8%) | 194 (18.2%) |
Health Insurance Coverage by Household Income in Granbury
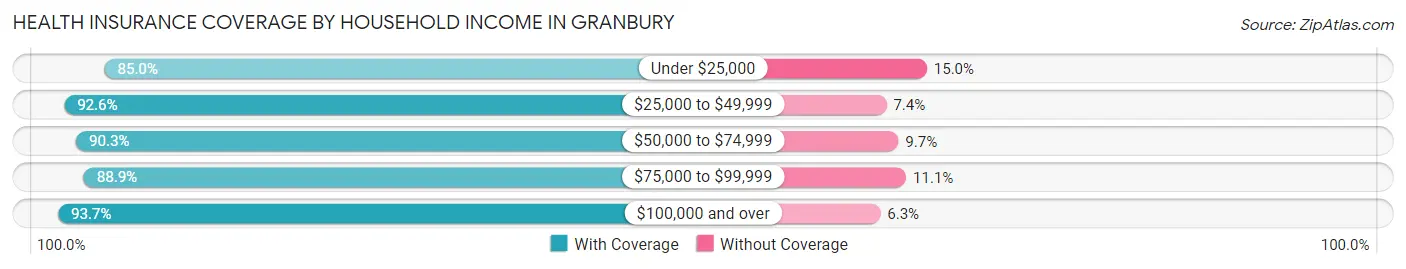
| Household Income | With Coverage | Without Coverage |
| Under $25,000 | 1,235 (85.0%) | 218 (15.0%) |
| $25,000 to $49,999 | 1,807 (92.6%) | 145 (7.4%) |
| $50,000 to $74,999 | 1,383 (90.3%) | 148 (9.7%) |
| $75,000 to $99,999 | 1,207 (88.9%) | 151 (11.1%) |
| $100,000 and over | 3,866 (93.7%) | 259 (6.3%) |
Public vs Private Health Insurance Coverage by Age in Granbury
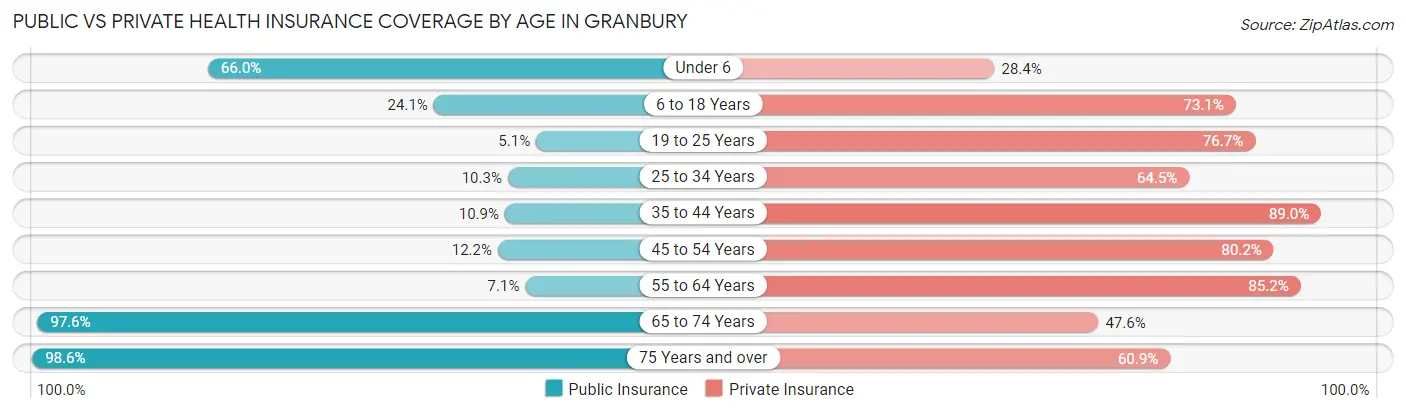
| Age Bracket | Public Insurance | Private Insurance |
| Under 6 | 535 (66.0%) | 230 (28.4%) |
| 6 to 18 Years | 221 (24.1%) | 671 (73.1%) |
| 19 to 25 Years | 54 (5.1%) | 816 (76.7%) |
| 25 to 34 Years | 144 (10.3%) | 900 (64.5%) |
| 35 to 44 Years | 65 (10.9%) | 532 (89.0%) |
| 45 to 54 Years | 117 (12.2%) | 771 (80.1%) |
| 55 to 64 Years | 102 (7.1%) | 1,228 (85.2%) |
| 65 to 74 Years | 1,449 (97.6%) | 707 (47.6%) |
| 75 Years and over | 1,739 (98.6%) | 1,075 (60.9%) |
| Total | 4,426 (42.4%) | 6,930 (66.4%) |
Disability Status by Sex by Age in Granbury
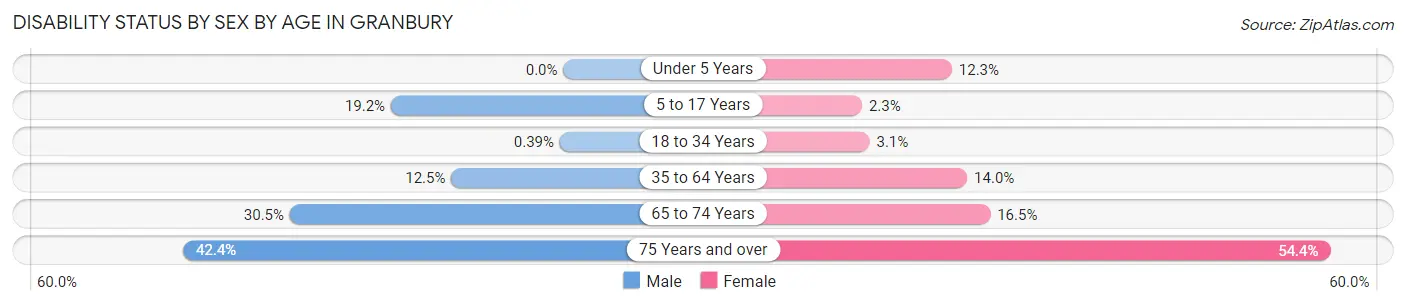
| Age Bracket | Male | Female |
| Under 5 Years | 0 (0.0%) | 38 (12.3%) |
| 5 to 17 Years | 53 (19.2%) | 15 (2.2%) |
| 18 to 34 Years | 5 (0.4%) | 38 (3.1%) |
| 35 to 64 Years | 152 (12.5%) | 249 (14.0%) |
| 65 to 74 Years | 194 (30.5%) | 140 (16.5%) |
| 75 Years and over | 319 (42.4%) | 550 (54.4%) |
Disability Class by Sex by Age in Granbury
Disability Class: Hearing Difficulty
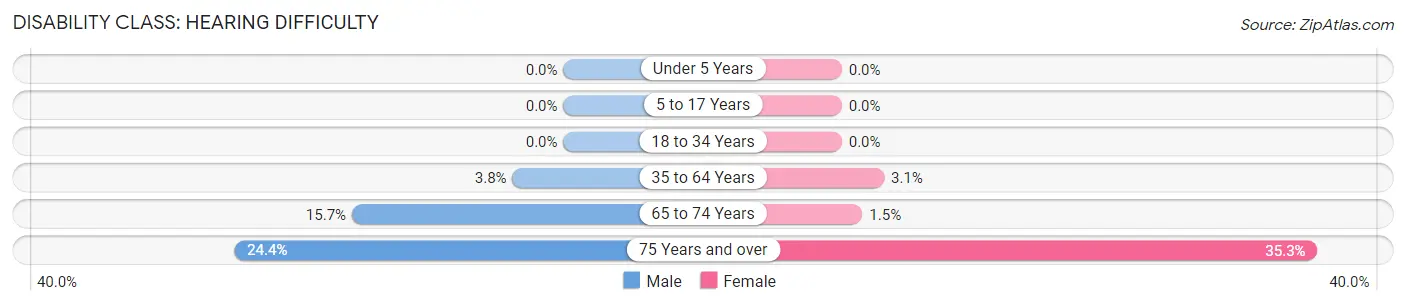
| Age Bracket | Male | Female |
| Under 5 Years | 0 (0.0%) | 0 (0.0%) |
| 5 to 17 Years | 0 (0.0%) | 0 (0.0%) |
| 18 to 34 Years | 0 (0.0%) | 0 (0.0%) |
| 35 to 64 Years | 46 (3.8%) | 56 (3.1%) |
| 65 to 74 Years | 100 (15.7%) | 13 (1.5%) |
| 75 Years and over | 184 (24.4%) | 357 (35.3%) |
Disability Class: Vision Difficulty
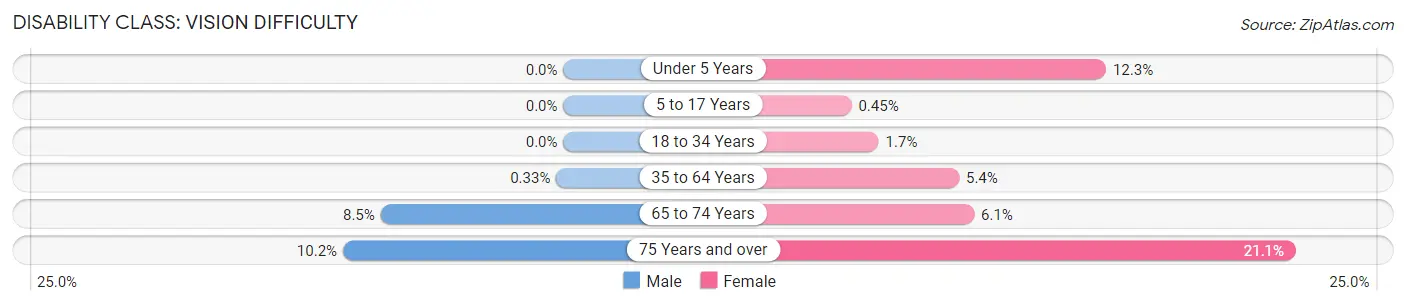
| Age Bracket | Male | Female |
| Under 5 Years | 0 (0.0%) | 38 (12.3%) |
| 5 to 17 Years | 0 (0.0%) | 3 (0.4%) |
| 18 to 34 Years | 0 (0.0%) | 21 (1.7%) |
| 35 to 64 Years | 4 (0.3%) | 97 (5.4%) |
| 65 to 74 Years | 54 (8.5%) | 52 (6.1%) |
| 75 Years and over | 77 (10.2%) | 213 (21.1%) |
Disability Class: Cognitive Difficulty
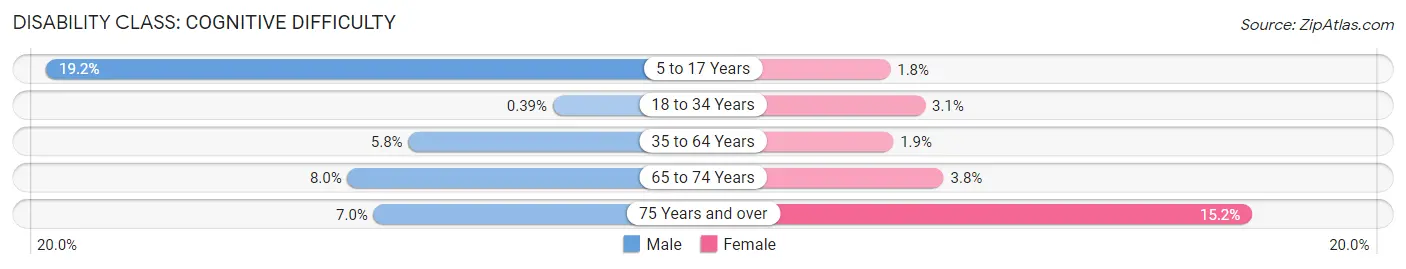
| Age Bracket | Male | Female |
| 5 to 17 Years | 53 (19.2%) | 12 (1.8%) |
| 18 to 34 Years | 5 (0.4%) | 38 (3.1%) |
| 35 to 64 Years | 70 (5.8%) | 34 (1.9%) |
| 65 to 74 Years | 51 (8.0%) | 32 (3.8%) |
| 75 Years and over | 53 (7.0%) | 154 (15.2%) |
Disability Class: Ambulatory Difficulty
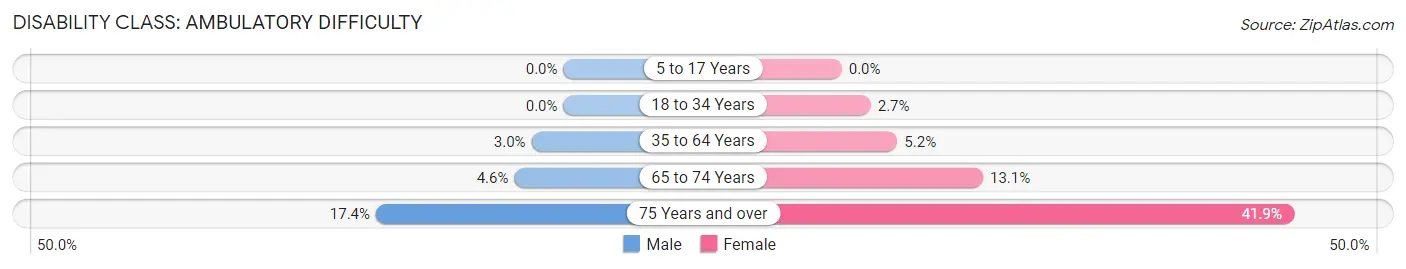
| Age Bracket | Male | Female |
| 5 to 17 Years | 0 (0.0%) | 0 (0.0%) |
| 18 to 34 Years | 0 (0.0%) | 33 (2.7%) |
| 35 to 64 Years | 36 (3.0%) | 92 (5.2%) |
| 65 to 74 Years | 29 (4.5%) | 111 (13.1%) |
| 75 Years and over | 131 (17.4%) | 424 (41.9%) |
Disability Class: Self-Care Difficulty
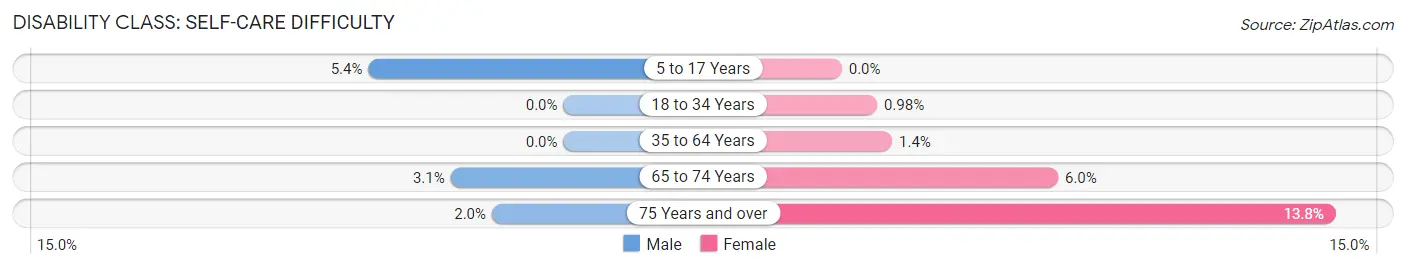
| Age Bracket | Male | Female |
| 5 to 17 Years | 15 (5.4%) | 0 (0.0%) |
| 18 to 34 Years | 0 (0.0%) | 12 (1.0%) |
| 35 to 64 Years | 0 (0.0%) | 25 (1.4%) |
| 65 to 74 Years | 20 (3.1%) | 51 (6.0%) |
| 75 Years and over | 15 (2.0%) | 139 (13.8%) |
Technology Access in Granbury
Computing Device Access in Granbury
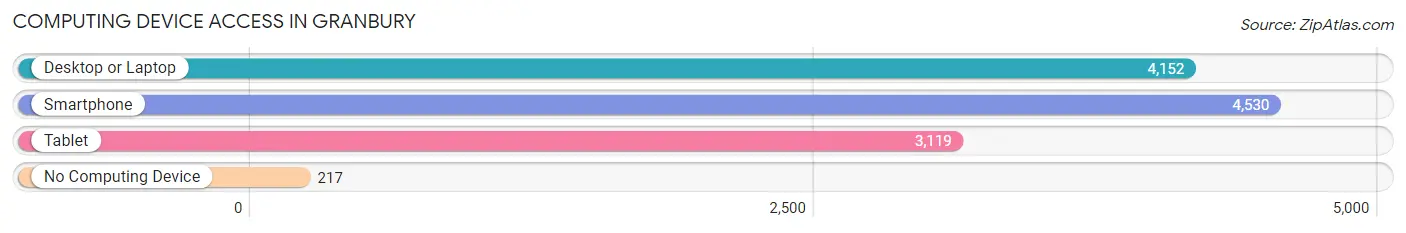
| Device Type | # Households | % Households |
| Desktop or Laptop | 4,152 | 80.4% |
| Smartphone | 4,530 | 87.7% |
| Tablet | 3,119 | 60.4% |
| No Computing Device | 217 | 4.2% |
| Total | 5,165 | 100.0% |
Internet Access in Granbury
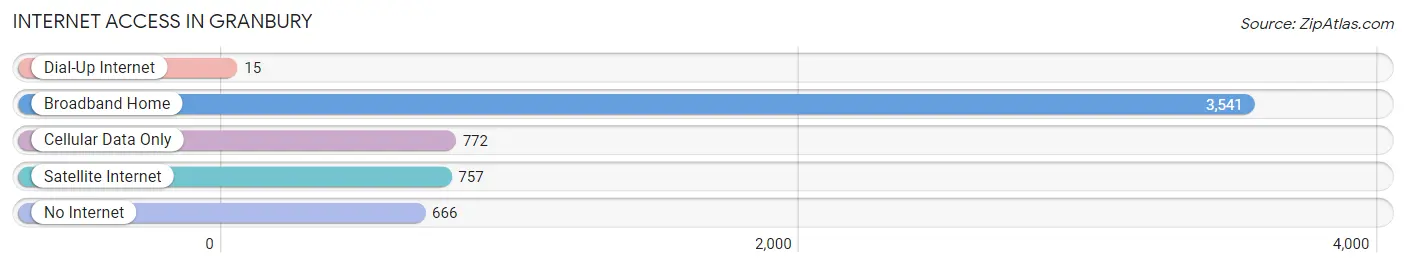
| Internet Type | # Households | % Households |
| Dial-Up Internet | 15 | 0.3% |
| Broadband Home | 3,541 | 68.6% |
| Cellular Data Only | 772 | 14.9% |
| Satellite Internet | 757 | 14.7% |
| No Internet | 666 | 12.9% |
| Total | 5,165 | 100.0% |
Granbury Summary
Granbury, Texas is a small city located in Hood County, Texas, about 40 miles southwest of Fort Worth. It is the county seat of Hood County and has a population of 8,279 as of the 2010 census. The city is named after Confederate General Hiram B. Granberry.
History
Granbury was founded in 1887 by General Hiram B. Granberry and his wife, Elizabeth. The city was named after the General, who was a veteran of the Civil War and a prominent figure in the area. The city was incorporated in 1887 and was the first city in Hood County.
Granbury was a thriving town in the late 19th century, with a population of over 1,000 people. The city was home to several businesses, including a cotton gin, a flour mill, a sawmill, and a brick factory. The city also had a school, a bank, and a newspaper.
In the early 20th century, Granbury experienced a period of growth and prosperity. The city was home to several large businesses, including a cotton mill, a lumber mill, and a brick factory. The city also had a hospital, a library, and a movie theater.
In the late 20th century, Granbury experienced a period of decline. The city's population decreased from over 1,000 in the early 1900s to just over 8,000 in the 2010 census. The city's economy shifted from agriculture to tourism, with the city becoming a popular destination for tourists.
Geography
Granbury is located in Hood County, Texas, about 40 miles southwest of Fort Worth. The city is situated on the Brazos River and is surrounded by rolling hills and wooded areas. The city has a total area of 8.3 square miles, with a population density of 990 people per square mile.
Economy
Granbury's economy is largely based on tourism. The city is home to several attractions, including the Granbury Opera House, the Granbury Historic Square, and the Granbury City Park. The city also has several restaurants, shops, and hotels.
The city is also home to several manufacturing companies, including a steel mill, a plastics factory, and a printing company. The city also has several retail stores, including a Walmart Supercenter and a Home Depot.
Demographics
As of the 2010 census, Granbury had a population of 8,279. The racial makeup of the city was 79.2% White, 11.3% African American, 0.7% Native American, 0.7% Asian, 0.1% Pacific Islander, 6.2% from other races, and 2.0% from two or more races. Hispanic or Latino of any race were 13.3% of the population.
The median income for a household in Granbury was $41,945, and the median income for a family was $50,945. The per capita income for the city was $21,945. About 11.3% of families and 14.2% of the population were below the poverty line, including 18.2% of those under age 18 and 8.2% of those age 65 or over.
Common Questions
What is Per Capita Income in Granbury?
Per Capita income in Granbury is $45,255.
What is the Median Family Income in Granbury?
Median Family Income in Granbury is $95,592.
What is the Median Household income in Granbury?
Median Household Income in Granbury is $65,015.
What is Income or Wage Gap in Granbury?
Income or Wage Gap in Granbury is 54.4%.
Women in Granbury earn 45.6 cents for every dollar earned by a man.
What is Family Income Deficit in Granbury?
Family Income Deficit in Granbury is $8,486.
Families that are below poverty line in Granbury earn $8,486 less on average than the poverty threshold level.
What is Inequality or Gini Index in Granbury?
Inequality or Gini Index in Granbury is 0.50.
What is the Total Population of Granbury?
Total Population of Granbury is 11,218.
What is the Total Male Population of Granbury?
Total Male Population of Granbury is 5,054.
What is the Total Female Population of Granbury?
Total Female Population of Granbury is 6,164.
What is the Ratio of Males per 100 Females in Granbury?
There are 81.99 Males per 100 Females in Granbury.
What is the Ratio of Females per 100 Males in Granbury?
There are 121.96 Females per 100 Males in Granbury.
What is the Median Population Age in Granbury?
Median Population Age in Granbury is 52.0 Years.
What is the Average Family Size in Granbury
Average Family Size in Granbury is 2.5 People.
What is the Average Household Size in Granbury
Average Household Size in Granbury is 2.0 People.
How Large is the Labor Force in Granbury?
There are 4,766 People in the Labor Forcein in Granbury.
What is the Percentage of People in the Labor Force in Granbury?
49.0% of People are in the Labor Force in Granbury.
What is the Unemployment Rate in Granbury?
Unemployment Rate in Granbury is 3.4%.