Glen Rose, TX Map & Demographics
Glen Rose Map
Glen Rose Overview
$35,086
PER CAPITA INCOME
$89,423
AVG FAMILY INCOME
$73,804
AVG HOUSEHOLD INCOME
49.1%
WAGE / INCOME GAP [ % ]
50.9¢/ $1
WAGE / INCOME GAP [ $ ]
0.39
INEQUALITY / GINI INDEX
2,698
TOTAL POPULATION
1,225
MALE POPULATION
1,473
FEMALE POPULATION
83.16
MALES / 100 FEMALES
120.24
FEMALES / 100 MALES
43.6
MEDIAN AGE
2.9
AVG FAMILY SIZE
2.7
AVG HOUSEHOLD SIZE
1,298
LABOR FORCE [ PEOPLE ]
58.9%
PERCENT IN LABOR FORCE
2.6%
UNEMPLOYMENT RATE
Glen Rose Zip Codes
Glen Rose Area Codes
Income in Glen Rose
Income Overview in Glen Rose
Per Capita Income in Glen Rose is $35,086, while median incomes of families and households are $89,423 and $73,804 respectively.
| Characteristic | Number | Measure |
| Per Capita Income | 2,698 | $35,086 |
| Median Family Income | 734 | $89,423 |
| Mean Family Income | 734 | $97,508 |
| Median Household Income | 954 | $73,804 |
| Mean Household Income | 954 | $89,212 |
| Income Deficit | 734 | $0 |
| Wage / Income Gap (%) | 2,698 | 49.13% |
| Wage / Income Gap ($) | 2,698 | 50.87¢ per $1 |
| Gini / Inequality Index | 2,698 | 0.39 |
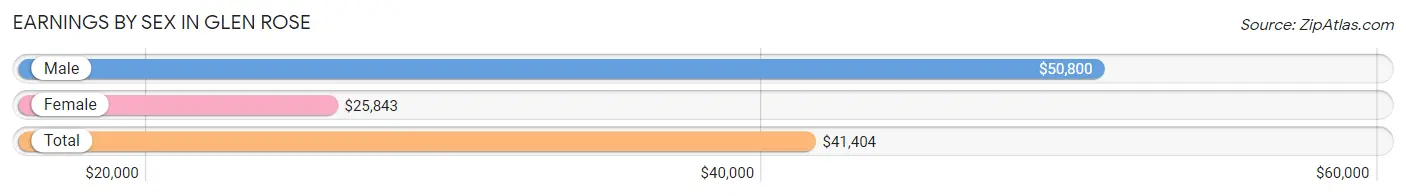
Earnings by Sex in Glen Rose
Average Earnings in Glen Rose are $41,404, $50,800 for men and $25,843 for women, a difference of 49.1%.
| Sex | Number | Average Earnings |
| Male | 748 (55.9%) | $50,800 |
| Female | 589 (44.1%) | $25,843 |
| Total | 1,337 (100.0%) | $41,404 |
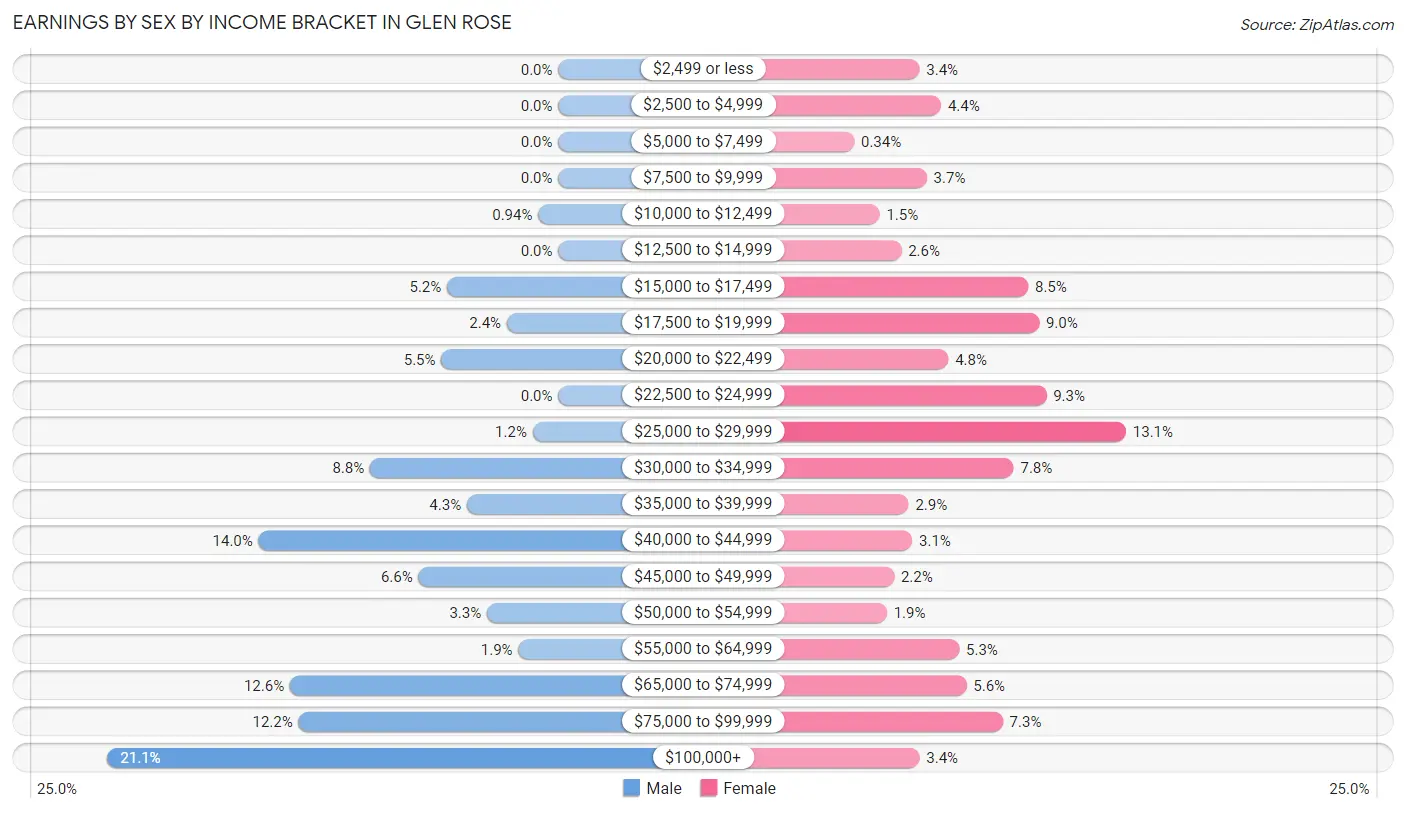
Earnings by Sex by Income Bracket in Glen Rose
The most common earnings brackets in Glen Rose are $100,000+ for men (158 | 21.1%) and $25,000 to $29,999 for women (77 | 13.1%).
| Income | Male | Female |
| $2,499 or less | 0 (0.0%) | 20 (3.4%) |
| $2,500 to $4,999 | 0 (0.0%) | 26 (4.4%) |
| $5,000 to $7,499 | 0 (0.0%) | 2 (0.3%) |
| $7,500 to $9,999 | 0 (0.0%) | 22 (3.7%) |
| $10,000 to $12,499 | 7 (0.9%) | 9 (1.5%) |
| $12,500 to $14,999 | 0 (0.0%) | 15 (2.5%) |
| $15,000 to $17,499 | 39 (5.2%) | 50 (8.5%) |
| $17,500 to $19,999 | 18 (2.4%) | 53 (9.0%) |
| $20,000 to $22,499 | 41 (5.5%) | 28 (4.8%) |
| $22,500 to $24,999 | 0 (0.0%) | 55 (9.3%) |
| $25,000 to $29,999 | 9 (1.2%) | 77 (13.1%) |
| $30,000 to $34,999 | 66 (8.8%) | 46 (7.8%) |
| $35,000 to $39,999 | 32 (4.3%) | 17 (2.9%) |
| $40,000 to $44,999 | 105 (14.0%) | 18 (3.1%) |
| $45,000 to $49,999 | 49 (6.6%) | 13 (2.2%) |
| $50,000 to $54,999 | 25 (3.3%) | 11 (1.9%) |
| $55,000 to $64,999 | 14 (1.9%) | 31 (5.3%) |
| $65,000 to $74,999 | 94 (12.6%) | 33 (5.6%) |
| $75,000 to $99,999 | 91 (12.2%) | 43 (7.3%) |
| $100,000+ | 158 (21.1%) | 20 (3.4%) |
| Total | 748 (100.0%) | 589 (100.0%) |
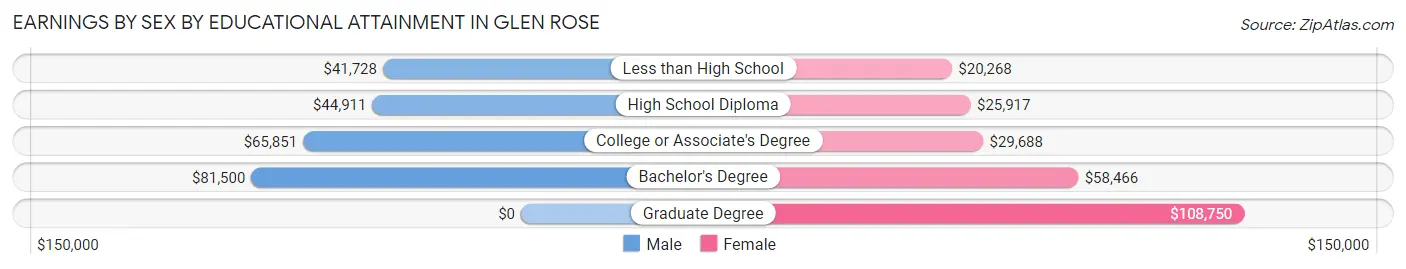
Earnings by Sex by Educational Attainment in Glen Rose
Average earnings in Glen Rose are $65,185 for men and $27,209 for women, a difference of 58.3%. Men with an educational attainment of bachelor's degree enjoy the highest average annual earnings of $81,500, while those with less than high school education earn the least with $41,728. Women with an educational attainment of graduate degree earn the most with the average annual earnings of $108,750, while those with less than high school education have the smallest earnings of $20,268.
| Educational Attainment | Male Income | Female Income |
| Less than High School | $41,728 | $20,268 |
| High School Diploma | $44,911 | $25,917 |
| College or Associate's Degree | $65,851 | $29,688 |
| Bachelor's Degree | $81,500 | $58,466 |
| Graduate Degree | - | - |
| Total | $65,185 | $27,209 |
Family Income in Glen Rose
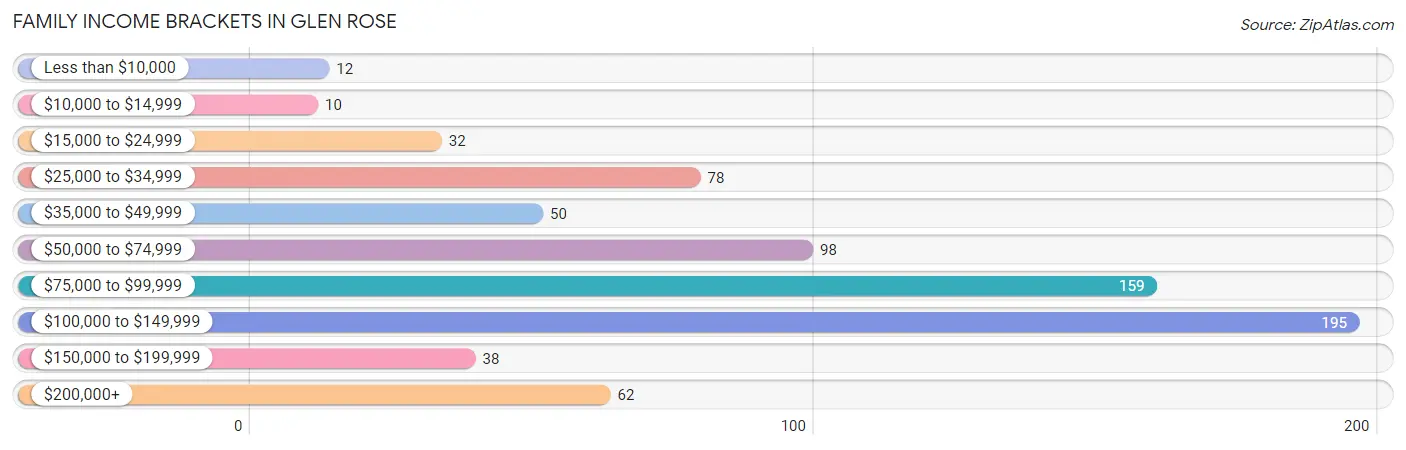
Family Income Brackets in Glen Rose
According to the Glen Rose family income data, there are 195 families falling into the $100,000 to $149,999 income range, which is the most common income bracket and makes up 26.6% of all families. Conversely, the $10,000 to $14,999 income bracket is the least frequent group with only 10 families (1.4%) belonging to this category.
| Income Bracket | # Families | % Families |
| Less than $10,000 | 12 | 1.6% |
| $10,000 to $14,999 | 10 | 1.4% |
| $15,000 to $24,999 | 32 | 4.4% |
| $25,000 to $34,999 | 78 | 10.6% |
| $35,000 to $49,999 | 50 | 6.8% |
| $50,000 to $74,999 | 98 | 13.4% |
| $75,000 to $99,999 | 159 | 21.7% |
| $100,000 to $149,999 | 195 | 26.6% |
| $150,000 to $199,999 | 38 | 5.2% |
| $200,000+ | 62 | 8.4% |
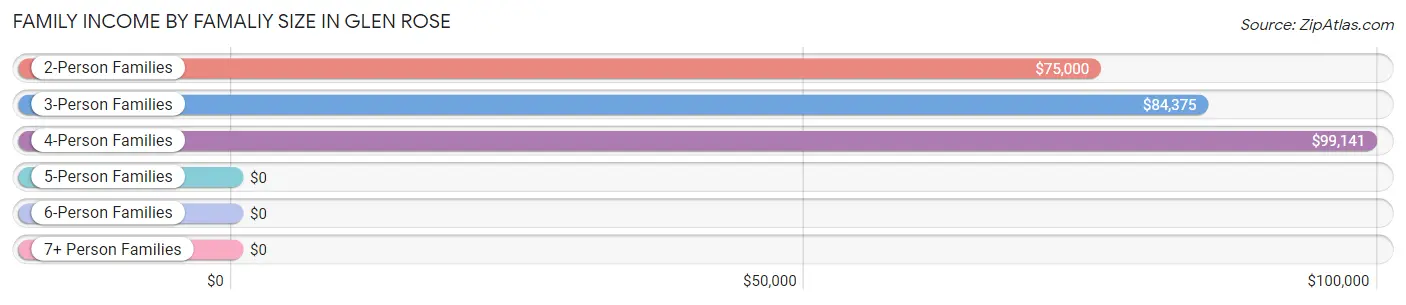
Family Income by Famaliy Size in Glen Rose
4-person families (135 | 18.4%) account for the highest median family income in Glen Rose with $99,141 per family, while 2-person families (378 | 51.5%) have the highest median income of $37,500 per family member.
| Income Bracket | # Families | Median Income |
| 2-Person Families | 378 (51.5%) | $75,000 |
| 3-Person Families | 169 (23.0%) | $84,375 |
| 4-Person Families | 135 (18.4%) | $99,141 |
| 5-Person Families | 21 (2.9%) | $0 |
| 6-Person Families | 12 (1.6%) | $0 |
| 7+ Person Families | 19 (2.6%) | $0 |
| Total | 734 (100.0%) | $89,423 |
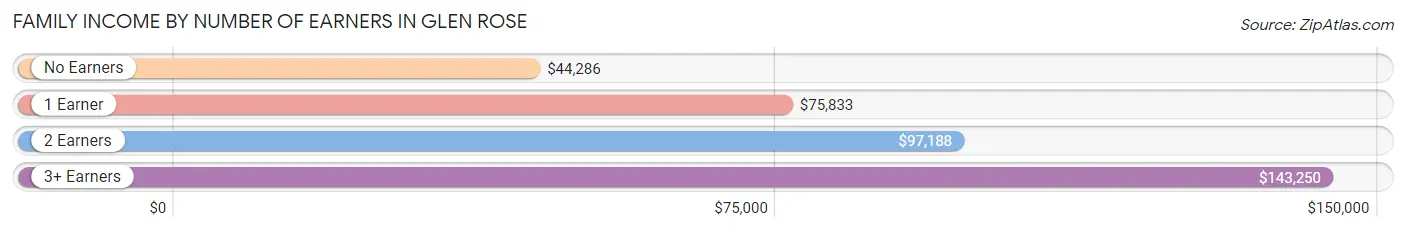
Family Income by Number of Earners in Glen Rose
The median family income in Glen Rose is $89,423, with families comprising 3+ earners (35) having the highest median family income of $143,250, while families with no earners (112) have the lowest median family income of $44,286, accounting for 4.8% and 15.3% of families, respectively.
| Number of Earners | # Families | Median Income |
| No Earners | 112 (15.3%) | $44,286 |
| 1 Earner | 224 (30.5%) | $75,833 |
| 2 Earners | 363 (49.5%) | $97,188 |
| 3+ Earners | 35 (4.8%) | $143,250 |
| Total | 734 (100.0%) | $89,423 |
Household Income in Glen Rose
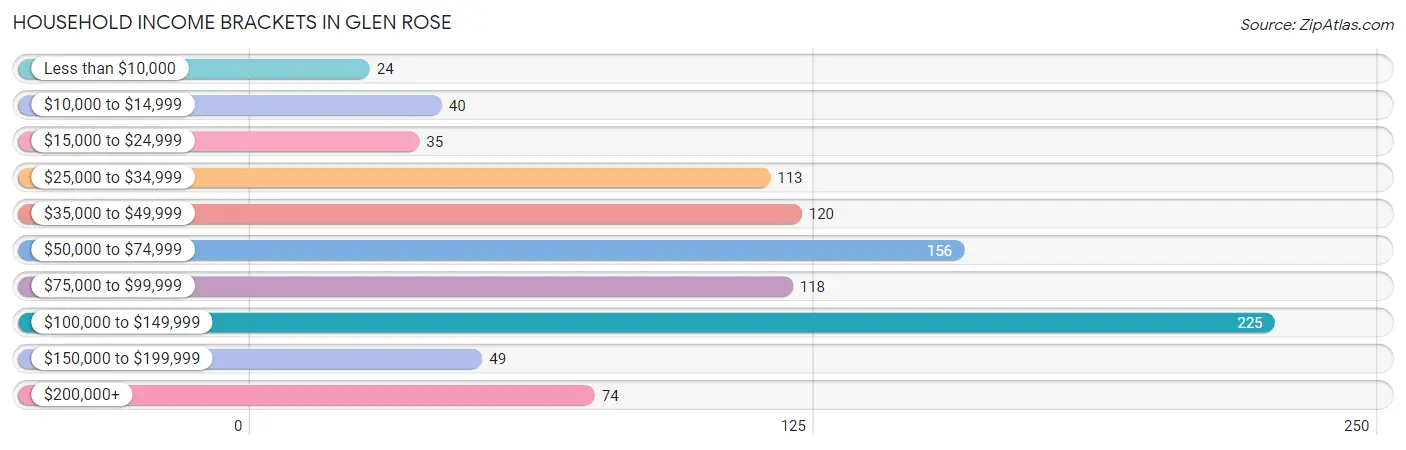
Household Income Brackets in Glen Rose
With 225 households falling in the category, the $100,000 to $149,999 income range is the most frequent in Glen Rose, accounting for 23.6% of all households. In contrast, only 24 households (2.5%) fall into the less than $10,000 income bracket, making it the least populous group.
| Income Bracket | # Households | % Households |
| Less than $10,000 | 24 | 2.5% |
| $10,000 to $14,999 | 40 | 4.2% |
| $15,000 to $24,999 | 35 | 3.7% |
| $25,000 to $34,999 | 113 | 11.8% |
| $35,000 to $49,999 | 120 | 12.6% |
| $50,000 to $74,999 | 156 | 16.4% |
| $75,000 to $99,999 | 118 | 12.4% |
| $100,000 to $149,999 | 225 | 23.6% |
| $150,000 to $199,999 | 49 | 5.1% |
| $200,000+ | 74 | 7.8% |
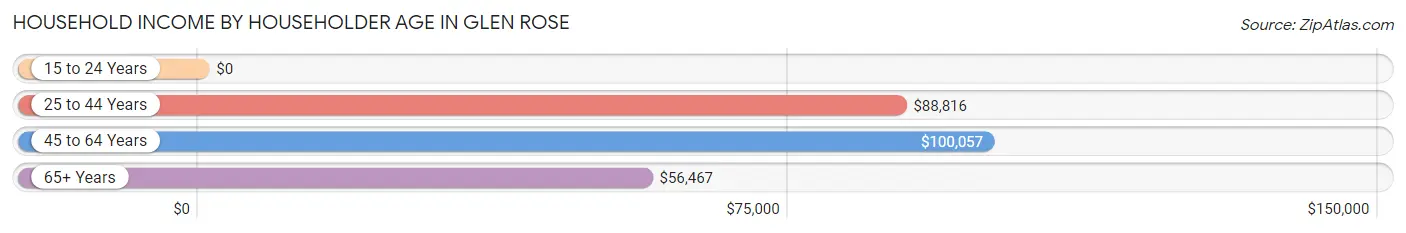
Household Income by Householder Age in Glen Rose
The median household income in Glen Rose is $73,804, with the highest median household income of $100,057 found in the 45 to 64 years age bracket for the primary householder. A total of 343 households (35.9%) fall into this category. Meanwhile, the 15 to 24 years age bracket for the primary householder has the lowest median household income of $0, with 12 households (1.3%) in this group.
| Income Bracket | # Households | Median Income |
| 15 to 24 Years | 12 (1.3%) | $0 |
| 25 to 44 Years | 306 (32.1%) | $88,816 |
| 45 to 64 Years | 343 (35.9%) | $100,057 |
| 65+ Years | 293 (30.7%) | $56,467 |
| Total | 954 (100.0%) | $73,804 |
Poverty in Glen Rose
Income Below Poverty by Sex and Age in Glen Rose
With 4.8% poverty level for males and 11.0% for females among the residents of Glen Rose, 5 year old males and 16 and 17 year old females are the most vulnerable to poverty, with 9 males (39.1%) and 8 females (25.8%) in their respective age groups living below the poverty level.
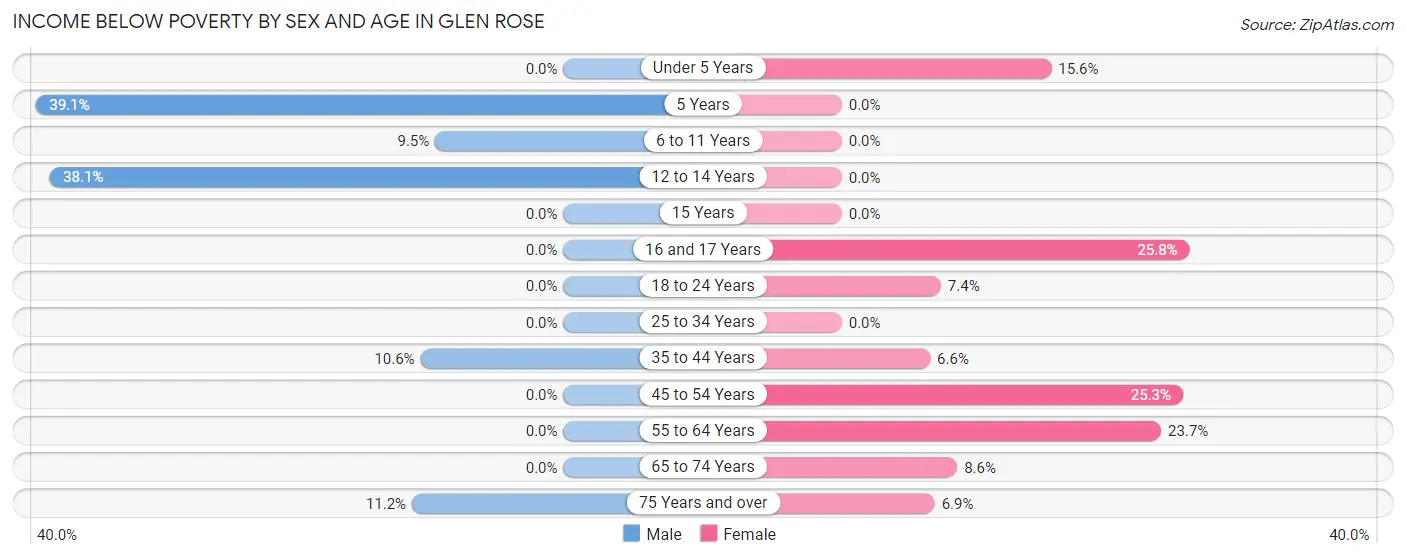
| Age Bracket | Male | Female |
| Under 5 Years | 0 (0.0%) | 7 (15.6%) |
| 5 Years | 9 (39.1%) | 0 (0.0%) |
| 6 to 11 Years | 8 (9.5%) | 0 (0.0%) |
| 12 to 14 Years | 8 (38.1%) | 0 (0.0%) |
| 15 Years | 0 (0.0%) | 0 (0.0%) |
| 16 and 17 Years | 0 (0.0%) | 8 (25.8%) |
| 18 to 24 Years | 0 (0.0%) | 12 (7.4%) |
| 25 to 34 Years | 0 (0.0%) | 0 (0.0%) |
| 35 to 44 Years | 21 (10.6%) | 12 (6.6%) |
| 45 to 54 Years | 0 (0.0%) | 40 (25.3%) |
| 55 to 64 Years | 0 (0.0%) | 55 (23.7%) |
| 65 to 74 Years | 0 (0.0%) | 12 (8.6%) |
| 75 Years and over | 10 (11.2%) | 4 (6.9%) |
| Total | 56 (4.8%) | 150 (11.0%) |
Income Above Poverty by Sex and Age in Glen Rose
According to the poverty statistics in Glen Rose, males aged under 5 years and females aged 5 years are the age groups that are most secure financially, with 100.0% of males and 100.0% of females in these age groups living above the poverty line.
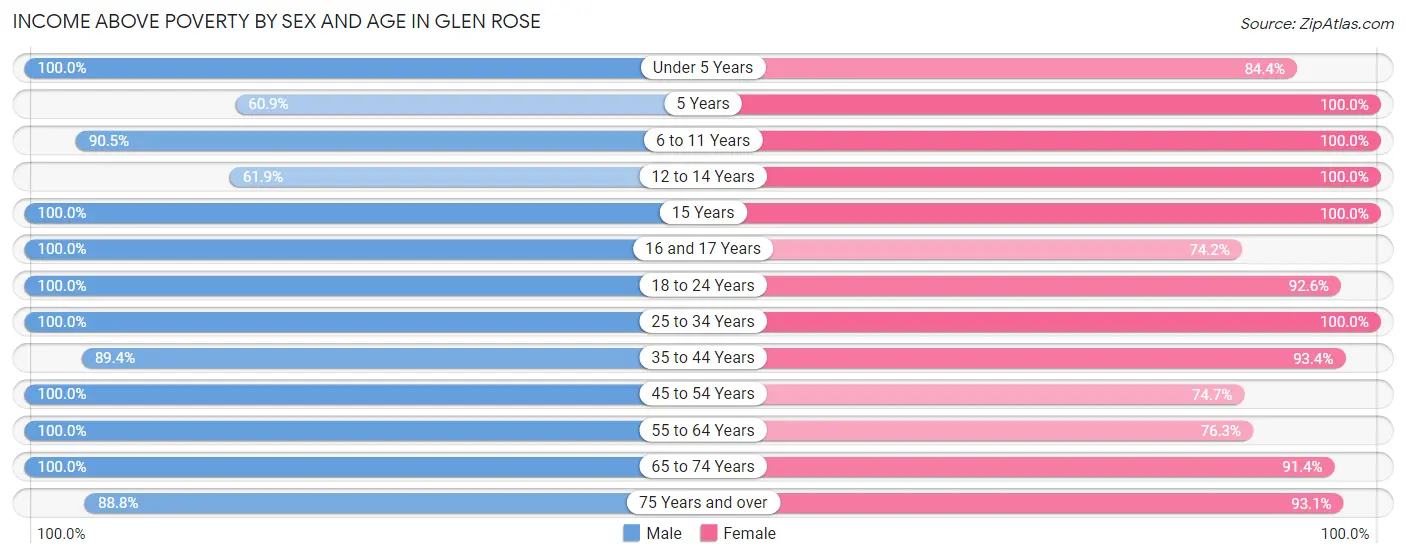
| Age Bracket | Male | Female |
| Under 5 Years | 73 (100.0%) | 38 (84.4%) |
| 5 Years | 14 (60.9%) | 7 (100.0%) |
| 6 to 11 Years | 76 (90.5%) | 41 (100.0%) |
| 12 to 14 Years | 13 (61.9%) | 164 (100.0%) |
| 15 Years | 16 (100.0%) | 20 (100.0%) |
| 16 and 17 Years | 8 (100.0%) | 23 (74.2%) |
| 18 to 24 Years | 90 (100.0%) | 151 (92.6%) |
| 25 to 34 Years | 114 (100.0%) | 119 (100.0%) |
| 35 to 44 Years | 177 (89.4%) | 171 (93.4%) |
| 45 to 54 Years | 151 (100.0%) | 118 (74.7%) |
| 55 to 64 Years | 154 (100.0%) | 177 (76.3%) |
| 65 to 74 Years | 151 (100.0%) | 128 (91.4%) |
| 75 Years and over | 79 (88.8%) | 54 (93.1%) |
| Total | 1,116 (95.2%) | 1,211 (89.0%) |
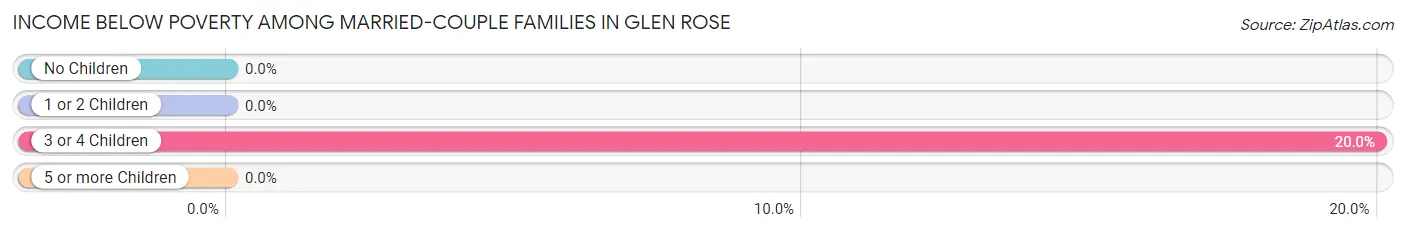
Income Below Poverty Among Married-Couple Families in Glen Rose
The poverty statistics for married-couple families in Glen Rose show that 1.6% or 9 of the total 549 families live below the poverty line. Families with 3 or 4 children have the highest poverty rate of 20.0%, comprising of 9 families. On the other hand, families with no children have the lowest poverty rate of 0.0%, which includes 0 families.
| Children | Above Poverty | Below Poverty |
| No Children | 336 (100.0%) | 0 (0.0%) |
| 1 or 2 Children | 168 (100.0%) | 0 (0.0%) |
| 3 or 4 Children | 36 (80.0%) | 9 (20.0%) |
| 5 or more Children | 0 (0.0%) | 0 (0.0%) |
| Total | 540 (98.4%) | 9 (1.6%) |
Income Below Poverty Among Single-Parent Households in Glen Rose
According to the poverty data in Glen Rose, 27.9% or 22 single-father households and 11.3% or 12 single-mother households are living below the poverty line. Among single-father households, those with no children have the highest poverty rate, with 10 households (100.0%) experiencing poverty. Likewise, among single-mother households, those with 1 or 2 children have the highest poverty rate, with 12 households (12.5%) falling below the poverty line.
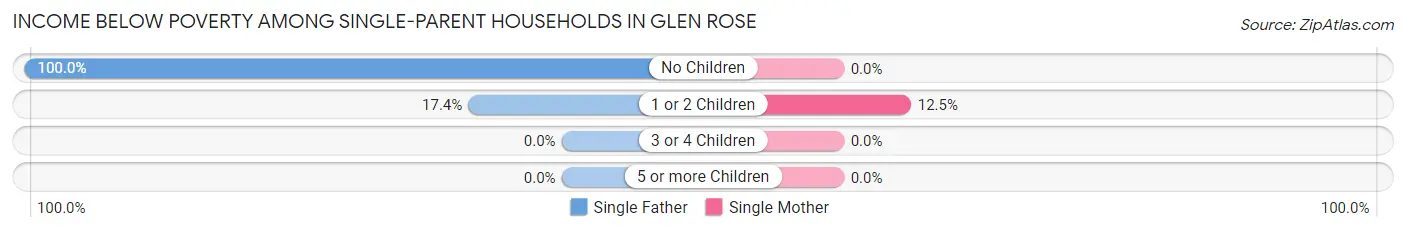
| Children | Single Father | Single Mother |
| No Children | 10 (100.0%) | 0 (0.0%) |
| 1 or 2 Children | 12 (17.4%) | 12 (12.5%) |
| 3 or 4 Children | 0 (0.0%) | 0 (0.0%) |
| 5 or more Children | 0 (0.0%) | 0 (0.0%) |
| Total | 22 (27.9%) | 12 (11.3%) |
Income Below Poverty Among Married-Couple vs Single-Parent Households in Glen Rose
The poverty data for Glen Rose shows that 9 of the married-couple family households (1.6%) and 34 of the single-parent households (18.4%) are living below the poverty level. Within the married-couple family households, those with 3 or 4 children have the highest poverty rate, with 9 households (20.0%) falling below the poverty line. Among the single-parent households, those with no children have the highest poverty rate, with 10 household (50.0%) living below poverty.
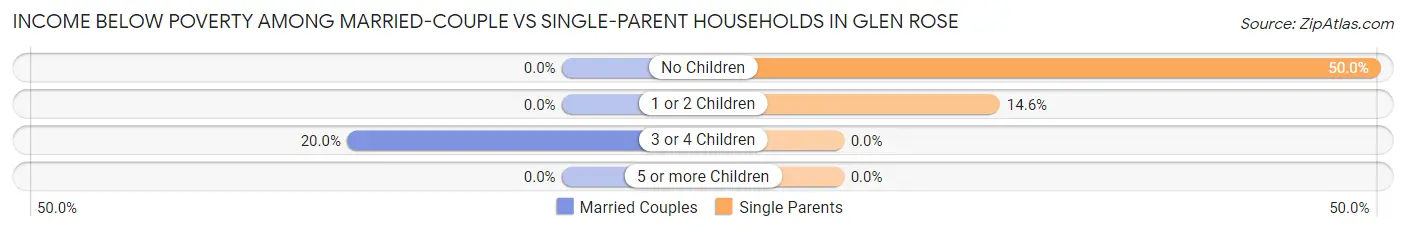
| Children | Married-Couple Families | Single-Parent Households |
| No Children | 0 (0.0%) | 10 (50.0%) |
| 1 or 2 Children | 0 (0.0%) | 24 (14.5%) |
| 3 or 4 Children | 9 (20.0%) | 0 (0.0%) |
| 5 or more Children | 0 (0.0%) | 0 (0.0%) |
| Total | 9 (1.6%) | 34 (18.4%) |
Race in Glen Rose
The most populous races in Glen Rose are White / Caucasian (2,134 | 79.1%), Hispanic or Latino (598 | 22.2%), and Two or more Races (367 | 13.6%).
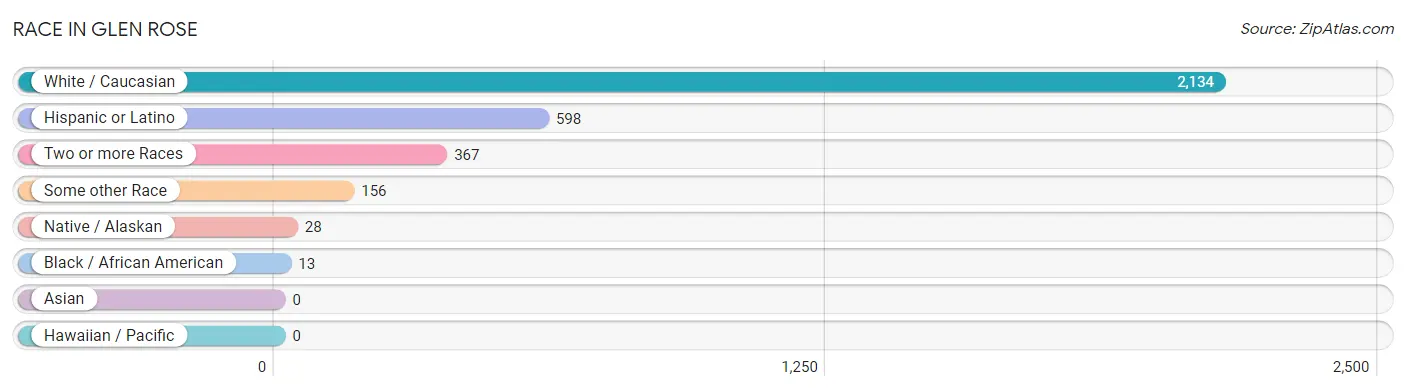
| Race | # Population | % Population |
| Asian | 0 | 0.0% |
| Black / African American | 13 | 0.5% |
| Hawaiian / Pacific | 0 | 0.0% |
| Hispanic or Latino | 598 | 22.2% |
| Native / Alaskan | 28 | 1.0% |
| White / Caucasian | 2,134 | 79.1% |
| Two or more Races | 367 | 13.6% |
| Some other Race | 156 | 5.8% |
| Total | 2,698 | 100.0% |
Ancestry in Glen Rose
The most populous ancestries reported in Glen Rose are Mexican (537 | 19.9%), English (432 | 16.0%), German (327 | 12.1%), Irish (216 | 8.0%), and American (177 | 6.6%), together accounting for 62.6% of all Glen Rose residents.
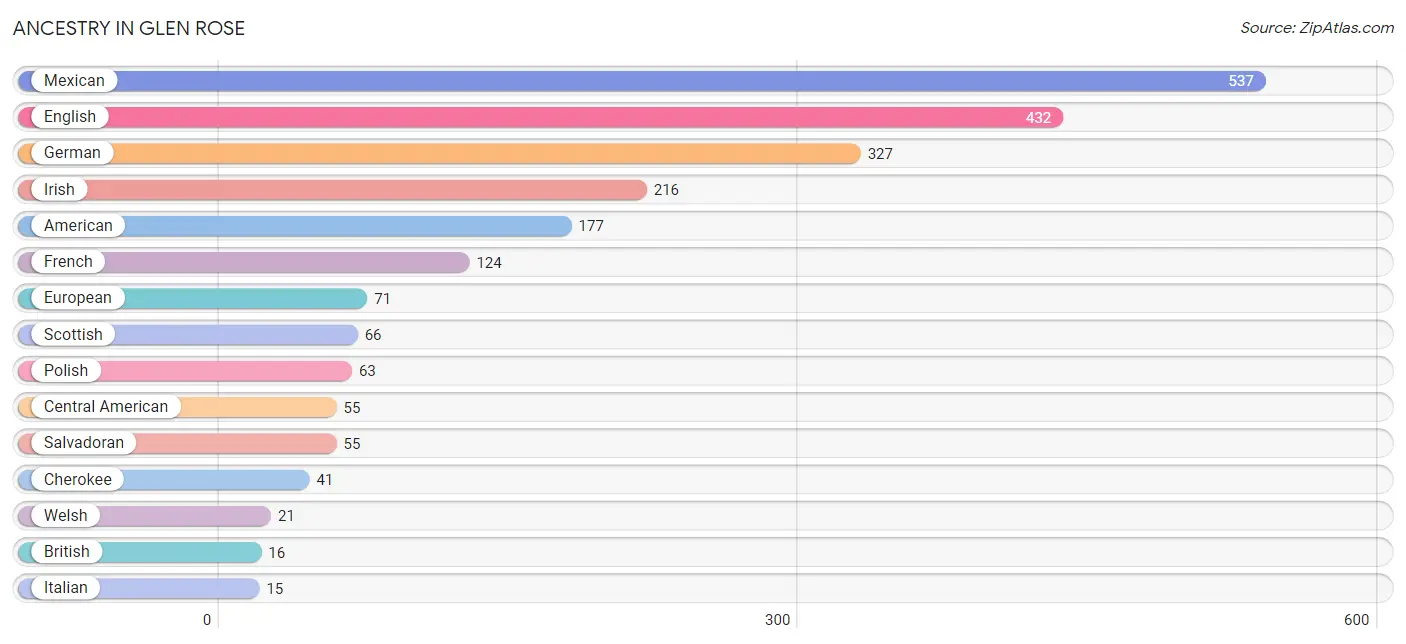
| Ancestry | # Population | % Population |
| American | 177 | 6.6% |
| British | 16 | 0.6% |
| Central American | 55 | 2.0% |
| Cherokee | 41 | 1.5% |
| Choctaw | 5 | 0.2% |
| Czech | 3 | 0.1% |
| Czechoslovakian | 9 | 0.3% |
| Danish | 5 | 0.2% |
| Dutch | 7 | 0.3% |
| English | 432 | 16.0% |
| European | 71 | 2.6% |
| French | 124 | 4.6% |
| German | 327 | 12.1% |
| Greek | 12 | 0.4% |
| Irish | 216 | 8.0% |
| Italian | 15 | 0.6% |
| Mexican | 537 | 19.9% |
| Polish | 63 | 2.3% |
| Puerto Rican | 6 | 0.2% |
| Salvadoran | 55 | 2.0% |
| Scotch-Irish | 7 | 0.3% |
| Scottish | 66 | 2.5% |
| Swedish | 8 | 0.3% |
| Swiss | 2 | 0.1% |
| Welsh | 21 | 0.8% | View All 25 Rows |
Immigrants in Glen Rose
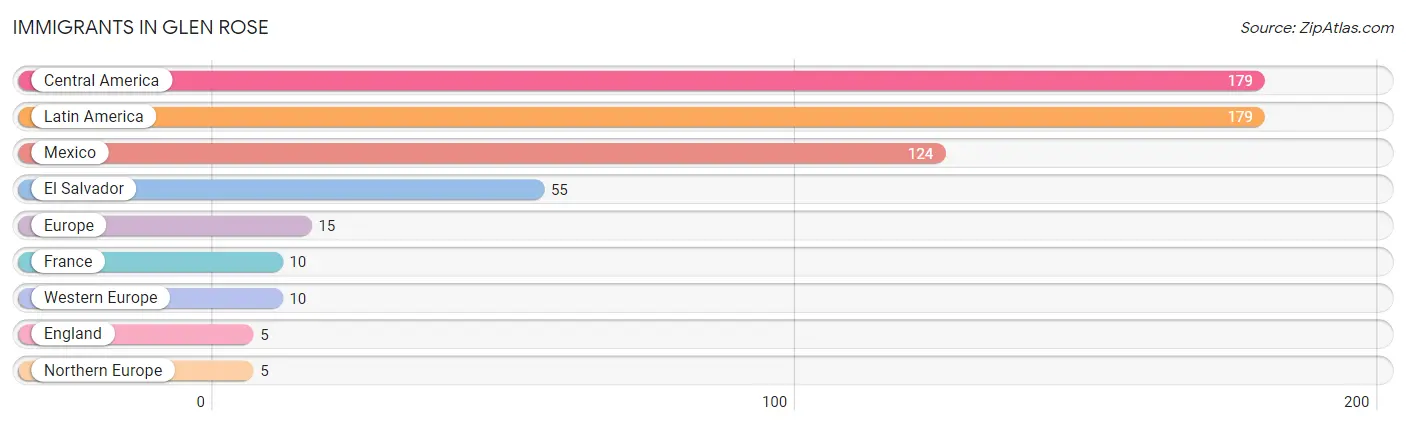
The most numerous immigrant groups reported in Glen Rose came from Central America (179 | 6.6%), Latin America (179 | 6.6%), Mexico (124 | 4.6%), El Salvador (55 | 2.0%), and Europe (15 | 0.6%), together accounting for 20.5% of all Glen Rose residents.
| Immigration Origin | # Population | % Population |
| Central America | 179 | 6.6% |
| El Salvador | 55 | 2.0% |
| England | 5 | 0.2% |
| Europe | 15 | 0.6% |
| France | 10 | 0.4% |
| Latin America | 179 | 6.6% |
| Mexico | 124 | 4.6% |
| Northern Europe | 5 | 0.2% |
| Western Europe | 10 | 0.4% | View All 9 Rows |
Sex and Age in Glen Rose
Sex and Age in Glen Rose
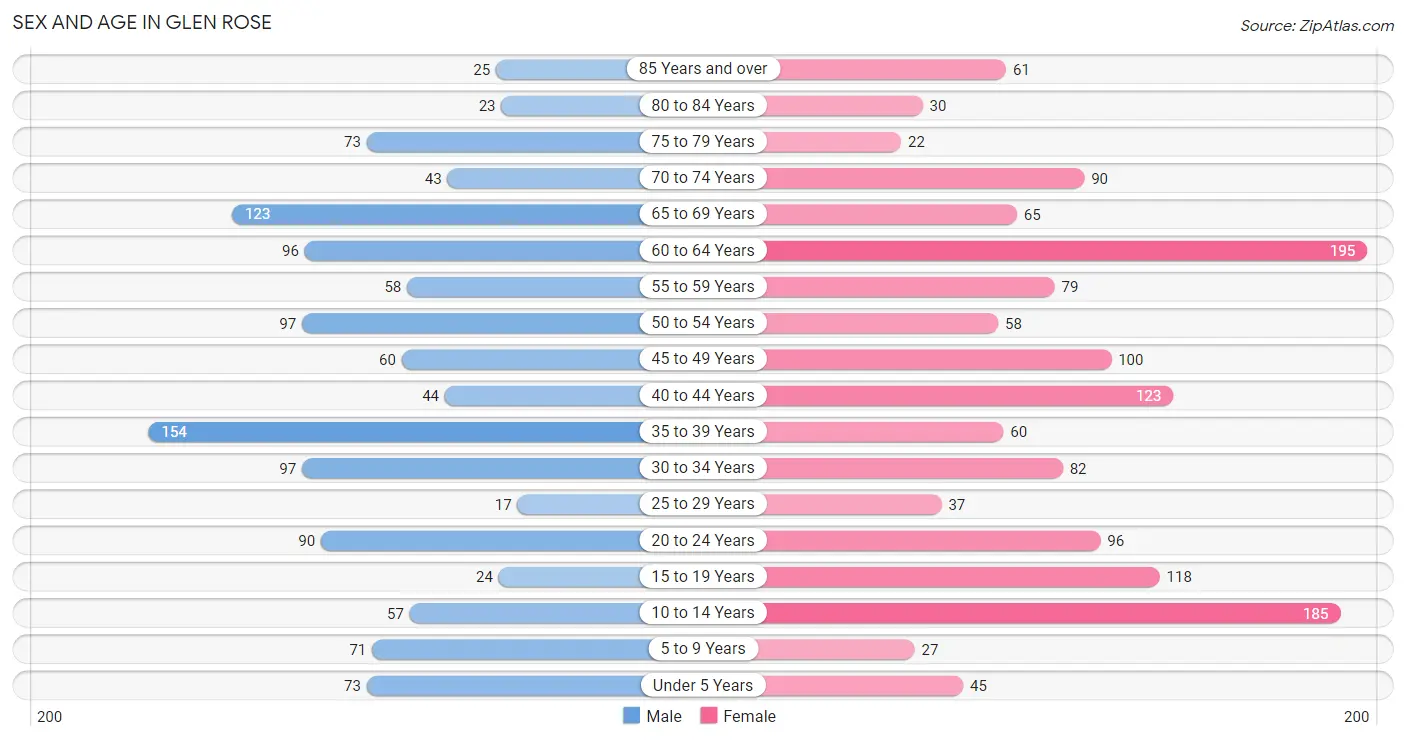
The most populous age groups in Glen Rose are 35 to 39 Years (154 | 12.6%) for men and 60 to 64 Years (195 | 13.2%) for women.
| Age Bracket | Male | Female |
| Under 5 Years | 73 (6.0%) | 45 (3.0%) |
| 5 to 9 Years | 71 (5.8%) | 27 (1.8%) |
| 10 to 14 Years | 57 (4.6%) | 185 (12.6%) |
| 15 to 19 Years | 24 (2.0%) | 118 (8.0%) |
| 20 to 24 Years | 90 (7.3%) | 96 (6.5%) |
| 25 to 29 Years | 17 (1.4%) | 37 (2.5%) |
| 30 to 34 Years | 97 (7.9%) | 82 (5.6%) |
| 35 to 39 Years | 154 (12.6%) | 60 (4.1%) |
| 40 to 44 Years | 44 (3.6%) | 123 (8.4%) |
| 45 to 49 Years | 60 (4.9%) | 100 (6.8%) |
| 50 to 54 Years | 97 (7.9%) | 58 (3.9%) |
| 55 to 59 Years | 58 (4.7%) | 79 (5.4%) |
| 60 to 64 Years | 96 (7.8%) | 195 (13.2%) |
| 65 to 69 Years | 123 (10.0%) | 65 (4.4%) |
| 70 to 74 Years | 43 (3.5%) | 90 (6.1%) |
| 75 to 79 Years | 73 (6.0%) | 22 (1.5%) |
| 80 to 84 Years | 23 (1.9%) | 30 (2.0%) |
| 85 Years and over | 25 (2.0%) | 61 (4.1%) |
| Total | 1,225 (100.0%) | 1,473 (100.0%) |
Families and Households in Glen Rose
Median Family Size in Glen Rose
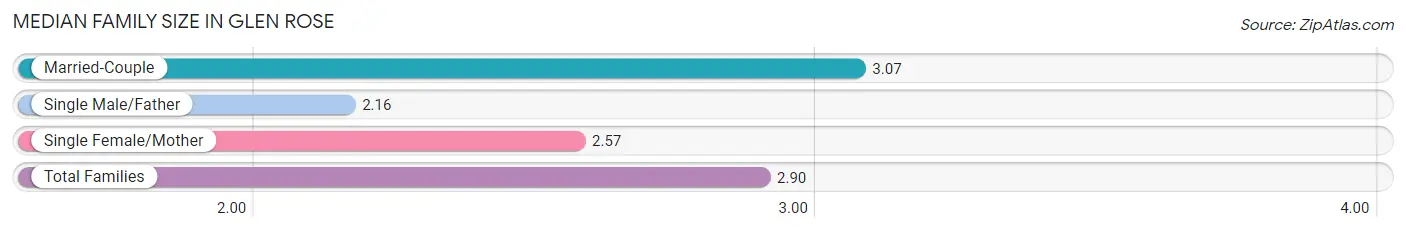
The median family size in Glen Rose is 2.90 persons per family, with married-couple families (549 | 74.8%) accounting for the largest median family size of 3.07 persons per family. On the other hand, single male/father families (79 | 10.8%) represent the smallest median family size with 2.16 persons per family.
| Family Type | # Families | Family Size |
| Married-Couple | 549 (74.8%) | 3.07 |
| Single Male/Father | 79 (10.8%) | 2.16 |
| Single Female/Mother | 106 (14.4%) | 2.57 |
| Total Families | 734 (100.0%) | 2.90 |
Median Household Size in Glen Rose
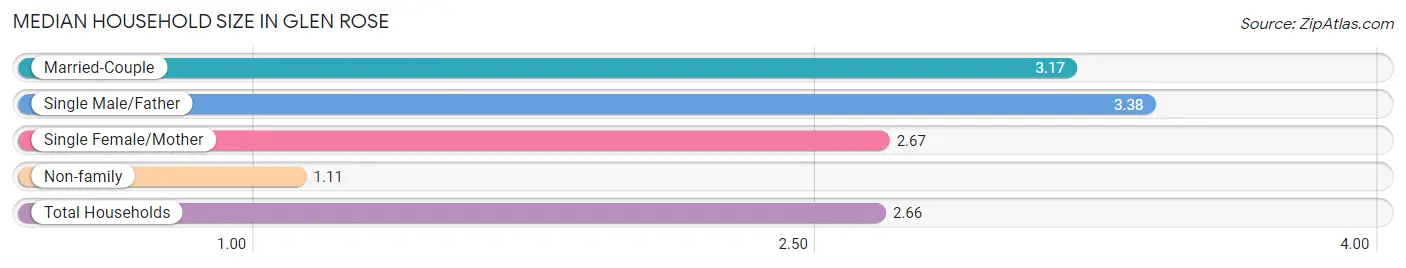
The median household size in Glen Rose is 2.66 persons per household, with single male/father households (79 | 8.3%) accounting for the largest median household size of 3.38 persons per household. non-family households (220 | 23.1%) represent the smallest median household size with 1.11 persons per household.
| Household Type | # Households | Household Size |
| Married-Couple | 549 (57.6%) | 3.17 |
| Single Male/Father | 79 (8.3%) | 3.38 |
| Single Female/Mother | 106 (11.1%) | 2.67 |
| Non-family | 220 (23.1%) | 1.11 |
| Total Households | 954 (100.0%) | 2.66 |
Household Size by Marriage Status in Glen Rose
Out of a total of 954 households in Glen Rose, 734 (76.9%) are family households, while 220 (23.1%) are nonfamily households. The most numerous type of family households are 2-person households, comprising 366, and the most common type of nonfamily households are 1-person households, comprising 196.
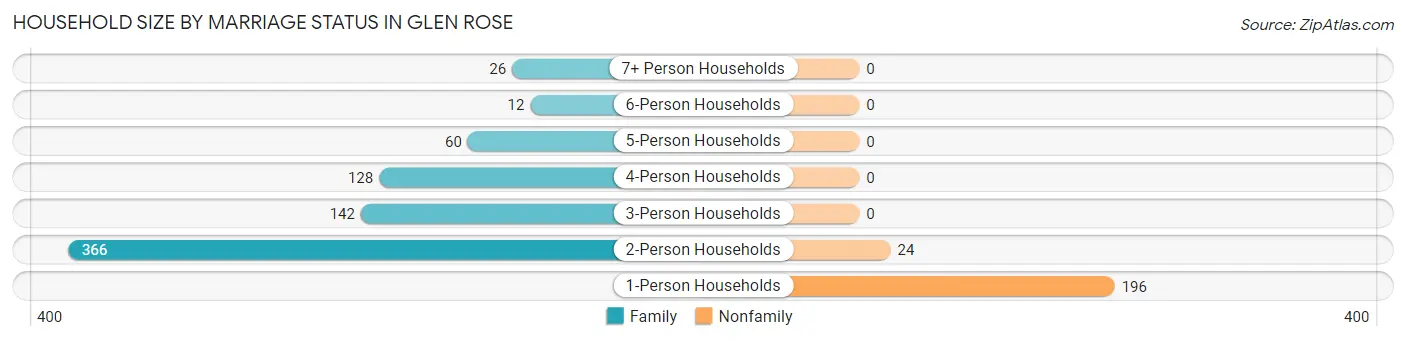
| Household Size | Family Households | Nonfamily Households |
| 1-Person Households | - | 196 (20.5%) |
| 2-Person Households | 366 (38.4%) | 24 (2.5%) |
| 3-Person Households | 142 (14.9%) | 0 (0.0%) |
| 4-Person Households | 128 (13.4%) | 0 (0.0%) |
| 5-Person Households | 60 (6.3%) | 0 (0.0%) |
| 6-Person Households | 12 (1.3%) | 0 (0.0%) |
| 7+ Person Households | 26 (2.7%) | 0 (0.0%) |
| Total | 734 (76.9%) | 220 (23.1%) |
Female Fertility in Glen Rose
Fertility by Age in Glen Rose
Average fertility rate in Glen Rose is 19.0 births per 1,000 women. Women in the age bracket of 20 to 34 years have the highest fertility rate with 56.0 births per 1,000 women. Women in the age bracket of 20 to 34 years acount for 100.0% of all women with births.
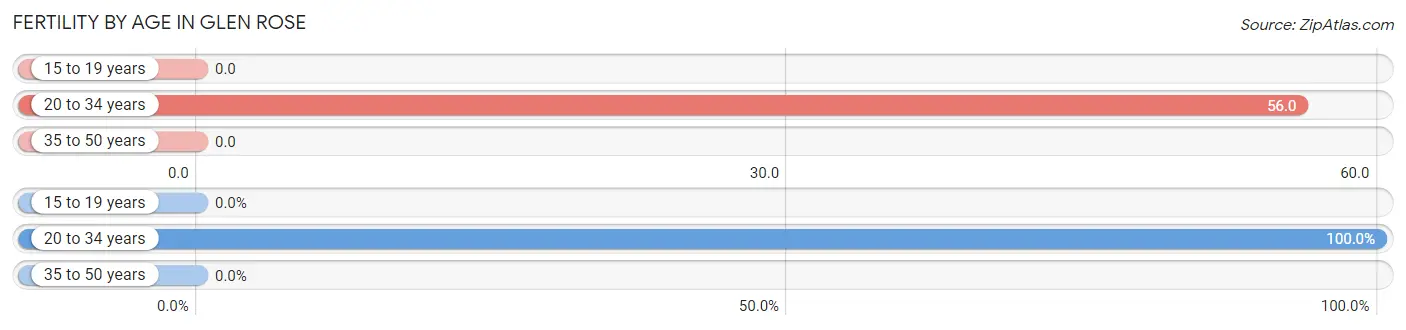
| Age Bracket | Women with Births | Births / 1,000 Women |
| 15 to 19 years | 0 (0.0%) | 0.0 |
| 20 to 34 years | 12 (100.0%) | 56.0 |
| 35 to 50 years | 0 (0.0%) | 0.0 |
| Total | 12 (100.0%) | 19.0 |
Fertility by Age by Marriage Status in Glen Rose
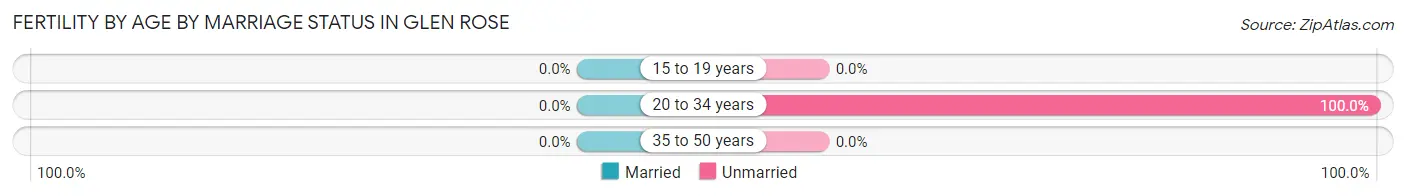
| Age Bracket | Married | Unmarried |
| 15 to 19 years | 0 (0.0%) | 0 (0.0%) |
| 20 to 34 years | 0 (0.0%) | 12 (100.0%) |
| 35 to 50 years | 0 (0.0%) | 0 (0.0%) |
| Total | 0 (0.0%) | 12 (100.0%) |
Fertility by Education in Glen Rose
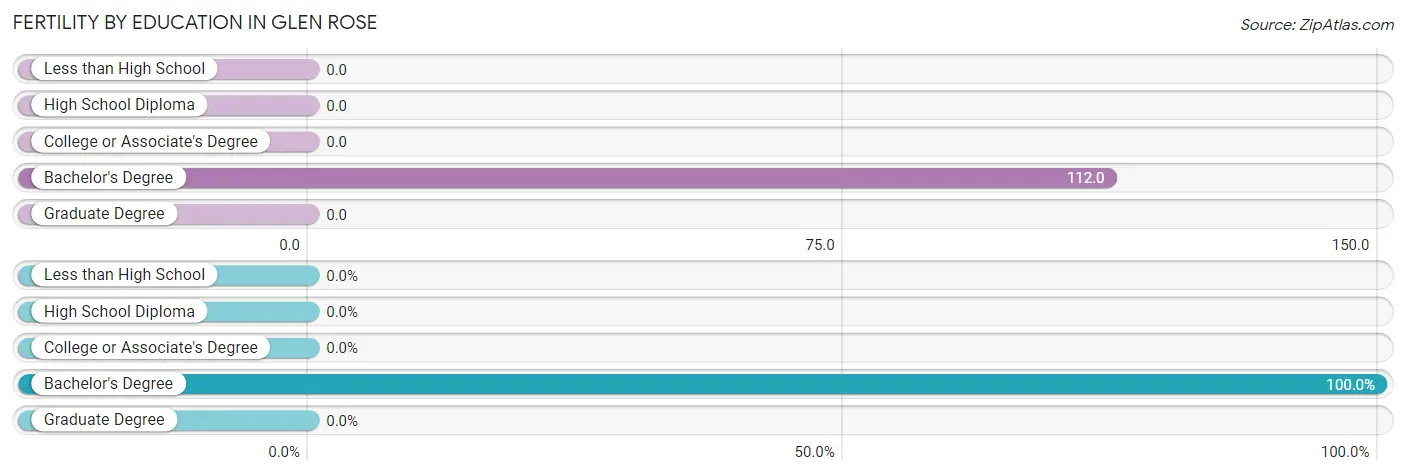
| Educational Attainment | Women with Births | Births / 1,000 Women |
| Less than High School | 0 (0.0%) | 0.0 |
| High School Diploma | 0 (0.0%) | 0.0 |
| College or Associate's Degree | 0 (0.0%) | 0.0 |
| Bachelor's Degree | 12 (100.0%) | 112.0 |
| Graduate Degree | 0 (0.0%) | 0.0 |
| Total | 12 (100.0%) | 19.0 |
Fertility by Education by Marriage Status in Glen Rose
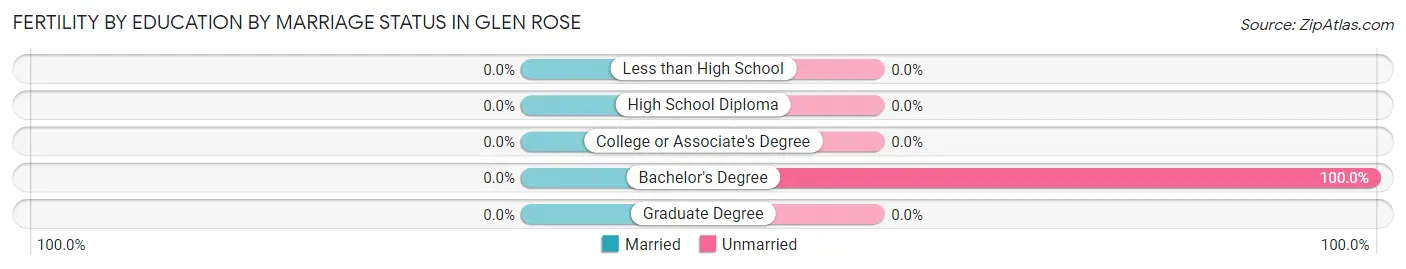
| Educational Attainment | Married | Unmarried |
| Less than High School | 0 (0.0%) | 0 (0.0%) |
| High School Diploma | 0 (0.0%) | 0 (0.0%) |
| College or Associate's Degree | 0 (0.0%) | 0 (0.0%) |
| Bachelor's Degree | 0 (0.0%) | 12 (100.0%) |
| Graduate Degree | 0 (0.0%) | 0 (0.0%) |
| Total | 0 (0.0%) | 12 (100.0%) |
Employment Characteristics in Glen Rose
Employment by Class of Employer in Glen Rose
Among the 1,243 employed individuals in Glen Rose, private company employees (856 | 68.9%), local government employees (136 | 10.9%), and self-employed (not incorporated) (125 | 10.1%) make up the most common classes of employment.
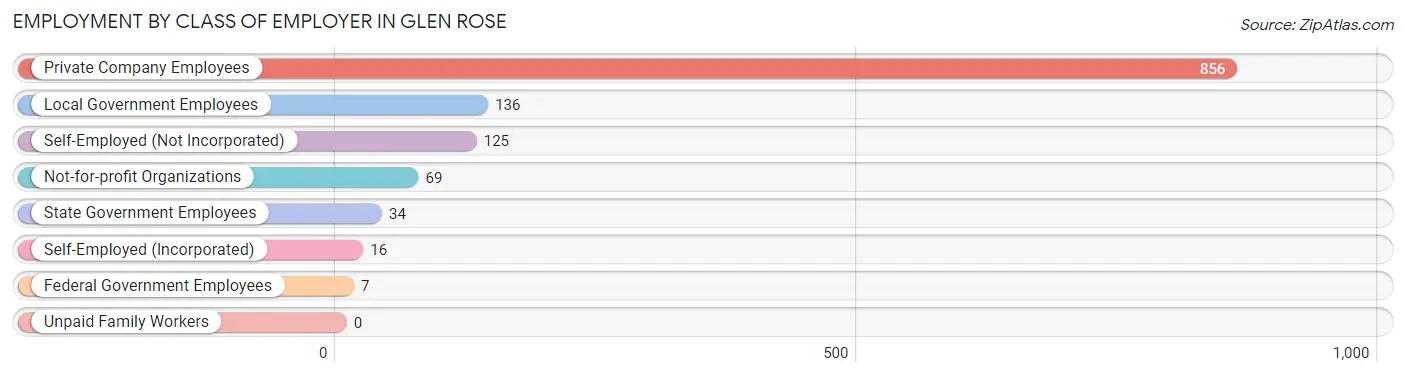
| Employer Class | # Employees | % Employees |
| Private Company Employees | 856 | 68.9% |
| Self-Employed (Incorporated) | 16 | 1.3% |
| Self-Employed (Not Incorporated) | 125 | 10.1% |
| Not-for-profit Organizations | 69 | 5.6% |
| Local Government Employees | 136 | 10.9% |
| State Government Employees | 34 | 2.7% |
| Federal Government Employees | 7 | 0.6% |
| Unpaid Family Workers | 0 | 0.0% |
| Total | 1,243 | 100.0% |
Employment Status by Age in Glen Rose
According to the labor force statistics for Glen Rose, out of the total population over 16 years of age (2,204), 58.9% or 1,298 individuals are in the labor force, with 2.6% or 34 of them unemployed. The age group with the highest labor force participation rate is 30 to 34 years, with 93.3% or 167 individuals in the labor force. Within the labor force, the 16 to 19 years age range has the highest percentage of unemployed individuals, with 84.6% or 22 of them being unemployed.
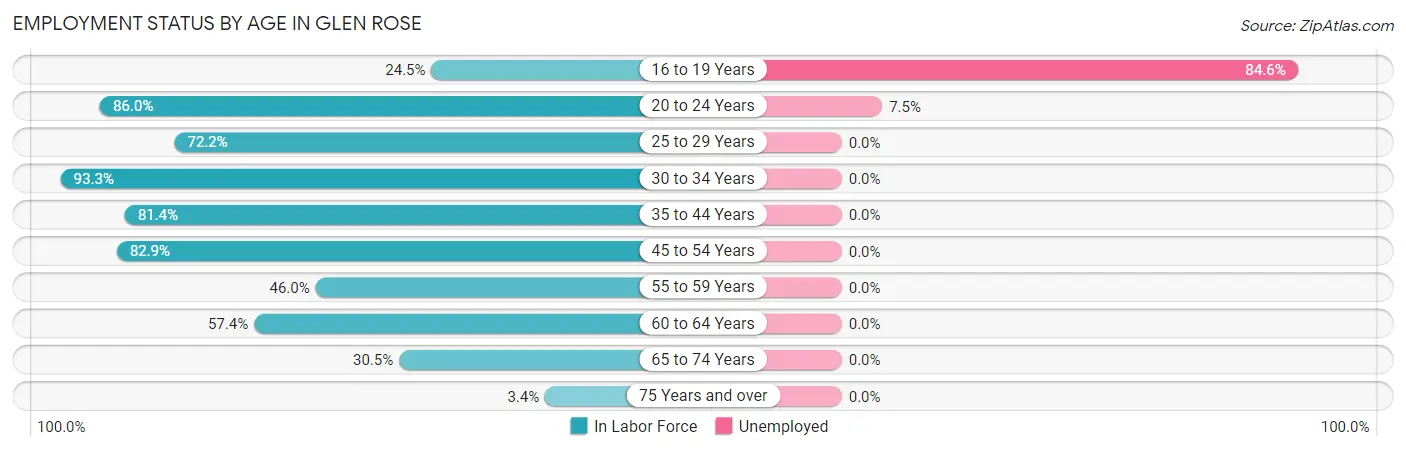
| Age Bracket | In Labor Force | Unemployed |
| 16 to 19 Years | 26 (24.5%) | 22 (84.6%) |
| 20 to 24 Years | 160 (86.0%) | 12 (7.5%) |
| 25 to 29 Years | 39 (72.2%) | 0 (0.0%) |
| 30 to 34 Years | 167 (93.3%) | 0 (0.0%) |
| 35 to 44 Years | 310 (81.4%) | 0 (0.0%) |
| 45 to 54 Years | 261 (82.9%) | 0 (0.0%) |
| 55 to 59 Years | 63 (46.0%) | 0 (0.0%) |
| 60 to 64 Years | 167 (57.4%) | 0 (0.0%) |
| 65 to 74 Years | 98 (30.5%) | 0 (0.0%) |
| 75 Years and over | 8 (3.4%) | 0 (0.0%) |
| Total | 1,298 (58.9%) | 34 (2.6%) |
Employment Status by Educational Attainment in Glen Rose
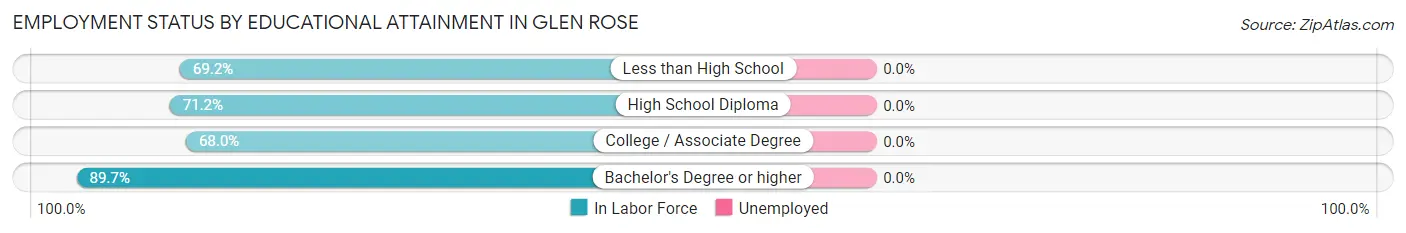
| Educational Attainment | In Labor Force | Unemployed |
| Less than High School | 157 (69.2%) | 0 (0.0%) |
| High School Diploma | 220 (71.2%) | 0 (0.0%) |
| College / Associate Degree | 334 (68.0%) | 0 (0.0%) |
| Bachelor's Degree or higher | 296 (89.7%) | 0 (0.0%) |
| Total | 1,007 (74.2%) | 0 (0.0%) |
Employment Occupations by Sex in Glen Rose
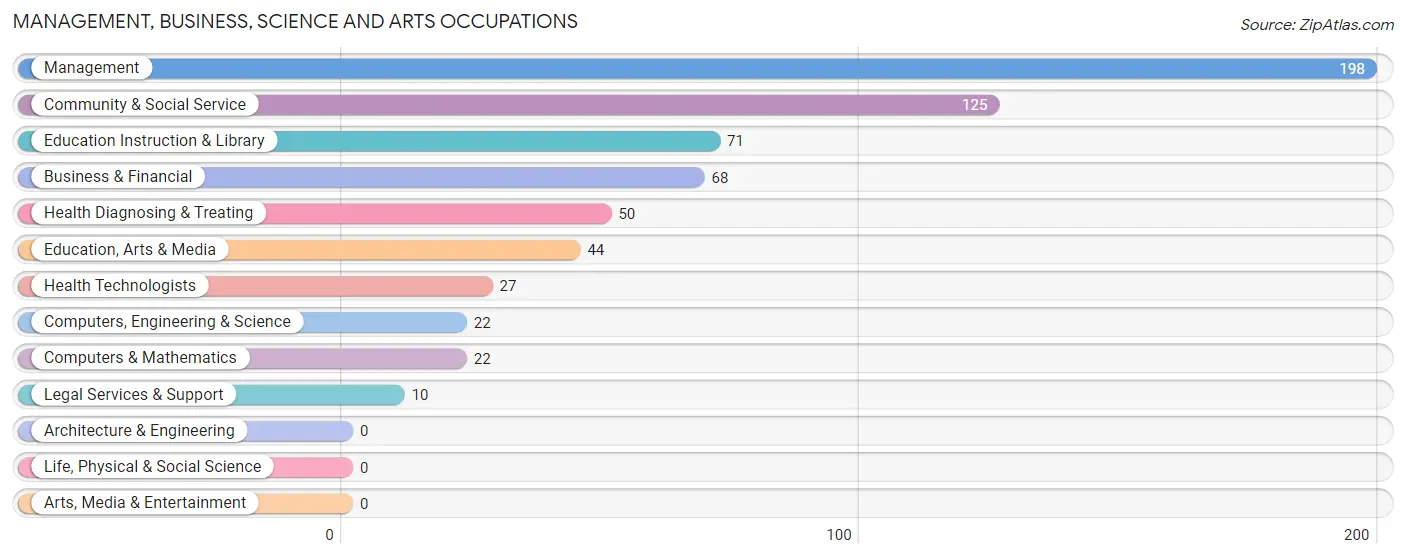
Management, Business, Science and Arts Occupations
The most common Management, Business, Science and Arts occupations in Glen Rose are Management (198 | 15.7%), Community & Social Service (125 | 9.9%), Education Instruction & Library (71 | 5.6%), Business & Financial (68 | 5.4%), and Health Diagnosing & Treating (50 | 4.0%).
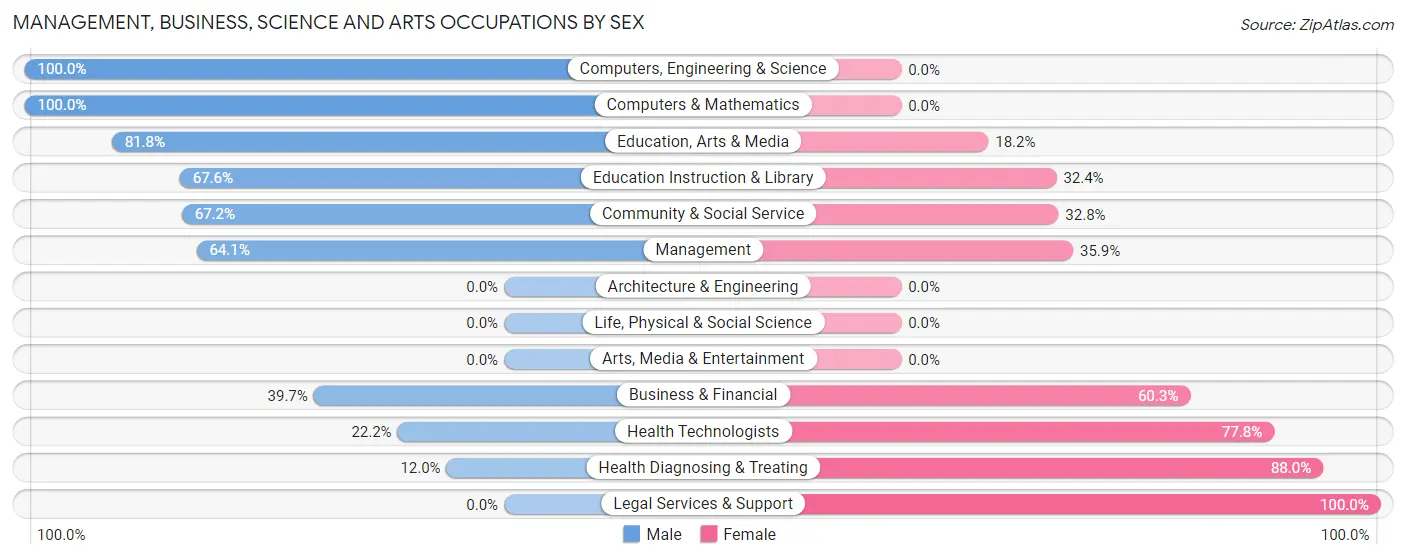
Management, Business, Science and Arts Occupations by Sex
Within the Management, Business, Science and Arts occupations in Glen Rose, the most male-oriented occupations are Computers, Engineering & Science (100.0%), Computers & Mathematics (100.0%), and Education, Arts & Media (81.8%), while the most female-oriented occupations are Legal Services & Support (100.0%), Health Diagnosing & Treating (88.0%), and Health Technologists (77.8%).
| Occupation | Male | Female |
| Management | 127 (64.1%) | 71 (35.9%) |
| Business & Financial | 27 (39.7%) | 41 (60.3%) |
| Computers, Engineering & Science | 22 (100.0%) | 0 (0.0%) |
| Computers & Mathematics | 22 (100.0%) | 0 (0.0%) |
| Architecture & Engineering | 0 (0.0%) | 0 (0.0%) |
| Life, Physical & Social Science | 0 (0.0%) | 0 (0.0%) |
| Community & Social Service | 84 (67.2%) | 41 (32.8%) |
| Education, Arts & Media | 36 (81.8%) | 8 (18.2%) |
| Legal Services & Support | 0 (0.0%) | 10 (100.0%) |
| Education Instruction & Library | 48 (67.6%) | 23 (32.4%) |
| Arts, Media & Entertainment | 0 (0.0%) | 0 (0.0%) |
| Health Diagnosing & Treating | 6 (12.0%) | 44 (88.0%) |
| Health Technologists | 6 (22.2%) | 21 (77.8%) |
| Total (Category) | 266 (57.5%) | 197 (42.5%) |
| Total (Overall) | 748 (59.1%) | 517 (40.9%) |
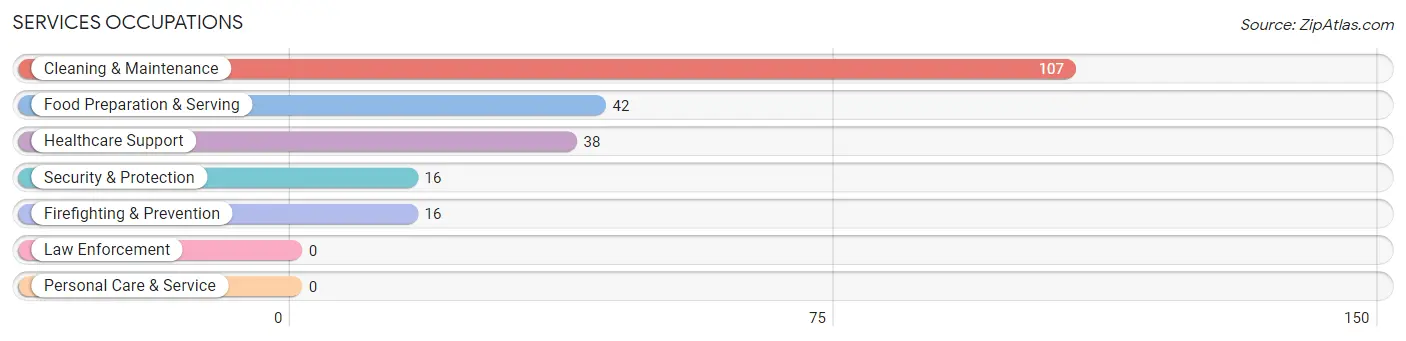
Services Occupations
The most common Services occupations in Glen Rose are Cleaning & Maintenance (107 | 8.5%), Food Preparation & Serving (42 | 3.3%), Healthcare Support (38 | 3.0%), Security & Protection (16 | 1.3%), and Firefighting & Prevention (16 | 1.3%).
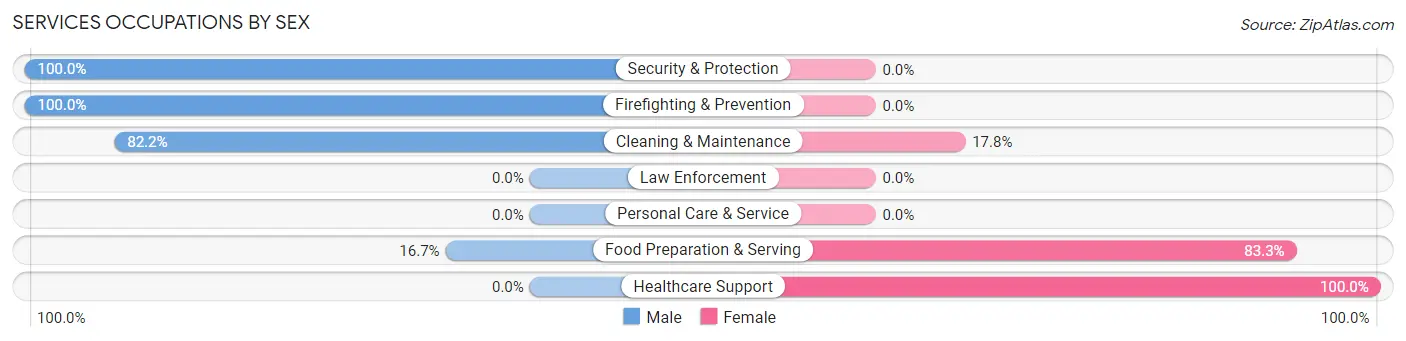
Services Occupations by Sex
Within the Services occupations in Glen Rose, the most male-oriented occupations are Security & Protection (100.0%), Firefighting & Prevention (100.0%), and Cleaning & Maintenance (82.2%), while the most female-oriented occupations are Healthcare Support (100.0%), Food Preparation & Serving (83.3%), and Cleaning & Maintenance (17.8%).
| Occupation | Male | Female |
| Healthcare Support | 0 (0.0%) | 38 (100.0%) |
| Security & Protection | 16 (100.0%) | 0 (0.0%) |
| Firefighting & Prevention | 16 (100.0%) | 0 (0.0%) |
| Law Enforcement | 0 (0.0%) | 0 (0.0%) |
| Food Preparation & Serving | 7 (16.7%) | 35 (83.3%) |
| Cleaning & Maintenance | 88 (82.2%) | 19 (17.8%) |
| Personal Care & Service | 0 (0.0%) | 0 (0.0%) |
| Total (Category) | 111 (54.7%) | 92 (45.3%) |
| Total (Overall) | 748 (59.1%) | 517 (40.9%) |
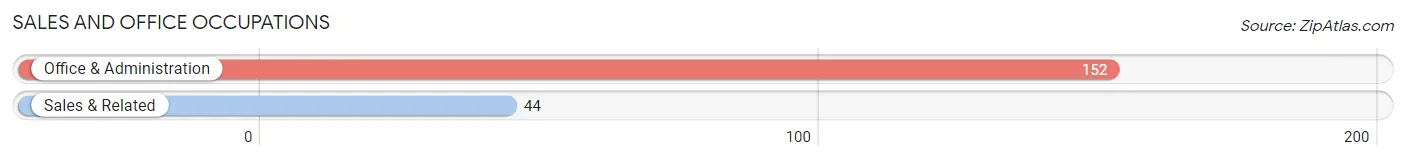
Sales and Office Occupations
The most common Sales and Office occupations in Glen Rose are Office & Administration (152 | 12.0%), and Sales & Related (44 | 3.5%).
Sales and Office Occupations by Sex
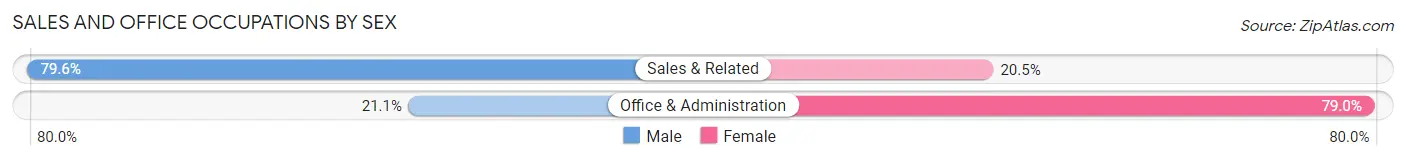
| Occupation | Male | Female |
| Sales & Related | 35 (79.5%) | 9 (20.4%) |
| Office & Administration | 32 (21.0%) | 120 (78.9%) |
| Total (Category) | 67 (34.2%) | 129 (65.8%) |
| Total (Overall) | 748 (59.1%) | 517 (40.9%) |
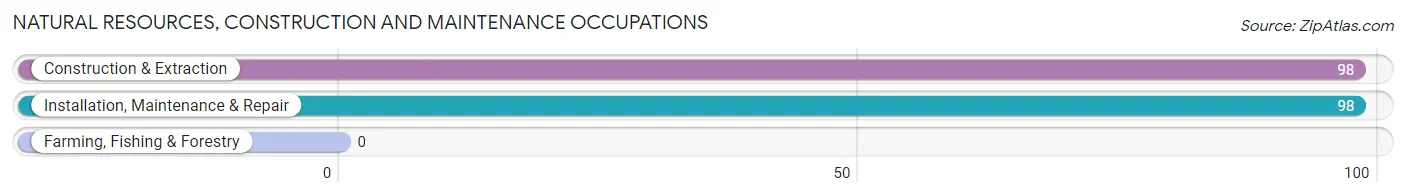
Natural Resources, Construction and Maintenance Occupations
The most common Natural Resources, Construction and Maintenance occupations in Glen Rose are Construction & Extraction (98 | 7.7%), and Installation, Maintenance & Repair (98 | 7.7%).
Natural Resources, Construction and Maintenance Occupations by Sex
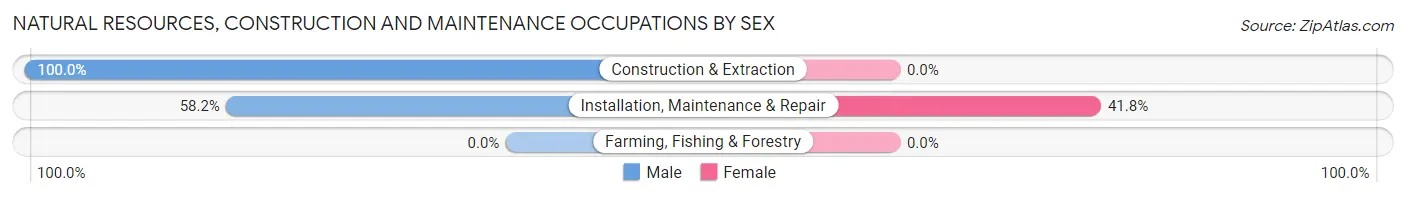
| Occupation | Male | Female |
| Farming, Fishing & Forestry | 0 (0.0%) | 0 (0.0%) |
| Construction & Extraction | 98 (100.0%) | 0 (0.0%) |
| Installation, Maintenance & Repair | 57 (58.2%) | 41 (41.8%) |
| Total (Category) | 155 (79.1%) | 41 (20.9%) |
| Total (Overall) | 748 (59.1%) | 517 (40.9%) |
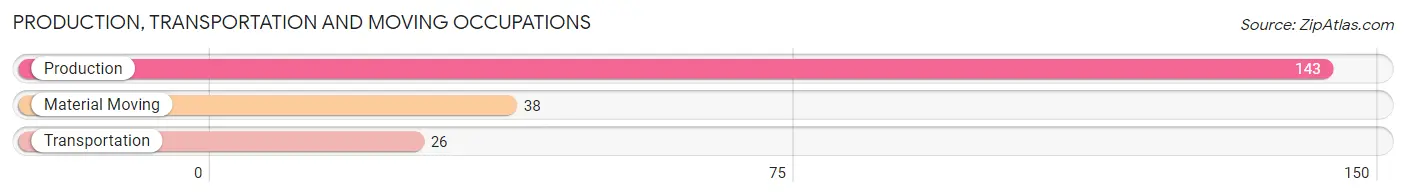
Production, Transportation and Moving Occupations
The most common Production, Transportation and Moving occupations in Glen Rose are Production (143 | 11.3%), Material Moving (38 | 3.0%), and Transportation (26 | 2.1%).
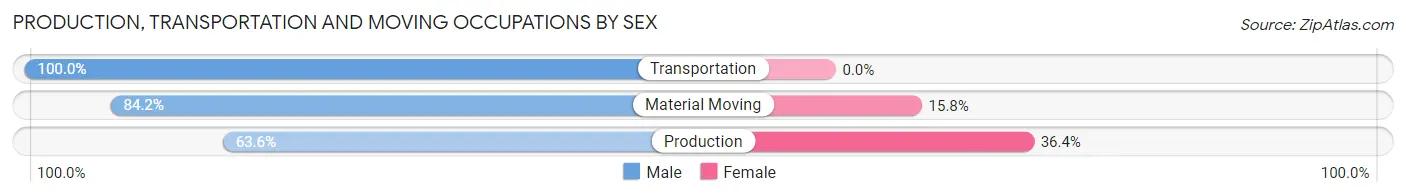
Production, Transportation and Moving Occupations by Sex
| Occupation | Male | Female |
| Production | 91 (63.6%) | 52 (36.4%) |
| Transportation | 26 (100.0%) | 0 (0.0%) |
| Material Moving | 32 (84.2%) | 6 (15.8%) |
| Total (Category) | 149 (72.0%) | 58 (28.0%) |
| Total (Overall) | 748 (59.1%) | 517 (40.9%) |
Employment Industries by Sex in Glen Rose
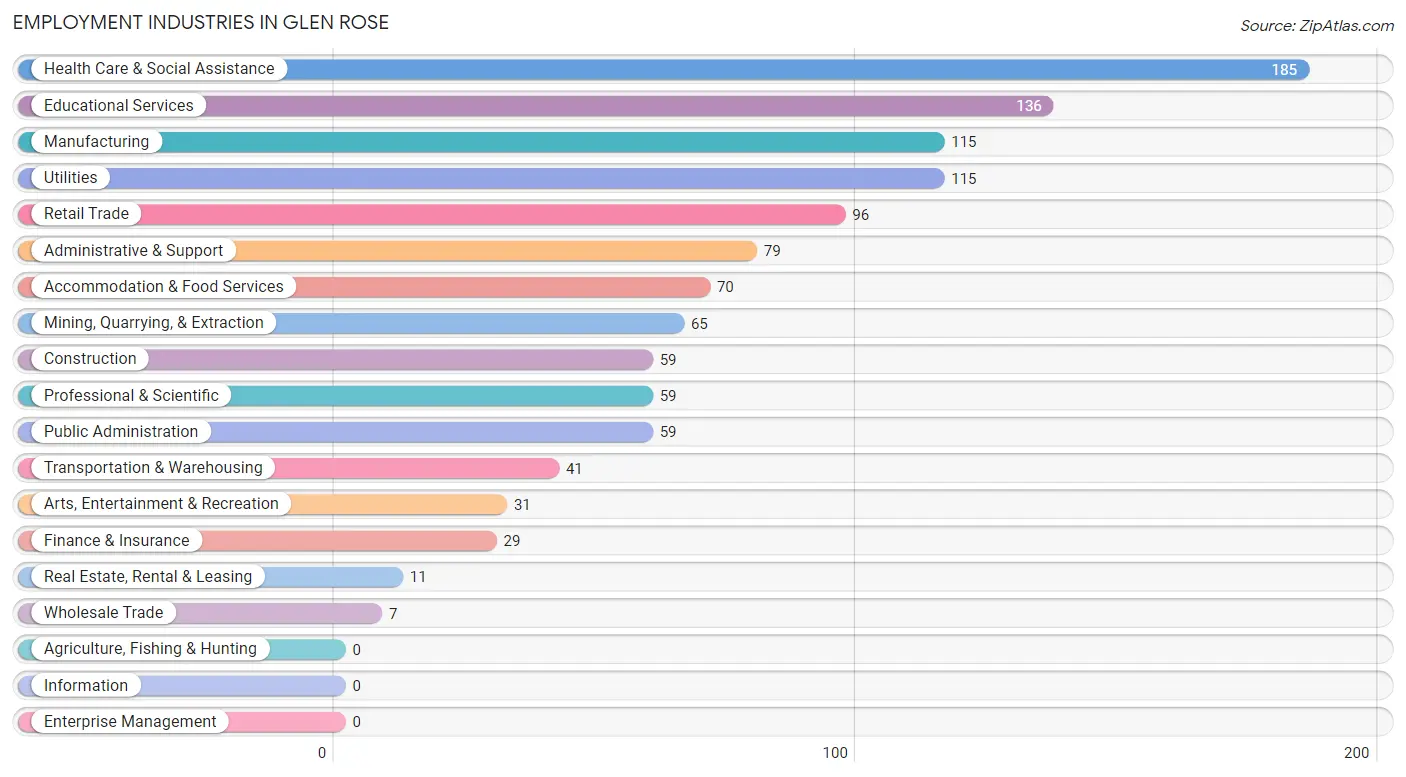
Employment Industries in Glen Rose
The major employment industries in Glen Rose include Health Care & Social Assistance (185 | 14.6%), Educational Services (136 | 10.7%), Manufacturing (115 | 9.1%), Utilities (115 | 9.1%), and Retail Trade (96 | 7.6%).
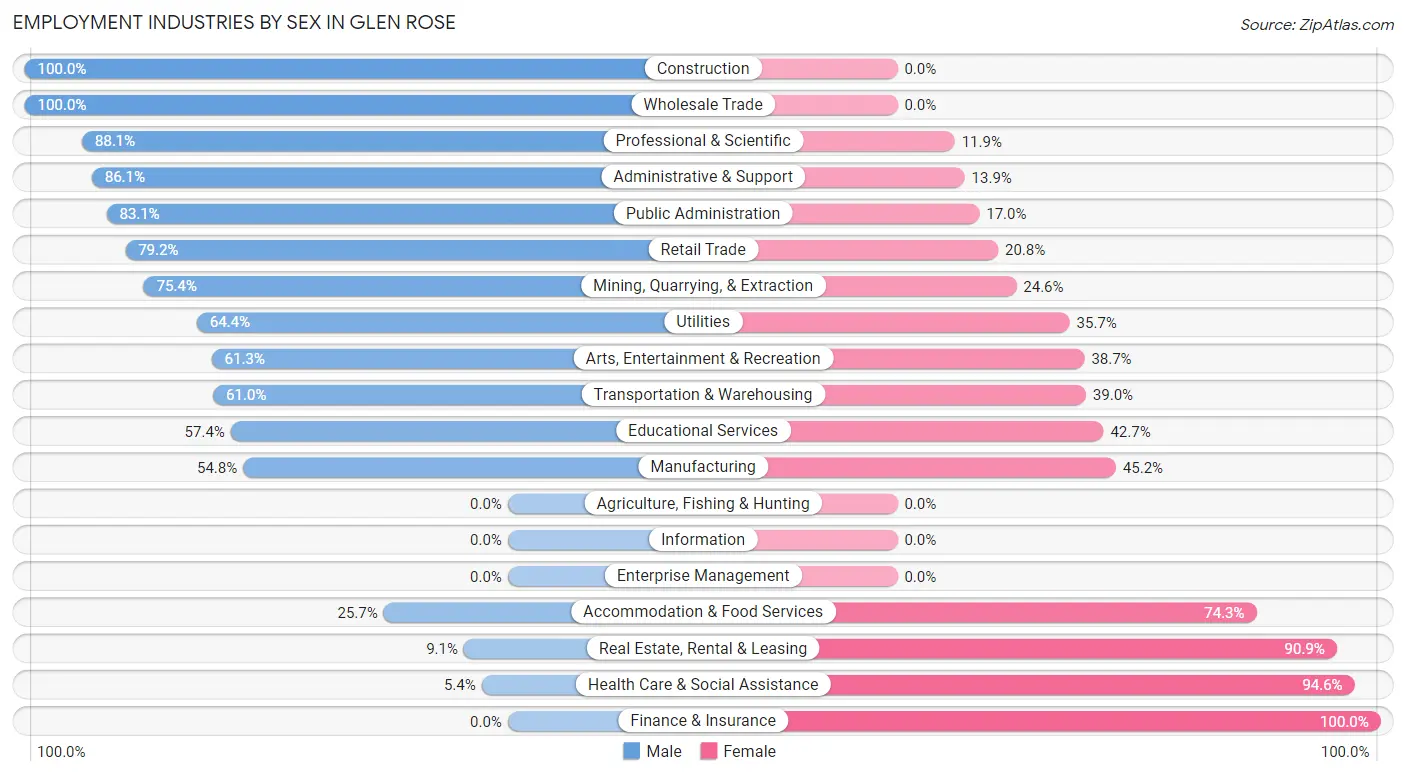
Employment Industries by Sex in Glen Rose
The Glen Rose industries that see more men than women are Construction (100.0%), Wholesale Trade (100.0%), and Professional & Scientific (88.1%), whereas the industries that tend to have a higher number of women are Finance & Insurance (100.0%), Health Care & Social Assistance (94.6%), and Real Estate, Rental & Leasing (90.9%).
| Industry | Male | Female |
| Agriculture, Fishing & Hunting | 0 (0.0%) | 0 (0.0%) |
| Mining, Quarrying, & Extraction | 49 (75.4%) | 16 (24.6%) |
| Construction | 59 (100.0%) | 0 (0.0%) |
| Manufacturing | 63 (54.8%) | 52 (45.2%) |
| Wholesale Trade | 7 (100.0%) | 0 (0.0%) |
| Retail Trade | 76 (79.2%) | 20 (20.8%) |
| Transportation & Warehousing | 25 (61.0%) | 16 (39.0%) |
| Utilities | 74 (64.3%) | 41 (35.6%) |
| Information | 0 (0.0%) | 0 (0.0%) |
| Finance & Insurance | 0 (0.0%) | 29 (100.0%) |
| Real Estate, Rental & Leasing | 1 (9.1%) | 10 (90.9%) |
| Professional & Scientific | 52 (88.1%) | 7 (11.9%) |
| Enterprise Management | 0 (0.0%) | 0 (0.0%) |
| Administrative & Support | 68 (86.1%) | 11 (13.9%) |
| Educational Services | 78 (57.4%) | 58 (42.6%) |
| Health Care & Social Assistance | 10 (5.4%) | 175 (94.6%) |
| Arts, Entertainment & Recreation | 19 (61.3%) | 12 (38.7%) |
| Accommodation & Food Services | 18 (25.7%) | 52 (74.3%) |
| Public Administration | 49 (83.1%) | 10 (17.0%) |
| Total | 748 (59.1%) | 517 (40.9%) |
Education in Glen Rose
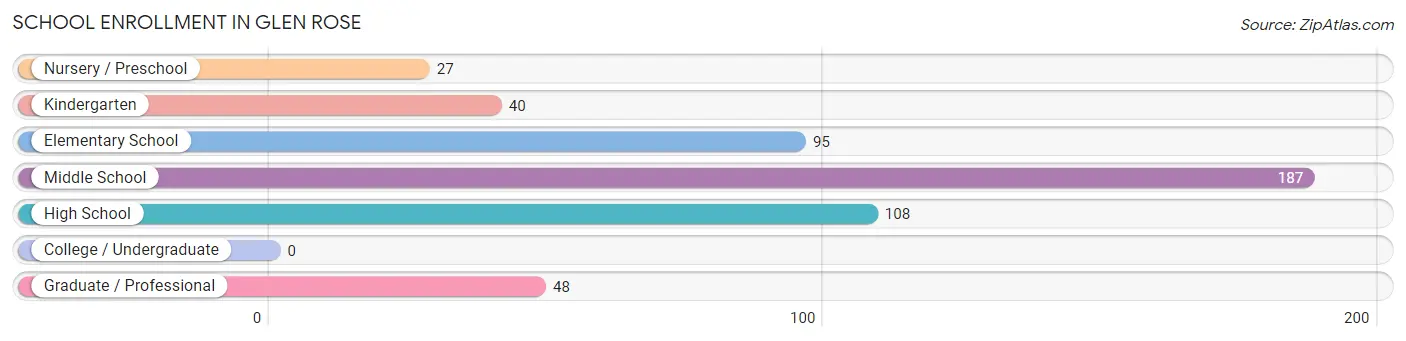
School Enrollment in Glen Rose
The most common levels of schooling among the 505 students in Glen Rose are middle school (187 | 37.0%), high school (108 | 21.4%), and elementary school (95 | 18.8%).
| School Level | # Students | % Students |
| Nursery / Preschool | 27 | 5.3% |
| Kindergarten | 40 | 7.9% |
| Elementary School | 95 | 18.8% |
| Middle School | 187 | 37.0% |
| High School | 108 | 21.4% |
| College / Undergraduate | 0 | 0.0% |
| Graduate / Professional | 48 | 9.5% |
| Total | 505 | 100.0% |
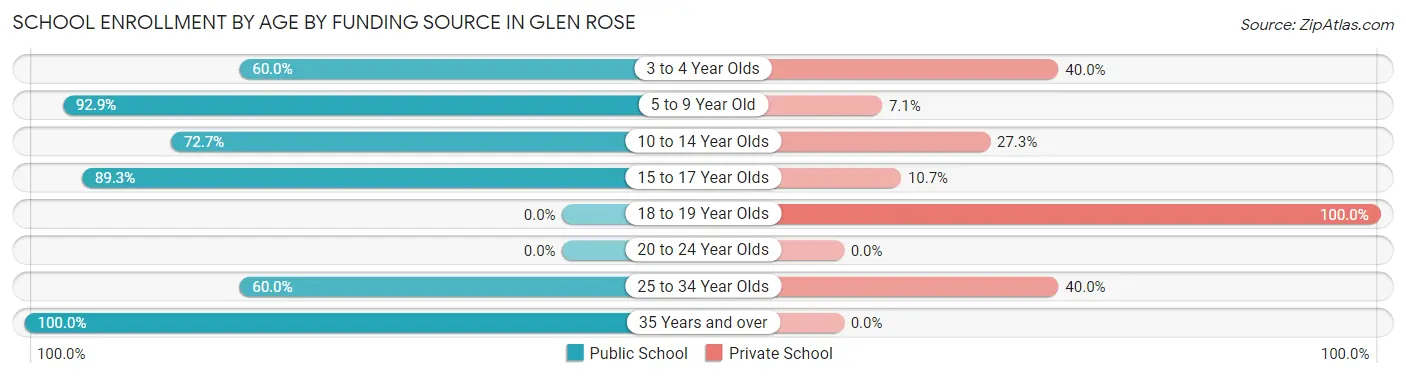
School Enrollment by Age by Funding Source in Glen Rose
Out of a total of 505 students who are enrolled in schools in Glen Rose, 121 (24.0%) attend a private institution, while the remaining 384 (76.0%) are enrolled in public schools. The age group of 18 to 19 year olds has the highest likelihood of being enrolled in private schools, with 22 (100.0% in the age bracket) enrolled. Conversely, the age group of 35 years and over has the lowest likelihood of being enrolled in a private school, with 23 (100.0% in the age bracket) attending a public institution.
| Age Bracket | Public School | Private School |
| 3 to 4 Year Olds | 12 (60.0%) | 8 (40.0%) |
| 5 to 9 Year Old | 91 (92.9%) | 7 (7.1%) |
| 10 to 14 Year Olds | 176 (72.7%) | 66 (27.3%) |
| 15 to 17 Year Olds | 67 (89.3%) | 8 (10.7%) |
| 18 to 19 Year Olds | 0 (0.0%) | 22 (100.0%) |
| 20 to 24 Year Olds | 0 (0.0%) | 0 (0.0%) |
| 25 to 34 Year Olds | 15 (60.0%) | 10 (40.0%) |
| 35 Years and over | 23 (100.0%) | 0 (0.0%) |
| Total | 384 (76.0%) | 121 (24.0%) |
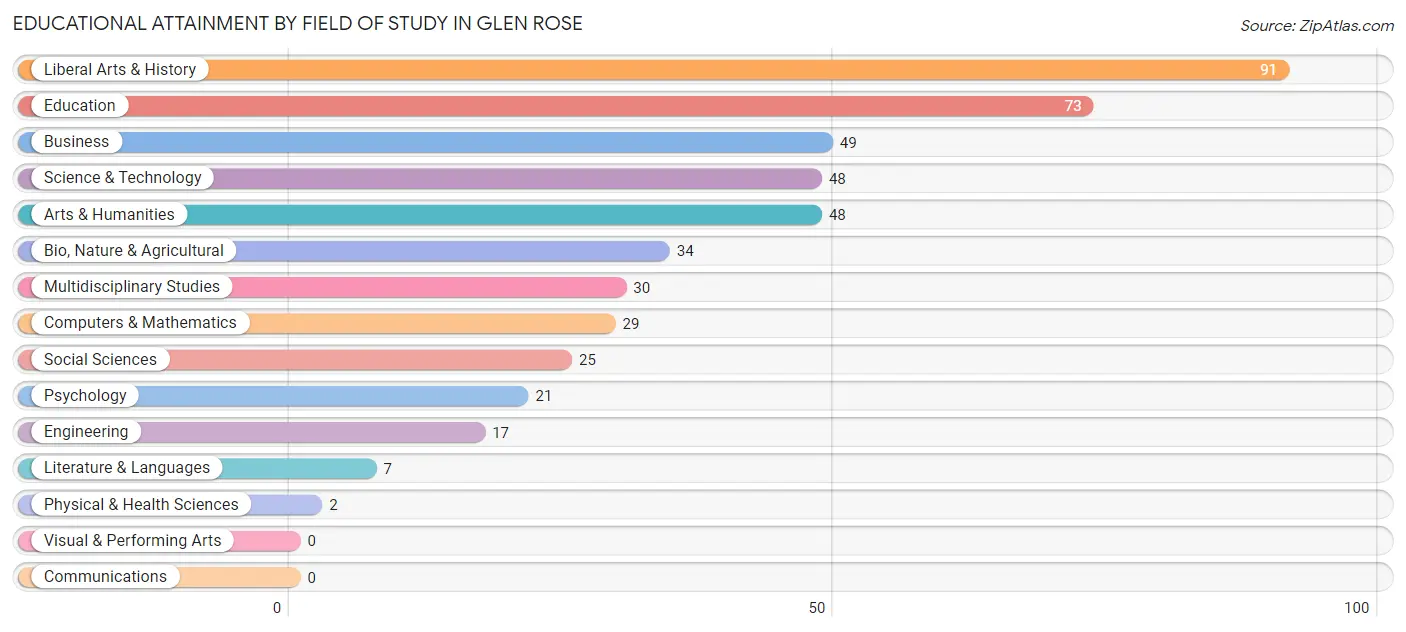
Educational Attainment by Field of Study in Glen Rose
Liberal arts & history (91 | 19.2%), education (73 | 15.4%), business (49 | 10.3%), science & technology (48 | 10.1%), and arts & humanities (48 | 10.1%) are the most common fields of study among 474 individuals in Glen Rose who have obtained a bachelor's degree or higher.
| Field of Study | # Graduates | % Graduates |
| Computers & Mathematics | 29 | 6.1% |
| Bio, Nature & Agricultural | 34 | 7.2% |
| Physical & Health Sciences | 2 | 0.4% |
| Psychology | 21 | 4.4% |
| Social Sciences | 25 | 5.3% |
| Engineering | 17 | 3.6% |
| Multidisciplinary Studies | 30 | 6.3% |
| Science & Technology | 48 | 10.1% |
| Business | 49 | 10.3% |
| Education | 73 | 15.4% |
| Literature & Languages | 7 | 1.5% |
| Liberal Arts & History | 91 | 19.2% |
| Visual & Performing Arts | 0 | 0.0% |
| Communications | 0 | 0.0% |
| Arts & Humanities | 48 | 10.1% |
| Total | 474 | 100.0% |
Transportation & Commute in Glen Rose
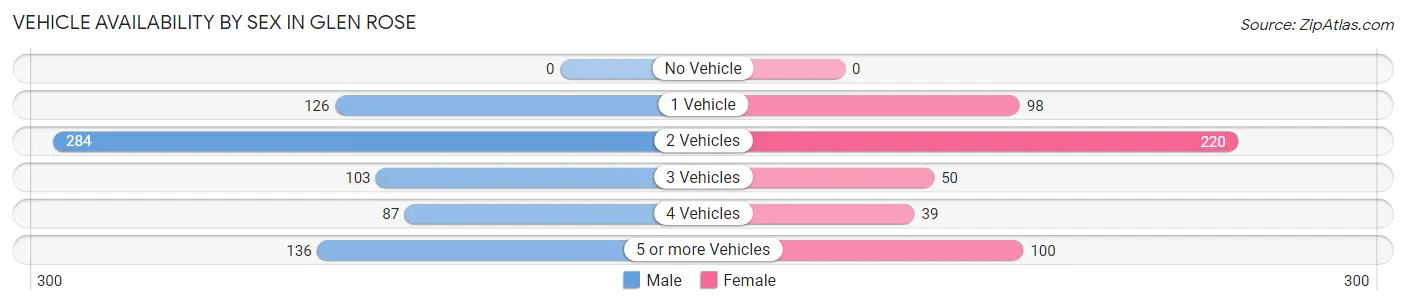
Vehicle Availability by Sex in Glen Rose
The most prevalent vehicle ownership categories in Glen Rose are males with 2 vehicles (284, accounting for 38.6%) and females with 2 vehicles (220, making up 56.0%).
| Vehicles Available | Male | Female |
| No Vehicle | 0 (0.0%) | 0 (0.0%) |
| 1 Vehicle | 126 (17.1%) | 98 (19.3%) |
| 2 Vehicles | 284 (38.6%) | 220 (43.4%) |
| 3 Vehicles | 103 (14.0%) | 50 (9.9%) |
| 4 Vehicles | 87 (11.8%) | 39 (7.7%) |
| 5 or more Vehicles | 136 (18.5%) | 100 (19.7%) |
| Total | 736 (100.0%) | 507 (100.0%) |
Commute Time in Glen Rose
The most frequently occuring commute durations in Glen Rose are 10 to 14 minutes (262 commuters, 23.6%), 5 to 9 minutes (242 commuters, 21.8%), and 30 to 34 minutes (128 commuters, 11.6%).
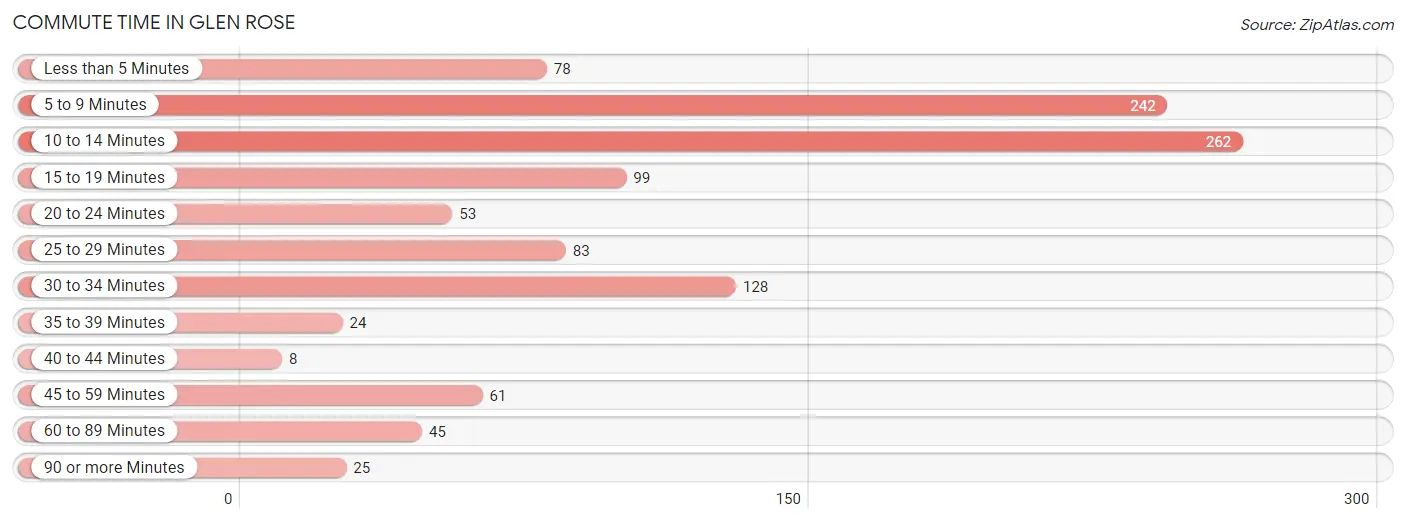
| Commute Time | # Commuters | % Commuters |
| Less than 5 Minutes | 78 | 7.0% |
| 5 to 9 Minutes | 242 | 21.8% |
| 10 to 14 Minutes | 262 | 23.6% |
| 15 to 19 Minutes | 99 | 8.9% |
| 20 to 24 Minutes | 53 | 4.8% |
| 25 to 29 Minutes | 83 | 7.5% |
| 30 to 34 Minutes | 128 | 11.6% |
| 35 to 39 Minutes | 24 | 2.2% |
| 40 to 44 Minutes | 8 | 0.7% |
| 45 to 59 Minutes | 61 | 5.5% |
| 60 to 89 Minutes | 45 | 4.1% |
| 90 or more Minutes | 25 | 2.3% |
Commute Time by Sex in Glen Rose
The most common commute times in Glen Rose are 10 to 14 minutes (194 commuters, 29.8%) for males and 30 to 34 minutes (118 commuters, 25.8%) for females.
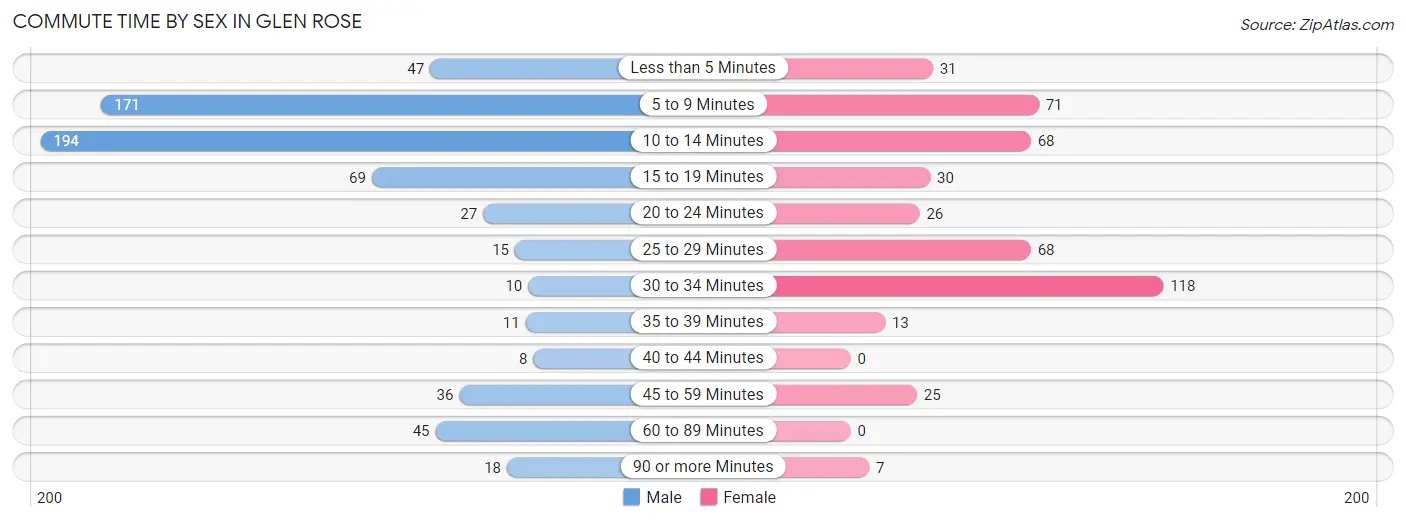
| Commute Time | Male | Female |
| Less than 5 Minutes | 47 (7.2%) | 31 (6.8%) |
| 5 to 9 Minutes | 171 (26.3%) | 71 (15.5%) |
| 10 to 14 Minutes | 194 (29.8%) | 68 (14.9%) |
| 15 to 19 Minutes | 69 (10.6%) | 30 (6.6%) |
| 20 to 24 Minutes | 27 (4.2%) | 26 (5.7%) |
| 25 to 29 Minutes | 15 (2.3%) | 68 (14.9%) |
| 30 to 34 Minutes | 10 (1.5%) | 118 (25.8%) |
| 35 to 39 Minutes | 11 (1.7%) | 13 (2.8%) |
| 40 to 44 Minutes | 8 (1.2%) | 0 (0.0%) |
| 45 to 59 Minutes | 36 (5.5%) | 25 (5.5%) |
| 60 to 89 Minutes | 45 (6.9%) | 0 (0.0%) |
| 90 or more Minutes | 18 (2.8%) | 7 (1.5%) |
Time of Departure to Work by Sex in Glen Rose
The most frequent times of departure to work in Glen Rose are 6:30 AM to 6:59 AM (123, 18.9%) for males and 7:00 AM to 7:29 AM (155, 33.9%) for females.
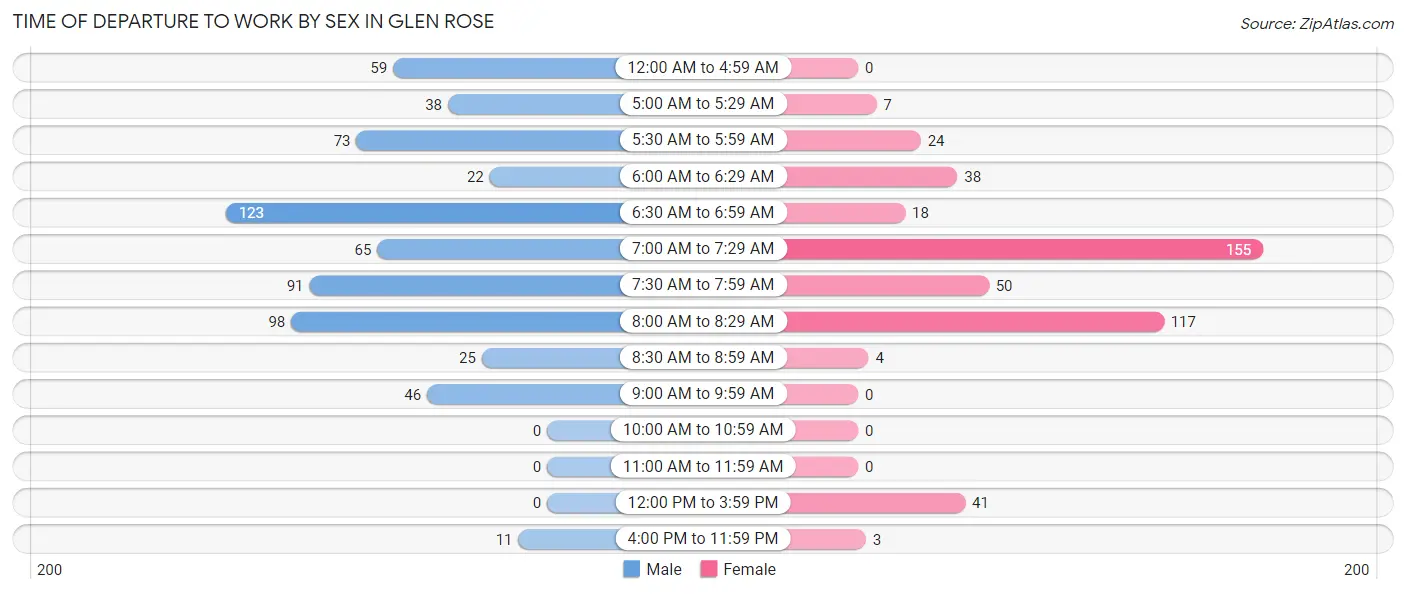
| Time of Departure | Male | Female |
| 12:00 AM to 4:59 AM | 59 (9.1%) | 0 (0.0%) |
| 5:00 AM to 5:29 AM | 38 (5.8%) | 7 (1.5%) |
| 5:30 AM to 5:59 AM | 73 (11.2%) | 24 (5.2%) |
| 6:00 AM to 6:29 AM | 22 (3.4%) | 38 (8.3%) |
| 6:30 AM to 6:59 AM | 123 (18.9%) | 18 (3.9%) |
| 7:00 AM to 7:29 AM | 65 (10.0%) | 155 (33.9%) |
| 7:30 AM to 7:59 AM | 91 (14.0%) | 50 (10.9%) |
| 8:00 AM to 8:29 AM | 98 (15.0%) | 117 (25.6%) |
| 8:30 AM to 8:59 AM | 25 (3.8%) | 4 (0.9%) |
| 9:00 AM to 9:59 AM | 46 (7.1%) | 0 (0.0%) |
| 10:00 AM to 10:59 AM | 0 (0.0%) | 0 (0.0%) |
| 11:00 AM to 11:59 AM | 0 (0.0%) | 0 (0.0%) |
| 12:00 PM to 3:59 PM | 0 (0.0%) | 41 (9.0%) |
| 4:00 PM to 11:59 PM | 11 (1.7%) | 3 (0.7%) |
| Total | 651 (100.0%) | 457 (100.0%) |
Housing Occupancy in Glen Rose
Occupancy by Ownership in Glen Rose
Of the total 954 dwellings in Glen Rose, owner-occupied units account for 648 (67.9%), while renter-occupied units make up 306 (32.1%).
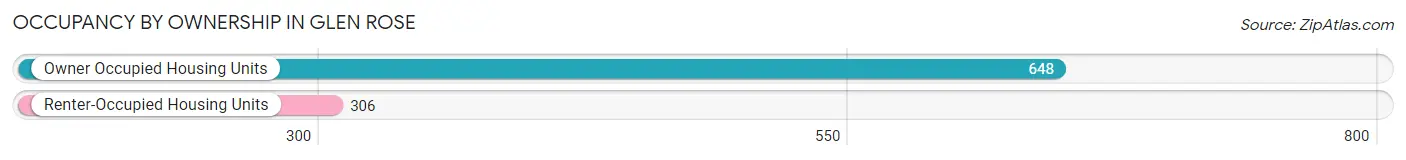
| Occupancy | # Housing Units | % Housing Units |
| Owner Occupied Housing Units | 648 | 67.9% |
| Renter-Occupied Housing Units | 306 | 32.1% |
| Total Occupied Housing Units | 954 | 100.0% |
Occupancy by Household Size in Glen Rose
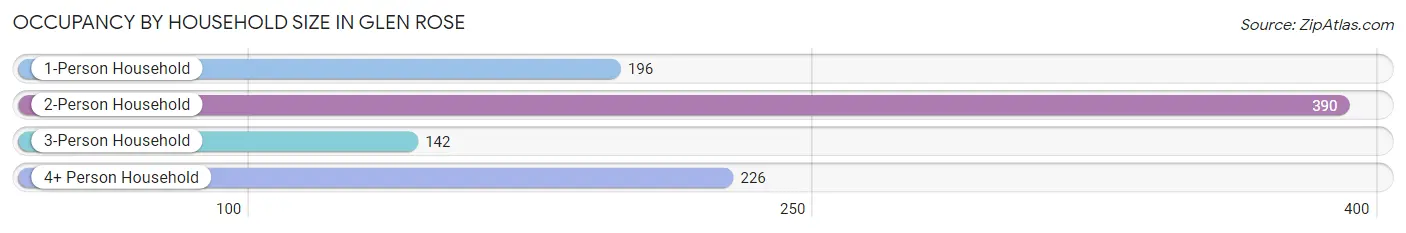
| Household Size | # Housing Units | % Housing Units |
| 1-Person Household | 196 | 20.5% |
| 2-Person Household | 390 | 40.9% |
| 3-Person Household | 142 | 14.9% |
| 4+ Person Household | 226 | 23.7% |
| Total Housing Units | 954 | 100.0% |
Occupancy by Ownership by Household Size in Glen Rose
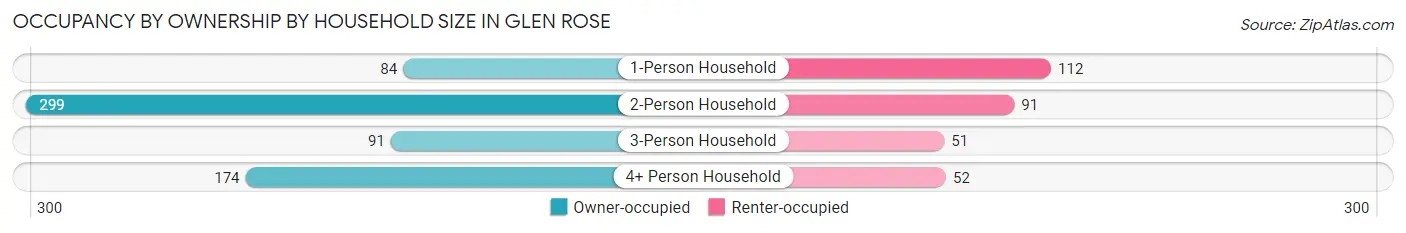
| Household Size | Owner-occupied | Renter-occupied |
| 1-Person Household | 84 (42.9%) | 112 (57.1%) |
| 2-Person Household | 299 (76.7%) | 91 (23.3%) |
| 3-Person Household | 91 (64.1%) | 51 (35.9%) |
| 4+ Person Household | 174 (77.0%) | 52 (23.0%) |
| Total Housing Units | 648 (67.9%) | 306 (32.1%) |
Occupancy by Educational Attainment in Glen Rose
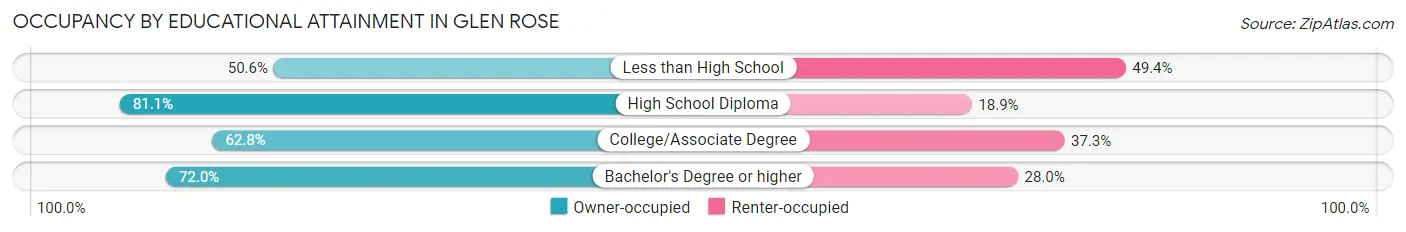
| Household Size | Owner-occupied | Renter-occupied |
| Less than High School | 43 (50.6%) | 42 (49.4%) |
| High School Diploma | 146 (81.1%) | 34 (18.9%) |
| College/Associate Degree | 251 (62.7%) | 149 (37.2%) |
| Bachelor's Degree or higher | 208 (72.0%) | 81 (28.0%) |
Occupancy by Age of Householder in Glen Rose
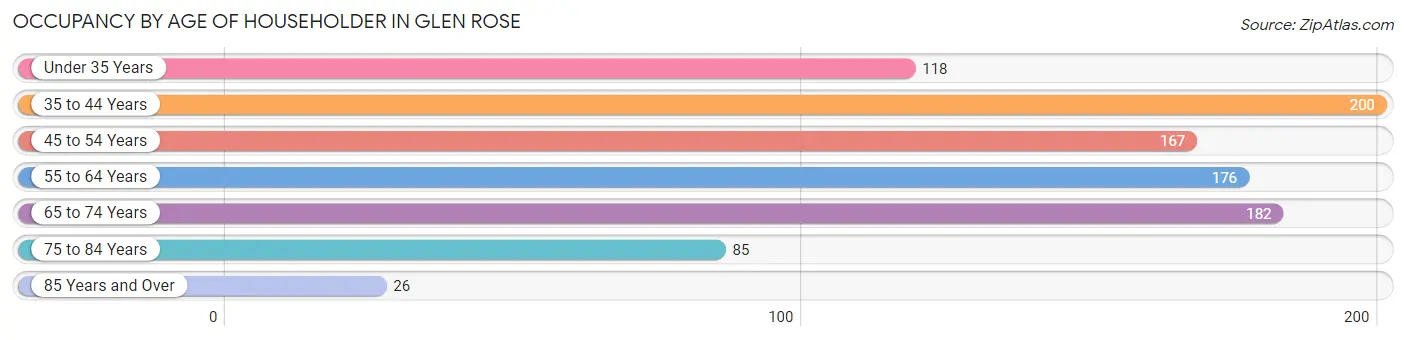
| Age Bracket | # Households | % Households |
| Under 35 Years | 118 | 12.4% |
| 35 to 44 Years | 200 | 21.0% |
| 45 to 54 Years | 167 | 17.5% |
| 55 to 64 Years | 176 | 18.4% |
| 65 to 74 Years | 182 | 19.1% |
| 75 to 84 Years | 85 | 8.9% |
| 85 Years and Over | 26 | 2.7% |
| Total | 954 | 100.0% |
Housing Finances in Glen Rose
Median Income by Occupancy in Glen Rose
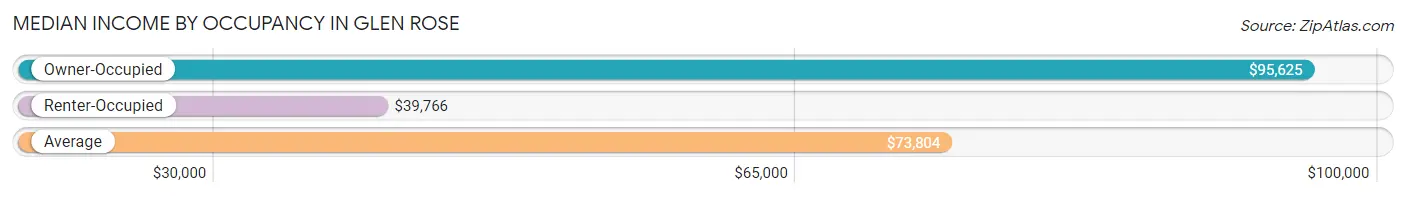
| Occupancy Type | # Households | Median Income |
| Owner-Occupied | 648 (67.9%) | $95,625 |
| Renter-Occupied | 306 (32.1%) | $39,766 |
| Average | 954 (100.0%) | $73,804 |
Occupancy by Householder Income Bracket in Glen Rose
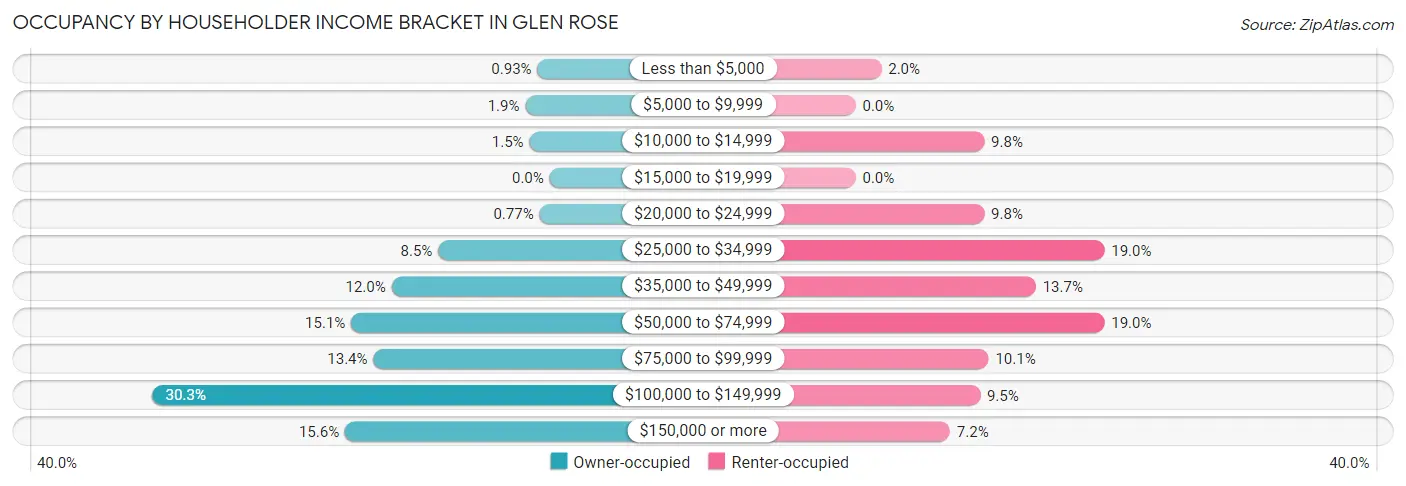
| Income Bracket | Owner-occupied | Renter-occupied |
| Less than $5,000 | 6 (0.9%) | 6 (2.0%) |
| $5,000 to $9,999 | 12 (1.8%) | 0 (0.0%) |
| $10,000 to $14,999 | 10 (1.5%) | 30 (9.8%) |
| $15,000 to $19,999 | 0 (0.0%) | 0 (0.0%) |
| $20,000 to $24,999 | 5 (0.8%) | 30 (9.8%) |
| $25,000 to $34,999 | 55 (8.5%) | 58 (19.0%) |
| $35,000 to $49,999 | 78 (12.0%) | 42 (13.7%) |
| $50,000 to $74,999 | 98 (15.1%) | 58 (19.0%) |
| $75,000 to $99,999 | 87 (13.4%) | 31 (10.1%) |
| $100,000 to $149,999 | 196 (30.2%) | 29 (9.5%) |
| $150,000 or more | 101 (15.6%) | 22 (7.2%) |
| Total | 648 (100.0%) | 306 (100.0%) |
Monthly Housing Cost Tiers in Glen Rose
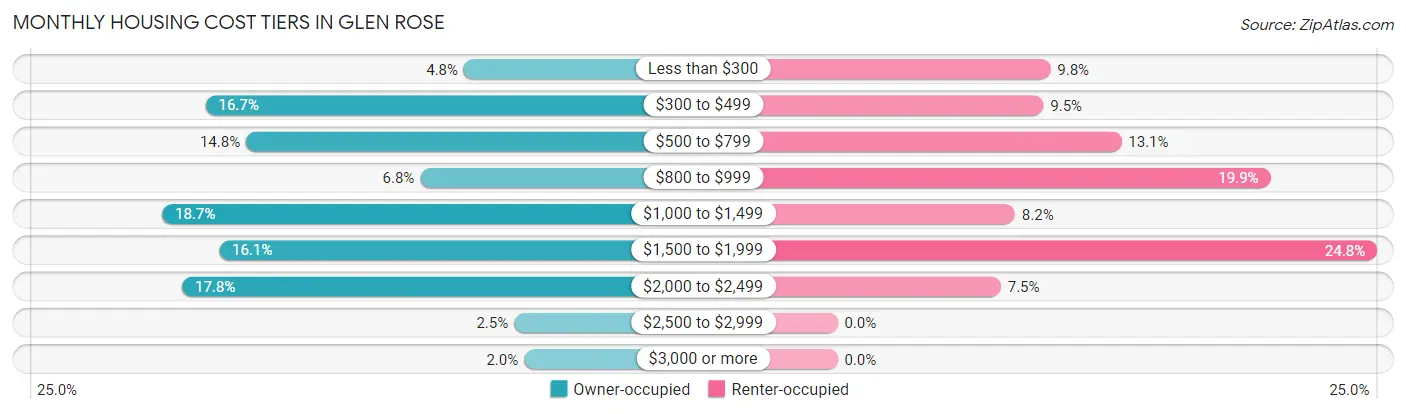
| Monthly Cost | Owner-occupied | Renter-occupied |
| Less than $300 | 31 (4.8%) | 30 (9.8%) |
| $300 to $499 | 108 (16.7%) | 29 (9.5%) |
| $500 to $799 | 96 (14.8%) | 40 (13.1%) |
| $800 to $999 | 44 (6.8%) | 61 (19.9%) |
| $1,000 to $1,499 | 121 (18.7%) | 25 (8.2%) |
| $1,500 to $1,999 | 104 (16.1%) | 76 (24.8%) |
| $2,000 to $2,499 | 115 (17.7%) | 23 (7.5%) |
| $2,500 to $2,999 | 16 (2.5%) | 0 (0.0%) |
| $3,000 or more | 13 (2.0%) | 0 (0.0%) |
| Total | 648 (100.0%) | 306 (100.0%) |
Physical Housing Characteristics in Glen Rose
Housing Structures in Glen Rose
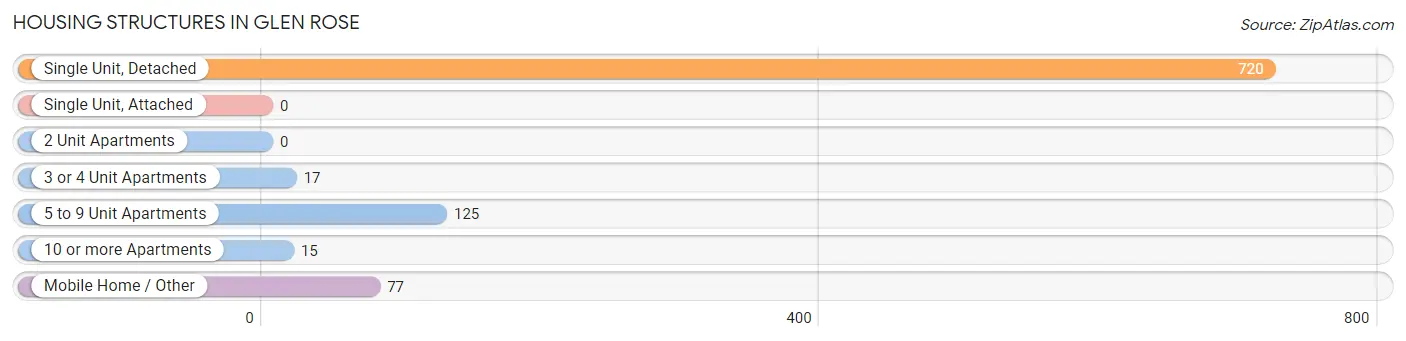
| Structure Type | # Housing Units | % Housing Units |
| Single Unit, Detached | 720 | 75.5% |
| Single Unit, Attached | 0 | 0.0% |
| 2 Unit Apartments | 0 | 0.0% |
| 3 or 4 Unit Apartments | 17 | 1.8% |
| 5 to 9 Unit Apartments | 125 | 13.1% |
| 10 or more Apartments | 15 | 1.6% |
| Mobile Home / Other | 77 | 8.1% |
| Total | 954 | 100.0% |
Housing Structures by Occupancy in Glen Rose
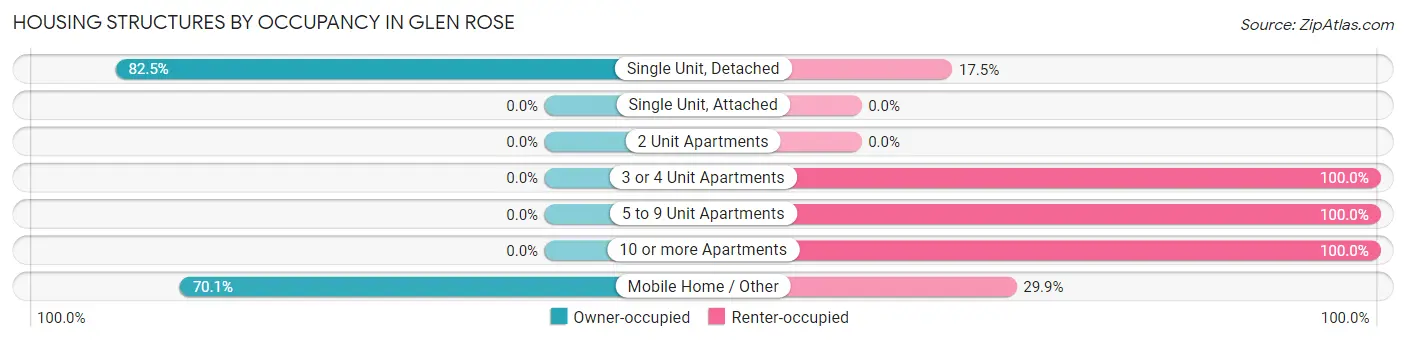
| Structure Type | Owner-occupied | Renter-occupied |
| Single Unit, Detached | 594 (82.5%) | 126 (17.5%) |
| Single Unit, Attached | 0 (0.0%) | 0 (0.0%) |
| 2 Unit Apartments | 0 (0.0%) | 0 (0.0%) |
| 3 or 4 Unit Apartments | 0 (0.0%) | 17 (100.0%) |
| 5 to 9 Unit Apartments | 0 (0.0%) | 125 (100.0%) |
| 10 or more Apartments | 0 (0.0%) | 15 (100.0%) |
| Mobile Home / Other | 54 (70.1%) | 23 (29.9%) |
| Total | 648 (67.9%) | 306 (32.1%) |
Housing Structures by Number of Rooms in Glen Rose
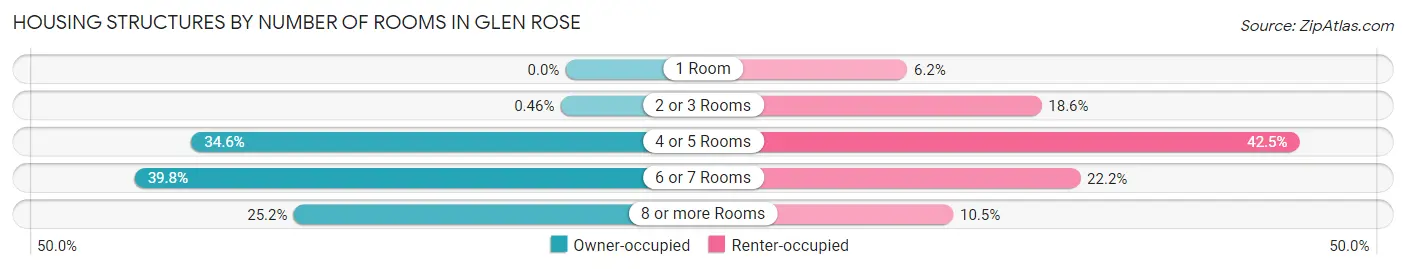
| Number of Rooms | Owner-occupied | Renter-occupied |
| 1 Room | 0 (0.0%) | 19 (6.2%) |
| 2 or 3 Rooms | 3 (0.5%) | 57 (18.6%) |
| 4 or 5 Rooms | 224 (34.6%) | 130 (42.5%) |
| 6 or 7 Rooms | 258 (39.8%) | 68 (22.2%) |
| 8 or more Rooms | 163 (25.2%) | 32 (10.5%) |
| Total | 648 (100.0%) | 306 (100.0%) |
Housing Structure by Heating Type in Glen Rose
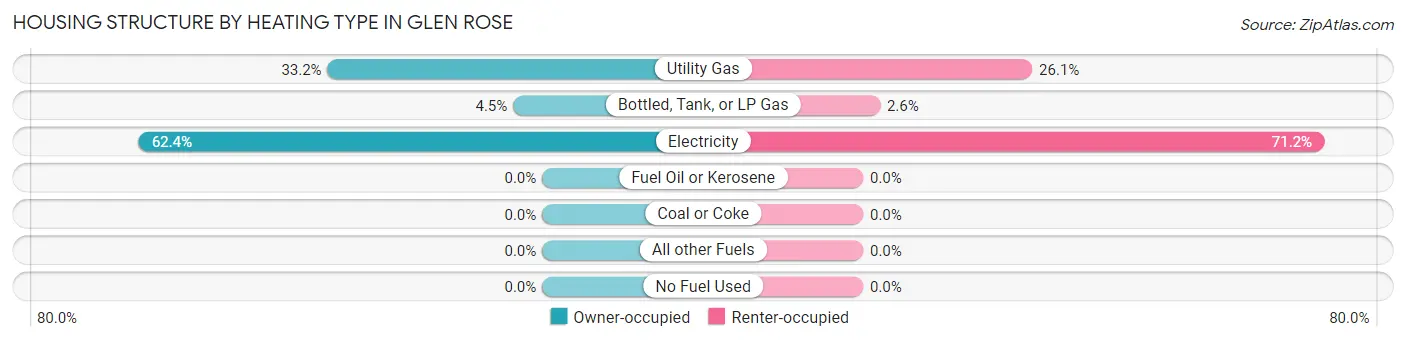
| Heating Type | Owner-occupied | Renter-occupied |
| Utility Gas | 215 (33.2%) | 80 (26.1%) |
| Bottled, Tank, or LP Gas | 29 (4.5%) | 8 (2.6%) |
| Electricity | 404 (62.4%) | 218 (71.2%) |
| Fuel Oil or Kerosene | 0 (0.0%) | 0 (0.0%) |
| Coal or Coke | 0 (0.0%) | 0 (0.0%) |
| All other Fuels | 0 (0.0%) | 0 (0.0%) |
| No Fuel Used | 0 (0.0%) | 0 (0.0%) |
| Total | 648 (100.0%) | 306 (100.0%) |
Household Vehicle Usage in Glen Rose
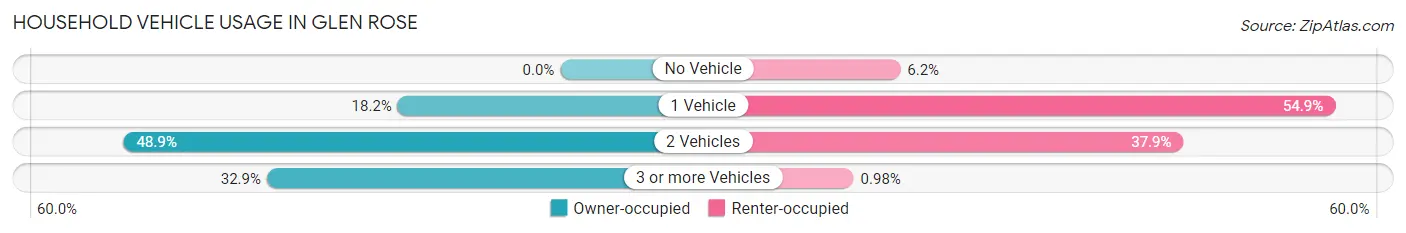
| Vehicles per Household | Owner-occupied | Renter-occupied |
| No Vehicle | 0 (0.0%) | 19 (6.2%) |
| 1 Vehicle | 118 (18.2%) | 168 (54.9%) |
| 2 Vehicles | 317 (48.9%) | 116 (37.9%) |
| 3 or more Vehicles | 213 (32.9%) | 3 (1.0%) |
| Total | 648 (100.0%) | 306 (100.0%) |
Real Estate & Mortgages in Glen Rose
Real Estate and Mortgage Overview in Glen Rose
| Characteristic | Without Mortgage | With Mortgage |
| Housing Units | 346 | 302 |
| Median Property Value | $168,400 | $273,600 |
| Median Household Income | $77,250 | $49 |
| Monthly Housing Costs | $614 | $13 |
| Real Estate Taxes | $2,262 | $0 |
Property Value by Mortgage Status in Glen Rose
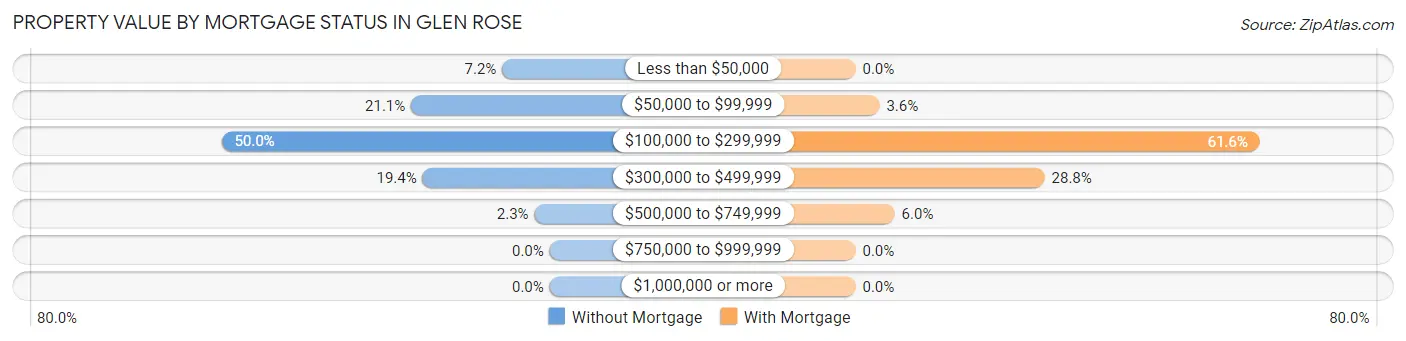
| Property Value | Without Mortgage | With Mortgage |
| Less than $50,000 | 25 (7.2%) | 0 (0.0%) |
| $50,000 to $99,999 | 73 (21.1%) | 11 (3.6%) |
| $100,000 to $299,999 | 173 (50.0%) | 186 (61.6%) |
| $300,000 to $499,999 | 67 (19.4%) | 87 (28.8%) |
| $500,000 to $749,999 | 8 (2.3%) | 18 (6.0%) |
| $750,000 to $999,999 | 0 (0.0%) | 0 (0.0%) |
| $1,000,000 or more | 0 (0.0%) | 0 (0.0%) |
| Total | 346 (100.0%) | 302 (100.0%) |
Household Income by Mortgage Status in Glen Rose
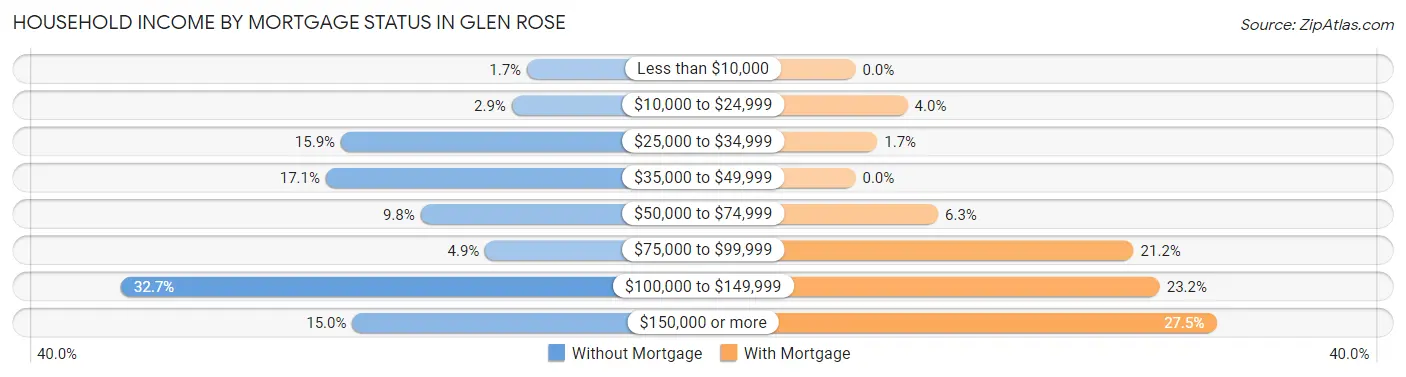
| Household Income | Without Mortgage | With Mortgage |
| Less than $10,000 | 6 (1.7%) | 0 (0.0%) |
| $10,000 to $24,999 | 10 (2.9%) | 12 (4.0%) |
| $25,000 to $34,999 | 55 (15.9%) | 5 (1.7%) |
| $35,000 to $49,999 | 59 (17.1%) | 0 (0.0%) |
| $50,000 to $74,999 | 34 (9.8%) | 19 (6.3%) |
| $75,000 to $99,999 | 17 (4.9%) | 64 (21.2%) |
| $100,000 to $149,999 | 113 (32.7%) | 70 (23.2%) |
| $150,000 or more | 52 (15.0%) | 83 (27.5%) |
| Total | 346 (100.0%) | 302 (100.0%) |
Property Value to Household Income Ratio in Glen Rose
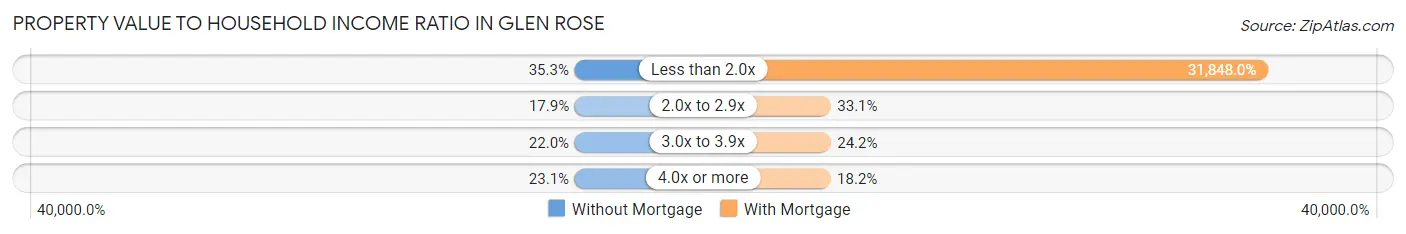
| Value-to-Income Ratio | Without Mortgage | With Mortgage |
| Less than 2.0x | 122 (35.3%) | 96,181 (31,848.0%) |
| 2.0x to 2.9x | 62 (17.9%) | 100 (33.1%) |
| 3.0x to 3.9x | 76 (22.0%) | 73 (24.2%) |
| 4.0x or more | 80 (23.1%) | 55 (18.2%) |
| Total | 346 (100.0%) | 302 (100.0%) |
Real Estate Taxes by Mortgage Status in Glen Rose
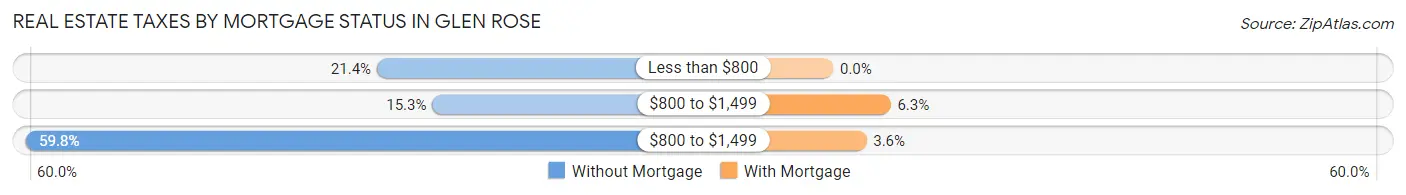
| Property Taxes | Without Mortgage | With Mortgage |
| Less than $800 | 74 (21.4%) | 0 (0.0%) |
| $800 to $1,499 | 53 (15.3%) | 19 (6.3%) |
| $800 to $1,499 | 207 (59.8%) | 11 (3.6%) |
| Total | 346 (100.0%) | 302 (100.0%) |
Health & Disability in Glen Rose
Health Insurance Coverage by Age in Glen Rose
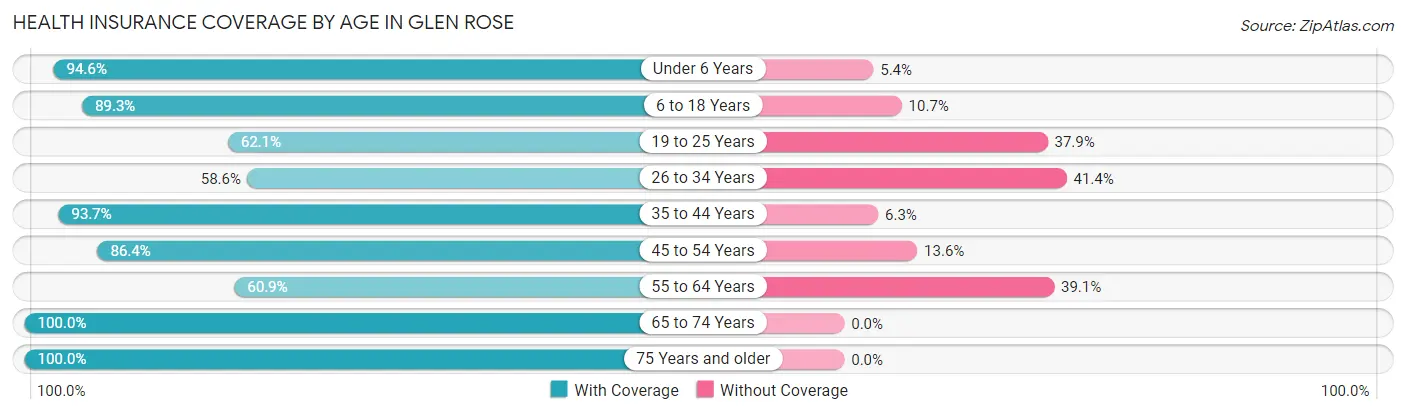
| Age Bracket | With Coverage | Without Coverage |
| Under 6 Years | 140 (94.6%) | 8 (5.4%) |
| 6 to 18 Years | 384 (89.3%) | 46 (10.7%) |
| 19 to 25 Years | 136 (62.1%) | 83 (37.9%) |
| 26 to 34 Years | 130 (58.6%) | 92 (41.4%) |
| 35 to 44 Years | 357 (93.7%) | 24 (6.3%) |
| 45 to 54 Years | 267 (86.4%) | 42 (13.6%) |
| 55 to 64 Years | 235 (60.9%) | 151 (39.1%) |
| 65 to 74 Years | 291 (100.0%) | 0 (0.0%) |
| 75 Years and older | 147 (100.0%) | 0 (0.0%) |
| Total | 2,087 (82.4%) | 446 (17.6%) |
Health Insurance Coverage by Citizenship Status in Glen Rose
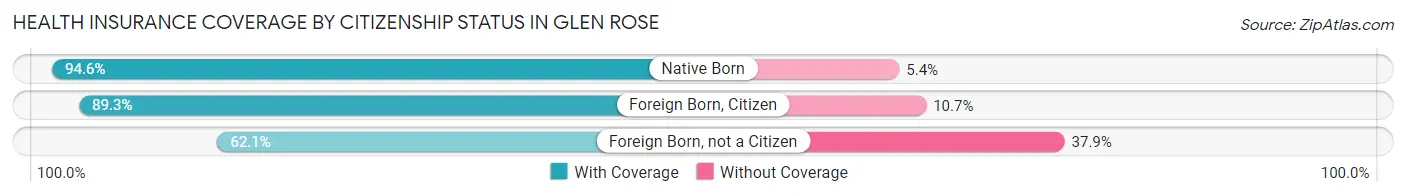
| Citizenship Status | With Coverage | Without Coverage |
| Native Born | 140 (94.6%) | 8 (5.4%) |
| Foreign Born, Citizen | 384 (89.3%) | 46 (10.7%) |
| Foreign Born, not a Citizen | 136 (62.1%) | 83 (37.9%) |
Health Insurance Coverage by Household Income in Glen Rose
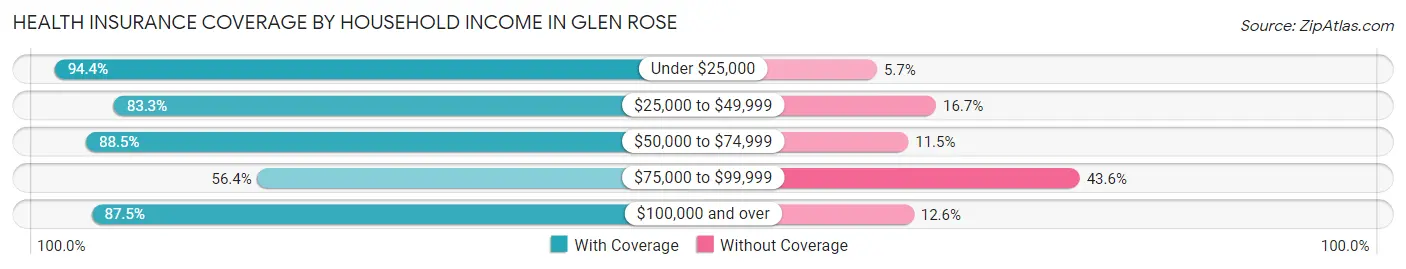
| Household Income | With Coverage | Without Coverage |
| Under $25,000 | 117 (94.4%) | 7 (5.7%) |
| $25,000 to $49,999 | 408 (83.3%) | 82 (16.7%) |
| $50,000 to $74,999 | 307 (88.5%) | 40 (11.5%) |
| $75,000 to $99,999 | 217 (56.4%) | 168 (43.6%) |
| $100,000 and over | 1,038 (87.5%) | 149 (12.6%) |
Public vs Private Health Insurance Coverage by Age in Glen Rose
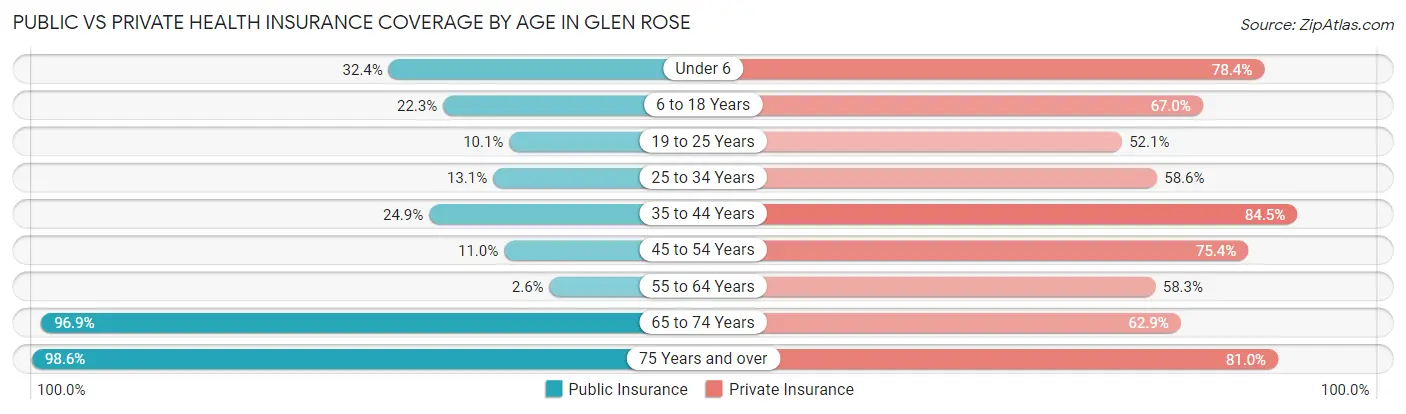
| Age Bracket | Public Insurance | Private Insurance |
| Under 6 | 48 (32.4%) | 116 (78.4%) |
| 6 to 18 Years | 96 (22.3%) | 288 (67.0%) |
| 19 to 25 Years | 22 (10.1%) | 114 (52.0%) |
| 25 to 34 Years | 29 (13.1%) | 130 (58.6%) |
| 35 to 44 Years | 95 (24.9%) | 322 (84.5%) |
| 45 to 54 Years | 34 (11.0%) | 233 (75.4%) |
| 55 to 64 Years | 10 (2.6%) | 225 (58.3%) |
| 65 to 74 Years | 282 (96.9%) | 183 (62.9%) |
| 75 Years and over | 145 (98.6%) | 119 (80.9%) |
| Total | 761 (30.0%) | 1,730 (68.3%) |
Disability Status by Sex by Age in Glen Rose
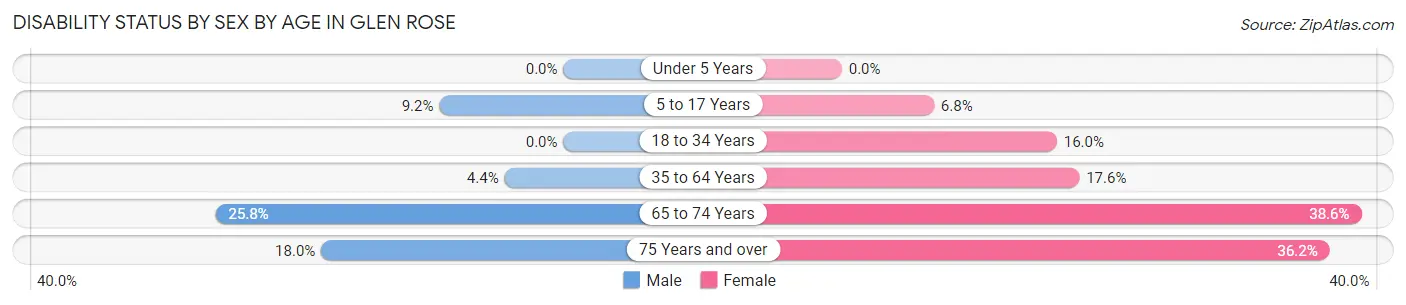
| Age Bracket | Male | Female |
| Under 5 Years | 0 (0.0%) | 0 (0.0%) |
| 5 to 17 Years | 14 (9.2%) | 18 (6.8%) |
| 18 to 34 Years | 0 (0.0%) | 45 (16.0%) |
| 35 to 64 Years | 22 (4.4%) | 101 (17.6%) |
| 65 to 74 Years | 39 (25.8%) | 54 (38.6%) |
| 75 Years and over | 16 (18.0%) | 21 (36.2%) |
Disability Class by Sex by Age in Glen Rose
Disability Class: Hearing Difficulty
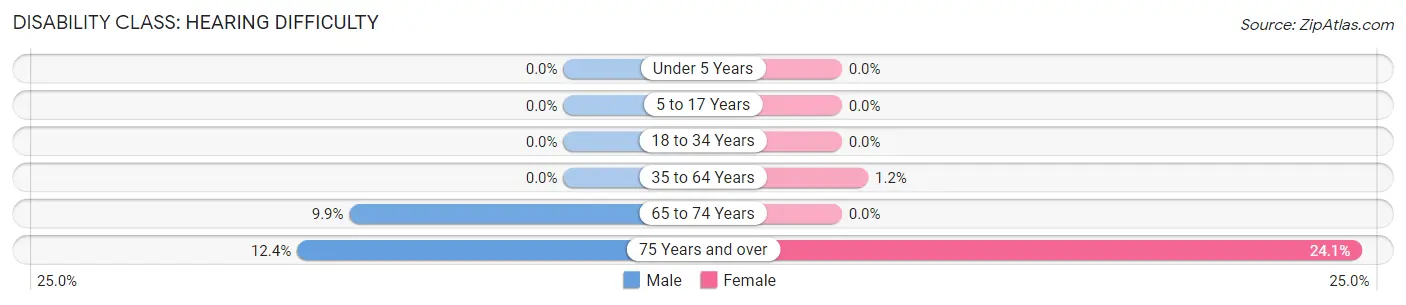
| Age Bracket | Male | Female |
| Under 5 Years | 0 (0.0%) | 0 (0.0%) |
| 5 to 17 Years | 0 (0.0%) | 0 (0.0%) |
| 18 to 34 Years | 0 (0.0%) | 0 (0.0%) |
| 35 to 64 Years | 0 (0.0%) | 7 (1.2%) |
| 65 to 74 Years | 15 (9.9%) | 0 (0.0%) |
| 75 Years and over | 11 (12.4%) | 14 (24.1%) |
Disability Class: Vision Difficulty
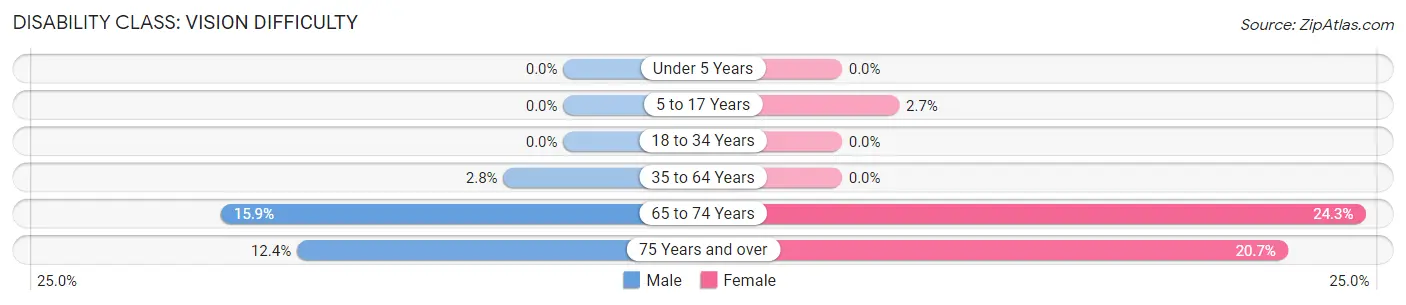
| Age Bracket | Male | Female |
| Under 5 Years | 0 (0.0%) | 0 (0.0%) |
| 5 to 17 Years | 0 (0.0%) | 7 (2.7%) |
| 18 to 34 Years | 0 (0.0%) | 0 (0.0%) |
| 35 to 64 Years | 14 (2.8%) | 0 (0.0%) |
| 65 to 74 Years | 24 (15.9%) | 34 (24.3%) |
| 75 Years and over | 11 (12.4%) | 12 (20.7%) |
Disability Class: Cognitive Difficulty
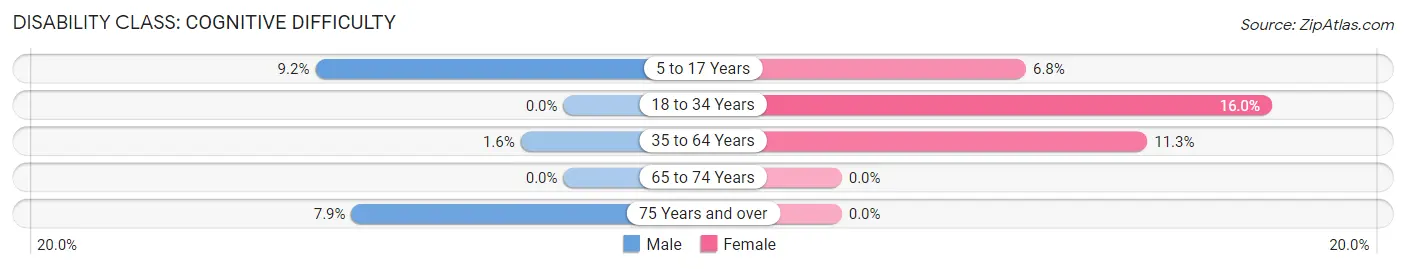
| Age Bracket | Male | Female |
| 5 to 17 Years | 14 (9.2%) | 18 (6.8%) |
| 18 to 34 Years | 0 (0.0%) | 45 (16.0%) |
| 35 to 64 Years | 8 (1.6%) | 65 (11.3%) |
| 65 to 74 Years | 0 (0.0%) | 0 (0.0%) |
| 75 Years and over | 7 (7.9%) | 0 (0.0%) |
Disability Class: Ambulatory Difficulty
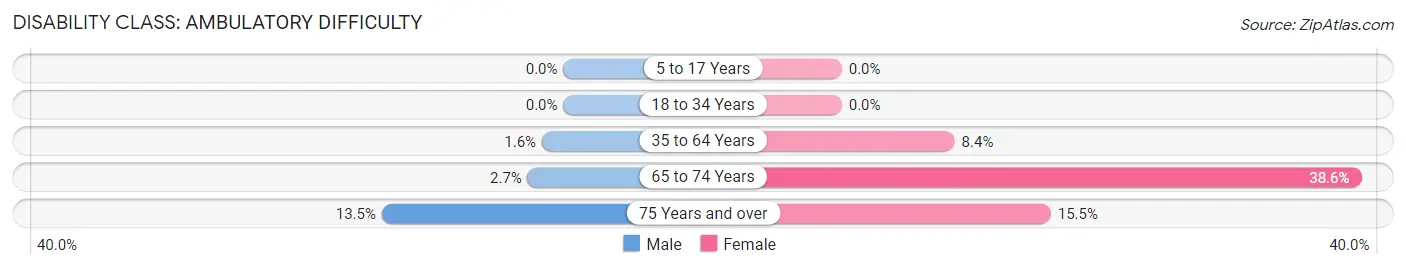
| Age Bracket | Male | Female |
| 5 to 17 Years | 0 (0.0%) | 0 (0.0%) |
| 18 to 34 Years | 0 (0.0%) | 0 (0.0%) |
| 35 to 64 Years | 8 (1.6%) | 48 (8.4%) |
| 65 to 74 Years | 4 (2.6%) | 54 (38.6%) |
| 75 Years and over | 12 (13.5%) | 9 (15.5%) |
Disability Class: Self-Care Difficulty
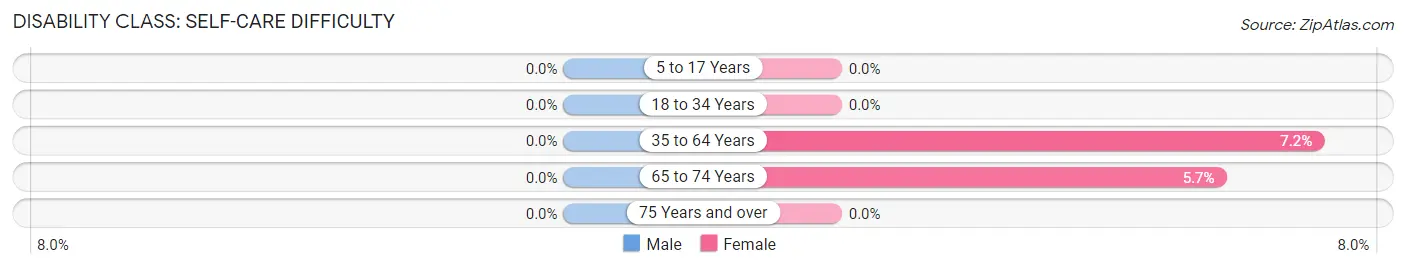
| Age Bracket | Male | Female |
| 5 to 17 Years | 0 (0.0%) | 0 (0.0%) |
| 18 to 34 Years | 0 (0.0%) | 0 (0.0%) |
| 35 to 64 Years | 0 (0.0%) | 41 (7.2%) |
| 65 to 74 Years | 0 (0.0%) | 8 (5.7%) |
| 75 Years and over | 0 (0.0%) | 0 (0.0%) |
Technology Access in Glen Rose
Computing Device Access in Glen Rose
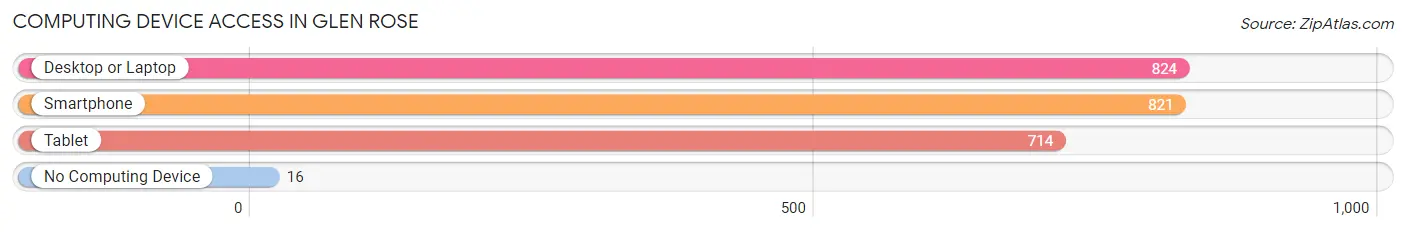
| Device Type | # Households | % Households |
| Desktop or Laptop | 824 | 86.4% |
| Smartphone | 821 | 86.1% |
| Tablet | 714 | 74.8% |
| No Computing Device | 16 | 1.7% |
| Total | 954 | 100.0% |
Internet Access in Glen Rose
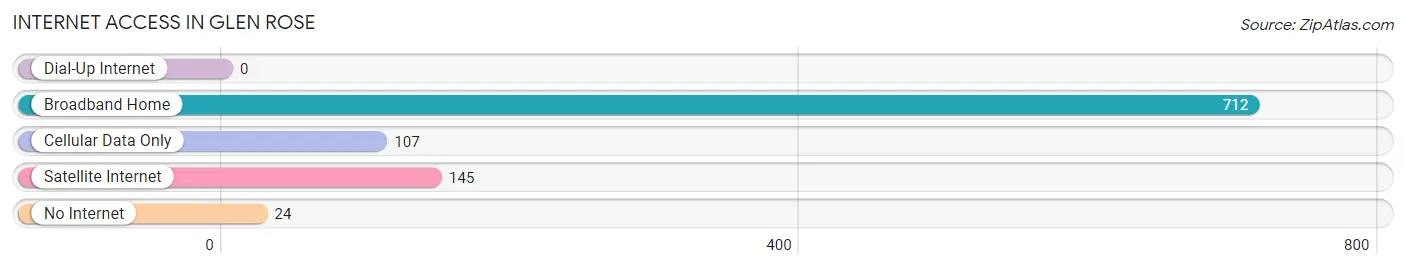
| Internet Type | # Households | % Households |
| Dial-Up Internet | 0 | 0.0% |
| Broadband Home | 712 | 74.6% |
| Cellular Data Only | 107 | 11.2% |
| Satellite Internet | 145 | 15.2% |
| No Internet | 24 | 2.5% |
| Total | 954 | 100.0% |
Glen Rose Summary
Glen Rose is a small town located in Somervell County, Texas, United States. It is situated about 70 miles southwest of Dallas and is part of the Dallas-Fort Worth Metroplex. The town is known for its natural beauty, its proximity to Dinosaur Valley State Park, and its historic downtown.
History
Glen Rose was founded in 1854 by settlers from Tennessee and Kentucky. The town was originally called “Goshen”, but the name was changed to Glen Rose in 1876. The town was named after the nearby Glen Rose limestone formation, which is a type of sedimentary rock.
The town grew slowly until the early 1900s, when the railroad arrived and the town began to develop. The railroad brought new businesses and industries to the area, and the population began to grow.
In the 1920s, the town was incorporated and began to develop further. The town was home to several businesses, including a cotton gin, a flour mill, and a sawmill.
Geography
Glen Rose is located in Somervell County, Texas, about 70 miles southwest of Dallas. The town is situated on the Paluxy River, which is a tributary of the Brazos River. The town is surrounded by rolling hills and is located in the Edwards Plateau region of Texas.
The climate in Glen Rose is generally mild, with hot summers and cool winters. The average annual temperature is around 68 degrees Fahrenheit. The average annual precipitation is around 33 inches.
Economy
The economy of Glen Rose is largely based on tourism. The town is home to Dinosaur Valley State Park, which attracts visitors from all over the world. The park is home to dinosaur tracks, which are some of the best-preserved dinosaur tracks in the world.
The town is also home to several other attractions, including the Fossil Rim Wildlife Center, the Somervell County Museum, and the Squaw Valley Golf Course.
In addition to tourism, the town is also home to several businesses, including a lumber mill, a feed mill, and a manufacturing plant.
Demographics
As of the 2010 census, the population of Glen Rose was 2,444. The racial makeup of the town was 94.3% White, 0.7% African American, 0.3% Native American, 0.2% Asian, 0.1% Pacific Islander, 2.7% from other races, and 1.7% from two or more races. Hispanic or Latino of any race were 5.3% of the population.
The median household income in Glen Rose was $37,917, and the median family income was $45,938. The per capita income was $20,945. About 11.3% of the population was below the poverty line.
Common Questions
What is Per Capita Income in Glen Rose?
Per Capita income in Glen Rose is $35,086.
What is the Median Family Income in Glen Rose?
Median Family Income in Glen Rose is $89,423.
What is the Median Household income in Glen Rose?
Median Household Income in Glen Rose is $73,804.
What is Income or Wage Gap in Glen Rose?
Income or Wage Gap in Glen Rose is 49.1%.
Women in Glen Rose earn 50.9 cents for every dollar earned by a man.
What is Inequality or Gini Index in Glen Rose?
Inequality or Gini Index in Glen Rose is 0.39.
What is the Total Population of Glen Rose?
Total Population of Glen Rose is 2,698.
What is the Total Male Population of Glen Rose?
Total Male Population of Glen Rose is 1,225.
What is the Total Female Population of Glen Rose?
Total Female Population of Glen Rose is 1,473.
What is the Ratio of Males per 100 Females in Glen Rose?
There are 83.16 Males per 100 Females in Glen Rose.
What is the Ratio of Females per 100 Males in Glen Rose?
There are 120.24 Females per 100 Males in Glen Rose.
What is the Median Population Age in Glen Rose?
Median Population Age in Glen Rose is 43.6 Years.
What is the Average Family Size in Glen Rose
Average Family Size in Glen Rose is 2.9 People.
What is the Average Household Size in Glen Rose
Average Household Size in Glen Rose is 2.7 People.
How Large is the Labor Force in Glen Rose?
There are 1,298 People in the Labor Forcein in Glen Rose.
What is the Percentage of People in the Labor Force in Glen Rose?
58.9% of People are in the Labor Force in Glen Rose.
What is the Unemployment Rate in Glen Rose?
Unemployment Rate in Glen Rose is 2.6%.