Garrison, TX Map & Demographics
Garrison Map
Garrison Overview
$27,094
PER CAPITA INCOME
$49,848
AVG FAMILY INCOME
$40,147
AVG HOUSEHOLD INCOME
62.7%
WAGE / INCOME GAP [ % ]
37.3¢/ $1
WAGE / INCOME GAP [ $ ]
0.46
INEQUALITY / GINI INDEX
987
TOTAL POPULATION
443
MALE POPULATION
544
FEMALE POPULATION
81.43
MALES / 100 FEMALES
122.80
FEMALES / 100 MALES
50.3
MEDIAN AGE
2.6
AVG FAMILY SIZE
2.0
AVG HOUSEHOLD SIZE
432
LABOR FORCE [ PEOPLE ]
51.9%
PERCENT IN LABOR FORCE
12.3%
UNEMPLOYMENT RATE
Garrison Zip Codes
Garrison Area Codes
Income in Garrison
Income Overview in Garrison
Per Capita Income in Garrison is $27,094, while median incomes of families and households are $49,848 and $40,147 respectively.
| Characteristic | Number | Measure |
| Per Capita Income | 987 | $27,094 |
| Median Family Income | 253 | $49,848 |
| Mean Family Income | 253 | $76,208 |
| Median Household Income | 438 | $40,147 |
| Mean Household Income | 438 | $56,944 |
| Income Deficit | 253 | $0 |
| Wage / Income Gap (%) | 987 | 62.69% |
| Wage / Income Gap ($) | 987 | 37.31¢ per $1 |
| Gini / Inequality Index | 987 | 0.46 |
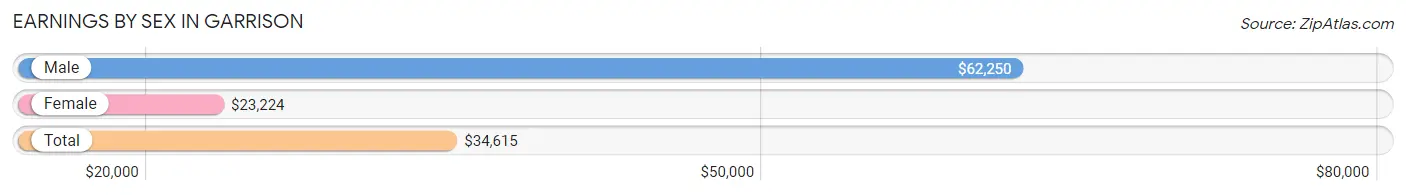
Earnings by Sex in Garrison
Average Earnings in Garrison are $34,615, $62,250 for men and $23,224 for women, a difference of 62.7%.
| Sex | Number | Average Earnings |
| Male | 199 (46.5%) | $62,250 |
| Female | 229 (53.5%) | $23,224 |
| Total | 428 (100.0%) | $34,615 |
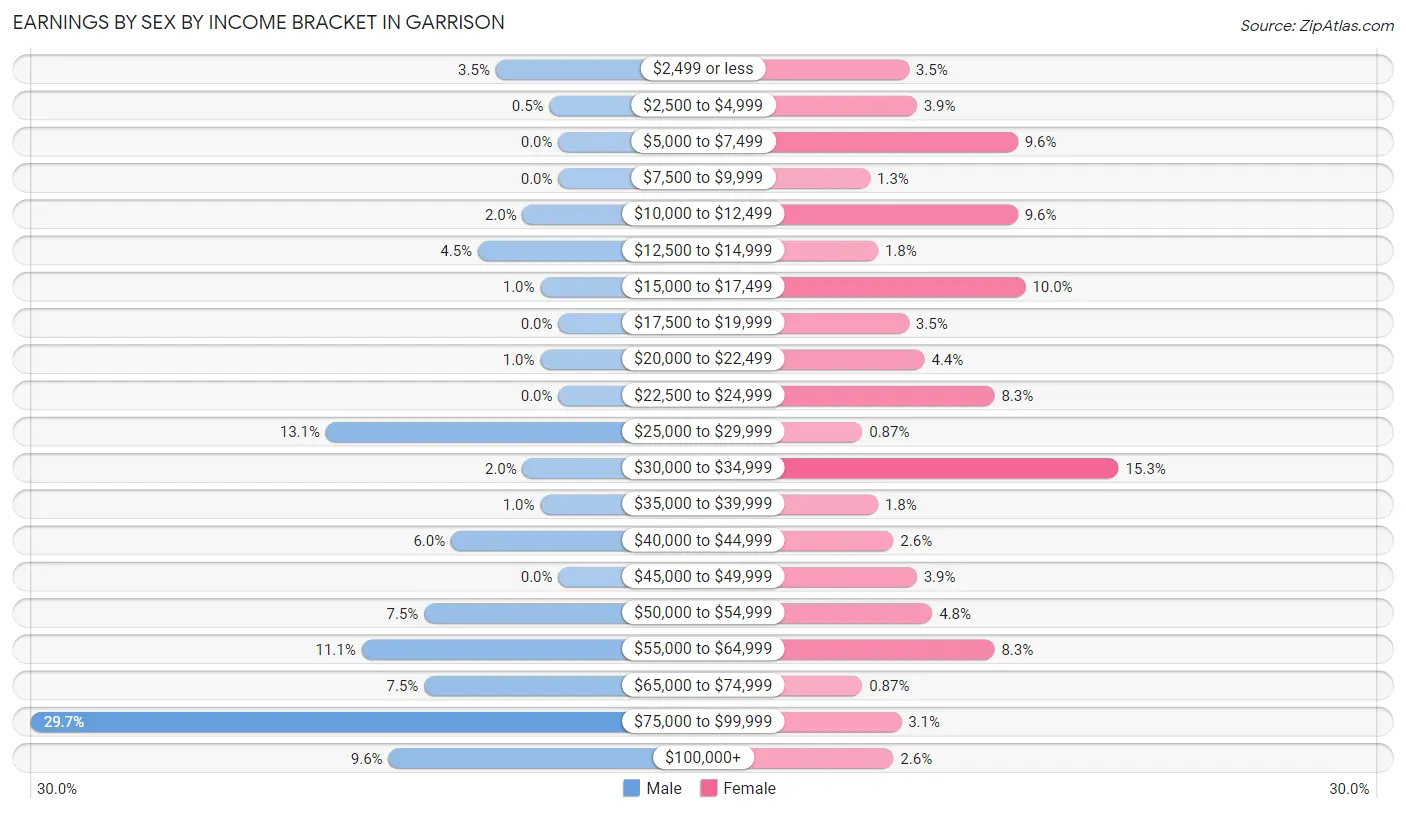
Earnings by Sex by Income Bracket in Garrison
The most common earnings brackets in Garrison are $75,000 to $99,999 for men (59 | 29.6%) and $30,000 to $34,999 for women (35 | 15.3%).
| Income | Male | Female |
| $2,499 or less | 7 (3.5%) | 8 (3.5%) |
| $2,500 to $4,999 | 1 (0.5%) | 9 (3.9%) |
| $5,000 to $7,499 | 0 (0.0%) | 22 (9.6%) |
| $7,500 to $9,999 | 0 (0.0%) | 3 (1.3%) |
| $10,000 to $12,499 | 4 (2.0%) | 22 (9.6%) |
| $12,500 to $14,999 | 9 (4.5%) | 4 (1.8%) |
| $15,000 to $17,499 | 2 (1.0%) | 23 (10.0%) |
| $17,500 to $19,999 | 0 (0.0%) | 8 (3.5%) |
| $20,000 to $22,499 | 2 (1.0%) | 10 (4.4%) |
| $22,500 to $24,999 | 0 (0.0%) | 19 (8.3%) |
| $25,000 to $29,999 | 26 (13.1%) | 2 (0.9%) |
| $30,000 to $34,999 | 4 (2.0%) | 35 (15.3%) |
| $35,000 to $39,999 | 2 (1.0%) | 4 (1.8%) |
| $40,000 to $44,999 | 12 (6.0%) | 6 (2.6%) |
| $45,000 to $49,999 | 0 (0.0%) | 9 (3.9%) |
| $50,000 to $54,999 | 15 (7.5%) | 11 (4.8%) |
| $55,000 to $64,999 | 22 (11.1%) | 19 (8.3%) |
| $65,000 to $74,999 | 15 (7.5%) | 2 (0.9%) |
| $75,000 to $99,999 | 59 (29.6%) | 7 (3.1%) |
| $100,000+ | 19 (9.6%) | 6 (2.6%) |
| Total | 199 (100.0%) | 229 (100.0%) |
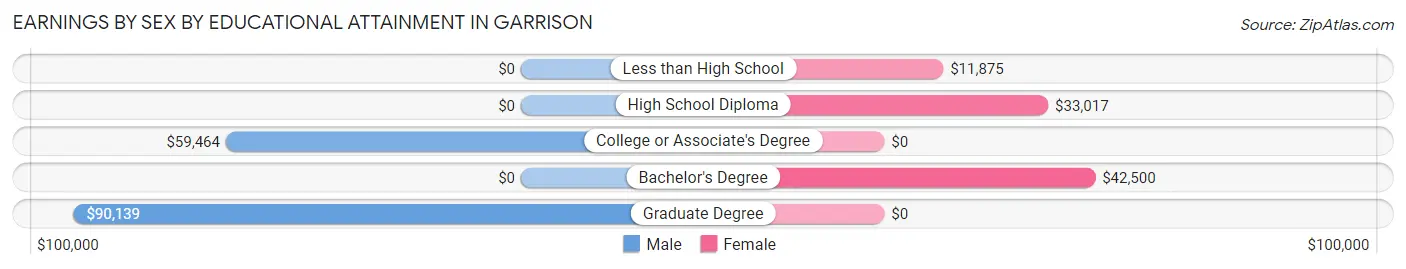
Earnings by Sex by Educational Attainment in Garrison
Average earnings in Garrison are $63,542 for men and $24,297 for women, a difference of 61.8%. Men with an educational attainment of graduate degree enjoy the highest average annual earnings of $90,139, while those with college or associate's degree education earn the least with $59,464. Women with an educational attainment of bachelor's degree earn the most with the average annual earnings of $42,500, while those with less than high school education have the smallest earnings of $11,875.
| Educational Attainment | Male Income | Female Income |
| Less than High School | - | - |
| High School Diploma | - | - |
| College or Associate's Degree | $59,464 | $0 |
| Bachelor's Degree | - | - |
| Graduate Degree | $90,139 | $0 |
| Total | $63,542 | $24,297 |
Family Income in Garrison
Family Income Brackets in Garrison
According to the Garrison family income data, there are 60 families falling into the $100,000 to $149,999 income range, which is the most common income bracket and makes up 23.7% of all families. Conversely, the $10,000 to $14,999 income bracket is the least frequent group with only 10 families (4.0%) belonging to this category.
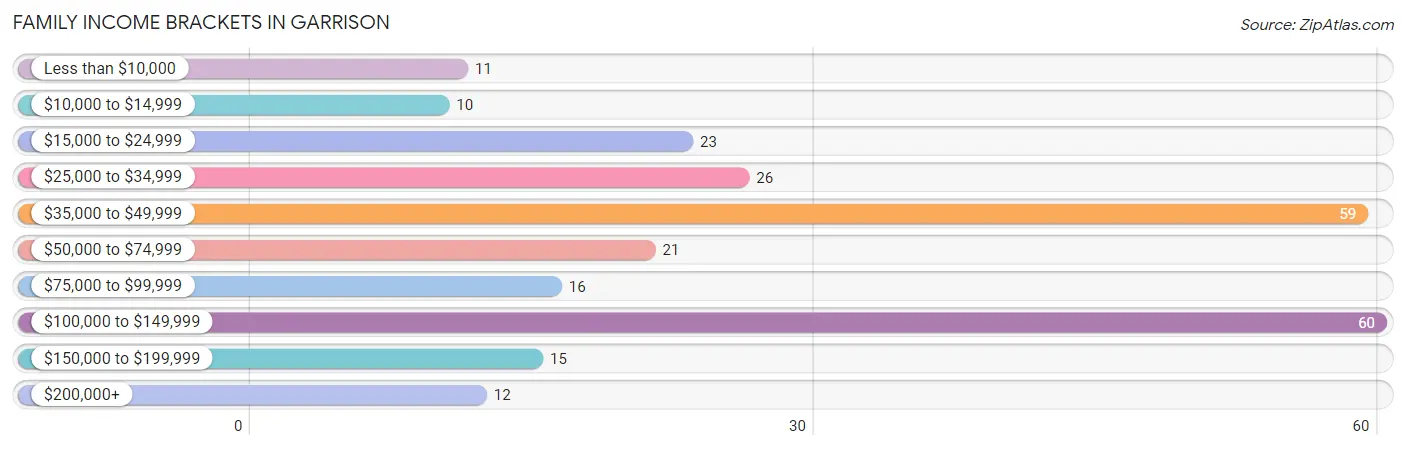
| Income Bracket | # Families | % Families |
| Less than $10,000 | 11 | 4.3% |
| $10,000 to $14,999 | 10 | 4.0% |
| $15,000 to $24,999 | 23 | 9.1% |
| $25,000 to $34,999 | 26 | 10.3% |
| $35,000 to $49,999 | 59 | 23.3% |
| $50,000 to $74,999 | 21 | 8.3% |
| $75,000 to $99,999 | 16 | 6.3% |
| $100,000 to $149,999 | 60 | 23.7% |
| $150,000 to $199,999 | 15 | 5.9% |
| $200,000+ | 12 | 4.7% |
Family Income by Famaliy Size in Garrison
4-person families (37 | 14.6%) account for the highest median family income in Garrison with $101,875 per family, while 4-person families (37 | 14.6%) have the highest median income of $25,469 per family member.
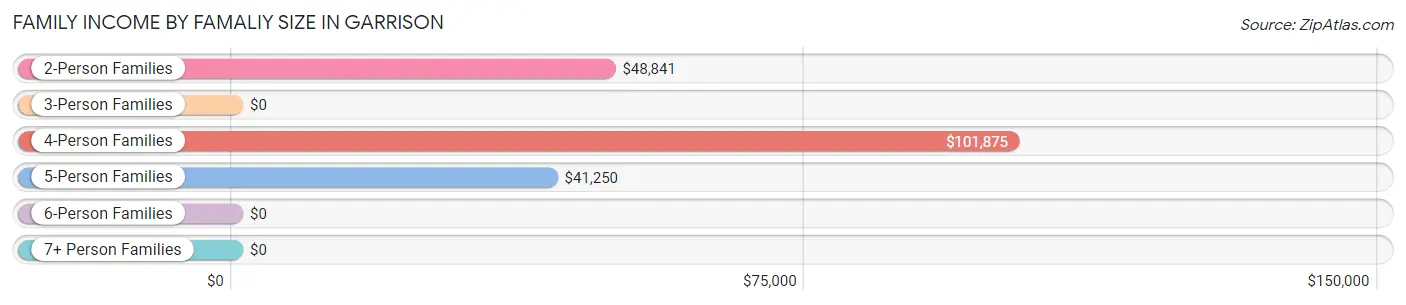
| Income Bracket | # Families | Median Income |
| 2-Person Families | 168 (66.4%) | $48,841 |
| 3-Person Families | 38 (15.0%) | $0 |
| 4-Person Families | 37 (14.6%) | $101,875 |
| 5-Person Families | 7 (2.8%) | $41,250 |
| 6-Person Families | 3 (1.2%) | $0 |
| 7+ Person Families | 0 (0.0%) | $0 |
| Total | 253 (100.0%) | $49,848 |
Family Income by Number of Earners in Garrison
The median family income in Garrison is $49,848, with families comprising 2 earners (109) having the highest median family income of $117,543, while families with no earners (48) have the lowest median family income of $18,333, accounting for 43.1% and 19.0% of families, respectively.
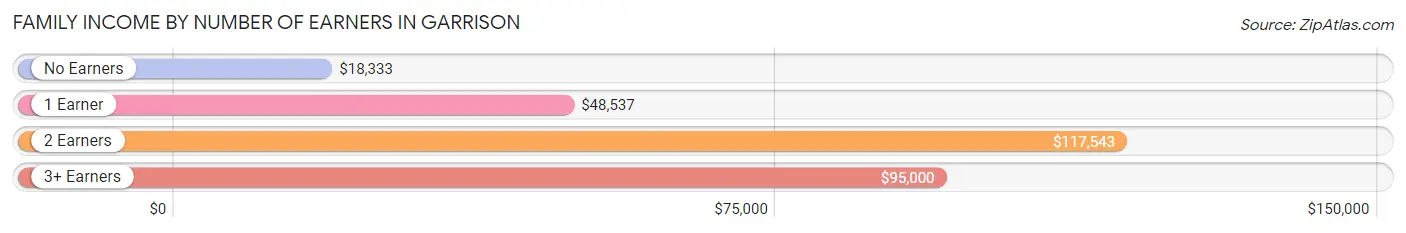
| Number of Earners | # Families | Median Income |
| No Earners | 48 (19.0%) | $18,333 |
| 1 Earner | 86 (34.0%) | $48,537 |
| 2 Earners | 109 (43.1%) | $117,543 |
| 3+ Earners | 10 (4.0%) | $95,000 |
| Total | 253 (100.0%) | $49,848 |
Household Income in Garrison
Household Income Brackets in Garrison
With 86 households falling in the category, the $15,000 to $24,999 income range is the most frequent in Garrison, accounting for 19.6% of all households. In contrast, only 12 households (2.7%) fall into the $200,000+ income bracket, making it the least populous group.
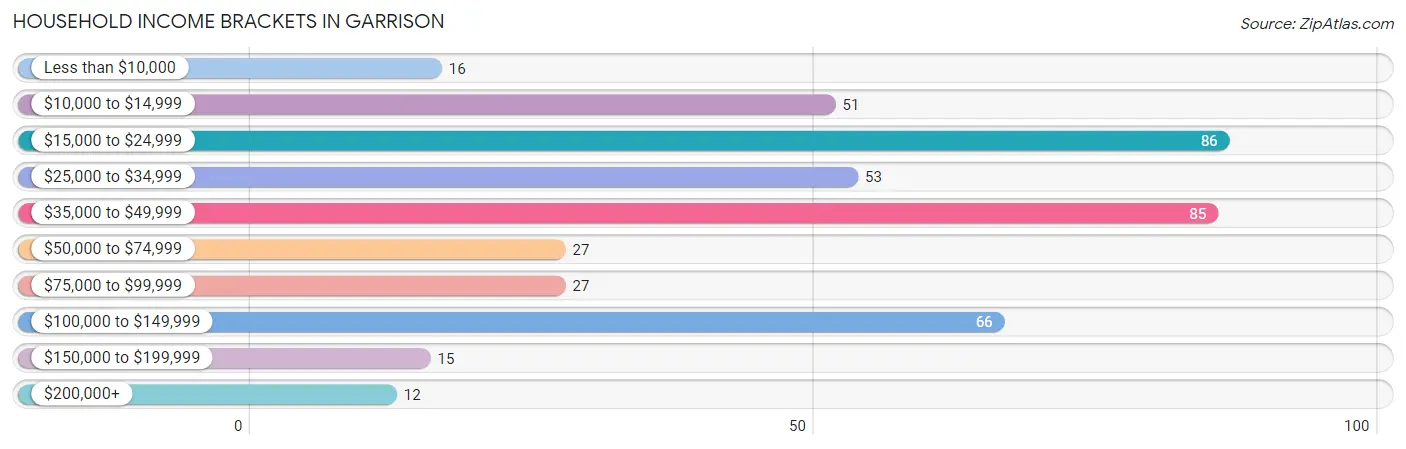
| Income Bracket | # Households | % Households |
| Less than $10,000 | 16 | 3.7% |
| $10,000 to $14,999 | 51 | 11.6% |
| $15,000 to $24,999 | 86 | 19.6% |
| $25,000 to $34,999 | 53 | 12.1% |
| $35,000 to $49,999 | 85 | 19.4% |
| $50,000 to $74,999 | 27 | 6.2% |
| $75,000 to $99,999 | 27 | 6.2% |
| $100,000 to $149,999 | 66 | 15.1% |
| $150,000 to $199,999 | 15 | 3.4% |
| $200,000+ | 12 | 2.7% |
Household Income by Householder Age in Garrison
The median household income in Garrison is $40,147, with the highest median household income of $45,500 found in the 25 to 44 years age bracket for the primary householder. A total of 112 households (25.6%) fall into this category. Meanwhile, the 15 to 24 years age bracket for the primary householder has the lowest median household income of $0, with 8 households (1.8%) in this group.
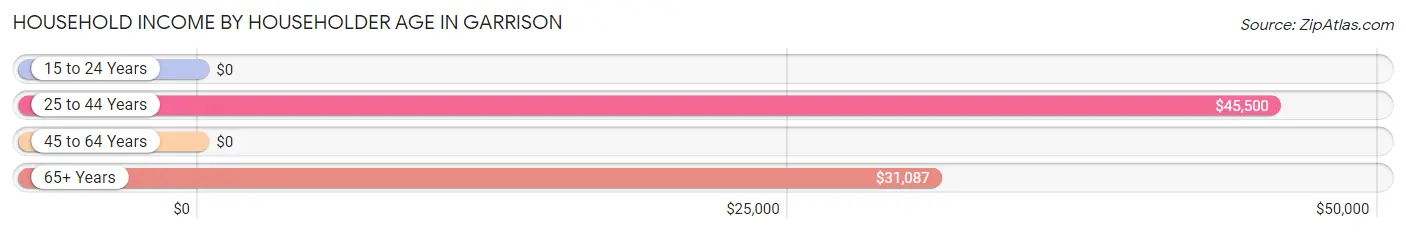
| Income Bracket | # Households | Median Income |
| 15 to 24 Years | 8 (1.8%) | $0 |
| 25 to 44 Years | 112 (25.6%) | $45,500 |
| 45 to 64 Years | 184 (42.0%) | $0 |
| 65+ Years | 134 (30.6%) | $31,087 |
| Total | 438 (100.0%) | $40,147 |
Poverty in Garrison
Income Below Poverty by Sex and Age in Garrison
With 17.0% poverty level for males and 22.3% for females among the residents of Garrison, 6 to 11 year old males and 25 to 34 year old females are the most vulnerable to poverty, with 20 males (55.6%) and 14 females (51.8%) in their respective age groups living below the poverty level.
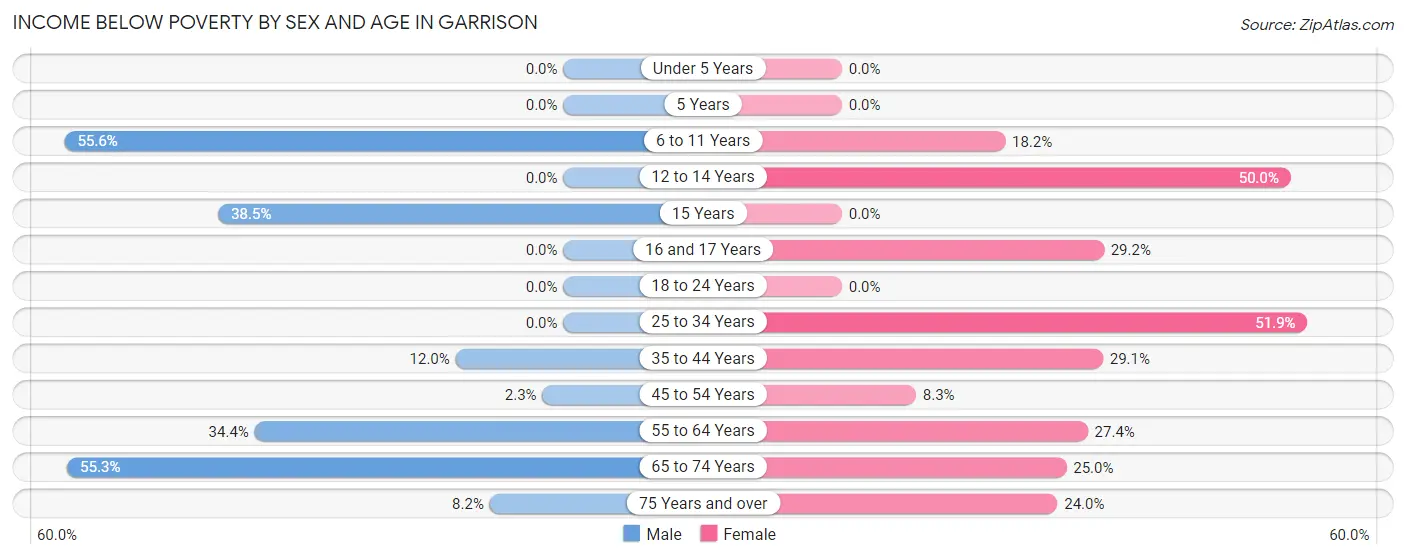
| Age Bracket | Male | Female |
| Under 5 Years | 0 (0.0%) | 0 (0.0%) |
| 5 Years | 0 (0.0%) | 0 (0.0%) |
| 6 to 11 Years | 20 (55.6%) | 8 (18.2%) |
| 12 to 14 Years | 0 (0.0%) | 4 (50.0%) |
| 15 Years | 5 (38.5%) | 0 (0.0%) |
| 16 and 17 Years | 0 (0.0%) | 7 (29.2%) |
| 18 to 24 Years | 0 (0.0%) | 0 (0.0%) |
| 25 to 34 Years | 0 (0.0%) | 14 (51.8%) |
| 35 to 44 Years | 6 (12.0%) | 25 (29.1%) |
| 45 to 54 Years | 2 (2.3%) | 8 (8.3%) |
| 55 to 64 Years | 11 (34.4%) | 23 (27.4%) |
| 65 to 74 Years | 21 (55.3%) | 11 (25.0%) |
| 75 Years and over | 5 (8.2%) | 6 (24.0%) |
| Total | 70 (17.0%) | 106 (22.3%) |
Income Above Poverty by Sex and Age in Garrison
According to the poverty statistics in Garrison, males aged under 5 years and females aged under 5 years are the age groups that are most secure financially, with 100.0% of males and 100.0% of females in these age groups living above the poverty line.
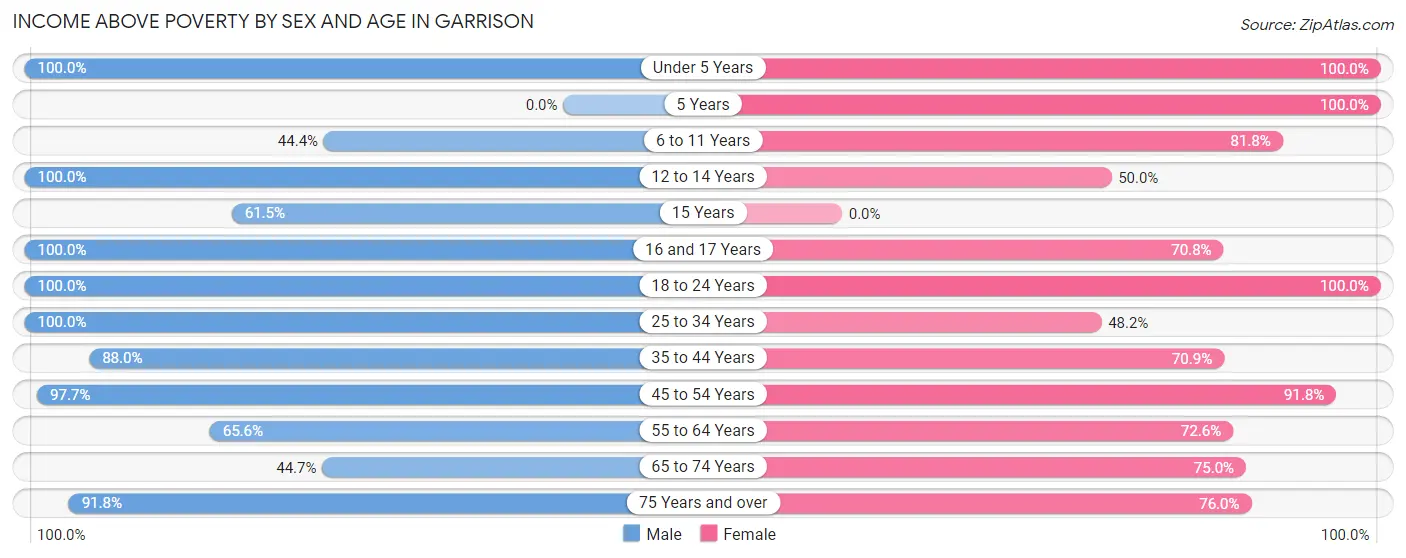
| Age Bracket | Male | Female |
| Under 5 Years | 21 (100.0%) | 11 (100.0%) |
| 5 Years | 0 (0.0%) | 3 (100.0%) |
| 6 to 11 Years | 16 (44.4%) | 36 (81.8%) |
| 12 to 14 Years | 19 (100.0%) | 4 (50.0%) |
| 15 Years | 8 (61.5%) | 0 (0.0%) |
| 16 and 17 Years | 3 (100.0%) | 17 (70.8%) |
| 18 to 24 Years | 17 (100.0%) | 23 (100.0%) |
| 25 to 34 Years | 36 (100.0%) | 13 (48.1%) |
| 35 to 44 Years | 44 (88.0%) | 61 (70.9%) |
| 45 to 54 Years | 84 (97.7%) | 89 (91.7%) |
| 55 to 64 Years | 21 (65.6%) | 61 (72.6%) |
| 65 to 74 Years | 17 (44.7%) | 33 (75.0%) |
| 75 Years and over | 56 (91.8%) | 19 (76.0%) |
| Total | 342 (83.0%) | 370 (77.7%) |
Income Below Poverty Among Married-Couple Families in Garrison
The poverty statistics for married-couple families in Garrison show that 4.9% or 10 of the total 203 families live below the poverty line. Families with 1 or 2 children have the highest poverty rate of 8.6%, comprising of 5 families. On the other hand, families with 3 or 4 children have the lowest poverty rate of 0.0%, which includes 0 families.
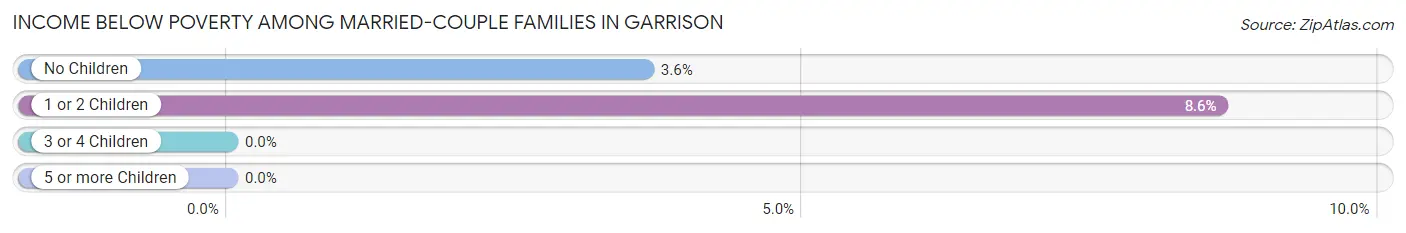
| Children | Above Poverty | Below Poverty |
| No Children | 133 (96.4%) | 5 (3.6%) |
| 1 or 2 Children | 53 (91.4%) | 5 (8.6%) |
| 3 or 4 Children | 7 (100.0%) | 0 (0.0%) |
| 5 or more Children | 0 (0.0%) | 0 (0.0%) |
| Total | 193 (95.1%) | 10 (4.9%) |
Income Below Poverty Among Single-Parent Households in Garrison
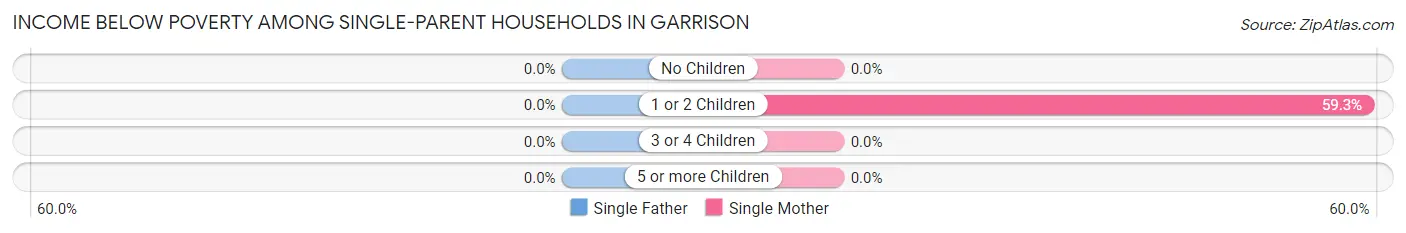
| Children | Single Father | Single Mother |
| No Children | 0 (0.0%) | 0 (0.0%) |
| 1 or 2 Children | 0 (0.0%) | 16 (59.3%) |
| 3 or 4 Children | 0 (0.0%) | 0 (0.0%) |
| 5 or more Children | 0 (0.0%) | 0 (0.0%) |
| Total | 0 (0.0%) | 16 (37.2%) |
Income Below Poverty Among Married-Couple vs Single-Parent Households in Garrison
The poverty data for Garrison shows that 10 of the married-couple family households (4.9%) and 16 of the single-parent households (32.0%) are living below the poverty level. Within the married-couple family households, those with 1 or 2 children have the highest poverty rate, with 5 households (8.6%) falling below the poverty line. Among the single-parent households, those with 1 or 2 children have the highest poverty rate, with 16 household (47.1%) living below poverty.
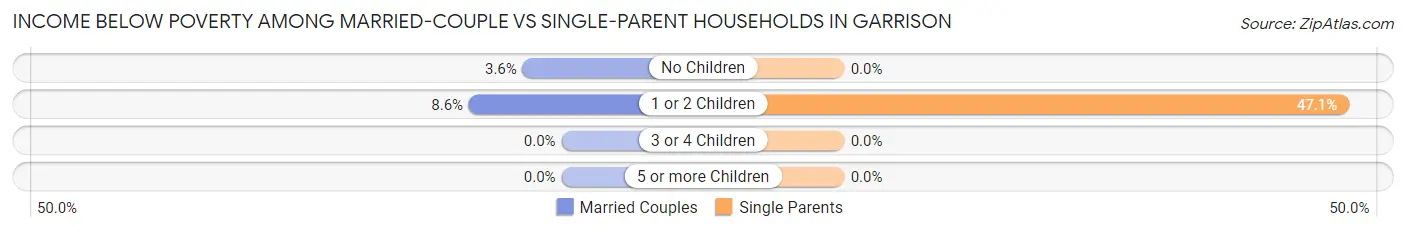
| Children | Married-Couple Families | Single-Parent Households |
| No Children | 5 (3.6%) | 0 (0.0%) |
| 1 or 2 Children | 5 (8.6%) | 16 (47.1%) |
| 3 or 4 Children | 0 (0.0%) | 0 (0.0%) |
| 5 or more Children | 0 (0.0%) | 0 (0.0%) |
| Total | 10 (4.9%) | 16 (32.0%) |
Race in Garrison
The most populous races in Garrison are White / Caucasian (673 | 68.2%), Black / African American (247 | 25.0%), and Two or more Races (53 | 5.4%).
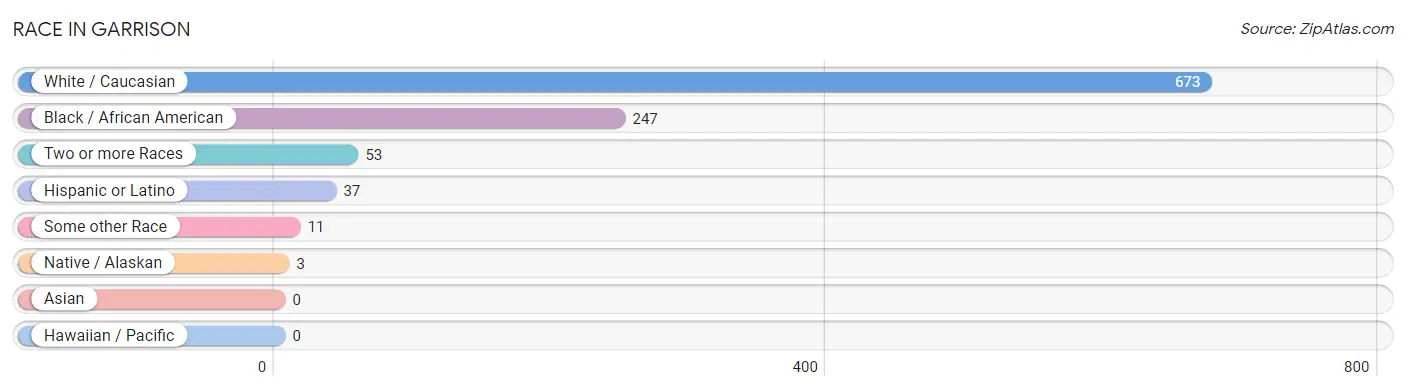
| Race | # Population | % Population |
| Asian | 0 | 0.0% |
| Black / African American | 247 | 25.0% |
| Hawaiian / Pacific | 0 | 0.0% |
| Hispanic or Latino | 37 | 3.7% |
| Native / Alaskan | 3 | 0.3% |
| White / Caucasian | 673 | 68.2% |
| Two or more Races | 53 | 5.4% |
| Some other Race | 11 | 1.1% |
| Total | 987 | 100.0% |
Ancestry in Garrison
The most populous ancestries reported in Garrison are American (146 | 14.8%), Irish (122 | 12.4%), German (63 | 6.4%), English (60 | 6.1%), and Mexican (37 | 3.7%), together accounting for 43.4% of all Garrison residents.
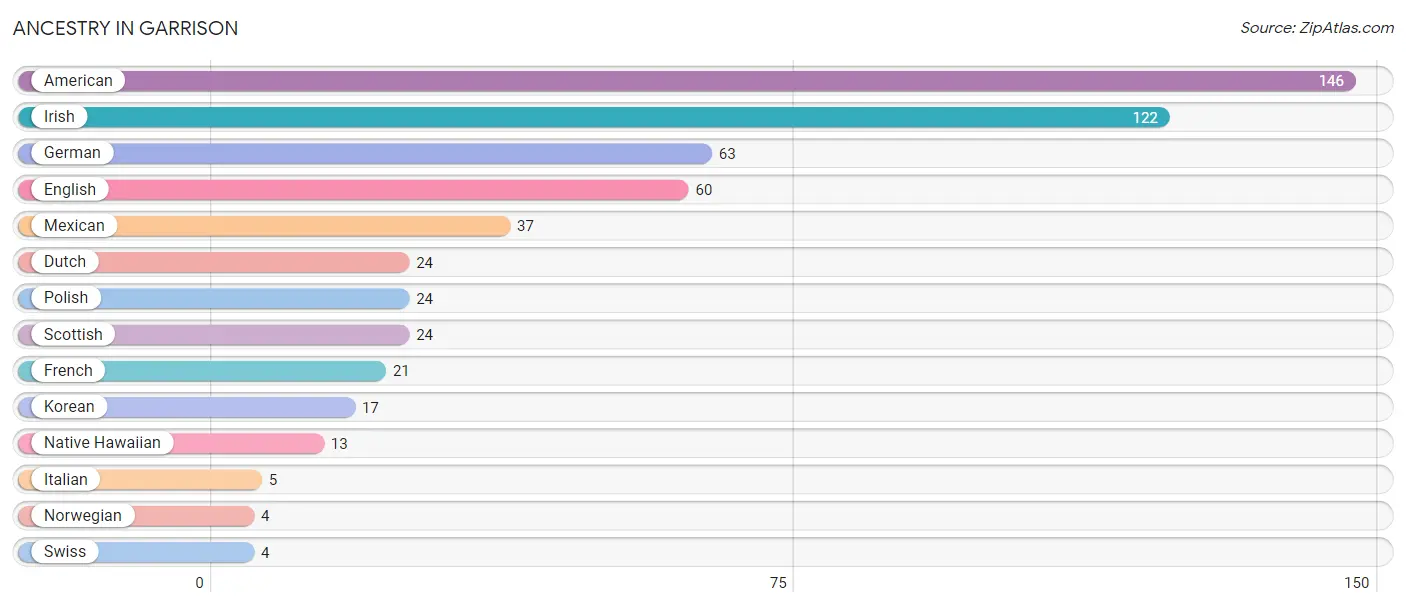
| Ancestry | # Population | % Population |
| American | 146 | 14.8% |
| Dutch | 24 | 2.4% |
| English | 60 | 6.1% |
| French | 21 | 2.1% |
| German | 63 | 6.4% |
| Irish | 122 | 12.4% |
| Italian | 5 | 0.5% |
| Korean | 17 | 1.7% |
| Mexican | 37 | 3.7% |
| Native Hawaiian | 13 | 1.3% |
| Norwegian | 4 | 0.4% |
| Polish | 24 | 2.4% |
| Scottish | 24 | 2.4% |
| Swiss | 4 | 0.4% | View All 14 Rows |
Immigrants in Garrison
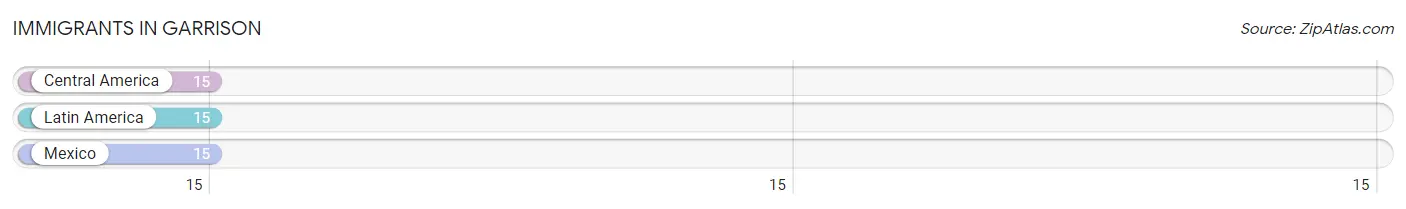
The most numerous immigrant groups reported in Garrison came from Central America (15 | 1.5%), Latin America (15 | 1.5%), and Mexico (15 | 1.5%), together accounting for 4.6% of all Garrison residents.
| Immigration Origin | # Population | % Population |
| Central America | 15 | 1.5% |
| Latin America | 15 | 1.5% |
| Mexico | 15 | 1.5% | View All 3 Rows |
Sex and Age in Garrison
Sex and Age in Garrison
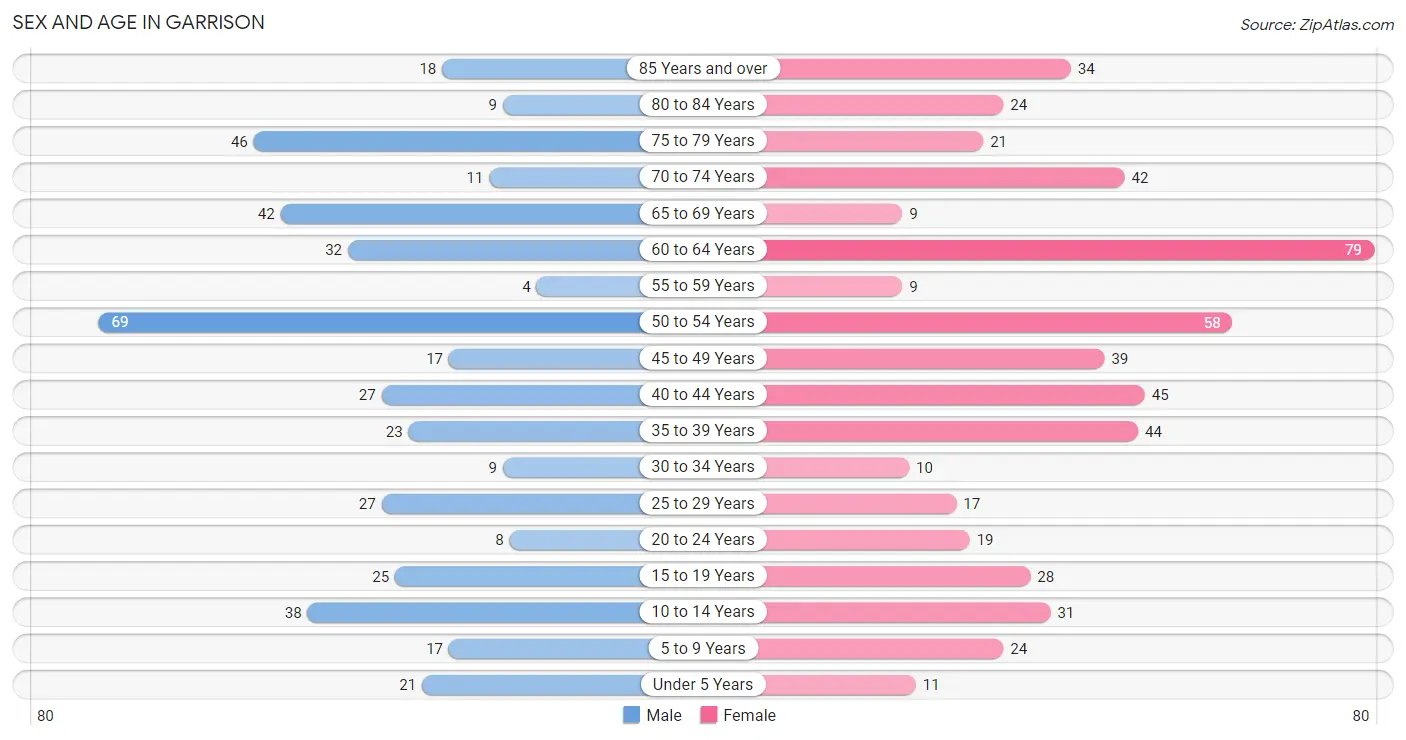
The most populous age groups in Garrison are 50 to 54 Years (69 | 15.6%) for men and 60 to 64 Years (79 | 14.5%) for women.
| Age Bracket | Male | Female |
| Under 5 Years | 21 (4.7%) | 11 (2.0%) |
| 5 to 9 Years | 17 (3.8%) | 24 (4.4%) |
| 10 to 14 Years | 38 (8.6%) | 31 (5.7%) |
| 15 to 19 Years | 25 (5.6%) | 28 (5.1%) |
| 20 to 24 Years | 8 (1.8%) | 19 (3.5%) |
| 25 to 29 Years | 27 (6.1%) | 17 (3.1%) |
| 30 to 34 Years | 9 (2.0%) | 10 (1.8%) |
| 35 to 39 Years | 23 (5.2%) | 44 (8.1%) |
| 40 to 44 Years | 27 (6.1%) | 45 (8.3%) |
| 45 to 49 Years | 17 (3.8%) | 39 (7.2%) |
| 50 to 54 Years | 69 (15.6%) | 58 (10.7%) |
| 55 to 59 Years | 4 (0.9%) | 9 (1.7%) |
| 60 to 64 Years | 32 (7.2%) | 79 (14.5%) |
| 65 to 69 Years | 42 (9.5%) | 9 (1.7%) |
| 70 to 74 Years | 11 (2.5%) | 42 (7.7%) |
| 75 to 79 Years | 46 (10.4%) | 21 (3.9%) |
| 80 to 84 Years | 9 (2.0%) | 24 (4.4%) |
| 85 Years and over | 18 (4.1%) | 34 (6.2%) |
| Total | 443 (100.0%) | 544 (100.0%) |
Families and Households in Garrison
Median Family Size in Garrison
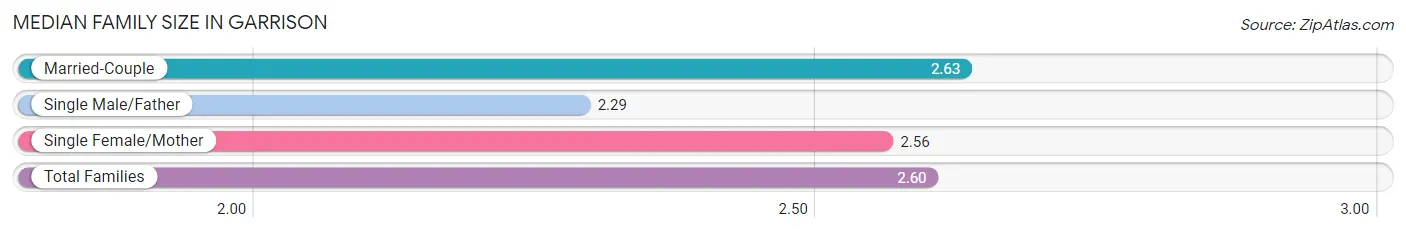
The median family size in Garrison is 2.60 persons per family, with married-couple families (203 | 80.2%) accounting for the largest median family size of 2.63 persons per family. On the other hand, single male/father families (7 | 2.8%) represent the smallest median family size with 2.29 persons per family.
| Family Type | # Families | Family Size |
| Married-Couple | 203 (80.2%) | 2.63 |
| Single Male/Father | 7 (2.8%) | 2.29 |
| Single Female/Mother | 43 (17.0%) | 2.56 |
| Total Families | 253 (100.0%) | 2.60 |
Median Household Size in Garrison
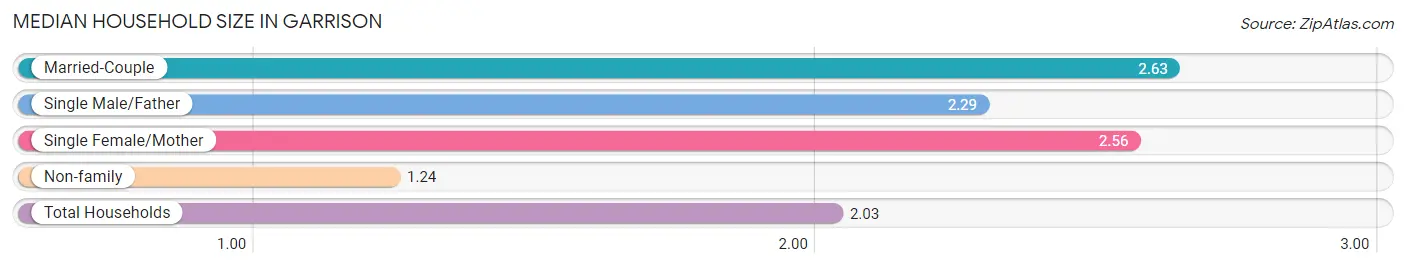
The median household size in Garrison is 2.03 persons per household, with married-couple households (203 | 46.4%) accounting for the largest median household size of 2.63 persons per household. non-family households (185 | 42.2%) represent the smallest median household size with 1.24 persons per household.
| Household Type | # Households | Household Size |
| Married-Couple | 203 (46.4%) | 2.63 |
| Single Male/Father | 7 (1.6%) | 2.29 |
| Single Female/Mother | 43 (9.8%) | 2.56 |
| Non-family | 185 (42.2%) | 1.24 |
| Total Households | 438 (100.0%) | 2.03 |
Household Size by Marriage Status in Garrison
Out of a total of 438 households in Garrison, 253 (57.8%) are family households, while 185 (42.2%) are nonfamily households. The most numerous type of family households are 2-person households, comprising 168, and the most common type of nonfamily households are 1-person households, comprising 124.
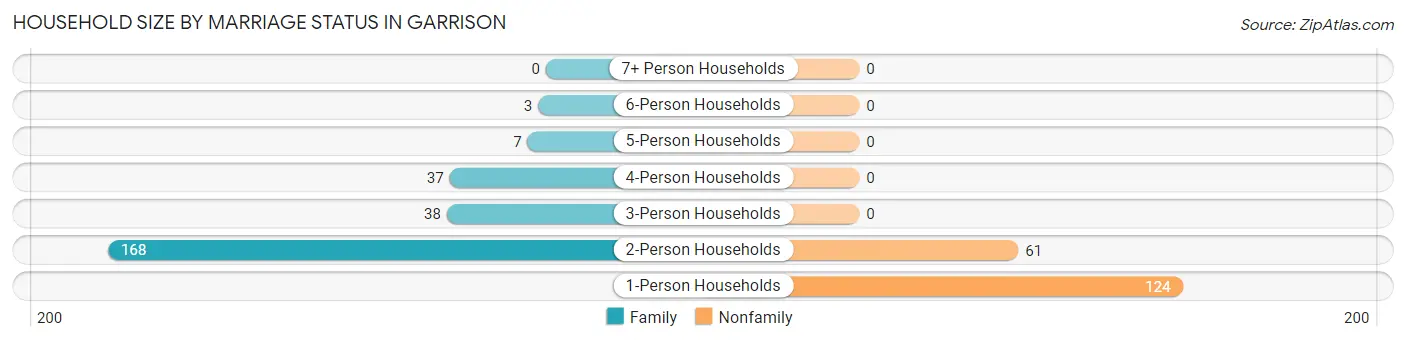
| Household Size | Family Households | Nonfamily Households |
| 1-Person Households | - | 124 (28.3%) |
| 2-Person Households | 168 (38.4%) | 61 (13.9%) |
| 3-Person Households | 38 (8.7%) | 0 (0.0%) |
| 4-Person Households | 37 (8.5%) | 0 (0.0%) |
| 5-Person Households | 7 (1.6%) | 0 (0.0%) |
| 6-Person Households | 3 (0.7%) | 0 (0.0%) |
| 7+ Person Households | 0 (0.0%) | 0 (0.0%) |
| Total | 253 (57.8%) | 185 (42.2%) |
Female Fertility in Garrison
Fertility by Age in Garrison
Average fertility rate in Garrison is 76.0 births per 1,000 women. Women in the age bracket of 20 to 34 years have the highest fertility rate with 217.0 births per 1,000 women. Women in the age bracket of 20 to 34 years acount for 62.5% of all women with births.
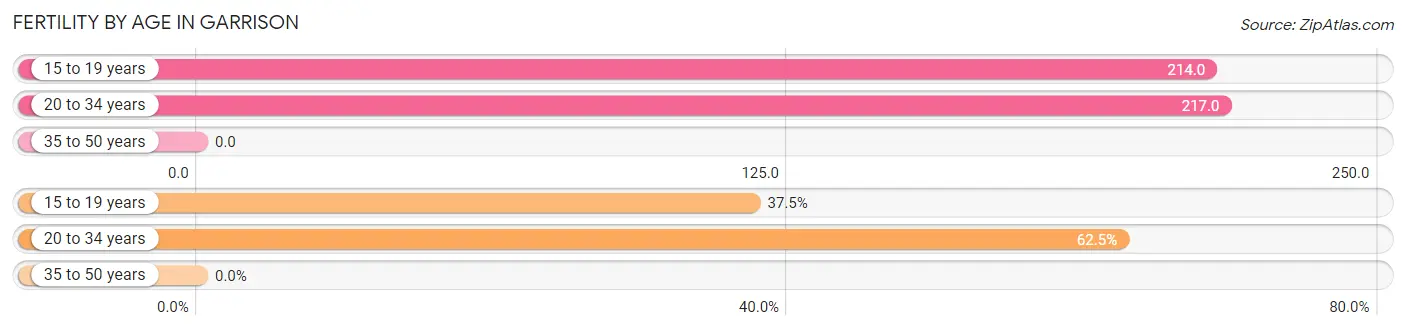
| Age Bracket | Women with Births | Births / 1,000 Women |
| 15 to 19 years | 6 (37.5%) | 214.0 |
| 20 to 34 years | 10 (62.5%) | 217.0 |
| 35 to 50 years | 0 (0.0%) | 0.0 |
| Total | 16 (100.0%) | 76.0 |
Fertility by Age by Marriage Status in Garrison
62.5% of women with births (16) in Garrison are married. The highest percentage of unmarried women with births falls into 15 to 19 years age bracket with 100.0% of them unmarried at the time of birth, while the lowest percentage of unmarried women with births belong to 20 to 34 years age bracket with 0.0% of them unmarried.
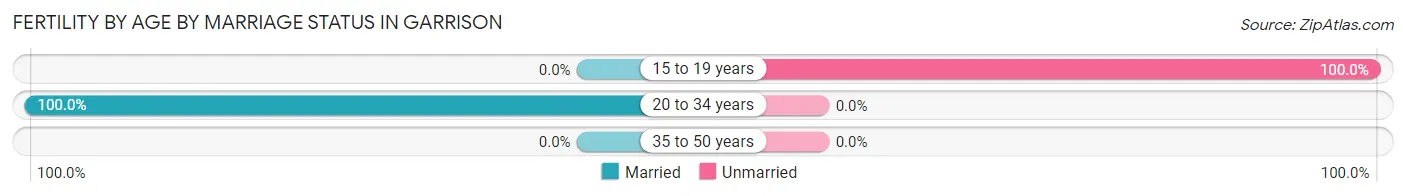
| Age Bracket | Married | Unmarried |
| 15 to 19 years | 0 (0.0%) | 6 (100.0%) |
| 20 to 34 years | 10 (100.0%) | 0 (0.0%) |
| 35 to 50 years | 0 (0.0%) | 0 (0.0%) |
| Total | 10 (62.5%) | 6 (37.5%) |
Fertility by Education in Garrison
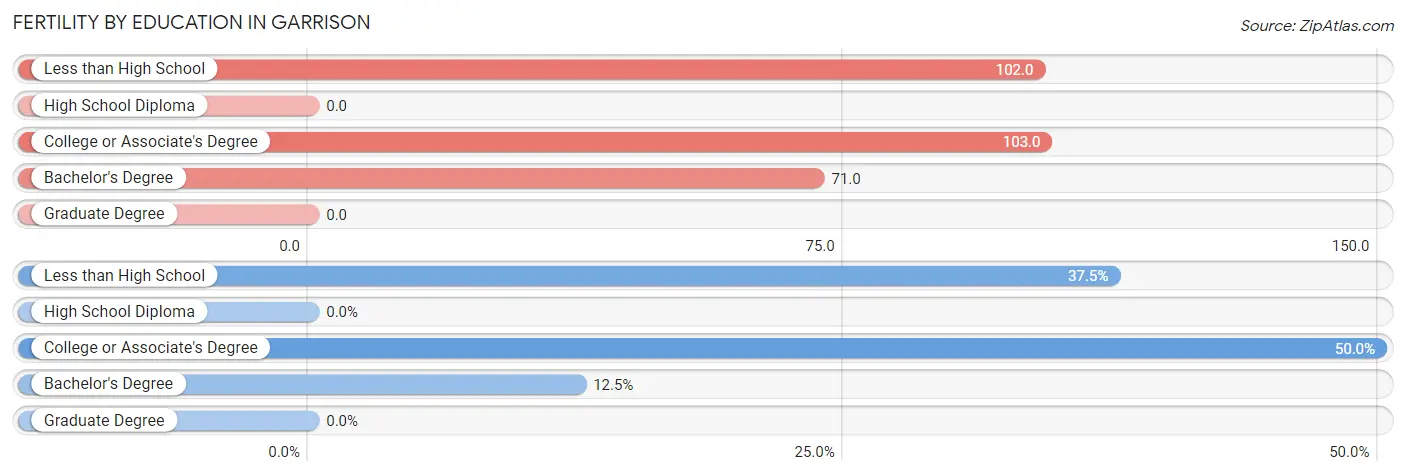
| Educational Attainment | Women with Births | Births / 1,000 Women |
| Less than High School | 6 (37.5%) | 102.0 |
| High School Diploma | 0 (0.0%) | 0.0 |
| College or Associate's Degree | 8 (50.0%) | 103.0 |
| Bachelor's Degree | 2 (12.5%) | 71.0 |
| Graduate Degree | 0 (0.0%) | 0.0 |
| Total | 16 (100.0%) | 76.0 |
Fertility by Education by Marriage Status in Garrison
37.5% of women with births in Garrison are unmarried. Women with the educational attainment of college or associate's degree are most likely to be married with 100.0% of them married at childbirth, while women with the educational attainment of less than high school are least likely to be married with 100.0% of them unmarried at childbirth.
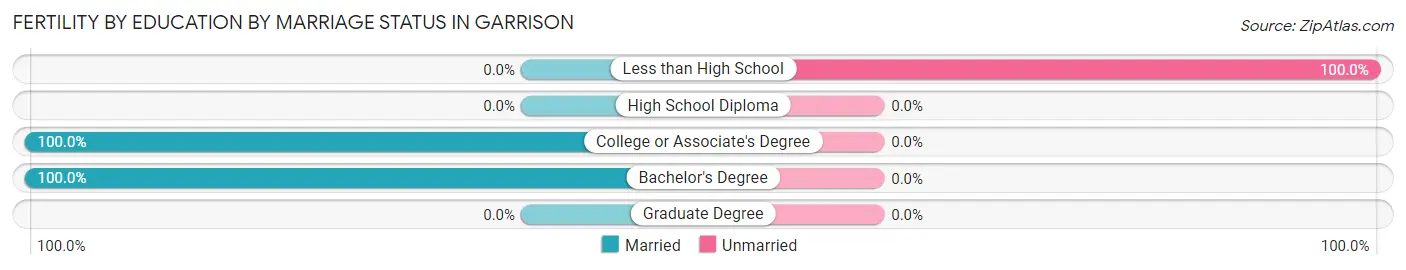
| Educational Attainment | Married | Unmarried |
| Less than High School | 0 (0.0%) | 6 (100.0%) |
| High School Diploma | 0 (0.0%) | 0 (0.0%) |
| College or Associate's Degree | 8 (100.0%) | 0 (0.0%) |
| Bachelor's Degree | 2 (100.0%) | 0 (0.0%) |
| Graduate Degree | 0 (0.0%) | 0 (0.0%) |
| Total | 10 (62.5%) | 6 (37.5%) |
Employment Characteristics in Garrison
Employment by Class of Employer in Garrison
Among the 379 employed individuals in Garrison, private company employees (264 | 69.7%), local government employees (37 | 9.8%), and state government employees (30 | 7.9%) make up the most common classes of employment.
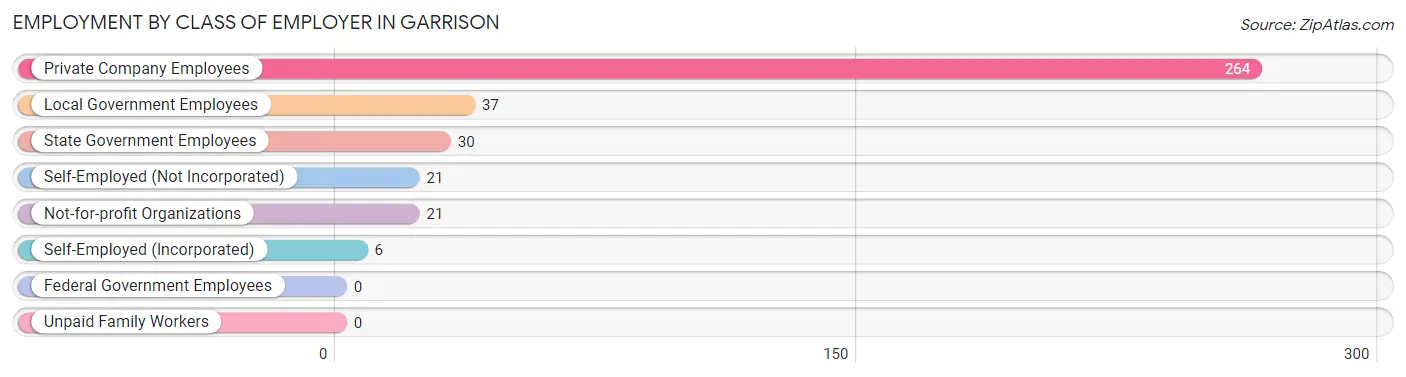
| Employer Class | # Employees | % Employees |
| Private Company Employees | 264 | 69.7% |
| Self-Employed (Incorporated) | 6 | 1.6% |
| Self-Employed (Not Incorporated) | 21 | 5.5% |
| Not-for-profit Organizations | 21 | 5.5% |
| Local Government Employees | 37 | 9.8% |
| State Government Employees | 30 | 7.9% |
| Federal Government Employees | 0 | 0.0% |
| Unpaid Family Workers | 0 | 0.0% |
| Total | 379 | 100.0% |
Employment Status by Age in Garrison
According to the labor force statistics for Garrison, out of the total population over 16 years of age (832), 51.9% or 432 individuals are in the labor force, with 12.3% or 53 of them unemployed. The age group with the highest labor force participation rate is 55 to 59 years, with 100.0% or 13 individuals in the labor force. Within the labor force, the 65 to 74 years age range has the highest percentage of unemployed individuals, with 66.7% or 10 of them being unemployed.
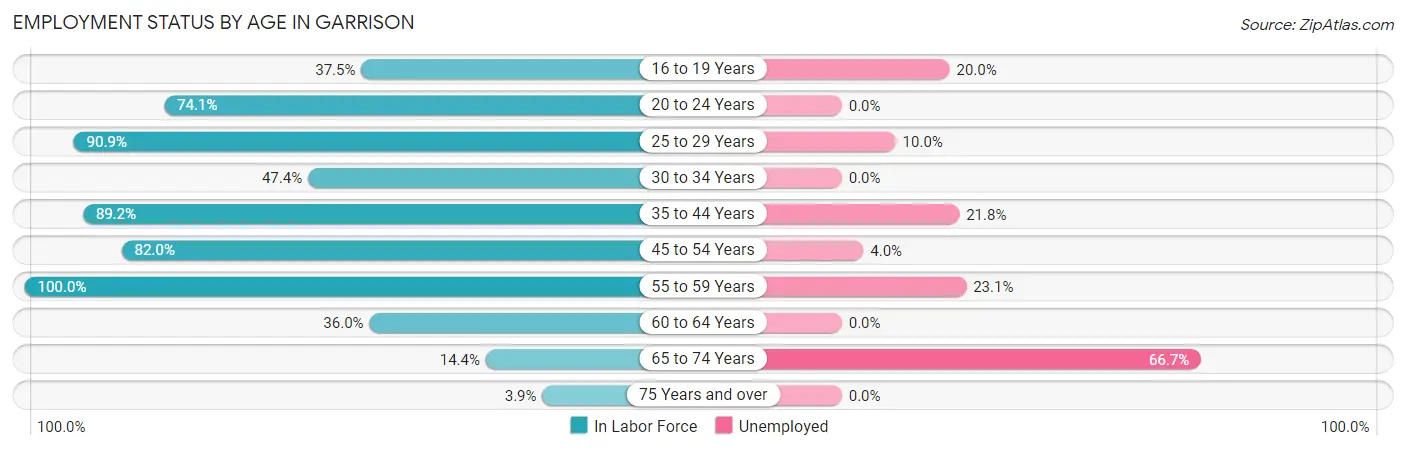
| Age Bracket | In Labor Force | Unemployed |
| 16 to 19 Years | 15 (37.5%) | 3 (20.0%) |
| 20 to 24 Years | 20 (74.1%) | 0 (0.0%) |
| 25 to 29 Years | 40 (90.9%) | 4 (10.0%) |
| 30 to 34 Years | 9 (47.4%) | 0 (0.0%) |
| 35 to 44 Years | 124 (89.2%) | 27 (21.8%) |
| 45 to 54 Years | 150 (82.0%) | 6 (4.0%) |
| 55 to 59 Years | 13 (100.0%) | 3 (23.1%) |
| 60 to 64 Years | 40 (36.0%) | 0 (0.0%) |
| 65 to 74 Years | 15 (14.4%) | 10 (66.7%) |
| 75 Years and over | 6 (3.9%) | 0 (0.0%) |
| Total | 432 (51.9%) | 53 (12.3%) |
Employment Status by Educational Attainment in Garrison
According to labor force statistics for Garrison, 73.9% of individuals (376) out of the total population between 25 and 64 years of age (509) are in the labor force, with 10.6% or 40 of them being unemployed. The group with the highest labor force participation rate are those with the educational attainment of bachelor's degree or higher, with 96.3% or 103 individuals in the labor force. Within the labor force, individuals with less than high school education have the highest percentage of unemployment, with 47.6% or 20 of them being unemployed.
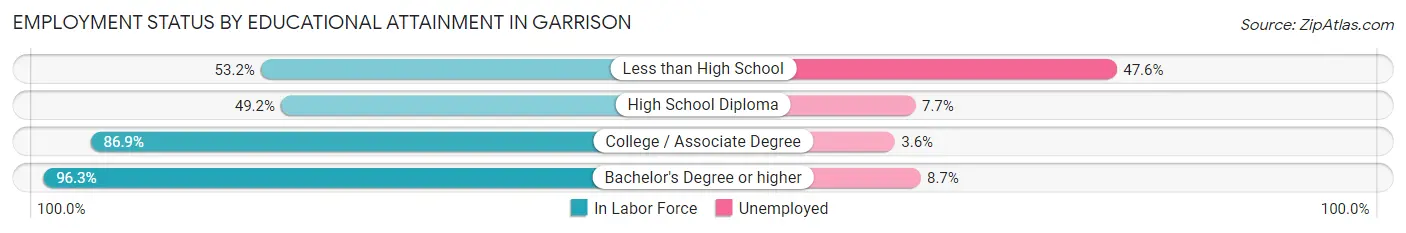
| Educational Attainment | In Labor Force | Unemployed |
| Less than High School | 42 (53.2%) | 38 (47.6%) |
| High School Diploma | 65 (49.2%) | 10 (7.7%) |
| College / Associate Degree | 166 (86.9%) | 7 (3.6%) |
| Bachelor's Degree or higher | 103 (96.3%) | 9 (8.7%) |
| Total | 376 (73.9%) | 54 (10.6%) |
Employment Occupations by Sex in Garrison
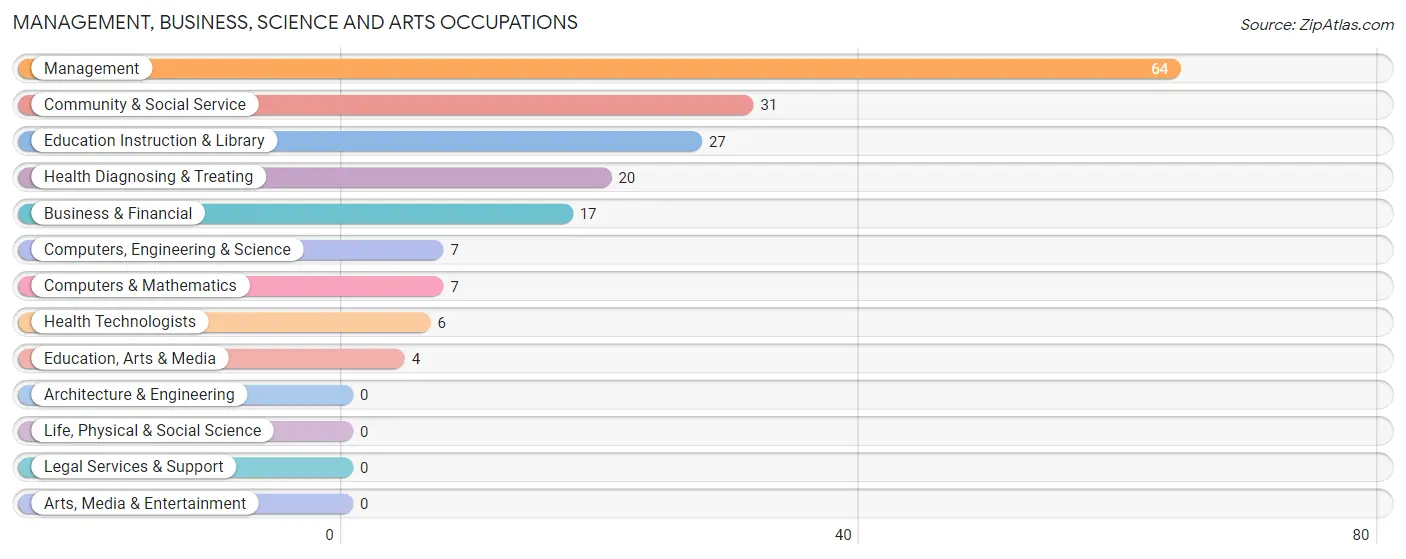
Management, Business, Science and Arts Occupations
The most common Management, Business, Science and Arts occupations in Garrison are Management (64 | 16.9%), Community & Social Service (31 | 8.2%), Education Instruction & Library (27 | 7.1%), Health Diagnosing & Treating (20 | 5.3%), and Business & Financial (17 | 4.5%).
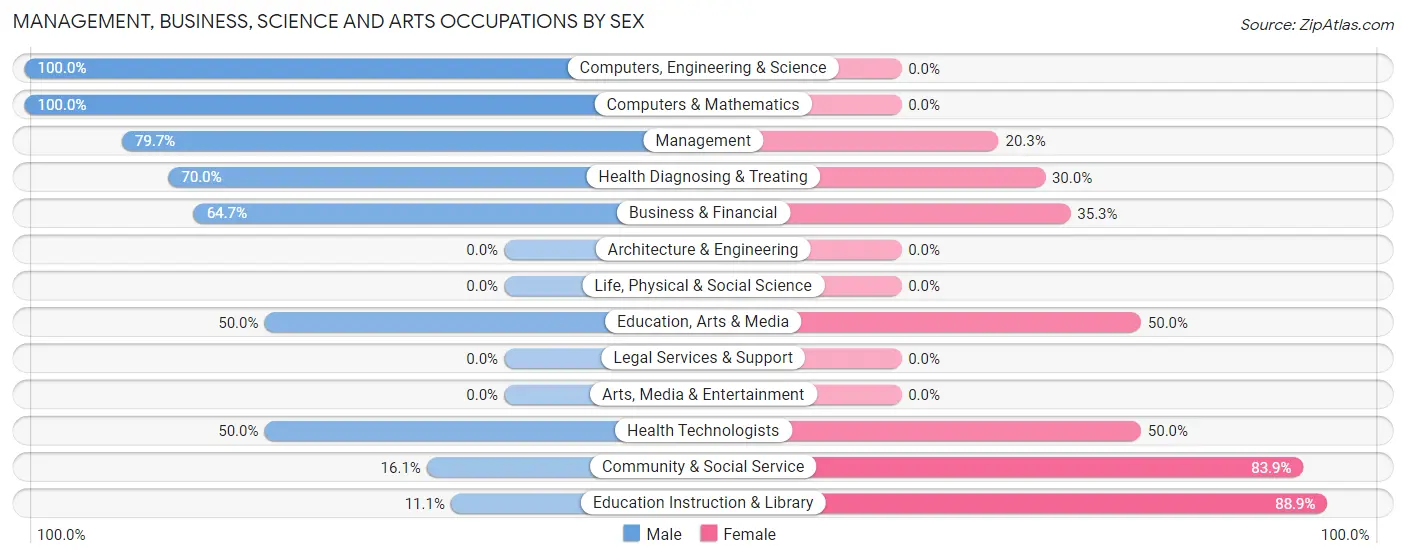
Management, Business, Science and Arts Occupations by Sex
Within the Management, Business, Science and Arts occupations in Garrison, the most male-oriented occupations are Computers, Engineering & Science (100.0%), Computers & Mathematics (100.0%), and Management (79.7%), while the most female-oriented occupations are Education Instruction & Library (88.9%), Community & Social Service (83.9%), and Education, Arts & Media (50.0%).
| Occupation | Male | Female |
| Management | 51 (79.7%) | 13 (20.3%) |
| Business & Financial | 11 (64.7%) | 6 (35.3%) |
| Computers, Engineering & Science | 7 (100.0%) | 0 (0.0%) |
| Computers & Mathematics | 7 (100.0%) | 0 (0.0%) |
| Architecture & Engineering | 0 (0.0%) | 0 (0.0%) |
| Life, Physical & Social Science | 0 (0.0%) | 0 (0.0%) |
| Community & Social Service | 5 (16.1%) | 26 (83.9%) |
| Education, Arts & Media | 2 (50.0%) | 2 (50.0%) |
| Legal Services & Support | 0 (0.0%) | 0 (0.0%) |
| Education Instruction & Library | 3 (11.1%) | 24 (88.9%) |
| Arts, Media & Entertainment | 0 (0.0%) | 0 (0.0%) |
| Health Diagnosing & Treating | 14 (70.0%) | 6 (30.0%) |
| Health Technologists | 3 (50.0%) | 3 (50.0%) |
| Total (Category) | 88 (63.3%) | 51 (36.7%) |
| Total (Overall) | 182 (48.0%) | 197 (52.0%) |
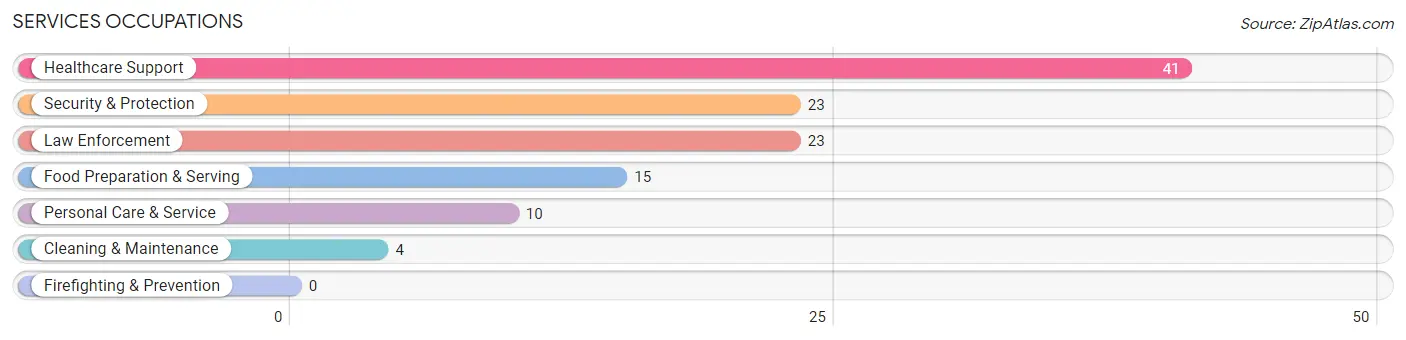
Services Occupations
The most common Services occupations in Garrison are Healthcare Support (41 | 10.8%), Security & Protection (23 | 6.1%), Law Enforcement (23 | 6.1%), Food Preparation & Serving (15 | 4.0%), and Personal Care & Service (10 | 2.6%).
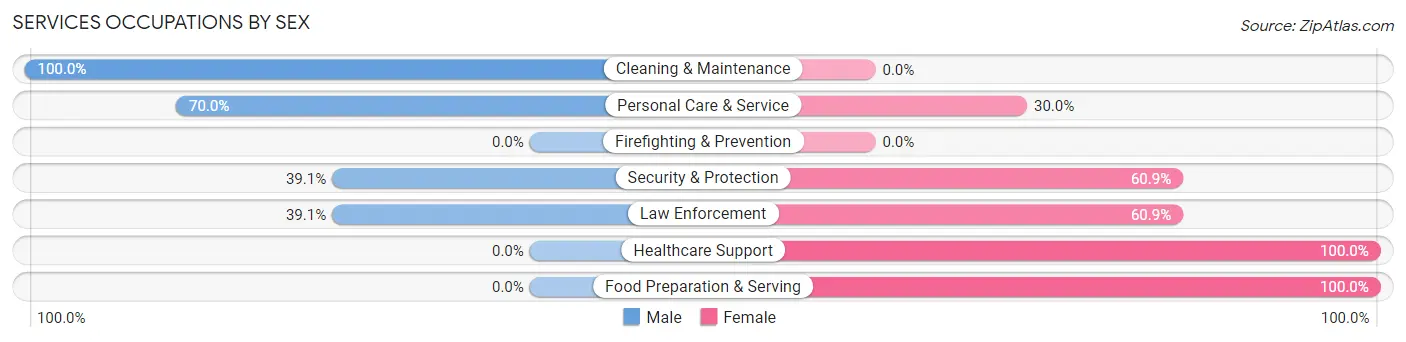
Services Occupations by Sex
Within the Services occupations in Garrison, the most male-oriented occupations are Cleaning & Maintenance (100.0%), Personal Care & Service (70.0%), and Security & Protection (39.1%), while the most female-oriented occupations are Healthcare Support (100.0%), Food Preparation & Serving (100.0%), and Security & Protection (60.9%).
| Occupation | Male | Female |
| Healthcare Support | 0 (0.0%) | 41 (100.0%) |
| Security & Protection | 9 (39.1%) | 14 (60.9%) |
| Firefighting & Prevention | 0 (0.0%) | 0 (0.0%) |
| Law Enforcement | 9 (39.1%) | 14 (60.9%) |
| Food Preparation & Serving | 0 (0.0%) | 15 (100.0%) |
| Cleaning & Maintenance | 4 (100.0%) | 0 (0.0%) |
| Personal Care & Service | 7 (70.0%) | 3 (30.0%) |
| Total (Category) | 20 (21.5%) | 73 (78.5%) |
| Total (Overall) | 182 (48.0%) | 197 (52.0%) |
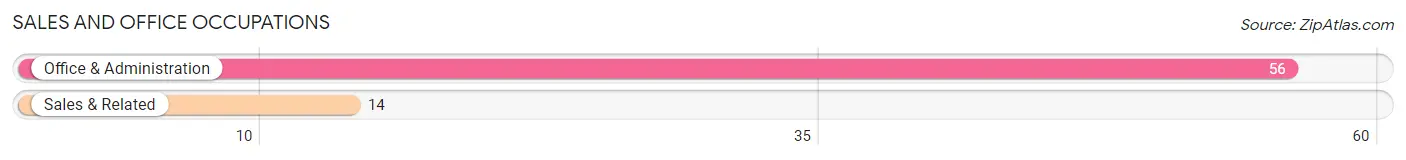
Sales and Office Occupations
The most common Sales and Office occupations in Garrison are Office & Administration (56 | 14.8%), and Sales & Related (14 | 3.7%).
Sales and Office Occupations by Sex
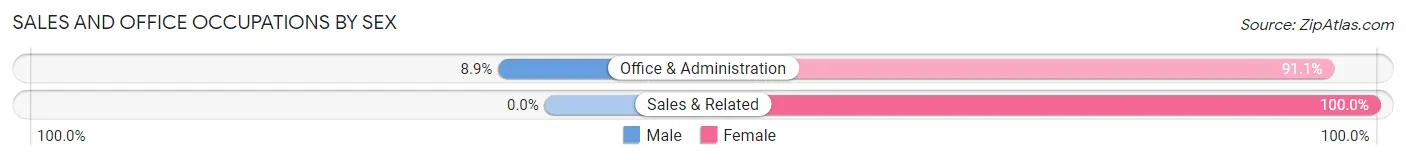
| Occupation | Male | Female |
| Sales & Related | 0 (0.0%) | 14 (100.0%) |
| Office & Administration | 5 (8.9%) | 51 (91.1%) |
| Total (Category) | 5 (7.1%) | 65 (92.9%) |
| Total (Overall) | 182 (48.0%) | 197 (52.0%) |
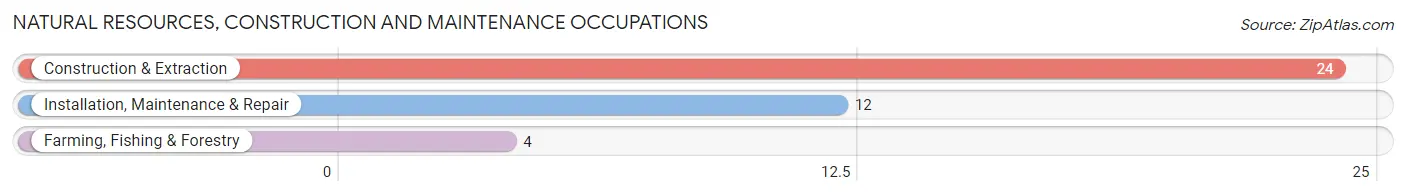
Natural Resources, Construction and Maintenance Occupations
The most common Natural Resources, Construction and Maintenance occupations in Garrison are Construction & Extraction (24 | 6.3%), Installation, Maintenance & Repair (12 | 3.2%), and Farming, Fishing & Forestry (4 | 1.1%).
Natural Resources, Construction and Maintenance Occupations by Sex
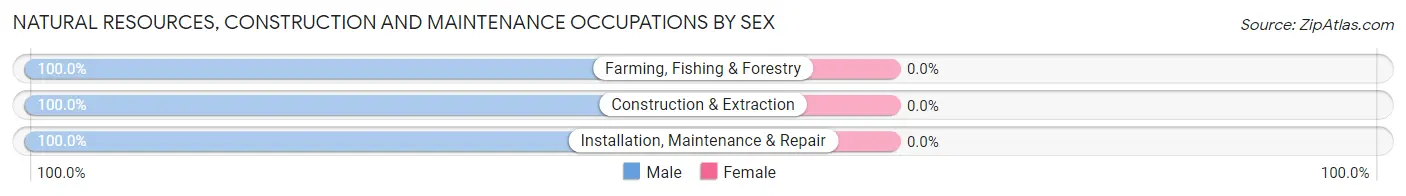
| Occupation | Male | Female |
| Farming, Fishing & Forestry | 4 (100.0%) | 0 (0.0%) |
| Construction & Extraction | 24 (100.0%) | 0 (0.0%) |
| Installation, Maintenance & Repair | 12 (100.0%) | 0 (0.0%) |
| Total (Category) | 40 (100.0%) | 0 (0.0%) |
| Total (Overall) | 182 (48.0%) | 197 (52.0%) |
Production, Transportation and Moving Occupations
The most common Production, Transportation and Moving occupations in Garrison are Transportation (20 | 5.3%), Material Moving (15 | 4.0%), and Production (2 | 0.5%).
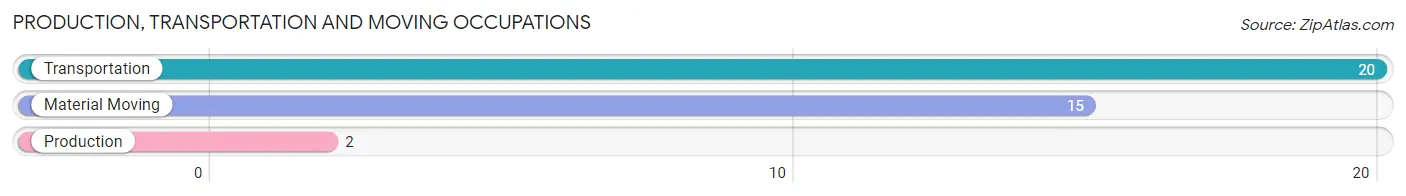
Production, Transportation and Moving Occupations by Sex
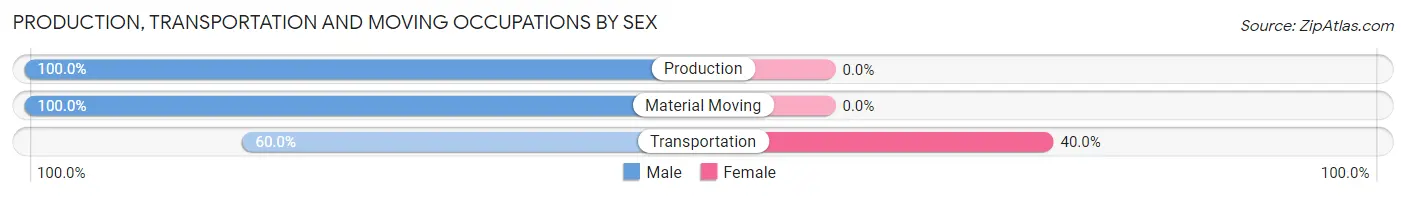
| Occupation | Male | Female |
| Production | 2 (100.0%) | 0 (0.0%) |
| Transportation | 12 (60.0%) | 8 (40.0%) |
| Material Moving | 15 (100.0%) | 0 (0.0%) |
| Total (Category) | 29 (78.4%) | 8 (21.6%) |
| Total (Overall) | 182 (48.0%) | 197 (52.0%) |
Employment Industries by Sex in Garrison
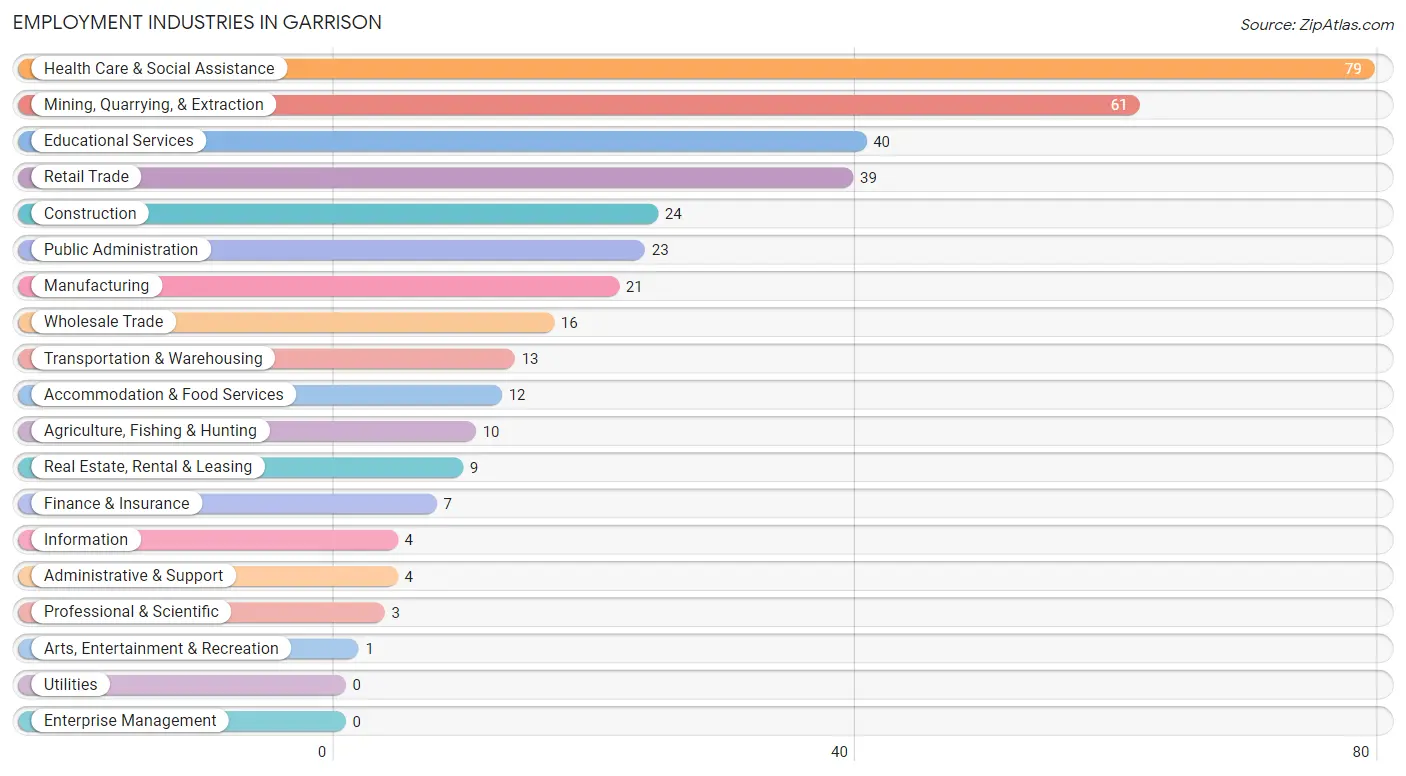
Employment Industries in Garrison
The major employment industries in Garrison include Health Care & Social Assistance (79 | 20.8%), Mining, Quarrying, & Extraction (61 | 16.1%), Educational Services (40 | 10.5%), Retail Trade (39 | 10.3%), and Construction (24 | 6.3%).
Employment Industries by Sex in Garrison
The Garrison industries that see more men than women are Agriculture, Fishing & Hunting (100.0%), Construction (100.0%), and Information (100.0%), whereas the industries that tend to have a higher number of women are Wholesale Trade (100.0%), Professional & Scientific (100.0%), and Accommodation & Food Services (100.0%).
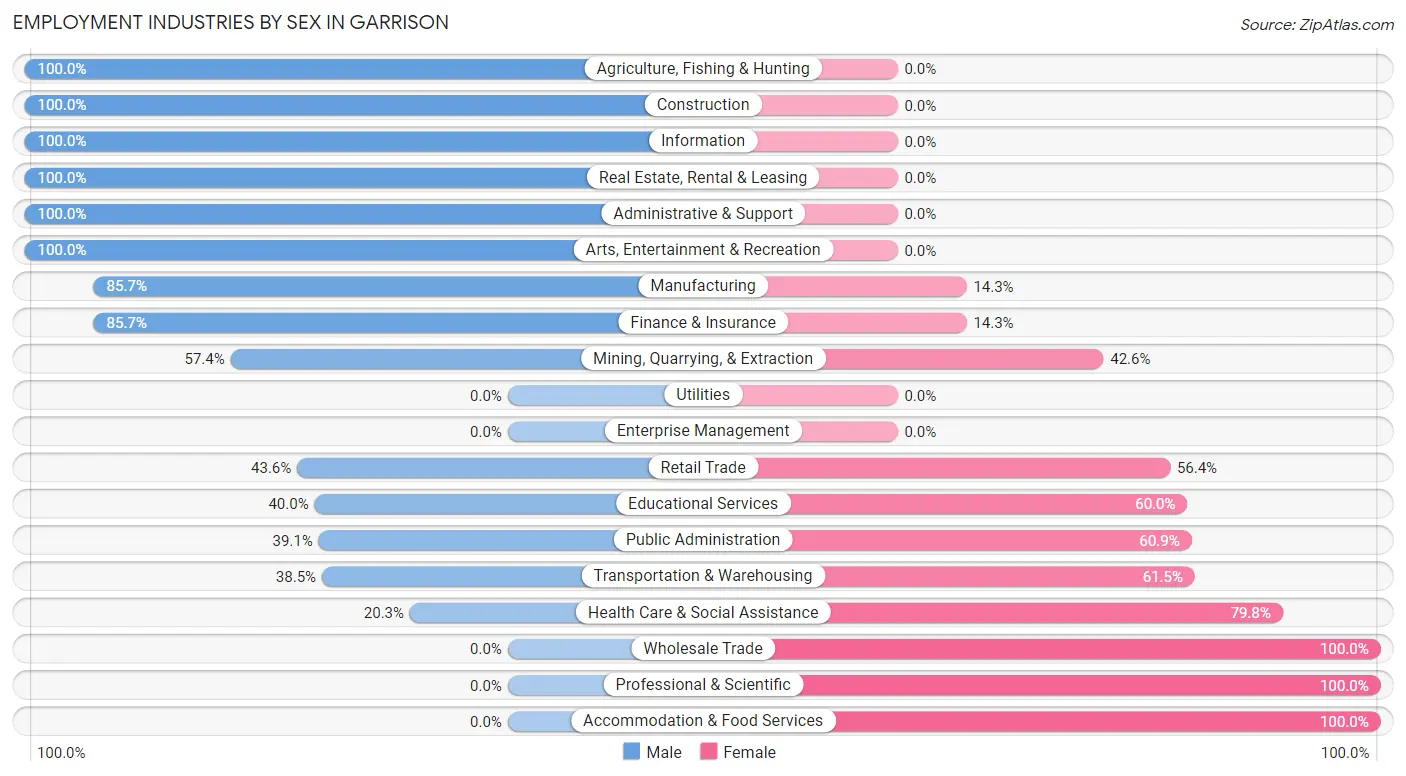
| Industry | Male | Female |
| Agriculture, Fishing & Hunting | 10 (100.0%) | 0 (0.0%) |
| Mining, Quarrying, & Extraction | 35 (57.4%) | 26 (42.6%) |
| Construction | 24 (100.0%) | 0 (0.0%) |
| Manufacturing | 18 (85.7%) | 3 (14.3%) |
| Wholesale Trade | 0 (0.0%) | 16 (100.0%) |
| Retail Trade | 17 (43.6%) | 22 (56.4%) |
| Transportation & Warehousing | 5 (38.5%) | 8 (61.5%) |
| Utilities | 0 (0.0%) | 0 (0.0%) |
| Information | 4 (100.0%) | 0 (0.0%) |
| Finance & Insurance | 6 (85.7%) | 1 (14.3%) |
| Real Estate, Rental & Leasing | 9 (100.0%) | 0 (0.0%) |
| Professional & Scientific | 0 (0.0%) | 3 (100.0%) |
| Enterprise Management | 0 (0.0%) | 0 (0.0%) |
| Administrative & Support | 4 (100.0%) | 0 (0.0%) |
| Educational Services | 16 (40.0%) | 24 (60.0%) |
| Health Care & Social Assistance | 16 (20.3%) | 63 (79.7%) |
| Arts, Entertainment & Recreation | 1 (100.0%) | 0 (0.0%) |
| Accommodation & Food Services | 0 (0.0%) | 12 (100.0%) |
| Public Administration | 9 (39.1%) | 14 (60.9%) |
| Total | 182 (48.0%) | 197 (52.0%) |
Education in Garrison
School Enrollment in Garrison
The most common levels of schooling among the 171 students in Garrison are high school (59 | 34.5%), middle school (45 | 26.3%), and elementary school (44 | 25.7%).
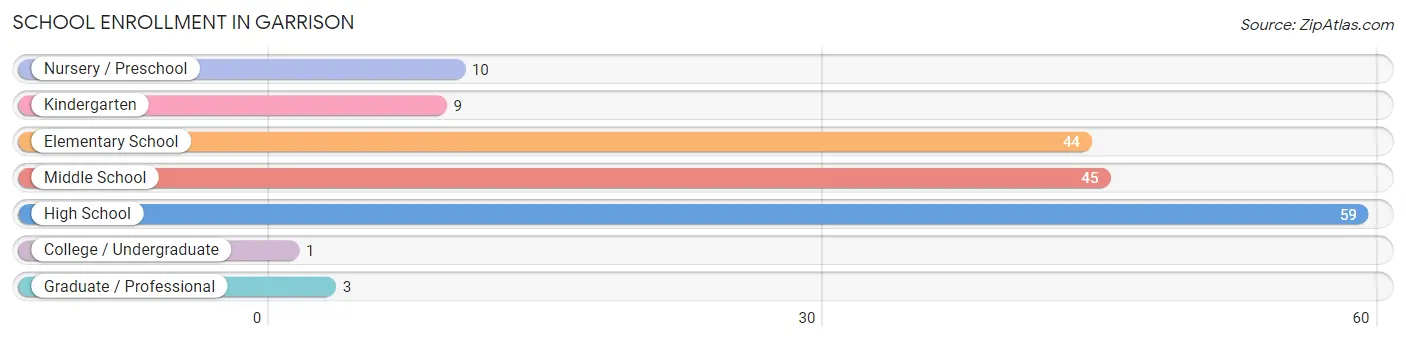
| School Level | # Students | % Students |
| Nursery / Preschool | 10 | 5.9% |
| Kindergarten | 9 | 5.3% |
| Elementary School | 44 | 25.7% |
| Middle School | 45 | 26.3% |
| High School | 59 | 34.5% |
| College / Undergraduate | 1 | 0.6% |
| Graduate / Professional | 3 | 1.8% |
| Total | 171 | 100.0% |
School Enrollment by Age by Funding Source in Garrison
Out of a total of 171 students who are enrolled in schools in Garrison, 21 (12.3%) attend a private institution, while the remaining 150 (87.7%) are enrolled in public schools. The age group of 10 to 14 year olds has the highest likelihood of being enrolled in private schools, with 15 (21.7% in the age bracket) enrolled. Conversely, the age group of 3 to 4 year olds has the lowest likelihood of being enrolled in a private school, with 7 (100.0% in the age bracket) attending a public institution.
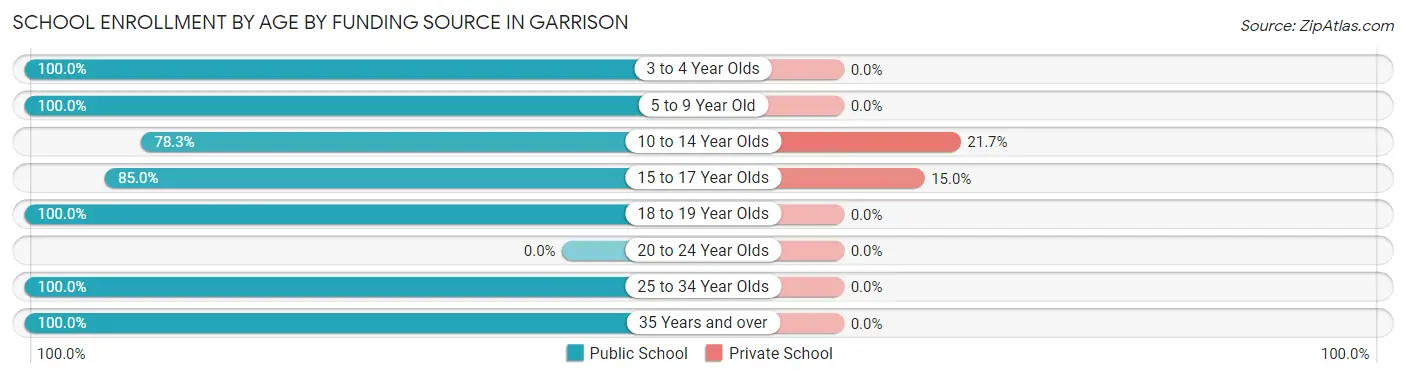
| Age Bracket | Public School | Private School |
| 3 to 4 Year Olds | 7 (100.0%) | 0 (0.0%) |
| 5 to 9 Year Old | 41 (100.0%) | 0 (0.0%) |
| 10 to 14 Year Olds | 54 (78.3%) | 15 (21.7%) |
| 15 to 17 Year Olds | 34 (85.0%) | 6 (15.0%) |
| 18 to 19 Year Olds | 10 (100.0%) | 0 (0.0%) |
| 20 to 24 Year Olds | 0 (0.0%) | 0 (0.0%) |
| 25 to 34 Year Olds | 1 (100.0%) | 0 (0.0%) |
| 35 Years and over | 3 (100.0%) | 0 (0.0%) |
| Total | 150 (87.7%) | 21 (12.3%) |
Educational Attainment by Field of Study in Garrison
Education (37 | 29.1%), business (27 | 21.3%), bio, nature & agricultural (15 | 11.8%), arts & humanities (10 | 7.9%), and social sciences (7 | 5.5%) are the most common fields of study among 127 individuals in Garrison who have obtained a bachelor's degree or higher.
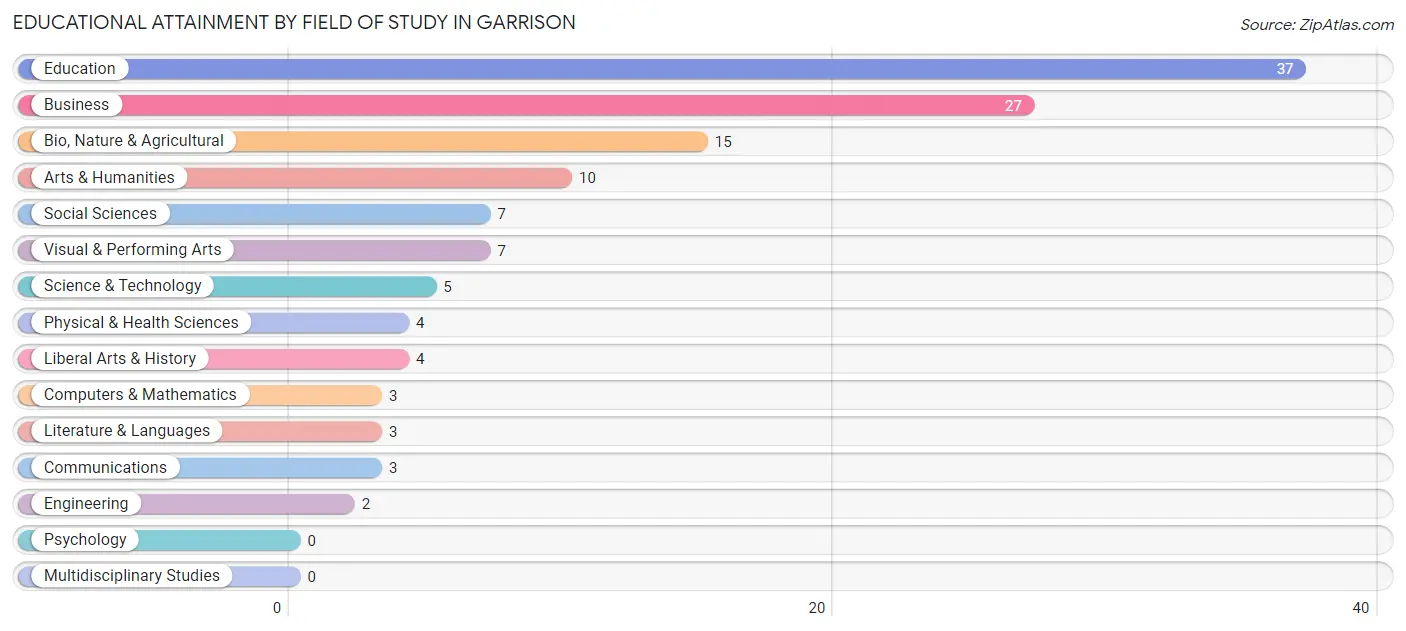
| Field of Study | # Graduates | % Graduates |
| Computers & Mathematics | 3 | 2.4% |
| Bio, Nature & Agricultural | 15 | 11.8% |
| Physical & Health Sciences | 4 | 3.2% |
| Psychology | 0 | 0.0% |
| Social Sciences | 7 | 5.5% |
| Engineering | 2 | 1.6% |
| Multidisciplinary Studies | 0 | 0.0% |
| Science & Technology | 5 | 3.9% |
| Business | 27 | 21.3% |
| Education | 37 | 29.1% |
| Literature & Languages | 3 | 2.4% |
| Liberal Arts & History | 4 | 3.2% |
| Visual & Performing Arts | 7 | 5.5% |
| Communications | 3 | 2.4% |
| Arts & Humanities | 10 | 7.9% |
| Total | 127 | 100.0% |
Transportation & Commute in Garrison
Vehicle Availability by Sex in Garrison
The most prevalent vehicle ownership categories in Garrison are males with 2 vehicles (70, accounting for 38.5%) and females with 2 vehicles (61, making up 35.5%).
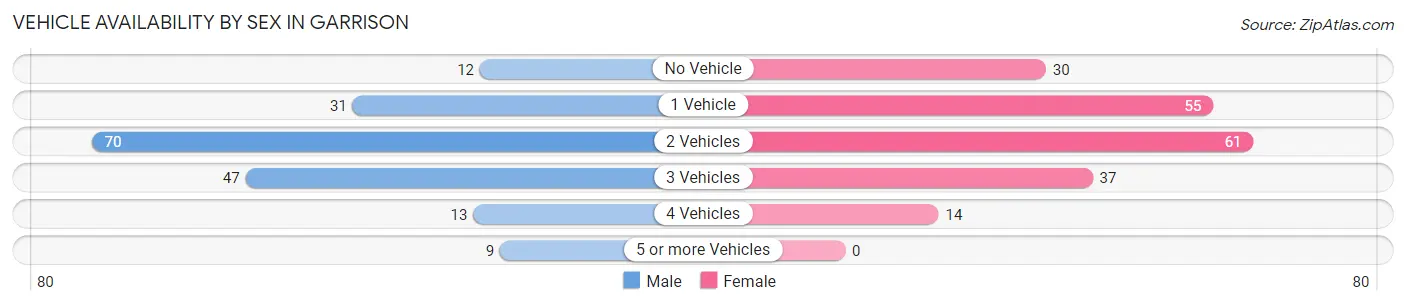
| Vehicles Available | Male | Female |
| No Vehicle | 12 (6.6%) | 30 (15.2%) |
| 1 Vehicle | 31 (17.0%) | 55 (27.9%) |
| 2 Vehicles | 70 (38.5%) | 61 (31.0%) |
| 3 Vehicles | 47 (25.8%) | 37 (18.8%) |
| 4 Vehicles | 13 (7.1%) | 14 (7.1%) |
| 5 or more Vehicles | 9 (5.0%) | 0 (0.0%) |
| Total | 182 (100.0%) | 197 (100.0%) |
Commute Time in Garrison
The most frequently occuring commute durations in Garrison are 5 to 9 minutes (98 commuters, 27.8%), 20 to 24 minutes (61 commuters, 17.3%), and less than 5 minutes (56 commuters, 15.9%).
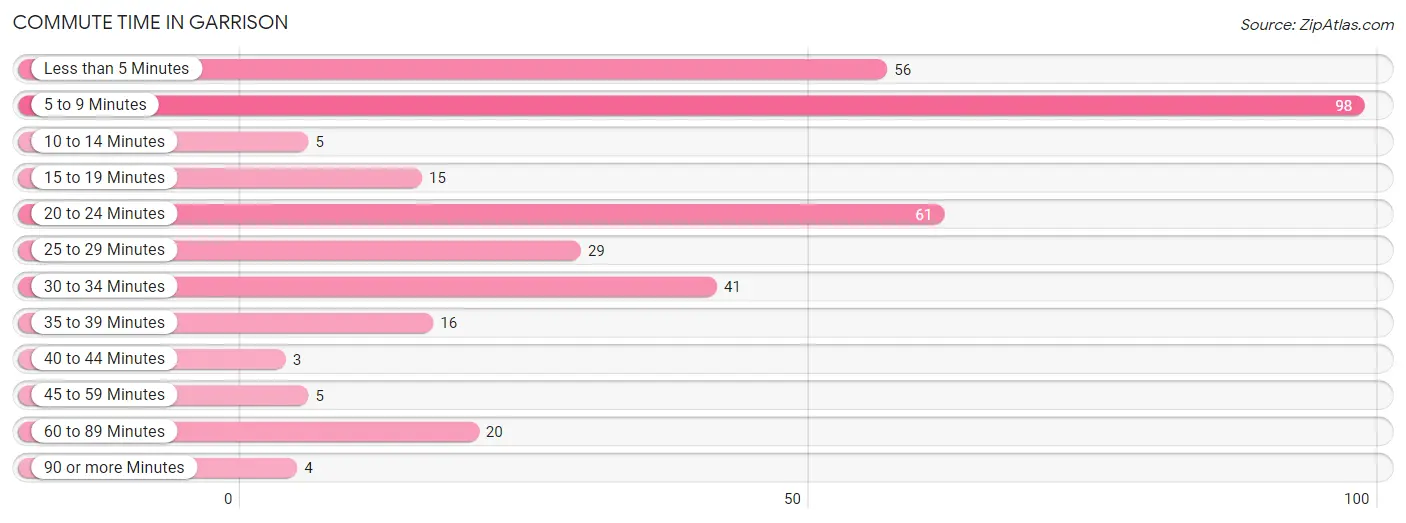
| Commute Time | # Commuters | % Commuters |
| Less than 5 Minutes | 56 | 15.9% |
| 5 to 9 Minutes | 98 | 27.8% |
| 10 to 14 Minutes | 5 | 1.4% |
| 15 to 19 Minutes | 15 | 4.3% |
| 20 to 24 Minutes | 61 | 17.3% |
| 25 to 29 Minutes | 29 | 8.2% |
| 30 to 34 Minutes | 41 | 11.6% |
| 35 to 39 Minutes | 16 | 4.5% |
| 40 to 44 Minutes | 3 | 0.9% |
| 45 to 59 Minutes | 5 | 1.4% |
| 60 to 89 Minutes | 20 | 5.7% |
| 90 or more Minutes | 4 | 1.1% |
Commute Time by Sex in Garrison
The most common commute times in Garrison are 20 to 24 minutes (38 commuters, 22.4%) for males and 5 to 9 minutes (67 commuters, 36.6%) for females.
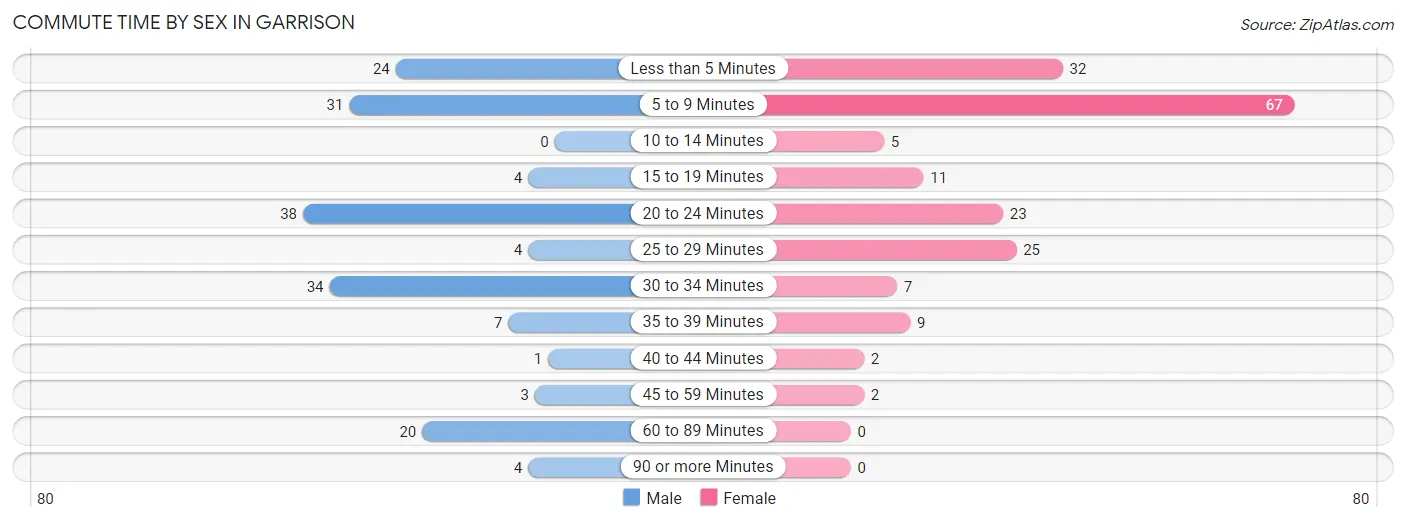
| Commute Time | Male | Female |
| Less than 5 Minutes | 24 (14.1%) | 32 (17.5%) |
| 5 to 9 Minutes | 31 (18.2%) | 67 (36.6%) |
| 10 to 14 Minutes | 0 (0.0%) | 5 (2.7%) |
| 15 to 19 Minutes | 4 (2.4%) | 11 (6.0%) |
| 20 to 24 Minutes | 38 (22.4%) | 23 (12.6%) |
| 25 to 29 Minutes | 4 (2.4%) | 25 (13.7%) |
| 30 to 34 Minutes | 34 (20.0%) | 7 (3.8%) |
| 35 to 39 Minutes | 7 (4.1%) | 9 (4.9%) |
| 40 to 44 Minutes | 1 (0.6%) | 2 (1.1%) |
| 45 to 59 Minutes | 3 (1.8%) | 2 (1.1%) |
| 60 to 89 Minutes | 20 (11.8%) | 0 (0.0%) |
| 90 or more Minutes | 4 (2.4%) | 0 (0.0%) |
Time of Departure to Work by Sex in Garrison
The most frequent times of departure to work in Garrison are 6:00 AM to 6:29 AM (52, 30.6%) for males and 7:00 AM to 7:29 AM (54, 29.5%) for females.
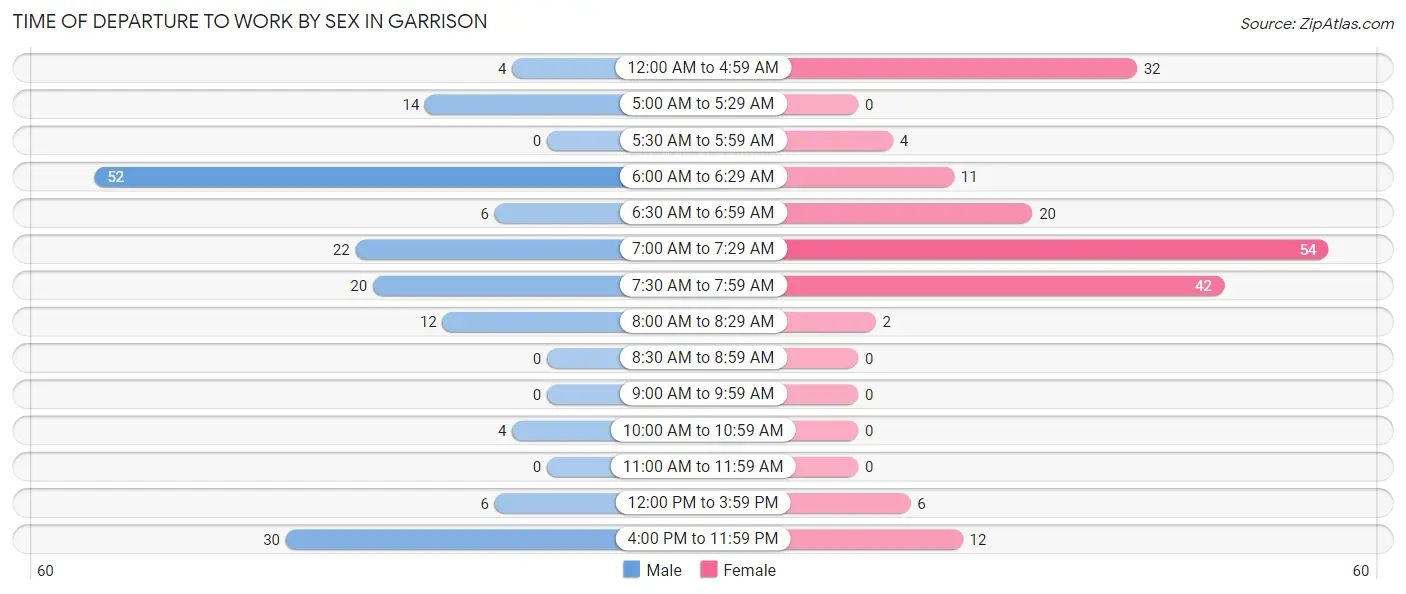
| Time of Departure | Male | Female |
| 12:00 AM to 4:59 AM | 4 (2.4%) | 32 (17.5%) |
| 5:00 AM to 5:29 AM | 14 (8.2%) | 0 (0.0%) |
| 5:30 AM to 5:59 AM | 0 (0.0%) | 4 (2.2%) |
| 6:00 AM to 6:29 AM | 52 (30.6%) | 11 (6.0%) |
| 6:30 AM to 6:59 AM | 6 (3.5%) | 20 (10.9%) |
| 7:00 AM to 7:29 AM | 22 (12.9%) | 54 (29.5%) |
| 7:30 AM to 7:59 AM | 20 (11.8%) | 42 (23.0%) |
| 8:00 AM to 8:29 AM | 12 (7.1%) | 2 (1.1%) |
| 8:30 AM to 8:59 AM | 0 (0.0%) | 0 (0.0%) |
| 9:00 AM to 9:59 AM | 0 (0.0%) | 0 (0.0%) |
| 10:00 AM to 10:59 AM | 4 (2.4%) | 0 (0.0%) |
| 11:00 AM to 11:59 AM | 0 (0.0%) | 0 (0.0%) |
| 12:00 PM to 3:59 PM | 6 (3.5%) | 6 (3.3%) |
| 4:00 PM to 11:59 PM | 30 (17.6%) | 12 (6.6%) |
| Total | 170 (100.0%) | 183 (100.0%) |
Housing Occupancy in Garrison
Occupancy by Ownership in Garrison
Of the total 438 dwellings in Garrison, owner-occupied units account for 261 (59.6%), while renter-occupied units make up 177 (40.4%).
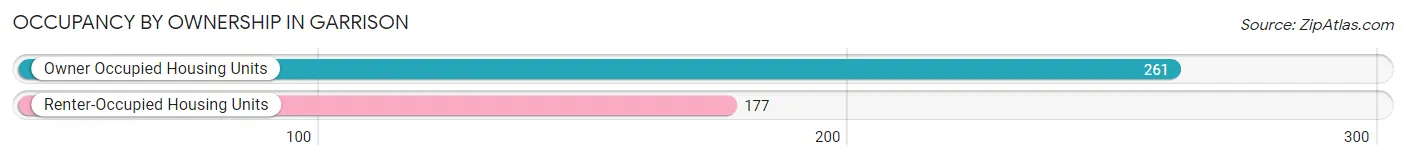
| Occupancy | # Housing Units | % Housing Units |
| Owner Occupied Housing Units | 261 | 59.6% |
| Renter-Occupied Housing Units | 177 | 40.4% |
| Total Occupied Housing Units | 438 | 100.0% |
Occupancy by Household Size in Garrison
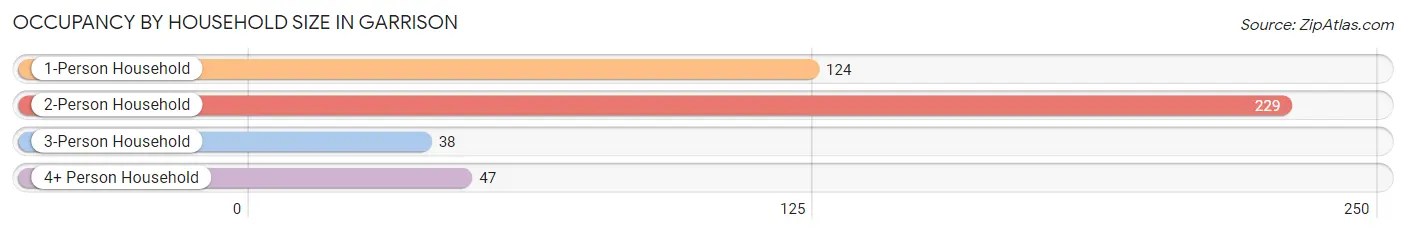
| Household Size | # Housing Units | % Housing Units |
| 1-Person Household | 124 | 28.3% |
| 2-Person Household | 229 | 52.3% |
| 3-Person Household | 38 | 8.7% |
| 4+ Person Household | 47 | 10.7% |
| Total Housing Units | 438 | 100.0% |
Occupancy by Ownership by Household Size in Garrison
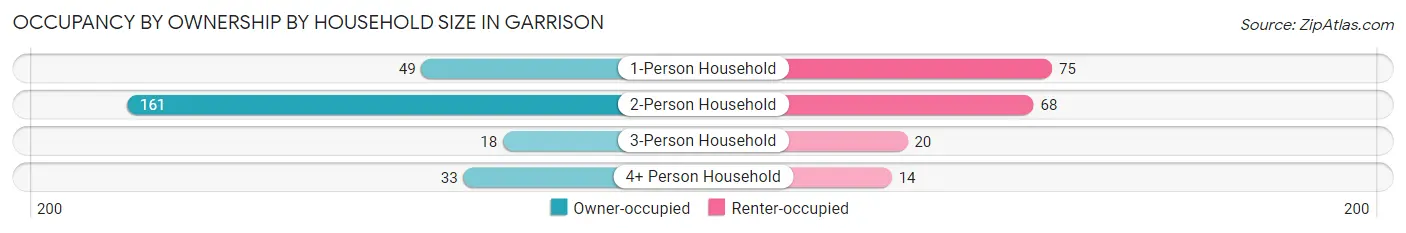
| Household Size | Owner-occupied | Renter-occupied |
| 1-Person Household | 49 (39.5%) | 75 (60.5%) |
| 2-Person Household | 161 (70.3%) | 68 (29.7%) |
| 3-Person Household | 18 (47.4%) | 20 (52.6%) |
| 4+ Person Household | 33 (70.2%) | 14 (29.8%) |
| Total Housing Units | 261 (59.6%) | 177 (40.4%) |
Occupancy by Educational Attainment in Garrison
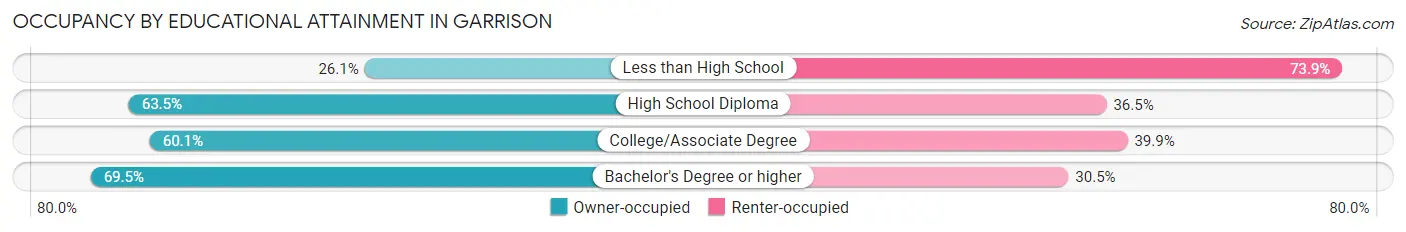
| Household Size | Owner-occupied | Renter-occupied |
| Less than High School | 12 (26.1%) | 34 (73.9%) |
| High School Diploma | 106 (63.5%) | 61 (36.5%) |
| College/Associate Degree | 86 (60.1%) | 57 (39.9%) |
| Bachelor's Degree or higher | 57 (69.5%) | 25 (30.5%) |
Occupancy by Age of Householder in Garrison
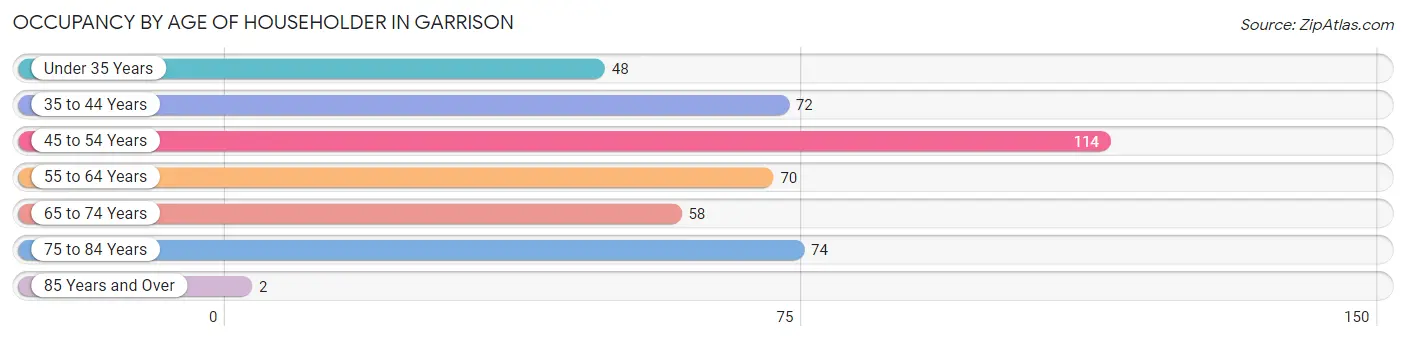
| Age Bracket | # Households | % Households |
| Under 35 Years | 48 | 11.0% |
| 35 to 44 Years | 72 | 16.4% |
| 45 to 54 Years | 114 | 26.0% |
| 55 to 64 Years | 70 | 16.0% |
| 65 to 74 Years | 58 | 13.2% |
| 75 to 84 Years | 74 | 16.9% |
| 85 Years and Over | 2 | 0.5% |
| Total | 438 | 100.0% |
Housing Finances in Garrison
Median Income by Occupancy in Garrison
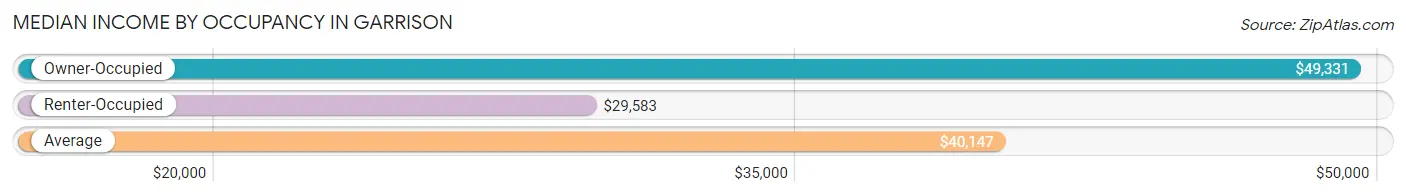
| Occupancy Type | # Households | Median Income |
| Owner-Occupied | 261 (59.6%) | $49,331 |
| Renter-Occupied | 177 (40.4%) | $29,583 |
| Average | 438 (100.0%) | $40,147 |
Occupancy by Householder Income Bracket in Garrison
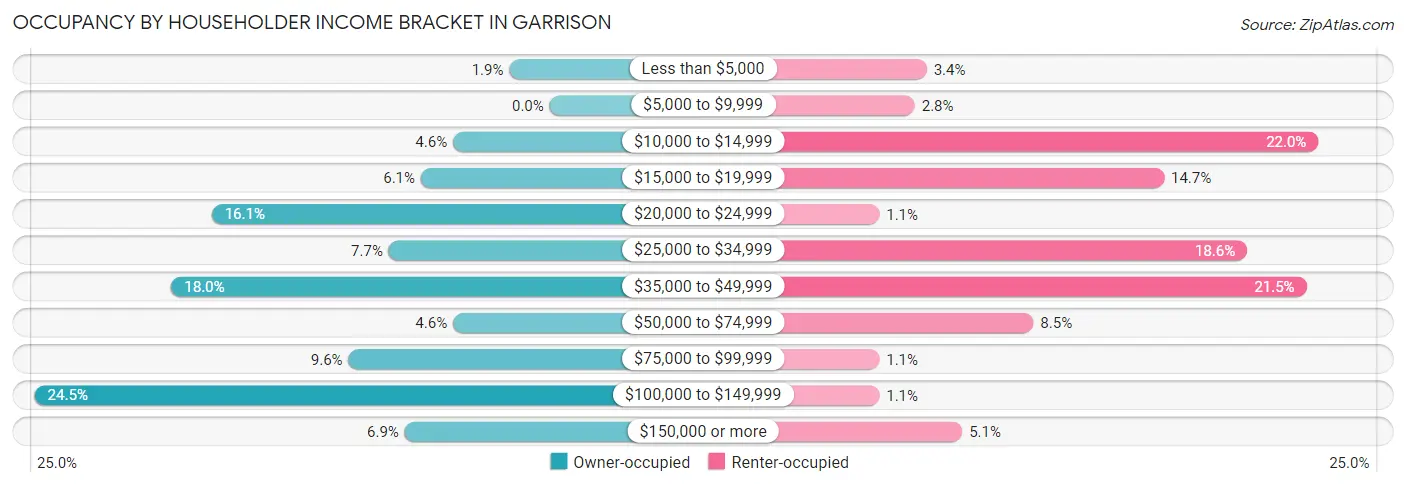
| Income Bracket | Owner-occupied | Renter-occupied |
| Less than $5,000 | 5 (1.9%) | 6 (3.4%) |
| $5,000 to $9,999 | 0 (0.0%) | 5 (2.8%) |
| $10,000 to $14,999 | 12 (4.6%) | 39 (22.0%) |
| $15,000 to $19,999 | 16 (6.1%) | 26 (14.7%) |
| $20,000 to $24,999 | 42 (16.1%) | 2 (1.1%) |
| $25,000 to $34,999 | 20 (7.7%) | 33 (18.6%) |
| $35,000 to $49,999 | 47 (18.0%) | 38 (21.5%) |
| $50,000 to $74,999 | 12 (4.6%) | 15 (8.5%) |
| $75,000 to $99,999 | 25 (9.6%) | 2 (1.1%) |
| $100,000 to $149,999 | 64 (24.5%) | 2 (1.1%) |
| $150,000 or more | 18 (6.9%) | 9 (5.1%) |
| Total | 261 (100.0%) | 177 (100.0%) |
Monthly Housing Cost Tiers in Garrison
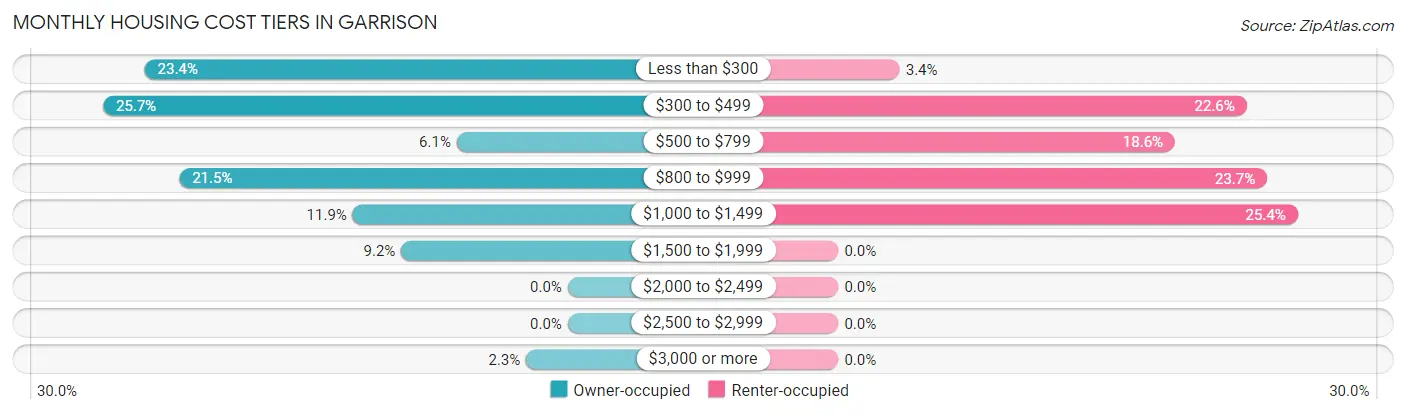
| Monthly Cost | Owner-occupied | Renter-occupied |
| Less than $300 | 61 (23.4%) | 6 (3.4%) |
| $300 to $499 | 67 (25.7%) | 40 (22.6%) |
| $500 to $799 | 16 (6.1%) | 33 (18.6%) |
| $800 to $999 | 56 (21.5%) | 42 (23.7%) |
| $1,000 to $1,499 | 31 (11.9%) | 45 (25.4%) |
| $1,500 to $1,999 | 24 (9.2%) | 0 (0.0%) |
| $2,000 to $2,499 | 0 (0.0%) | 0 (0.0%) |
| $2,500 to $2,999 | 0 (0.0%) | 0 (0.0%) |
| $3,000 or more | 6 (2.3%) | 0 (0.0%) |
| Total | 261 (100.0%) | 177 (100.0%) |
Physical Housing Characteristics in Garrison
Housing Structures in Garrison
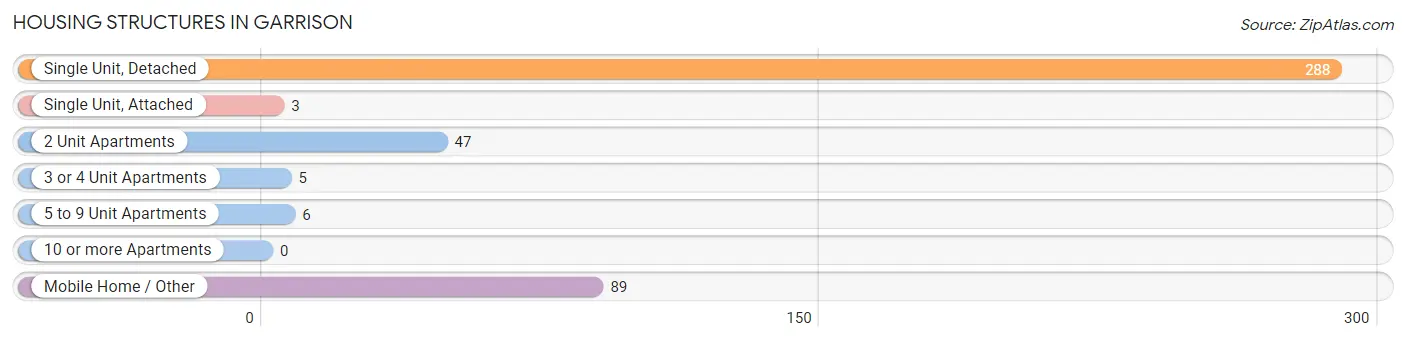
| Structure Type | # Housing Units | % Housing Units |
| Single Unit, Detached | 288 | 65.7% |
| Single Unit, Attached | 3 | 0.7% |
| 2 Unit Apartments | 47 | 10.7% |
| 3 or 4 Unit Apartments | 5 | 1.1% |
| 5 to 9 Unit Apartments | 6 | 1.4% |
| 10 or more Apartments | 0 | 0.0% |
| Mobile Home / Other | 89 | 20.3% |
| Total | 438 | 100.0% |
Housing Structures by Occupancy in Garrison
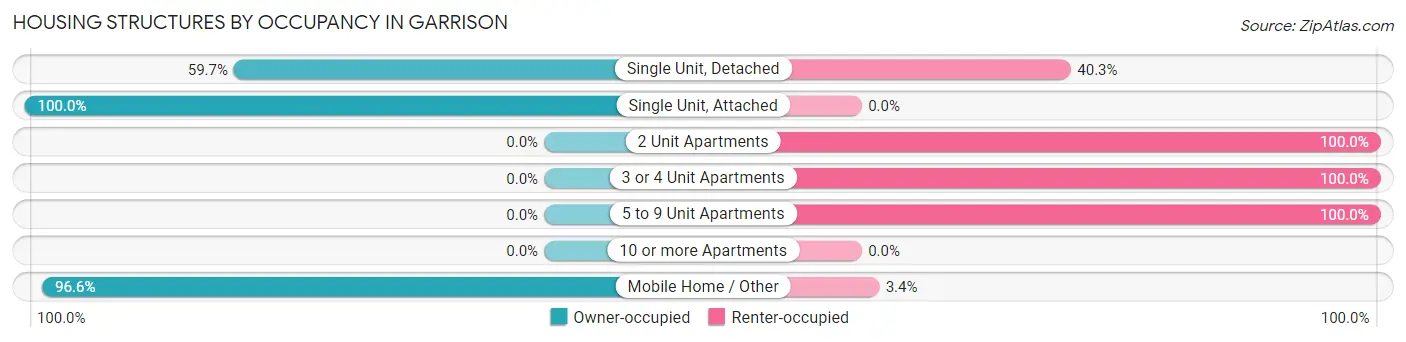
| Structure Type | Owner-occupied | Renter-occupied |
| Single Unit, Detached | 172 (59.7%) | 116 (40.3%) |
| Single Unit, Attached | 3 (100.0%) | 0 (0.0%) |
| 2 Unit Apartments | 0 (0.0%) | 47 (100.0%) |
| 3 or 4 Unit Apartments | 0 (0.0%) | 5 (100.0%) |
| 5 to 9 Unit Apartments | 0 (0.0%) | 6 (100.0%) |
| 10 or more Apartments | 0 (0.0%) | 0 (0.0%) |
| Mobile Home / Other | 86 (96.6%) | 3 (3.4%) |
| Total | 261 (59.6%) | 177 (40.4%) |
Housing Structures by Number of Rooms in Garrison
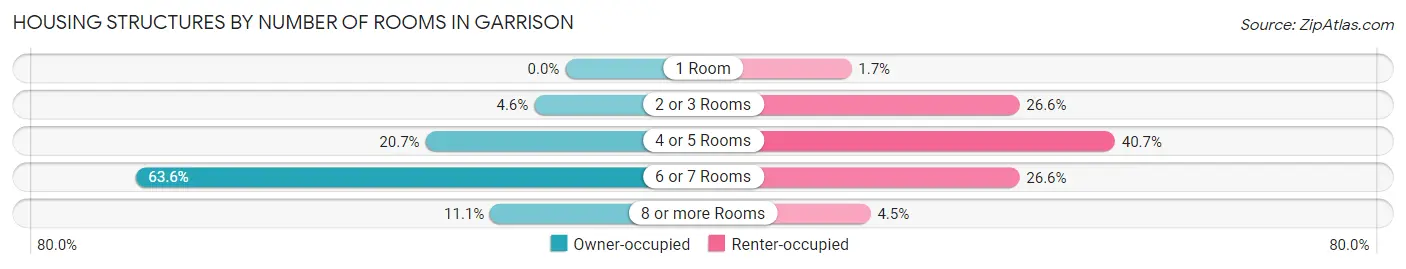
| Number of Rooms | Owner-occupied | Renter-occupied |
| 1 Room | 0 (0.0%) | 3 (1.7%) |
| 2 or 3 Rooms | 12 (4.6%) | 47 (26.6%) |
| 4 or 5 Rooms | 54 (20.7%) | 72 (40.7%) |
| 6 or 7 Rooms | 166 (63.6%) | 47 (26.6%) |
| 8 or more Rooms | 29 (11.1%) | 8 (4.5%) |
| Total | 261 (100.0%) | 177 (100.0%) |
Housing Structure by Heating Type in Garrison
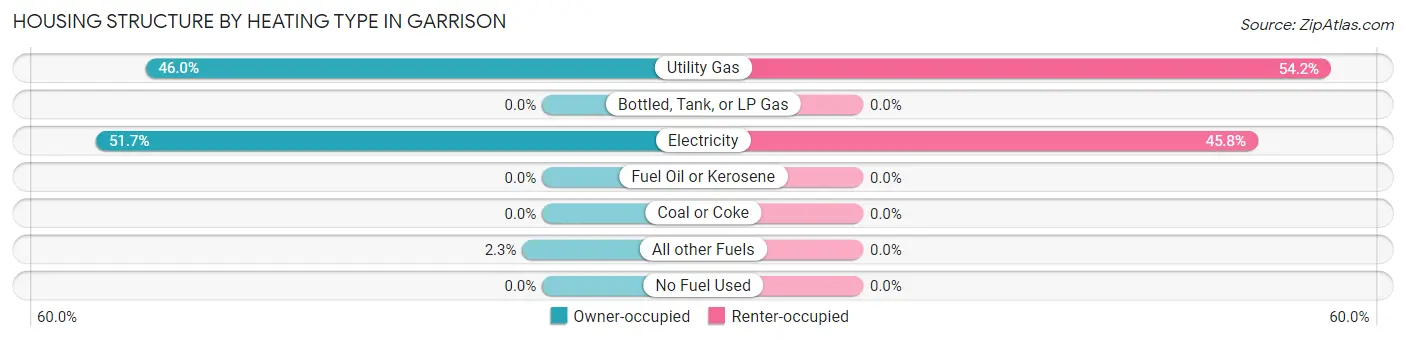
| Heating Type | Owner-occupied | Renter-occupied |
| Utility Gas | 120 (46.0%) | 96 (54.2%) |
| Bottled, Tank, or LP Gas | 0 (0.0%) | 0 (0.0%) |
| Electricity | 135 (51.7%) | 81 (45.8%) |
| Fuel Oil or Kerosene | 0 (0.0%) | 0 (0.0%) |
| Coal or Coke | 0 (0.0%) | 0 (0.0%) |
| All other Fuels | 6 (2.3%) | 0 (0.0%) |
| No Fuel Used | 0 (0.0%) | 0 (0.0%) |
| Total | 261 (100.0%) | 177 (100.0%) |
Household Vehicle Usage in Garrison
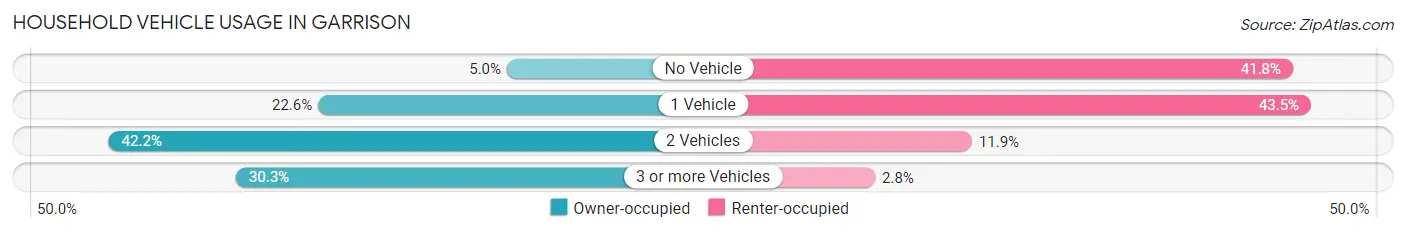
| Vehicles per Household | Owner-occupied | Renter-occupied |
| No Vehicle | 13 (5.0%) | 74 (41.8%) |
| 1 Vehicle | 59 (22.6%) | 77 (43.5%) |
| 2 Vehicles | 110 (42.1%) | 21 (11.9%) |
| 3 or more Vehicles | 79 (30.3%) | 5 (2.8%) |
| Total | 261 (100.0%) | 177 (100.0%) |
Real Estate & Mortgages in Garrison
Real Estate and Mortgage Overview in Garrison
| Characteristic | Without Mortgage | With Mortgage |
| Housing Units | 139 | 122 |
| Median Property Value | - | - |
| Median Household Income | $33,750 | $15 |
| Monthly Housing Costs | $319 | $6 |
| Real Estate Taxes | $432 | $0 |
Property Value by Mortgage Status in Garrison
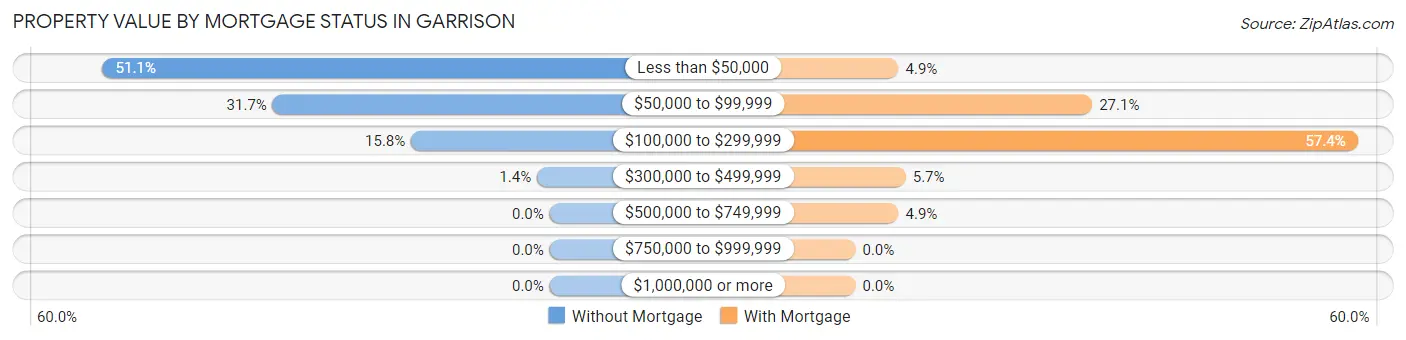
| Property Value | Without Mortgage | With Mortgage |
| Less than $50,000 | 71 (51.1%) | 6 (4.9%) |
| $50,000 to $99,999 | 44 (31.7%) | 33 (27.1%) |
| $100,000 to $299,999 | 22 (15.8%) | 70 (57.4%) |
| $300,000 to $499,999 | 2 (1.4%) | 7 (5.7%) |
| $500,000 to $749,999 | 0 (0.0%) | 6 (4.9%) |
| $750,000 to $999,999 | 0 (0.0%) | 0 (0.0%) |
| $1,000,000 or more | 0 (0.0%) | 0 (0.0%) |
| Total | 139 (100.0%) | 122 (100.0%) |
Household Income by Mortgage Status in Garrison
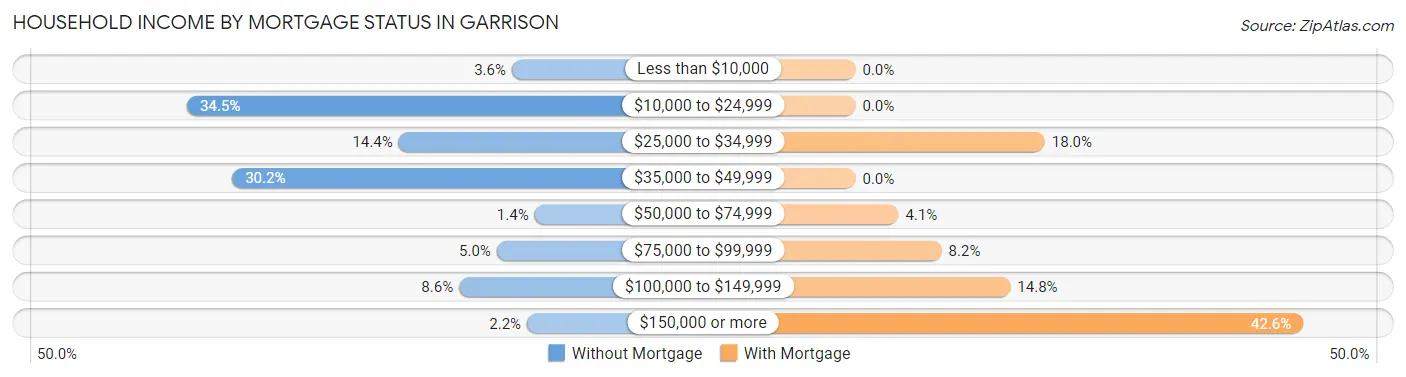
| Household Income | Without Mortgage | With Mortgage |
| Less than $10,000 | 5 (3.6%) | 0 (0.0%) |
| $10,000 to $24,999 | 48 (34.5%) | 0 (0.0%) |
| $25,000 to $34,999 | 20 (14.4%) | 22 (18.0%) |
| $35,000 to $49,999 | 42 (30.2%) | 0 (0.0%) |
| $50,000 to $74,999 | 2 (1.4%) | 5 (4.1%) |
| $75,000 to $99,999 | 7 (5.0%) | 10 (8.2%) |
| $100,000 to $149,999 | 12 (8.6%) | 18 (14.7%) |
| $150,000 or more | 3 (2.2%) | 52 (42.6%) |
| Total | 139 (100.0%) | 122 (100.0%) |
Property Value to Household Income Ratio in Garrison
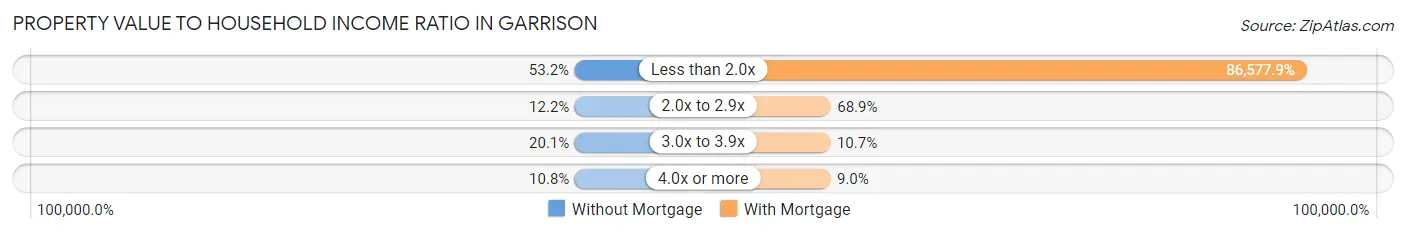
| Value-to-Income Ratio | Without Mortgage | With Mortgage |
| Less than 2.0x | 74 (53.2%) | 105,625 (86,577.9%) |
| 2.0x to 2.9x | 17 (12.2%) | 84 (68.9%) |
| 3.0x to 3.9x | 28 (20.1%) | 13 (10.7%) |
| 4.0x or more | 15 (10.8%) | 11 (9.0%) |
| Total | 139 (100.0%) | 122 (100.0%) |
Real Estate Taxes by Mortgage Status in Garrison
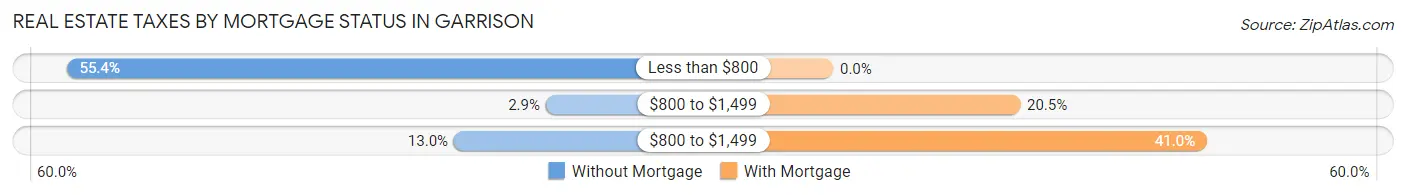
| Property Taxes | Without Mortgage | With Mortgage |
| Less than $800 | 77 (55.4%) | 0 (0.0%) |
| $800 to $1,499 | 4 (2.9%) | 25 (20.5%) |
| $800 to $1,499 | 18 (13.0%) | 50 (41.0%) |
| Total | 139 (100.0%) | 122 (100.0%) |
Health & Disability in Garrison
Health Insurance Coverage by Age in Garrison
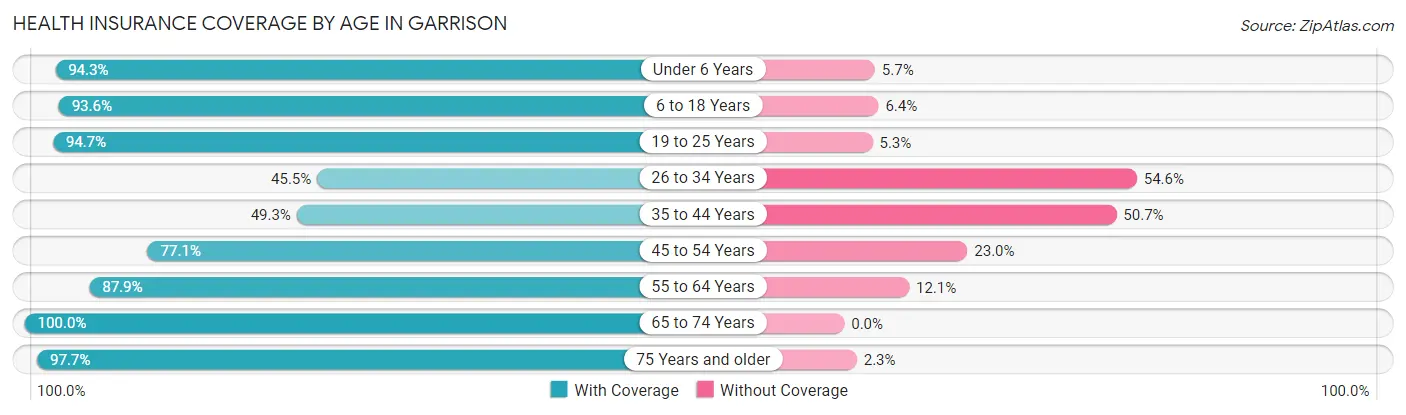
| Age Bracket | With Coverage | Without Coverage |
| Under 6 Years | 33 (94.3%) | 2 (5.7%) |
| 6 to 18 Years | 147 (93.6%) | 10 (6.4%) |
| 19 to 25 Years | 36 (94.7%) | 2 (5.3%) |
| 26 to 34 Years | 25 (45.5%) | 30 (54.5%) |
| 35 to 44 Years | 67 (49.3%) | 69 (50.7%) |
| 45 to 54 Years | 141 (77.0%) | 42 (23.0%) |
| 55 to 64 Years | 102 (87.9%) | 14 (12.1%) |
| 65 to 74 Years | 82 (100.0%) | 0 (0.0%) |
| 75 Years and older | 84 (97.7%) | 2 (2.3%) |
| Total | 717 (80.7%) | 171 (19.3%) |
Health Insurance Coverage by Citizenship Status in Garrison
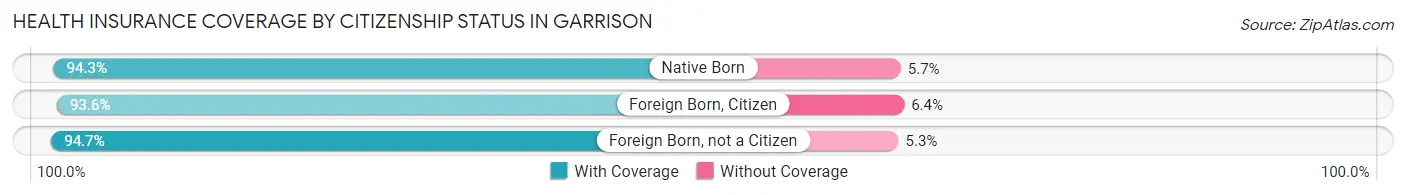
| Citizenship Status | With Coverage | Without Coverage |
| Native Born | 33 (94.3%) | 2 (5.7%) |
| Foreign Born, Citizen | 147 (93.6%) | 10 (6.4%) |
| Foreign Born, not a Citizen | 36 (94.7%) | 2 (5.3%) |
Health Insurance Coverage by Household Income in Garrison
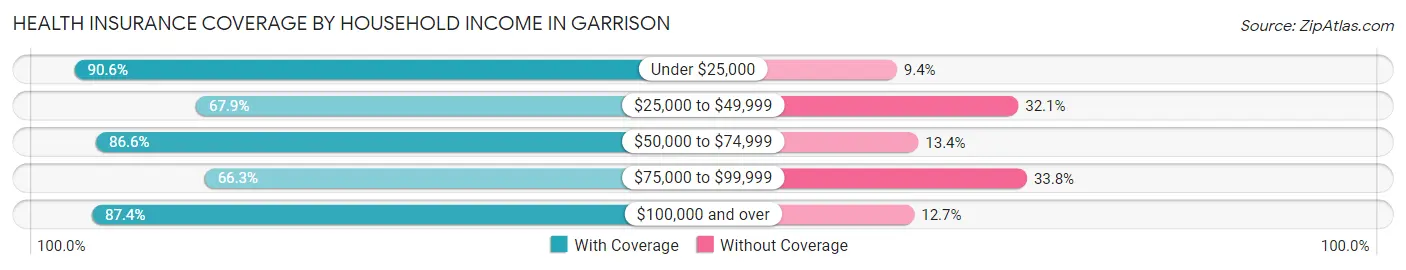
| Household Income | With Coverage | Without Coverage |
| Under $25,000 | 203 (90.6%) | 21 (9.4%) |
| $25,000 to $49,999 | 169 (67.9%) | 80 (32.1%) |
| $50,000 to $74,999 | 71 (86.6%) | 11 (13.4%) |
| $75,000 to $99,999 | 53 (66.2%) | 27 (33.8%) |
| $100,000 and over | 221 (87.4%) | 32 (12.7%) |
Public vs Private Health Insurance Coverage by Age in Garrison
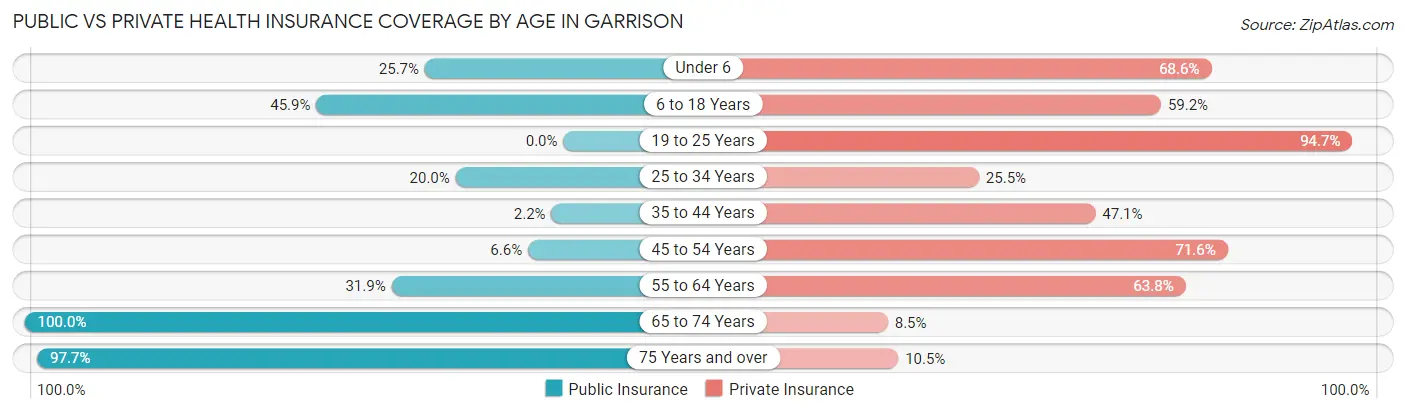
| Age Bracket | Public Insurance | Private Insurance |
| Under 6 | 9 (25.7%) | 24 (68.6%) |
| 6 to 18 Years | 72 (45.9%) | 93 (59.2%) |
| 19 to 25 Years | 0 (0.0%) | 36 (94.7%) |
| 25 to 34 Years | 11 (20.0%) | 14 (25.5%) |
| 35 to 44 Years | 3 (2.2%) | 64 (47.1%) |
| 45 to 54 Years | 12 (6.6%) | 131 (71.6%) |
| 55 to 64 Years | 37 (31.9%) | 74 (63.8%) |
| 65 to 74 Years | 82 (100.0%) | 7 (8.5%) |
| 75 Years and over | 84 (97.7%) | 9 (10.5%) |
| Total | 310 (34.9%) | 452 (50.9%) |
Disability Status by Sex by Age in Garrison
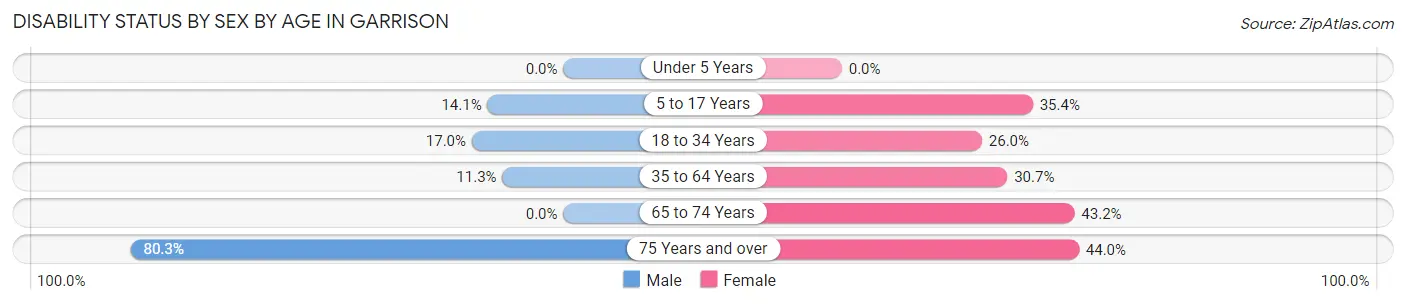
| Age Bracket | Male | Female |
| Under 5 Years | 0 (0.0%) | 0 (0.0%) |
| 5 to 17 Years | 10 (14.1%) | 28 (35.4%) |
| 18 to 34 Years | 9 (17.0%) | 13 (26.0%) |
| 35 to 64 Years | 19 (11.3%) | 82 (30.7%) |
| 65 to 74 Years | 0 (0.0%) | 19 (43.2%) |
| 75 Years and over | 49 (80.3%) | 11 (44.0%) |
Disability Class by Sex by Age in Garrison
Disability Class: Hearing Difficulty
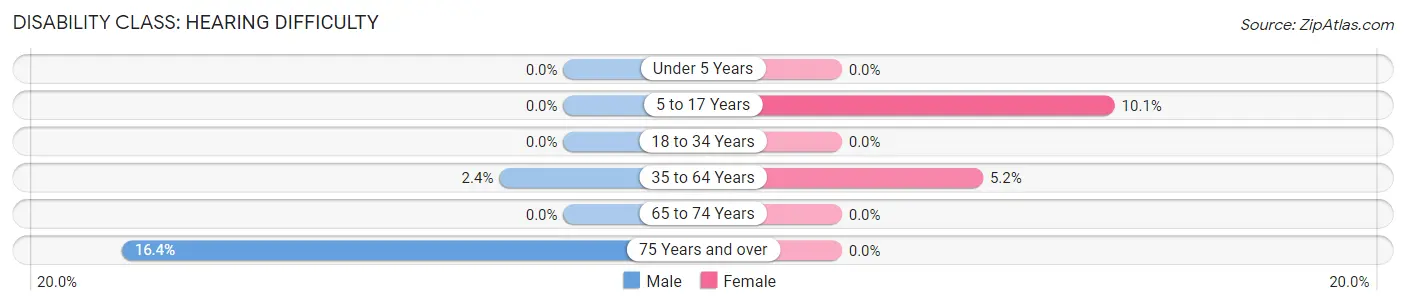
| Age Bracket | Male | Female |
| Under 5 Years | 0 (0.0%) | 0 (0.0%) |
| 5 to 17 Years | 0 (0.0%) | 8 (10.1%) |
| 18 to 34 Years | 0 (0.0%) | 0 (0.0%) |
| 35 to 64 Years | 4 (2.4%) | 14 (5.2%) |
| 65 to 74 Years | 0 (0.0%) | 0 (0.0%) |
| 75 Years and over | 10 (16.4%) | 0 (0.0%) |
Disability Class: Vision Difficulty
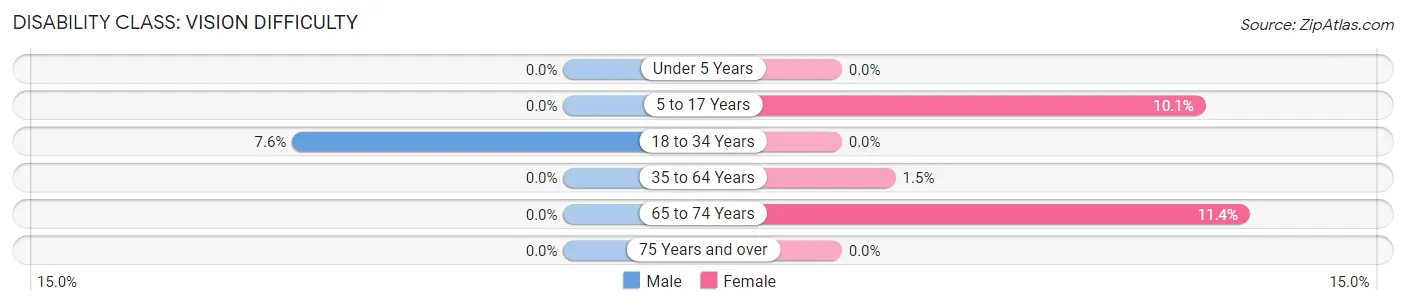
| Age Bracket | Male | Female |
| Under 5 Years | 0 (0.0%) | 0 (0.0%) |
| 5 to 17 Years | 0 (0.0%) | 8 (10.1%) |
| 18 to 34 Years | 4 (7.5%) | 0 (0.0%) |
| 35 to 64 Years | 0 (0.0%) | 4 (1.5%) |
| 65 to 74 Years | 0 (0.0%) | 5 (11.4%) |
| 75 Years and over | 0 (0.0%) | 0 (0.0%) |
Disability Class: Cognitive Difficulty
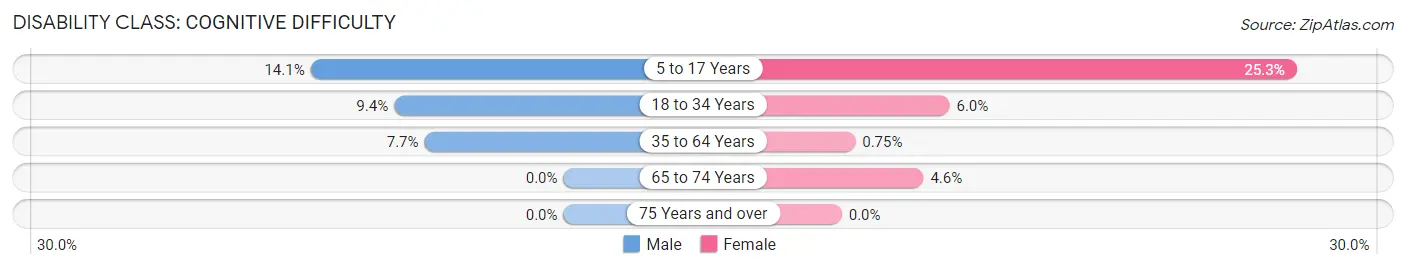
| Age Bracket | Male | Female |
| 5 to 17 Years | 10 (14.1%) | 20 (25.3%) |
| 18 to 34 Years | 5 (9.4%) | 3 (6.0%) |
| 35 to 64 Years | 13 (7.7%) | 2 (0.7%) |
| 65 to 74 Years | 0 (0.0%) | 2 (4.5%) |
| 75 Years and over | 0 (0.0%) | 0 (0.0%) |
Disability Class: Ambulatory Difficulty
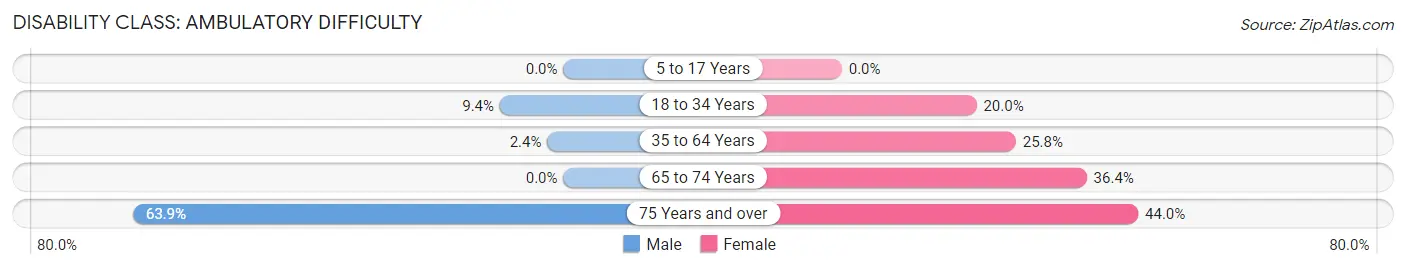
| Age Bracket | Male | Female |
| 5 to 17 Years | 0 (0.0%) | 0 (0.0%) |
| 18 to 34 Years | 5 (9.4%) | 10 (20.0%) |
| 35 to 64 Years | 4 (2.4%) | 69 (25.8%) |
| 65 to 74 Years | 0 (0.0%) | 16 (36.4%) |
| 75 Years and over | 39 (63.9%) | 11 (44.0%) |
Disability Class: Self-Care Difficulty
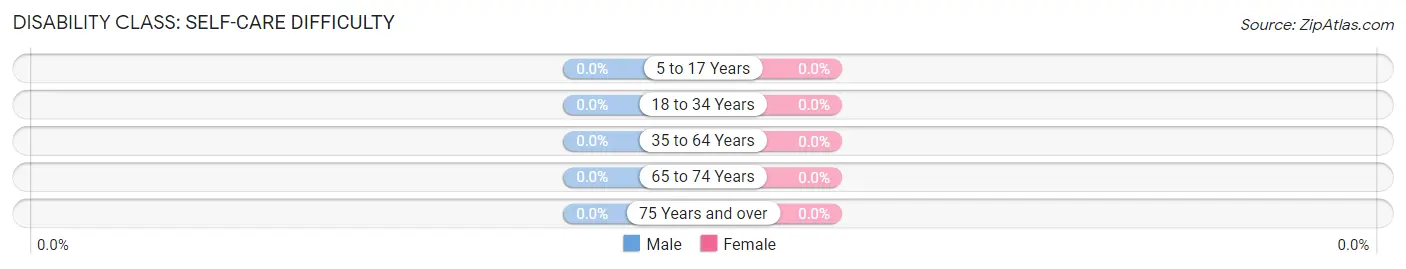
| Age Bracket | Male | Female |
| 5 to 17 Years | 0 (0.0%) | 0 (0.0%) |
| 18 to 34 Years | 0 (0.0%) | 0 (0.0%) |
| 35 to 64 Years | 0 (0.0%) | 0 (0.0%) |
| 65 to 74 Years | 0 (0.0%) | 0 (0.0%) |
| 75 Years and over | 0 (0.0%) | 0 (0.0%) |
Technology Access in Garrison
Computing Device Access in Garrison
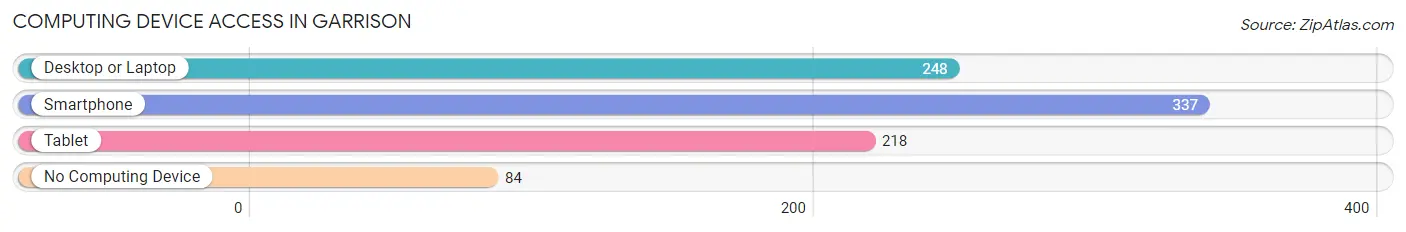
| Device Type | # Households | % Households |
| Desktop or Laptop | 248 | 56.6% |
| Smartphone | 337 | 76.9% |
| Tablet | 218 | 49.8% |
| No Computing Device | 84 | 19.2% |
| Total | 438 | 100.0% |
Internet Access in Garrison
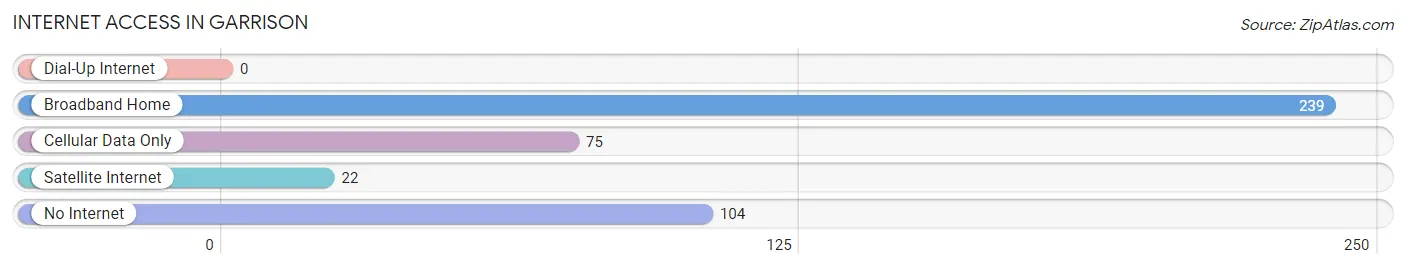
| Internet Type | # Households | % Households |
| Dial-Up Internet | 0 | 0.0% |
| Broadband Home | 239 | 54.6% |
| Cellular Data Only | 75 | 17.1% |
| Satellite Internet | 22 | 5.0% |
| No Internet | 104 | 23.7% |
| Total | 438 | 100.0% |
Garrison Summary
Garrison, Texas is a small town located in Nacogdoches County, Texas. It is situated on the banks of the Angelina River, approximately 20 miles east of Nacogdoches. The town was founded in 1845 by William Garrison, a former soldier in the Texas Revolution. The town was named after him and has been a part of Nacogdoches County since its inception.
History
Garrison was founded in 1845 by William Garrison, a former soldier in the Texas Revolution. The town was named after him and has been a part of Nacogdoches County since its inception. The town was originally a small farming community, but it soon grew to become a major center of commerce in the area. The town was home to several businesses, including a cotton gin, a sawmill, and a gristmill.
In the late 19th century, Garrison was a major stop on the Texas and New Orleans Railroad. The railroad brought new economic opportunities to the town, and it soon became a hub for the lumber industry. The town also became a popular destination for tourists, who came to enjoy the area’s natural beauty.
In the early 20th century, Garrison was a major center of the oil industry. The town was home to several oil refineries and was a major supplier of oil to the rest of the country. The town also became a major center of the timber industry, and it was home to several sawmills and lumber yards.
Geography
Garrison is located in Nacogdoches County, Texas. It is situated on the banks of the Angelina River, approximately 20 miles east of Nacogdoches. The town is surrounded by rolling hills and lush forests. The climate in Garrison is humid subtropical, with hot summers and mild winters.
Economy
Garrison’s economy is largely based on the timber and oil industries. The town is home to several sawmills and lumber yards, as well as several oil refineries. The town is also home to several small businesses, including restaurants, retail stores, and service providers.
Demographics
As of the 2010 census, the population of Garrison was 1,845. The racial makeup of the town was 79.3% White, 16.2% African American, 0.7% Native American, 0.3% Asian, and 3.5% from other races. The median household income in Garrison was $37,917, and the median family income was $45,938.
Garrison is a small town with a rich history and a vibrant economy. It is home to several businesses, including sawmills, oil refineries, and retail stores. The town is also home to a diverse population, with a mix of races and ethnicities. Garrison is a great place to live and work, and it is a great place to visit.
Common Questions
What is Per Capita Income in Garrison?
Per Capita income in Garrison is $27,094.
What is the Median Family Income in Garrison?
Median Family Income in Garrison is $49,848.
What is the Median Household income in Garrison?
Median Household Income in Garrison is $40,147.
What is Income or Wage Gap in Garrison?
Income or Wage Gap in Garrison is 62.7%.
Women in Garrison earn 37.3 cents for every dollar earned by a man.
What is Inequality or Gini Index in Garrison?
Inequality or Gini Index in Garrison is 0.46.
What is the Total Population of Garrison?
Total Population of Garrison is 987.
What is the Total Male Population of Garrison?
Total Male Population of Garrison is 443.
What is the Total Female Population of Garrison?
Total Female Population of Garrison is 544.
What is the Ratio of Males per 100 Females in Garrison?
There are 81.43 Males per 100 Females in Garrison.
What is the Ratio of Females per 100 Males in Garrison?
There are 122.80 Females per 100 Males in Garrison.
What is the Median Population Age in Garrison?
Median Population Age in Garrison is 50.3 Years.
What is the Average Family Size in Garrison
Average Family Size in Garrison is 2.6 People.
What is the Average Household Size in Garrison
Average Household Size in Garrison is 2.0 People.
How Large is the Labor Force in Garrison?
There are 432 People in the Labor Forcein in Garrison.
What is the Percentage of People in the Labor Force in Garrison?
51.9% of People are in the Labor Force in Garrison.
What is the Unemployment Rate in Garrison?
Unemployment Rate in Garrison is 12.3%.