Gallatin, TX Map & Demographics
Gallatin Map
Gallatin Overview
$34,643
PER CAPITA INCOME
$86,563
AVG FAMILY INCOME
$78,250
AVG HOUSEHOLD INCOME
46.5%
WAGE / INCOME GAP [ % ]
53.5¢/ $1
WAGE / INCOME GAP [ $ ]
0.31
INEQUALITY / GINI INDEX
358
TOTAL POPULATION
185
MALE POPULATION
173
FEMALE POPULATION
106.94
MALES / 100 FEMALES
93.51
FEMALES / 100 MALES
32.1
MEDIAN AGE
2.8
AVG FAMILY SIZE
2.6
AVG HOUSEHOLD SIZE
183
LABOR FORCE [ PEOPLE ]
65.8%
PERCENT IN LABOR FORCE
7.1%
UNEMPLOYMENT RATE
Gallatin Zip Codes
Income in Gallatin
Income Overview in Gallatin
Per Capita Income in Gallatin is $34,643, while median incomes of families and households are $86,563 and $78,250 respectively.
| Characteristic | Number | Measure |
| Per Capita Income | 358 | $34,643 |
| Median Family Income | 117 | $86,563 |
| Mean Family Income | 117 | $99,340 |
| Median Household Income | 135 | $78,250 |
| Mean Household Income | 135 | $93,599 |
| Income Deficit | 117 | $0 |
| Wage / Income Gap (%) | 358 | 46.55% |
| Wage / Income Gap ($) | 358 | 53.45¢ per $1 |
| Gini / Inequality Index | 358 | 0.31 |
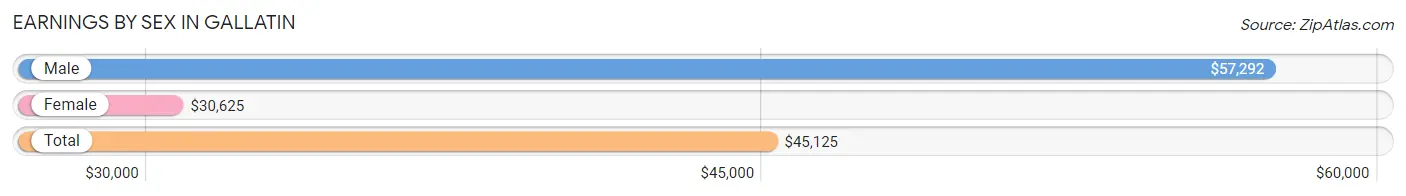
Earnings by Sex in Gallatin
Average Earnings in Gallatin are $45,125, $57,292 for men and $30,625 for women, a difference of 46.6%.
| Sex | Number | Average Earnings |
| Male | 108 (57.8%) | $57,292 |
| Female | 79 (42.2%) | $30,625 |
| Total | 187 (100.0%) | $45,125 |
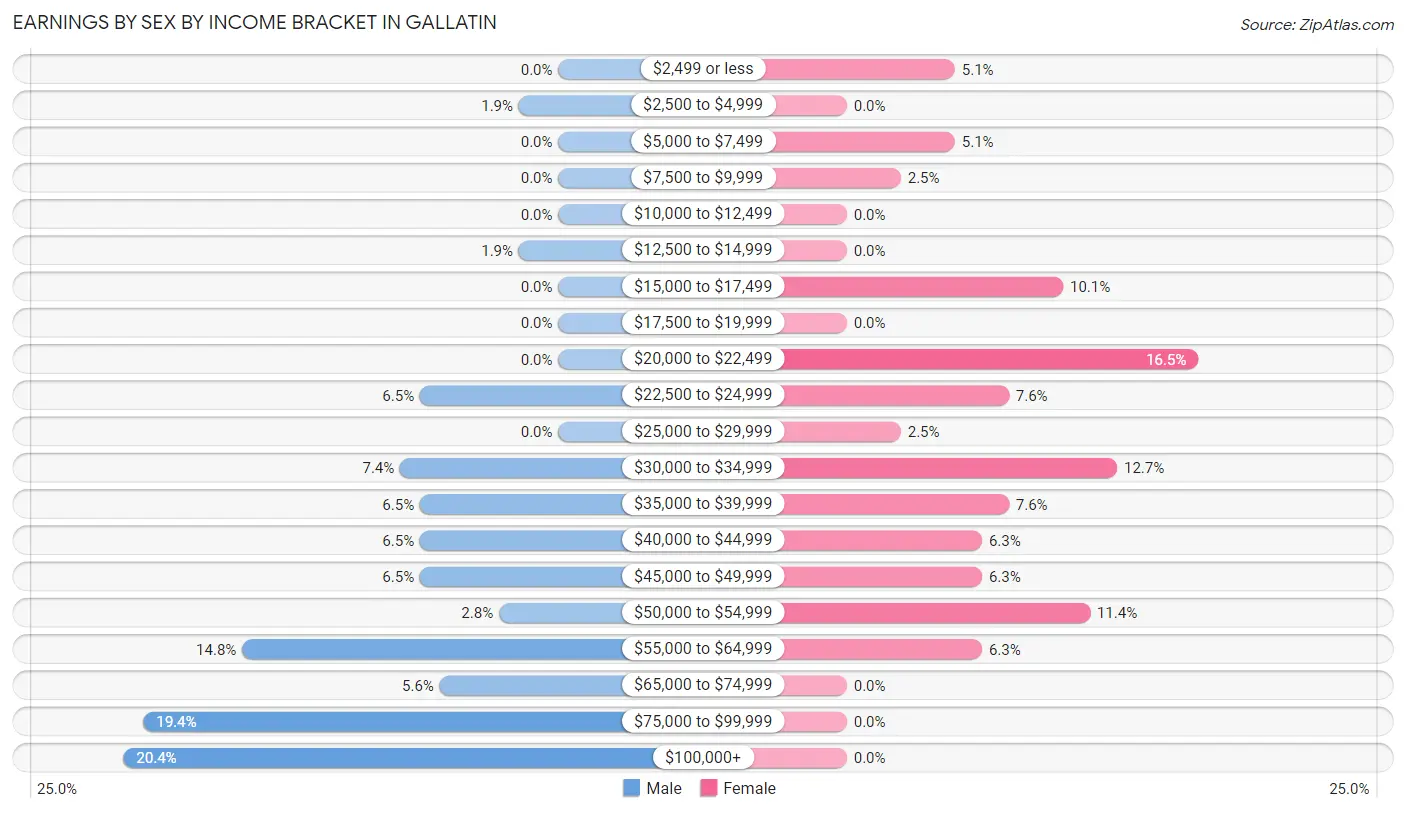
Earnings by Sex by Income Bracket in Gallatin
The most common earnings brackets in Gallatin are $100,000+ for men (22 | 20.4%) and $20,000 to $22,499 for women (13 | 16.5%).
| Income | Male | Female |
| $2,499 or less | 0 (0.0%) | 4 (5.1%) |
| $2,500 to $4,999 | 2 (1.8%) | 0 (0.0%) |
| $5,000 to $7,499 | 0 (0.0%) | 4 (5.1%) |
| $7,500 to $9,999 | 0 (0.0%) | 2 (2.5%) |
| $10,000 to $12,499 | 0 (0.0%) | 0 (0.0%) |
| $12,500 to $14,999 | 2 (1.8%) | 0 (0.0%) |
| $15,000 to $17,499 | 0 (0.0%) | 8 (10.1%) |
| $17,500 to $19,999 | 0 (0.0%) | 0 (0.0%) |
| $20,000 to $22,499 | 0 (0.0%) | 13 (16.5%) |
| $22,500 to $24,999 | 7 (6.5%) | 6 (7.6%) |
| $25,000 to $29,999 | 0 (0.0%) | 2 (2.5%) |
| $30,000 to $34,999 | 8 (7.4%) | 10 (12.7%) |
| $35,000 to $39,999 | 7 (6.5%) | 6 (7.6%) |
| $40,000 to $44,999 | 7 (6.5%) | 5 (6.3%) |
| $45,000 to $49,999 | 7 (6.5%) | 5 (6.3%) |
| $50,000 to $54,999 | 3 (2.8%) | 9 (11.4%) |
| $55,000 to $64,999 | 16 (14.8%) | 5 (6.3%) |
| $65,000 to $74,999 | 6 (5.6%) | 0 (0.0%) |
| $75,000 to $99,999 | 21 (19.4%) | 0 (0.0%) |
| $100,000+ | 22 (20.4%) | 0 (0.0%) |
| Total | 108 (100.0%) | 79 (100.0%) |
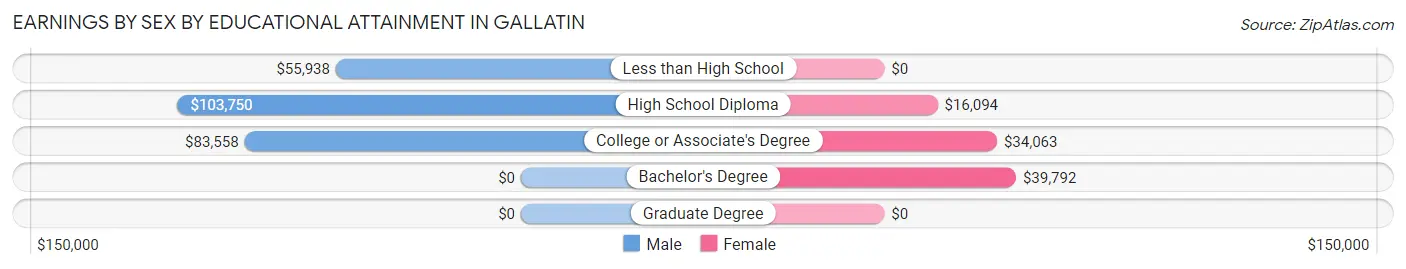
Earnings by Sex by Educational Attainment in Gallatin
Average earnings in Gallatin are $74,750 for men and $34,375 for women, a difference of 54.0%. Men with an educational attainment of high school diploma enjoy the highest average annual earnings of $103,750, while those with less than high school education earn the least with $55,938. Women with an educational attainment of bachelor's degree earn the most with the average annual earnings of $39,792, while those with high school diploma education have the smallest earnings of $16,094.
| Educational Attainment | Male Income | Female Income |
| Less than High School | $55,938 | $0 |
| High School Diploma | $103,750 | $16,094 |
| College or Associate's Degree | $83,558 | $34,063 |
| Bachelor's Degree | - | - |
| Graduate Degree | - | - |
| Total | $74,750 | $34,375 |
Family Income in Gallatin
Family Income Brackets in Gallatin
According to the Gallatin family income data, there are 37 families falling into the $50,000 to $74,999 income range, which is the most common income bracket and makes up 31.6% of all families.
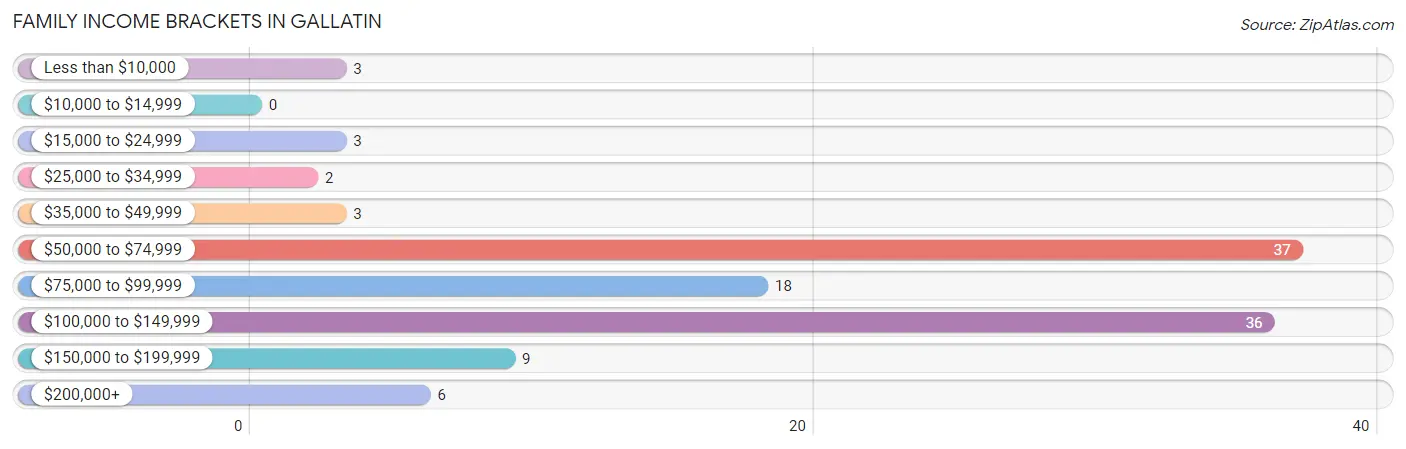
| Income Bracket | # Families | % Families |
| Less than $10,000 | 3 | 2.6% |
| $10,000 to $14,999 | 0 | 0.0% |
| $15,000 to $24,999 | 3 | 2.6% |
| $25,000 to $34,999 | 2 | 1.7% |
| $35,000 to $49,999 | 3 | 2.6% |
| $50,000 to $74,999 | 37 | 31.6% |
| $75,000 to $99,999 | 18 | 15.4% |
| $100,000 to $149,999 | 36 | 30.8% |
| $150,000 to $199,999 | 9 | 7.7% |
| $200,000+ | 6 | 5.1% |
Family Income by Famaliy Size in Gallatin
4-person families (20 | 17.1%) account for the highest median family income in Gallatin with $83,750 per family, while 2-person families (43 | 36.7%) have the highest median income of $36,927 per family member.
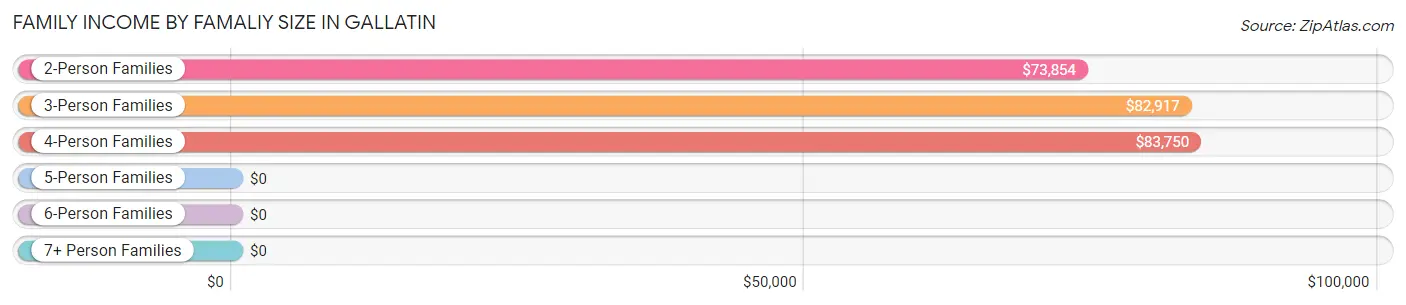
| Income Bracket | # Families | Median Income |
| 2-Person Families | 43 (36.7%) | $73,854 |
| 3-Person Families | 33 (28.2%) | $82,917 |
| 4-Person Families | 20 (17.1%) | $83,750 |
| 5-Person Families | 16 (13.7%) | $0 |
| 6-Person Families | 5 (4.3%) | $0 |
| 7+ Person Families | 0 (0.0%) | $0 |
| Total | 117 (100.0%) | $86,563 |
Family Income by Number of Earners in Gallatin
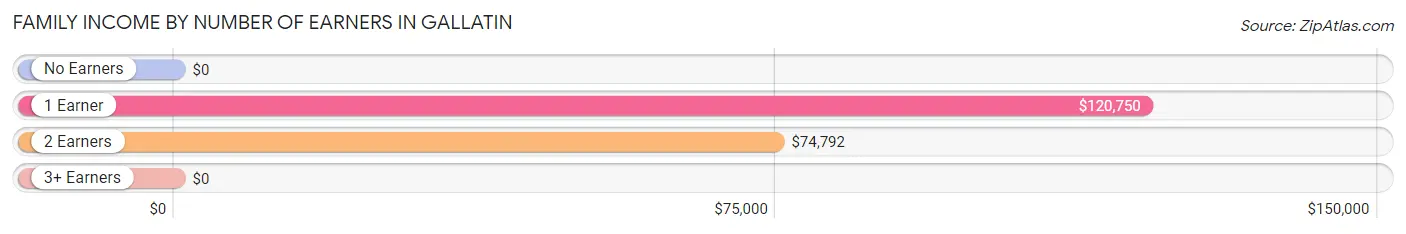
| Number of Earners | # Families | Median Income |
| No Earners | 14 (12.0%) | $0 |
| 1 Earner | 32 (27.4%) | $120,750 |
| 2 Earners | 58 (49.6%) | $74,792 |
| 3+ Earners | 13 (11.1%) | $0 |
| Total | 117 (100.0%) | $86,563 |
Household Income in Gallatin
Household Income Brackets in Gallatin
With 41 households falling in the category, the $50,000 to $74,999 income range is the most frequent in Gallatin, accounting for 30.4% of all households.
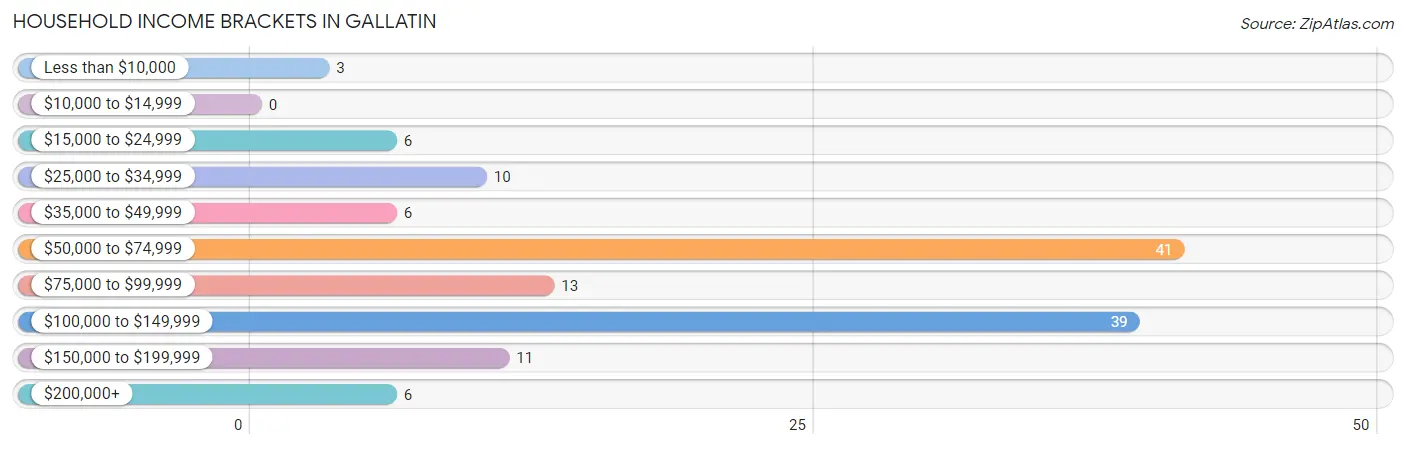
| Income Bracket | # Households | % Households |
| Less than $10,000 | 3 | 2.2% |
| $10,000 to $14,999 | 0 | 0.0% |
| $15,000 to $24,999 | 6 | 4.4% |
| $25,000 to $34,999 | 10 | 7.4% |
| $35,000 to $49,999 | 6 | 4.4% |
| $50,000 to $74,999 | 41 | 30.4% |
| $75,000 to $99,999 | 13 | 9.6% |
| $100,000 to $149,999 | 39 | 28.9% |
| $150,000 to $199,999 | 11 | 8.1% |
| $200,000+ | 6 | 4.4% |
Household Income by Householder Age in Gallatin
The median household income in Gallatin is $78,250, with the highest median household income of $116,250 found in the 25 to 44 years age bracket for the primary householder. A total of 58 households (43.0%) fall into this category. Meanwhile, the 15 to 24 years age bracket for the primary householder has the lowest median household income of $0, with 16 households (11.8%) in this group.
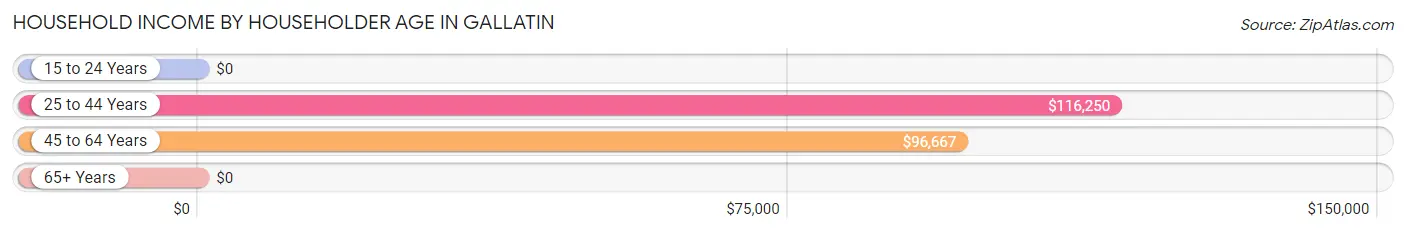
| Income Bracket | # Households | Median Income |
| 15 to 24 Years | 16 (11.8%) | $0 |
| 25 to 44 Years | 58 (43.0%) | $116,250 |
| 45 to 64 Years | 28 (20.7%) | $96,667 |
| 65+ Years | 33 (24.4%) | $0 |
| Total | 135 (100.0%) | $78,250 |
Poverty in Gallatin
Income Below Poverty by Sex and Age in Gallatin
With 3.2% poverty level for males and 1.7% for females among the residents of Gallatin, under 5 year old males and 25 to 34 year old females are the most vulnerable to poverty, with 3 males (30.0%) and 3 females (8.3%) in their respective age groups living below the poverty level.
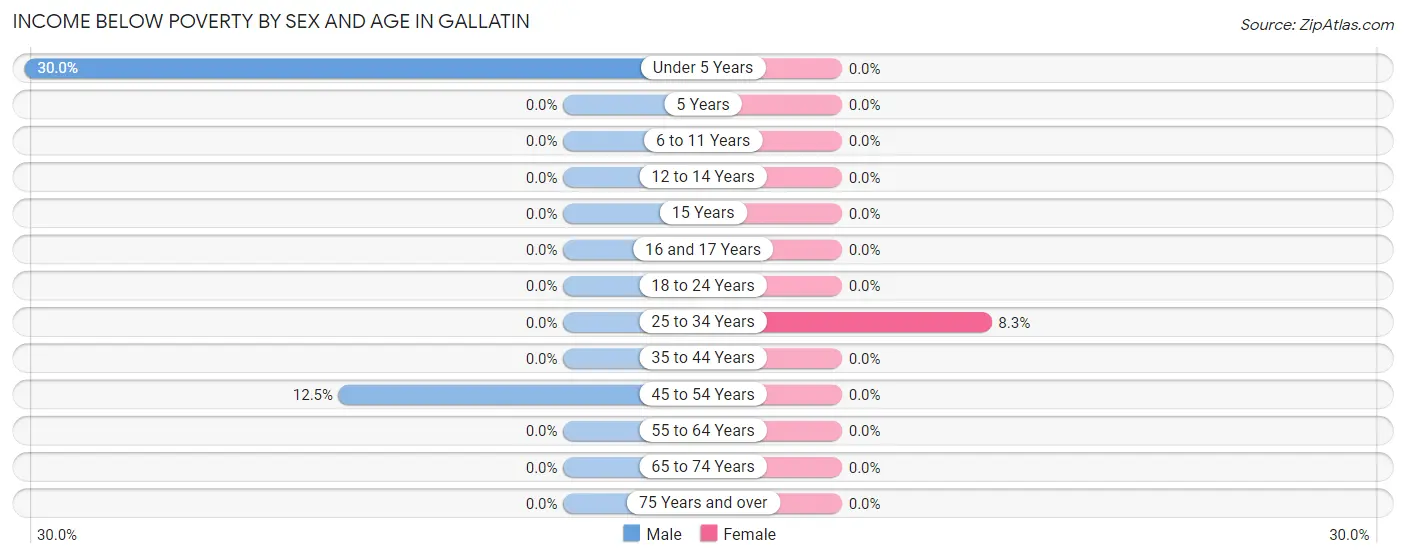
| Age Bracket | Male | Female |
| Under 5 Years | 3 (30.0%) | 0 (0.0%) |
| 5 Years | 0 (0.0%) | 0 (0.0%) |
| 6 to 11 Years | 0 (0.0%) | 0 (0.0%) |
| 12 to 14 Years | 0 (0.0%) | 0 (0.0%) |
| 15 Years | 0 (0.0%) | 0 (0.0%) |
| 16 and 17 Years | 0 (0.0%) | 0 (0.0%) |
| 18 to 24 Years | 0 (0.0%) | 0 (0.0%) |
| 25 to 34 Years | 0 (0.0%) | 3 (8.3%) |
| 35 to 44 Years | 0 (0.0%) | 0 (0.0%) |
| 45 to 54 Years | 3 (12.5%) | 0 (0.0%) |
| 55 to 64 Years | 0 (0.0%) | 0 (0.0%) |
| 65 to 74 Years | 0 (0.0%) | 0 (0.0%) |
| 75 Years and over | 0 (0.0%) | 0 (0.0%) |
| Total | 6 (3.2%) | 3 (1.7%) |
Income Above Poverty by Sex and Age in Gallatin
According to the poverty statistics in Gallatin, males aged 5 years and females aged under 5 years are the age groups that are most secure financially, with 100.0% of males and 100.0% of females in these age groups living above the poverty line.
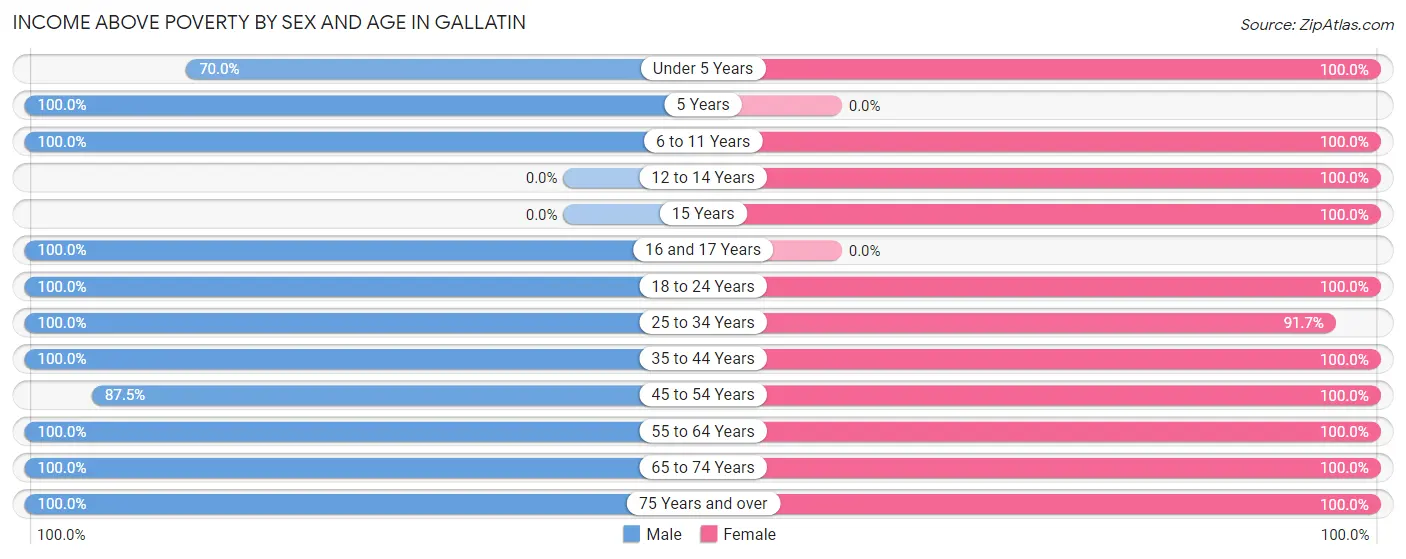
| Age Bracket | Male | Female |
| Under 5 Years | 7 (70.0%) | 30 (100.0%) |
| 5 Years | 9 (100.0%) | 0 (0.0%) |
| 6 to 11 Years | 16 (100.0%) | 2 (100.0%) |
| 12 to 14 Years | 0 (0.0%) | 4 (100.0%) |
| 15 Years | 0 (0.0%) | 9 (100.0%) |
| 16 and 17 Years | 3 (100.0%) | 0 (0.0%) |
| 18 to 24 Years | 27 (100.0%) | 17 (100.0%) |
| 25 to 34 Years | 41 (100.0%) | 33 (91.7%) |
| 35 to 44 Years | 19 (100.0%) | 18 (100.0%) |
| 45 to 54 Years | 21 (87.5%) | 5 (100.0%) |
| 55 to 64 Years | 14 (100.0%) | 28 (100.0%) |
| 65 to 74 Years | 13 (100.0%) | 11 (100.0%) |
| 75 Years and over | 9 (100.0%) | 13 (100.0%) |
| Total | 179 (96.8%) | 170 (98.3%) |
Income Below Poverty Among Married-Couple Families in Gallatin
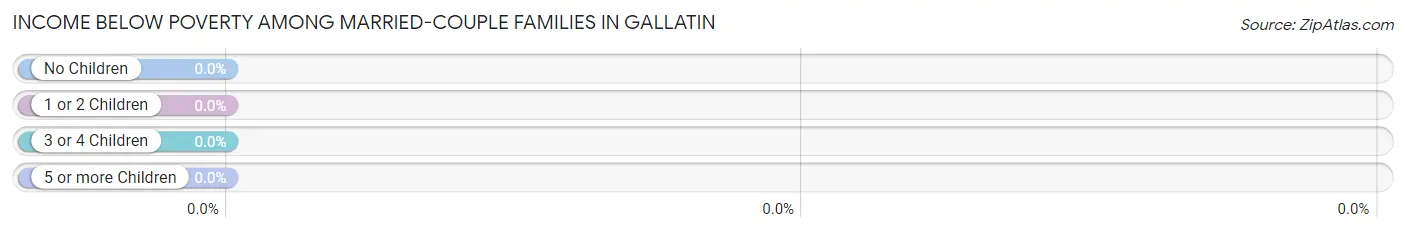
| Children | Above Poverty | Below Poverty |
| No Children | 51 (100.0%) | 0 (0.0%) |
| 1 or 2 Children | 29 (100.0%) | 0 (0.0%) |
| 3 or 4 Children | 15 (100.0%) | 0 (0.0%) |
| 5 or more Children | 0 (0.0%) | 0 (0.0%) |
| Total | 95 (100.0%) | 0 (0.0%) |
Income Below Poverty Among Single-Parent Households in Gallatin
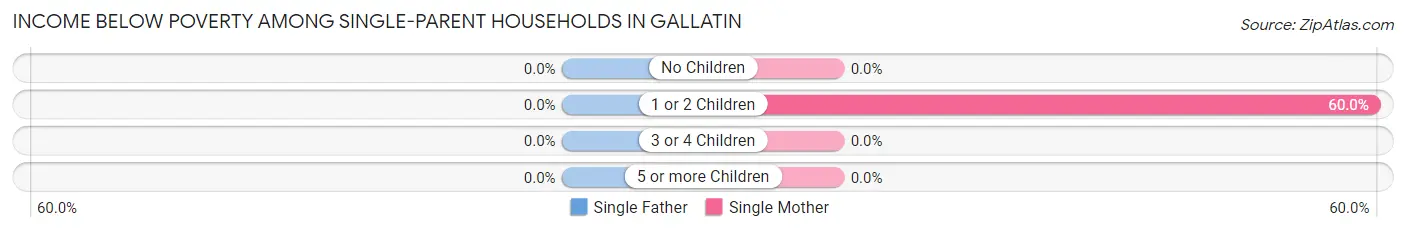
| Children | Single Father | Single Mother |
| No Children | 0 (0.0%) | 0 (0.0%) |
| 1 or 2 Children | 0 (0.0%) | 3 (60.0%) |
| 3 or 4 Children | 0 (0.0%) | 0 (0.0%) |
| 5 or more Children | 0 (0.0%) | 0 (0.0%) |
| Total | 0 (0.0%) | 3 (37.5%) |
Income Below Poverty Among Married-Couple vs Single-Parent Households in Gallatin
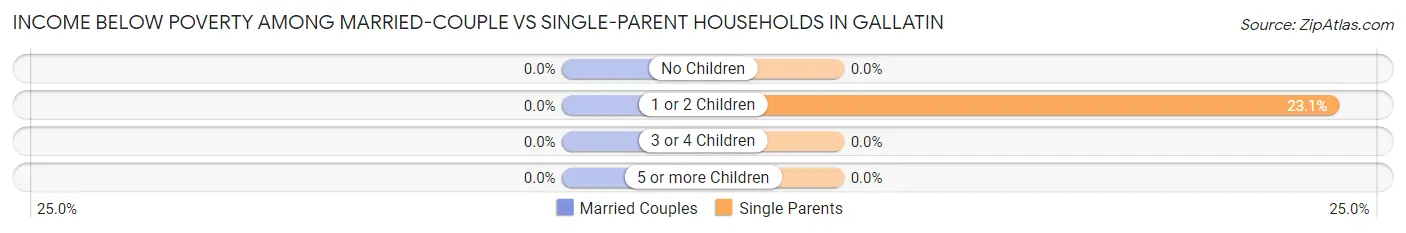
| Children | Married-Couple Families | Single-Parent Households |
| No Children | 0 (0.0%) | 0 (0.0%) |
| 1 or 2 Children | 0 (0.0%) | 3 (23.1%) |
| 3 or 4 Children | 0 (0.0%) | 0 (0.0%) |
| 5 or more Children | 0 (0.0%) | 0 (0.0%) |
| Total | 0 (0.0%) | 3 (13.6%) |
Race in Gallatin
The most populous races in Gallatin are White / Caucasian (220 | 61.5%), Two or more Races (108 | 30.2%), and Hispanic or Latino (102 | 28.5%).
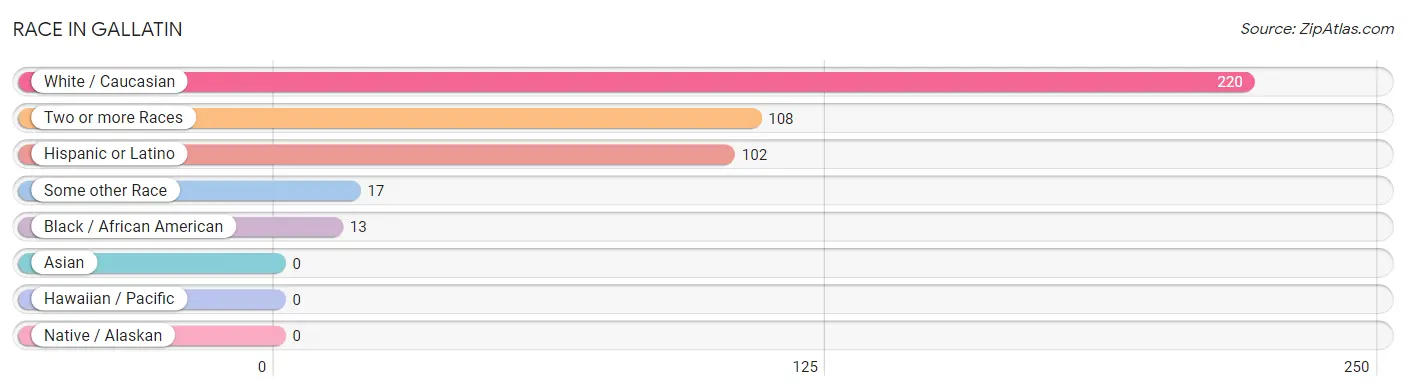
| Race | # Population | % Population |
| Asian | 0 | 0.0% |
| Black / African American | 13 | 3.6% |
| Hawaiian / Pacific | 0 | 0.0% |
| Hispanic or Latino | 102 | 28.5% |
| Native / Alaskan | 0 | 0.0% |
| White / Caucasian | 220 | 61.5% |
| Two or more Races | 108 | 30.2% |
| Some other Race | 17 | 4.8% |
| Total | 358 | 100.0% |
Ancestry in Gallatin
The most populous ancestries reported in Gallatin are American (90 | 25.1%), Mexican (76 | 21.2%), Central American (24 | 6.7%), Honduran (19 | 5.3%), and French (11 | 3.1%), together accounting for 61.4% of all Gallatin residents.
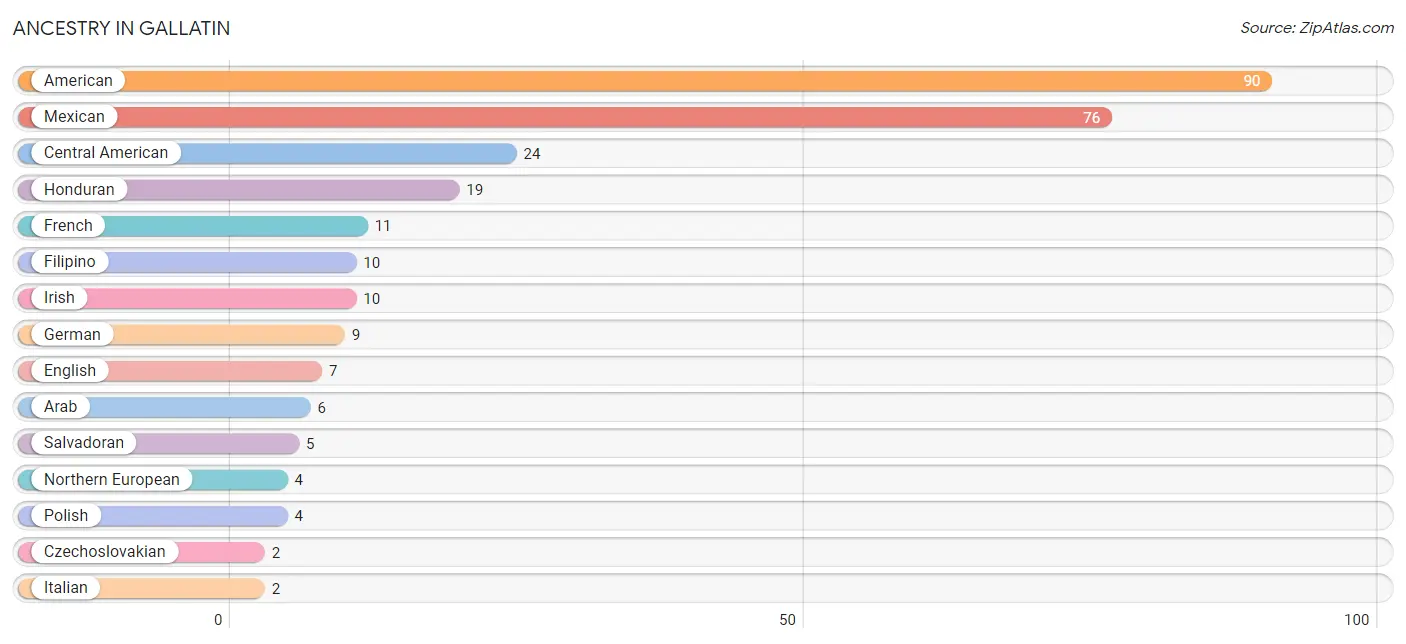
| Ancestry | # Population | % Population |
| American | 90 | 25.1% |
| Arab | 6 | 1.7% |
| Central American | 24 | 6.7% |
| Czechoslovakian | 2 | 0.6% |
| English | 7 | 2.0% |
| Filipino | 10 | 2.8% |
| French | 11 | 3.1% |
| German | 9 | 2.5% |
| Honduran | 19 | 5.3% |
| Irish | 10 | 2.8% |
| Italian | 2 | 0.6% |
| Mexican | 76 | 21.2% |
| Northern European | 4 | 1.1% |
| Norwegian | 2 | 0.6% |
| Polish | 4 | 1.1% |
| Salvadoran | 5 | 1.4% |
| Scotch-Irish | 2 | 0.6% | View All 17 Rows |
Immigrants in Gallatin
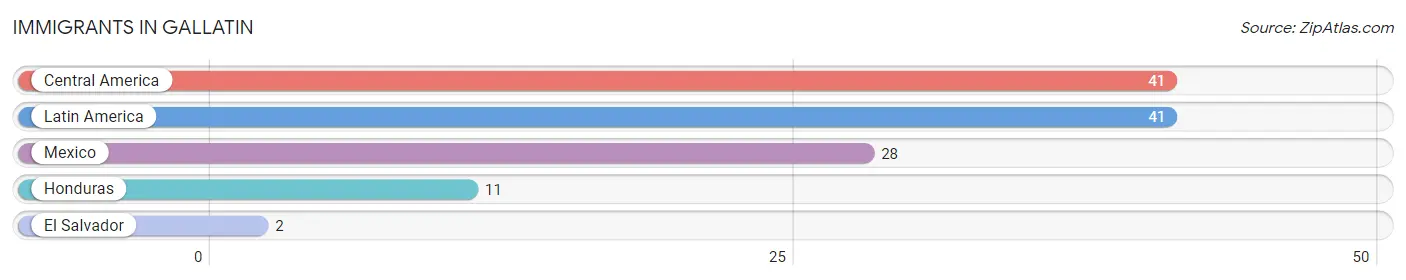
The most numerous immigrant groups reported in Gallatin came from Central America (41 | 11.5%), Latin America (41 | 11.5%), Mexico (28 | 7.8%), Honduras (11 | 3.1%), and El Salvador (2 | 0.6%), together accounting for 34.4% of all Gallatin residents.
| Immigration Origin | # Population | % Population |
| Central America | 41 | 11.5% |
| El Salvador | 2 | 0.6% |
| Honduras | 11 | 3.1% |
| Latin America | 41 | 11.5% |
| Mexico | 28 | 7.8% | View All 5 Rows |
Sex and Age in Gallatin
Sex and Age in Gallatin
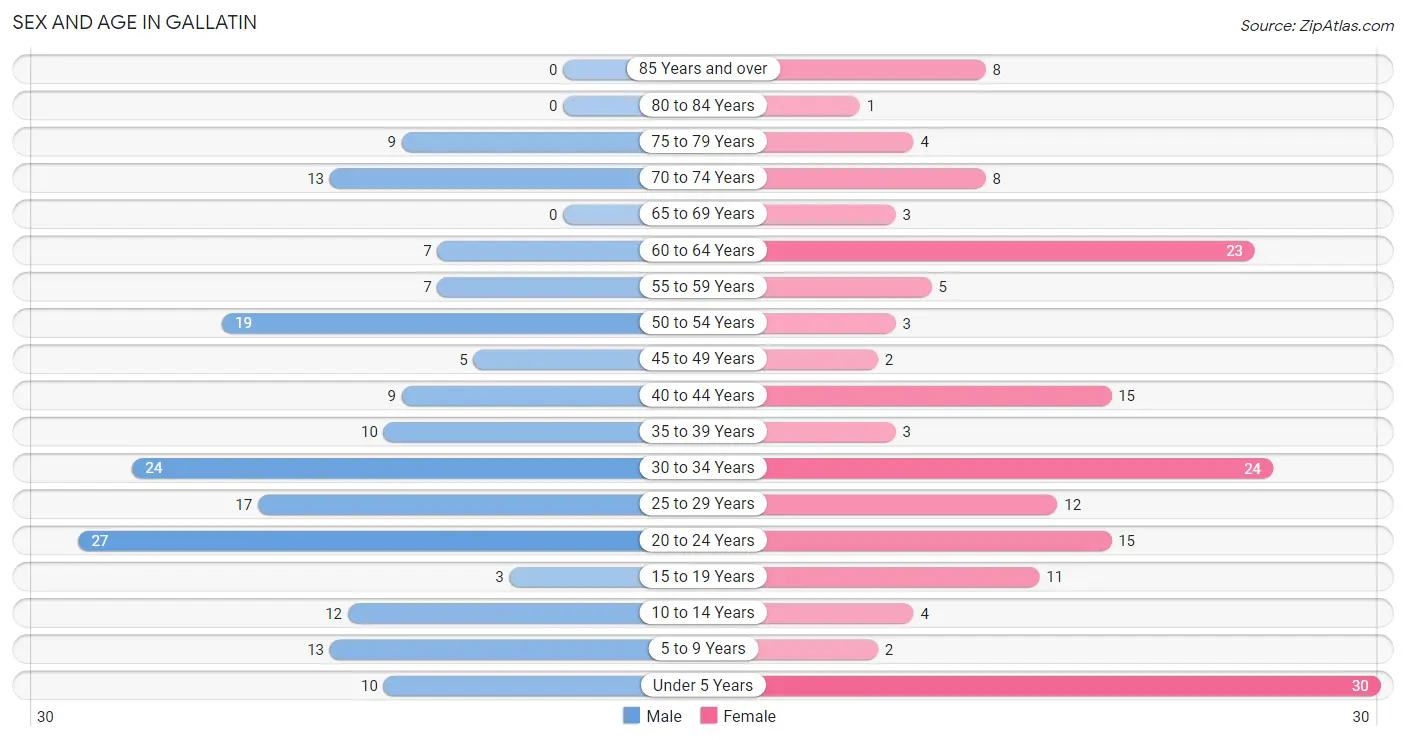
The most populous age groups in Gallatin are 20 to 24 Years (27 | 14.6%) for men and Under 5 Years (30 | 17.3%) for women.
| Age Bracket | Male | Female |
| Under 5 Years | 10 (5.4%) | 30 (17.3%) |
| 5 to 9 Years | 13 (7.0%) | 2 (1.2%) |
| 10 to 14 Years | 12 (6.5%) | 4 (2.3%) |
| 15 to 19 Years | 3 (1.6%) | 11 (6.4%) |
| 20 to 24 Years | 27 (14.6%) | 15 (8.7%) |
| 25 to 29 Years | 17 (9.2%) | 12 (6.9%) |
| 30 to 34 Years | 24 (13.0%) | 24 (13.9%) |
| 35 to 39 Years | 10 (5.4%) | 3 (1.7%) |
| 40 to 44 Years | 9 (4.9%) | 15 (8.7%) |
| 45 to 49 Years | 5 (2.7%) | 2 (1.2%) |
| 50 to 54 Years | 19 (10.3%) | 3 (1.7%) |
| 55 to 59 Years | 7 (3.8%) | 5 (2.9%) |
| 60 to 64 Years | 7 (3.8%) | 23 (13.3%) |
| 65 to 69 Years | 0 (0.0%) | 3 (1.7%) |
| 70 to 74 Years | 13 (7.0%) | 8 (4.6%) |
| 75 to 79 Years | 9 (4.9%) | 4 (2.3%) |
| 80 to 84 Years | 0 (0.0%) | 1 (0.6%) |
| 85 Years and over | 0 (0.0%) | 8 (4.6%) |
| Total | 185 (100.0%) | 173 (100.0%) |
Families and Households in Gallatin
Median Family Size in Gallatin
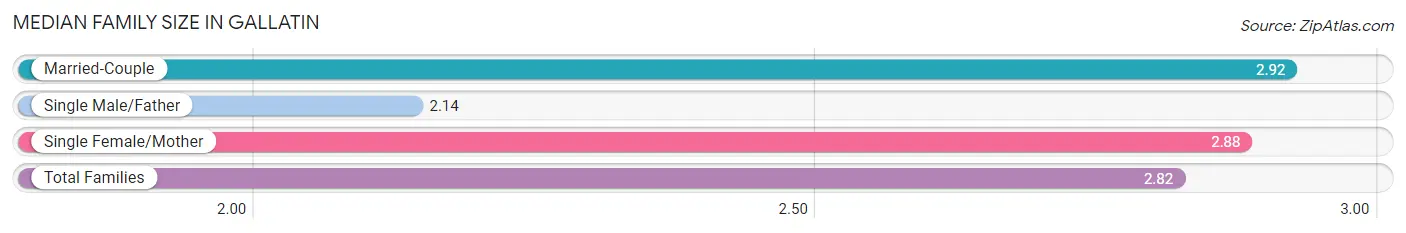
The median family size in Gallatin is 2.82 persons per family, with married-couple families (95 | 81.2%) accounting for the largest median family size of 2.92 persons per family. On the other hand, single male/father families (14 | 12.0%) represent the smallest median family size with 2.14 persons per family.
| Family Type | # Families | Family Size |
| Married-Couple | 95 (81.2%) | 2.92 |
| Single Male/Father | 14 (12.0%) | 2.14 |
| Single Female/Mother | 8 (6.8%) | 2.88 |
| Total Families | 117 (100.0%) | 2.82 |
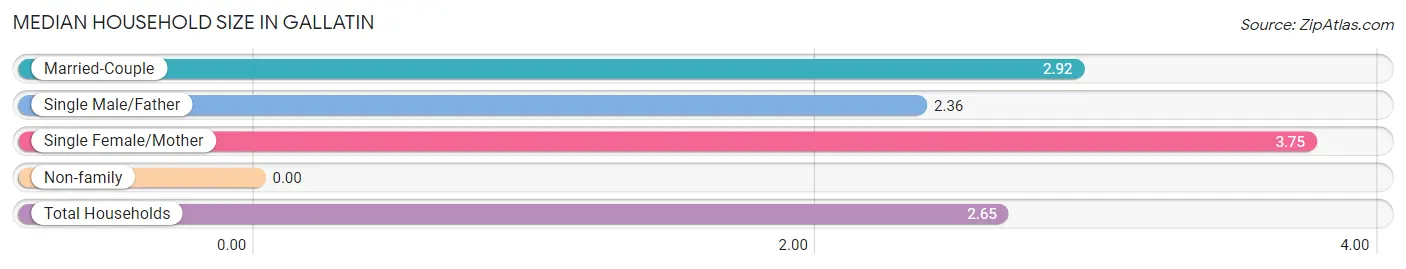
Median Household Size in Gallatin
| Household Type | # Households | Household Size |
| Married-Couple | 95 (70.4%) | 2.92 |
| Single Male/Father | 14 (10.4%) | 2.36 |
| Single Female/Mother | 8 (5.9%) | 3.75 |
| Non-family | 18 (13.3%) | - |
| Total Households | 135 (100.0%) | 2.65 |
Household Size by Marriage Status in Gallatin
Out of a total of 135 households in Gallatin, 117 (86.7%) are family households, while 18 (13.3%) are nonfamily households. The most numerous type of family households are 2-person households, comprising 43, and the most common type of nonfamily households are 1-person households, comprising 18.
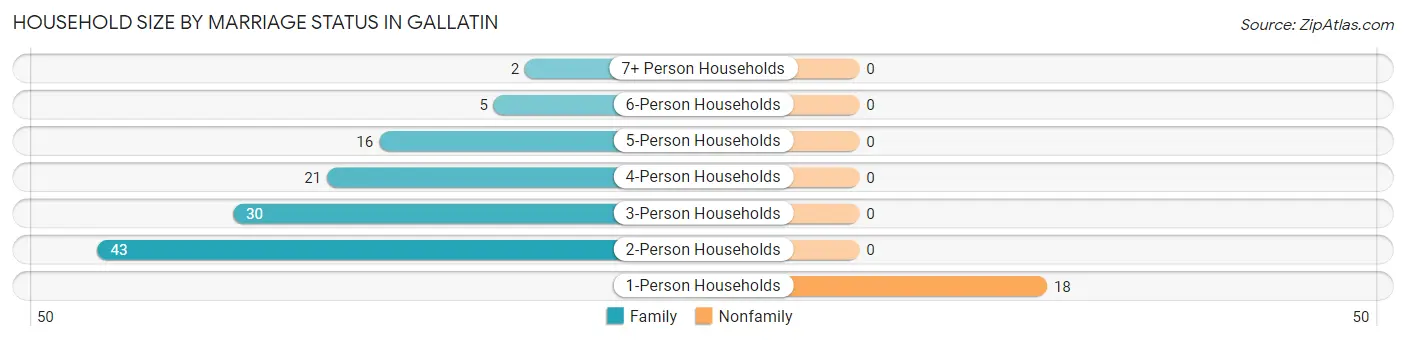
| Household Size | Family Households | Nonfamily Households |
| 1-Person Households | - | 18 (13.3%) |
| 2-Person Households | 43 (31.9%) | 0 (0.0%) |
| 3-Person Households | 30 (22.2%) | 0 (0.0%) |
| 4-Person Households | 21 (15.6%) | 0 (0.0%) |
| 5-Person Households | 16 (11.8%) | 0 (0.0%) |
| 6-Person Households | 5 (3.7%) | 0 (0.0%) |
| 7+ Person Households | 2 (1.5%) | 0 (0.0%) |
| Total | 117 (86.7%) | 18 (13.3%) |
Female Fertility in Gallatin
Fertility by Age in Gallatin
| Age Bracket | Women with Births | Births / 1,000 Women |
| 15 to 19 years | 0 (0.0%) | 0.0 |
| 20 to 34 years | 0 (0.0%) | 0.0 |
| 35 to 50 years | 0 (0.0%) | 0.0 |
| Total | 0 (0.0%) | 0.0 |
Fertility by Age by Marriage Status in Gallatin
| Age Bracket | Married | Unmarried |
| 15 to 19 years | 0 (0.0%) | 0 (0.0%) |
| 20 to 34 years | 0 (0.0%) | 0 (0.0%) |
| 35 to 50 years | 0 (0.0%) | 0 (0.0%) |
| Total | 0 (0.0%) | 0 (0.0%) |
Fertility by Education in Gallatin
| Educational Attainment | Women with Births | Births / 1,000 Women |
| Less than High School | 0 (0.0%) | 0.0 |
| High School Diploma | 0 (0.0%) | 0.0 |
| College or Associate's Degree | 0 (0.0%) | 0.0 |
| Bachelor's Degree | 0 (0.0%) | 0.0 |
| Graduate Degree | 0 (0.0%) | 0.0 |
| Total | 0 (0.0%) | 0.0 |
Fertility by Education by Marriage Status in Gallatin
| Educational Attainment | Married | Unmarried |
| Less than High School | 0 (0.0%) | 0 (0.0%) |
| High School Diploma | 0 (0.0%) | 0 (0.0%) |
| College or Associate's Degree | 0 (0.0%) | 0 (0.0%) |
| Bachelor's Degree | 0 (0.0%) | 0 (0.0%) |
| Graduate Degree | 0 (0.0%) | 0 (0.0%) |
| Total | 0 (0.0%) | 0 (0.0%) |
Employment Characteristics in Gallatin
Employment by Class of Employer in Gallatin
Among the 170 employed individuals in Gallatin, private company employees (121 | 71.2%), local government employees (23 | 13.5%), and state government employees (13 | 7.6%) make up the most common classes of employment.
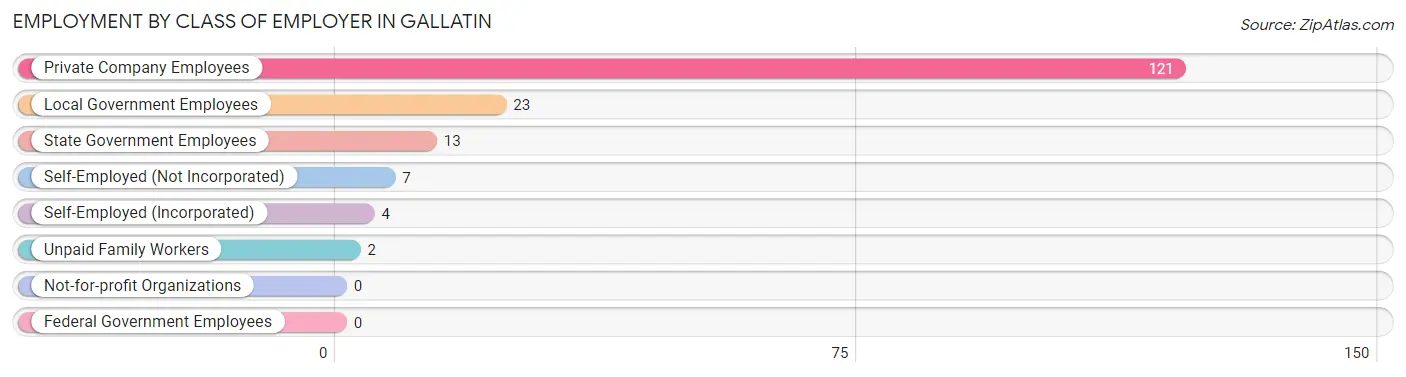
| Employer Class | # Employees | % Employees |
| Private Company Employees | 121 | 71.2% |
| Self-Employed (Incorporated) | 4 | 2.4% |
| Self-Employed (Not Incorporated) | 7 | 4.1% |
| Not-for-profit Organizations | 0 | 0.0% |
| Local Government Employees | 23 | 13.5% |
| State Government Employees | 13 | 7.6% |
| Federal Government Employees | 0 | 0.0% |
| Unpaid Family Workers | 2 | 1.2% |
| Total | 170 | 100.0% |
Employment Status by Age in Gallatin
According to the labor force statistics for Gallatin, out of the total population over 16 years of age (278), 65.8% or 183 individuals are in the labor force, with 7.1% or 13 of them unemployed. The age group with the highest labor force participation rate is 55 to 59 years, with 100.0% or 12 individuals in the labor force. Within the labor force, the 60 to 64 years age range has the highest percentage of unemployed individuals, with 60.0% or 9 of them being unemployed.
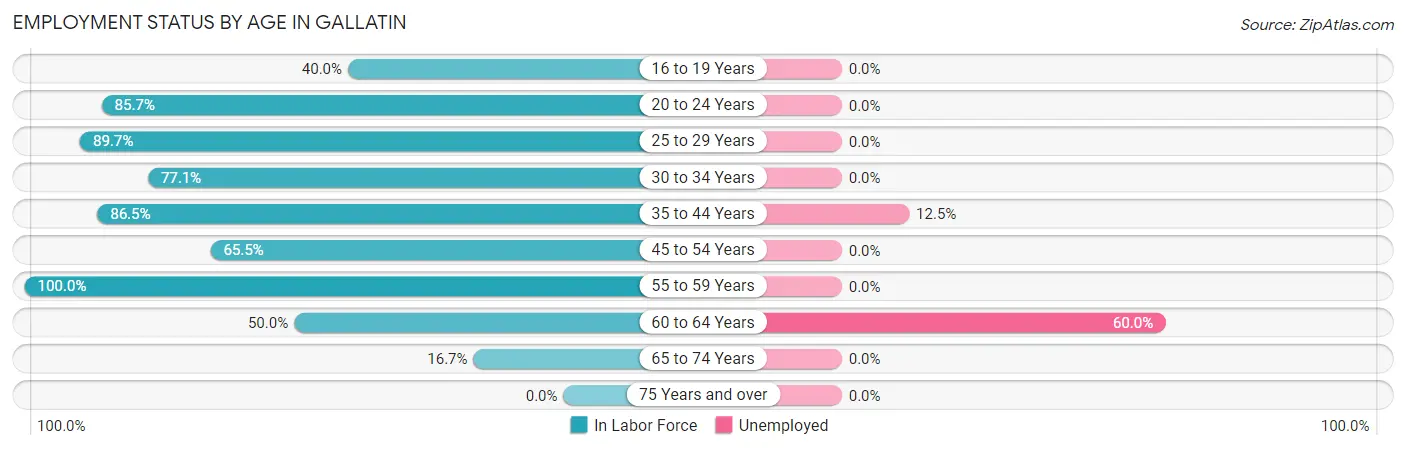
| Age Bracket | In Labor Force | Unemployed |
| 16 to 19 Years | 2 (40.0%) | 0 (0.0%) |
| 20 to 24 Years | 36 (85.7%) | 0 (0.0%) |
| 25 to 29 Years | 26 (89.7%) | 0 (0.0%) |
| 30 to 34 Years | 37 (77.1%) | 0 (0.0%) |
| 35 to 44 Years | 32 (86.5%) | 4 (12.5%) |
| 45 to 54 Years | 19 (65.5%) | 0 (0.0%) |
| 55 to 59 Years | 12 (100.0%) | 0 (0.0%) |
| 60 to 64 Years | 15 (50.0%) | 9 (60.0%) |
| 65 to 74 Years | 4 (16.7%) | 0 (0.0%) |
| 75 Years and over | 0 (0.0%) | 0 (0.0%) |
| Total | 183 (65.8%) | 13 (7.1%) |
Employment Status by Educational Attainment in Gallatin
According to labor force statistics for Gallatin, 76.2% of individuals (141) out of the total population between 25 and 64 years of age (185) are in the labor force, with 9.2% or 13 of them being unemployed. The group with the highest labor force participation rate are those with the educational attainment of bachelor's degree or higher, with 100.0% or 17 individuals in the labor force. Within the labor force, individuals with college / associate degree education have the highest percentage of unemployment, with 22.4% or 13 of them being unemployed.
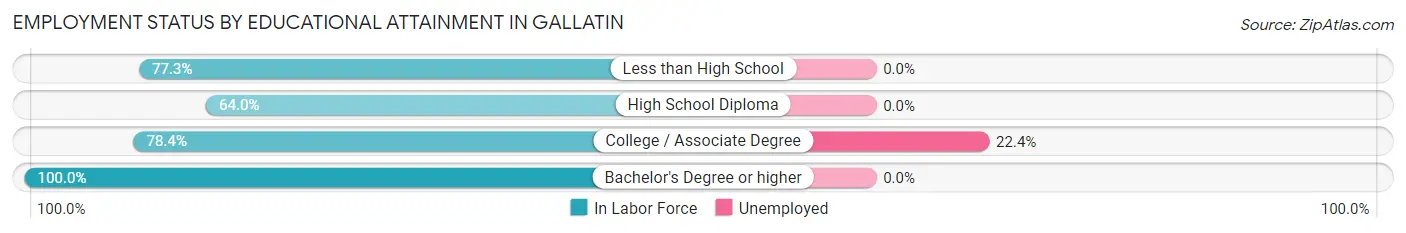
| Educational Attainment | In Labor Force | Unemployed |
| Less than High School | 34 (77.3%) | 0 (0.0%) |
| High School Diploma | 32 (64.0%) | 0 (0.0%) |
| College / Associate Degree | 58 (78.4%) | 17 (22.4%) |
| Bachelor's Degree or higher | 17 (100.0%) | 0 (0.0%) |
| Total | 141 (76.2%) | 17 (9.2%) |
Employment Occupations by Sex in Gallatin
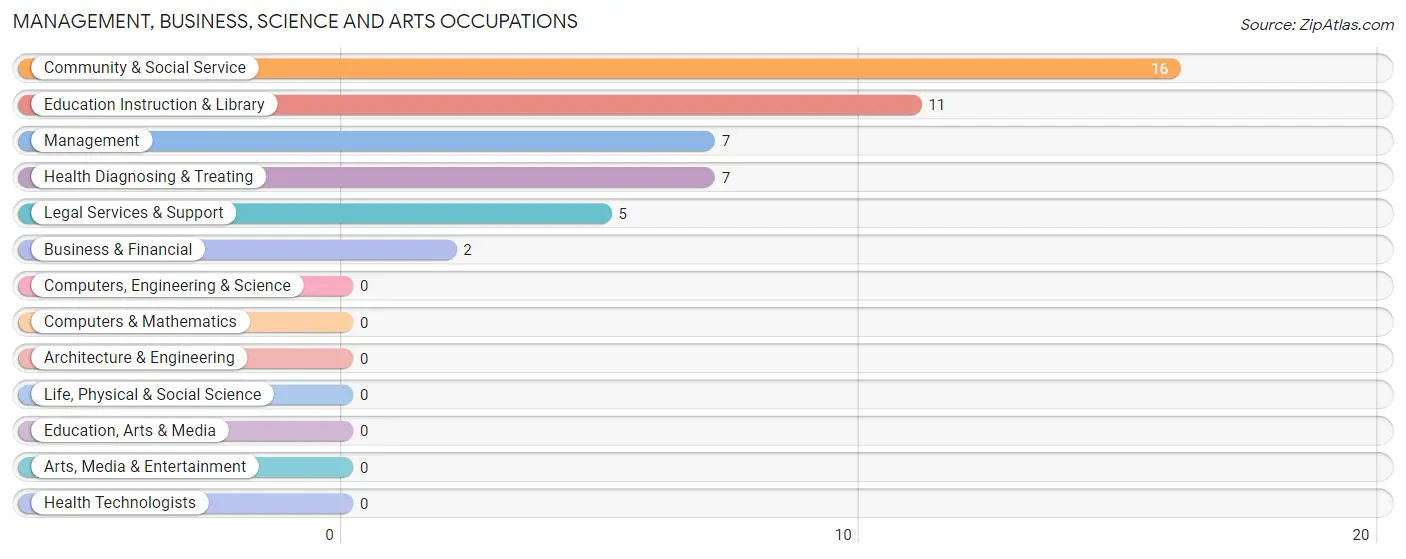
Management, Business, Science and Arts Occupations
The most common Management, Business, Science and Arts occupations in Gallatin are Community & Social Service (16 | 9.4%), Education Instruction & Library (11 | 6.5%), Management (7 | 4.1%), Health Diagnosing & Treating (7 | 4.1%), and Legal Services & Support (5 | 2.9%).
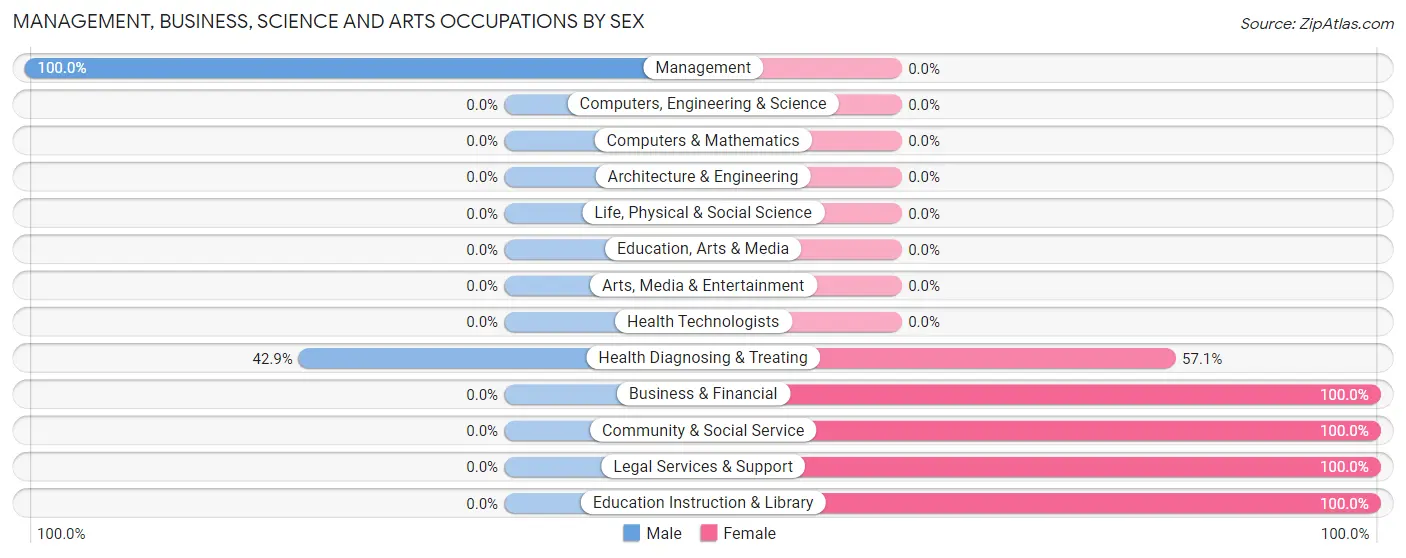
Management, Business, Science and Arts Occupations by Sex
Within the Management, Business, Science and Arts occupations in Gallatin, the most male-oriented occupations are Management (100.0%), and Health Diagnosing & Treating (42.9%), while the most female-oriented occupations are Business & Financial (100.0%), Community & Social Service (100.0%), and Legal Services & Support (100.0%).
| Occupation | Male | Female |
| Management | 7 (100.0%) | 0 (0.0%) |
| Business & Financial | 0 (0.0%) | 2 (100.0%) |
| Computers, Engineering & Science | 0 (0.0%) | 0 (0.0%) |
| Computers & Mathematics | 0 (0.0%) | 0 (0.0%) |
| Architecture & Engineering | 0 (0.0%) | 0 (0.0%) |
| Life, Physical & Social Science | 0 (0.0%) | 0 (0.0%) |
| Community & Social Service | 0 (0.0%) | 16 (100.0%) |
| Education, Arts & Media | 0 (0.0%) | 0 (0.0%) |
| Legal Services & Support | 0 (0.0%) | 5 (100.0%) |
| Education Instruction & Library | 0 (0.0%) | 11 (100.0%) |
| Arts, Media & Entertainment | 0 (0.0%) | 0 (0.0%) |
| Health Diagnosing & Treating | 3 (42.9%) | 4 (57.1%) |
| Health Technologists | 0 (0.0%) | 0 (0.0%) |
| Total (Category) | 10 (31.2%) | 22 (68.8%) |
| Total (Overall) | 106 (62.4%) | 64 (37.7%) |
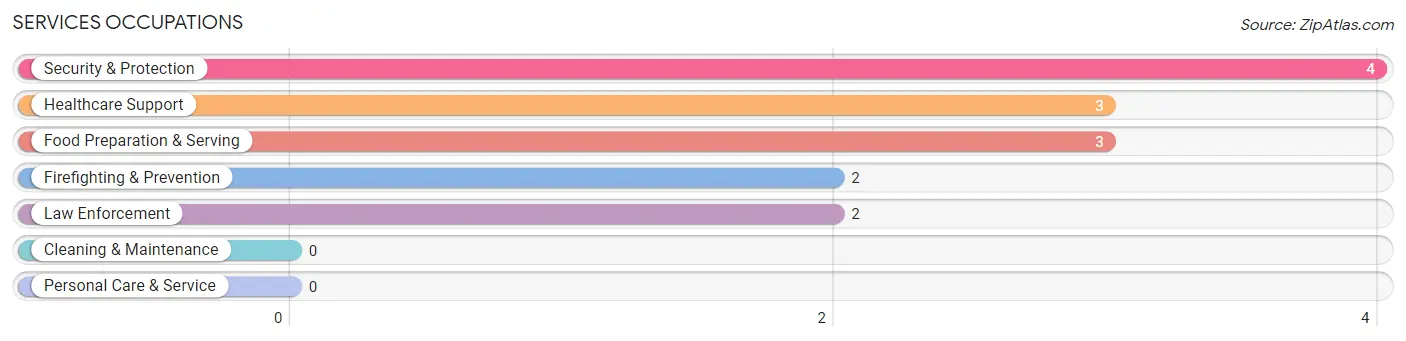
Services Occupations
The most common Services occupations in Gallatin are Security & Protection (4 | 2.4%), Healthcare Support (3 | 1.8%), Food Preparation & Serving (3 | 1.8%), Firefighting & Prevention (2 | 1.2%), and Law Enforcement (2 | 1.2%).
Services Occupations by Sex
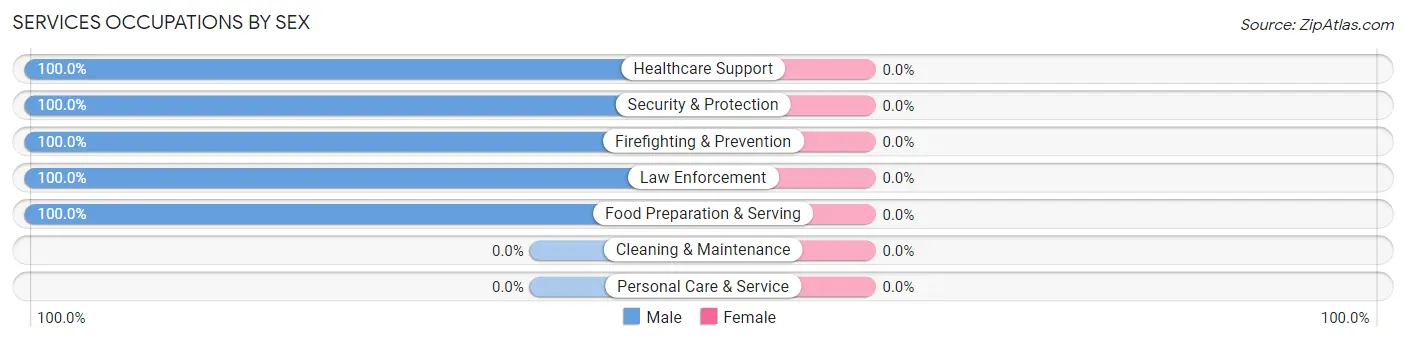
| Occupation | Male | Female |
| Healthcare Support | 3 (100.0%) | 0 (0.0%) |
| Security & Protection | 4 (100.0%) | 0 (0.0%) |
| Firefighting & Prevention | 2 (100.0%) | 0 (0.0%) |
| Law Enforcement | 2 (100.0%) | 0 (0.0%) |
| Food Preparation & Serving | 3 (100.0%) | 0 (0.0%) |
| Cleaning & Maintenance | 0 (0.0%) | 0 (0.0%) |
| Personal Care & Service | 0 (0.0%) | 0 (0.0%) |
| Total (Category) | 10 (100.0%) | 0 (0.0%) |
| Total (Overall) | 106 (62.4%) | 64 (37.7%) |
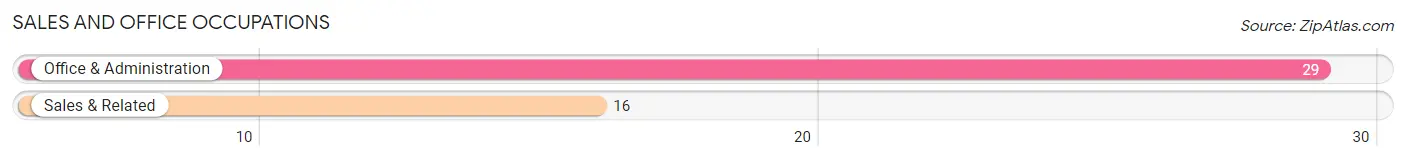
Sales and Office Occupations
The most common Sales and Office occupations in Gallatin are Office & Administration (29 | 17.1%), and Sales & Related (16 | 9.4%).
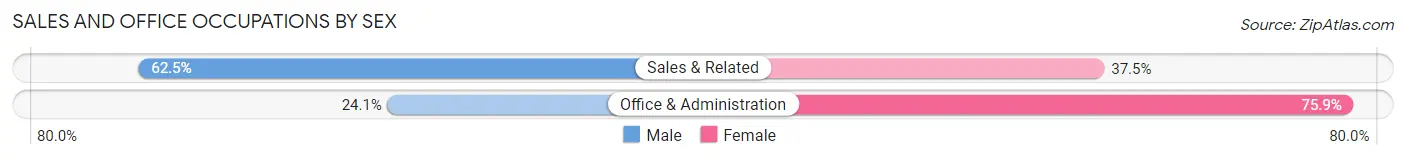
Sales and Office Occupations by Sex
| Occupation | Male | Female |
| Sales & Related | 10 (62.5%) | 6 (37.5%) |
| Office & Administration | 7 (24.1%) | 22 (75.9%) |
| Total (Category) | 17 (37.8%) | 28 (62.2%) |
| Total (Overall) | 106 (62.4%) | 64 (37.7%) |
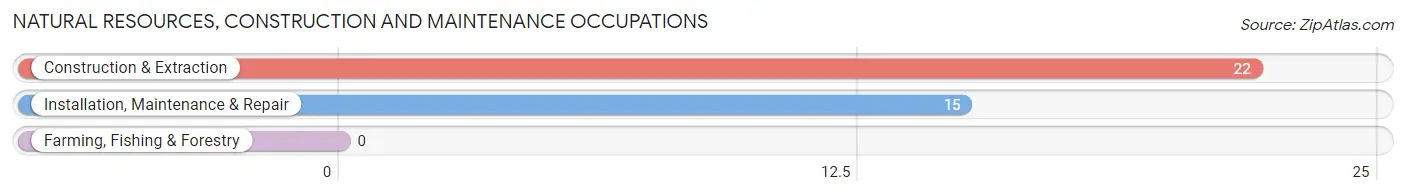
Natural Resources, Construction and Maintenance Occupations
The most common Natural Resources, Construction and Maintenance occupations in Gallatin are Construction & Extraction (22 | 12.9%), and Installation, Maintenance & Repair (15 | 8.8%).
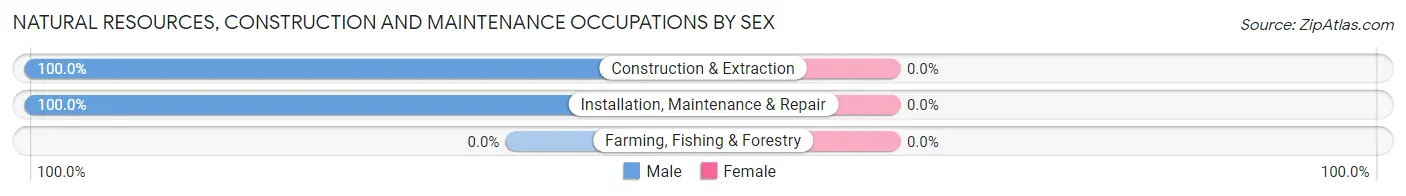
Natural Resources, Construction and Maintenance Occupations by Sex
| Occupation | Male | Female |
| Farming, Fishing & Forestry | 0 (0.0%) | 0 (0.0%) |
| Construction & Extraction | 22 (100.0%) | 0 (0.0%) |
| Installation, Maintenance & Repair | 15 (100.0%) | 0 (0.0%) |
| Total (Category) | 37 (100.0%) | 0 (0.0%) |
| Total (Overall) | 106 (62.4%) | 64 (37.7%) |
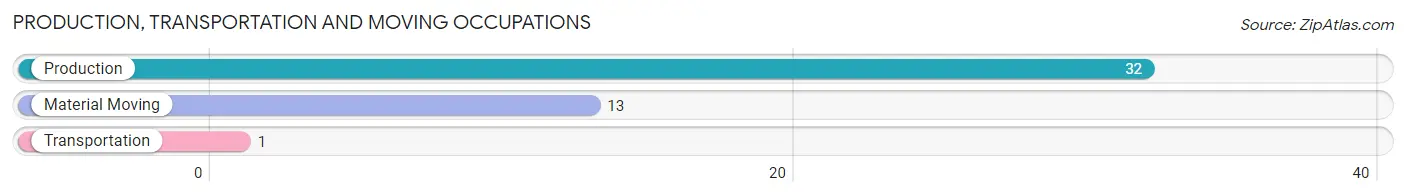
Production, Transportation and Moving Occupations
The most common Production, Transportation and Moving occupations in Gallatin are Production (32 | 18.8%), Material Moving (13 | 7.6%), and Transportation (1 | 0.6%).
Production, Transportation and Moving Occupations by Sex
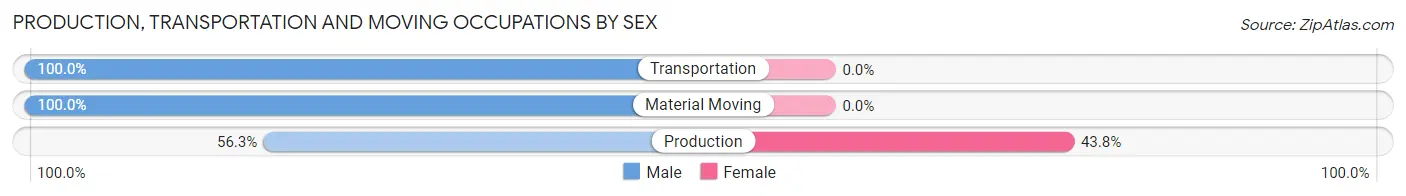
| Occupation | Male | Female |
| Production | 18 (56.2%) | 14 (43.8%) |
| Transportation | 1 (100.0%) | 0 (0.0%) |
| Material Moving | 13 (100.0%) | 0 (0.0%) |
| Total (Category) | 32 (69.6%) | 14 (30.4%) |
| Total (Overall) | 106 (62.4%) | 64 (37.7%) |
Employment Industries by Sex in Gallatin
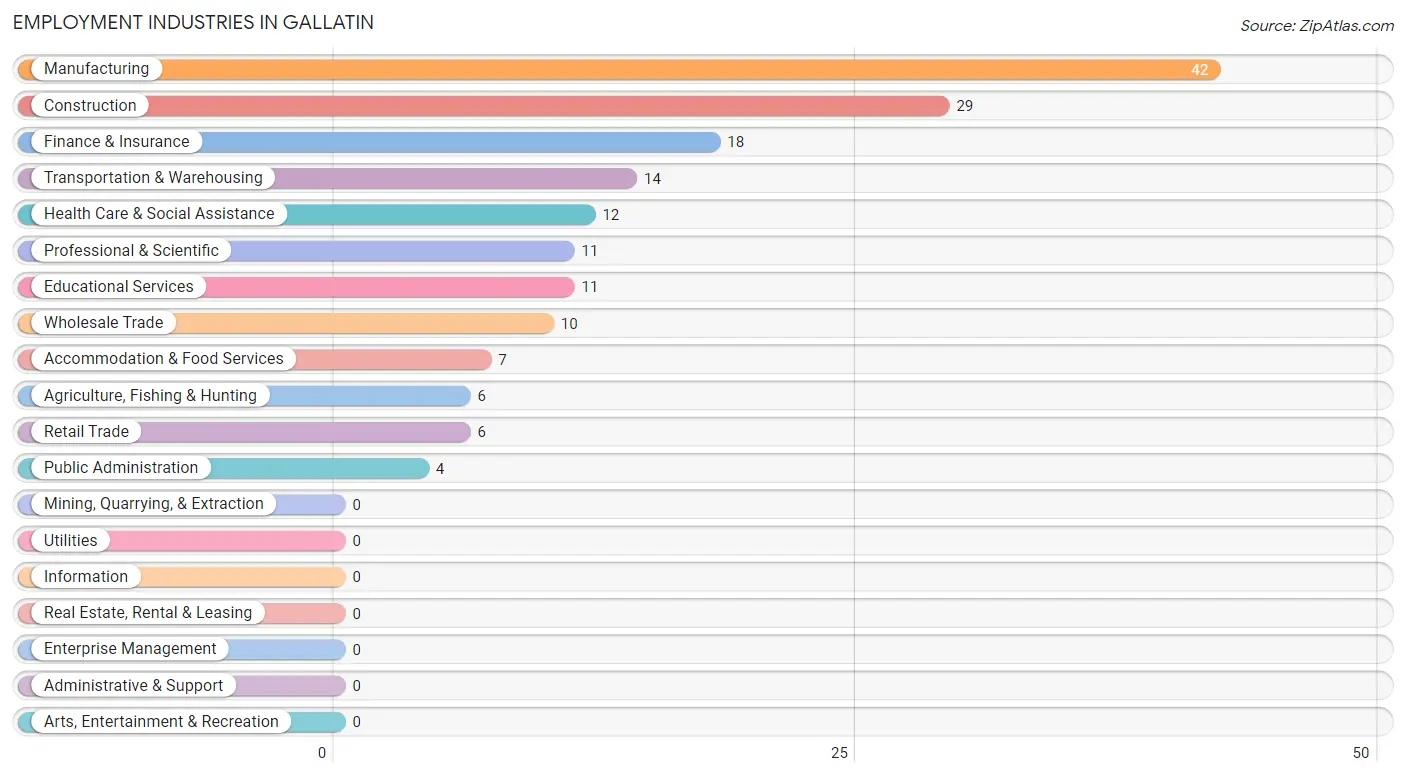
Employment Industries in Gallatin
The major employment industries in Gallatin include Manufacturing (42 | 24.7%), Construction (29 | 17.1%), Finance & Insurance (18 | 10.6%), Transportation & Warehousing (14 | 8.2%), and Health Care & Social Assistance (12 | 7.1%).
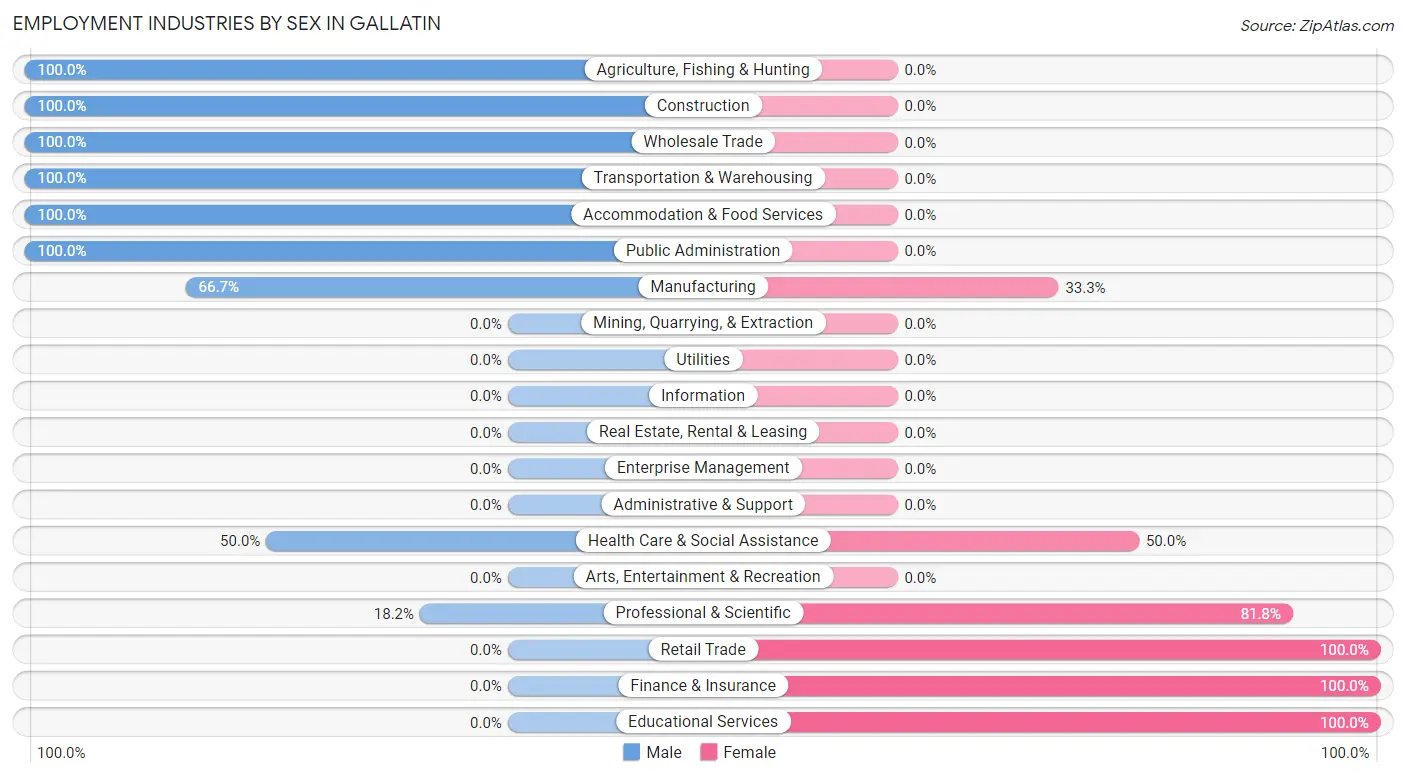
Employment Industries by Sex in Gallatin
The Gallatin industries that see more men than women are Agriculture, Fishing & Hunting (100.0%), Construction (100.0%), and Wholesale Trade (100.0%), whereas the industries that tend to have a higher number of women are Retail Trade (100.0%), Finance & Insurance (100.0%), and Educational Services (100.0%).
| Industry | Male | Female |
| Agriculture, Fishing & Hunting | 6 (100.0%) | 0 (0.0%) |
| Mining, Quarrying, & Extraction | 0 (0.0%) | 0 (0.0%) |
| Construction | 29 (100.0%) | 0 (0.0%) |
| Manufacturing | 28 (66.7%) | 14 (33.3%) |
| Wholesale Trade | 10 (100.0%) | 0 (0.0%) |
| Retail Trade | 0 (0.0%) | 6 (100.0%) |
| Transportation & Warehousing | 14 (100.0%) | 0 (0.0%) |
| Utilities | 0 (0.0%) | 0 (0.0%) |
| Information | 0 (0.0%) | 0 (0.0%) |
| Finance & Insurance | 0 (0.0%) | 18 (100.0%) |
| Real Estate, Rental & Leasing | 0 (0.0%) | 0 (0.0%) |
| Professional & Scientific | 2 (18.2%) | 9 (81.8%) |
| Enterprise Management | 0 (0.0%) | 0 (0.0%) |
| Administrative & Support | 0 (0.0%) | 0 (0.0%) |
| Educational Services | 0 (0.0%) | 11 (100.0%) |
| Health Care & Social Assistance | 6 (50.0%) | 6 (50.0%) |
| Arts, Entertainment & Recreation | 0 (0.0%) | 0 (0.0%) |
| Accommodation & Food Services | 7 (100.0%) | 0 (0.0%) |
| Public Administration | 4 (100.0%) | 0 (0.0%) |
| Total | 106 (62.4%) | 64 (37.7%) |
Education in Gallatin
School Enrollment in Gallatin
The most common levels of schooling among the 45 students in Gallatin are elementary school (16 | 35.6%), high school (14 | 31.1%), and nursery / preschool (6 | 13.3%).
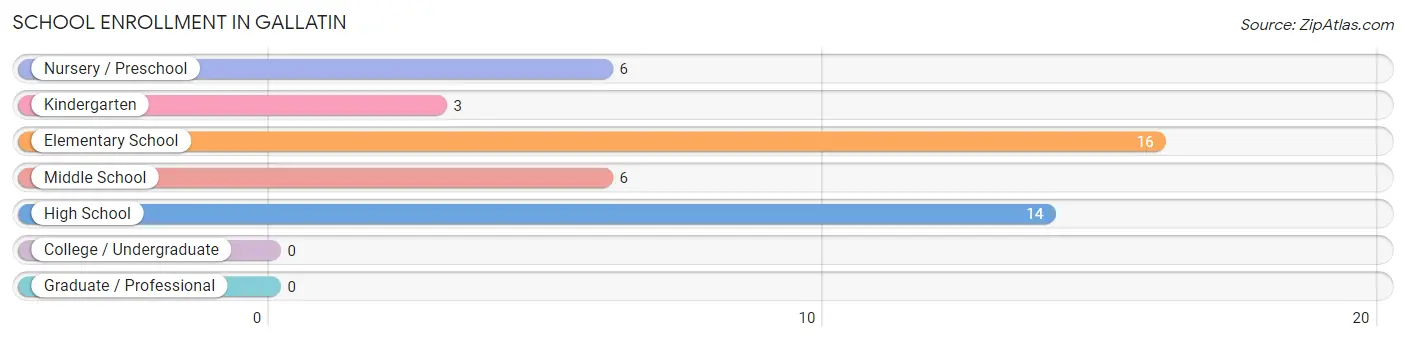
| School Level | # Students | % Students |
| Nursery / Preschool | 6 | 13.3% |
| Kindergarten | 3 | 6.7% |
| Elementary School | 16 | 35.6% |
| Middle School | 6 | 13.3% |
| High School | 14 | 31.1% |
| College / Undergraduate | 0 | 0.0% |
| Graduate / Professional | 0 | 0.0% |
| Total | 45 | 100.0% |
School Enrollment by Age by Funding Source in Gallatin
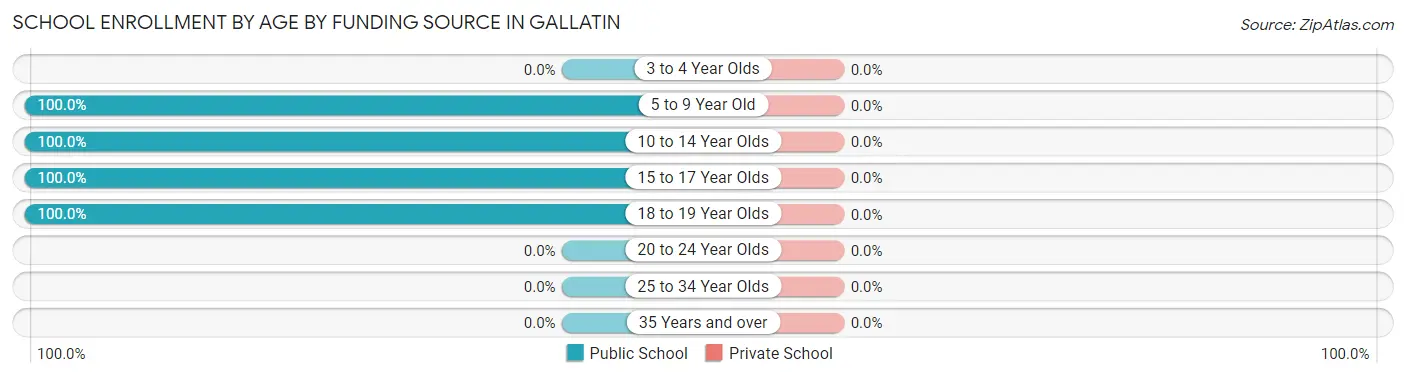
| Age Bracket | Public School | Private School |
| 3 to 4 Year Olds | 0 (0.0%) | 0 (0.0%) |
| 5 to 9 Year Old | 15 (100.0%) | 0 (0.0%) |
| 10 to 14 Year Olds | 16 (100.0%) | 0 (0.0%) |
| 15 to 17 Year Olds | 12 (100.0%) | 0 (0.0%) |
| 18 to 19 Year Olds | 2 (100.0%) | 0 (0.0%) |
| 20 to 24 Year Olds | 0 (0.0%) | 0 (0.0%) |
| 25 to 34 Year Olds | 0 (0.0%) | 0 (0.0%) |
| 35 Years and over | 0 (0.0%) | 0 (0.0%) |
| Total | 45 (100.0%) | 0 (0.0%) |
Educational Attainment by Field of Study in Gallatin
Education (9 | 37.5%), computers & mathematics (6 | 25.0%), business (6 | 25.0%), social sciences (2 | 8.3%), and arts & humanities (1 | 4.2%) are the most common fields of study among 24 individuals in Gallatin who have obtained a bachelor's degree or higher.
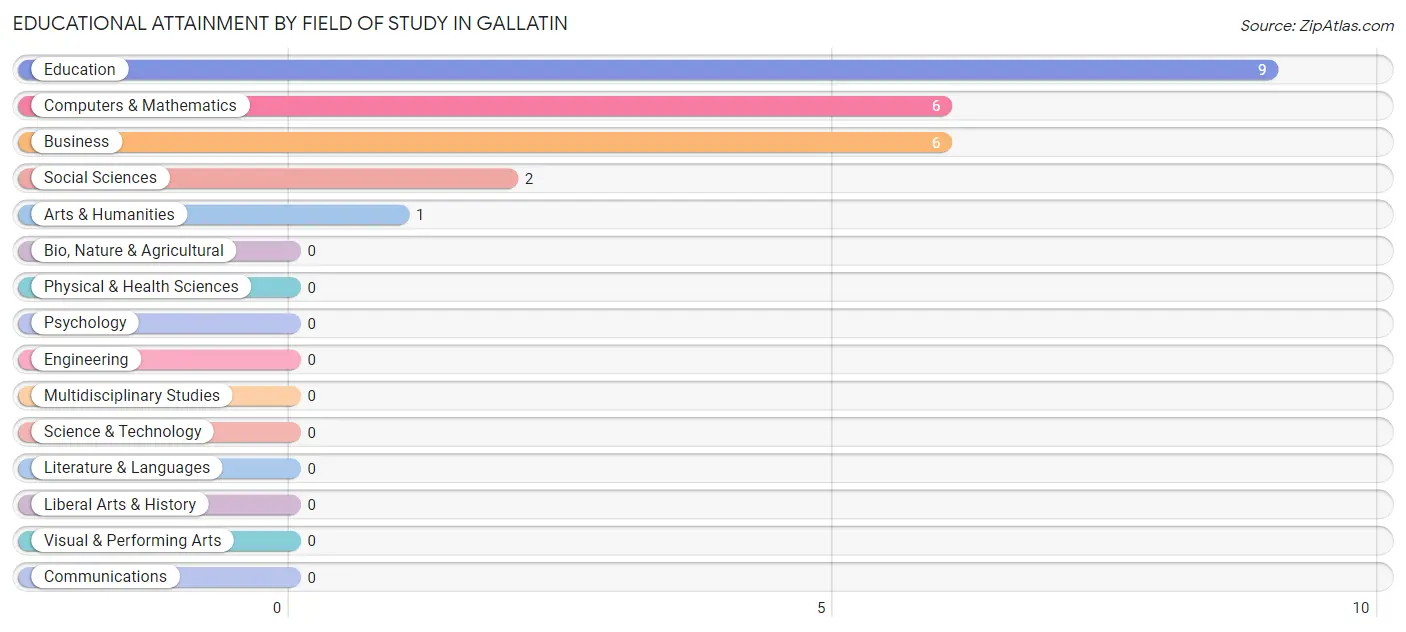
| Field of Study | # Graduates | % Graduates |
| Computers & Mathematics | 6 | 25.0% |
| Bio, Nature & Agricultural | 0 | 0.0% |
| Physical & Health Sciences | 0 | 0.0% |
| Psychology | 0 | 0.0% |
| Social Sciences | 2 | 8.3% |
| Engineering | 0 | 0.0% |
| Multidisciplinary Studies | 0 | 0.0% |
| Science & Technology | 0 | 0.0% |
| Business | 6 | 25.0% |
| Education | 9 | 37.5% |
| Literature & Languages | 0 | 0.0% |
| Liberal Arts & History | 0 | 0.0% |
| Visual & Performing Arts | 0 | 0.0% |
| Communications | 0 | 0.0% |
| Arts & Humanities | 1 | 4.2% |
| Total | 24 | 100.0% |
Transportation & Commute in Gallatin
Vehicle Availability by Sex in Gallatin
The most prevalent vehicle ownership categories in Gallatin are males with 2 vehicles (47, accounting for 44.3%) and females with 2 vehicles (31, making up 73.4%).
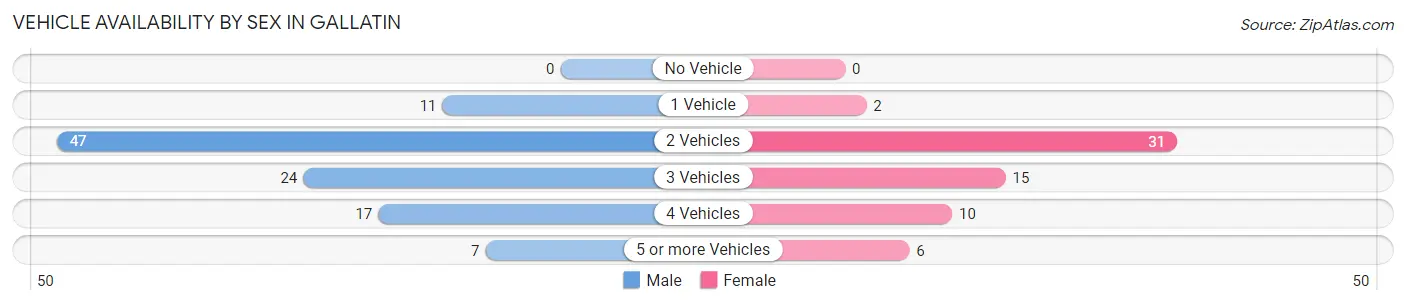
| Vehicles Available | Male | Female |
| No Vehicle | 0 (0.0%) | 0 (0.0%) |
| 1 Vehicle | 11 (10.4%) | 2 (3.1%) |
| 2 Vehicles | 47 (44.3%) | 31 (48.4%) |
| 3 Vehicles | 24 (22.6%) | 15 (23.4%) |
| 4 Vehicles | 17 (16.0%) | 10 (15.6%) |
| 5 or more Vehicles | 7 (6.6%) | 6 (9.4%) |
| Total | 106 (100.0%) | 64 (100.0%) |
Commute Time in Gallatin
The most frequently occuring commute durations in Gallatin are 15 to 19 minutes (61 commuters, 41.2%), 10 to 14 minutes (33 commuters, 22.3%), and 20 to 24 minutes (23 commuters, 15.5%).
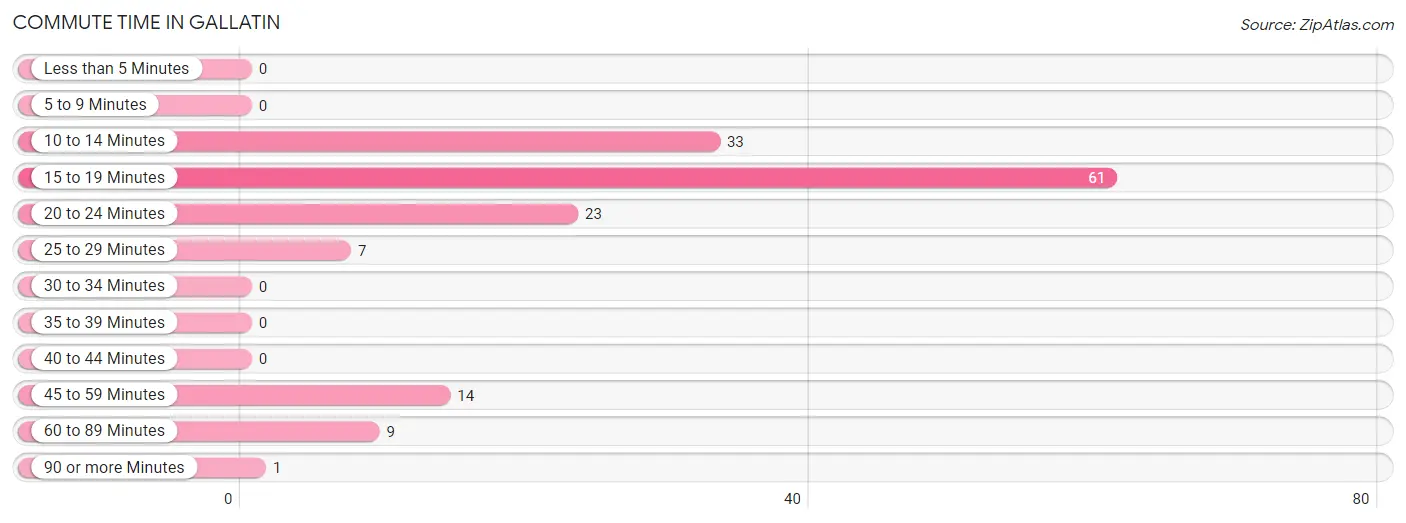
| Commute Time | # Commuters | % Commuters |
| Less than 5 Minutes | 0 | 0.0% |
| 5 to 9 Minutes | 0 | 0.0% |
| 10 to 14 Minutes | 33 | 22.3% |
| 15 to 19 Minutes | 61 | 41.2% |
| 20 to 24 Minutes | 23 | 15.5% |
| 25 to 29 Minutes | 7 | 4.7% |
| 30 to 34 Minutes | 0 | 0.0% |
| 35 to 39 Minutes | 0 | 0.0% |
| 40 to 44 Minutes | 0 | 0.0% |
| 45 to 59 Minutes | 14 | 9.5% |
| 60 to 89 Minutes | 9 | 6.1% |
| 90 or more Minutes | 1 | 0.7% |
Commute Time by Sex in Gallatin
The most common commute times in Gallatin are 15 to 19 minutes (35 commuters, 40.7%) for males and 15 to 19 minutes (26 commuters, 41.9%) for females.
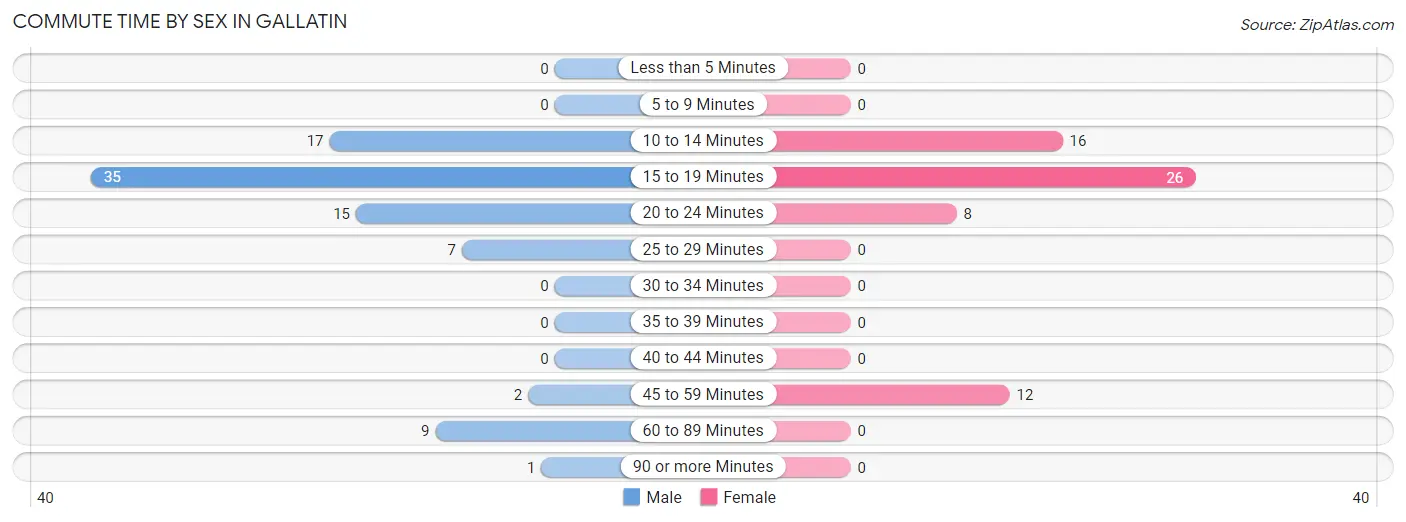
| Commute Time | Male | Female |
| Less than 5 Minutes | 0 (0.0%) | 0 (0.0%) |
| 5 to 9 Minutes | 0 (0.0%) | 0 (0.0%) |
| 10 to 14 Minutes | 17 (19.8%) | 16 (25.8%) |
| 15 to 19 Minutes | 35 (40.7%) | 26 (41.9%) |
| 20 to 24 Minutes | 15 (17.4%) | 8 (12.9%) |
| 25 to 29 Minutes | 7 (8.1%) | 0 (0.0%) |
| 30 to 34 Minutes | 0 (0.0%) | 0 (0.0%) |
| 35 to 39 Minutes | 0 (0.0%) | 0 (0.0%) |
| 40 to 44 Minutes | 0 (0.0%) | 0 (0.0%) |
| 45 to 59 Minutes | 2 (2.3%) | 12 (19.4%) |
| 60 to 89 Minutes | 9 (10.5%) | 0 (0.0%) |
| 90 or more Minutes | 1 (1.2%) | 0 (0.0%) |
Time of Departure to Work by Sex in Gallatin
The most frequent times of departure to work in Gallatin are 6:00 AM to 6:29 AM (30, 34.9%) for males and 7:00 AM to 7:29 AM (31, 50.0%) for females.
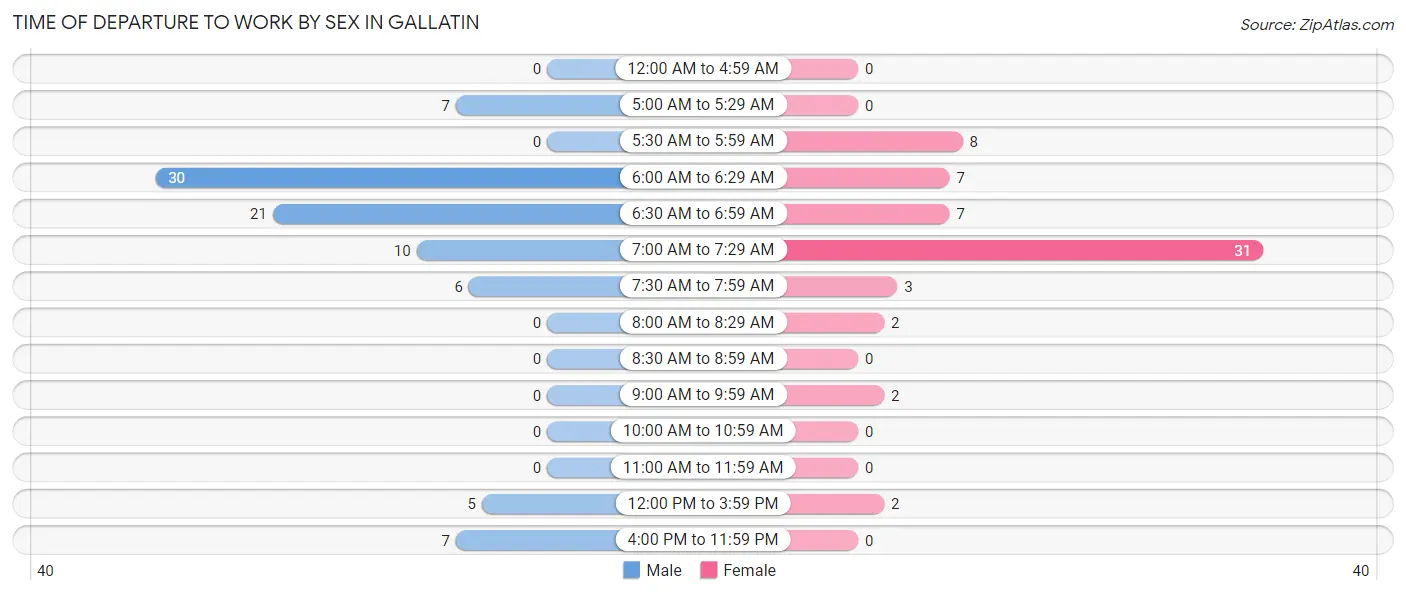
| Time of Departure | Male | Female |
| 12:00 AM to 4:59 AM | 0 (0.0%) | 0 (0.0%) |
| 5:00 AM to 5:29 AM | 7 (8.1%) | 0 (0.0%) |
| 5:30 AM to 5:59 AM | 0 (0.0%) | 8 (12.9%) |
| 6:00 AM to 6:29 AM | 30 (34.9%) | 7 (11.3%) |
| 6:30 AM to 6:59 AM | 21 (24.4%) | 7 (11.3%) |
| 7:00 AM to 7:29 AM | 10 (11.6%) | 31 (50.0%) |
| 7:30 AM to 7:59 AM | 6 (7.0%) | 3 (4.8%) |
| 8:00 AM to 8:29 AM | 0 (0.0%) | 2 (3.2%) |
| 8:30 AM to 8:59 AM | 0 (0.0%) | 0 (0.0%) |
| 9:00 AM to 9:59 AM | 0 (0.0%) | 2 (3.2%) |
| 10:00 AM to 10:59 AM | 0 (0.0%) | 0 (0.0%) |
| 11:00 AM to 11:59 AM | 0 (0.0%) | 0 (0.0%) |
| 12:00 PM to 3:59 PM | 5 (5.8%) | 2 (3.2%) |
| 4:00 PM to 11:59 PM | 7 (8.1%) | 0 (0.0%) |
| Total | 86 (100.0%) | 62 (100.0%) |
Housing Occupancy in Gallatin
Occupancy by Ownership in Gallatin
Of the total 135 dwellings in Gallatin, owner-occupied units account for 99 (73.3%), while renter-occupied units make up 36 (26.7%).
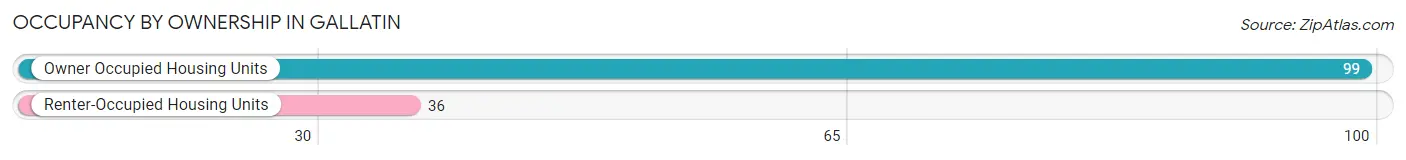
| Occupancy | # Housing Units | % Housing Units |
| Owner Occupied Housing Units | 99 | 73.3% |
| Renter-Occupied Housing Units | 36 | 26.7% |
| Total Occupied Housing Units | 135 | 100.0% |
Occupancy by Household Size in Gallatin
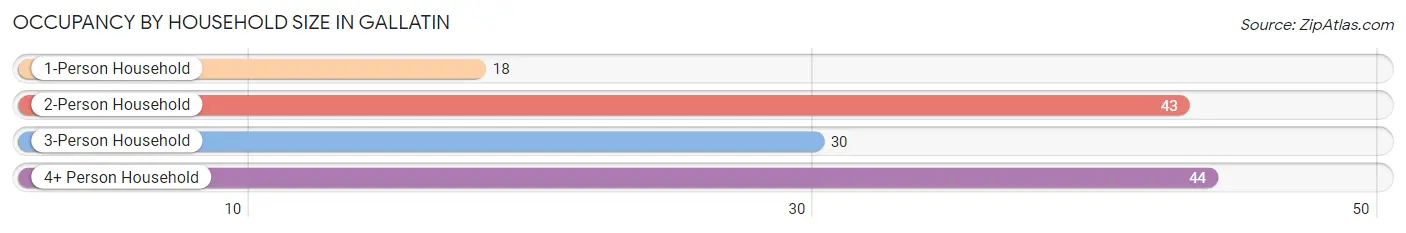
| Household Size | # Housing Units | % Housing Units |
| 1-Person Household | 18 | 13.3% |
| 2-Person Household | 43 | 31.9% |
| 3-Person Household | 30 | 22.2% |
| 4+ Person Household | 44 | 32.6% |
| Total Housing Units | 135 | 100.0% |
Occupancy by Ownership by Household Size in Gallatin
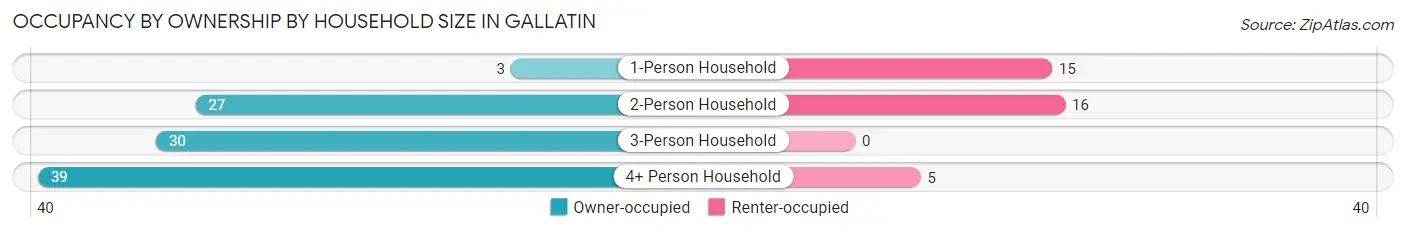
| Household Size | Owner-occupied | Renter-occupied |
| 1-Person Household | 3 (16.7%) | 15 (83.3%) |
| 2-Person Household | 27 (62.8%) | 16 (37.2%) |
| 3-Person Household | 30 (100.0%) | 0 (0.0%) |
| 4+ Person Household | 39 (88.6%) | 5 (11.4%) |
| Total Housing Units | 99 (73.3%) | 36 (26.7%) |
Occupancy by Educational Attainment in Gallatin
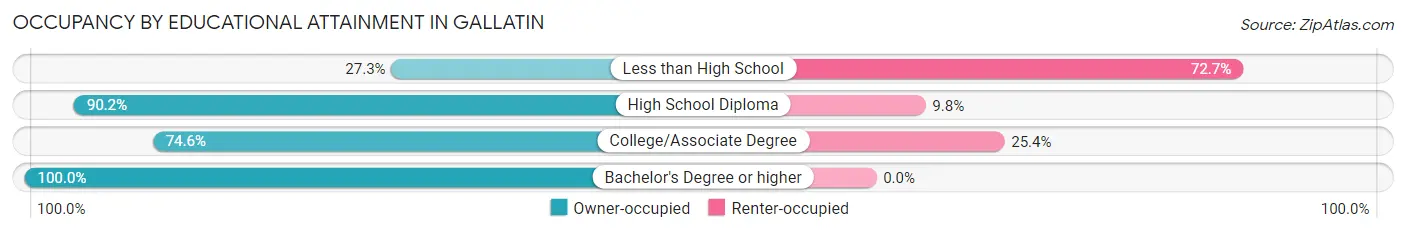
| Household Size | Owner-occupied | Renter-occupied |
| Less than High School | 6 (27.3%) | 16 (72.7%) |
| High School Diploma | 37 (90.2%) | 4 (9.8%) |
| College/Associate Degree | 47 (74.6%) | 16 (25.4%) |
| Bachelor's Degree or higher | 9 (100.0%) | 0 (0.0%) |
Occupancy by Age of Householder in Gallatin
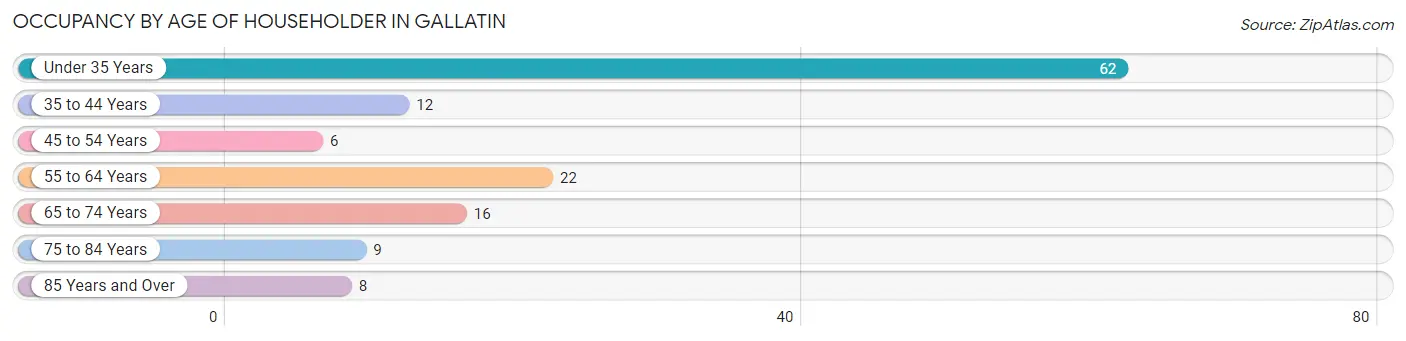
| Age Bracket | # Households | % Households |
| Under 35 Years | 62 | 45.9% |
| 35 to 44 Years | 12 | 8.9% |
| 45 to 54 Years | 6 | 4.4% |
| 55 to 64 Years | 22 | 16.3% |
| 65 to 74 Years | 16 | 11.8% |
| 75 to 84 Years | 9 | 6.7% |
| 85 Years and Over | 8 | 5.9% |
| Total | 135 | 100.0% |
Housing Finances in Gallatin
Median Income by Occupancy in Gallatin
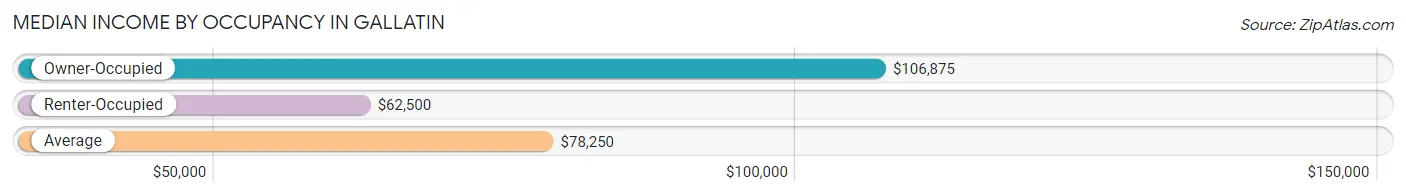
| Occupancy Type | # Households | Median Income |
| Owner-Occupied | 99 (73.3%) | $106,875 |
| Renter-Occupied | 36 (26.7%) | $62,500 |
| Average | 135 (100.0%) | $78,250 |
Occupancy by Householder Income Bracket in Gallatin
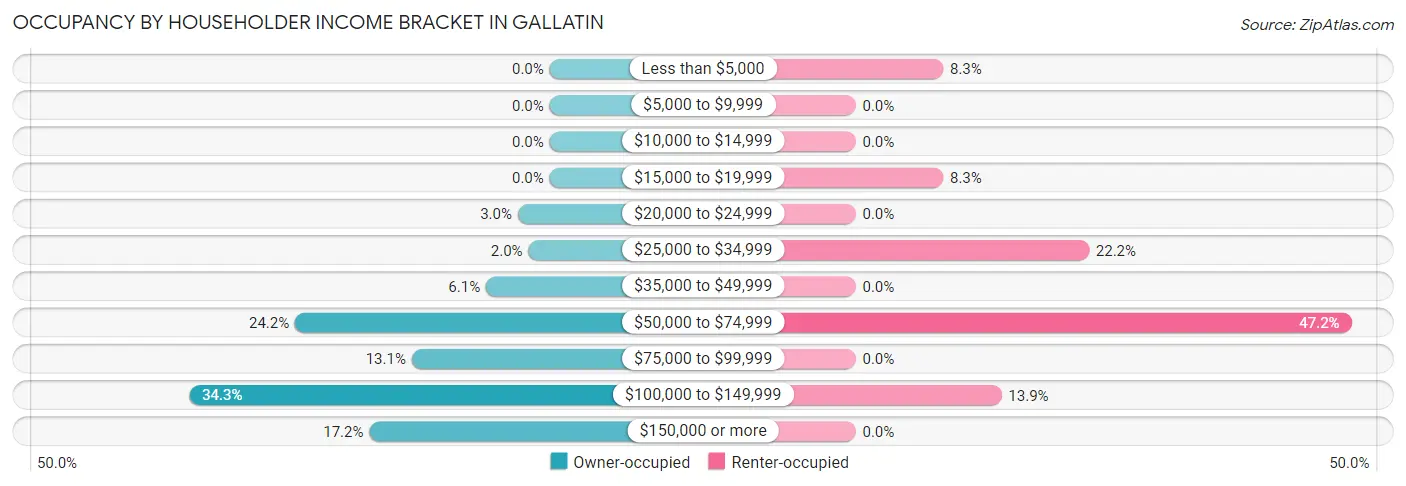
| Income Bracket | Owner-occupied | Renter-occupied |
| Less than $5,000 | 0 (0.0%) | 3 (8.3%) |
| $5,000 to $9,999 | 0 (0.0%) | 0 (0.0%) |
| $10,000 to $14,999 | 0 (0.0%) | 0 (0.0%) |
| $15,000 to $19,999 | 0 (0.0%) | 3 (8.3%) |
| $20,000 to $24,999 | 3 (3.0%) | 0 (0.0%) |
| $25,000 to $34,999 | 2 (2.0%) | 8 (22.2%) |
| $35,000 to $49,999 | 6 (6.1%) | 0 (0.0%) |
| $50,000 to $74,999 | 24 (24.2%) | 17 (47.2%) |
| $75,000 to $99,999 | 13 (13.1%) | 0 (0.0%) |
| $100,000 to $149,999 | 34 (34.3%) | 5 (13.9%) |
| $150,000 or more | 17 (17.2%) | 0 (0.0%) |
| Total | 99 (100.0%) | 36 (100.0%) |
Monthly Housing Cost Tiers in Gallatin
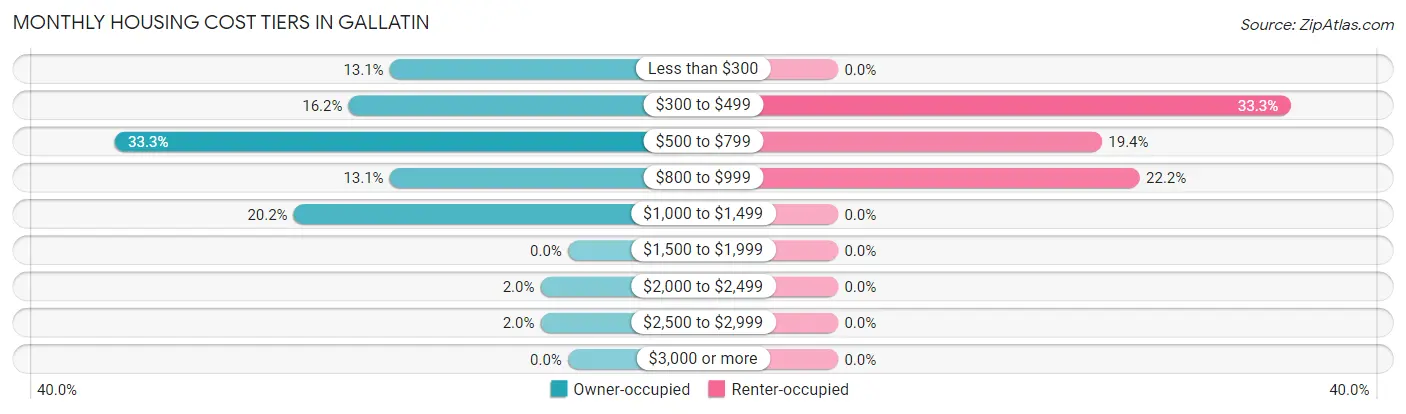
| Monthly Cost | Owner-occupied | Renter-occupied |
| Less than $300 | 13 (13.1%) | 0 (0.0%) |
| $300 to $499 | 16 (16.2%) | 12 (33.3%) |
| $500 to $799 | 33 (33.3%) | 7 (19.4%) |
| $800 to $999 | 13 (13.1%) | 8 (22.2%) |
| $1,000 to $1,499 | 20 (20.2%) | 0 (0.0%) |
| $1,500 to $1,999 | 0 (0.0%) | 0 (0.0%) |
| $2,000 to $2,499 | 2 (2.0%) | 0 (0.0%) |
| $2,500 to $2,999 | 2 (2.0%) | 0 (0.0%) |
| $3,000 or more | 0 (0.0%) | 0 (0.0%) |
| Total | 99 (100.0%) | 36 (100.0%) |
Physical Housing Characteristics in Gallatin
Housing Structures in Gallatin
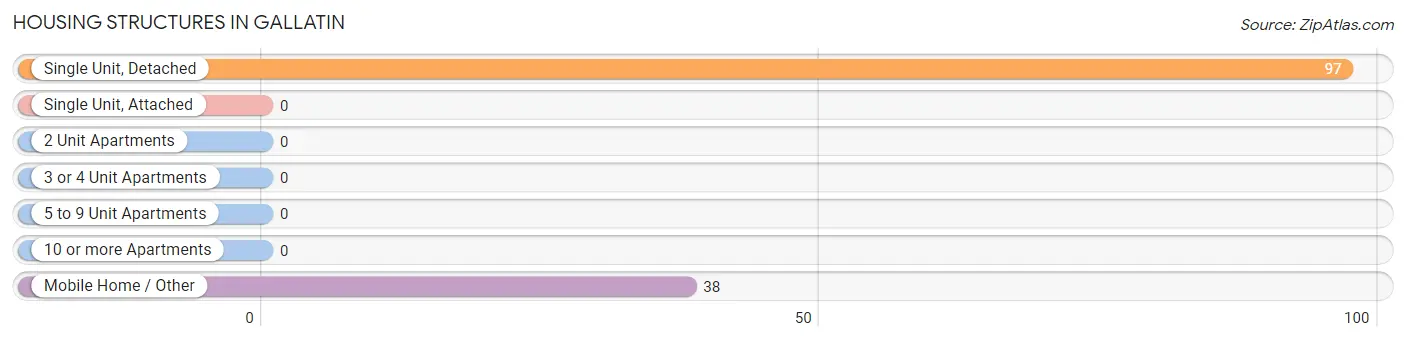
| Structure Type | # Housing Units | % Housing Units |
| Single Unit, Detached | 97 | 71.9% |
| Single Unit, Attached | 0 | 0.0% |
| 2 Unit Apartments | 0 | 0.0% |
| 3 or 4 Unit Apartments | 0 | 0.0% |
| 5 to 9 Unit Apartments | 0 | 0.0% |
| 10 or more Apartments | 0 | 0.0% |
| Mobile Home / Other | 38 | 28.1% |
| Total | 135 | 100.0% |
Housing Structures by Occupancy in Gallatin
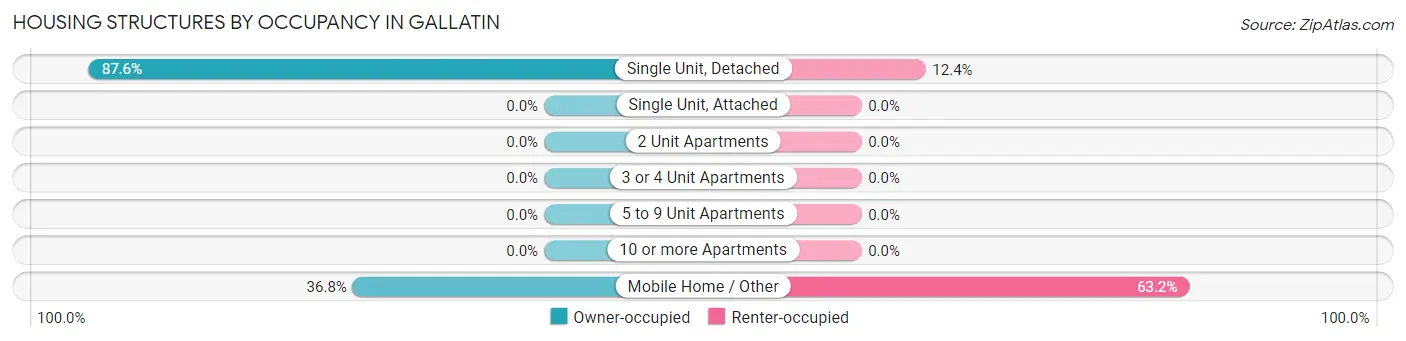
| Structure Type | Owner-occupied | Renter-occupied |
| Single Unit, Detached | 85 (87.6%) | 12 (12.4%) |
| Single Unit, Attached | 0 (0.0%) | 0 (0.0%) |
| 2 Unit Apartments | 0 (0.0%) | 0 (0.0%) |
| 3 or 4 Unit Apartments | 0 (0.0%) | 0 (0.0%) |
| 5 to 9 Unit Apartments | 0 (0.0%) | 0 (0.0%) |
| 10 or more Apartments | 0 (0.0%) | 0 (0.0%) |
| Mobile Home / Other | 14 (36.8%) | 24 (63.2%) |
| Total | 99 (73.3%) | 36 (26.7%) |
Housing Structures by Number of Rooms in Gallatin
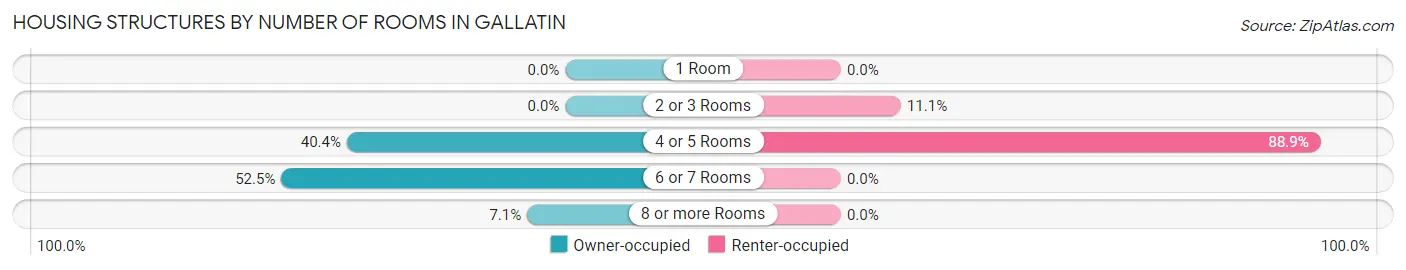
| Number of Rooms | Owner-occupied | Renter-occupied |
| 1 Room | 0 (0.0%) | 0 (0.0%) |
| 2 or 3 Rooms | 0 (0.0%) | 4 (11.1%) |
| 4 or 5 Rooms | 40 (40.4%) | 32 (88.9%) |
| 6 or 7 Rooms | 52 (52.5%) | 0 (0.0%) |
| 8 or more Rooms | 7 (7.1%) | 0 (0.0%) |
| Total | 99 (100.0%) | 36 (100.0%) |
Housing Structure by Heating Type in Gallatin
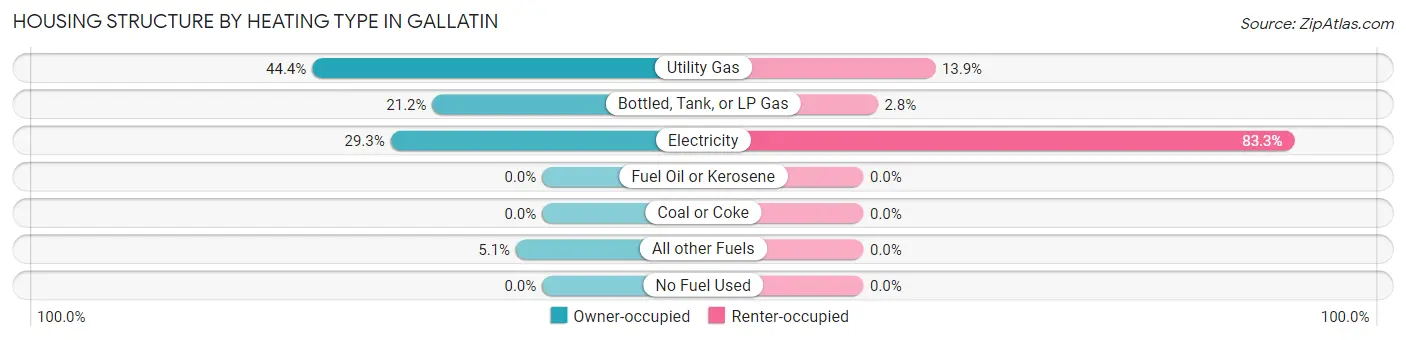
| Heating Type | Owner-occupied | Renter-occupied |
| Utility Gas | 44 (44.4%) | 5 (13.9%) |
| Bottled, Tank, or LP Gas | 21 (21.2%) | 1 (2.8%) |
| Electricity | 29 (29.3%) | 30 (83.3%) |
| Fuel Oil or Kerosene | 0 (0.0%) | 0 (0.0%) |
| Coal or Coke | 0 (0.0%) | 0 (0.0%) |
| All other Fuels | 5 (5.1%) | 0 (0.0%) |
| No Fuel Used | 0 (0.0%) | 0 (0.0%) |
| Total | 99 (100.0%) | 36 (100.0%) |
Household Vehicle Usage in Gallatin
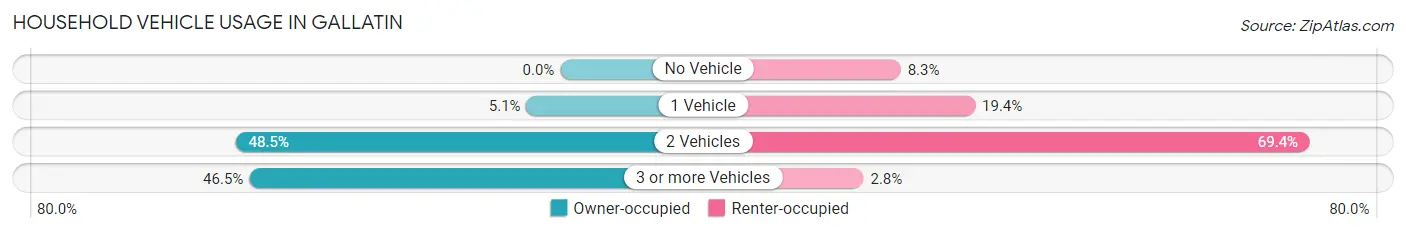
| Vehicles per Household | Owner-occupied | Renter-occupied |
| No Vehicle | 0 (0.0%) | 3 (8.3%) |
| 1 Vehicle | 5 (5.1%) | 7 (19.4%) |
| 2 Vehicles | 48 (48.5%) | 25 (69.4%) |
| 3 or more Vehicles | 46 (46.5%) | 1 (2.8%) |
| Total | 99 (100.0%) | 36 (100.0%) |
Real Estate & Mortgages in Gallatin
Real Estate and Mortgage Overview in Gallatin
| Characteristic | Without Mortgage | With Mortgage |
| Housing Units | 51 | 48 |
| Median Property Value | $146,900 | $115,000 |
| Median Household Income | $120,313 | $2 |
| Monthly Housing Costs | $478 | $0 |
| Real Estate Taxes | $922 | $0 |
Property Value by Mortgage Status in Gallatin
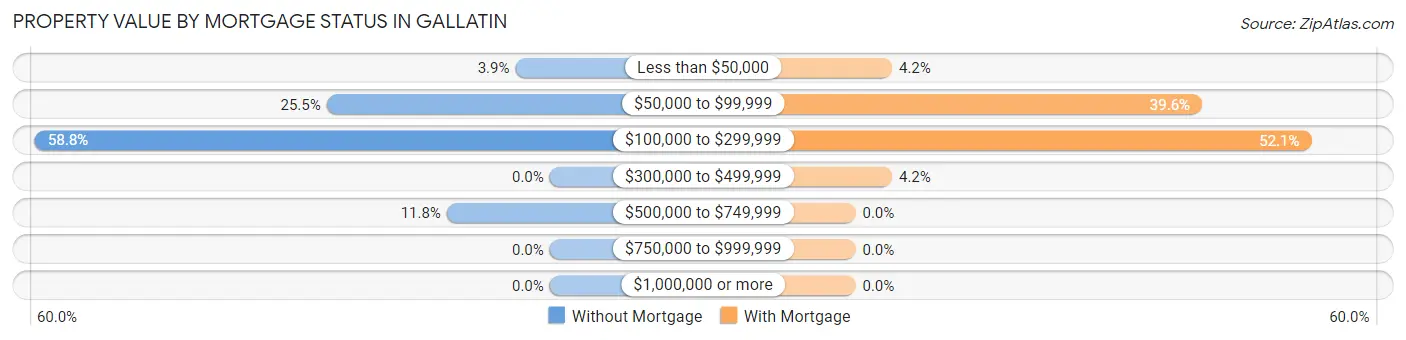
| Property Value | Without Mortgage | With Mortgage |
| Less than $50,000 | 2 (3.9%) | 2 (4.2%) |
| $50,000 to $99,999 | 13 (25.5%) | 19 (39.6%) |
| $100,000 to $299,999 | 30 (58.8%) | 25 (52.1%) |
| $300,000 to $499,999 | 0 (0.0%) | 2 (4.2%) |
| $500,000 to $749,999 | 6 (11.8%) | 0 (0.0%) |
| $750,000 to $999,999 | 0 (0.0%) | 0 (0.0%) |
| $1,000,000 or more | 0 (0.0%) | 0 (0.0%) |
| Total | 51 (100.0%) | 48 (100.0%) |
Household Income by Mortgage Status in Gallatin
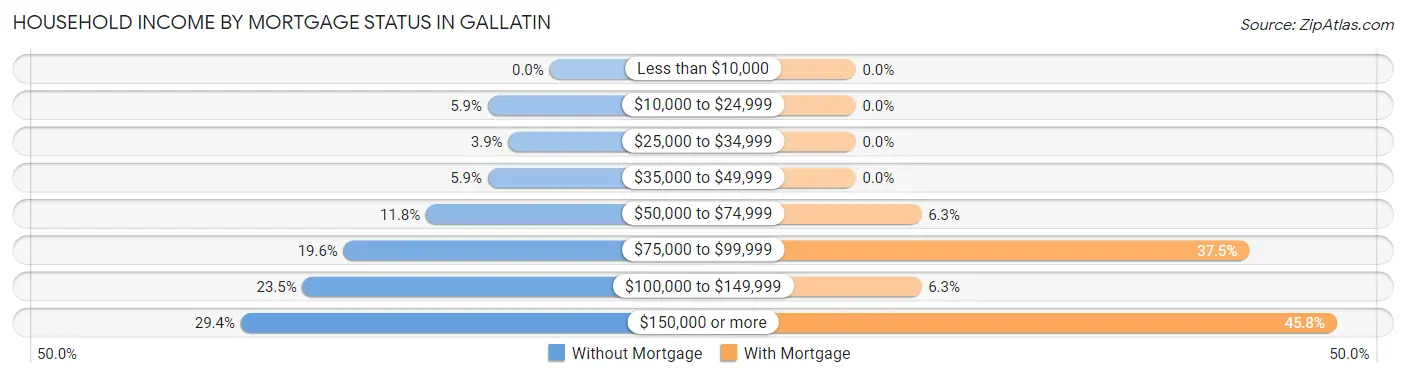
| Household Income | Without Mortgage | With Mortgage |
| Less than $10,000 | 0 (0.0%) | 0 (0.0%) |
| $10,000 to $24,999 | 3 (5.9%) | 0 (0.0%) |
| $25,000 to $34,999 | 2 (3.9%) | 0 (0.0%) |
| $35,000 to $49,999 | 3 (5.9%) | 0 (0.0%) |
| $50,000 to $74,999 | 6 (11.8%) | 3 (6.2%) |
| $75,000 to $99,999 | 10 (19.6%) | 18 (37.5%) |
| $100,000 to $149,999 | 12 (23.5%) | 3 (6.2%) |
| $150,000 or more | 15 (29.4%) | 22 (45.8%) |
| Total | 51 (100.0%) | 48 (100.0%) |
Property Value to Household Income Ratio in Gallatin
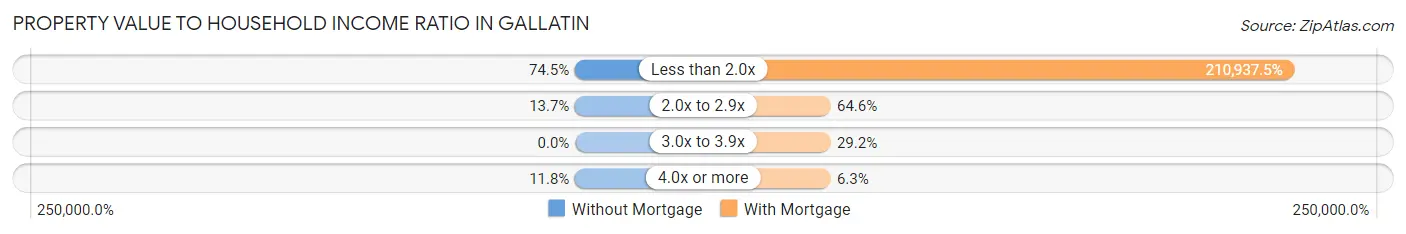
| Value-to-Income Ratio | Without Mortgage | With Mortgage |
| Less than 2.0x | 38 (74.5%) | 101,250 (210,937.5%) |
| 2.0x to 2.9x | 7 (13.7%) | 31 (64.6%) |
| 3.0x to 3.9x | 0 (0.0%) | 14 (29.2%) |
| 4.0x or more | 6 (11.8%) | 3 (6.2%) |
| Total | 51 (100.0%) | 48 (100.0%) |
Real Estate Taxes by Mortgage Status in Gallatin
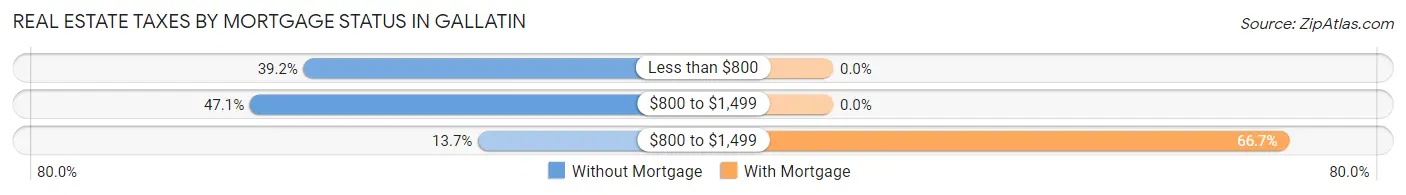
| Property Taxes | Without Mortgage | With Mortgage |
| Less than $800 | 20 (39.2%) | 0 (0.0%) |
| $800 to $1,499 | 24 (47.1%) | 0 (0.0%) |
| $800 to $1,499 | 7 (13.7%) | 32 (66.7%) |
| Total | 51 (100.0%) | 48 (100.0%) |
Health & Disability in Gallatin
Health Insurance Coverage by Age in Gallatin
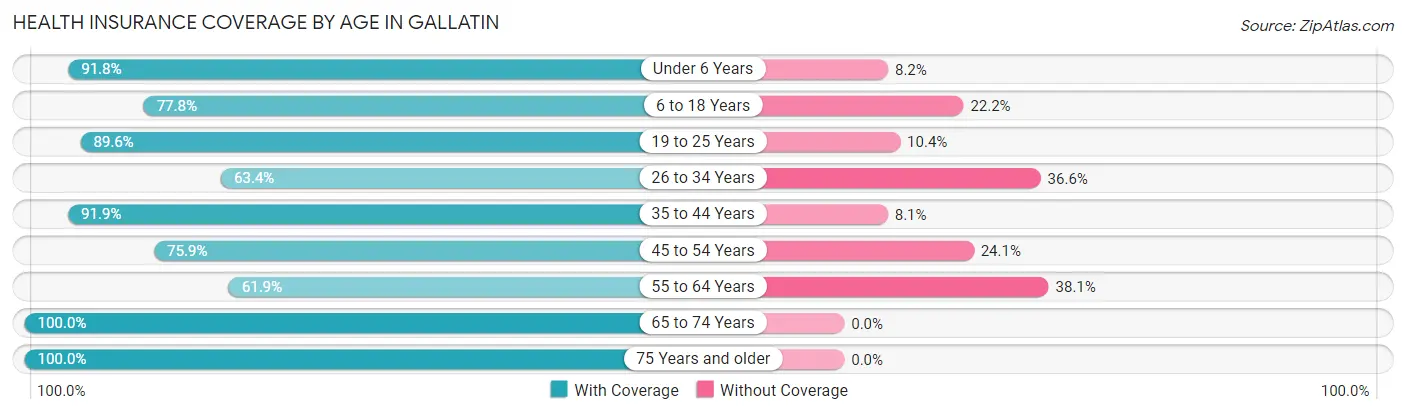
| Age Bracket | With Coverage | Without Coverage |
| Under 6 Years | 45 (91.8%) | 4 (8.2%) |
| 6 to 18 Years | 28 (77.8%) | 8 (22.2%) |
| 19 to 25 Years | 43 (89.6%) | 5 (10.4%) |
| 26 to 34 Years | 45 (63.4%) | 26 (36.6%) |
| 35 to 44 Years | 34 (91.9%) | 3 (8.1%) |
| 45 to 54 Years | 22 (75.9%) | 7 (24.1%) |
| 55 to 64 Years | 26 (61.9%) | 16 (38.1%) |
| 65 to 74 Years | 24 (100.0%) | 0 (0.0%) |
| 75 Years and older | 22 (100.0%) | 0 (0.0%) |
| Total | 289 (80.7%) | 69 (19.3%) |
Health Insurance Coverage by Citizenship Status in Gallatin
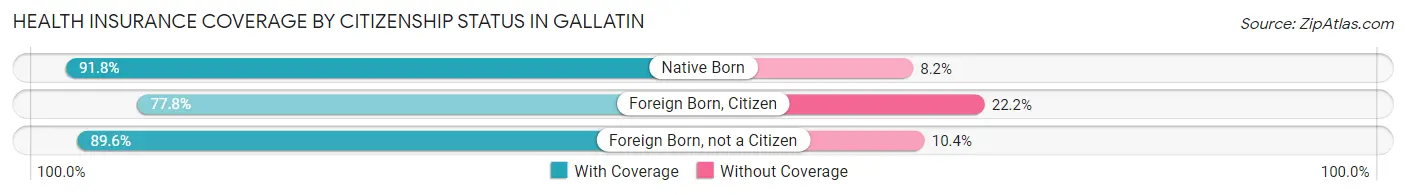
| Citizenship Status | With Coverage | Without Coverage |
| Native Born | 45 (91.8%) | 4 (8.2%) |
| Foreign Born, Citizen | 28 (77.8%) | 8 (22.2%) |
| Foreign Born, not a Citizen | 43 (89.6%) | 5 (10.4%) |
Health Insurance Coverage by Household Income in Gallatin
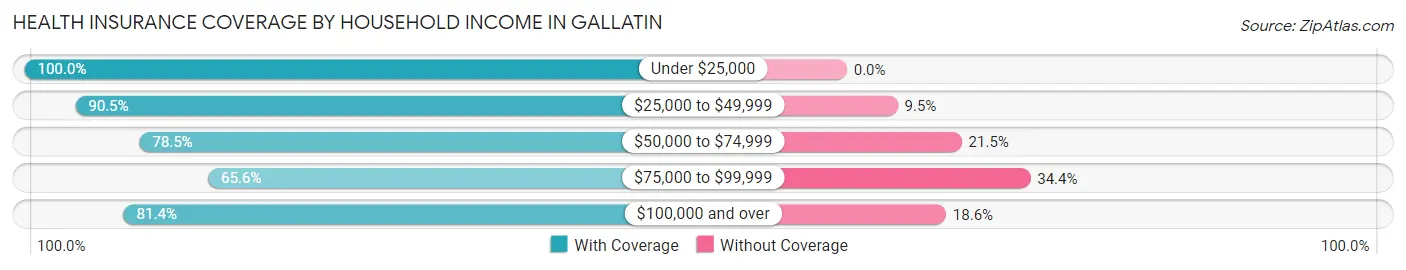
| Household Income | With Coverage | Without Coverage |
| Under $25,000 | 16 (100.0%) | 0 (0.0%) |
| $25,000 to $49,999 | 19 (90.5%) | 2 (9.5%) |
| $50,000 to $74,999 | 62 (78.5%) | 17 (21.5%) |
| $75,000 to $99,999 | 21 (65.6%) | 11 (34.4%) |
| $100,000 and over | 171 (81.4%) | 39 (18.6%) |
Public vs Private Health Insurance Coverage by Age in Gallatin
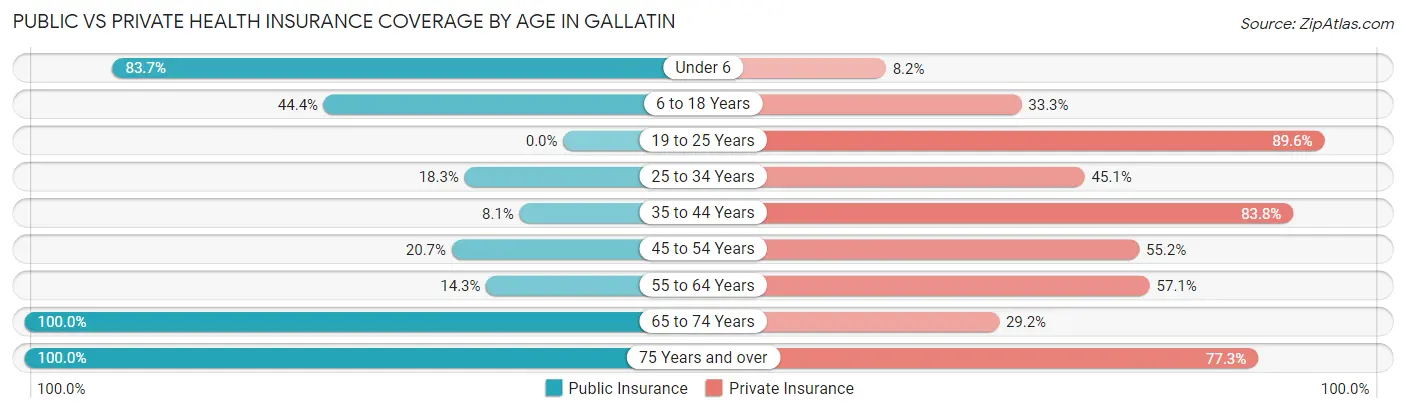
| Age Bracket | Public Insurance | Private Insurance |
| Under 6 | 41 (83.7%) | 4 (8.2%) |
| 6 to 18 Years | 16 (44.4%) | 12 (33.3%) |
| 19 to 25 Years | 0 (0.0%) | 43 (89.6%) |
| 25 to 34 Years | 13 (18.3%) | 32 (45.1%) |
| 35 to 44 Years | 3 (8.1%) | 31 (83.8%) |
| 45 to 54 Years | 6 (20.7%) | 16 (55.2%) |
| 55 to 64 Years | 6 (14.3%) | 24 (57.1%) |
| 65 to 74 Years | 24 (100.0%) | 7 (29.2%) |
| 75 Years and over | 22 (100.0%) | 17 (77.3%) |
| Total | 131 (36.6%) | 186 (52.0%) |
Disability Status by Sex by Age in Gallatin
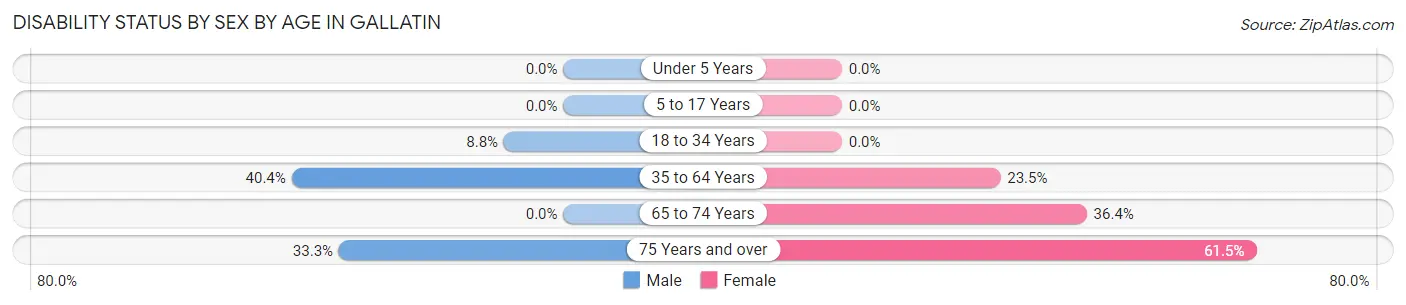
| Age Bracket | Male | Female |
| Under 5 Years | 0 (0.0%) | 0 (0.0%) |
| 5 to 17 Years | 0 (0.0%) | 0 (0.0%) |
| 18 to 34 Years | 6 (8.8%) | 0 (0.0%) |
| 35 to 64 Years | 23 (40.4%) | 12 (23.5%) |
| 65 to 74 Years | 0 (0.0%) | 4 (36.4%) |
| 75 Years and over | 3 (33.3%) | 8 (61.5%) |
Disability Class by Sex by Age in Gallatin
Disability Class: Hearing Difficulty
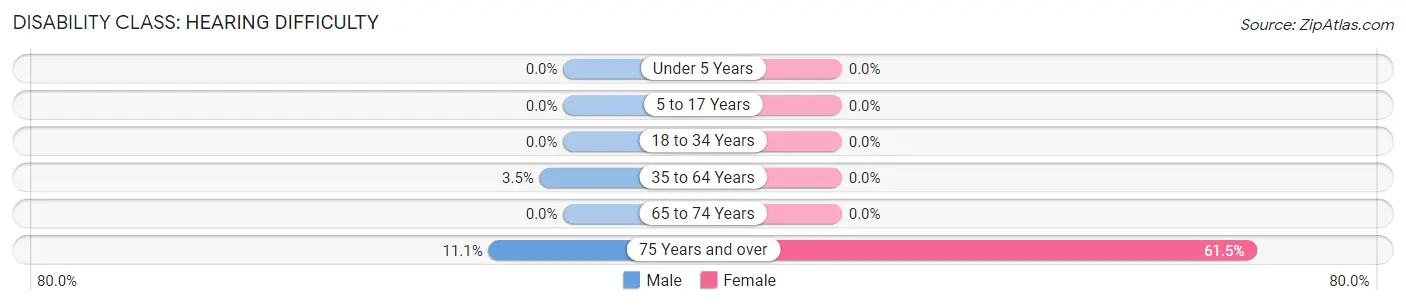
| Age Bracket | Male | Female |
| Under 5 Years | 0 (0.0%) | 0 (0.0%) |
| 5 to 17 Years | 0 (0.0%) | 0 (0.0%) |
| 18 to 34 Years | 0 (0.0%) | 0 (0.0%) |
| 35 to 64 Years | 2 (3.5%) | 0 (0.0%) |
| 65 to 74 Years | 0 (0.0%) | 0 (0.0%) |
| 75 Years and over | 1 (11.1%) | 8 (61.5%) |
Disability Class: Vision Difficulty
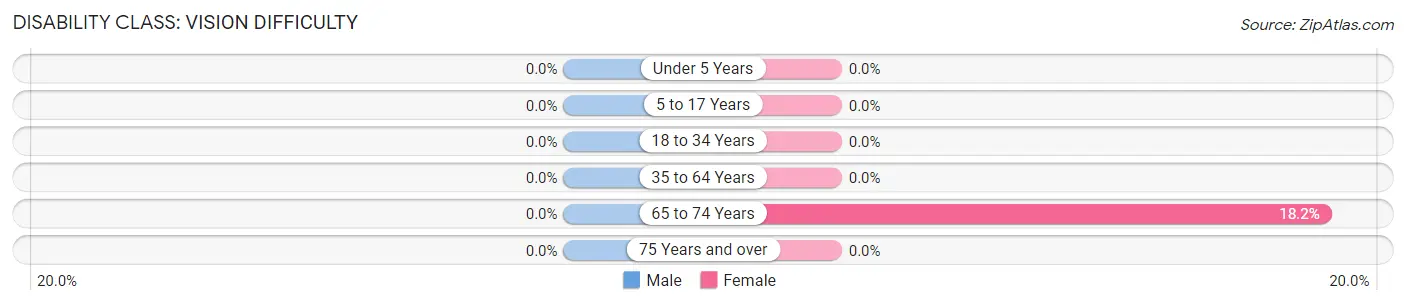
| Age Bracket | Male | Female |
| Under 5 Years | 0 (0.0%) | 0 (0.0%) |
| 5 to 17 Years | 0 (0.0%) | 0 (0.0%) |
| 18 to 34 Years | 0 (0.0%) | 0 (0.0%) |
| 35 to 64 Years | 0 (0.0%) | 0 (0.0%) |
| 65 to 74 Years | 0 (0.0%) | 2 (18.2%) |
| 75 Years and over | 0 (0.0%) | 0 (0.0%) |
Disability Class: Cognitive Difficulty
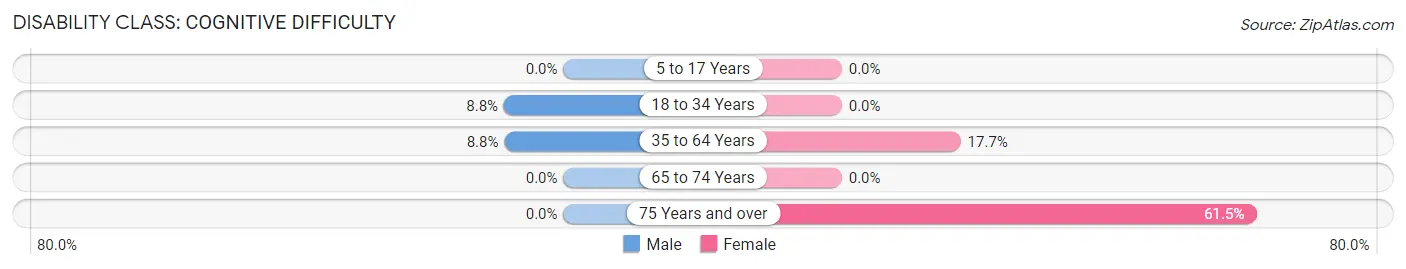
| Age Bracket | Male | Female |
| 5 to 17 Years | 0 (0.0%) | 0 (0.0%) |
| 18 to 34 Years | 6 (8.8%) | 0 (0.0%) |
| 35 to 64 Years | 5 (8.8%) | 9 (17.6%) |
| 65 to 74 Years | 0 (0.0%) | 0 (0.0%) |
| 75 Years and over | 0 (0.0%) | 8 (61.5%) |
Disability Class: Ambulatory Difficulty
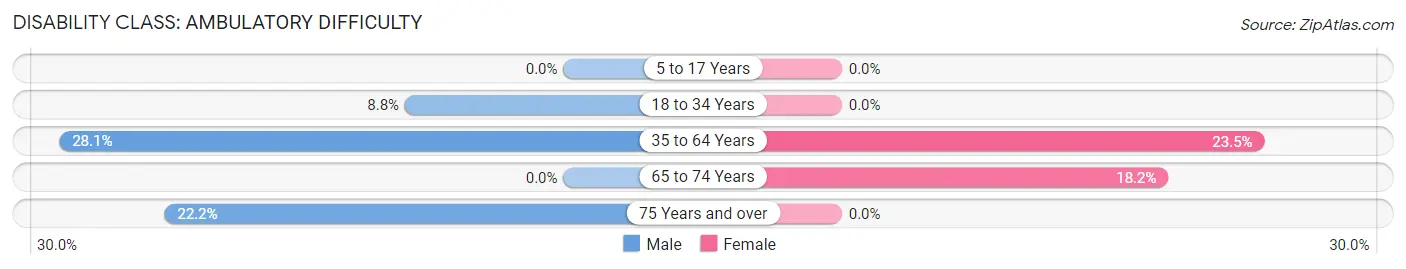
| Age Bracket | Male | Female |
| 5 to 17 Years | 0 (0.0%) | 0 (0.0%) |
| 18 to 34 Years | 6 (8.8%) | 0 (0.0%) |
| 35 to 64 Years | 16 (28.1%) | 12 (23.5%) |
| 65 to 74 Years | 0 (0.0%) | 2 (18.2%) |
| 75 Years and over | 2 (22.2%) | 0 (0.0%) |
Disability Class: Self-Care Difficulty
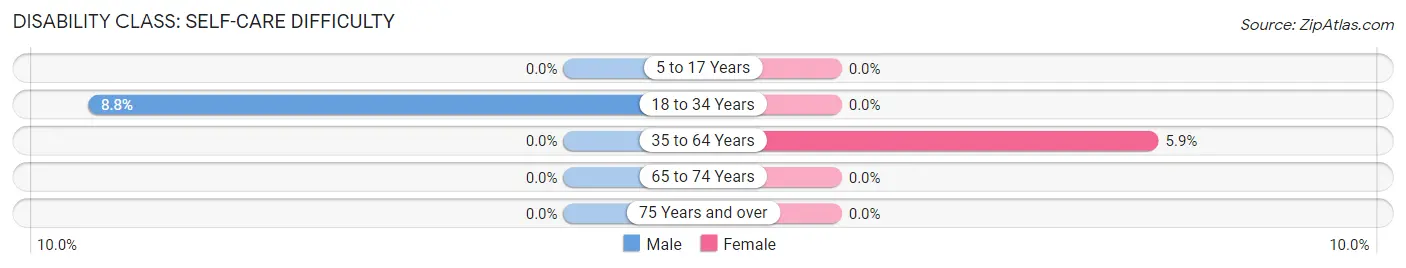
| Age Bracket | Male | Female |
| 5 to 17 Years | 0 (0.0%) | 0 (0.0%) |
| 18 to 34 Years | 6 (8.8%) | 0 (0.0%) |
| 35 to 64 Years | 0 (0.0%) | 3 (5.9%) |
| 65 to 74 Years | 0 (0.0%) | 0 (0.0%) |
| 75 Years and over | 0 (0.0%) | 0 (0.0%) |
Technology Access in Gallatin
Computing Device Access in Gallatin
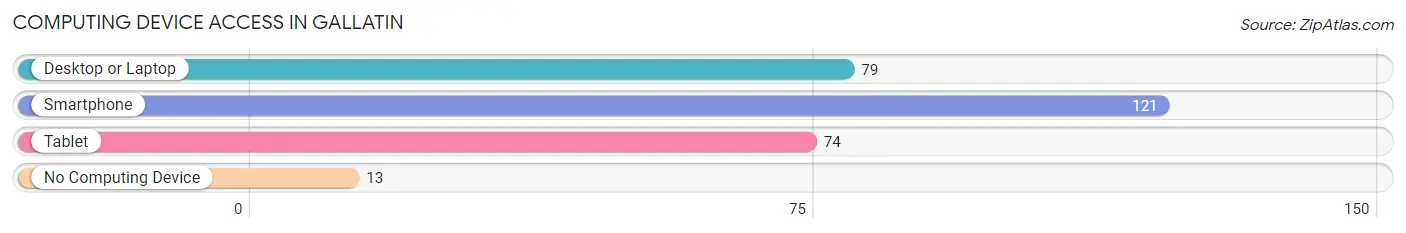
| Device Type | # Households | % Households |
| Desktop or Laptop | 79 | 58.5% |
| Smartphone | 121 | 89.6% |
| Tablet | 74 | 54.8% |
| No Computing Device | 13 | 9.6% |
| Total | 135 | 100.0% |
Internet Access in Gallatin
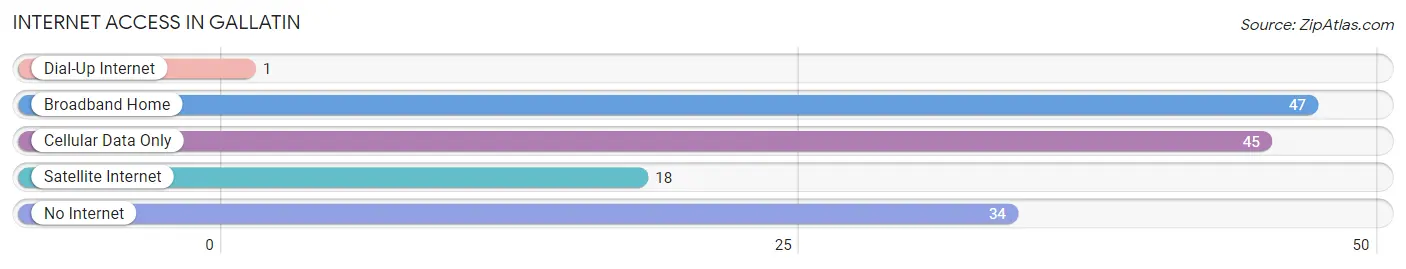
| Internet Type | # Households | % Households |
| Dial-Up Internet | 1 | 0.7% |
| Broadband Home | 47 | 34.8% |
| Cellular Data Only | 45 | 33.3% |
| Satellite Internet | 18 | 13.3% |
| No Internet | 34 | 25.2% |
| Total | 135 | 100.0% |
Gallatin Summary
History
The town of Gallatin, Texas is located in the northeast corner of the state, in the county of Delta. It is situated on the banks of the Sulphur River, and is the county seat of Delta County. The town was founded in 1876, and was named after Albert Gallatin, the Secretary of the Treasury under President Thomas Jefferson.
The town was originally settled by a group of settlers from the nearby town of Clarksville, who were looking for a new place to call home. The settlers were attracted to the area due to its fertile soil and abundant water supply. The town quickly grew, and by the early 1900s, it had become a thriving agricultural center.
The town was also home to a number of businesses, including a cotton gin, a grist mill, a blacksmith shop, and a general store. The town also had a school, a post office, and a number of churches.
In the early 1900s, the town was also home to a number of oil wells, which helped to fuel the local economy. The town was also home to a number of cotton gins, which helped to process the cotton grown in the area.
In the late 1940s, the town began to experience a decline in population, as many of the residents moved away to larger cities. This decline continued until the late 1970s, when the town began to experience a resurgence in population.
Today, Gallatin is a small town with a population of just over 1,000 people. The town is home to a number of businesses, including a grocery store, a hardware store, a bank, and a number of restaurants. The town also has a number of churches, and is home to a number of historic buildings.
Geography
Gallatin is located in the northeast corner of Texas, in Delta County. The town is situated on the banks of the Sulphur River, and is surrounded by rolling hills and farmland. The town is located approximately 30 miles from the nearest major city, Texarkana.
The town has a total area of 1.2 square miles, all of which is land. The town has a humid subtropical climate, with hot summers and mild winters. The average temperature in the summer is around 90 degrees Fahrenheit, and the average temperature in the winter is around 40 degrees Fahrenheit.
Economy
The economy of Gallatin is largely based on agriculture. The town is home to a number of farms, which produce a variety of crops, including cotton, corn, soybeans, and wheat. The town is also home to a number of businesses, including a grocery store, a hardware store, a bank, and a number of restaurants.
The town is also home to a number of oil wells, which help to fuel the local economy. The town is also home to a number of cotton gins, which help to process the cotton grown in the area.
Demographics
As of the 2010 census, the town of Gallatin had a population of 1,072 people. The racial makeup of the town was 94.3% White, 0.7% African American, 0.2% Native American, 0.2% Asian, 0.1% Pacific Islander, 2.7% from other races, and 1.7% from two or more races. Hispanic or Latino of any race were 4.7% of the population.
The median income for a household in the town was $31,250, and the median income for a family was $37,500. The per capita income for the town was $15,945. About 16.2% of families and 19.2% of the population were below the poverty line, including 25.2% of those under age 18 and 11.3% of those age 65 or over.
Common Questions
What is Per Capita Income in Gallatin?
Per Capita income in Gallatin is $34,643.
What is the Median Family Income in Gallatin?
Median Family Income in Gallatin is $86,563.
What is the Median Household income in Gallatin?
Median Household Income in Gallatin is $78,250.
What is Income or Wage Gap in Gallatin?
Income or Wage Gap in Gallatin is 46.5%.
Women in Gallatin earn 53.5 cents for every dollar earned by a man.
What is Inequality or Gini Index in Gallatin?
Inequality or Gini Index in Gallatin is 0.31.
What is the Total Population of Gallatin?
Total Population of Gallatin is 358.
What is the Total Male Population of Gallatin?
Total Male Population of Gallatin is 185.
What is the Total Female Population of Gallatin?
Total Female Population of Gallatin is 173.
What is the Ratio of Males per 100 Females in Gallatin?
There are 106.94 Males per 100 Females in Gallatin.
What is the Ratio of Females per 100 Males in Gallatin?
There are 93.51 Females per 100 Males in Gallatin.
What is the Median Population Age in Gallatin?
Median Population Age in Gallatin is 32.1 Years.
What is the Average Family Size in Gallatin
Average Family Size in Gallatin is 2.8 People.
What is the Average Household Size in Gallatin
Average Household Size in Gallatin is 2.6 People.
How Large is the Labor Force in Gallatin?
There are 183 People in the Labor Forcein in Gallatin.
What is the Percentage of People in the Labor Force in Gallatin?
65.8% of People are in the Labor Force in Gallatin.
What is the Unemployment Rate in Gallatin?
Unemployment Rate in Gallatin is 7.1%.