Franklin, TX Map & Demographics
Franklin Map
Franklin Overview
$25,563
PER CAPITA INCOME
$56,250
AVG FAMILY INCOME
$49,063
AVG HOUSEHOLD INCOME
71.4%
WAGE / INCOME GAP [ % ]
28.6¢/ $1
WAGE / INCOME GAP [ $ ]
0.41
INEQUALITY / GINI INDEX
1,354
TOTAL POPULATION
617
MALE POPULATION
737
FEMALE POPULATION
83.72
MALES / 100 FEMALES
119.45
FEMALES / 100 MALES
39.6
MEDIAN AGE
3.1
AVG FAMILY SIZE
2.4
AVG HOUSEHOLD SIZE
572
LABOR FORCE [ PEOPLE ]
53.1%
PERCENT IN LABOR FORCE
9.6%
UNEMPLOYMENT RATE
Franklin Zip Codes
Franklin Area Codes
Income in Franklin
Income Overview in Franklin
Per Capita Income in Franklin is $25,563, while median incomes of families and households are $56,250 and $49,063 respectively.
| Characteristic | Number | Measure |
| Per Capita Income | 1,354 | $25,563 |
| Median Family Income | 324 | $56,250 |
| Mean Family Income | 324 | $71,310 |
| Median Household Income | 510 | $49,063 |
| Mean Household Income | 510 | $62,715 |
| Income Deficit | 324 | $0 |
| Wage / Income Gap (%) | 1,354 | 71.36% |
| Wage / Income Gap ($) | 1,354 | 28.64¢ per $1 |
| Gini / Inequality Index | 1,354 | 0.41 |
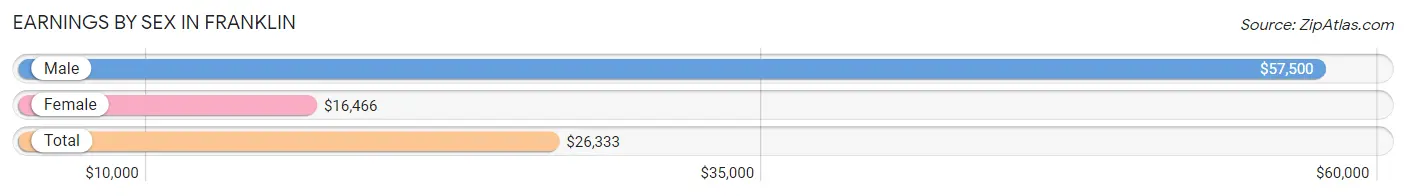
Earnings by Sex in Franklin
Average Earnings in Franklin are $26,333, $57,500 for men and $16,466 for women, a difference of 71.4%.
| Sex | Number | Average Earnings |
| Male | 286 (45.1%) | $57,500 |
| Female | 348 (54.9%) | $16,466 |
| Total | 634 (100.0%) | $26,333 |
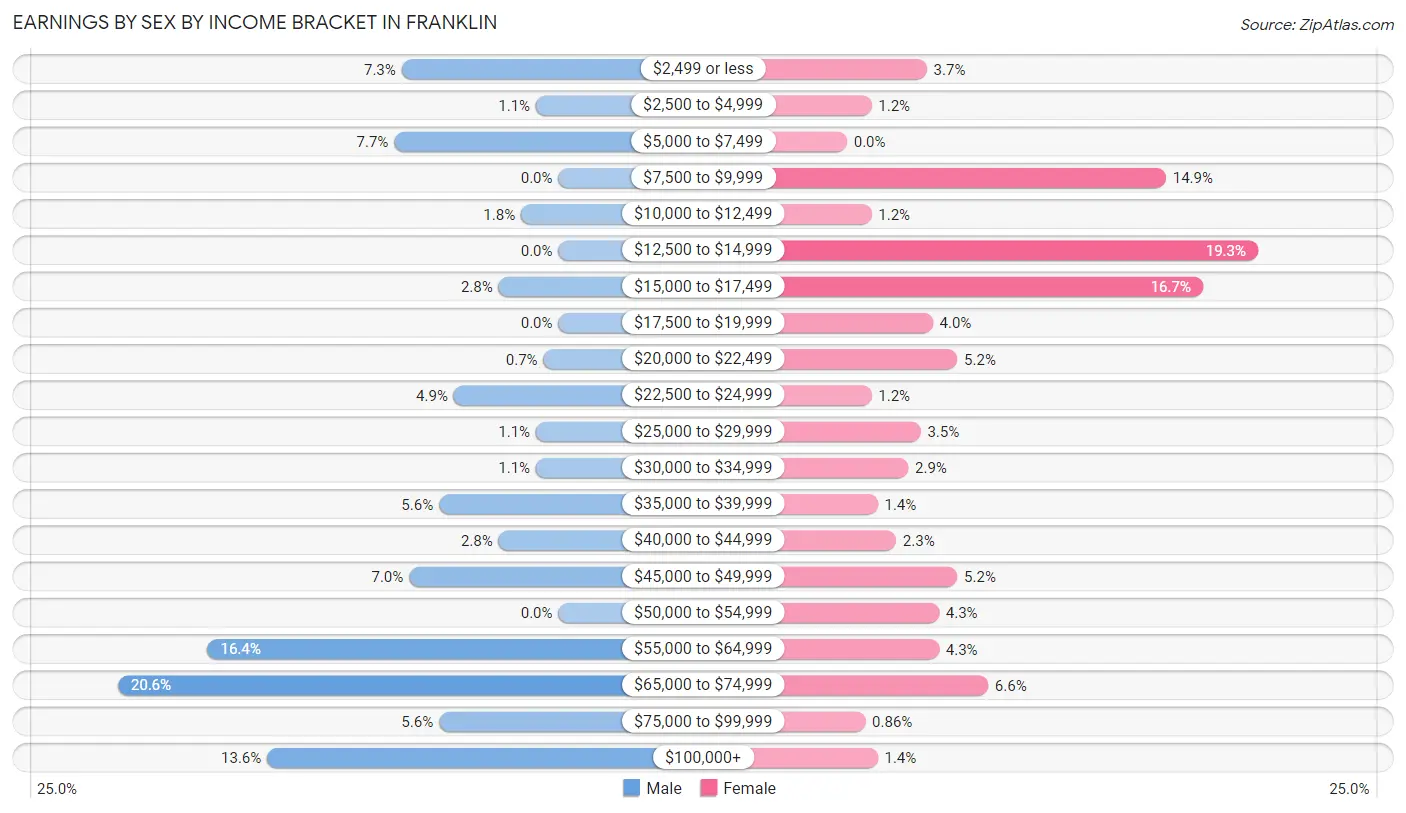
Earnings by Sex by Income Bracket in Franklin
The most common earnings brackets in Franklin are $65,000 to $74,999 for men (59 | 20.6%) and $12,500 to $14,999 for women (67 | 19.3%).
| Income | Male | Female |
| $2,499 or less | 21 (7.3%) | 13 (3.7%) |
| $2,500 to $4,999 | 3 (1.1%) | 4 (1.1%) |
| $5,000 to $7,499 | 22 (7.7%) | 0 (0.0%) |
| $7,500 to $9,999 | 0 (0.0%) | 52 (14.9%) |
| $10,000 to $12,499 | 5 (1.8%) | 4 (1.1%) |
| $12,500 to $14,999 | 0 (0.0%) | 67 (19.3%) |
| $15,000 to $17,499 | 8 (2.8%) | 58 (16.7%) |
| $17,500 to $19,999 | 0 (0.0%) | 14 (4.0%) |
| $20,000 to $22,499 | 2 (0.7%) | 18 (5.2%) |
| $22,500 to $24,999 | 14 (4.9%) | 4 (1.1%) |
| $25,000 to $29,999 | 3 (1.1%) | 12 (3.5%) |
| $30,000 to $34,999 | 3 (1.1%) | 10 (2.9%) |
| $35,000 to $39,999 | 16 (5.6%) | 5 (1.4%) |
| $40,000 to $44,999 | 8 (2.8%) | 8 (2.3%) |
| $45,000 to $49,999 | 20 (7.0%) | 18 (5.2%) |
| $50,000 to $54,999 | 0 (0.0%) | 15 (4.3%) |
| $55,000 to $64,999 | 47 (16.4%) | 15 (4.3%) |
| $65,000 to $74,999 | 59 (20.6%) | 23 (6.6%) |
| $75,000 to $99,999 | 16 (5.6%) | 3 (0.9%) |
| $100,000+ | 39 (13.6%) | 5 (1.4%) |
| Total | 286 (100.0%) | 348 (100.0%) |
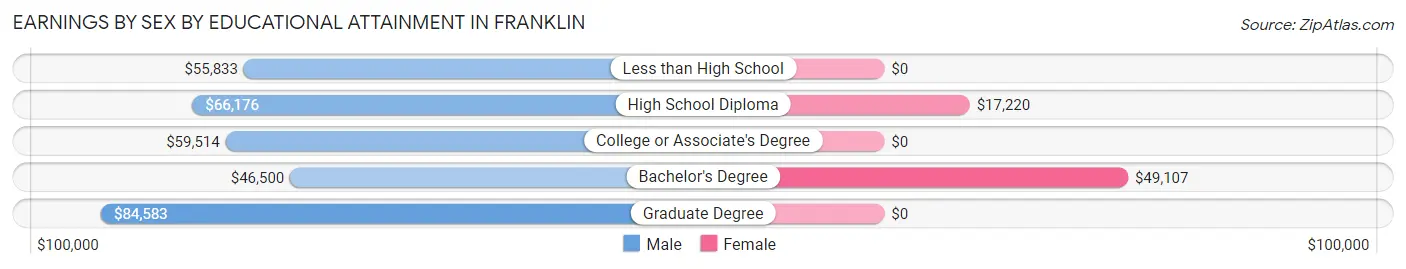
Earnings by Sex by Educational Attainment in Franklin
Average earnings in Franklin are $58,696 for men and $22,083 for women, a difference of 62.4%. Men with an educational attainment of graduate degree enjoy the highest average annual earnings of $84,583, while those with bachelor's degree education earn the least with $46,500. Women with an educational attainment of bachelor's degree earn the most with the average annual earnings of $49,107, while those with high school diploma education have the smallest earnings of $17,220.
| Educational Attainment | Male Income | Female Income |
| Less than High School | $55,833 | $0 |
| High School Diploma | $66,176 | $17,220 |
| College or Associate's Degree | $59,514 | $0 |
| Bachelor's Degree | $46,500 | $49,107 |
| Graduate Degree | $84,583 | $0 |
| Total | $58,696 | $22,083 |
Family Income in Franklin
Family Income Brackets in Franklin
According to the Franklin family income data, there are 71 families falling into the $25,000 to $34,999 income range, which is the most common income bracket and makes up 21.9% of all families. Conversely, the $10,000 to $14,999 income bracket is the least frequent group with only 3 families (0.9%) belonging to this category.
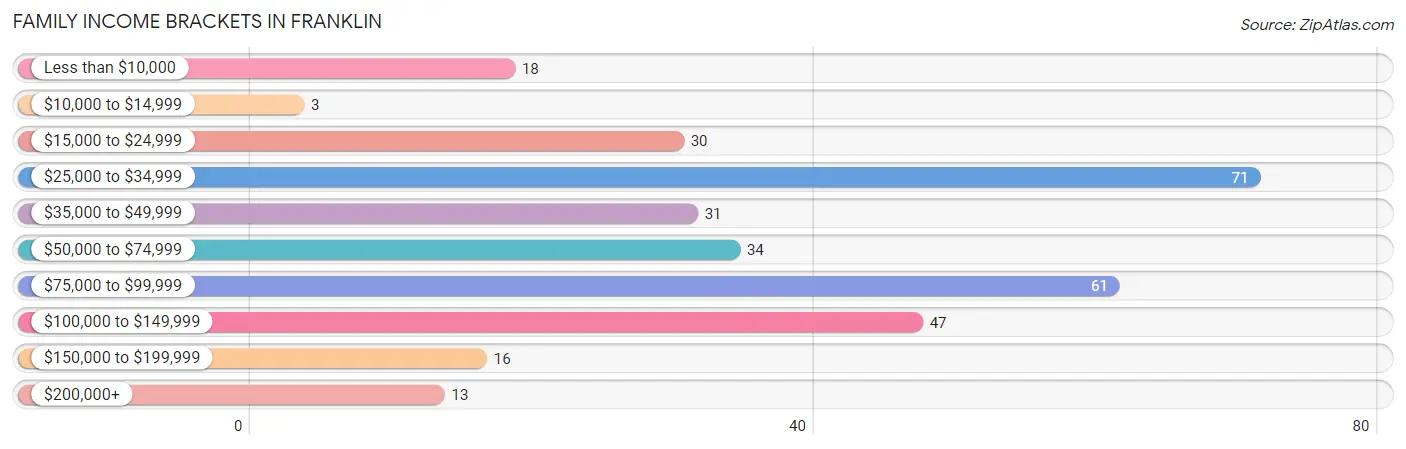
| Income Bracket | # Families | % Families |
| Less than $10,000 | 18 | 5.6% |
| $10,000 to $14,999 | 3 | 0.9% |
| $15,000 to $24,999 | 30 | 9.3% |
| $25,000 to $34,999 | 71 | 21.9% |
| $35,000 to $49,999 | 31 | 9.6% |
| $50,000 to $74,999 | 34 | 10.5% |
| $75,000 to $99,999 | 61 | 18.8% |
| $100,000 to $149,999 | 47 | 14.5% |
| $150,000 to $199,999 | 16 | 4.9% |
| $200,000+ | 13 | 4.0% |
Family Income by Famaliy Size in Franklin
3-person families (126 | 38.9%) account for the highest median family income in Franklin with $76,083 per family, while 3-person families (126 | 38.9%) have the highest median income of $25,361 per family member.
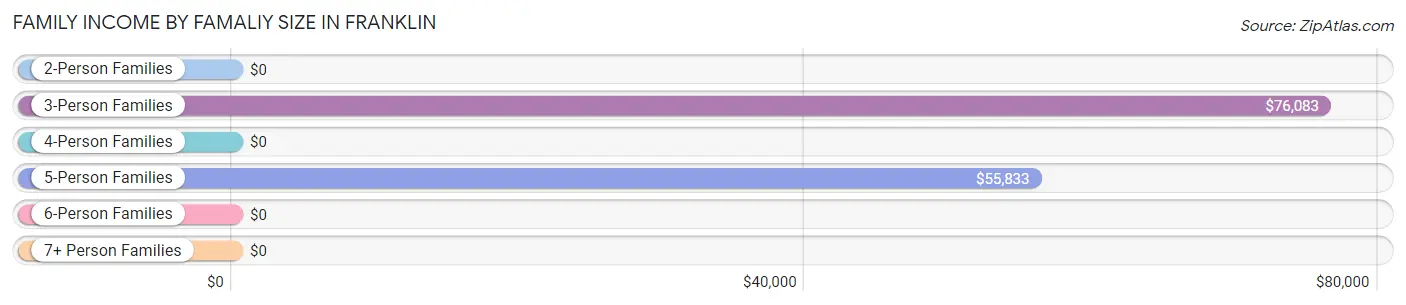
| Income Bracket | # Families | Median Income |
| 2-Person Families | 138 (42.6%) | $0 |
| 3-Person Families | 126 (38.9%) | $76,083 |
| 4-Person Families | 12 (3.7%) | $0 |
| 5-Person Families | 36 (11.1%) | $55,833 |
| 6-Person Families | 7 (2.2%) | $0 |
| 7+ Person Families | 5 (1.5%) | $0 |
| Total | 324 (100.0%) | $56,250 |
Family Income by Number of Earners in Franklin
The median family income in Franklin is $56,250, with families comprising 3+ earners (14) having the highest median family income of $133,000, while families with no earners (41) have the lowest median family income of $38,750, accounting for 4.3% and 12.7% of families, respectively.
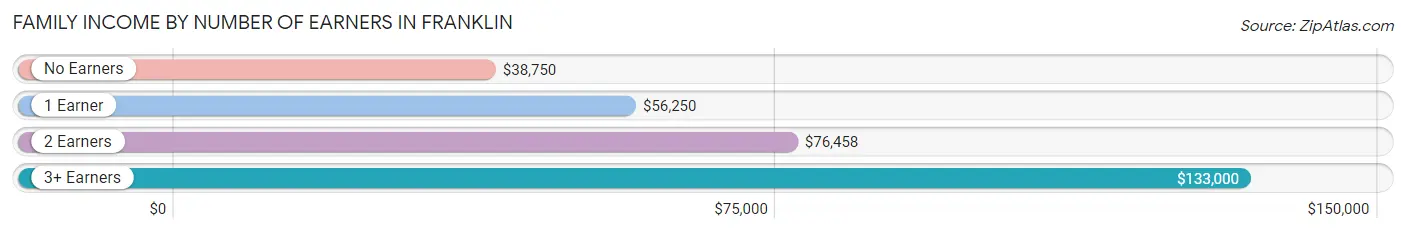
| Number of Earners | # Families | Median Income |
| No Earners | 41 (12.7%) | $38,750 |
| 1 Earner | 146 (45.1%) | $56,250 |
| 2 Earners | 123 (38.0%) | $76,458 |
| 3+ Earners | 14 (4.3%) | $133,000 |
| Total | 324 (100.0%) | $56,250 |
Household Income in Franklin
Household Income Brackets in Franklin
With 88 households falling in the category, the $50,000 to $74,999 income range is the most frequent in Franklin, accounting for 17.2% of all households. In contrast, only 13 households (2.5%) fall into the $200,000+ income bracket, making it the least populous group.
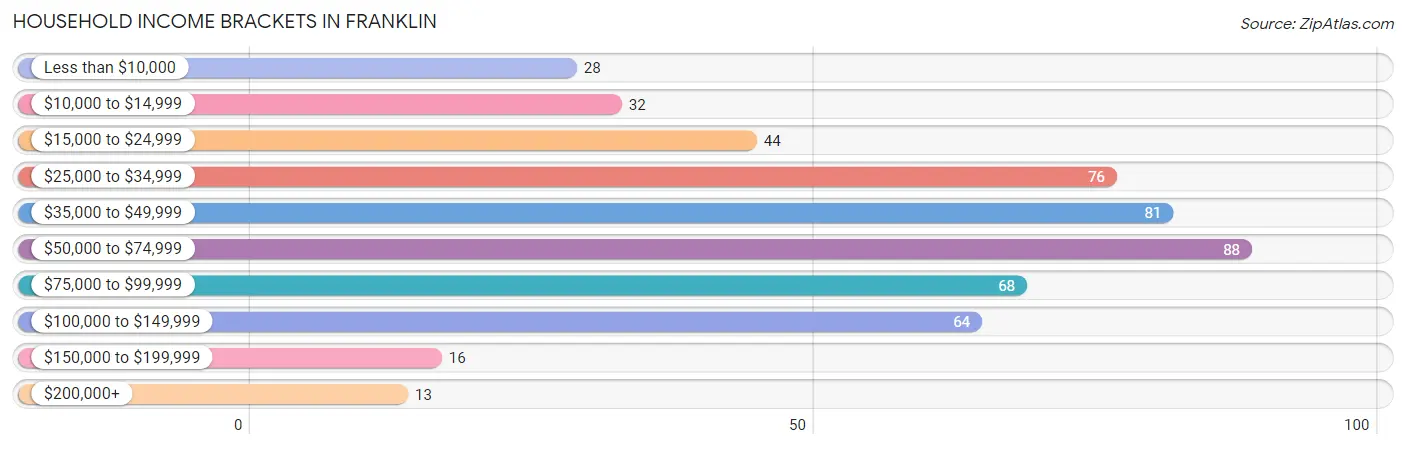
| Income Bracket | # Households | % Households |
| Less than $10,000 | 28 | 5.5% |
| $10,000 to $14,999 | 32 | 6.3% |
| $15,000 to $24,999 | 44 | 8.6% |
| $25,000 to $34,999 | 76 | 14.9% |
| $35,000 to $49,999 | 81 | 15.9% |
| $50,000 to $74,999 | 88 | 17.3% |
| $75,000 to $99,999 | 68 | 13.3% |
| $100,000 to $149,999 | 64 | 12.5% |
| $150,000 to $199,999 | 16 | 3.1% |
| $200,000+ | 13 | 2.5% |
Household Income by Householder Age in Franklin
The median household income in Franklin is $49,063, with the highest median household income of $65,560 found in the 25 to 44 years age bracket for the primary householder. A total of 149 households (29.2%) fall into this category. Meanwhile, the 15 to 24 years age bracket for the primary householder has the lowest median household income of $31,520, with 62 households (12.2%) in this group.
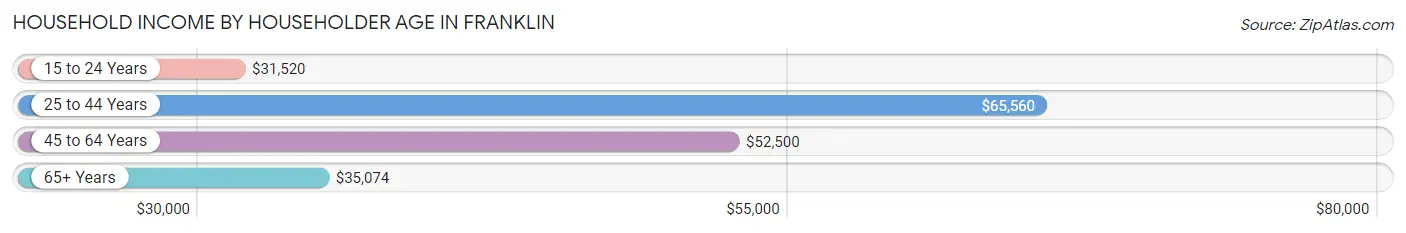
| Income Bracket | # Households | Median Income |
| 15 to 24 Years | 62 (12.2%) | $31,520 |
| 25 to 44 Years | 149 (29.2%) | $65,560 |
| 45 to 64 Years | 194 (38.0%) | $52,500 |
| 65+ Years | 105 (20.6%) | $35,074 |
| Total | 510 (100.0%) | $49,063 |
Poverty in Franklin
Income Below Poverty by Sex and Age in Franklin
With 14.0% poverty level for males and 23.1% for females among the residents of Franklin, 5 year old males and 16 and 17 year old females are the most vulnerable to poverty, with 6 males (75.0%) and 18 females (60.0%) in their respective age groups living below the poverty level.
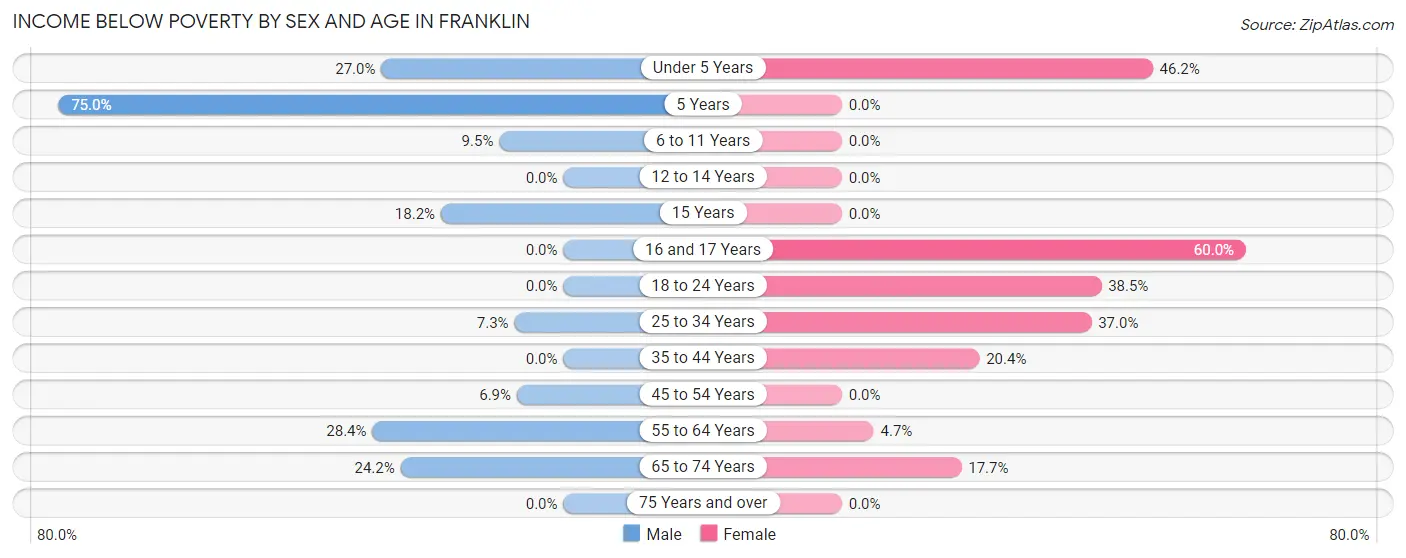
| Age Bracket | Male | Female |
| Under 5 Years | 10 (27.0%) | 30 (46.2%) |
| 5 Years | 6 (75.0%) | 0 (0.0%) |
| 6 to 11 Years | 6 (9.5%) | 0 (0.0%) |
| 12 to 14 Years | 0 (0.0%) | 0 (0.0%) |
| 15 Years | 4 (18.2%) | 0 (0.0%) |
| 16 and 17 Years | 0 (0.0%) | 18 (60.0%) |
| 18 to 24 Years | 0 (0.0%) | 52 (38.5%) |
| 25 to 34 Years | 4 (7.3%) | 10 (37.0%) |
| 35 to 44 Years | 0 (0.0%) | 30 (20.4%) |
| 45 to 54 Years | 6 (6.9%) | 0 (0.0%) |
| 55 to 64 Years | 19 (28.4%) | 5 (4.7%) |
| 65 to 74 Years | 22 (24.2%) | 11 (17.7%) |
| 75 Years and over | 0 (0.0%) | 0 (0.0%) |
| Total | 77 (14.0%) | 156 (23.1%) |
Income Above Poverty by Sex and Age in Franklin
According to the poverty statistics in Franklin, males aged 12 to 14 years and females aged 5 years are the age groups that are most secure financially, with 100.0% of males and 100.0% of females in these age groups living above the poverty line.
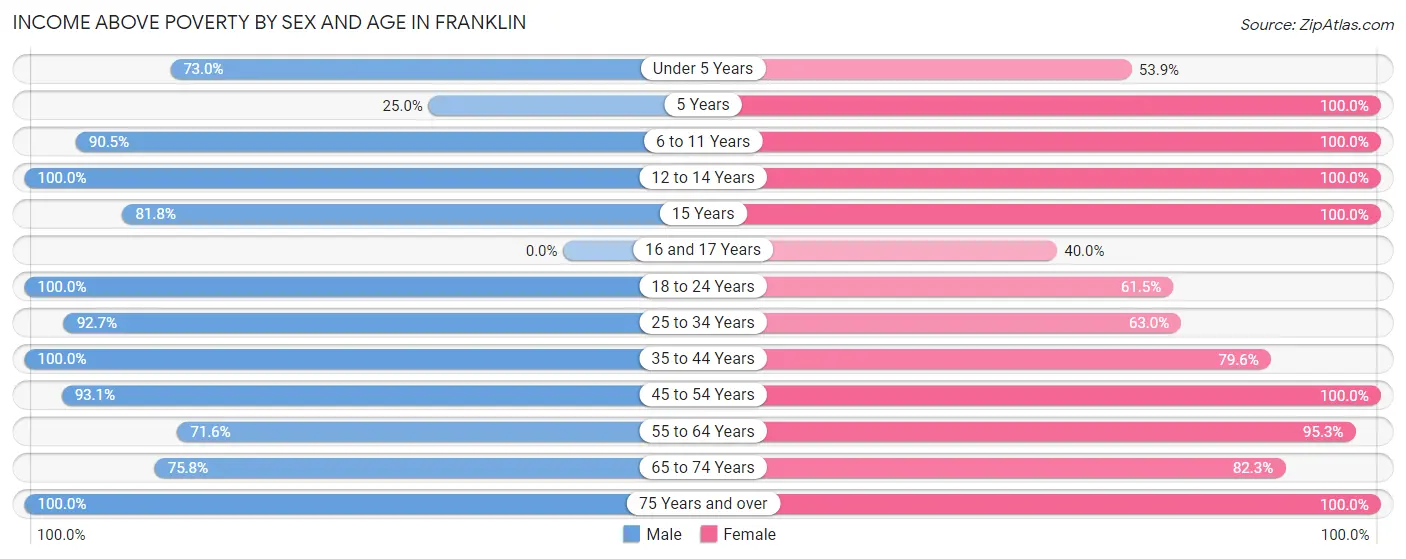
| Age Bracket | Male | Female |
| Under 5 Years | 27 (73.0%) | 35 (53.8%) |
| 5 Years | 2 (25.0%) | 5 (100.0%) |
| 6 to 11 Years | 57 (90.5%) | 36 (100.0%) |
| 12 to 14 Years | 29 (100.0%) | 9 (100.0%) |
| 15 Years | 18 (81.8%) | 3 (100.0%) |
| 16 and 17 Years | 0 (0.0%) | 12 (40.0%) |
| 18 to 24 Years | 23 (100.0%) | 83 (61.5%) |
| 25 to 34 Years | 51 (92.7%) | 17 (63.0%) |
| 35 to 44 Years | 64 (100.0%) | 117 (79.6%) |
| 45 to 54 Years | 81 (93.1%) | 25 (100.0%) |
| 55 to 64 Years | 48 (71.6%) | 101 (95.3%) |
| 65 to 74 Years | 69 (75.8%) | 51 (82.3%) |
| 75 Years and over | 6 (100.0%) | 26 (100.0%) |
| Total | 475 (86.1%) | 520 (76.9%) |
Income Below Poverty Among Married-Couple Families in Franklin
The poverty statistics for married-couple families in Franklin show that 3.9% or 8 of the total 204 families live below the poverty line. Families with 3 or 4 children have the highest poverty rate of 50.0%, comprising of 5 families. On the other hand, families with 1 or 2 children have the lowest poverty rate of 0.0%, which includes 0 families.
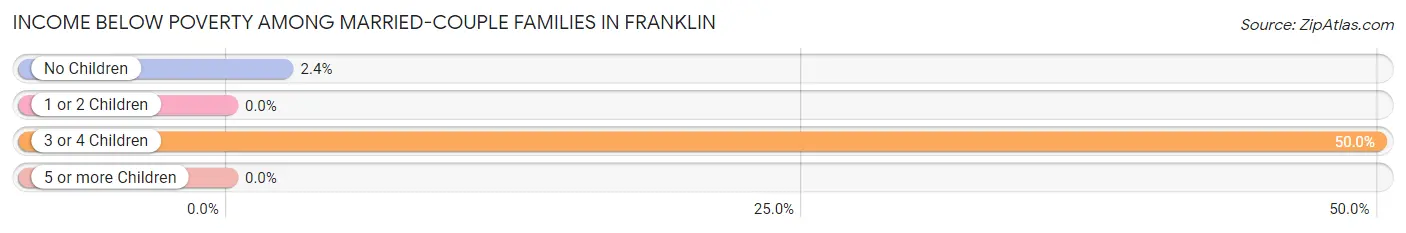
| Children | Above Poverty | Below Poverty |
| No Children | 121 (97.6%) | 3 (2.4%) |
| 1 or 2 Children | 65 (100.0%) | 0 (0.0%) |
| 3 or 4 Children | 5 (50.0%) | 5 (50.0%) |
| 5 or more Children | 5 (100.0%) | 0 (0.0%) |
| Total | 196 (96.1%) | 8 (3.9%) |
Income Below Poverty Among Single-Parent Households in Franklin
According to the poverty data in Franklin, 21.7% or 13 single-father households and 50.0% or 30 single-mother households are living below the poverty line. Among single-father households, those with 1 or 2 children have the highest poverty rate, with 13 households (32.5%) experiencing poverty. Likewise, among single-mother households, those with 1 or 2 children have the highest poverty rate, with 30 households (83.3%) falling below the poverty line.
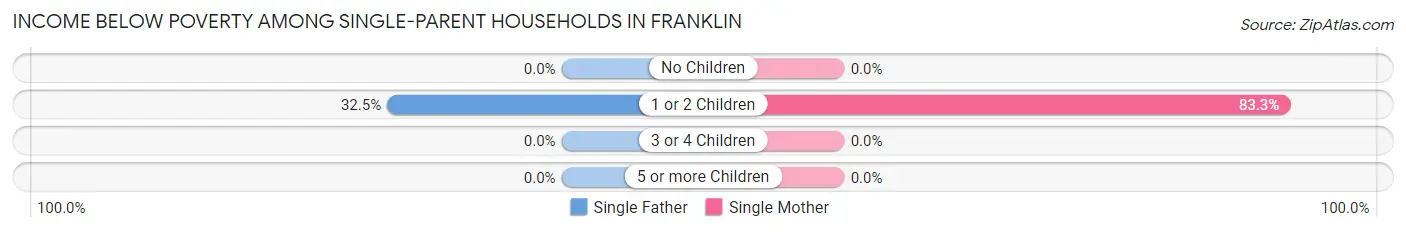
| Children | Single Father | Single Mother |
| No Children | 0 (0.0%) | 0 (0.0%) |
| 1 or 2 Children | 13 (32.5%) | 30 (83.3%) |
| 3 or 4 Children | 0 (0.0%) | 0 (0.0%) |
| 5 or more Children | 0 (0.0%) | 0 (0.0%) |
| Total | 13 (21.7%) | 30 (50.0%) |
Income Below Poverty Among Married-Couple vs Single-Parent Households in Franklin
The poverty data for Franklin shows that 8 of the married-couple family households (3.9%) and 43 of the single-parent households (35.8%) are living below the poverty level. Within the married-couple family households, those with 3 or 4 children have the highest poverty rate, with 5 households (50.0%) falling below the poverty line. Among the single-parent households, those with 1 or 2 children have the highest poverty rate, with 43 household (56.6%) living below poverty.
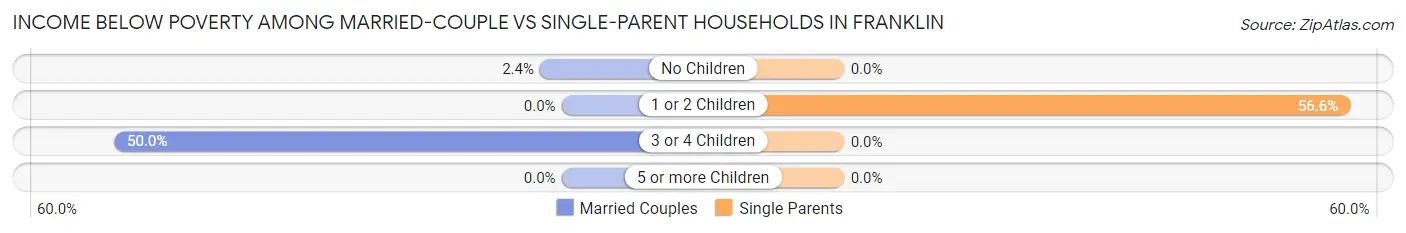
| Children | Married-Couple Families | Single-Parent Households |
| No Children | 3 (2.4%) | 0 (0.0%) |
| 1 or 2 Children | 0 (0.0%) | 43 (56.6%) |
| 3 or 4 Children | 5 (50.0%) | 0 (0.0%) |
| 5 or more Children | 0 (0.0%) | 0 (0.0%) |
| Total | 8 (3.9%) | 43 (35.8%) |
Race in Franklin
The most populous races in Franklin are White / Caucasian (957 | 70.7%), Black / African American (288 | 21.3%), and Hispanic or Latino (107 | 7.9%).
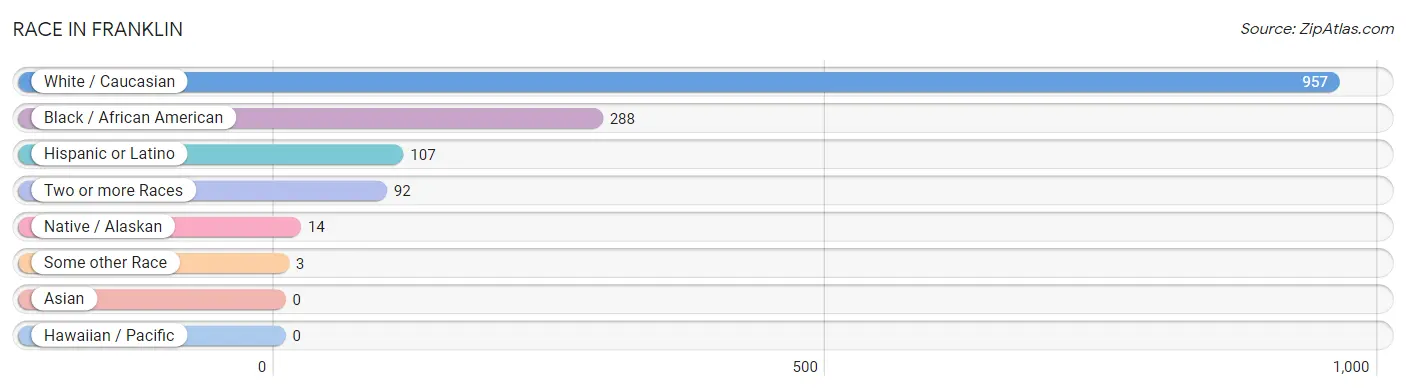
| Race | # Population | % Population |
| Asian | 0 | 0.0% |
| Black / African American | 288 | 21.3% |
| Hawaiian / Pacific | 0 | 0.0% |
| Hispanic or Latino | 107 | 7.9% |
| Native / Alaskan | 14 | 1.0% |
| White / Caucasian | 957 | 70.7% |
| Two or more Races | 92 | 6.8% |
| Some other Race | 3 | 0.2% |
| Total | 1,354 | 100.0% |
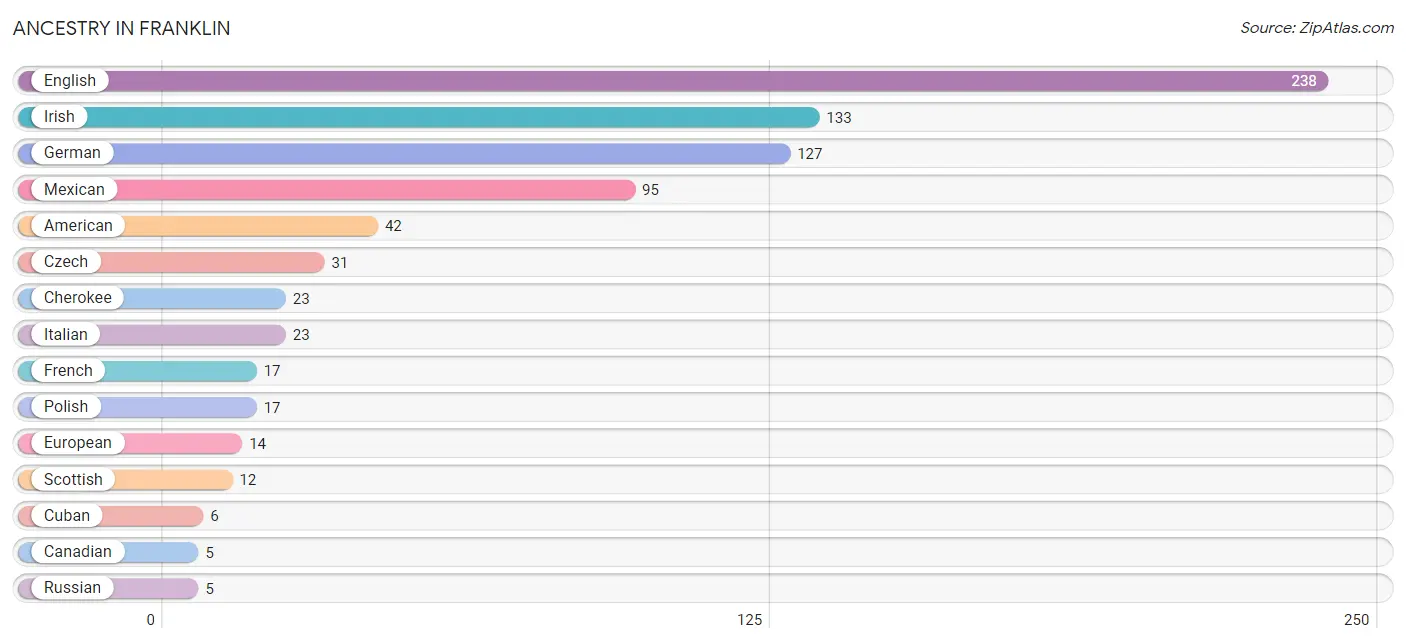
Ancestry in Franklin
The most populous ancestries reported in Franklin are English (238 | 17.6%), Irish (133 | 9.8%), German (127 | 9.4%), Mexican (95 | 7.0%), and American (42 | 3.1%), together accounting for 46.9% of all Franklin residents.
| Ancestry | # Population | % Population |
| American | 42 | 3.1% |
| Armenian | 4 | 0.3% |
| Canadian | 5 | 0.4% |
| Central American | 3 | 0.2% |
| Cherokee | 23 | 1.7% |
| Cuban | 6 | 0.4% |
| Czech | 31 | 2.3% |
| Dutch | 2 | 0.2% |
| English | 238 | 17.6% |
| European | 14 | 1.0% |
| French | 17 | 1.3% |
| German | 127 | 9.4% |
| Honduran | 3 | 0.2% |
| Irish | 133 | 9.8% |
| Italian | 23 | 1.7% |
| Mexican | 95 | 7.0% |
| Polish | 17 | 1.3% |
| Russian | 5 | 0.4% |
| Scotch-Irish | 4 | 0.3% |
| Scottish | 12 | 0.9% |
| Welsh | 5 | 0.4% | View All 21 Rows |
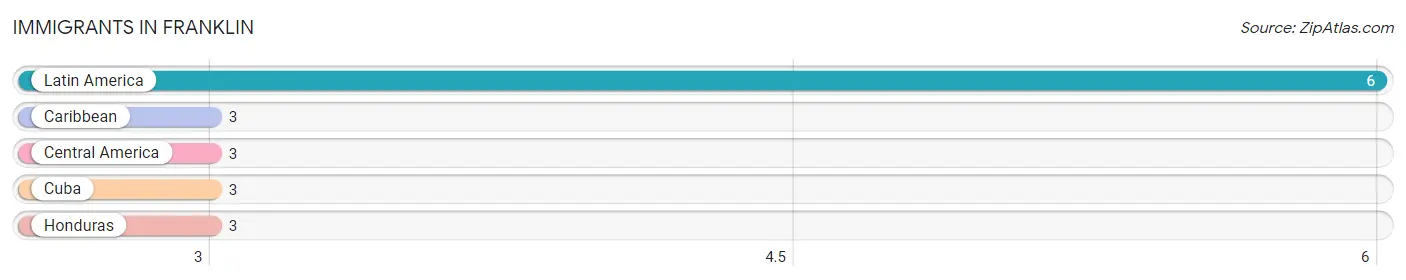
Immigrants in Franklin
The most numerous immigrant groups reported in Franklin came from Latin America (6 | 0.4%), Caribbean (3 | 0.2%), Central America (3 | 0.2%), Cuba (3 | 0.2%), and Honduras (3 | 0.2%), together accounting for 1.3% of all Franklin residents.
| Immigration Origin | # Population | % Population |
| Caribbean | 3 | 0.2% |
| Central America | 3 | 0.2% |
| Cuba | 3 | 0.2% |
| Honduras | 3 | 0.2% |
| Latin America | 6 | 0.4% | View All 5 Rows |
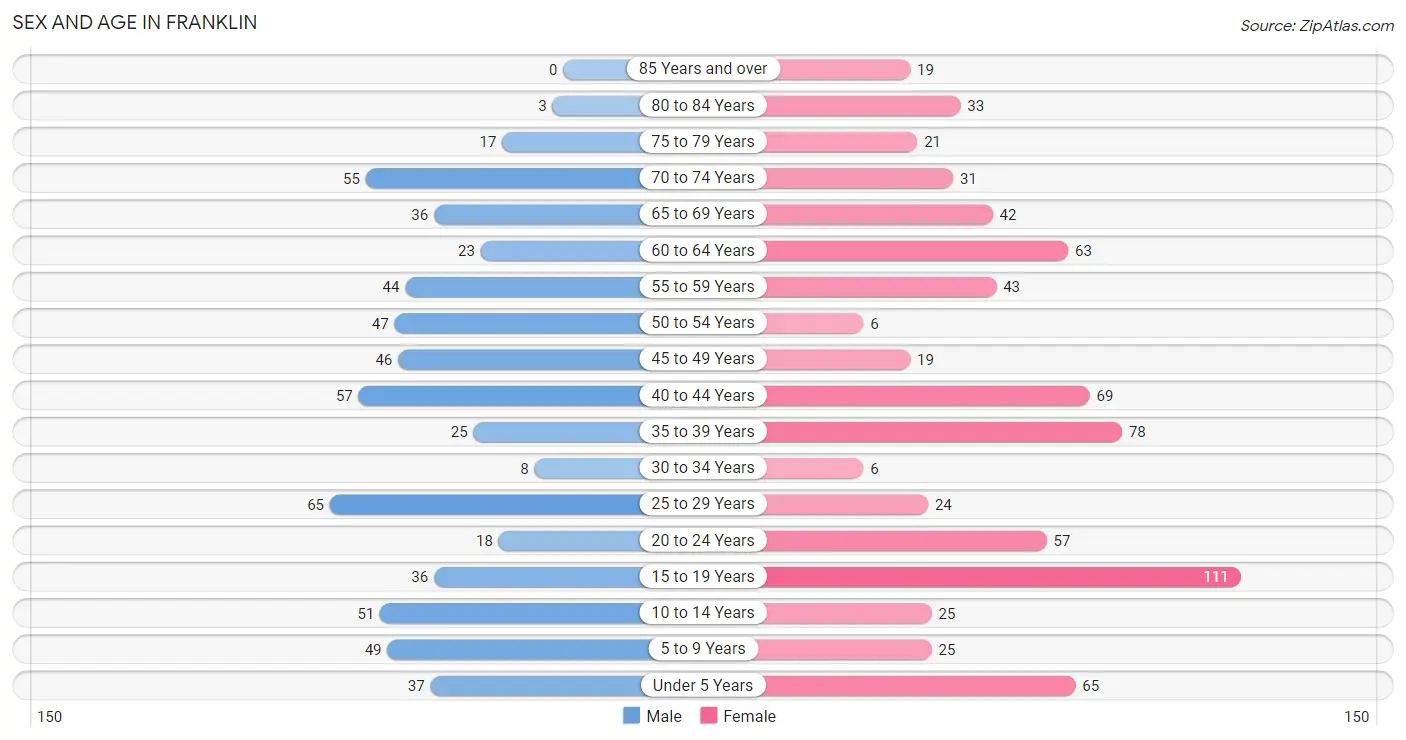
Sex and Age in Franklin
Sex and Age in Franklin
The most populous age groups in Franklin are 25 to 29 Years (65 | 10.5%) for men and 15 to 19 Years (111 | 15.1%) for women.
| Age Bracket | Male | Female |
| Under 5 Years | 37 (6.0%) | 65 (8.8%) |
| 5 to 9 Years | 49 (7.9%) | 25 (3.4%) |
| 10 to 14 Years | 51 (8.3%) | 25 (3.4%) |
| 15 to 19 Years | 36 (5.8%) | 111 (15.1%) |
| 20 to 24 Years | 18 (2.9%) | 57 (7.7%) |
| 25 to 29 Years | 65 (10.5%) | 24 (3.3%) |
| 30 to 34 Years | 8 (1.3%) | 6 (0.8%) |
| 35 to 39 Years | 25 (4.1%) | 78 (10.6%) |
| 40 to 44 Years | 57 (9.2%) | 69 (9.4%) |
| 45 to 49 Years | 46 (7.5%) | 19 (2.6%) |
| 50 to 54 Years | 47 (7.6%) | 6 (0.8%) |
| 55 to 59 Years | 44 (7.1%) | 43 (5.8%) |
| 60 to 64 Years | 23 (3.7%) | 63 (8.6%) |
| 65 to 69 Years | 36 (5.8%) | 42 (5.7%) |
| 70 to 74 Years | 55 (8.9%) | 31 (4.2%) |
| 75 to 79 Years | 17 (2.8%) | 21 (2.9%) |
| 80 to 84 Years | 3 (0.5%) | 33 (4.5%) |
| 85 Years and over | 0 (0.0%) | 19 (2.6%) |
| Total | 617 (100.0%) | 737 (100.0%) |
Families and Households in Franklin
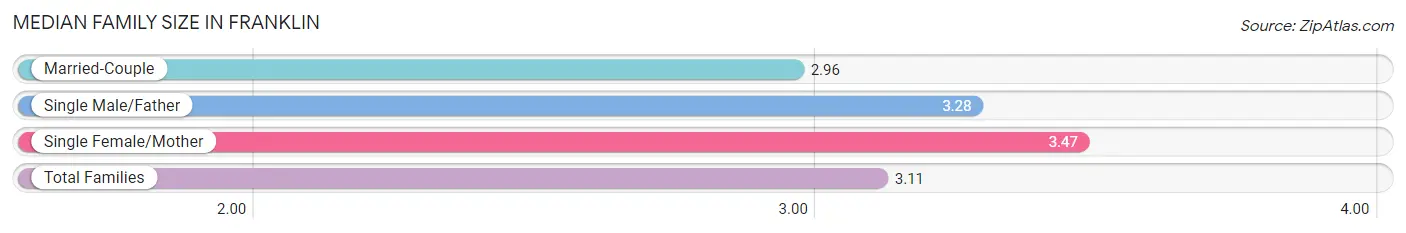
Median Family Size in Franklin
The median family size in Franklin is 3.11 persons per family, with single female/mother families (60 | 18.5%) accounting for the largest median family size of 3.47 persons per family. On the other hand, married-couple families (204 | 63.0%) represent the smallest median family size with 2.96 persons per family.
| Family Type | # Families | Family Size |
| Married-Couple | 204 (63.0%) | 2.96 |
| Single Male/Father | 60 (18.5%) | 3.28 |
| Single Female/Mother | 60 (18.5%) | 3.47 |
| Total Families | 324 (100.0%) | 3.11 |
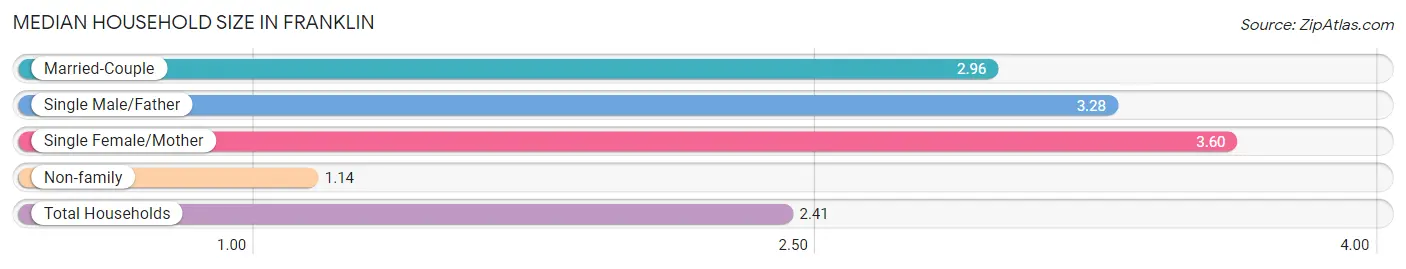
Median Household Size in Franklin
The median household size in Franklin is 2.41 persons per household, with single female/mother households (60 | 11.8%) accounting for the largest median household size of 3.6 persons per household. non-family households (186 | 36.5%) represent the smallest median household size with 1.14 persons per household.
| Household Type | # Households | Household Size |
| Married-Couple | 204 (40.0%) | 2.96 |
| Single Male/Father | 60 (11.8%) | 3.28 |
| Single Female/Mother | 60 (11.8%) | 3.60 |
| Non-family | 186 (36.5%) | 1.14 |
| Total Households | 510 (100.0%) | 2.41 |
Household Size by Marriage Status in Franklin
Out of a total of 510 households in Franklin, 324 (63.5%) are family households, while 186 (36.5%) are nonfamily households. The most numerous type of family households are 2-person households, comprising 138, and the most common type of nonfamily households are 1-person households, comprising 165.
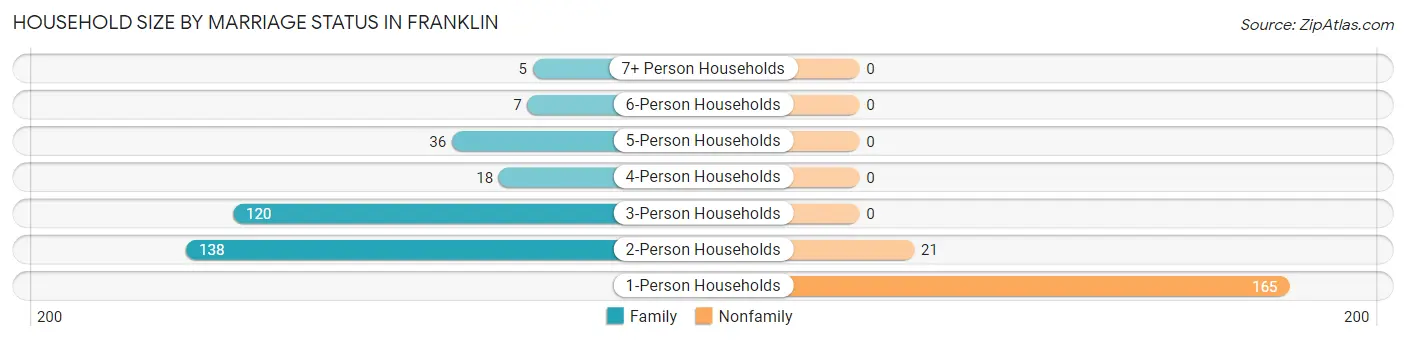
| Household Size | Family Households | Nonfamily Households |
| 1-Person Households | - | 165 (32.4%) |
| 2-Person Households | 138 (27.1%) | 21 (4.1%) |
| 3-Person Households | 120 (23.5%) | 0 (0.0%) |
| 4-Person Households | 18 (3.5%) | 0 (0.0%) |
| 5-Person Households | 36 (7.1%) | 0 (0.0%) |
| 6-Person Households | 7 (1.4%) | 0 (0.0%) |
| 7+ Person Households | 5 (1.0%) | 0 (0.0%) |
| Total | 324 (63.5%) | 186 (36.5%) |
Female Fertility in Franklin
Fertility by Age in Franklin
Average fertility rate in Franklin is 143.0 births per 1,000 women. Women in the age bracket of 15 to 19 years have the highest fertility rate with 468.0 births per 1,000 women. Women in the age bracket of 15 to 19 years acount for 100.0% of all women with births.
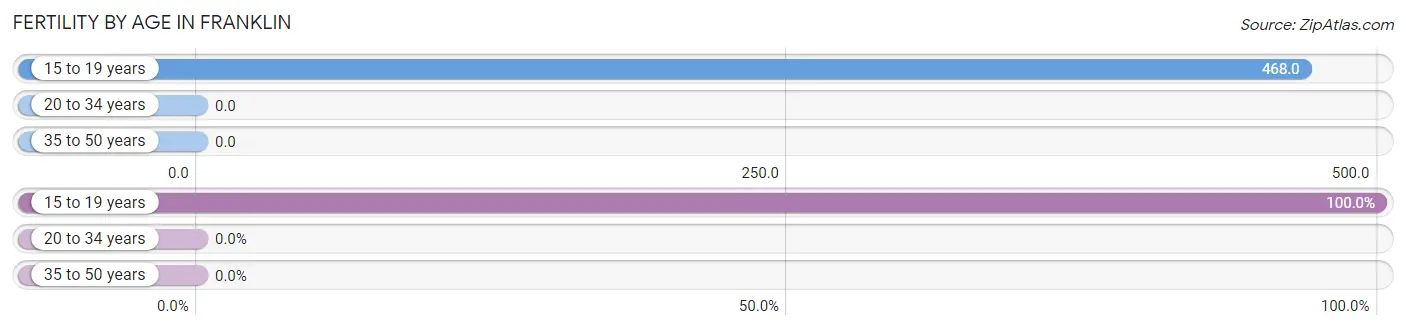
| Age Bracket | Women with Births | Births / 1,000 Women |
| 15 to 19 years | 52 (100.0%) | 468.0 |
| 20 to 34 years | 0 (0.0%) | 0.0 |
| 35 to 50 years | 0 (0.0%) | 0.0 |
| Total | 52 (100.0%) | 143.0 |
Fertility by Age by Marriage Status in Franklin
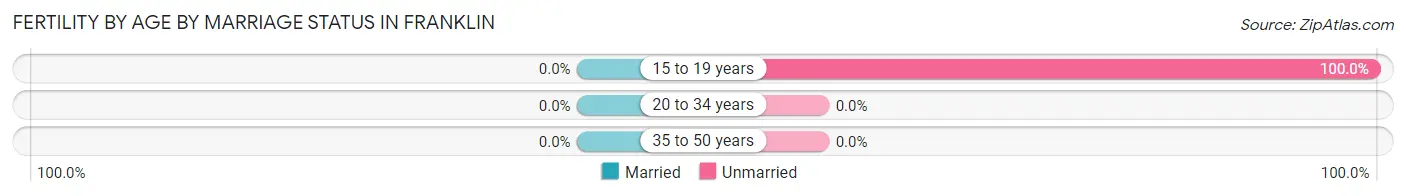
| Age Bracket | Married | Unmarried |
| 15 to 19 years | 0 (0.0%) | 52 (100.0%) |
| 20 to 34 years | 0 (0.0%) | 0 (0.0%) |
| 35 to 50 years | 0 (0.0%) | 0 (0.0%) |
| Total | 0 (0.0%) | 52 (100.0%) |
Fertility by Education in Franklin
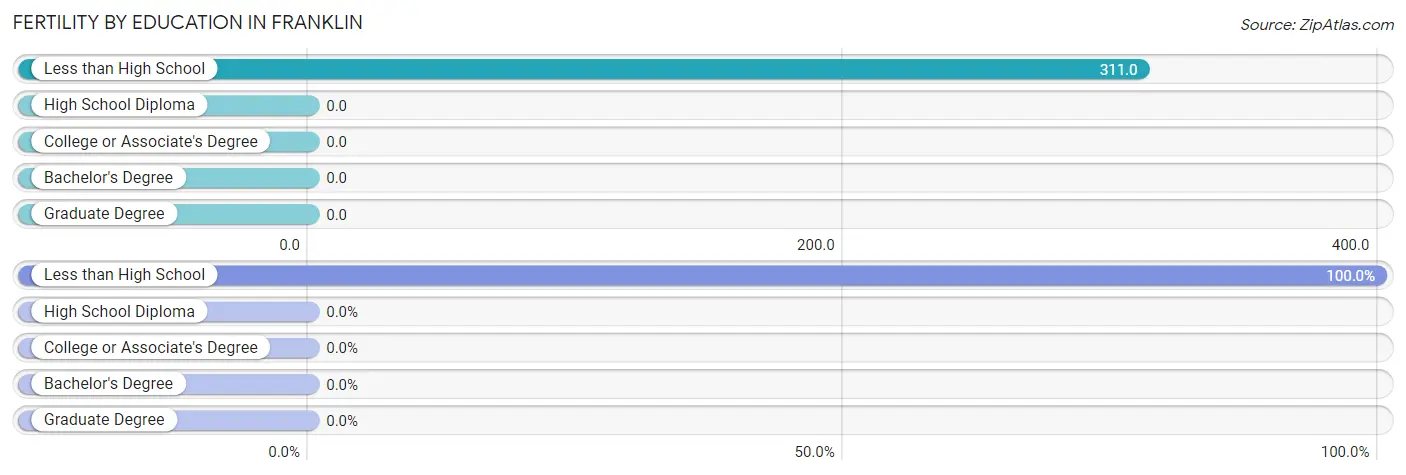
| Educational Attainment | Women with Births | Births / 1,000 Women |
| Less than High School | 52 (100.0%) | 311.0 |
| High School Diploma | 0 (0.0%) | 0.0 |
| College or Associate's Degree | 0 (0.0%) | 0.0 |
| Bachelor's Degree | 0 (0.0%) | 0.0 |
| Graduate Degree | 0 (0.0%) | 0.0 |
| Total | 52 (100.0%) | 143.0 |
Fertility by Education by Marriage Status in Franklin
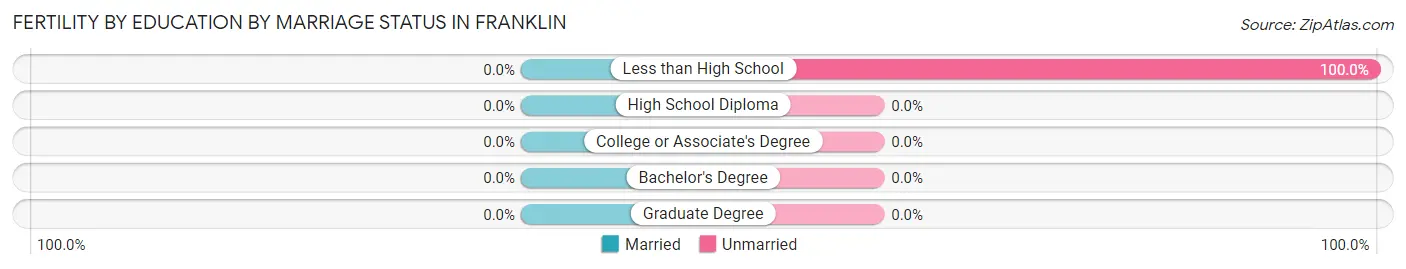
| Educational Attainment | Married | Unmarried |
| Less than High School | 0 (0.0%) | 52 (100.0%) |
| High School Diploma | 0 (0.0%) | 0 (0.0%) |
| College or Associate's Degree | 0 (0.0%) | 0 (0.0%) |
| Bachelor's Degree | 0 (0.0%) | 0 (0.0%) |
| Graduate Degree | 0 (0.0%) | 0 (0.0%) |
| Total | 0 (0.0%) | 52 (100.0%) |
Employment Characteristics in Franklin
Employment by Class of Employer in Franklin
Among the 517 employed individuals in Franklin, private company employees (362 | 70.0%), local government employees (83 | 16.1%), and not-for-profit organizations (25 | 4.8%) make up the most common classes of employment.
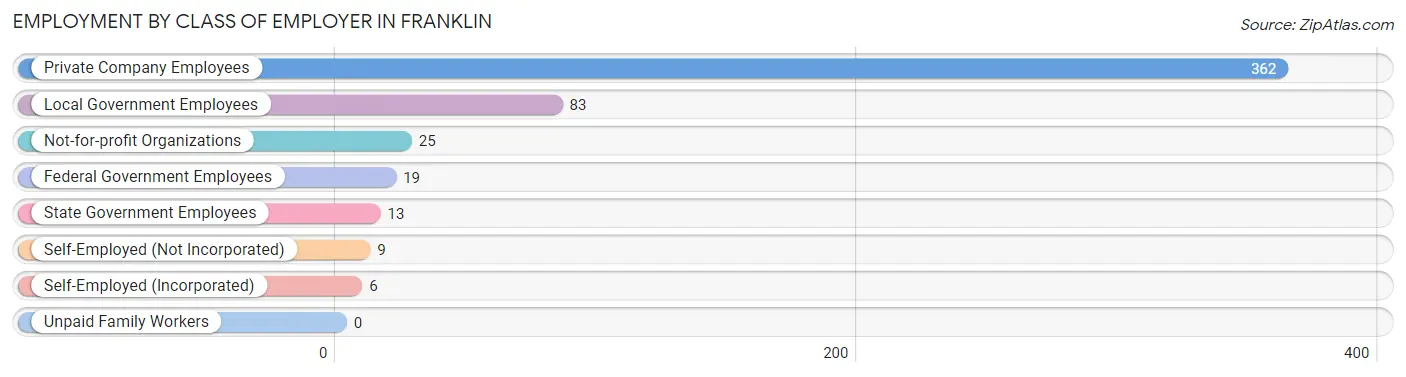
| Employer Class | # Employees | % Employees |
| Private Company Employees | 362 | 70.0% |
| Self-Employed (Incorporated) | 6 | 1.2% |
| Self-Employed (Not Incorporated) | 9 | 1.7% |
| Not-for-profit Organizations | 25 | 4.8% |
| Local Government Employees | 83 | 16.1% |
| State Government Employees | 13 | 2.5% |
| Federal Government Employees | 19 | 3.7% |
| Unpaid Family Workers | 0 | 0.0% |
| Total | 517 | 100.0% |
Employment Status by Age in Franklin
According to the labor force statistics for Franklin, out of the total population over 16 years of age (1,077), 53.1% or 572 individuals are in the labor force, with 9.6% or 55 of them unemployed. The age group with the highest labor force participation rate is 20 to 24 years, with 88.0% or 66 individuals in the labor force. Within the labor force, the 20 to 24 years age range has the highest percentage of unemployed individuals, with 83.3% or 55 of them being unemployed.
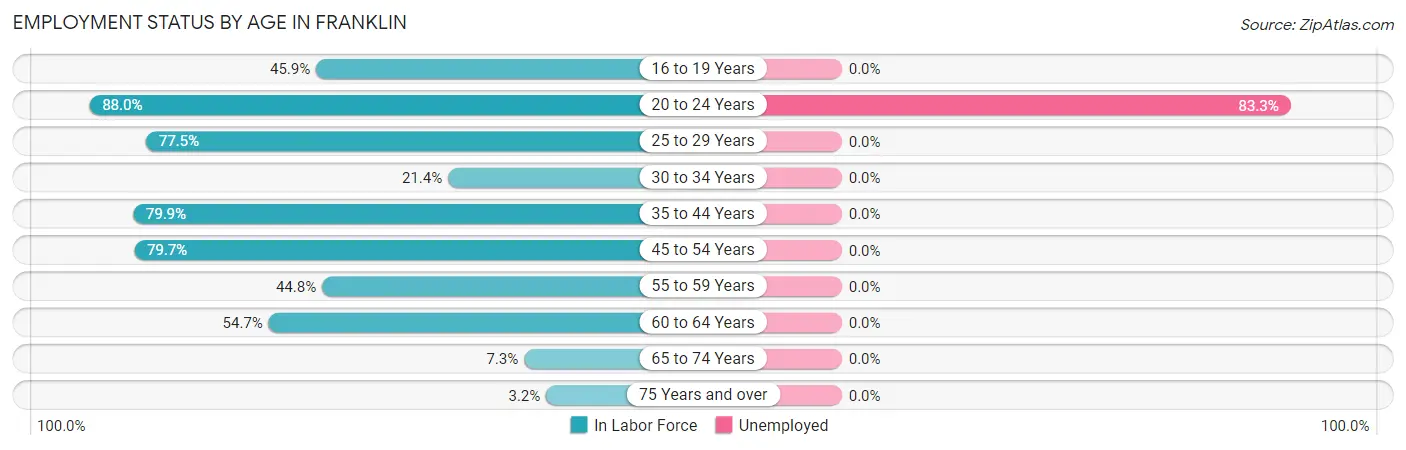
| Age Bracket | In Labor Force | Unemployed |
| 16 to 19 Years | 56 (45.9%) | 0 (0.0%) |
| 20 to 24 Years | 66 (88.0%) | 55 (83.3%) |
| 25 to 29 Years | 69 (77.5%) | 0 (0.0%) |
| 30 to 34 Years | 3 (21.4%) | 0 (0.0%) |
| 35 to 44 Years | 183 (79.9%) | 0 (0.0%) |
| 45 to 54 Years | 94 (79.7%) | 0 (0.0%) |
| 55 to 59 Years | 39 (44.8%) | 0 (0.0%) |
| 60 to 64 Years | 47 (54.7%) | 0 (0.0%) |
| 65 to 74 Years | 12 (7.3%) | 0 (0.0%) |
| 75 Years and over | 3 (3.2%) | 0 (0.0%) |
| Total | 572 (53.1%) | 55 (9.6%) |
Employment Status by Educational Attainment in Franklin
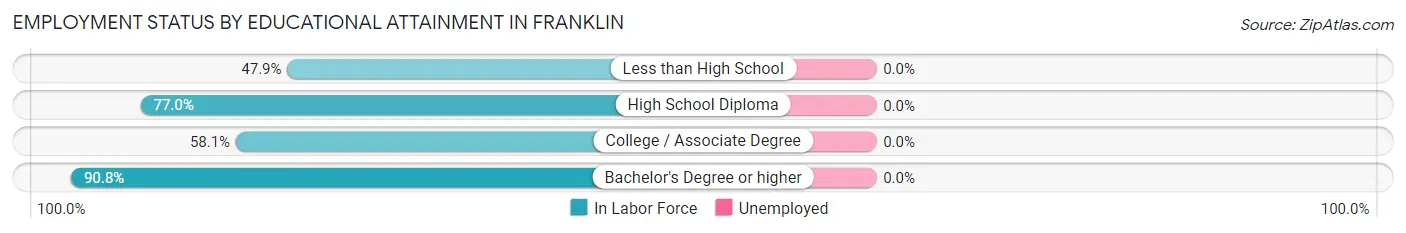
| Educational Attainment | In Labor Force | Unemployed |
| Less than High School | 23 (47.9%) | 0 (0.0%) |
| High School Diploma | 201 (77.0%) | 0 (0.0%) |
| College / Associate Degree | 132 (58.1%) | 0 (0.0%) |
| Bachelor's Degree or higher | 79 (90.8%) | 0 (0.0%) |
| Total | 435 (69.8%) | 0 (0.0%) |
Employment Occupations by Sex in Franklin
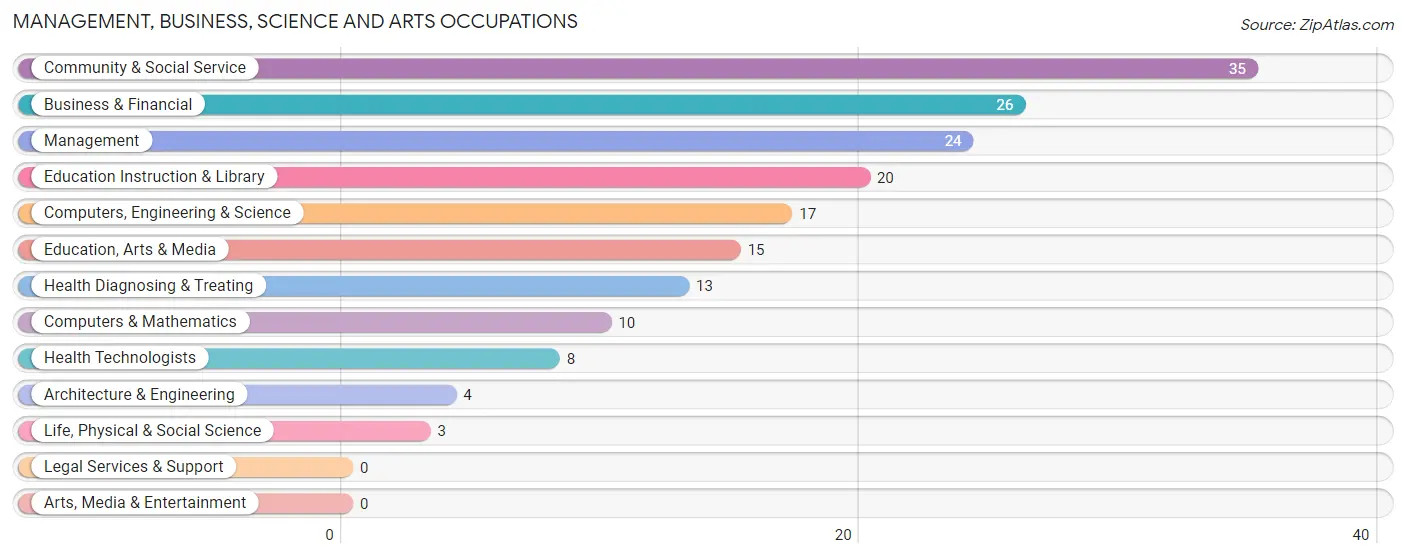
Management, Business, Science and Arts Occupations
The most common Management, Business, Science and Arts occupations in Franklin are Community & Social Service (35 | 6.8%), Business & Financial (26 | 5.0%), Management (24 | 4.6%), Education Instruction & Library (20 | 3.9%), and Computers, Engineering & Science (17 | 3.3%).
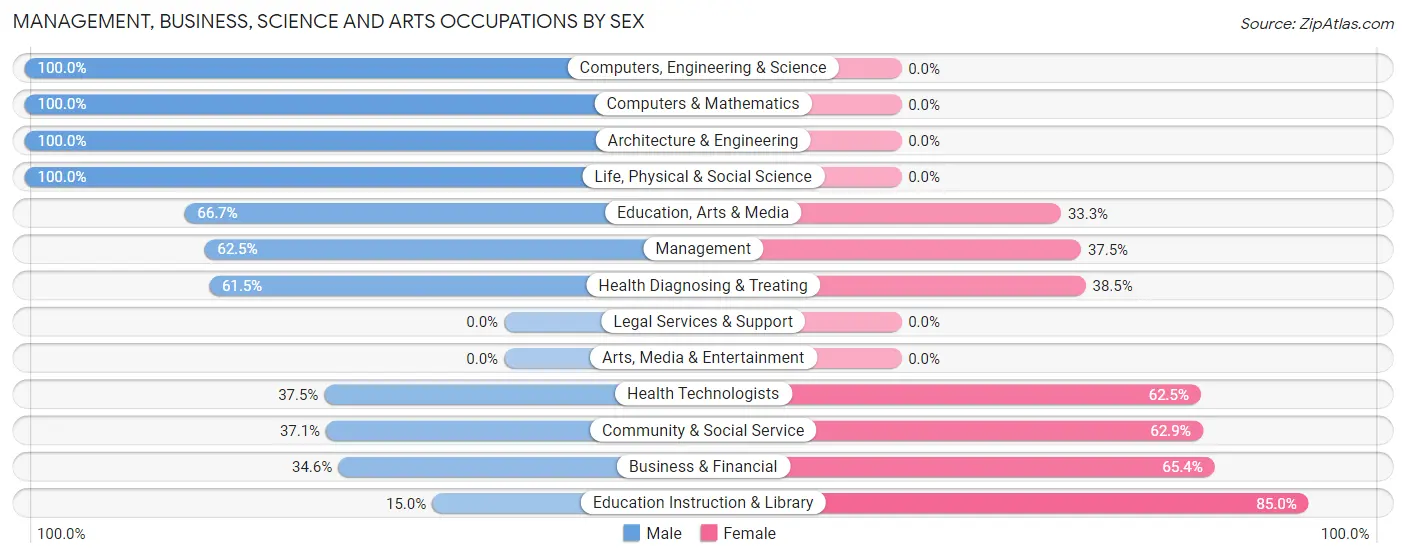
Management, Business, Science and Arts Occupations by Sex
Within the Management, Business, Science and Arts occupations in Franklin, the most male-oriented occupations are Computers, Engineering & Science (100.0%), Computers & Mathematics (100.0%), and Architecture & Engineering (100.0%), while the most female-oriented occupations are Education Instruction & Library (85.0%), Business & Financial (65.4%), and Community & Social Service (62.9%).
| Occupation | Male | Female |
| Management | 15 (62.5%) | 9 (37.5%) |
| Business & Financial | 9 (34.6%) | 17 (65.4%) |
| Computers, Engineering & Science | 17 (100.0%) | 0 (0.0%) |
| Computers & Mathematics | 10 (100.0%) | 0 (0.0%) |
| Architecture & Engineering | 4 (100.0%) | 0 (0.0%) |
| Life, Physical & Social Science | 3 (100.0%) | 0 (0.0%) |
| Community & Social Service | 13 (37.1%) | 22 (62.9%) |
| Education, Arts & Media | 10 (66.7%) | 5 (33.3%) |
| Legal Services & Support | 0 (0.0%) | 0 (0.0%) |
| Education Instruction & Library | 3 (15.0%) | 17 (85.0%) |
| Arts, Media & Entertainment | 0 (0.0%) | 0 (0.0%) |
| Health Diagnosing & Treating | 8 (61.5%) | 5 (38.5%) |
| Health Technologists | 3 (37.5%) | 5 (62.5%) |
| Total (Category) | 62 (53.9%) | 53 (46.1%) |
| Total (Overall) | 241 (46.6%) | 276 (53.4%) |
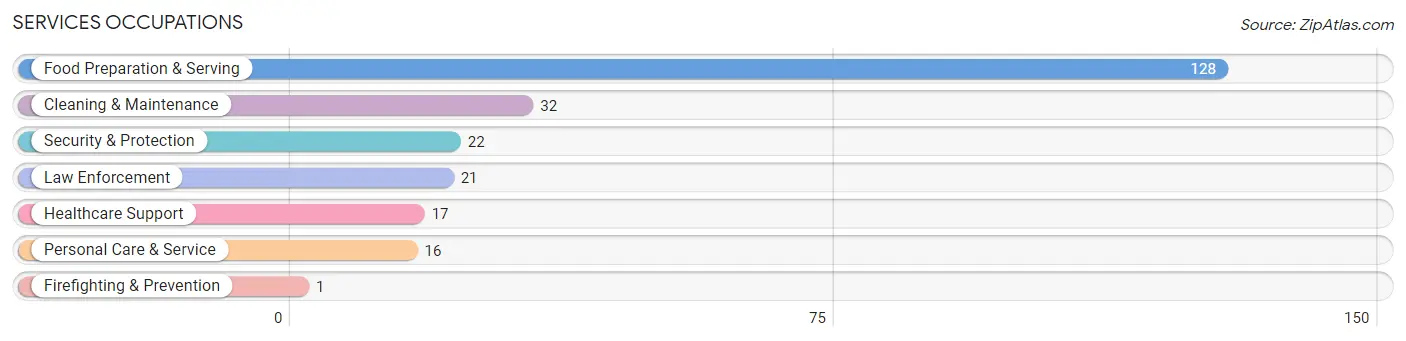
Services Occupations
The most common Services occupations in Franklin are Food Preparation & Serving (128 | 24.8%), Cleaning & Maintenance (32 | 6.2%), Security & Protection (22 | 4.3%), Law Enforcement (21 | 4.1%), and Healthcare Support (17 | 3.3%).
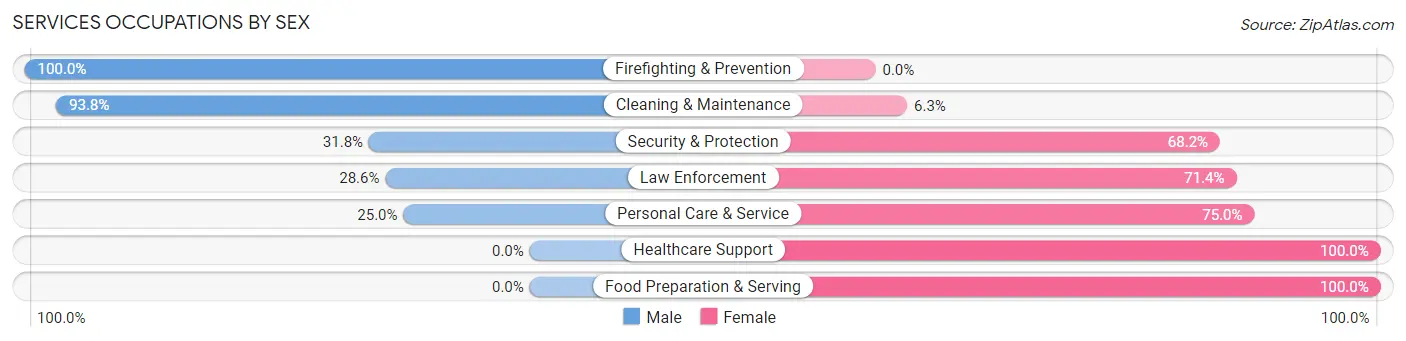
Services Occupations by Sex
Within the Services occupations in Franklin, the most male-oriented occupations are Firefighting & Prevention (100.0%), Cleaning & Maintenance (93.8%), and Security & Protection (31.8%), while the most female-oriented occupations are Healthcare Support (100.0%), Food Preparation & Serving (100.0%), and Personal Care & Service (75.0%).
| Occupation | Male | Female |
| Healthcare Support | 0 (0.0%) | 17 (100.0%) |
| Security & Protection | 7 (31.8%) | 15 (68.2%) |
| Firefighting & Prevention | 1 (100.0%) | 0 (0.0%) |
| Law Enforcement | 6 (28.6%) | 15 (71.4%) |
| Food Preparation & Serving | 0 (0.0%) | 128 (100.0%) |
| Cleaning & Maintenance | 30 (93.8%) | 2 (6.2%) |
| Personal Care & Service | 4 (25.0%) | 12 (75.0%) |
| Total (Category) | 41 (19.1%) | 174 (80.9%) |
| Total (Overall) | 241 (46.6%) | 276 (53.4%) |
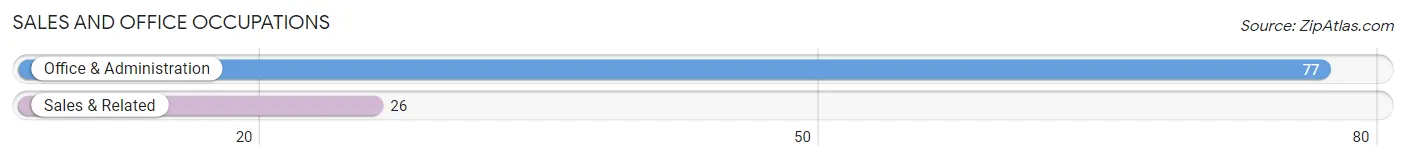
Sales and Office Occupations
The most common Sales and Office occupations in Franklin are Office & Administration (77 | 14.9%), and Sales & Related (26 | 5.0%).
Sales and Office Occupations by Sex
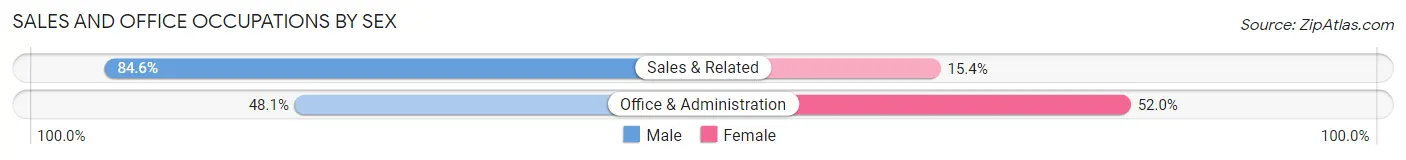
| Occupation | Male | Female |
| Sales & Related | 22 (84.6%) | 4 (15.4%) |
| Office & Administration | 37 (48.0%) | 40 (51.9%) |
| Total (Category) | 59 (57.3%) | 44 (42.7%) |
| Total (Overall) | 241 (46.6%) | 276 (53.4%) |
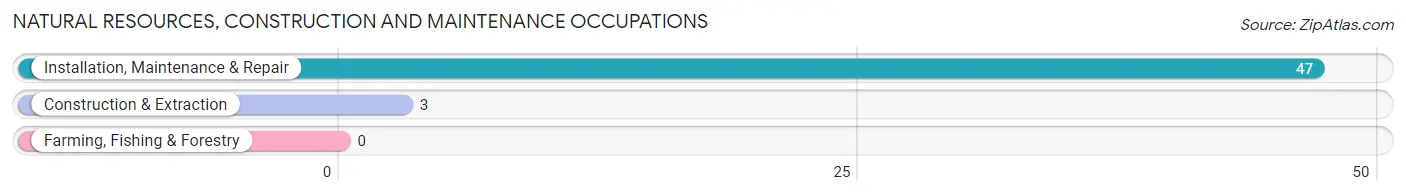
Natural Resources, Construction and Maintenance Occupations
The most common Natural Resources, Construction and Maintenance occupations in Franklin are Installation, Maintenance & Repair (47 | 9.1%), and Construction & Extraction (3 | 0.6%).
Natural Resources, Construction and Maintenance Occupations by Sex
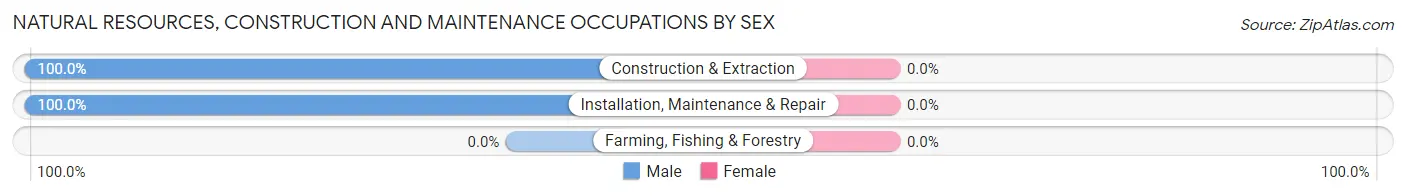
| Occupation | Male | Female |
| Farming, Fishing & Forestry | 0 (0.0%) | 0 (0.0%) |
| Construction & Extraction | 3 (100.0%) | 0 (0.0%) |
| Installation, Maintenance & Repair | 47 (100.0%) | 0 (0.0%) |
| Total (Category) | 50 (100.0%) | 0 (0.0%) |
| Total (Overall) | 241 (46.6%) | 276 (53.4%) |
Production, Transportation and Moving Occupations
The most common Production, Transportation and Moving occupations in Franklin are Transportation (30 | 5.8%), and Material Moving (4 | 0.8%).
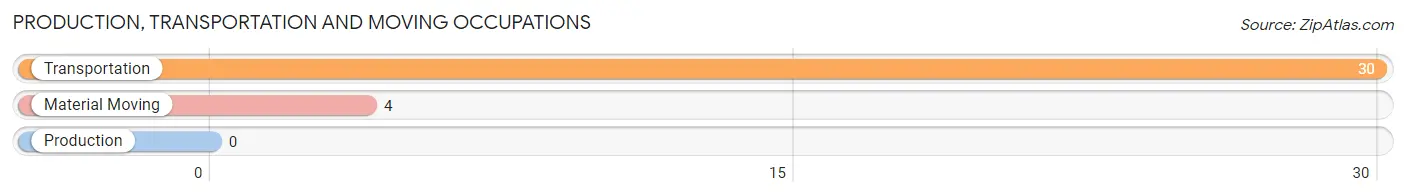
Production, Transportation and Moving Occupations by Sex
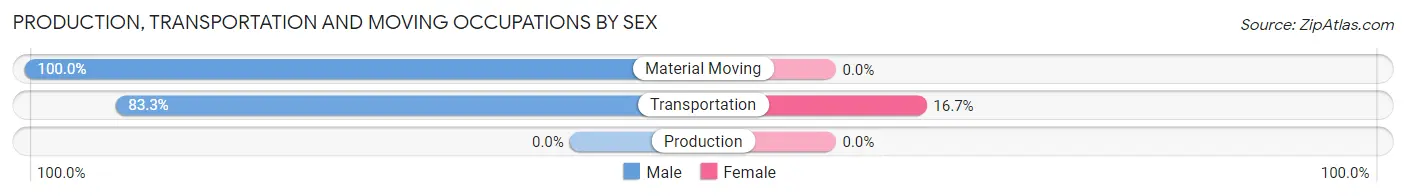
| Occupation | Male | Female |
| Production | 0 (0.0%) | 0 (0.0%) |
| Transportation | 25 (83.3%) | 5 (16.7%) |
| Material Moving | 4 (100.0%) | 0 (0.0%) |
| Total (Category) | 29 (85.3%) | 5 (14.7%) |
| Total (Overall) | 241 (46.6%) | 276 (53.4%) |
Employment Industries by Sex in Franklin
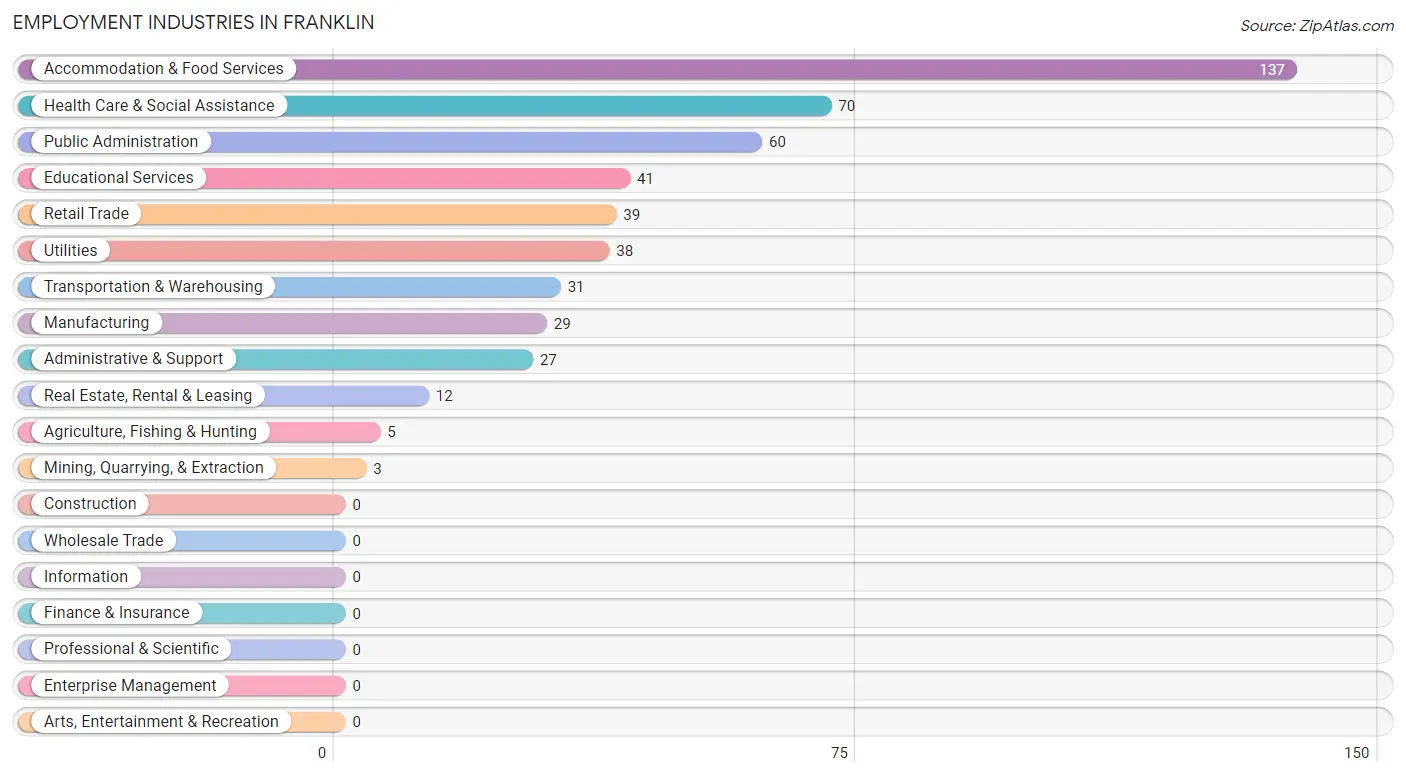
Employment Industries in Franklin
The major employment industries in Franklin include Accommodation & Food Services (137 | 26.5%), Health Care & Social Assistance (70 | 13.5%), Public Administration (60 | 11.6%), Educational Services (41 | 7.9%), and Retail Trade (39 | 7.5%).
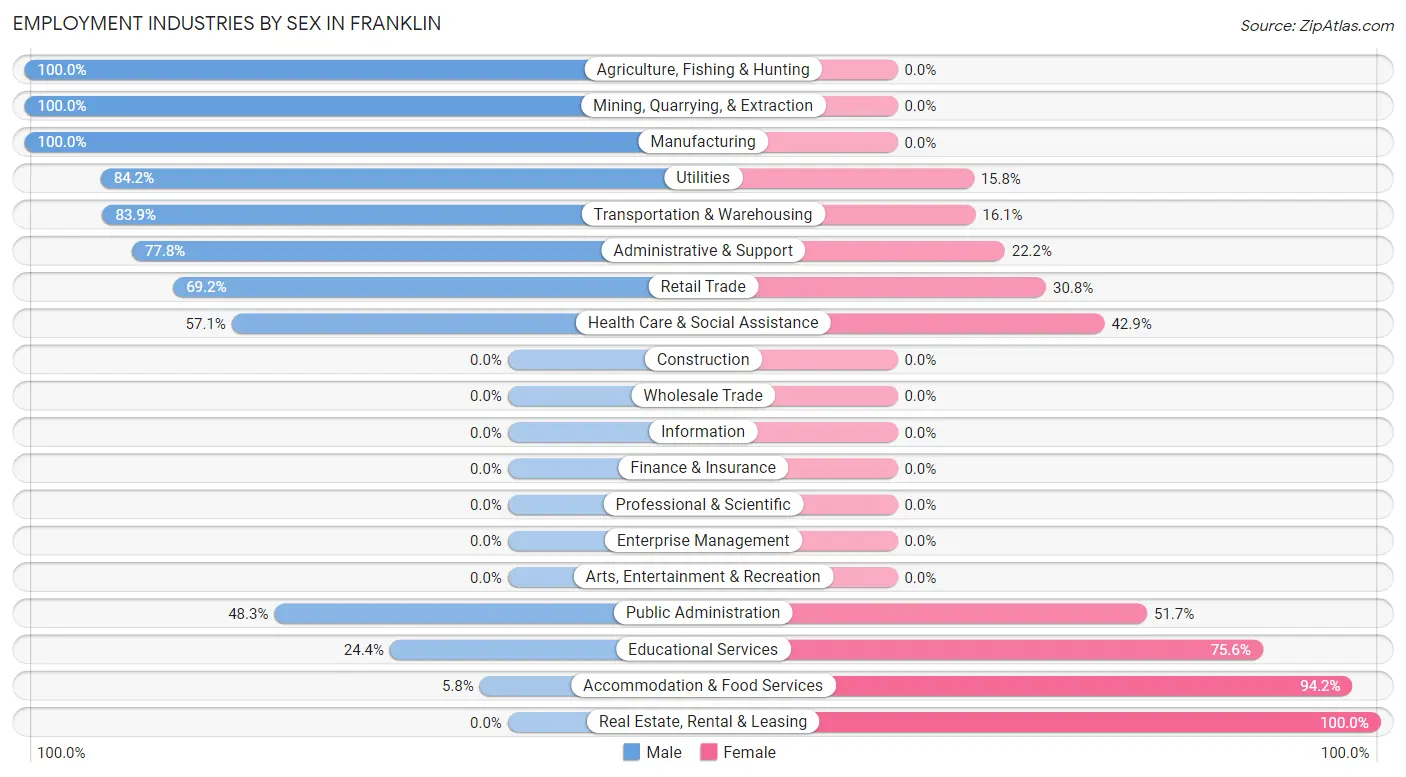
Employment Industries by Sex in Franklin
The Franklin industries that see more men than women are Agriculture, Fishing & Hunting (100.0%), Mining, Quarrying, & Extraction (100.0%), and Manufacturing (100.0%), whereas the industries that tend to have a higher number of women are Real Estate, Rental & Leasing (100.0%), Accommodation & Food Services (94.2%), and Educational Services (75.6%).
| Industry | Male | Female |
| Agriculture, Fishing & Hunting | 5 (100.0%) | 0 (0.0%) |
| Mining, Quarrying, & Extraction | 3 (100.0%) | 0 (0.0%) |
| Construction | 0 (0.0%) | 0 (0.0%) |
| Manufacturing | 29 (100.0%) | 0 (0.0%) |
| Wholesale Trade | 0 (0.0%) | 0 (0.0%) |
| Retail Trade | 27 (69.2%) | 12 (30.8%) |
| Transportation & Warehousing | 26 (83.9%) | 5 (16.1%) |
| Utilities | 32 (84.2%) | 6 (15.8%) |
| Information | 0 (0.0%) | 0 (0.0%) |
| Finance & Insurance | 0 (0.0%) | 0 (0.0%) |
| Real Estate, Rental & Leasing | 0 (0.0%) | 12 (100.0%) |
| Professional & Scientific | 0 (0.0%) | 0 (0.0%) |
| Enterprise Management | 0 (0.0%) | 0 (0.0%) |
| Administrative & Support | 21 (77.8%) | 6 (22.2%) |
| Educational Services | 10 (24.4%) | 31 (75.6%) |
| Health Care & Social Assistance | 40 (57.1%) | 30 (42.9%) |
| Arts, Entertainment & Recreation | 0 (0.0%) | 0 (0.0%) |
| Accommodation & Food Services | 8 (5.8%) | 129 (94.2%) |
| Public Administration | 29 (48.3%) | 31 (51.7%) |
| Total | 241 (46.6%) | 276 (53.4%) |
Education in Franklin
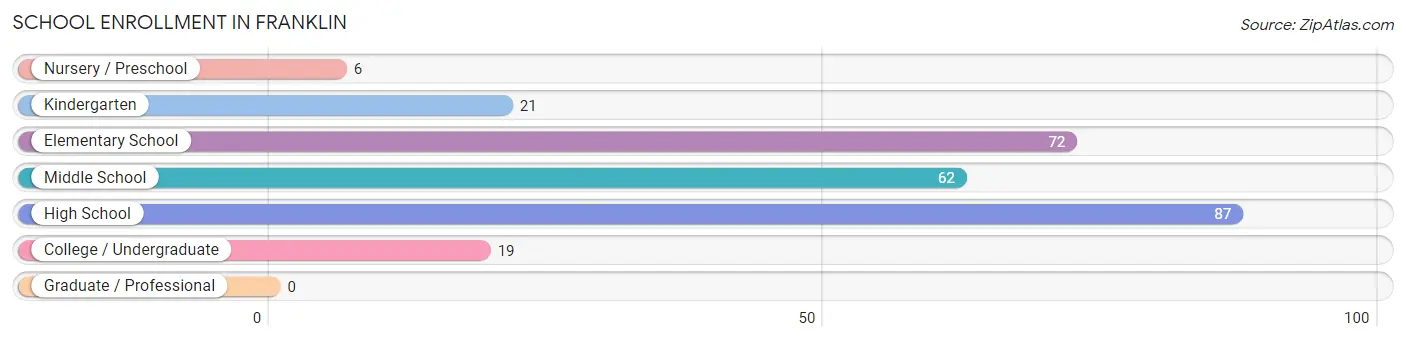
School Enrollment in Franklin
The most common levels of schooling among the 267 students in Franklin are high school (87 | 32.6%), elementary school (72 | 27.0%), and middle school (62 | 23.2%).
| School Level | # Students | % Students |
| Nursery / Preschool | 6 | 2.2% |
| Kindergarten | 21 | 7.9% |
| Elementary School | 72 | 27.0% |
| Middle School | 62 | 23.2% |
| High School | 87 | 32.6% |
| College / Undergraduate | 19 | 7.1% |
| Graduate / Professional | 0 | 0.0% |
| Total | 267 | 100.0% |
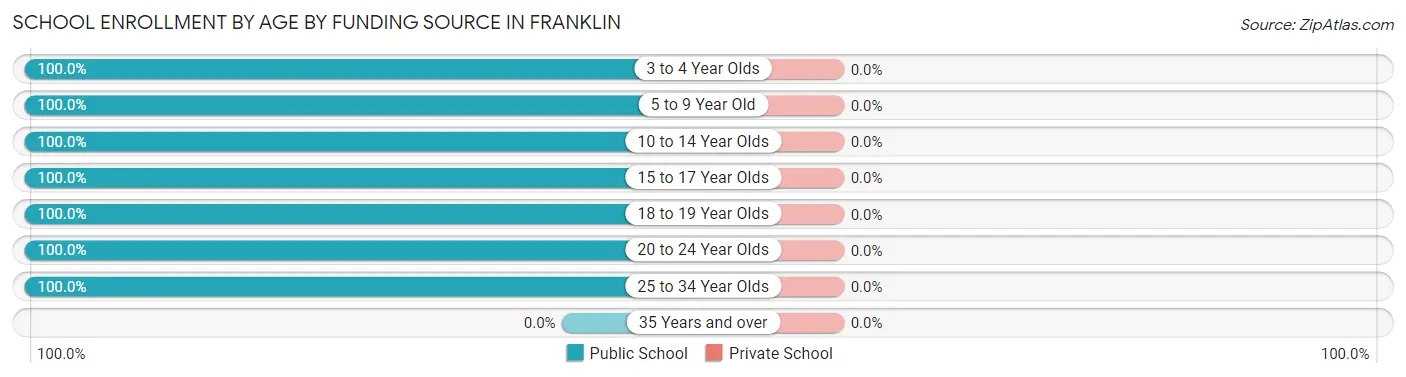
School Enrollment by Age by Funding Source in Franklin
| Age Bracket | Public School | Private School |
| 3 to 4 Year Olds | 14 (100.0%) | 0 (0.0%) |
| 5 to 9 Year Old | 74 (100.0%) | 0 (0.0%) |
| 10 to 14 Year Olds | 76 (100.0%) | 0 (0.0%) |
| 15 to 17 Year Olds | 55 (100.0%) | 0 (0.0%) |
| 18 to 19 Year Olds | 40 (100.0%) | 0 (0.0%) |
| 20 to 24 Year Olds | 3 (100.0%) | 0 (0.0%) |
| 25 to 34 Year Olds | 5 (100.0%) | 0 (0.0%) |
| 35 Years and over | 0 (0.0%) | 0 (0.0%) |
| Total | 267 (100.0%) | 0 (0.0%) |
Educational Attainment by Field of Study in Franklin
Education (48 | 29.4%), bio, nature & agricultural (25 | 15.3%), liberal arts & history (23 | 14.1%), psychology (15 | 9.2%), and social sciences (9 | 5.5%) are the most common fields of study among 163 individuals in Franklin who have obtained a bachelor's degree or higher.
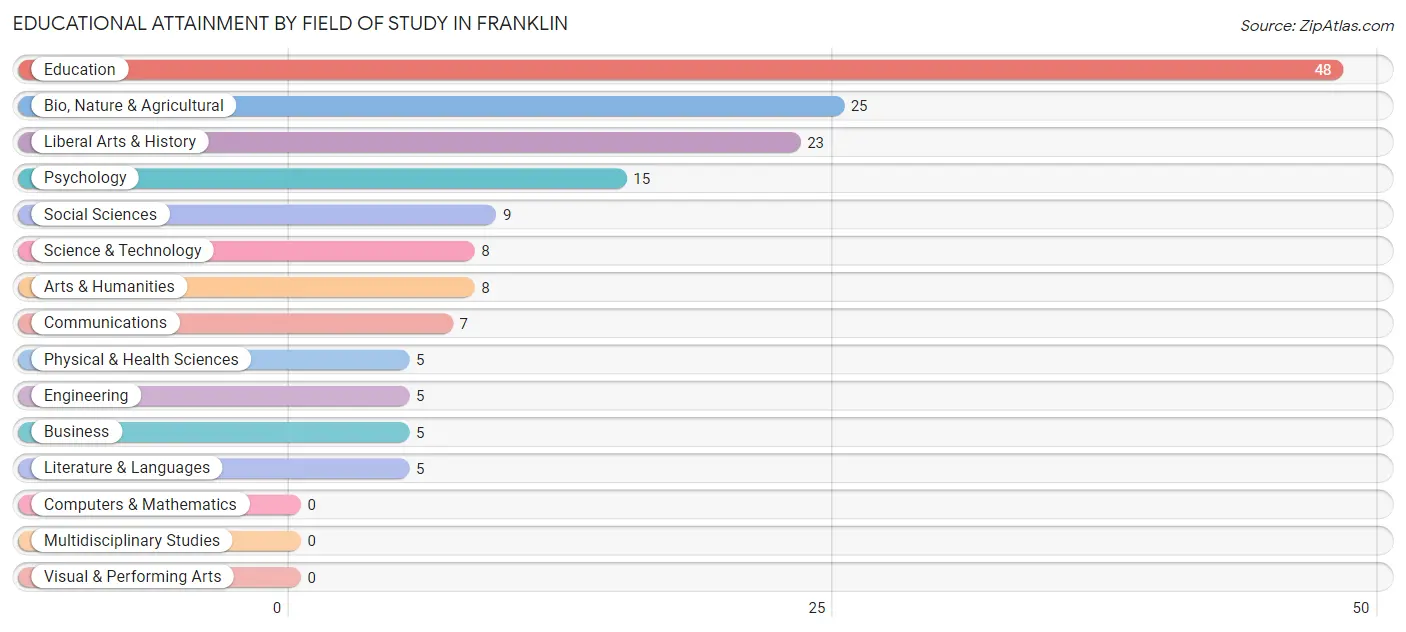
| Field of Study | # Graduates | % Graduates |
| Computers & Mathematics | 0 | 0.0% |
| Bio, Nature & Agricultural | 25 | 15.3% |
| Physical & Health Sciences | 5 | 3.1% |
| Psychology | 15 | 9.2% |
| Social Sciences | 9 | 5.5% |
| Engineering | 5 | 3.1% |
| Multidisciplinary Studies | 0 | 0.0% |
| Science & Technology | 8 | 4.9% |
| Business | 5 | 3.1% |
| Education | 48 | 29.4% |
| Literature & Languages | 5 | 3.1% |
| Liberal Arts & History | 23 | 14.1% |
| Visual & Performing Arts | 0 | 0.0% |
| Communications | 7 | 4.3% |
| Arts & Humanities | 8 | 4.9% |
| Total | 163 | 100.0% |
Transportation & Commute in Franklin
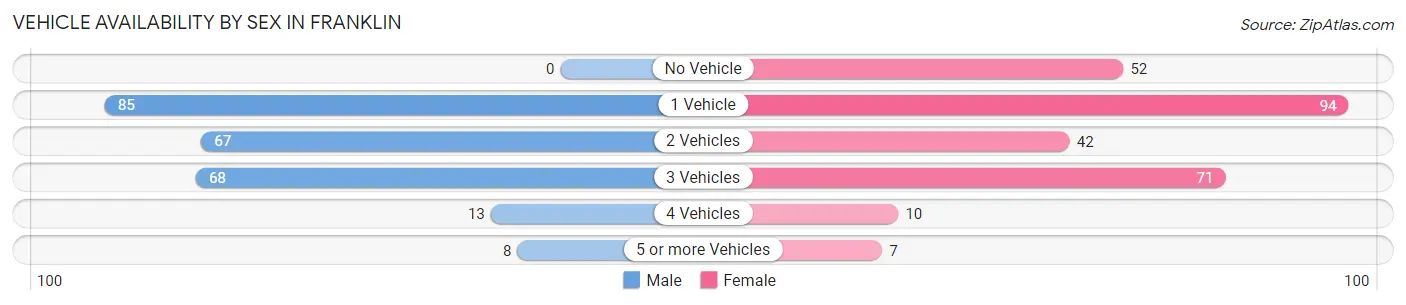
Vehicle Availability by Sex in Franklin
The most prevalent vehicle ownership categories in Franklin are males with 1 vehicle (85, accounting for 35.3%) and females with 1 vehicle (94, making up 30.8%).
| Vehicles Available | Male | Female |
| No Vehicle | 0 (0.0%) | 52 (18.8%) |
| 1 Vehicle | 85 (35.3%) | 94 (34.1%) |
| 2 Vehicles | 67 (27.8%) | 42 (15.2%) |
| 3 Vehicles | 68 (28.2%) | 71 (25.7%) |
| 4 Vehicles | 13 (5.4%) | 10 (3.6%) |
| 5 or more Vehicles | 8 (3.3%) | 7 (2.5%) |
| Total | 241 (100.0%) | 276 (100.0%) |
Commute Time in Franklin
The most frequently occuring commute durations in Franklin are 5 to 9 minutes (157 commuters, 31.2%), 15 to 19 minutes (109 commuters, 21.7%), and less than 5 minutes (60 commuters, 11.9%).
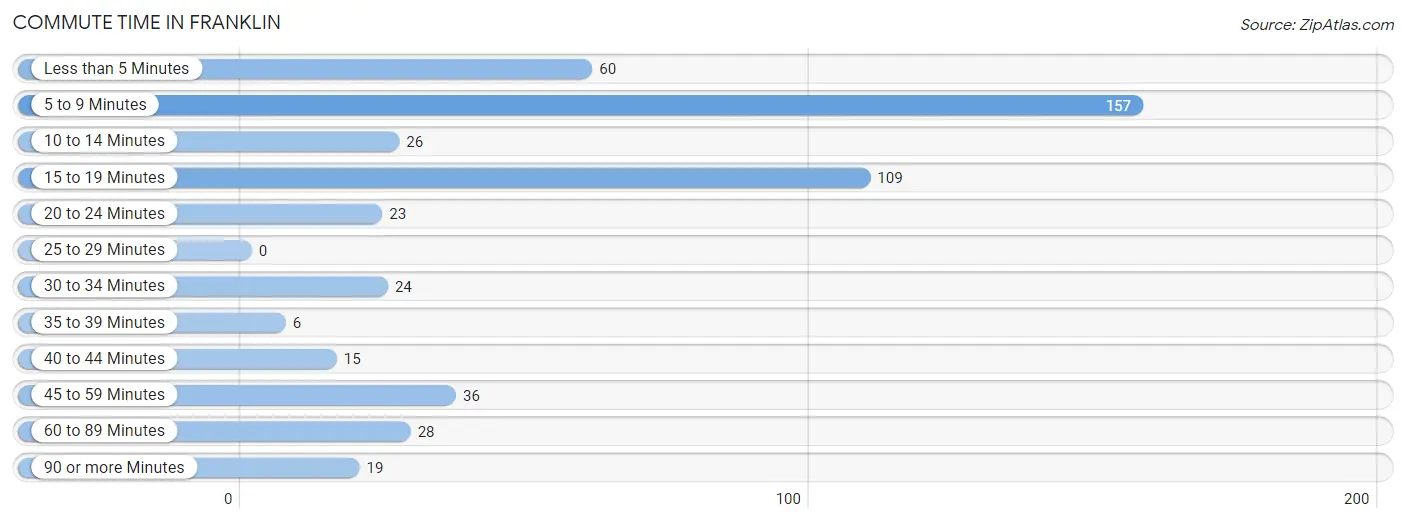
| Commute Time | # Commuters | % Commuters |
| Less than 5 Minutes | 60 | 11.9% |
| 5 to 9 Minutes | 157 | 31.2% |
| 10 to 14 Minutes | 26 | 5.2% |
| 15 to 19 Minutes | 109 | 21.7% |
| 20 to 24 Minutes | 23 | 4.6% |
| 25 to 29 Minutes | 0 | 0.0% |
| 30 to 34 Minutes | 24 | 4.8% |
| 35 to 39 Minutes | 6 | 1.2% |
| 40 to 44 Minutes | 15 | 3.0% |
| 45 to 59 Minutes | 36 | 7.2% |
| 60 to 89 Minutes | 28 | 5.6% |
| 90 or more Minutes | 19 | 3.8% |
Commute Time by Sex in Franklin
The most common commute times in Franklin are 5 to 9 minutes (56 commuters, 24.1%) for males and 5 to 9 minutes (101 commuters, 37.3%) for females.
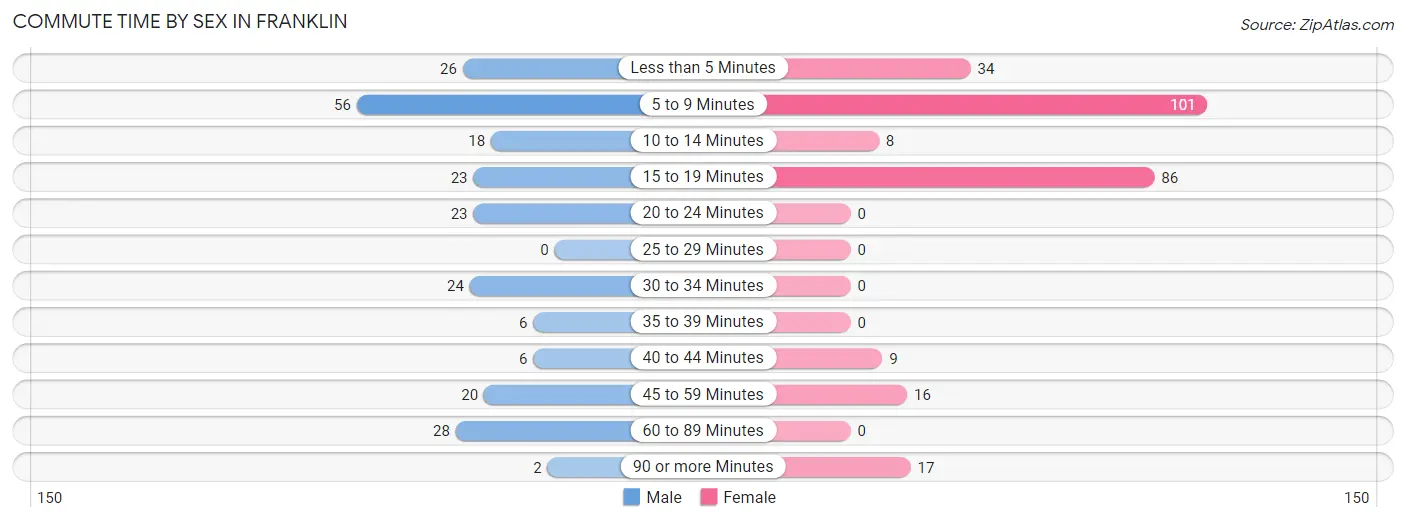
| Commute Time | Male | Female |
| Less than 5 Minutes | 26 (11.2%) | 34 (12.6%) |
| 5 to 9 Minutes | 56 (24.1%) | 101 (37.3%) |
| 10 to 14 Minutes | 18 (7.8%) | 8 (2.9%) |
| 15 to 19 Minutes | 23 (9.9%) | 86 (31.7%) |
| 20 to 24 Minutes | 23 (9.9%) | 0 (0.0%) |
| 25 to 29 Minutes | 0 (0.0%) | 0 (0.0%) |
| 30 to 34 Minutes | 24 (10.3%) | 0 (0.0%) |
| 35 to 39 Minutes | 6 (2.6%) | 0 (0.0%) |
| 40 to 44 Minutes | 6 (2.6%) | 9 (3.3%) |
| 45 to 59 Minutes | 20 (8.6%) | 16 (5.9%) |
| 60 to 89 Minutes | 28 (12.1%) | 0 (0.0%) |
| 90 or more Minutes | 2 (0.9%) | 17 (6.3%) |
Time of Departure to Work by Sex in Franklin
The most frequent times of departure to work in Franklin are 12:00 PM to 3:59 PM (55, 23.7%) for males and 6:30 AM to 6:59 AM (90, 33.2%) for females.
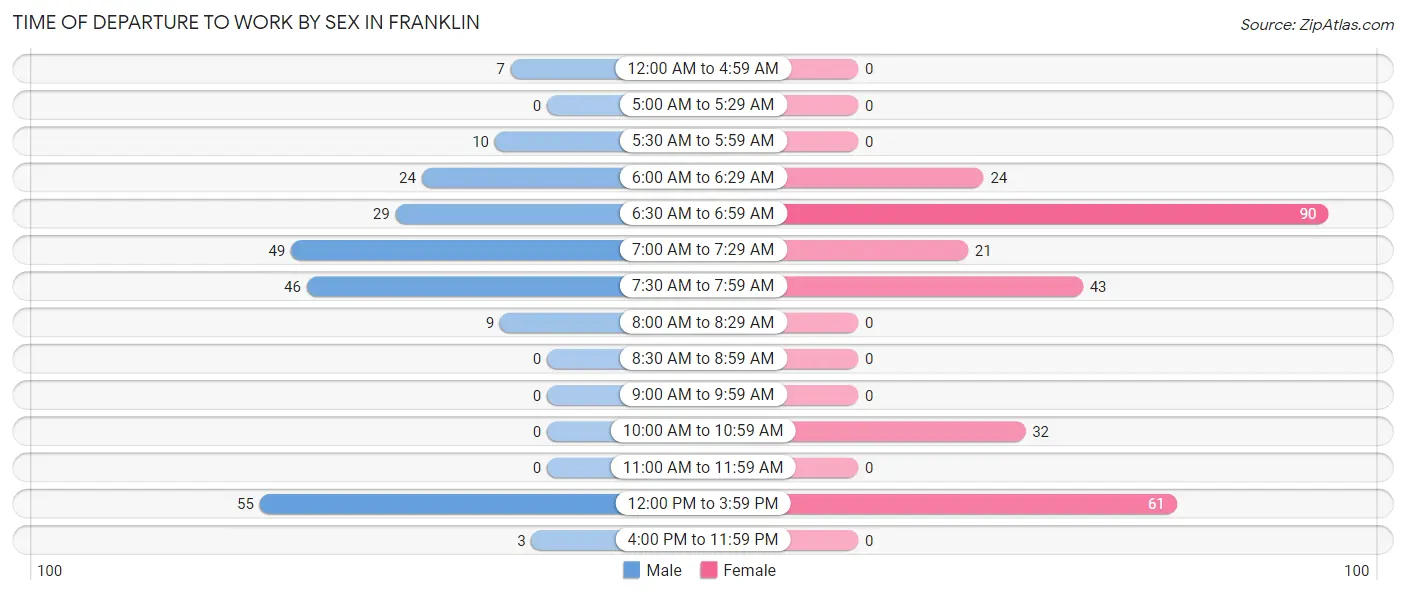
| Time of Departure | Male | Female |
| 12:00 AM to 4:59 AM | 7 (3.0%) | 0 (0.0%) |
| 5:00 AM to 5:29 AM | 0 (0.0%) | 0 (0.0%) |
| 5:30 AM to 5:59 AM | 10 (4.3%) | 0 (0.0%) |
| 6:00 AM to 6:29 AM | 24 (10.3%) | 24 (8.9%) |
| 6:30 AM to 6:59 AM | 29 (12.5%) | 90 (33.2%) |
| 7:00 AM to 7:29 AM | 49 (21.1%) | 21 (7.7%) |
| 7:30 AM to 7:59 AM | 46 (19.8%) | 43 (15.9%) |
| 8:00 AM to 8:29 AM | 9 (3.9%) | 0 (0.0%) |
| 8:30 AM to 8:59 AM | 0 (0.0%) | 0 (0.0%) |
| 9:00 AM to 9:59 AM | 0 (0.0%) | 0 (0.0%) |
| 10:00 AM to 10:59 AM | 0 (0.0%) | 32 (11.8%) |
| 11:00 AM to 11:59 AM | 0 (0.0%) | 0 (0.0%) |
| 12:00 PM to 3:59 PM | 55 (23.7%) | 61 (22.5%) |
| 4:00 PM to 11:59 PM | 3 (1.3%) | 0 (0.0%) |
| Total | 232 (100.0%) | 271 (100.0%) |
Housing Occupancy in Franklin
Occupancy by Ownership in Franklin
Of the total 510 dwellings in Franklin, owner-occupied units account for 271 (53.1%), while renter-occupied units make up 239 (46.9%).
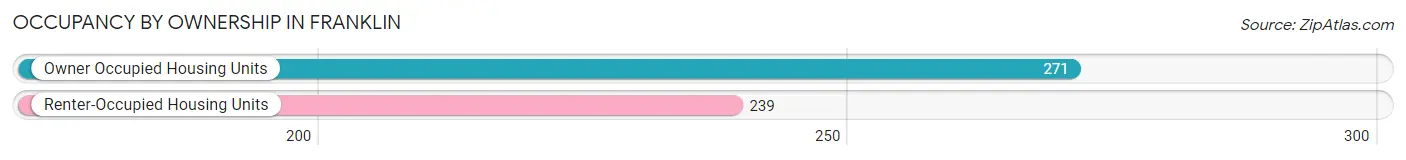
| Occupancy | # Housing Units | % Housing Units |
| Owner Occupied Housing Units | 271 | 53.1% |
| Renter-Occupied Housing Units | 239 | 46.9% |
| Total Occupied Housing Units | 510 | 100.0% |
Occupancy by Household Size in Franklin
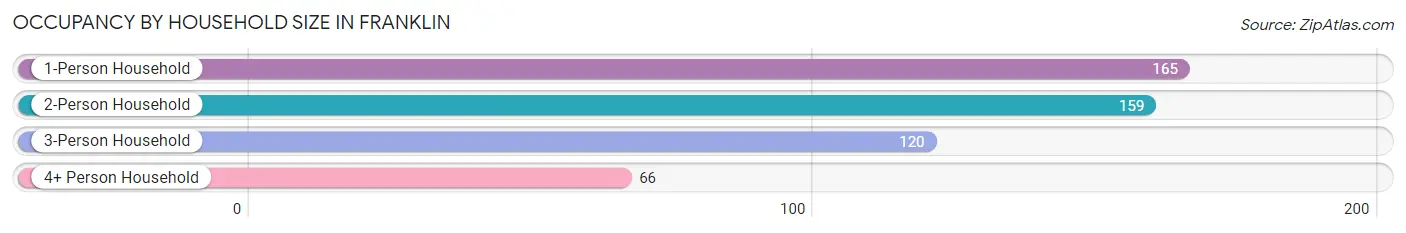
| Household Size | # Housing Units | % Housing Units |
| 1-Person Household | 165 | 32.4% |
| 2-Person Household | 159 | 31.2% |
| 3-Person Household | 120 | 23.5% |
| 4+ Person Household | 66 | 12.9% |
| Total Housing Units | 510 | 100.0% |
Occupancy by Ownership by Household Size in Franklin
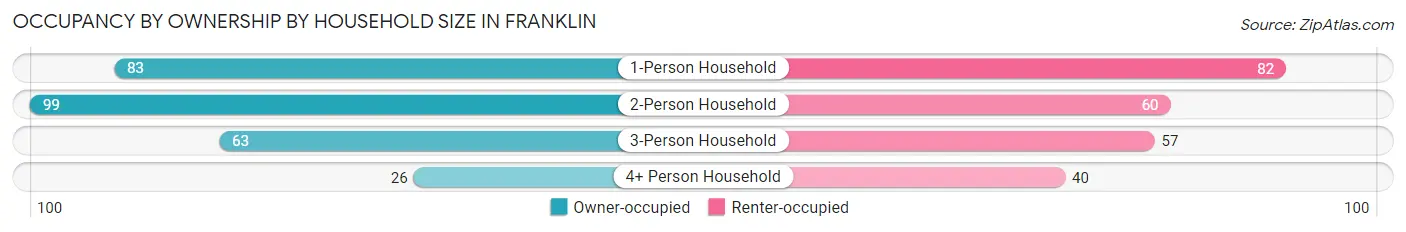
| Household Size | Owner-occupied | Renter-occupied |
| 1-Person Household | 83 (50.3%) | 82 (49.7%) |
| 2-Person Household | 99 (62.3%) | 60 (37.7%) |
| 3-Person Household | 63 (52.5%) | 57 (47.5%) |
| 4+ Person Household | 26 (39.4%) | 40 (60.6%) |
| Total Housing Units | 271 (53.1%) | 239 (46.9%) |
Occupancy by Educational Attainment in Franklin
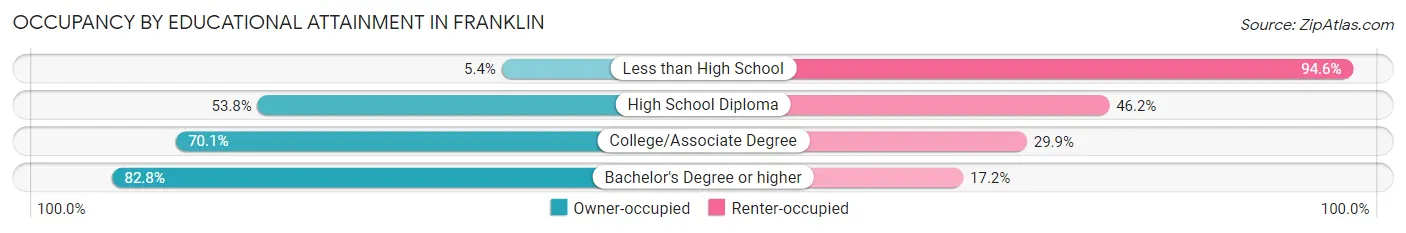
| Household Size | Owner-occupied | Renter-occupied |
| Less than High School | 6 (5.4%) | 105 (94.6%) |
| High School Diploma | 85 (53.8%) | 73 (46.2%) |
| College/Associate Degree | 108 (70.1%) | 46 (29.9%) |
| Bachelor's Degree or higher | 72 (82.8%) | 15 (17.2%) |
Occupancy by Age of Householder in Franklin
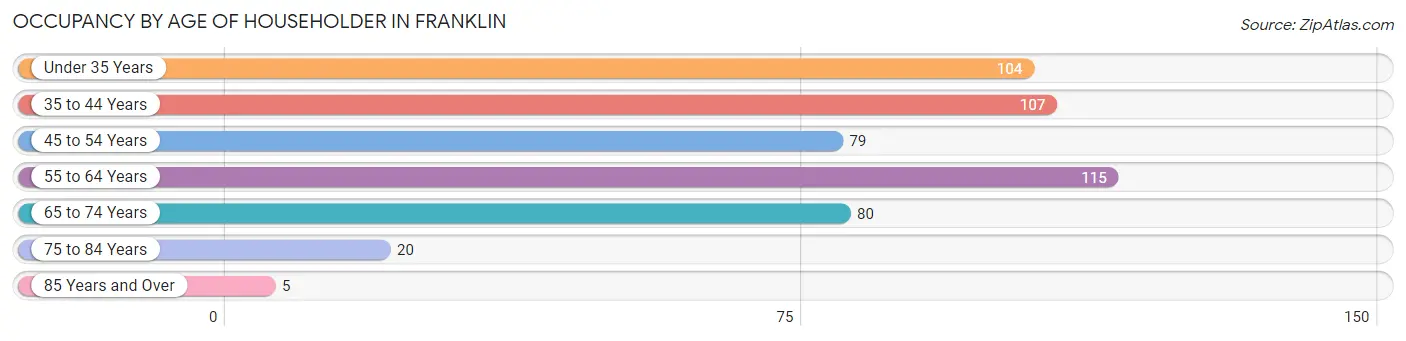
| Age Bracket | # Households | % Households |
| Under 35 Years | 104 | 20.4% |
| 35 to 44 Years | 107 | 21.0% |
| 45 to 54 Years | 79 | 15.5% |
| 55 to 64 Years | 115 | 22.6% |
| 65 to 74 Years | 80 | 15.7% |
| 75 to 84 Years | 20 | 3.9% |
| 85 Years and Over | 5 | 1.0% |
| Total | 510 | 100.0% |
Housing Finances in Franklin
Median Income by Occupancy in Franklin
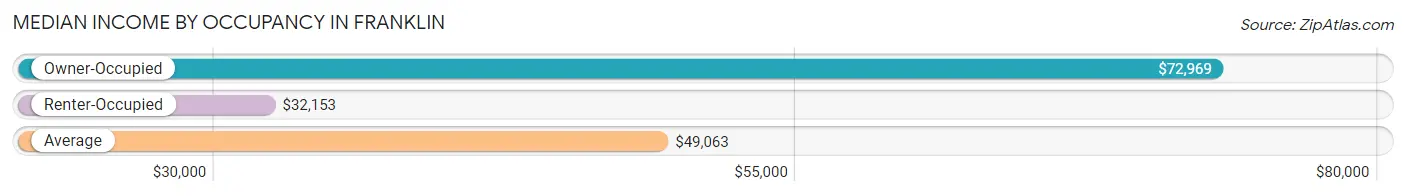
| Occupancy Type | # Households | Median Income |
| Owner-Occupied | 271 (53.1%) | $72,969 |
| Renter-Occupied | 239 (46.9%) | $32,153 |
| Average | 510 (100.0%) | $49,063 |
Occupancy by Householder Income Bracket in Franklin
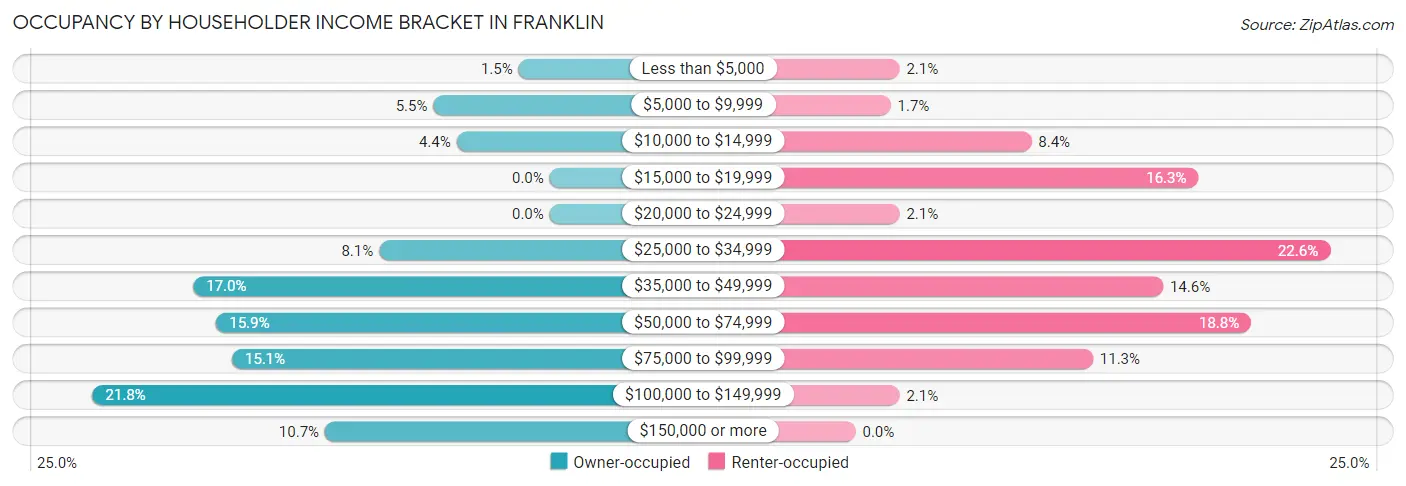
| Income Bracket | Owner-occupied | Renter-occupied |
| Less than $5,000 | 4 (1.5%) | 5 (2.1%) |
| $5,000 to $9,999 | 15 (5.5%) | 4 (1.7%) |
| $10,000 to $14,999 | 12 (4.4%) | 20 (8.4%) |
| $15,000 to $19,999 | 0 (0.0%) | 39 (16.3%) |
| $20,000 to $24,999 | 0 (0.0%) | 5 (2.1%) |
| $25,000 to $34,999 | 22 (8.1%) | 54 (22.6%) |
| $35,000 to $49,999 | 46 (17.0%) | 35 (14.6%) |
| $50,000 to $74,999 | 43 (15.9%) | 45 (18.8%) |
| $75,000 to $99,999 | 41 (15.1%) | 27 (11.3%) |
| $100,000 to $149,999 | 59 (21.8%) | 5 (2.1%) |
| $150,000 or more | 29 (10.7%) | 0 (0.0%) |
| Total | 271 (100.0%) | 239 (100.0%) |
Monthly Housing Cost Tiers in Franklin
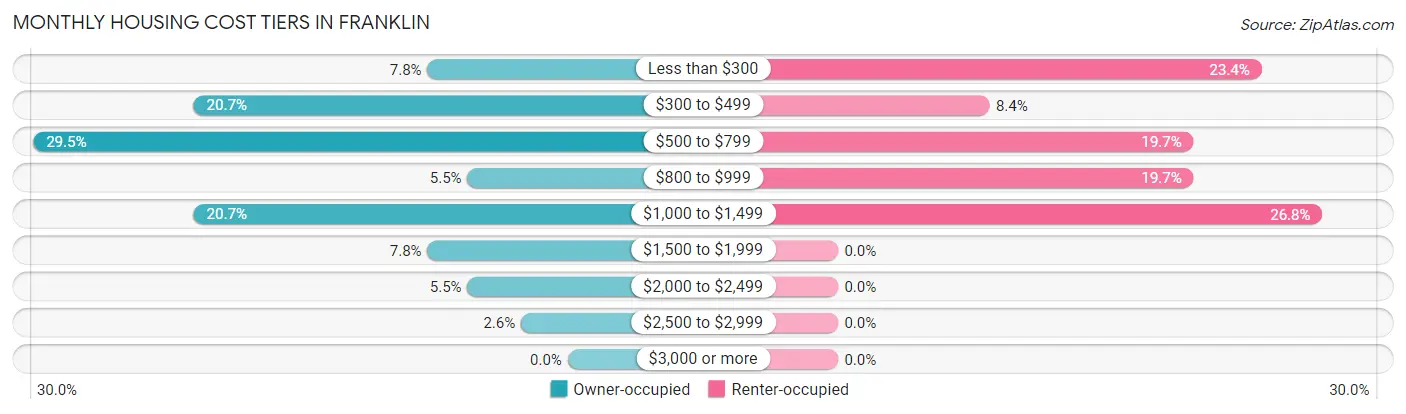
| Monthly Cost | Owner-occupied | Renter-occupied |
| Less than $300 | 21 (7.7%) | 56 (23.4%) |
| $300 to $499 | 56 (20.7%) | 20 (8.4%) |
| $500 to $799 | 80 (29.5%) | 47 (19.7%) |
| $800 to $999 | 15 (5.5%) | 47 (19.7%) |
| $1,000 to $1,499 | 56 (20.7%) | 64 (26.8%) |
| $1,500 to $1,999 | 21 (7.7%) | 0 (0.0%) |
| $2,000 to $2,499 | 15 (5.5%) | 0 (0.0%) |
| $2,500 to $2,999 | 7 (2.6%) | 0 (0.0%) |
| $3,000 or more | 0 (0.0%) | 0 (0.0%) |
| Total | 271 (100.0%) | 239 (100.0%) |
Physical Housing Characteristics in Franklin
Housing Structures in Franklin
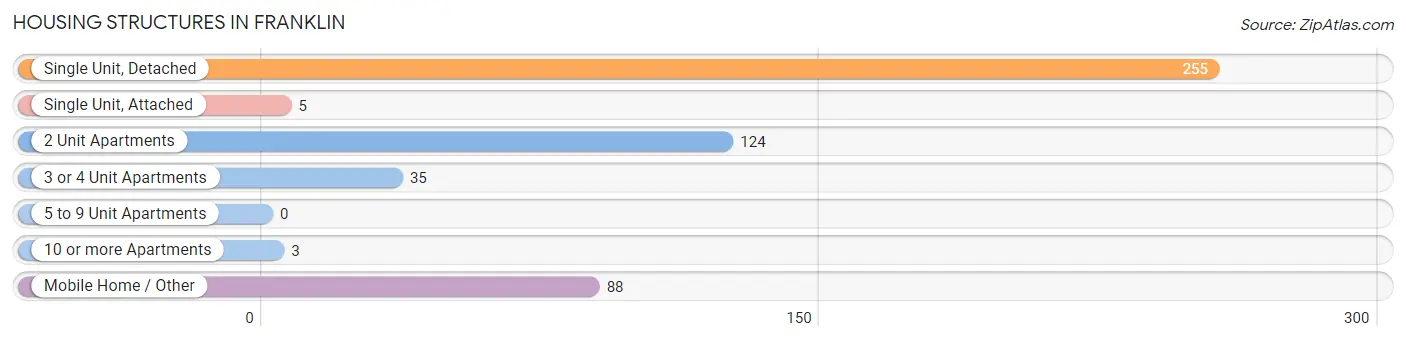
| Structure Type | # Housing Units | % Housing Units |
| Single Unit, Detached | 255 | 50.0% |
| Single Unit, Attached | 5 | 1.0% |
| 2 Unit Apartments | 124 | 24.3% |
| 3 or 4 Unit Apartments | 35 | 6.9% |
| 5 to 9 Unit Apartments | 0 | 0.0% |
| 10 or more Apartments | 3 | 0.6% |
| Mobile Home / Other | 88 | 17.2% |
| Total | 510 | 100.0% |
Housing Structures by Occupancy in Franklin
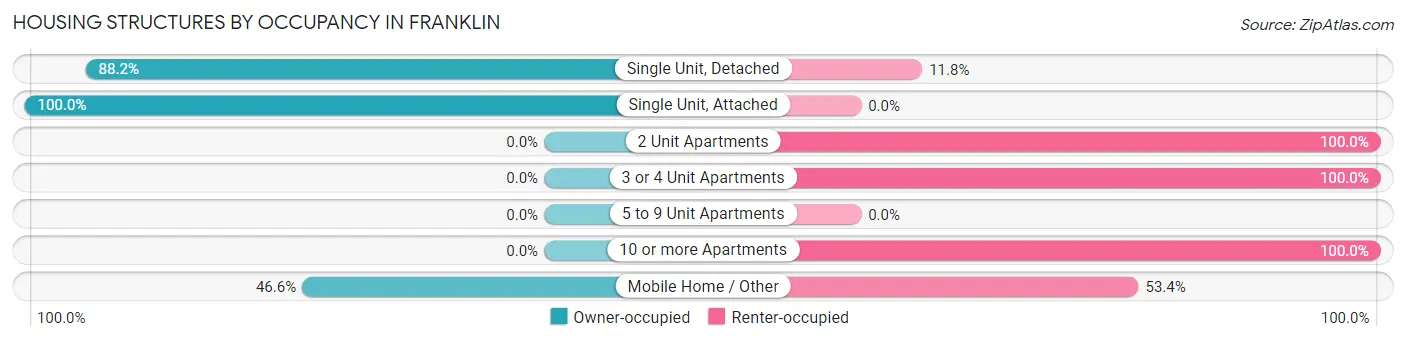
| Structure Type | Owner-occupied | Renter-occupied |
| Single Unit, Detached | 225 (88.2%) | 30 (11.8%) |
| Single Unit, Attached | 5 (100.0%) | 0 (0.0%) |
| 2 Unit Apartments | 0 (0.0%) | 124 (100.0%) |
| 3 or 4 Unit Apartments | 0 (0.0%) | 35 (100.0%) |
| 5 to 9 Unit Apartments | 0 (0.0%) | 0 (0.0%) |
| 10 or more Apartments | 0 (0.0%) | 3 (100.0%) |
| Mobile Home / Other | 41 (46.6%) | 47 (53.4%) |
| Total | 271 (53.1%) | 239 (46.9%) |
Housing Structures by Number of Rooms in Franklin
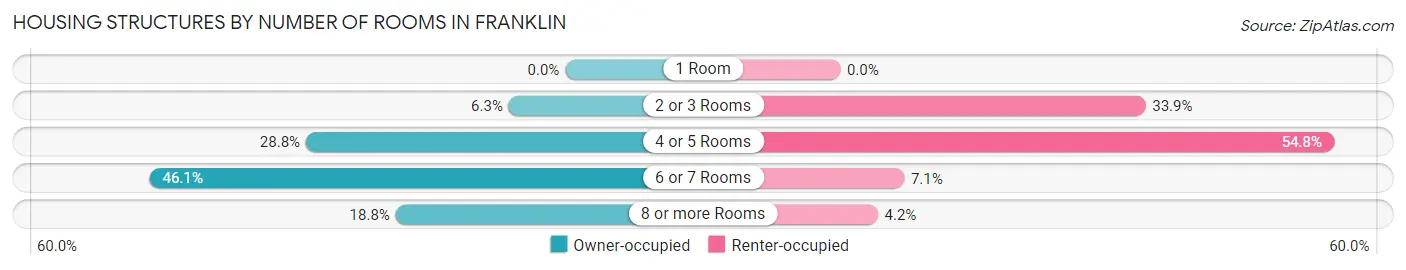
| Number of Rooms | Owner-occupied | Renter-occupied |
| 1 Room | 0 (0.0%) | 0 (0.0%) |
| 2 or 3 Rooms | 17 (6.3%) | 81 (33.9%) |
| 4 or 5 Rooms | 78 (28.8%) | 131 (54.8%) |
| 6 or 7 Rooms | 125 (46.1%) | 17 (7.1%) |
| 8 or more Rooms | 51 (18.8%) | 10 (4.2%) |
| Total | 271 (100.0%) | 239 (100.0%) |
Housing Structure by Heating Type in Franklin
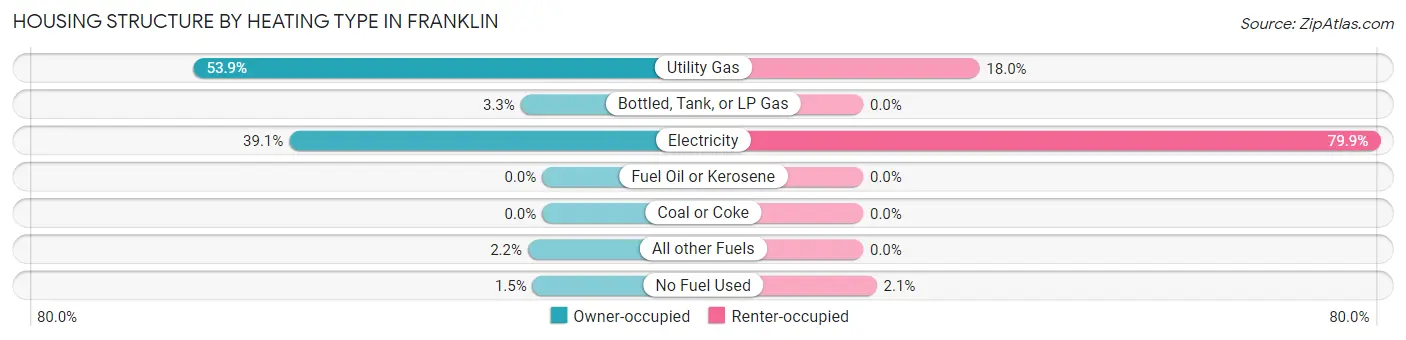
| Heating Type | Owner-occupied | Renter-occupied |
| Utility Gas | 146 (53.9%) | 43 (18.0%) |
| Bottled, Tank, or LP Gas | 9 (3.3%) | 0 (0.0%) |
| Electricity | 106 (39.1%) | 191 (79.9%) |
| Fuel Oil or Kerosene | 0 (0.0%) | 0 (0.0%) |
| Coal or Coke | 0 (0.0%) | 0 (0.0%) |
| All other Fuels | 6 (2.2%) | 0 (0.0%) |
| No Fuel Used | 4 (1.5%) | 5 (2.1%) |
| Total | 271 (100.0%) | 239 (100.0%) |
Household Vehicle Usage in Franklin
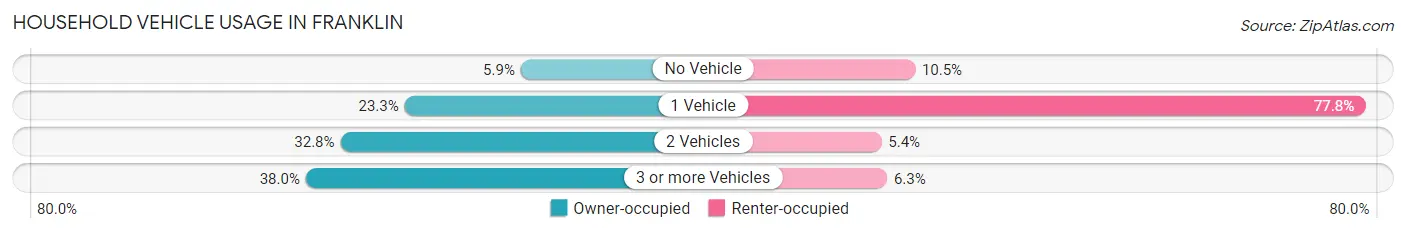
| Vehicles per Household | Owner-occupied | Renter-occupied |
| No Vehicle | 16 (5.9%) | 25 (10.5%) |
| 1 Vehicle | 63 (23.3%) | 186 (77.8%) |
| 2 Vehicles | 89 (32.8%) | 13 (5.4%) |
| 3 or more Vehicles | 103 (38.0%) | 15 (6.3%) |
| Total | 271 (100.0%) | 239 (100.0%) |
Real Estate & Mortgages in Franklin
Real Estate and Mortgage Overview in Franklin
| Characteristic | Without Mortgage | With Mortgage |
| Housing Units | 157 | 114 |
| Median Property Value | - | - |
| Median Household Income | $42,679 | $21 |
| Monthly Housing Costs | $513 | $0 |
| Real Estate Taxes | $1,404 | $9 |
Property Value by Mortgage Status in Franklin
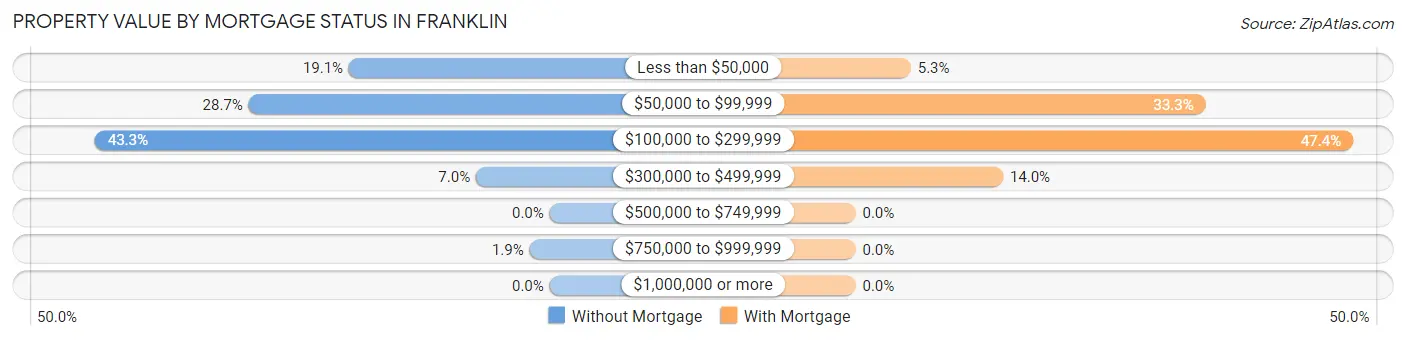
| Property Value | Without Mortgage | With Mortgage |
| Less than $50,000 | 30 (19.1%) | 6 (5.3%) |
| $50,000 to $99,999 | 45 (28.7%) | 38 (33.3%) |
| $100,000 to $299,999 | 68 (43.3%) | 54 (47.4%) |
| $300,000 to $499,999 | 11 (7.0%) | 16 (14.0%) |
| $500,000 to $749,999 | 0 (0.0%) | 0 (0.0%) |
| $750,000 to $999,999 | 3 (1.9%) | 0 (0.0%) |
| $1,000,000 or more | 0 (0.0%) | 0 (0.0%) |
| Total | 157 (100.0%) | 114 (100.0%) |
Household Income by Mortgage Status in Franklin
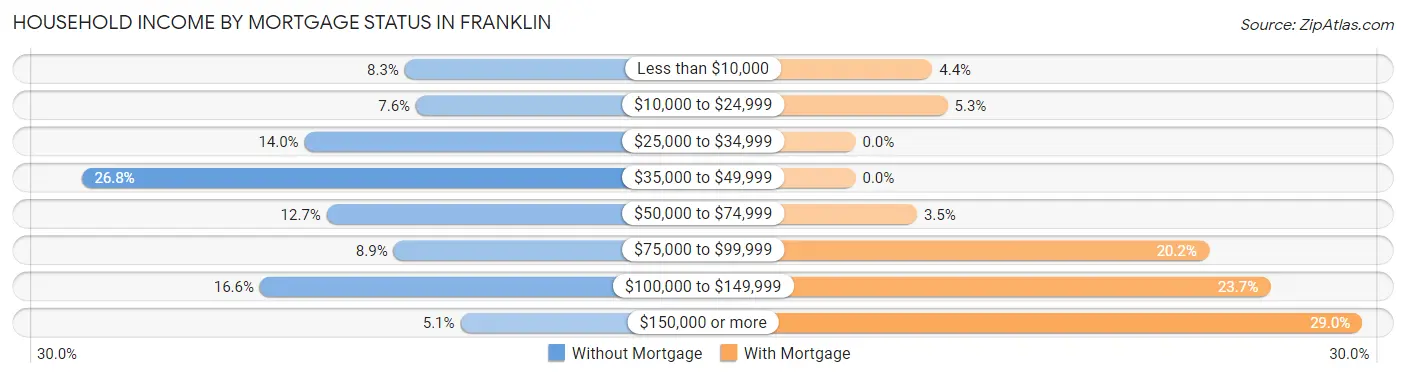
| Household Income | Without Mortgage | With Mortgage |
| Less than $10,000 | 13 (8.3%) | 5 (4.4%) |
| $10,000 to $24,999 | 12 (7.6%) | 6 (5.3%) |
| $25,000 to $34,999 | 22 (14.0%) | 0 (0.0%) |
| $35,000 to $49,999 | 42 (26.8%) | 0 (0.0%) |
| $50,000 to $74,999 | 20 (12.7%) | 4 (3.5%) |
| $75,000 to $99,999 | 14 (8.9%) | 23 (20.2%) |
| $100,000 to $149,999 | 26 (16.6%) | 27 (23.7%) |
| $150,000 or more | 8 (5.1%) | 33 (28.9%) |
| Total | 157 (100.0%) | 114 (100.0%) |
Property Value to Household Income Ratio in Franklin
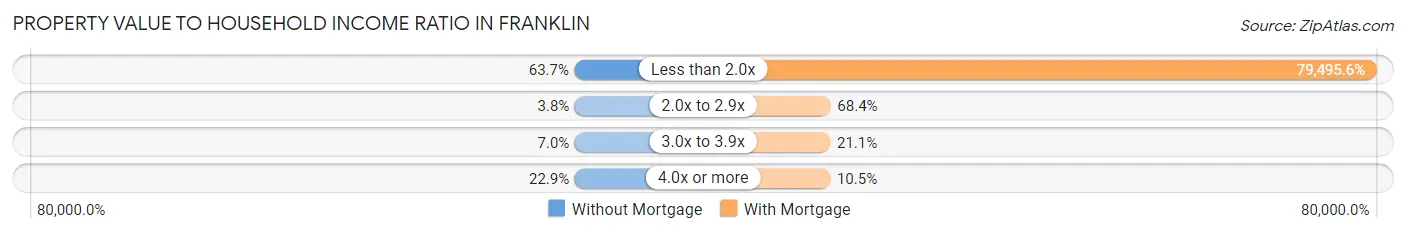
| Value-to-Income Ratio | Without Mortgage | With Mortgage |
| Less than 2.0x | 100 (63.7%) | 90,625 (79,495.6%) |
| 2.0x to 2.9x | 6 (3.8%) | 78 (68.4%) |
| 3.0x to 3.9x | 11 (7.0%) | 24 (21.0%) |
| 4.0x or more | 36 (22.9%) | 12 (10.5%) |
| Total | 157 (100.0%) | 114 (100.0%) |
Real Estate Taxes by Mortgage Status in Franklin
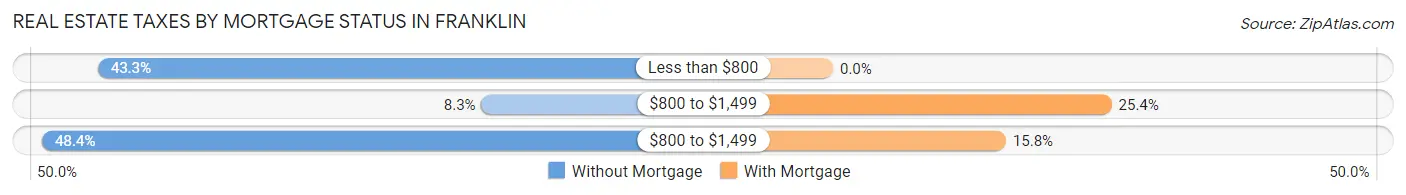
| Property Taxes | Without Mortgage | With Mortgage |
| Less than $800 | 68 (43.3%) | 0 (0.0%) |
| $800 to $1,499 | 13 (8.3%) | 29 (25.4%) |
| $800 to $1,499 | 76 (48.4%) | 18 (15.8%) |
| Total | 157 (100.0%) | 114 (100.0%) |
Health & Disability in Franklin
Health Insurance Coverage by Age in Franklin
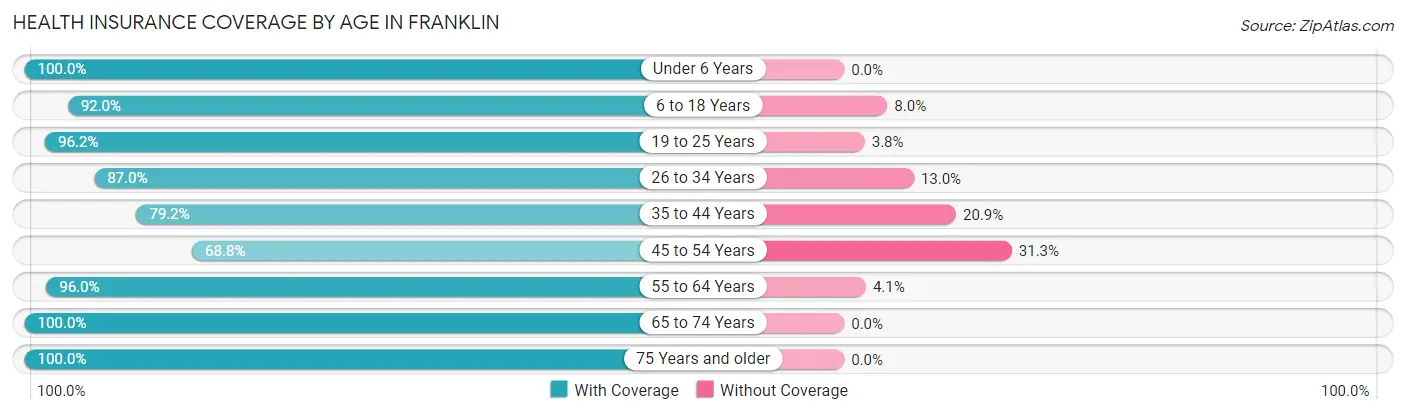
| Age Bracket | With Coverage | Without Coverage |
| Under 6 Years | 115 (100.0%) | 0 (0.0%) |
| 6 to 18 Years | 206 (92.0%) | 18 (8.0%) |
| 19 to 25 Years | 126 (96.2%) | 5 (3.8%) |
| 26 to 34 Years | 67 (87.0%) | 10 (13.0%) |
| 35 to 44 Years | 167 (79.1%) | 44 (20.8%) |
| 45 to 54 Years | 77 (68.8%) | 35 (31.2%) |
| 55 to 64 Years | 166 (96.0%) | 7 (4.1%) |
| 65 to 74 Years | 153 (100.0%) | 0 (0.0%) |
| 75 Years and older | 32 (100.0%) | 0 (0.0%) |
| Total | 1,109 (90.3%) | 119 (9.7%) |
Health Insurance Coverage by Citizenship Status in Franklin
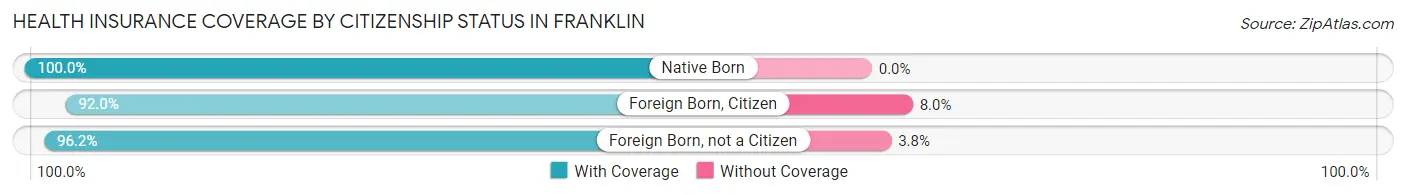
| Citizenship Status | With Coverage | Without Coverage |
| Native Born | 115 (100.0%) | 0 (0.0%) |
| Foreign Born, Citizen | 206 (92.0%) | 18 (8.0%) |
| Foreign Born, not a Citizen | 126 (96.2%) | 5 (3.8%) |
Health Insurance Coverage by Household Income in Franklin
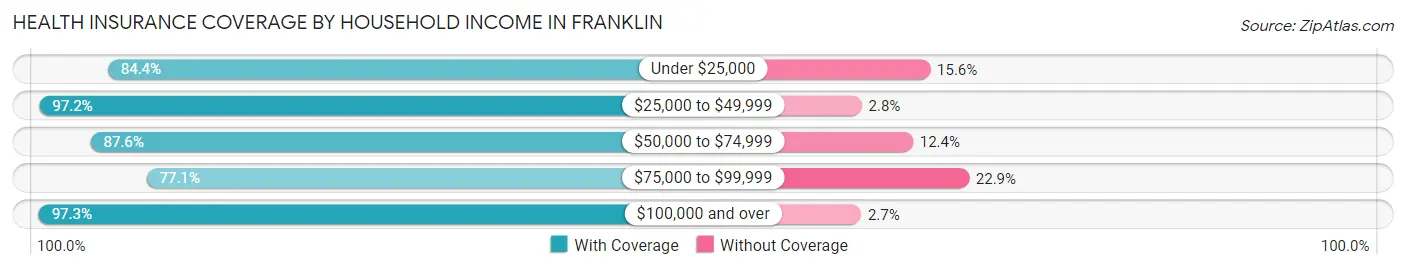
| Household Income | With Coverage | Without Coverage |
| Under $25,000 | 200 (84.4%) | 37 (15.6%) |
| $25,000 to $49,999 | 315 (97.2%) | 9 (2.8%) |
| $50,000 to $74,999 | 156 (87.6%) | 22 (12.4%) |
| $75,000 to $99,999 | 145 (77.1%) | 43 (22.9%) |
| $100,000 and over | 293 (97.3%) | 8 (2.7%) |
Public vs Private Health Insurance Coverage by Age in Franklin
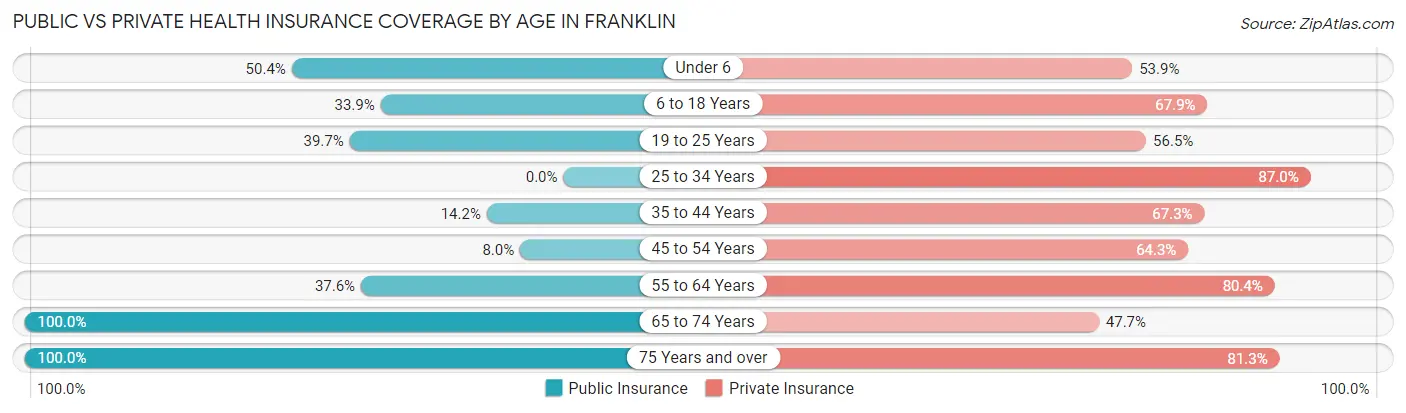
| Age Bracket | Public Insurance | Private Insurance |
| Under 6 | 58 (50.4%) | 62 (53.9%) |
| 6 to 18 Years | 76 (33.9%) | 152 (67.9%) |
| 19 to 25 Years | 52 (39.7%) | 74 (56.5%) |
| 25 to 34 Years | 0 (0.0%) | 67 (87.0%) |
| 35 to 44 Years | 30 (14.2%) | 142 (67.3%) |
| 45 to 54 Years | 9 (8.0%) | 72 (64.3%) |
| 55 to 64 Years | 65 (37.6%) | 139 (80.3%) |
| 65 to 74 Years | 153 (100.0%) | 73 (47.7%) |
| 75 Years and over | 32 (100.0%) | 26 (81.2%) |
| Total | 475 (38.7%) | 807 (65.7%) |
Disability Status by Sex by Age in Franklin
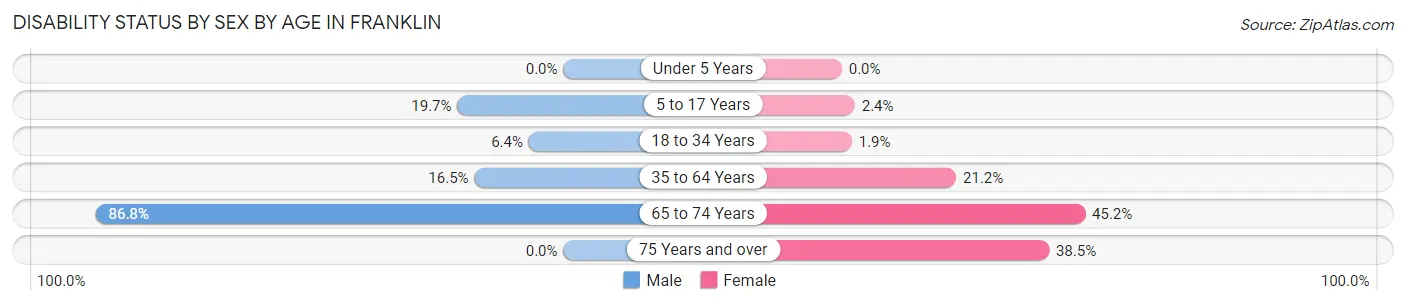
| Age Bracket | Male | Female |
| Under 5 Years | 0 (0.0%) | 0 (0.0%) |
| 5 to 17 Years | 24 (19.7%) | 2 (2.4%) |
| 18 to 34 Years | 5 (6.4%) | 3 (1.8%) |
| 35 to 64 Years | 36 (16.5%) | 59 (21.2%) |
| 65 to 74 Years | 79 (86.8%) | 28 (45.2%) |
| 75 Years and over | 0 (0.0%) | 10 (38.5%) |
Disability Class by Sex by Age in Franklin
Disability Class: Hearing Difficulty
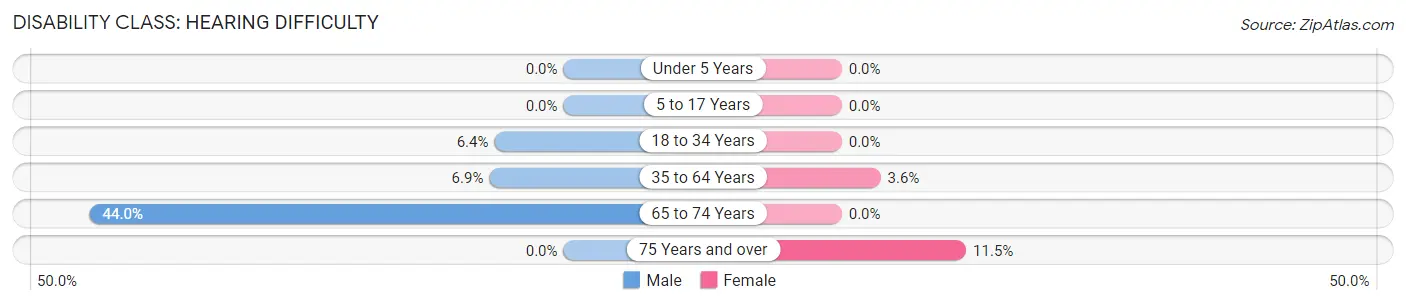
| Age Bracket | Male | Female |
| Under 5 Years | 0 (0.0%) | 0 (0.0%) |
| 5 to 17 Years | 0 (0.0%) | 0 (0.0%) |
| 18 to 34 Years | 5 (6.4%) | 0 (0.0%) |
| 35 to 64 Years | 15 (6.9%) | 10 (3.6%) |
| 65 to 74 Years | 40 (44.0%) | 0 (0.0%) |
| 75 Years and over | 0 (0.0%) | 3 (11.5%) |
Disability Class: Vision Difficulty
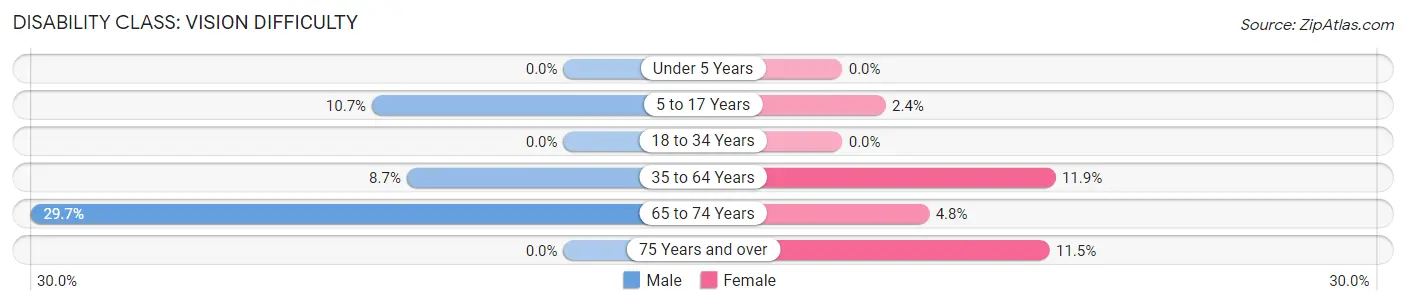
| Age Bracket | Male | Female |
| Under 5 Years | 0 (0.0%) | 0 (0.0%) |
| 5 to 17 Years | 13 (10.7%) | 2 (2.4%) |
| 18 to 34 Years | 0 (0.0%) | 0 (0.0%) |
| 35 to 64 Years | 19 (8.7%) | 33 (11.9%) |
| 65 to 74 Years | 27 (29.7%) | 3 (4.8%) |
| 75 Years and over | 0 (0.0%) | 3 (11.5%) |
Disability Class: Cognitive Difficulty
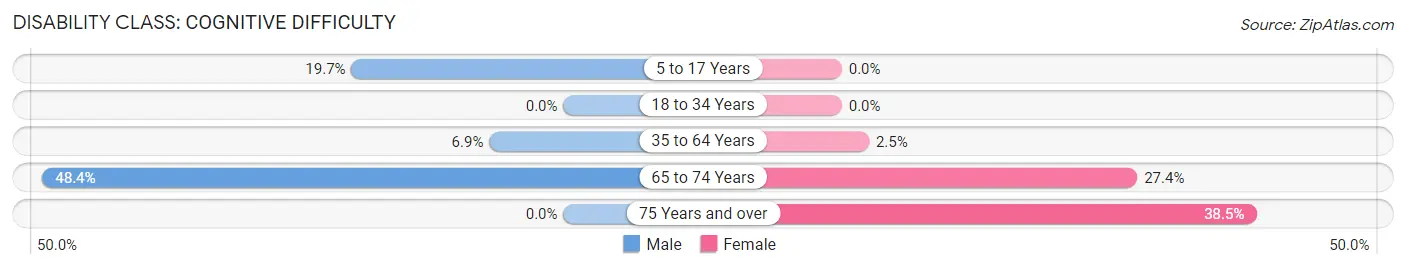
| Age Bracket | Male | Female |
| 5 to 17 Years | 24 (19.7%) | 0 (0.0%) |
| 18 to 34 Years | 0 (0.0%) | 0 (0.0%) |
| 35 to 64 Years | 15 (6.9%) | 7 (2.5%) |
| 65 to 74 Years | 44 (48.3%) | 17 (27.4%) |
| 75 Years and over | 0 (0.0%) | 10 (38.5%) |
Disability Class: Ambulatory Difficulty
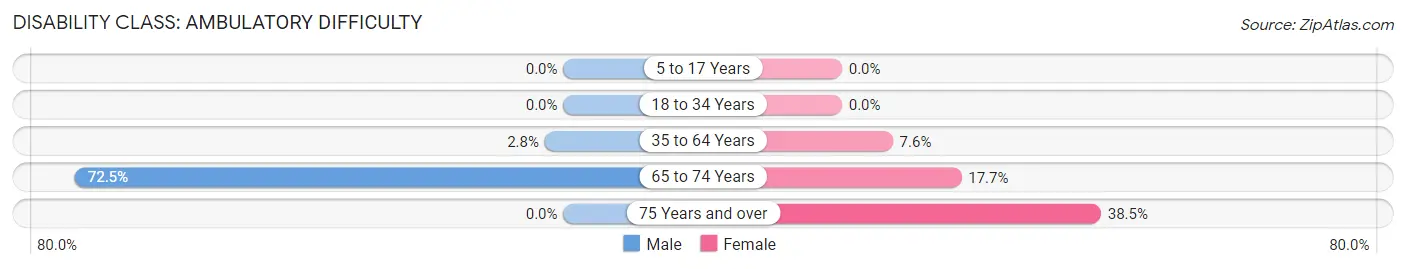
| Age Bracket | Male | Female |
| 5 to 17 Years | 0 (0.0%) | 0 (0.0%) |
| 18 to 34 Years | 0 (0.0%) | 0 (0.0%) |
| 35 to 64 Years | 6 (2.8%) | 21 (7.5%) |
| 65 to 74 Years | 66 (72.5%) | 11 (17.7%) |
| 75 Years and over | 0 (0.0%) | 10 (38.5%) |
Disability Class: Self-Care Difficulty
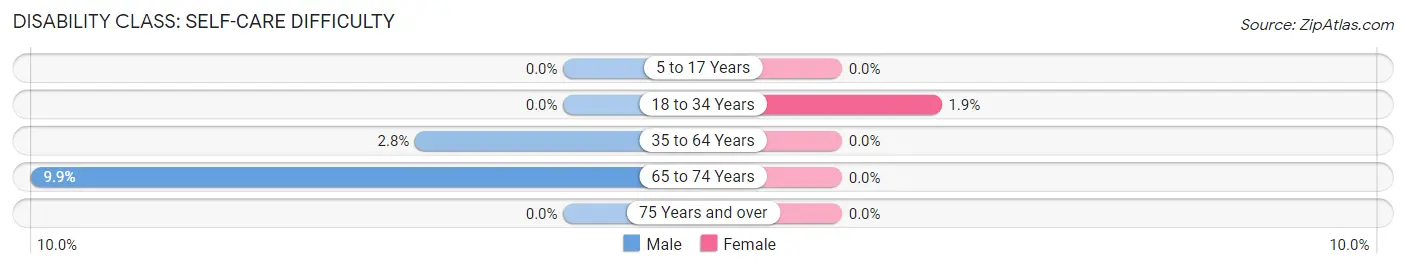
| Age Bracket | Male | Female |
| 5 to 17 Years | 0 (0.0%) | 0 (0.0%) |
| 18 to 34 Years | 0 (0.0%) | 3 (1.8%) |
| 35 to 64 Years | 6 (2.8%) | 0 (0.0%) |
| 65 to 74 Years | 9 (9.9%) | 0 (0.0%) |
| 75 Years and over | 0 (0.0%) | 0 (0.0%) |
Technology Access in Franklin
Computing Device Access in Franklin
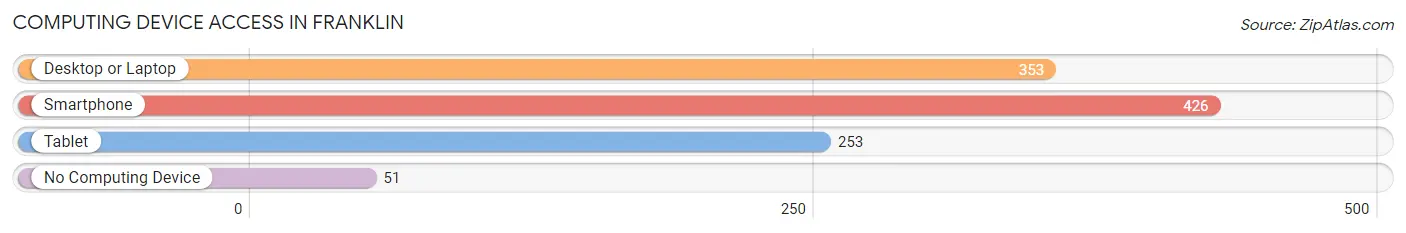
| Device Type | # Households | % Households |
| Desktop or Laptop | 353 | 69.2% |
| Smartphone | 426 | 83.5% |
| Tablet | 253 | 49.6% |
| No Computing Device | 51 | 10.0% |
| Total | 510 | 100.0% |
Internet Access in Franklin
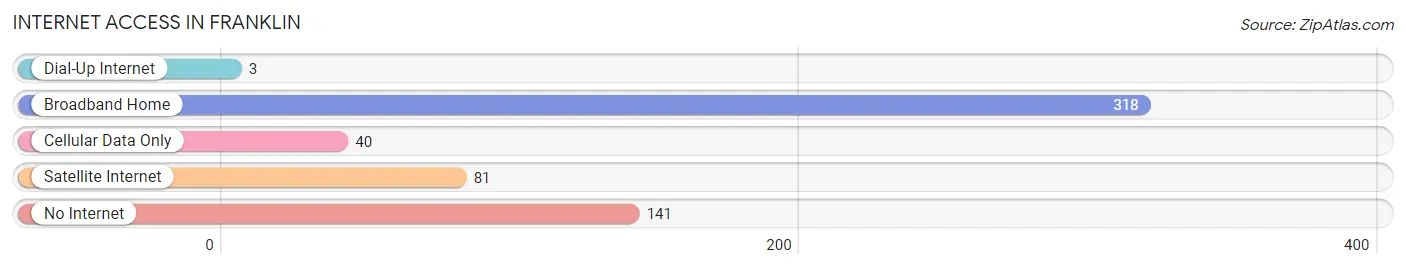
| Internet Type | # Households | % Households |
| Dial-Up Internet | 3 | 0.6% |
| Broadband Home | 318 | 62.4% |
| Cellular Data Only | 40 | 7.8% |
| Satellite Internet | 81 | 15.9% |
| No Internet | 141 | 27.7% |
| Total | 510 | 100.0% |
Franklin Summary
Franklin, Texas is a small town located in Robertson County, Texas. It is situated about halfway between Bryan and Hearne, and is part of the Bryan-College Station metropolitan area. The population of Franklin was 1,845 in the 2010 census, making it the second-largest town in Robertson County.
History
Franklin was founded in 1846 by a group of settlers from Tennessee. The town was named after Benjamin Franklin, one of the Founding Fathers of the United States. The town was originally a farming community, and the first post office was established in 1848.
In the late 19th century, the town began to grow and prosper. The railroad arrived in 1881, and the town was incorporated in 1882. The town was a center of commerce for the surrounding area, and the population grew to over 1,000 by the early 20th century.
In the early 20th century, Franklin was a thriving agricultural center. Cotton was the main crop, and the town had several cotton gins and a cottonseed oil mill. The town also had several stores, a bank, a hotel, and a movie theater.
Geography
Franklin is located in Robertson County, Texas, about halfway between Bryan and Hearne. The town is situated on the Brazos River, and is surrounded by rolling hills and farmland. The climate is hot and humid in the summer, and mild in the winter.
Economy
Franklin’s economy is largely based on agriculture. Cotton is still the main crop, and the town also produces corn, wheat, and hay. The town also has several small businesses, including a grocery store, a hardware store, and a restaurant.
Demographics
As of the 2010 census, the population of Franklin was 1,845. The racial makeup of the town was 79.3% White, 16.2% Hispanic or Latino, 1.7% African American, 0.7% Native American, 0.3% Asian, and 1.9% from other races. The median household income was $37,917, and the median family income was $45,938.
Conclusion
Franklin, Texas is a small town located in Robertson County, Texas. It was founded in 1846 by a group of settlers from Tennessee, and was named after Benjamin Franklin. The town was originally a farming community, and the railroad arrived in 1881. Today, Franklin is a thriving agricultural center, and the population is 1,845. The town’s economy is largely based on agriculture, and the town also has several small businesses. The racial makeup of the town is 79.3% White, 16.2% Hispanic or Latino, 1.7% African American, 0.7% Native American, 0.3% Asian, and 1.9% from other races. The median household income is $37,917, and the median family income is $45,938.
Common Questions
What is Per Capita Income in Franklin?
Per Capita income in Franklin is $25,563.
What is the Median Family Income in Franklin?
Median Family Income in Franklin is $56,250.
What is the Median Household income in Franklin?
Median Household Income in Franklin is $49,063.
What is Income or Wage Gap in Franklin?
Income or Wage Gap in Franklin is 71.4%.
Women in Franklin earn 28.6 cents for every dollar earned by a man.
What is Inequality or Gini Index in Franklin?
Inequality or Gini Index in Franklin is 0.41.
What is the Total Population of Franklin?
Total Population of Franklin is 1,354.
What is the Total Male Population of Franklin?
Total Male Population of Franklin is 617.
What is the Total Female Population of Franklin?
Total Female Population of Franklin is 737.
What is the Ratio of Males per 100 Females in Franklin?
There are 83.72 Males per 100 Females in Franklin.
What is the Ratio of Females per 100 Males in Franklin?
There are 119.45 Females per 100 Males in Franklin.
What is the Median Population Age in Franklin?
Median Population Age in Franklin is 39.6 Years.
What is the Average Family Size in Franklin
Average Family Size in Franklin is 3.1 People.
What is the Average Household Size in Franklin
Average Household Size in Franklin is 2.4 People.
How Large is the Labor Force in Franklin?
There are 572 People in the Labor Forcein in Franklin.
What is the Percentage of People in the Labor Force in Franklin?
53.1% of People are in the Labor Force in Franklin.
What is the Unemployment Rate in Franklin?
Unemployment Rate in Franklin is 9.6%.