Forney, TX Map & Demographics
Forney Map
Forney Overview
$37,044
PER CAPITA INCOME
$123,459
AVG FAMILY INCOME
$102,107
AVG HOUSEHOLD INCOME
18.1%
WAGE / INCOME GAP [ % ]
81.9¢/ $1
WAGE / INCOME GAP [ $ ]
0.33
INEQUALITY / GINI INDEX
25,269
TOTAL POPULATION
13,588
MALE POPULATION
11,681
FEMALE POPULATION
116.33
MALES / 100 FEMALES
85.97
FEMALES / 100 MALES
32.0
MEDIAN AGE
3.4
AVG FAMILY SIZE
3.0
AVG HOUSEHOLD SIZE
14,198
LABOR FORCE [ PEOPLE ]
75.0%
PERCENT IN LABOR FORCE
5.0%
UNEMPLOYMENT RATE
Forney Zip Codes
Income in Forney
Income Overview in Forney
Per Capita Income in Forney is $37,044, while median incomes of families and households are $123,459 and $102,107 respectively.
| Characteristic | Number | Measure |
| Per Capita Income | 25,269 | $37,044 |
| Median Family Income | 6,482 | $123,459 |
| Mean Family Income | 6,482 | $120,228 |
| Median Household Income | 8,520 | $102,107 |
| Mean Household Income | 8,520 | $108,591 |
| Income Deficit | 6,482 | $0 |
| Wage / Income Gap (%) | 25,269 | 18.09% |
| Wage / Income Gap ($) | 25,269 | 81.91¢ per $1 |
| Gini / Inequality Index | 25,269 | 0.33 |
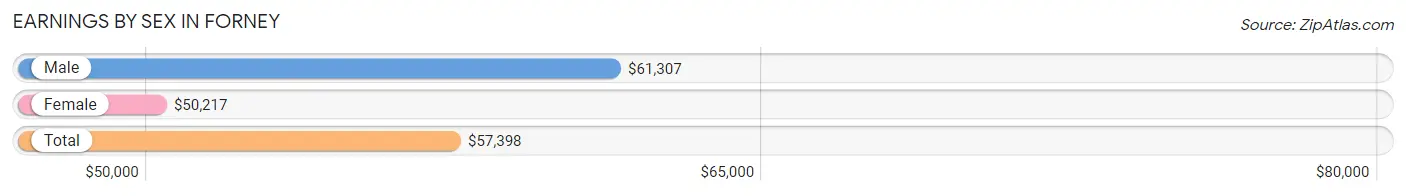
Earnings by Sex in Forney
Average Earnings in Forney are $57,398, $61,307 for men and $50,217 for women, a difference of 18.1%.
| Sex | Number | Average Earnings |
| Male | 7,684 (53.5%) | $61,307 |
| Female | 6,689 (46.5%) | $50,217 |
| Total | 14,373 (100.0%) | $57,398 |
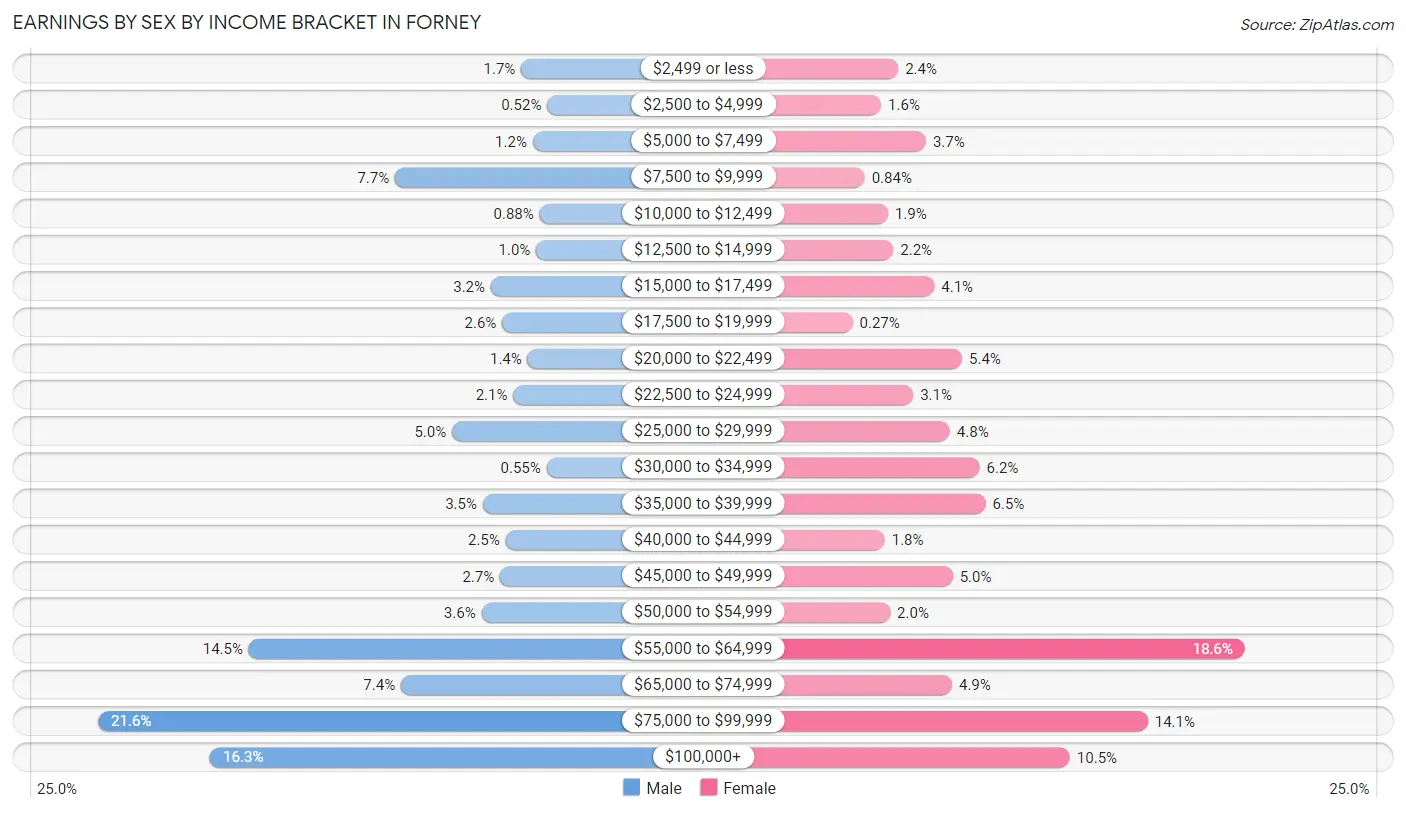
Earnings by Sex by Income Bracket in Forney
The most common earnings brackets in Forney are $75,000 to $99,999 for men (1,657 | 21.6%) and $55,000 to $64,999 for women (1,247 | 18.6%).
| Income | Male | Female |
| $2,499 or less | 134 (1.7%) | 161 (2.4%) |
| $2,500 to $4,999 | 40 (0.5%) | 108 (1.6%) |
| $5,000 to $7,499 | 92 (1.2%) | 248 (3.7%) |
| $7,500 to $9,999 | 588 (7.6%) | 56 (0.8%) |
| $10,000 to $12,499 | 68 (0.9%) | 129 (1.9%) |
| $12,500 to $14,999 | 80 (1.0%) | 146 (2.2%) |
| $15,000 to $17,499 | 243 (3.2%) | 274 (4.1%) |
| $17,500 to $19,999 | 202 (2.6%) | 18 (0.3%) |
| $20,000 to $22,499 | 111 (1.4%) | 361 (5.4%) |
| $22,500 to $24,999 | 162 (2.1%) | 208 (3.1%) |
| $25,000 to $29,999 | 383 (5.0%) | 323 (4.8%) |
| $30,000 to $34,999 | 42 (0.5%) | 416 (6.2%) |
| $35,000 to $39,999 | 272 (3.5%) | 435 (6.5%) |
| $40,000 to $44,999 | 190 (2.5%) | 119 (1.8%) |
| $45,000 to $49,999 | 210 (2.7%) | 332 (5.0%) |
| $50,000 to $54,999 | 277 (3.6%) | 136 (2.0%) |
| $55,000 to $64,999 | 1,114 (14.5%) | 1,247 (18.6%) |
| $65,000 to $74,999 | 566 (7.4%) | 330 (4.9%) |
| $75,000 to $99,999 | 1,657 (21.6%) | 943 (14.1%) |
| $100,000+ | 1,253 (16.3%) | 699 (10.4%) |
| Total | 7,684 (100.0%) | 6,689 (100.0%) |
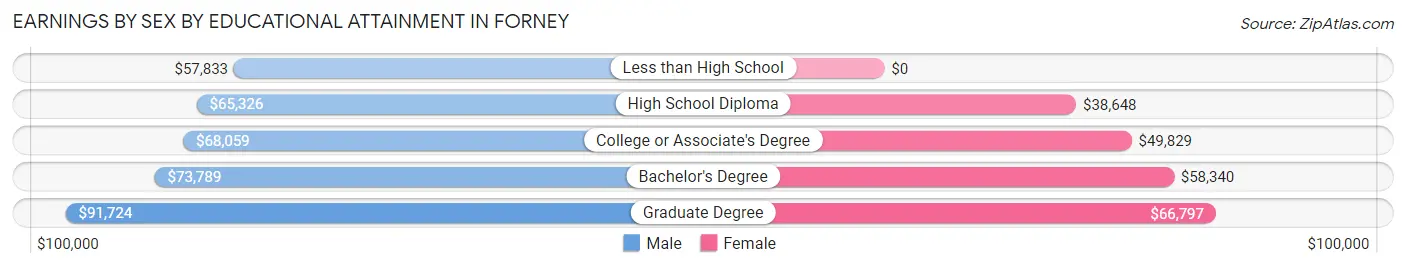
Earnings by Sex by Educational Attainment in Forney
Average earnings in Forney are $68,713 for men and $57,179 for women, a difference of 16.8%. Men with an educational attainment of graduate degree enjoy the highest average annual earnings of $91,724, while those with less than high school education earn the least with $57,833. Women with an educational attainment of graduate degree earn the most with the average annual earnings of $66,797, while those with high school diploma education have the smallest earnings of $38,648.
| Educational Attainment | Male Income | Female Income |
| Less than High School | $57,833 | $0 |
| High School Diploma | $65,326 | $38,648 |
| College or Associate's Degree | $68,059 | $49,829 |
| Bachelor's Degree | $73,789 | $58,340 |
| Graduate Degree | $91,724 | $66,797 |
| Total | $68,713 | $57,179 |
Family Income in Forney
Family Income Brackets in Forney
According to the Forney family income data, there are 1,731 families falling into the $100,000 to $149,999 income range, which is the most common income bracket and makes up 26.7% of all families. Conversely, the $10,000 to $14,999 income bracket is the least frequent group with only 52 families (0.8%) belonging to this category.
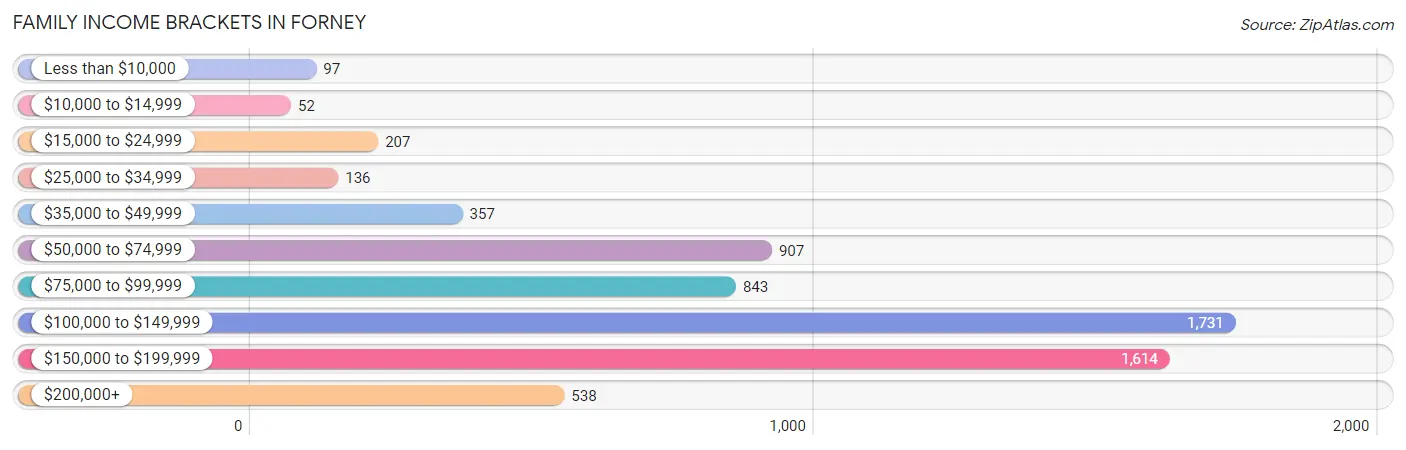
| Income Bracket | # Families | % Families |
| Less than $10,000 | 97 | 1.5% |
| $10,000 to $14,999 | 52 | 0.8% |
| $15,000 to $24,999 | 207 | 3.2% |
| $25,000 to $34,999 | 136 | 2.1% |
| $35,000 to $49,999 | 357 | 5.5% |
| $50,000 to $74,999 | 907 | 14.0% |
| $75,000 to $99,999 | 843 | 13.0% |
| $100,000 to $149,999 | 1,731 | 26.7% |
| $150,000 to $199,999 | 1,614 | 24.9% |
| $200,000+ | 538 | 8.3% |
Family Income by Famaliy Size in Forney
4-person families (1,688 | 26.0%) account for the highest median family income in Forney with $154,618 per family, while 2-person families (2,184 | 33.7%) have the highest median income of $47,206 per family member.
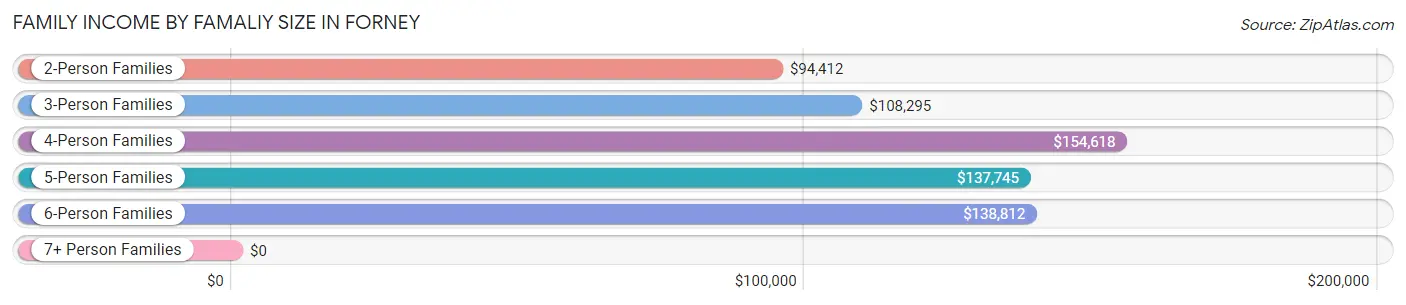
| Income Bracket | # Families | Median Income |
| 2-Person Families | 2,184 (33.7%) | $94,412 |
| 3-Person Families | 1,419 (21.9%) | $108,295 |
| 4-Person Families | 1,688 (26.0%) | $154,618 |
| 5-Person Families | 708 (10.9%) | $137,745 |
| 6-Person Families | 364 (5.6%) | $138,812 |
| 7+ Person Families | 119 (1.8%) | $0 |
| Total | 6,482 (100.0%) | $123,459 |
Family Income by Number of Earners in Forney
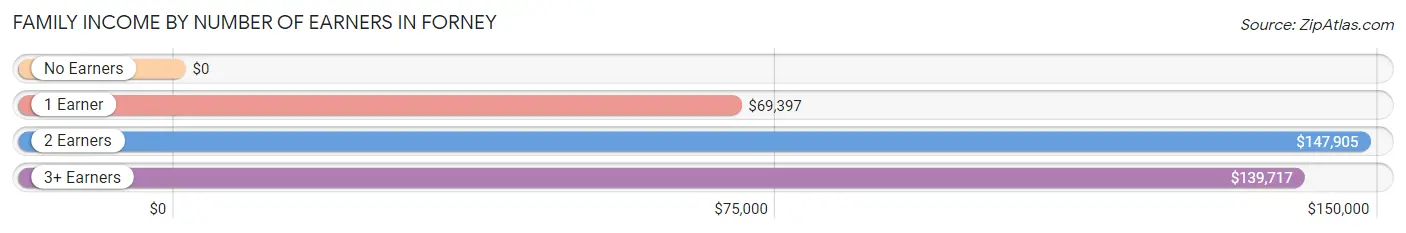
| Number of Earners | # Families | Median Income |
| No Earners | 338 (5.2%) | $0 |
| 1 Earner | 1,915 (29.5%) | $69,397 |
| 2 Earners | 3,294 (50.8%) | $147,905 |
| 3+ Earners | 935 (14.4%) | $139,717 |
| Total | 6,482 (100.0%) | $123,459 |
Household Income in Forney
Household Income Brackets in Forney
With 2,045 households falling in the category, the $100,000 to $149,999 income range is the most frequent in Forney, accounting for 24.0% of all households. In contrast, only 136 households (1.6%) fall into the $10,000 to $14,999 income bracket, making it the least populous group.
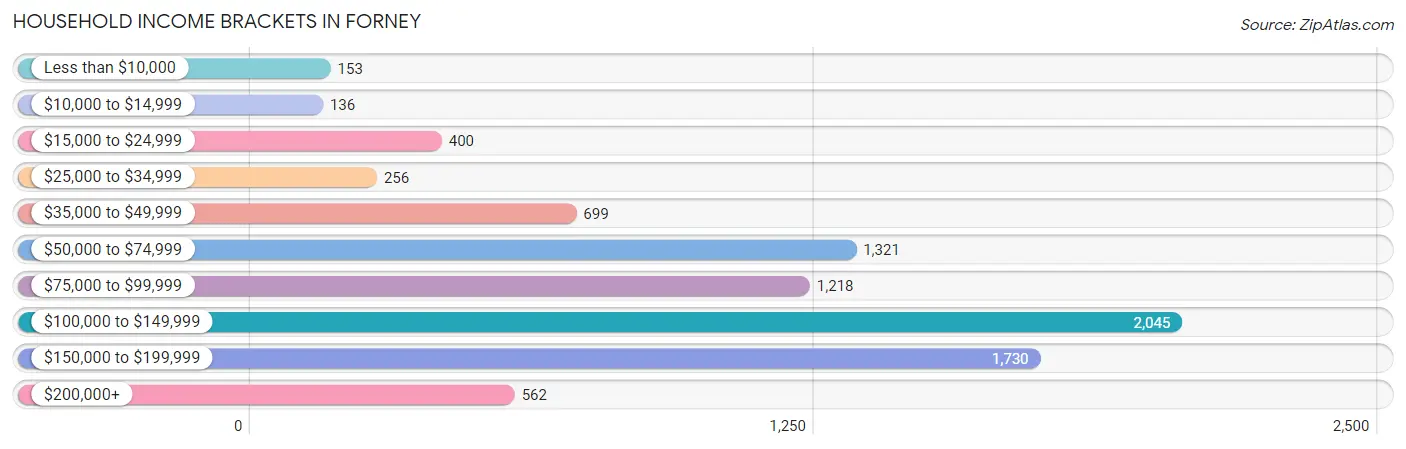
| Income Bracket | # Households | % Households |
| Less than $10,000 | 153 | 1.8% |
| $10,000 to $14,999 | 136 | 1.6% |
| $15,000 to $24,999 | 400 | 4.7% |
| $25,000 to $34,999 | 256 | 3.0% |
| $35,000 to $49,999 | 699 | 8.2% |
| $50,000 to $74,999 | 1,321 | 15.5% |
| $75,000 to $99,999 | 1,218 | 14.3% |
| $100,000 to $149,999 | 2,045 | 24.0% |
| $150,000 to $199,999 | 1,730 | 20.3% |
| $200,000+ | 562 | 6.6% |
Household Income by Householder Age in Forney
The median household income in Forney is $102,107, with the highest median household income of $115,026 found in the 45 to 64 years age bracket for the primary householder. A total of 3,035 households (35.6%) fall into this category. Meanwhile, the 15 to 24 years age bracket for the primary householder has the lowest median household income of $0, with 232 households (2.7%) in this group.
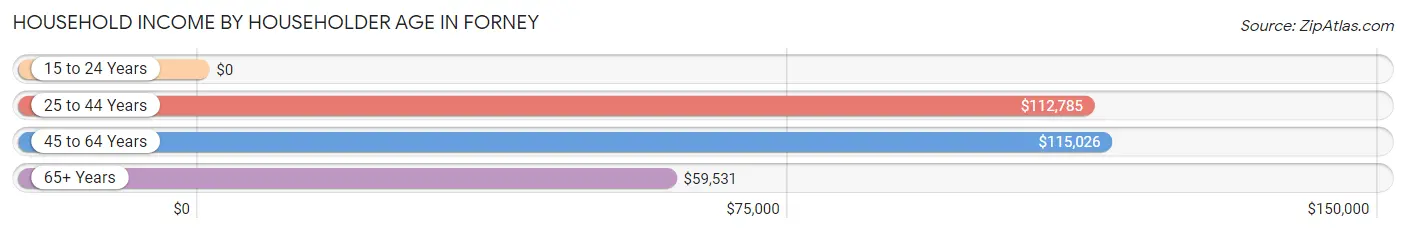
| Income Bracket | # Households | Median Income |
| 15 to 24 Years | 232 (2.7%) | $0 |
| 25 to 44 Years | 4,099 (48.1%) | $112,785 |
| 45 to 64 Years | 3,035 (35.6%) | $115,026 |
| 65+ Years | 1,154 (13.5%) | $59,531 |
| Total | 8,520 (100.0%) | $102,107 |
Poverty in Forney
Income Below Poverty by Sex and Age in Forney
With 5.6% poverty level for males and 8.0% for females among the residents of Forney, 15 year old males and 75 year old and over females are the most vulnerable to poverty, with 48 males (17.0%) and 69 females (29.9%) in their respective age groups living below the poverty level.
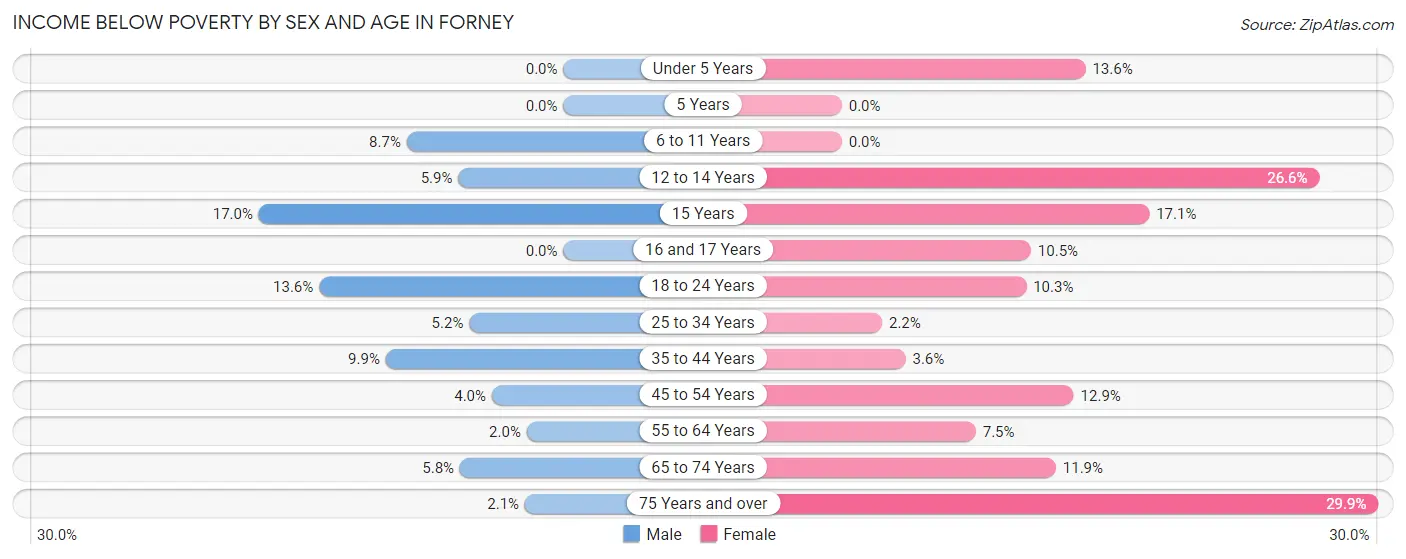
| Age Bracket | Male | Female |
| Under 5 Years | 0 (0.0%) | 84 (13.6%) |
| 5 Years | 0 (0.0%) | 0 (0.0%) |
| 6 to 11 Years | 80 (8.7%) | 0 (0.0%) |
| 12 to 14 Years | 33 (5.9%) | 109 (26.6%) |
| 15 Years | 48 (17.0%) | 25 (17.1%) |
| 16 and 17 Years | 0 (0.0%) | 38 (10.5%) |
| 18 to 24 Years | 161 (13.6%) | 156 (10.3%) |
| 25 to 34 Years | 117 (5.2%) | 47 (2.2%) |
| 35 to 44 Years | 182 (9.9%) | 78 (3.5%) |
| 45 to 54 Years | 70 (4.0%) | 172 (12.9%) |
| 55 to 64 Years | 26 (2.0%) | 77 (7.5%) |
| 65 to 74 Years | 30 (5.8%) | 75 (11.9%) |
| 75 Years and over | 8 (2.1%) | 69 (29.9%) |
| Total | 755 (5.6%) | 930 (8.0%) |
Income Above Poverty by Sex and Age in Forney
According to the poverty statistics in Forney, males aged under 5 years and females aged 5 years are the age groups that are most secure financially, with 100.0% of males and 100.0% of females in these age groups living above the poverty line.
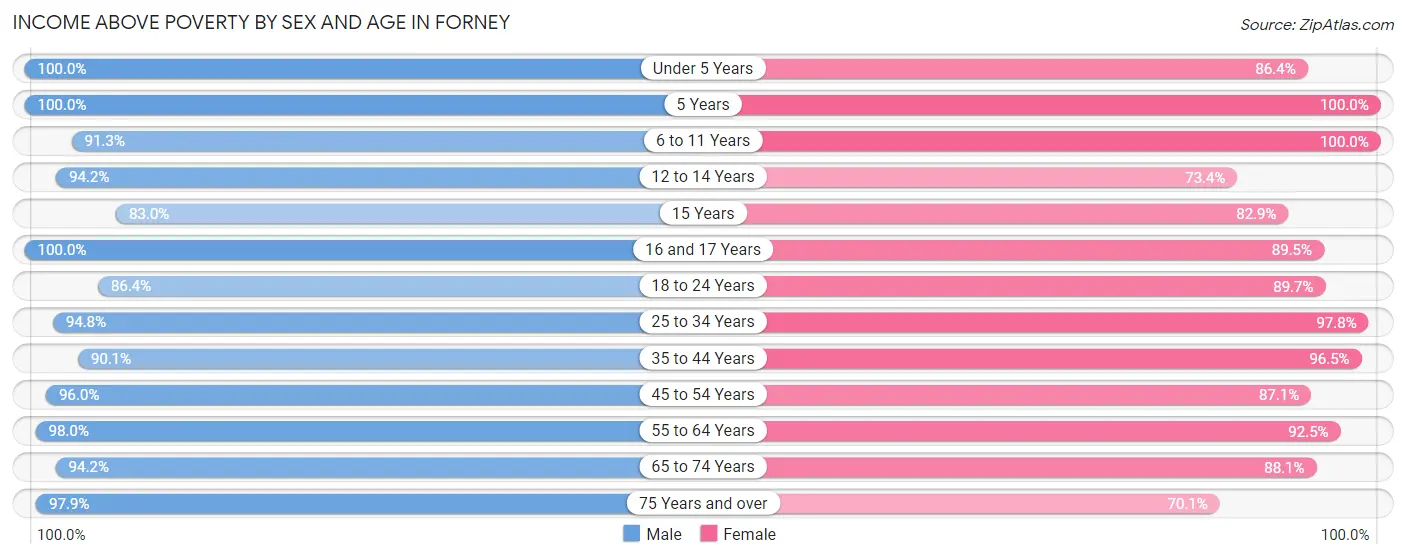
| Age Bracket | Male | Female |
| Under 5 Years | 1,780 (100.0%) | 535 (86.4%) |
| 5 Years | 434 (100.0%) | 268 (100.0%) |
| 6 to 11 Years | 837 (91.3%) | 812 (100.0%) |
| 12 to 14 Years | 531 (94.2%) | 301 (73.4%) |
| 15 Years | 235 (83.0%) | 121 (82.9%) |
| 16 and 17 Years | 326 (100.0%) | 323 (89.5%) |
| 18 to 24 Years | 1,023 (86.4%) | 1,363 (89.7%) |
| 25 to 34 Years | 2,117 (94.8%) | 2,050 (97.8%) |
| 35 to 44 Years | 1,658 (90.1%) | 2,119 (96.5%) |
| 45 to 54 Years | 1,691 (96.0%) | 1,160 (87.1%) |
| 55 to 64 Years | 1,250 (98.0%) | 955 (92.5%) |
| 65 to 74 Years | 491 (94.2%) | 554 (88.1%) |
| 75 Years and over | 365 (97.9%) | 162 (70.1%) |
| Total | 12,738 (94.4%) | 10,723 (92.0%) |
Income Below Poverty Among Married-Couple Families in Forney
The poverty statistics for married-couple families in Forney show that 3.7% or 180 of the total 4,834 families live below the poverty line. Families with 1 or 2 children have the highest poverty rate of 5.8%, comprising of 141 families. On the other hand, families with 3 or 4 children have the lowest poverty rate of 0.0%, which includes 0 families.
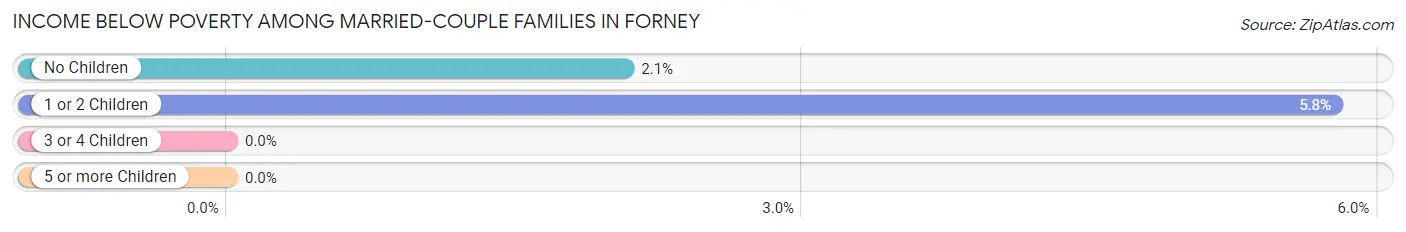
| Children | Above Poverty | Below Poverty |
| No Children | 1,844 (97.9%) | 39 (2.1%) |
| 1 or 2 Children | 2,301 (94.2%) | 141 (5.8%) |
| 3 or 4 Children | 445 (100.0%) | 0 (0.0%) |
| 5 or more Children | 64 (100.0%) | 0 (0.0%) |
| Total | 4,654 (96.3%) | 180 (3.7%) |
Income Below Poverty Among Single-Parent Households in Forney
According to the poverty data in Forney, 7.5% or 33 single-father households and 11.4% or 138 single-mother households are living below the poverty line. Among single-father households, those with 1 or 2 children have the highest poverty rate, with 33 households (12.7%) experiencing poverty. Likewise, among single-mother households, those with 3 or 4 children have the highest poverty rate, with 25 households (15.1%) falling below the poverty line.
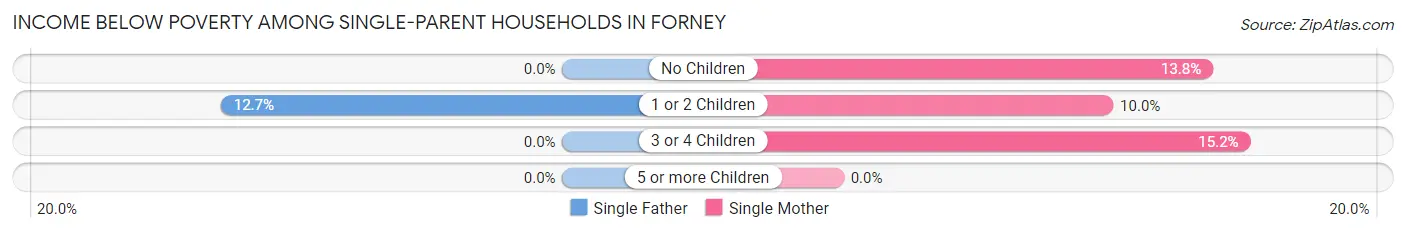
| Children | Single Father | Single Mother |
| No Children | 0 (0.0%) | 30 (13.8%) |
| 1 or 2 Children | 33 (12.7%) | 83 (10.0%) |
| 3 or 4 Children | 0 (0.0%) | 25 (15.1%) |
| 5 or more Children | 0 (0.0%) | 0 (0.0%) |
| Total | 33 (7.5%) | 138 (11.4%) |
Income Below Poverty Among Married-Couple vs Single-Parent Households in Forney
The poverty data for Forney shows that 180 of the married-couple family households (3.7%) and 171 of the single-parent households (10.4%) are living below the poverty level. Within the married-couple family households, those with 1 or 2 children have the highest poverty rate, with 141 households (5.8%) falling below the poverty line. Among the single-parent households, those with 3 or 4 children have the highest poverty rate, with 25 household (11.4%) living below poverty.
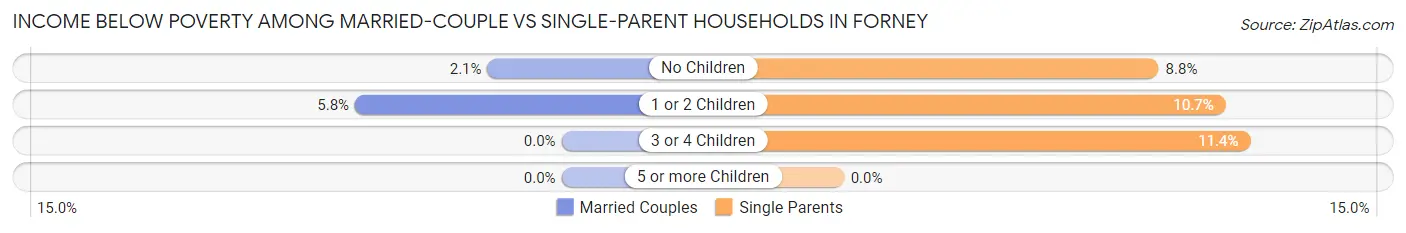
| Children | Married-Couple Families | Single-Parent Households |
| No Children | 39 (2.1%) | 30 (8.8%) |
| 1 or 2 Children | 141 (5.8%) | 116 (10.7%) |
| 3 or 4 Children | 0 (0.0%) | 25 (11.4%) |
| 5 or more Children | 0 (0.0%) | 0 (0.0%) |
| Total | 180 (3.7%) | 171 (10.4%) |
Race in Forney
The most populous races in Forney are White / Caucasian (17,847 | 70.6%), Hispanic or Latino (4,548 | 18.0%), and Black / African American (4,058 | 16.1%).
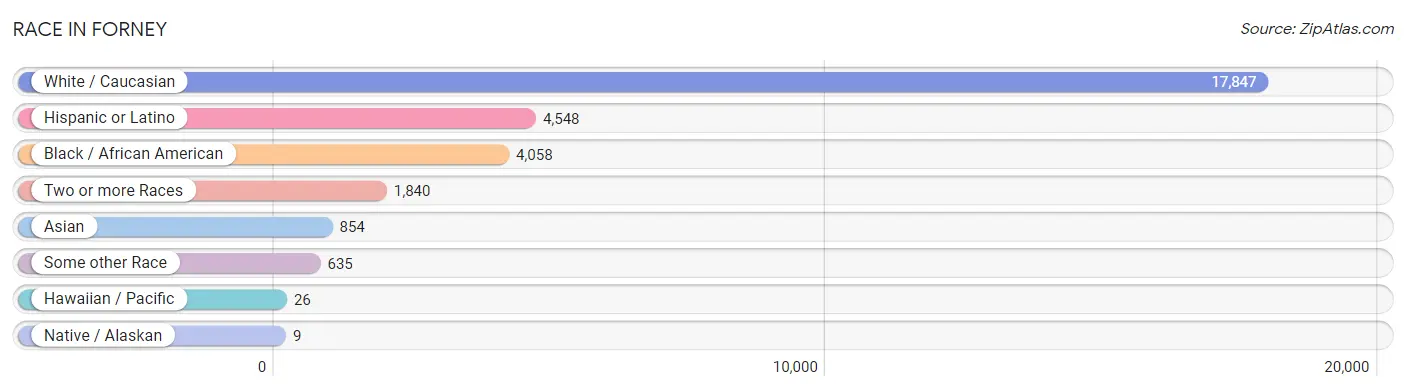
| Race | # Population | % Population |
| Asian | 854 | 3.4% |
| Black / African American | 4,058 | 16.1% |
| Hawaiian / Pacific | 26 | 0.1% |
| Hispanic or Latino | 4,548 | 18.0% |
| Native / Alaskan | 9 | 0.0% |
| White / Caucasian | 17,847 | 70.6% |
| Two or more Races | 1,840 | 7.3% |
| Some other Race | 635 | 2.5% |
| Total | 25,269 | 100.0% |
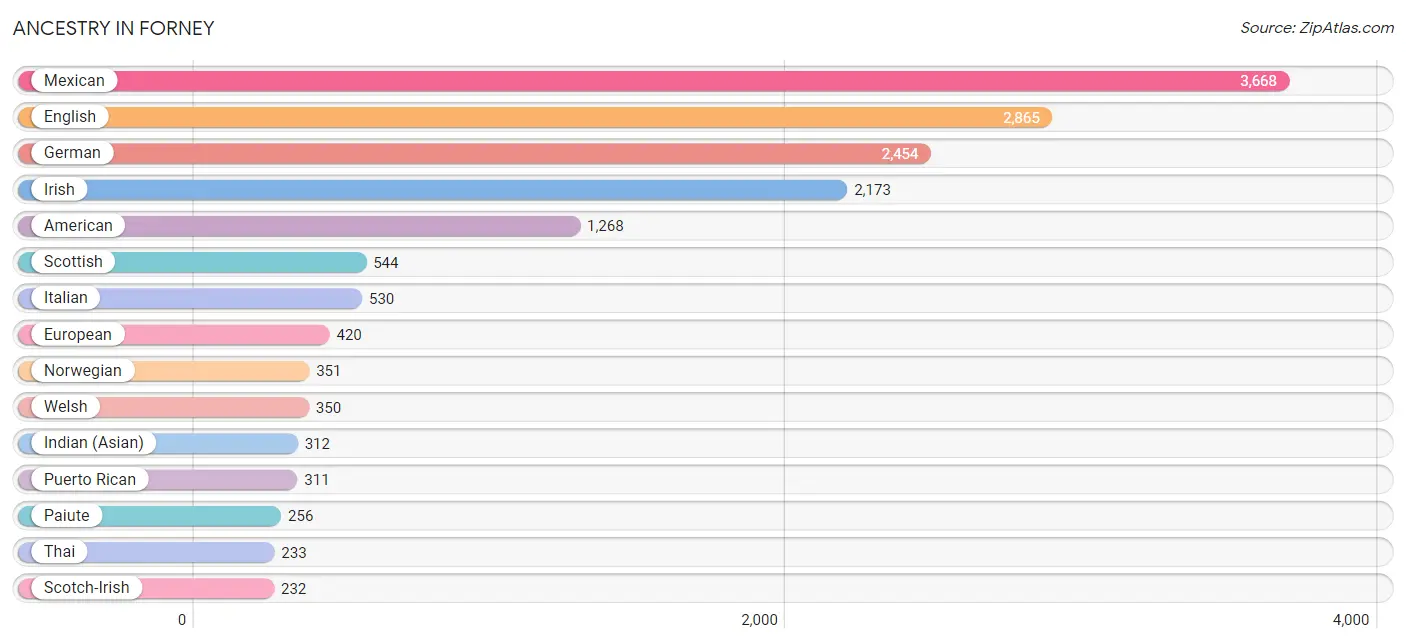
Ancestry in Forney
The most populous ancestries reported in Forney are Mexican (3,668 | 14.5%), English (2,865 | 11.3%), German (2,454 | 9.7%), Irish (2,173 | 8.6%), and American (1,268 | 5.0%), together accounting for 49.2% of all Forney residents.
| Ancestry | # Population | % Population |
| African | 115 | 0.5% |
| American | 1,268 | 5.0% |
| Arab | 126 | 0.5% |
| Austrian | 17 | 0.1% |
| Bhutanese | 141 | 0.6% |
| British | 107 | 0.4% |
| Canadian | 31 | 0.1% |
| Central American | 49 | 0.2% |
| Cherokee | 75 | 0.3% |
| Chilean | 62 | 0.3% |
| Choctaw | 21 | 0.1% |
| Czech | 96 | 0.4% |
| Czechoslovakian | 17 | 0.1% |
| Danish | 12 | 0.1% |
| Dutch | 22 | 0.1% |
| Eastern European | 93 | 0.4% |
| Egyptian | 37 | 0.2% |
| English | 2,865 | 11.3% |
| European | 420 | 1.7% |
| French | 66 | 0.3% |
| French Canadian | 107 | 0.4% |
| German | 2,454 | 9.7% |
| Guamanian / Chamorro | 26 | 0.1% |
| Honduran | 49 | 0.2% |
| Indian (Asian) | 312 | 1.2% |
| Iranian | 21 | 0.1% |
| Irish | 2,173 | 8.6% |
| Italian | 530 | 2.1% |
| Korean | 89 | 0.4% |
| Lebanese | 59 | 0.2% |
| Malaysian | 49 | 0.2% |
| Mexican | 3,668 | 14.5% |
| Native Hawaiian | 32 | 0.1% |
| Northern European | 181 | 0.7% |
| Norwegian | 351 | 1.4% |
| Paiute | 256 | 1.0% |
| Pennsylvania German | 52 | 0.2% |
| Peruvian | 165 | 0.6% |
| Polish | 84 | 0.3% |
| Portuguese | 17 | 0.1% |
| Puerto Rican | 311 | 1.2% |
| Russian | 18 | 0.1% |
| Scandinavian | 100 | 0.4% |
| Scotch-Irish | 232 | 0.9% |
| Scottish | 544 | 2.1% |
| Slovak | 22 | 0.1% |
| Slovene | 48 | 0.2% |
| South American | 227 | 0.9% |
| South American Indian | 21 | 0.1% |
| Spaniard | 34 | 0.1% |
| Spanish | 15 | 0.1% |
| Sri Lankan | 172 | 0.7% |
| Subsaharan African | 115 | 0.5% |
| Swedish | 89 | 0.4% |
| Swiss | 32 | 0.1% |
| Syrian | 30 | 0.1% |
| Thai | 233 | 0.9% |
| Welsh | 350 | 1.4% | View All 58 Rows |
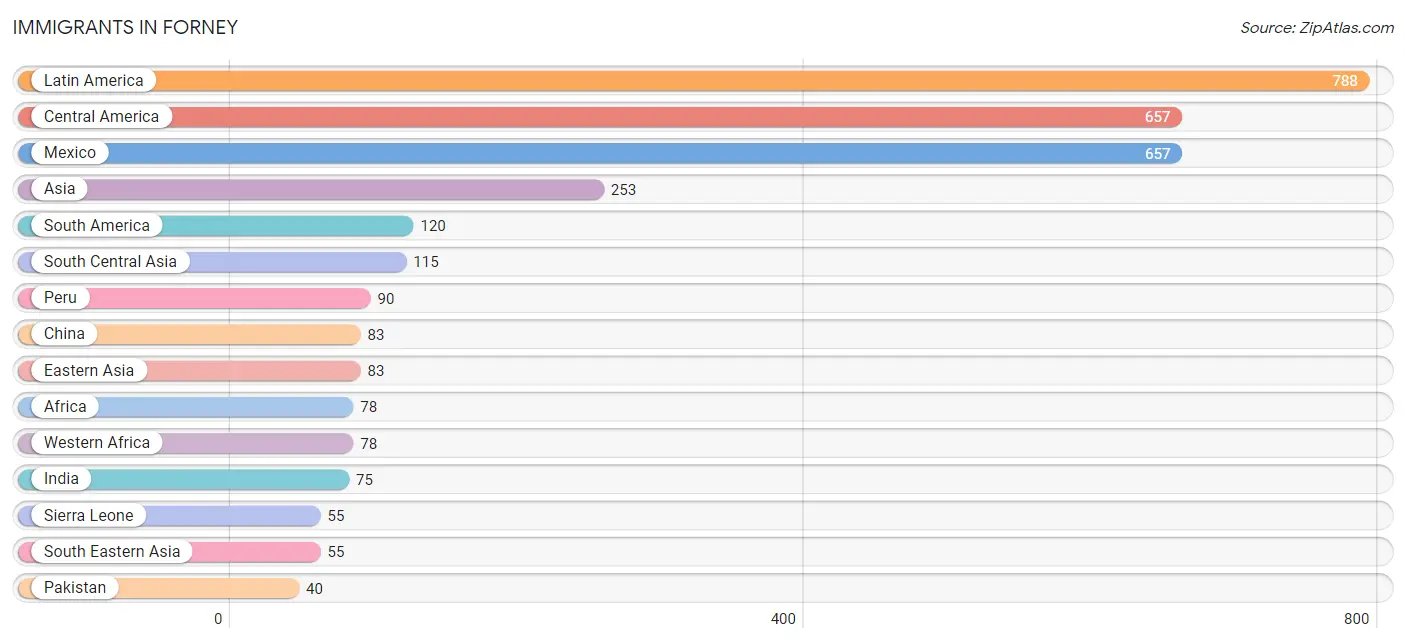
Immigrants in Forney
The most numerous immigrant groups reported in Forney came from Latin America (788 | 3.1%), Central America (657 | 2.6%), Mexico (657 | 2.6%), Asia (253 | 1.0%), and South America (120 | 0.5%), together accounting for 9.8% of all Forney residents.
| Immigration Origin | # Population | % Population |
| Africa | 78 | 0.3% |
| Asia | 253 | 1.0% |
| Canada | 10 | 0.0% |
| Caribbean | 11 | 0.0% |
| Central America | 657 | 2.6% |
| Chile | 30 | 0.1% |
| China | 83 | 0.3% |
| Eastern Asia | 83 | 0.3% |
| Europe | 19 | 0.1% |
| Germany | 19 | 0.1% |
| Haiti | 11 | 0.0% |
| India | 75 | 0.3% |
| Latin America | 788 | 3.1% |
| Mexico | 657 | 2.6% |
| Nigeria | 23 | 0.1% |
| Pakistan | 40 | 0.2% |
| Peru | 90 | 0.4% |
| Sierra Leone | 55 | 0.2% |
| Singapore | 27 | 0.1% |
| South America | 120 | 0.5% |
| South Central Asia | 115 | 0.5% |
| South Eastern Asia | 55 | 0.2% |
| Vietnam | 28 | 0.1% |
| Western Africa | 78 | 0.3% |
| Western Europe | 19 | 0.1% | View All 25 Rows |
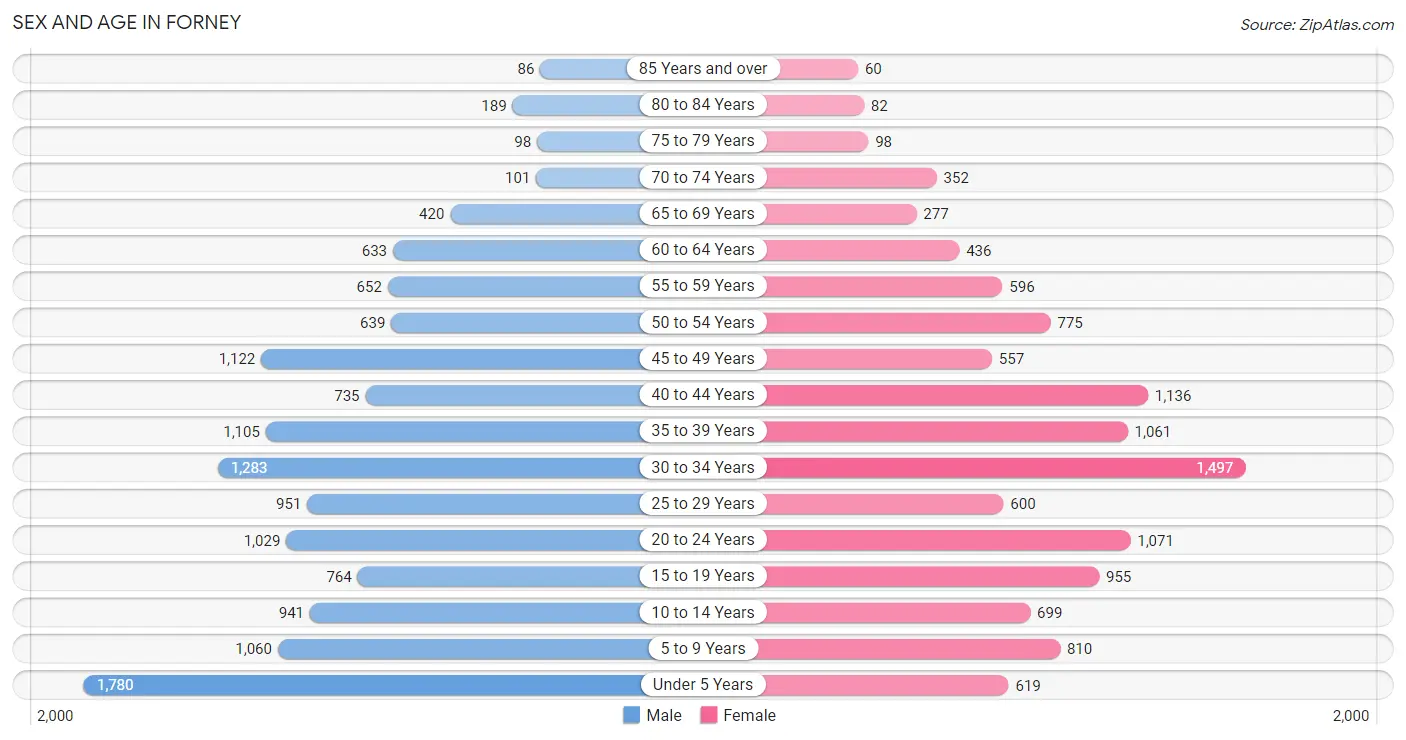
Sex and Age in Forney
Sex and Age in Forney
The most populous age groups in Forney are Under 5 Years (1,780 | 13.1%) for men and 30 to 34 Years (1,497 | 12.8%) for women.
| Age Bracket | Male | Female |
| Under 5 Years | 1,780 (13.1%) | 619 (5.3%) |
| 5 to 9 Years | 1,060 (7.8%) | 810 (6.9%) |
| 10 to 14 Years | 941 (6.9%) | 699 (6.0%) |
| 15 to 19 Years | 764 (5.6%) | 955 (8.2%) |
| 20 to 24 Years | 1,029 (7.6%) | 1,071 (9.2%) |
| 25 to 29 Years | 951 (7.0%) | 600 (5.1%) |
| 30 to 34 Years | 1,283 (9.4%) | 1,497 (12.8%) |
| 35 to 39 Years | 1,105 (8.1%) | 1,061 (9.1%) |
| 40 to 44 Years | 735 (5.4%) | 1,136 (9.7%) |
| 45 to 49 Years | 1,122 (8.3%) | 557 (4.8%) |
| 50 to 54 Years | 639 (4.7%) | 775 (6.6%) |
| 55 to 59 Years | 652 (4.8%) | 596 (5.1%) |
| 60 to 64 Years | 633 (4.7%) | 436 (3.7%) |
| 65 to 69 Years | 420 (3.1%) | 277 (2.4%) |
| 70 to 74 Years | 101 (0.7%) | 352 (3.0%) |
| 75 to 79 Years | 98 (0.7%) | 98 (0.8%) |
| 80 to 84 Years | 189 (1.4%) | 82 (0.7%) |
| 85 Years and over | 86 (0.6%) | 60 (0.5%) |
| Total | 13,588 (100.0%) | 11,681 (100.0%) |
Families and Households in Forney
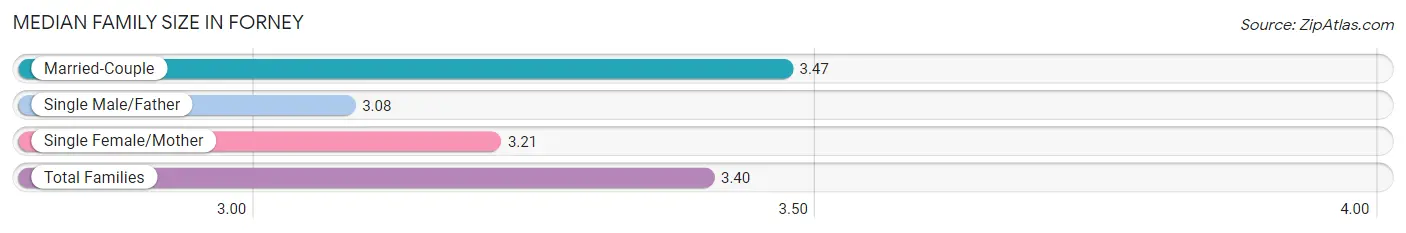
Median Family Size in Forney
The median family size in Forney is 3.40 persons per family, with married-couple families (4,834 | 74.6%) accounting for the largest median family size of 3.47 persons per family. On the other hand, single male/father families (438 | 6.8%) represent the smallest median family size with 3.08 persons per family.
| Family Type | # Families | Family Size |
| Married-Couple | 4,834 (74.6%) | 3.47 |
| Single Male/Father | 438 (6.8%) | 3.08 |
| Single Female/Mother | 1,210 (18.7%) | 3.21 |
| Total Families | 6,482 (100.0%) | 3.40 |
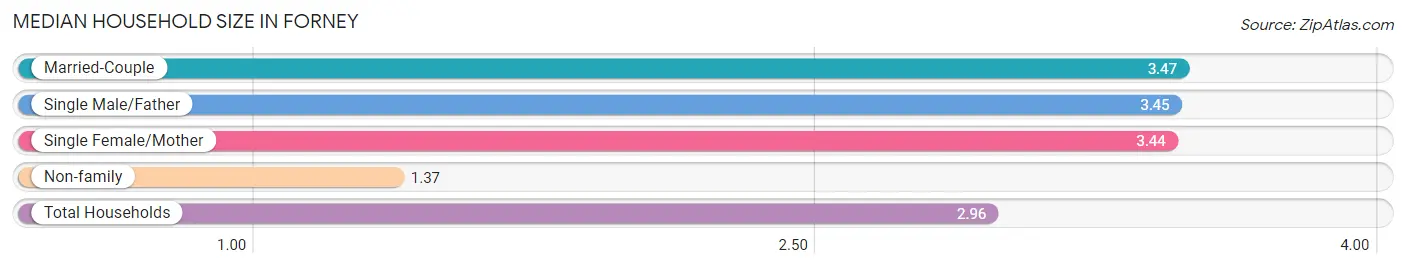
Median Household Size in Forney
The median household size in Forney is 2.96 persons per household, with married-couple households (4,834 | 56.7%) accounting for the largest median household size of 3.47 persons per household. non-family households (2,038 | 23.9%) represent the smallest median household size with 1.37 persons per household.
| Household Type | # Households | Household Size |
| Married-Couple | 4,834 (56.7%) | 3.47 |
| Single Male/Father | 438 (5.1%) | 3.45 |
| Single Female/Mother | 1,210 (14.2%) | 3.44 |
| Non-family | 2,038 (23.9%) | 1.37 |
| Total Households | 8,520 (100.0%) | 2.96 |
Household Size by Marriage Status in Forney
Out of a total of 8,520 households in Forney, 6,482 (76.1%) are family households, while 2,038 (23.9%) are nonfamily households. The most numerous type of family households are 2-person households, comprising 2,013, and the most common type of nonfamily households are 1-person households, comprising 1,562.
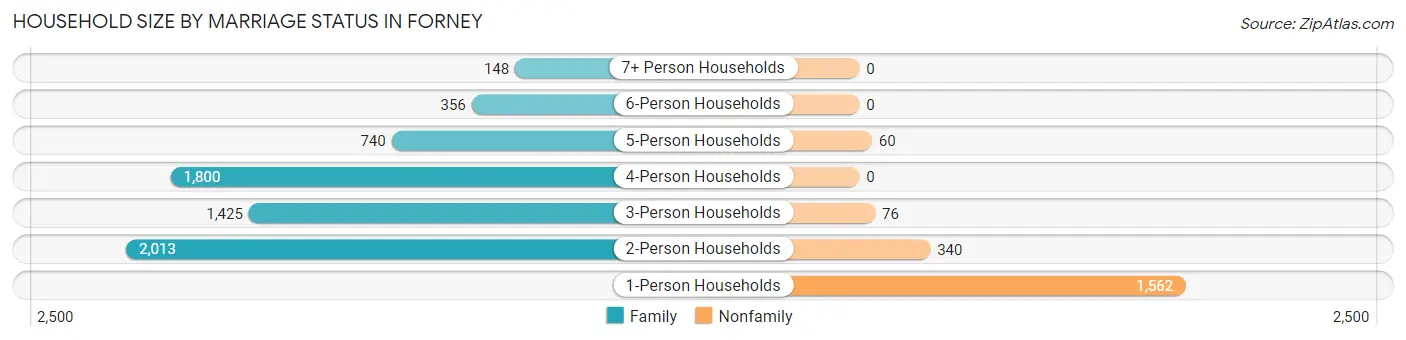
| Household Size | Family Households | Nonfamily Households |
| 1-Person Households | - | 1,562 (18.3%) |
| 2-Person Households | 2,013 (23.6%) | 340 (4.0%) |
| 3-Person Households | 1,425 (16.7%) | 76 (0.9%) |
| 4-Person Households | 1,800 (21.1%) | 0 (0.0%) |
| 5-Person Households | 740 (8.7%) | 60 (0.7%) |
| 6-Person Households | 356 (4.2%) | 0 (0.0%) |
| 7+ Person Households | 148 (1.7%) | 0 (0.0%) |
| Total | 6,482 (76.1%) | 2,038 (23.9%) |
Female Fertility in Forney
Fertility by Age in Forney
Average fertility rate in Forney is 81.0 births per 1,000 women. Women in the age bracket of 20 to 34 years have the highest fertility rate with 120.0 births per 1,000 women. Women in the age bracket of 20 to 34 years acount for 67.4% of all women with births.
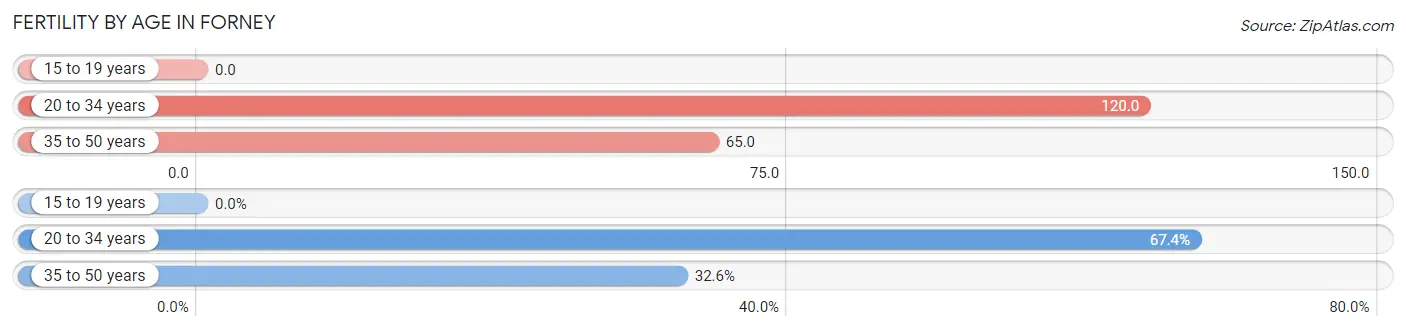
| Age Bracket | Women with Births | Births / 1,000 Women |
| 15 to 19 years | 0 (0.0%) | 0.0 |
| 20 to 34 years | 379 (67.4%) | 120.0 |
| 35 to 50 years | 183 (32.6%) | 65.0 |
| Total | 562 (100.0%) | 81.0 |
Fertility by Age by Marriage Status in Forney
59.6% of women with births (562) in Forney are married. The highest percentage of unmarried women with births falls into 20 to 34 years age bracket with 53.6% of them unmarried at the time of birth, while the lowest percentage of unmarried women with births belong to 35 to 50 years age bracket with 13.1% of them unmarried.
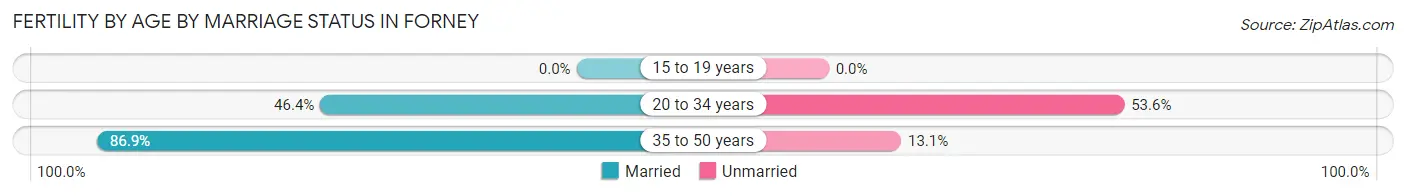
| Age Bracket | Married | Unmarried |
| 15 to 19 years | 0 (0.0%) | 0 (0.0%) |
| 20 to 34 years | 176 (46.4%) | 203 (53.6%) |
| 35 to 50 years | 159 (86.9%) | 24 (13.1%) |
| Total | 335 (59.6%) | 227 (40.4%) |
Fertility by Education in Forney
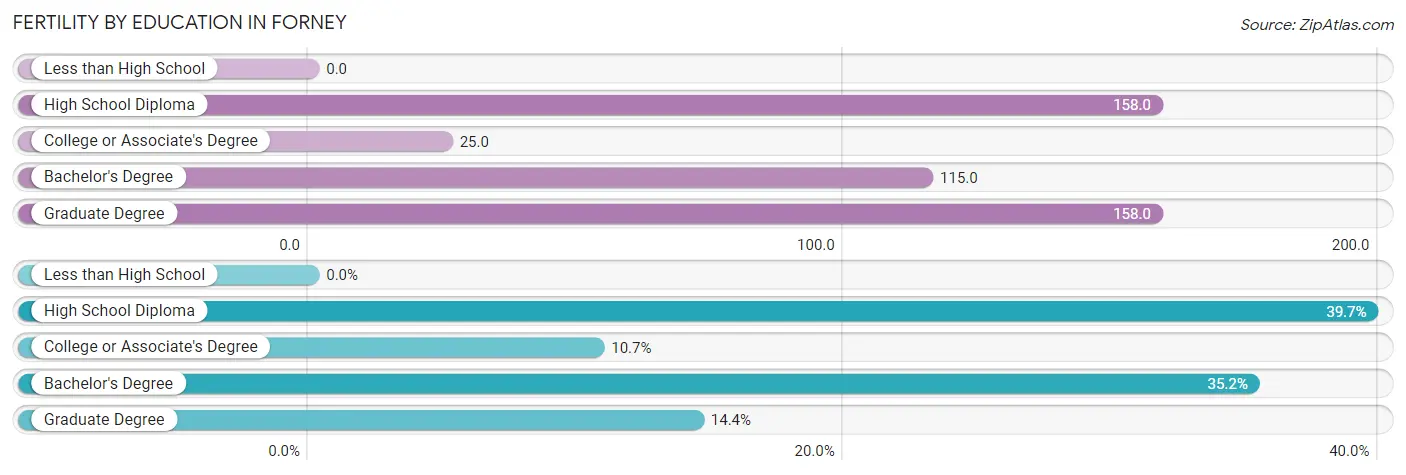
| Educational Attainment | Women with Births | Births / 1,000 Women |
| Less than High School | 0 (0.0%) | 0.0 |
| High School Diploma | 223 (39.7%) | 158.0 |
| College or Associate's Degree | 60 (10.7%) | 25.0 |
| Bachelor's Degree | 198 (35.2%) | 115.0 |
| Graduate Degree | 81 (14.4%) | 158.0 |
| Total | 562 (100.0%) | 81.0 |
Fertility by Education by Marriage Status in Forney
40.4% of women with births in Forney are unmarried. Women with the educational attainment of college or associate's degree are most likely to be married with 100.0% of them married at childbirth, while women with the educational attainment of graduate degree are least likely to be married with 85.2% of them unmarried at childbirth.
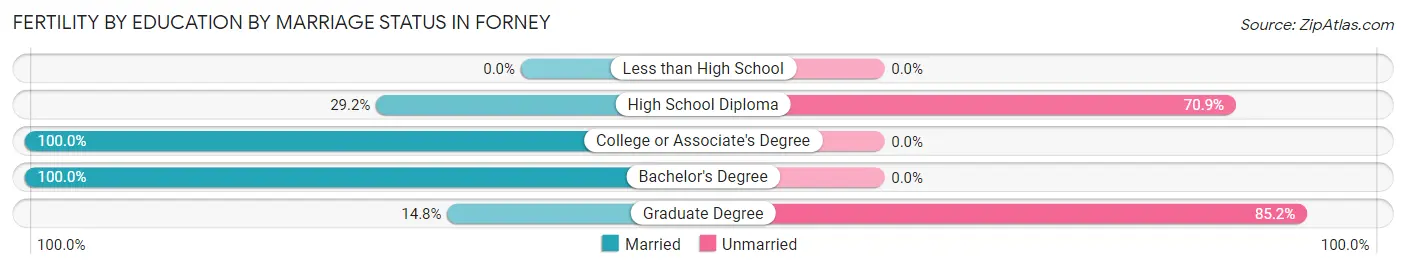
| Educational Attainment | Married | Unmarried |
| Less than High School | 0 (0.0%) | 0 (0.0%) |
| High School Diploma | 65 (29.1%) | 158 (70.9%) |
| College or Associate's Degree | 60 (100.0%) | 0 (0.0%) |
| Bachelor's Degree | 198 (100.0%) | 0 (0.0%) |
| Graduate Degree | 12 (14.8%) | 69 (85.2%) |
| Total | 335 (59.6%) | 227 (40.4%) |
Employment Characteristics in Forney
Employment by Class of Employer in Forney
Among the 13,459 employed individuals in Forney, private company employees (9,132 | 67.8%), local government employees (1,682 | 12.5%), and not-for-profit organizations (998 | 7.4%) make up the most common classes of employment.
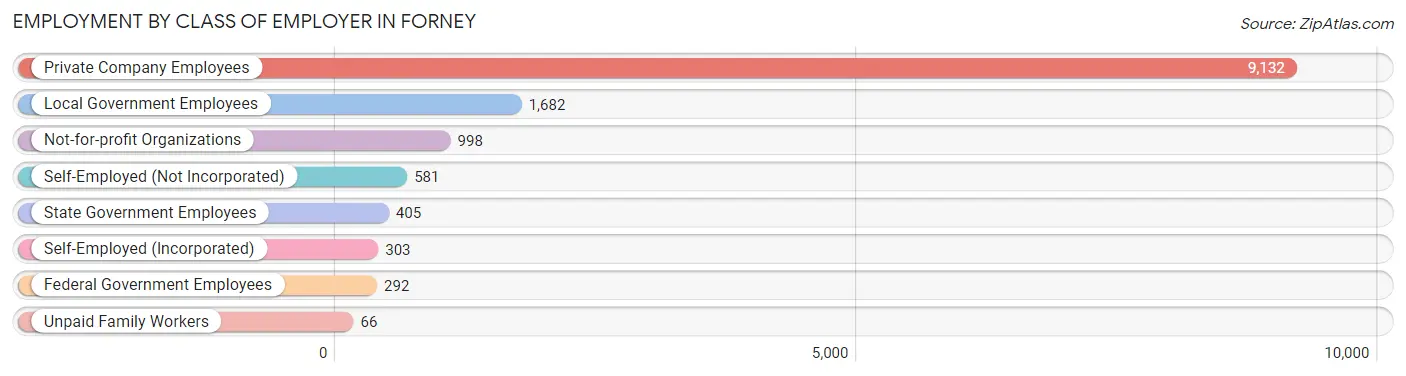
| Employer Class | # Employees | % Employees |
| Private Company Employees | 9,132 | 67.8% |
| Self-Employed (Incorporated) | 303 | 2.2% |
| Self-Employed (Not Incorporated) | 581 | 4.3% |
| Not-for-profit Organizations | 998 | 7.4% |
| Local Government Employees | 1,682 | 12.5% |
| State Government Employees | 405 | 3.0% |
| Federal Government Employees | 292 | 2.2% |
| Unpaid Family Workers | 66 | 0.5% |
| Total | 13,459 | 100.0% |
Employment Status by Age in Forney
According to the labor force statistics for Forney, out of the total population over 16 years of age (18,931), 75.0% or 14,198 individuals are in the labor force, with 5.0% or 710 of them unemployed. The age group with the highest labor force participation rate is 20 to 24 years, with 91.0% or 1,911 individuals in the labor force. Within the labor force, the 20 to 24 years age range has the highest percentage of unemployed individuals, with 21.3% or 407 of them being unemployed.
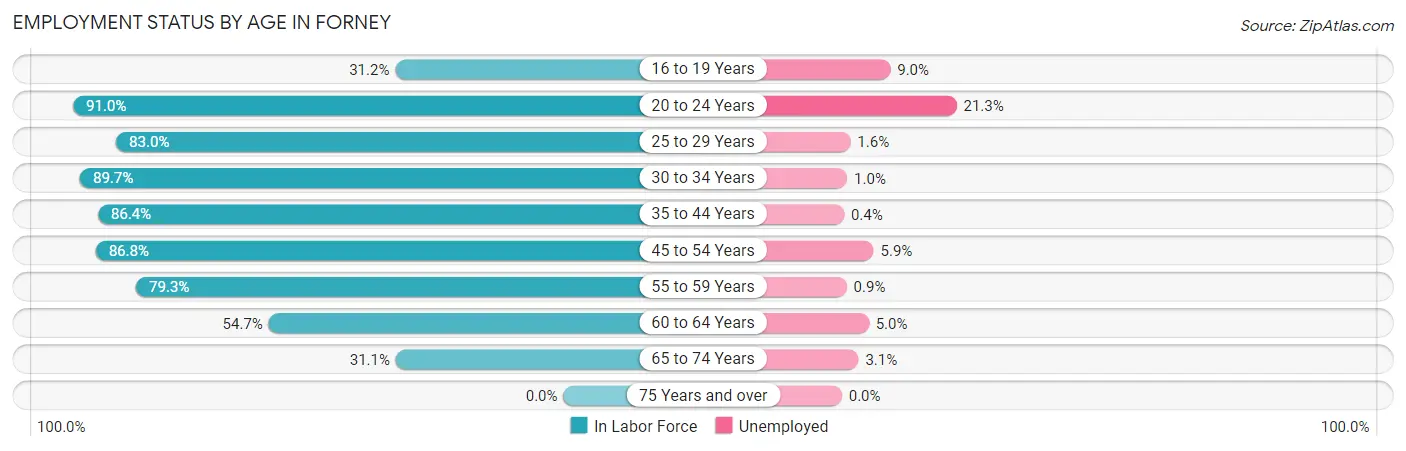
| Age Bracket | In Labor Force | Unemployed |
| 16 to 19 Years | 402 (31.2%) | 36 (9.0%) |
| 20 to 24 Years | 1,911 (91.0%) | 407 (21.3%) |
| 25 to 29 Years | 1,287 (83.0%) | 21 (1.6%) |
| 30 to 34 Years | 2,494 (89.7%) | 25 (1.0%) |
| 35 to 44 Years | 3,488 (86.4%) | 14 (0.4%) |
| 45 to 54 Years | 2,685 (86.8%) | 158 (5.9%) |
| 55 to 59 Years | 990 (79.3%) | 9 (0.9%) |
| 60 to 64 Years | 585 (54.7%) | 29 (5.0%) |
| 65 to 74 Years | 358 (31.1%) | 11 (3.1%) |
| 75 Years and over | 0 (0.0%) | 0 (0.0%) |
| Total | 14,198 (75.0%) | 710 (5.0%) |
Employment Status by Educational Attainment in Forney
According to labor force statistics for Forney, 83.7% of individuals (11,532) out of the total population between 25 and 64 years of age (13,778) are in the labor force, with 2.2% or 254 of them being unemployed. The group with the highest labor force participation rate are those with the educational attainment of bachelor's degree or higher, with 86.5% or 4,113 individuals in the labor force. Within the labor force, individuals with college / associate degree education have the highest percentage of unemployment, with 4.1% or 175 of them being unemployed.
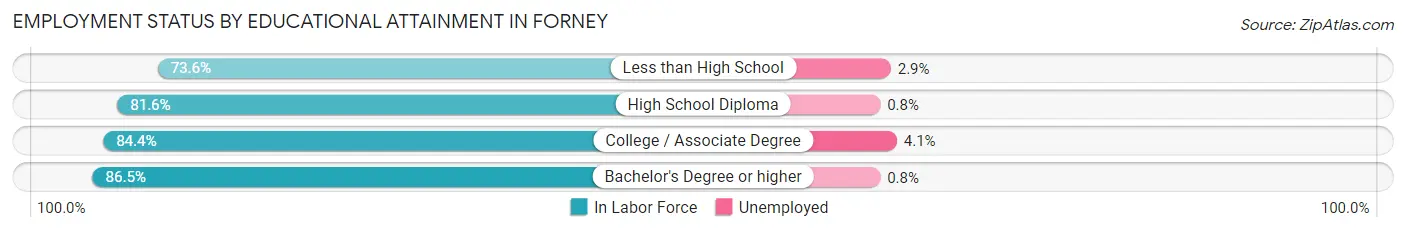
| Educational Attainment | In Labor Force | Unemployed |
| Less than High School | 828 (73.6%) | 33 (2.9%) |
| High School Diploma | 2,328 (81.6%) | 23 (0.8%) |
| College / Associate Degree | 4,258 (84.4%) | 207 (4.1%) |
| Bachelor's Degree or higher | 4,113 (86.5%) | 38 (0.8%) |
| Total | 11,532 (83.7%) | 303 (2.2%) |
Employment Occupations by Sex in Forney
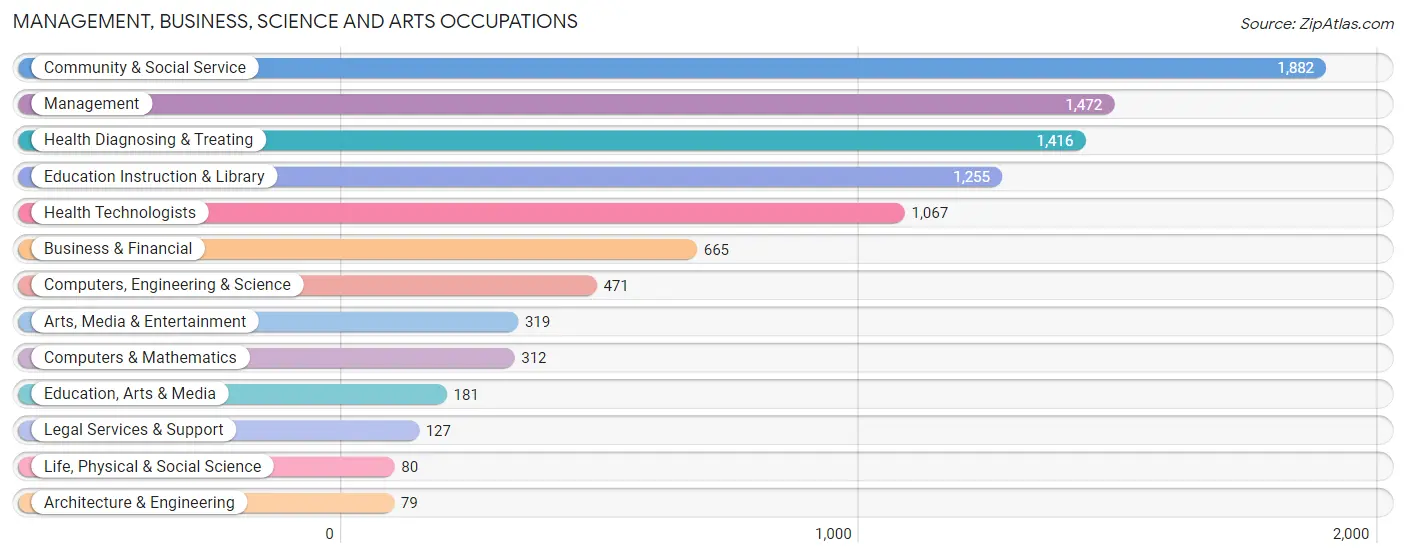
Management, Business, Science and Arts Occupations
The most common Management, Business, Science and Arts occupations in Forney are Community & Social Service (1,882 | 14.0%), Management (1,472 | 10.9%), Health Diagnosing & Treating (1,416 | 10.5%), Education Instruction & Library (1,255 | 9.3%), and Health Technologists (1,067 | 7.9%).
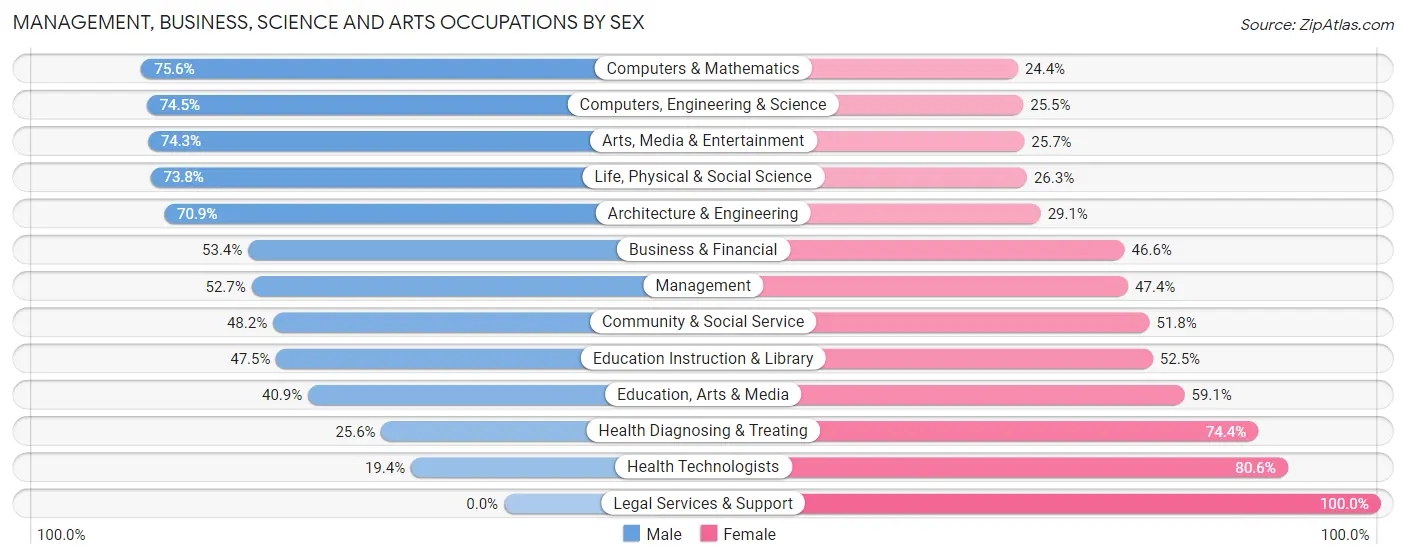
Management, Business, Science and Arts Occupations by Sex
Within the Management, Business, Science and Arts occupations in Forney, the most male-oriented occupations are Computers & Mathematics (75.6%), Computers, Engineering & Science (74.5%), and Arts, Media & Entertainment (74.3%), while the most female-oriented occupations are Legal Services & Support (100.0%), Health Technologists (80.6%), and Health Diagnosing & Treating (74.4%).
| Occupation | Male | Female |
| Management | 775 (52.6%) | 697 (47.3%) |
| Business & Financial | 355 (53.4%) | 310 (46.6%) |
| Computers, Engineering & Science | 351 (74.5%) | 120 (25.5%) |
| Computers & Mathematics | 236 (75.6%) | 76 (24.4%) |
| Architecture & Engineering | 56 (70.9%) | 23 (29.1%) |
| Life, Physical & Social Science | 59 (73.8%) | 21 (26.3%) |
| Community & Social Service | 907 (48.2%) | 975 (51.8%) |
| Education, Arts & Media | 74 (40.9%) | 107 (59.1%) |
| Legal Services & Support | 0 (0.0%) | 127 (100.0%) |
| Education Instruction & Library | 596 (47.5%) | 659 (52.5%) |
| Arts, Media & Entertainment | 237 (74.3%) | 82 (25.7%) |
| Health Diagnosing & Treating | 362 (25.6%) | 1,054 (74.4%) |
| Health Technologists | 207 (19.4%) | 860 (80.6%) |
| Total (Category) | 2,750 (46.6%) | 3,156 (53.4%) |
| Total (Overall) | 7,132 (53.0%) | 6,333 (47.0%) |
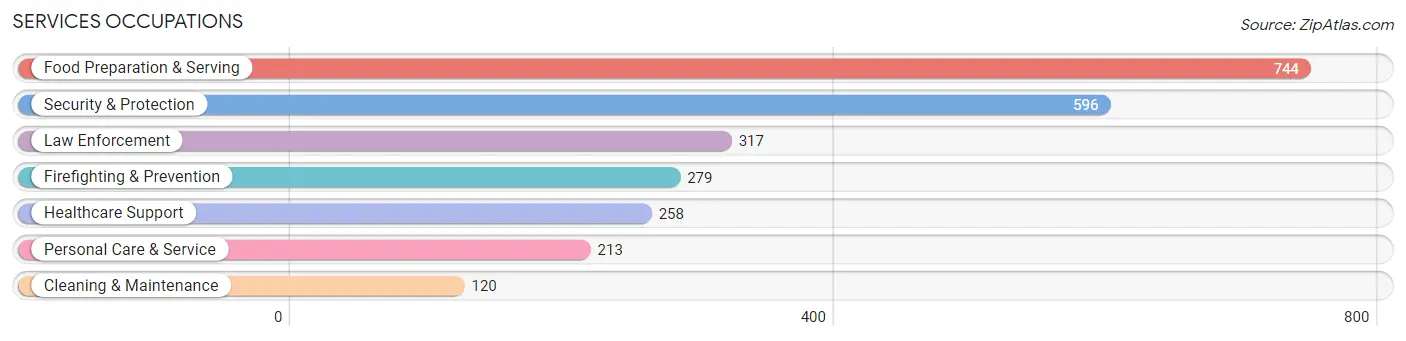
Services Occupations
The most common Services occupations in Forney are Food Preparation & Serving (744 | 5.5%), Security & Protection (596 | 4.4%), Law Enforcement (317 | 2.4%), Firefighting & Prevention (279 | 2.1%), and Healthcare Support (258 | 1.9%).
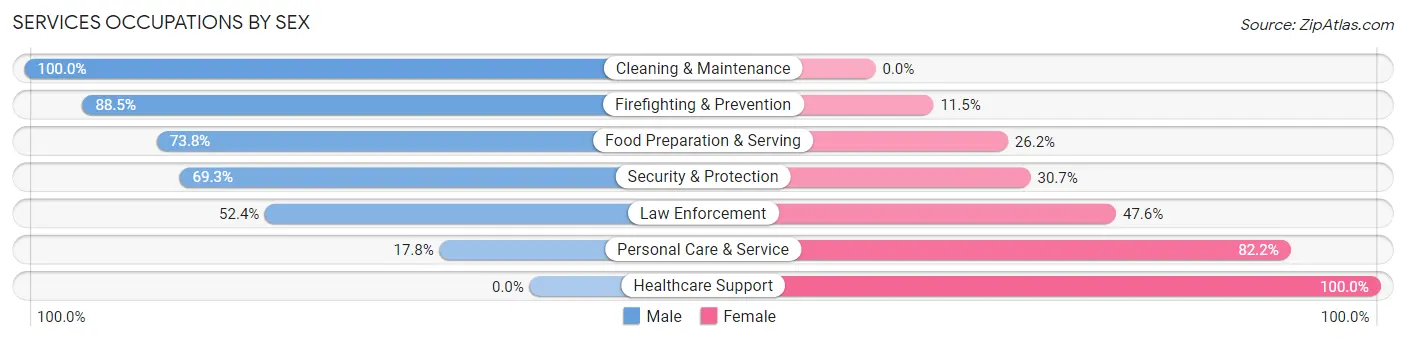
Services Occupations by Sex
Within the Services occupations in Forney, the most male-oriented occupations are Cleaning & Maintenance (100.0%), Firefighting & Prevention (88.5%), and Food Preparation & Serving (73.8%), while the most female-oriented occupations are Healthcare Support (100.0%), Personal Care & Service (82.2%), and Law Enforcement (47.6%).
| Occupation | Male | Female |
| Healthcare Support | 0 (0.0%) | 258 (100.0%) |
| Security & Protection | 413 (69.3%) | 183 (30.7%) |
| Firefighting & Prevention | 247 (88.5%) | 32 (11.5%) |
| Law Enforcement | 166 (52.4%) | 151 (47.6%) |
| Food Preparation & Serving | 549 (73.8%) | 195 (26.2%) |
| Cleaning & Maintenance | 120 (100.0%) | 0 (0.0%) |
| Personal Care & Service | 38 (17.8%) | 175 (82.2%) |
| Total (Category) | 1,120 (58.0%) | 811 (42.0%) |
| Total (Overall) | 7,132 (53.0%) | 6,333 (47.0%) |
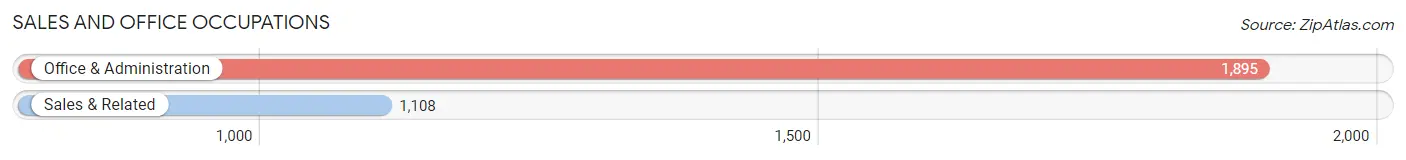
Sales and Office Occupations
The most common Sales and Office occupations in Forney are Office & Administration (1,895 | 14.1%), and Sales & Related (1,108 | 8.2%).
Sales and Office Occupations by Sex
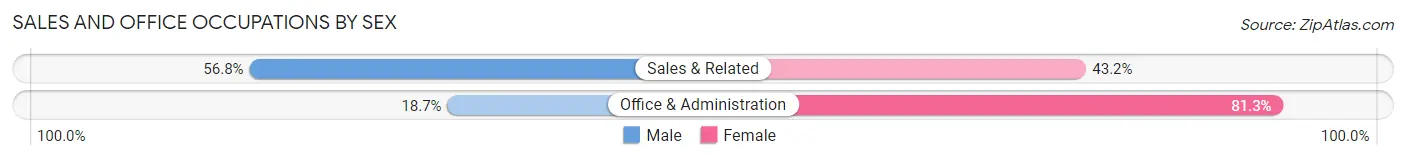
| Occupation | Male | Female |
| Sales & Related | 629 (56.8%) | 479 (43.2%) |
| Office & Administration | 354 (18.7%) | 1,541 (81.3%) |
| Total (Category) | 983 (32.7%) | 2,020 (67.3%) |
| Total (Overall) | 7,132 (53.0%) | 6,333 (47.0%) |
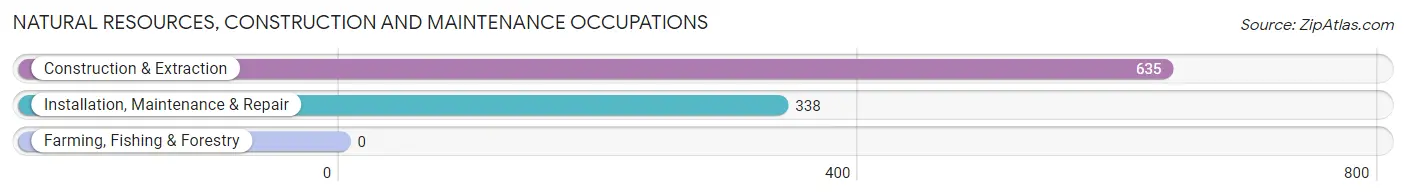
Natural Resources, Construction and Maintenance Occupations
The most common Natural Resources, Construction and Maintenance occupations in Forney are Construction & Extraction (635 | 4.7%), and Installation, Maintenance & Repair (338 | 2.5%).
Natural Resources, Construction and Maintenance Occupations by Sex
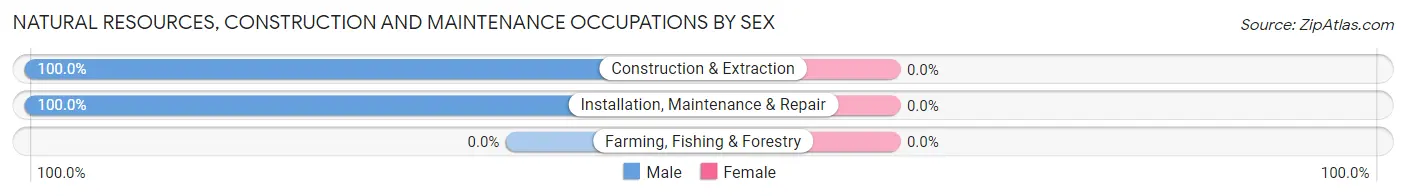
| Occupation | Male | Female |
| Farming, Fishing & Forestry | 0 (0.0%) | 0 (0.0%) |
| Construction & Extraction | 635 (100.0%) | 0 (0.0%) |
| Installation, Maintenance & Repair | 338 (100.0%) | 0 (0.0%) |
| Total (Category) | 973 (100.0%) | 0 (0.0%) |
| Total (Overall) | 7,132 (53.0%) | 6,333 (47.0%) |
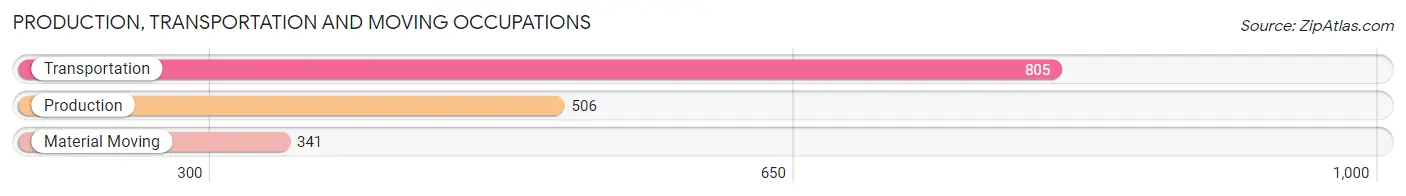
Production, Transportation and Moving Occupations
The most common Production, Transportation and Moving occupations in Forney are Transportation (805 | 6.0%), Production (506 | 3.8%), and Material Moving (341 | 2.5%).
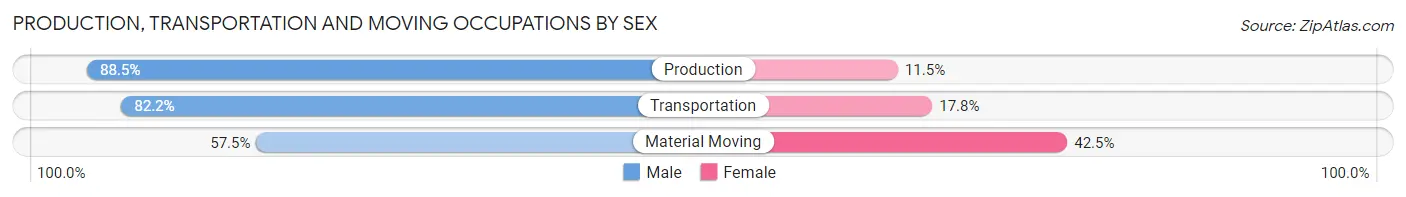
Production, Transportation and Moving Occupations by Sex
| Occupation | Male | Female |
| Production | 448 (88.5%) | 58 (11.5%) |
| Transportation | 662 (82.2%) | 143 (17.8%) |
| Material Moving | 196 (57.5%) | 145 (42.5%) |
| Total (Category) | 1,306 (79.1%) | 346 (20.9%) |
| Total (Overall) | 7,132 (53.0%) | 6,333 (47.0%) |
Employment Industries by Sex in Forney
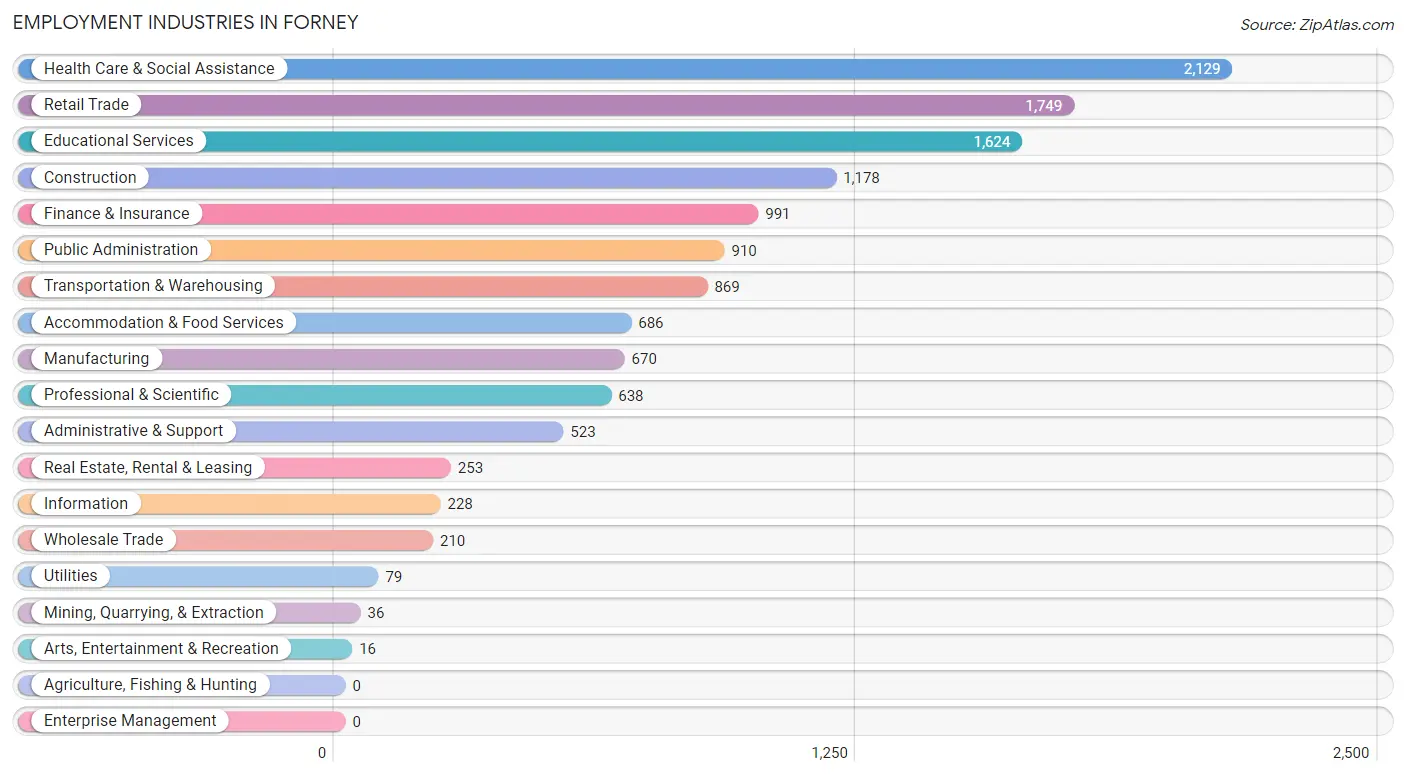
Employment Industries in Forney
The major employment industries in Forney include Health Care & Social Assistance (2,129 | 15.8%), Retail Trade (1,749 | 13.0%), Educational Services (1,624 | 12.1%), Construction (1,178 | 8.7%), and Finance & Insurance (991 | 7.4%).
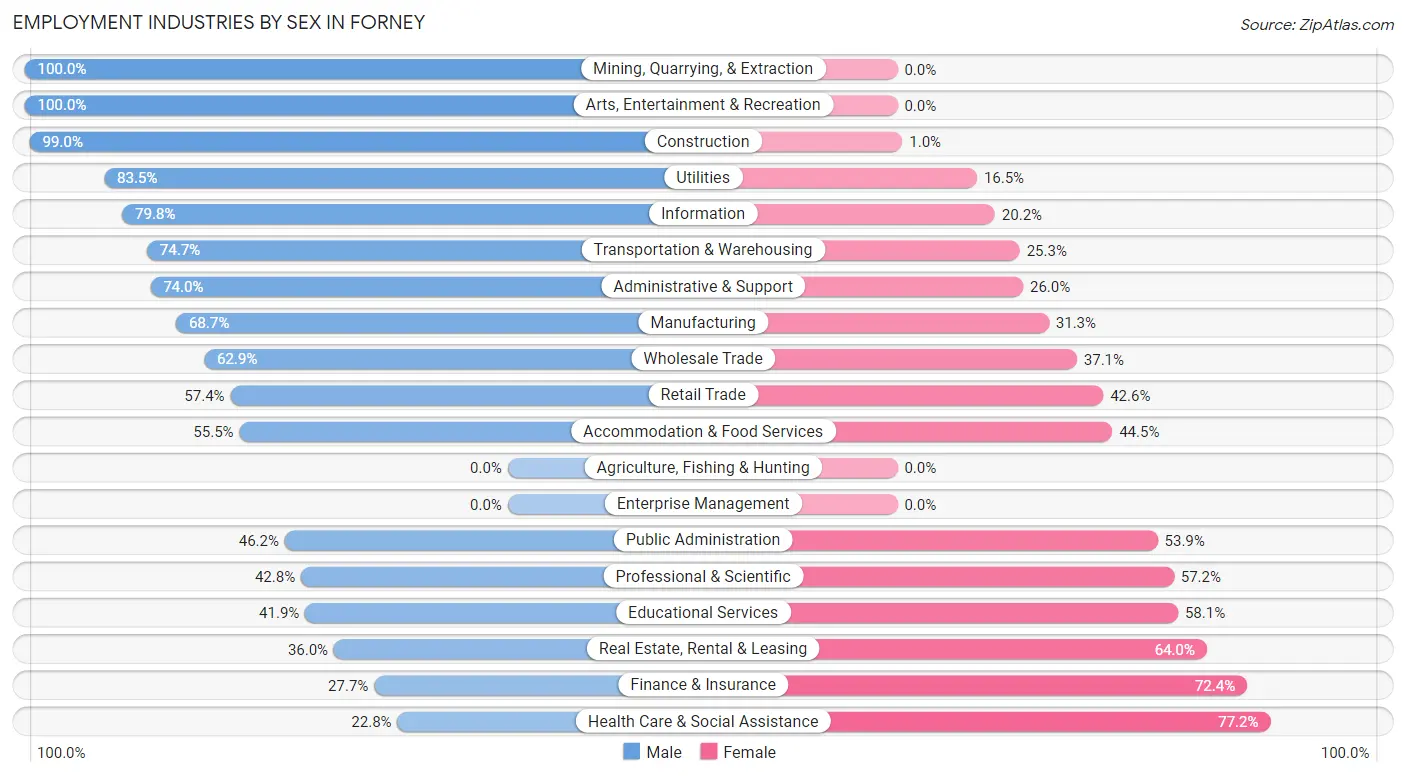
Employment Industries by Sex in Forney
The Forney industries that see more men than women are Mining, Quarrying, & Extraction (100.0%), Arts, Entertainment & Recreation (100.0%), and Construction (99.0%), whereas the industries that tend to have a higher number of women are Health Care & Social Assistance (77.2%), Finance & Insurance (72.4%), and Real Estate, Rental & Leasing (64.0%).
| Industry | Male | Female |
| Agriculture, Fishing & Hunting | 0 (0.0%) | 0 (0.0%) |
| Mining, Quarrying, & Extraction | 36 (100.0%) | 0 (0.0%) |
| Construction | 1,166 (99.0%) | 12 (1.0%) |
| Manufacturing | 460 (68.7%) | 210 (31.3%) |
| Wholesale Trade | 132 (62.9%) | 78 (37.1%) |
| Retail Trade | 1,004 (57.4%) | 745 (42.6%) |
| Transportation & Warehousing | 649 (74.7%) | 220 (25.3%) |
| Utilities | 66 (83.5%) | 13 (16.5%) |
| Information | 182 (79.8%) | 46 (20.2%) |
| Finance & Insurance | 274 (27.7%) | 717 (72.4%) |
| Real Estate, Rental & Leasing | 91 (36.0%) | 162 (64.0%) |
| Professional & Scientific | 273 (42.8%) | 365 (57.2%) |
| Enterprise Management | 0 (0.0%) | 0 (0.0%) |
| Administrative & Support | 387 (74.0%) | 136 (26.0%) |
| Educational Services | 681 (41.9%) | 943 (58.1%) |
| Health Care & Social Assistance | 486 (22.8%) | 1,643 (77.2%) |
| Arts, Entertainment & Recreation | 16 (100.0%) | 0 (0.0%) |
| Accommodation & Food Services | 381 (55.5%) | 305 (44.5%) |
| Public Administration | 420 (46.2%) | 490 (53.8%) |
| Total | 7,132 (53.0%) | 6,333 (47.0%) |
Education in Forney
School Enrollment in Forney
The most common levels of schooling among the 6,748 students in Forney are high school (1,492 | 22.1%), middle school (1,309 | 19.4%), and college / undergraduate (1,234 | 18.3%).
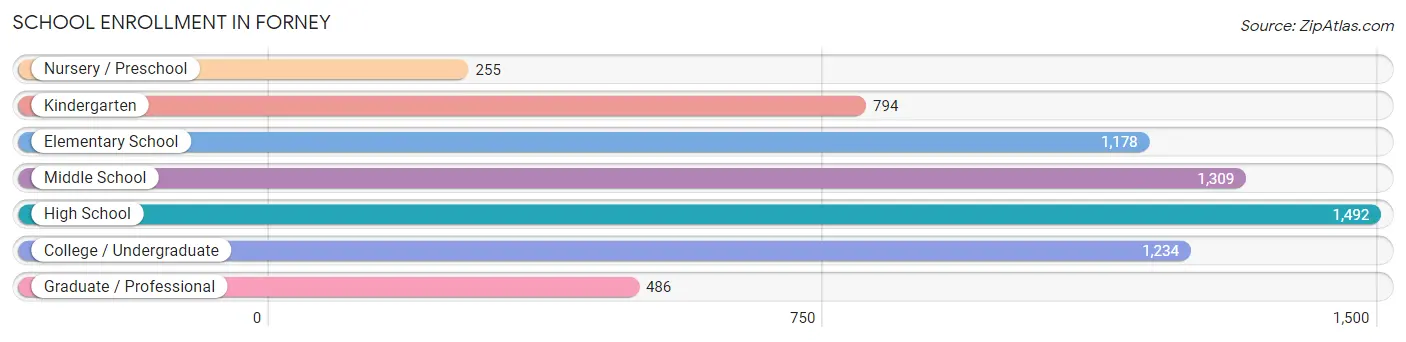
| School Level | # Students | % Students |
| Nursery / Preschool | 255 | 3.8% |
| Kindergarten | 794 | 11.8% |
| Elementary School | 1,178 | 17.5% |
| Middle School | 1,309 | 19.4% |
| High School | 1,492 | 22.1% |
| College / Undergraduate | 1,234 | 18.3% |
| Graduate / Professional | 486 | 7.2% |
| Total | 6,748 | 100.0% |
School Enrollment by Age by Funding Source in Forney
Out of a total of 6,748 students who are enrolled in schools in Forney, 1,073 (15.9%) attend a private institution, while the remaining 5,675 (84.1%) are enrolled in public schools. The age group of 3 to 4 year olds has the highest likelihood of being enrolled in private schools, with 206 (80.8% in the age bracket) enrolled. Conversely, the age group of 15 to 17 year olds has the lowest likelihood of being enrolled in a private school, with 1,002 (97.9% in the age bracket) attending a public institution.
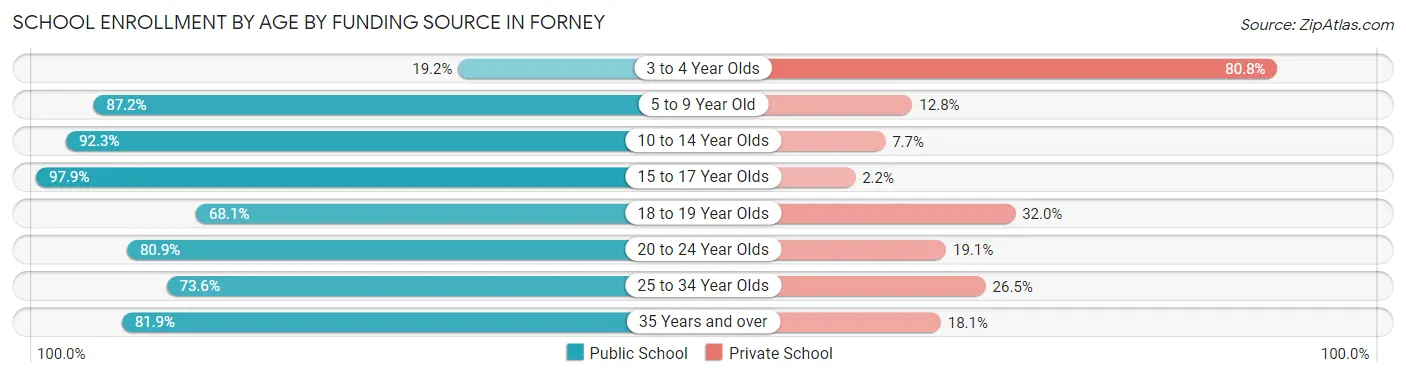
| Age Bracket | Public School | Private School |
| 3 to 4 Year Olds | 49 (19.2%) | 206 (80.8%) |
| 5 to 9 Year Old | 1,601 (87.2%) | 235 (12.8%) |
| 10 to 14 Year Olds | 1,513 (92.3%) | 127 (7.7%) |
| 15 to 17 Year Olds | 1,002 (97.9%) | 22 (2.1%) |
| 18 to 19 Year Olds | 345 (68.0%) | 162 (32.0%) |
| 20 to 24 Year Olds | 297 (80.9%) | 70 (19.1%) |
| 25 to 34 Year Olds | 445 (73.6%) | 160 (26.5%) |
| 35 Years and over | 421 (81.9%) | 93 (18.1%) |
| Total | 5,675 (84.1%) | 1,073 (15.9%) |
Educational Attainment by Field of Study in Forney
Business (1,500 | 28.0%), education (1,027 | 19.2%), science & technology (588 | 11.0%), communications (550 | 10.3%), and liberal arts & history (411 | 7.7%) are the most common fields of study among 5,363 individuals in Forney who have obtained a bachelor's degree or higher.
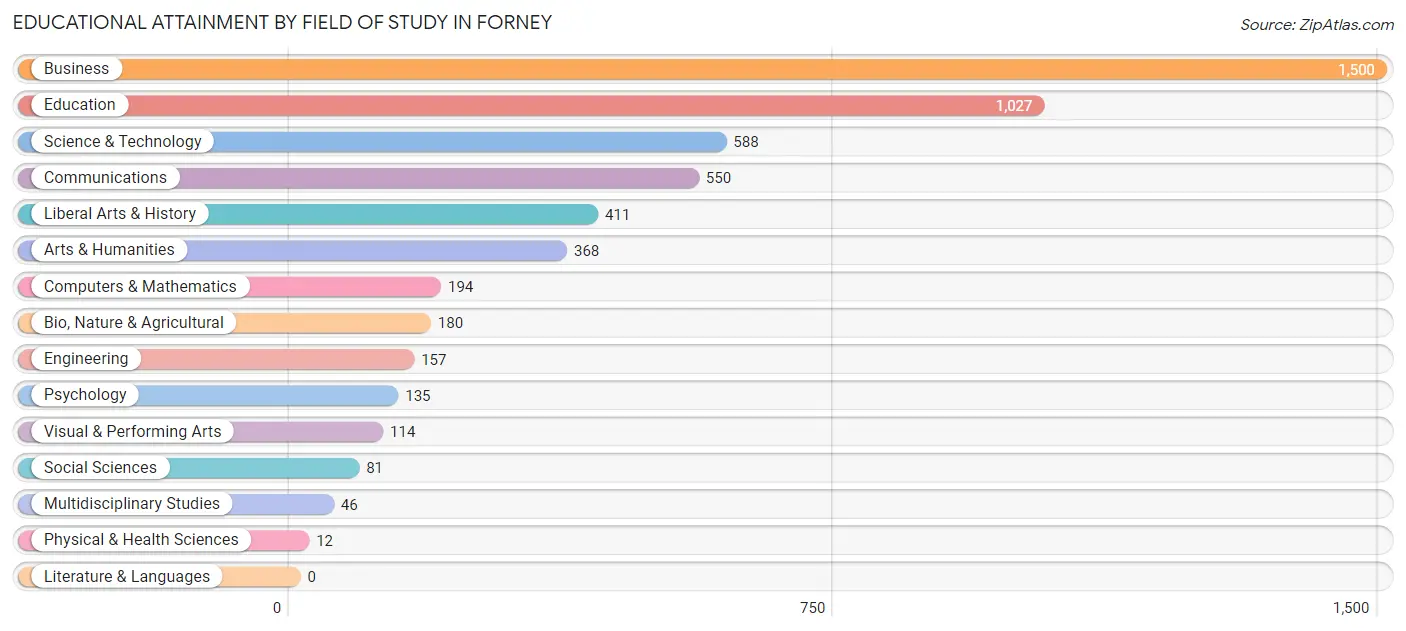
| Field of Study | # Graduates | % Graduates |
| Computers & Mathematics | 194 | 3.6% |
| Bio, Nature & Agricultural | 180 | 3.4% |
| Physical & Health Sciences | 12 | 0.2% |
| Psychology | 135 | 2.5% |
| Social Sciences | 81 | 1.5% |
| Engineering | 157 | 2.9% |
| Multidisciplinary Studies | 46 | 0.9% |
| Science & Technology | 588 | 11.0% |
| Business | 1,500 | 28.0% |
| Education | 1,027 | 19.2% |
| Literature & Languages | 0 | 0.0% |
| Liberal Arts & History | 411 | 7.7% |
| Visual & Performing Arts | 114 | 2.1% |
| Communications | 550 | 10.3% |
| Arts & Humanities | 368 | 6.9% |
| Total | 5,363 | 100.0% |
Transportation & Commute in Forney
Vehicle Availability by Sex in Forney
The most prevalent vehicle ownership categories in Forney are males with 2 vehicles (3,118, accounting for 43.8%) and females with 2 vehicles (2,520, making up 49.2%).
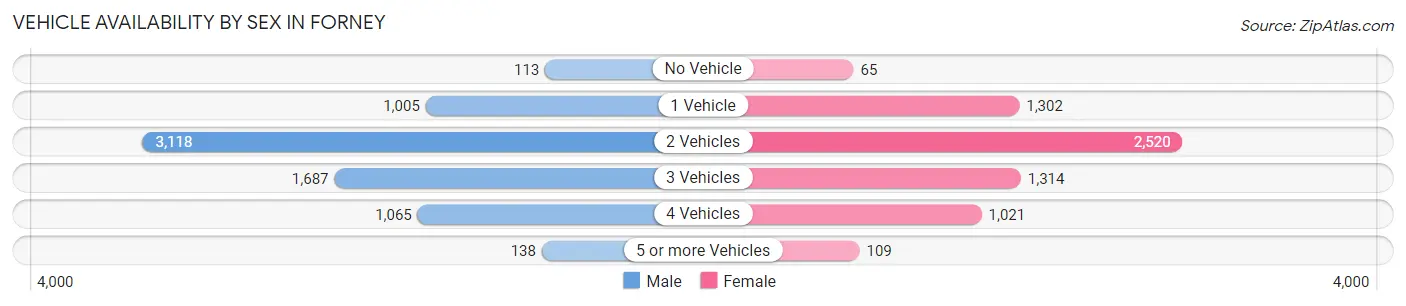
| Vehicles Available | Male | Female |
| No Vehicle | 113 (1.6%) | 65 (1.0%) |
| 1 Vehicle | 1,005 (14.1%) | 1,302 (20.6%) |
| 2 Vehicles | 3,118 (43.8%) | 2,520 (39.8%) |
| 3 Vehicles | 1,687 (23.7%) | 1,314 (20.8%) |
| 4 Vehicles | 1,065 (14.9%) | 1,021 (16.1%) |
| 5 or more Vehicles | 138 (1.9%) | 109 (1.7%) |
| Total | 7,126 (100.0%) | 6,331 (100.0%) |
Commute Time in Forney
The most frequently occuring commute durations in Forney are 30 to 34 minutes (2,462 commuters, 20.2%), 60 to 89 minutes (1,901 commuters, 15.6%), and 45 to 59 minutes (1,326 commuters, 10.9%).
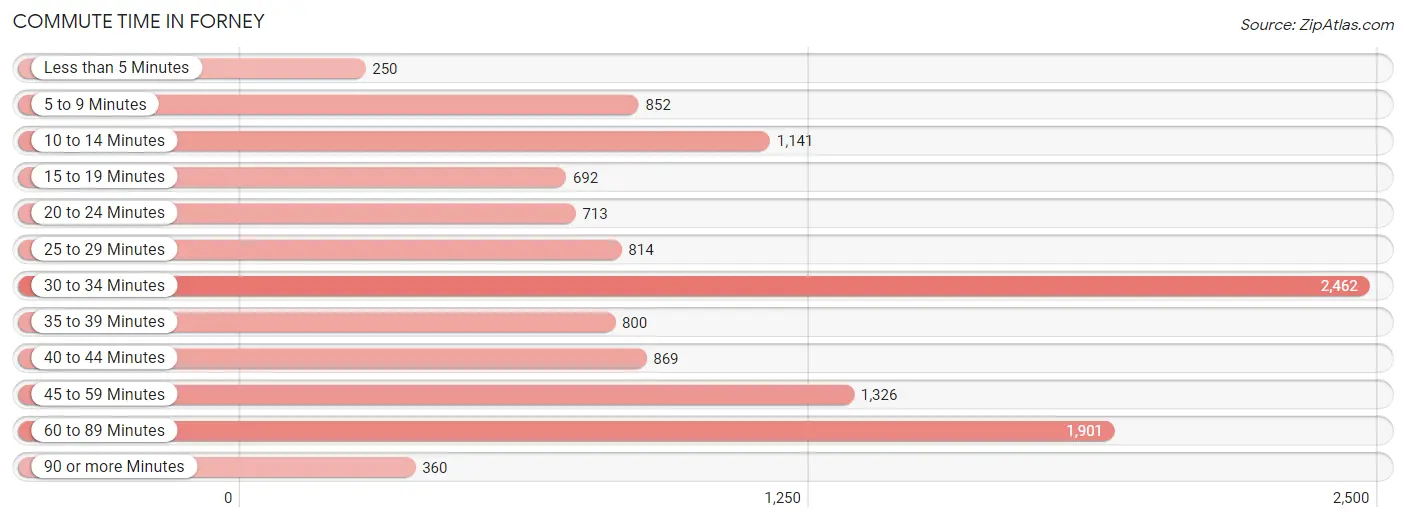
| Commute Time | # Commuters | % Commuters |
| Less than 5 Minutes | 250 | 2.1% |
| 5 to 9 Minutes | 852 | 7.0% |
| 10 to 14 Minutes | 1,141 | 9.4% |
| 15 to 19 Minutes | 692 | 5.7% |
| 20 to 24 Minutes | 713 | 5.9% |
| 25 to 29 Minutes | 814 | 6.7% |
| 30 to 34 Minutes | 2,462 | 20.2% |
| 35 to 39 Minutes | 800 | 6.6% |
| 40 to 44 Minutes | 869 | 7.1% |
| 45 to 59 Minutes | 1,326 | 10.9% |
| 60 to 89 Minutes | 1,901 | 15.6% |
| 90 or more Minutes | 360 | 3.0% |
Commute Time by Sex in Forney
The most common commute times in Forney are 30 to 34 minutes (1,322 commuters, 20.6%) for males and 30 to 34 minutes (1,140 commuters, 19.8%) for females.
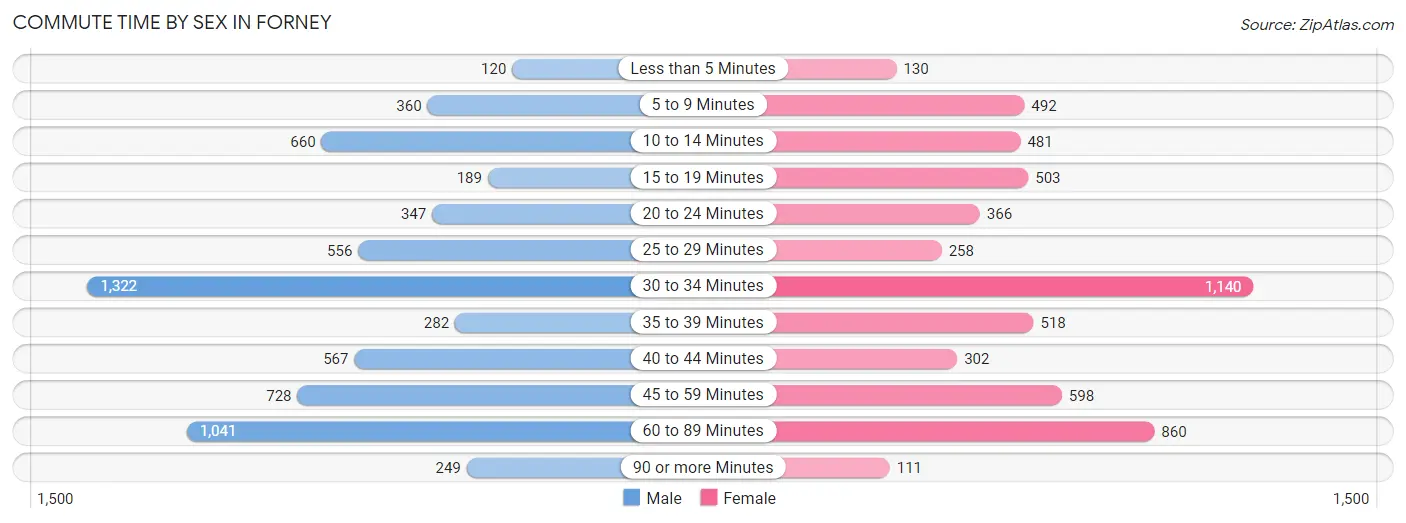
| Commute Time | Male | Female |
| Less than 5 Minutes | 120 (1.9%) | 130 (2.3%) |
| 5 to 9 Minutes | 360 (5.6%) | 492 (8.5%) |
| 10 to 14 Minutes | 660 (10.3%) | 481 (8.4%) |
| 15 to 19 Minutes | 189 (2.9%) | 503 (8.7%) |
| 20 to 24 Minutes | 347 (5.4%) | 366 (6.4%) |
| 25 to 29 Minutes | 556 (8.7%) | 258 (4.5%) |
| 30 to 34 Minutes | 1,322 (20.6%) | 1,140 (19.8%) |
| 35 to 39 Minutes | 282 (4.4%) | 518 (9.0%) |
| 40 to 44 Minutes | 567 (8.8%) | 302 (5.2%) |
| 45 to 59 Minutes | 728 (11.3%) | 598 (10.4%) |
| 60 to 89 Minutes | 1,041 (16.2%) | 860 (14.9%) |
| 90 or more Minutes | 249 (3.9%) | 111 (1.9%) |
Time of Departure to Work by Sex in Forney
The most frequent times of departure to work in Forney are 7:00 AM to 7:29 AM (1,115, 17.4%) for males and 7:00 AM to 7:29 AM (1,190, 20.7%) for females.
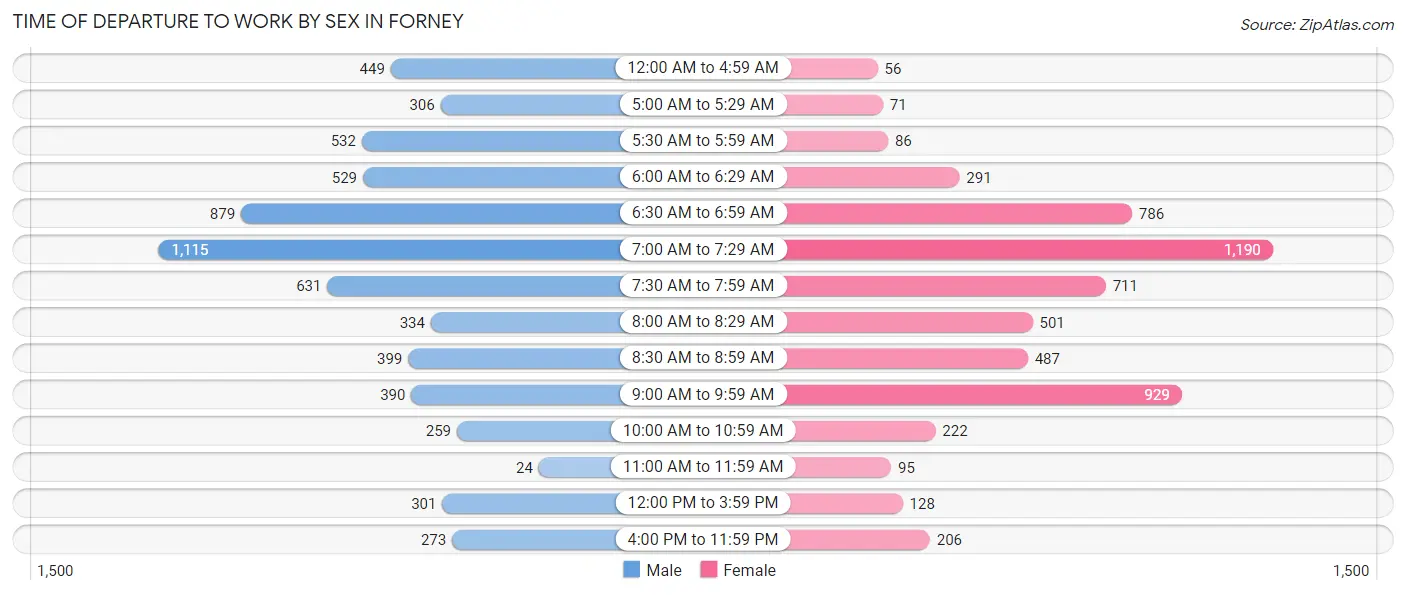
| Time of Departure | Male | Female |
| 12:00 AM to 4:59 AM | 449 (7.0%) | 56 (1.0%) |
| 5:00 AM to 5:29 AM | 306 (4.8%) | 71 (1.2%) |
| 5:30 AM to 5:59 AM | 532 (8.3%) | 86 (1.5%) |
| 6:00 AM to 6:29 AM | 529 (8.2%) | 291 (5.1%) |
| 6:30 AM to 6:59 AM | 879 (13.7%) | 786 (13.7%) |
| 7:00 AM to 7:29 AM | 1,115 (17.4%) | 1,190 (20.7%) |
| 7:30 AM to 7:59 AM | 631 (9.8%) | 711 (12.3%) |
| 8:00 AM to 8:29 AM | 334 (5.2%) | 501 (8.7%) |
| 8:30 AM to 8:59 AM | 399 (6.2%) | 487 (8.5%) |
| 9:00 AM to 9:59 AM | 390 (6.1%) | 929 (16.1%) |
| 10:00 AM to 10:59 AM | 259 (4.0%) | 222 (3.8%) |
| 11:00 AM to 11:59 AM | 24 (0.4%) | 95 (1.7%) |
| 12:00 PM to 3:59 PM | 301 (4.7%) | 128 (2.2%) |
| 4:00 PM to 11:59 PM | 273 (4.3%) | 206 (3.6%) |
| Total | 6,421 (100.0%) | 5,759 (100.0%) |
Housing Occupancy in Forney
Occupancy by Ownership in Forney
Of the total 8,520 dwellings in Forney, owner-occupied units account for 6,222 (73.0%), while renter-occupied units make up 2,298 (27.0%).
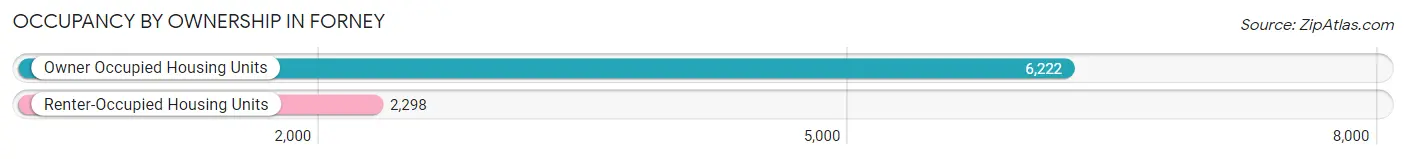
| Occupancy | # Housing Units | % Housing Units |
| Owner Occupied Housing Units | 6,222 | 73.0% |
| Renter-Occupied Housing Units | 2,298 | 27.0% |
| Total Occupied Housing Units | 8,520 | 100.0% |
Occupancy by Household Size in Forney
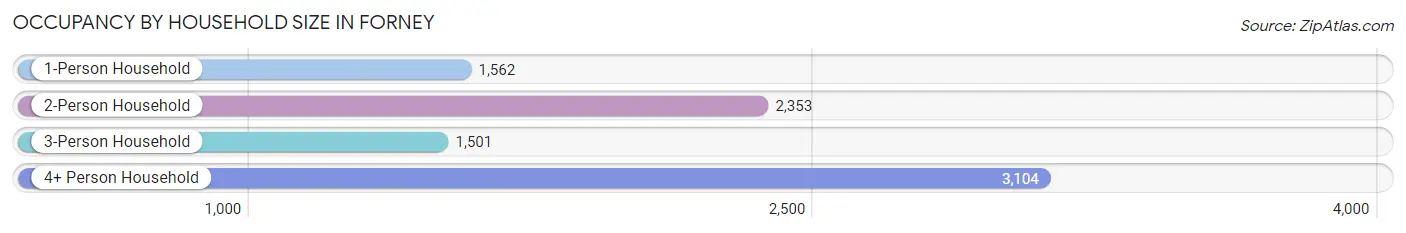
| Household Size | # Housing Units | % Housing Units |
| 1-Person Household | 1,562 | 18.3% |
| 2-Person Household | 2,353 | 27.6% |
| 3-Person Household | 1,501 | 17.6% |
| 4+ Person Household | 3,104 | 36.4% |
| Total Housing Units | 8,520 | 100.0% |
Occupancy by Ownership by Household Size in Forney
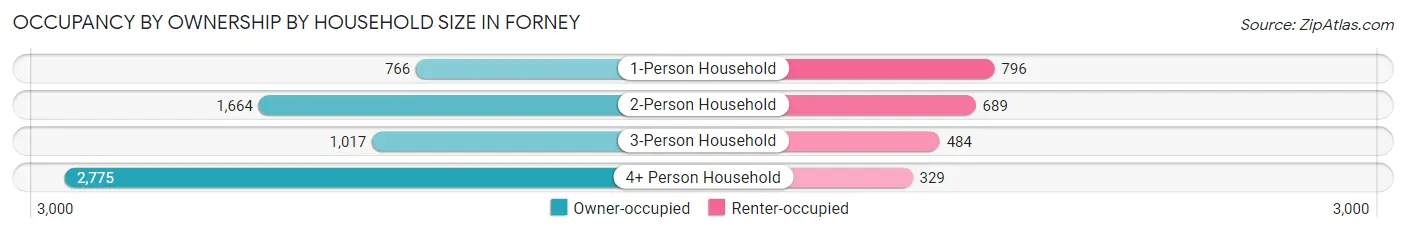
| Household Size | Owner-occupied | Renter-occupied |
| 1-Person Household | 766 (49.0%) | 796 (51.0%) |
| 2-Person Household | 1,664 (70.7%) | 689 (29.3%) |
| 3-Person Household | 1,017 (67.7%) | 484 (32.3%) |
| 4+ Person Household | 2,775 (89.4%) | 329 (10.6%) |
| Total Housing Units | 6,222 (73.0%) | 2,298 (27.0%) |
Occupancy by Educational Attainment in Forney
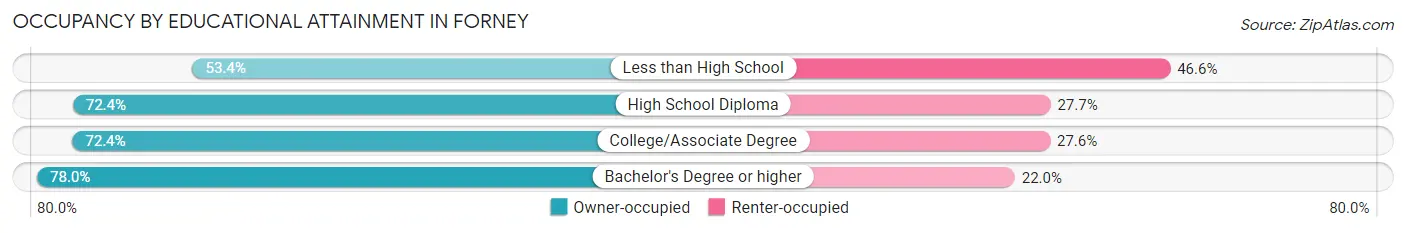
| Household Size | Owner-occupied | Renter-occupied |
| Less than High School | 270 (53.4%) | 236 (46.6%) |
| High School Diploma | 1,303 (72.4%) | 498 (27.7%) |
| College/Associate Degree | 2,563 (72.4%) | 976 (27.6%) |
| Bachelor's Degree or higher | 2,086 (78.0%) | 588 (22.0%) |
Occupancy by Age of Householder in Forney
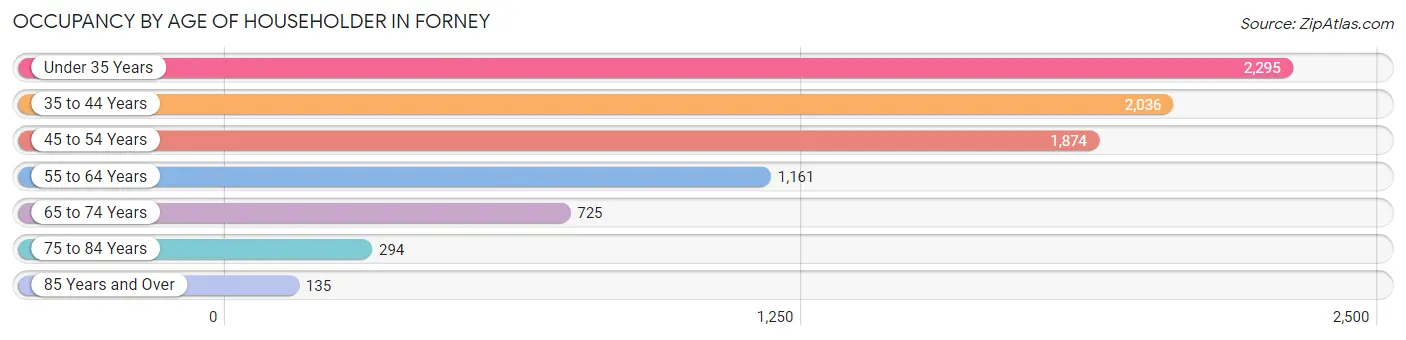
| Age Bracket | # Households | % Households |
| Under 35 Years | 2,295 | 26.9% |
| 35 to 44 Years | 2,036 | 23.9% |
| 45 to 54 Years | 1,874 | 22.0% |
| 55 to 64 Years | 1,161 | 13.6% |
| 65 to 74 Years | 725 | 8.5% |
| 75 to 84 Years | 294 | 3.5% |
| 85 Years and Over | 135 | 1.6% |
| Total | 8,520 | 100.0% |
Housing Finances in Forney
Median Income by Occupancy in Forney
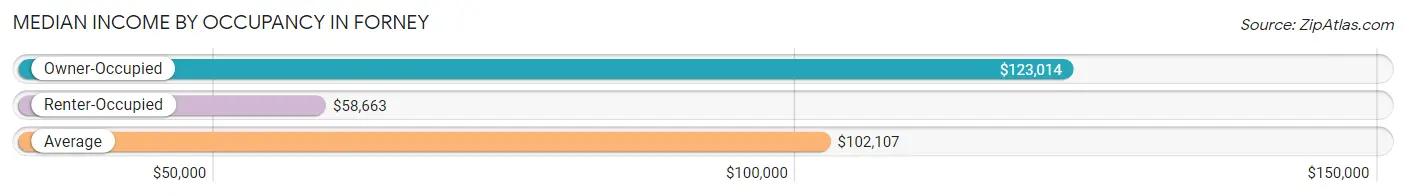
| Occupancy Type | # Households | Median Income |
| Owner-Occupied | 6,222 (73.0%) | $123,014 |
| Renter-Occupied | 2,298 (27.0%) | $58,663 |
| Average | 8,520 (100.0%) | $102,107 |
Occupancy by Householder Income Bracket in Forney
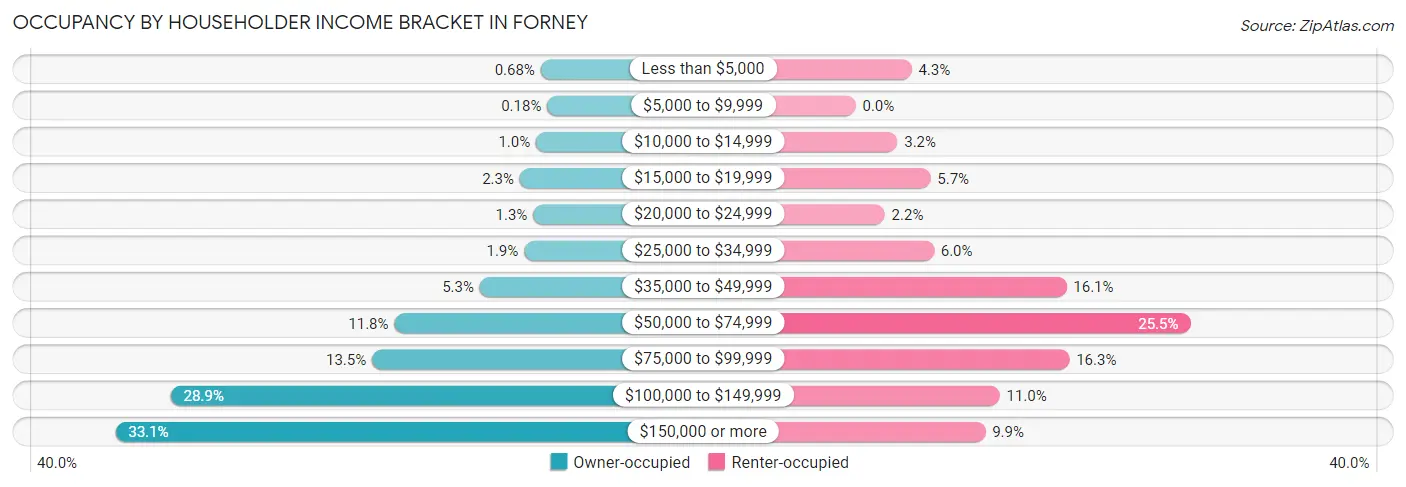
| Income Bracket | Owner-occupied | Renter-occupied |
| Less than $5,000 | 42 (0.7%) | 98 (4.3%) |
| $5,000 to $9,999 | 11 (0.2%) | 0 (0.0%) |
| $10,000 to $14,999 | 64 (1.0%) | 73 (3.2%) |
| $15,000 to $19,999 | 141 (2.3%) | 131 (5.7%) |
| $20,000 to $24,999 | 78 (1.3%) | 51 (2.2%) |
| $25,000 to $34,999 | 121 (1.9%) | 137 (6.0%) |
| $35,000 to $49,999 | 331 (5.3%) | 369 (16.1%) |
| $50,000 to $74,999 | 736 (11.8%) | 586 (25.5%) |
| $75,000 to $99,999 | 842 (13.5%) | 374 (16.3%) |
| $100,000 to $149,999 | 1,797 (28.9%) | 252 (11.0%) |
| $150,000 or more | 2,059 (33.1%) | 227 (9.9%) |
| Total | 6,222 (100.0%) | 2,298 (100.0%) |
Monthly Housing Cost Tiers in Forney
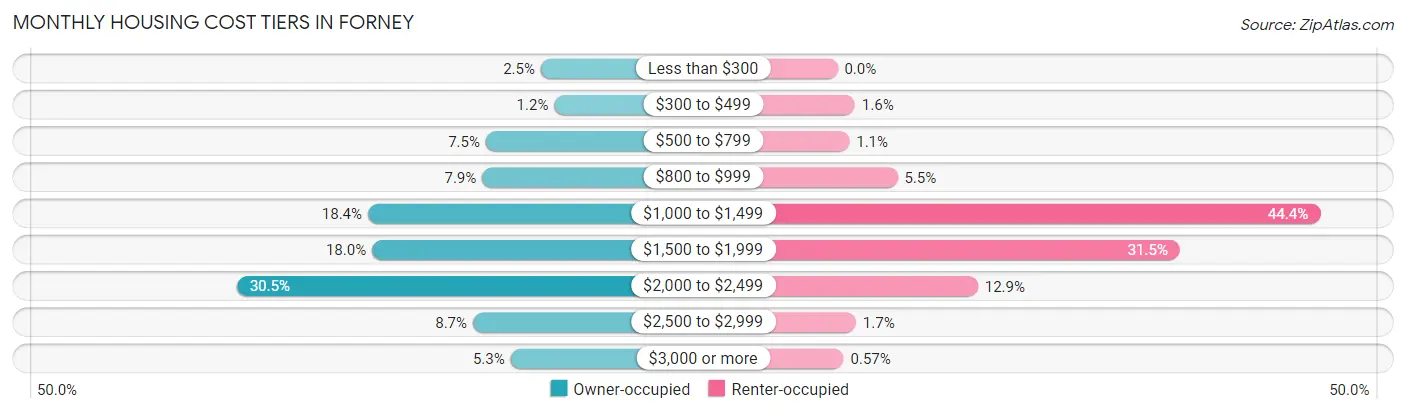
| Monthly Cost | Owner-occupied | Renter-occupied |
| Less than $300 | 154 (2.5%) | 0 (0.0%) |
| $300 to $499 | 77 (1.2%) | 37 (1.6%) |
| $500 to $799 | 469 (7.5%) | 25 (1.1%) |
| $800 to $999 | 490 (7.9%) | 127 (5.5%) |
| $1,000 to $1,499 | 1,145 (18.4%) | 1,021 (44.4%) |
| $1,500 to $1,999 | 1,121 (18.0%) | 724 (31.5%) |
| $2,000 to $2,499 | 1,896 (30.5%) | 297 (12.9%) |
| $2,500 to $2,999 | 543 (8.7%) | 39 (1.7%) |
| $3,000 or more | 327 (5.3%) | 13 (0.6%) |
| Total | 6,222 (100.0%) | 2,298 (100.0%) |
Physical Housing Characteristics in Forney
Housing Structures in Forney
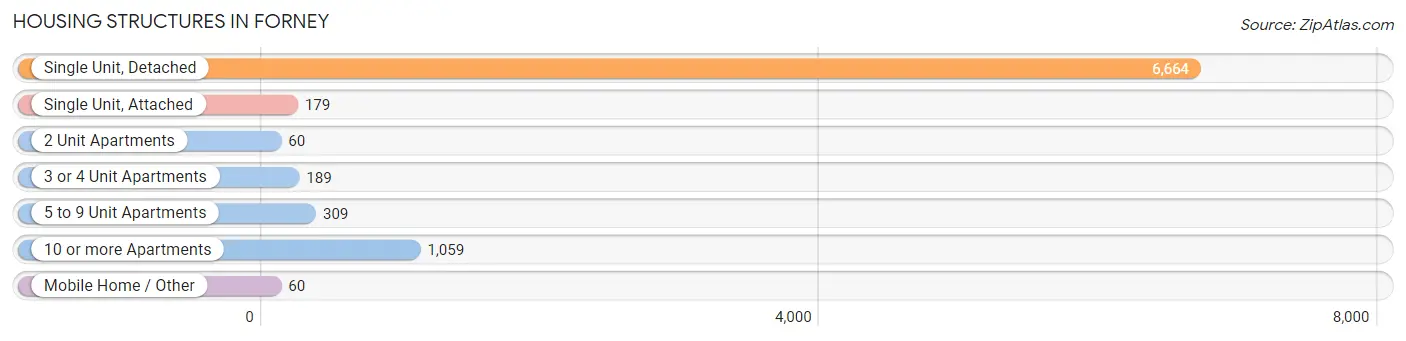
| Structure Type | # Housing Units | % Housing Units |
| Single Unit, Detached | 6,664 | 78.2% |
| Single Unit, Attached | 179 | 2.1% |
| 2 Unit Apartments | 60 | 0.7% |
| 3 or 4 Unit Apartments | 189 | 2.2% |
| 5 to 9 Unit Apartments | 309 | 3.6% |
| 10 or more Apartments | 1,059 | 12.4% |
| Mobile Home / Other | 60 | 0.7% |
| Total | 8,520 | 100.0% |
Housing Structures by Occupancy in Forney
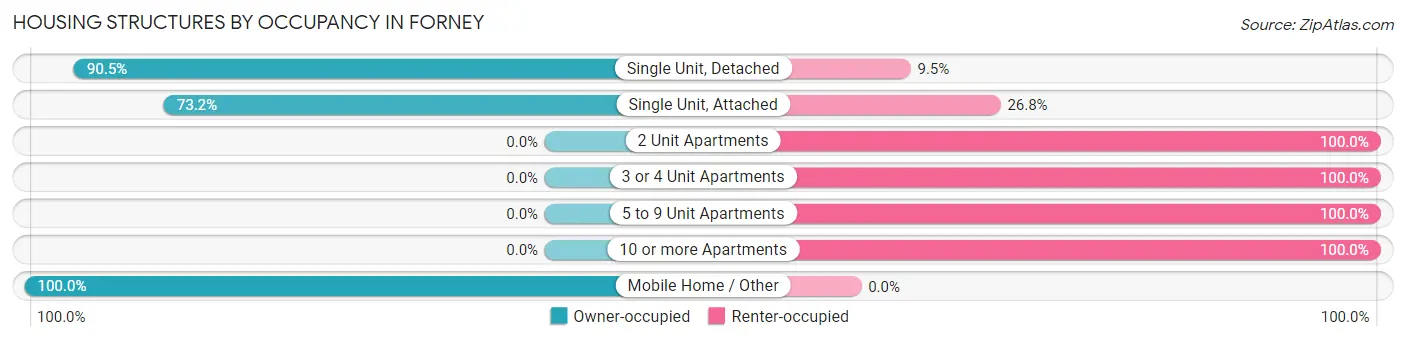
| Structure Type | Owner-occupied | Renter-occupied |
| Single Unit, Detached | 6,031 (90.5%) | 633 (9.5%) |
| Single Unit, Attached | 131 (73.2%) | 48 (26.8%) |
| 2 Unit Apartments | 0 (0.0%) | 60 (100.0%) |
| 3 or 4 Unit Apartments | 0 (0.0%) | 189 (100.0%) |
| 5 to 9 Unit Apartments | 0 (0.0%) | 309 (100.0%) |
| 10 or more Apartments | 0 (0.0%) | 1,059 (100.0%) |
| Mobile Home / Other | 60 (100.0%) | 0 (0.0%) |
| Total | 6,222 (73.0%) | 2,298 (27.0%) |
Housing Structures by Number of Rooms in Forney
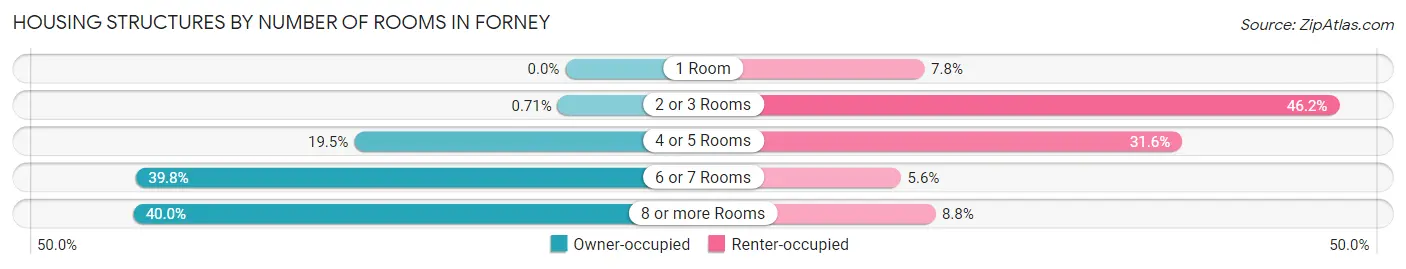
| Number of Rooms | Owner-occupied | Renter-occupied |
| 1 Room | 0 (0.0%) | 179 (7.8%) |
| 2 or 3 Rooms | 44 (0.7%) | 1,061 (46.2%) |
| 4 or 5 Rooms | 1,215 (19.5%) | 727 (31.6%) |
| 6 or 7 Rooms | 2,474 (39.8%) | 129 (5.6%) |
| 8 or more Rooms | 2,489 (40.0%) | 202 (8.8%) |
| Total | 6,222 (100.0%) | 2,298 (100.0%) |
Housing Structure by Heating Type in Forney
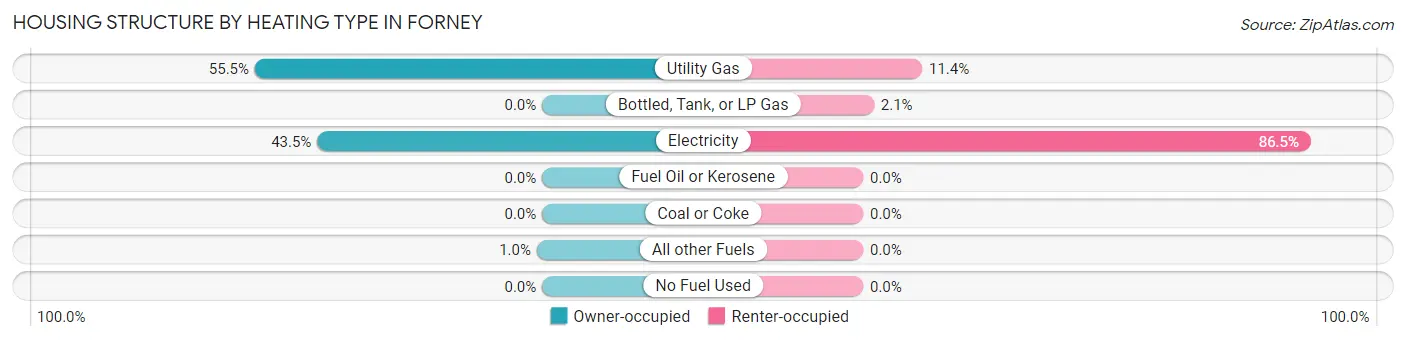
| Heating Type | Owner-occupied | Renter-occupied |
| Utility Gas | 3,454 (55.5%) | 262 (11.4%) |
| Bottled, Tank, or LP Gas | 0 (0.0%) | 48 (2.1%) |
| Electricity | 2,704 (43.5%) | 1,988 (86.5%) |
| Fuel Oil or Kerosene | 0 (0.0%) | 0 (0.0%) |
| Coal or Coke | 0 (0.0%) | 0 (0.0%) |
| All other Fuels | 64 (1.0%) | 0 (0.0%) |
| No Fuel Used | 0 (0.0%) | 0 (0.0%) |
| Total | 6,222 (100.0%) | 2,298 (100.0%) |
Household Vehicle Usage in Forney
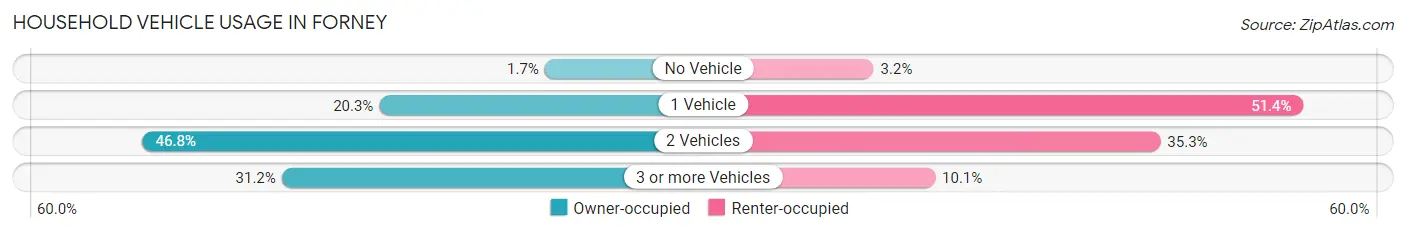
| Vehicles per Household | Owner-occupied | Renter-occupied |
| No Vehicle | 108 (1.7%) | 74 (3.2%) |
| 1 Vehicle | 1,262 (20.3%) | 1,180 (51.3%) |
| 2 Vehicles | 2,910 (46.8%) | 812 (35.3%) |
| 3 or more Vehicles | 1,942 (31.2%) | 232 (10.1%) |
| Total | 6,222 (100.0%) | 2,298 (100.0%) |
Real Estate & Mortgages in Forney
Real Estate and Mortgage Overview in Forney
| Characteristic | Without Mortgage | With Mortgage |
| Housing Units | 1,409 | 4,813 |
| Median Property Value | $258,200 | $282,700 |
| Median Household Income | $69,236 | $1,796 |
| Monthly Housing Costs | $874 | $327 |
| Real Estate Taxes | $3,830 | $85 |
Property Value by Mortgage Status in Forney
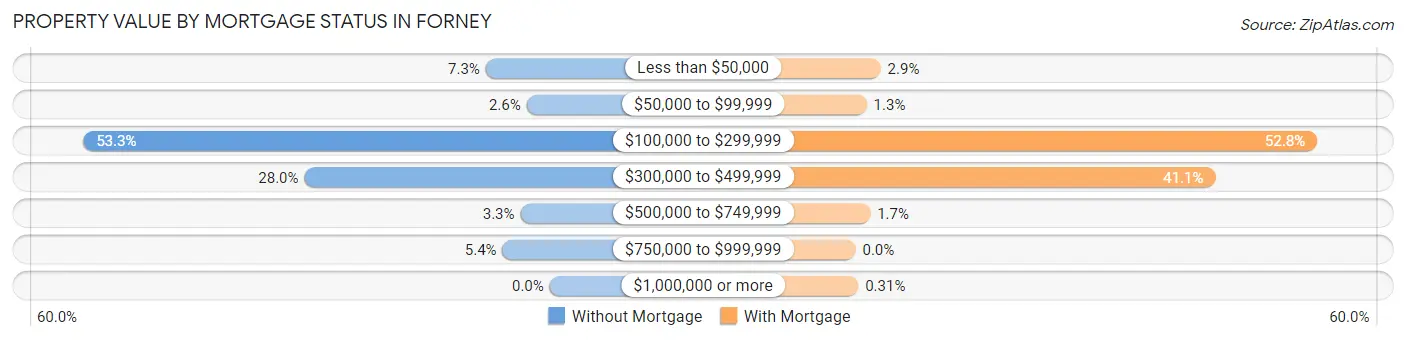
| Property Value | Without Mortgage | With Mortgage |
| Less than $50,000 | 103 (7.3%) | 138 (2.9%) |
| $50,000 to $99,999 | 37 (2.6%) | 61 (1.3%) |
| $100,000 to $299,999 | 751 (53.3%) | 2,539 (52.7%) |
| $300,000 to $499,999 | 395 (28.0%) | 1,979 (41.1%) |
| $500,000 to $749,999 | 47 (3.3%) | 81 (1.7%) |
| $750,000 to $999,999 | 76 (5.4%) | 0 (0.0%) |
| $1,000,000 or more | 0 (0.0%) | 15 (0.3%) |
| Total | 1,409 (100.0%) | 4,813 (100.0%) |
Household Income by Mortgage Status in Forney
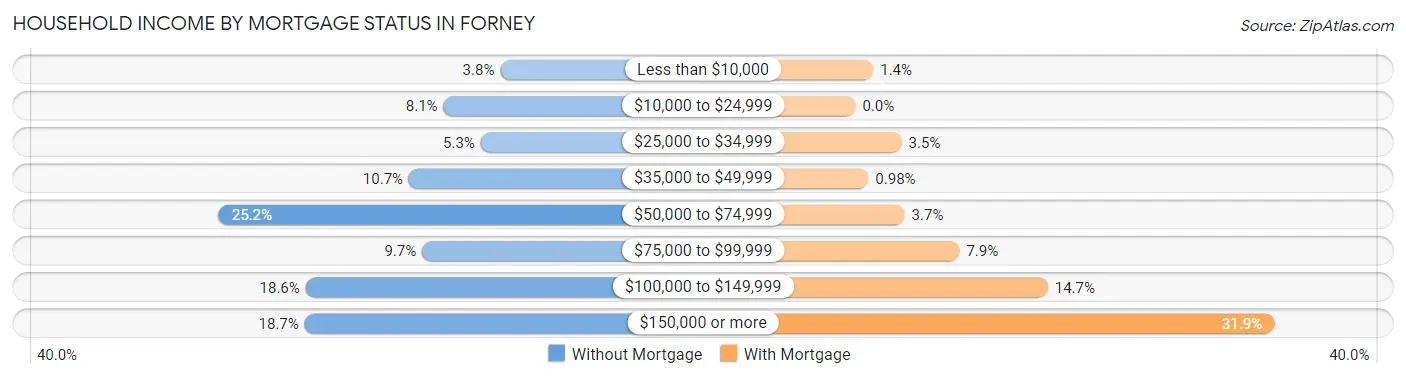
| Household Income | Without Mortgage | With Mortgage |
| Less than $10,000 | 53 (3.8%) | 65 (1.3%) |
| $10,000 to $24,999 | 114 (8.1%) | 0 (0.0%) |
| $25,000 to $34,999 | 74 (5.2%) | 169 (3.5%) |
| $35,000 to $49,999 | 151 (10.7%) | 47 (1.0%) |
| $50,000 to $74,999 | 355 (25.2%) | 180 (3.7%) |
| $75,000 to $99,999 | 137 (9.7%) | 381 (7.9%) |
| $100,000 to $149,999 | 262 (18.6%) | 705 (14.6%) |
| $150,000 or more | 263 (18.7%) | 1,535 (31.9%) |
| Total | 1,409 (100.0%) | 4,813 (100.0%) |
Property Value to Household Income Ratio in Forney
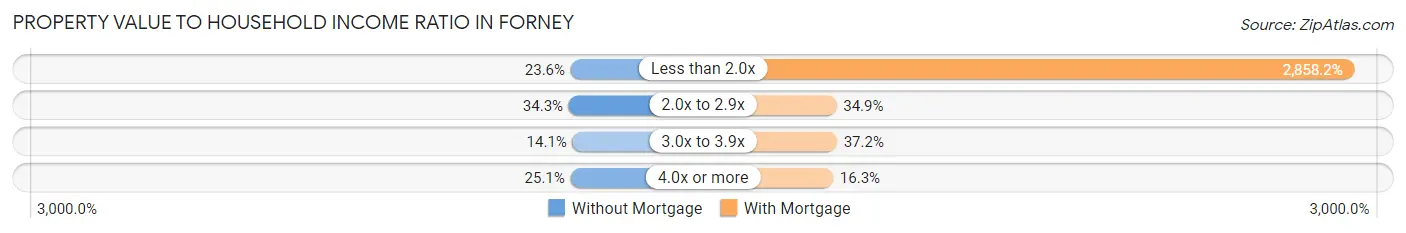
| Value-to-Income Ratio | Without Mortgage | With Mortgage |
| Less than 2.0x | 333 (23.6%) | 137,567 (2,858.2%) |
| 2.0x to 2.9x | 483 (34.3%) | 1,678 (34.9%) |
| 3.0x to 3.9x | 198 (14.1%) | 1,791 (37.2%) |
| 4.0x or more | 353 (25.1%) | 784 (16.3%) |
| Total | 1,409 (100.0%) | 4,813 (100.0%) |
Real Estate Taxes by Mortgage Status in Forney
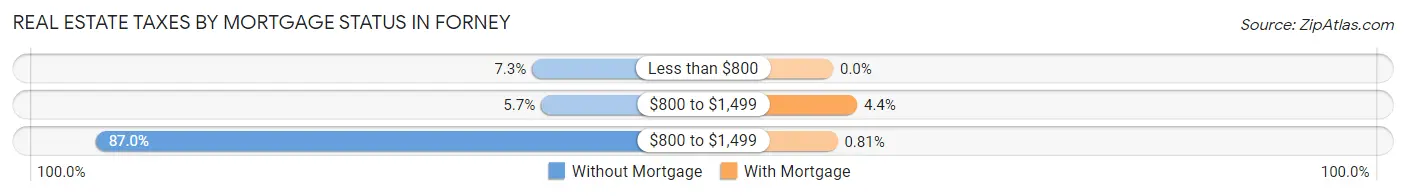
| Property Taxes | Without Mortgage | With Mortgage |
| Less than $800 | 103 (7.3%) | 0 (0.0%) |
| $800 to $1,499 | 80 (5.7%) | 211 (4.4%) |
| $800 to $1,499 | 1,226 (87.0%) | 39 (0.8%) |
| Total | 1,409 (100.0%) | 4,813 (100.0%) |
Health & Disability in Forney
Health Insurance Coverage by Age in Forney
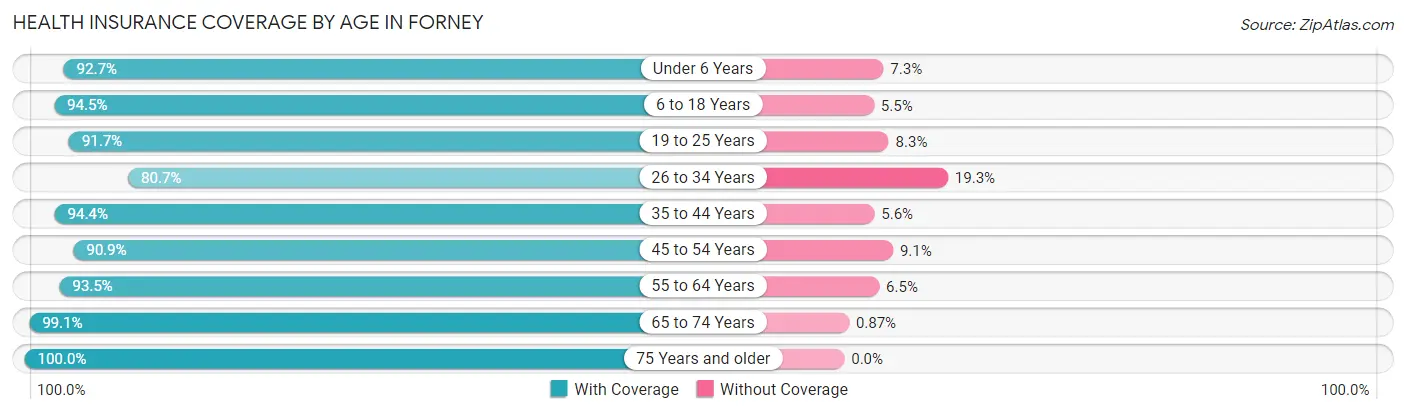
| Age Bracket | With Coverage | Without Coverage |
| Under 6 Years | 2,875 (92.7%) | 226 (7.3%) |
| 6 to 18 Years | 4,159 (94.5%) | 243 (5.5%) |
| 19 to 25 Years | 2,306 (91.7%) | 208 (8.3%) |
| 26 to 34 Years | 3,261 (80.7%) | 781 (19.3%) |
| 35 to 44 Years | 3,792 (94.4%) | 225 (5.6%) |
| 45 to 54 Years | 2,804 (90.9%) | 280 (9.1%) |
| 55 to 64 Years | 2,158 (93.5%) | 150 (6.5%) |
| 65 to 74 Years | 1,140 (99.1%) | 10 (0.9%) |
| 75 Years and older | 604 (100.0%) | 0 (0.0%) |
| Total | 23,099 (91.6%) | 2,123 (8.4%) |
Health Insurance Coverage by Citizenship Status in Forney
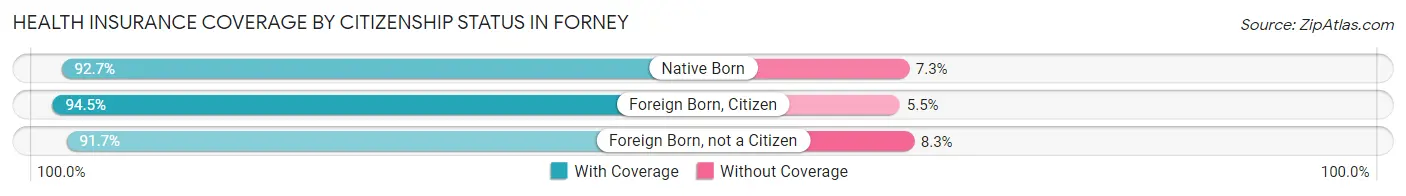
| Citizenship Status | With Coverage | Without Coverage |
| Native Born | 2,875 (92.7%) | 226 (7.3%) |
| Foreign Born, Citizen | 4,159 (94.5%) | 243 (5.5%) |
| Foreign Born, not a Citizen | 2,306 (91.7%) | 208 (8.3%) |
Health Insurance Coverage by Household Income in Forney
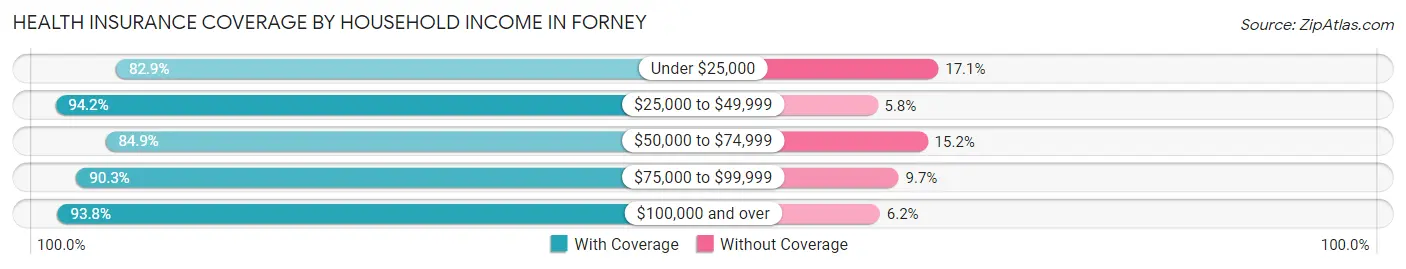
| Household Income | With Coverage | Without Coverage |
| Under $25,000 | 1,194 (82.9%) | 247 (17.1%) |
| $25,000 to $49,999 | 2,047 (94.2%) | 125 (5.8%) |
| $50,000 to $74,999 | 2,811 (84.9%) | 502 (15.1%) |
| $75,000 to $99,999 | 2,994 (90.3%) | 322 (9.7%) |
| $100,000 and over | 14,047 (93.8%) | 927 (6.2%) |
Public vs Private Health Insurance Coverage by Age in Forney
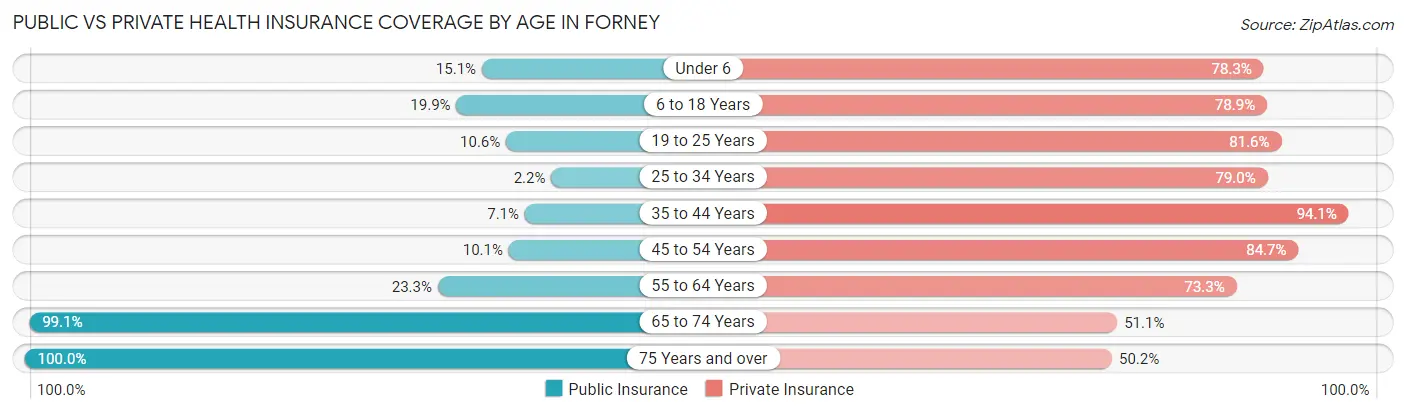
| Age Bracket | Public Insurance | Private Insurance |
| Under 6 | 469 (15.1%) | 2,428 (78.3%) |
| 6 to 18 Years | 874 (19.9%) | 3,474 (78.9%) |
| 19 to 25 Years | 267 (10.6%) | 2,051 (81.6%) |
| 25 to 34 Years | 90 (2.2%) | 3,194 (79.0%) |
| 35 to 44 Years | 287 (7.1%) | 3,779 (94.1%) |
| 45 to 54 Years | 312 (10.1%) | 2,613 (84.7%) |
| 55 to 64 Years | 538 (23.3%) | 1,691 (73.3%) |
| 65 to 74 Years | 1,140 (99.1%) | 588 (51.1%) |
| 75 Years and over | 604 (100.0%) | 303 (50.2%) |
| Total | 4,581 (18.2%) | 20,121 (79.8%) |
Disability Status by Sex by Age in Forney
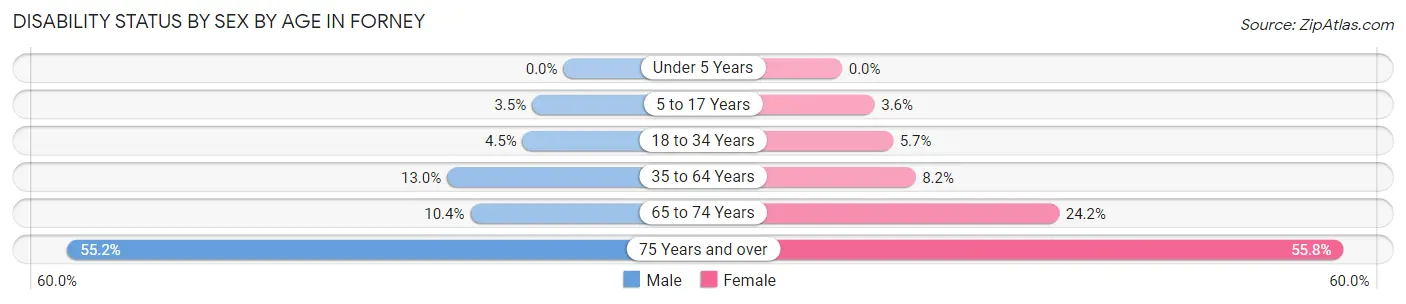
| Age Bracket | Male | Female |
| Under 5 Years | 0 (0.0%) | 0 (0.0%) |
| 5 to 17 Years | 91 (3.5%) | 73 (3.6%) |
| 18 to 34 Years | 155 (4.5%) | 205 (5.7%) |
| 35 to 64 Years | 628 (13.0%) | 373 (8.2%) |
| 65 to 74 Years | 54 (10.4%) | 152 (24.2%) |
| 75 Years and over | 206 (55.2%) | 129 (55.8%) |
Disability Class by Sex by Age in Forney
Disability Class: Hearing Difficulty
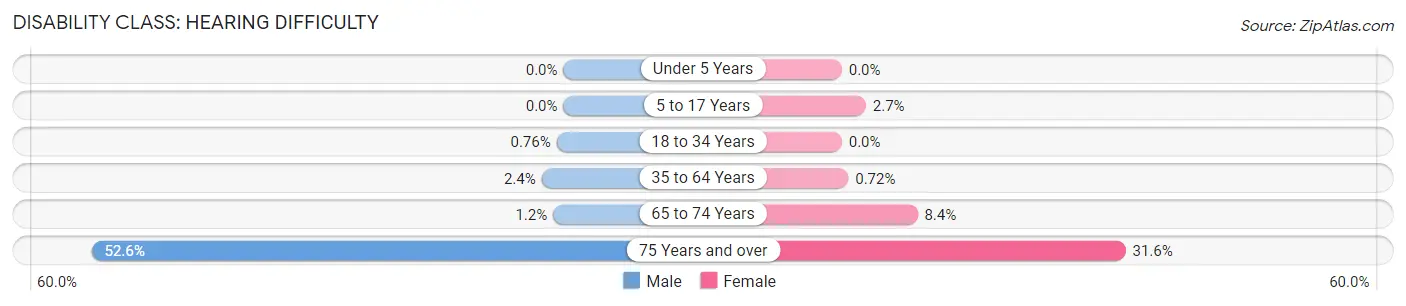
| Age Bracket | Male | Female |
| Under 5 Years | 0 (0.0%) | 0 (0.0%) |
| 5 to 17 Years | 0 (0.0%) | 54 (2.7%) |
| 18 to 34 Years | 26 (0.8%) | 0 (0.0%) |
| 35 to 64 Years | 118 (2.4%) | 33 (0.7%) |
| 65 to 74 Years | 6 (1.1%) | 53 (8.4%) |
| 75 Years and over | 196 (52.5%) | 73 (31.6%) |
Disability Class: Vision Difficulty
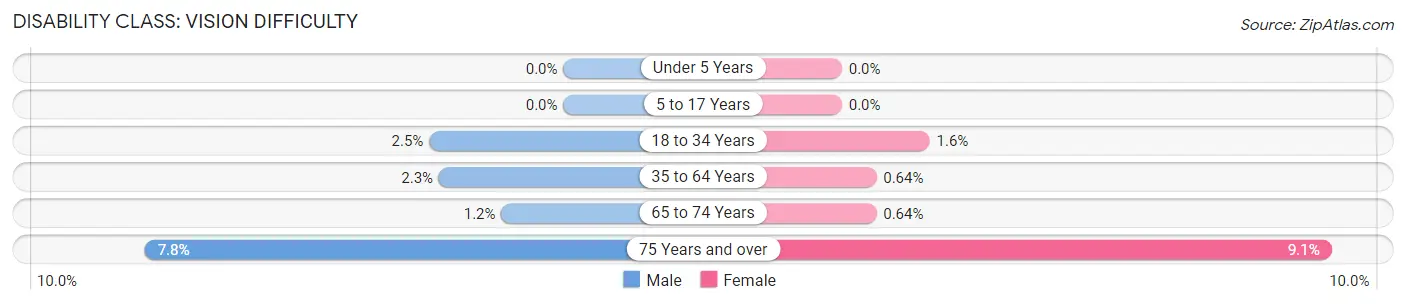
| Age Bracket | Male | Female |
| Under 5 Years | 0 (0.0%) | 0 (0.0%) |
| 5 to 17 Years | 0 (0.0%) | 0 (0.0%) |
| 18 to 34 Years | 85 (2.5%) | 59 (1.6%) |
| 35 to 64 Years | 112 (2.3%) | 29 (0.6%) |
| 65 to 74 Years | 6 (1.1%) | 4 (0.6%) |
| 75 Years and over | 29 (7.8%) | 21 (9.1%) |
Disability Class: Cognitive Difficulty
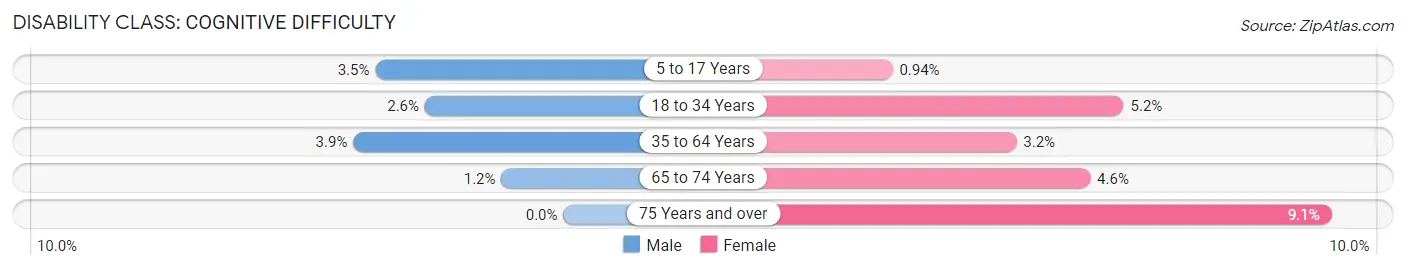
| Age Bracket | Male | Female |
| 5 to 17 Years | 91 (3.5%) | 19 (0.9%) |
| 18 to 34 Years | 88 (2.6%) | 189 (5.2%) |
| 35 to 64 Years | 189 (3.9%) | 148 (3.2%) |
| 65 to 74 Years | 6 (1.1%) | 29 (4.6%) |
| 75 Years and over | 0 (0.0%) | 21 (9.1%) |
Disability Class: Ambulatory Difficulty
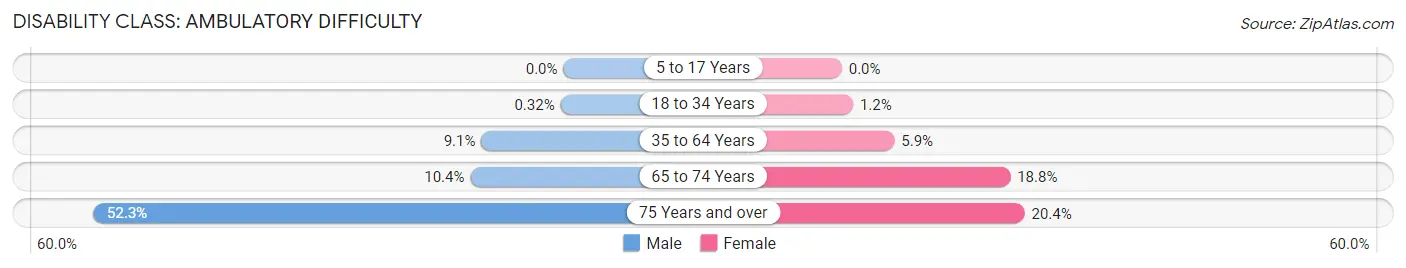
| Age Bracket | Male | Female |
| 5 to 17 Years | 0 (0.0%) | 0 (0.0%) |
| 18 to 34 Years | 11 (0.3%) | 45 (1.2%) |
| 35 to 64 Years | 443 (9.1%) | 267 (5.9%) |
| 65 to 74 Years | 54 (10.4%) | 118 (18.8%) |
| 75 Years and over | 195 (52.3%) | 47 (20.3%) |
Disability Class: Self-Care Difficulty
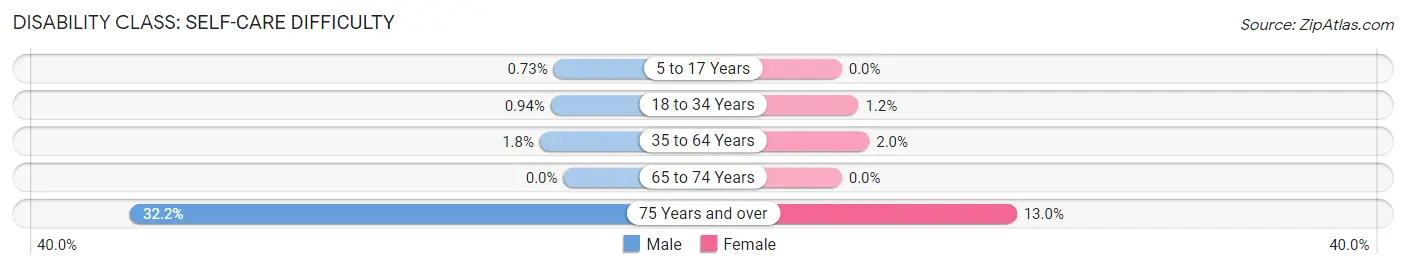
| Age Bracket | Male | Female |
| 5 to 17 Years | 19 (0.7%) | 0 (0.0%) |
| 18 to 34 Years | 32 (0.9%) | 45 (1.2%) |
| 35 to 64 Years | 85 (1.8%) | 93 (2.0%) |
| 65 to 74 Years | 0 (0.0%) | 0 (0.0%) |
| 75 Years and over | 120 (32.2%) | 30 (13.0%) |
Technology Access in Forney
Computing Device Access in Forney
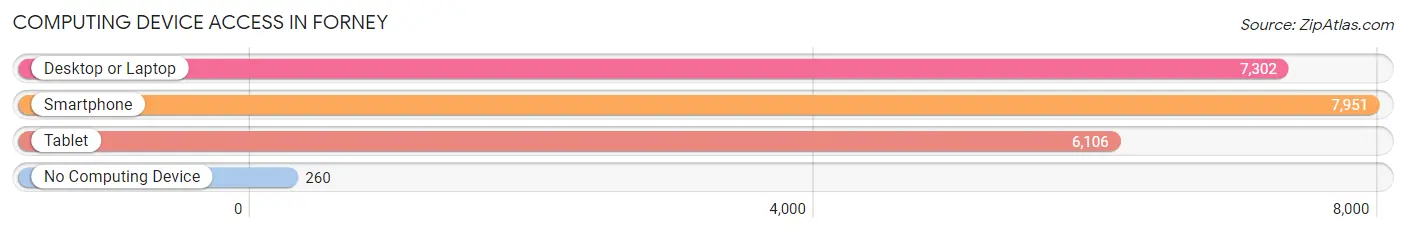
| Device Type | # Households | % Households |
| Desktop or Laptop | 7,302 | 85.7% |
| Smartphone | 7,951 | 93.3% |
| Tablet | 6,106 | 71.7% |
| No Computing Device | 260 | 3.0% |
| Total | 8,520 | 100.0% |
Internet Access in Forney
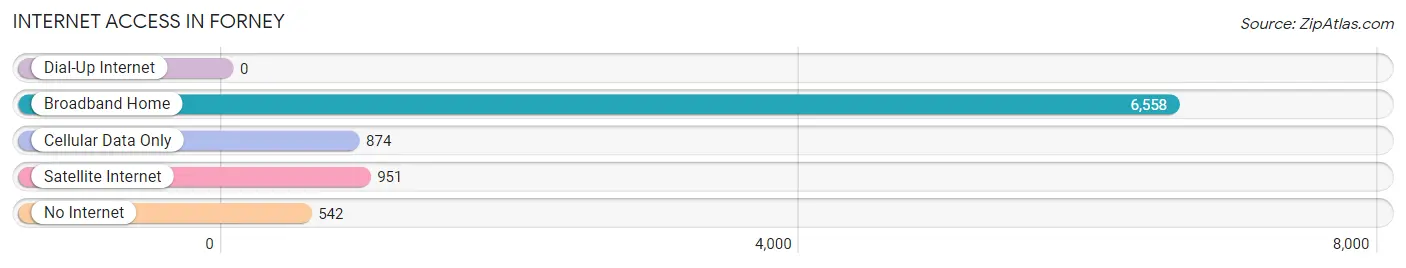
| Internet Type | # Households | % Households |
| Dial-Up Internet | 0 | 0.0% |
| Broadband Home | 6,558 | 77.0% |
| Cellular Data Only | 874 | 10.3% |
| Satellite Internet | 951 | 11.2% |
| No Internet | 542 | 6.4% |
| Total | 8,520 | 100.0% |
Forney Summary
Forney, Texas is a small city located in Kaufman County, Texas, about 20 miles east of Dallas. The city was founded in 1873 and named after William Forney, a Confederate general. The city has a population of approximately 20,000 people and is part of the Dallas-Fort Worth-Arlington metropolitan area.
Geography
Forney is located in the northeast corner of Kaufman County, Texas, about 20 miles east of Dallas. The city is situated on the edge of the Blackland Prairie, a region of rolling hills and fertile soil. The city is bordered by the cities of Mesquite, Balch Springs, and Seagoville. The city is also located near Lake Ray Hubbard, a popular recreational area.
The climate in Forney is typical of the region, with hot summers and mild winters. The average temperature in the summer is around 90 degrees Fahrenheit, while the average temperature in the winter is around 50 degrees Fahrenheit. The city receives an average of 40 inches of rain per year.
Economy
Forney’s economy is largely based on manufacturing and retail. The city is home to several large manufacturing companies, including a steel mill, a plastics plant, and a paper mill. The city also has a large retail sector, with several large shopping centers and a variety of restaurants and stores.
The city is also home to several educational institutions, including the University of Texas at Dallas, Texas A&M University-Commerce, and Eastfield College. The city is also home to several medical facilities, including a hospital and several clinics.
Demographics
As of the 2010 census, the population of Forney was 19,619. The racial makeup of the city was 79.3% White, 11.2% African American, 0.7% Native American, 1.2% Asian, 0.1% Pacific Islander, 5.2% from other races, and 2.5% from two or more races. Hispanic or Latino of any race were 13.3% of the population.
The median income for a household in Forney was $50,945, and the median income for a family was $60,945. The per capita income for the city was $22,945. About 8.2% of families and 10.3% of the population were below the poverty line, including 14.2% of those under age 18 and 8.2% of those age 65 or over.
Conclusion
Forney, Texas is a small city located in Kaufman County, Texas, about 20 miles east of Dallas. The city was founded in 1873 and named after William Forney, a Confederate general. The city has a population of approximately 20,000 people and is part of the Dallas-Fort Worth-Arlington metropolitan area. The city’s economy is largely based on manufacturing and retail, and the city is home to several educational institutions and medical facilities. The population of Forney is largely white, with a significant Hispanic or Latino population. The median income for a household in Forney is $50,945, and the per capita income for the city is $22,945.
Common Questions
What is Per Capita Income in Forney?
Per Capita income in Forney is $37,044.
What is the Median Family Income in Forney?
Median Family Income in Forney is $123,459.
What is the Median Household income in Forney?
Median Household Income in Forney is $102,107.
What is Income or Wage Gap in Forney?
Income or Wage Gap in Forney is 18.1%.
Women in Forney earn 81.9 cents for every dollar earned by a man.
What is Inequality or Gini Index in Forney?
Inequality or Gini Index in Forney is 0.33.
What is the Total Population of Forney?
Total Population of Forney is 25,269.
What is the Total Male Population of Forney?
Total Male Population of Forney is 13,588.
What is the Total Female Population of Forney?
Total Female Population of Forney is 11,681.
What is the Ratio of Males per 100 Females in Forney?
There are 116.33 Males per 100 Females in Forney.
What is the Ratio of Females per 100 Males in Forney?
There are 85.97 Females per 100 Males in Forney.
What is the Median Population Age in Forney?
Median Population Age in Forney is 32.0 Years.
What is the Average Family Size in Forney
Average Family Size in Forney is 3.4 People.
What is the Average Household Size in Forney
Average Household Size in Forney is 3.0 People.
How Large is the Labor Force in Forney?
There are 14,198 People in the Labor Forcein in Forney.
What is the Percentage of People in the Labor Force in Forney?
75.0% of People are in the Labor Force in Forney.
What is the Unemployment Rate in Forney?
Unemployment Rate in Forney is 5.0%.