Farmersville, TX Map & Demographics
Farmersville Map
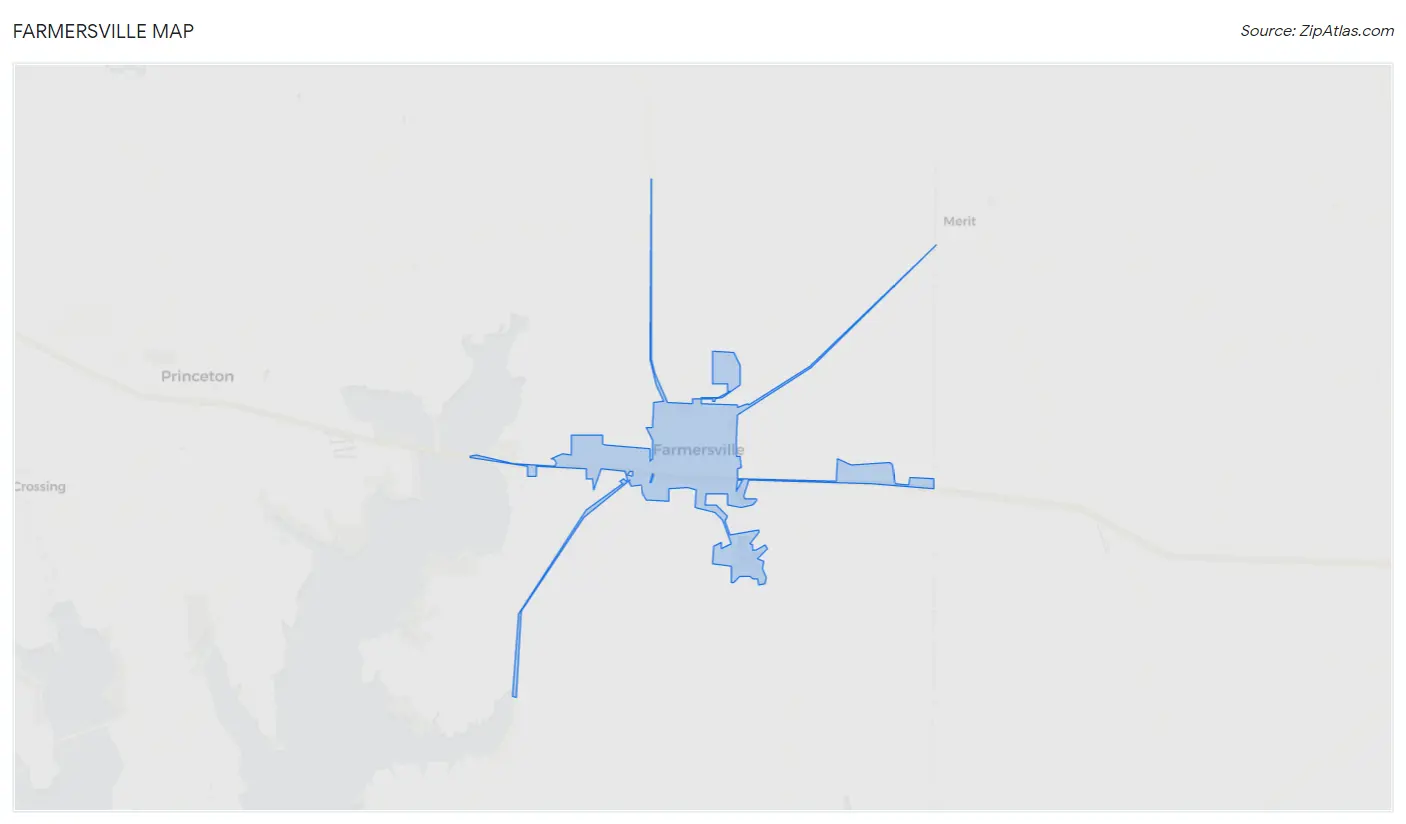
Farmersville Overview
$29,479
PER CAPITA INCOME
$81,110
AVG FAMILY INCOME
69.1%
WAGE / INCOME GAP [ % ]
30.9¢/ $1
WAGE / INCOME GAP [ $ ]
0.52
INEQUALITY / GINI INDEX
3,708
TOTAL POPULATION
1,784
MALE POPULATION
1,924
FEMALE POPULATION
92.72
MALES / 100 FEMALES
107.85
FEMALES / 100 MALES
35.5
MEDIAN AGE
3.3
AVG FAMILY SIZE
2.5
AVG HOUSEHOLD SIZE
1,394
LABOR FORCE [ PEOPLE ]
48.0%
PERCENT IN LABOR FORCE
4.2%
UNEMPLOYMENT RATE
Farmersville Zip Codes
Income in Farmersville
Income Overview in Farmersville
| Characteristic | Number | Measure |
| Per Capita Income | 3,708 | $29,479 |
| Median Family Income | 861 | $81,110 |
| Mean Family Income | 861 | $95,401 |
| Median Household Income | 1,422 | $0 |
| Mean Household Income | 1,422 | $74,008 |
| Income Deficit | 861 | $0 |
| Wage / Income Gap (%) | 3,708 | 69.11% |
| Wage / Income Gap ($) | 3,708 | 30.89¢ per $1 |
| Gini / Inequality Index | 3,708 | 0.52 |
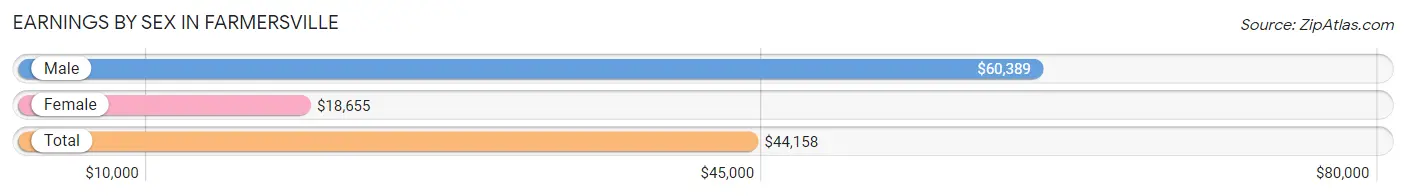
Earnings by Sex in Farmersville
Average Earnings in Farmersville are $44,158, $60,389 for men and $18,655 for women, a difference of 69.1%.
| Sex | Number | Average Earnings |
| Male | 1,096 (70.5%) | $60,389 |
| Female | 459 (29.5%) | $18,655 |
| Total | 1,555 (100.0%) | $44,158 |
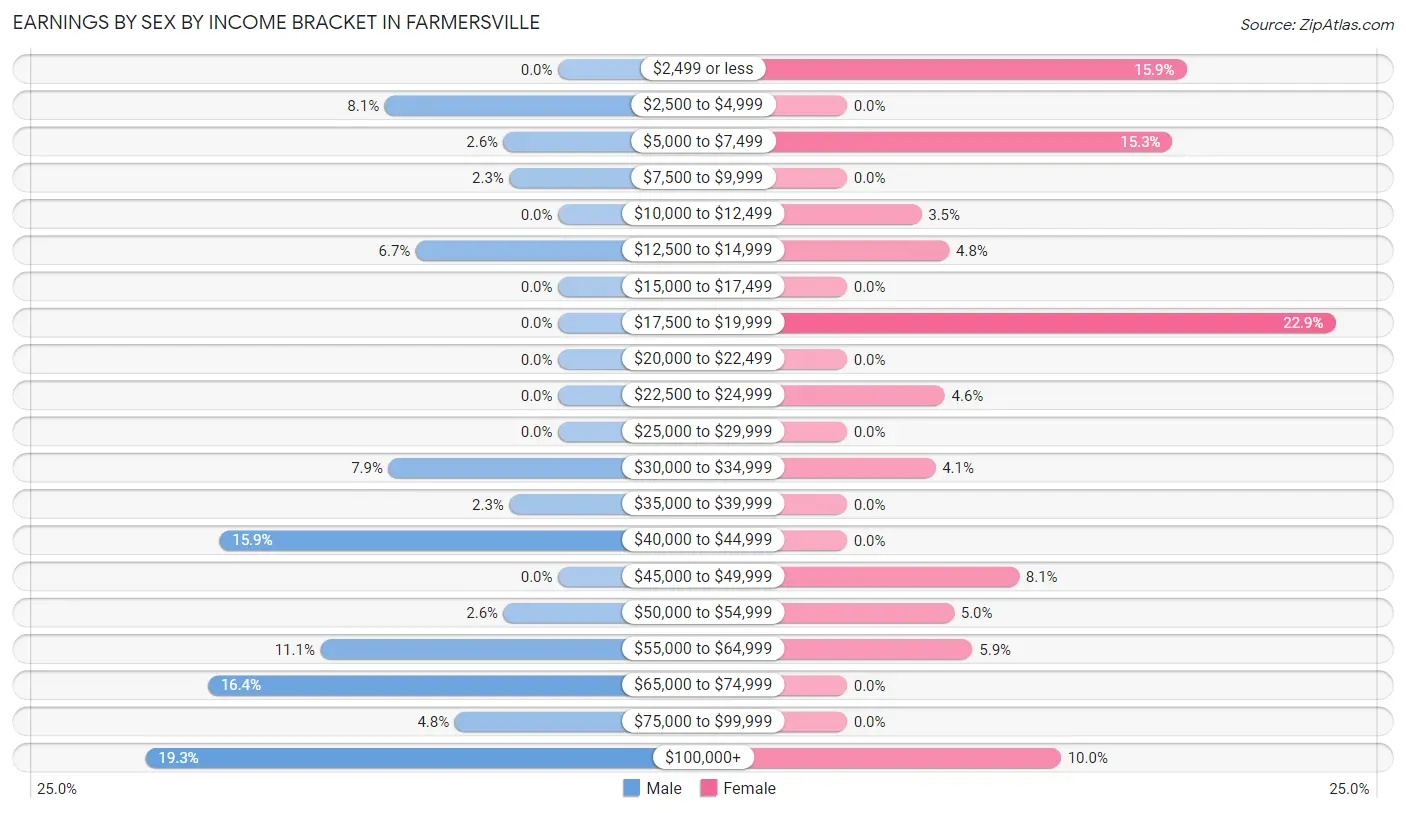
Earnings by Sex by Income Bracket in Farmersville
The most common earnings brackets in Farmersville are $100,000+ for men (212 | 19.3%) and $17,500 to $19,999 for women (105 | 22.9%).
| Income | Male | Female |
| $2,499 or less | 0 (0.0%) | 73 (15.9%) |
| $2,500 to $4,999 | 89 (8.1%) | 0 (0.0%) |
| $5,000 to $7,499 | 28 (2.5%) | 70 (15.2%) |
| $7,500 to $9,999 | 25 (2.3%) | 0 (0.0%) |
| $10,000 to $12,499 | 0 (0.0%) | 16 (3.5%) |
| $12,500 to $14,999 | 73 (6.7%) | 22 (4.8%) |
| $15,000 to $17,499 | 0 (0.0%) | 0 (0.0%) |
| $17,500 to $19,999 | 0 (0.0%) | 105 (22.9%) |
| $20,000 to $22,499 | 0 (0.0%) | 0 (0.0%) |
| $22,500 to $24,999 | 0 (0.0%) | 21 (4.6%) |
| $25,000 to $29,999 | 0 (0.0%) | 0 (0.0%) |
| $30,000 to $34,999 | 87 (7.9%) | 19 (4.1%) |
| $35,000 to $39,999 | 25 (2.3%) | 0 (0.0%) |
| $40,000 to $44,999 | 174 (15.9%) | 0 (0.0%) |
| $45,000 to $49,999 | 0 (0.0%) | 37 (8.1%) |
| $50,000 to $54,999 | 28 (2.5%) | 23 (5.0%) |
| $55,000 to $64,999 | 122 (11.1%) | 27 (5.9%) |
| $65,000 to $74,999 | 180 (16.4%) | 0 (0.0%) |
| $75,000 to $99,999 | 53 (4.8%) | 0 (0.0%) |
| $100,000+ | 212 (19.3%) | 46 (10.0%) |
| Total | 1,096 (100.0%) | 459 (100.0%) |
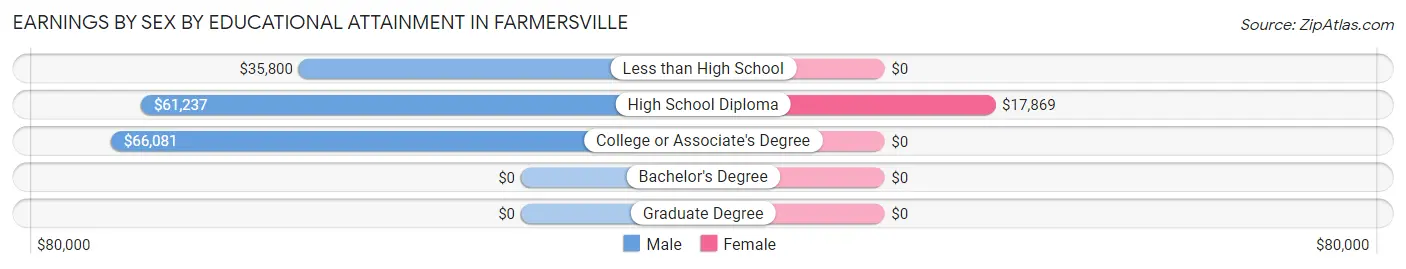
Earnings by Sex by Educational Attainment in Farmersville
Average earnings in Farmersville are $66,791 for men and $19,262 for women, a difference of 71.2%. Men with an educational attainment of college or associate's degree enjoy the highest average annual earnings of $66,081, while those with less than high school education earn the least with $35,800. Women with an educational attainment of high school diploma earn the most with the average annual earnings of $17,869, while those with high school diploma education have the smallest earnings of $17,869.
| Educational Attainment | Male Income | Female Income |
| Less than High School | $35,800 | $0 |
| High School Diploma | $61,237 | $17,869 |
| College or Associate's Degree | $66,081 | $0 |
| Bachelor's Degree | - | - |
| Graduate Degree | - | - |
| Total | $66,791 | $19,262 |
Family Income in Farmersville
Family Income Brackets in Farmersville
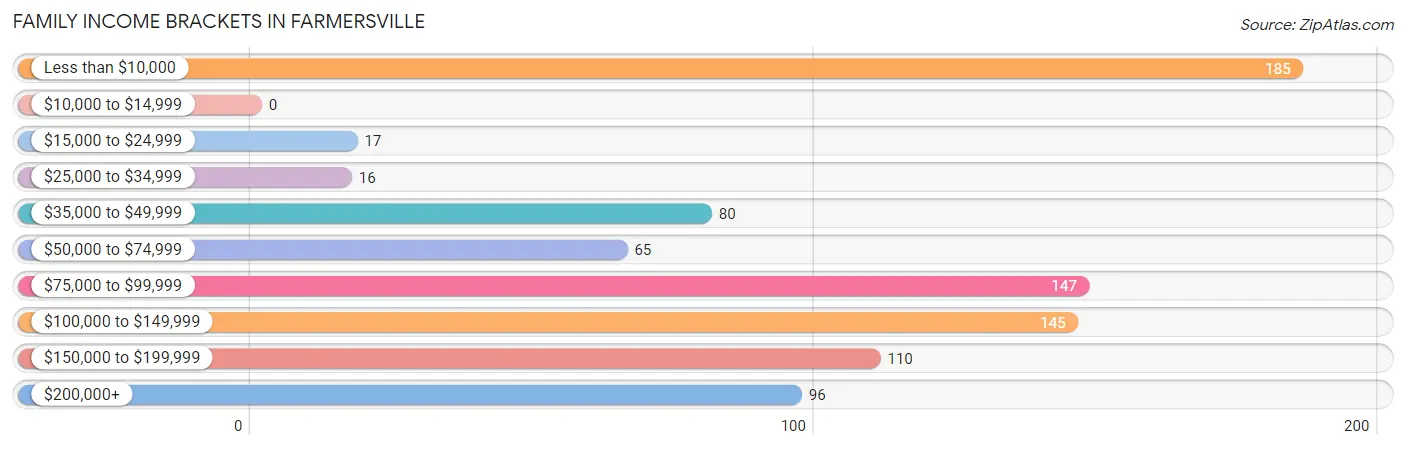
According to the Farmersville family income data, there are 185 families falling into the less than $10,000 income range, which is the most common income bracket and makes up 21.5% of all families.
| Income Bracket | # Families | % Families |
| Less than $10,000 | 185 | 21.5% |
| $10,000 to $14,999 | 0 | 0.0% |
| $15,000 to $24,999 | 17 | 2.0% |
| $25,000 to $34,999 | 16 | 1.9% |
| $35,000 to $49,999 | 80 | 9.3% |
| $50,000 to $74,999 | 65 | 7.5% |
| $75,000 to $99,999 | 147 | 17.1% |
| $100,000 to $149,999 | 145 | 16.8% |
| $150,000 to $199,999 | 110 | 12.8% |
| $200,000+ | 96 | 11.1% |
Family Income by Famaliy Size in Farmersville
| Income Bracket | # Families | Median Income |
| 2-Person Families | 219 (25.4%) | $0 |
| 3-Person Families | 371 (43.1%) | $0 |
| 4-Person Families | 214 (24.8%) | $0 |
| 5-Person Families | 29 (3.4%) | $0 |
| 6-Person Families | 28 (3.3%) | $0 |
| 7+ Person Families | 0 (0.0%) | $0 |
| Total | 861 (100.0%) | $81,110 |
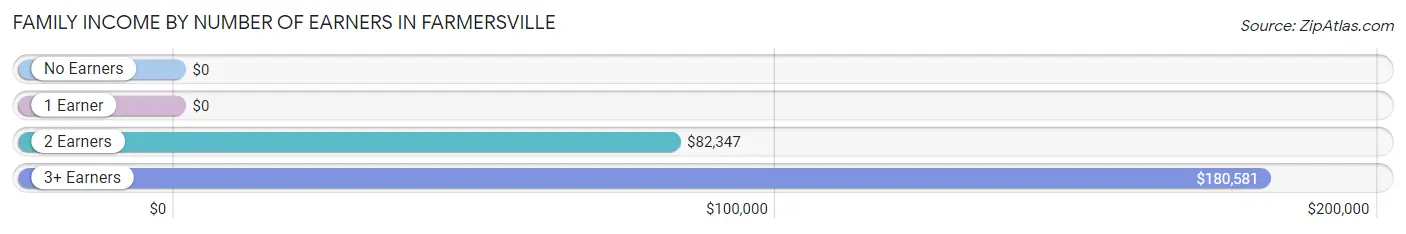
Family Income by Number of Earners in Farmersville
| Number of Earners | # Families | Median Income |
| No Earners | 195 (22.7%) | $0 |
| 1 Earner | 318 (36.9%) | $0 |
| 2 Earners | 216 (25.1%) | $82,347 |
| 3+ Earners | 132 (15.3%) | $180,581 |
| Total | 861 (100.0%) | $81,110 |
Household Income in Farmersville
Household Income Brackets in Farmersville
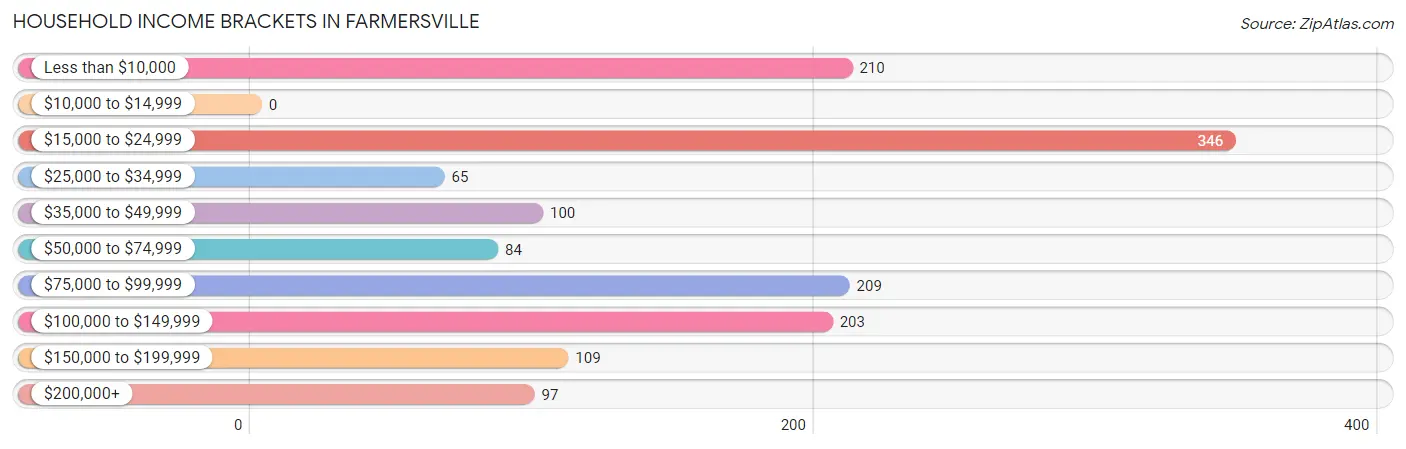
With 346 households falling in the category, the $15,000 to $24,999 income range is the most frequent in Farmersville, accounting for 24.3% of all households.
| Income Bracket | # Households | % Households |
| Less than $10,000 | 210 | 14.8% |
| $10,000 to $14,999 | 0 | 0.0% |
| $15,000 to $24,999 | 346 | 24.3% |
| $25,000 to $34,999 | 65 | 4.6% |
| $35,000 to $49,999 | 100 | 7.0% |
| $50,000 to $74,999 | 84 | 5.9% |
| $75,000 to $99,999 | 209 | 14.7% |
| $100,000 to $149,999 | 203 | 14.3% |
| $150,000 to $199,999 | 109 | 7.7% |
| $200,000+ | 97 | 6.8% |
Household Income by Householder Age in Farmersville
The median household income in Farmersville is $0, with the highest median household income of $76,109 found in the 25 to 44 years age bracket for the primary householder. A total of 405 households (28.5%) fall into this category.
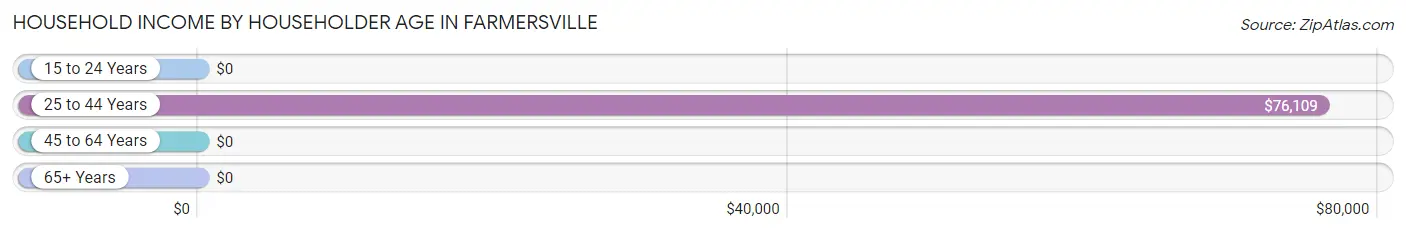
| Income Bracket | # Households | Median Income |
| 15 to 24 Years | 0 (0.0%) | $0 |
| 25 to 44 Years | 405 (28.5%) | $76,109 |
| 45 to 64 Years | 621 (43.7%) | $0 |
| 65+ Years | 396 (27.9%) | $0 |
| Total | 1,422 (100.0%) | $0 |
Poverty in Farmersville
Income Below Poverty by Sex and Age in Farmersville
With 19.8% poverty level for males and 23.6% for females among the residents of Farmersville, 75 year old and over males and 18 to 24 year old females are the most vulnerable to poverty, with 24 males (100.0%) and 51 females (100.0%) in their respective age groups living below the poverty level.
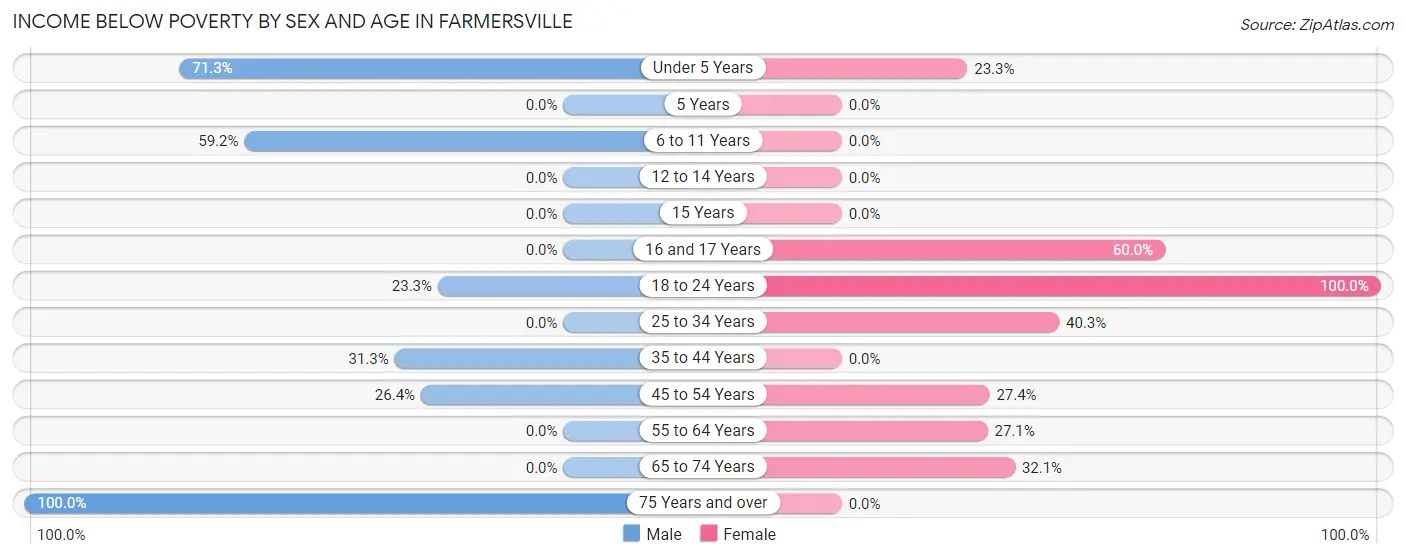
| Age Bracket | Male | Female |
| Under 5 Years | 62 (71.3%) | 24 (23.3%) |
| 5 Years | 0 (0.0%) | 0 (0.0%) |
| 6 to 11 Years | 61 (59.2%) | 0 (0.0%) |
| 12 to 14 Years | 0 (0.0%) | 0 (0.0%) |
| 15 Years | 0 (0.0%) | 0 (0.0%) |
| 16 and 17 Years | 0 (0.0%) | 66 (60.0%) |
| 18 to 24 Years | 51 (23.3%) | 51 (100.0%) |
| 25 to 34 Years | 0 (0.0%) | 96 (40.3%) |
| 35 to 44 Years | 73 (31.3%) | 0 (0.0%) |
| 45 to 54 Years | 78 (26.4%) | 71 (27.4%) |
| 55 to 64 Years | 0 (0.0%) | 99 (27.1%) |
| 65 to 74 Years | 0 (0.0%) | 18 (32.1%) |
| 75 Years and over | 24 (100.0%) | 0 (0.0%) |
| Total | 349 (19.8%) | 425 (23.6%) |
Income Above Poverty by Sex and Age in Farmersville
According to the poverty statistics in Farmersville, males aged 12 to 14 years and females aged 6 to 11 years are the age groups that are most secure financially, with 100.0% of males and 100.0% of females in these age groups living above the poverty line.
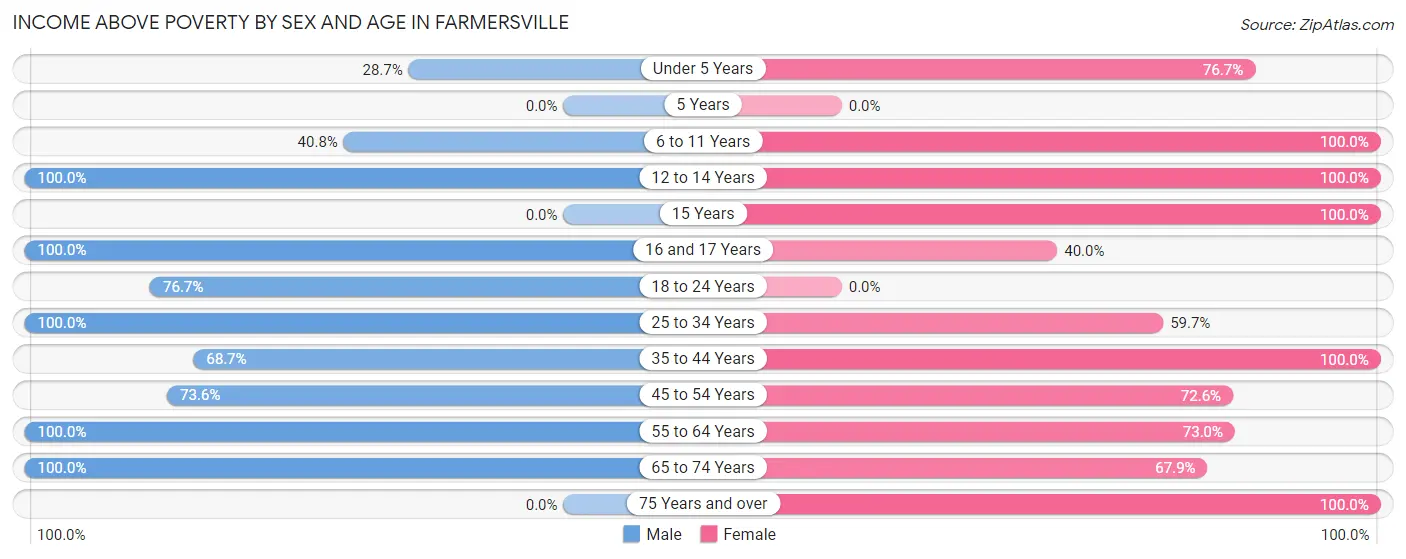
| Age Bracket | Male | Female |
| Under 5 Years | 25 (28.7%) | 79 (76.7%) |
| 5 Years | 0 (0.0%) | 0 (0.0%) |
| 6 to 11 Years | 42 (40.8%) | 169 (100.0%) |
| 12 to 14 Years | 161 (100.0%) | 26 (100.0%) |
| 15 Years | 0 (0.0%) | 82 (100.0%) |
| 16 and 17 Years | 162 (100.0%) | 44 (40.0%) |
| 18 to 24 Years | 168 (76.7%) | 0 (0.0%) |
| 25 to 34 Years | 209 (100.0%) | 142 (59.7%) |
| 35 to 44 Years | 160 (68.7%) | 73 (100.0%) |
| 45 to 54 Years | 217 (73.6%) | 188 (72.6%) |
| 55 to 64 Years | 164 (100.0%) | 267 (73.0%) |
| 65 to 74 Years | 105 (100.0%) | 38 (67.9%) |
| 75 Years and over | 0 (0.0%) | 265 (100.0%) |
| Total | 1,413 (80.2%) | 1,373 (76.4%) |
Income Below Poverty Among Married-Couple Families in Farmersville
The poverty statistics for married-couple families in Farmersville show that 11.5% or 71 of the total 617 families live below the poverty line. Families with 1 or 2 children have the highest poverty rate of 19.2%, comprising of 71 families. On the other hand, families with no children have the lowest poverty rate of 0.0%, which includes 0 families.
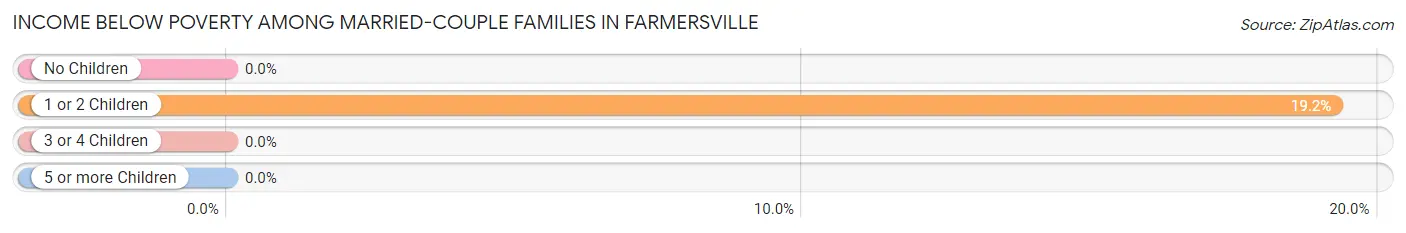
| Children | Above Poverty | Below Poverty |
| No Children | 191 (100.0%) | 0 (0.0%) |
| 1 or 2 Children | 298 (80.8%) | 71 (19.2%) |
| 3 or 4 Children | 57 (100.0%) | 0 (0.0%) |
| 5 or more Children | 0 (0.0%) | 0 (0.0%) |
| Total | 546 (88.5%) | 71 (11.5%) |
Income Below Poverty Among Single-Parent Households in Farmersville
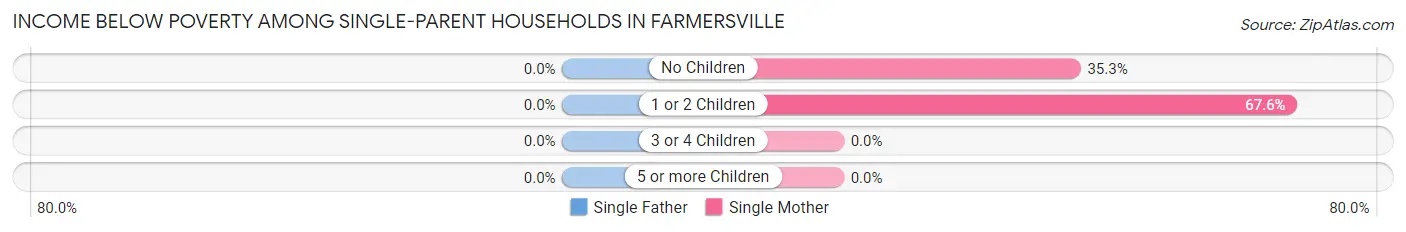
| Children | Single Father | Single Mother |
| No Children | 0 (0.0%) | 18 (35.3%) |
| 1 or 2 Children | 0 (0.0%) | 96 (67.6%) |
| 3 or 4 Children | 0 (0.0%) | 0 (0.0%) |
| 5 or more Children | 0 (0.0%) | 0 (0.0%) |
| Total | 0 (0.0%) | 114 (55.1%) |
Income Below Poverty Among Married-Couple vs Single-Parent Households in Farmersville
The poverty data for Farmersville shows that 71 of the married-couple family households (11.5%) and 114 of the single-parent households (46.7%) are living below the poverty level. Within the married-couple family households, those with 1 or 2 children have the highest poverty rate, with 71 households (19.2%) falling below the poverty line. Among the single-parent households, those with 1 or 2 children have the highest poverty rate, with 96 household (53.6%) living below poverty.
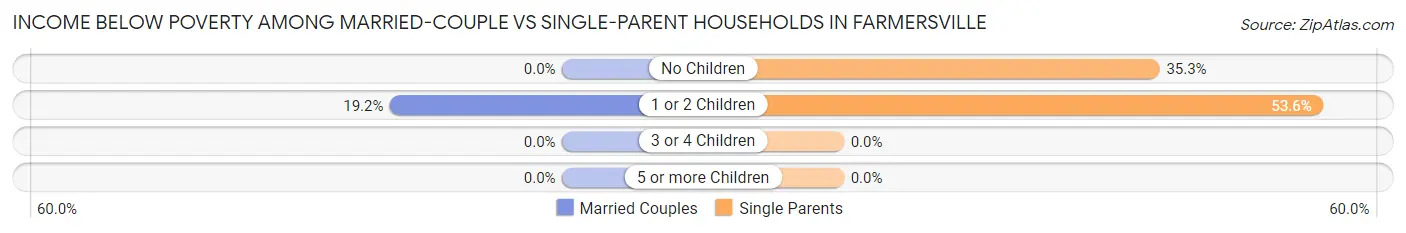
| Children | Married-Couple Families | Single-Parent Households |
| No Children | 0 (0.0%) | 18 (35.3%) |
| 1 or 2 Children | 71 (19.2%) | 96 (53.6%) |
| 3 or 4 Children | 0 (0.0%) | 0 (0.0%) |
| 5 or more Children | 0 (0.0%) | 0 (0.0%) |
| Total | 71 (11.5%) | 114 (46.7%) |
Race in Farmersville
The most populous races in Farmersville are White / Caucasian (2,993 | 80.7%), Hispanic or Latino (437 | 11.8%), and Black / African American (427 | 11.5%).
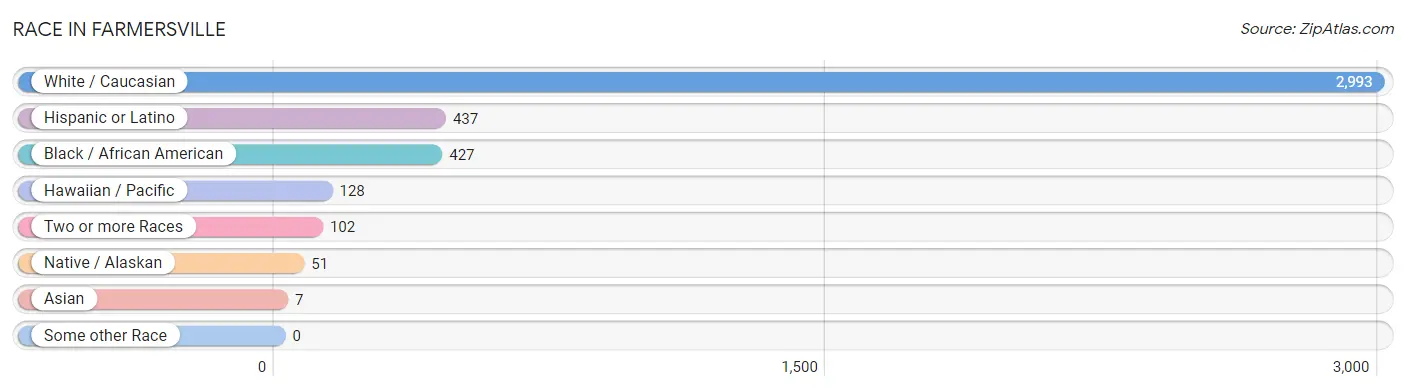
| Race | # Population | % Population |
| Asian | 7 | 0.2% |
| Black / African American | 427 | 11.5% |
| Hawaiian / Pacific | 128 | 3.5% |
| Hispanic or Latino | 437 | 11.8% |
| Native / Alaskan | 51 | 1.4% |
| White / Caucasian | 2,993 | 80.7% |
| Two or more Races | 102 | 2.8% |
| Some other Race | 0 | 0.0% |
| Total | 3,708 | 100.0% |
Ancestry in Farmersville
The most populous ancestries reported in Farmersville are American (799 | 21.5%), Irish (663 | 17.9%), Mexican (437 | 11.8%), Italian (398 | 10.7%), and European (377 | 10.2%), together accounting for 72.1% of all Farmersville residents.
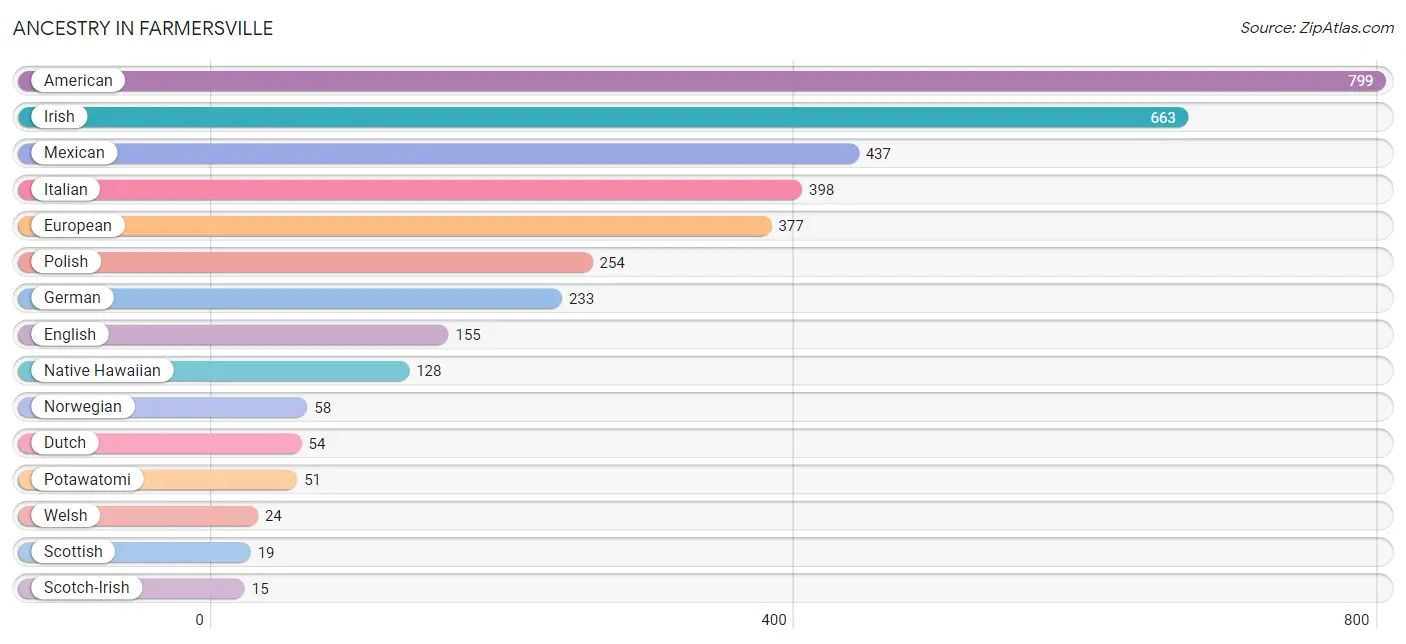
| Ancestry | # Population | % Population |
| American | 799 | 21.5% |
| Dutch | 54 | 1.5% |
| English | 155 | 4.2% |
| European | 377 | 10.2% |
| German | 233 | 6.3% |
| Irish | 663 | 17.9% |
| Italian | 398 | 10.7% |
| Mexican | 437 | 11.8% |
| Native Hawaiian | 128 | 3.5% |
| Norwegian | 58 | 1.6% |
| Polish | 254 | 6.9% |
| Potawatomi | 51 | 1.4% |
| Scotch-Irish | 15 | 0.4% |
| Scottish | 19 | 0.5% |
| Thai | 7 | 0.2% |
| Welsh | 24 | 0.6% | View All 16 Rows |
Immigrants in Farmersville
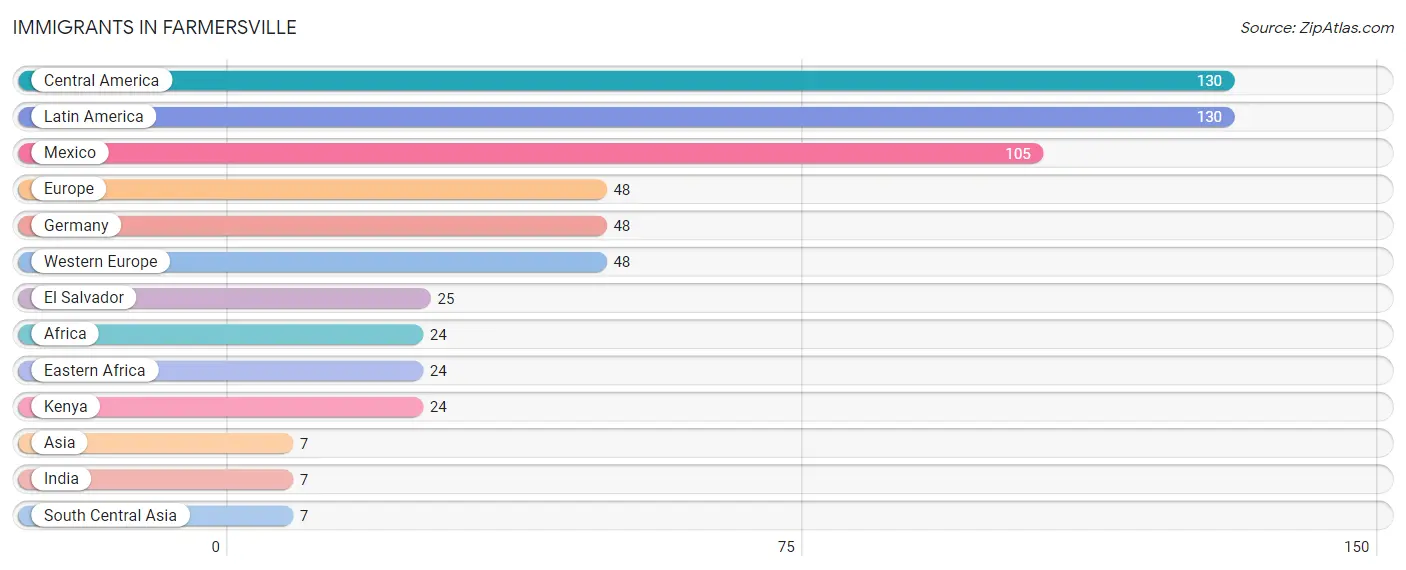
The most numerous immigrant groups reported in Farmersville came from Central America (130 | 3.5%), Latin America (130 | 3.5%), Mexico (105 | 2.8%), Europe (48 | 1.3%), and Germany (48 | 1.3%), together accounting for 12.4% of all Farmersville residents.
| Immigration Origin | # Population | % Population |
| Africa | 24 | 0.6% |
| Asia | 7 | 0.2% |
| Central America | 130 | 3.5% |
| Eastern Africa | 24 | 0.6% |
| El Salvador | 25 | 0.7% |
| Europe | 48 | 1.3% |
| Germany | 48 | 1.3% |
| India | 7 | 0.2% |
| Kenya | 24 | 0.6% |
| Latin America | 130 | 3.5% |
| Mexico | 105 | 2.8% |
| South Central Asia | 7 | 0.2% |
| Western Europe | 48 | 1.3% | View All 13 Rows |
Sex and Age in Farmersville
Sex and Age in Farmersville
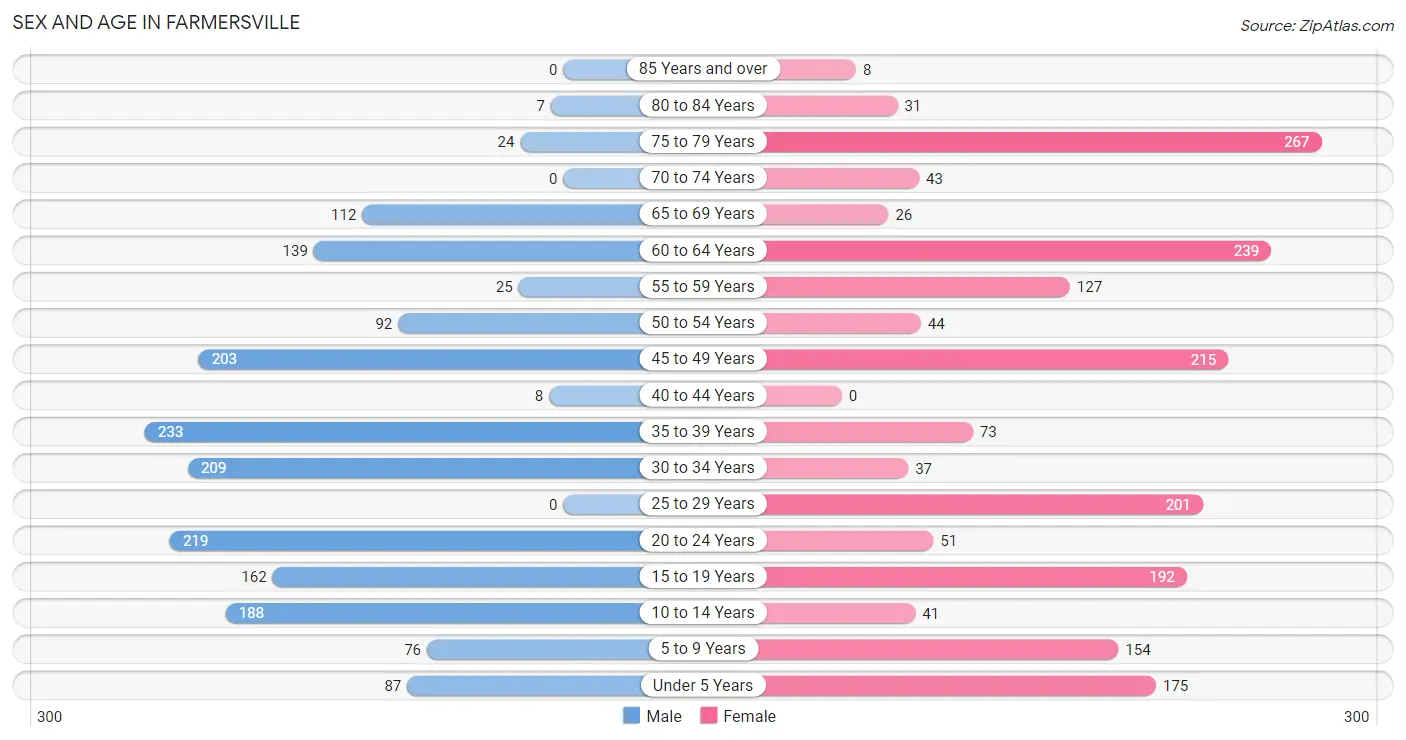
The most populous age groups in Farmersville are 35 to 39 Years (233 | 13.1%) for men and 75 to 79 Years (267 | 13.9%) for women.
| Age Bracket | Male | Female |
| Under 5 Years | 87 (4.9%) | 175 (9.1%) |
| 5 to 9 Years | 76 (4.3%) | 154 (8.0%) |
| 10 to 14 Years | 188 (10.5%) | 41 (2.1%) |
| 15 to 19 Years | 162 (9.1%) | 192 (10.0%) |
| 20 to 24 Years | 219 (12.3%) | 51 (2.6%) |
| 25 to 29 Years | 0 (0.0%) | 201 (10.4%) |
| 30 to 34 Years | 209 (11.7%) | 37 (1.9%) |
| 35 to 39 Years | 233 (13.1%) | 73 (3.8%) |
| 40 to 44 Years | 8 (0.4%) | 0 (0.0%) |
| 45 to 49 Years | 203 (11.4%) | 215 (11.2%) |
| 50 to 54 Years | 92 (5.2%) | 44 (2.3%) |
| 55 to 59 Years | 25 (1.4%) | 127 (6.6%) |
| 60 to 64 Years | 139 (7.8%) | 239 (12.4%) |
| 65 to 69 Years | 112 (6.3%) | 26 (1.3%) |
| 70 to 74 Years | 0 (0.0%) | 43 (2.2%) |
| 75 to 79 Years | 24 (1.3%) | 267 (13.9%) |
| 80 to 84 Years | 7 (0.4%) | 31 (1.6%) |
| 85 Years and over | 0 (0.0%) | 8 (0.4%) |
| Total | 1,784 (100.0%) | 1,924 (100.0%) |
Families and Households in Farmersville
Median Family Size in Farmersville
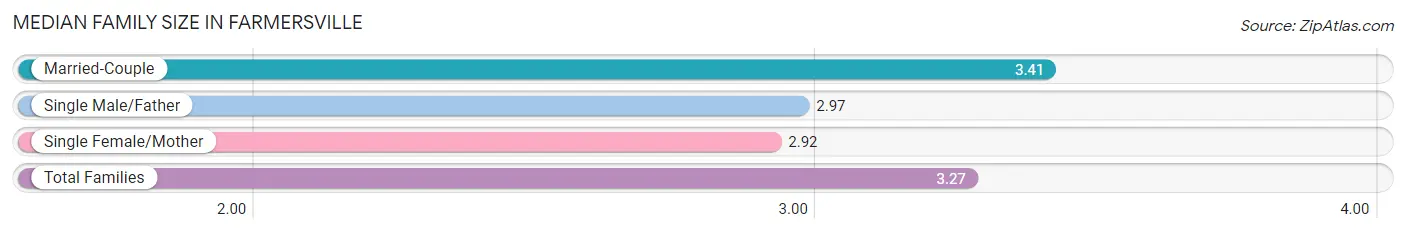
The median family size in Farmersville is 3.27 persons per family, with married-couple families (617 | 71.7%) accounting for the largest median family size of 3.41 persons per family. On the other hand, single female/mother families (207 | 24.0%) represent the smallest median family size with 2.92 persons per family.
| Family Type | # Families | Family Size |
| Married-Couple | 617 (71.7%) | 3.41 |
| Single Male/Father | 37 (4.3%) | 2.97 |
| Single Female/Mother | 207 (24.0%) | 2.92 |
| Total Families | 861 (100.0%) | 3.27 |
Median Household Size in Farmersville
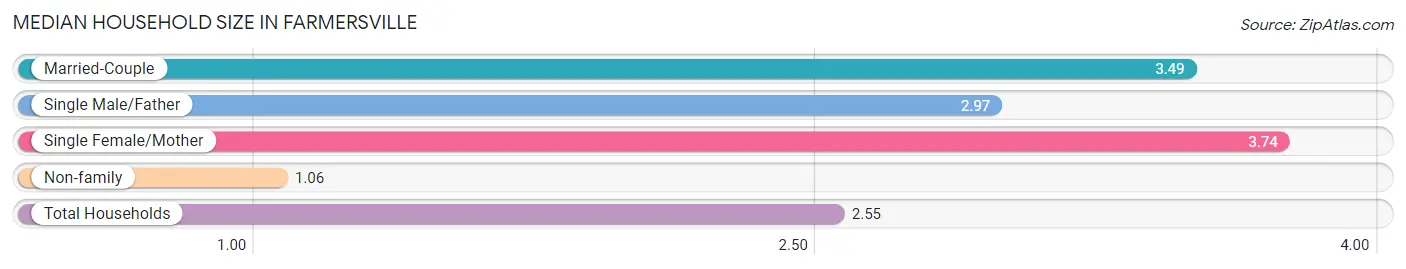
The median household size in Farmersville is 2.55 persons per household, with single female/mother households (207 | 14.6%) accounting for the largest median household size of 3.74 persons per household. non-family households (561 | 39.5%) represent the smallest median household size with 1.06 persons per household.
| Household Type | # Households | Household Size |
| Married-Couple | 617 (43.4%) | 3.49 |
| Single Male/Father | 37 (2.6%) | 2.97 |
| Single Female/Mother | 207 (14.6%) | 3.74 |
| Non-family | 561 (39.5%) | 1.06 |
| Total Households | 1,422 (100.0%) | 2.55 |
Household Size by Marriage Status in Farmersville
Out of a total of 1,422 households in Farmersville, 861 (60.6%) are family households, while 561 (39.5%) are nonfamily households. The most numerous type of family households are 3-person households, comprising 321, and the most common type of nonfamily households are 1-person households, comprising 537.
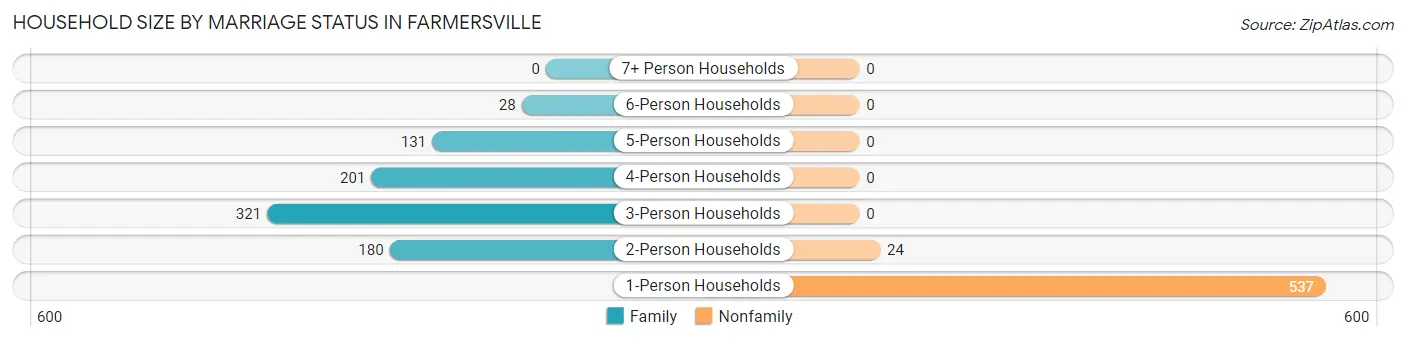
| Household Size | Family Households | Nonfamily Households |
| 1-Person Households | - | 537 (37.8%) |
| 2-Person Households | 180 (12.7%) | 24 (1.7%) |
| 3-Person Households | 321 (22.6%) | 0 (0.0%) |
| 4-Person Households | 201 (14.1%) | 0 (0.0%) |
| 5-Person Households | 131 (9.2%) | 0 (0.0%) |
| 6-Person Households | 28 (2.0%) | 0 (0.0%) |
| 7+ Person Households | 0 (0.0%) | 0 (0.0%) |
| Total | 861 (60.6%) | 561 (39.5%) |
Female Fertility in Farmersville
Fertility by Age in Farmersville
Average fertility rate in Farmersville is 95.0 births per 1,000 women. Women in the age bracket of 20 to 34 years have the highest fertility rate with 253.0 births per 1,000 women. Women in the age bracket of 20 to 34 years acount for 100.0% of all women with births.
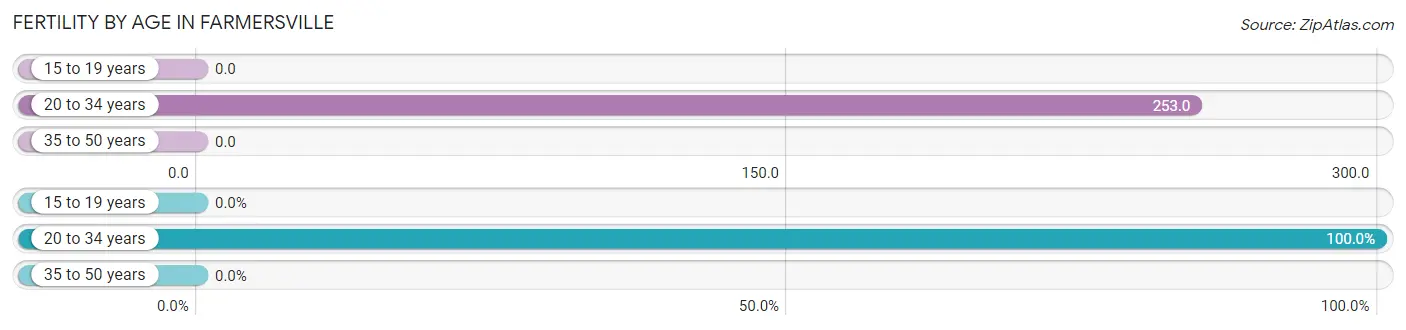
| Age Bracket | Women with Births | Births / 1,000 Women |
| 15 to 19 years | 0 (0.0%) | 0.0 |
| 20 to 34 years | 73 (100.0%) | 253.0 |
| 35 to 50 years | 0 (0.0%) | 0.0 |
| Total | 73 (100.0%) | 95.0 |
Fertility by Age by Marriage Status in Farmersville
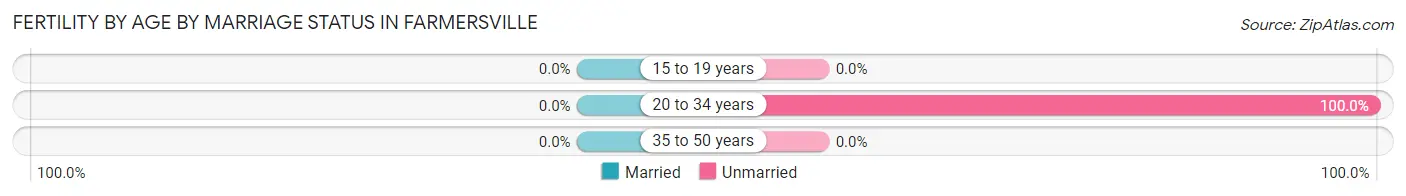
| Age Bracket | Married | Unmarried |
| 15 to 19 years | 0 (0.0%) | 0 (0.0%) |
| 20 to 34 years | 0 (0.0%) | 73 (100.0%) |
| 35 to 50 years | 0 (0.0%) | 0 (0.0%) |
| Total | 0 (0.0%) | 73 (100.0%) |
Fertility by Education in Farmersville
| Educational Attainment | Women with Births | Births / 1,000 Women |
| Less than High School | 0 (0.0%) | 0.0 |
| High School Diploma | 73 (100.0%) | 196.0 |
| College or Associate's Degree | 0 (0.0%) | 0.0 |
| Bachelor's Degree | 0 (0.0%) | 0.0 |
| Graduate Degree | 0 (0.0%) | 0.0 |
| Total | 73 (100.0%) | 95.0 |
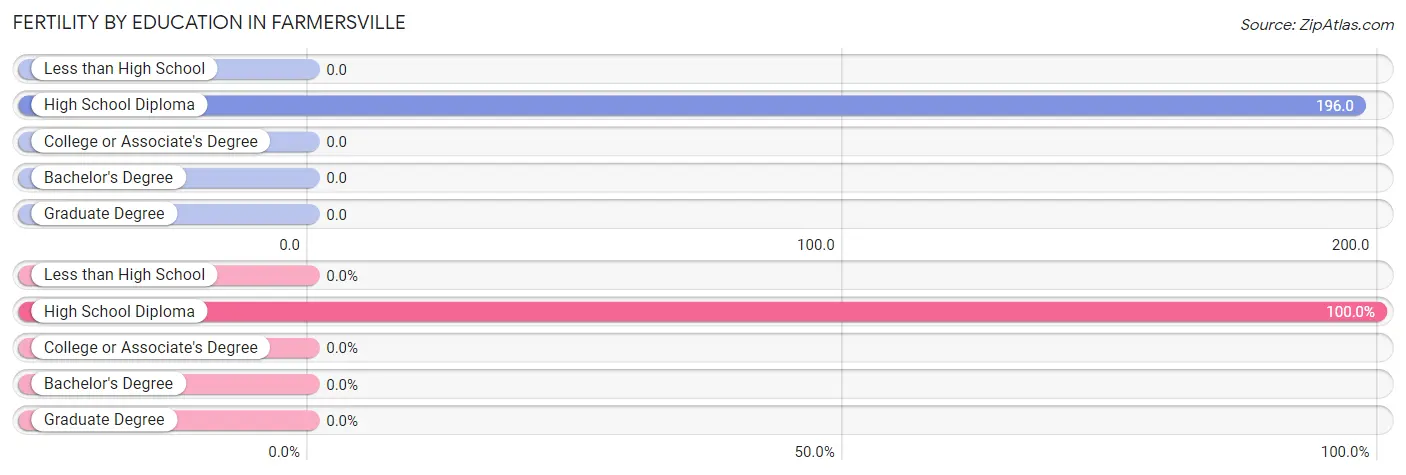
Fertility by Education by Marriage Status in Farmersville
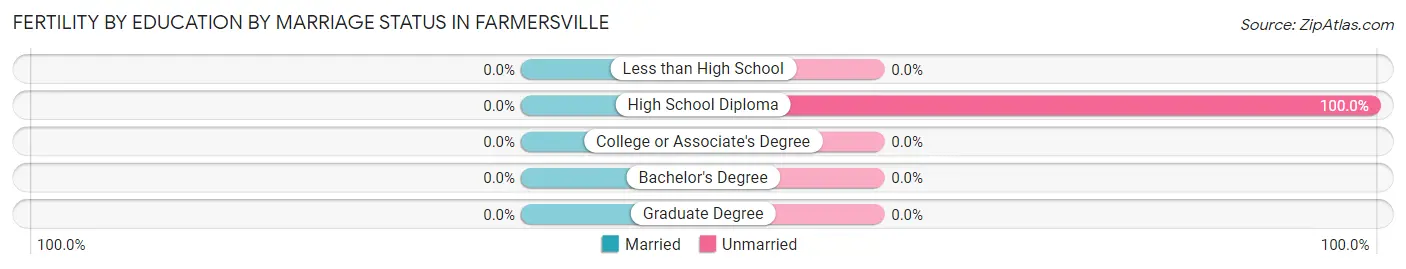
| Educational Attainment | Married | Unmarried |
| Less than High School | 0 (0.0%) | 0 (0.0%) |
| High School Diploma | 0 (0.0%) | 73 (100.0%) |
| College or Associate's Degree | 0 (0.0%) | 0 (0.0%) |
| Bachelor's Degree | 0 (0.0%) | 0 (0.0%) |
| Graduate Degree | 0 (0.0%) | 0 (0.0%) |
| Total | 0 (0.0%) | 73 (100.0%) |
Employment Characteristics in Farmersville
Employment by Class of Employer in Farmersville
Among the 1,337 employed individuals in Farmersville, private company employees (1,087 | 81.3%), local government employees (149 | 11.1%), and not-for-profit organizations (47 | 3.5%) make up the most common classes of employment.
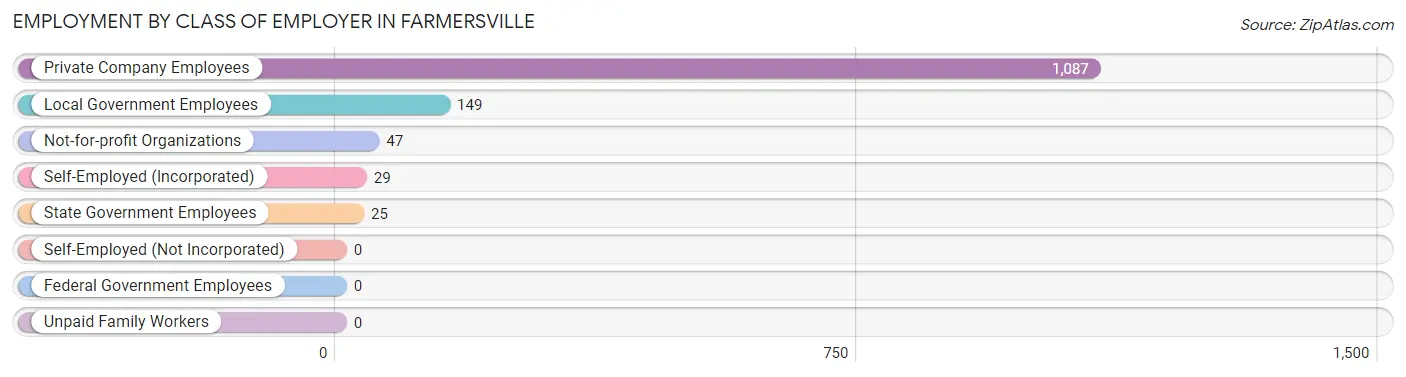
| Employer Class | # Employees | % Employees |
| Private Company Employees | 1,087 | 81.3% |
| Self-Employed (Incorporated) | 29 | 2.2% |
| Self-Employed (Not Incorporated) | 0 | 0.0% |
| Not-for-profit Organizations | 47 | 3.5% |
| Local Government Employees | 149 | 11.1% |
| State Government Employees | 25 | 1.9% |
| Federal Government Employees | 0 | 0.0% |
| Unpaid Family Workers | 0 | 0.0% |
| Total | 1,337 | 100.0% |
Employment Status by Age in Farmersville
According to the labor force statistics for Farmersville, out of the total population over 16 years of age (2,905), 48.0% or 1,394 individuals are in the labor force, with 4.2% or 59 of them unemployed. The age group with the highest labor force participation rate is 30 to 34 years, with 100.0% or 246 individuals in the labor force. Within the labor force, the 65 to 74 years age range has the highest percentage of unemployed individuals, with 40.6% or 58 of them being unemployed.
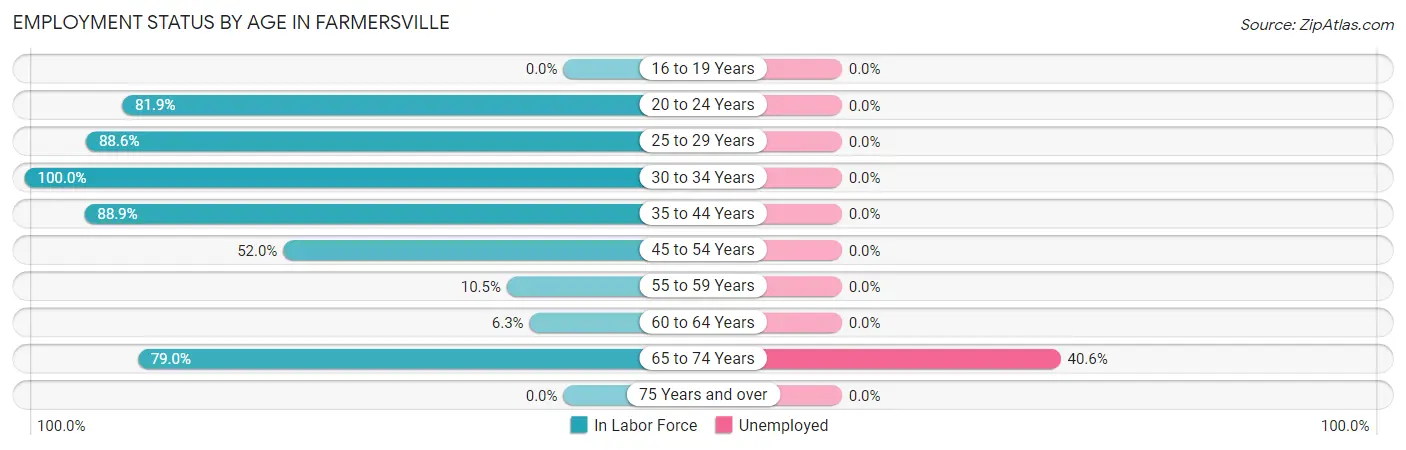
| Age Bracket | In Labor Force | Unemployed |
| 16 to 19 Years | 0 (0.0%) | 0 (0.0%) |
| 20 to 24 Years | 221 (81.9%) | 0 (0.0%) |
| 25 to 29 Years | 178 (88.6%) | 0 (0.0%) |
| 30 to 34 Years | 246 (100.0%) | 0 (0.0%) |
| 35 to 44 Years | 279 (88.9%) | 0 (0.0%) |
| 45 to 54 Years | 288 (52.0%) | 0 (0.0%) |
| 55 to 59 Years | 16 (10.5%) | 0 (0.0%) |
| 60 to 64 Years | 24 (6.3%) | 0 (0.0%) |
| 65 to 74 Years | 143 (79.0%) | 58 (40.6%) |
| 75 Years and over | 0 (0.0%) | 0 (0.0%) |
| Total | 1,394 (48.0%) | 59 (4.2%) |
Employment Status by Educational Attainment in Farmersville
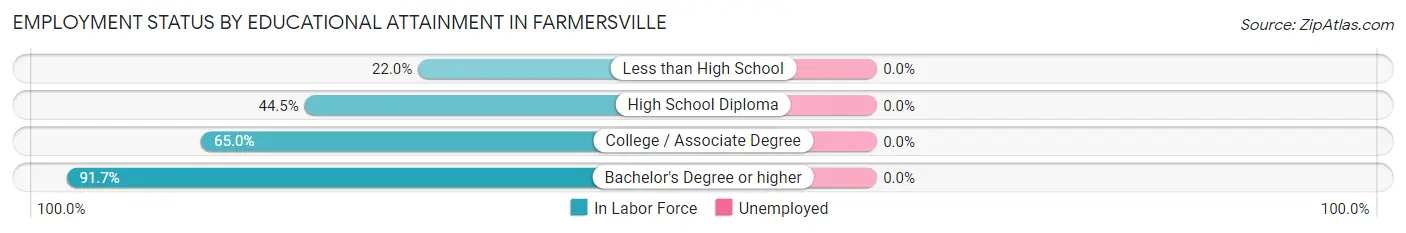
| Educational Attainment | In Labor Force | Unemployed |
| Less than High School | 57 (22.0%) | 0 (0.0%) |
| High School Diploma | 297 (44.5%) | 0 (0.0%) |
| College / Associate Degree | 401 (65.0%) | 0 (0.0%) |
| Bachelor's Degree or higher | 276 (91.7%) | 0 (0.0%) |
| Total | 1,031 (55.9%) | 0 (0.0%) |
Employment Occupations by Sex in Farmersville
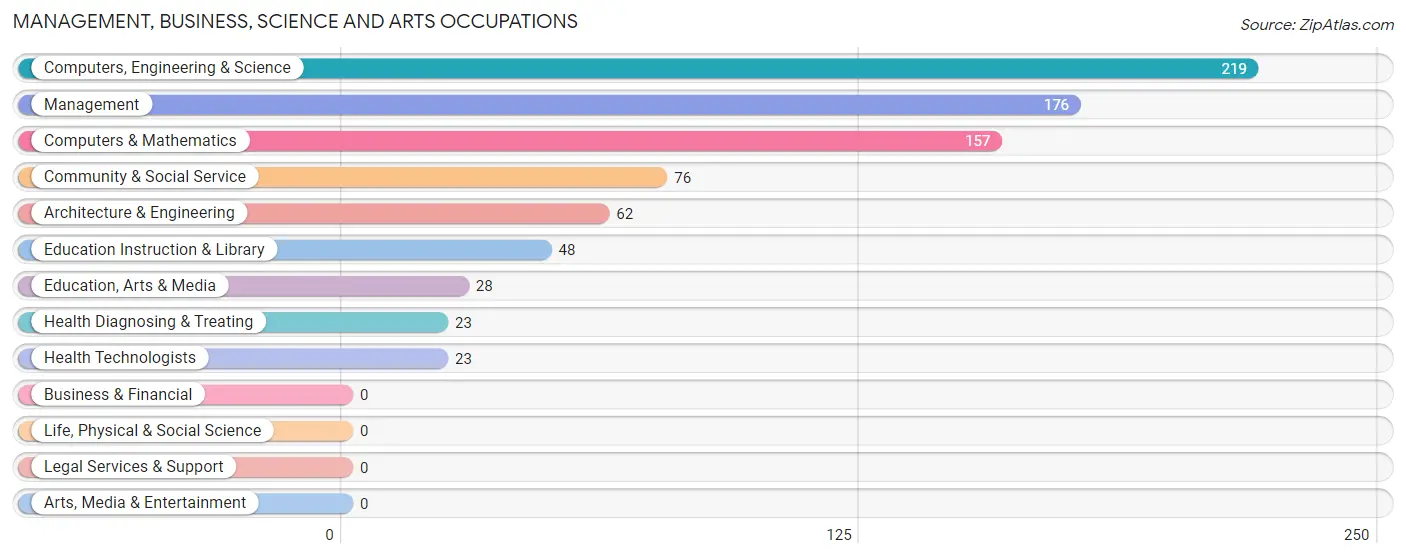
Management, Business, Science and Arts Occupations
The most common Management, Business, Science and Arts occupations in Farmersville are Computers, Engineering & Science (219 | 16.4%), Management (176 | 13.2%), Computers & Mathematics (157 | 11.7%), Community & Social Service (76 | 5.7%), and Architecture & Engineering (62 | 4.6%).
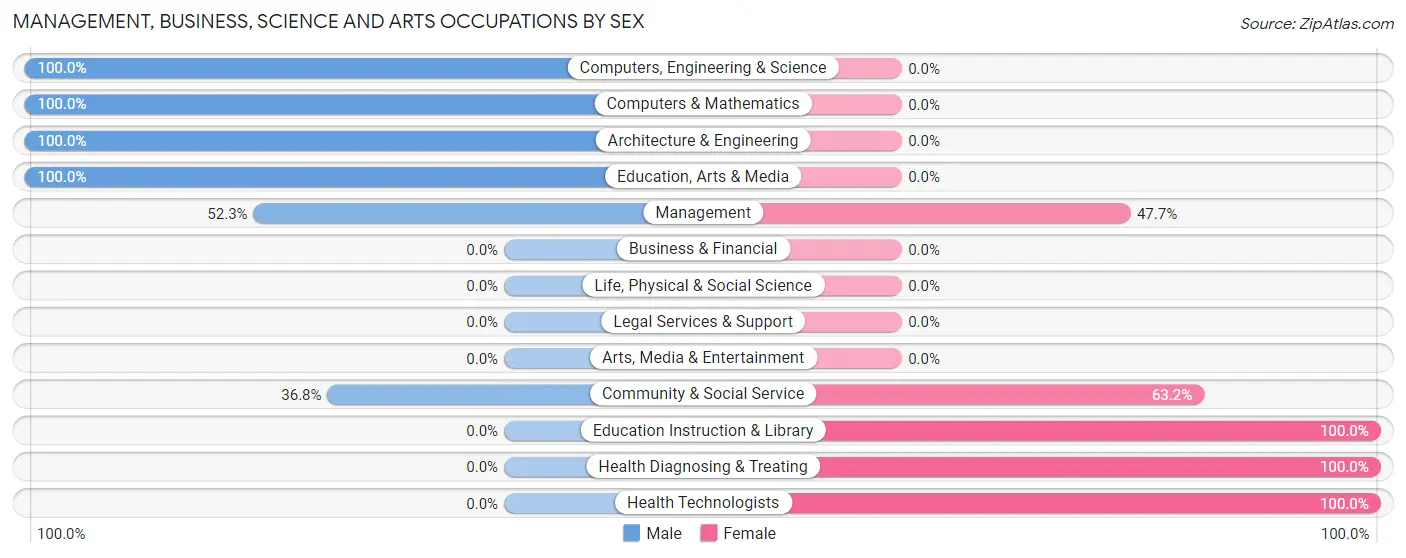
Management, Business, Science and Arts Occupations by Sex
Within the Management, Business, Science and Arts occupations in Farmersville, the most male-oriented occupations are Computers, Engineering & Science (100.0%), Computers & Mathematics (100.0%), and Architecture & Engineering (100.0%), while the most female-oriented occupations are Education Instruction & Library (100.0%), Health Diagnosing & Treating (100.0%), and Health Technologists (100.0%).
| Occupation | Male | Female |
| Management | 92 (52.3%) | 84 (47.7%) |
| Business & Financial | 0 (0.0%) | 0 (0.0%) |
| Computers, Engineering & Science | 219 (100.0%) | 0 (0.0%) |
| Computers & Mathematics | 157 (100.0%) | 0 (0.0%) |
| Architecture & Engineering | 62 (100.0%) | 0 (0.0%) |
| Life, Physical & Social Science | 0 (0.0%) | 0 (0.0%) |
| Community & Social Service | 28 (36.8%) | 48 (63.2%) |
| Education, Arts & Media | 28 (100.0%) | 0 (0.0%) |
| Legal Services & Support | 0 (0.0%) | 0 (0.0%) |
| Education Instruction & Library | 0 (0.0%) | 48 (100.0%) |
| Arts, Media & Entertainment | 0 (0.0%) | 0 (0.0%) |
| Health Diagnosing & Treating | 0 (0.0%) | 23 (100.0%) |
| Health Technologists | 0 (0.0%) | 23 (100.0%) |
| Total (Category) | 339 (68.6%) | 155 (31.4%) |
| Total (Overall) | 900 (67.3%) | 437 (32.7%) |
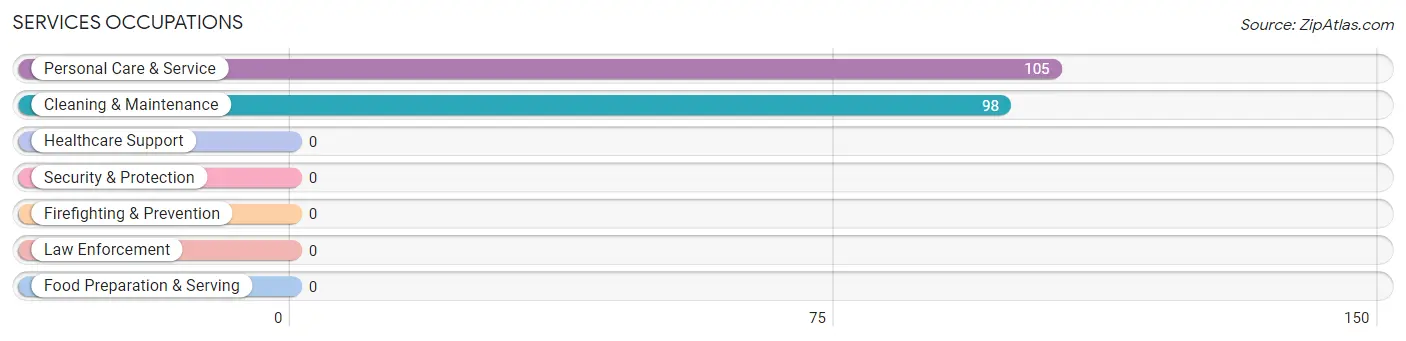
Services Occupations
The most common Services occupations in Farmersville are Personal Care & Service (105 | 7.9%), and Cleaning & Maintenance (98 | 7.3%).
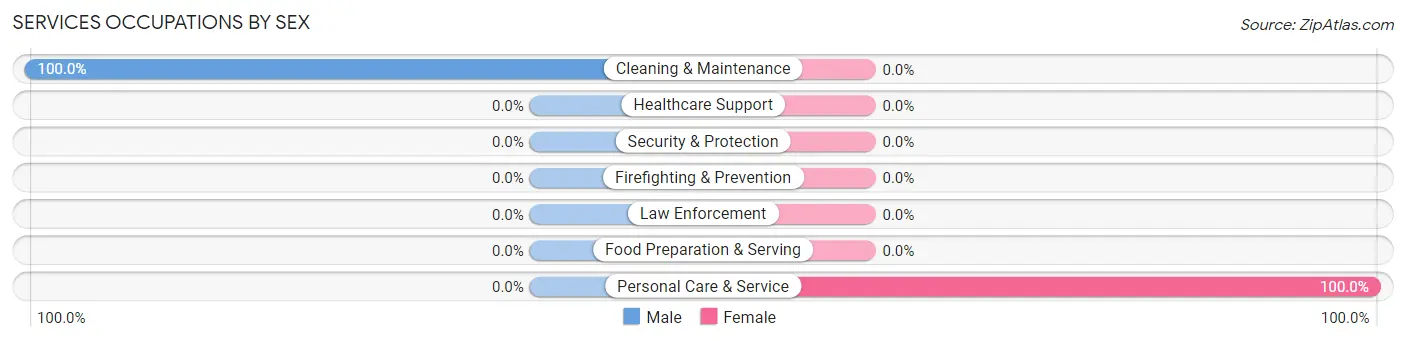
Services Occupations by Sex
| Occupation | Male | Female |
| Healthcare Support | 0 (0.0%) | 0 (0.0%) |
| Security & Protection | 0 (0.0%) | 0 (0.0%) |
| Firefighting & Prevention | 0 (0.0%) | 0 (0.0%) |
| Law Enforcement | 0 (0.0%) | 0 (0.0%) |
| Food Preparation & Serving | 0 (0.0%) | 0 (0.0%) |
| Cleaning & Maintenance | 98 (100.0%) | 0 (0.0%) |
| Personal Care & Service | 0 (0.0%) | 105 (100.0%) |
| Total (Category) | 98 (48.3%) | 105 (51.7%) |
| Total (Overall) | 900 (67.3%) | 437 (32.7%) |
Sales and Office Occupations
The most common Sales and Office occupations in Farmersville are Sales & Related (256 | 19.2%), and Office & Administration (87 | 6.5%).

Sales and Office Occupations by Sex

| Occupation | Male | Female |
| Sales & Related | 205 (80.1%) | 51 (19.9%) |
| Office & Administration | 50 (57.5%) | 37 (42.5%) |
| Total (Category) | 255 (74.3%) | 88 (25.7%) |
| Total (Overall) | 900 (67.3%) | 437 (32.7%) |
Natural Resources, Construction and Maintenance Occupations
The most common Natural Resources, Construction and Maintenance occupations in Farmersville are Construction & Extraction (77 | 5.8%), and Farming, Fishing & Forestry (25 | 1.9%).

Natural Resources, Construction and Maintenance Occupations by Sex

| Occupation | Male | Female |
| Farming, Fishing & Forestry | 25 (100.0%) | 0 (0.0%) |
| Construction & Extraction | 77 (100.0%) | 0 (0.0%) |
| Installation, Maintenance & Repair | 0 (0.0%) | 0 (0.0%) |
| Total (Category) | 102 (100.0%) | 0 (0.0%) |
| Total (Overall) | 900 (67.3%) | 437 (32.7%) |
Production, Transportation and Moving Occupations
The most common Production, Transportation and Moving occupations in Farmersville are Material Moving (106 | 7.9%), Production (73 | 5.5%), and Transportation (16 | 1.2%).
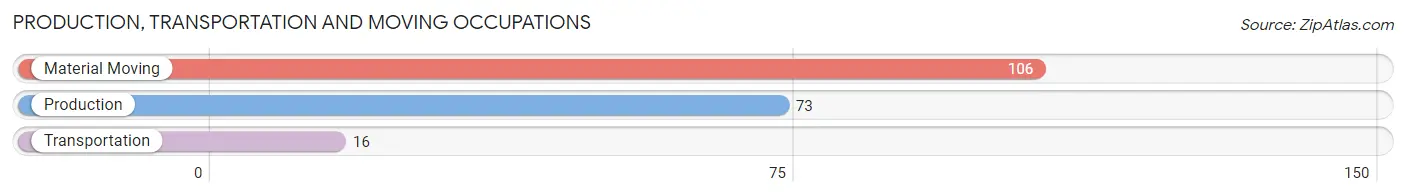
Production, Transportation and Moving Occupations by Sex

| Occupation | Male | Female |
| Production | 0 (0.0%) | 73 (100.0%) |
| Transportation | 0 (0.0%) | 16 (100.0%) |
| Material Moving | 106 (100.0%) | 0 (0.0%) |
| Total (Category) | 106 (54.4%) | 89 (45.6%) |
| Total (Overall) | 900 (67.3%) | 437 (32.7%) |
Employment Industries by Sex in Farmersville
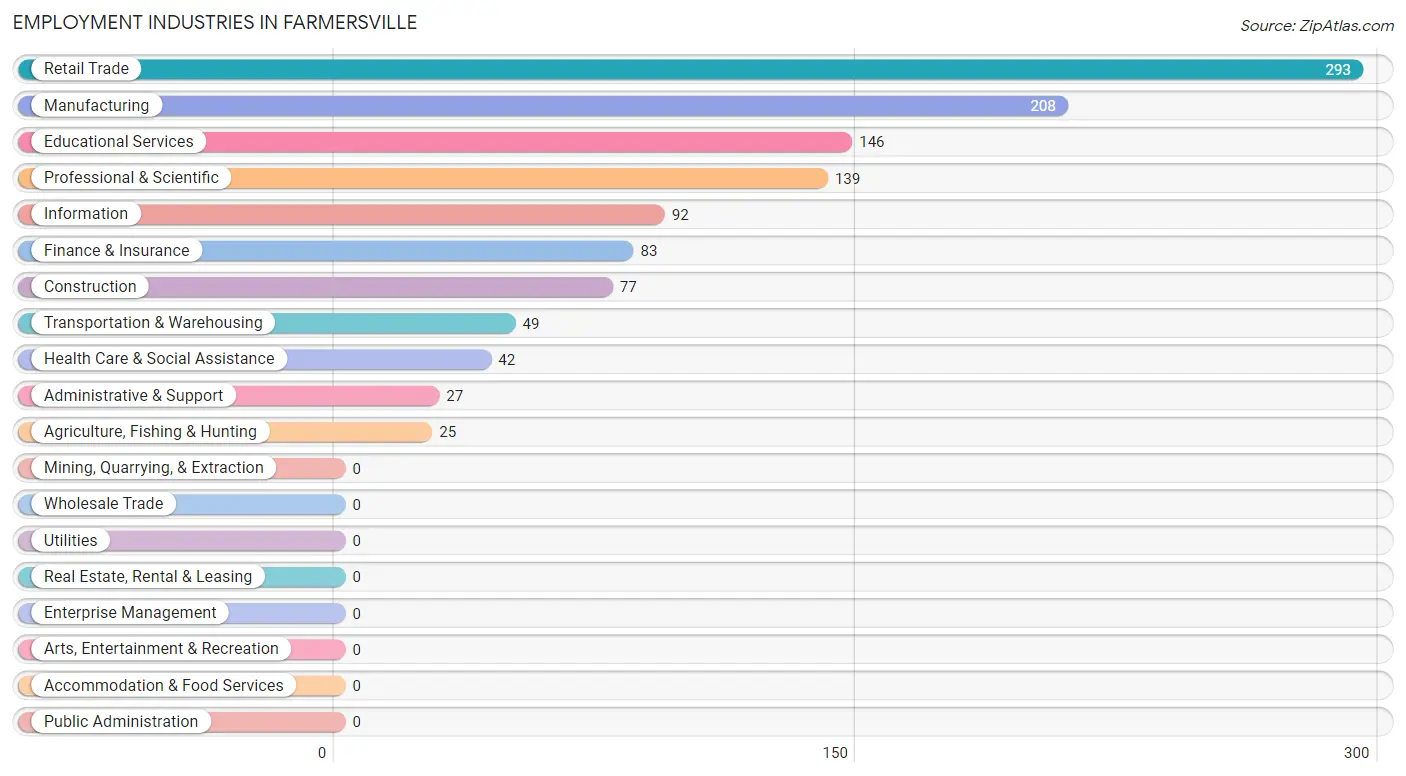
Employment Industries in Farmersville
The major employment industries in Farmersville include Retail Trade (293 | 21.9%), Manufacturing (208 | 15.6%), Educational Services (146 | 10.9%), Professional & Scientific (139 | 10.4%), and Information (92 | 6.9%).
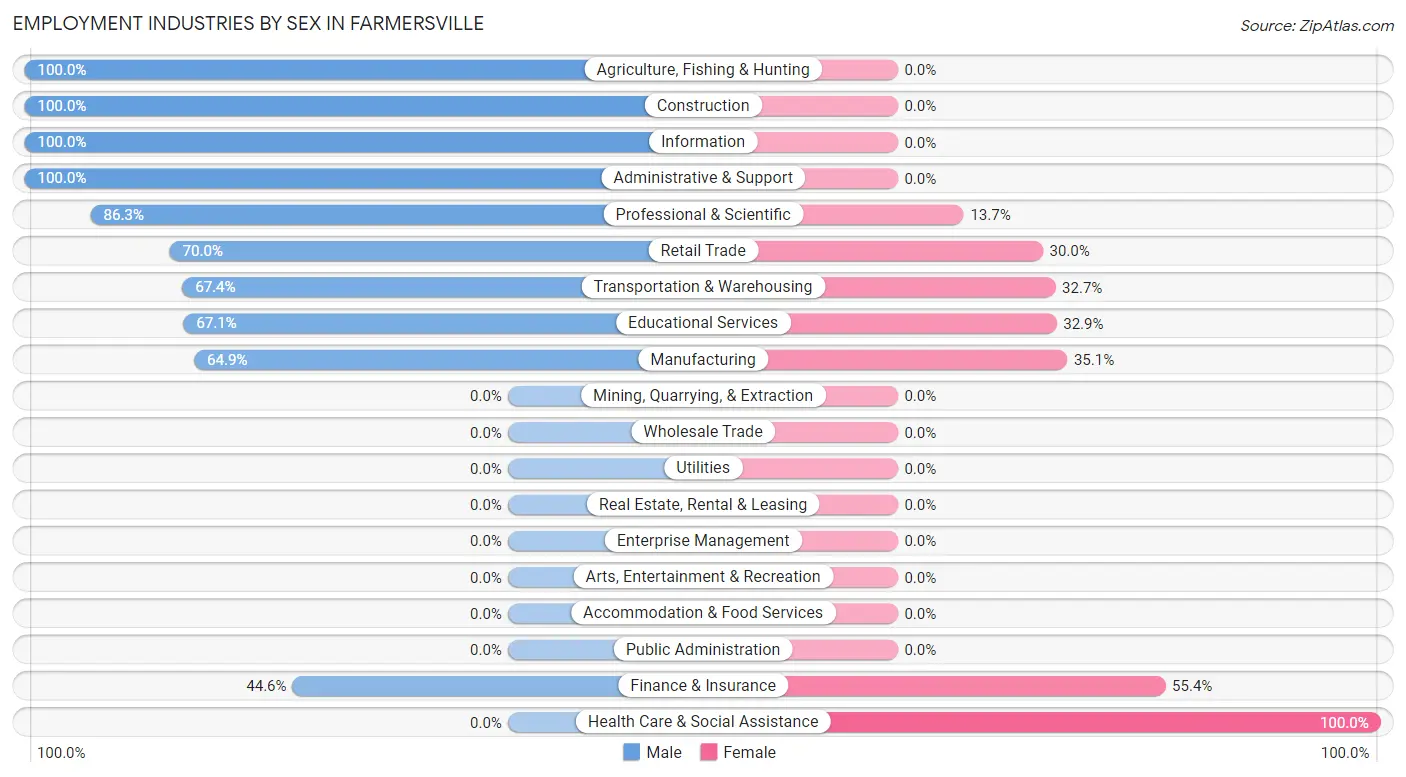
Employment Industries by Sex in Farmersville
The Farmersville industries that see more men than women are Agriculture, Fishing & Hunting (100.0%), Construction (100.0%), and Information (100.0%), whereas the industries that tend to have a higher number of women are Health Care & Social Assistance (100.0%), Finance & Insurance (55.4%), and Manufacturing (35.1%).
| Industry | Male | Female |
| Agriculture, Fishing & Hunting | 25 (100.0%) | 0 (0.0%) |
| Mining, Quarrying, & Extraction | 0 (0.0%) | 0 (0.0%) |
| Construction | 77 (100.0%) | 0 (0.0%) |
| Manufacturing | 135 (64.9%) | 73 (35.1%) |
| Wholesale Trade | 0 (0.0%) | 0 (0.0%) |
| Retail Trade | 205 (70.0%) | 88 (30.0%) |
| Transportation & Warehousing | 33 (67.3%) | 16 (32.7%) |
| Utilities | 0 (0.0%) | 0 (0.0%) |
| Information | 92 (100.0%) | 0 (0.0%) |
| Finance & Insurance | 37 (44.6%) | 46 (55.4%) |
| Real Estate, Rental & Leasing | 0 (0.0%) | 0 (0.0%) |
| Professional & Scientific | 120 (86.3%) | 19 (13.7%) |
| Enterprise Management | 0 (0.0%) | 0 (0.0%) |
| Administrative & Support | 27 (100.0%) | 0 (0.0%) |
| Educational Services | 98 (67.1%) | 48 (32.9%) |
| Health Care & Social Assistance | 0 (0.0%) | 42 (100.0%) |
| Arts, Entertainment & Recreation | 0 (0.0%) | 0 (0.0%) |
| Accommodation & Food Services | 0 (0.0%) | 0 (0.0%) |
| Public Administration | 0 (0.0%) | 0 (0.0%) |
| Total | 900 (67.3%) | 437 (32.7%) |
Education in Farmersville
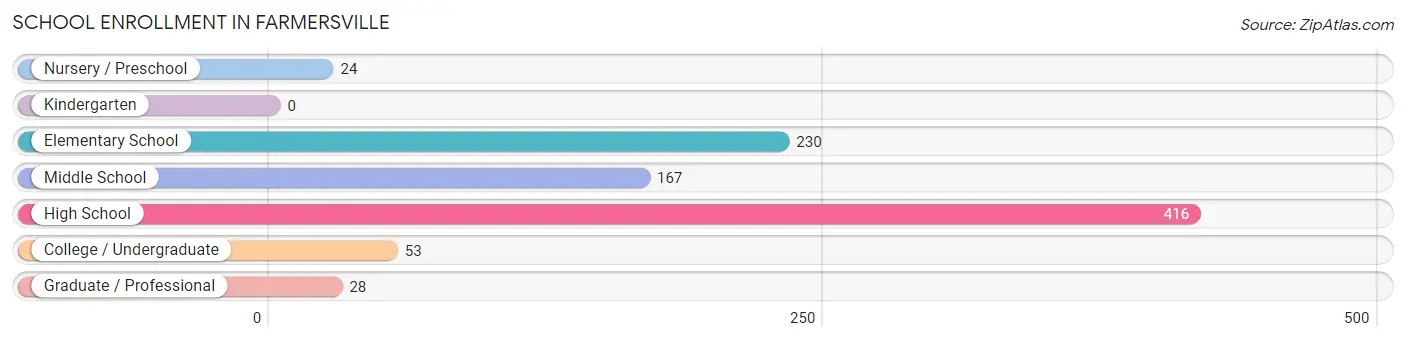
School Enrollment in Farmersville
The most common levels of schooling among the 918 students in Farmersville are high school (416 | 45.3%), elementary school (230 | 25.1%), and middle school (167 | 18.2%).
| School Level | # Students | % Students |
| Nursery / Preschool | 24 | 2.6% |
| Kindergarten | 0 | 0.0% |
| Elementary School | 230 | 25.1% |
| Middle School | 167 | 18.2% |
| High School | 416 | 45.3% |
| College / Undergraduate | 53 | 5.8% |
| Graduate / Professional | 28 | 3.0% |
| Total | 918 | 100.0% |
School Enrollment by Age by Funding Source in Farmersville
Out of a total of 918 students who are enrolled in schools in Farmersville, 28 (3.1%) attend a private institution, while the remaining 890 (96.9%) are enrolled in public schools. The age group of 35 years and over has the highest likelihood of being enrolled in private schools, with 28 (100.0% in the age bracket) enrolled. Conversely, the age group of 3 to 4 year olds has the lowest likelihood of being enrolled in a private school, with 24 (100.0% in the age bracket) attending a public institution.
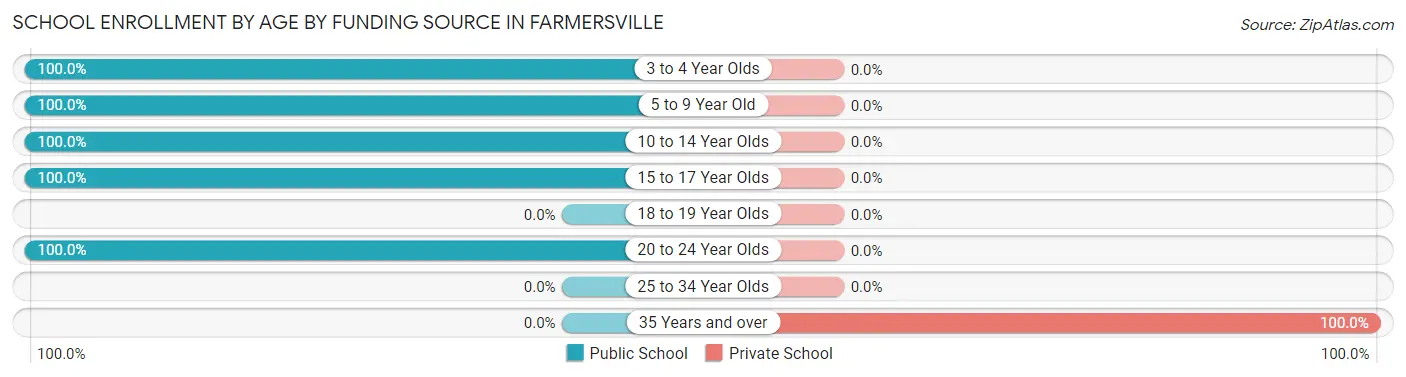
| Age Bracket | Public School | Private School |
| 3 to 4 Year Olds | 24 (100.0%) | 0 (0.0%) |
| 5 to 9 Year Old | 230 (100.0%) | 0 (0.0%) |
| 10 to 14 Year Olds | 229 (100.0%) | 0 (0.0%) |
| 15 to 17 Year Olds | 354 (100.0%) | 0 (0.0%) |
| 18 to 19 Year Olds | 0 (0.0%) | 0 (0.0%) |
| 20 to 24 Year Olds | 53 (100.0%) | 0 (0.0%) |
| 25 to 34 Year Olds | 0 (0.0%) | 0 (0.0%) |
| 35 Years and over | 0 (0.0%) | 28 (100.0%) |
| Total | 890 (96.9%) | 28 (3.1%) |
Educational Attainment by Field of Study in Farmersville
Computers & mathematics (120 | 31.0%), engineering (62 | 16.0%), science & technology (62 | 16.0%), business (49 | 12.7%), and psychology (28 | 7.2%) are the most common fields of study among 387 individuals in Farmersville who have obtained a bachelor's degree or higher.
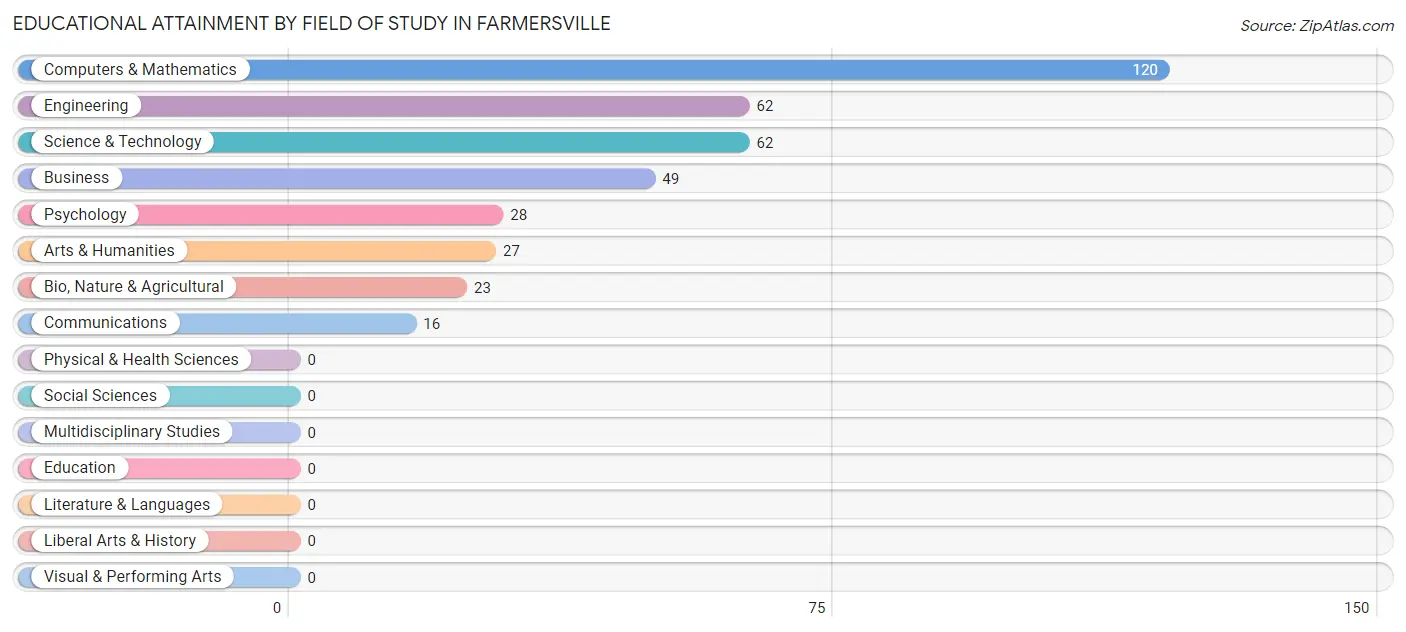
| Field of Study | # Graduates | % Graduates |
| Computers & Mathematics | 120 | 31.0% |
| Bio, Nature & Agricultural | 23 | 5.9% |
| Physical & Health Sciences | 0 | 0.0% |
| Psychology | 28 | 7.2% |
| Social Sciences | 0 | 0.0% |
| Engineering | 62 | 16.0% |
| Multidisciplinary Studies | 0 | 0.0% |
| Science & Technology | 62 | 16.0% |
| Business | 49 | 12.7% |
| Education | 0 | 0.0% |
| Literature & Languages | 0 | 0.0% |
| Liberal Arts & History | 0 | 0.0% |
| Visual & Performing Arts | 0 | 0.0% |
| Communications | 16 | 4.1% |
| Arts & Humanities | 27 | 7.0% |
| Total | 387 | 100.0% |
Transportation & Commute in Farmersville
Vehicle Availability by Sex in Farmersville
The most prevalent vehicle ownership categories in Farmersville are males with 2 vehicles (435, accounting for 48.3%) and females with 2 vehicles (128, making up 99.5%).
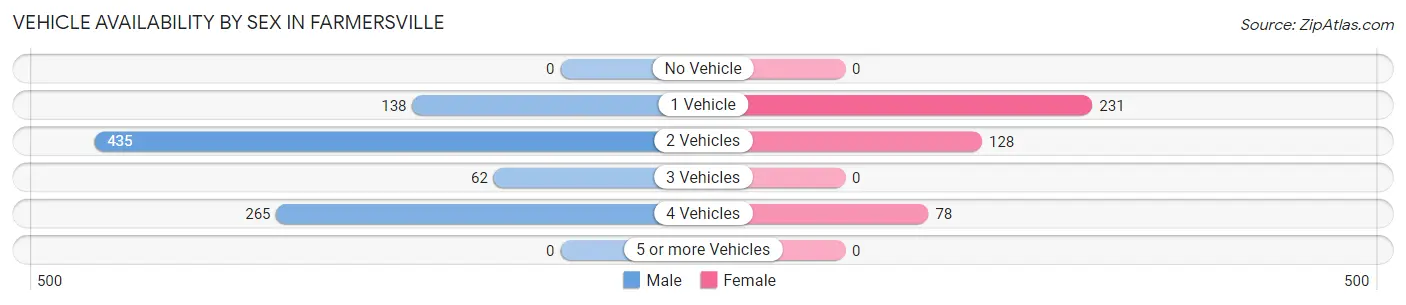
| Vehicles Available | Male | Female |
| No Vehicle | 0 (0.0%) | 0 (0.0%) |
| 1 Vehicle | 138 (15.3%) | 231 (52.9%) |
| 2 Vehicles | 435 (48.3%) | 128 (29.3%) |
| 3 Vehicles | 62 (6.9%) | 0 (0.0%) |
| 4 Vehicles | 265 (29.4%) | 78 (17.8%) |
| 5 or more Vehicles | 0 (0.0%) | 0 (0.0%) |
| Total | 900 (100.0%) | 437 (100.0%) |
Commute Time in Farmersville
The most frequently occuring commute durations in Farmersville are 30 to 34 minutes (362 commuters, 31.9%), 45 to 59 minutes (335 commuters, 29.5%), and 20 to 24 minutes (120 commuters, 10.6%).
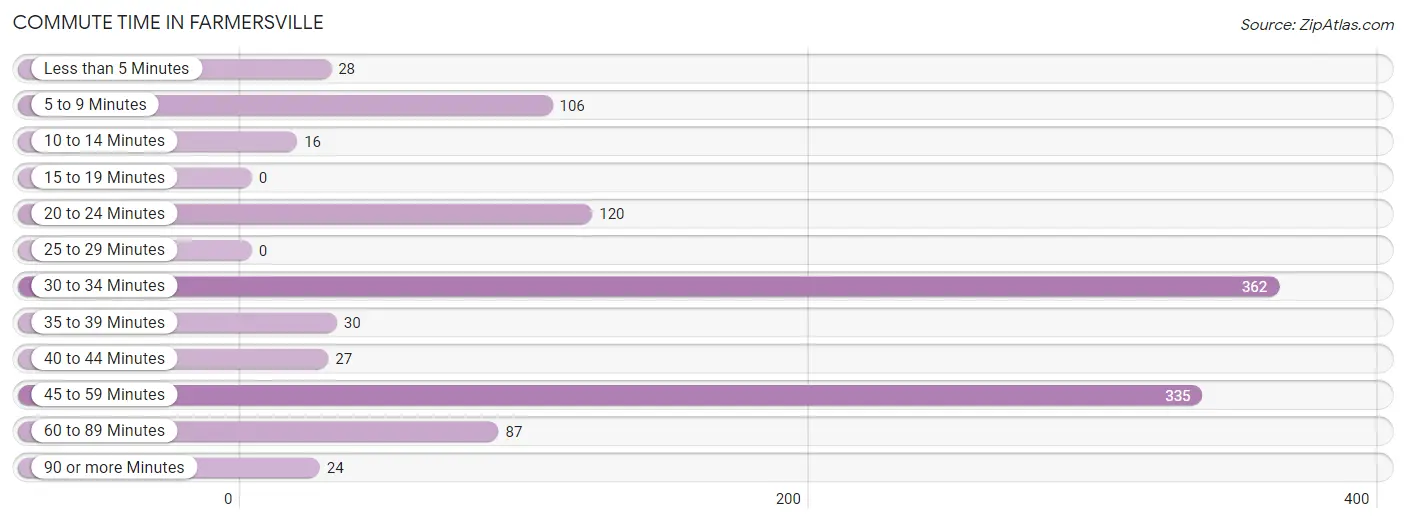
| Commute Time | # Commuters | % Commuters |
| Less than 5 Minutes | 28 | 2.5% |
| 5 to 9 Minutes | 106 | 9.3% |
| 10 to 14 Minutes | 16 | 1.4% |
| 15 to 19 Minutes | 0 | 0.0% |
| 20 to 24 Minutes | 120 | 10.6% |
| 25 to 29 Minutes | 0 | 0.0% |
| 30 to 34 Minutes | 362 | 31.9% |
| 35 to 39 Minutes | 30 | 2.6% |
| 40 to 44 Minutes | 27 | 2.4% |
| 45 to 59 Minutes | 335 | 29.5% |
| 60 to 89 Minutes | 87 | 7.7% |
| 90 or more Minutes | 24 | 2.1% |
Commute Time by Sex in Farmersville
The most common commute times in Farmersville are 30 to 34 minutes (225 commuters, 29.3%) for males and 45 to 59 minutes (156 commuters, 42.4%) for females.
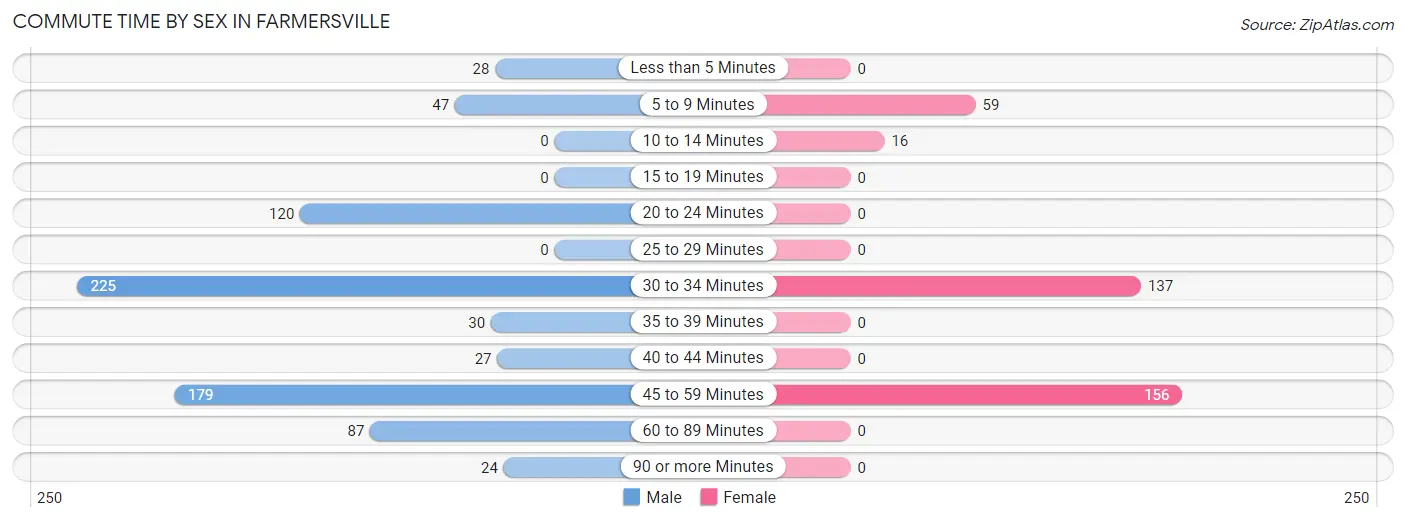
| Commute Time | Male | Female |
| Less than 5 Minutes | 28 (3.6%) | 0 (0.0%) |
| 5 to 9 Minutes | 47 (6.1%) | 59 (16.0%) |
| 10 to 14 Minutes | 0 (0.0%) | 16 (4.3%) |
| 15 to 19 Minutes | 0 (0.0%) | 0 (0.0%) |
| 20 to 24 Minutes | 120 (15.7%) | 0 (0.0%) |
| 25 to 29 Minutes | 0 (0.0%) | 0 (0.0%) |
| 30 to 34 Minutes | 225 (29.3%) | 137 (37.2%) |
| 35 to 39 Minutes | 30 (3.9%) | 0 (0.0%) |
| 40 to 44 Minutes | 27 (3.5%) | 0 (0.0%) |
| 45 to 59 Minutes | 179 (23.3%) | 156 (42.4%) |
| 60 to 89 Minutes | 87 (11.3%) | 0 (0.0%) |
| 90 or more Minutes | 24 (3.1%) | 0 (0.0%) |
Time of Departure to Work by Sex in Farmersville
The most frequent times of departure to work in Farmersville are 5:00 AM to 5:29 AM (238, 31.0%) for males and 7:00 AM to 7:29 AM (105, 28.5%) for females.
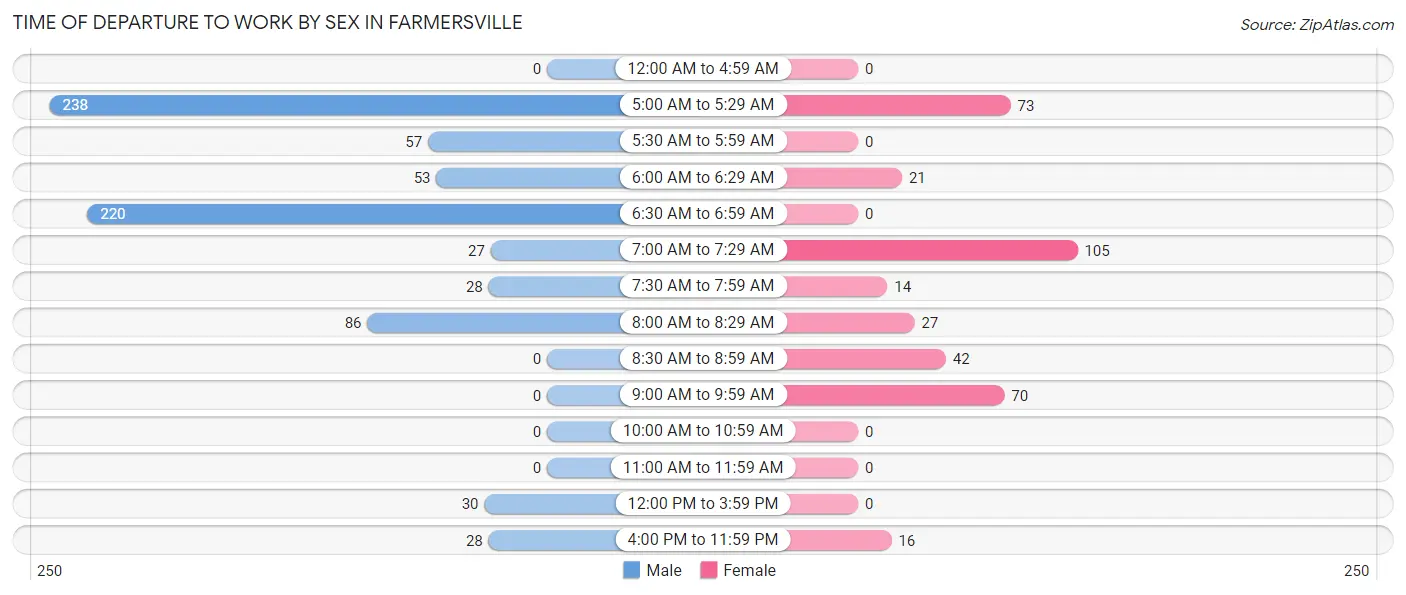
| Time of Departure | Male | Female |
| 12:00 AM to 4:59 AM | 0 (0.0%) | 0 (0.0%) |
| 5:00 AM to 5:29 AM | 238 (31.0%) | 73 (19.8%) |
| 5:30 AM to 5:59 AM | 57 (7.4%) | 0 (0.0%) |
| 6:00 AM to 6:29 AM | 53 (6.9%) | 21 (5.7%) |
| 6:30 AM to 6:59 AM | 220 (28.7%) | 0 (0.0%) |
| 7:00 AM to 7:29 AM | 27 (3.5%) | 105 (28.5%) |
| 7:30 AM to 7:59 AM | 28 (3.6%) | 14 (3.8%) |
| 8:00 AM to 8:29 AM | 86 (11.2%) | 27 (7.3%) |
| 8:30 AM to 8:59 AM | 0 (0.0%) | 42 (11.4%) |
| 9:00 AM to 9:59 AM | 0 (0.0%) | 70 (19.0%) |
| 10:00 AM to 10:59 AM | 0 (0.0%) | 0 (0.0%) |
| 11:00 AM to 11:59 AM | 0 (0.0%) | 0 (0.0%) |
| 12:00 PM to 3:59 PM | 30 (3.9%) | 0 (0.0%) |
| 4:00 PM to 11:59 PM | 28 (3.6%) | 16 (4.3%) |
| Total | 767 (100.0%) | 368 (100.0%) |
Housing Occupancy in Farmersville
Occupancy by Ownership in Farmersville
Of the total 1,422 dwellings in Farmersville, owner-occupied units account for 970 (68.2%), while renter-occupied units make up 452 (31.8%).
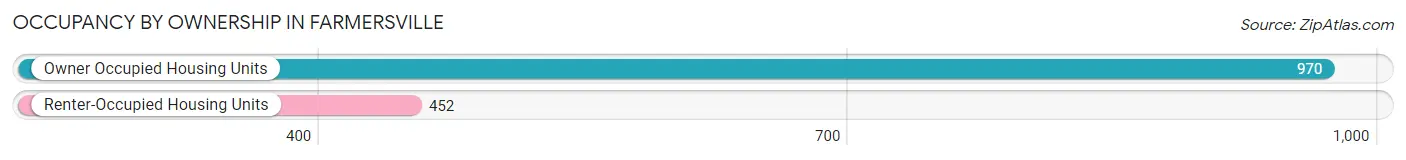
| Occupancy | # Housing Units | % Housing Units |
| Owner Occupied Housing Units | 970 | 68.2% |
| Renter-Occupied Housing Units | 452 | 31.8% |
| Total Occupied Housing Units | 1,422 | 100.0% |
Occupancy by Household Size in Farmersville
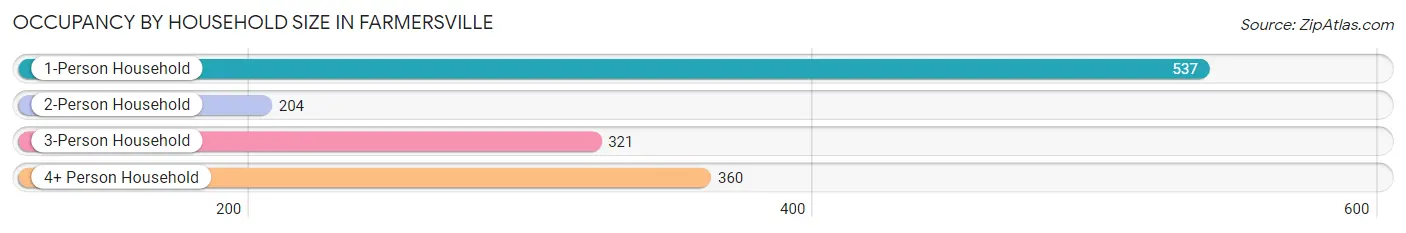
| Household Size | # Housing Units | % Housing Units |
| 1-Person Household | 537 | 37.8% |
| 2-Person Household | 204 | 14.3% |
| 3-Person Household | 321 | 22.6% |
| 4+ Person Household | 360 | 25.3% |
| Total Housing Units | 1,422 | 100.0% |
Occupancy by Ownership by Household Size in Farmersville
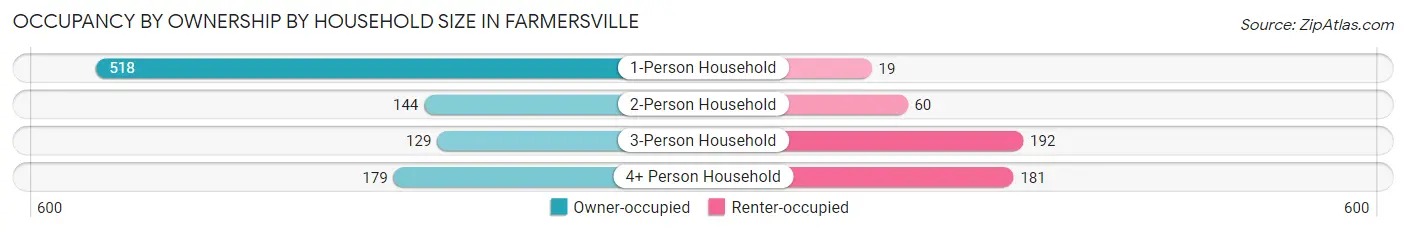
| Household Size | Owner-occupied | Renter-occupied |
| 1-Person Household | 518 (96.5%) | 19 (3.5%) |
| 2-Person Household | 144 (70.6%) | 60 (29.4%) |
| 3-Person Household | 129 (40.2%) | 192 (59.8%) |
| 4+ Person Household | 179 (49.7%) | 181 (50.3%) |
| Total Housing Units | 970 (68.2%) | 452 (31.8%) |
Occupancy by Educational Attainment in Farmersville
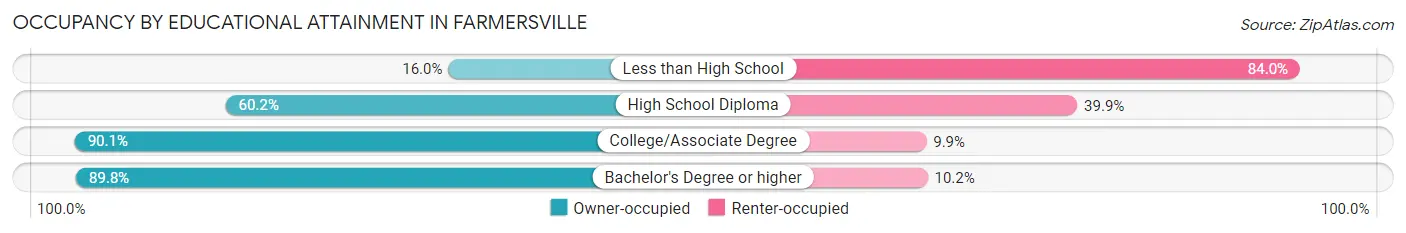
| Household Size | Owner-occupied | Renter-occupied |
| Less than High School | 24 (16.0%) | 126 (84.0%) |
| High School Diploma | 400 (60.2%) | 265 (39.9%) |
| College/Associate Degree | 299 (90.1%) | 33 (9.9%) |
| Bachelor's Degree or higher | 247 (89.8%) | 28 (10.2%) |
Occupancy by Age of Householder in Farmersville
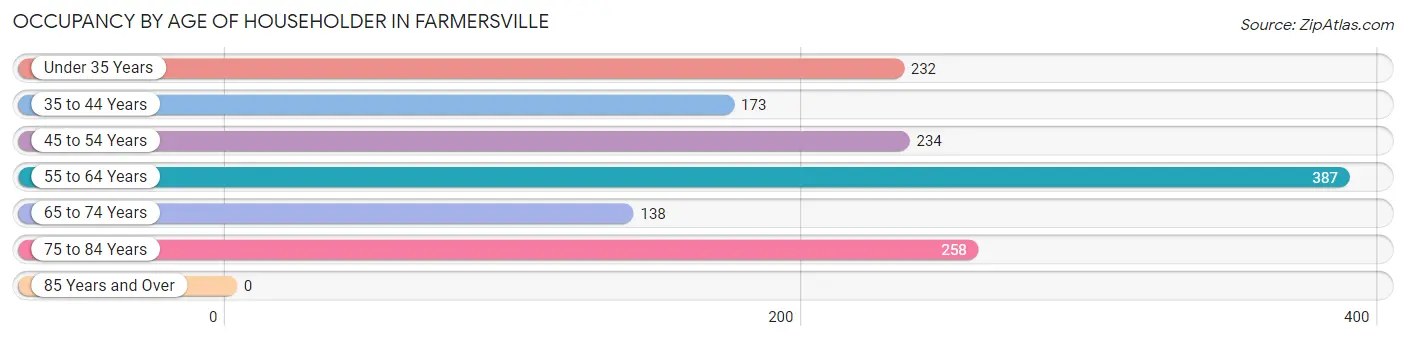
| Age Bracket | # Households | % Households |
| Under 35 Years | 232 | 16.3% |
| 35 to 44 Years | 173 | 12.2% |
| 45 to 54 Years | 234 | 16.5% |
| 55 to 64 Years | 387 | 27.2% |
| 65 to 74 Years | 138 | 9.7% |
| 75 to 84 Years | 258 | 18.1% |
| 85 Years and Over | 0 | 0.0% |
| Total | 1,422 | 100.0% |
Housing Finances in Farmersville
Median Income by Occupancy in Farmersville
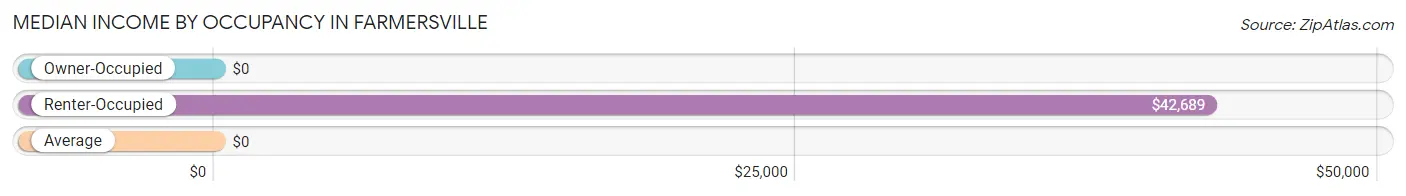
| Occupancy Type | # Households | Median Income |
| Owner-Occupied | 970 (68.2%) | $0 |
| Renter-Occupied | 452 (31.8%) | $42,689 |
| Average | 1,422 (100.0%) | $0 |
Occupancy by Householder Income Bracket in Farmersville
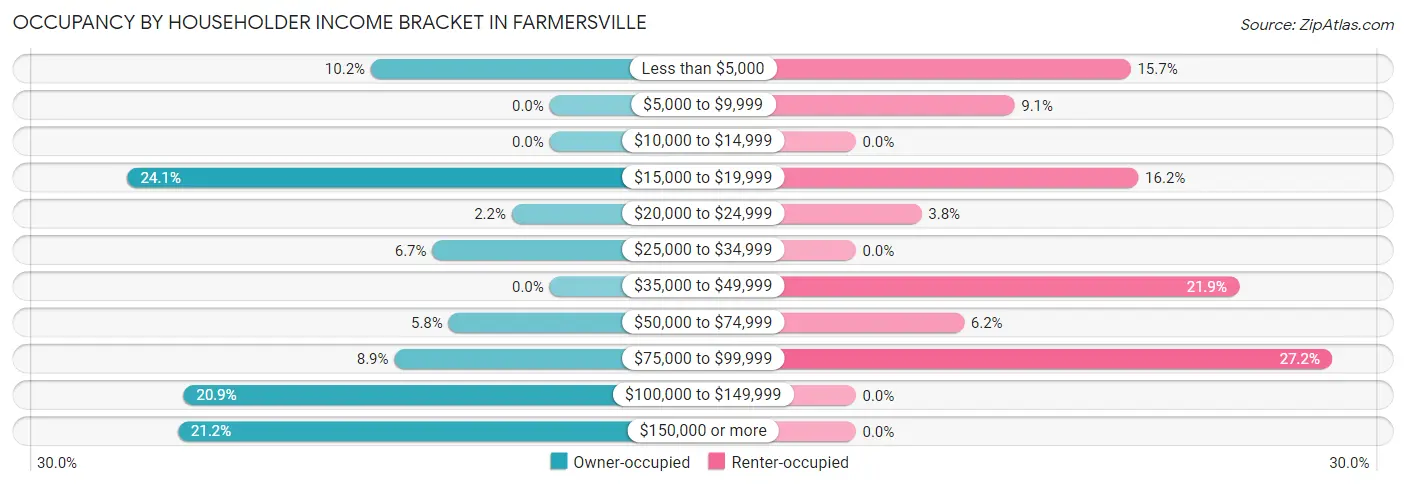
| Income Bracket | Owner-occupied | Renter-occupied |
| Less than $5,000 | 99 (10.2%) | 71 (15.7%) |
| $5,000 to $9,999 | 0 (0.0%) | 41 (9.1%) |
| $10,000 to $14,999 | 0 (0.0%) | 0 (0.0%) |
| $15,000 to $19,999 | 234 (24.1%) | 73 (16.2%) |
| $20,000 to $24,999 | 21 (2.2%) | 17 (3.8%) |
| $25,000 to $34,999 | 65 (6.7%) | 0 (0.0%) |
| $35,000 to $49,999 | 0 (0.0%) | 99 (21.9%) |
| $50,000 to $74,999 | 56 (5.8%) | 28 (6.2%) |
| $75,000 to $99,999 | 86 (8.9%) | 123 (27.2%) |
| $100,000 to $149,999 | 203 (20.9%) | 0 (0.0%) |
| $150,000 or more | 206 (21.2%) | 0 (0.0%) |
| Total | 970 (100.0%) | 452 (100.0%) |
Monthly Housing Cost Tiers in Farmersville
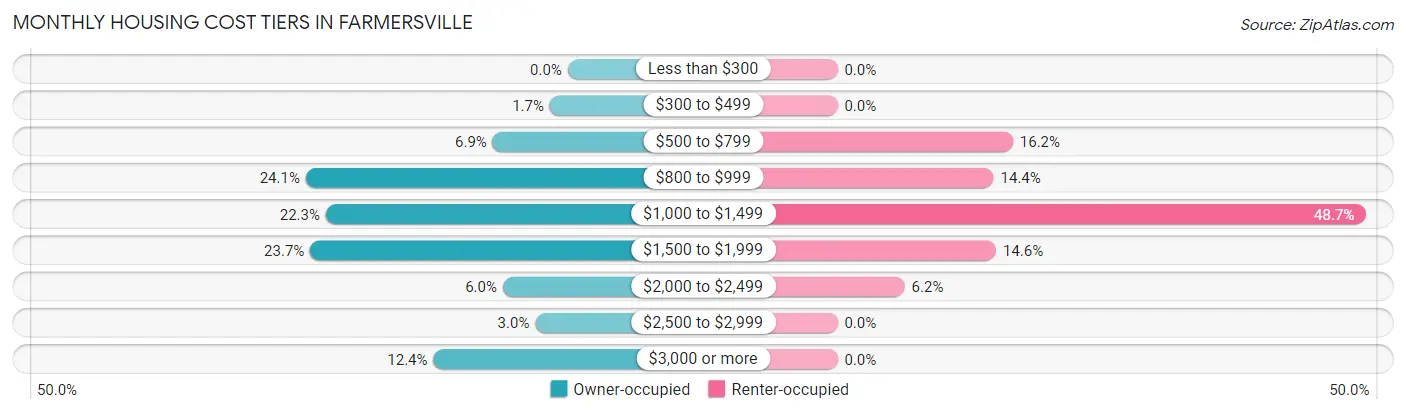
| Monthly Cost | Owner-occupied | Renter-occupied |
| Less than $300 | 0 (0.0%) | 0 (0.0%) |
| $300 to $499 | 16 (1.7%) | 0 (0.0%) |
| $500 to $799 | 67 (6.9%) | 73 (16.2%) |
| $800 to $999 | 234 (24.1%) | 65 (14.4%) |
| $1,000 to $1,499 | 216 (22.3%) | 220 (48.7%) |
| $1,500 to $1,999 | 230 (23.7%) | 66 (14.6%) |
| $2,000 to $2,499 | 58 (6.0%) | 28 (6.2%) |
| $2,500 to $2,999 | 29 (3.0%) | 0 (0.0%) |
| $3,000 or more | 120 (12.4%) | 0 (0.0%) |
| Total | 970 (100.0%) | 452 (100.0%) |
Physical Housing Characteristics in Farmersville
Housing Structures in Farmersville
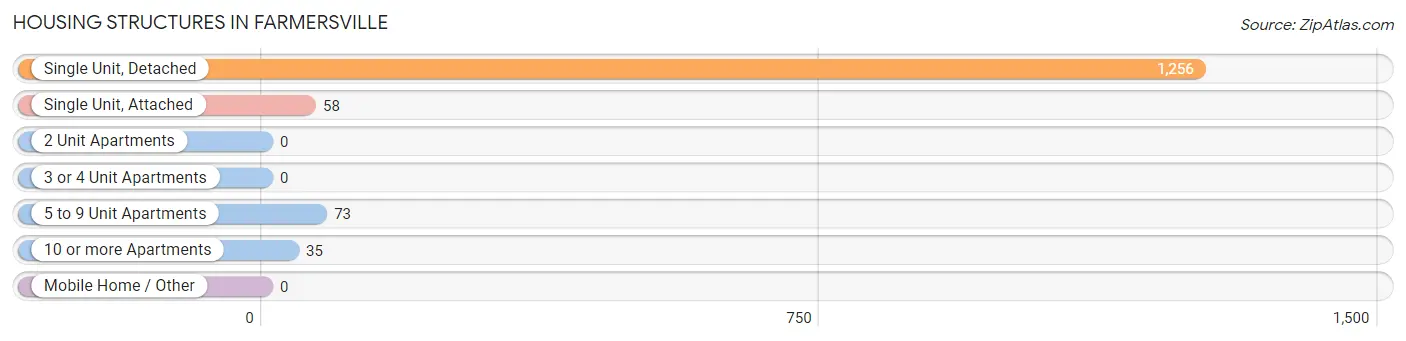
| Structure Type | # Housing Units | % Housing Units |
| Single Unit, Detached | 1,256 | 88.3% |
| Single Unit, Attached | 58 | 4.1% |
| 2 Unit Apartments | 0 | 0.0% |
| 3 or 4 Unit Apartments | 0 | 0.0% |
| 5 to 9 Unit Apartments | 73 | 5.1% |
| 10 or more Apartments | 35 | 2.5% |
| Mobile Home / Other | 0 | 0.0% |
| Total | 1,422 | 100.0% |
Housing Structures by Occupancy in Farmersville
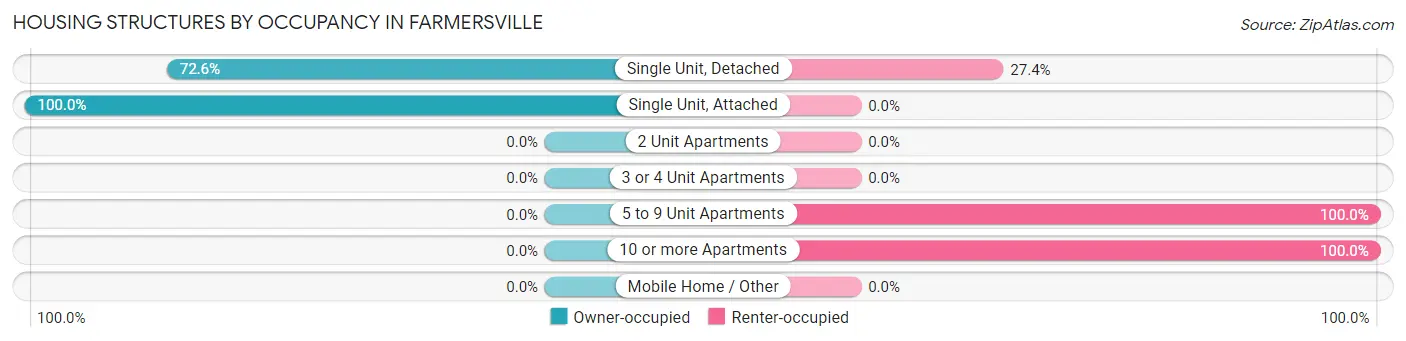
| Structure Type | Owner-occupied | Renter-occupied |
| Single Unit, Detached | 912 (72.6%) | 344 (27.4%) |
| Single Unit, Attached | 58 (100.0%) | 0 (0.0%) |
| 2 Unit Apartments | 0 (0.0%) | 0 (0.0%) |
| 3 or 4 Unit Apartments | 0 (0.0%) | 0 (0.0%) |
| 5 to 9 Unit Apartments | 0 (0.0%) | 73 (100.0%) |
| 10 or more Apartments | 0 (0.0%) | 35 (100.0%) |
| Mobile Home / Other | 0 (0.0%) | 0 (0.0%) |
| Total | 970 (68.2%) | 452 (31.8%) |
Housing Structures by Number of Rooms in Farmersville
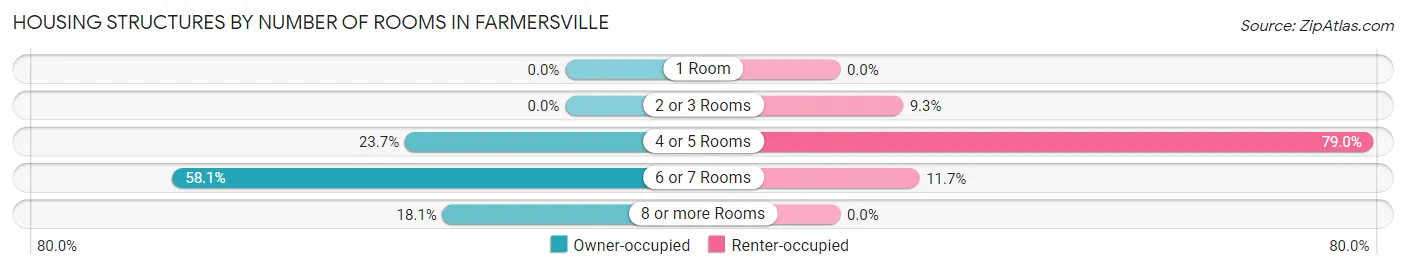
| Number of Rooms | Owner-occupied | Renter-occupied |
| 1 Room | 0 (0.0%) | 0 (0.0%) |
| 2 or 3 Rooms | 0 (0.0%) | 42 (9.3%) |
| 4 or 5 Rooms | 230 (23.7%) | 357 (79.0%) |
| 6 or 7 Rooms | 564 (58.1%) | 53 (11.7%) |
| 8 or more Rooms | 176 (18.1%) | 0 (0.0%) |
| Total | 970 (100.0%) | 452 (100.0%) |
Housing Structure by Heating Type in Farmersville
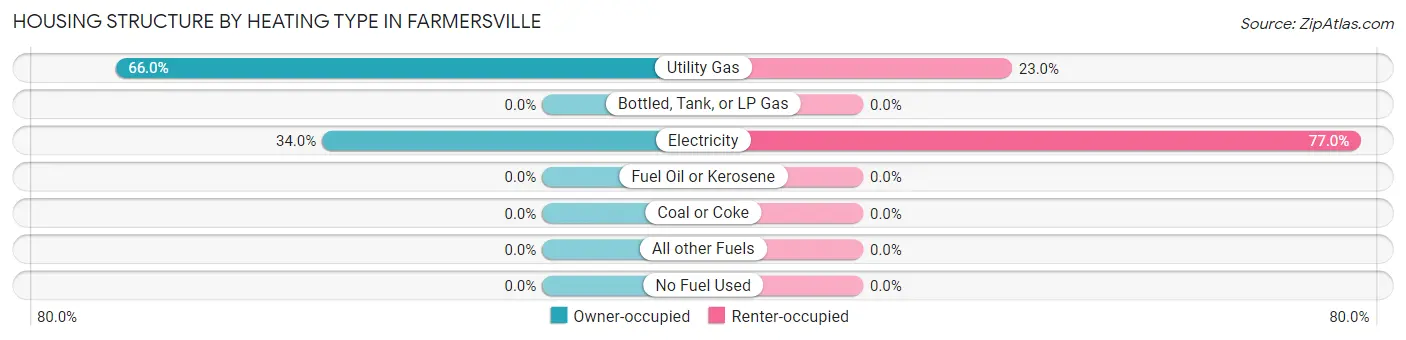
| Heating Type | Owner-occupied | Renter-occupied |
| Utility Gas | 640 (66.0%) | 104 (23.0%) |
| Bottled, Tank, or LP Gas | 0 (0.0%) | 0 (0.0%) |
| Electricity | 330 (34.0%) | 348 (77.0%) |
| Fuel Oil or Kerosene | 0 (0.0%) | 0 (0.0%) |
| Coal or Coke | 0 (0.0%) | 0 (0.0%) |
| All other Fuels | 0 (0.0%) | 0 (0.0%) |
| No Fuel Used | 0 (0.0%) | 0 (0.0%) |
| Total | 970 (100.0%) | 452 (100.0%) |
Household Vehicle Usage in Farmersville
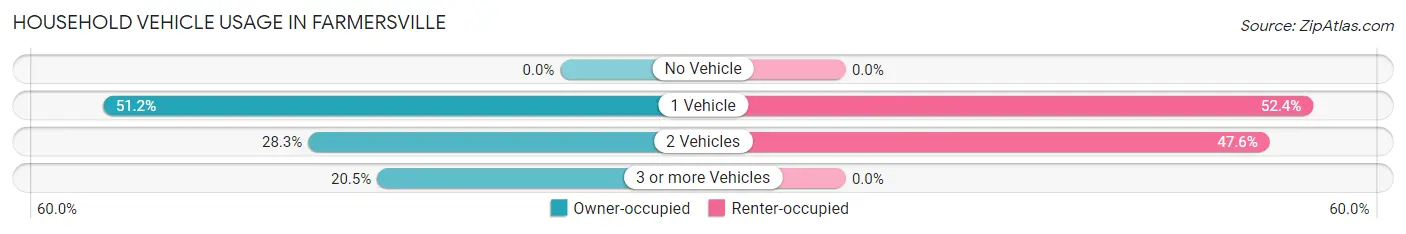
| Vehicles per Household | Owner-occupied | Renter-occupied |
| No Vehicle | 0 (0.0%) | 0 (0.0%) |
| 1 Vehicle | 497 (51.2%) | 237 (52.4%) |
| 2 Vehicles | 274 (28.2%) | 215 (47.6%) |
| 3 or more Vehicles | 199 (20.5%) | 0 (0.0%) |
| Total | 970 (100.0%) | 452 (100.0%) |
Real Estate & Mortgages in Farmersville
Real Estate and Mortgage Overview in Farmersville
| Characteristic | Without Mortgage | With Mortgage |
| Housing Units | 416 | 554 |
| Median Property Value | $276,700 | $221,500 |
| Median Household Income | $18,665 | $206 |
| Monthly Housing Costs | $853 | $120 |
| Real Estate Taxes | $5,938 | $0 |
Property Value by Mortgage Status in Farmersville
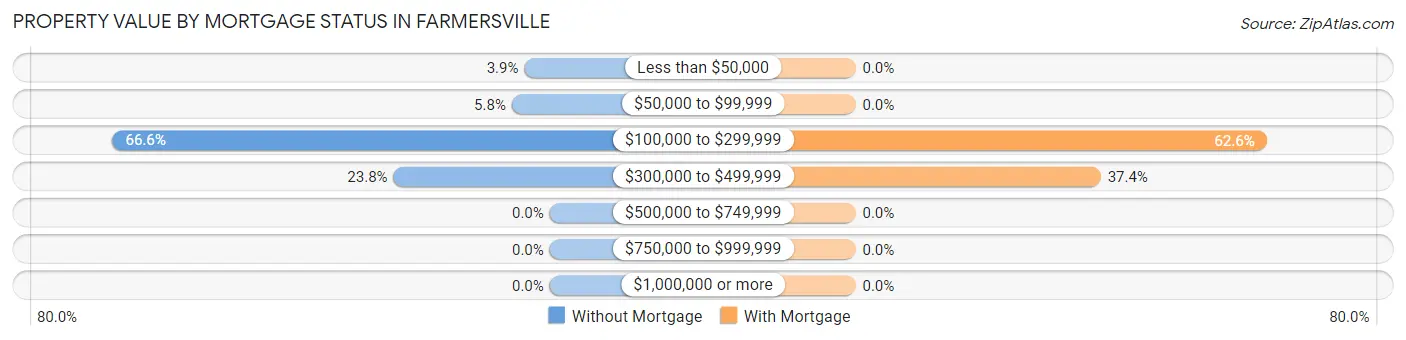
| Property Value | Without Mortgage | With Mortgage |
| Less than $50,000 | 16 (3.8%) | 0 (0.0%) |
| $50,000 to $99,999 | 24 (5.8%) | 0 (0.0%) |
| $100,000 to $299,999 | 277 (66.6%) | 347 (62.6%) |
| $300,000 to $499,999 | 99 (23.8%) | 207 (37.4%) |
| $500,000 to $749,999 | 0 (0.0%) | 0 (0.0%) |
| $750,000 to $999,999 | 0 (0.0%) | 0 (0.0%) |
| $1,000,000 or more | 0 (0.0%) | 0 (0.0%) |
| Total | 416 (100.0%) | 554 (100.0%) |
Household Income by Mortgage Status in Farmersville
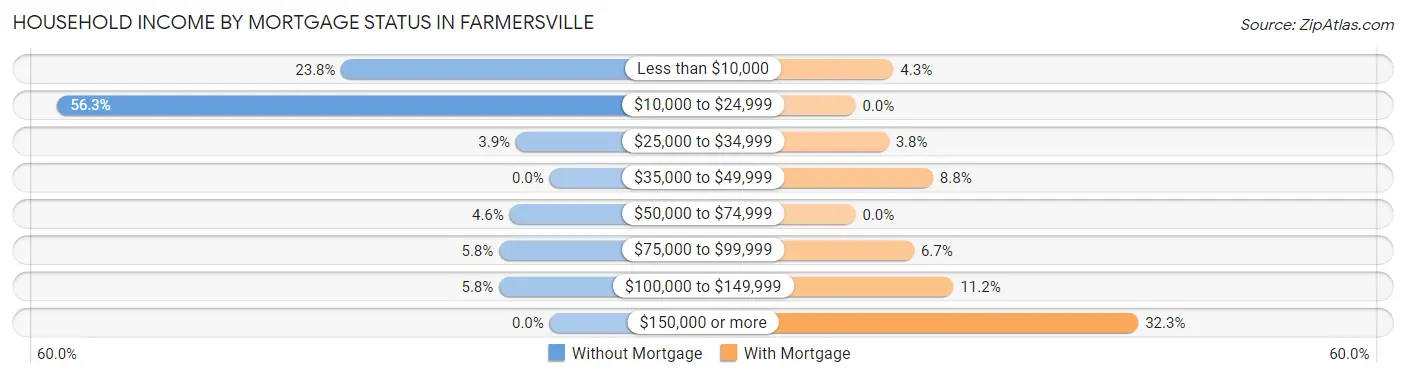
| Household Income | Without Mortgage | With Mortgage |
| Less than $10,000 | 99 (23.8%) | 24 (4.3%) |
| $10,000 to $24,999 | 234 (56.2%) | 0 (0.0%) |
| $25,000 to $34,999 | 16 (3.8%) | 21 (3.8%) |
| $35,000 to $49,999 | 0 (0.0%) | 49 (8.8%) |
| $50,000 to $74,999 | 19 (4.6%) | 0 (0.0%) |
| $75,000 to $99,999 | 24 (5.8%) | 37 (6.7%) |
| $100,000 to $149,999 | 24 (5.8%) | 62 (11.2%) |
| $150,000 or more | 0 (0.0%) | 179 (32.3%) |
| Total | 416 (100.0%) | 554 (100.0%) |
Property Value to Household Income Ratio in Farmersville
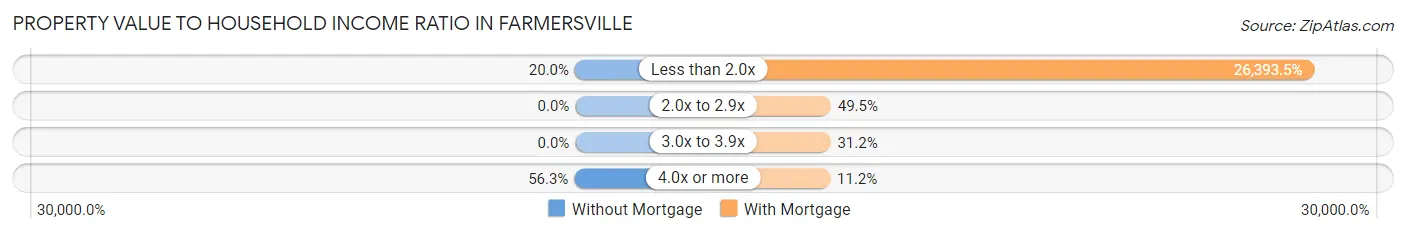
| Value-to-Income Ratio | Without Mortgage | With Mortgage |
| Less than 2.0x | 83 (20.0%) | 146,220 (26,393.5%) |
| 2.0x to 2.9x | 0 (0.0%) | 274 (49.5%) |
| 3.0x to 3.9x | 0 (0.0%) | 173 (31.2%) |
| 4.0x or more | 234 (56.2%) | 62 (11.2%) |
| Total | 416 (100.0%) | 554 (100.0%) |
Real Estate Taxes by Mortgage Status in Farmersville

| Property Taxes | Without Mortgage | With Mortgage |
| Less than $800 | 16 (3.8%) | 0 (0.0%) |
| $800 to $1,499 | 24 (5.8%) | 49 (8.8%) |
| $800 to $1,499 | 376 (90.4%) | 21 (3.8%) |
| Total | 416 (100.0%) | 554 (100.0%) |
Health & Disability in Farmersville
Health Insurance Coverage by Age in Farmersville
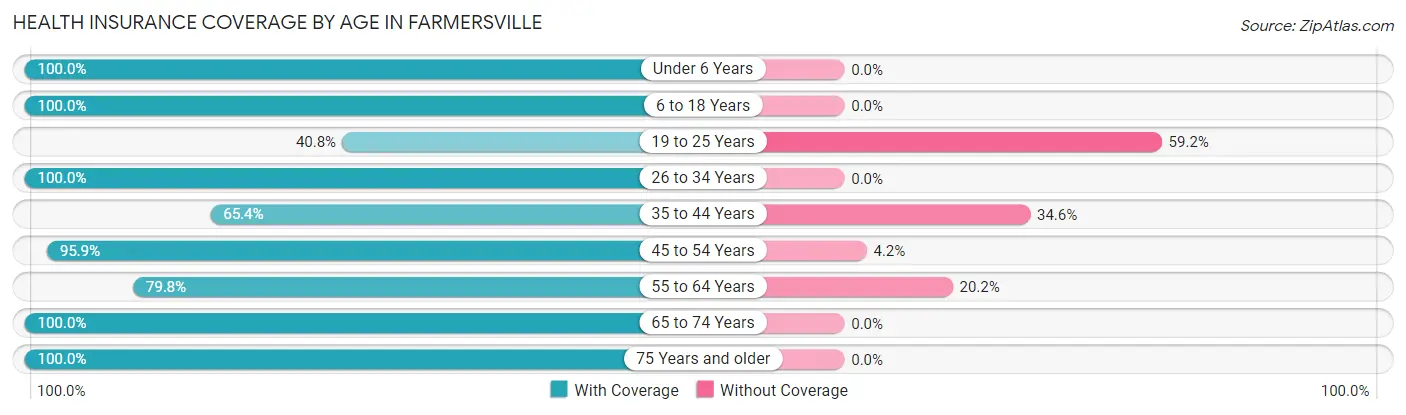
| Age Bracket | With Coverage | Without Coverage |
| Under 6 Years | 262 (100.0%) | 0 (0.0%) |
| 6 to 18 Years | 813 (100.0%) | 0 (0.0%) |
| 19 to 25 Years | 140 (40.8%) | 203 (59.2%) |
| 26 to 34 Years | 374 (100.0%) | 0 (0.0%) |
| 35 to 44 Years | 200 (65.4%) | 106 (34.6%) |
| 45 to 54 Years | 531 (95.9%) | 23 (4.2%) |
| 55 to 64 Years | 423 (79.8%) | 107 (20.2%) |
| 65 to 74 Years | 161 (100.0%) | 0 (0.0%) |
| 75 Years and older | 289 (100.0%) | 0 (0.0%) |
| Total | 3,193 (87.9%) | 439 (12.1%) |
Health Insurance Coverage by Citizenship Status in Farmersville

| Citizenship Status | With Coverage | Without Coverage |
| Native Born | 262 (100.0%) | 0 (0.0%) |
| Foreign Born, Citizen | 813 (100.0%) | 0 (0.0%) |
| Foreign Born, not a Citizen | 140 (40.8%) | 203 (59.2%) |
Health Insurance Coverage by Household Income in Farmersville
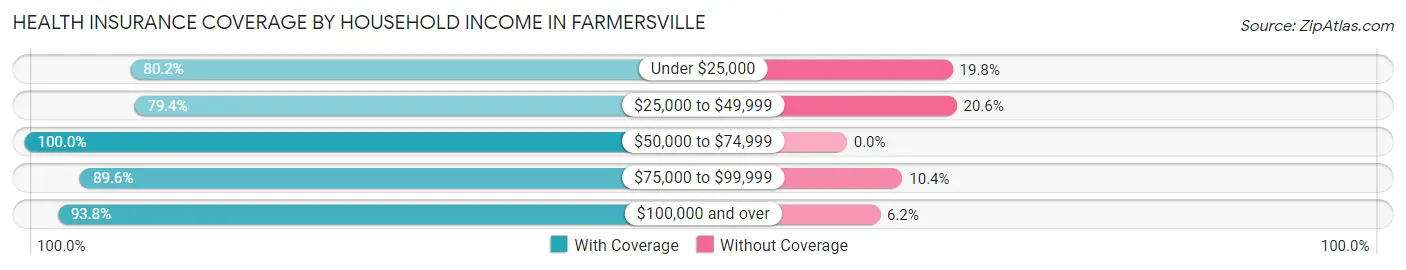
| Household Income | With Coverage | Without Coverage |
| Under $25,000 | 797 (80.2%) | 197 (19.8%) |
| $25,000 to $49,999 | 425 (79.4%) | 110 (20.6%) |
| $50,000 to $74,999 | 290 (100.0%) | 0 (0.0%) |
| $75,000 to $99,999 | 413 (89.6%) | 48 (10.4%) |
| $100,000 and over | 1,268 (93.8%) | 84 (6.2%) |
Public vs Private Health Insurance Coverage by Age in Farmersville
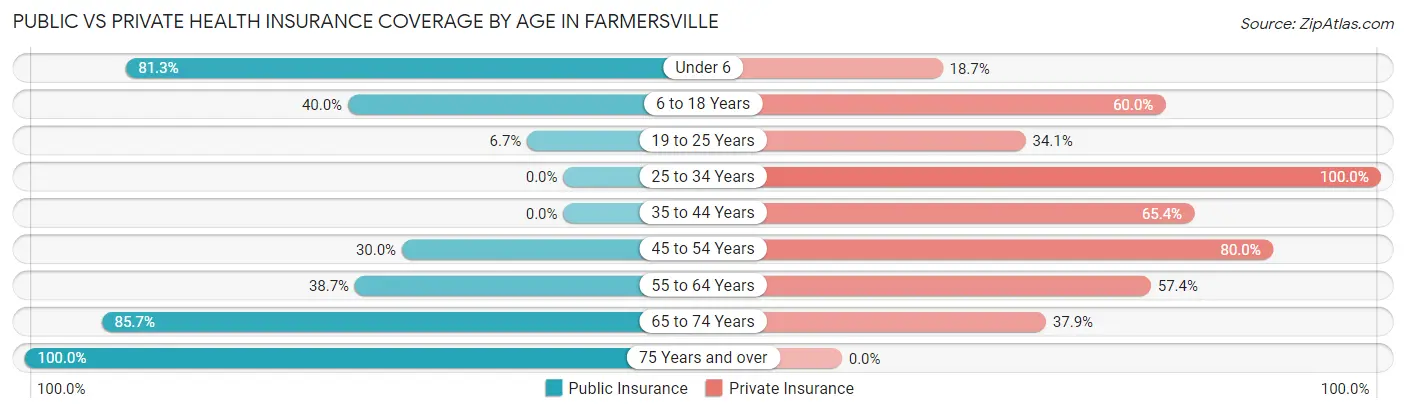
| Age Bracket | Public Insurance | Private Insurance |
| Under 6 | 213 (81.3%) | 49 (18.7%) |
| 6 to 18 Years | 325 (40.0%) | 488 (60.0%) |
| 19 to 25 Years | 23 (6.7%) | 117 (34.1%) |
| 25 to 34 Years | 0 (0.0%) | 374 (100.0%) |
| 35 to 44 Years | 0 (0.0%) | 200 (65.4%) |
| 45 to 54 Years | 166 (30.0%) | 443 (80.0%) |
| 55 to 64 Years | 205 (38.7%) | 304 (57.4%) |
| 65 to 74 Years | 138 (85.7%) | 61 (37.9%) |
| 75 Years and over | 289 (100.0%) | 0 (0.0%) |
| Total | 1,359 (37.4%) | 2,036 (56.1%) |
Disability Status by Sex by Age in Farmersville
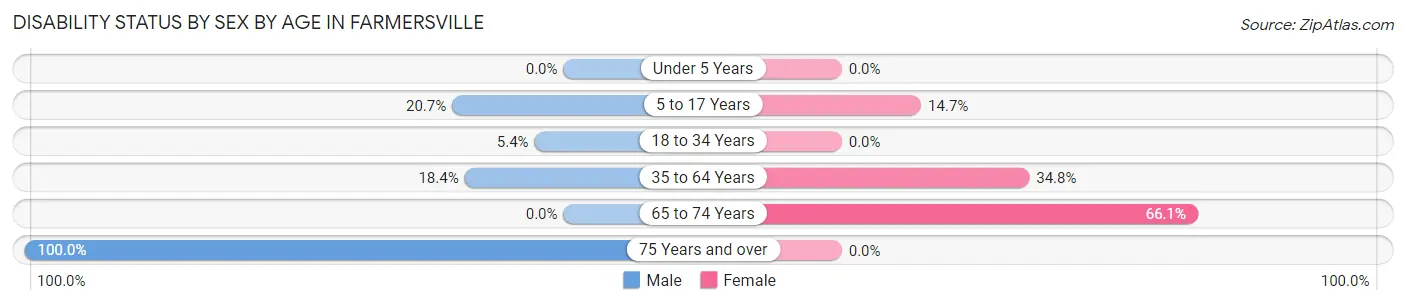
| Age Bracket | Male | Female |
| Under 5 Years | 0 (0.0%) | 0 (0.0%) |
| 5 to 17 Years | 88 (20.7%) | 57 (14.7%) |
| 18 to 34 Years | 23 (5.4%) | 0 (0.0%) |
| 35 to 64 Years | 127 (18.3%) | 243 (34.8%) |
| 65 to 74 Years | 0 (0.0%) | 37 (66.1%) |
| 75 Years and over | 24 (100.0%) | 0 (0.0%) |
Disability Class by Sex by Age in Farmersville
Disability Class: Hearing Difficulty
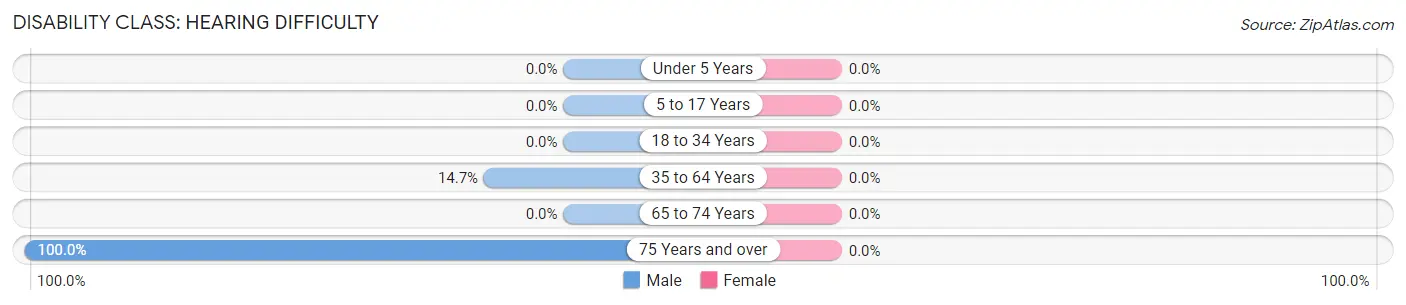
| Age Bracket | Male | Female |
| Under 5 Years | 0 (0.0%) | 0 (0.0%) |
| 5 to 17 Years | 0 (0.0%) | 0 (0.0%) |
| 18 to 34 Years | 0 (0.0%) | 0 (0.0%) |
| 35 to 64 Years | 102 (14.7%) | 0 (0.0%) |
| 65 to 74 Years | 0 (0.0%) | 0 (0.0%) |
| 75 Years and over | 24 (100.0%) | 0 (0.0%) |
Disability Class: Vision Difficulty
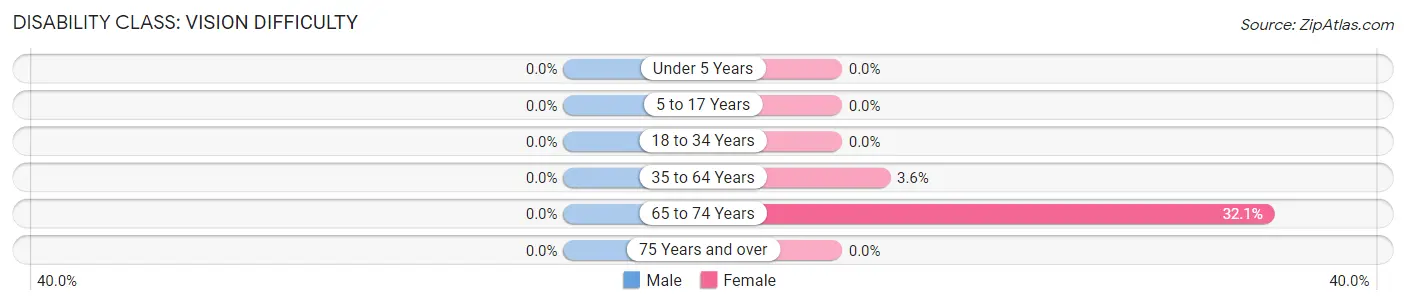
| Age Bracket | Male | Female |
| Under 5 Years | 0 (0.0%) | 0 (0.0%) |
| 5 to 17 Years | 0 (0.0%) | 0 (0.0%) |
| 18 to 34 Years | 0 (0.0%) | 0 (0.0%) |
| 35 to 64 Years | 0 (0.0%) | 25 (3.6%) |
| 65 to 74 Years | 0 (0.0%) | 18 (32.1%) |
| 75 Years and over | 0 (0.0%) | 0 (0.0%) |
Disability Class: Cognitive Difficulty
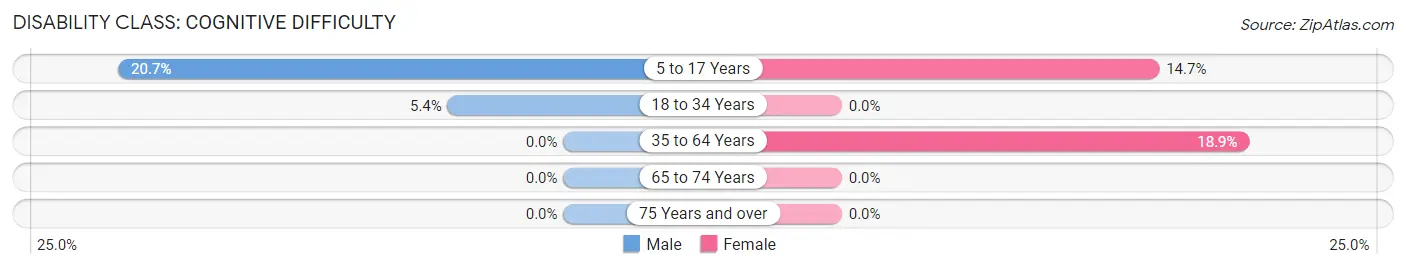
| Age Bracket | Male | Female |
| 5 to 17 Years | 88 (20.7%) | 57 (14.7%) |
| 18 to 34 Years | 23 (5.4%) | 0 (0.0%) |
| 35 to 64 Years | 0 (0.0%) | 132 (18.9%) |
| 65 to 74 Years | 0 (0.0%) | 0 (0.0%) |
| 75 Years and over | 0 (0.0%) | 0 (0.0%) |
Disability Class: Ambulatory Difficulty
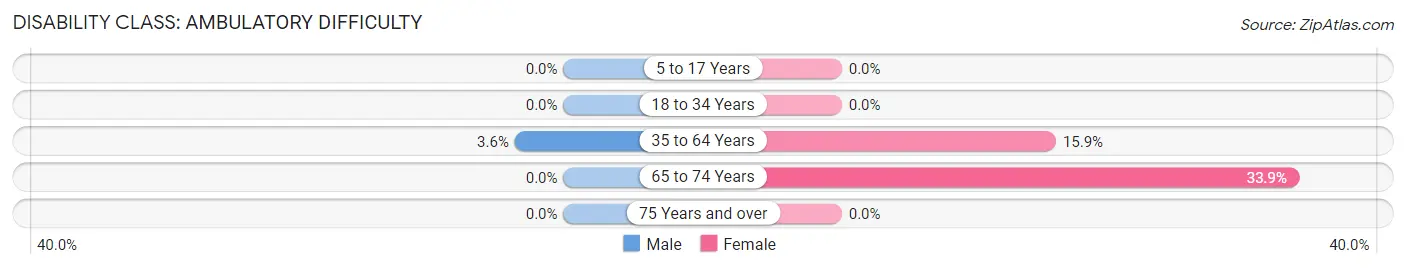
| Age Bracket | Male | Female |
| 5 to 17 Years | 0 (0.0%) | 0 (0.0%) |
| 18 to 34 Years | 0 (0.0%) | 0 (0.0%) |
| 35 to 64 Years | 25 (3.6%) | 111 (15.9%) |
| 65 to 74 Years | 0 (0.0%) | 19 (33.9%) |
| 75 Years and over | 0 (0.0%) | 0 (0.0%) |
Disability Class: Self-Care Difficulty
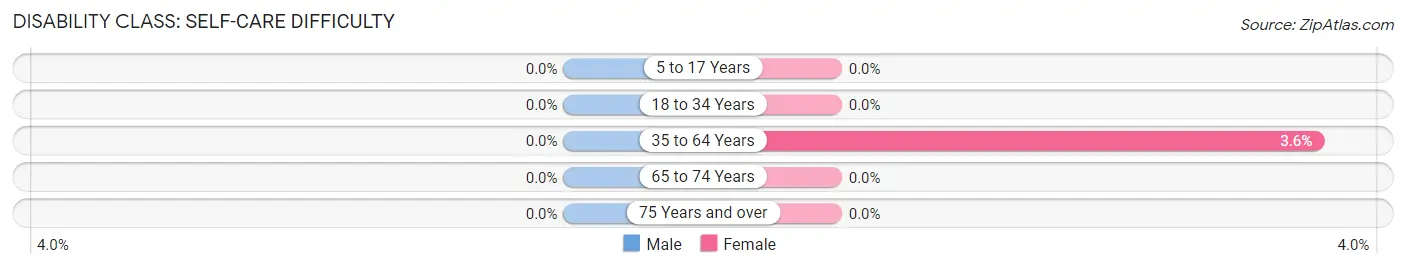
| Age Bracket | Male | Female |
| 5 to 17 Years | 0 (0.0%) | 0 (0.0%) |
| 18 to 34 Years | 0 (0.0%) | 0 (0.0%) |
| 35 to 64 Years | 0 (0.0%) | 25 (3.6%) |
| 65 to 74 Years | 0 (0.0%) | 0 (0.0%) |
| 75 Years and over | 0 (0.0%) | 0 (0.0%) |
Technology Access in Farmersville
Computing Device Access in Farmersville
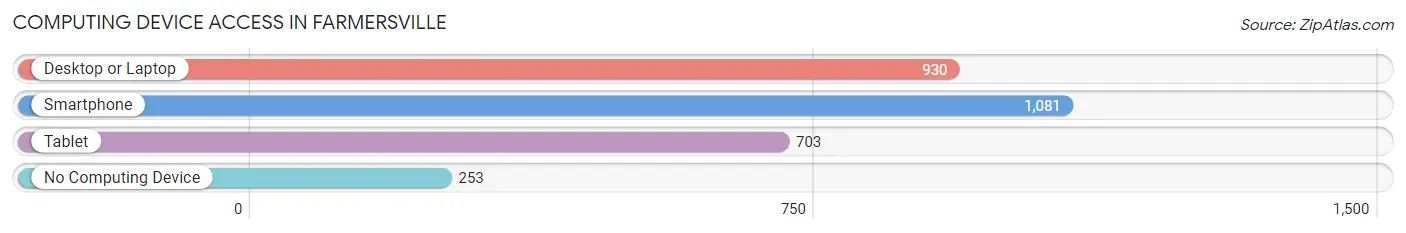
| Device Type | # Households | % Households |
| Desktop or Laptop | 930 | 65.4% |
| Smartphone | 1,081 | 76.0% |
| Tablet | 703 | 49.4% |
| No Computing Device | 253 | 17.8% |
| Total | 1,422 | 100.0% |
Internet Access in Farmersville
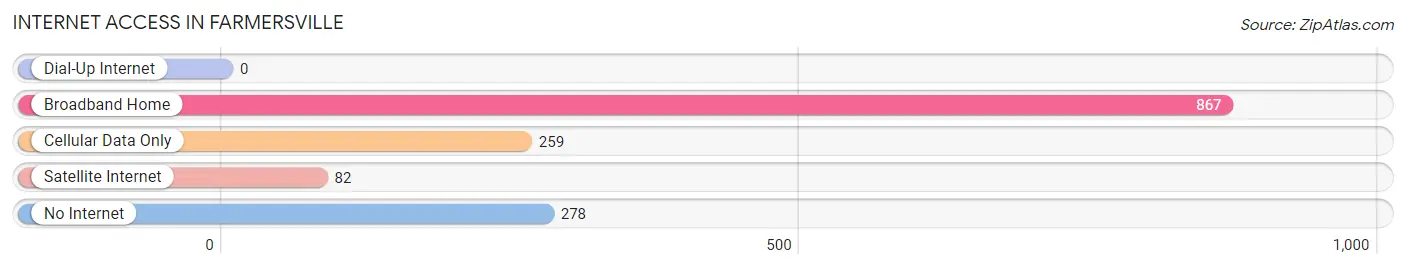
| Internet Type | # Households | % Households |
| Dial-Up Internet | 0 | 0.0% |
| Broadband Home | 867 | 61.0% |
| Cellular Data Only | 259 | 18.2% |
| Satellite Internet | 82 | 5.8% |
| No Internet | 278 | 19.6% |
| Total | 1,422 | 100.0% |
Farmersville Summary
Farmersville is a small town located in Collin County, Texas, United States. It is situated about 37 miles northeast of Dallas and is part of the Dallas-Fort Worth metropolitan area. The town has a population of 3,301 as of the 2010 census.
History
The area that is now Farmersville was first settled in the 1840s by a group of farmers from Kentucky. The town was officially founded in 1849 and was named after the farmers who settled there. The town was incorporated in 1873 and has remained a small, rural community ever since.
The town was an important stop on the Texas and Pacific Railway, which was built in 1876. This allowed the town to become a major shipping center for the surrounding area. The town also had a cotton gin, a grist mill, and a blacksmith shop.
In the early 1900s, Farmersville was a thriving agricultural center. The town was home to several cotton gins, a canning factory, and a creamery. The town also had a bank, a hotel, and several stores.
Geography
Farmersville is located at 33°10'45"N 96°20'45"W (33.179167, -96.345833). The town is situated in the northeast corner of Collin County, about 37 miles northeast of Dallas. The town is located on the banks of the East Fork of the Trinity River.
The town has a total area of 2.2 square miles, all of which is land. The town is located in a flat, open area with rolling hills in the surrounding area. The town is located in the Blackland Prairie region of Texas, which is known for its fertile soil and abundant wildlife.
Economy
The economy of Farmersville is largely based on agriculture. The town is home to several farms and ranches, which produce a variety of crops, including cotton, corn, wheat, and hay. The town also has several businesses, including a feed store, a hardware store, and a lumber yard.
The town is also home to several manufacturing companies, including a plastics factory and a metal fabrication plant. The town is also home to several retail stores, including a grocery store, a pharmacy, and a hardware store.
Demographics
As of the 2010 census, the town had a population of 3,301. The racial makeup of the town was 79.3% White, 11.2% Hispanic or Latino, 6.2% African American, 0.7% Native American, 0.3% Asian, and 2.5% from other races.
The median household income in the town was $37,917, and the median family income was $45,938. The per capita income in the town was $17,845. About 16.3% of the population was below the poverty line.
Conclusion
Farmersville is a small town located in Collin County, Texas, United States. It is situated about 37 miles northeast of Dallas and is part of the Dallas-Fort Worth metropolitan area. The town has a population of 3,301 as of the 2010 census. The town was founded in 1849 and has remained a small, rural community ever since. The economy of Farmersville is largely based on agriculture, with several farms and ranches producing a variety of crops. The town also has several businesses, including a feed store, a hardware store, and a lumber yard. The racial makeup of the town is 79.3% White, 11.2% Hispanic or Latino, 6.2% African American, 0.7% Native American, 0.3% Asian, and 2.5% from other races. The median household income in the town was $37,917, and the median family income was $45,938. About 16.3% of the population was below the poverty line.
Common Questions
What is Per Capita Income in Farmersville?
Per Capita income in Farmersville is $29,479.
What is the Median Family Income in Farmersville?
Median Family Income in Farmersville is $81,110.
What is Income or Wage Gap in Farmersville?
Income or Wage Gap in Farmersville is 69.1%.
Women in Farmersville earn 30.9 cents for every dollar earned by a man.
What is Inequality or Gini Index in Farmersville?
Inequality or Gini Index in Farmersville is 0.52.
What is the Total Population of Farmersville?
Total Population of Farmersville is 3,708.
What is the Total Male Population of Farmersville?
Total Male Population of Farmersville is 1,784.
What is the Total Female Population of Farmersville?
Total Female Population of Farmersville is 1,924.
What is the Ratio of Males per 100 Females in Farmersville?
There are 92.72 Males per 100 Females in Farmersville.
What is the Ratio of Females per 100 Males in Farmersville?
There are 107.85 Females per 100 Males in Farmersville.
What is the Median Population Age in Farmersville?
Median Population Age in Farmersville is 35.5 Years.
What is the Average Family Size in Farmersville
Average Family Size in Farmersville is 3.3 People.
What is the Average Household Size in Farmersville
Average Household Size in Farmersville is 2.5 People.
How Large is the Labor Force in Farmersville?
There are 1,394 People in the Labor Forcein in Farmersville.
What is the Percentage of People in the Labor Force in Farmersville?
48.0% of People are in the Labor Force in Farmersville.
What is the Unemployment Rate in Farmersville?
Unemployment Rate in Farmersville is 4.2%.