Emhouse, TX Map & Demographics
Emhouse Map
Emhouse Overview
$17,339
PER CAPITA INCOME
$47,500
AVG FAMILY INCOME
$46,000
AVG HOUSEHOLD INCOME
0.32
INEQUALITY / GINI INDEX
160
TOTAL POPULATION
81
MALE POPULATION
79
FEMALE POPULATION
102.53
MALES / 100 FEMALES
97.53
FEMALES / 100 MALES
31.5
MEDIAN AGE
4.0
AVG FAMILY SIZE
3.5
AVG HOUSEHOLD SIZE
78
LABOR FORCE [ PEOPLE ]
57.8%
PERCENT IN LABOR FORCE
Income in Emhouse
Income Overview in Emhouse
Per Capita Income in Emhouse is $17,339, while median incomes of families and households are $47,500 and $46,000 respectively.
| Characteristic | Number | Measure |
| Per Capita Income | 160 | $17,339 |
| Median Family Income | 34 | $47,500 |
| Mean Family Income | 34 | $62,703 |
| Median Household Income | 46 | $46,000 |
| Mean Household Income | 46 | $57,676 |
| Income Deficit | 34 | $0 |
| Wage / Income Gap (%) | 160 | 0.00% |
| Wage / Income Gap ($) | 160 | 100.00¢ per $1 |
| Gini / Inequality Index | 160 | 0.32 |
Earnings by Sex in Emhouse
| Sex | Number | Average Earnings |
| Male | 47 (58.8%) | $0 |
| Female | 33 (41.2%) | $0 |
| Total | 80 (100.0%) | $0 |
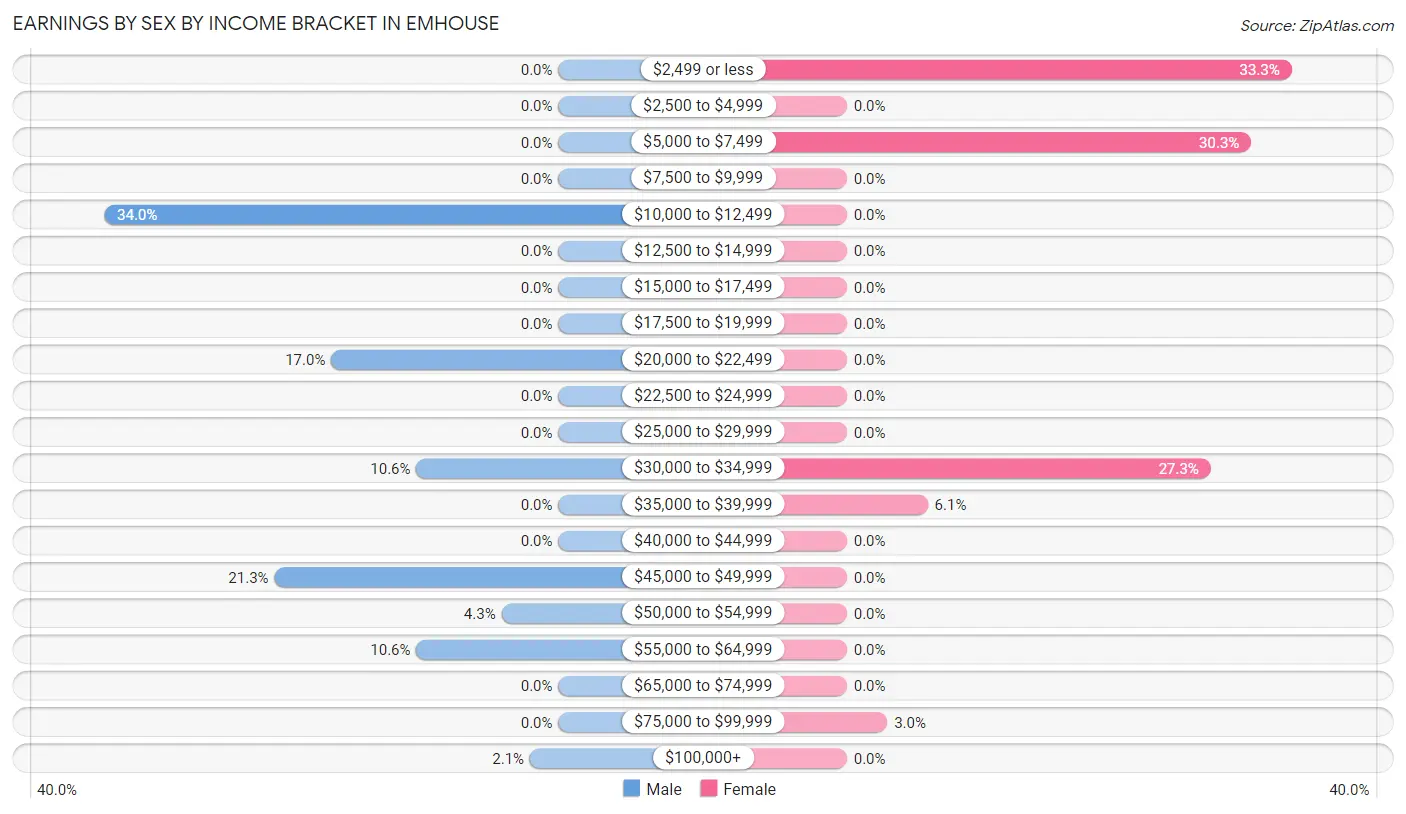
Earnings by Sex by Income Bracket in Emhouse
The most common earnings brackets in Emhouse are $10,000 to $12,499 for men (16 | 34.0%) and $2,499 or less for women (11 | 33.3%).
| Income | Male | Female |
| $2,499 or less | 0 (0.0%) | 11 (33.3%) |
| $2,500 to $4,999 | 0 (0.0%) | 0 (0.0%) |
| $5,000 to $7,499 | 0 (0.0%) | 10 (30.3%) |
| $7,500 to $9,999 | 0 (0.0%) | 0 (0.0%) |
| $10,000 to $12,499 | 16 (34.0%) | 0 (0.0%) |
| $12,500 to $14,999 | 0 (0.0%) | 0 (0.0%) |
| $15,000 to $17,499 | 0 (0.0%) | 0 (0.0%) |
| $17,500 to $19,999 | 0 (0.0%) | 0 (0.0%) |
| $20,000 to $22,499 | 8 (17.0%) | 0 (0.0%) |
| $22,500 to $24,999 | 0 (0.0%) | 0 (0.0%) |
| $25,000 to $29,999 | 0 (0.0%) | 0 (0.0%) |
| $30,000 to $34,999 | 5 (10.6%) | 9 (27.3%) |
| $35,000 to $39,999 | 0 (0.0%) | 2 (6.1%) |
| $40,000 to $44,999 | 0 (0.0%) | 0 (0.0%) |
| $45,000 to $49,999 | 10 (21.3%) | 0 (0.0%) |
| $50,000 to $54,999 | 2 (4.3%) | 0 (0.0%) |
| $55,000 to $64,999 | 5 (10.6%) | 0 (0.0%) |
| $65,000 to $74,999 | 0 (0.0%) | 0 (0.0%) |
| $75,000 to $99,999 | 0 (0.0%) | 1 (3.0%) |
| $100,000+ | 1 (2.1%) | 0 (0.0%) |
| Total | 47 (100.0%) | 33 (100.0%) |
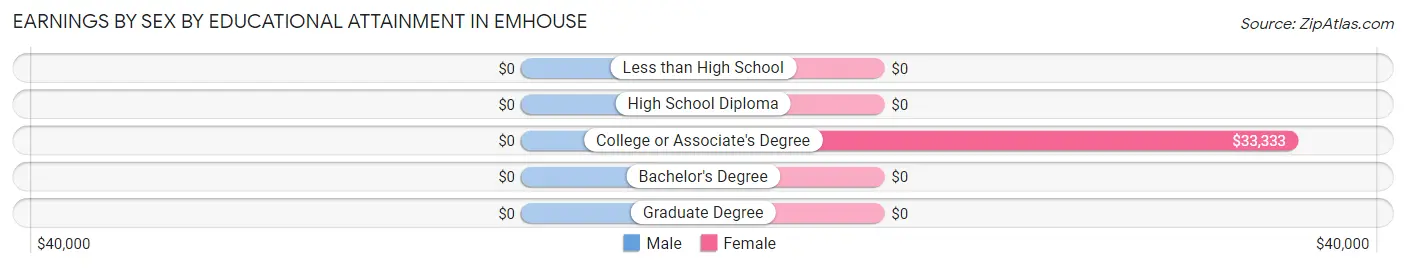
Earnings by Sex by Educational Attainment in Emhouse
| Educational Attainment | Male Income | Female Income |
| Less than High School | - | - |
| High School Diploma | - | - |
| College or Associate's Degree | - | - |
| Bachelor's Degree | - | - |
| Graduate Degree | - | - |
| Total | $34,250 | $30,833 |
Family Income in Emhouse
Family Income Brackets in Emhouse
According to the Emhouse family income data, there are 8 families falling into the $25,000 to $34,999 income range, which is the most common income bracket and makes up 23.5% of all families.
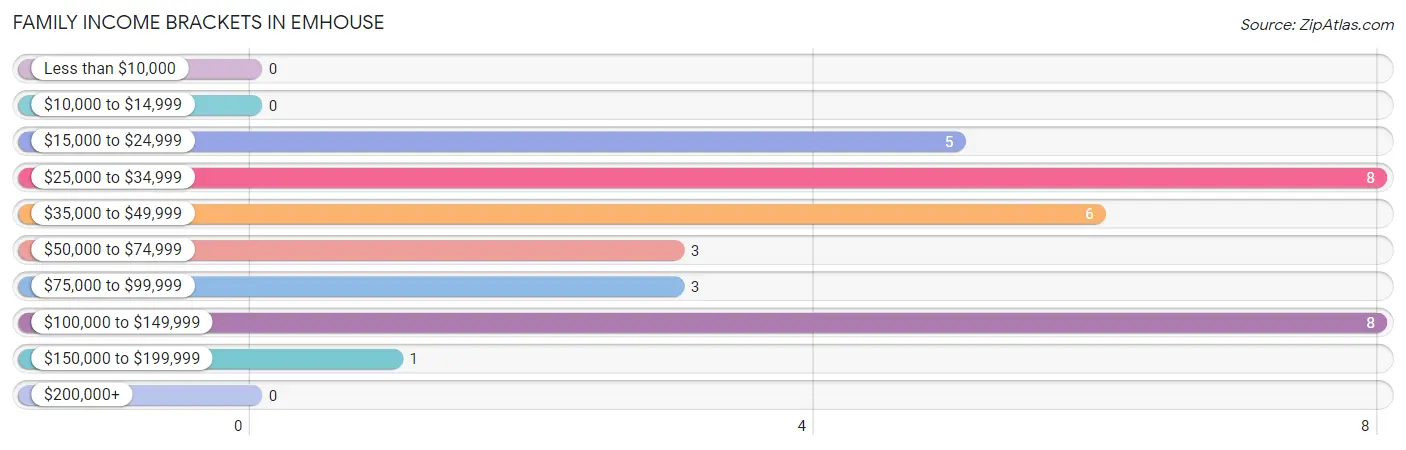
| Income Bracket | # Families | % Families |
| Less than $10,000 | 0 | 0.0% |
| $10,000 to $14,999 | 0 | 0.0% |
| $15,000 to $24,999 | 5 | 14.7% |
| $25,000 to $34,999 | 8 | 23.5% |
| $35,000 to $49,999 | 6 | 17.6% |
| $50,000 to $74,999 | 3 | 8.8% |
| $75,000 to $99,999 | 3 | 8.8% |
| $100,000 to $149,999 | 8 | 23.5% |
| $150,000 to $199,999 | 1 | 2.9% |
| $200,000+ | 0 | 0.0% |
Family Income by Famaliy Size in Emhouse
4-person families (12 | 35.3%) account for the highest median family income in Emhouse with $102,857 per family, while 4-person families (12 | 35.3%) have the highest median income of $25,714 per family member.
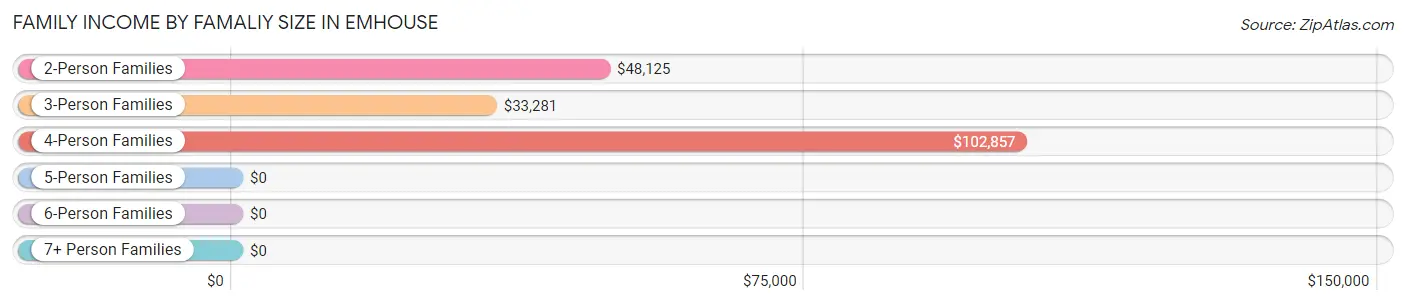
| Income Bracket | # Families | Median Income |
| 2-Person Families | 5 (14.7%) | $48,125 |
| 3-Person Families | 15 (44.1%) | $33,281 |
| 4-Person Families | 12 (35.3%) | $102,857 |
| 5-Person Families | 1 (2.9%) | $0 |
| 6-Person Families | 0 (0.0%) | $0 |
| 7+ Person Families | 1 (2.9%) | $0 |
| Total | 34 (100.0%) | $47,500 |
Family Income by Number of Earners in Emhouse
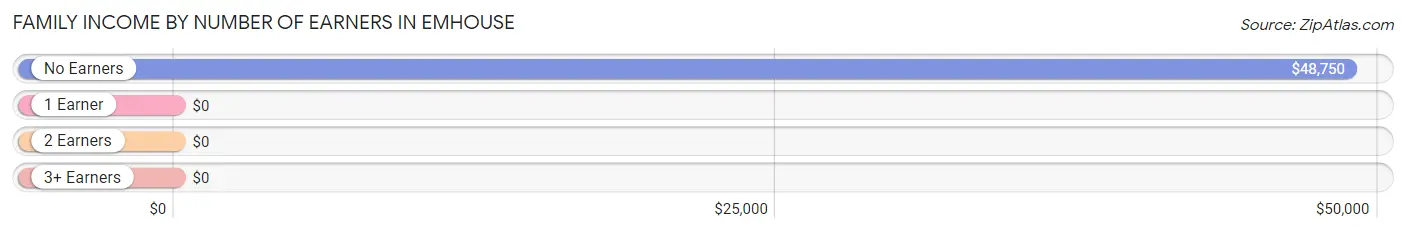
| Number of Earners | # Families | Median Income |
| No Earners | 6 (17.6%) | $48,750 |
| 1 Earner | 2 (5.9%) | $0 |
| 2 Earners | 26 (76.5%) | $0 |
| 3+ Earners | 0 (0.0%) | $0 |
| Total | 34 (100.0%) | $47,500 |
Household Income in Emhouse
Household Income Brackets in Emhouse
With 16 households falling in the category, the $35,000 to $49,999 income range is the most frequent in Emhouse, accounting for 34.8% of all households.
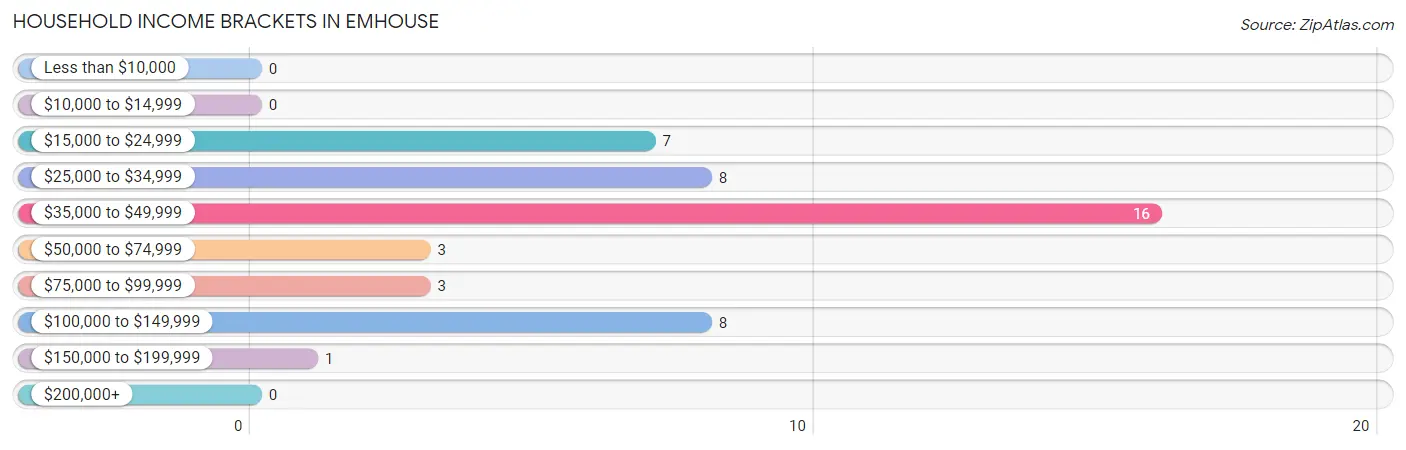
| Income Bracket | # Households | % Households |
| Less than $10,000 | 0 | 0.0% |
| $10,000 to $14,999 | 0 | 0.0% |
| $15,000 to $24,999 | 7 | 15.2% |
| $25,000 to $34,999 | 8 | 17.4% |
| $35,000 to $49,999 | 16 | 34.8% |
| $50,000 to $74,999 | 3 | 6.5% |
| $75,000 to $99,999 | 3 | 6.5% |
| $100,000 to $149,999 | 8 | 17.4% |
| $150,000 to $199,999 | 1 | 2.2% |
| $200,000+ | 0 | 0.0% |
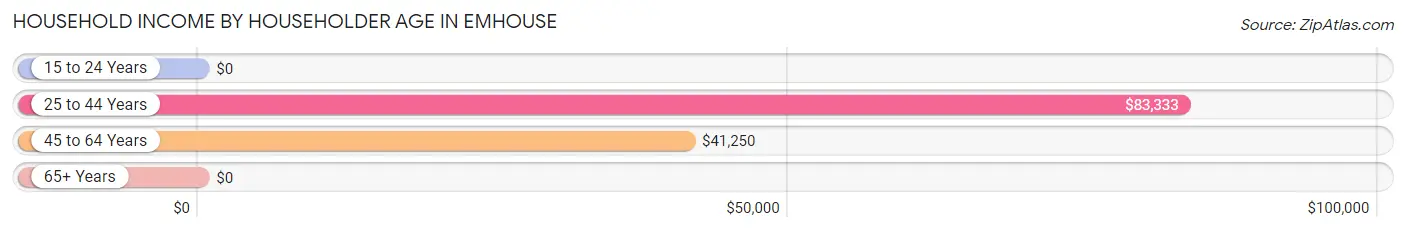
Household Income by Householder Age in Emhouse
The median household income in Emhouse is $46,000, with the highest median household income of $83,333 found in the 25 to 44 years age bracket for the primary householder. A total of 6 households (13.0%) fall into this category.
| Income Bracket | # Households | Median Income |
| 15 to 24 Years | 0 (0.0%) | $0 |
| 25 to 44 Years | 6 (13.0%) | $83,333 |
| 45 to 64 Years | 22 (47.8%) | $41,250 |
| 65+ Years | 18 (39.1%) | $0 |
| Total | 46 (100.0%) | $46,000 |
Poverty in Emhouse
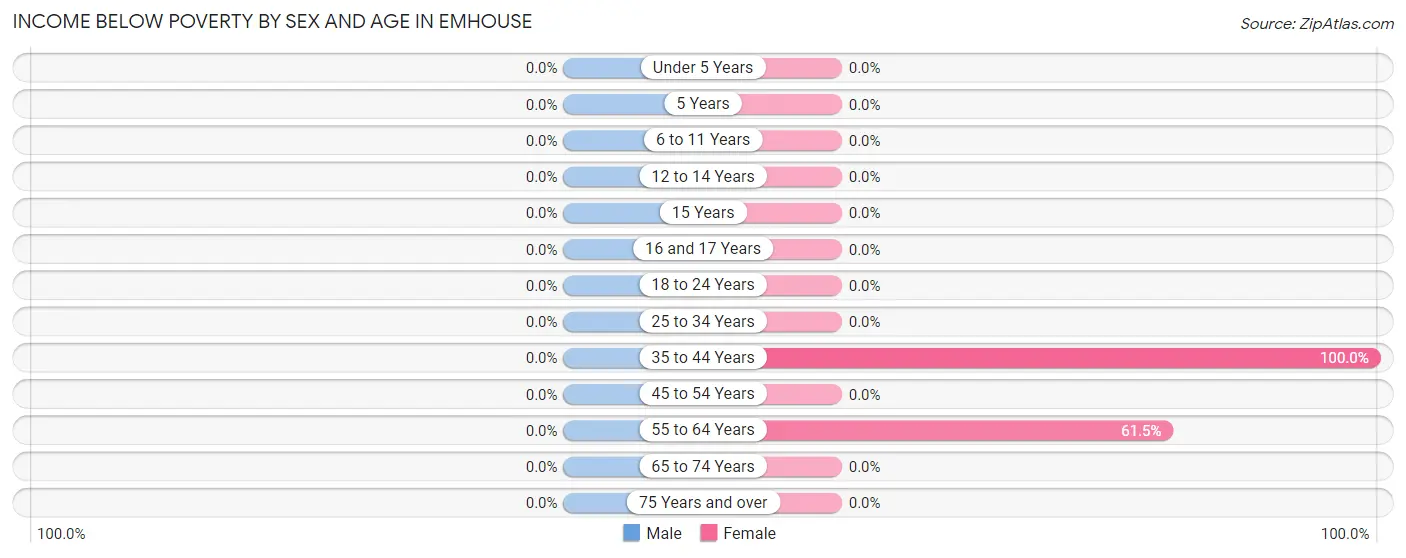
Income Below Poverty by Sex and Age in Emhouse
| Age Bracket | Male | Female |
| Under 5 Years | 0 (0.0%) | 0 (0.0%) |
| 5 Years | 0 (0.0%) | 0 (0.0%) |
| 6 to 11 Years | 0 (0.0%) | 0 (0.0%) |
| 12 to 14 Years | 0 (0.0%) | 0 (0.0%) |
| 15 Years | 0 (0.0%) | 0 (0.0%) |
| 16 and 17 Years | 0 (0.0%) | 0 (0.0%) |
| 18 to 24 Years | 0 (0.0%) | 0 (0.0%) |
| 25 to 34 Years | 0 (0.0%) | 0 (0.0%) |
| 35 to 44 Years | 0 (0.0%) | 6 (100.0%) |
| 45 to 54 Years | 0 (0.0%) | 0 (0.0%) |
| 55 to 64 Years | 0 (0.0%) | 8 (61.5%) |
| 65 to 74 Years | 0 (0.0%) | 0 (0.0%) |
| 75 Years and over | 0 (0.0%) | 0 (0.0%) |
| Total | 0 (0.0%) | 14 (17.7%) |
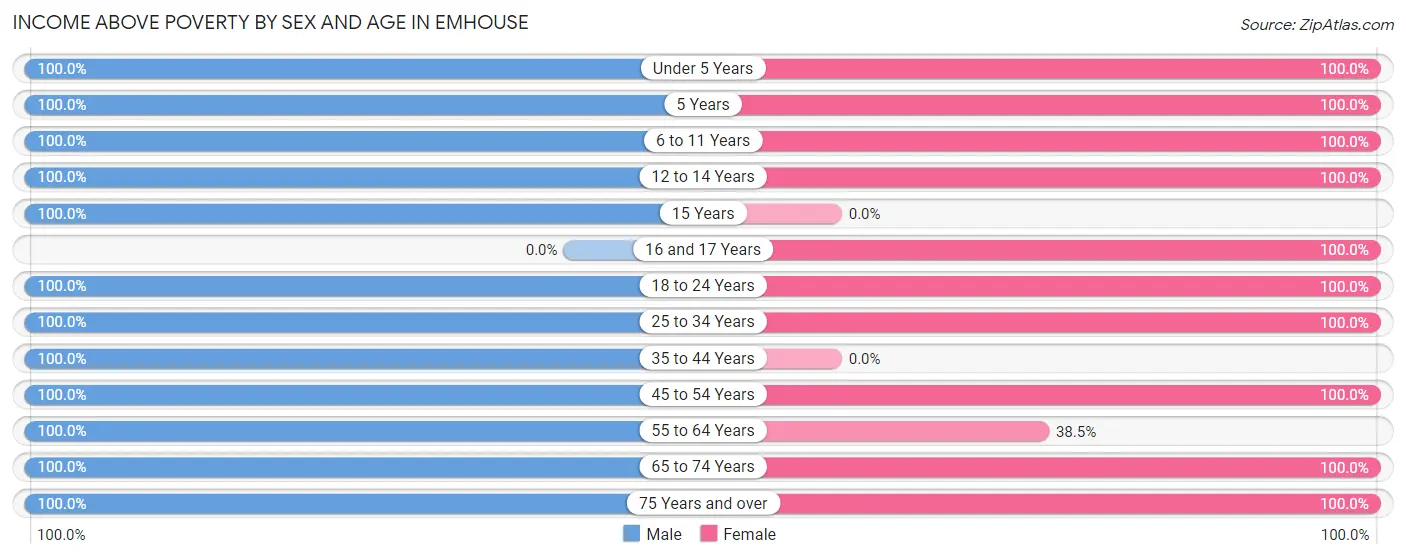
Income Above Poverty by Sex and Age in Emhouse
According to the poverty statistics in Emhouse, males aged under 5 years and females aged under 5 years are the age groups that are most secure financially, with 100.0% of males and 100.0% of females in these age groups living above the poverty line.
| Age Bracket | Male | Female |
| Under 5 Years | 2 (100.0%) | 6 (100.0%) |
| 5 Years | 4 (100.0%) | 2 (100.0%) |
| 6 to 11 Years | 6 (100.0%) | 1 (100.0%) |
| 12 to 14 Years | 2 (100.0%) | 1 (100.0%) |
| 15 Years | 1 (100.0%) | 0 (0.0%) |
| 16 and 17 Years | 0 (0.0%) | 4 (100.0%) |
| 18 to 24 Years | 24 (100.0%) | 11 (100.0%) |
| 25 to 34 Years | 8 (100.0%) | 10 (100.0%) |
| 35 to 44 Years | 1 (100.0%) | 0 (0.0%) |
| 45 to 54 Years | 6 (100.0%) | 18 (100.0%) |
| 55 to 64 Years | 10 (100.0%) | 5 (38.5%) |
| 65 to 74 Years | 10 (100.0%) | 3 (100.0%) |
| 75 Years and over | 7 (100.0%) | 4 (100.0%) |
| Total | 81 (100.0%) | 65 (82.3%) |
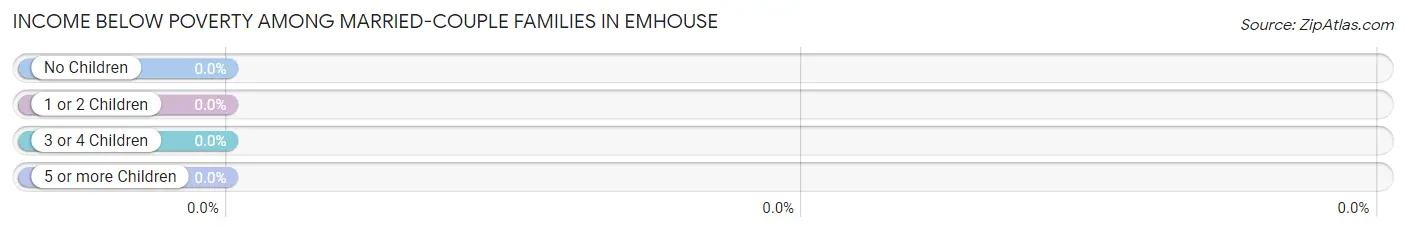
Income Below Poverty Among Married-Couple Families in Emhouse
| Children | Above Poverty | Below Poverty |
| No Children | 5 (100.0%) | 0 (0.0%) |
| 1 or 2 Children | 5 (100.0%) | 0 (0.0%) |
| 3 or 4 Children | 0 (0.0%) | 0 (0.0%) |
| 5 or more Children | 1 (100.0%) | 0 (0.0%) |
| Total | 11 (100.0%) | 0 (0.0%) |
Income Below Poverty Among Single-Parent Households in Emhouse
| Children | Single Father | Single Mother |
| No Children | 0 (0.0%) | 0 (0.0%) |
| 1 or 2 Children | 0 (0.0%) | 0 (0.0%) |
| 3 or 4 Children | 0 (0.0%) | 0 (0.0%) |
| 5 or more Children | 0 (0.0%) | 0 (0.0%) |
| Total | 0 (0.0%) | 0 (0.0%) |
Income Below Poverty Among Married-Couple vs Single-Parent Households in Emhouse
| Children | Married-Couple Families | Single-Parent Households |
| No Children | 0 (0.0%) | 0 (0.0%) |
| 1 or 2 Children | 0 (0.0%) | 0 (0.0%) |
| 3 or 4 Children | 0 (0.0%) | 0 (0.0%) |
| 5 or more Children | 0 (0.0%) | 0 (0.0%) |
| Total | 0 (0.0%) | 0 (0.0%) |
Race in Emhouse
The most populous races in Emhouse are White / Caucasian (92 | 57.5%), Hispanic or Latino (58 | 36.2%), and Some other Race (46 | 28.7%).
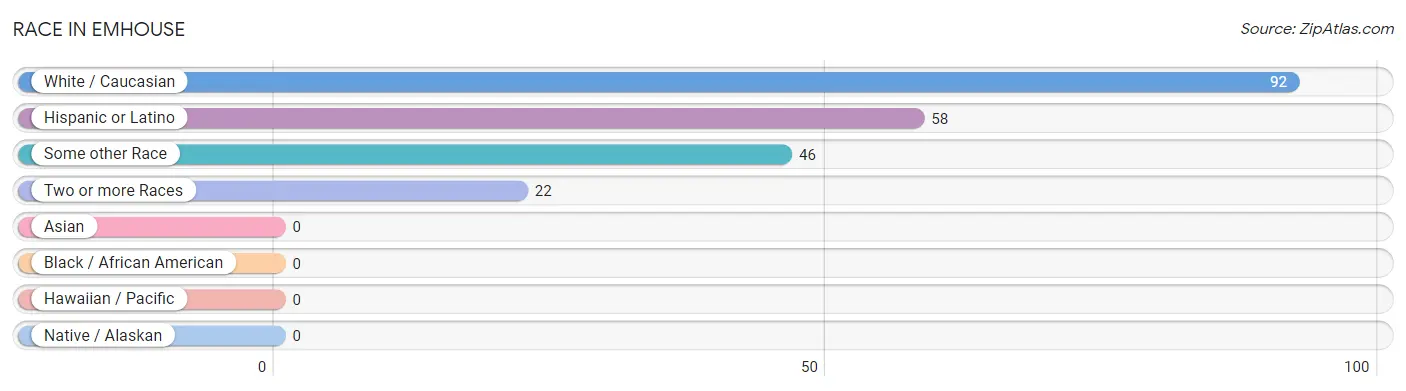
| Race | # Population | % Population |
| Asian | 0 | 0.0% |
| Black / African American | 0 | 0.0% |
| Hawaiian / Pacific | 0 | 0.0% |
| Hispanic or Latino | 58 | 36.2% |
| Native / Alaskan | 0 | 0.0% |
| White / Caucasian | 92 | 57.5% |
| Two or more Races | 22 | 13.8% |
| Some other Race | 46 | 28.7% |
| Total | 160 | 100.0% |
Ancestry in Emhouse
The most populous ancestries reported in Emhouse are Mexican (58 | 36.2%), English (11 | 6.9%), Blackfeet (10 | 6.2%), German (10 | 6.2%), and American (7 | 4.4%), together accounting for 60.0% of all Emhouse residents.
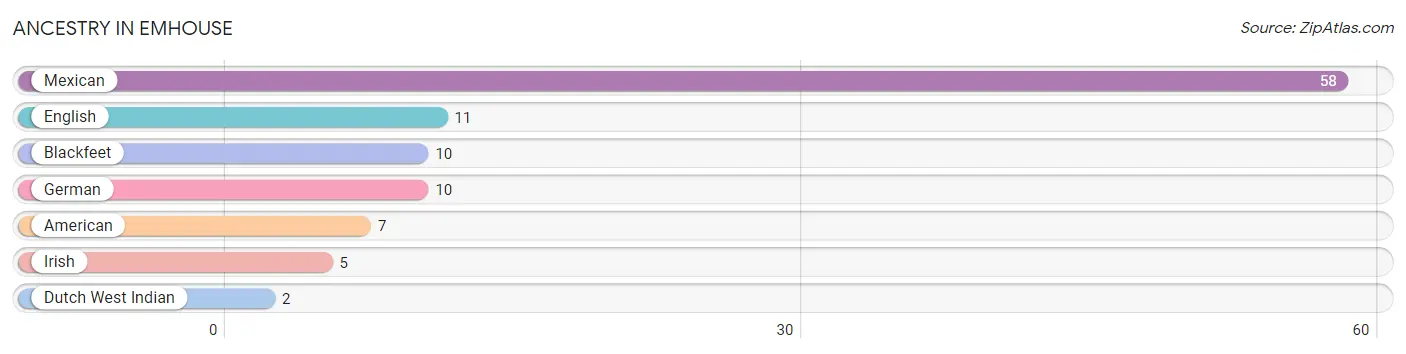
| Ancestry | # Population | % Population |
| American | 7 | 4.4% |
| Blackfeet | 10 | 6.2% |
| Dutch West Indian | 2 | 1.3% |
| English | 11 | 6.9% |
| German | 10 | 6.2% |
| Irish | 5 | 3.1% |
| Mexican | 58 | 36.2% | View All 7 Rows |
Immigrants in Emhouse
The most numerous immigrant groups reported in Emhouse came from Central America (16 | 10.0%), Latin America (16 | 10.0%), and Mexico (16 | 10.0%), together accounting for 30.0% of all Emhouse residents.
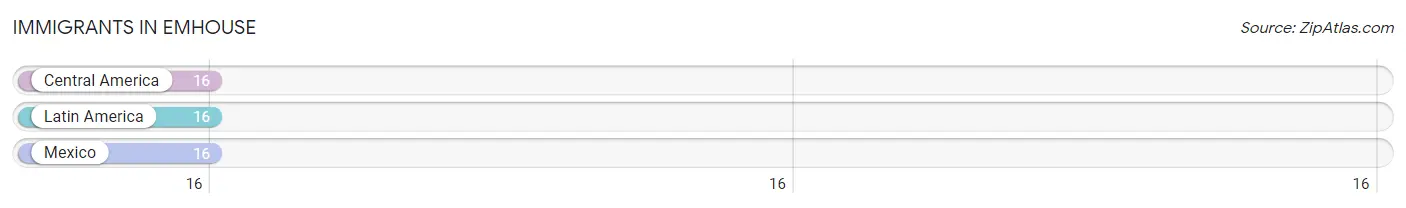
| Immigration Origin | # Population | % Population |
| Central America | 16 | 10.0% |
| Latin America | 16 | 10.0% |
| Mexico | 16 | 10.0% | View All 3 Rows |
Sex and Age in Emhouse
Sex and Age in Emhouse
The most populous age groups in Emhouse are 20 to 24 Years (24 | 29.6%) for men and 55 to 59 Years (13 | 16.5%) for women.
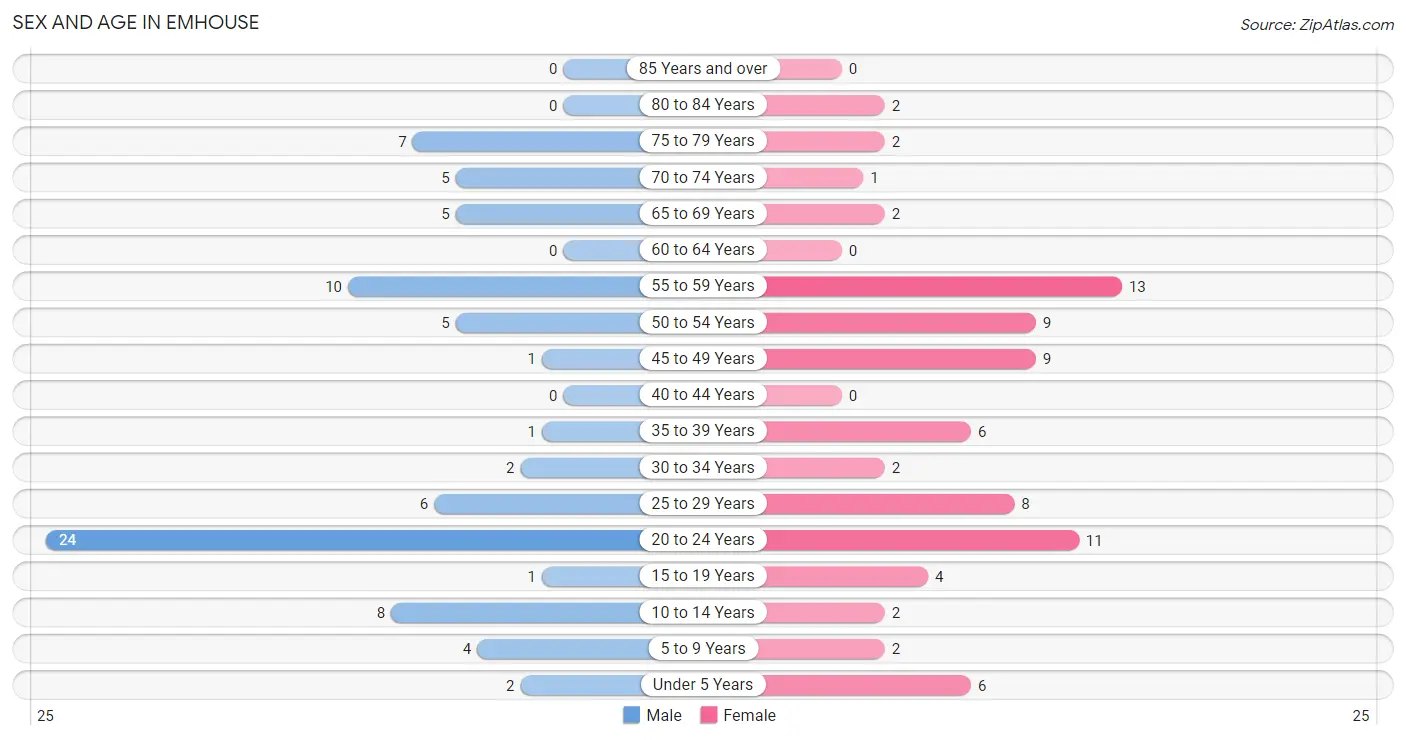
| Age Bracket | Male | Female |
| Under 5 Years | 2 (2.5%) | 6 (7.6%) |
| 5 to 9 Years | 4 (4.9%) | 2 (2.5%) |
| 10 to 14 Years | 8 (9.9%) | 2 (2.5%) |
| 15 to 19 Years | 1 (1.2%) | 4 (5.1%) |
| 20 to 24 Years | 24 (29.6%) | 11 (13.9%) |
| 25 to 29 Years | 6 (7.4%) | 8 (10.1%) |
| 30 to 34 Years | 2 (2.5%) | 2 (2.5%) |
| 35 to 39 Years | 1 (1.2%) | 6 (7.6%) |
| 40 to 44 Years | 0 (0.0%) | 0 (0.0%) |
| 45 to 49 Years | 1 (1.2%) | 9 (11.4%) |
| 50 to 54 Years | 5 (6.2%) | 9 (11.4%) |
| 55 to 59 Years | 10 (12.3%) | 13 (16.5%) |
| 60 to 64 Years | 0 (0.0%) | 0 (0.0%) |
| 65 to 69 Years | 5 (6.2%) | 2 (2.5%) |
| 70 to 74 Years | 5 (6.2%) | 1 (1.3%) |
| 75 to 79 Years | 7 (8.6%) | 2 (2.5%) |
| 80 to 84 Years | 0 (0.0%) | 2 (2.5%) |
| 85 Years and over | 0 (0.0%) | 0 (0.0%) |
| Total | 81 (100.0%) | 79 (100.0%) |
Families and Households in Emhouse
Median Family Size in Emhouse
The median family size in Emhouse is 4.03 persons per family, with single female/mother families (3 | 8.8%) accounting for the largest median family size of 6.67 persons per family. On the other hand, single male/father families (20 | 58.8%) represent the smallest median family size with 3.70 persons per family.
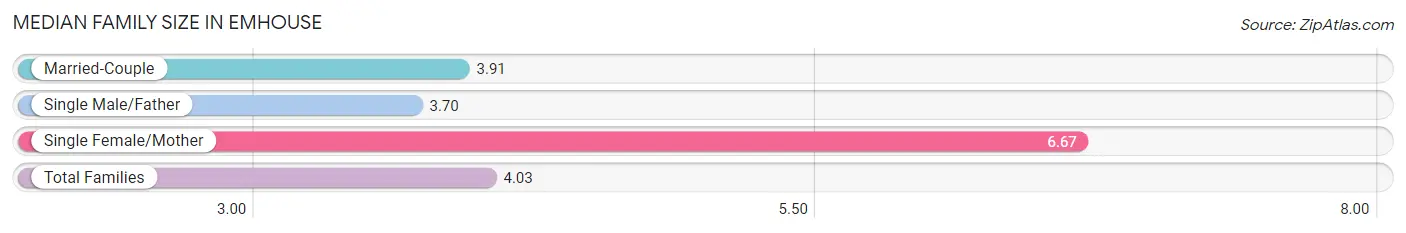
| Family Type | # Families | Family Size |
| Married-Couple | 11 (32.4%) | 3.91 |
| Single Male/Father | 20 (58.8%) | 3.70 |
| Single Female/Mother | 3 (8.8%) | 6.67 |
| Total Families | 34 (100.0%) | 4.03 |
Median Household Size in Emhouse
The median household size in Emhouse is 3.48 persons per household, with single female/mother households (3 | 6.5%) accounting for the largest median household size of 6.67 persons per household. non-family households (12 | 26.1%) represent the smallest median household size with 1.42 persons per household.
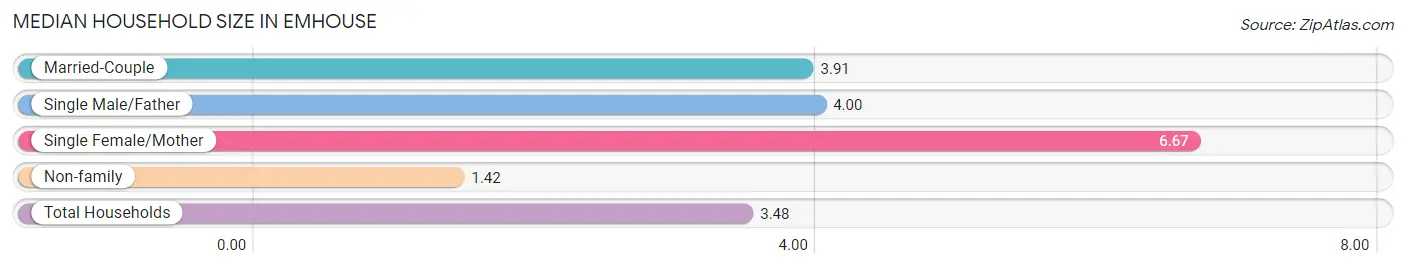
| Household Type | # Households | Household Size |
| Married-Couple | 11 (23.9%) | 3.91 |
| Single Male/Father | 20 (43.5%) | 4.00 |
| Single Female/Mother | 3 (6.5%) | 6.67 |
| Non-family | 12 (26.1%) | 1.42 |
| Total Households | 46 (100.0%) | 3.48 |
Household Size by Marriage Status in Emhouse
Out of a total of 46 households in Emhouse, 34 (73.9%) are family households, while 12 (26.1%) are nonfamily households. The most numerous type of family households are 3-person households, comprising 15, and the most common type of nonfamily households are 2-person households, comprising 8.
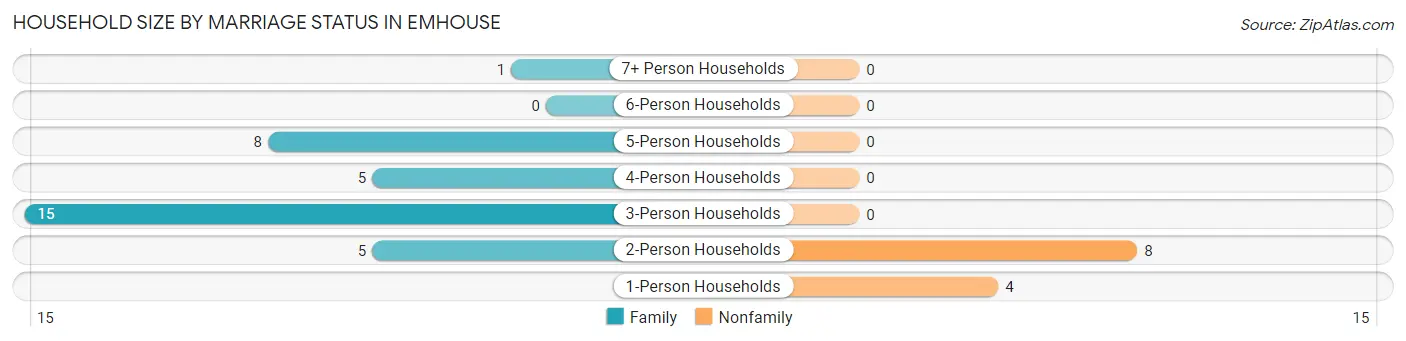
| Household Size | Family Households | Nonfamily Households |
| 1-Person Households | - | 4 (8.7%) |
| 2-Person Households | 5 (10.9%) | 8 (17.4%) |
| 3-Person Households | 15 (32.6%) | 0 (0.0%) |
| 4-Person Households | 5 (10.9%) | 0 (0.0%) |
| 5-Person Households | 8 (17.4%) | 0 (0.0%) |
| 6-Person Households | 0 (0.0%) | 0 (0.0%) |
| 7+ Person Households | 1 (2.2%) | 0 (0.0%) |
| Total | 34 (73.9%) | 12 (26.1%) |
Female Fertility in Emhouse
Fertility by Age in Emhouse
Average fertility rate in Emhouse is 75.0 births per 1,000 women. Women in the age bracket of 20 to 34 years have the highest fertility rate with 143.0 births per 1,000 women. Women in the age bracket of 20 to 34 years acount for 100.0% of all women with births.
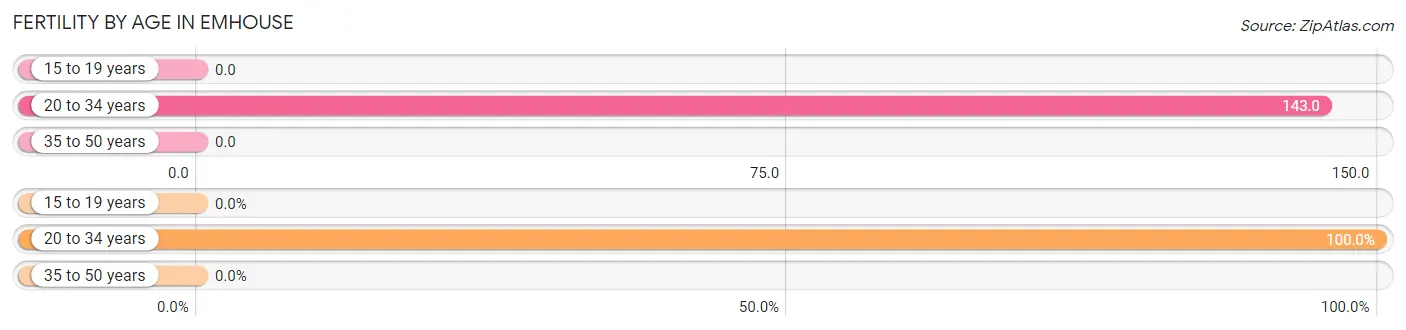
| Age Bracket | Women with Births | Births / 1,000 Women |
| 15 to 19 years | 0 (0.0%) | 0.0 |
| 20 to 34 years | 3 (100.0%) | 143.0 |
| 35 to 50 years | 0 (0.0%) | 0.0 |
| Total | 3 (100.0%) | 75.0 |
Fertility by Age by Marriage Status in Emhouse
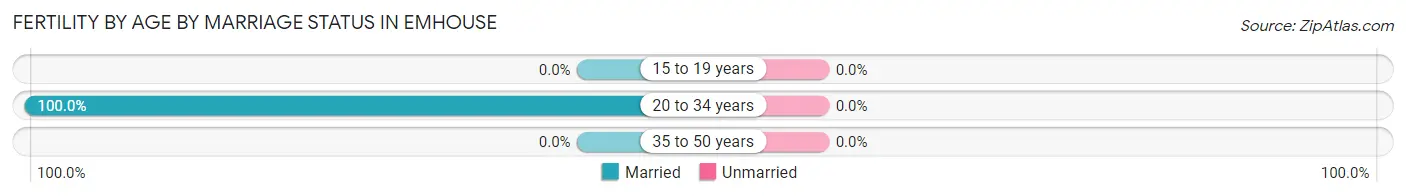
| Age Bracket | Married | Unmarried |
| 15 to 19 years | 0 (0.0%) | 0 (0.0%) |
| 20 to 34 years | 3 (100.0%) | 0 (0.0%) |
| 35 to 50 years | 0 (0.0%) | 0 (0.0%) |
| Total | 3 (100.0%) | 0 (0.0%) |
Fertility by Education in Emhouse
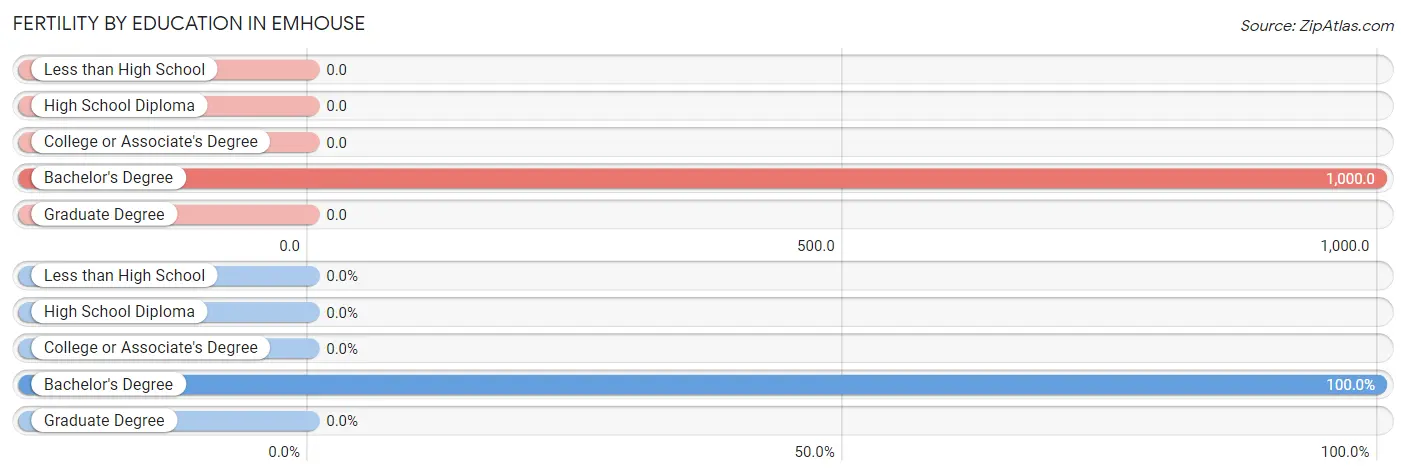
| Educational Attainment | Women with Births | Births / 1,000 Women |
| Less than High School | 0 (0.0%) | 0.0 |
| High School Diploma | 0 (0.0%) | 0.0 |
| College or Associate's Degree | 0 (0.0%) | 0.0 |
| Bachelor's Degree | 3 (100.0%) | 1,000.0 |
| Graduate Degree | 0 (0.0%) | 0.0 |
| Total | 3 (100.0%) | 75.0 |
Fertility by Education by Marriage Status in Emhouse
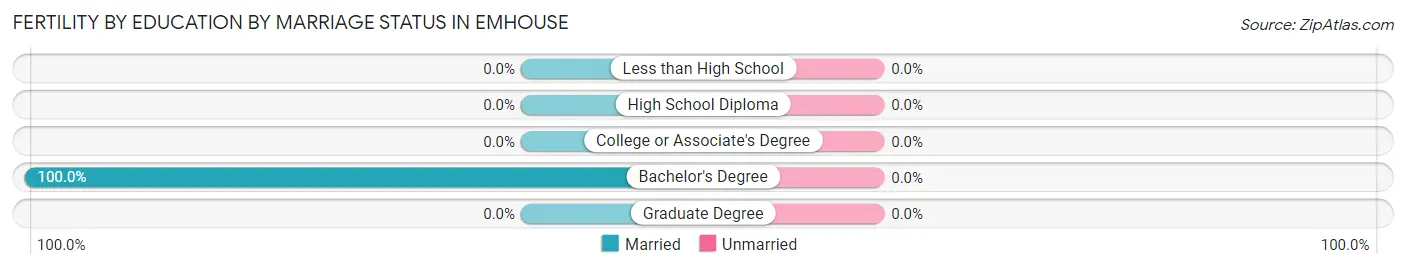
| Educational Attainment | Married | Unmarried |
| Less than High School | 0 (0.0%) | 0 (0.0%) |
| High School Diploma | 0 (0.0%) | 0 (0.0%) |
| College or Associate's Degree | 0 (0.0%) | 0 (0.0%) |
| Bachelor's Degree | 3 (100.0%) | 0 (0.0%) |
| Graduate Degree | 0 (0.0%) | 0 (0.0%) |
| Total | 3 (100.0%) | 0 (0.0%) |
Employment Characteristics in Emhouse
Employment by Class of Employer in Emhouse
Among the 78 employed individuals in Emhouse, private company employees (70 | 89.7%), and self-employed (not incorporated) (8 | 10.3%) make up the most common classes of employment.
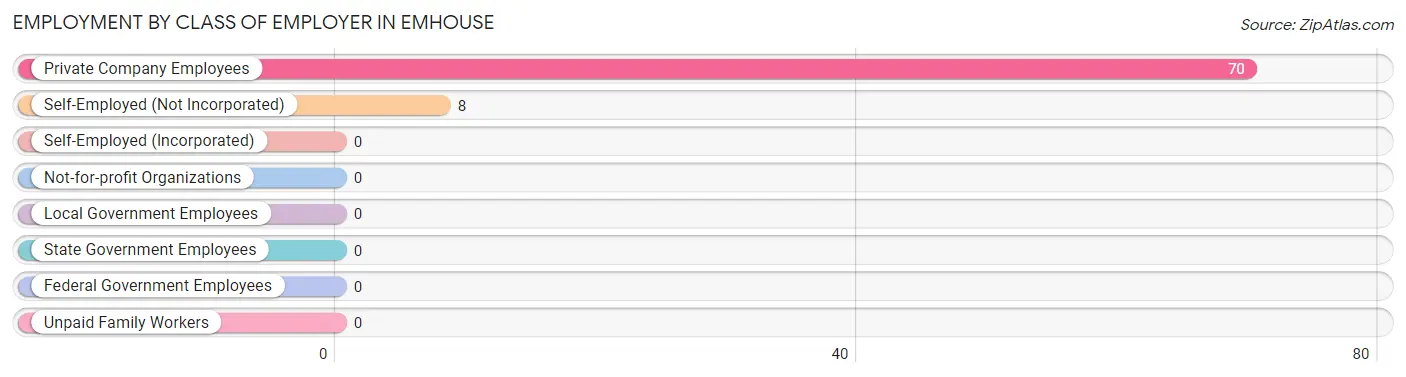
| Employer Class | # Employees | % Employees |
| Private Company Employees | 70 | 89.7% |
| Self-Employed (Incorporated) | 0 | 0.0% |
| Self-Employed (Not Incorporated) | 8 | 10.3% |
| Not-for-profit Organizations | 0 | 0.0% |
| Local Government Employees | 0 | 0.0% |
| State Government Employees | 0 | 0.0% |
| Federal Government Employees | 0 | 0.0% |
| Unpaid Family Workers | 0 | 0.0% |
| Total | 78 | 100.0% |
Employment Status by Age in Emhouse
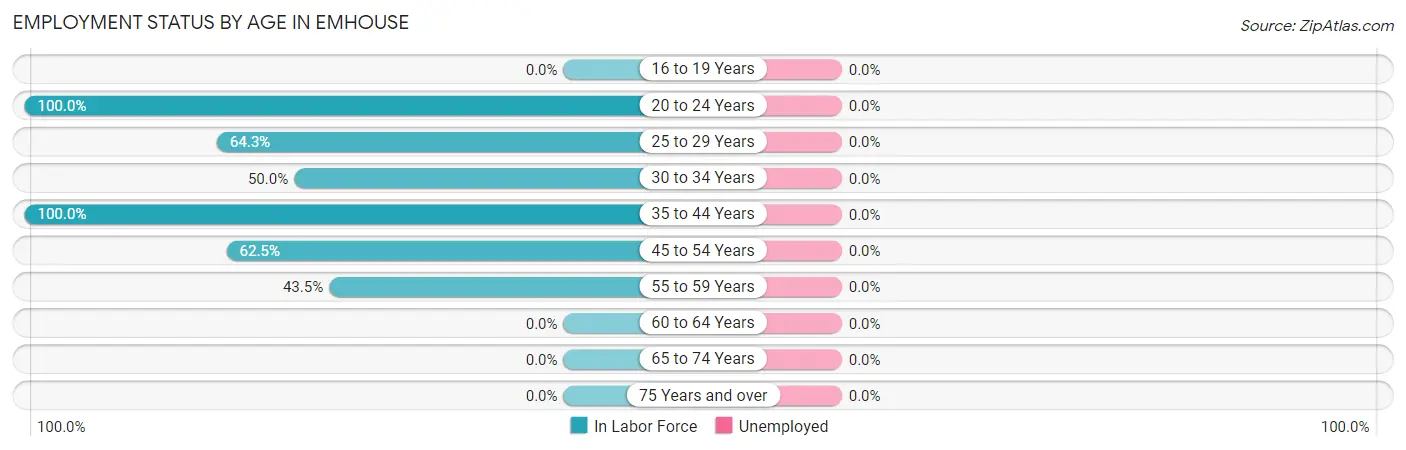
| Age Bracket | In Labor Force | Unemployed |
| 16 to 19 Years | 0 (0.0%) | 0 (0.0%) |
| 20 to 24 Years | 35 (100.0%) | 0 (0.0%) |
| 25 to 29 Years | 9 (64.3%) | 0 (0.0%) |
| 30 to 34 Years | 2 (50.0%) | 0 (0.0%) |
| 35 to 44 Years | 7 (100.0%) | 0 (0.0%) |
| 45 to 54 Years | 15 (62.5%) | 0 (0.0%) |
| 55 to 59 Years | 10 (43.5%) | 0 (0.0%) |
| 60 to 64 Years | 0 (0.0%) | 0 (0.0%) |
| 65 to 74 Years | 0 (0.0%) | 0 (0.0%) |
| 75 Years and over | 0 (0.0%) | 0 (0.0%) |
| Total | 78 (57.8%) | 0 (0.0%) |
Employment Status by Educational Attainment in Emhouse
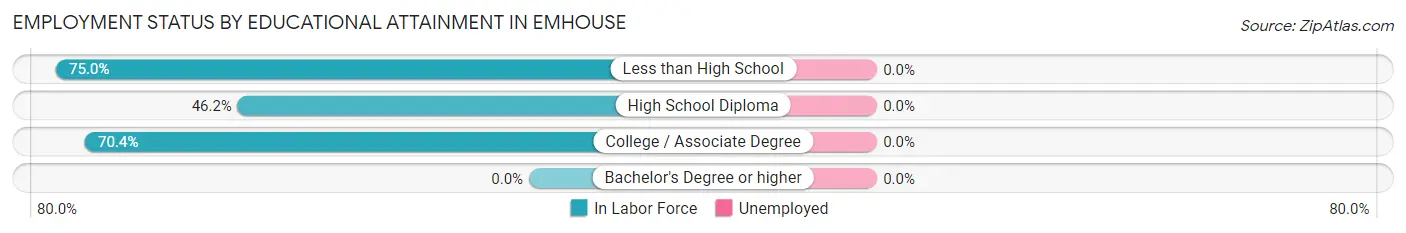
| Educational Attainment | In Labor Force | Unemployed |
| Less than High School | 12 (75.0%) | 0 (0.0%) |
| High School Diploma | 12 (46.2%) | 0 (0.0%) |
| College / Associate Degree | 19 (70.4%) | 0 (0.0%) |
| Bachelor's Degree or higher | 0 (0.0%) | 0 (0.0%) |
| Total | 43 (59.7%) | 0 (0.0%) |
Employment Occupations by Sex in Emhouse
Management, Business, Science and Arts Occupations
The most common Management, Business, Science and Arts occupations in Emhouse are Community & Social Service (4 | 5.1%), Education Instruction & Library (4 | 5.1%), and Management (1 | 1.3%).
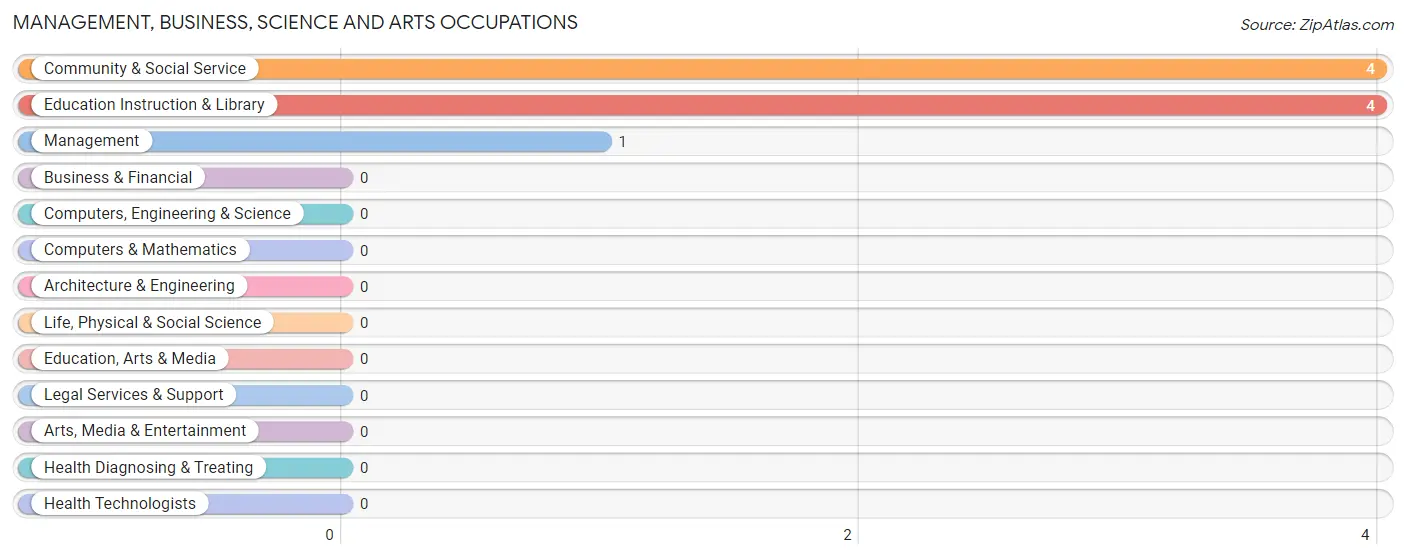
Management, Business, Science and Arts Occupations by Sex
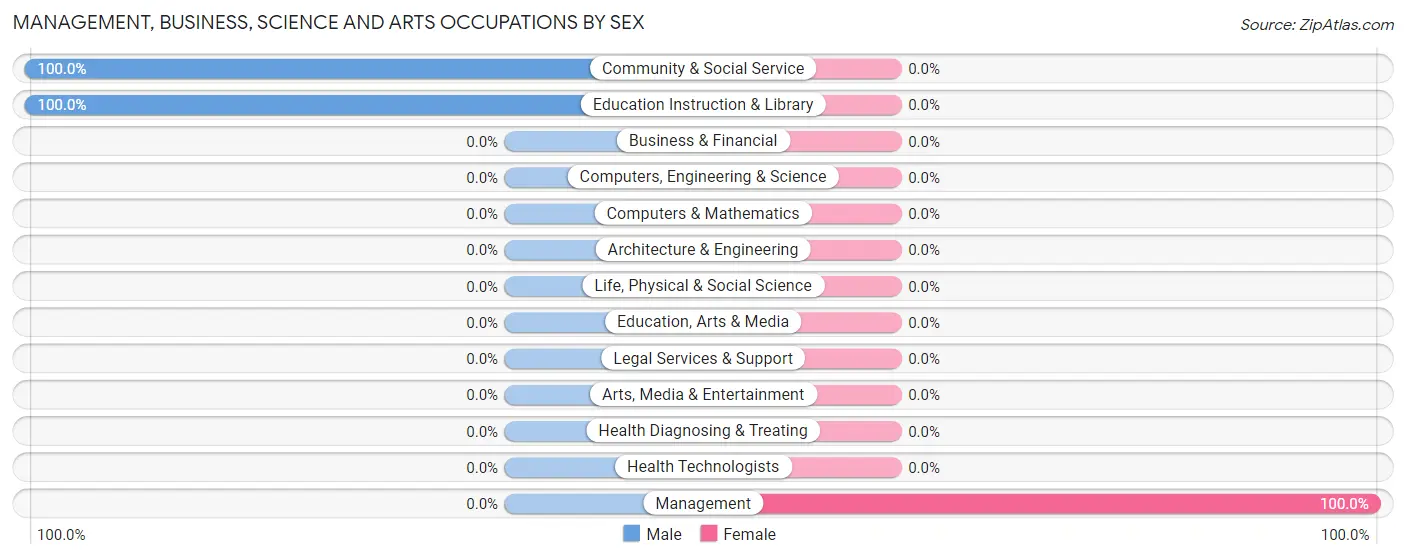
| Occupation | Male | Female |
| Management | 0 (0.0%) | 1 (100.0%) |
| Business & Financial | 0 (0.0%) | 0 (0.0%) |
| Computers, Engineering & Science | 0 (0.0%) | 0 (0.0%) |
| Computers & Mathematics | 0 (0.0%) | 0 (0.0%) |
| Architecture & Engineering | 0 (0.0%) | 0 (0.0%) |
| Life, Physical & Social Science | 0 (0.0%) | 0 (0.0%) |
| Community & Social Service | 4 (100.0%) | 0 (0.0%) |
| Education, Arts & Media | 0 (0.0%) | 0 (0.0%) |
| Legal Services & Support | 0 (0.0%) | 0 (0.0%) |
| Education Instruction & Library | 4 (100.0%) | 0 (0.0%) |
| Arts, Media & Entertainment | 0 (0.0%) | 0 (0.0%) |
| Health Diagnosing & Treating | 0 (0.0%) | 0 (0.0%) |
| Health Technologists | 0 (0.0%) | 0 (0.0%) |
| Total (Category) | 4 (80.0%) | 1 (20.0%) |
| Total (Overall) | 47 (60.3%) | 31 (39.7%) |
Services Occupations
The most common Services occupations in Emhouse are Food Preparation & Serving (13 | 16.7%), Security & Protection (8 | 10.3%), Firefighting & Prevention (8 | 10.3%), and Healthcare Support (5 | 6.4%).
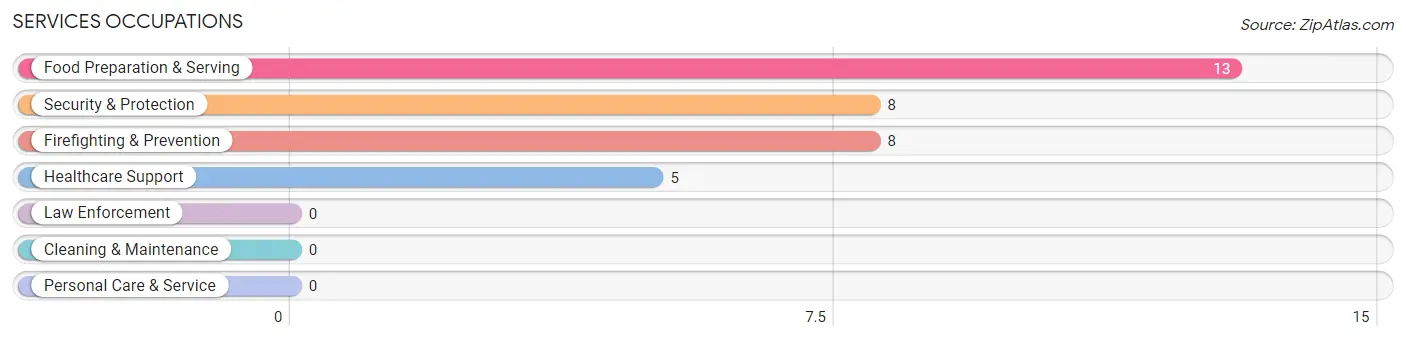
Services Occupations by Sex
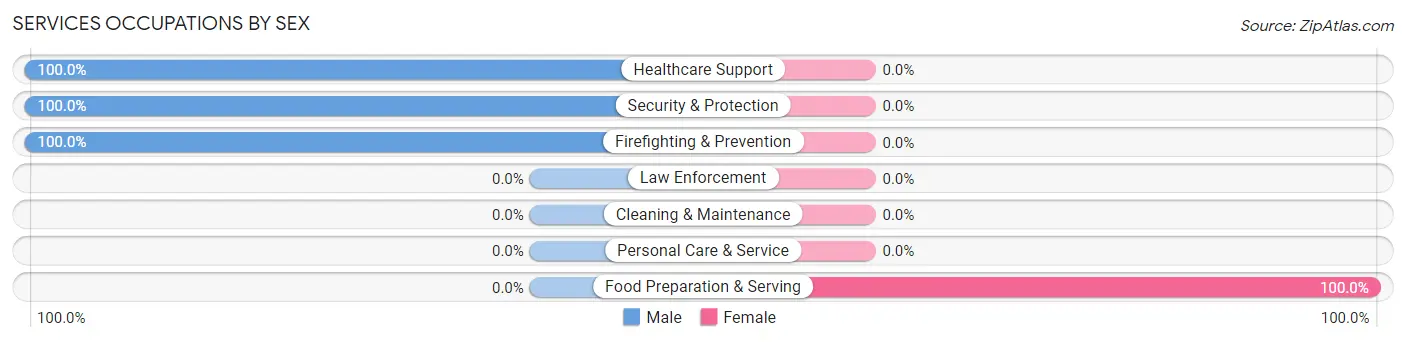
| Occupation | Male | Female |
| Healthcare Support | 5 (100.0%) | 0 (0.0%) |
| Security & Protection | 8 (100.0%) | 0 (0.0%) |
| Firefighting & Prevention | 8 (100.0%) | 0 (0.0%) |
| Law Enforcement | 0 (0.0%) | 0 (0.0%) |
| Food Preparation & Serving | 0 (0.0%) | 13 (100.0%) |
| Cleaning & Maintenance | 0 (0.0%) | 0 (0.0%) |
| Personal Care & Service | 0 (0.0%) | 0 (0.0%) |
| Total (Category) | 13 (50.0%) | 13 (50.0%) |
| Total (Overall) | 47 (60.3%) | 31 (39.7%) |
Sales and Office Occupations
The most common Sales and Office occupations in Emhouse are , and Office & Administration (13 | 16.7%).

Sales and Office Occupations by Sex

| Occupation | Male | Female |
| Sales & Related | 0 (0.0%) | 0 (0.0%) |
| Office & Administration | 2 (15.4%) | 11 (84.6%) |
| Total (Category) | 2 (15.4%) | 11 (84.6%) |
| Total (Overall) | 47 (60.3%) | 31 (39.7%) |
Natural Resources, Construction and Maintenance Occupations
The most common Natural Resources, Construction and Maintenance occupations in Emhouse are Construction & Extraction (12 | 15.4%), and Installation, Maintenance & Repair (9 | 11.5%).
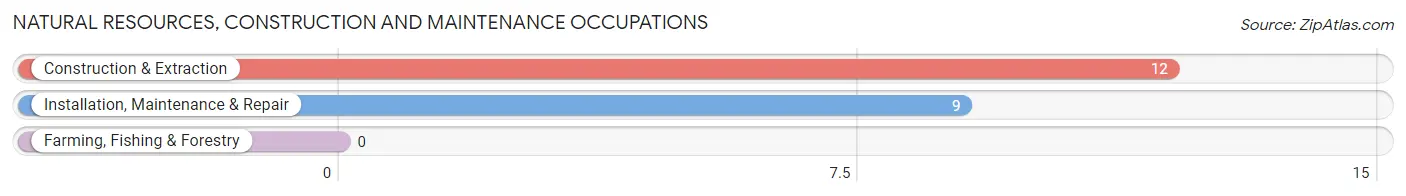
Natural Resources, Construction and Maintenance Occupations by Sex
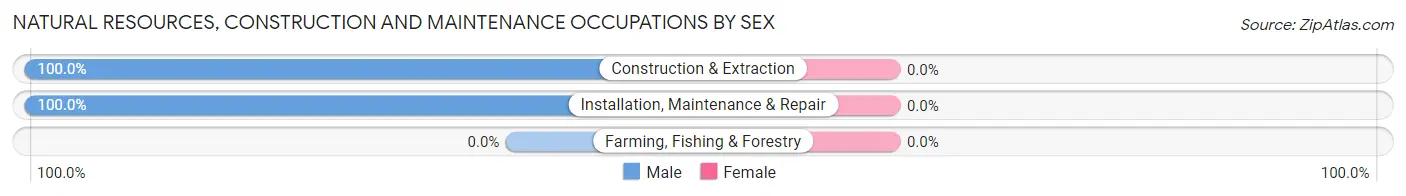
| Occupation | Male | Female |
| Farming, Fishing & Forestry | 0 (0.0%) | 0 (0.0%) |
| Construction & Extraction | 12 (100.0%) | 0 (0.0%) |
| Installation, Maintenance & Repair | 9 (100.0%) | 0 (0.0%) |
| Total (Category) | 21 (100.0%) | 0 (0.0%) |
| Total (Overall) | 47 (60.3%) | 31 (39.7%) |
Production, Transportation and Moving Occupations
The most common Production, Transportation and Moving occupations in Emhouse are Production (7 | 9.0%), and Material Moving (6 | 7.7%).
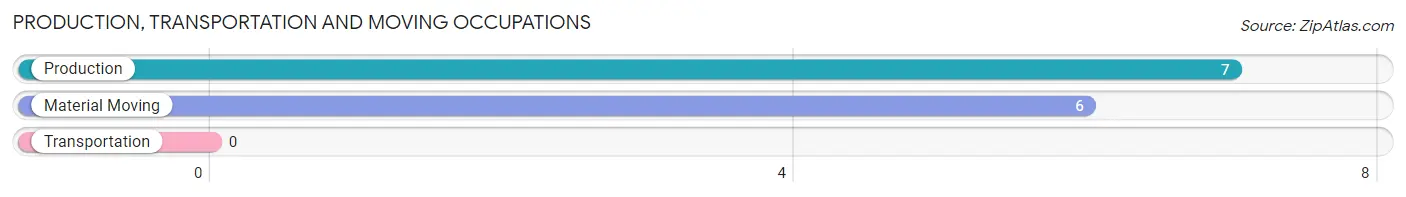
Production, Transportation and Moving Occupations by Sex
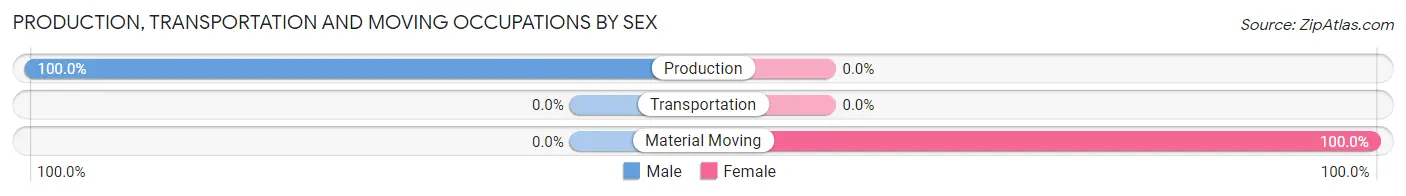
| Occupation | Male | Female |
| Production | 7 (100.0%) | 0 (0.0%) |
| Transportation | 0 (0.0%) | 0 (0.0%) |
| Material Moving | 0 (0.0%) | 6 (100.0%) |
| Total (Category) | 7 (53.8%) | 6 (46.2%) |
| Total (Overall) | 47 (60.3%) | 31 (39.7%) |
Employment Industries by Sex in Emhouse
Employment Industries in Emhouse
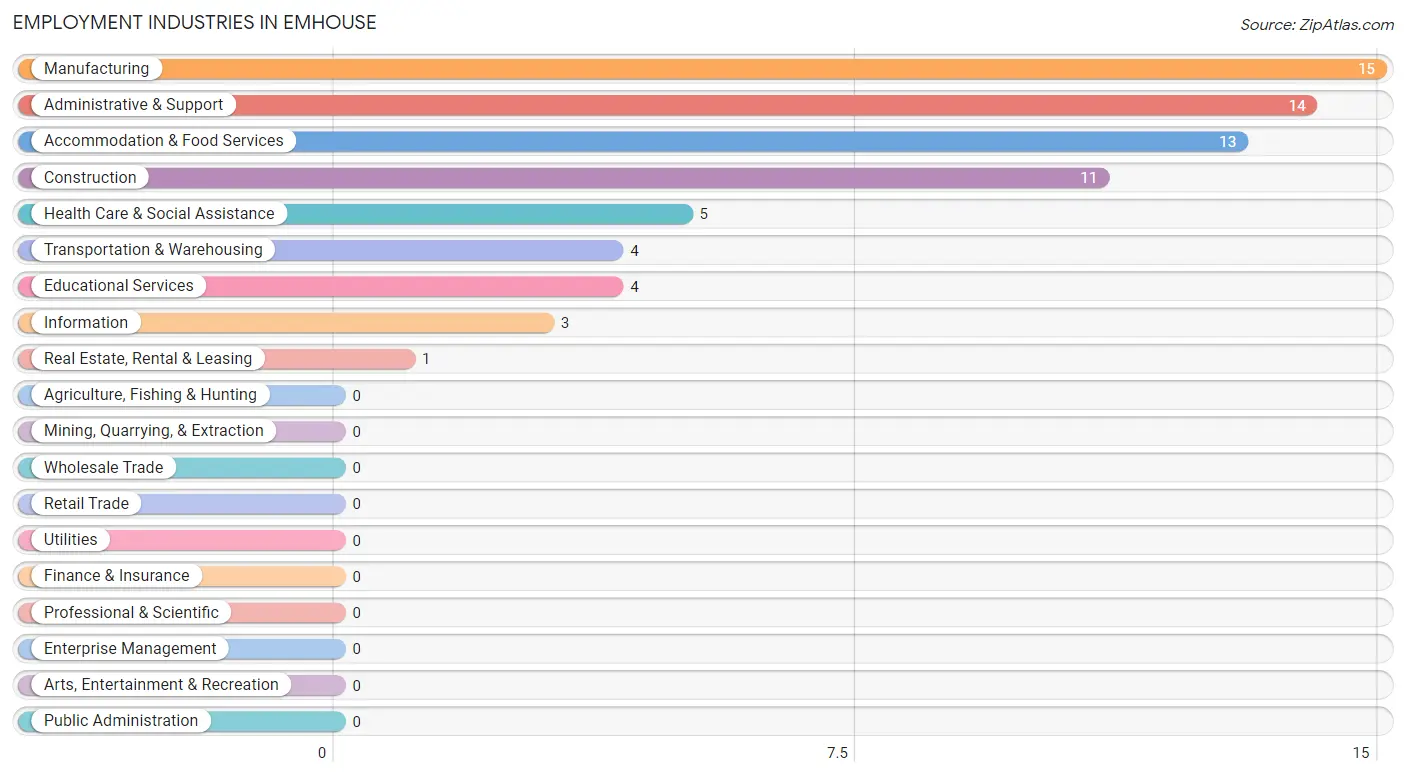
The major employment industries in Emhouse include Manufacturing (15 | 19.2%), Administrative & Support (14 | 17.9%), Accommodation & Food Services (13 | 16.7%), Construction (11 | 14.1%), and Health Care & Social Assistance (5 | 6.4%).
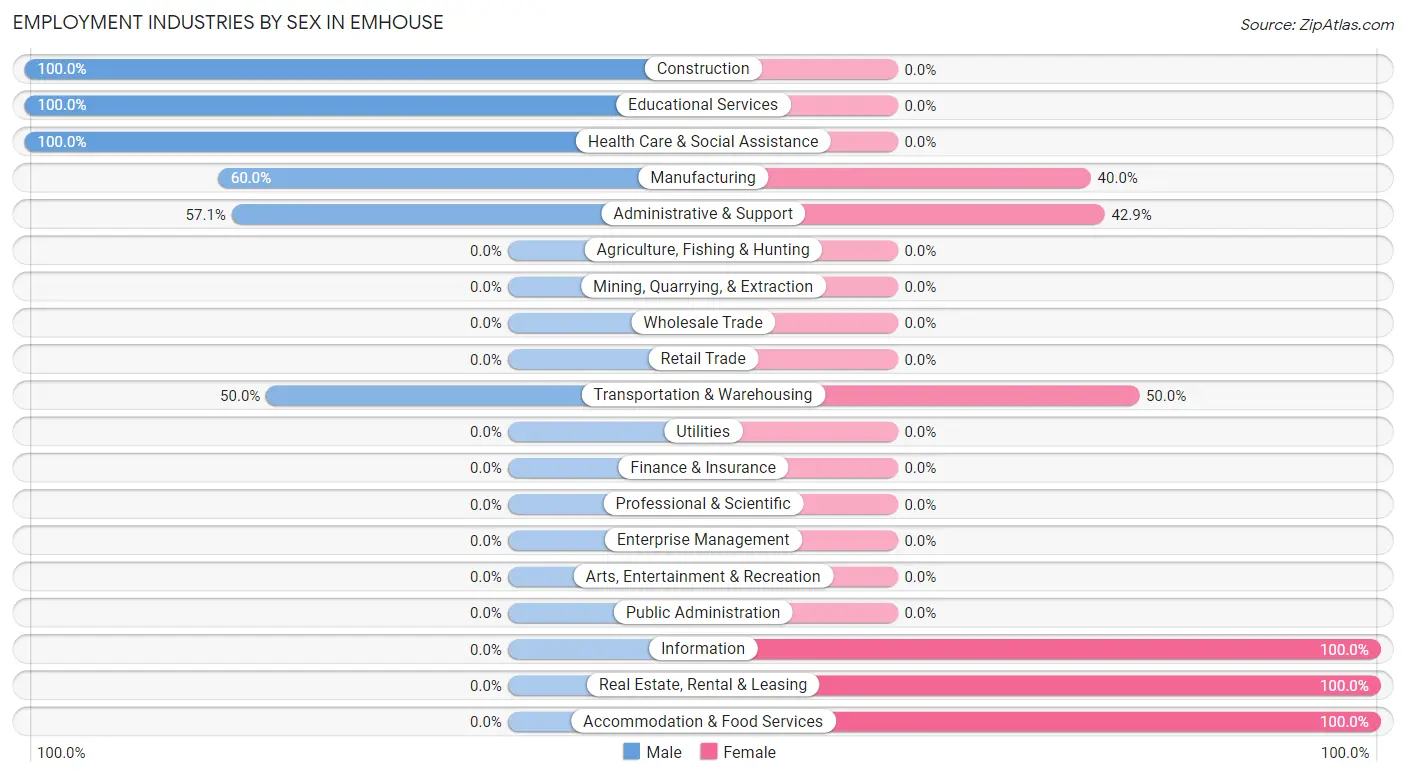
Employment Industries by Sex in Emhouse
The Emhouse industries that see more men than women are Construction (100.0%), Educational Services (100.0%), and Health Care & Social Assistance (100.0%), whereas the industries that tend to have a higher number of women are Information (100.0%), Real Estate, Rental & Leasing (100.0%), and Accommodation & Food Services (100.0%).
| Industry | Male | Female |
| Agriculture, Fishing & Hunting | 0 (0.0%) | 0 (0.0%) |
| Mining, Quarrying, & Extraction | 0 (0.0%) | 0 (0.0%) |
| Construction | 11 (100.0%) | 0 (0.0%) |
| Manufacturing | 9 (60.0%) | 6 (40.0%) |
| Wholesale Trade | 0 (0.0%) | 0 (0.0%) |
| Retail Trade | 0 (0.0%) | 0 (0.0%) |
| Transportation & Warehousing | 2 (50.0%) | 2 (50.0%) |
| Utilities | 0 (0.0%) | 0 (0.0%) |
| Information | 0 (0.0%) | 3 (100.0%) |
| Finance & Insurance | 0 (0.0%) | 0 (0.0%) |
| Real Estate, Rental & Leasing | 0 (0.0%) | 1 (100.0%) |
| Professional & Scientific | 0 (0.0%) | 0 (0.0%) |
| Enterprise Management | 0 (0.0%) | 0 (0.0%) |
| Administrative & Support | 8 (57.1%) | 6 (42.9%) |
| Educational Services | 4 (100.0%) | 0 (0.0%) |
| Health Care & Social Assistance | 5 (100.0%) | 0 (0.0%) |
| Arts, Entertainment & Recreation | 0 (0.0%) | 0 (0.0%) |
| Accommodation & Food Services | 0 (0.0%) | 13 (100.0%) |
| Public Administration | 0 (0.0%) | 0 (0.0%) |
| Total | 47 (60.3%) | 31 (39.7%) |
Education in Emhouse
School Enrollment in Emhouse
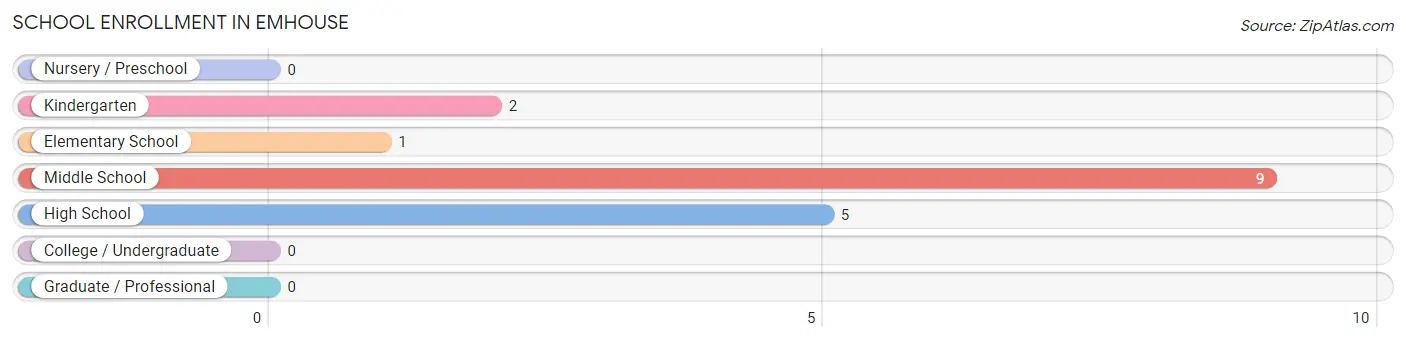
The most common levels of schooling among the 17 students in Emhouse are middle school (9 | 52.9%), high school (5 | 29.4%), and kindergarten (2 | 11.8%).
| School Level | # Students | % Students |
| Nursery / Preschool | 0 | 0.0% |
| Kindergarten | 2 | 11.8% |
| Elementary School | 1 | 5.9% |
| Middle School | 9 | 52.9% |
| High School | 5 | 29.4% |
| College / Undergraduate | 0 | 0.0% |
| Graduate / Professional | 0 | 0.0% |
| Total | 17 | 100.0% |
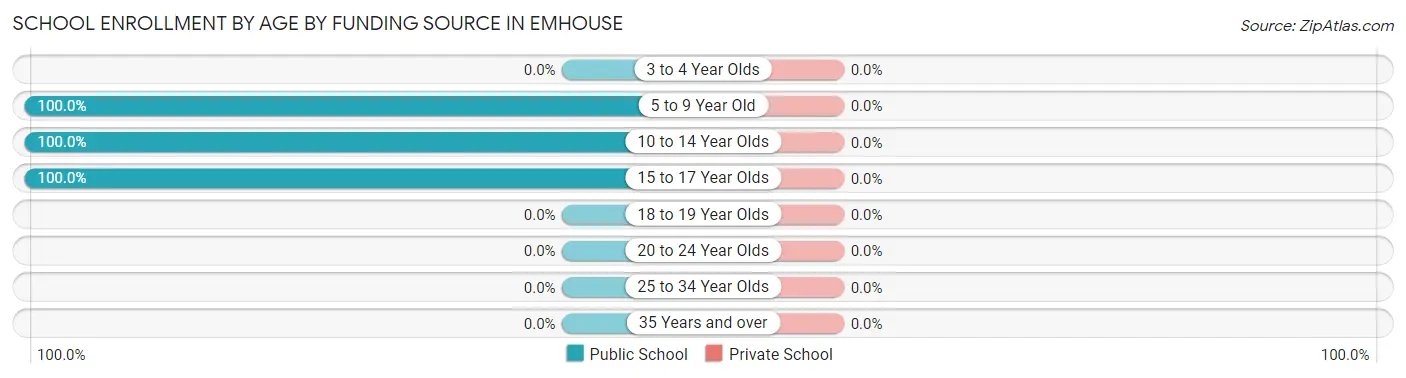
School Enrollment by Age by Funding Source in Emhouse
| Age Bracket | Public School | Private School |
| 3 to 4 Year Olds | 0 (0.0%) | 0 (0.0%) |
| 5 to 9 Year Old | 2 (100.0%) | 0 (0.0%) |
| 10 to 14 Year Olds | 10 (100.0%) | 0 (0.0%) |
| 15 to 17 Year Olds | 5 (100.0%) | 0 (0.0%) |
| 18 to 19 Year Olds | 0 (0.0%) | 0 (0.0%) |
| 20 to 24 Year Olds | 0 (0.0%) | 0 (0.0%) |
| 25 to 34 Year Olds | 0 (0.0%) | 0 (0.0%) |
| 35 Years and over | 0 (0.0%) | 0 (0.0%) |
| Total | 17 (100.0%) | 0 (0.0%) |
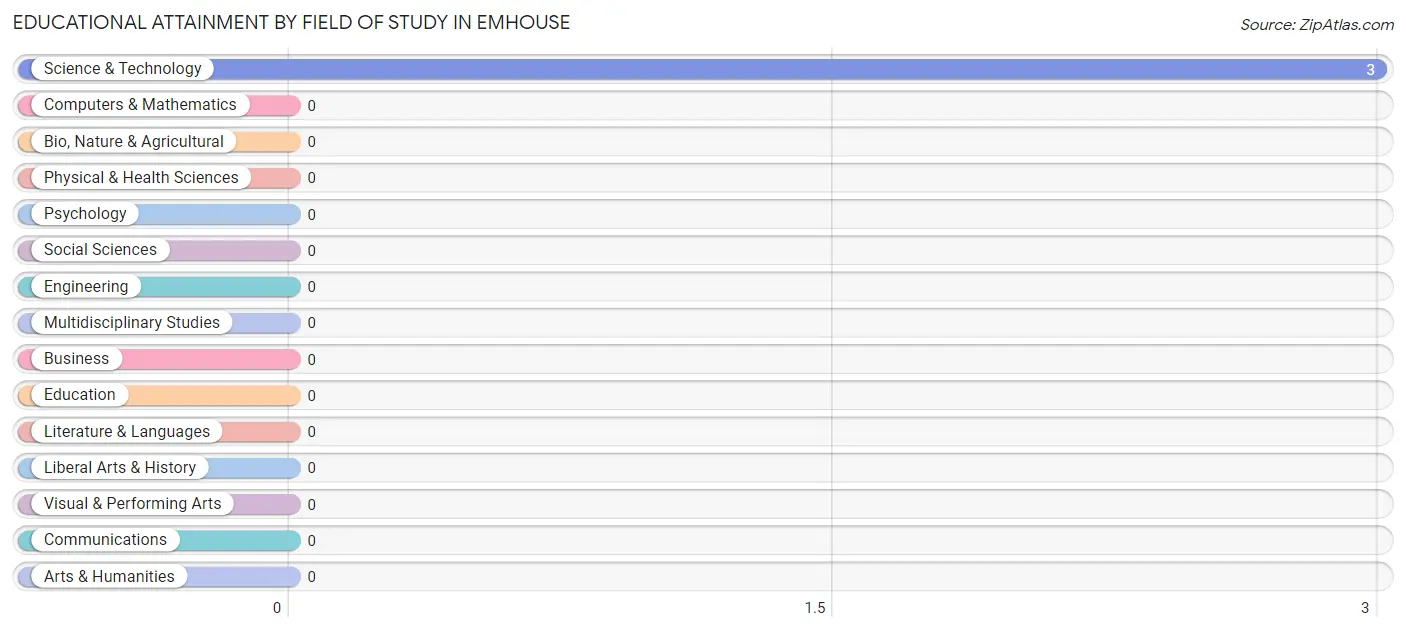
Educational Attainment by Field of Study in Emhouse
, and science & technology (3 | 100.0%) are the most common fields of study among 3 individuals in Emhouse who have obtained a bachelor's degree or higher.
| Field of Study | # Graduates | % Graduates |
| Computers & Mathematics | 0 | 0.0% |
| Bio, Nature & Agricultural | 0 | 0.0% |
| Physical & Health Sciences | 0 | 0.0% |
| Psychology | 0 | 0.0% |
| Social Sciences | 0 | 0.0% |
| Engineering | 0 | 0.0% |
| Multidisciplinary Studies | 0 | 0.0% |
| Science & Technology | 3 | 100.0% |
| Business | 0 | 0.0% |
| Education | 0 | 0.0% |
| Literature & Languages | 0 | 0.0% |
| Liberal Arts & History | 0 | 0.0% |
| Visual & Performing Arts | 0 | 0.0% |
| Communications | 0 | 0.0% |
| Arts & Humanities | 0 | 0.0% |
| Total | 3 | 100.0% |
Transportation & Commute in Emhouse
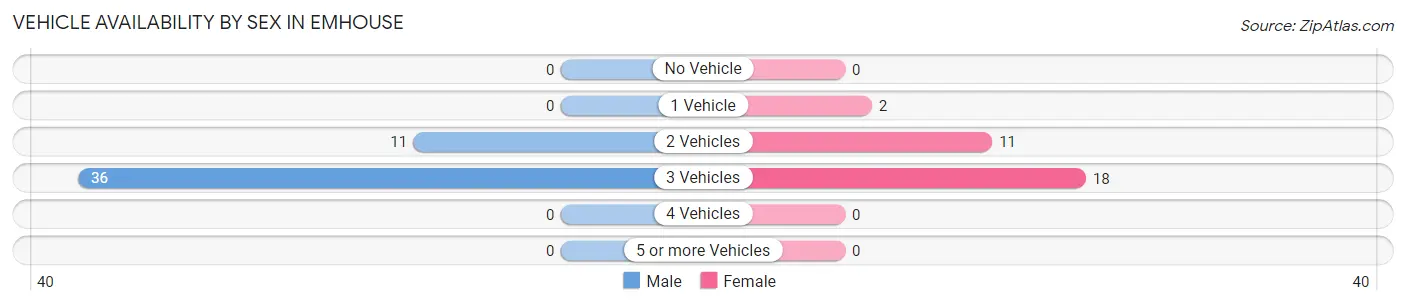
Vehicle Availability by Sex in Emhouse
The most prevalent vehicle ownership categories in Emhouse are males with 3 vehicles (36, accounting for 76.6%) and females with 3 vehicles (18, making up 116.1%).
| Vehicles Available | Male | Female |
| No Vehicle | 0 (0.0%) | 0 (0.0%) |
| 1 Vehicle | 0 (0.0%) | 2 (6.5%) |
| 2 Vehicles | 11 (23.4%) | 11 (35.5%) |
| 3 Vehicles | 36 (76.6%) | 18 (58.1%) |
| 4 Vehicles | 0 (0.0%) | 0 (0.0%) |
| 5 or more Vehicles | 0 (0.0%) | 0 (0.0%) |
| Total | 47 (100.0%) | 31 (100.0%) |
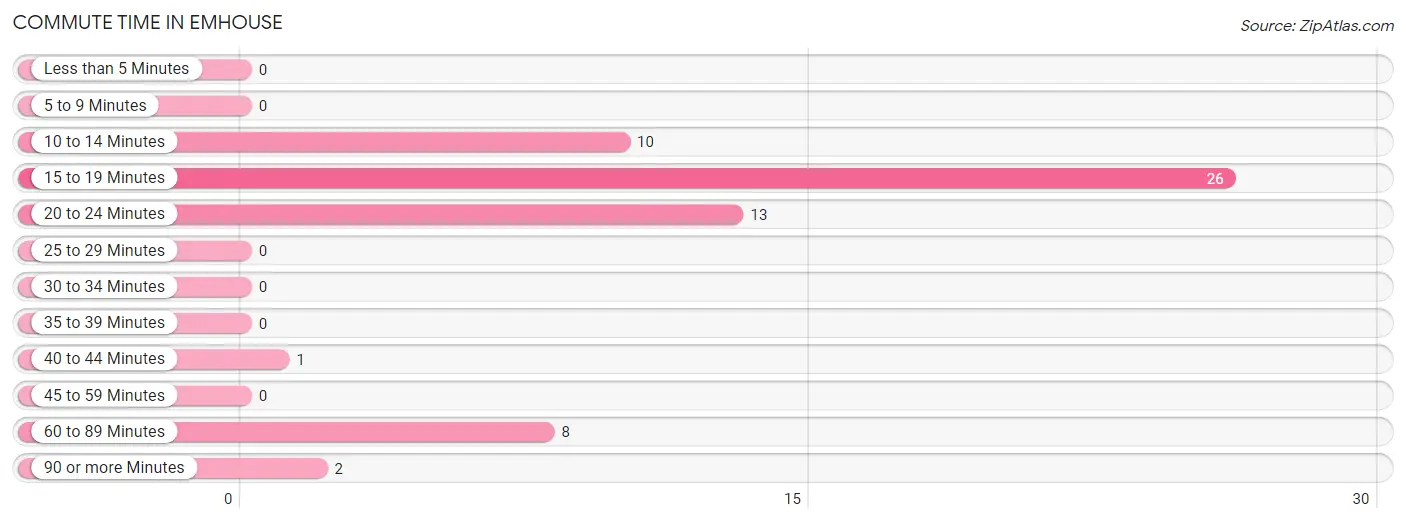
Commute Time in Emhouse
The most frequently occuring commute durations in Emhouse are 15 to 19 minutes (26 commuters, 43.3%), 20 to 24 minutes (13 commuters, 21.7%), and 10 to 14 minutes (10 commuters, 16.7%).
| Commute Time | # Commuters | % Commuters |
| Less than 5 Minutes | 0 | 0.0% |
| 5 to 9 Minutes | 0 | 0.0% |
| 10 to 14 Minutes | 10 | 16.7% |
| 15 to 19 Minutes | 26 | 43.3% |
| 20 to 24 Minutes | 13 | 21.7% |
| 25 to 29 Minutes | 0 | 0.0% |
| 30 to 34 Minutes | 0 | 0.0% |
| 35 to 39 Minutes | 0 | 0.0% |
| 40 to 44 Minutes | 1 | 1.7% |
| 45 to 59 Minutes | 0 | 0.0% |
| 60 to 89 Minutes | 8 | 13.3% |
| 90 or more Minutes | 2 | 3.3% |
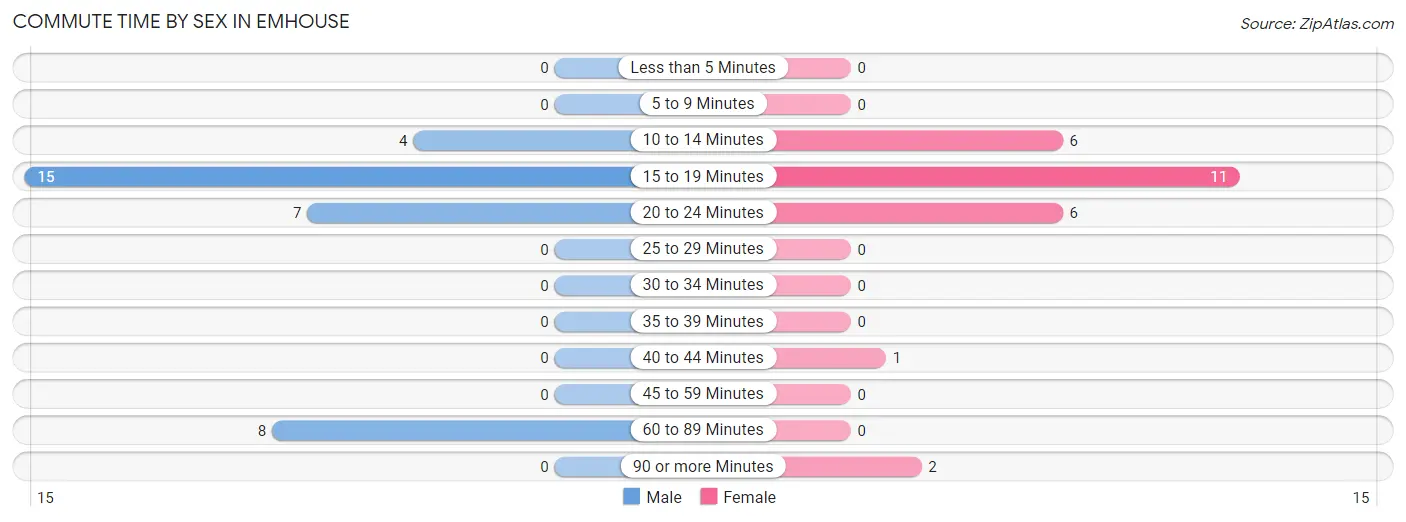
Commute Time by Sex in Emhouse
The most common commute times in Emhouse are 15 to 19 minutes (15 commuters, 44.1%) for males and 15 to 19 minutes (11 commuters, 42.3%) for females.
| Commute Time | Male | Female |
| Less than 5 Minutes | 0 (0.0%) | 0 (0.0%) |
| 5 to 9 Minutes | 0 (0.0%) | 0 (0.0%) |
| 10 to 14 Minutes | 4 (11.8%) | 6 (23.1%) |
| 15 to 19 Minutes | 15 (44.1%) | 11 (42.3%) |
| 20 to 24 Minutes | 7 (20.6%) | 6 (23.1%) |
| 25 to 29 Minutes | 0 (0.0%) | 0 (0.0%) |
| 30 to 34 Minutes | 0 (0.0%) | 0 (0.0%) |
| 35 to 39 Minutes | 0 (0.0%) | 0 (0.0%) |
| 40 to 44 Minutes | 0 (0.0%) | 1 (3.8%) |
| 45 to 59 Minutes | 0 (0.0%) | 0 (0.0%) |
| 60 to 89 Minutes | 8 (23.5%) | 0 (0.0%) |
| 90 or more Minutes | 0 (0.0%) | 2 (7.7%) |
Time of Departure to Work by Sex in Emhouse
The most frequent times of departure to work in Emhouse are 12:00 AM to 4:59 AM (17, 50.0%) for males and 10:00 AM to 10:59 AM (11, 42.3%) for females.
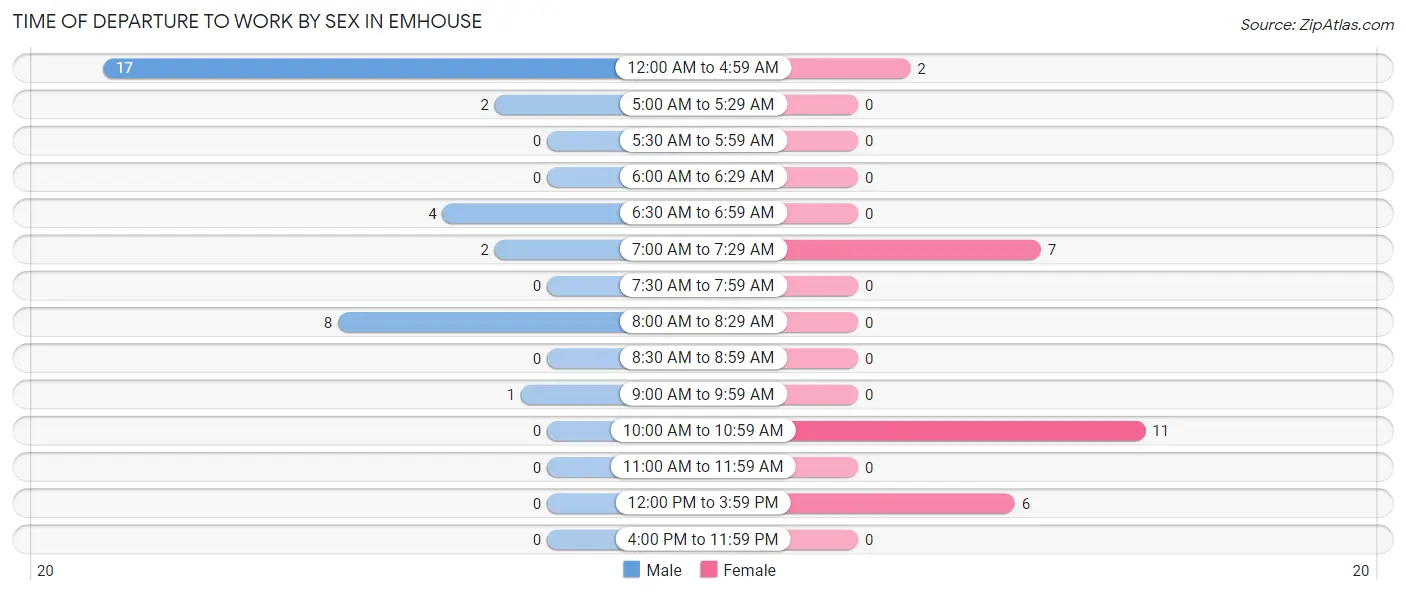
| Time of Departure | Male | Female |
| 12:00 AM to 4:59 AM | 17 (50.0%) | 2 (7.7%) |
| 5:00 AM to 5:29 AM | 2 (5.9%) | 0 (0.0%) |
| 5:30 AM to 5:59 AM | 0 (0.0%) | 0 (0.0%) |
| 6:00 AM to 6:29 AM | 0 (0.0%) | 0 (0.0%) |
| 6:30 AM to 6:59 AM | 4 (11.8%) | 0 (0.0%) |
| 7:00 AM to 7:29 AM | 2 (5.9%) | 7 (26.9%) |
| 7:30 AM to 7:59 AM | 0 (0.0%) | 0 (0.0%) |
| 8:00 AM to 8:29 AM | 8 (23.5%) | 0 (0.0%) |
| 8:30 AM to 8:59 AM | 0 (0.0%) | 0 (0.0%) |
| 9:00 AM to 9:59 AM | 1 (2.9%) | 0 (0.0%) |
| 10:00 AM to 10:59 AM | 0 (0.0%) | 11 (42.3%) |
| 11:00 AM to 11:59 AM | 0 (0.0%) | 0 (0.0%) |
| 12:00 PM to 3:59 PM | 0 (0.0%) | 6 (23.1%) |
| 4:00 PM to 11:59 PM | 0 (0.0%) | 0 (0.0%) |
| Total | 34 (100.0%) | 26 (100.0%) |
Housing Occupancy in Emhouse
Occupancy by Ownership in Emhouse
Of the total 46 dwellings in Emhouse, owner-occupied units account for 40 (87.0%), while renter-occupied units make up 6 (13.0%).
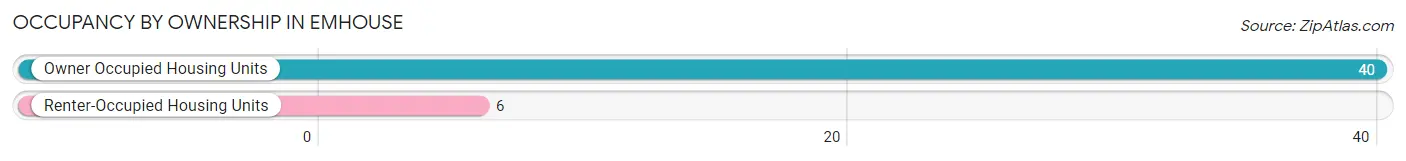
| Occupancy | # Housing Units | % Housing Units |
| Owner Occupied Housing Units | 40 | 87.0% |
| Renter-Occupied Housing Units | 6 | 13.0% |
| Total Occupied Housing Units | 46 | 100.0% |
Occupancy by Household Size in Emhouse
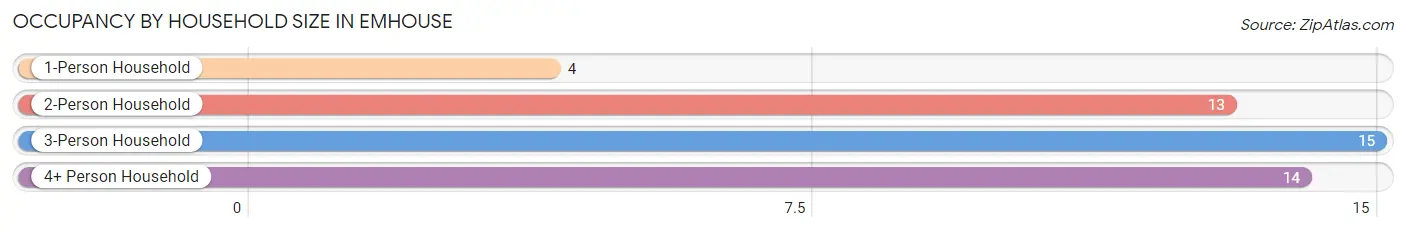
| Household Size | # Housing Units | % Housing Units |
| 1-Person Household | 4 | 8.7% |
| 2-Person Household | 13 | 28.3% |
| 3-Person Household | 15 | 32.6% |
| 4+ Person Household | 14 | 30.4% |
| Total Housing Units | 46 | 100.0% |
Occupancy by Ownership by Household Size in Emhouse
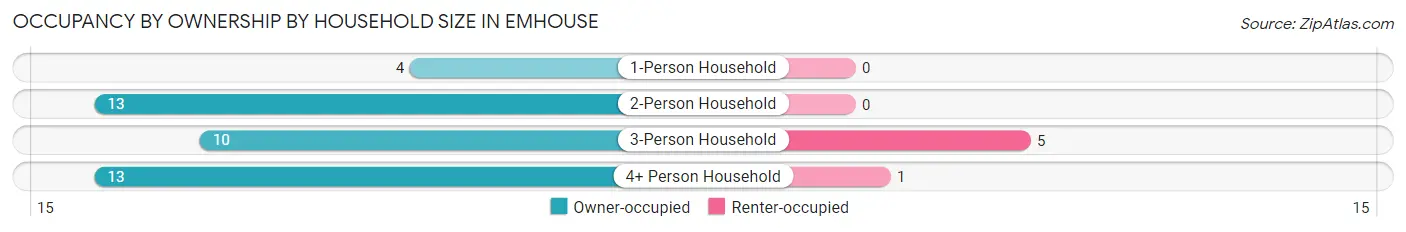
| Household Size | Owner-occupied | Renter-occupied |
| 1-Person Household | 4 (100.0%) | 0 (0.0%) |
| 2-Person Household | 13 (100.0%) | 0 (0.0%) |
| 3-Person Household | 10 (66.7%) | 5 (33.3%) |
| 4+ Person Household | 13 (92.9%) | 1 (7.1%) |
| Total Housing Units | 40 (87.0%) | 6 (13.0%) |
Occupancy by Educational Attainment in Emhouse
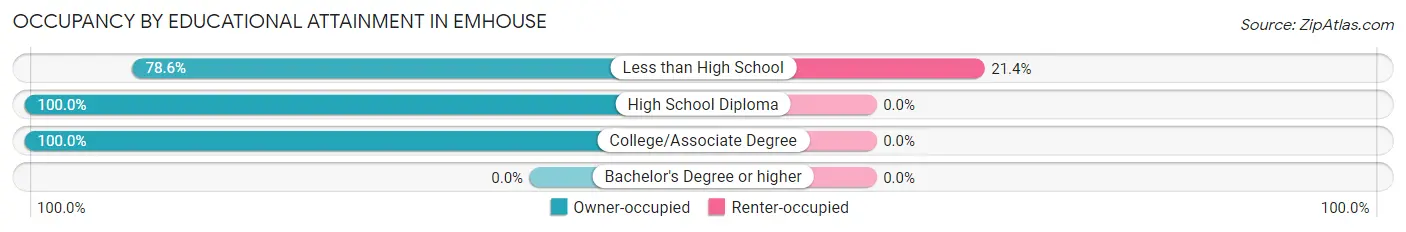
| Household Size | Owner-occupied | Renter-occupied |
| Less than High School | 22 (78.6%) | 6 (21.4%) |
| High School Diploma | 4 (100.0%) | 0 (0.0%) |
| College/Associate Degree | 14 (100.0%) | 0 (0.0%) |
| Bachelor's Degree or higher | 0 (0.0%) | 0 (0.0%) |
Occupancy by Age of Householder in Emhouse
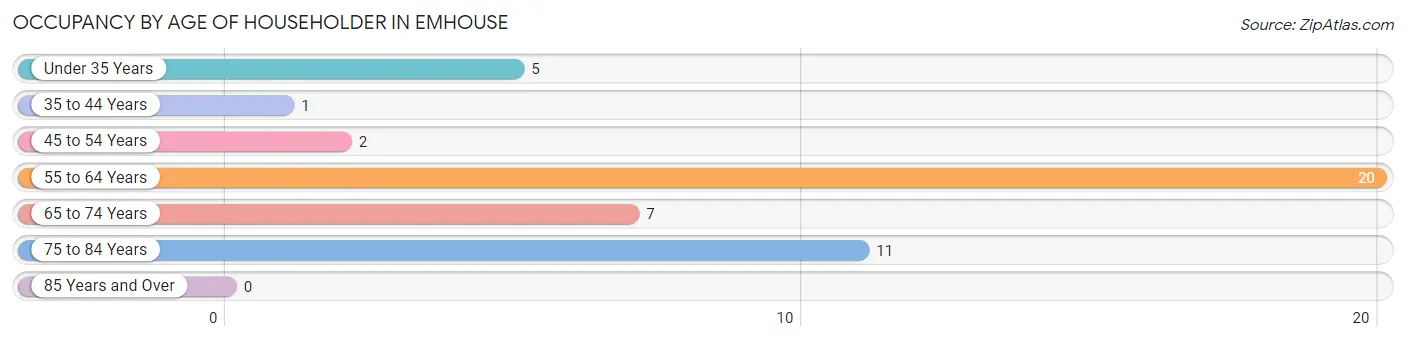
| Age Bracket | # Households | % Households |
| Under 35 Years | 5 | 10.9% |
| 35 to 44 Years | 1 | 2.2% |
| 45 to 54 Years | 2 | 4.3% |
| 55 to 64 Years | 20 | 43.5% |
| 65 to 74 Years | 7 | 15.2% |
| 75 to 84 Years | 11 | 23.9% |
| 85 Years and Over | 0 | 0.0% |
| Total | 46 | 100.0% |
Housing Finances in Emhouse
Median Income by Occupancy in Emhouse
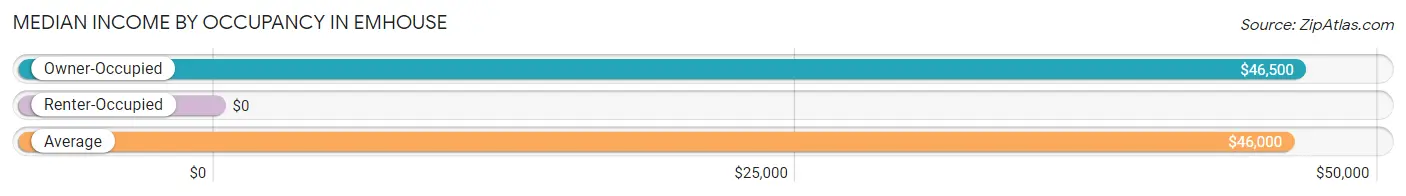
| Occupancy Type | # Households | Median Income |
| Owner-Occupied | 40 (87.0%) | $46,500 |
| Renter-Occupied | 6 (13.0%) | $0 |
| Average | 46 (100.0%) | $46,000 |
Occupancy by Householder Income Bracket in Emhouse
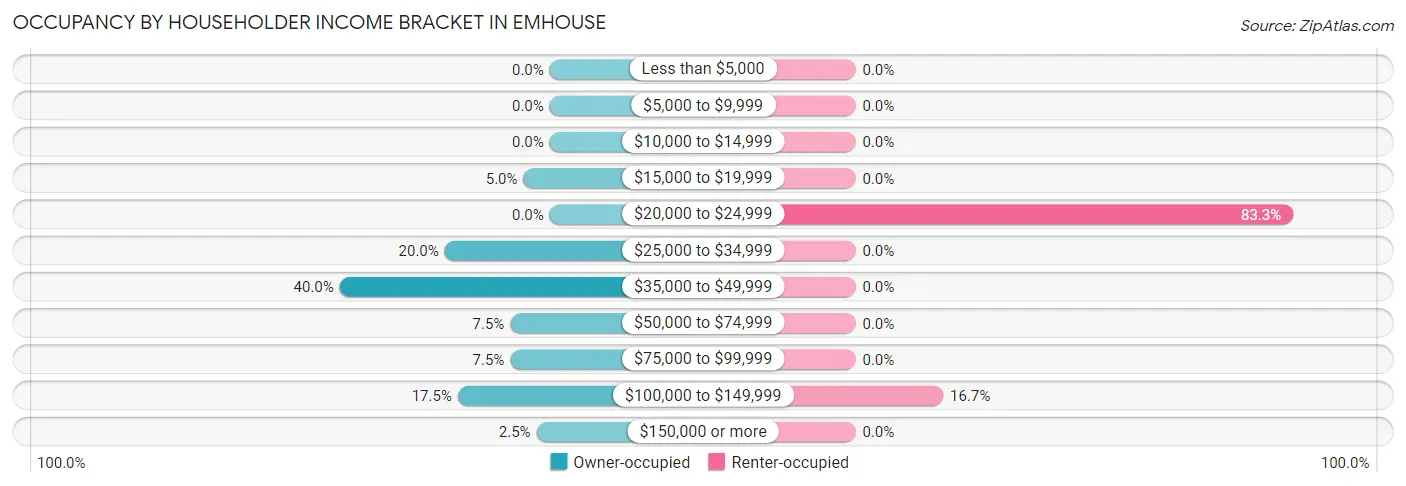
| Income Bracket | Owner-occupied | Renter-occupied |
| Less than $5,000 | 0 (0.0%) | 0 (0.0%) |
| $5,000 to $9,999 | 0 (0.0%) | 0 (0.0%) |
| $10,000 to $14,999 | 0 (0.0%) | 0 (0.0%) |
| $15,000 to $19,999 | 2 (5.0%) | 0 (0.0%) |
| $20,000 to $24,999 | 0 (0.0%) | 5 (83.3%) |
| $25,000 to $34,999 | 8 (20.0%) | 0 (0.0%) |
| $35,000 to $49,999 | 16 (40.0%) | 0 (0.0%) |
| $50,000 to $74,999 | 3 (7.5%) | 0 (0.0%) |
| $75,000 to $99,999 | 3 (7.5%) | 0 (0.0%) |
| $100,000 to $149,999 | 7 (17.5%) | 1 (16.7%) |
| $150,000 or more | 1 (2.5%) | 0 (0.0%) |
| Total | 40 (100.0%) | 6 (100.0%) |
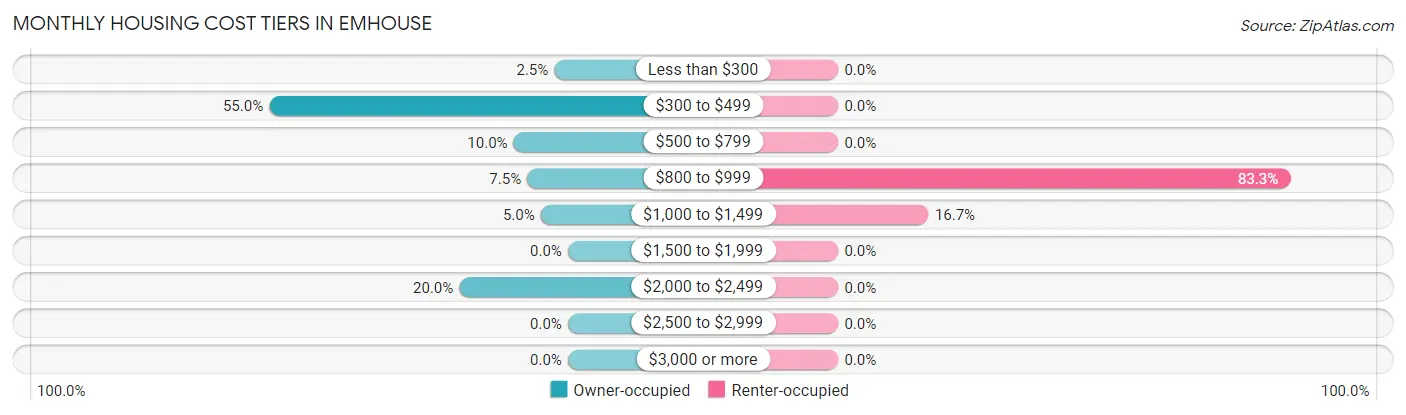
Monthly Housing Cost Tiers in Emhouse
| Monthly Cost | Owner-occupied | Renter-occupied |
| Less than $300 | 1 (2.5%) | 0 (0.0%) |
| $300 to $499 | 22 (55.0%) | 0 (0.0%) |
| $500 to $799 | 4 (10.0%) | 0 (0.0%) |
| $800 to $999 | 3 (7.5%) | 5 (83.3%) |
| $1,000 to $1,499 | 2 (5.0%) | 1 (16.7%) |
| $1,500 to $1,999 | 0 (0.0%) | 0 (0.0%) |
| $2,000 to $2,499 | 8 (20.0%) | 0 (0.0%) |
| $2,500 to $2,999 | 0 (0.0%) | 0 (0.0%) |
| $3,000 or more | 0 (0.0%) | 0 (0.0%) |
| Total | 40 (100.0%) | 6 (100.0%) |
Physical Housing Characteristics in Emhouse
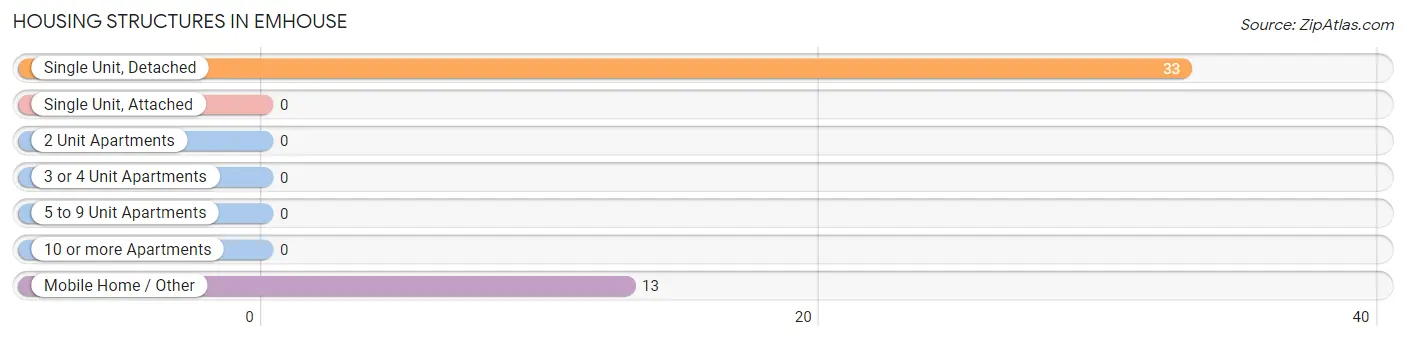
Housing Structures in Emhouse
| Structure Type | # Housing Units | % Housing Units |
| Single Unit, Detached | 33 | 71.7% |
| Single Unit, Attached | 0 | 0.0% |
| 2 Unit Apartments | 0 | 0.0% |
| 3 or 4 Unit Apartments | 0 | 0.0% |
| 5 to 9 Unit Apartments | 0 | 0.0% |
| 10 or more Apartments | 0 | 0.0% |
| Mobile Home / Other | 13 | 28.3% |
| Total | 46 | 100.0% |
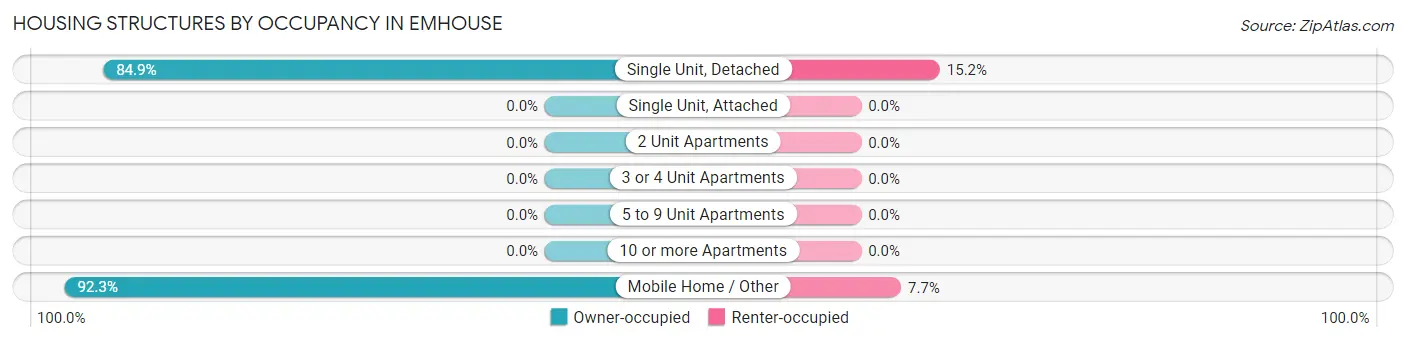
Housing Structures by Occupancy in Emhouse
| Structure Type | Owner-occupied | Renter-occupied |
| Single Unit, Detached | 28 (84.9%) | 5 (15.1%) |
| Single Unit, Attached | 0 (0.0%) | 0 (0.0%) |
| 2 Unit Apartments | 0 (0.0%) | 0 (0.0%) |
| 3 or 4 Unit Apartments | 0 (0.0%) | 0 (0.0%) |
| 5 to 9 Unit Apartments | 0 (0.0%) | 0 (0.0%) |
| 10 or more Apartments | 0 (0.0%) | 0 (0.0%) |
| Mobile Home / Other | 12 (92.3%) | 1 (7.7%) |
| Total | 40 (87.0%) | 6 (13.0%) |
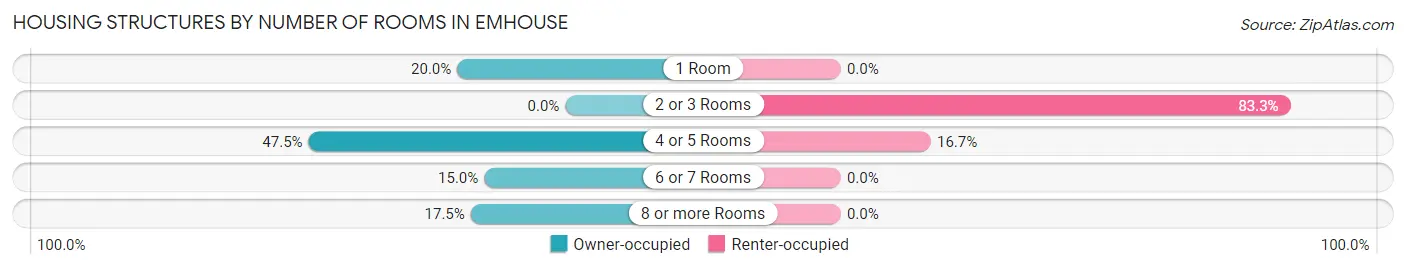
Housing Structures by Number of Rooms in Emhouse
| Number of Rooms | Owner-occupied | Renter-occupied |
| 1 Room | 8 (20.0%) | 0 (0.0%) |
| 2 or 3 Rooms | 0 (0.0%) | 5 (83.3%) |
| 4 or 5 Rooms | 19 (47.5%) | 1 (16.7%) |
| 6 or 7 Rooms | 6 (15.0%) | 0 (0.0%) |
| 8 or more Rooms | 7 (17.5%) | 0 (0.0%) |
| Total | 40 (100.0%) | 6 (100.0%) |
Housing Structure by Heating Type in Emhouse
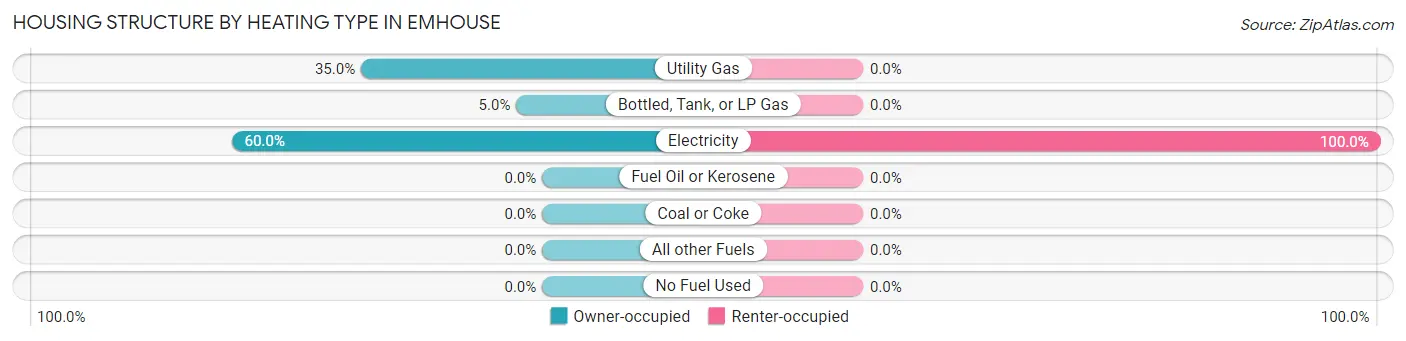
| Heating Type | Owner-occupied | Renter-occupied |
| Utility Gas | 14 (35.0%) | 0 (0.0%) |
| Bottled, Tank, or LP Gas | 2 (5.0%) | 0 (0.0%) |
| Electricity | 24 (60.0%) | 6 (100.0%) |
| Fuel Oil or Kerosene | 0 (0.0%) | 0 (0.0%) |
| Coal or Coke | 0 (0.0%) | 0 (0.0%) |
| All other Fuels | 0 (0.0%) | 0 (0.0%) |
| No Fuel Used | 0 (0.0%) | 0 (0.0%) |
| Total | 40 (100.0%) | 6 (100.0%) |
Household Vehicle Usage in Emhouse
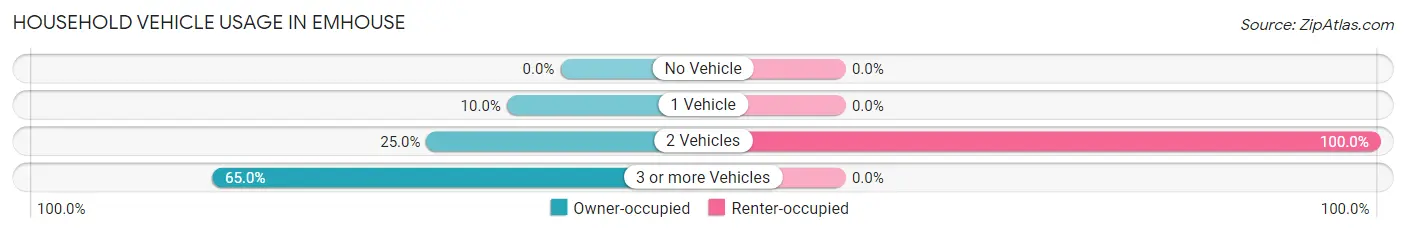
| Vehicles per Household | Owner-occupied | Renter-occupied |
| No Vehicle | 0 (0.0%) | 0 (0.0%) |
| 1 Vehicle | 4 (10.0%) | 0 (0.0%) |
| 2 Vehicles | 10 (25.0%) | 6 (100.0%) |
| 3 or more Vehicles | 26 (65.0%) | 0 (0.0%) |
| Total | 40 (100.0%) | 6 (100.0%) |
Real Estate & Mortgages in Emhouse
Real Estate and Mortgage Overview in Emhouse
| Characteristic | Without Mortgage | With Mortgage |
| Housing Units | 29 | 11 |
| Median Property Value | $82,500 | $117,200 |
| Median Household Income | $45,125 | $1 |
| Monthly Housing Costs | $429 | $0 |
| Real Estate Taxes | - | - |
Property Value by Mortgage Status in Emhouse
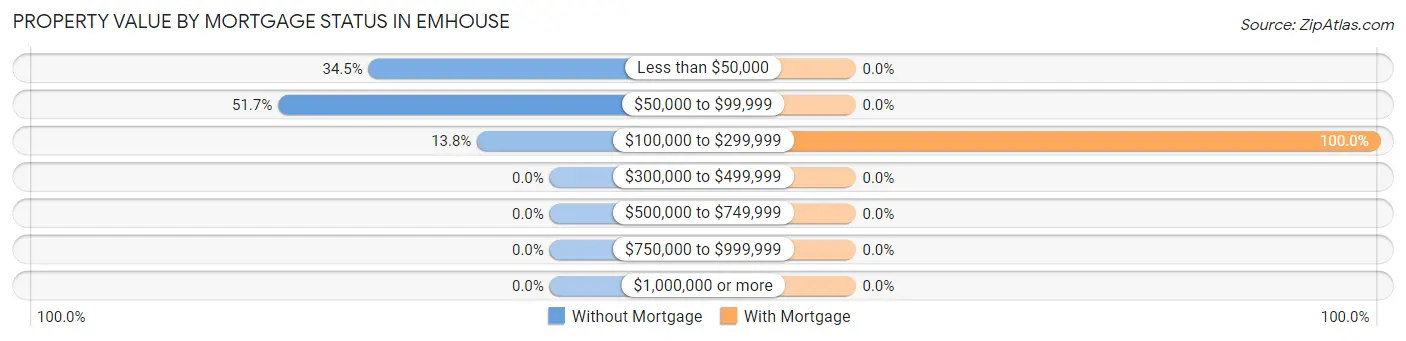
| Property Value | Without Mortgage | With Mortgage |
| Less than $50,000 | 10 (34.5%) | 0 (0.0%) |
| $50,000 to $99,999 | 15 (51.7%) | 0 (0.0%) |
| $100,000 to $299,999 | 4 (13.8%) | 11 (100.0%) |
| $300,000 to $499,999 | 0 (0.0%) | 0 (0.0%) |
| $500,000 to $749,999 | 0 (0.0%) | 0 (0.0%) |
| $750,000 to $999,999 | 0 (0.0%) | 0 (0.0%) |
| $1,000,000 or more | 0 (0.0%) | 0 (0.0%) |
| Total | 29 (100.0%) | 11 (100.0%) |
Household Income by Mortgage Status in Emhouse
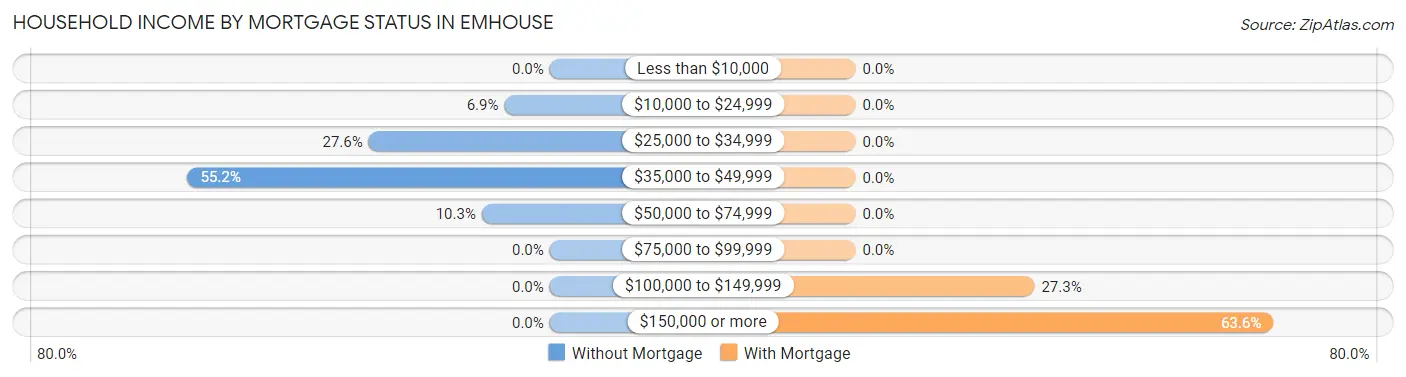
| Household Income | Without Mortgage | With Mortgage |
| Less than $10,000 | 0 (0.0%) | 0 (0.0%) |
| $10,000 to $24,999 | 2 (6.9%) | 0 (0.0%) |
| $25,000 to $34,999 | 8 (27.6%) | 0 (0.0%) |
| $35,000 to $49,999 | 16 (55.2%) | 0 (0.0%) |
| $50,000 to $74,999 | 3 (10.3%) | 0 (0.0%) |
| $75,000 to $99,999 | 0 (0.0%) | 0 (0.0%) |
| $100,000 to $149,999 | 0 (0.0%) | 3 (27.3%) |
| $150,000 or more | 0 (0.0%) | 7 (63.6%) |
| Total | 29 (100.0%) | 11 (100.0%) |
Property Value to Household Income Ratio in Emhouse
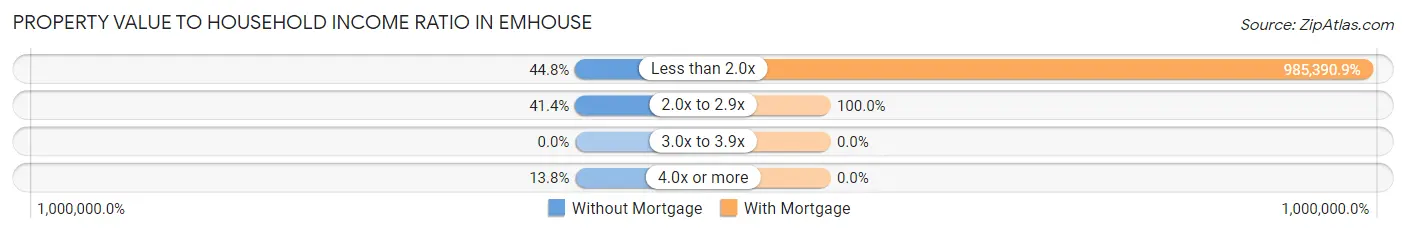
| Value-to-Income Ratio | Without Mortgage | With Mortgage |
| Less than 2.0x | 13 (44.8%) | 108,393 (985,390.9%) |
| 2.0x to 2.9x | 12 (41.4%) | 11 (100.0%) |
| 3.0x to 3.9x | 0 (0.0%) | 0 (0.0%) |
| 4.0x or more | 4 (13.8%) | 0 (0.0%) |
| Total | 29 (100.0%) | 11 (100.0%) |
Real Estate Taxes by Mortgage Status in Emhouse
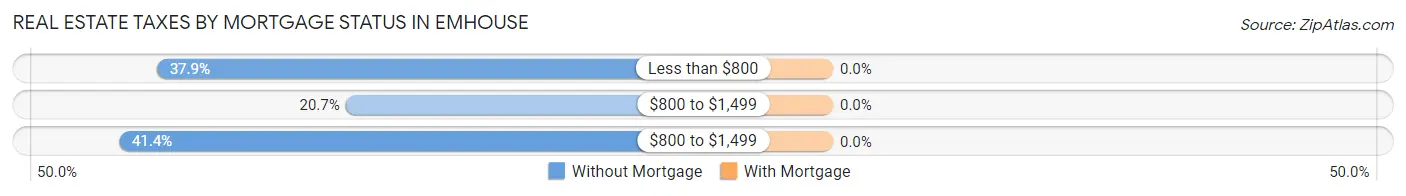
| Property Taxes | Without Mortgage | With Mortgage |
| Less than $800 | 11 (37.9%) | 0 (0.0%) |
| $800 to $1,499 | 6 (20.7%) | 0 (0.0%) |
| $800 to $1,499 | 12 (41.4%) | 0 (0.0%) |
| Total | 29 (100.0%) | 11 (100.0%) |
Health & Disability in Emhouse
Health Insurance Coverage by Age in Emhouse
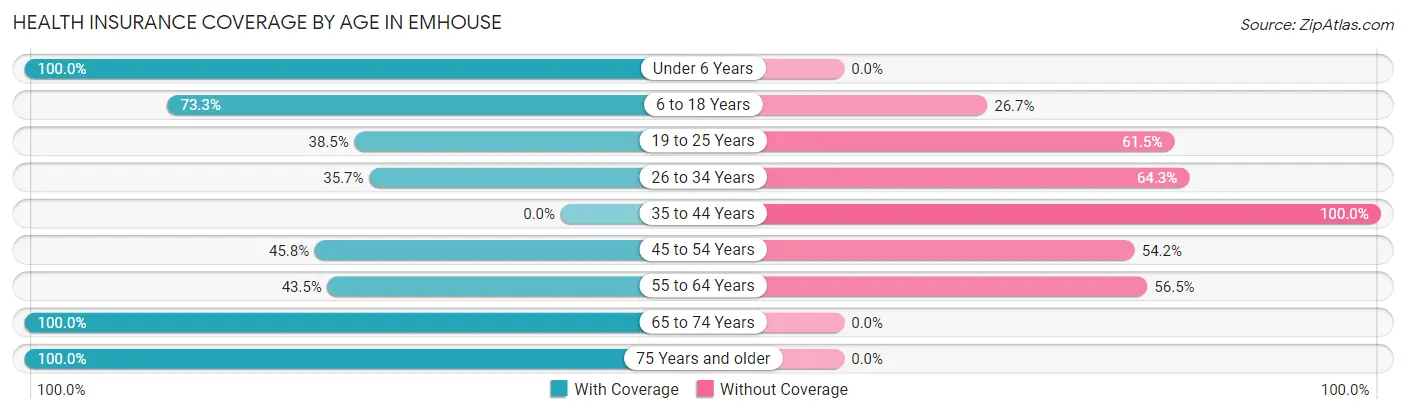
| Age Bracket | With Coverage | Without Coverage |
| Under 6 Years | 14 (100.0%) | 0 (0.0%) |
| 6 to 18 Years | 11 (73.3%) | 4 (26.7%) |
| 19 to 25 Years | 15 (38.5%) | 24 (61.5%) |
| 26 to 34 Years | 5 (35.7%) | 9 (64.3%) |
| 35 to 44 Years | 0 (0.0%) | 7 (100.0%) |
| 45 to 54 Years | 11 (45.8%) | 13 (54.2%) |
| 55 to 64 Years | 10 (43.5%) | 13 (56.5%) |
| 65 to 74 Years | 13 (100.0%) | 0 (0.0%) |
| 75 Years and older | 11 (100.0%) | 0 (0.0%) |
| Total | 90 (56.2%) | 70 (43.8%) |
Health Insurance Coverage by Citizenship Status in Emhouse
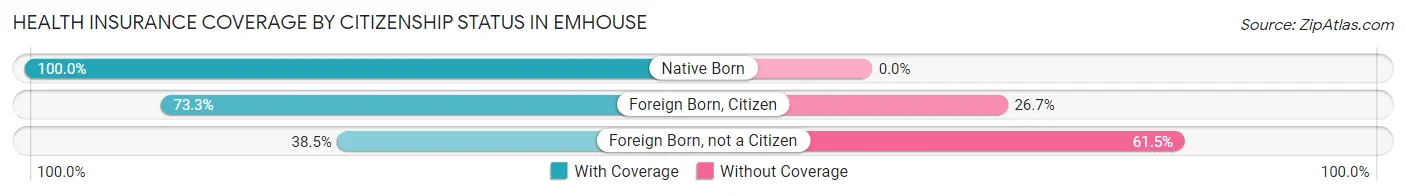
| Citizenship Status | With Coverage | Without Coverage |
| Native Born | 14 (100.0%) | 0 (0.0%) |
| Foreign Born, Citizen | 11 (73.3%) | 4 (26.7%) |
| Foreign Born, not a Citizen | 15 (38.5%) | 24 (61.5%) |
Health Insurance Coverage by Household Income in Emhouse
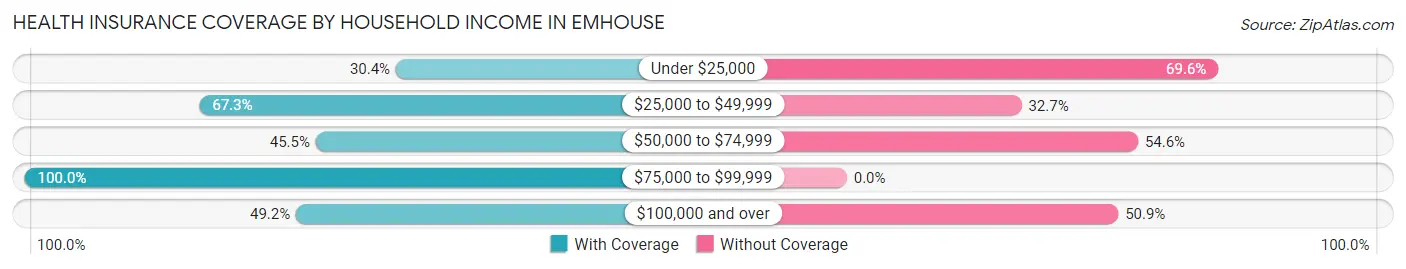
| Household Income | With Coverage | Without Coverage |
| Under $25,000 | 7 (30.4%) | 16 (69.6%) |
| $25,000 to $49,999 | 37 (67.3%) | 18 (32.7%) |
| $50,000 to $74,999 | 5 (45.5%) | 6 (54.5%) |
| $75,000 to $99,999 | 12 (100.0%) | 0 (0.0%) |
| $100,000 and over | 29 (49.1%) | 30 (50.8%) |
Public vs Private Health Insurance Coverage by Age in Emhouse
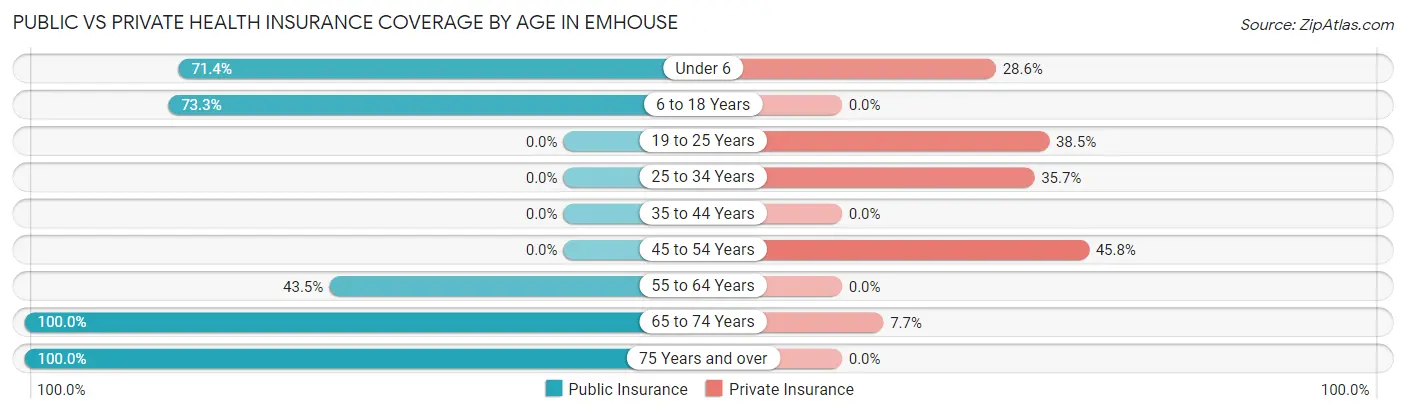
| Age Bracket | Public Insurance | Private Insurance |
| Under 6 | 10 (71.4%) | 4 (28.6%) |
| 6 to 18 Years | 11 (73.3%) | 0 (0.0%) |
| 19 to 25 Years | 0 (0.0%) | 15 (38.5%) |
| 25 to 34 Years | 0 (0.0%) | 5 (35.7%) |
| 35 to 44 Years | 0 (0.0%) | 0 (0.0%) |
| 45 to 54 Years | 0 (0.0%) | 11 (45.8%) |
| 55 to 64 Years | 10 (43.5%) | 0 (0.0%) |
| 65 to 74 Years | 13 (100.0%) | 1 (7.7%) |
| 75 Years and over | 11 (100.0%) | 0 (0.0%) |
| Total | 55 (34.4%) | 36 (22.5%) |
Disability Status by Sex by Age in Emhouse
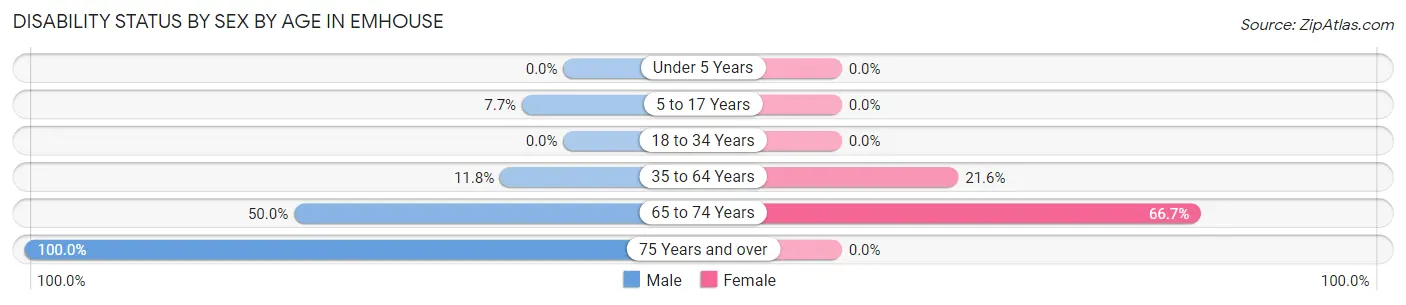
| Age Bracket | Male | Female |
| Under 5 Years | 0 (0.0%) | 0 (0.0%) |
| 5 to 17 Years | 1 (7.7%) | 0 (0.0%) |
| 18 to 34 Years | 0 (0.0%) | 0 (0.0%) |
| 35 to 64 Years | 2 (11.8%) | 8 (21.6%) |
| 65 to 74 Years | 5 (50.0%) | 2 (66.7%) |
| 75 Years and over | 7 (100.0%) | 0 (0.0%) |
Disability Class by Sex by Age in Emhouse
Disability Class: Hearing Difficulty
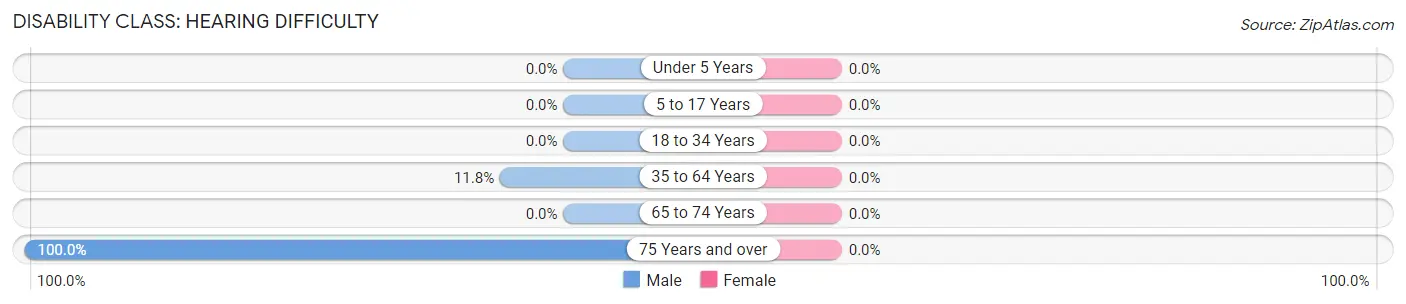
| Age Bracket | Male | Female |
| Under 5 Years | 0 (0.0%) | 0 (0.0%) |
| 5 to 17 Years | 0 (0.0%) | 0 (0.0%) |
| 18 to 34 Years | 0 (0.0%) | 0 (0.0%) |
| 35 to 64 Years | 2 (11.8%) | 0 (0.0%) |
| 65 to 74 Years | 0 (0.0%) | 0 (0.0%) |
| 75 Years and over | 7 (100.0%) | 0 (0.0%) |
Disability Class: Vision Difficulty
| Age Bracket | Male | Female |
| Under 5 Years | 0 (0.0%) | 0 (0.0%) |
| 5 to 17 Years | 0 (0.0%) | 0 (0.0%) |
| 18 to 34 Years | 0 (0.0%) | 0 (0.0%) |
| 35 to 64 Years | 0 (0.0%) | 0 (0.0%) |
| 65 to 74 Years | 0 (0.0%) | 0 (0.0%) |
| 75 Years and over | 0 (0.0%) | 0 (0.0%) |
Disability Class: Cognitive Difficulty
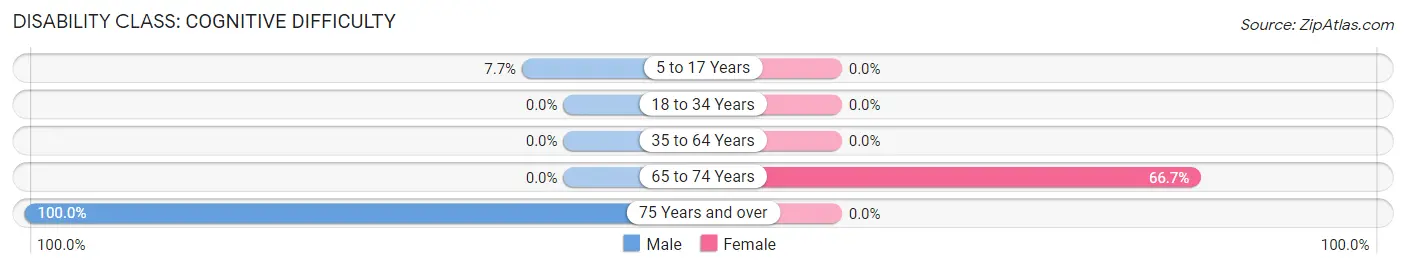
| Age Bracket | Male | Female |
| 5 to 17 Years | 1 (7.7%) | 0 (0.0%) |
| 18 to 34 Years | 0 (0.0%) | 0 (0.0%) |
| 35 to 64 Years | 0 (0.0%) | 0 (0.0%) |
| 65 to 74 Years | 0 (0.0%) | 2 (66.7%) |
| 75 Years and over | 7 (100.0%) | 0 (0.0%) |
Disability Class: Ambulatory Difficulty
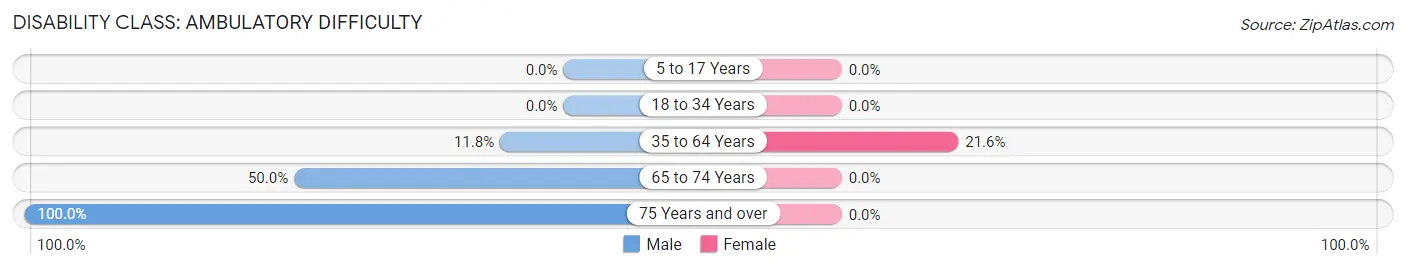
| Age Bracket | Male | Female |
| 5 to 17 Years | 0 (0.0%) | 0 (0.0%) |
| 18 to 34 Years | 0 (0.0%) | 0 (0.0%) |
| 35 to 64 Years | 2 (11.8%) | 8 (21.6%) |
| 65 to 74 Years | 5 (50.0%) | 0 (0.0%) |
| 75 Years and over | 7 (100.0%) | 0 (0.0%) |
Disability Class: Self-Care Difficulty
| Age Bracket | Male | Female |
| 5 to 17 Years | 0 (0.0%) | 0 (0.0%) |
| 18 to 34 Years | 0 (0.0%) | 0 (0.0%) |
| 35 to 64 Years | 0 (0.0%) | 0 (0.0%) |
| 65 to 74 Years | 0 (0.0%) | 0 (0.0%) |
| 75 Years and over | 0 (0.0%) | 0 (0.0%) |
Technology Access in Emhouse
Computing Device Access in Emhouse
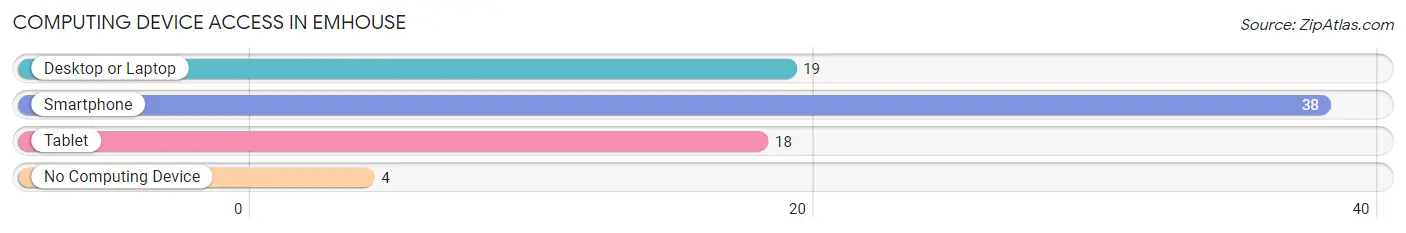
| Device Type | # Households | % Households |
| Desktop or Laptop | 19 | 41.3% |
| Smartphone | 38 | 82.6% |
| Tablet | 18 | 39.1% |
| No Computing Device | 4 | 8.7% |
| Total | 46 | 100.0% |
Internet Access in Emhouse
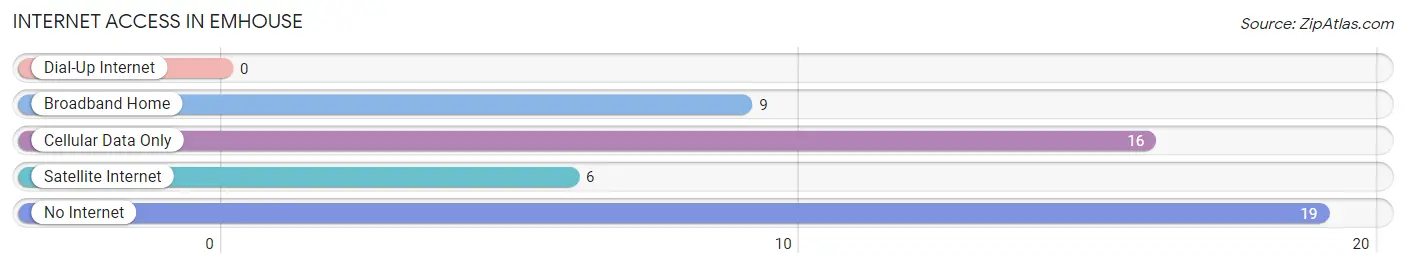
| Internet Type | # Households | % Households |
| Dial-Up Internet | 0 | 0.0% |
| Broadband Home | 9 | 19.6% |
| Cellular Data Only | 16 | 34.8% |
| Satellite Internet | 6 | 13.0% |
| No Internet | 19 | 41.3% |
| Total | 46 | 100.0% |
Emhouse Summary
Emhouse is a small unincorporated community located in Navarro County, Texas, United States. It is situated along State Highway 22, approximately 8 miles east of Corsicana and about 50 miles south of Dallas. The population of Emhouse was estimated to be around 200 in 2020.
Geography
Emhouse is located at 32°02'45"N, 96°30'45"W (32.04583, -96.51250). It is situated along State Highway 22, approximately 8 miles east of Corsicana and about 50 miles south of Dallas. The terrain is mostly flat with some rolling hills. The area is mostly rural, with some small farms and ranches. The climate is humid subtropical, with hot summers and mild winters.
History
Emhouse was founded in the late 1800s by a group of settlers from Tennessee. The town was named after the Emhouse family, who were among the first settlers. The town grew slowly, and by the early 1900s had a population of around 200. The town was home to several businesses, including a general store, a blacksmith shop, and a cotton gin.
In the early 1900s, the town was served by the Texas and Pacific Railway. The railway provided a link to the larger cities of Dallas and Fort Worth. The town also had a post office, which was established in 1902.
In the mid-1900s, the town began to decline. The railway was abandoned in the 1950s, and the post office closed in the 1970s. By the 2000s, the population had dropped to around 200.
Economy
The economy of Emhouse is largely based on agriculture. The area is home to several small farms and ranches, which produce a variety of crops, including cotton, corn, and hay. The town also has a few small businesses, including a convenience store and a gas station.
Demographics
As of the 2010 census, the population of Emhouse was estimated to be around 200. The racial makeup of the town was 97.5% White, 0.5% African American, 0.5% Native American, and 1.5% from other races. The median household income was $37,500, and the median family income was $41,250.
Conclusion
Emhouse is a small unincorporated community located in Navarro County, Texas. It is situated along State Highway 22, approximately 8 miles east of Corsicana and about 50 miles south of Dallas. The population of Emhouse was estimated to be around 200 in 2020. The economy of Emhouse is largely based on agriculture, with some small businesses. The racial makeup of the town was 97.5% White, 0.5% African American, 0.5% Native American, and 1.5% from other races. The median household income was $37,500, and the median family income was $41,250.
Common Questions
What is Per Capita Income in Emhouse?
Per Capita income in Emhouse is $17,339.
What is the Median Family Income in Emhouse?
Median Family Income in Emhouse is $47,500.
What is the Median Household income in Emhouse?
Median Household Income in Emhouse is $46,000.
What is Inequality or Gini Index in Emhouse?
Inequality or Gini Index in Emhouse is 0.32.
What is the Total Population of Emhouse?
Total Population of Emhouse is 160.
What is the Total Male Population of Emhouse?
Total Male Population of Emhouse is 81.
What is the Total Female Population of Emhouse?
Total Female Population of Emhouse is 79.
What is the Ratio of Males per 100 Females in Emhouse?
There are 102.53 Males per 100 Females in Emhouse.
What is the Ratio of Females per 100 Males in Emhouse?
There are 97.53 Females per 100 Males in Emhouse.
What is the Median Population Age in Emhouse?
Median Population Age in Emhouse is 31.5 Years.
What is the Average Family Size in Emhouse
Average Family Size in Emhouse is 4.0 People.
What is the Average Household Size in Emhouse
Average Household Size in Emhouse is 3.5 People.
How Large is the Labor Force in Emhouse?
There are 78 People in the Labor Forcein in Emhouse.
What is the Percentage of People in the Labor Force in Emhouse?
57.8% of People are in the Labor Force in Emhouse.