El Campo, TX Map & Demographics
El Campo Map
El Campo Overview
$26,016
PER CAPITA INCOME
$67,997
AVG FAMILY INCOME
$62,667
AVG HOUSEHOLD INCOME
39.4%
WAGE / INCOME GAP [ % ]
60.6¢/ $1
WAGE / INCOME GAP [ $ ]
$11,149
FAMILY INCOME DEFICIT
0.43
INEQUALITY / GINI INDEX
12,242
TOTAL POPULATION
5,941
MALE POPULATION
6,301
FEMALE POPULATION
94.29
MALES / 100 FEMALES
106.06
FEMALES / 100 MALES
35.9
MEDIAN AGE
3.3
AVG FAMILY SIZE
2.8
AVG HOUSEHOLD SIZE
5,325
LABOR FORCE [ PEOPLE ]
58.5%
PERCENT IN LABOR FORCE
9.0%
UNEMPLOYMENT RATE
El Campo Zip Codes
El Campo Area Codes
Income in El Campo
Income Overview in El Campo
Per Capita Income in El Campo is $26,016, while median incomes of families and households are $67,997 and $62,667 respectively.
| Characteristic | Number | Measure |
| Per Capita Income | 12,242 | $26,016 |
| Median Family Income | 3,196 | $67,997 |
| Mean Family Income | 3,196 | $86,198 |
| Median Household Income | 4,284 | $62,667 |
| Mean Household Income | 4,284 | $75,414 |
| Income Deficit | 3,196 | $11,149 |
| Wage / Income Gap (%) | 12,242 | 39.36% |
| Wage / Income Gap ($) | 12,242 | 60.64¢ per $1 |
| Gini / Inequality Index | 12,242 | 0.43 |
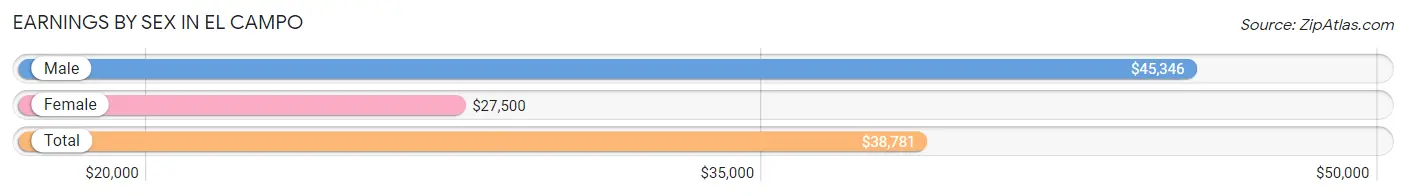
Earnings by Sex in El Campo
Average Earnings in El Campo are $38,781, $45,346 for men and $27,500 for women, a difference of 39.4%.
| Sex | Number | Average Earnings |
| Male | 3,082 (56.0%) | $45,346 |
| Female | 2,424 (44.0%) | $27,500 |
| Total | 5,506 (100.0%) | $38,781 |
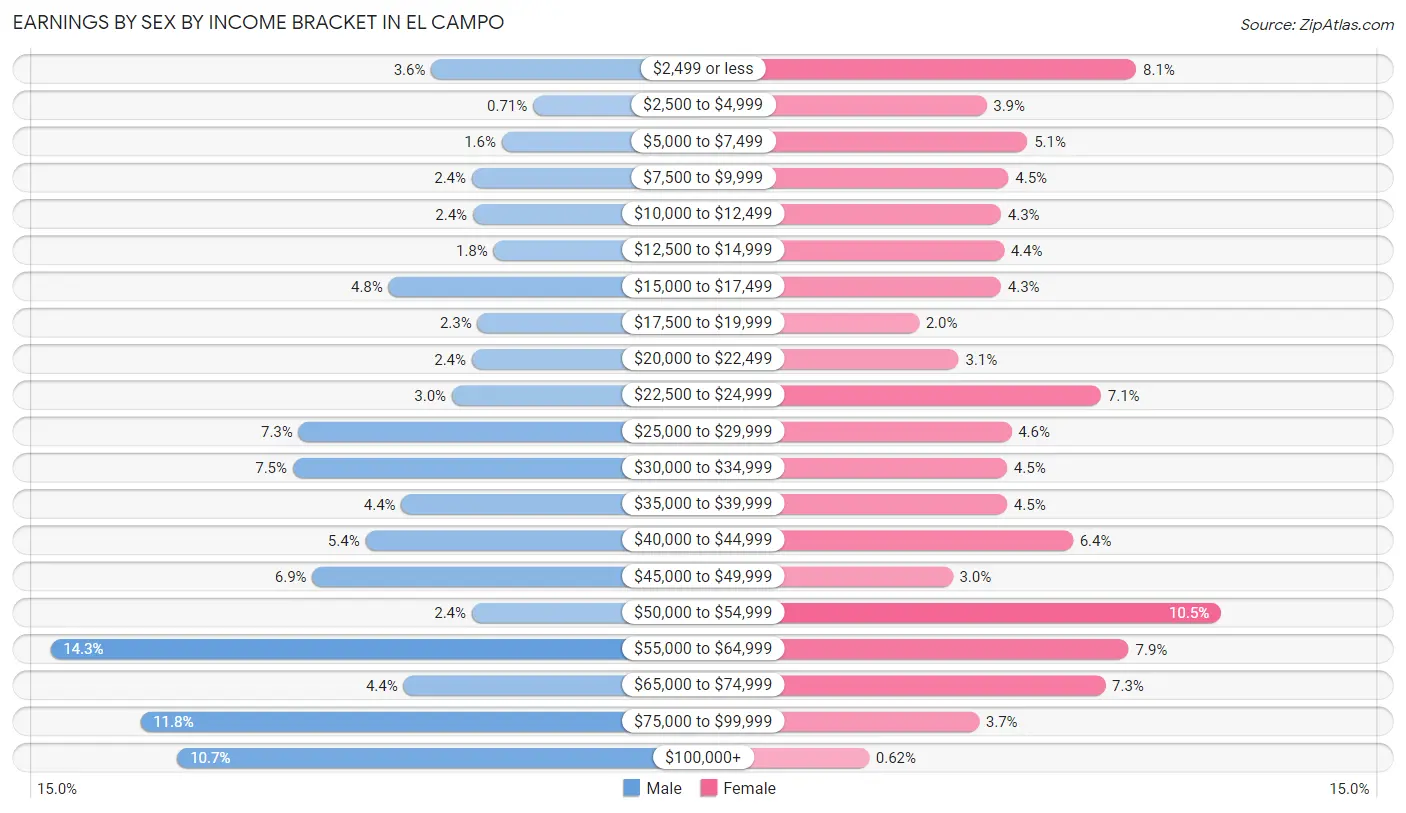
Earnings by Sex by Income Bracket in El Campo
The most common earnings brackets in El Campo are $55,000 to $64,999 for men (440 | 14.3%) and $50,000 to $54,999 for women (255 | 10.5%).
| Income | Male | Female |
| $2,499 or less | 110 (3.6%) | 197 (8.1%) |
| $2,500 to $4,999 | 22 (0.7%) | 95 (3.9%) |
| $5,000 to $7,499 | 49 (1.6%) | 123 (5.1%) |
| $7,500 to $9,999 | 75 (2.4%) | 110 (4.5%) |
| $10,000 to $12,499 | 74 (2.4%) | 105 (4.3%) |
| $12,500 to $14,999 | 56 (1.8%) | 107 (4.4%) |
| $15,000 to $17,499 | 147 (4.8%) | 105 (4.3%) |
| $17,500 to $19,999 | 70 (2.3%) | 49 (2.0%) |
| $20,000 to $22,499 | 75 (2.4%) | 76 (3.1%) |
| $22,500 to $24,999 | 92 (3.0%) | 173 (7.1%) |
| $25,000 to $29,999 | 225 (7.3%) | 112 (4.6%) |
| $30,000 to $34,999 | 230 (7.5%) | 109 (4.5%) |
| $35,000 to $39,999 | 136 (4.4%) | 109 (4.5%) |
| $40,000 to $44,999 | 167 (5.4%) | 154 (6.4%) |
| $45,000 to $49,999 | 213 (6.9%) | 72 (3.0%) |
| $50,000 to $54,999 | 75 (2.4%) | 255 (10.5%) |
| $55,000 to $64,999 | 440 (14.3%) | 192 (7.9%) |
| $65,000 to $74,999 | 134 (4.3%) | 176 (7.3%) |
| $75,000 to $99,999 | 362 (11.7%) | 90 (3.7%) |
| $100,000+ | 330 (10.7%) | 15 (0.6%) |
| Total | 3,082 (100.0%) | 2,424 (100.0%) |
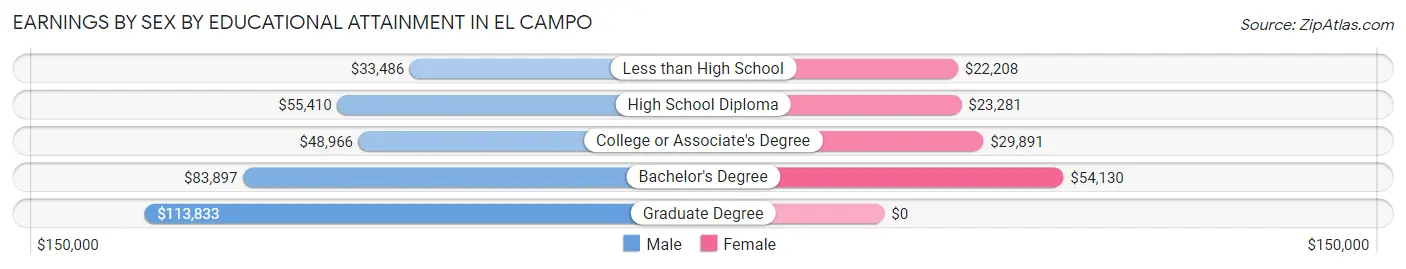
Earnings by Sex by Educational Attainment in El Campo
Average earnings in El Campo are $48,603 for men and $31,759 for women, a difference of 34.7%. Men with an educational attainment of graduate degree enjoy the highest average annual earnings of $113,833, while those with less than high school education earn the least with $33,486. Women with an educational attainment of bachelor's degree earn the most with the average annual earnings of $54,130, while those with less than high school education have the smallest earnings of $22,208.
| Educational Attainment | Male Income | Female Income |
| Less than High School | $33,486 | $22,208 |
| High School Diploma | $55,410 | $23,281 |
| College or Associate's Degree | $48,966 | $29,891 |
| Bachelor's Degree | $83,897 | $54,130 |
| Graduate Degree | $113,833 | $0 |
| Total | $48,603 | $31,759 |
Family Income in El Campo
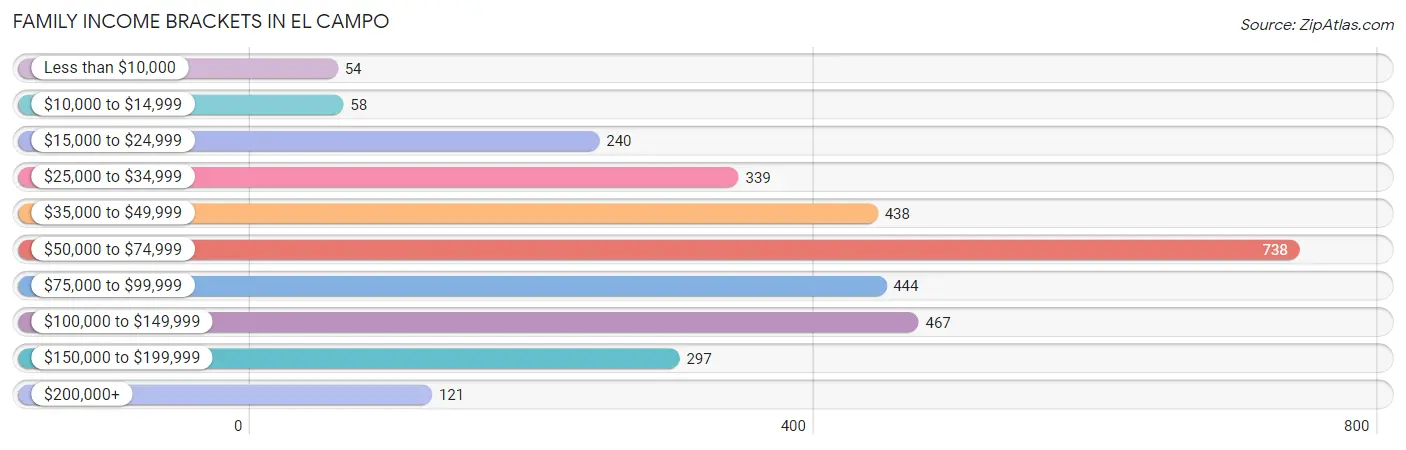
Family Income Brackets in El Campo
According to the El Campo family income data, there are 738 families falling into the $50,000 to $74,999 income range, which is the most common income bracket and makes up 23.1% of all families. Conversely, the less than $10,000 income bracket is the least frequent group with only 54 families (1.7%) belonging to this category.
| Income Bracket | # Families | % Families |
| Less than $10,000 | 54 | 1.7% |
| $10,000 to $14,999 | 58 | 1.8% |
| $15,000 to $24,999 | 240 | 7.5% |
| $25,000 to $34,999 | 339 | 10.6% |
| $35,000 to $49,999 | 438 | 13.7% |
| $50,000 to $74,999 | 738 | 23.1% |
| $75,000 to $99,999 | 444 | 13.9% |
| $100,000 to $149,999 | 467 | 14.6% |
| $150,000 to $199,999 | 297 | 9.3% |
| $200,000+ | 121 | 3.8% |
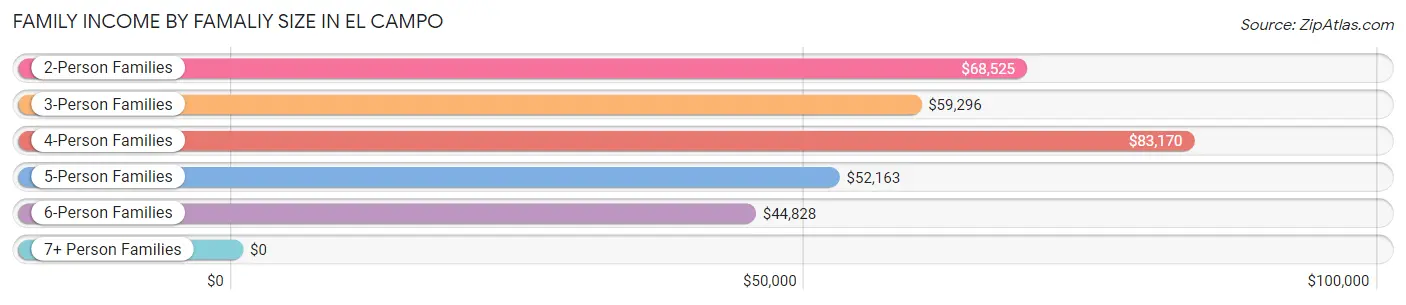
Family Income by Famaliy Size in El Campo
4-person families (814 | 25.5%) account for the highest median family income in El Campo with $83,170 per family, while 2-person families (1,246 | 39.0%) have the highest median income of $34,262 per family member.
| Income Bracket | # Families | Median Income |
| 2-Person Families | 1,246 (39.0%) | $68,525 |
| 3-Person Families | 631 (19.7%) | $59,296 |
| 4-Person Families | 814 (25.5%) | $83,170 |
| 5-Person Families | 430 (13.5%) | $52,163 |
| 6-Person Families | 54 (1.7%) | $44,828 |
| 7+ Person Families | 21 (0.7%) | $0 |
| Total | 3,196 (100.0%) | $67,997 |
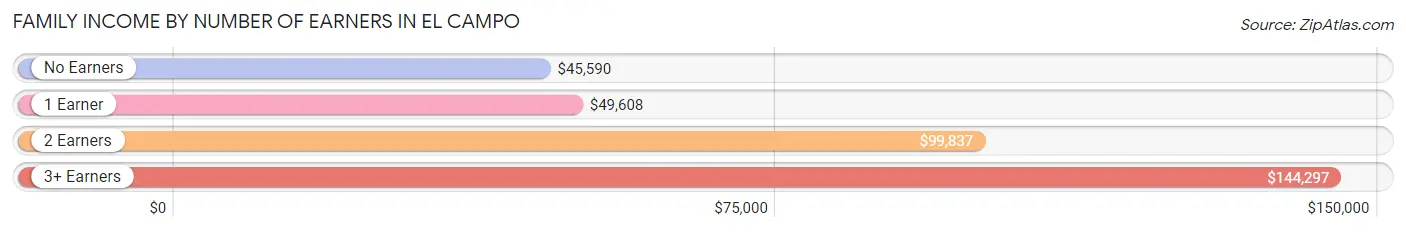
Family Income by Number of Earners in El Campo
The median family income in El Campo is $67,997, with families comprising 3+ earners (245) having the highest median family income of $144,297, while families with no earners (351) have the lowest median family income of $45,590, accounting for 7.7% and 11.0% of families, respectively.
| Number of Earners | # Families | Median Income |
| No Earners | 351 (11.0%) | $45,590 |
| 1 Earner | 1,322 (41.4%) | $49,608 |
| 2 Earners | 1,278 (40.0%) | $99,837 |
| 3+ Earners | 245 (7.7%) | $144,297 |
| Total | 3,196 (100.0%) | $67,997 |
Household Income in El Campo
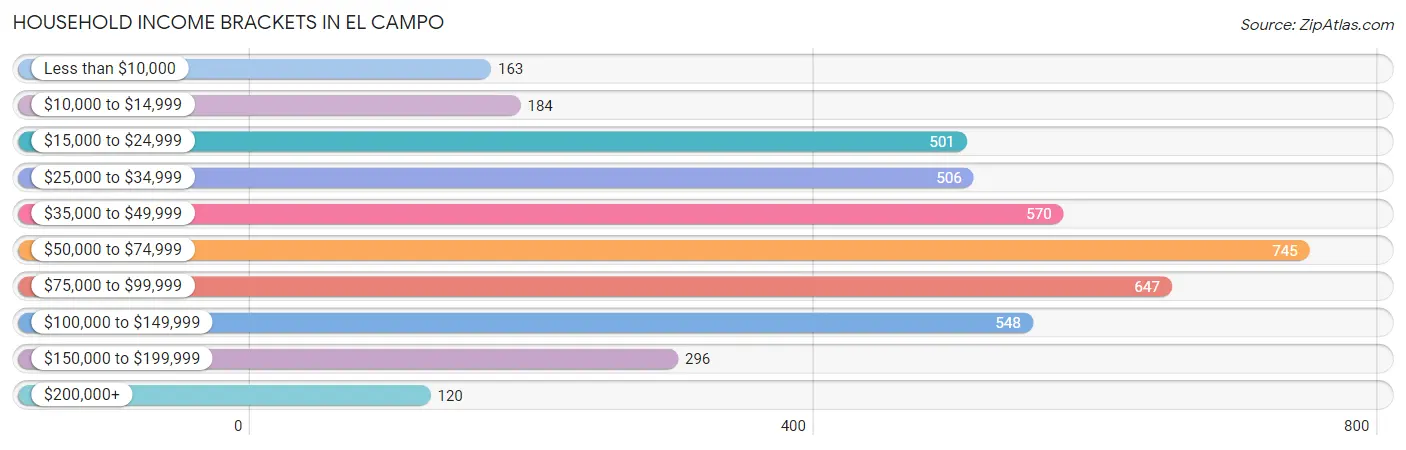
Household Income Brackets in El Campo
With 745 households falling in the category, the $50,000 to $74,999 income range is the most frequent in El Campo, accounting for 17.4% of all households. In contrast, only 120 households (2.8%) fall into the $200,000+ income bracket, making it the least populous group.
| Income Bracket | # Households | % Households |
| Less than $10,000 | 163 | 3.8% |
| $10,000 to $14,999 | 184 | 4.3% |
| $15,000 to $24,999 | 501 | 11.7% |
| $25,000 to $34,999 | 506 | 11.8% |
| $35,000 to $49,999 | 570 | 13.3% |
| $50,000 to $74,999 | 745 | 17.4% |
| $75,000 to $99,999 | 647 | 15.1% |
| $100,000 to $149,999 | 548 | 12.8% |
| $150,000 to $199,999 | 296 | 6.9% |
| $200,000+ | 120 | 2.8% |
Household Income by Householder Age in El Campo
The median household income in El Campo is $62,667, with the highest median household income of $75,096 found in the 25 to 44 years age bracket for the primary householder. A total of 1,512 households (35.3%) fall into this category. Meanwhile, the 65+ years age bracket for the primary householder has the lowest median household income of $40,653, with 1,389 households (32.4%) in this group.
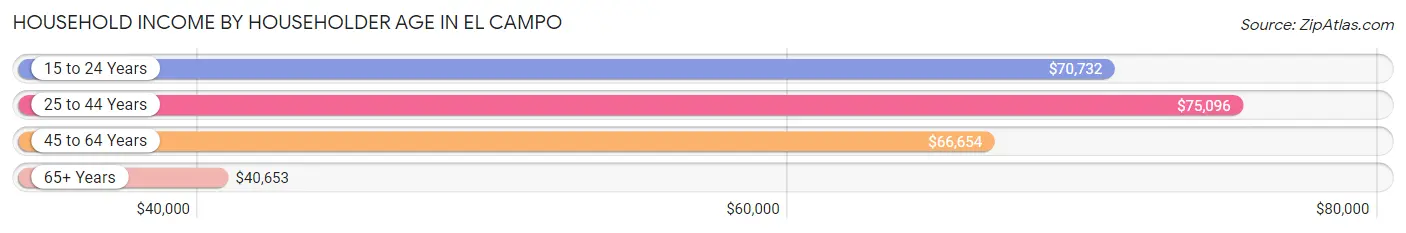
| Income Bracket | # Households | Median Income |
| 15 to 24 Years | 140 (3.3%) | $70,732 |
| 25 to 44 Years | 1,512 (35.3%) | $75,096 |
| 45 to 64 Years | 1,243 (29.0%) | $66,654 |
| 65+ Years | 1,389 (32.4%) | $40,653 |
| Total | 4,284 (100.0%) | $62,667 |
Poverty in El Campo
Income Below Poverty by Sex and Age in El Campo
With 16.7% poverty level for males and 18.3% for females among the residents of El Campo, 15 year old males and 5 year old females are the most vulnerable to poverty, with 65 males (75.6%) and 62 females (44.0%) in their respective age groups living below the poverty level.
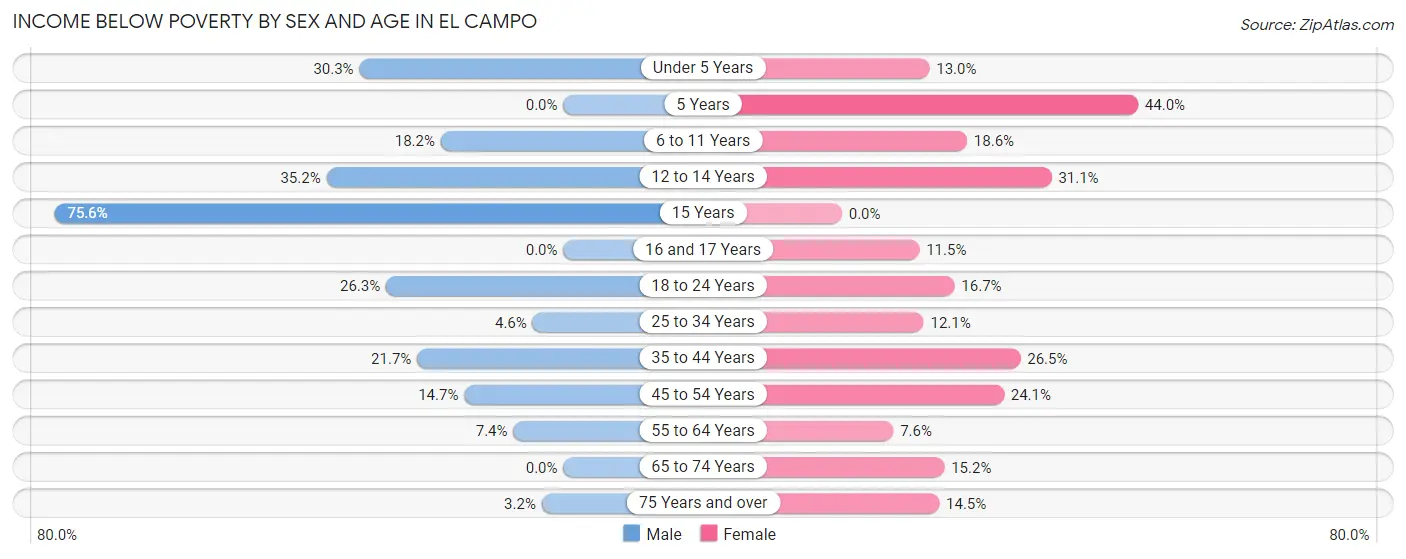
| Age Bracket | Male | Female |
| Under 5 Years | 162 (30.3%) | 43 (13.0%) |
| 5 Years | 0 (0.0%) | 62 (44.0%) |
| 6 to 11 Years | 105 (18.2%) | 110 (18.6%) |
| 12 to 14 Years | 153 (35.2%) | 99 (31.1%) |
| 15 Years | 65 (75.6%) | 0 (0.0%) |
| 16 and 17 Years | 0 (0.0%) | 39 (11.5%) |
| 18 to 24 Years | 124 (26.3%) | 98 (16.7%) |
| 25 to 34 Years | 23 (4.6%) | 100 (12.1%) |
| 35 to 44 Years | 193 (21.7%) | 259 (26.5%) |
| 45 to 54 Years | 107 (14.7%) | 141 (24.1%) |
| 55 to 64 Years | 38 (7.4%) | 34 (7.6%) |
| 65 to 74 Years | 0 (0.0%) | 94 (15.2%) |
| 75 Years and over | 11 (3.2%) | 61 (14.4%) |
| Total | 981 (16.7%) | 1,140 (18.3%) |
Income Above Poverty by Sex and Age in El Campo
According to the poverty statistics in El Campo, males aged 5 years and females aged 15 years are the age groups that are most secure financially, with 100.0% of males and 100.0% of females in these age groups living above the poverty line.
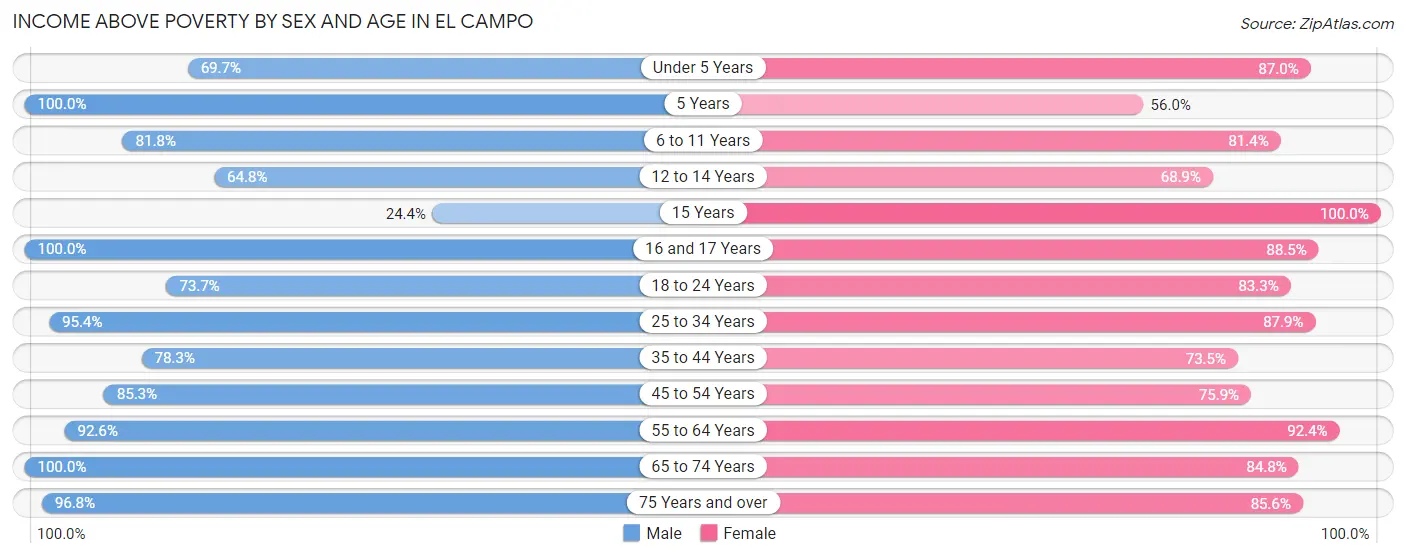
| Age Bracket | Male | Female |
| Under 5 Years | 373 (69.7%) | 288 (87.0%) |
| 5 Years | 63 (100.0%) | 79 (56.0%) |
| 6 to 11 Years | 472 (81.8%) | 482 (81.4%) |
| 12 to 14 Years | 282 (64.8%) | 219 (68.9%) |
| 15 Years | 21 (24.4%) | 62 (100.0%) |
| 16 and 17 Years | 166 (100.0%) | 300 (88.5%) |
| 18 to 24 Years | 347 (73.7%) | 488 (83.3%) |
| 25 to 34 Years | 481 (95.4%) | 724 (87.9%) |
| 35 to 44 Years | 696 (78.3%) | 718 (73.5%) |
| 45 to 54 Years | 620 (85.3%) | 445 (75.9%) |
| 55 to 64 Years | 474 (92.6%) | 411 (92.4%) |
| 65 to 74 Years | 573 (100.0%) | 524 (84.8%) |
| 75 Years and over | 332 (96.8%) | 361 (85.6%) |
| Total | 4,900 (83.3%) | 5,101 (81.7%) |
Income Below Poverty Among Married-Couple Families in El Campo
The poverty statistics for married-couple families in El Campo show that 6.6% or 141 of the total 2,125 families live below the poverty line. Families with 5 or more children have the highest poverty rate of 100.0%, comprising of 21 families. On the other hand, families with no children have the lowest poverty rate of 1.4%, which includes 14 families.
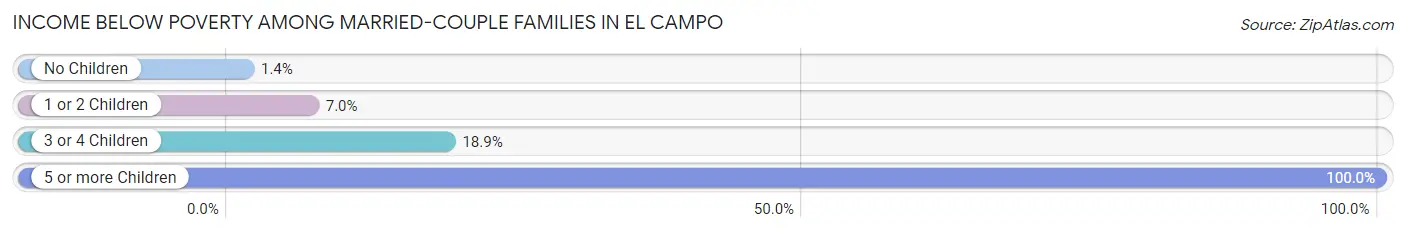
| Children | Above Poverty | Below Poverty |
| No Children | 993 (98.6%) | 14 (1.4%) |
| 1 or 2 Children | 794 (93.0%) | 60 (7.0%) |
| 3 or 4 Children | 197 (81.1%) | 46 (18.9%) |
| 5 or more Children | 0 (0.0%) | 21 (100.0%) |
| Total | 1,984 (93.4%) | 141 (6.6%) |
Income Below Poverty Among Single-Parent Households in El Campo
According to the poverty data in El Campo, 17.9% or 58 single-father households and 17.9% or 134 single-mother households are living below the poverty line. Among single-father households, those with 3 or 4 children have the highest poverty rate, with 49 households (76.6%) experiencing poverty. Likewise, among single-mother households, those with 3 or 4 children have the highest poverty rate, with 38 households (29.9%) falling below the poverty line.
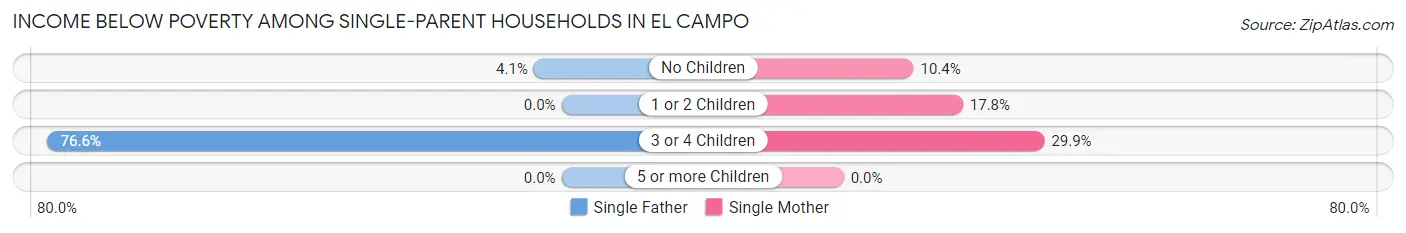
| Children | Single Father | Single Mother |
| No Children | 9 (4.1%) | 20 (10.4%) |
| 1 or 2 Children | 0 (0.0%) | 76 (17.8%) |
| 3 or 4 Children | 49 (76.6%) | 38 (29.9%) |
| 5 or more Children | 0 (0.0%) | 0 (0.0%) |
| Total | 58 (17.9%) | 134 (17.9%) |
Income Below Poverty Among Married-Couple vs Single-Parent Households in El Campo
The poverty data for El Campo shows that 141 of the married-couple family households (6.6%) and 192 of the single-parent households (17.9%) are living below the poverty level. Within the married-couple family households, those with 5 or more children have the highest poverty rate, with 21 households (100.0%) falling below the poverty line. Among the single-parent households, those with 3 or 4 children have the highest poverty rate, with 87 household (45.6%) living below poverty.
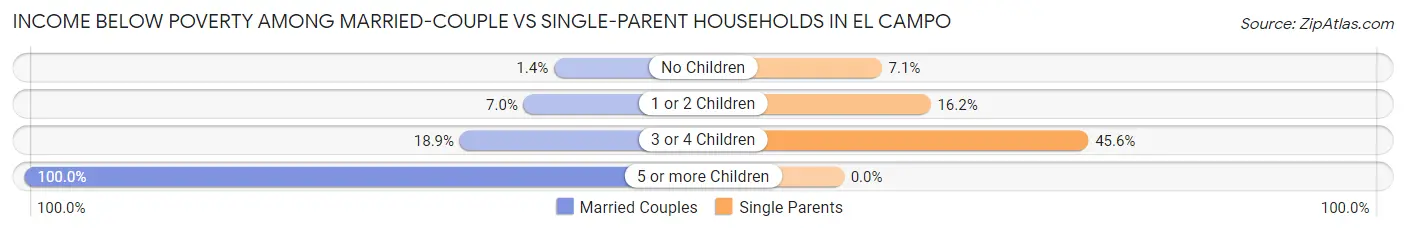
| Children | Married-Couple Families | Single-Parent Households |
| No Children | 14 (1.4%) | 29 (7.1%) |
| 1 or 2 Children | 60 (7.0%) | 76 (16.2%) |
| 3 or 4 Children | 46 (18.9%) | 87 (45.6%) |
| 5 or more Children | 21 (100.0%) | 0 (0.0%) |
| Total | 141 (6.6%) | 192 (17.9%) |
Race in El Campo
The most populous races in El Campo are White / Caucasian (9,053 | 74.0%), Hispanic or Latino (6,276 | 51.3%), and Two or more Races (1,246 | 10.2%).
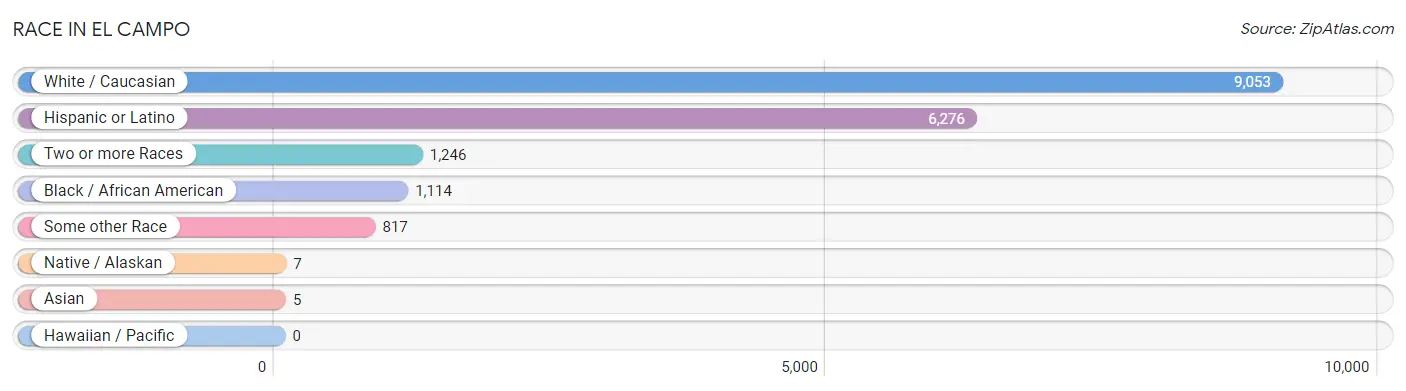
| Race | # Population | % Population |
| Asian | 5 | 0.0% |
| Black / African American | 1,114 | 9.1% |
| Hawaiian / Pacific | 0 | 0.0% |
| Hispanic or Latino | 6,276 | 51.3% |
| Native / Alaskan | 7 | 0.1% |
| White / Caucasian | 9,053 | 74.0% |
| Two or more Races | 1,246 | 10.2% |
| Some other Race | 817 | 6.7% |
| Total | 12,242 | 100.0% |
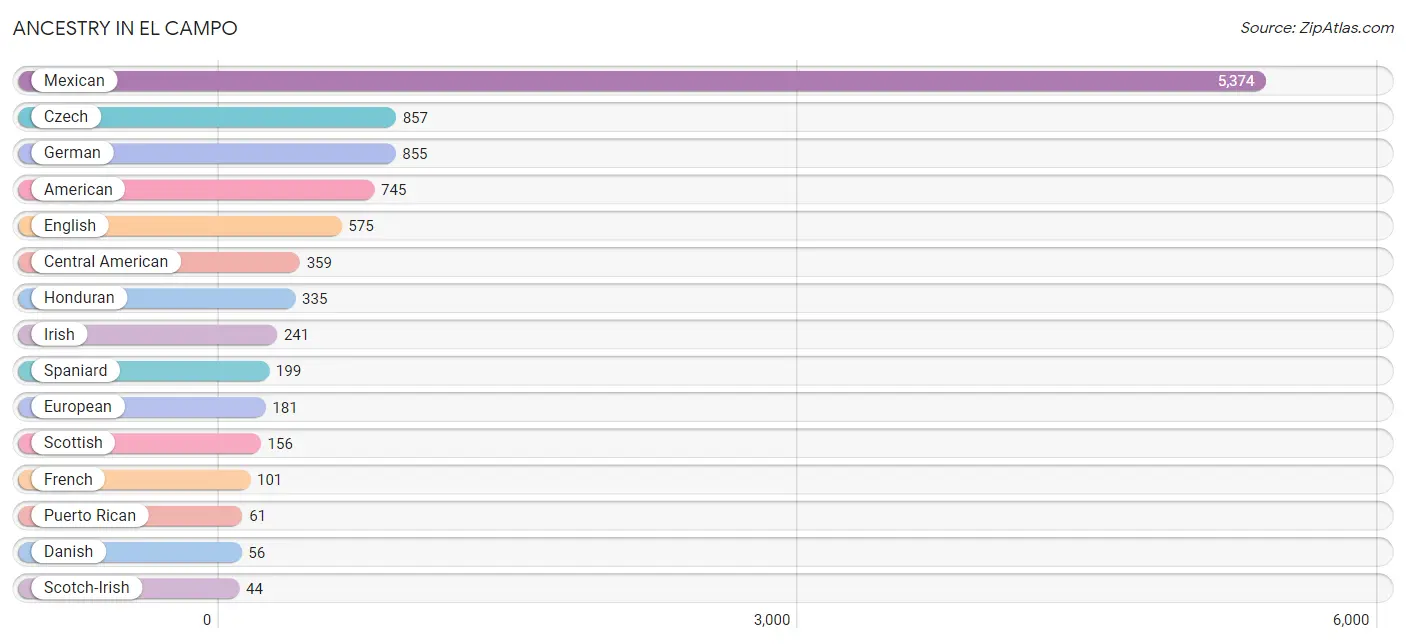
Ancestry in El Campo
The most populous ancestries reported in El Campo are Mexican (5,374 | 43.9%), Czech (857 | 7.0%), German (855 | 7.0%), American (745 | 6.1%), and English (575 | 4.7%), together accounting for 68.7% of all El Campo residents.
| Ancestry | # Population | % Population |
| African | 7 | 0.1% |
| American | 745 | 6.1% |
| Apache | 23 | 0.2% |
| Arab | 30 | 0.3% |
| Argentinean | 10 | 0.1% |
| Austrian | 15 | 0.1% |
| British | 41 | 0.3% |
| Cajun | 3 | 0.0% |
| Central American | 359 | 2.9% |
| Czech | 857 | 7.0% |
| Czechoslovakian | 32 | 0.3% |
| Danish | 56 | 0.5% |
| Dutch | 16 | 0.1% |
| English | 575 | 4.7% |
| European | 181 | 1.5% |
| French | 101 | 0.8% |
| German | 855 | 7.0% |
| Guatemalan | 10 | 0.1% |
| Honduran | 335 | 2.7% |
| Irish | 241 | 2.0% |
| Italian | 33 | 0.3% |
| Japanese | 8 | 0.1% |
| Lebanese | 30 | 0.3% |
| Mexican | 5,374 | 43.9% |
| Nicaraguan | 12 | 0.1% |
| Northern European | 10 | 0.1% |
| Panamanian | 2 | 0.0% |
| Polish | 33 | 0.3% |
| Puerto Rican | 61 | 0.5% |
| Scotch-Irish | 44 | 0.4% |
| Scottish | 156 | 1.3% |
| South American | 10 | 0.1% |
| Spaniard | 199 | 1.6% |
| Spanish | 5 | 0.0% |
| Subsaharan African | 7 | 0.1% |
| Swedish | 31 | 0.3% |
| Swiss | 16 | 0.1% | View All 37 Rows |
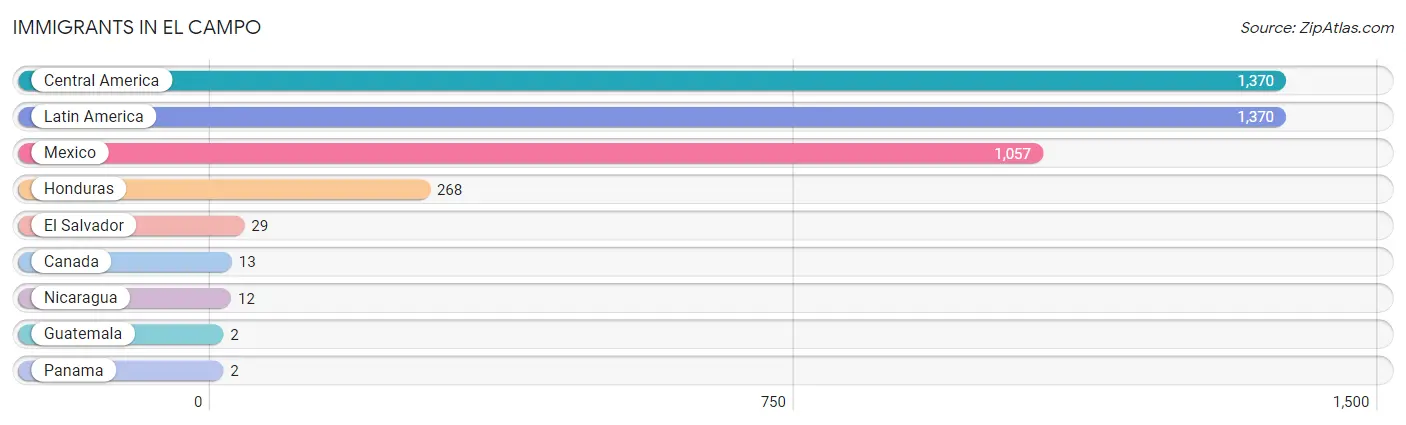
Immigrants in El Campo
The most numerous immigrant groups reported in El Campo came from Central America (1,370 | 11.2%), Latin America (1,370 | 11.2%), Mexico (1,057 | 8.6%), Honduras (268 | 2.2%), and El Salvador (29 | 0.2%), together accounting for 33.4% of all El Campo residents.
| Immigration Origin | # Population | % Population |
| Canada | 13 | 0.1% |
| Central America | 1,370 | 11.2% |
| El Salvador | 29 | 0.2% |
| Guatemala | 2 | 0.0% |
| Honduras | 268 | 2.2% |
| Latin America | 1,370 | 11.2% |
| Mexico | 1,057 | 8.6% |
| Nicaragua | 12 | 0.1% |
| Panama | 2 | 0.0% | View All 9 Rows |
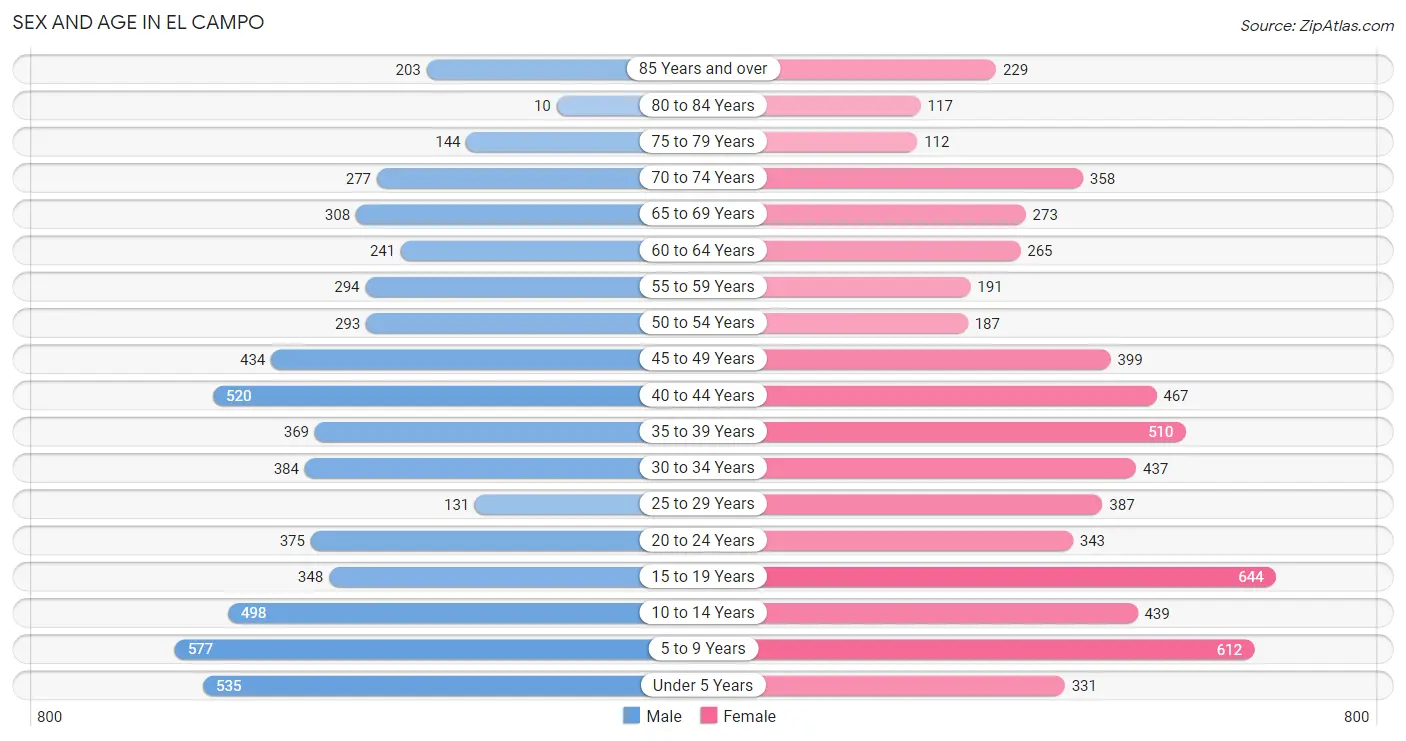
Sex and Age in El Campo
Sex and Age in El Campo
The most populous age groups in El Campo are 5 to 9 Years (577 | 9.7%) for men and 15 to 19 Years (644 | 10.2%) for women.
| Age Bracket | Male | Female |
| Under 5 Years | 535 (9.0%) | 331 (5.2%) |
| 5 to 9 Years | 577 (9.7%) | 612 (9.7%) |
| 10 to 14 Years | 498 (8.4%) | 439 (7.0%) |
| 15 to 19 Years | 348 (5.9%) | 644 (10.2%) |
| 20 to 24 Years | 375 (6.3%) | 343 (5.4%) |
| 25 to 29 Years | 131 (2.2%) | 387 (6.1%) |
| 30 to 34 Years | 384 (6.5%) | 437 (6.9%) |
| 35 to 39 Years | 369 (6.2%) | 510 (8.1%) |
| 40 to 44 Years | 520 (8.7%) | 467 (7.4%) |
| 45 to 49 Years | 434 (7.3%) | 399 (6.3%) |
| 50 to 54 Years | 293 (4.9%) | 187 (3.0%) |
| 55 to 59 Years | 294 (5.0%) | 191 (3.0%) |
| 60 to 64 Years | 241 (4.1%) | 265 (4.2%) |
| 65 to 69 Years | 308 (5.2%) | 273 (4.3%) |
| 70 to 74 Years | 277 (4.7%) | 358 (5.7%) |
| 75 to 79 Years | 144 (2.4%) | 112 (1.8%) |
| 80 to 84 Years | 10 (0.2%) | 117 (1.9%) |
| 85 Years and over | 203 (3.4%) | 229 (3.6%) |
| Total | 5,941 (100.0%) | 6,301 (100.0%) |
Families and Households in El Campo
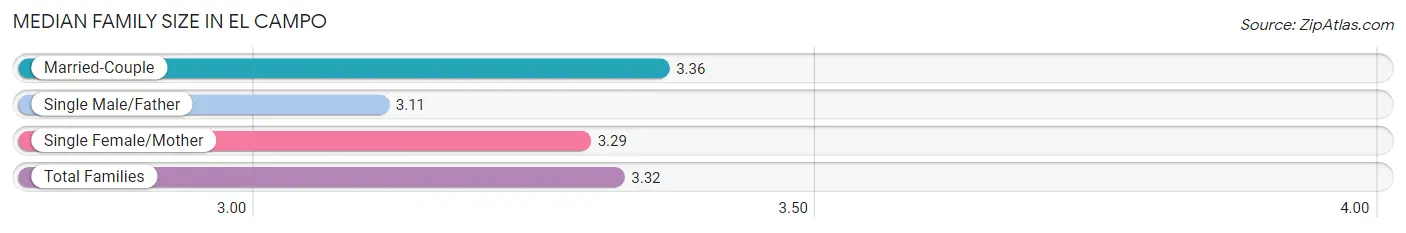
Median Family Size in El Campo
The median family size in El Campo is 3.32 persons per family, with married-couple families (2,125 | 66.5%) accounting for the largest median family size of 3.36 persons per family. On the other hand, single male/father families (324 | 10.1%) represent the smallest median family size with 3.11 persons per family.
| Family Type | # Families | Family Size |
| Married-Couple | 2,125 (66.5%) | 3.36 |
| Single Male/Father | 324 (10.1%) | 3.11 |
| Single Female/Mother | 747 (23.4%) | 3.29 |
| Total Families | 3,196 (100.0%) | 3.32 |
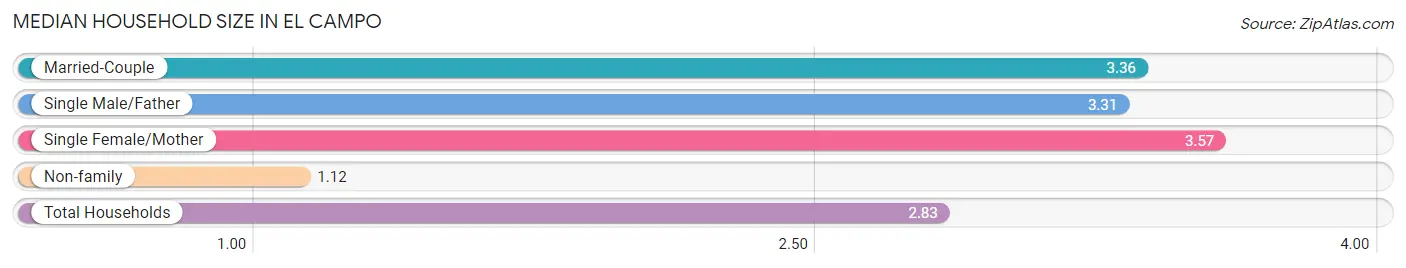
Median Household Size in El Campo
The median household size in El Campo is 2.83 persons per household, with single female/mother households (747 | 17.4%) accounting for the largest median household size of 3.57 persons per household. non-family households (1,088 | 25.4%) represent the smallest median household size with 1.12 persons per household.
| Household Type | # Households | Household Size |
| Married-Couple | 2,125 (49.6%) | 3.36 |
| Single Male/Father | 324 (7.6%) | 3.31 |
| Single Female/Mother | 747 (17.4%) | 3.57 |
| Non-family | 1,088 (25.4%) | 1.12 |
| Total Households | 4,284 (100.0%) | 2.83 |
Household Size by Marriage Status in El Campo
Out of a total of 4,284 households in El Campo, 3,196 (74.6%) are family households, while 1,088 (25.4%) are nonfamily households. The most numerous type of family households are 2-person households, comprising 1,157, and the most common type of nonfamily households are 1-person households, comprising 1,004.
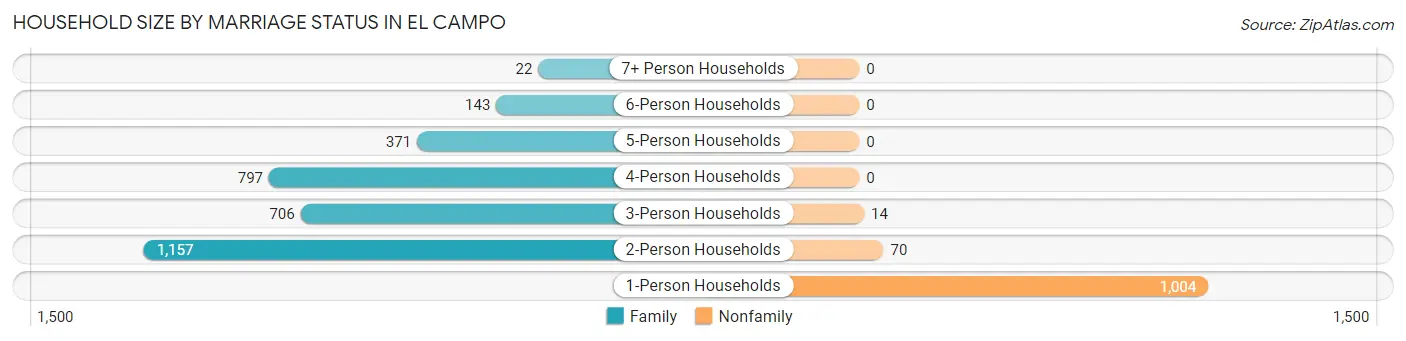
| Household Size | Family Households | Nonfamily Households |
| 1-Person Households | - | 1,004 (23.4%) |
| 2-Person Households | 1,157 (27.0%) | 70 (1.6%) |
| 3-Person Households | 706 (16.5%) | 14 (0.3%) |
| 4-Person Households | 797 (18.6%) | 0 (0.0%) |
| 5-Person Households | 371 (8.7%) | 0 (0.0%) |
| 6-Person Households | 143 (3.3%) | 0 (0.0%) |
| 7+ Person Households | 22 (0.5%) | 0 (0.0%) |
| Total | 3,196 (74.6%) | 1,088 (25.4%) |
Female Fertility in El Campo
Fertility by Age in El Campo
Average fertility rate in El Campo is 73.0 births per 1,000 women. Women in the age bracket of 15 to 19 years have the highest fertility rate with 129.0 births per 1,000 women. Women in the age bracket of 35 to 50 years acount for 36.3% of all women with births.
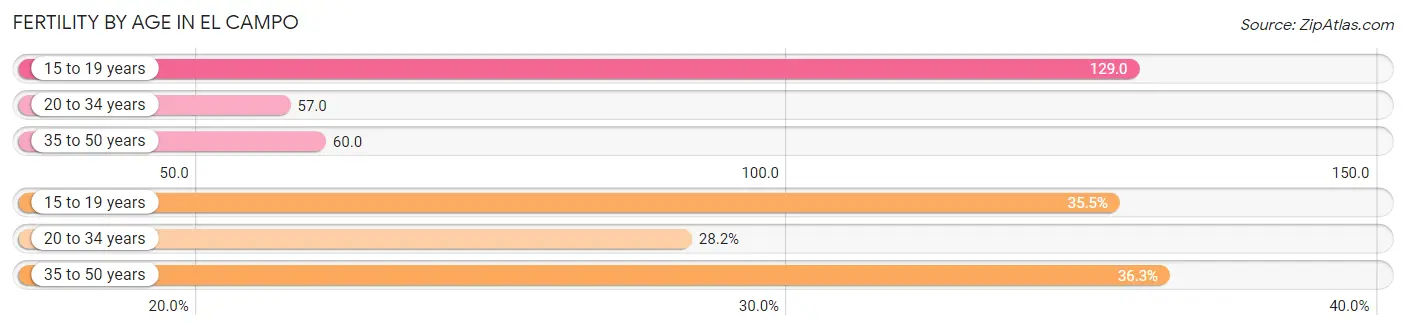
| Age Bracket | Women with Births | Births / 1,000 Women |
| 15 to 19 years | 83 (35.5%) | 129.0 |
| 20 to 34 years | 66 (28.2%) | 57.0 |
| 35 to 50 years | 85 (36.3%) | 60.0 |
| Total | 234 (100.0%) | 73.0 |
Fertility by Age by Marriage Status in El Campo
47.0% of women with births (234) in El Campo are married. The highest percentage of unmarried women with births falls into 15 to 19 years age bracket with 100.0% of them unmarried at the time of birth, while the lowest percentage of unmarried women with births belong to 35 to 50 years age bracket with 0.0% of them unmarried.
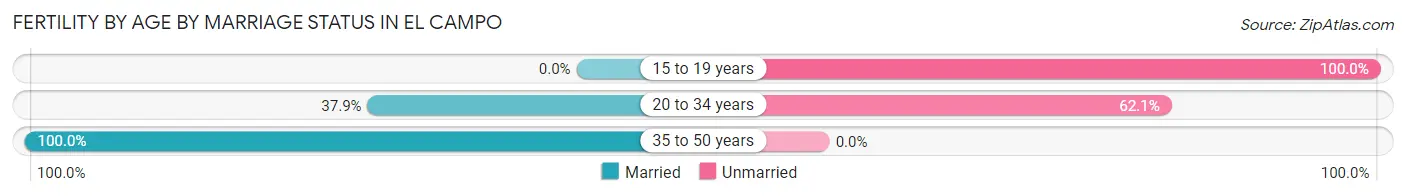
| Age Bracket | Married | Unmarried |
| 15 to 19 years | 0 (0.0%) | 83 (100.0%) |
| 20 to 34 years | 25 (37.9%) | 41 (62.1%) |
| 35 to 50 years | 85 (100.0%) | 0 (0.0%) |
| Total | 110 (47.0%) | 124 (53.0%) |
Fertility by Education in El Campo
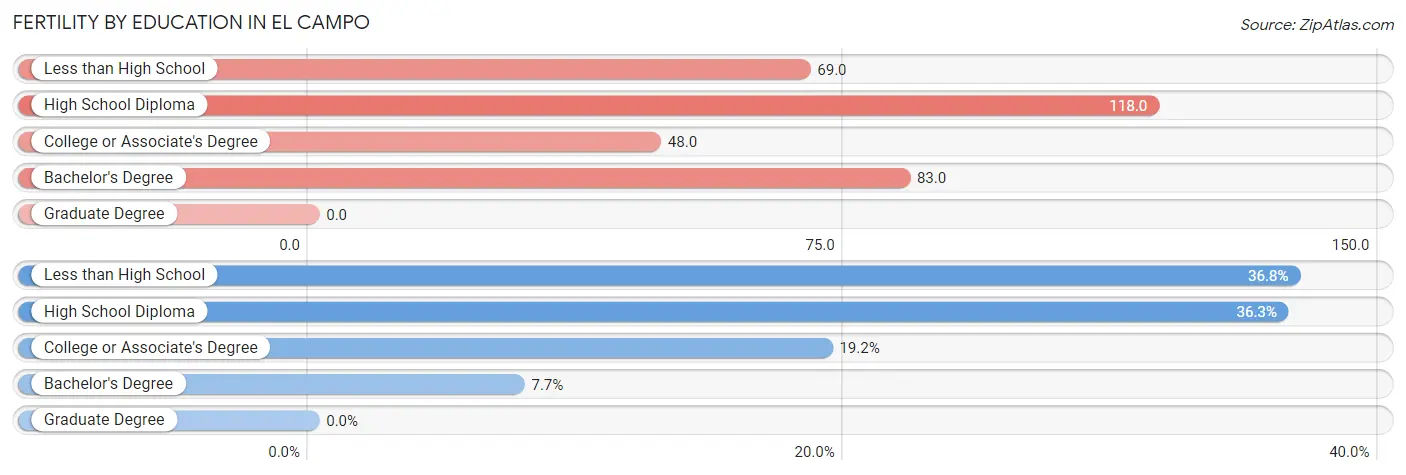
| Educational Attainment | Women with Births | Births / 1,000 Women |
| Less than High School | 86 (36.7%) | 69.0 |
| High School Diploma | 85 (36.3%) | 118.0 |
| College or Associate's Degree | 45 (19.2%) | 48.0 |
| Bachelor's Degree | 18 (7.7%) | 83.0 |
| Graduate Degree | 0 (0.0%) | 0.0 |
| Total | 234 (100.0%) | 73.0 |
Fertility by Education by Marriage Status in El Campo
53.0% of women with births in El Campo are unmarried. Women with the educational attainment of high school diploma are most likely to be married with 100.0% of them married at childbirth, while women with the educational attainment of less than high school are least likely to be married with 96.5% of them unmarried at childbirth.
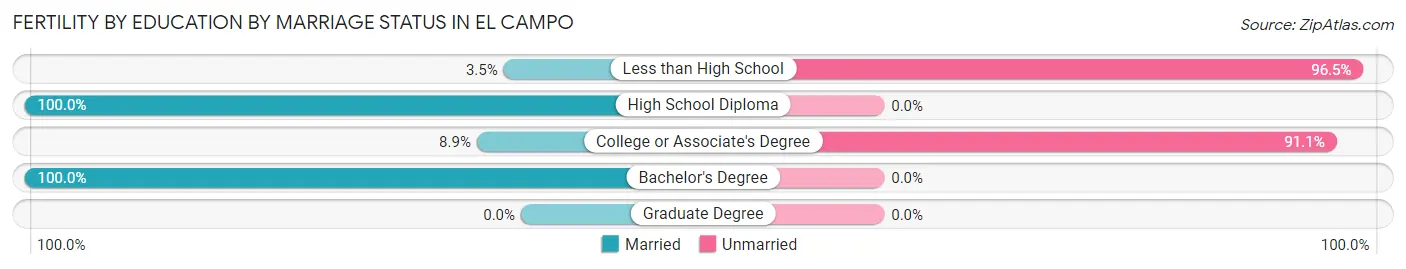
| Educational Attainment | Married | Unmarried |
| Less than High School | 3 (3.5%) | 83 (96.5%) |
| High School Diploma | 85 (100.0%) | 0 (0.0%) |
| College or Associate's Degree | 4 (8.9%) | 41 (91.1%) |
| Bachelor's Degree | 18 (100.0%) | 0 (0.0%) |
| Graduate Degree | 0 (0.0%) | 0 (0.0%) |
| Total | 110 (47.0%) | 124 (53.0%) |
Employment Characteristics in El Campo
Employment by Class of Employer in El Campo
Among the 4,741 employed individuals in El Campo, private company employees (3,416 | 72.1%), local government employees (478 | 10.1%), and not-for-profit organizations (252 | 5.3%) make up the most common classes of employment.
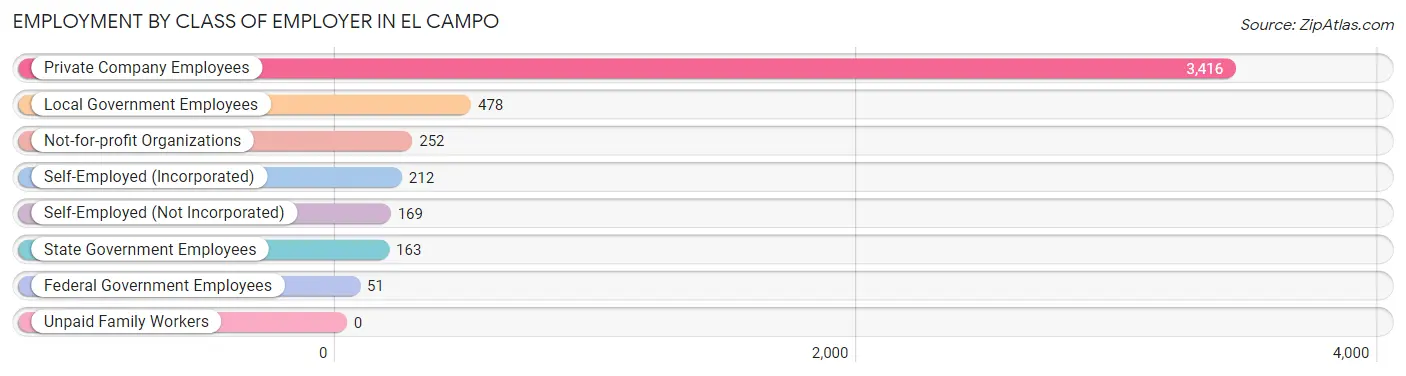
| Employer Class | # Employees | % Employees |
| Private Company Employees | 3,416 | 72.1% |
| Self-Employed (Incorporated) | 212 | 4.5% |
| Self-Employed (Not Incorporated) | 169 | 3.6% |
| Not-for-profit Organizations | 252 | 5.3% |
| Local Government Employees | 478 | 10.1% |
| State Government Employees | 163 | 3.4% |
| Federal Government Employees | 51 | 1.1% |
| Unpaid Family Workers | 0 | 0.0% |
| Total | 4,741 | 100.0% |
Employment Status by Age in El Campo
According to the labor force statistics for El Campo, out of the total population over 16 years of age (9,102), 58.5% or 5,325 individuals are in the labor force, with 9.0% or 479 of them unemployed. The age group with the highest labor force participation rate is 35 to 44 years, with 84.9% or 1,584 individuals in the labor force. Within the labor force, the 16 to 19 years age range has the highest percentage of unemployed individuals, with 53.9% or 76 of them being unemployed.
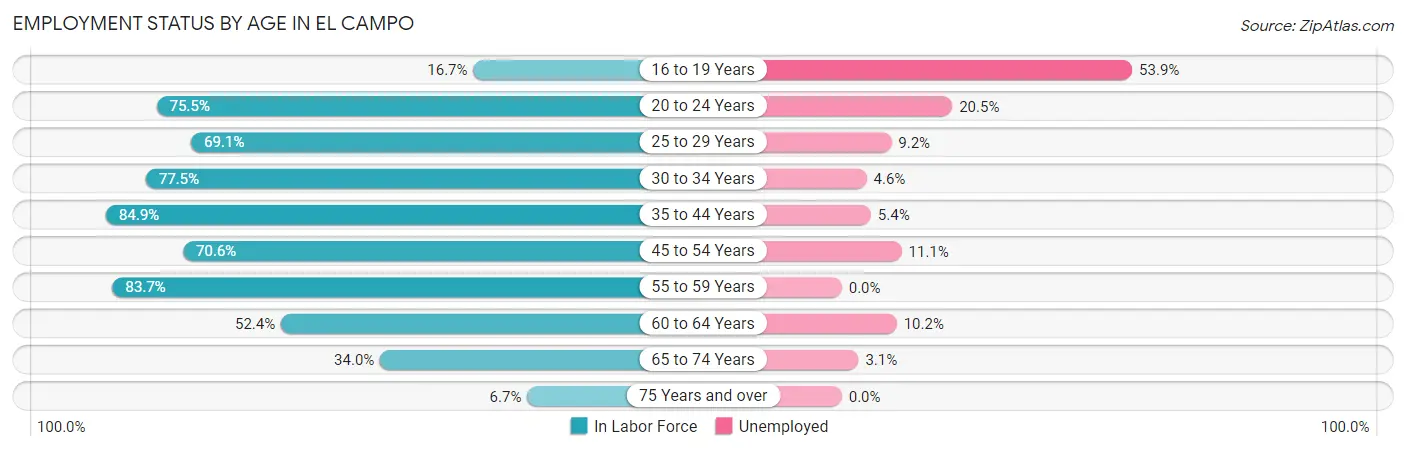
| Age Bracket | In Labor Force | Unemployed |
| 16 to 19 Years | 141 (16.7%) | 76 (53.9%) |
| 20 to 24 Years | 542 (75.5%) | 111 (20.5%) |
| 25 to 29 Years | 358 (69.1%) | 33 (9.2%) |
| 30 to 34 Years | 636 (77.5%) | 29 (4.6%) |
| 35 to 44 Years | 1,584 (84.9%) | 86 (5.4%) |
| 45 to 54 Years | 927 (70.6%) | 103 (11.1%) |
| 55 to 59 Years | 406 (83.7%) | 0 (0.0%) |
| 60 to 64 Years | 265 (52.4%) | 27 (10.2%) |
| 65 to 74 Years | 413 (34.0%) | 13 (3.1%) |
| 75 Years and over | 55 (6.7%) | 0 (0.0%) |
| Total | 5,325 (58.5%) | 479 (9.0%) |
Employment Status by Educational Attainment in El Campo
According to labor force statistics for El Campo, 75.8% of individuals (4,176) out of the total population between 25 and 64 years of age (5,509) are in the labor force, with 6.7% or 280 of them being unemployed. The group with the highest labor force participation rate are those with the educational attainment of bachelor's degree or higher, with 81.5% or 639 individuals in the labor force. Within the labor force, individuals with high school diploma education have the highest percentage of unemployment, with 11.6% or 148 of them being unemployed.
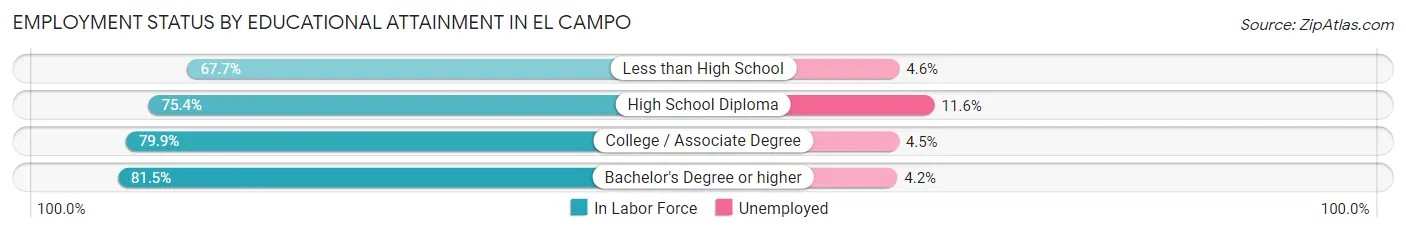
| Educational Attainment | In Labor Force | Unemployed |
| Less than High School | 904 (67.7%) | 61 (4.6%) |
| High School Diploma | 1,275 (75.4%) | 196 (11.6%) |
| College / Associate Degree | 1,357 (79.9%) | 76 (4.5%) |
| Bachelor's Degree or higher | 639 (81.5%) | 33 (4.2%) |
| Total | 4,176 (75.8%) | 369 (6.7%) |
Employment Occupations by Sex in El Campo
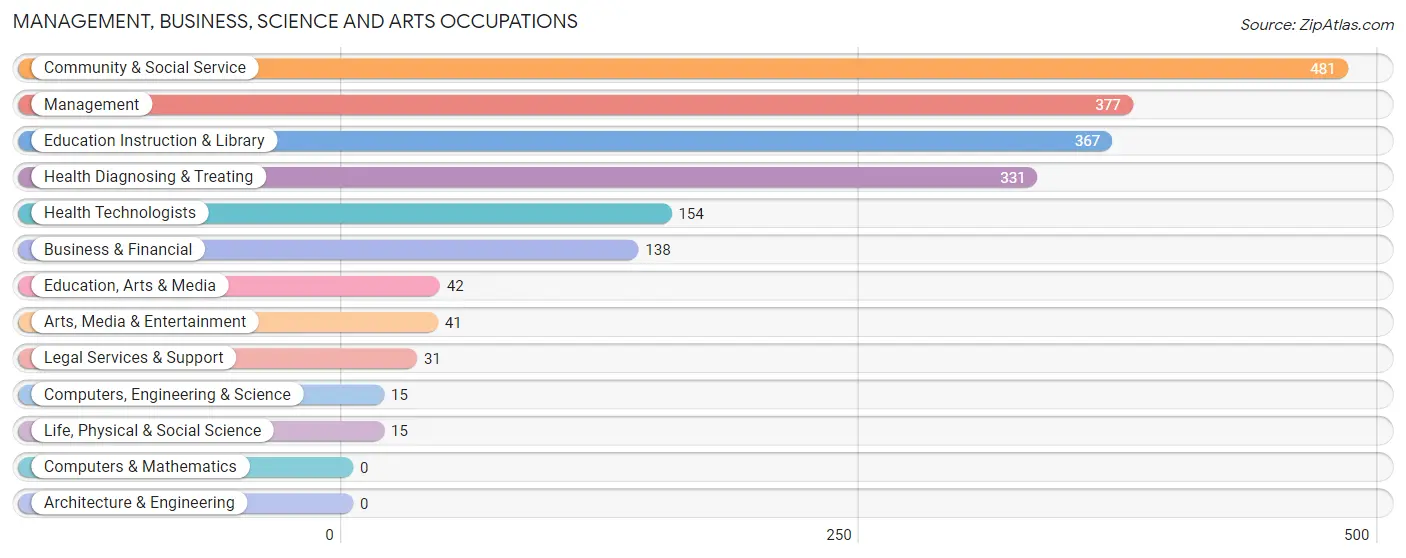
Management, Business, Science and Arts Occupations
The most common Management, Business, Science and Arts occupations in El Campo are Community & Social Service (481 | 9.9%), Management (377 | 7.8%), Education Instruction & Library (367 | 7.6%), Health Diagnosing & Treating (331 | 6.8%), and Health Technologists (154 | 3.2%).
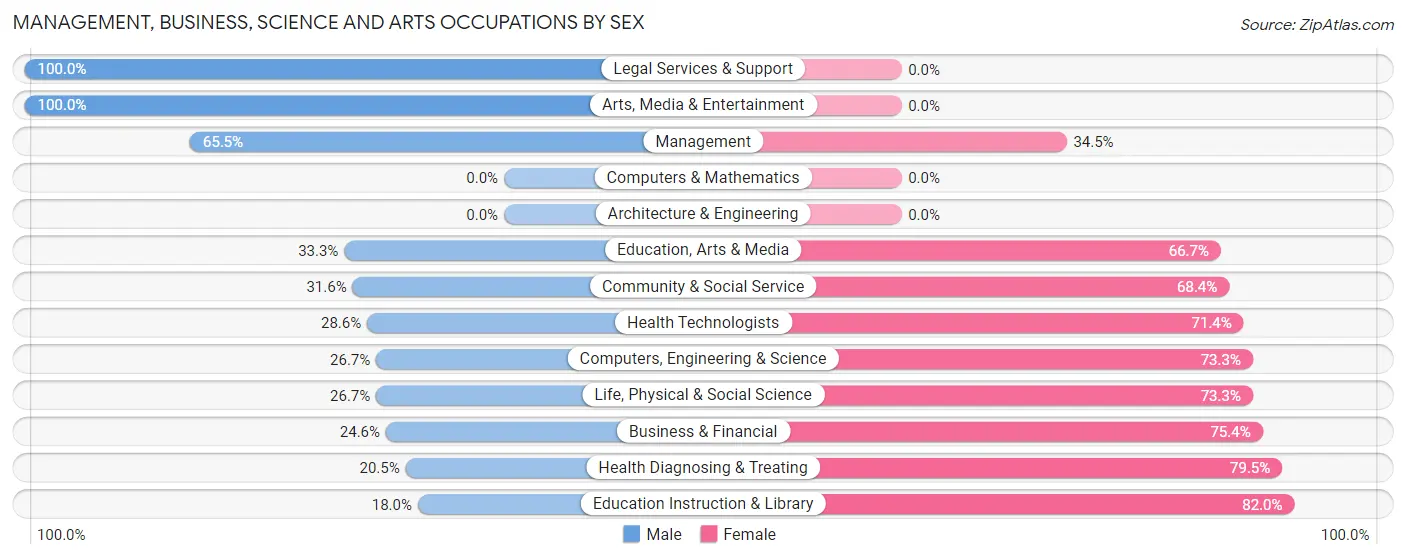
Management, Business, Science and Arts Occupations by Sex
Within the Management, Business, Science and Arts occupations in El Campo, the most male-oriented occupations are Legal Services & Support (100.0%), Arts, Media & Entertainment (100.0%), and Management (65.5%), while the most female-oriented occupations are Education Instruction & Library (82.0%), Health Diagnosing & Treating (79.5%), and Business & Financial (75.4%).
| Occupation | Male | Female |
| Management | 247 (65.5%) | 130 (34.5%) |
| Business & Financial | 34 (24.6%) | 104 (75.4%) |
| Computers, Engineering & Science | 4 (26.7%) | 11 (73.3%) |
| Computers & Mathematics | 0 (0.0%) | 0 (0.0%) |
| Architecture & Engineering | 0 (0.0%) | 0 (0.0%) |
| Life, Physical & Social Science | 4 (26.7%) | 11 (73.3%) |
| Community & Social Service | 152 (31.6%) | 329 (68.4%) |
| Education, Arts & Media | 14 (33.3%) | 28 (66.7%) |
| Legal Services & Support | 31 (100.0%) | 0 (0.0%) |
| Education Instruction & Library | 66 (18.0%) | 301 (82.0%) |
| Arts, Media & Entertainment | 41 (100.0%) | 0 (0.0%) |
| Health Diagnosing & Treating | 68 (20.5%) | 263 (79.5%) |
| Health Technologists | 44 (28.6%) | 110 (71.4%) |
| Total (Category) | 505 (37.6%) | 837 (62.4%) |
| Total (Overall) | 2,819 (58.1%) | 2,030 (41.9%) |
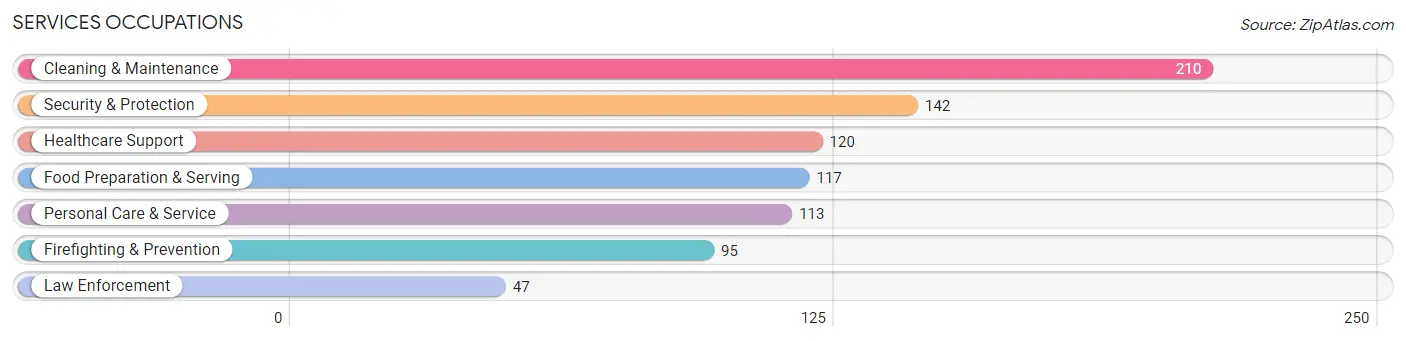
Services Occupations
The most common Services occupations in El Campo are Cleaning & Maintenance (210 | 4.3%), Security & Protection (142 | 2.9%), Healthcare Support (120 | 2.5%), Food Preparation & Serving (117 | 2.4%), and Personal Care & Service (113 | 2.3%).
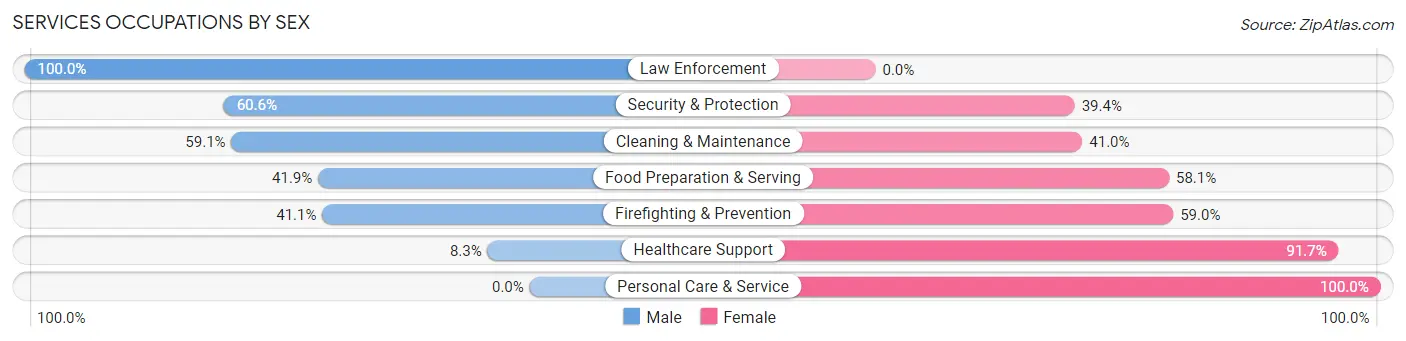
Services Occupations by Sex
Within the Services occupations in El Campo, the most male-oriented occupations are Law Enforcement (100.0%), Security & Protection (60.6%), and Cleaning & Maintenance (59.1%), while the most female-oriented occupations are Personal Care & Service (100.0%), Healthcare Support (91.7%), and Firefighting & Prevention (59.0%).
| Occupation | Male | Female |
| Healthcare Support | 10 (8.3%) | 110 (91.7%) |
| Security & Protection | 86 (60.6%) | 56 (39.4%) |
| Firefighting & Prevention | 39 (41.0%) | 56 (59.0%) |
| Law Enforcement | 47 (100.0%) | 0 (0.0%) |
| Food Preparation & Serving | 49 (41.9%) | 68 (58.1%) |
| Cleaning & Maintenance | 124 (59.1%) | 86 (40.9%) |
| Personal Care & Service | 0 (0.0%) | 113 (100.0%) |
| Total (Category) | 269 (38.3%) | 433 (61.7%) |
| Total (Overall) | 2,819 (58.1%) | 2,030 (41.9%) |
Sales and Office Occupations
The most common Sales and Office occupations in El Campo are Sales & Related (680 | 14.0%), and Office & Administration (432 | 8.9%).
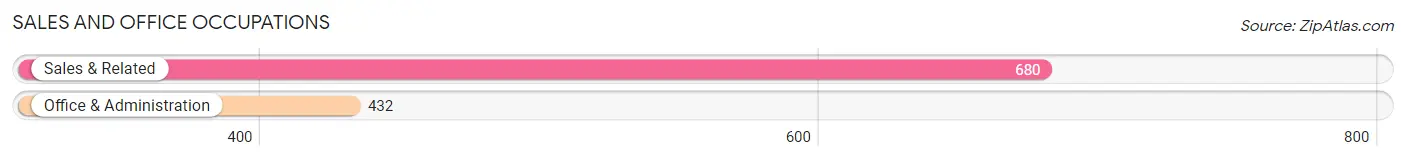
Sales and Office Occupations by Sex

| Occupation | Male | Female |
| Sales & Related | 413 (60.7%) | 267 (39.3%) |
| Office & Administration | 64 (14.8%) | 368 (85.2%) |
| Total (Category) | 477 (42.9%) | 635 (57.1%) |
| Total (Overall) | 2,819 (58.1%) | 2,030 (41.9%) |
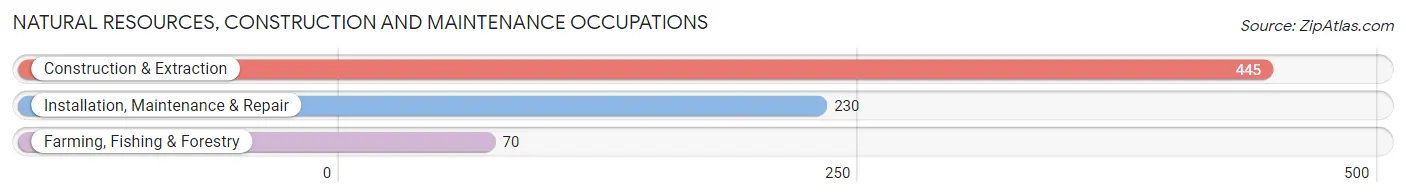
Natural Resources, Construction and Maintenance Occupations
The most common Natural Resources, Construction and Maintenance occupations in El Campo are Construction & Extraction (445 | 9.2%), Installation, Maintenance & Repair (230 | 4.7%), and Farming, Fishing & Forestry (70 | 1.4%).
Natural Resources, Construction and Maintenance Occupations by Sex
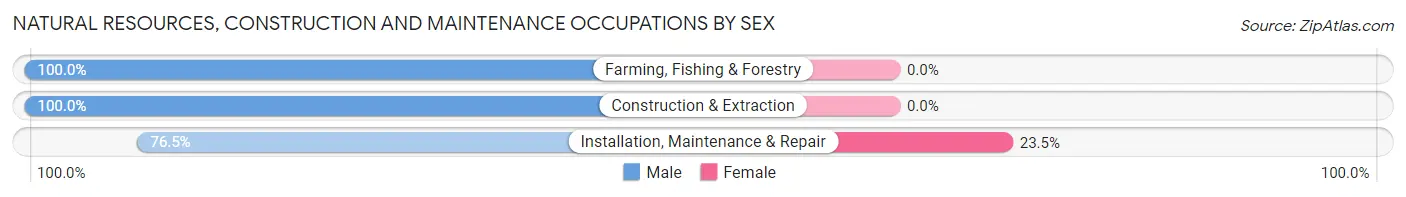
| Occupation | Male | Female |
| Farming, Fishing & Forestry | 70 (100.0%) | 0 (0.0%) |
| Construction & Extraction | 445 (100.0%) | 0 (0.0%) |
| Installation, Maintenance & Repair | 176 (76.5%) | 54 (23.5%) |
| Total (Category) | 691 (92.7%) | 54 (7.2%) |
| Total (Overall) | 2,819 (58.1%) | 2,030 (41.9%) |
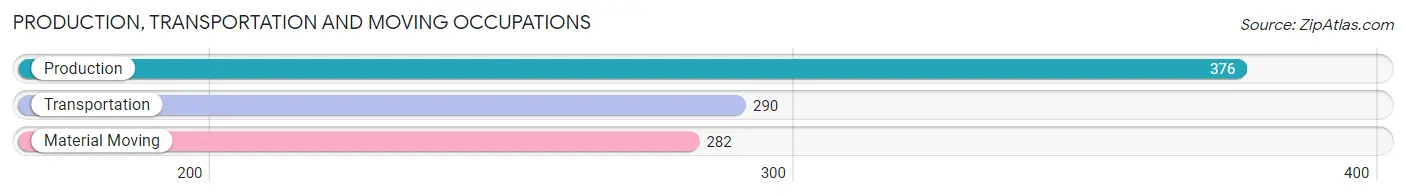
Production, Transportation and Moving Occupations
The most common Production, Transportation and Moving occupations in El Campo are Production (376 | 7.7%), Transportation (290 | 6.0%), and Material Moving (282 | 5.8%).
Production, Transportation and Moving Occupations by Sex
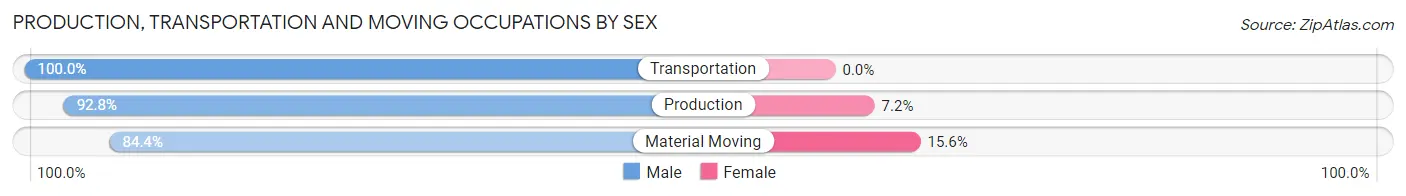
| Occupation | Male | Female |
| Production | 349 (92.8%) | 27 (7.2%) |
| Transportation | 290 (100.0%) | 0 (0.0%) |
| Material Moving | 238 (84.4%) | 44 (15.6%) |
| Total (Category) | 877 (92.5%) | 71 (7.5%) |
| Total (Overall) | 2,819 (58.1%) | 2,030 (41.9%) |
Employment Industries by Sex in El Campo
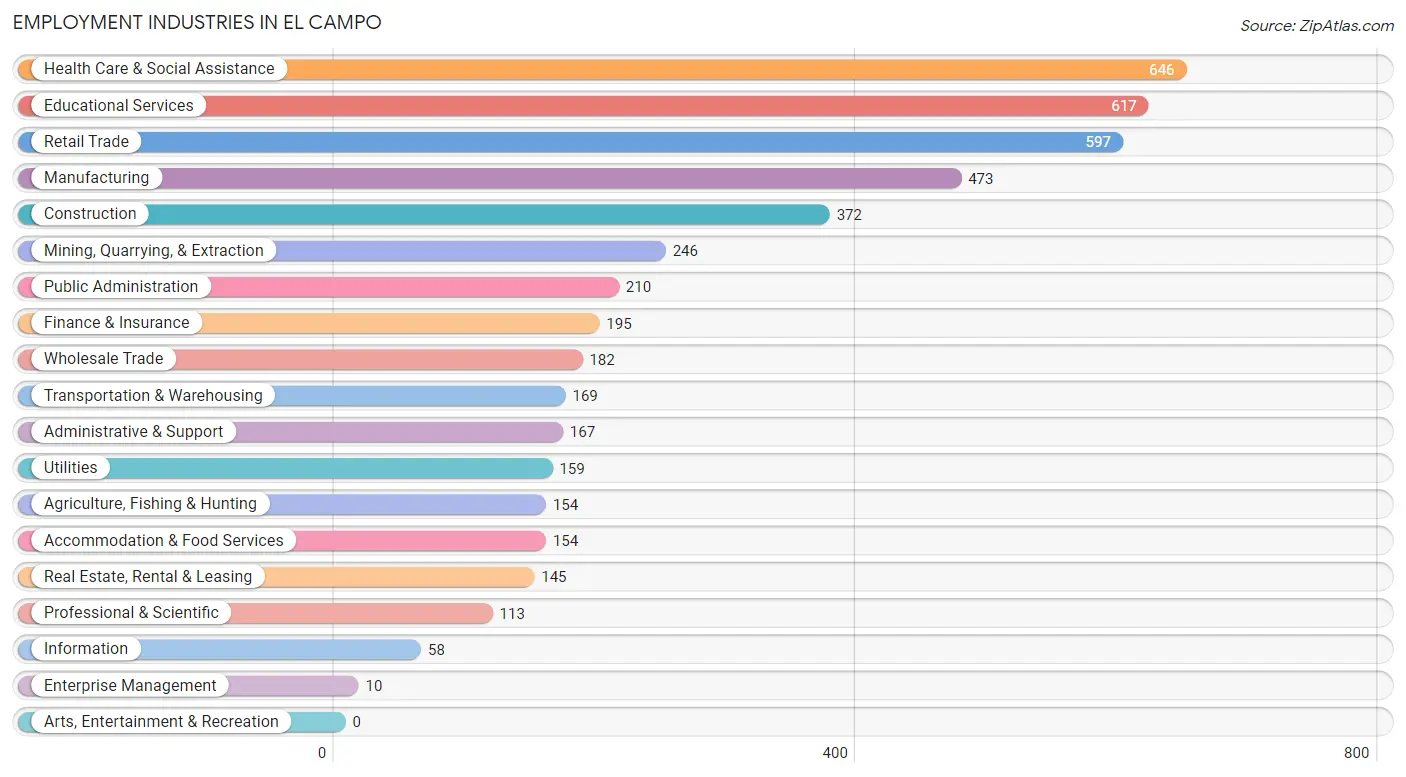
Employment Industries in El Campo
The major employment industries in El Campo include Health Care & Social Assistance (646 | 13.3%), Educational Services (617 | 12.7%), Retail Trade (597 | 12.3%), Manufacturing (473 | 9.8%), and Construction (372 | 7.7%).
Employment Industries by Sex in El Campo
The El Campo industries that see more men than women are Agriculture, Fishing & Hunting (100.0%), Utilities (100.0%), and Information (100.0%), whereas the industries that tend to have a higher number of women are Educational Services (85.4%), Health Care & Social Assistance (84.8%), and Finance & Insurance (63.1%).
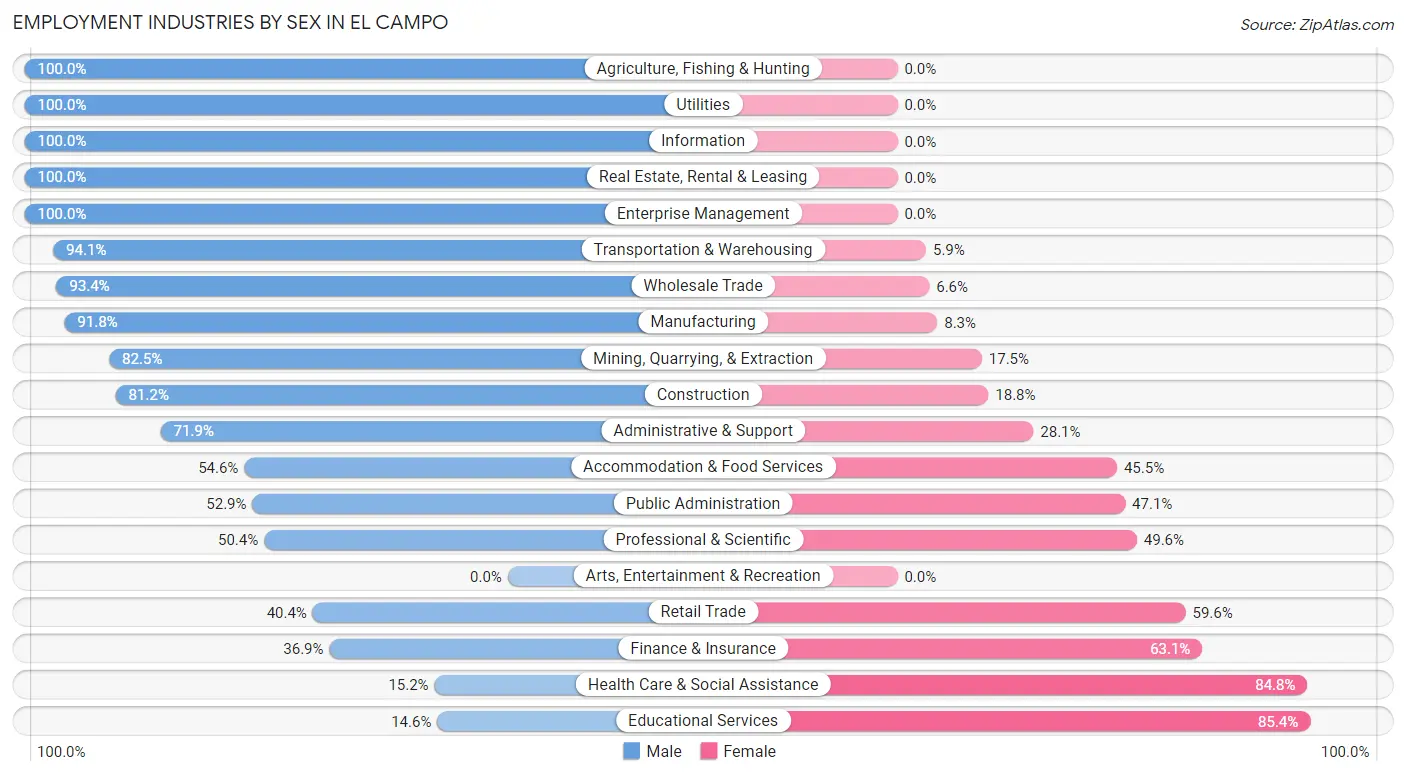
| Industry | Male | Female |
| Agriculture, Fishing & Hunting | 154 (100.0%) | 0 (0.0%) |
| Mining, Quarrying, & Extraction | 203 (82.5%) | 43 (17.5%) |
| Construction | 302 (81.2%) | 70 (18.8%) |
| Manufacturing | 434 (91.7%) | 39 (8.3%) |
| Wholesale Trade | 170 (93.4%) | 12 (6.6%) |
| Retail Trade | 241 (40.4%) | 356 (59.6%) |
| Transportation & Warehousing | 159 (94.1%) | 10 (5.9%) |
| Utilities | 159 (100.0%) | 0 (0.0%) |
| Information | 58 (100.0%) | 0 (0.0%) |
| Finance & Insurance | 72 (36.9%) | 123 (63.1%) |
| Real Estate, Rental & Leasing | 145 (100.0%) | 0 (0.0%) |
| Professional & Scientific | 57 (50.4%) | 56 (49.6%) |
| Enterprise Management | 10 (100.0%) | 0 (0.0%) |
| Administrative & Support | 120 (71.9%) | 47 (28.1%) |
| Educational Services | 90 (14.6%) | 527 (85.4%) |
| Health Care & Social Assistance | 98 (15.2%) | 548 (84.8%) |
| Arts, Entertainment & Recreation | 0 (0.0%) | 0 (0.0%) |
| Accommodation & Food Services | 84 (54.5%) | 70 (45.5%) |
| Public Administration | 111 (52.9%) | 99 (47.1%) |
| Total | 2,819 (58.1%) | 2,030 (41.9%) |
Education in El Campo
School Enrollment in El Campo
The most common levels of schooling among the 3,239 students in El Campo are high school (889 | 27.5%), elementary school (798 | 24.6%), and middle school (714 | 22.0%).
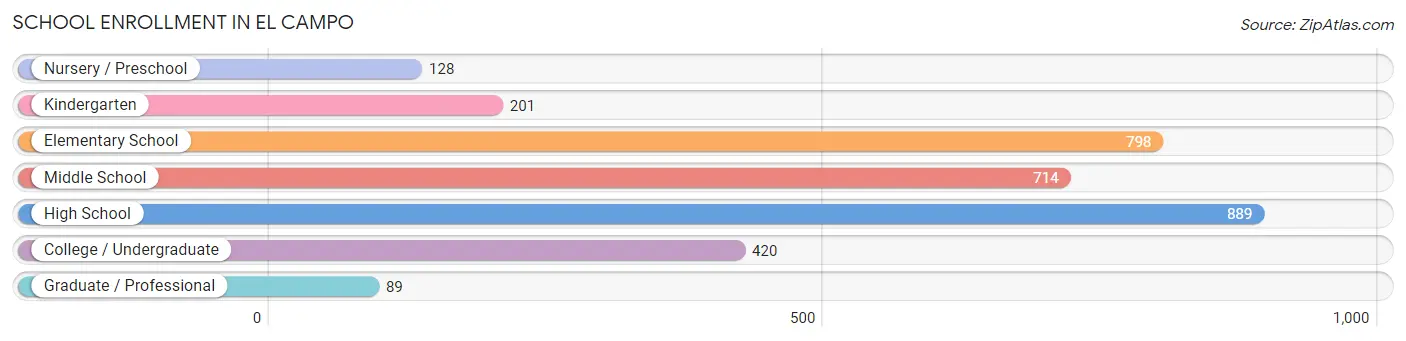
| School Level | # Students | % Students |
| Nursery / Preschool | 128 | 4.0% |
| Kindergarten | 201 | 6.2% |
| Elementary School | 798 | 24.6% |
| Middle School | 714 | 22.0% |
| High School | 889 | 27.5% |
| College / Undergraduate | 420 | 13.0% |
| Graduate / Professional | 89 | 2.8% |
| Total | 3,239 | 100.0% |
School Enrollment by Age by Funding Source in El Campo
Out of a total of 3,239 students who are enrolled in schools in El Campo, 343 (10.6%) attend a private institution, while the remaining 2,896 (89.4%) are enrolled in public schools. The age group of 3 to 4 year olds has the highest likelihood of being enrolled in private schools, with 87 (75.0% in the age bracket) enrolled. Conversely, the age group of 18 to 19 year olds has the lowest likelihood of being enrolled in a private school, with 255 (100.0% in the age bracket) attending a public institution.
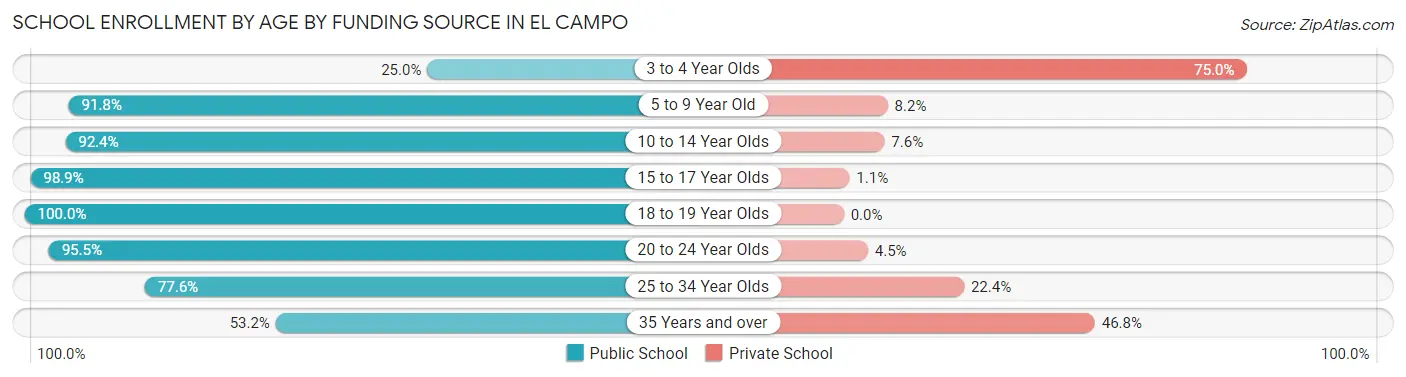
| Age Bracket | Public School | Private School |
| 3 to 4 Year Olds | 29 (25.0%) | 87 (75.0%) |
| 5 to 9 Year Old | 953 (91.8%) | 85 (8.2%) |
| 10 to 14 Year Olds | 657 (92.4%) | 54 (7.6%) |
| 15 to 17 Year Olds | 646 (98.9%) | 7 (1.1%) |
| 18 to 19 Year Olds | 255 (100.0%) | 0 (0.0%) |
| 20 to 24 Year Olds | 212 (95.5%) | 10 (4.5%) |
| 25 to 34 Year Olds | 45 (77.6%) | 13 (22.4%) |
| 35 Years and over | 99 (53.2%) | 87 (46.8%) |
| Total | 2,896 (89.4%) | 343 (10.6%) |
Educational Attainment by Field of Study in El Campo
Education (429 | 30.7%), business (280 | 20.1%), arts & humanities (115 | 8.2%), bio, nature & agricultural (113 | 8.1%), and communications (78 | 5.6%) are the most common fields of study among 1,395 individuals in El Campo who have obtained a bachelor's degree or higher.
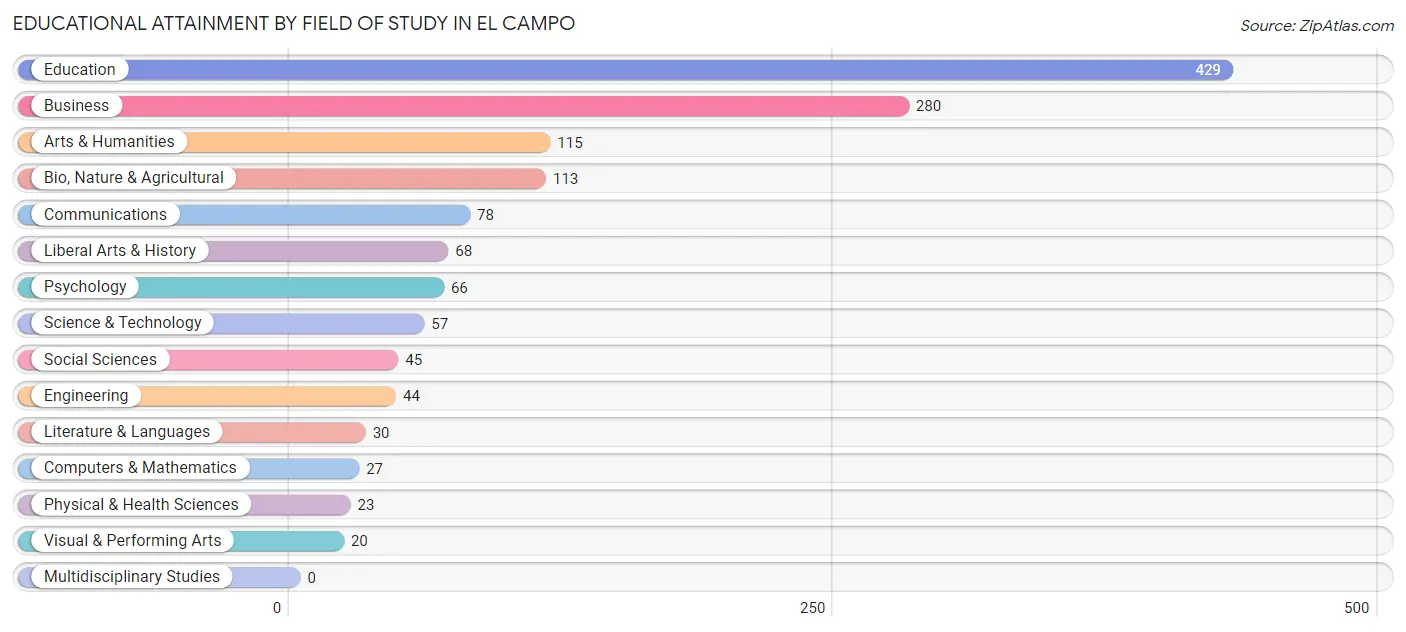
| Field of Study | # Graduates | % Graduates |
| Computers & Mathematics | 27 | 1.9% |
| Bio, Nature & Agricultural | 113 | 8.1% |
| Physical & Health Sciences | 23 | 1.7% |
| Psychology | 66 | 4.7% |
| Social Sciences | 45 | 3.2% |
| Engineering | 44 | 3.2% |
| Multidisciplinary Studies | 0 | 0.0% |
| Science & Technology | 57 | 4.1% |
| Business | 280 | 20.1% |
| Education | 429 | 30.7% |
| Literature & Languages | 30 | 2.1% |
| Liberal Arts & History | 68 | 4.9% |
| Visual & Performing Arts | 20 | 1.4% |
| Communications | 78 | 5.6% |
| Arts & Humanities | 115 | 8.2% |
| Total | 1,395 | 100.0% |
Transportation & Commute in El Campo
Vehicle Availability by Sex in El Campo
The most prevalent vehicle ownership categories in El Campo are males with 2 vehicles (1,475, accounting for 54.0%) and females with 2 vehicles (900, making up 73.4%).
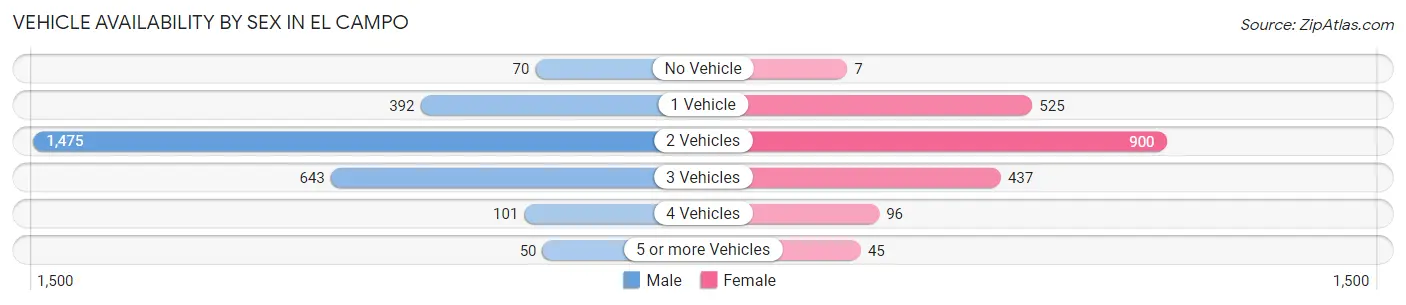
| Vehicles Available | Male | Female |
| No Vehicle | 70 (2.6%) | 7 (0.4%) |
| 1 Vehicle | 392 (14.3%) | 525 (26.1%) |
| 2 Vehicles | 1,475 (54.0%) | 900 (44.8%) |
| 3 Vehicles | 643 (23.5%) | 437 (21.7%) |
| 4 Vehicles | 101 (3.7%) | 96 (4.8%) |
| 5 or more Vehicles | 50 (1.8%) | 45 (2.2%) |
| Total | 2,731 (100.0%) | 2,010 (100.0%) |
Commute Time in El Campo
The most frequently occuring commute durations in El Campo are 5 to 9 minutes (1,105 commuters, 24.0%), 10 to 14 minutes (684 commuters, 14.8%), and 15 to 19 minutes (672 commuters, 14.6%).
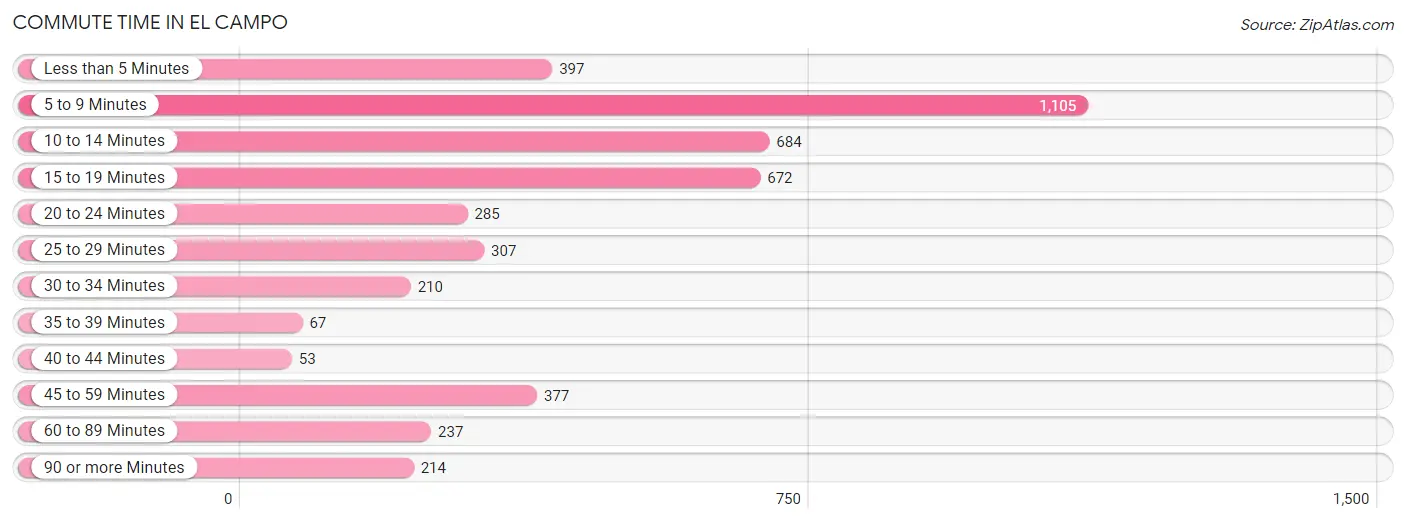
| Commute Time | # Commuters | % Commuters |
| Less than 5 Minutes | 397 | 8.6% |
| 5 to 9 Minutes | 1,105 | 24.0% |
| 10 to 14 Minutes | 684 | 14.8% |
| 15 to 19 Minutes | 672 | 14.6% |
| 20 to 24 Minutes | 285 | 6.2% |
| 25 to 29 Minutes | 307 | 6.7% |
| 30 to 34 Minutes | 210 | 4.6% |
| 35 to 39 Minutes | 67 | 1.5% |
| 40 to 44 Minutes | 53 | 1.1% |
| 45 to 59 Minutes | 377 | 8.2% |
| 60 to 89 Minutes | 237 | 5.1% |
| 90 or more Minutes | 214 | 4.6% |
Commute Time by Sex in El Campo
The most common commute times in El Campo are 5 to 9 minutes (622 commuters, 22.9%) for males and 5 to 9 minutes (483 commuters, 25.5%) for females.
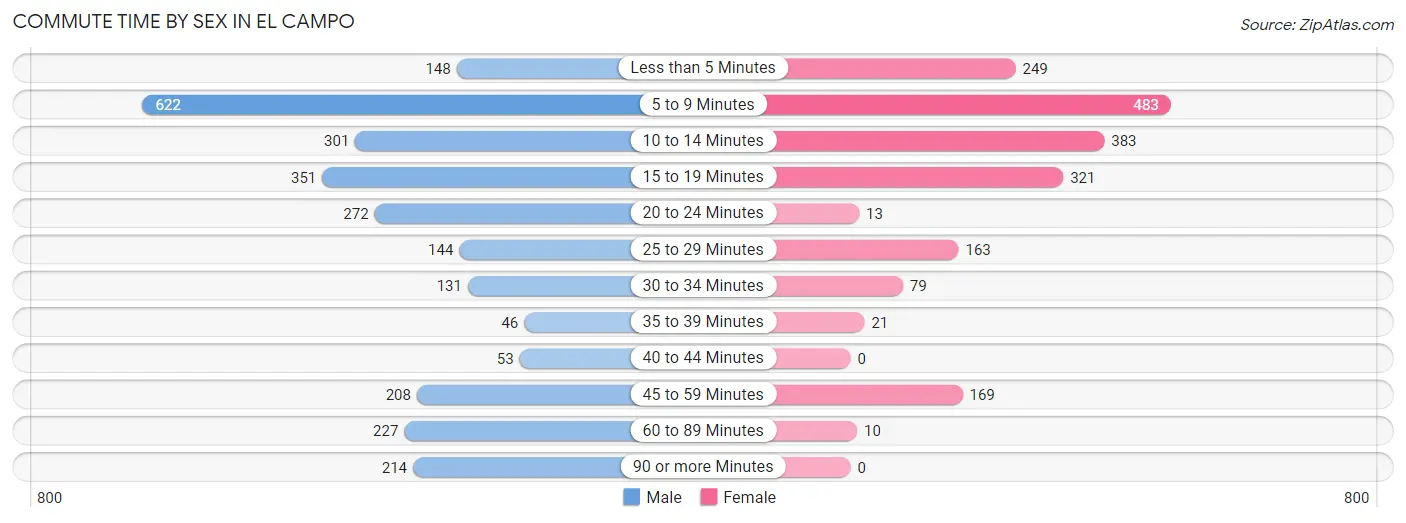
| Commute Time | Male | Female |
| Less than 5 Minutes | 148 (5.4%) | 249 (13.2%) |
| 5 to 9 Minutes | 622 (22.9%) | 483 (25.5%) |
| 10 to 14 Minutes | 301 (11.1%) | 383 (20.3%) |
| 15 to 19 Minutes | 351 (12.9%) | 321 (17.0%) |
| 20 to 24 Minutes | 272 (10.0%) | 13 (0.7%) |
| 25 to 29 Minutes | 144 (5.3%) | 163 (8.6%) |
| 30 to 34 Minutes | 131 (4.8%) | 79 (4.2%) |
| 35 to 39 Minutes | 46 (1.7%) | 21 (1.1%) |
| 40 to 44 Minutes | 53 (1.9%) | 0 (0.0%) |
| 45 to 59 Minutes | 208 (7.7%) | 169 (8.9%) |
| 60 to 89 Minutes | 227 (8.4%) | 10 (0.5%) |
| 90 or more Minutes | 214 (7.9%) | 0 (0.0%) |
Time of Departure to Work by Sex in El Campo
The most frequent times of departure to work in El Campo are 7:00 AM to 7:29 AM (613, 22.6%) for males and 7:00 AM to 7:29 AM (645, 34.1%) for females.
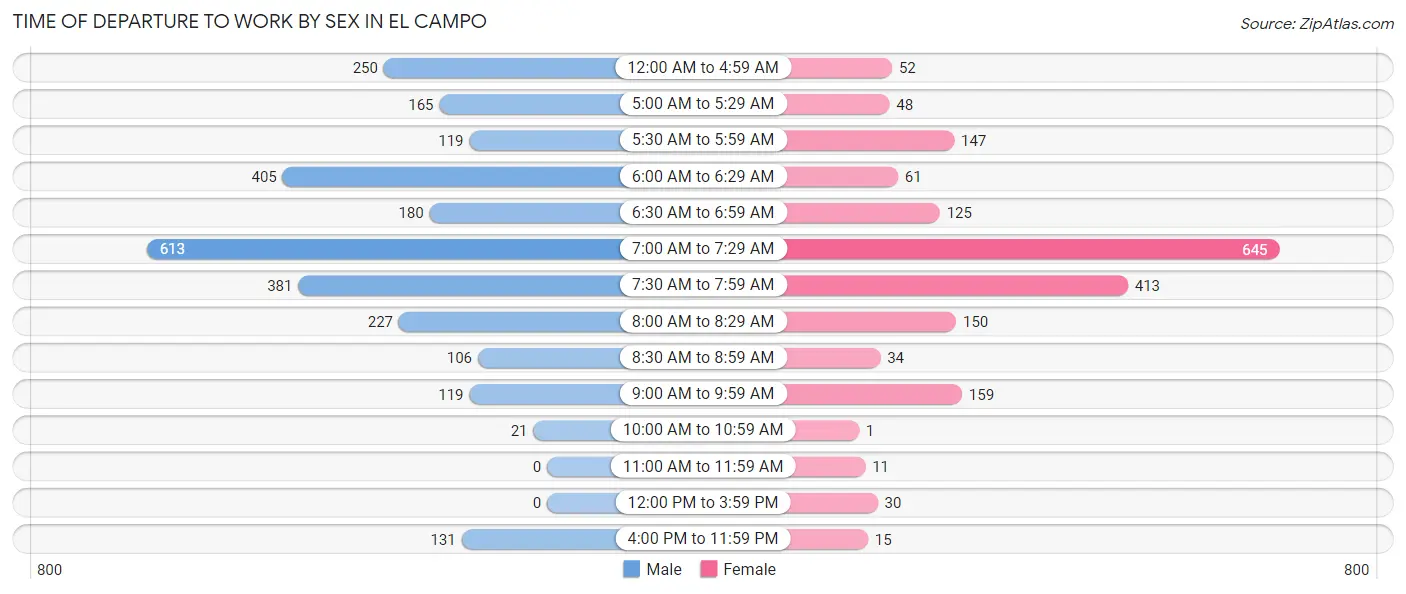
| Time of Departure | Male | Female |
| 12:00 AM to 4:59 AM | 250 (9.2%) | 52 (2.8%) |
| 5:00 AM to 5:29 AM | 165 (6.1%) | 48 (2.5%) |
| 5:30 AM to 5:59 AM | 119 (4.4%) | 147 (7.8%) |
| 6:00 AM to 6:29 AM | 405 (14.9%) | 61 (3.2%) |
| 6:30 AM to 6:59 AM | 180 (6.6%) | 125 (6.6%) |
| 7:00 AM to 7:29 AM | 613 (22.6%) | 645 (34.1%) |
| 7:30 AM to 7:59 AM | 381 (14.0%) | 413 (21.8%) |
| 8:00 AM to 8:29 AM | 227 (8.4%) | 150 (7.9%) |
| 8:30 AM to 8:59 AM | 106 (3.9%) | 34 (1.8%) |
| 9:00 AM to 9:59 AM | 119 (4.4%) | 159 (8.4%) |
| 10:00 AM to 10:59 AM | 21 (0.8%) | 1 (0.1%) |
| 11:00 AM to 11:59 AM | 0 (0.0%) | 11 (0.6%) |
| 12:00 PM to 3:59 PM | 0 (0.0%) | 30 (1.6%) |
| 4:00 PM to 11:59 PM | 131 (4.8%) | 15 (0.8%) |
| Total | 2,717 (100.0%) | 1,891 (100.0%) |
Housing Occupancy in El Campo
Occupancy by Ownership in El Campo
Of the total 4,284 dwellings in El Campo, owner-occupied units account for 2,432 (56.8%), while renter-occupied units make up 1,852 (43.2%).
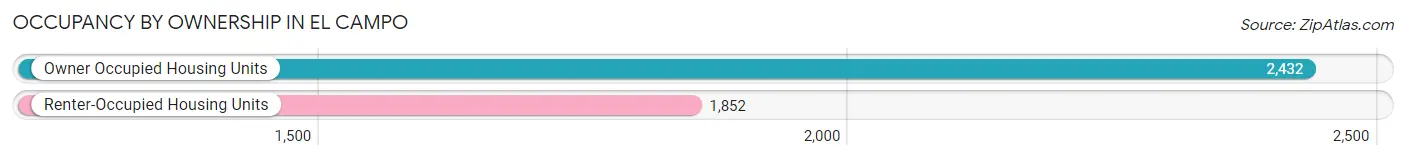
| Occupancy | # Housing Units | % Housing Units |
| Owner Occupied Housing Units | 2,432 | 56.8% |
| Renter-Occupied Housing Units | 1,852 | 43.2% |
| Total Occupied Housing Units | 4,284 | 100.0% |
Occupancy by Household Size in El Campo
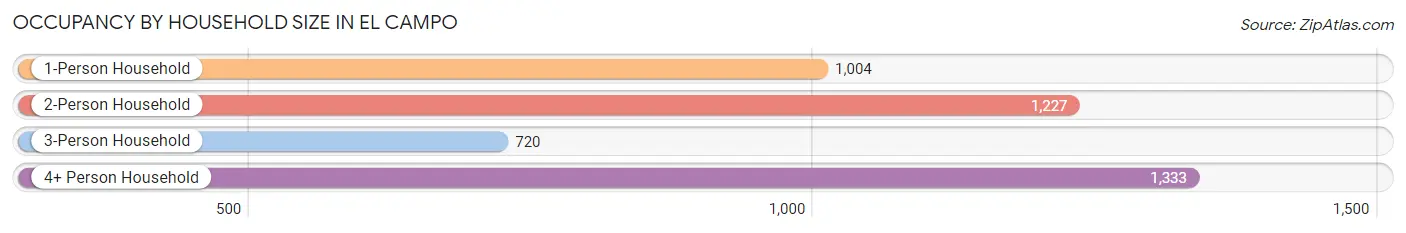
| Household Size | # Housing Units | % Housing Units |
| 1-Person Household | 1,004 | 23.4% |
| 2-Person Household | 1,227 | 28.6% |
| 3-Person Household | 720 | 16.8% |
| 4+ Person Household | 1,333 | 31.1% |
| Total Housing Units | 4,284 | 100.0% |
Occupancy by Ownership by Household Size in El Campo
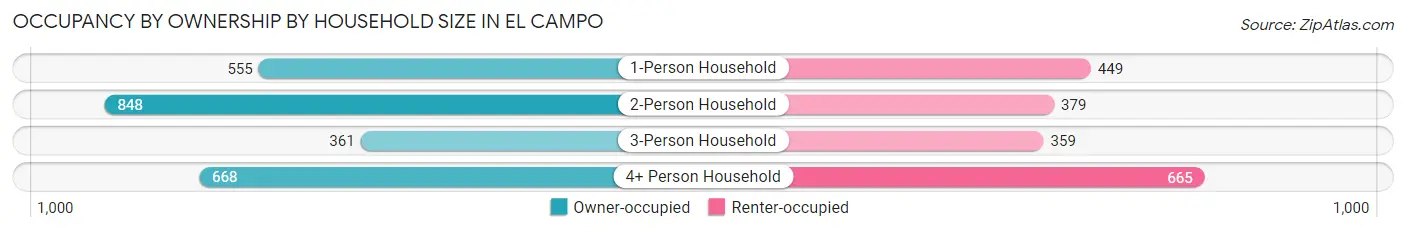
| Household Size | Owner-occupied | Renter-occupied |
| 1-Person Household | 555 (55.3%) | 449 (44.7%) |
| 2-Person Household | 848 (69.1%) | 379 (30.9%) |
| 3-Person Household | 361 (50.1%) | 359 (49.9%) |
| 4+ Person Household | 668 (50.1%) | 665 (49.9%) |
| Total Housing Units | 2,432 (56.8%) | 1,852 (43.2%) |
Occupancy by Educational Attainment in El Campo
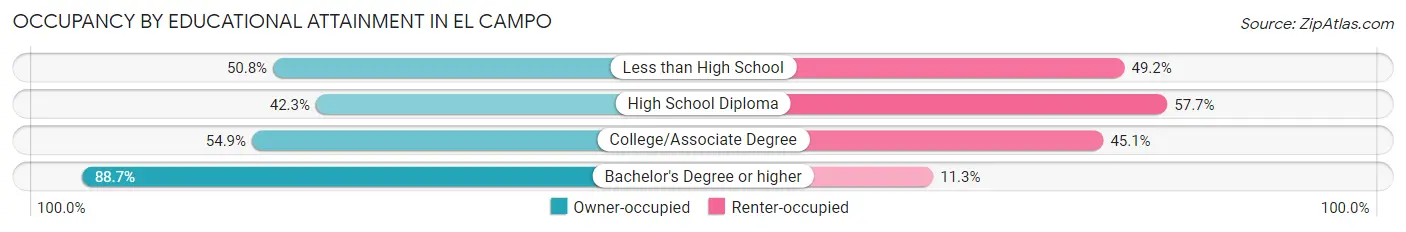
| Household Size | Owner-occupied | Renter-occupied |
| Less than High School | 535 (50.8%) | 519 (49.2%) |
| High School Diploma | 446 (42.3%) | 609 (57.7%) |
| College/Associate Degree | 778 (54.9%) | 638 (45.1%) |
| Bachelor's Degree or higher | 673 (88.7%) | 86 (11.3%) |
Occupancy by Age of Householder in El Campo
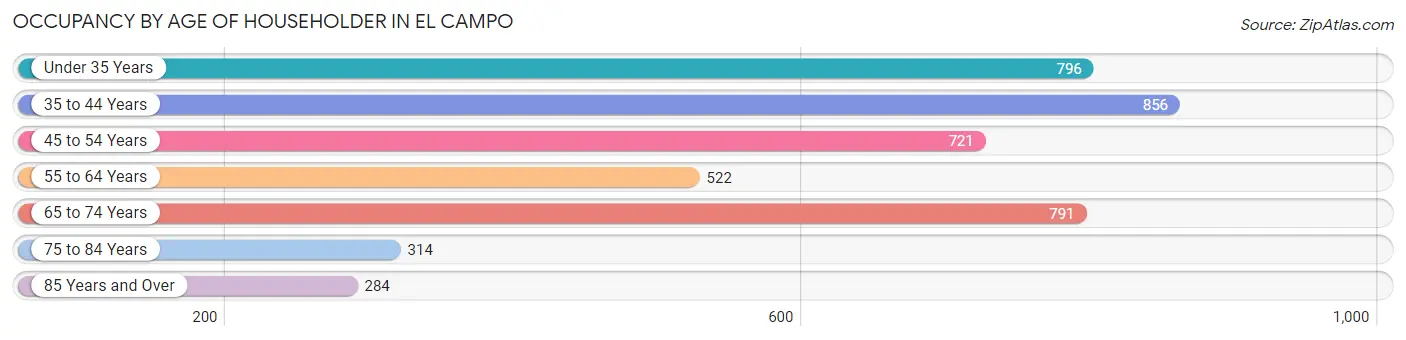
| Age Bracket | # Households | % Households |
| Under 35 Years | 796 | 18.6% |
| 35 to 44 Years | 856 | 20.0% |
| 45 to 54 Years | 721 | 16.8% |
| 55 to 64 Years | 522 | 12.2% |
| 65 to 74 Years | 791 | 18.5% |
| 75 to 84 Years | 314 | 7.3% |
| 85 Years and Over | 284 | 6.6% |
| Total | 4,284 | 100.0% |
Housing Finances in El Campo
Median Income by Occupancy in El Campo
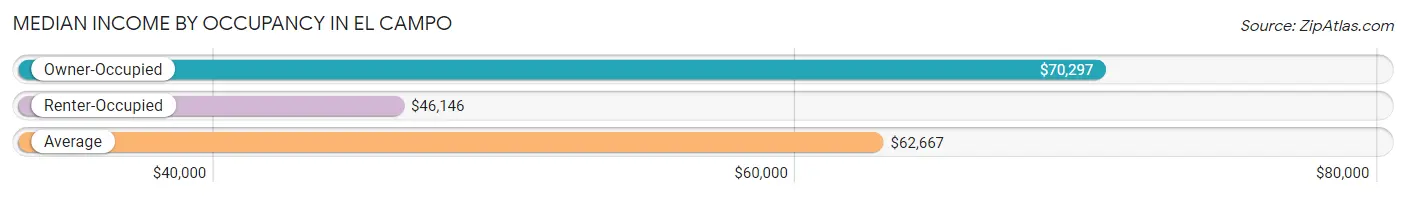
| Occupancy Type | # Households | Median Income |
| Owner-Occupied | 2,432 (56.8%) | $70,297 |
| Renter-Occupied | 1,852 (43.2%) | $46,146 |
| Average | 4,284 (100.0%) | $62,667 |
Occupancy by Householder Income Bracket in El Campo
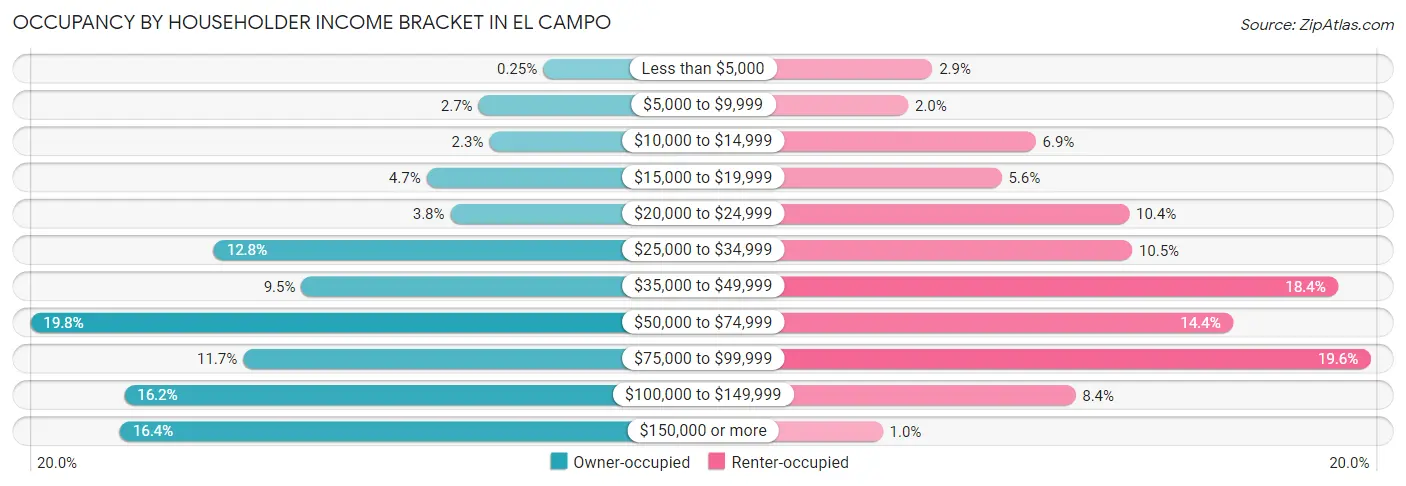
| Income Bracket | Owner-occupied | Renter-occupied |
| Less than $5,000 | 6 (0.3%) | 54 (2.9%) |
| $5,000 to $9,999 | 66 (2.7%) | 37 (2.0%) |
| $10,000 to $14,999 | 56 (2.3%) | 127 (6.9%) |
| $15,000 to $19,999 | 114 (4.7%) | 103 (5.6%) |
| $20,000 to $24,999 | 92 (3.8%) | 193 (10.4%) |
| $25,000 to $34,999 | 311 (12.8%) | 195 (10.5%) |
| $35,000 to $49,999 | 230 (9.5%) | 340 (18.4%) |
| $50,000 to $74,999 | 481 (19.8%) | 266 (14.4%) |
| $75,000 to $99,999 | 284 (11.7%) | 363 (19.6%) |
| $100,000 to $149,999 | 394 (16.2%) | 155 (8.4%) |
| $150,000 or more | 398 (16.4%) | 19 (1.0%) |
| Total | 2,432 (100.0%) | 1,852 (100.0%) |
Monthly Housing Cost Tiers in El Campo
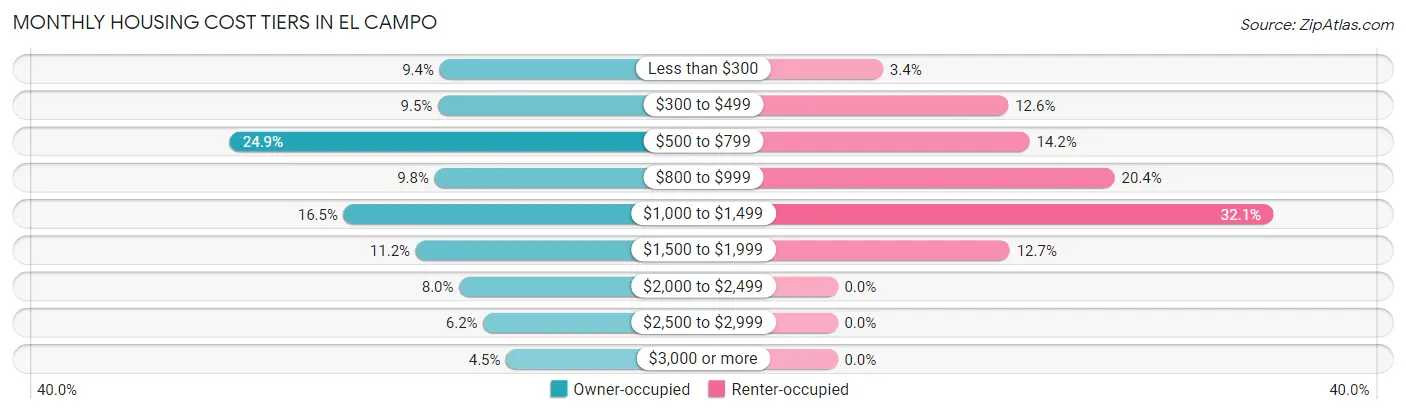
| Monthly Cost | Owner-occupied | Renter-occupied |
| Less than $300 | 229 (9.4%) | 62 (3.4%) |
| $300 to $499 | 232 (9.5%) | 233 (12.6%) |
| $500 to $799 | 605 (24.9%) | 262 (14.1%) |
| $800 to $999 | 238 (9.8%) | 378 (20.4%) |
| $1,000 to $1,499 | 401 (16.5%) | 594 (32.1%) |
| $1,500 to $1,999 | 272 (11.2%) | 235 (12.7%) |
| $2,000 to $2,499 | 194 (8.0%) | 0 (0.0%) |
| $2,500 to $2,999 | 151 (6.2%) | 0 (0.0%) |
| $3,000 or more | 110 (4.5%) | 0 (0.0%) |
| Total | 2,432 (100.0%) | 1,852 (100.0%) |
Physical Housing Characteristics in El Campo
Housing Structures in El Campo
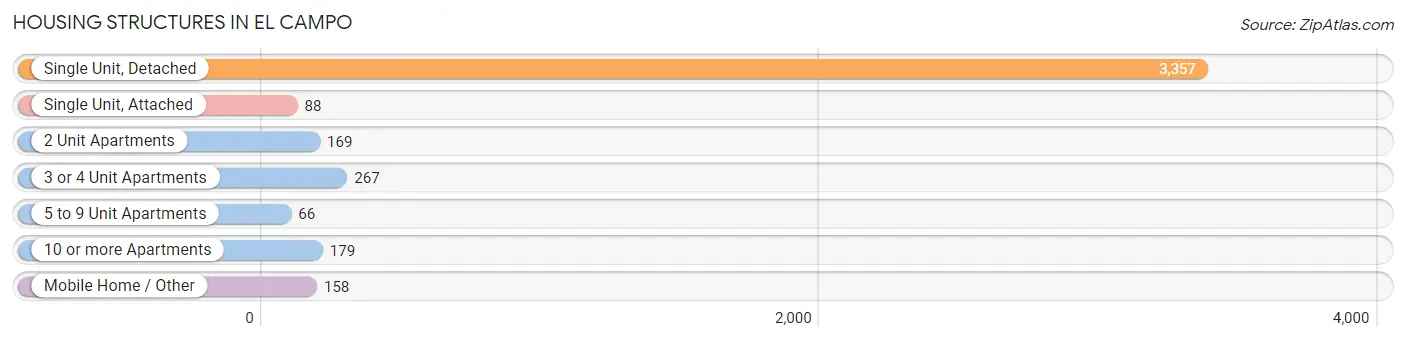
| Structure Type | # Housing Units | % Housing Units |
| Single Unit, Detached | 3,357 | 78.4% |
| Single Unit, Attached | 88 | 2.1% |
| 2 Unit Apartments | 169 | 3.9% |
| 3 or 4 Unit Apartments | 267 | 6.2% |
| 5 to 9 Unit Apartments | 66 | 1.5% |
| 10 or more Apartments | 179 | 4.2% |
| Mobile Home / Other | 158 | 3.7% |
| Total | 4,284 | 100.0% |
Housing Structures by Occupancy in El Campo
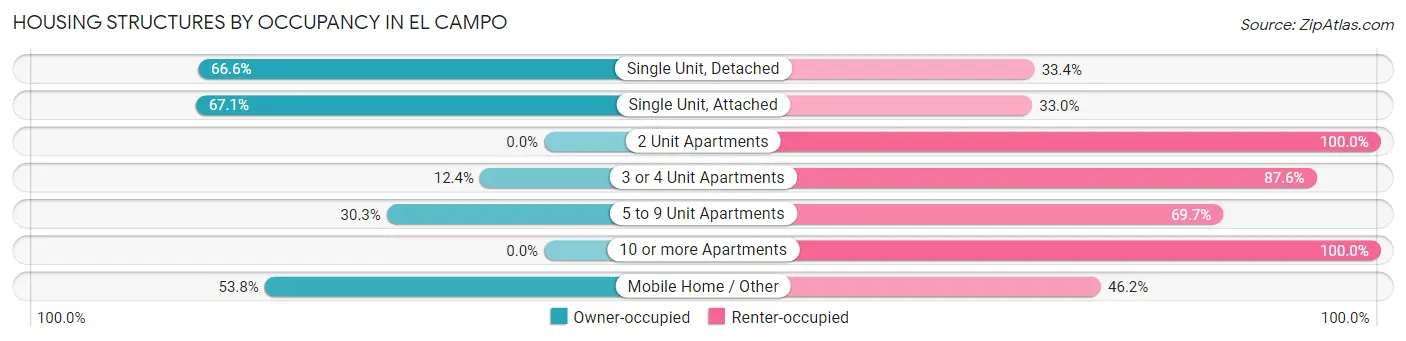
| Structure Type | Owner-occupied | Renter-occupied |
| Single Unit, Detached | 2,235 (66.6%) | 1,122 (33.4%) |
| Single Unit, Attached | 59 (67.0%) | 29 (33.0%) |
| 2 Unit Apartments | 0 (0.0%) | 169 (100.0%) |
| 3 or 4 Unit Apartments | 33 (12.4%) | 234 (87.6%) |
| 5 to 9 Unit Apartments | 20 (30.3%) | 46 (69.7%) |
| 10 or more Apartments | 0 (0.0%) | 179 (100.0%) |
| Mobile Home / Other | 85 (53.8%) | 73 (46.2%) |
| Total | 2,432 (56.8%) | 1,852 (43.2%) |
Housing Structures by Number of Rooms in El Campo
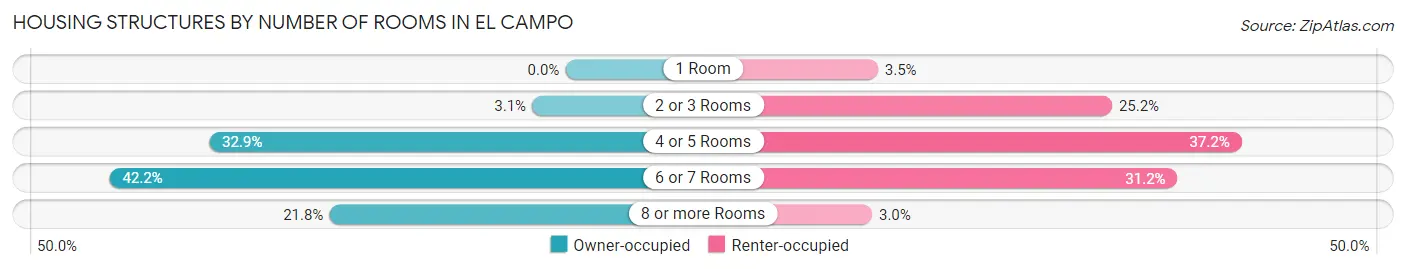
| Number of Rooms | Owner-occupied | Renter-occupied |
| 1 Room | 0 (0.0%) | 65 (3.5%) |
| 2 or 3 Rooms | 75 (3.1%) | 466 (25.2%) |
| 4 or 5 Rooms | 801 (32.9%) | 688 (37.1%) |
| 6 or 7 Rooms | 1,025 (42.1%) | 578 (31.2%) |
| 8 or more Rooms | 531 (21.8%) | 55 (3.0%) |
| Total | 2,432 (100.0%) | 1,852 (100.0%) |
Housing Structure by Heating Type in El Campo
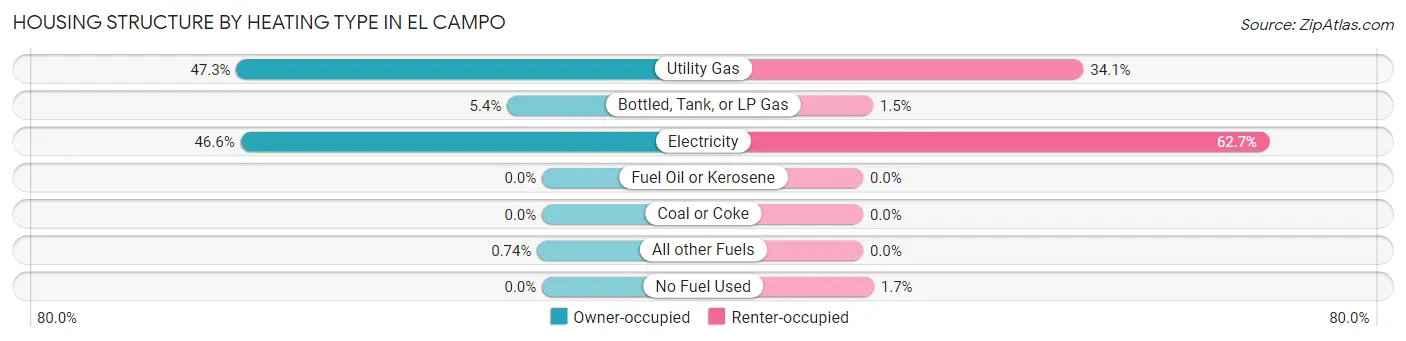
| Heating Type | Owner-occupied | Renter-occupied |
| Utility Gas | 1,149 (47.2%) | 631 (34.1%) |
| Bottled, Tank, or LP Gas | 131 (5.4%) | 28 (1.5%) |
| Electricity | 1,134 (46.6%) | 1,162 (62.7%) |
| Fuel Oil or Kerosene | 0 (0.0%) | 0 (0.0%) |
| Coal or Coke | 0 (0.0%) | 0 (0.0%) |
| All other Fuels | 18 (0.7%) | 0 (0.0%) |
| No Fuel Used | 0 (0.0%) | 31 (1.7%) |
| Total | 2,432 (100.0%) | 1,852 (100.0%) |
Household Vehicle Usage in El Campo
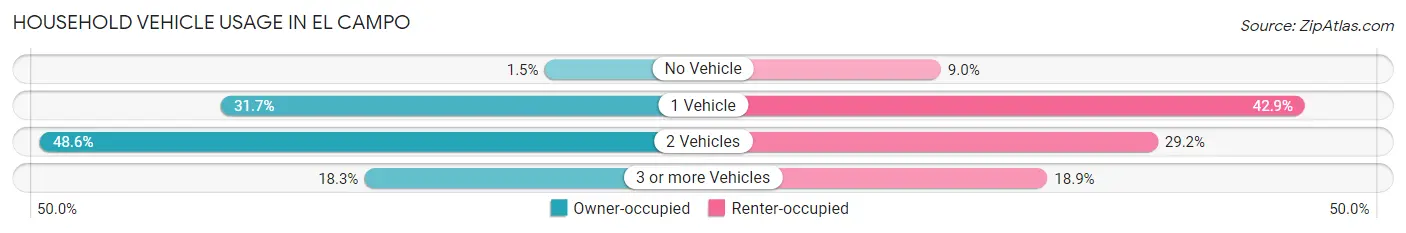
| Vehicles per Household | Owner-occupied | Renter-occupied |
| No Vehicle | 36 (1.5%) | 166 (9.0%) |
| 1 Vehicle | 770 (31.7%) | 795 (42.9%) |
| 2 Vehicles | 1,181 (48.6%) | 541 (29.2%) |
| 3 or more Vehicles | 445 (18.3%) | 350 (18.9%) |
| Total | 2,432 (100.0%) | 1,852 (100.0%) |
Real Estate & Mortgages in El Campo
Real Estate and Mortgage Overview in El Campo
| Characteristic | Without Mortgage | With Mortgage |
| Housing Units | 1,307 | 1,125 |
| Median Property Value | $150,900 | $200,300 |
| Median Household Income | $45,542 | $338 |
| Monthly Housing Costs | $638 | $105 |
| Real Estate Taxes | $2,943 | $0 |
Property Value by Mortgage Status in El Campo
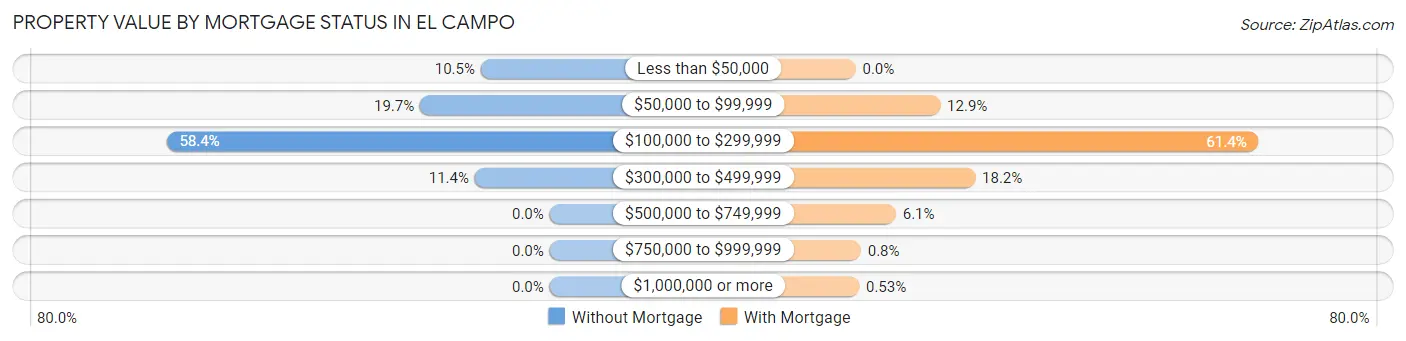
| Property Value | Without Mortgage | With Mortgage |
| Less than $50,000 | 137 (10.5%) | 0 (0.0%) |
| $50,000 to $99,999 | 258 (19.7%) | 145 (12.9%) |
| $100,000 to $299,999 | 763 (58.4%) | 691 (61.4%) |
| $300,000 to $499,999 | 149 (11.4%) | 205 (18.2%) |
| $500,000 to $749,999 | 0 (0.0%) | 69 (6.1%) |
| $750,000 to $999,999 | 0 (0.0%) | 9 (0.8%) |
| $1,000,000 or more | 0 (0.0%) | 6 (0.5%) |
| Total | 1,307 (100.0%) | 1,125 (100.0%) |
Household Income by Mortgage Status in El Campo
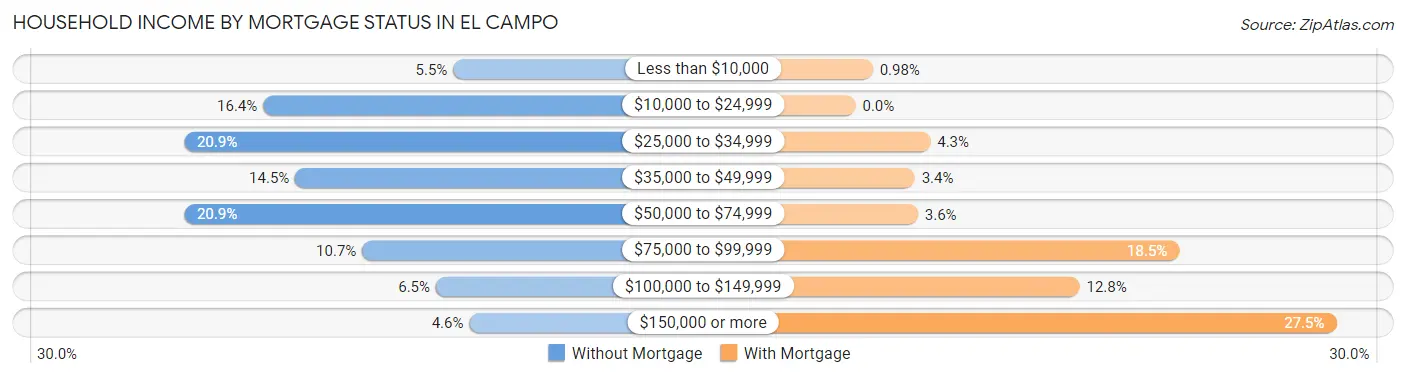
| Household Income | Without Mortgage | With Mortgage |
| Less than $10,000 | 72 (5.5%) | 11 (1.0%) |
| $10,000 to $24,999 | 214 (16.4%) | 0 (0.0%) |
| $25,000 to $34,999 | 273 (20.9%) | 48 (4.3%) |
| $35,000 to $49,999 | 190 (14.5%) | 38 (3.4%) |
| $50,000 to $74,999 | 273 (20.9%) | 40 (3.6%) |
| $75,000 to $99,999 | 140 (10.7%) | 208 (18.5%) |
| $100,000 to $149,999 | 85 (6.5%) | 144 (12.8%) |
| $150,000 or more | 60 (4.6%) | 309 (27.5%) |
| Total | 1,307 (100.0%) | 1,125 (100.0%) |
Property Value to Household Income Ratio in El Campo
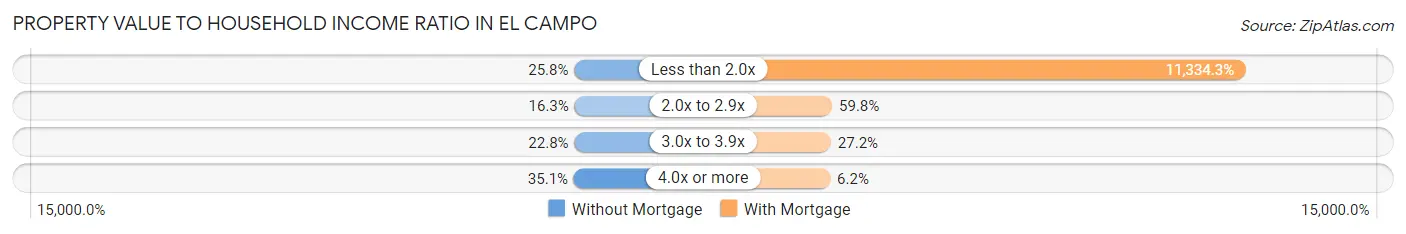
| Value-to-Income Ratio | Without Mortgage | With Mortgage |
| Less than 2.0x | 337 (25.8%) | 127,511 (11,334.3%) |
| 2.0x to 2.9x | 213 (16.3%) | 673 (59.8%) |
| 3.0x to 3.9x | 298 (22.8%) | 306 (27.2%) |
| 4.0x or more | 459 (35.1%) | 70 (6.2%) |
| Total | 1,307 (100.0%) | 1,125 (100.0%) |
Real Estate Taxes by Mortgage Status in El Campo
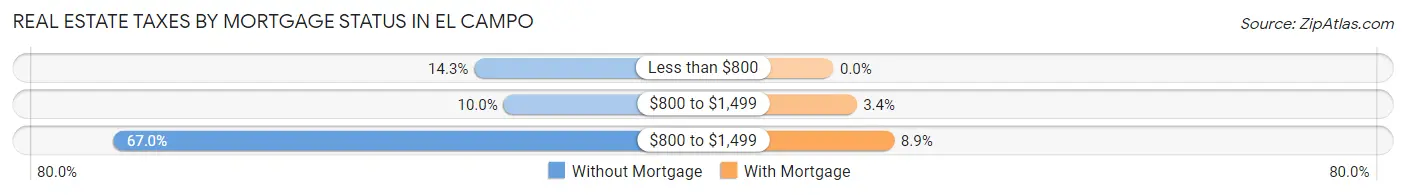
| Property Taxes | Without Mortgage | With Mortgage |
| Less than $800 | 187 (14.3%) | 0 (0.0%) |
| $800 to $1,499 | 131 (10.0%) | 38 (3.4%) |
| $800 to $1,499 | 875 (66.9%) | 100 (8.9%) |
| Total | 1,307 (100.0%) | 1,125 (100.0%) |
Health & Disability in El Campo
Health Insurance Coverage by Age in El Campo
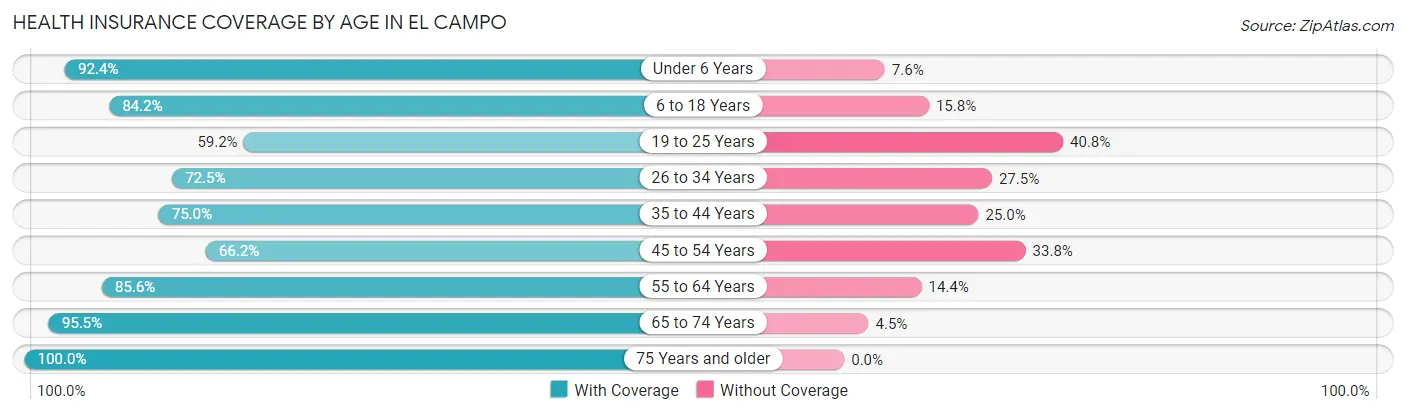
| Age Bracket | With Coverage | Without Coverage |
| Under 6 Years | 989 (92.4%) | 81 (7.6%) |
| 6 to 18 Years | 2,331 (84.2%) | 437 (15.8%) |
| 19 to 25 Years | 541 (59.2%) | 373 (40.8%) |
| 26 to 34 Years | 926 (72.5%) | 352 (27.5%) |
| 35 to 44 Years | 1,399 (75.0%) | 467 (25.0%) |
| 45 to 54 Years | 869 (66.2%) | 444 (33.8%) |
| 55 to 64 Years | 819 (85.6%) | 138 (14.4%) |
| 65 to 74 Years | 1,137 (95.5%) | 54 (4.5%) |
| 75 Years and older | 765 (100.0%) | 0 (0.0%) |
| Total | 9,776 (80.6%) | 2,346 (19.4%) |
Health Insurance Coverage by Citizenship Status in El Campo
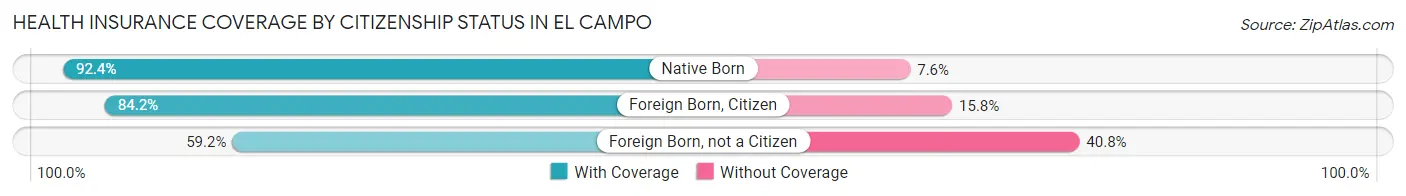
| Citizenship Status | With Coverage | Without Coverage |
| Native Born | 989 (92.4%) | 81 (7.6%) |
| Foreign Born, Citizen | 2,331 (84.2%) | 437 (15.8%) |
| Foreign Born, not a Citizen | 541 (59.2%) | 373 (40.8%) |
Health Insurance Coverage by Household Income in El Campo
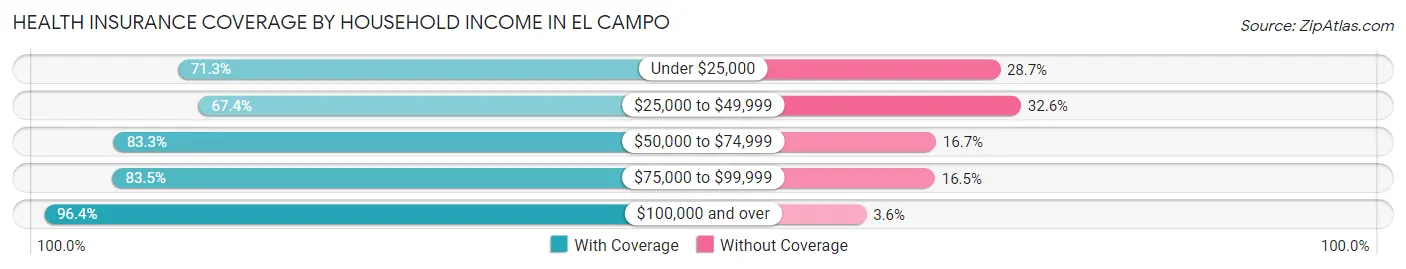
| Household Income | With Coverage | Without Coverage |
| Under $25,000 | 1,208 (71.3%) | 486 (28.7%) |
| $25,000 to $49,999 | 2,214 (67.4%) | 1,072 (32.6%) |
| $50,000 to $74,999 | 1,696 (83.3%) | 340 (16.7%) |
| $75,000 to $99,999 | 1,702 (83.5%) | 336 (16.5%) |
| $100,000 and over | 2,939 (96.4%) | 111 (3.6%) |
Public vs Private Health Insurance Coverage by Age in El Campo
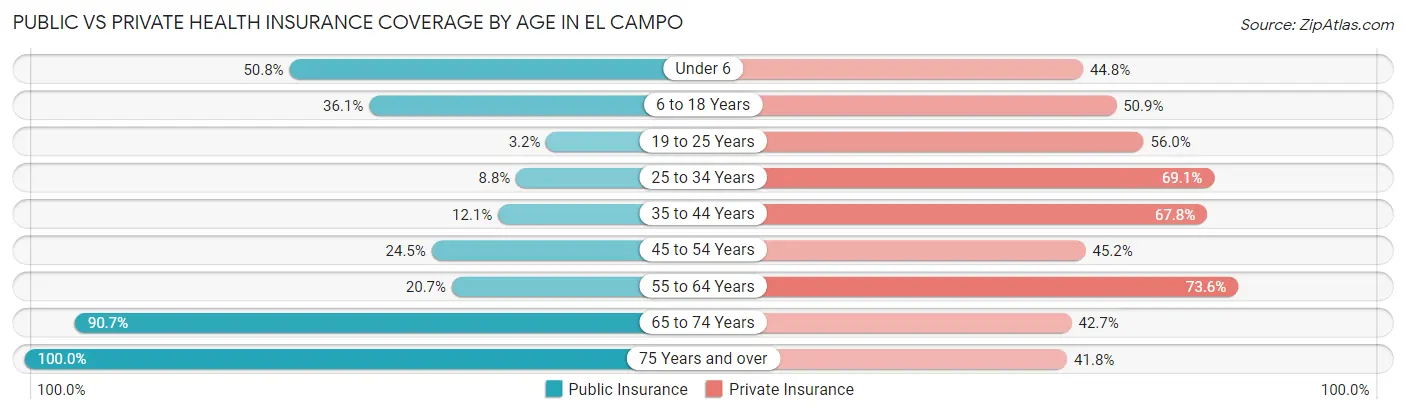
| Age Bracket | Public Insurance | Private Insurance |
| Under 6 | 544 (50.8%) | 479 (44.8%) |
| 6 to 18 Years | 998 (36.0%) | 1,410 (50.9%) |
| 19 to 25 Years | 29 (3.2%) | 512 (56.0%) |
| 25 to 34 Years | 112 (8.8%) | 883 (69.1%) |
| 35 to 44 Years | 226 (12.1%) | 1,265 (67.8%) |
| 45 to 54 Years | 321 (24.4%) | 594 (45.2%) |
| 55 to 64 Years | 198 (20.7%) | 704 (73.6%) |
| 65 to 74 Years | 1,080 (90.7%) | 508 (42.6%) |
| 75 Years and over | 765 (100.0%) | 320 (41.8%) |
| Total | 4,273 (35.2%) | 6,675 (55.1%) |
Disability Status by Sex by Age in El Campo
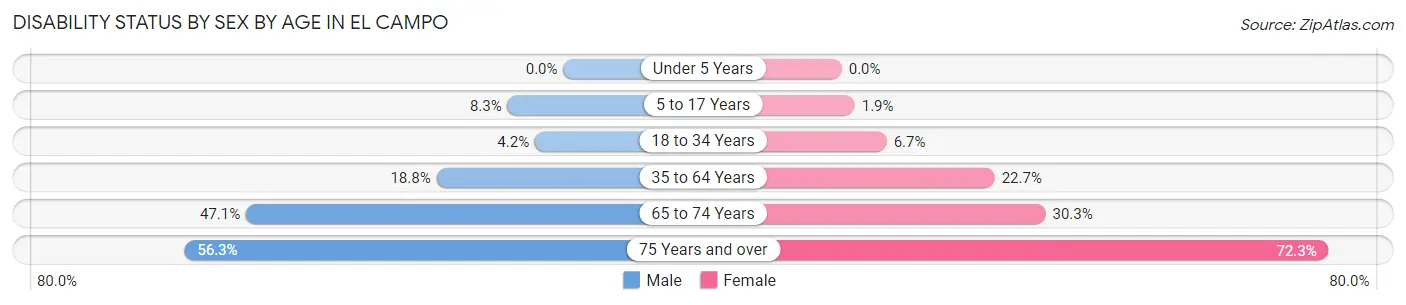
| Age Bracket | Male | Female |
| Under 5 Years | 0 (0.0%) | 0 (0.0%) |
| 5 to 17 Years | 110 (8.3%) | 28 (1.9%) |
| 18 to 34 Years | 41 (4.2%) | 94 (6.7%) |
| 35 to 64 Years | 401 (18.8%) | 456 (22.7%) |
| 65 to 74 Years | 270 (47.1%) | 187 (30.3%) |
| 75 Years and over | 193 (56.3%) | 305 (72.3%) |
Disability Class by Sex by Age in El Campo
Disability Class: Hearing Difficulty
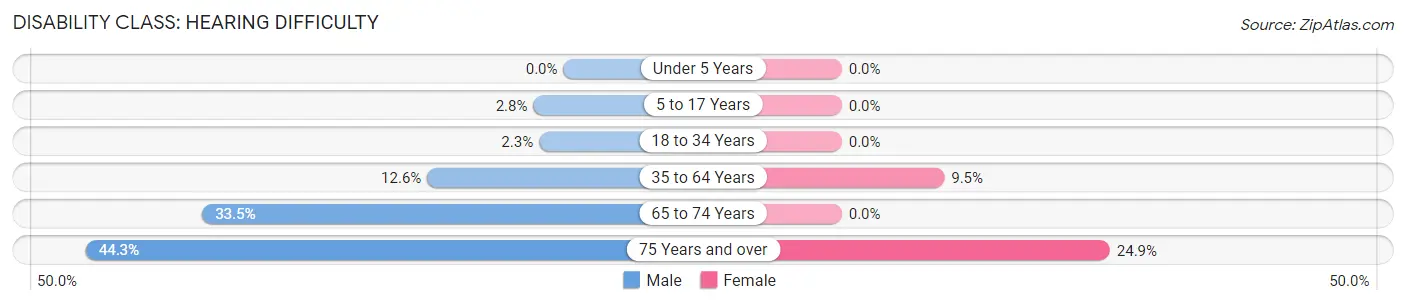
| Age Bracket | Male | Female |
| Under 5 Years | 0 (0.0%) | 0 (0.0%) |
| 5 to 17 Years | 37 (2.8%) | 0 (0.0%) |
| 18 to 34 Years | 22 (2.3%) | 0 (0.0%) |
| 35 to 64 Years | 269 (12.6%) | 191 (9.5%) |
| 65 to 74 Years | 192 (33.5%) | 0 (0.0%) |
| 75 Years and over | 152 (44.3%) | 105 (24.9%) |
Disability Class: Vision Difficulty
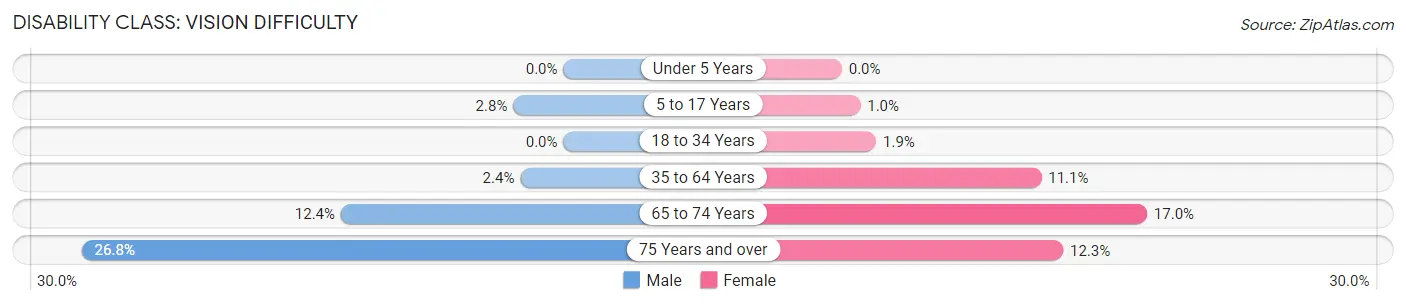
| Age Bracket | Male | Female |
| Under 5 Years | 0 (0.0%) | 0 (0.0%) |
| 5 to 17 Years | 37 (2.8%) | 15 (1.0%) |
| 18 to 34 Years | 0 (0.0%) | 27 (1.9%) |
| 35 to 64 Years | 51 (2.4%) | 223 (11.1%) |
| 65 to 74 Years | 71 (12.4%) | 105 (17.0%) |
| 75 Years and over | 92 (26.8%) | 52 (12.3%) |
Disability Class: Cognitive Difficulty
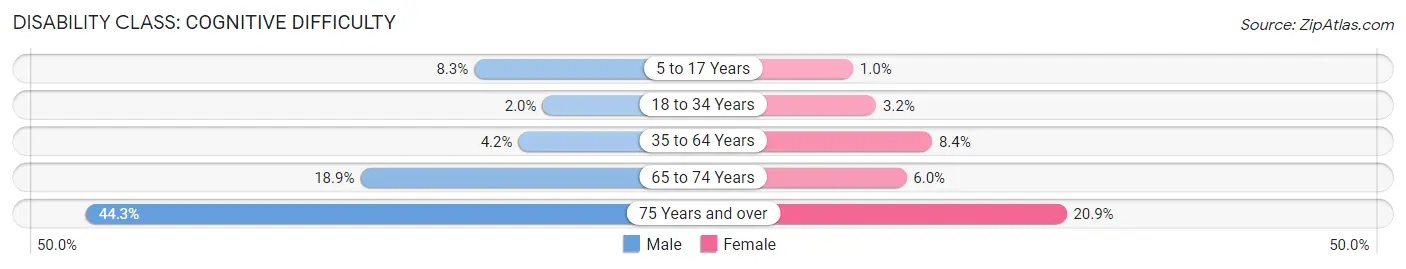
| Age Bracket | Male | Female |
| 5 to 17 Years | 110 (8.3%) | 15 (1.0%) |
| 18 to 34 Years | 19 (1.9%) | 45 (3.2%) |
| 35 to 64 Years | 89 (4.2%) | 168 (8.4%) |
| 65 to 74 Years | 108 (18.9%) | 37 (6.0%) |
| 75 Years and over | 152 (44.3%) | 88 (20.8%) |
Disability Class: Ambulatory Difficulty
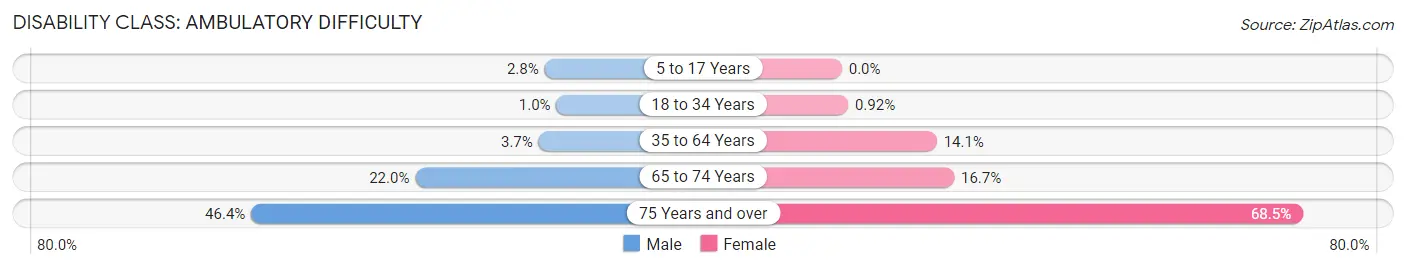
| Age Bracket | Male | Female |
| 5 to 17 Years | 37 (2.8%) | 0 (0.0%) |
| 18 to 34 Years | 10 (1.0%) | 13 (0.9%) |
| 35 to 64 Years | 78 (3.7%) | 283 (14.1%) |
| 65 to 74 Years | 126 (22.0%) | 103 (16.7%) |
| 75 Years and over | 159 (46.4%) | 289 (68.5%) |
Disability Class: Self-Care Difficulty
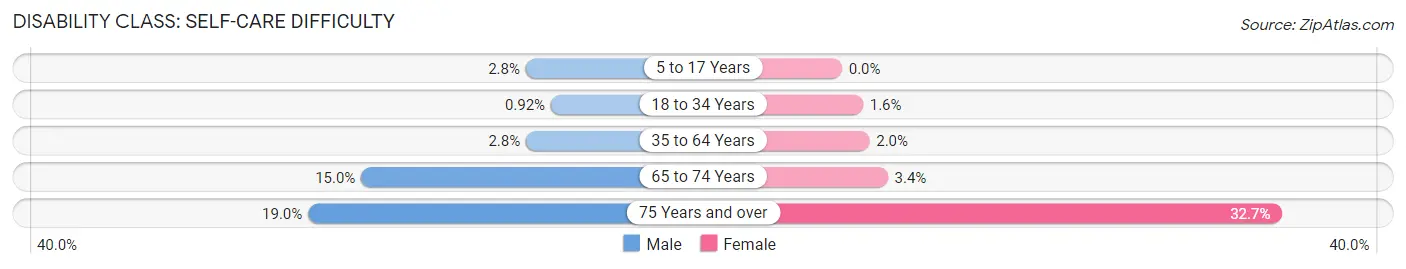
| Age Bracket | Male | Female |
| 5 to 17 Years | 37 (2.8%) | 0 (0.0%) |
| 18 to 34 Years | 9 (0.9%) | 22 (1.6%) |
| 35 to 64 Years | 59 (2.8%) | 41 (2.0%) |
| 65 to 74 Years | 86 (15.0%) | 21 (3.4%) |
| 75 Years and over | 65 (19.0%) | 138 (32.7%) |
Technology Access in El Campo
Computing Device Access in El Campo
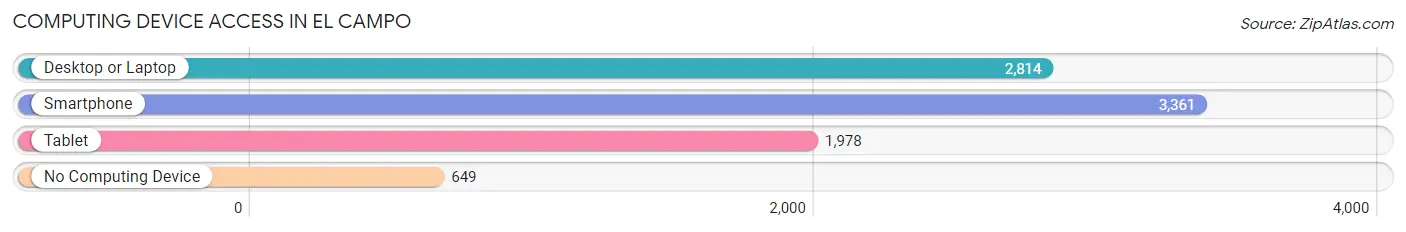
| Device Type | # Households | % Households |
| Desktop or Laptop | 2,814 | 65.7% |
| Smartphone | 3,361 | 78.4% |
| Tablet | 1,978 | 46.2% |
| No Computing Device | 649 | 15.1% |
| Total | 4,284 | 100.0% |
Internet Access in El Campo
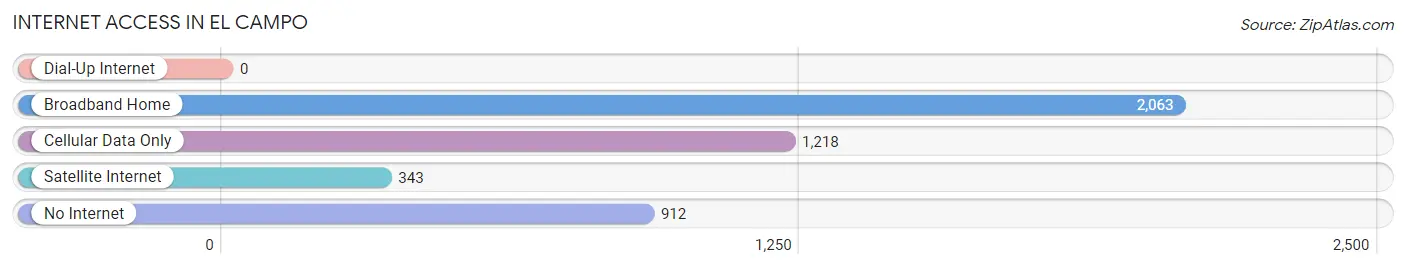
| Internet Type | # Households | % Households |
| Dial-Up Internet | 0 | 0.0% |
| Broadband Home | 2,063 | 48.2% |
| Cellular Data Only | 1,218 | 28.4% |
| Satellite Internet | 343 | 8.0% |
| No Internet | 912 | 21.3% |
| Total | 4,284 | 100.0% |
El Campo Summary
Campo, Texas is a small town located in the southeastern corner of Texas, in the county of Wharton. It is situated on the banks of the Colorado River, and is part of the Houston-The Woodlands-Sugar Land metropolitan area. The town has a population of just over 1,000 people, and is known for its rural charm and small-town atmosphere.
History
Campo, Texas was founded in 1845 by a group of settlers from the nearby town of Wharton. The settlers were looking for a place to settle and start a new life, and they chose the area around the Colorado River. The town was originally called “Campo de los Indios”, which translates to “Field of the Indians”. The name was changed to Campo in 1848, and the town was officially incorporated in 1851.
The town grew slowly over the years, and by the early 1900s it had become a thriving agricultural community. The town was home to several cotton gins, a sawmill, and a number of other businesses. The town also had a school, a post office, and a number of churches.
In the 1950s, the town began to experience a decline in population as people moved away to larger cities. This trend continued until the late 1980s, when the town began to experience a resurgence in population. This was due in part to the town’s proximity to Houston, which allowed for easy access to jobs and other amenities.
Geography
Campo, Texas is located in the southeastern corner of Texas, in the county of Wharton. It is situated on the banks of the Colorado River, and is part of the Houston-The Woodlands-Sugar Land metropolitan area. The town is located about 50 miles southeast of Houston, and about 30 miles west of the Gulf of Mexico.
The town is situated on flat terrain, with an elevation of about 50 feet above sea level. The climate in Campo is humid subtropical, with hot summers and mild winters. The average annual temperature is around 70 degrees Fahrenheit, and the average annual precipitation is around 40 inches.
Economy
The economy of Campo, Texas is largely based on agriculture. The town is home to several cotton gins, as well as a number of other agricultural businesses. The town also has a number of small businesses, including restaurants, retail stores, and service providers.
The town is also home to a number of oil and gas companies, which have been operating in the area since the early 1900s. The town is also home to a number of manufacturing companies, which produce a variety of products, including furniture, clothing, and electronics.
Demographics
As of the 2010 census, the population of Campo, Texas was 1,072. The population is largely made up of white (77.3%) and Hispanic (20.2%) residents. The median household income in the town is $37,917, and the median age is 37.7 years.
The town is served by the Wharton Independent School District, which includes two elementary schools, one middle school, and one high school. The town is also home to a number of churches, including Baptist, Methodist, and Catholic.
Conclusion
Campo, Texas is a small town located in the southeastern corner of Texas, in the county of Wharton. It is situated on the banks of the Colorado River, and is part of the Houston-The Woodlands-Sugar Land metropolitan area. The town has a population of just over 1,000 people, and is known for its rural charm and small-town atmosphere. The economy of Campo is largely based on agriculture, and the town is also home to a number of oil and gas companies, as well as manufacturing companies. The population of Campo is largely made up of white and Hispanic residents, and the median household income is $37,917. The town is served by the Wharton Independent School District, and is home to a number of churches.
Common Questions
What is Per Capita Income in El Campo?
Per Capita income in El Campo is $26,016.
What is the Median Family Income in El Campo?
Median Family Income in El Campo is $67,997.
What is the Median Household income in El Campo?
Median Household Income in El Campo is $62,667.
What is Income or Wage Gap in El Campo?
Income or Wage Gap in El Campo is 39.4%.
Women in El Campo earn 60.6 cents for every dollar earned by a man.
What is Family Income Deficit in El Campo?
Family Income Deficit in El Campo is $11,149.
Families that are below poverty line in El Campo earn $11,149 less on average than the poverty threshold level.
What is Inequality or Gini Index in El Campo?
Inequality or Gini Index in El Campo is 0.43.
What is the Total Population of El Campo?
Total Population of El Campo is 12,242.
What is the Total Male Population of El Campo?
Total Male Population of El Campo is 5,941.
What is the Total Female Population of El Campo?
Total Female Population of El Campo is 6,301.
What is the Ratio of Males per 100 Females in El Campo?
There are 94.29 Males per 100 Females in El Campo.
What is the Ratio of Females per 100 Males in El Campo?
There are 106.06 Females per 100 Males in El Campo.
What is the Median Population Age in El Campo?
Median Population Age in El Campo is 35.9 Years.
What is the Average Family Size in El Campo
Average Family Size in El Campo is 3.3 People.
What is the Average Household Size in El Campo
Average Household Size in El Campo is 2.8 People.
How Large is the Labor Force in El Campo?
There are 5,325 People in the Labor Forcein in El Campo.
What is the Percentage of People in the Labor Force in El Campo?
58.5% of People are in the Labor Force in El Campo.
What is the Unemployment Rate in El Campo?
Unemployment Rate in El Campo is 9.0%.