East Bernard, TX Map & Demographics
East Bernard Map
East Bernard Overview
$31,059
PER CAPITA INCOME
$89,188
AVG FAMILY INCOME
$72,500
AVG HOUSEHOLD INCOME
3.3%
WAGE / INCOME GAP [ % ]
96.7¢/ $1
WAGE / INCOME GAP [ $ ]
0.41
INEQUALITY / GINI INDEX
2,218
TOTAL POPULATION
1,061
MALE POPULATION
1,157
FEMALE POPULATION
91.70
MALES / 100 FEMALES
109.05
FEMALES / 100 MALES
40.2
MEDIAN AGE
3.4
AVG FAMILY SIZE
2.8
AVG HOUSEHOLD SIZE
914
LABOR FORCE [ PEOPLE ]
53.1%
PERCENT IN LABOR FORCE
9.5%
UNEMPLOYMENT RATE
East Bernard Zip Codes
East Bernard Area Codes
Income in East Bernard
Income Overview in East Bernard
Per Capita Income in East Bernard is $31,059, while median incomes of families and households are $89,188 and $72,500 respectively.
| Characteristic | Number | Measure |
| Per Capita Income | 2,218 | $31,059 |
| Median Family Income | 583 | $89,188 |
| Mean Family Income | 583 | $107,001 |
| Median Household Income | 780 | $72,500 |
| Mean Household Income | 780 | $90,235 |
| Income Deficit | 583 | $0 |
| Wage / Income Gap (%) | 2,218 | 3.27% |
| Wage / Income Gap ($) | 2,218 | 96.73¢ per $1 |
| Gini / Inequality Index | 2,218 | 0.41 |
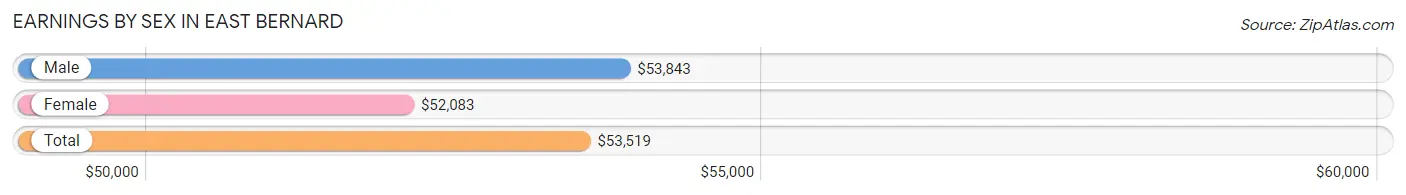
Earnings by Sex in East Bernard
Average Earnings in East Bernard are $53,519, $53,843 for men and $52,083 for women, a difference of 3.3%.
| Sex | Number | Average Earnings |
| Male | 497 (56.9%) | $53,843 |
| Female | 377 (43.1%) | $52,083 |
| Total | 874 (100.0%) | $53,519 |
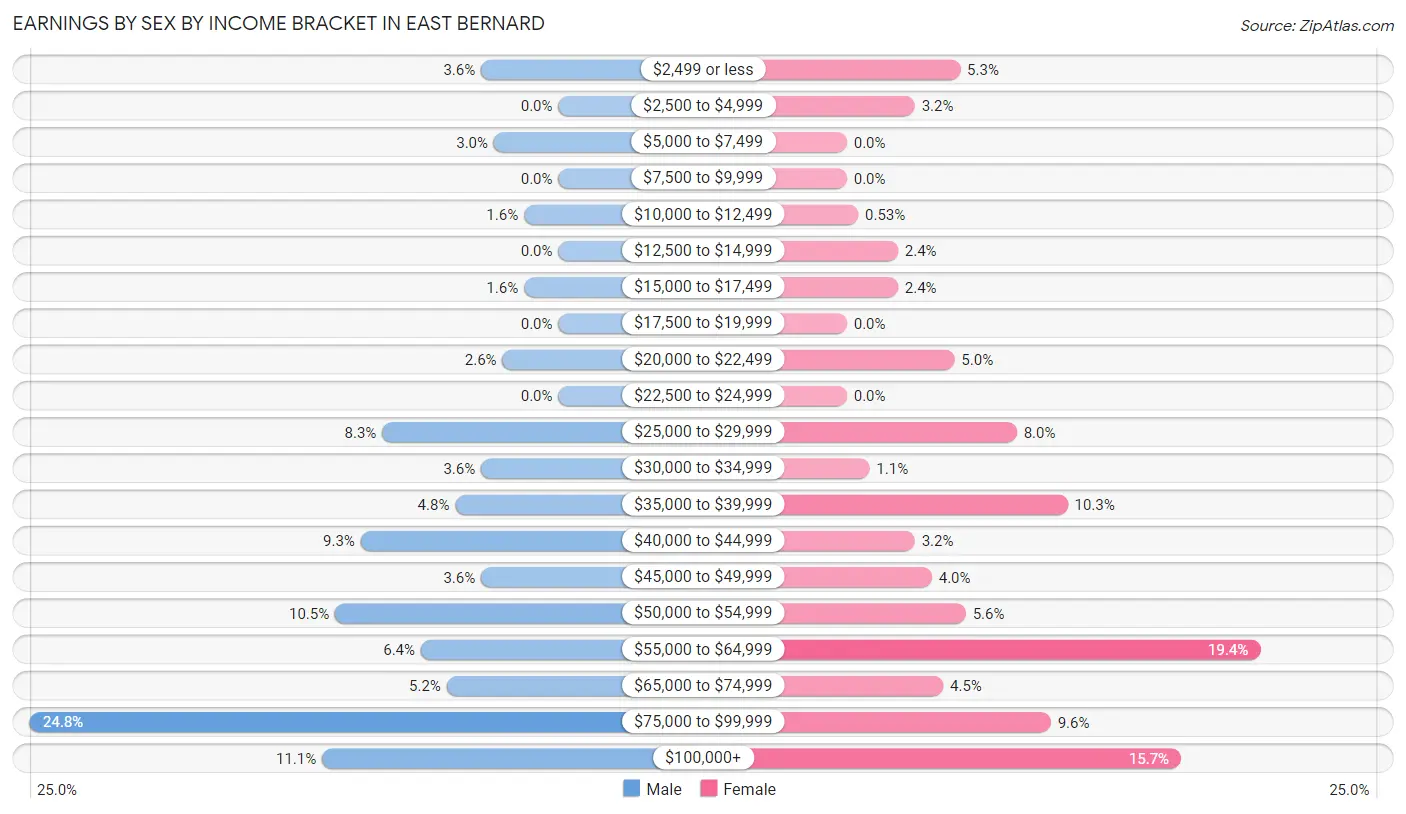
Earnings by Sex by Income Bracket in East Bernard
The most common earnings brackets in East Bernard are $75,000 to $99,999 for men (123 | 24.7%) and $55,000 to $64,999 for women (73 | 19.4%).
| Income | Male | Female |
| $2,499 or less | 18 (3.6%) | 20 (5.3%) |
| $2,500 to $4,999 | 0 (0.0%) | 12 (3.2%) |
| $5,000 to $7,499 | 15 (3.0%) | 0 (0.0%) |
| $7,500 to $9,999 | 0 (0.0%) | 0 (0.0%) |
| $10,000 to $12,499 | 8 (1.6%) | 2 (0.5%) |
| $12,500 to $14,999 | 0 (0.0%) | 9 (2.4%) |
| $15,000 to $17,499 | 8 (1.6%) | 9 (2.4%) |
| $17,500 to $19,999 | 0 (0.0%) | 0 (0.0%) |
| $20,000 to $22,499 | 13 (2.6%) | 19 (5.0%) |
| $22,500 to $24,999 | 0 (0.0%) | 0 (0.0%) |
| $25,000 to $29,999 | 41 (8.3%) | 30 (8.0%) |
| $30,000 to $34,999 | 18 (3.6%) | 4 (1.1%) |
| $35,000 to $39,999 | 24 (4.8%) | 39 (10.3%) |
| $40,000 to $44,999 | 46 (9.3%) | 12 (3.2%) |
| $45,000 to $49,999 | 18 (3.6%) | 15 (4.0%) |
| $50,000 to $54,999 | 52 (10.5%) | 21 (5.6%) |
| $55,000 to $64,999 | 32 (6.4%) | 73 (19.4%) |
| $65,000 to $74,999 | 26 (5.2%) | 17 (4.5%) |
| $75,000 to $99,999 | 123 (24.7%) | 36 (9.6%) |
| $100,000+ | 55 (11.1%) | 59 (15.7%) |
| Total | 497 (100.0%) | 377 (100.0%) |
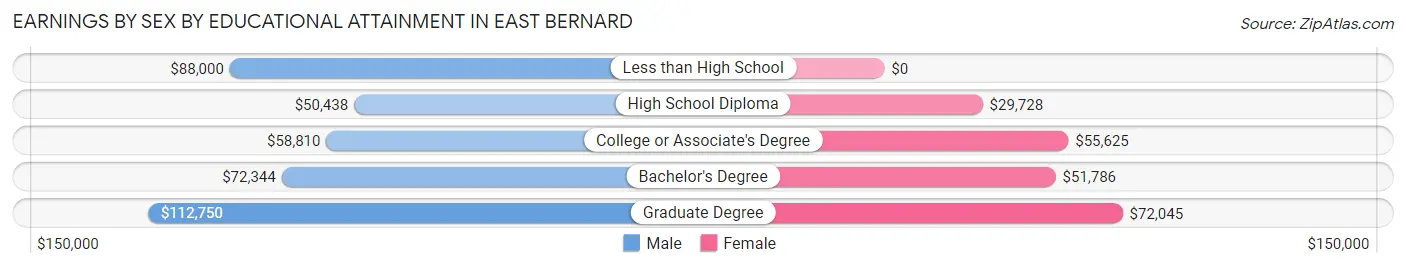
Earnings by Sex by Educational Attainment in East Bernard
Average earnings in East Bernard are $57,560 for men and $55,488 for women, a difference of 3.6%. Men with an educational attainment of graduate degree enjoy the highest average annual earnings of $112,750, while those with high school diploma education earn the least with $50,438. Women with an educational attainment of graduate degree earn the most with the average annual earnings of $72,045, while those with high school diploma education have the smallest earnings of $29,728.
| Educational Attainment | Male Income | Female Income |
| Less than High School | $88,000 | $0 |
| High School Diploma | $50,438 | $29,728 |
| College or Associate's Degree | $58,810 | $55,625 |
| Bachelor's Degree | $72,344 | $51,786 |
| Graduate Degree | $112,750 | $72,045 |
| Total | $57,560 | $55,488 |
Family Income in East Bernard
Family Income Brackets in East Bernard
According to the East Bernard family income data, there are 179 families falling into the $100,000 to $149,999 income range, which is the most common income bracket and makes up 30.7% of all families. Conversely, the less than $10,000 income bracket is the least frequent group with only 7 families (1.2%) belonging to this category.
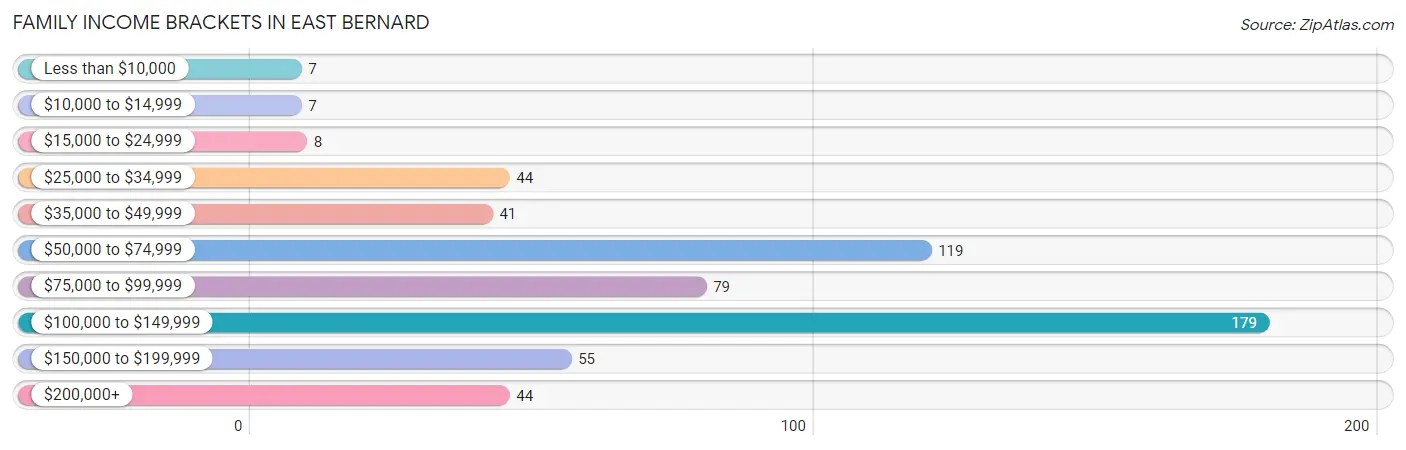
| Income Bracket | # Families | % Families |
| Less than $10,000 | 7 | 1.2% |
| $10,000 to $14,999 | 7 | 1.2% |
| $15,000 to $24,999 | 8 | 1.4% |
| $25,000 to $34,999 | 44 | 7.5% |
| $35,000 to $49,999 | 41 | 7.0% |
| $50,000 to $74,999 | 119 | 20.4% |
| $75,000 to $99,999 | 79 | 13.6% |
| $100,000 to $149,999 | 179 | 30.7% |
| $150,000 to $199,999 | 55 | 9.4% |
| $200,000+ | 44 | 7.5% |
Family Income by Famaliy Size in East Bernard
3-person families (56 | 9.6%) account for the highest median family income in East Bernard with $136,250 per family, while 3-person families (56 | 9.6%) have the highest median income of $45,417 per family member.
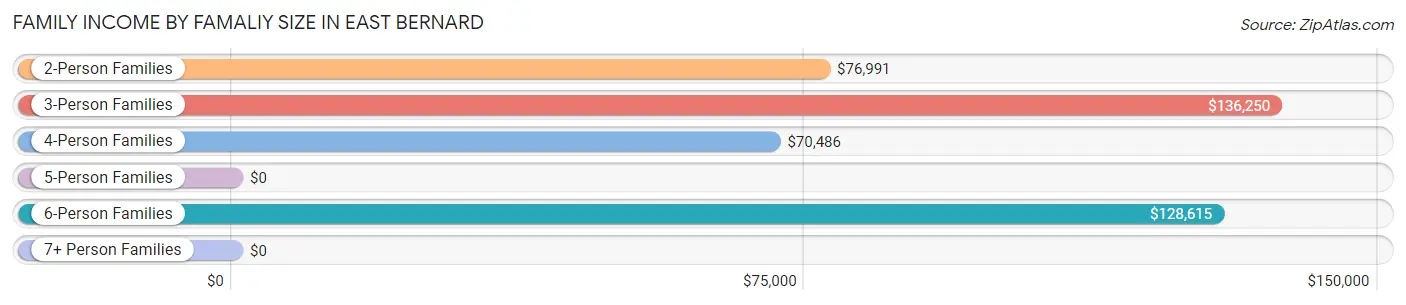
| Income Bracket | # Families | Median Income |
| 2-Person Families | 243 (41.7%) | $76,991 |
| 3-Person Families | 56 (9.6%) | $136,250 |
| 4-Person Families | 172 (29.5%) | $70,486 |
| 5-Person Families | 25 (4.3%) | $0 |
| 6-Person Families | 72 (12.3%) | $128,615 |
| 7+ Person Families | 15 (2.6%) | $0 |
| Total | 583 (100.0%) | $89,188 |
Family Income by Number of Earners in East Bernard
The median family income in East Bernard is $89,188, with families comprising 3+ earners (44) having the highest median family income of $138,750, while families with 1 earner (193) have the lowest median family income of $54,871, accounting for 7.5% and 33.1% of families, respectively.
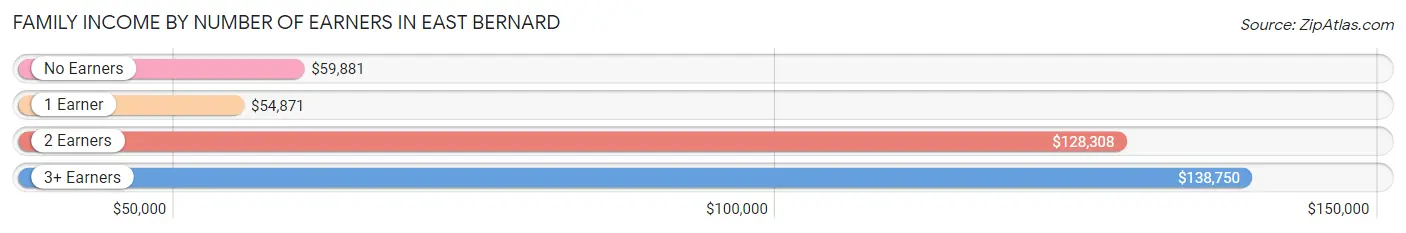
| Number of Earners | # Families | Median Income |
| No Earners | 100 (17.2%) | $59,881 |
| 1 Earner | 193 (33.1%) | $54,871 |
| 2 Earners | 246 (42.2%) | $128,308 |
| 3+ Earners | 44 (7.5%) | $138,750 |
| Total | 583 (100.0%) | $89,188 |
Household Income in East Bernard
Household Income Brackets in East Bernard
With 200 households falling in the category, the $100,000 to $149,999 income range is the most frequent in East Bernard, accounting for 25.6% of all households. In contrast, only 22 households (2.8%) fall into the $10,000 to $14,999 income bracket, making it the least populous group.
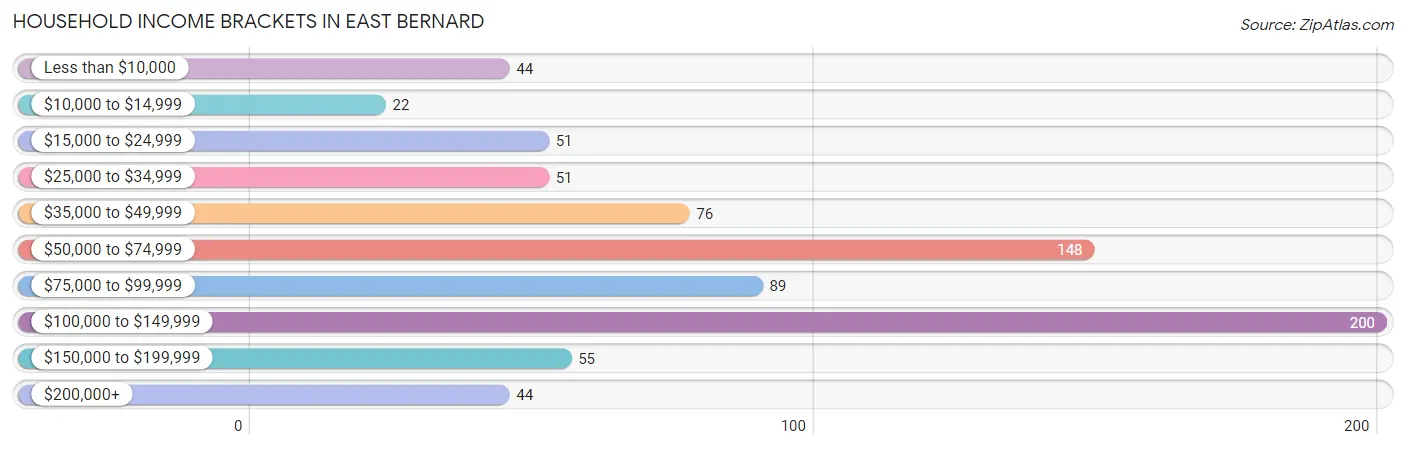
| Income Bracket | # Households | % Households |
| Less than $10,000 | 44 | 5.6% |
| $10,000 to $14,999 | 22 | 2.8% |
| $15,000 to $24,999 | 51 | 6.5% |
| $25,000 to $34,999 | 51 | 6.5% |
| $35,000 to $49,999 | 76 | 9.7% |
| $50,000 to $74,999 | 148 | 19.0% |
| $75,000 to $99,999 | 89 | 11.4% |
| $100,000 to $149,999 | 200 | 25.6% |
| $150,000 to $199,999 | 55 | 7.1% |
| $200,000+ | 44 | 5.6% |
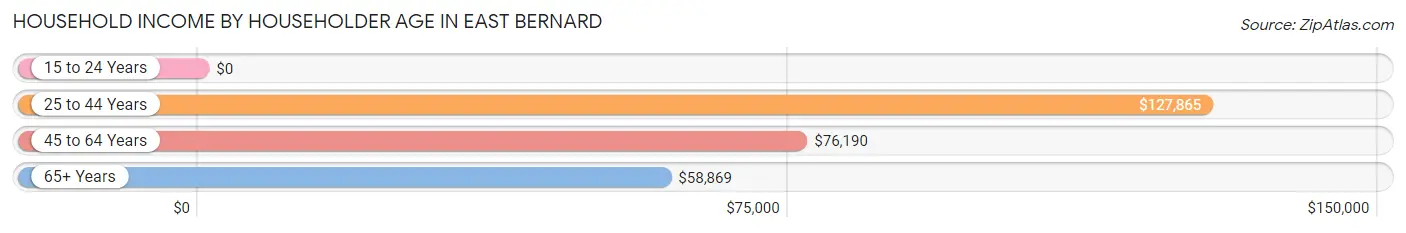
Household Income by Householder Age in East Bernard
The median household income in East Bernard is $72,500, with the highest median household income of $127,865 found in the 25 to 44 years age bracket for the primary householder. A total of 233 households (29.9%) fall into this category.
| Income Bracket | # Households | Median Income |
| 15 to 24 Years | 0 (0.0%) | $0 |
| 25 to 44 Years | 233 (29.9%) | $127,865 |
| 45 to 64 Years | 312 (40.0%) | $76,190 |
| 65+ Years | 235 (30.1%) | $58,869 |
| Total | 780 (100.0%) | $72,500 |
Poverty in East Bernard
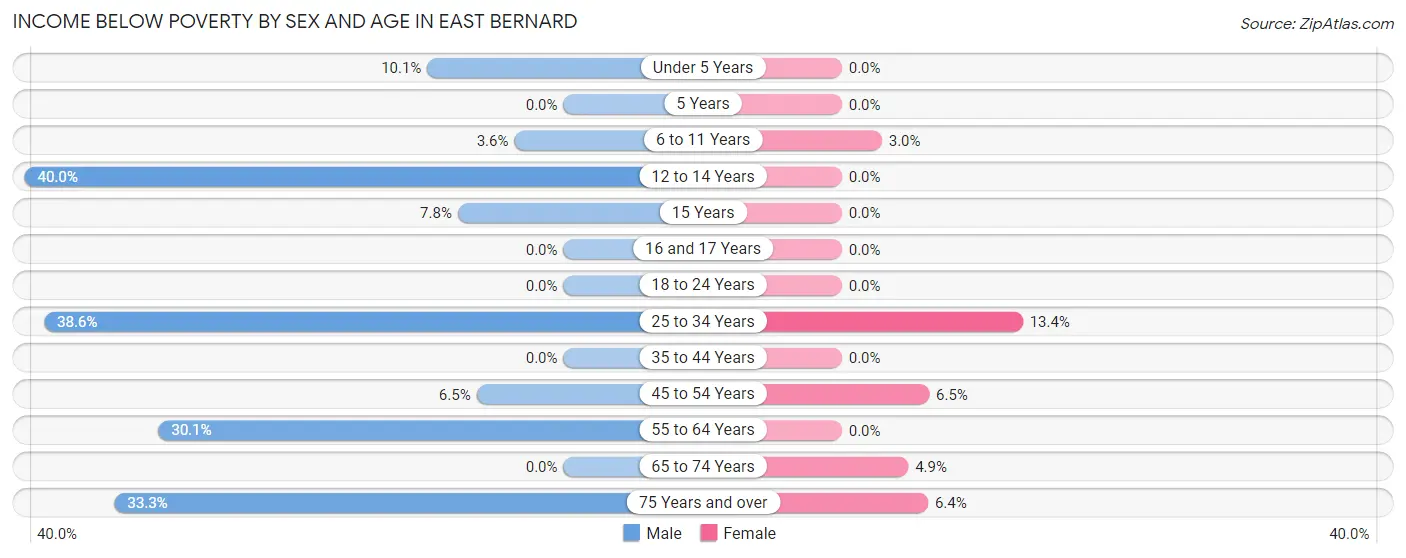
Income Below Poverty by Sex and Age in East Bernard
With 10.7% poverty level for males and 2.9% for females among the residents of East Bernard, 12 to 14 year old males and 25 to 34 year old females are the most vulnerable to poverty, with 4 males (40.0%) and 9 females (13.4%) in their respective age groups living below the poverty level.
| Age Bracket | Male | Female |
| Under 5 Years | 9 (10.1%) | 0 (0.0%) |
| 5 Years | 0 (0.0%) | 0 (0.0%) |
| 6 to 11 Years | 2 (3.6%) | 3 (3.0%) |
| 12 to 14 Years | 4 (40.0%) | 0 (0.0%) |
| 15 Years | 4 (7.8%) | 0 (0.0%) |
| 16 and 17 Years | 0 (0.0%) | 0 (0.0%) |
| 18 to 24 Years | 0 (0.0%) | 0 (0.0%) |
| 25 to 34 Years | 32 (38.6%) | 9 (13.4%) |
| 35 to 44 Years | 0 (0.0%) | 0 (0.0%) |
| 45 to 54 Years | 10 (6.5%) | 7 (6.5%) |
| 55 to 64 Years | 46 (30.1%) | 0 (0.0%) |
| 65 to 74 Years | 0 (0.0%) | 7 (4.9%) |
| 75 Years and over | 7 (33.3%) | 8 (6.4%) |
| Total | 114 (10.7%) | 34 (2.9%) |
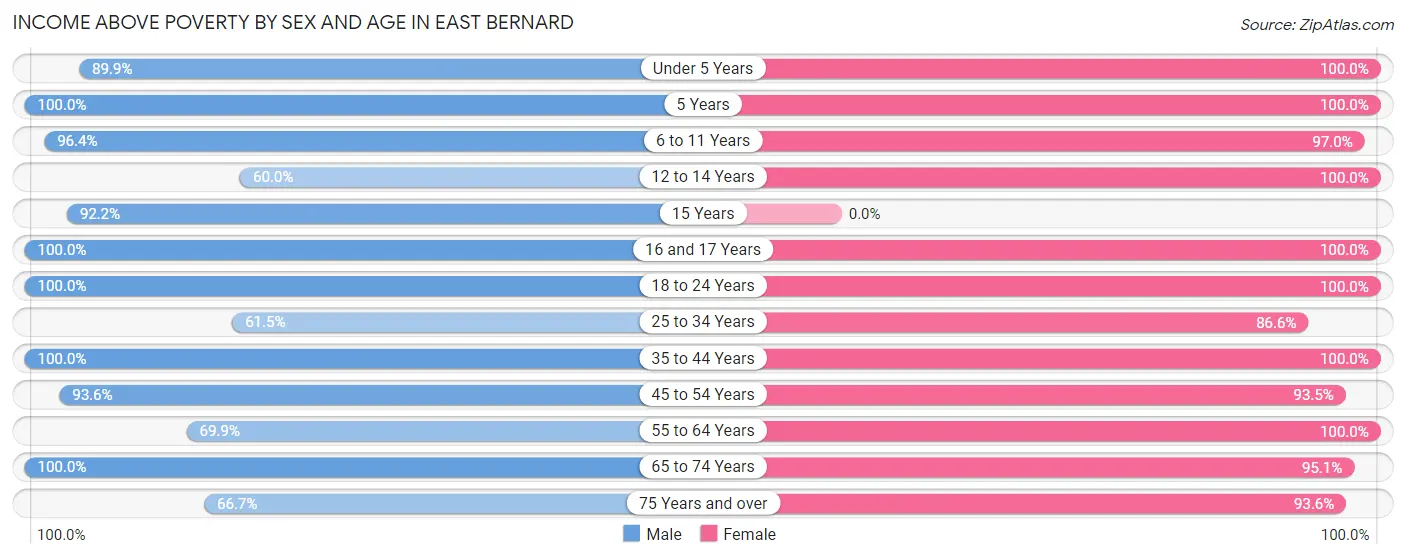
Income Above Poverty by Sex and Age in East Bernard
According to the poverty statistics in East Bernard, males aged 5 years and females aged under 5 years are the age groups that are most secure financially, with 100.0% of males and 100.0% of females in these age groups living above the poverty line.
| Age Bracket | Male | Female |
| Under 5 Years | 80 (89.9%) | 35 (100.0%) |
| 5 Years | 4 (100.0%) | 30 (100.0%) |
| 6 to 11 Years | 53 (96.4%) | 98 (97.0%) |
| 12 to 14 Years | 6 (60.0%) | 122 (100.0%) |
| 15 Years | 47 (92.2%) | 0 (0.0%) |
| 16 and 17 Years | 123 (100.0%) | 52 (100.0%) |
| 18 to 24 Years | 96 (100.0%) | 24 (100.0%) |
| 25 to 34 Years | 51 (61.5%) | 58 (86.6%) |
| 35 to 44 Years | 160 (100.0%) | 243 (100.0%) |
| 45 to 54 Years | 145 (93.5%) | 101 (93.5%) |
| 55 to 64 Years | 107 (69.9%) | 108 (100.0%) |
| 65 to 74 Years | 61 (100.0%) | 135 (95.1%) |
| 75 Years and over | 14 (66.7%) | 117 (93.6%) |
| Total | 947 (89.3%) | 1,123 (97.1%) |
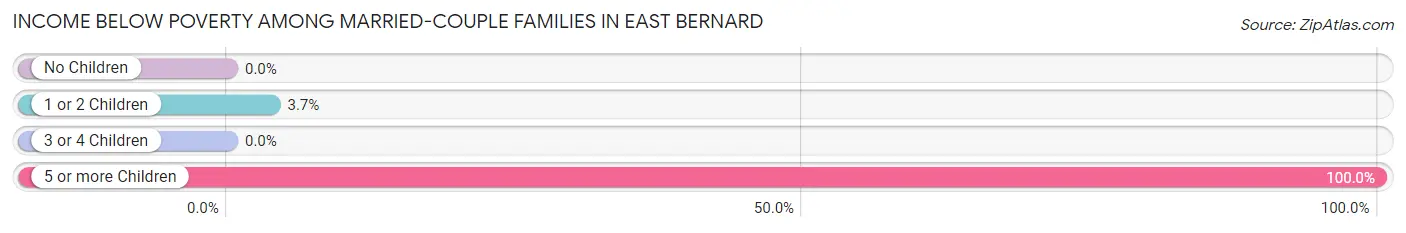
Income Below Poverty Among Married-Couple Families in East Bernard
The poverty statistics for married-couple families in East Bernard show that 3.2% or 15 of the total 471 families live below the poverty line. Families with 5 or more children have the highest poverty rate of 100.0%, comprising of 7 families. On the other hand, families with no children have the lowest poverty rate of 0.0%, which includes 0 families.
| Children | Above Poverty | Below Poverty |
| No Children | 216 (100.0%) | 0 (0.0%) |
| 1 or 2 Children | 208 (96.3%) | 8 (3.7%) |
| 3 or 4 Children | 32 (100.0%) | 0 (0.0%) |
| 5 or more Children | 0 (0.0%) | 7 (100.0%) |
| Total | 456 (96.8%) | 15 (3.2%) |
Income Below Poverty Among Single-Parent Households in East Bernard
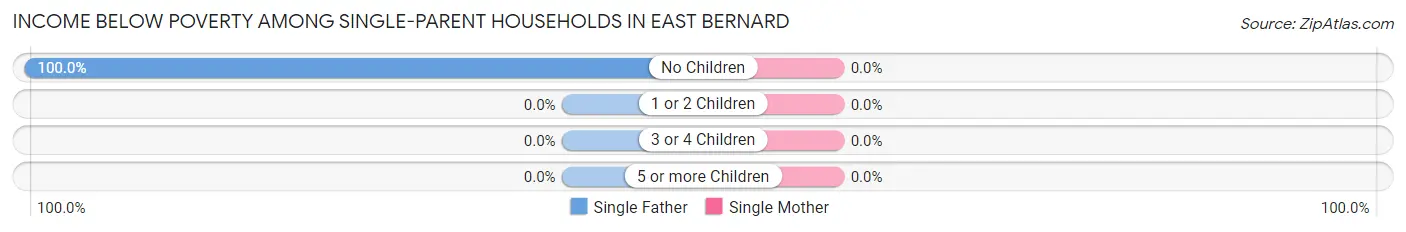
| Children | Single Father | Single Mother |
| No Children | 7 (100.0%) | 0 (0.0%) |
| 1 or 2 Children | 0 (0.0%) | 0 (0.0%) |
| 3 or 4 Children | 0 (0.0%) | 0 (0.0%) |
| 5 or more Children | 0 (0.0%) | 0 (0.0%) |
| Total | 7 (28.0%) | 0 (0.0%) |
Income Below Poverty Among Married-Couple vs Single-Parent Households in East Bernard
The poverty data for East Bernard shows that 15 of the married-couple family households (3.2%) and 7 of the single-parent households (6.2%) are living below the poverty level. Within the married-couple family households, those with 5 or more children have the highest poverty rate, with 7 households (100.0%) falling below the poverty line. Among the single-parent households, those with no children have the highest poverty rate, with 7 household (15.9%) living below poverty.
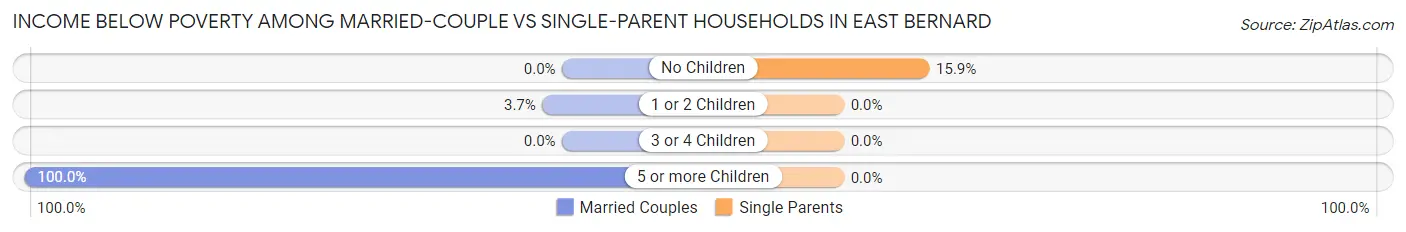
| Children | Married-Couple Families | Single-Parent Households |
| No Children | 0 (0.0%) | 7 (15.9%) |
| 1 or 2 Children | 8 (3.7%) | 0 (0.0%) |
| 3 or 4 Children | 0 (0.0%) | 0 (0.0%) |
| 5 or more Children | 7 (100.0%) | 0 (0.0%) |
| Total | 15 (3.2%) | 7 (6.2%) |
Race in East Bernard
The most populous races in East Bernard are White / Caucasian (1,984 | 89.4%), Hispanic or Latino (858 | 38.7%), and Two or more Races (186 | 8.4%).
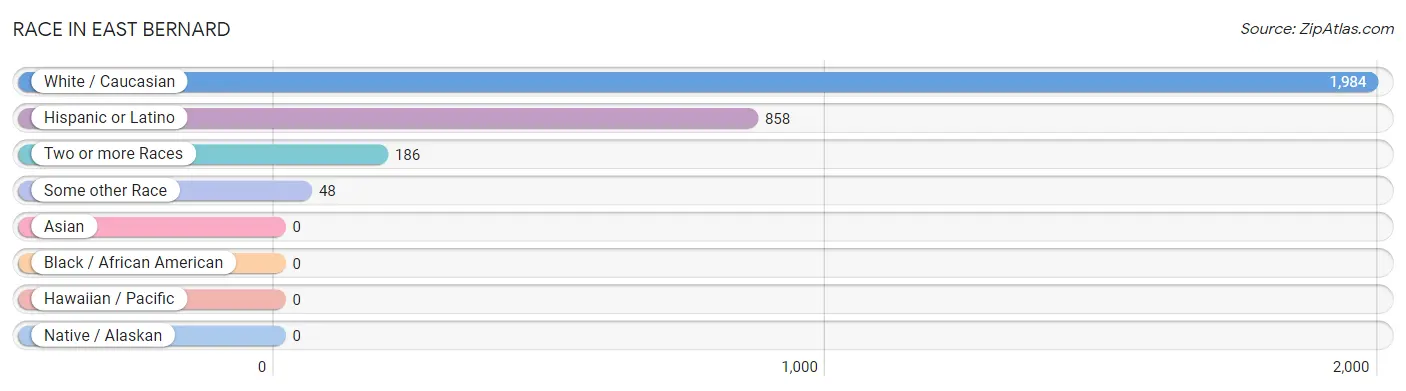
| Race | # Population | % Population |
| Asian | 0 | 0.0% |
| Black / African American | 0 | 0.0% |
| Hawaiian / Pacific | 0 | 0.0% |
| Hispanic or Latino | 858 | 38.7% |
| Native / Alaskan | 0 | 0.0% |
| White / Caucasian | 1,984 | 89.4% |
| Two or more Races | 186 | 8.4% |
| Some other Race | 48 | 2.2% |
| Total | 2,218 | 100.0% |
Ancestry in East Bernard
The most populous ancestries reported in East Bernard are Mexican (807 | 36.4%), Czech (561 | 25.3%), German (264 | 11.9%), English (172 | 7.7%), and Irish (95 | 4.3%), together accounting for 85.6% of all East Bernard residents.
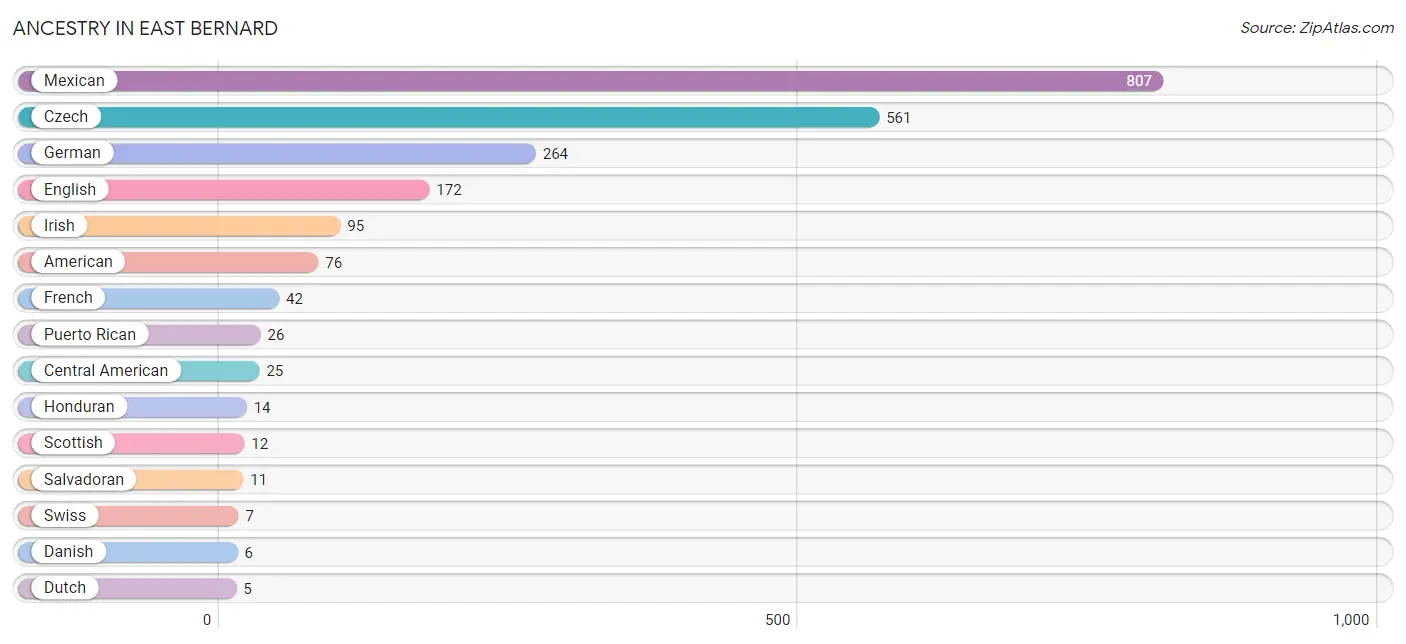
| Ancestry | # Population | % Population |
| American | 76 | 3.4% |
| Central American | 25 | 1.1% |
| Czech | 561 | 25.3% |
| Danish | 6 | 0.3% |
| Dutch | 5 | 0.2% |
| English | 172 | 7.7% |
| French | 42 | 1.9% |
| German | 264 | 11.9% |
| Honduran | 14 | 0.6% |
| Irish | 95 | 4.3% |
| Mexican | 807 | 36.4% |
| Polish | 3 | 0.1% |
| Puerto Rican | 26 | 1.2% |
| Salvadoran | 11 | 0.5% |
| Scottish | 12 | 0.5% |
| Swiss | 7 | 0.3% | View All 16 Rows |
Immigrants in East Bernard
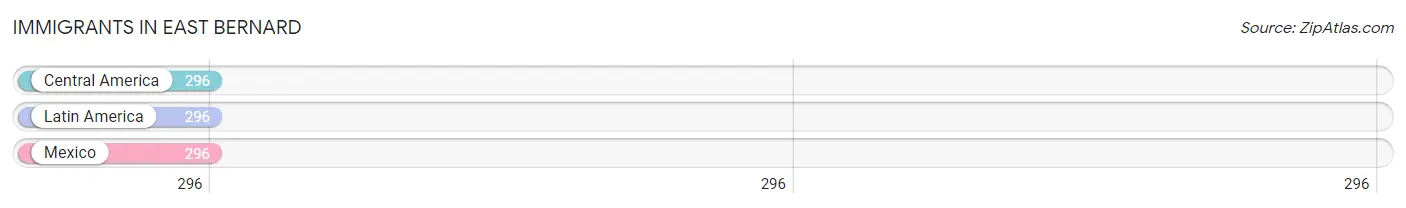
The most numerous immigrant groups reported in East Bernard came from Central America (296 | 13.4%), Latin America (296 | 13.4%), and Mexico (296 | 13.4%), together accounting for 40.1% of all East Bernard residents.
| Immigration Origin | # Population | % Population |
| Central America | 296 | 13.4% |
| Latin America | 296 | 13.4% |
| Mexico | 296 | 13.4% | View All 3 Rows |
Sex and Age in East Bernard
Sex and Age in East Bernard
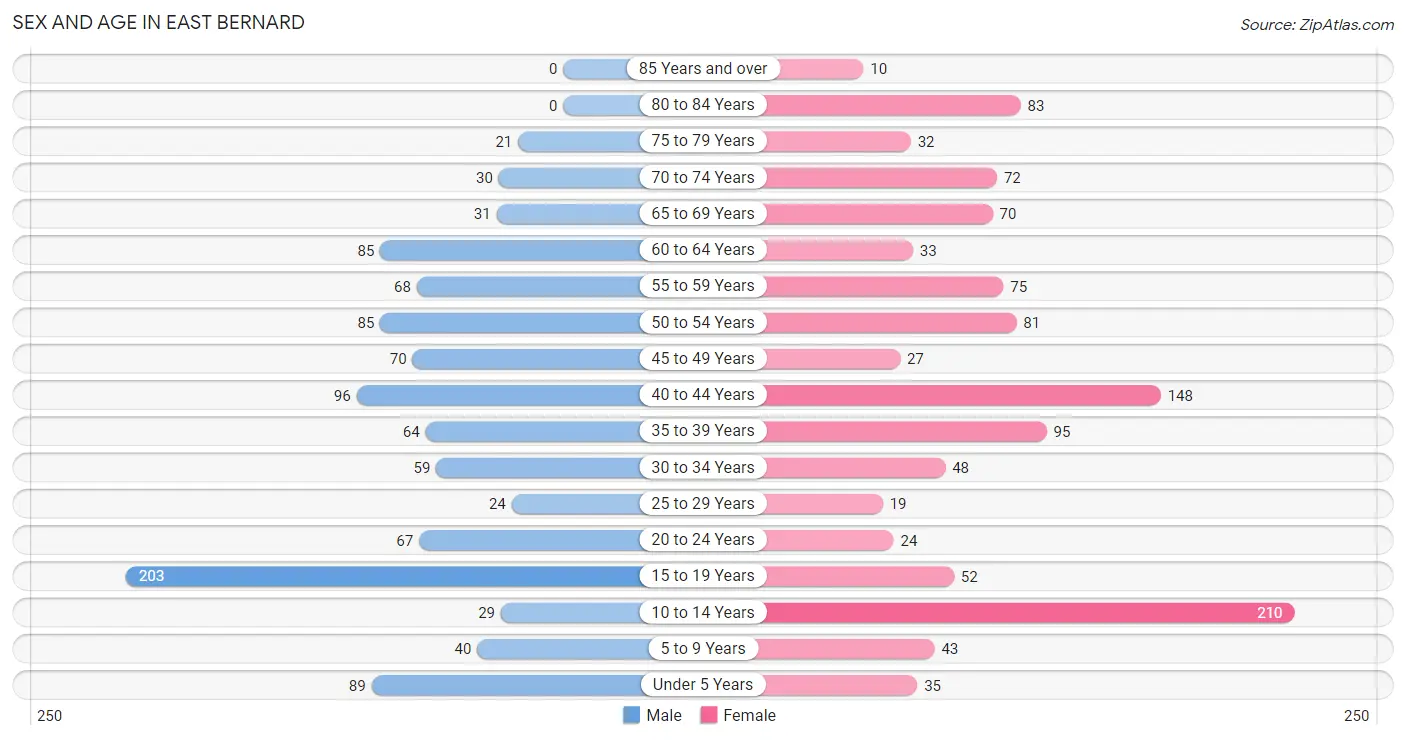
The most populous age groups in East Bernard are 15 to 19 Years (203 | 19.1%) for men and 10 to 14 Years (210 | 18.1%) for women.
| Age Bracket | Male | Female |
| Under 5 Years | 89 (8.4%) | 35 (3.0%) |
| 5 to 9 Years | 40 (3.8%) | 43 (3.7%) |
| 10 to 14 Years | 29 (2.7%) | 210 (18.1%) |
| 15 to 19 Years | 203 (19.1%) | 52 (4.5%) |
| 20 to 24 Years | 67 (6.3%) | 24 (2.1%) |
| 25 to 29 Years | 24 (2.3%) | 19 (1.6%) |
| 30 to 34 Years | 59 (5.6%) | 48 (4.2%) |
| 35 to 39 Years | 64 (6.0%) | 95 (8.2%) |
| 40 to 44 Years | 96 (9.0%) | 148 (12.8%) |
| 45 to 49 Years | 70 (6.6%) | 27 (2.3%) |
| 50 to 54 Years | 85 (8.0%) | 81 (7.0%) |
| 55 to 59 Years | 68 (6.4%) | 75 (6.5%) |
| 60 to 64 Years | 85 (8.0%) | 33 (2.9%) |
| 65 to 69 Years | 31 (2.9%) | 70 (6.0%) |
| 70 to 74 Years | 30 (2.8%) | 72 (6.2%) |
| 75 to 79 Years | 21 (2.0%) | 32 (2.8%) |
| 80 to 84 Years | 0 (0.0%) | 83 (7.2%) |
| 85 Years and over | 0 (0.0%) | 10 (0.9%) |
| Total | 1,061 (100.0%) | 1,157 (100.0%) |
Families and Households in East Bernard
Median Family Size in East Bernard
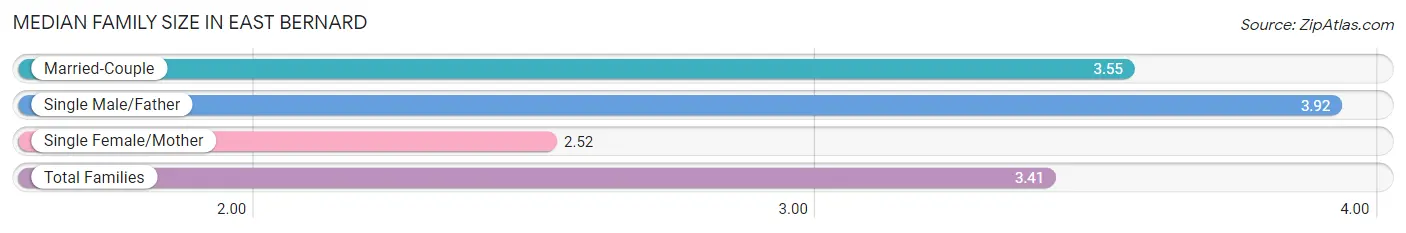
The median family size in East Bernard is 3.41 persons per family, with single male/father families (25 | 4.3%) accounting for the largest median family size of 3.92 persons per family. On the other hand, single female/mother families (87 | 14.9%) represent the smallest median family size with 2.52 persons per family.
| Family Type | # Families | Family Size |
| Married-Couple | 471 (80.8%) | 3.55 |
| Single Male/Father | 25 (4.3%) | 3.92 |
| Single Female/Mother | 87 (14.9%) | 2.52 |
| Total Families | 583 (100.0%) | 3.41 |
Median Household Size in East Bernard
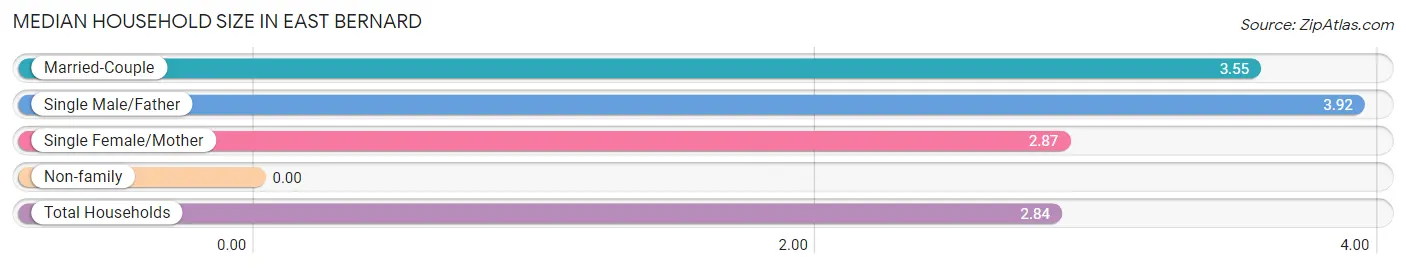
| Household Type | # Households | Household Size |
| Married-Couple | 471 (60.4%) | 3.55 |
| Single Male/Father | 25 (3.2%) | 3.92 |
| Single Female/Mother | 87 (11.2%) | 2.87 |
| Non-family | 197 (25.3%) | - |
| Total Households | 780 (100.0%) | 2.84 |
Household Size by Marriage Status in East Bernard
Out of a total of 780 households in East Bernard, 583 (74.7%) are family households, while 197 (25.3%) are nonfamily households. The most numerous type of family households are 2-person households, comprising 234, and the most common type of nonfamily households are 1-person households, comprising 197.
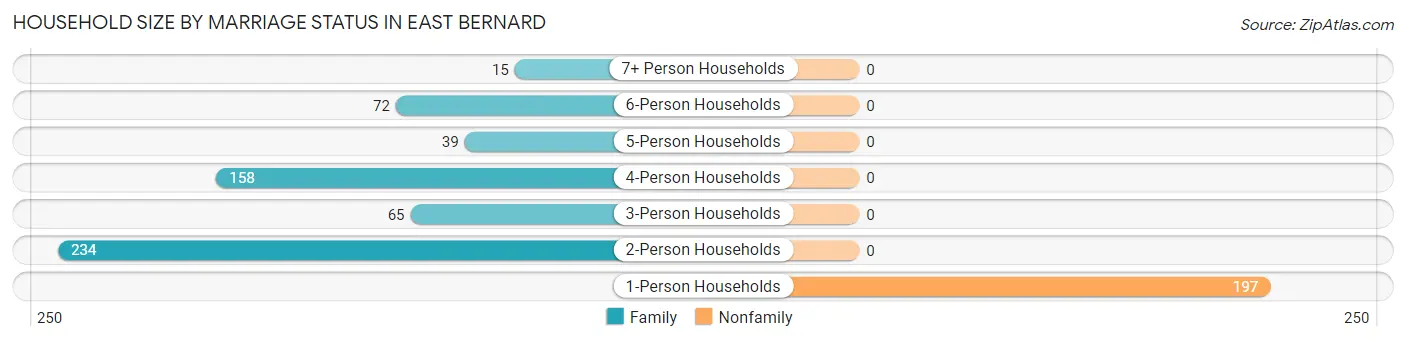
| Household Size | Family Households | Nonfamily Households |
| 1-Person Households | - | 197 (25.3%) |
| 2-Person Households | 234 (30.0%) | 0 (0.0%) |
| 3-Person Households | 65 (8.3%) | 0 (0.0%) |
| 4-Person Households | 158 (20.3%) | 0 (0.0%) |
| 5-Person Households | 39 (5.0%) | 0 (0.0%) |
| 6-Person Households | 72 (9.2%) | 0 (0.0%) |
| 7+ Person Households | 15 (1.9%) | 0 (0.0%) |
| Total | 583 (74.7%) | 197 (25.3%) |
Female Fertility in East Bernard
Fertility by Age in East Bernard
Average fertility rate in East Bernard is 19.0 births per 1,000 women. Women in the age bracket of 20 to 34 years have the highest fertility rate with 88.0 births per 1,000 women. Women in the age bracket of 20 to 34 years acount for 100.0% of all women with births.
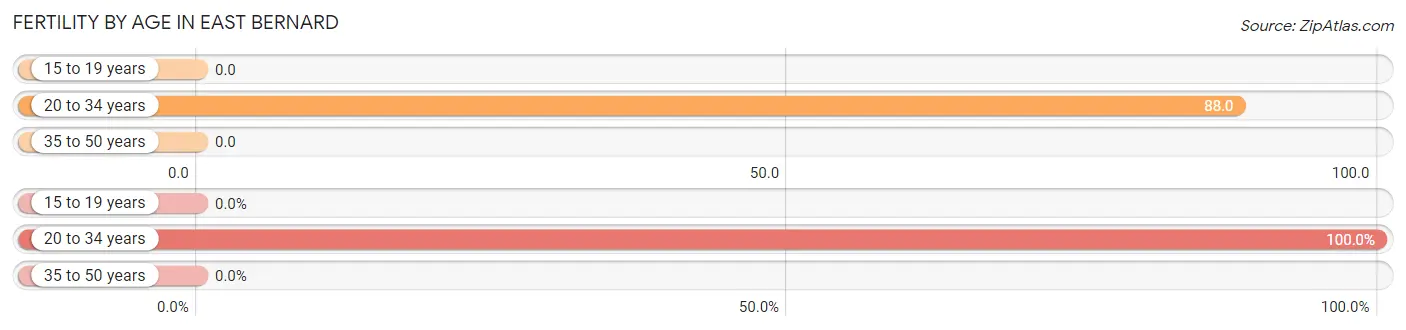
| Age Bracket | Women with Births | Births / 1,000 Women |
| 15 to 19 years | 0 (0.0%) | 0.0 |
| 20 to 34 years | 8 (100.0%) | 88.0 |
| 35 to 50 years | 0 (0.0%) | 0.0 |
| Total | 8 (100.0%) | 19.0 |
Fertility by Age by Marriage Status in East Bernard
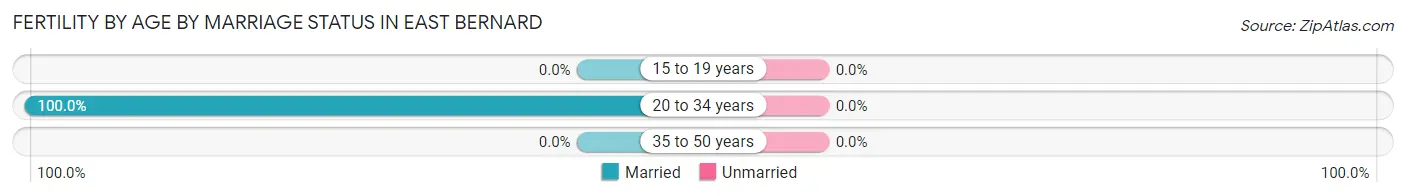
| Age Bracket | Married | Unmarried |
| 15 to 19 years | 0 (0.0%) | 0 (0.0%) |
| 20 to 34 years | 8 (100.0%) | 0 (0.0%) |
| 35 to 50 years | 0 (0.0%) | 0 (0.0%) |
| Total | 8 (100.0%) | 0 (0.0%) |
Fertility by Education in East Bernard
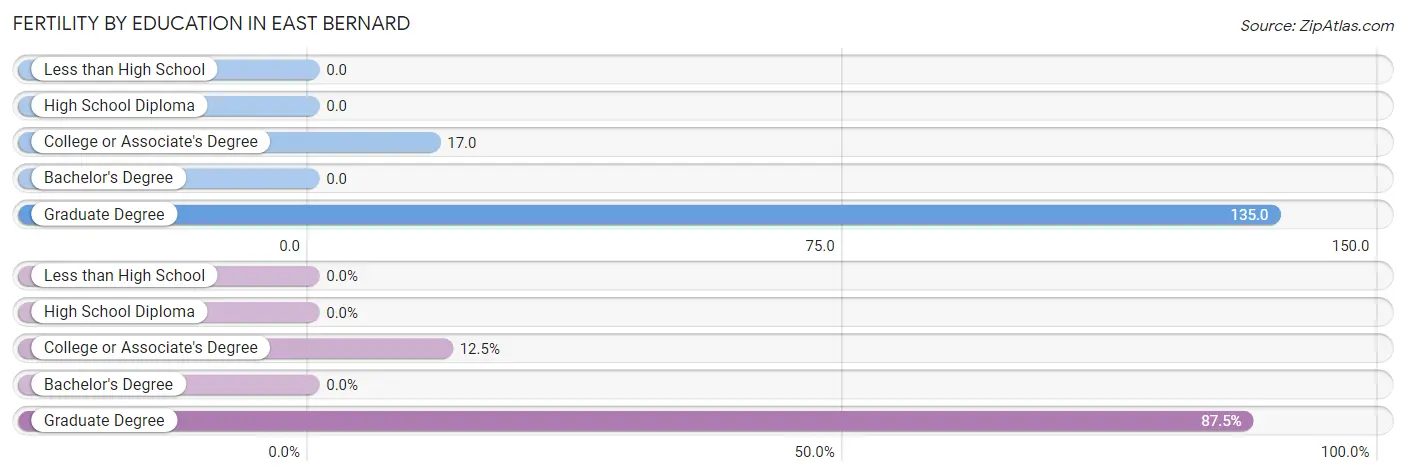
| Educational Attainment | Women with Births | Births / 1,000 Women |
| Less than High School | 0 (0.0%) | 0.0 |
| High School Diploma | 0 (0.0%) | 0.0 |
| College or Associate's Degree | 1 (12.5%) | 17.0 |
| Bachelor's Degree | 0 (0.0%) | 0.0 |
| Graduate Degree | 7 (87.5%) | 135.0 |
| Total | 8 (100.0%) | 19.0 |
Fertility by Education by Marriage Status in East Bernard
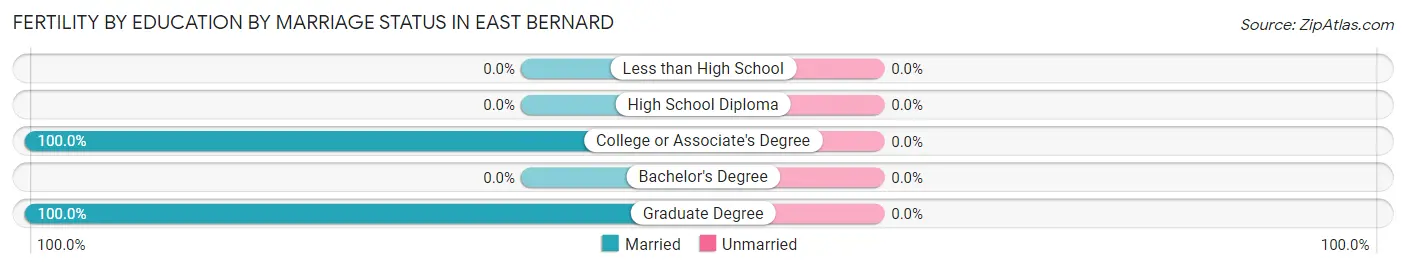
| Educational Attainment | Married | Unmarried |
| Less than High School | 0 (0.0%) | 0 (0.0%) |
| High School Diploma | 0 (0.0%) | 0 (0.0%) |
| College or Associate's Degree | 1 (100.0%) | 0 (0.0%) |
| Bachelor's Degree | 0 (0.0%) | 0 (0.0%) |
| Graduate Degree | 7 (100.0%) | 0 (0.0%) |
| Total | 8 (100.0%) | 0 (0.0%) |
Employment Characteristics in East Bernard
Employment by Class of Employer in East Bernard
Among the 825 employed individuals in East Bernard, private company employees (458 | 55.5%), local government employees (112 | 13.6%), and not-for-profit organizations (102 | 12.4%) make up the most common classes of employment.
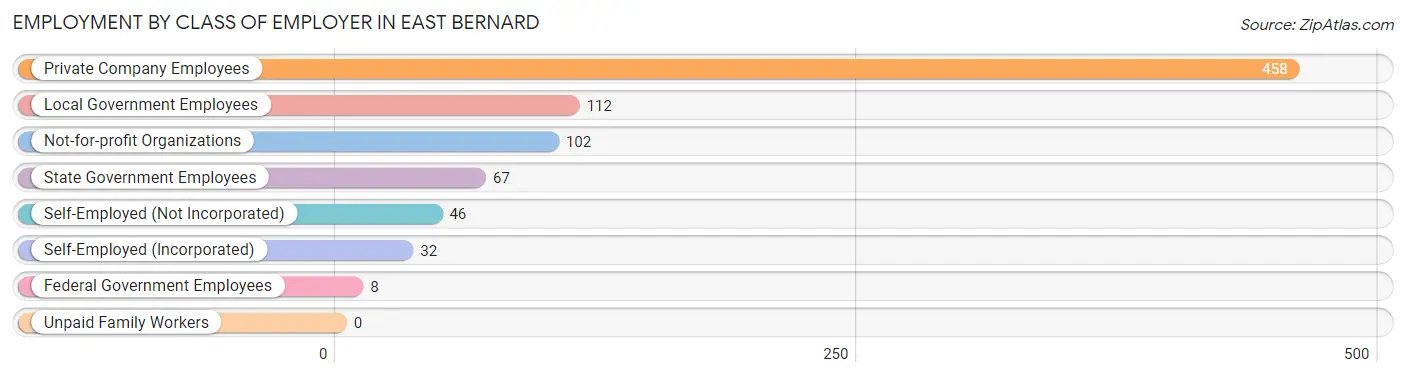
| Employer Class | # Employees | % Employees |
| Private Company Employees | 458 | 55.5% |
| Self-Employed (Incorporated) | 32 | 3.9% |
| Self-Employed (Not Incorporated) | 46 | 5.6% |
| Not-for-profit Organizations | 102 | 12.4% |
| Local Government Employees | 112 | 13.6% |
| State Government Employees | 67 | 8.1% |
| Federal Government Employees | 8 | 1.0% |
| Unpaid Family Workers | 0 | 0.0% |
| Total | 825 | 100.0% |
Employment Status by Age in East Bernard
According to the labor force statistics for East Bernard, out of the total population over 16 years of age (1,721), 53.1% or 914 individuals are in the labor force, with 9.5% or 87 of them unemployed. The age group with the highest labor force participation rate is 45 to 54 years, with 91.6% or 241 individuals in the labor force. Within the labor force, the 35 to 44 years age range has the highest percentage of unemployed individuals, with 24.4% or 81 of them being unemployed.
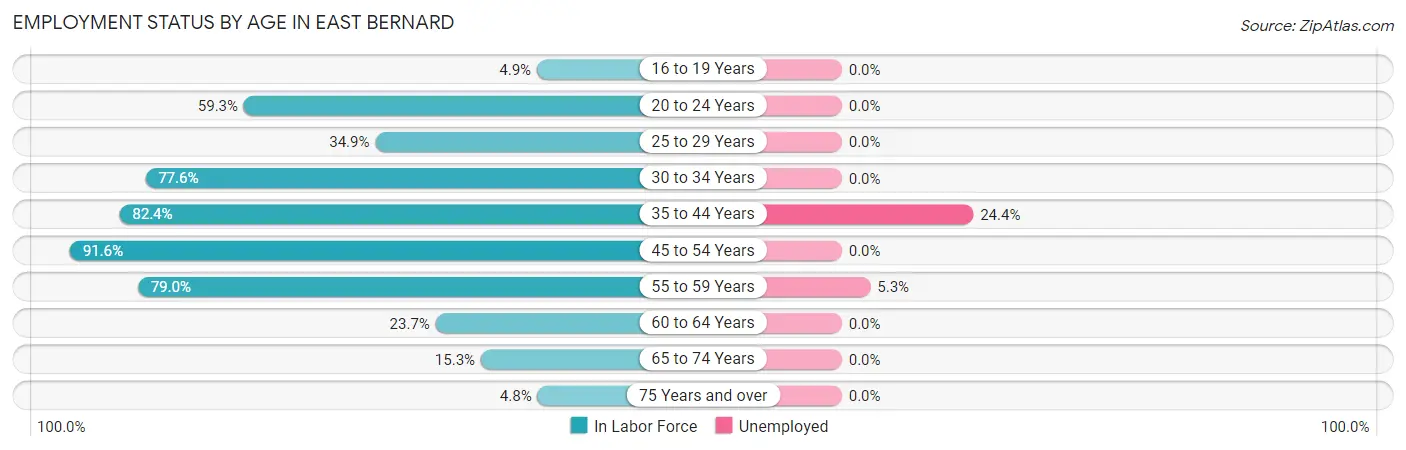
| Age Bracket | In Labor Force | Unemployed |
| 16 to 19 Years | 10 (4.9%) | 0 (0.0%) |
| 20 to 24 Years | 54 (59.3%) | 0 (0.0%) |
| 25 to 29 Years | 15 (34.9%) | 0 (0.0%) |
| 30 to 34 Years | 83 (77.6%) | 0 (0.0%) |
| 35 to 44 Years | 332 (82.4%) | 81 (24.4%) |
| 45 to 54 Years | 241 (91.6%) | 0 (0.0%) |
| 55 to 59 Years | 113 (79.0%) | 6 (5.3%) |
| 60 to 64 Years | 28 (23.7%) | 0 (0.0%) |
| 65 to 74 Years | 31 (15.3%) | 0 (0.0%) |
| 75 Years and over | 7 (4.8%) | 0 (0.0%) |
| Total | 914 (53.1%) | 87 (9.5%) |
Employment Status by Educational Attainment in East Bernard
According to labor force statistics for East Bernard, 75.4% of individuals (812) out of the total population between 25 and 64 years of age (1,077) are in the labor force, with 10.7% or 87 of them being unemployed. The group with the highest labor force participation rate are those with the educational attainment of less than high school, with 86.7% or 104 individuals in the labor force. Within the labor force, individuals with high school diploma education have the highest percentage of unemployment, with 26.9% or 77 of them being unemployed.
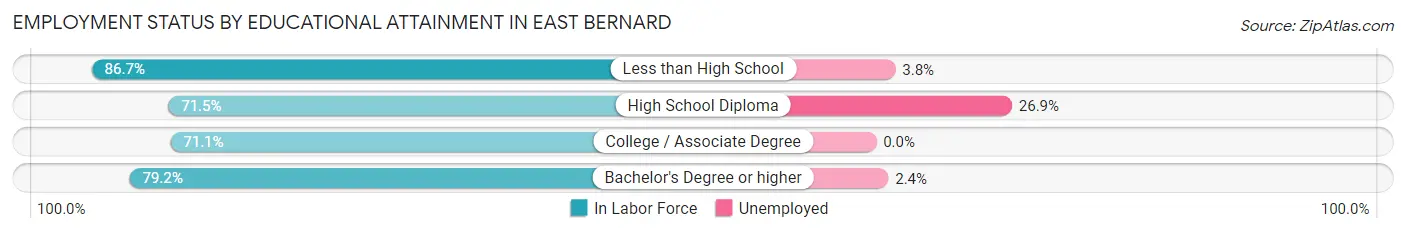
| Educational Attainment | In Labor Force | Unemployed |
| Less than High School | 104 (86.7%) | 5 (3.8%) |
| High School Diploma | 286 (71.5%) | 108 (26.9%) |
| College / Associate Degree | 170 (71.1%) | 0 (0.0%) |
| Bachelor's Degree or higher | 252 (79.2%) | 8 (2.4%) |
| Total | 812 (75.4%) | 115 (10.7%) |
Employment Occupations by Sex in East Bernard
Management, Business, Science and Arts Occupations
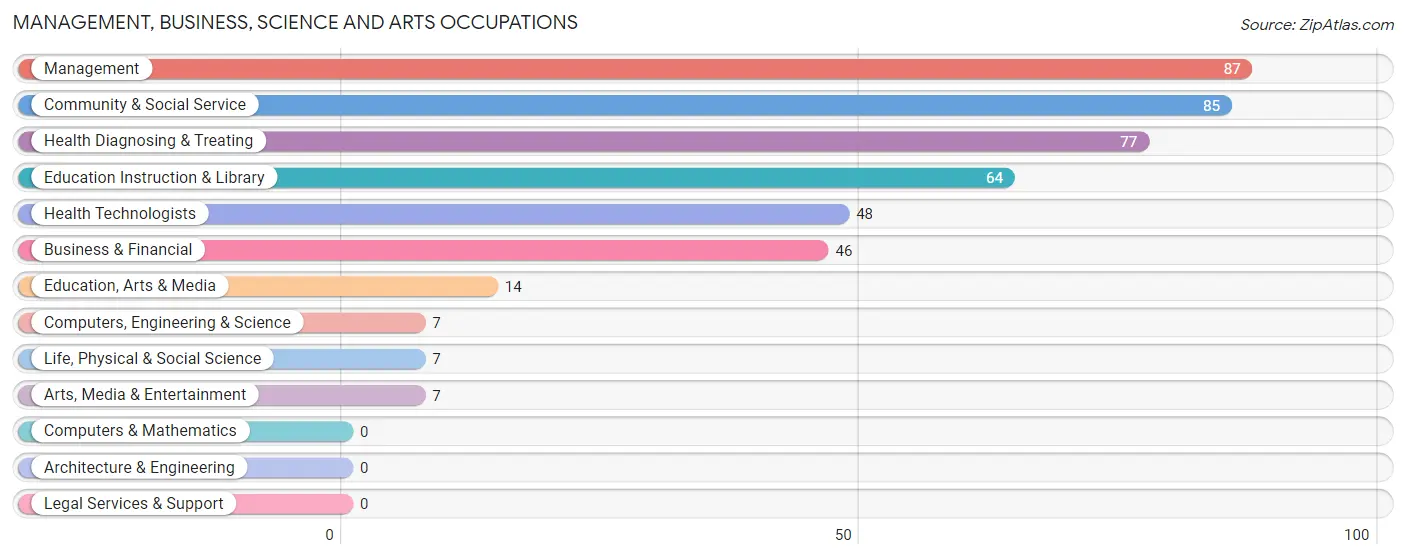
The most common Management, Business, Science and Arts occupations in East Bernard are Management (87 | 10.5%), Community & Social Service (85 | 10.3%), Health Diagnosing & Treating (77 | 9.3%), Education Instruction & Library (64 | 7.7%), and Health Technologists (48 | 5.8%).
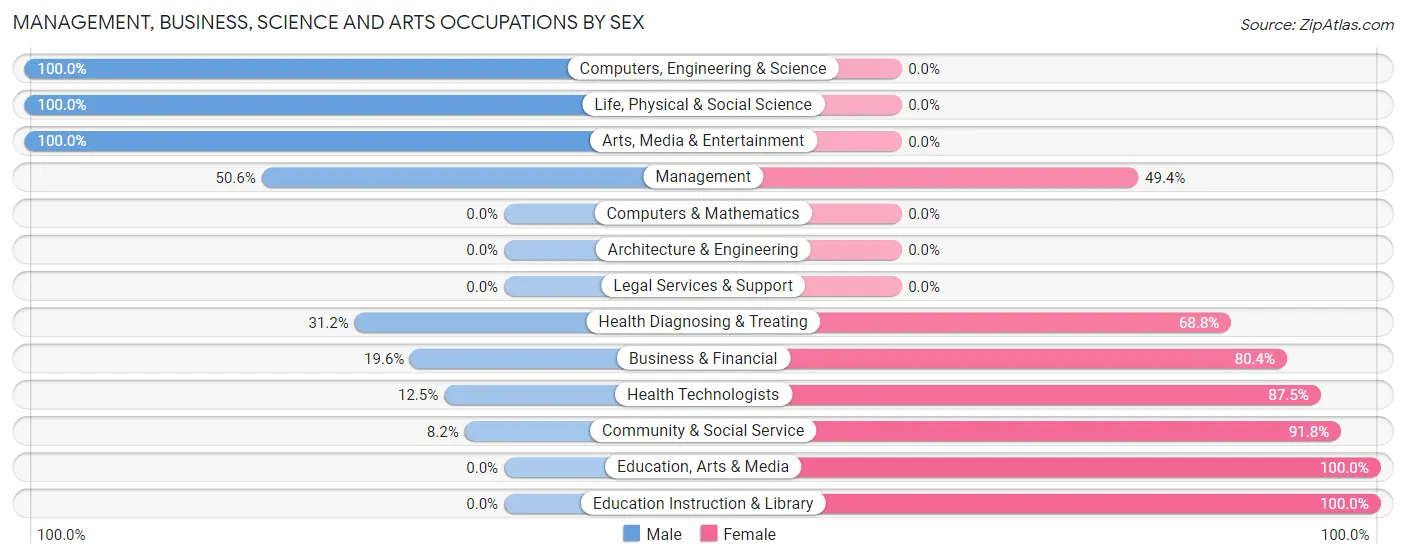
Management, Business, Science and Arts Occupations by Sex
Within the Management, Business, Science and Arts occupations in East Bernard, the most male-oriented occupations are Computers, Engineering & Science (100.0%), Life, Physical & Social Science (100.0%), and Arts, Media & Entertainment (100.0%), while the most female-oriented occupations are Education, Arts & Media (100.0%), Education Instruction & Library (100.0%), and Community & Social Service (91.8%).
| Occupation | Male | Female |
| Management | 44 (50.6%) | 43 (49.4%) |
| Business & Financial | 9 (19.6%) | 37 (80.4%) |
| Computers, Engineering & Science | 7 (100.0%) | 0 (0.0%) |
| Computers & Mathematics | 0 (0.0%) | 0 (0.0%) |
| Architecture & Engineering | 0 (0.0%) | 0 (0.0%) |
| Life, Physical & Social Science | 7 (100.0%) | 0 (0.0%) |
| Community & Social Service | 7 (8.2%) | 78 (91.8%) |
| Education, Arts & Media | 0 (0.0%) | 14 (100.0%) |
| Legal Services & Support | 0 (0.0%) | 0 (0.0%) |
| Education Instruction & Library | 0 (0.0%) | 64 (100.0%) |
| Arts, Media & Entertainment | 7 (100.0%) | 0 (0.0%) |
| Health Diagnosing & Treating | 24 (31.2%) | 53 (68.8%) |
| Health Technologists | 6 (12.5%) | 42 (87.5%) |
| Total (Category) | 91 (30.1%) | 211 (69.9%) |
| Total (Overall) | 474 (57.3%) | 353 (42.7%) |
Services Occupations
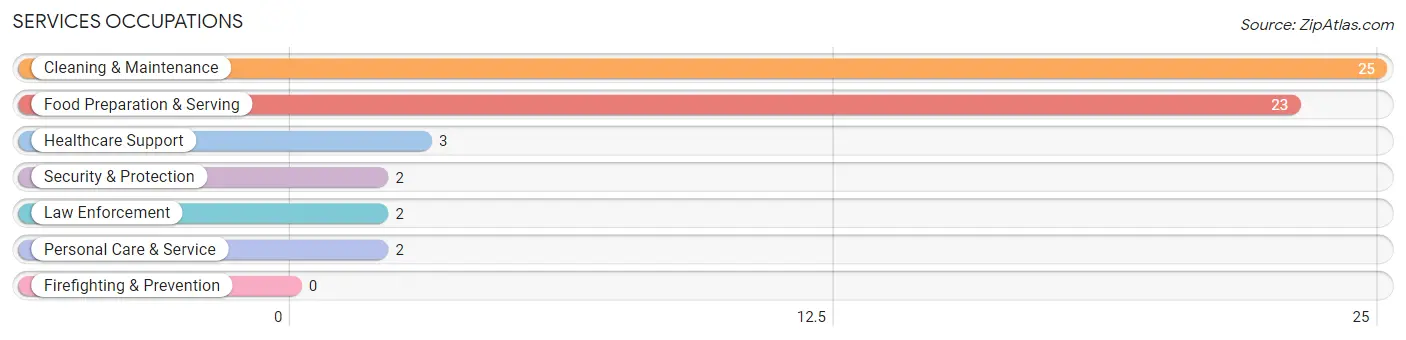
The most common Services occupations in East Bernard are Cleaning & Maintenance (25 | 3.0%), Food Preparation & Serving (23 | 2.8%), Healthcare Support (3 | 0.4%), Security & Protection (2 | 0.2%), and Law Enforcement (2 | 0.2%).
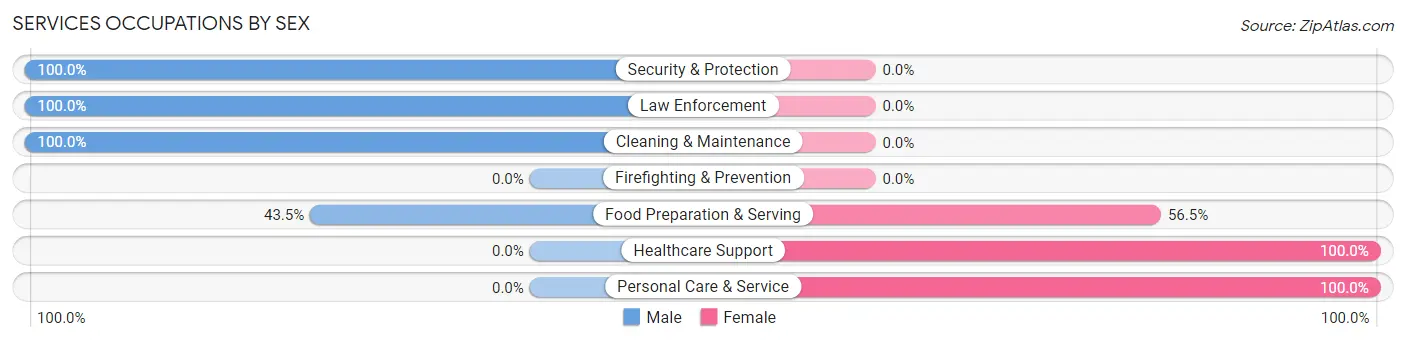
Services Occupations by Sex
Within the Services occupations in East Bernard, the most male-oriented occupations are Security & Protection (100.0%), Law Enforcement (100.0%), and Cleaning & Maintenance (100.0%), while the most female-oriented occupations are Healthcare Support (100.0%), Personal Care & Service (100.0%), and Food Preparation & Serving (56.5%).
| Occupation | Male | Female |
| Healthcare Support | 0 (0.0%) | 3 (100.0%) |
| Security & Protection | 2 (100.0%) | 0 (0.0%) |
| Firefighting & Prevention | 0 (0.0%) | 0 (0.0%) |
| Law Enforcement | 2 (100.0%) | 0 (0.0%) |
| Food Preparation & Serving | 10 (43.5%) | 13 (56.5%) |
| Cleaning & Maintenance | 25 (100.0%) | 0 (0.0%) |
| Personal Care & Service | 0 (0.0%) | 2 (100.0%) |
| Total (Category) | 37 (67.3%) | 18 (32.7%) |
| Total (Overall) | 474 (57.3%) | 353 (42.7%) |
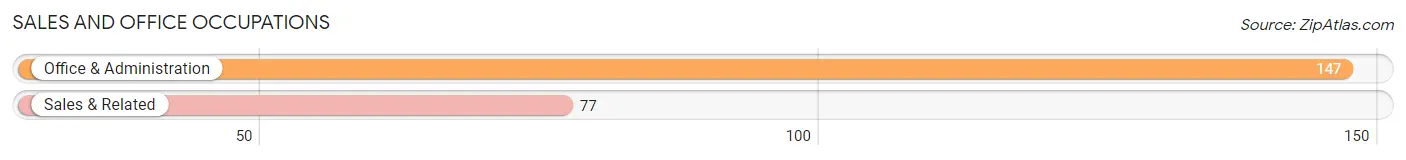
Sales and Office Occupations
The most common Sales and Office occupations in East Bernard are Office & Administration (147 | 17.8%), and Sales & Related (77 | 9.3%).
Sales and Office Occupations by Sex
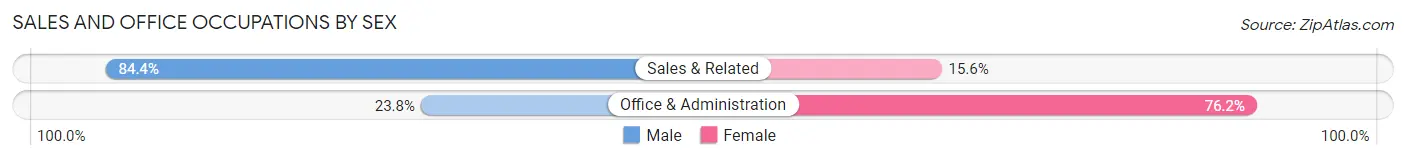
| Occupation | Male | Female |
| Sales & Related | 65 (84.4%) | 12 (15.6%) |
| Office & Administration | 35 (23.8%) | 112 (76.2%) |
| Total (Category) | 100 (44.6%) | 124 (55.4%) |
| Total (Overall) | 474 (57.3%) | 353 (42.7%) |
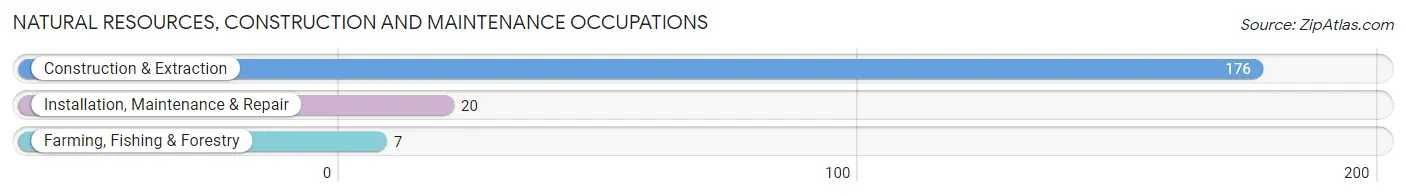
Natural Resources, Construction and Maintenance Occupations
The most common Natural Resources, Construction and Maintenance occupations in East Bernard are Construction & Extraction (176 | 21.3%), Installation, Maintenance & Repair (20 | 2.4%), and Farming, Fishing & Forestry (7 | 0.9%).
Natural Resources, Construction and Maintenance Occupations by Sex
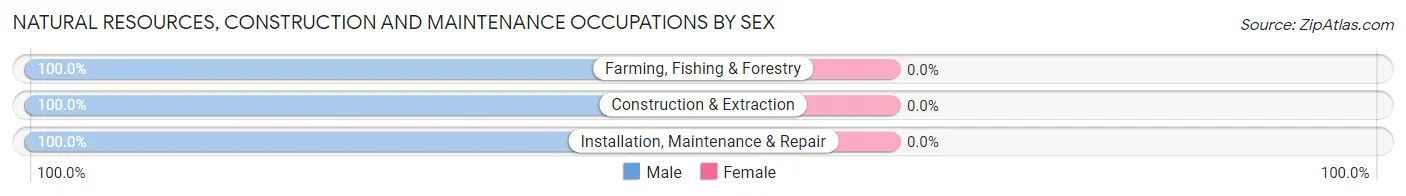
| Occupation | Male | Female |
| Farming, Fishing & Forestry | 7 (100.0%) | 0 (0.0%) |
| Construction & Extraction | 176 (100.0%) | 0 (0.0%) |
| Installation, Maintenance & Repair | 20 (100.0%) | 0 (0.0%) |
| Total (Category) | 203 (100.0%) | 0 (0.0%) |
| Total (Overall) | 474 (57.3%) | 353 (42.7%) |
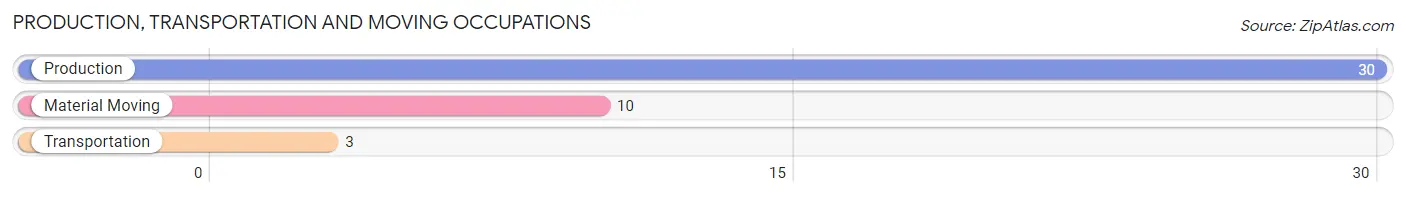
Production, Transportation and Moving Occupations
The most common Production, Transportation and Moving occupations in East Bernard are Production (30 | 3.6%), Material Moving (10 | 1.2%), and Transportation (3 | 0.4%).
Production, Transportation and Moving Occupations by Sex
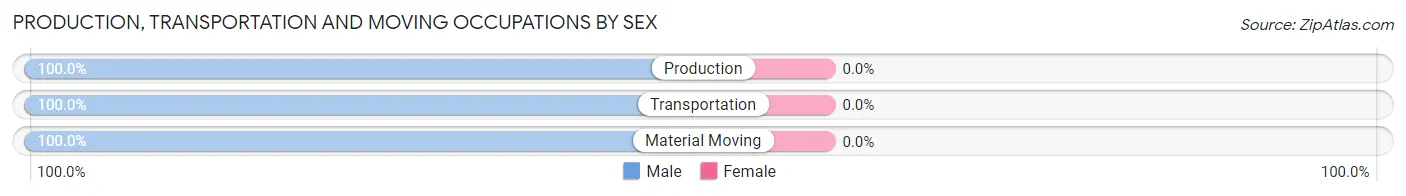
| Occupation | Male | Female |
| Production | 30 (100.0%) | 0 (0.0%) |
| Transportation | 3 (100.0%) | 0 (0.0%) |
| Material Moving | 10 (100.0%) | 0 (0.0%) |
| Total (Category) | 43 (100.0%) | 0 (0.0%) |
| Total (Overall) | 474 (57.3%) | 353 (42.7%) |
Employment Industries by Sex in East Bernard
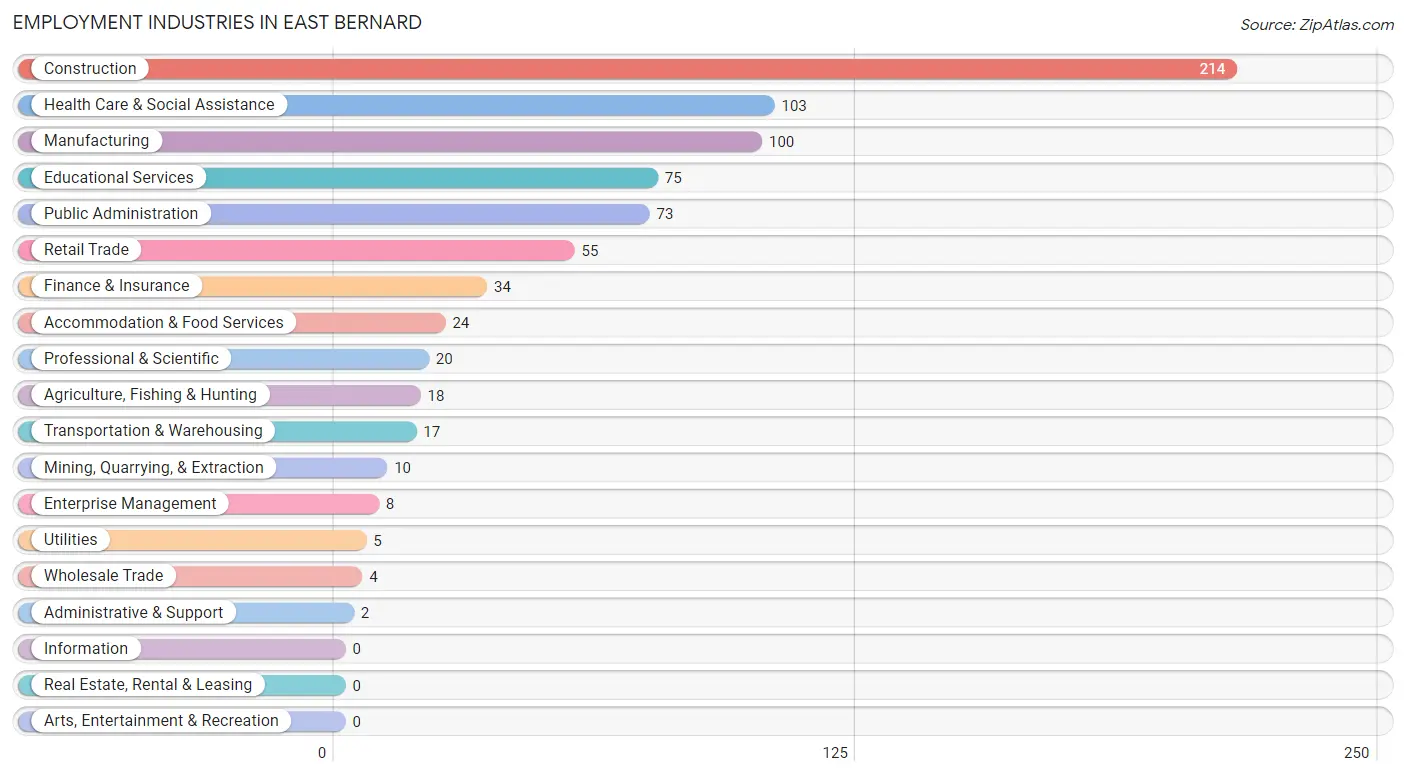
Employment Industries in East Bernard
The major employment industries in East Bernard include Construction (214 | 25.9%), Health Care & Social Assistance (103 | 12.4%), Manufacturing (100 | 12.1%), Educational Services (75 | 9.1%), and Public Administration (73 | 8.8%).
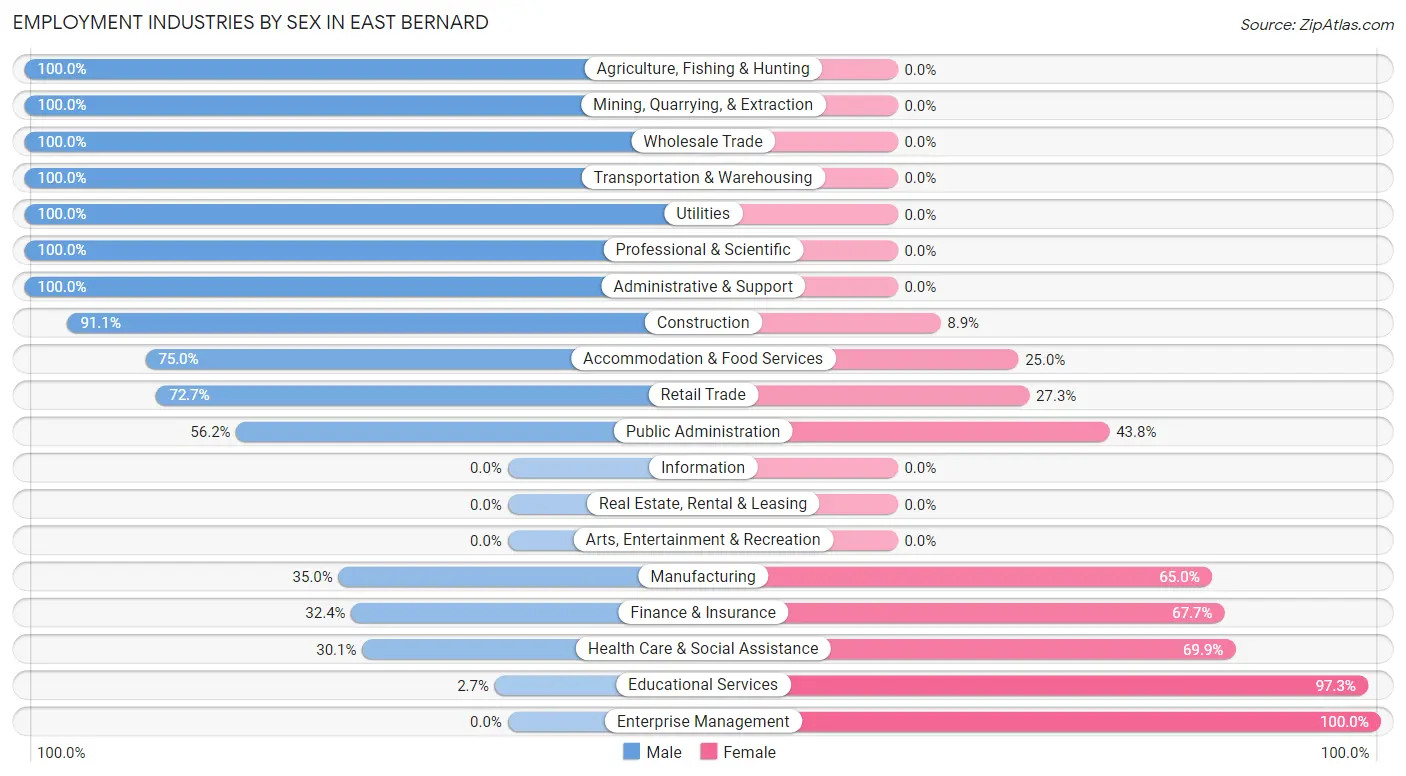
Employment Industries by Sex in East Bernard
The East Bernard industries that see more men than women are Agriculture, Fishing & Hunting (100.0%), Mining, Quarrying, & Extraction (100.0%), and Wholesale Trade (100.0%), whereas the industries that tend to have a higher number of women are Enterprise Management (100.0%), Educational Services (97.3%), and Health Care & Social Assistance (69.9%).
| Industry | Male | Female |
| Agriculture, Fishing & Hunting | 18 (100.0%) | 0 (0.0%) |
| Mining, Quarrying, & Extraction | 10 (100.0%) | 0 (0.0%) |
| Construction | 195 (91.1%) | 19 (8.9%) |
| Manufacturing | 35 (35.0%) | 65 (65.0%) |
| Wholesale Trade | 4 (100.0%) | 0 (0.0%) |
| Retail Trade | 40 (72.7%) | 15 (27.3%) |
| Transportation & Warehousing | 17 (100.0%) | 0 (0.0%) |
| Utilities | 5 (100.0%) | 0 (0.0%) |
| Information | 0 (0.0%) | 0 (0.0%) |
| Finance & Insurance | 11 (32.4%) | 23 (67.6%) |
| Real Estate, Rental & Leasing | 0 (0.0%) | 0 (0.0%) |
| Professional & Scientific | 20 (100.0%) | 0 (0.0%) |
| Enterprise Management | 0 (0.0%) | 8 (100.0%) |
| Administrative & Support | 2 (100.0%) | 0 (0.0%) |
| Educational Services | 2 (2.7%) | 73 (97.3%) |
| Health Care & Social Assistance | 31 (30.1%) | 72 (69.9%) |
| Arts, Entertainment & Recreation | 0 (0.0%) | 0 (0.0%) |
| Accommodation & Food Services | 18 (75.0%) | 6 (25.0%) |
| Public Administration | 41 (56.2%) | 32 (43.8%) |
| Total | 474 (57.3%) | 353 (42.7%) |
Education in East Bernard
School Enrollment in East Bernard
The most common levels of schooling among the 581 students in East Bernard are high school (228 | 39.2%), middle school (203 | 34.9%), and kindergarten (49 | 8.4%).
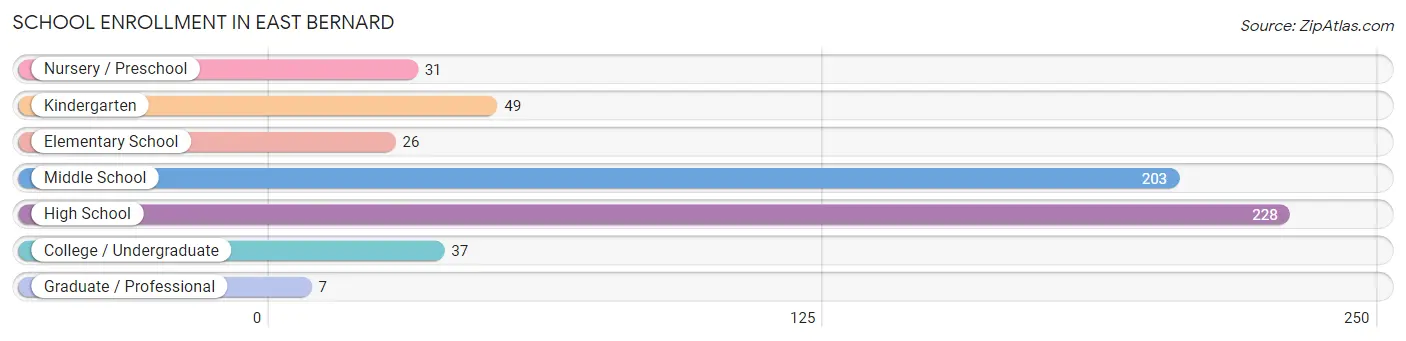
| School Level | # Students | % Students |
| Nursery / Preschool | 31 | 5.3% |
| Kindergarten | 49 | 8.4% |
| Elementary School | 26 | 4.5% |
| Middle School | 203 | 34.9% |
| High School | 228 | 39.2% |
| College / Undergraduate | 37 | 6.4% |
| Graduate / Professional | 7 | 1.2% |
| Total | 581 | 100.0% |
School Enrollment by Age by Funding Source in East Bernard
Out of a total of 581 students who are enrolled in schools in East Bernard, 34 (5.9%) attend a private institution, while the remaining 547 (94.1%) are enrolled in public schools. The age group of 3 to 4 year olds has the highest likelihood of being enrolled in private schools, with 21 (100.0% in the age bracket) enrolled. Conversely, the age group of 15 to 17 year olds has the lowest likelihood of being enrolled in a private school, with 226 (100.0% in the age bracket) attending a public institution.
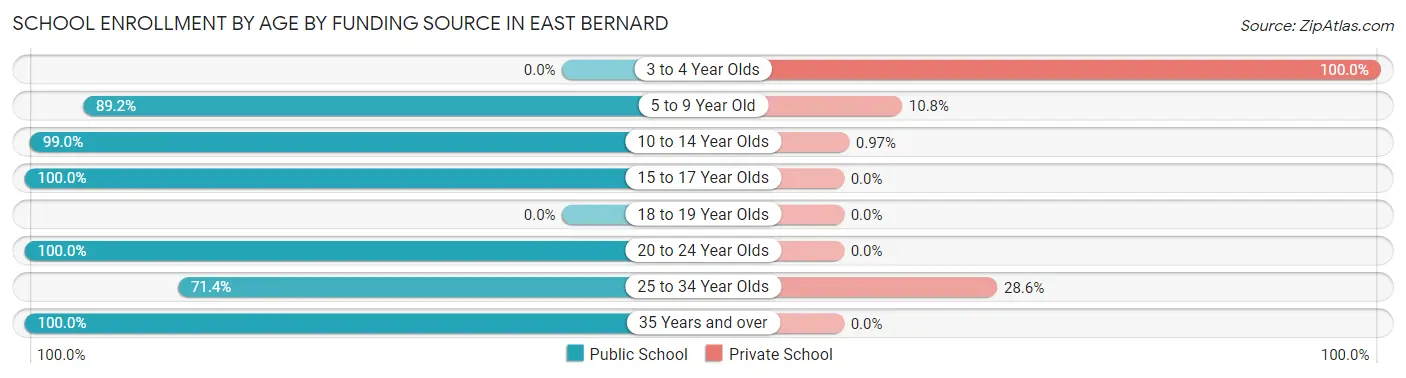
| Age Bracket | Public School | Private School |
| 3 to 4 Year Olds | 0 (0.0%) | 21 (100.0%) |
| 5 to 9 Year Old | 74 (89.2%) | 9 (10.8%) |
| 10 to 14 Year Olds | 205 (99.0%) | 2 (1.0%) |
| 15 to 17 Year Olds | 226 (100.0%) | 0 (0.0%) |
| 18 to 19 Year Olds | 0 (0.0%) | 0 (0.0%) |
| 20 to 24 Year Olds | 30 (100.0%) | 0 (0.0%) |
| 25 to 34 Year Olds | 5 (71.4%) | 2 (28.6%) |
| 35 Years and over | 7 (100.0%) | 0 (0.0%) |
| Total | 547 (94.1%) | 34 (5.9%) |
Educational Attainment by Field of Study in East Bernard
Education (115 | 28.8%), business (79 | 19.8%), bio, nature & agricultural (68 | 17.0%), social sciences (35 | 8.8%), and science & technology (30 | 7.5%) are the most common fields of study among 399 individuals in East Bernard who have obtained a bachelor's degree or higher.
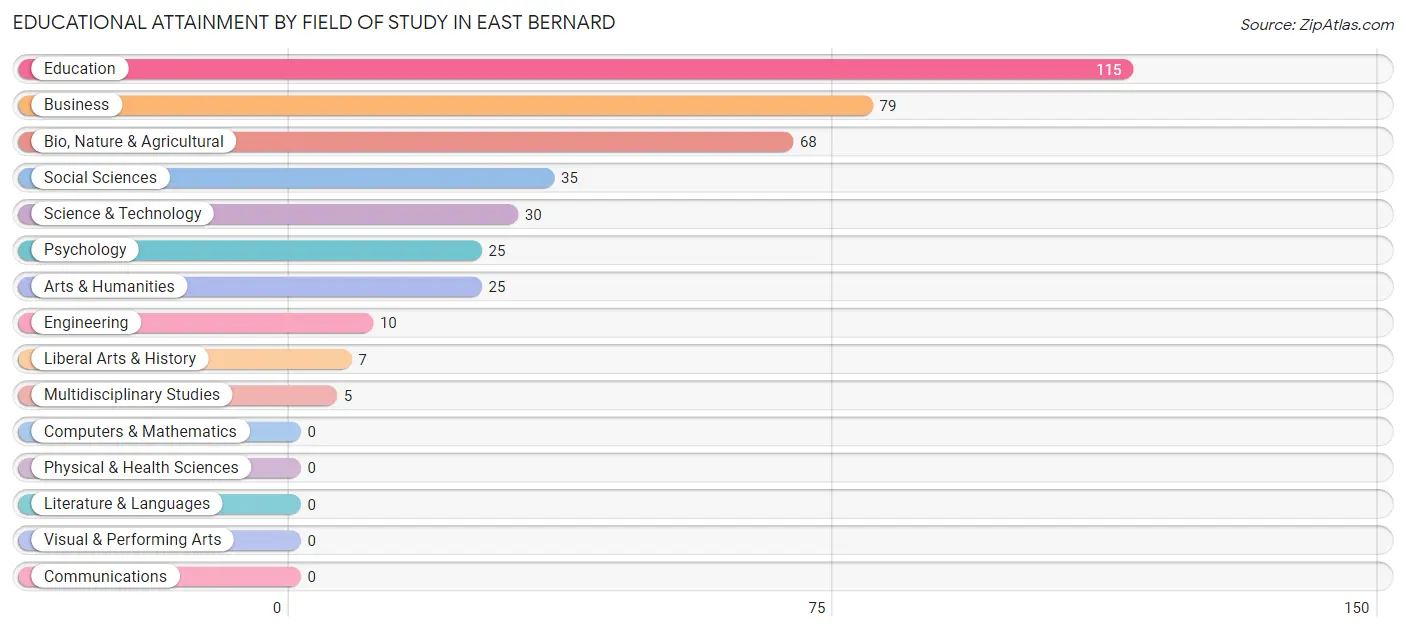
| Field of Study | # Graduates | % Graduates |
| Computers & Mathematics | 0 | 0.0% |
| Bio, Nature & Agricultural | 68 | 17.0% |
| Physical & Health Sciences | 0 | 0.0% |
| Psychology | 25 | 6.3% |
| Social Sciences | 35 | 8.8% |
| Engineering | 10 | 2.5% |
| Multidisciplinary Studies | 5 | 1.3% |
| Science & Technology | 30 | 7.5% |
| Business | 79 | 19.8% |
| Education | 115 | 28.8% |
| Literature & Languages | 0 | 0.0% |
| Liberal Arts & History | 7 | 1.8% |
| Visual & Performing Arts | 0 | 0.0% |
| Communications | 0 | 0.0% |
| Arts & Humanities | 25 | 6.3% |
| Total | 399 | 100.0% |
Transportation & Commute in East Bernard
Vehicle Availability by Sex in East Bernard
The most prevalent vehicle ownership categories in East Bernard are males with 2 vehicles (278, accounting for 58.7%) and females with 2 vehicles (155, making up 79.2%).
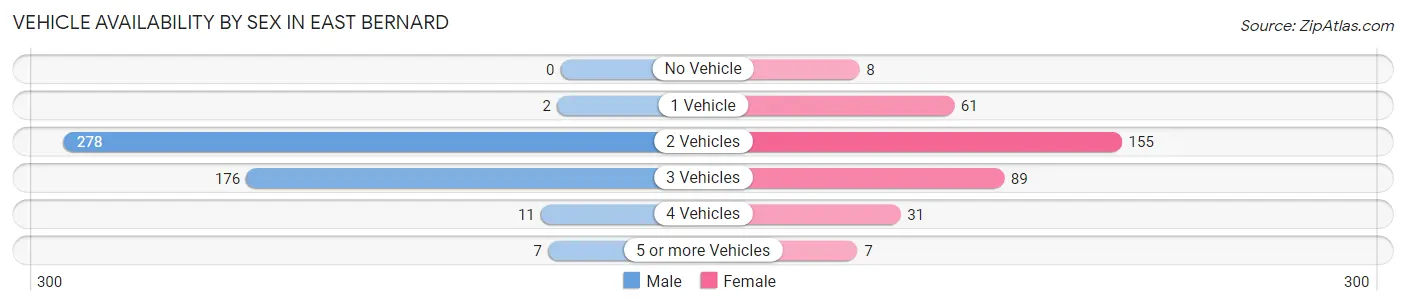
| Vehicles Available | Male | Female |
| No Vehicle | 0 (0.0%) | 8 (2.3%) |
| 1 Vehicle | 2 (0.4%) | 61 (17.4%) |
| 2 Vehicles | 278 (58.7%) | 155 (44.2%) |
| 3 Vehicles | 176 (37.1%) | 89 (25.4%) |
| 4 Vehicles | 11 (2.3%) | 31 (8.8%) |
| 5 or more Vehicles | 7 (1.5%) | 7 (2.0%) |
| Total | 474 (100.0%) | 351 (100.0%) |
Commute Time in East Bernard
The most frequently occuring commute durations in East Bernard are 30 to 34 minutes (133 commuters, 16.6%), 45 to 59 minutes (130 commuters, 16.2%), and 20 to 24 minutes (120 commuters, 15.0%).
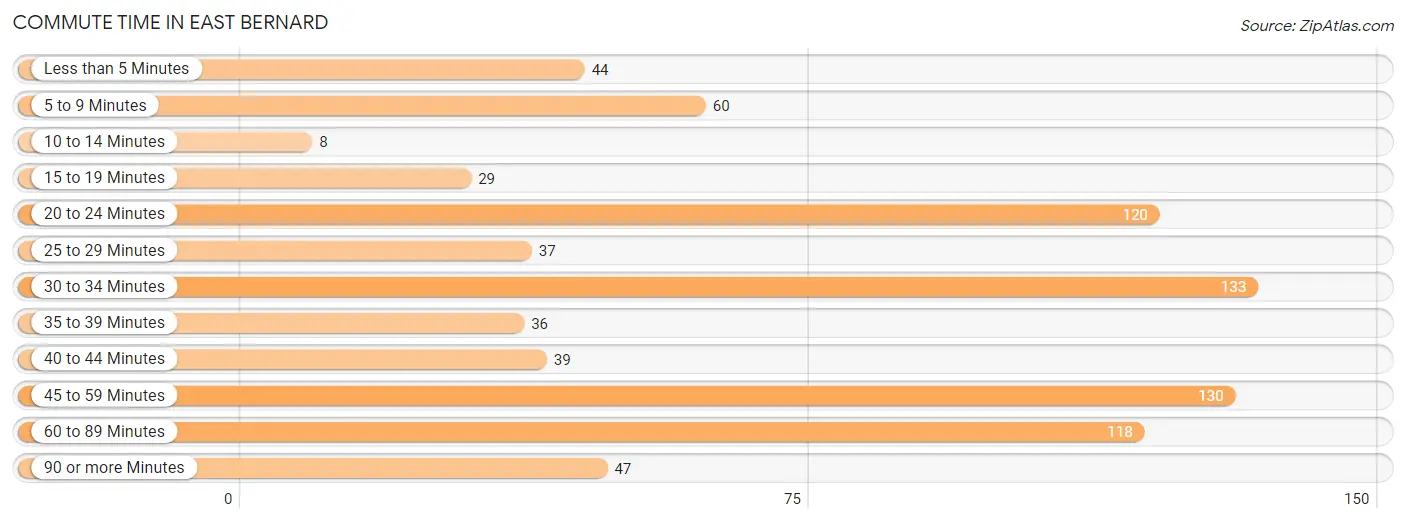
| Commute Time | # Commuters | % Commuters |
| Less than 5 Minutes | 44 | 5.5% |
| 5 to 9 Minutes | 60 | 7.5% |
| 10 to 14 Minutes | 8 | 1.0% |
| 15 to 19 Minutes | 29 | 3.6% |
| 20 to 24 Minutes | 120 | 15.0% |
| 25 to 29 Minutes | 37 | 4.6% |
| 30 to 34 Minutes | 133 | 16.6% |
| 35 to 39 Minutes | 36 | 4.5% |
| 40 to 44 Minutes | 39 | 4.9% |
| 45 to 59 Minutes | 130 | 16.2% |
| 60 to 89 Minutes | 118 | 14.7% |
| 90 or more Minutes | 47 | 5.9% |
Commute Time by Sex in East Bernard
The most common commute times in East Bernard are 45 to 59 minutes (125 commuters, 26.8%) for males and 20 to 24 minutes (83 commuters, 24.8%) for females.
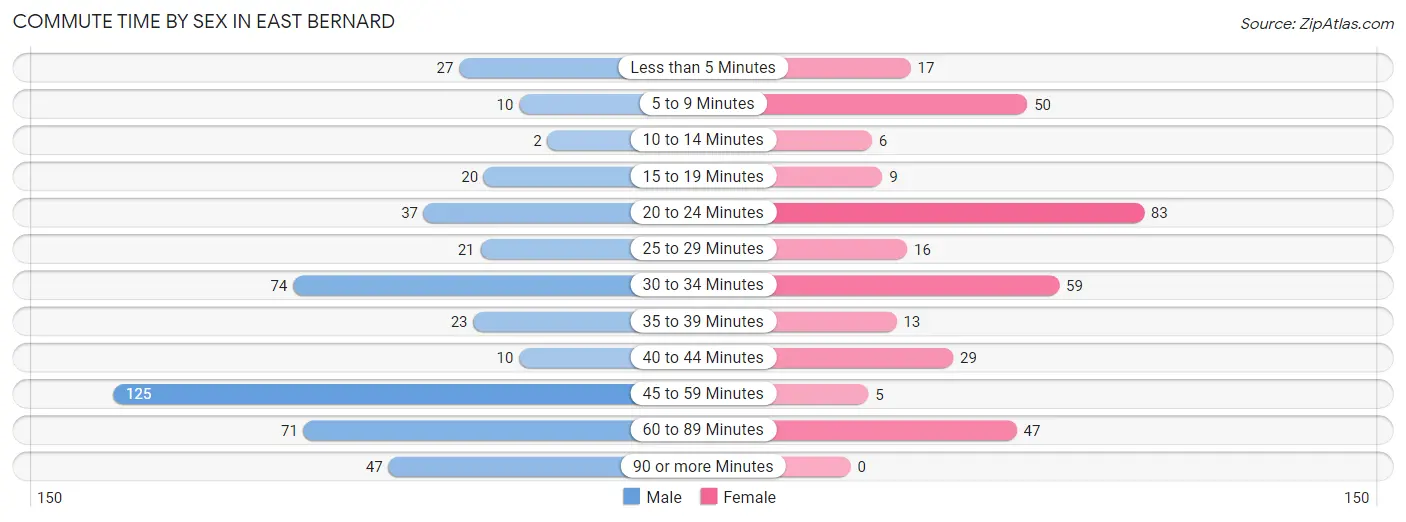
| Commute Time | Male | Female |
| Less than 5 Minutes | 27 (5.8%) | 17 (5.1%) |
| 5 to 9 Minutes | 10 (2.1%) | 50 (15.0%) |
| 10 to 14 Minutes | 2 (0.4%) | 6 (1.8%) |
| 15 to 19 Minutes | 20 (4.3%) | 9 (2.7%) |
| 20 to 24 Minutes | 37 (7.9%) | 83 (24.8%) |
| 25 to 29 Minutes | 21 (4.5%) | 16 (4.8%) |
| 30 to 34 Minutes | 74 (15.9%) | 59 (17.7%) |
| 35 to 39 Minutes | 23 (4.9%) | 13 (3.9%) |
| 40 to 44 Minutes | 10 (2.1%) | 29 (8.7%) |
| 45 to 59 Minutes | 125 (26.8%) | 5 (1.5%) |
| 60 to 89 Minutes | 71 (15.2%) | 47 (14.1%) |
| 90 or more Minutes | 47 (10.1%) | 0 (0.0%) |
Time of Departure to Work by Sex in East Bernard
The most frequent times of departure to work in East Bernard are 7:00 AM to 7:29 AM (140, 30.0%) for males and 7:00 AM to 7:29 AM (99, 29.6%) for females.
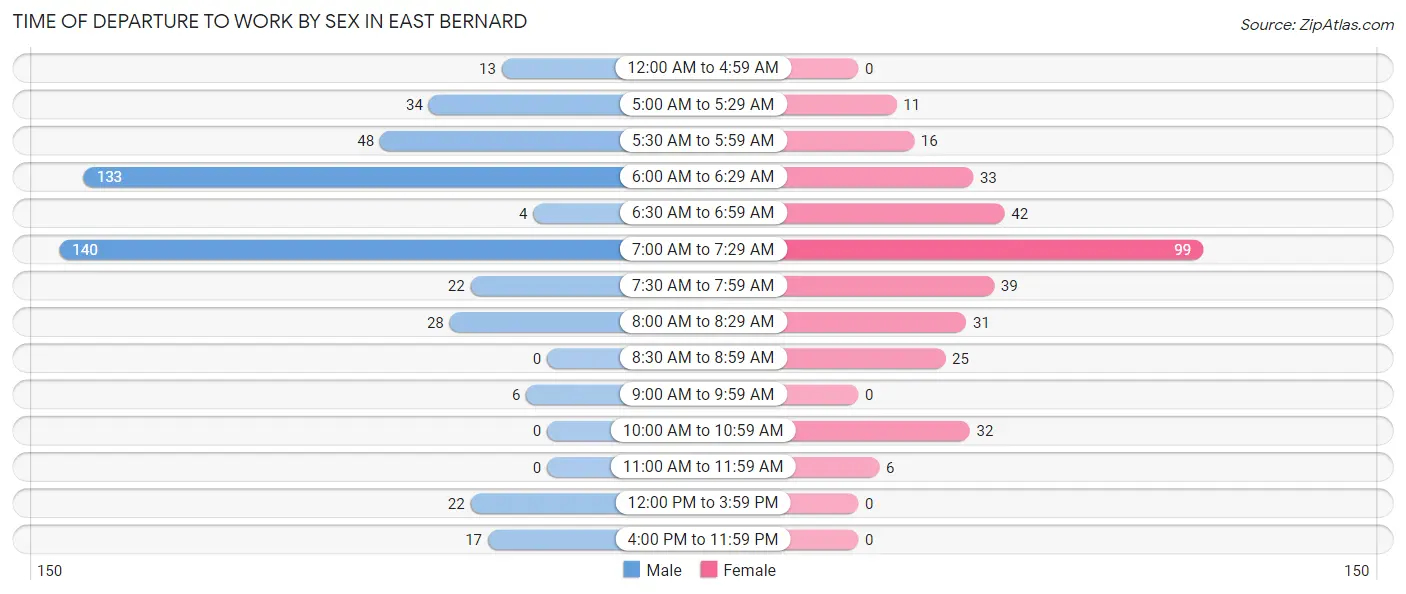
| Time of Departure | Male | Female |
| 12:00 AM to 4:59 AM | 13 (2.8%) | 0 (0.0%) |
| 5:00 AM to 5:29 AM | 34 (7.3%) | 11 (3.3%) |
| 5:30 AM to 5:59 AM | 48 (10.3%) | 16 (4.8%) |
| 6:00 AM to 6:29 AM | 133 (28.5%) | 33 (9.9%) |
| 6:30 AM to 6:59 AM | 4 (0.9%) | 42 (12.6%) |
| 7:00 AM to 7:29 AM | 140 (30.0%) | 99 (29.6%) |
| 7:30 AM to 7:59 AM | 22 (4.7%) | 39 (11.7%) |
| 8:00 AM to 8:29 AM | 28 (6.0%) | 31 (9.3%) |
| 8:30 AM to 8:59 AM | 0 (0.0%) | 25 (7.5%) |
| 9:00 AM to 9:59 AM | 6 (1.3%) | 0 (0.0%) |
| 10:00 AM to 10:59 AM | 0 (0.0%) | 32 (9.6%) |
| 11:00 AM to 11:59 AM | 0 (0.0%) | 6 (1.8%) |
| 12:00 PM to 3:59 PM | 22 (4.7%) | 0 (0.0%) |
| 4:00 PM to 11:59 PM | 17 (3.6%) | 0 (0.0%) |
| Total | 467 (100.0%) | 334 (100.0%) |
Housing Occupancy in East Bernard
Occupancy by Ownership in East Bernard
Of the total 780 dwellings in East Bernard, owner-occupied units account for 650 (83.3%), while renter-occupied units make up 130 (16.7%).
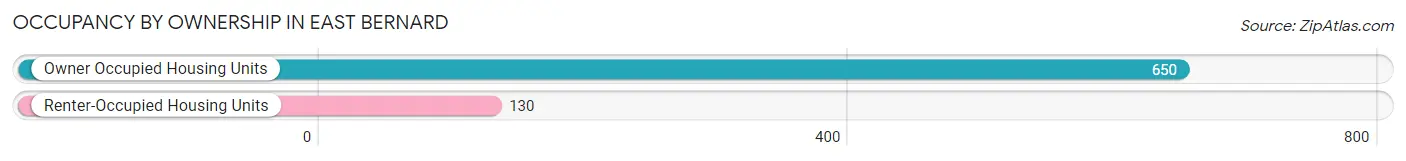
| Occupancy | # Housing Units | % Housing Units |
| Owner Occupied Housing Units | 650 | 83.3% |
| Renter-Occupied Housing Units | 130 | 16.7% |
| Total Occupied Housing Units | 780 | 100.0% |
Occupancy by Household Size in East Bernard
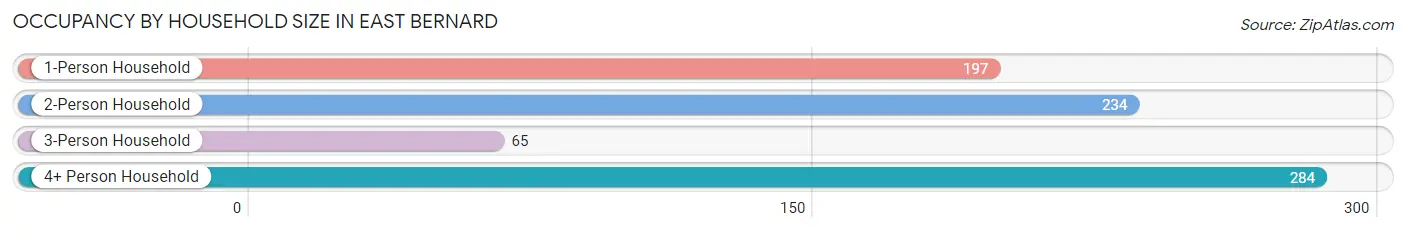
| Household Size | # Housing Units | % Housing Units |
| 1-Person Household | 197 | 25.3% |
| 2-Person Household | 234 | 30.0% |
| 3-Person Household | 65 | 8.3% |
| 4+ Person Household | 284 | 36.4% |
| Total Housing Units | 780 | 100.0% |
Occupancy by Ownership by Household Size in East Bernard
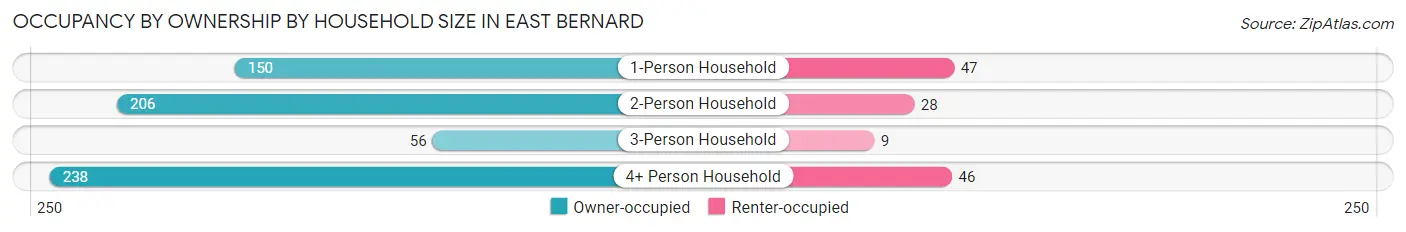
| Household Size | Owner-occupied | Renter-occupied |
| 1-Person Household | 150 (76.1%) | 47 (23.9%) |
| 2-Person Household | 206 (88.0%) | 28 (12.0%) |
| 3-Person Household | 56 (86.2%) | 9 (13.9%) |
| 4+ Person Household | 238 (83.8%) | 46 (16.2%) |
| Total Housing Units | 650 (83.3%) | 130 (16.7%) |
Occupancy by Educational Attainment in East Bernard
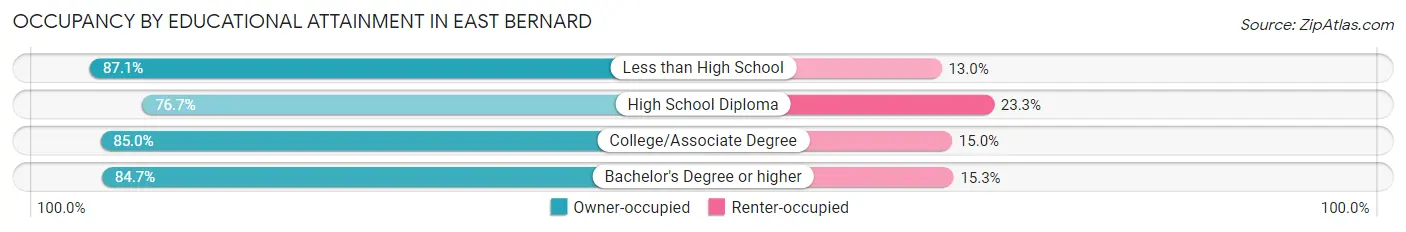
| Household Size | Owner-occupied | Renter-occupied |
| Less than High School | 121 (87.1%) | 18 (13.0%) |
| High School Diploma | 138 (76.7%) | 42 (23.3%) |
| College/Associate Degree | 181 (85.0%) | 32 (15.0%) |
| Bachelor's Degree or higher | 210 (84.7%) | 38 (15.3%) |
Occupancy by Age of Householder in East Bernard
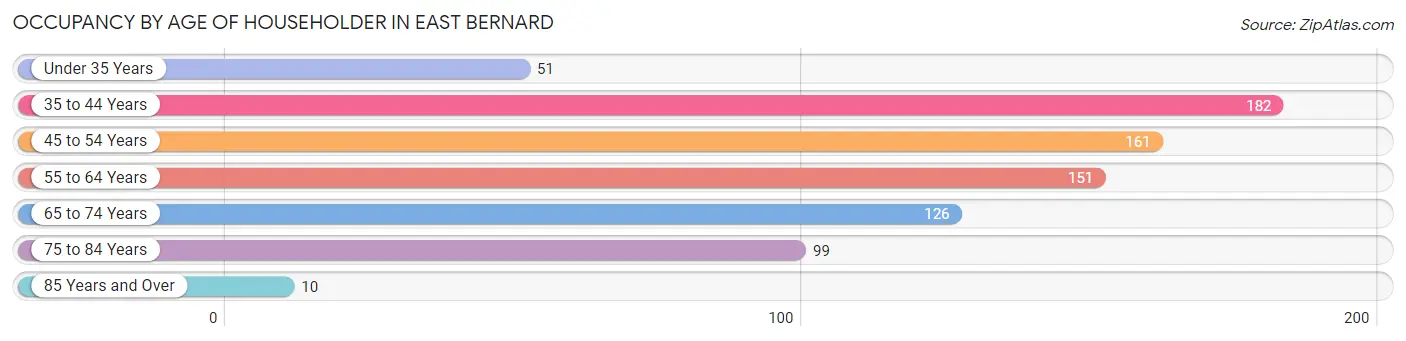
| Age Bracket | # Households | % Households |
| Under 35 Years | 51 | 6.5% |
| 35 to 44 Years | 182 | 23.3% |
| 45 to 54 Years | 161 | 20.6% |
| 55 to 64 Years | 151 | 19.4% |
| 65 to 74 Years | 126 | 16.2% |
| 75 to 84 Years | 99 | 12.7% |
| 85 Years and Over | 10 | 1.3% |
| Total | 780 | 100.0% |
Housing Finances in East Bernard
Median Income by Occupancy in East Bernard
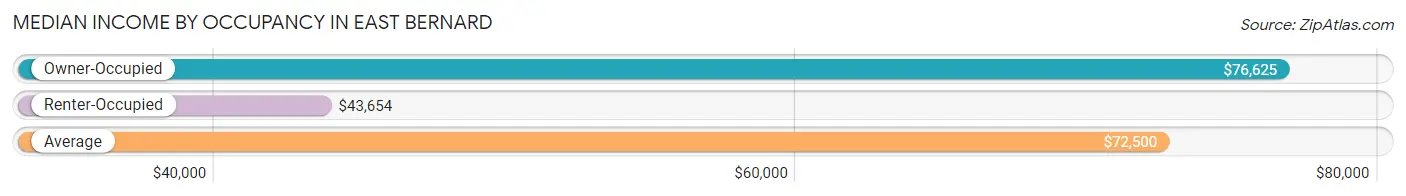
| Occupancy Type | # Households | Median Income |
| Owner-Occupied | 650 (83.3%) | $76,625 |
| Renter-Occupied | 130 (16.7%) | $43,654 |
| Average | 780 (100.0%) | $72,500 |
Occupancy by Householder Income Bracket in East Bernard
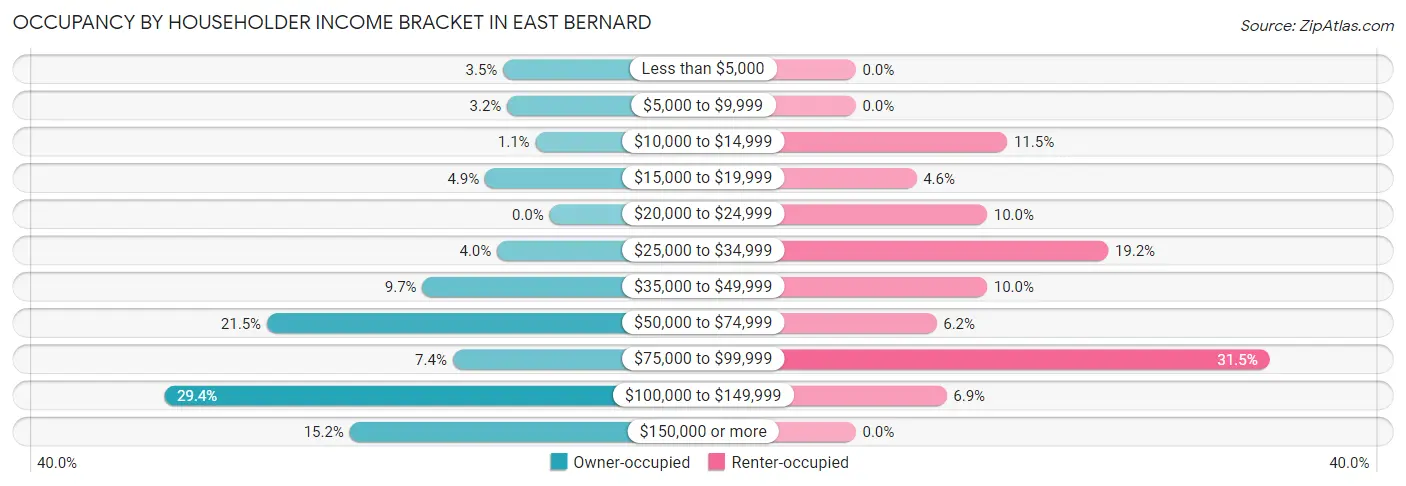
| Income Bracket | Owner-occupied | Renter-occupied |
| Less than $5,000 | 23 (3.5%) | 0 (0.0%) |
| $5,000 to $9,999 | 21 (3.2%) | 0 (0.0%) |
| $10,000 to $14,999 | 7 (1.1%) | 15 (11.5%) |
| $15,000 to $19,999 | 32 (4.9%) | 6 (4.6%) |
| $20,000 to $24,999 | 0 (0.0%) | 13 (10.0%) |
| $25,000 to $34,999 | 26 (4.0%) | 25 (19.2%) |
| $35,000 to $49,999 | 63 (9.7%) | 13 (10.0%) |
| $50,000 to $74,999 | 140 (21.5%) | 8 (6.1%) |
| $75,000 to $99,999 | 48 (7.4%) | 41 (31.5%) |
| $100,000 to $149,999 | 191 (29.4%) | 9 (6.9%) |
| $150,000 or more | 99 (15.2%) | 0 (0.0%) |
| Total | 650 (100.0%) | 130 (100.0%) |
Monthly Housing Cost Tiers in East Bernard
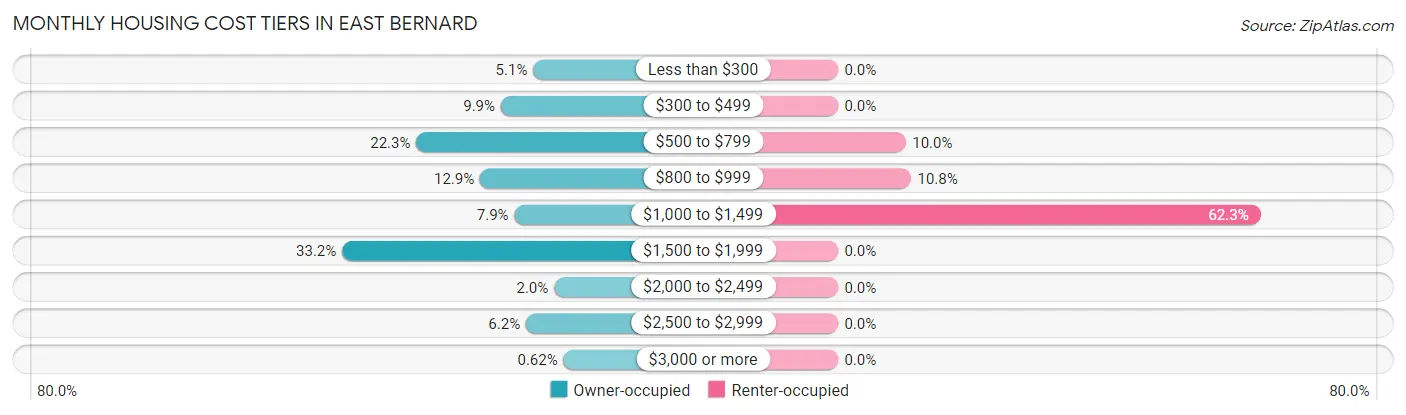
| Monthly Cost | Owner-occupied | Renter-occupied |
| Less than $300 | 33 (5.1%) | 0 (0.0%) |
| $300 to $499 | 64 (9.9%) | 0 (0.0%) |
| $500 to $799 | 145 (22.3%) | 13 (10.0%) |
| $800 to $999 | 84 (12.9%) | 14 (10.8%) |
| $1,000 to $1,499 | 51 (7.9%) | 81 (62.3%) |
| $1,500 to $1,999 | 216 (33.2%) | 0 (0.0%) |
| $2,000 to $2,499 | 13 (2.0%) | 0 (0.0%) |
| $2,500 to $2,999 | 40 (6.1%) | 0 (0.0%) |
| $3,000 or more | 4 (0.6%) | 0 (0.0%) |
| Total | 650 (100.0%) | 130 (100.0%) |
Physical Housing Characteristics in East Bernard
Housing Structures in East Bernard
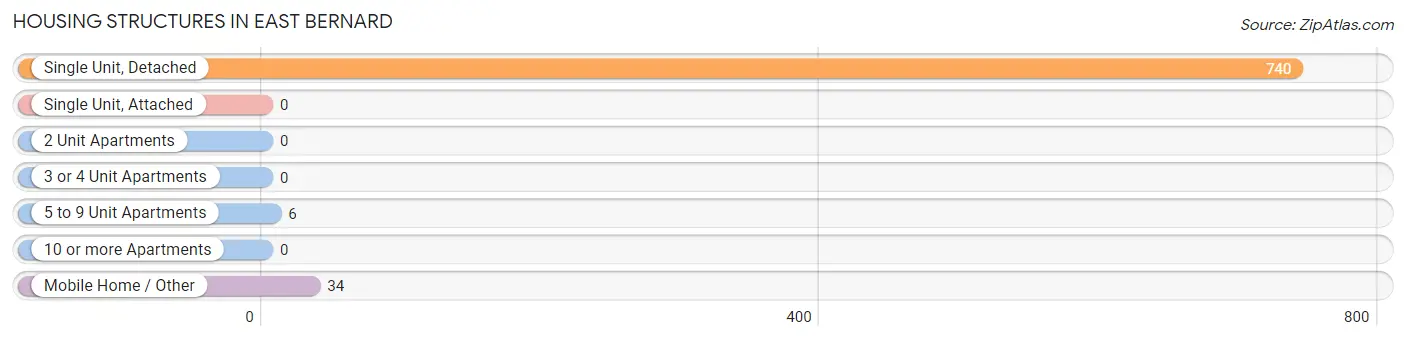
| Structure Type | # Housing Units | % Housing Units |
| Single Unit, Detached | 740 | 94.9% |
| Single Unit, Attached | 0 | 0.0% |
| 2 Unit Apartments | 0 | 0.0% |
| 3 or 4 Unit Apartments | 0 | 0.0% |
| 5 to 9 Unit Apartments | 6 | 0.8% |
| 10 or more Apartments | 0 | 0.0% |
| Mobile Home / Other | 34 | 4.4% |
| Total | 780 | 100.0% |
Housing Structures by Occupancy in East Bernard
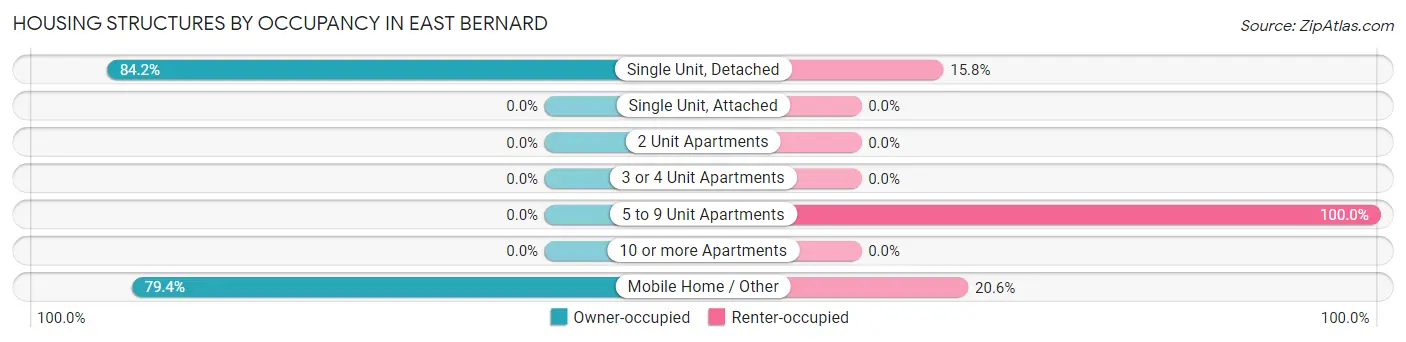
| Structure Type | Owner-occupied | Renter-occupied |
| Single Unit, Detached | 623 (84.2%) | 117 (15.8%) |
| Single Unit, Attached | 0 (0.0%) | 0 (0.0%) |
| 2 Unit Apartments | 0 (0.0%) | 0 (0.0%) |
| 3 or 4 Unit Apartments | 0 (0.0%) | 0 (0.0%) |
| 5 to 9 Unit Apartments | 0 (0.0%) | 6 (100.0%) |
| 10 or more Apartments | 0 (0.0%) | 0 (0.0%) |
| Mobile Home / Other | 27 (79.4%) | 7 (20.6%) |
| Total | 650 (83.3%) | 130 (16.7%) |
Housing Structures by Number of Rooms in East Bernard
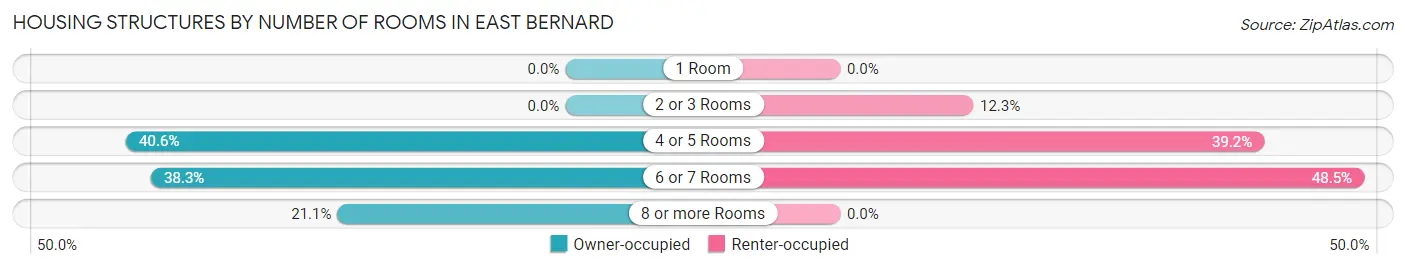
| Number of Rooms | Owner-occupied | Renter-occupied |
| 1 Room | 0 (0.0%) | 0 (0.0%) |
| 2 or 3 Rooms | 0 (0.0%) | 16 (12.3%) |
| 4 or 5 Rooms | 264 (40.6%) | 51 (39.2%) |
| 6 or 7 Rooms | 249 (38.3%) | 63 (48.5%) |
| 8 or more Rooms | 137 (21.1%) | 0 (0.0%) |
| Total | 650 (100.0%) | 130 (100.0%) |
Housing Structure by Heating Type in East Bernard
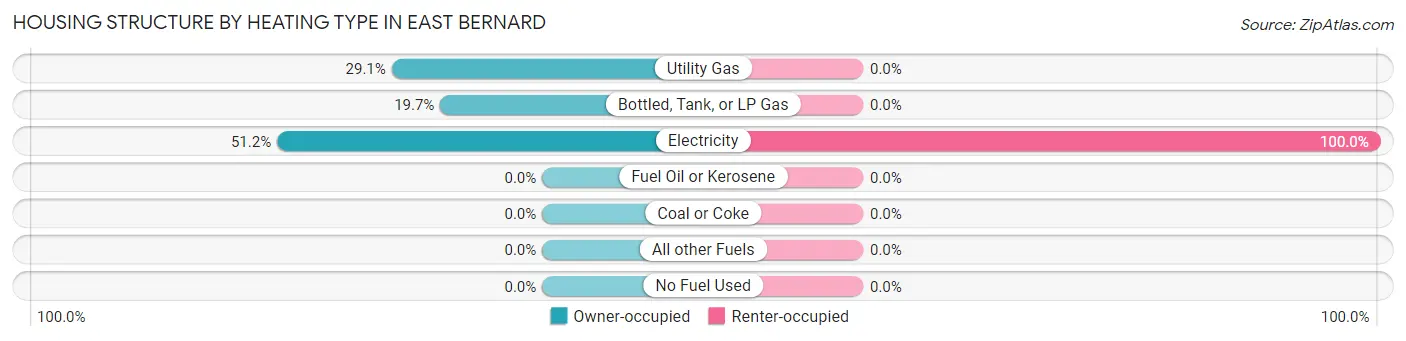
| Heating Type | Owner-occupied | Renter-occupied |
| Utility Gas | 189 (29.1%) | 0 (0.0%) |
| Bottled, Tank, or LP Gas | 128 (19.7%) | 0 (0.0%) |
| Electricity | 333 (51.2%) | 130 (100.0%) |
| Fuel Oil or Kerosene | 0 (0.0%) | 0 (0.0%) |
| Coal or Coke | 0 (0.0%) | 0 (0.0%) |
| All other Fuels | 0 (0.0%) | 0 (0.0%) |
| No Fuel Used | 0 (0.0%) | 0 (0.0%) |
| Total | 650 (100.0%) | 130 (100.0%) |
Household Vehicle Usage in East Bernard
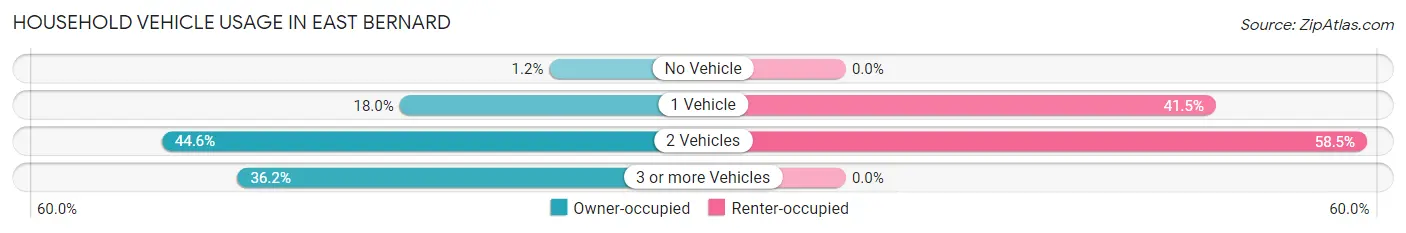
| Vehicles per Household | Owner-occupied | Renter-occupied |
| No Vehicle | 8 (1.2%) | 0 (0.0%) |
| 1 Vehicle | 117 (18.0%) | 54 (41.5%) |
| 2 Vehicles | 290 (44.6%) | 76 (58.5%) |
| 3 or more Vehicles | 235 (36.1%) | 0 (0.0%) |
| Total | 650 (100.0%) | 130 (100.0%) |
Real Estate & Mortgages in East Bernard
Real Estate and Mortgage Overview in East Bernard
| Characteristic | Without Mortgage | With Mortgage |
| Housing Units | 268 | 382 |
| Median Property Value | $227,000 | $221,500 |
| Median Household Income | $64,022 | $67 |
| Monthly Housing Costs | $560 | $4 |
| Real Estate Taxes | $3,322 | $0 |
Property Value by Mortgage Status in East Bernard
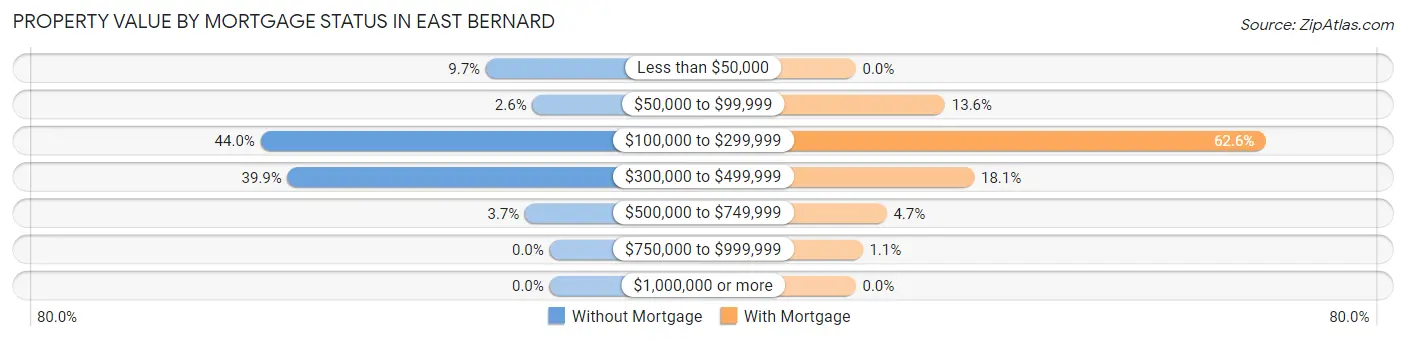
| Property Value | Without Mortgage | With Mortgage |
| Less than $50,000 | 26 (9.7%) | 0 (0.0%) |
| $50,000 to $99,999 | 7 (2.6%) | 52 (13.6%) |
| $100,000 to $299,999 | 118 (44.0%) | 239 (62.6%) |
| $300,000 to $499,999 | 107 (39.9%) | 69 (18.1%) |
| $500,000 to $749,999 | 10 (3.7%) | 18 (4.7%) |
| $750,000 to $999,999 | 0 (0.0%) | 4 (1.1%) |
| $1,000,000 or more | 0 (0.0%) | 0 (0.0%) |
| Total | 268 (100.0%) | 382 (100.0%) |
Household Income by Mortgage Status in East Bernard
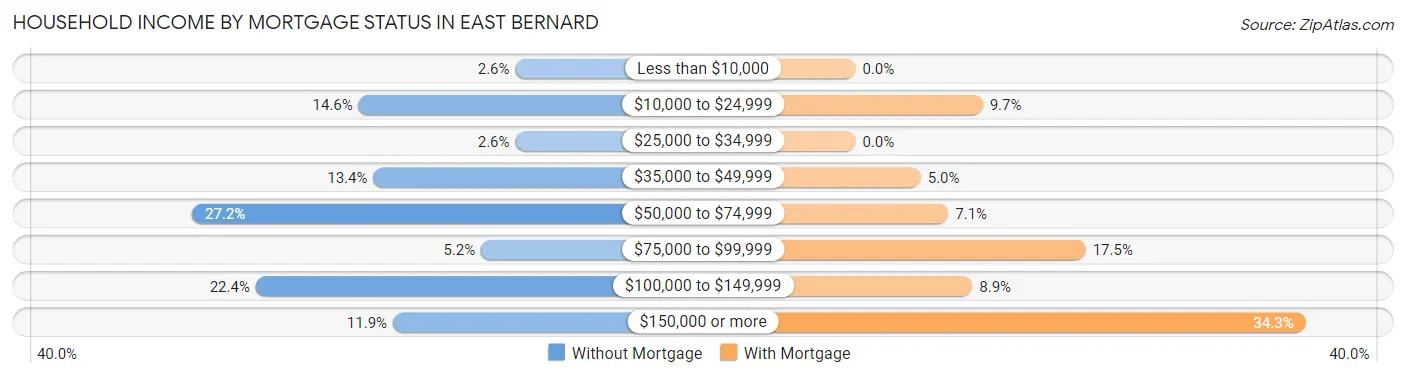
| Household Income | Without Mortgage | With Mortgage |
| Less than $10,000 | 7 (2.6%) | 0 (0.0%) |
| $10,000 to $24,999 | 39 (14.5%) | 37 (9.7%) |
| $25,000 to $34,999 | 7 (2.6%) | 0 (0.0%) |
| $35,000 to $49,999 | 36 (13.4%) | 19 (5.0%) |
| $50,000 to $74,999 | 73 (27.2%) | 27 (7.1%) |
| $75,000 to $99,999 | 14 (5.2%) | 67 (17.5%) |
| $100,000 to $149,999 | 60 (22.4%) | 34 (8.9%) |
| $150,000 or more | 32 (11.9%) | 131 (34.3%) |
| Total | 268 (100.0%) | 382 (100.0%) |
Property Value to Household Income Ratio in East Bernard
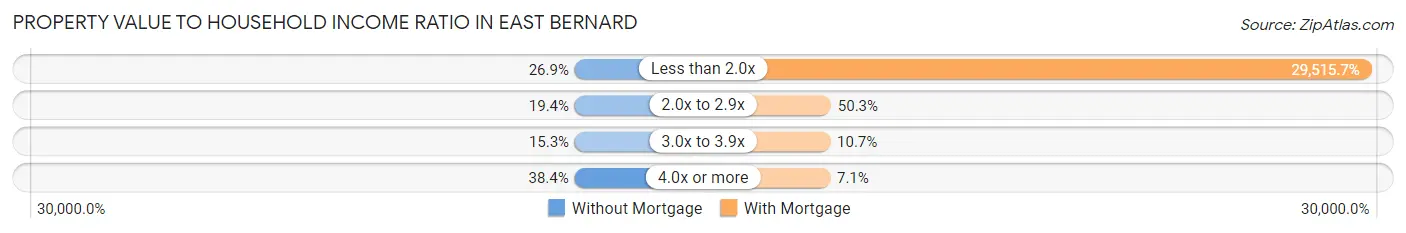
| Value-to-Income Ratio | Without Mortgage | With Mortgage |
| Less than 2.0x | 72 (26.9%) | 112,750 (29,515.7%) |
| 2.0x to 2.9x | 52 (19.4%) | 192 (50.3%) |
| 3.0x to 3.9x | 41 (15.3%) | 41 (10.7%) |
| 4.0x or more | 103 (38.4%) | 27 (7.1%) |
| Total | 268 (100.0%) | 382 (100.0%) |
Real Estate Taxes by Mortgage Status in East Bernard
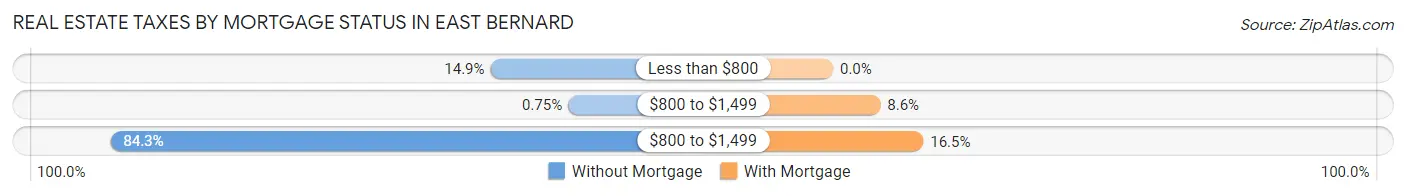
| Property Taxes | Without Mortgage | With Mortgage |
| Less than $800 | 40 (14.9%) | 0 (0.0%) |
| $800 to $1,499 | 2 (0.7%) | 33 (8.6%) |
| $800 to $1,499 | 226 (84.3%) | 63 (16.5%) |
| Total | 268 (100.0%) | 382 (100.0%) |
Health & Disability in East Bernard
Health Insurance Coverage by Age in East Bernard
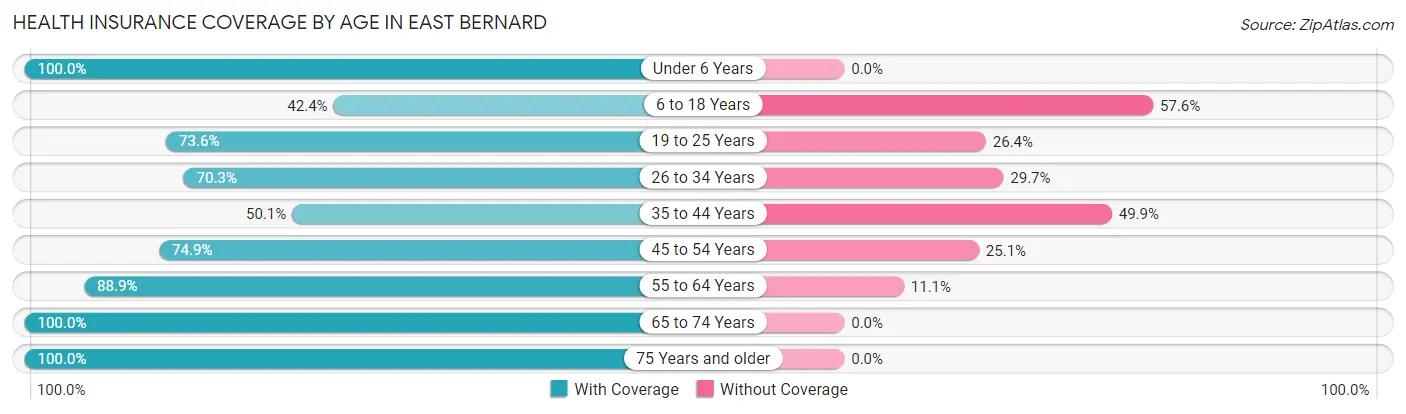
| Age Bracket | With Coverage | Without Coverage |
| Under 6 Years | 158 (100.0%) | 0 (0.0%) |
| 6 to 18 Years | 218 (42.4%) | 296 (57.6%) |
| 19 to 25 Years | 92 (73.6%) | 33 (26.4%) |
| 26 to 34 Years | 102 (70.3%) | 43 (29.7%) |
| 35 to 44 Years | 202 (50.1%) | 201 (49.9%) |
| 45 to 54 Years | 197 (74.9%) | 66 (25.1%) |
| 55 to 64 Years | 232 (88.9%) | 29 (11.1%) |
| 65 to 74 Years | 203 (100.0%) | 0 (0.0%) |
| 75 Years and older | 146 (100.0%) | 0 (0.0%) |
| Total | 1,550 (69.9%) | 668 (30.1%) |
Health Insurance Coverage by Citizenship Status in East Bernard
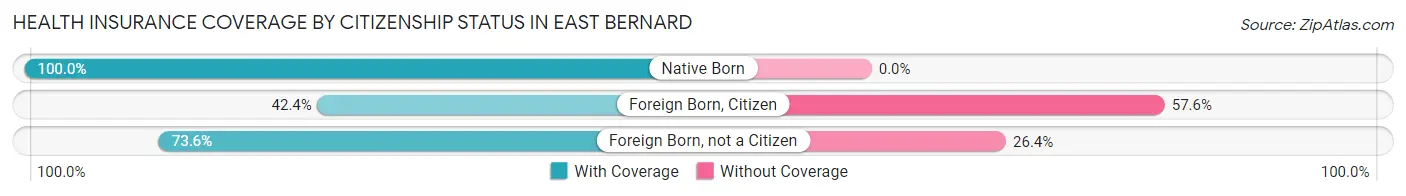
| Citizenship Status | With Coverage | Without Coverage |
| Native Born | 158 (100.0%) | 0 (0.0%) |
| Foreign Born, Citizen | 218 (42.4%) | 296 (57.6%) |
| Foreign Born, not a Citizen | 92 (73.6%) | 33 (26.4%) |
Health Insurance Coverage by Household Income in East Bernard
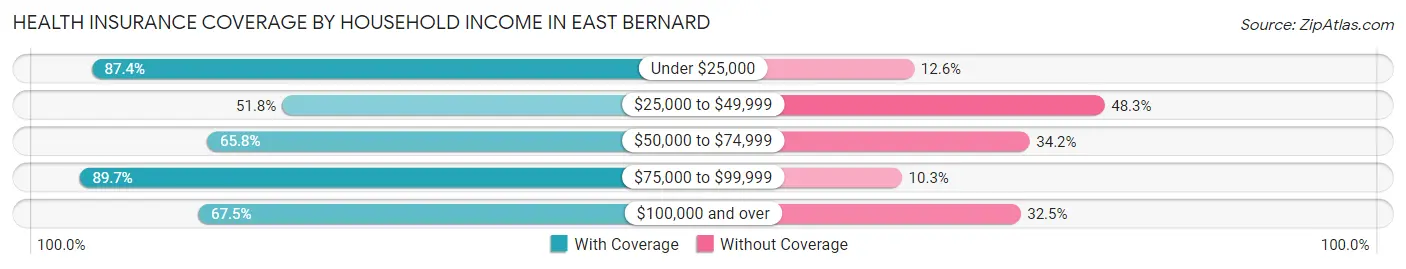
| Household Income | With Coverage | Without Coverage |
| Under $25,000 | 146 (87.4%) | 21 (12.6%) |
| $25,000 to $49,999 | 177 (51.7%) | 165 (48.2%) |
| $50,000 to $74,999 | 254 (65.8%) | 132 (34.2%) |
| $75,000 to $99,999 | 323 (89.7%) | 37 (10.3%) |
| $100,000 and over | 650 (67.5%) | 313 (32.5%) |
Public vs Private Health Insurance Coverage by Age in East Bernard
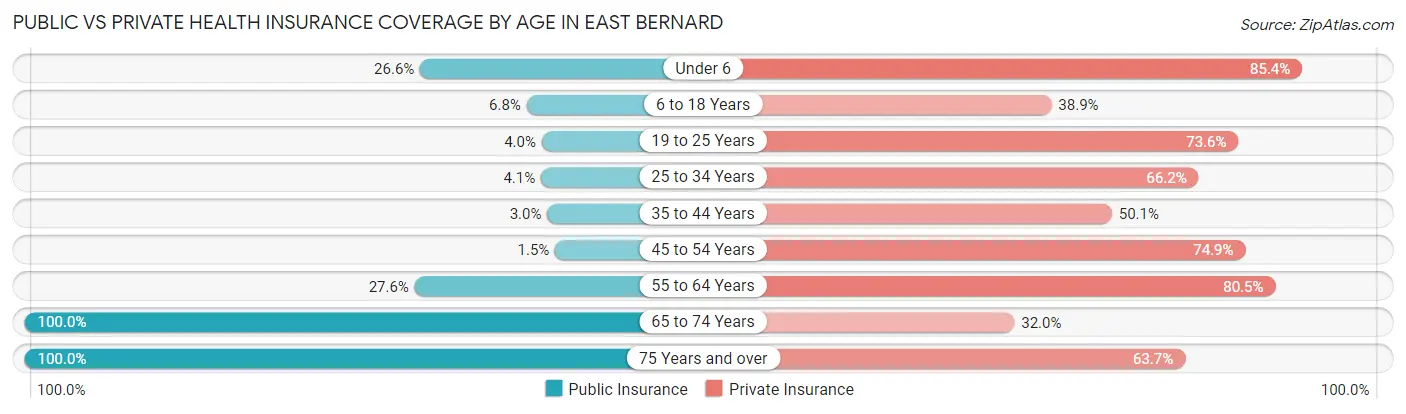
| Age Bracket | Public Insurance | Private Insurance |
| Under 6 | 42 (26.6%) | 135 (85.4%) |
| 6 to 18 Years | 35 (6.8%) | 200 (38.9%) |
| 19 to 25 Years | 5 (4.0%) | 92 (73.6%) |
| 25 to 34 Years | 6 (4.1%) | 96 (66.2%) |
| 35 to 44 Years | 12 (3.0%) | 202 (50.1%) |
| 45 to 54 Years | 4 (1.5%) | 197 (74.9%) |
| 55 to 64 Years | 72 (27.6%) | 210 (80.5%) |
| 65 to 74 Years | 203 (100.0%) | 65 (32.0%) |
| 75 Years and over | 146 (100.0%) | 93 (63.7%) |
| Total | 525 (23.7%) | 1,290 (58.2%) |
Disability Status by Sex by Age in East Bernard
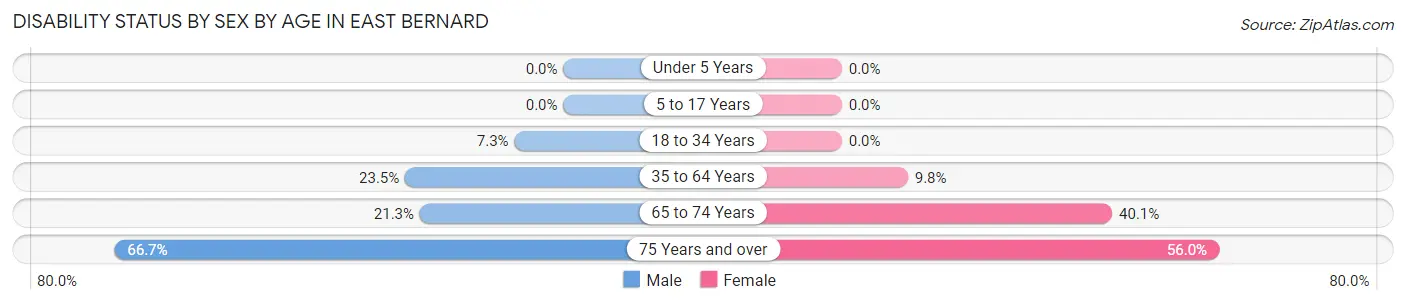
| Age Bracket | Male | Female |
| Under 5 Years | 0 (0.0%) | 0 (0.0%) |
| 5 to 17 Years | 0 (0.0%) | 0 (0.0%) |
| 18 to 34 Years | 13 (7.3%) | 0 (0.0%) |
| 35 to 64 Years | 110 (23.5%) | 45 (9.8%) |
| 65 to 74 Years | 13 (21.3%) | 57 (40.1%) |
| 75 Years and over | 14 (66.7%) | 70 (56.0%) |
Disability Class by Sex by Age in East Bernard
Disability Class: Hearing Difficulty
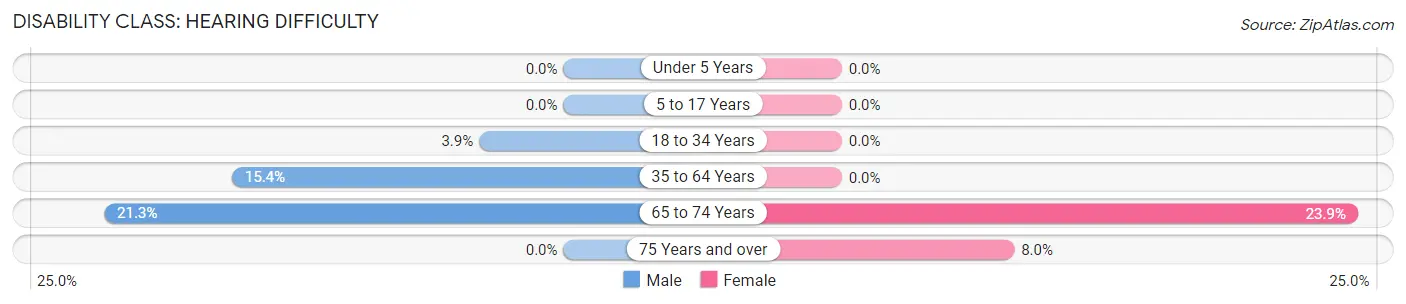
| Age Bracket | Male | Female |
| Under 5 Years | 0 (0.0%) | 0 (0.0%) |
| 5 to 17 Years | 0 (0.0%) | 0 (0.0%) |
| 18 to 34 Years | 7 (3.9%) | 0 (0.0%) |
| 35 to 64 Years | 72 (15.4%) | 0 (0.0%) |
| 65 to 74 Years | 13 (21.3%) | 34 (23.9%) |
| 75 Years and over | 0 (0.0%) | 10 (8.0%) |
Disability Class: Vision Difficulty
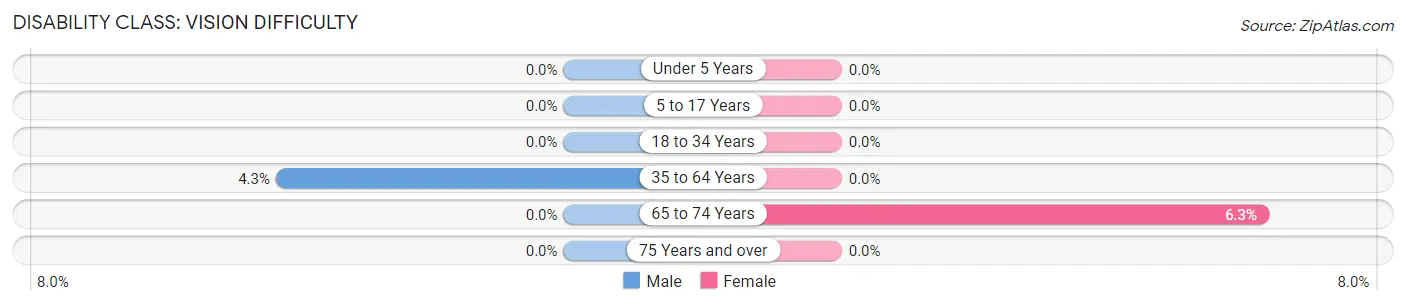
| Age Bracket | Male | Female |
| Under 5 Years | 0 (0.0%) | 0 (0.0%) |
| 5 to 17 Years | 0 (0.0%) | 0 (0.0%) |
| 18 to 34 Years | 0 (0.0%) | 0 (0.0%) |
| 35 to 64 Years | 20 (4.3%) | 0 (0.0%) |
| 65 to 74 Years | 0 (0.0%) | 9 (6.3%) |
| 75 Years and over | 0 (0.0%) | 0 (0.0%) |
Disability Class: Cognitive Difficulty
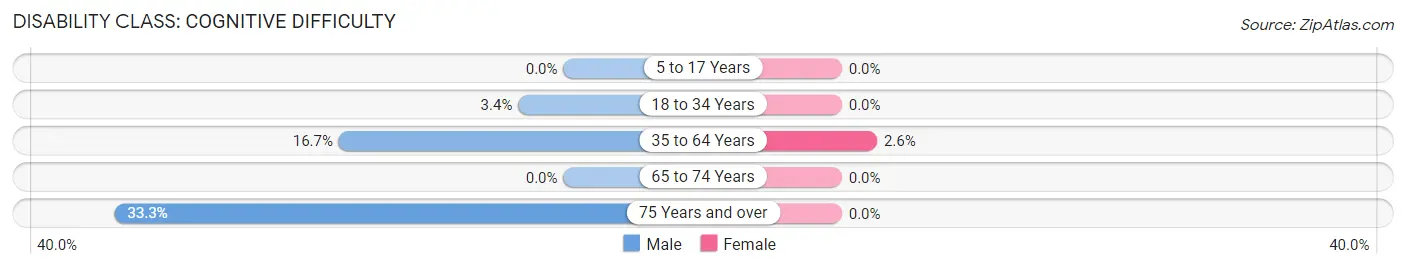
| Age Bracket | Male | Female |
| 5 to 17 Years | 0 (0.0%) | 0 (0.0%) |
| 18 to 34 Years | 6 (3.4%) | 0 (0.0%) |
| 35 to 64 Years | 78 (16.7%) | 12 (2.6%) |
| 65 to 74 Years | 0 (0.0%) | 0 (0.0%) |
| 75 Years and over | 7 (33.3%) | 0 (0.0%) |
Disability Class: Ambulatory Difficulty
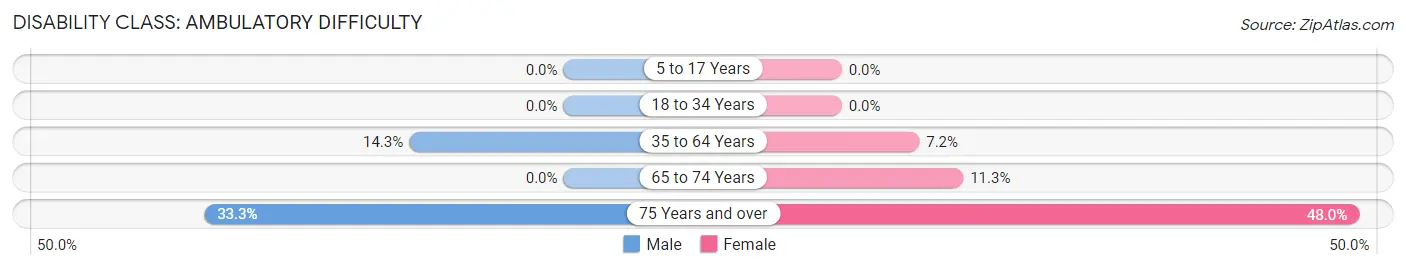
| Age Bracket | Male | Female |
| 5 to 17 Years | 0 (0.0%) | 0 (0.0%) |
| 18 to 34 Years | 0 (0.0%) | 0 (0.0%) |
| 35 to 64 Years | 67 (14.3%) | 33 (7.2%) |
| 65 to 74 Years | 0 (0.0%) | 16 (11.3%) |
| 75 Years and over | 7 (33.3%) | 60 (48.0%) |
Disability Class: Self-Care Difficulty
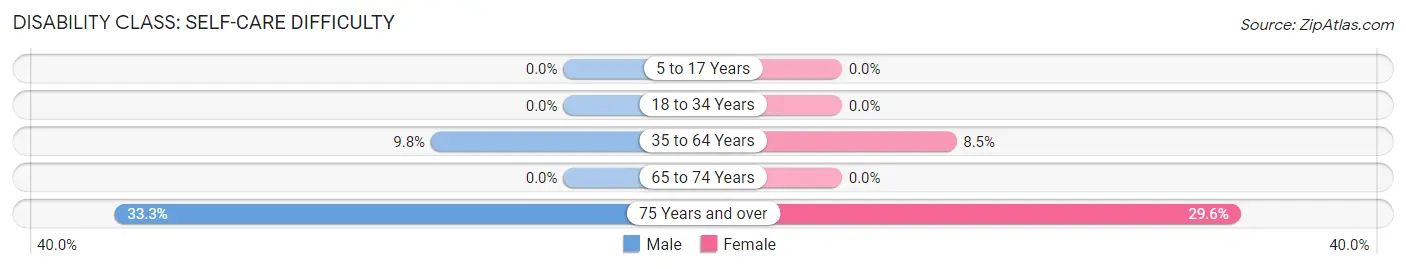
| Age Bracket | Male | Female |
| 5 to 17 Years | 0 (0.0%) | 0 (0.0%) |
| 18 to 34 Years | 0 (0.0%) | 0 (0.0%) |
| 35 to 64 Years | 46 (9.8%) | 39 (8.5%) |
| 65 to 74 Years | 0 (0.0%) | 0 (0.0%) |
| 75 Years and over | 7 (33.3%) | 37 (29.6%) |
Technology Access in East Bernard
Computing Device Access in East Bernard
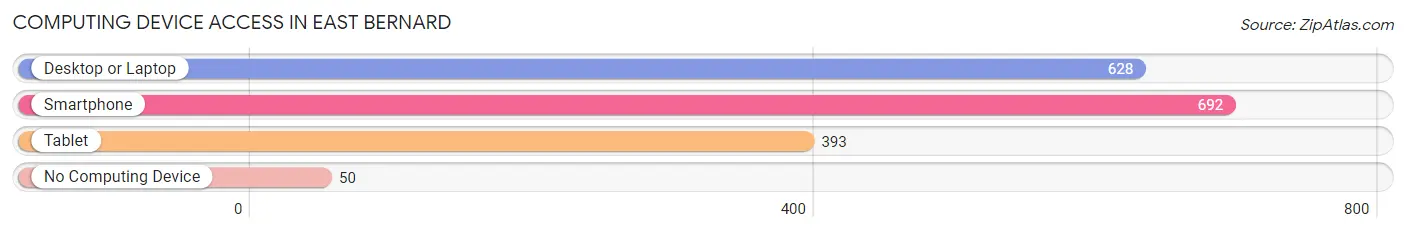
| Device Type | # Households | % Households |
| Desktop or Laptop | 628 | 80.5% |
| Smartphone | 692 | 88.7% |
| Tablet | 393 | 50.4% |
| No Computing Device | 50 | 6.4% |
| Total | 780 | 100.0% |
Internet Access in East Bernard
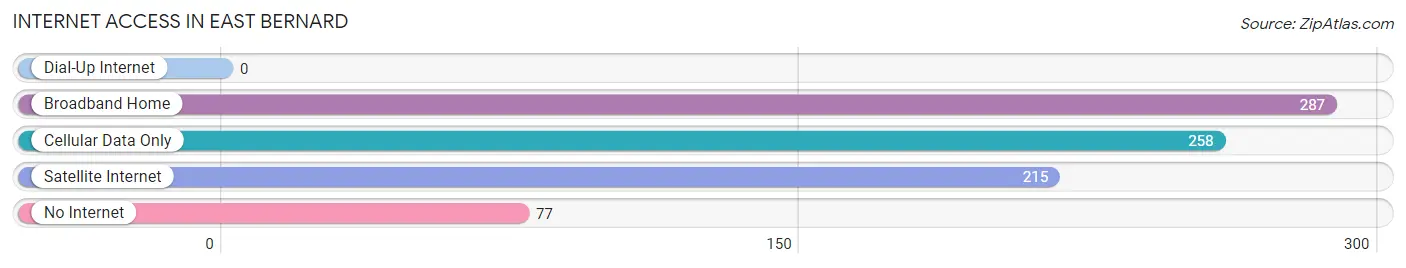
| Internet Type | # Households | % Households |
| Dial-Up Internet | 0 | 0.0% |
| Broadband Home | 287 | 36.8% |
| Cellular Data Only | 258 | 33.1% |
| Satellite Internet | 215 | 27.6% |
| No Internet | 77 | 9.9% |
| Total | 780 | 100.0% |
East Bernard Summary
Bernard, Texas is a small town located in Wharton County, Texas. It is situated on the banks of the San Bernard River, approximately 40 miles southwest of Houston. The town was founded in 1854 and is named after the river. The population of Bernard was 1,093 at the 2010 census.
History
The area around Bernard was first settled in the early 1800s by German immigrants. The town was founded in 1854 and named after the San Bernard River. The town was originally known as San Bernard, but the name was changed to East Bernard in 1891 to distinguish it from the nearby town of West Bernard.
The town was a major center for cotton production in the late 19th and early 20th centuries. The town was also home to a number of businesses, including a cotton gin, a grist mill, a sawmill, and a blacksmith shop.
In the early 20th century, the town was home to a number of churches, including the First Baptist Church, the First Methodist Church, and the First Presbyterian Church. The town also had a school, a post office, and a number of stores.
Geography
East Bernard is located at 29°41'25" North, 96°2'25" West (29.690278, -96.040278). The town is situated on the banks of the San Bernard River, approximately 40 miles southwest of Houston. The town is located in the Gulf Coastal Plains region of Texas.
The climate in East Bernard is humid subtropical, with hot summers and mild winters. The average annual temperature is 68°F (20°C). The average annual precipitation is 44 inches (112 cm).
Economy
The economy of East Bernard is largely based on agriculture. The town is home to a number of farms, including cotton, corn, and soybean farms. The town is also home to a number of businesses, including a feed store, a hardware store, and a lumber yard.
Demographics
As of the 2010 census, the population of East Bernard was 1,093. The racial makeup of the town was 79.3% White, 16.2% Hispanic or Latino, 1.2% African American, 0.7% Native American, 0.3% Asian, and 2.5% from other races.
The median household income in East Bernard was $37,917, and the median family income was $45,625. The per capita income was $17,917. About 16.2% of the population was below the poverty line.
Conclusion
East Bernard is a small town located in Wharton County, Texas. It was founded in 1854 and is situated on the banks of the San Bernard River, approximately 40 miles southwest of Houston. The town has a population of 1,093 and is largely based on agriculture. The town is home to a number of businesses, including a feed store, a hardware store, and a lumber yard. The median household income in East Bernard was $37,917, and the median family income was $45,625. The per capita income was $17,917. About 16.2% of the population was below the poverty line.
Common Questions
What is Per Capita Income in East Bernard?
Per Capita income in East Bernard is $31,059.
What is the Median Family Income in East Bernard?
Median Family Income in East Bernard is $89,188.
What is the Median Household income in East Bernard?
Median Household Income in East Bernard is $72,500.
What is Income or Wage Gap in East Bernard?
Income or Wage Gap in East Bernard is 3.3%.
Women in East Bernard earn 96.7 cents for every dollar earned by a man.
What is Inequality or Gini Index in East Bernard?
Inequality or Gini Index in East Bernard is 0.41.
What is the Total Population of East Bernard?
Total Population of East Bernard is 2,218.
What is the Total Male Population of East Bernard?
Total Male Population of East Bernard is 1,061.
What is the Total Female Population of East Bernard?
Total Female Population of East Bernard is 1,157.
What is the Ratio of Males per 100 Females in East Bernard?
There are 91.70 Males per 100 Females in East Bernard.
What is the Ratio of Females per 100 Males in East Bernard?
There are 109.05 Females per 100 Males in East Bernard.
What is the Median Population Age in East Bernard?
Median Population Age in East Bernard is 40.2 Years.
What is the Average Family Size in East Bernard
Average Family Size in East Bernard is 3.4 People.
What is the Average Household Size in East Bernard
Average Household Size in East Bernard is 2.8 People.
How Large is the Labor Force in East Bernard?
There are 914 People in the Labor Forcein in East Bernard.
What is the Percentage of People in the Labor Force in East Bernard?
53.1% of People are in the Labor Force in East Bernard.
What is the Unemployment Rate in East Bernard?
Unemployment Rate in East Bernard is 9.5%.