Dublin, TX Map & Demographics
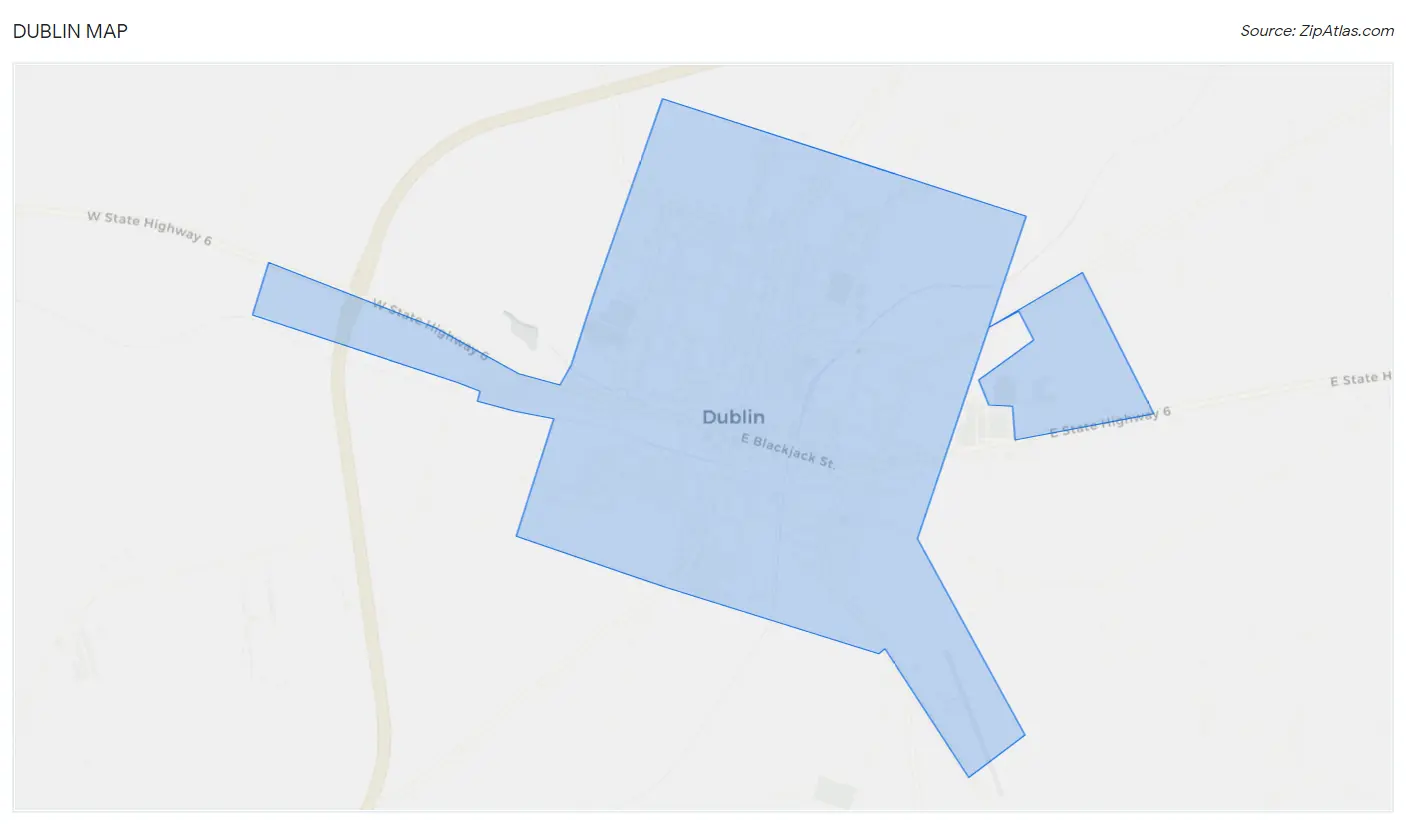
Dublin Map
Dublin Overview
$36,756
PER CAPITA INCOME
$58,031
AVG FAMILY INCOME
$52,153
AVG HOUSEHOLD INCOME
39.1%
WAGE / INCOME GAP [ % ]
60.9¢/ $1
WAGE / INCOME GAP [ $ ]
$10,562
FAMILY INCOME DEFICIT
0.65
INEQUALITY / GINI INDEX
3,397
TOTAL POPULATION
1,995
MALE POPULATION
1,402
FEMALE POPULATION
142.30
MALES / 100 FEMALES
70.28
FEMALES / 100 MALES
32.1
MEDIAN AGE
3.5
AVG FAMILY SIZE
2.9
AVG HOUSEHOLD SIZE
1,454
LABOR FORCE [ PEOPLE ]
59.8%
PERCENT IN LABOR FORCE
2.3%
UNEMPLOYMENT RATE
Dublin Zip Codes
Dublin Area Codes
Income in Dublin
Income Overview in Dublin
Per Capita Income in Dublin is $36,756, while median incomes of families and households are $58,031 and $52,153 respectively.
| Characteristic | Number | Measure |
| Per Capita Income | 3,397 | $36,756 |
| Median Family Income | 821 | $58,031 |
| Mean Family Income | 821 | $129,869 |
| Median Household Income | 1,163 | $52,153 |
| Mean Household Income | 1,163 | $104,812 |
| Income Deficit | 821 | $10,562 |
| Wage / Income Gap (%) | 3,397 | 39.07% |
| Wage / Income Gap ($) | 3,397 | 60.93¢ per $1 |
| Gini / Inequality Index | 3,397 | 0.65 |
Earnings by Sex in Dublin
Average Earnings in Dublin are $30,701, $35,322 for men and $21,523 for women, a difference of 39.1%.
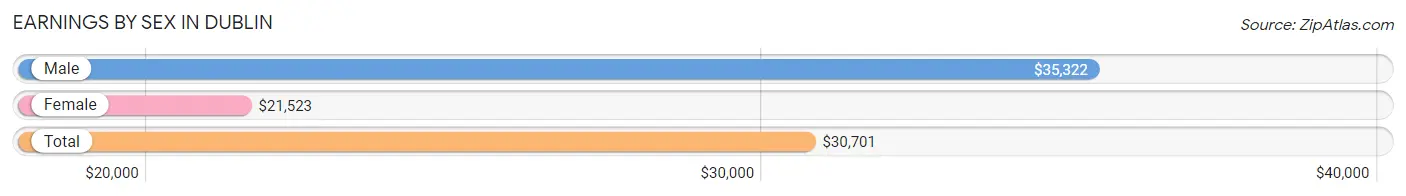
| Sex | Number | Average Earnings |
| Male | 940 (62.0%) | $35,322 |
| Female | 577 (38.0%) | $21,523 |
| Total | 1,517 (100.0%) | $30,701 |
Earnings by Sex by Income Bracket in Dublin
The most common earnings brackets in Dublin are $100,000+ for men (105 | 11.2%) and $10,000 to $12,499 for women (78 | 13.5%).
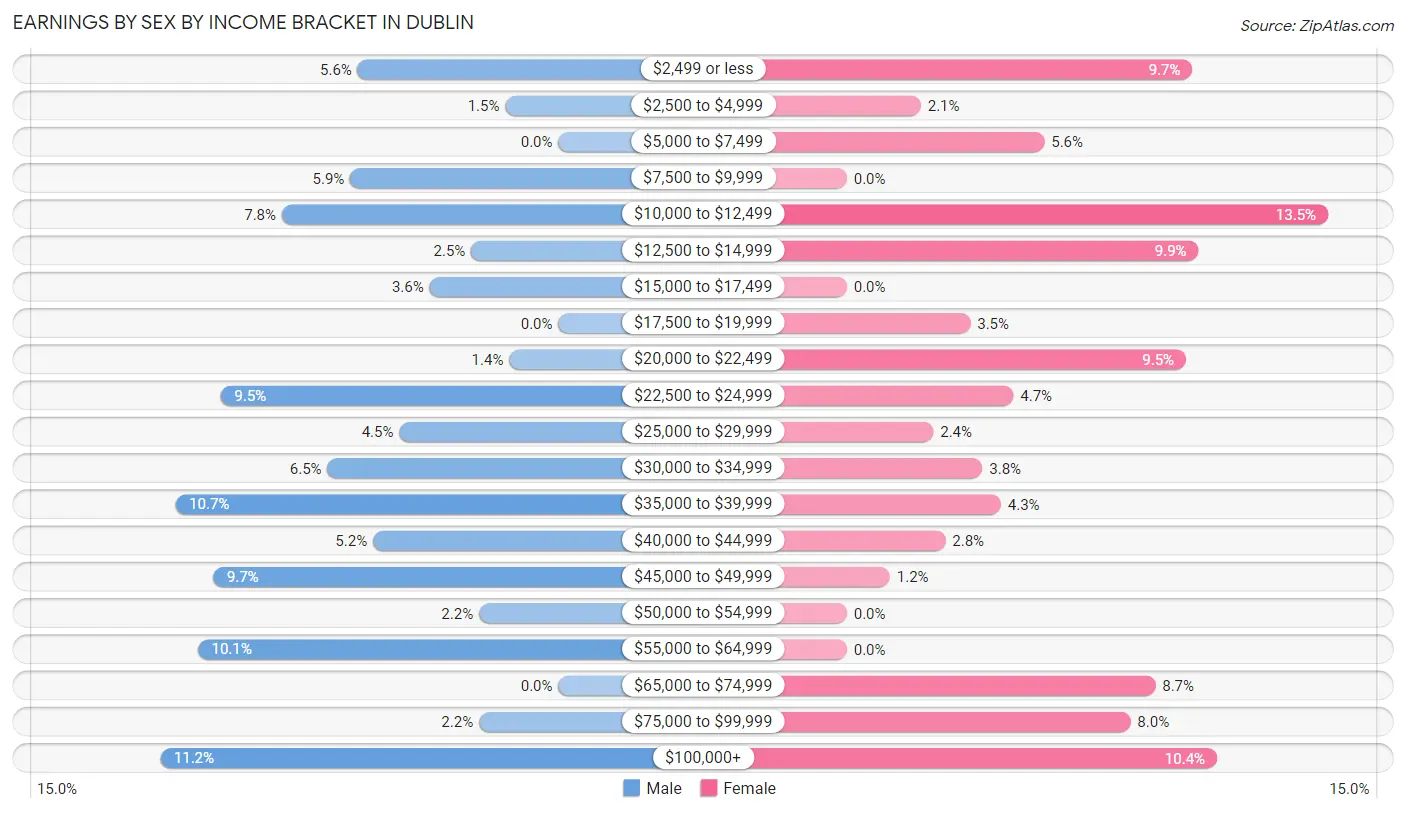
| Income | Male | Female |
| $2,499 or less | 53 (5.6%) | 56 (9.7%) |
| $2,500 to $4,999 | 14 (1.5%) | 12 (2.1%) |
| $5,000 to $7,499 | 0 (0.0%) | 32 (5.6%) |
| $7,500 to $9,999 | 55 (5.9%) | 0 (0.0%) |
| $10,000 to $12,499 | 73 (7.8%) | 78 (13.5%) |
| $12,500 to $14,999 | 23 (2.5%) | 57 (9.9%) |
| $15,000 to $17,499 | 34 (3.6%) | 0 (0.0%) |
| $17,500 to $19,999 | 0 (0.0%) | 20 (3.5%) |
| $20,000 to $22,499 | 13 (1.4%) | 55 (9.5%) |
| $22,500 to $24,999 | 89 (9.5%) | 27 (4.7%) |
| $25,000 to $29,999 | 42 (4.5%) | 14 (2.4%) |
| $30,000 to $34,999 | 61 (6.5%) | 22 (3.8%) |
| $35,000 to $39,999 | 101 (10.7%) | 25 (4.3%) |
| $40,000 to $44,999 | 49 (5.2%) | 16 (2.8%) |
| $45,000 to $49,999 | 91 (9.7%) | 7 (1.2%) |
| $50,000 to $54,999 | 21 (2.2%) | 0 (0.0%) |
| $55,000 to $64,999 | 95 (10.1%) | 0 (0.0%) |
| $65,000 to $74,999 | 0 (0.0%) | 50 (8.7%) |
| $75,000 to $99,999 | 21 (2.2%) | 46 (8.0%) |
| $100,000+ | 105 (11.2%) | 60 (10.4%) |
| Total | 940 (100.0%) | 577 (100.0%) |
Earnings by Sex by Educational Attainment in Dublin
Average earnings in Dublin are $35,194 for men and $28,750 for women, a difference of 18.3%. Men with an educational attainment of bachelor's degree enjoy the highest average annual earnings of $55,357, while those with high school diploma education earn the least with $26,250. Women with an educational attainment of bachelor's degree earn the most with the average annual earnings of $74,063, while those with less than high school education have the smallest earnings of $20,882.
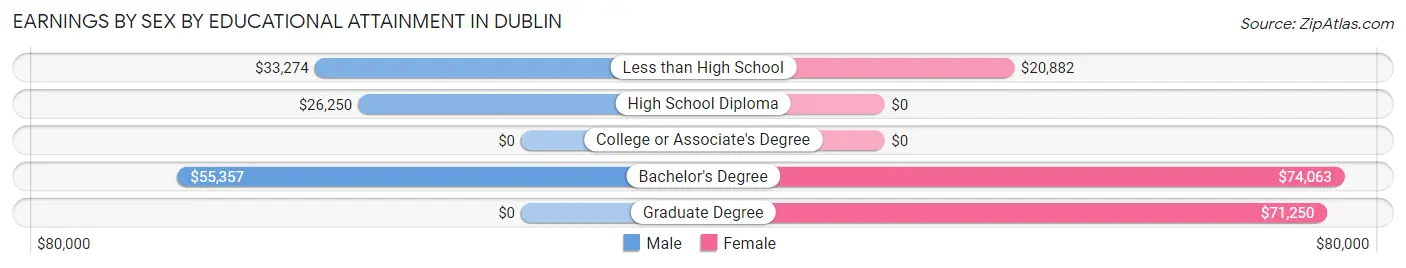
| Educational Attainment | Male Income | Female Income |
| Less than High School | $33,274 | $20,882 |
| High School Diploma | $26,250 | $0 |
| College or Associate's Degree | - | - |
| Bachelor's Degree | $55,357 | $74,063 |
| Graduate Degree | - | - |
| Total | $35,194 | $28,750 |
Family Income in Dublin
Family Income Brackets in Dublin
According to the Dublin family income data, there are 227 families falling into the $50,000 to $74,999 income range, which is the most common income bracket and makes up 27.7% of all families.
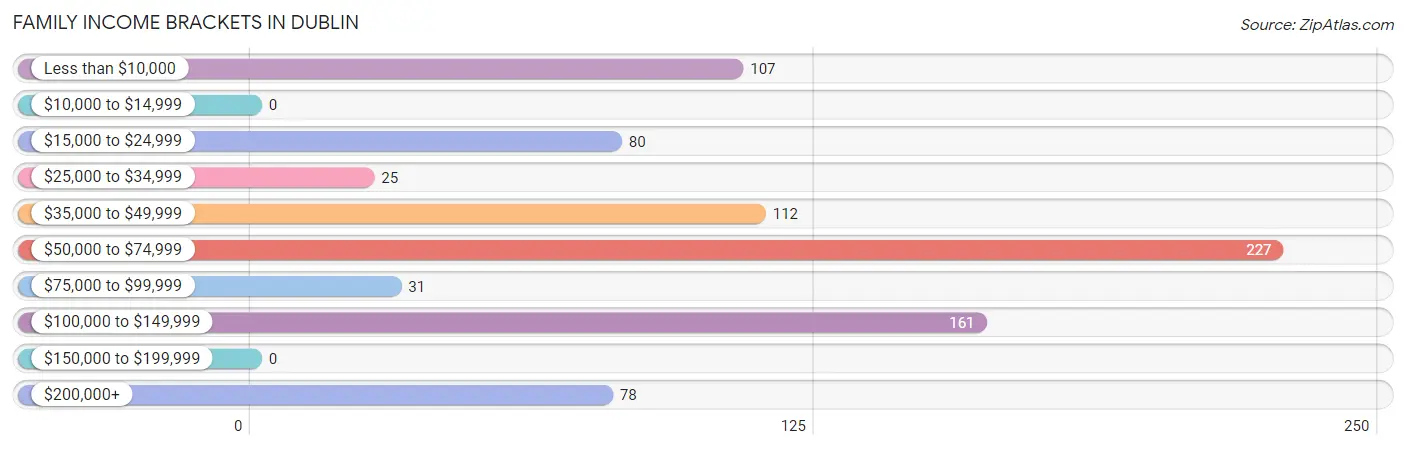
| Income Bracket | # Families | % Families |
| Less than $10,000 | 107 | 13.0% |
| $10,000 to $14,999 | 0 | 0.0% |
| $15,000 to $24,999 | 80 | 9.7% |
| $25,000 to $34,999 | 25 | 3.0% |
| $35,000 to $49,999 | 112 | 13.6% |
| $50,000 to $74,999 | 227 | 27.6% |
| $75,000 to $99,999 | 31 | 3.8% |
| $100,000 to $149,999 | 161 | 19.6% |
| $150,000 to $199,999 | 0 | 0.0% |
| $200,000+ | 78 | 9.5% |
Family Income by Famaliy Size in Dublin
4-person families (127 | 15.5%) account for the highest median family income in Dublin with $101,771 per family, while 2-person families (303 | 36.9%) have the highest median income of $26,875 per family member.
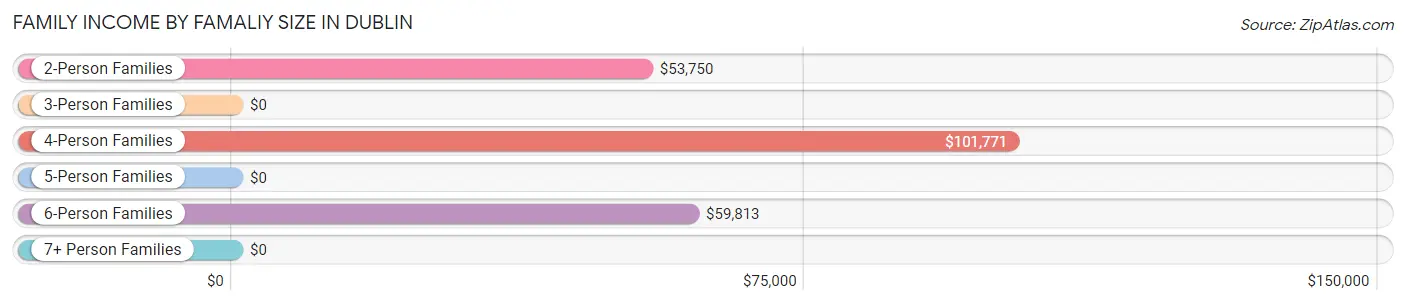
| Income Bracket | # Families | Median Income |
| 2-Person Families | 303 (36.9%) | $53,750 |
| 3-Person Families | 219 (26.7%) | $0 |
| 4-Person Families | 127 (15.5%) | $101,771 |
| 5-Person Families | 61 (7.4%) | $0 |
| 6-Person Families | 74 (9.0%) | $59,813 |
| 7+ Person Families | 37 (4.5%) | $0 |
| Total | 821 (100.0%) | $58,031 |
Family Income by Number of Earners in Dublin
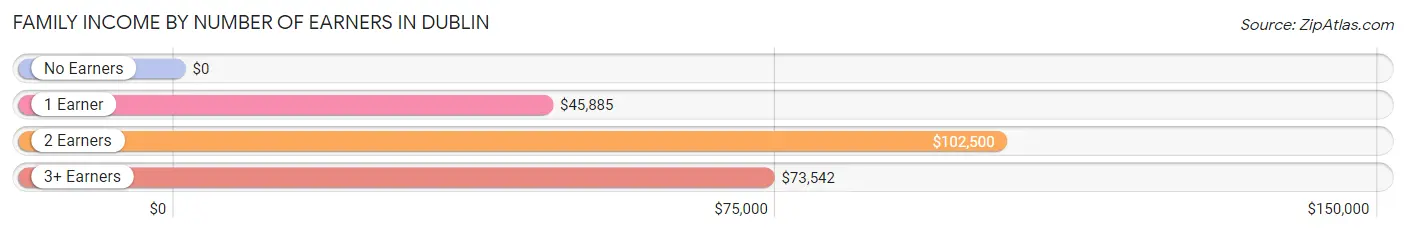
| Number of Earners | # Families | Median Income |
| No Earners | 165 (20.1%) | $0 |
| 1 Earner | 225 (27.4%) | $45,885 |
| 2 Earners | 342 (41.7%) | $102,500 |
| 3+ Earners | 89 (10.8%) | $73,542 |
| Total | 821 (100.0%) | $58,031 |
Household Income in Dublin
Household Income Brackets in Dublin
With 244 households falling in the category, the $50,000 to $74,999 income range is the most frequent in Dublin, accounting for 21.0% of all households. In contrast, only 22 households (1.9%) fall into the $150,000 to $199,999 income bracket, making it the least populous group.
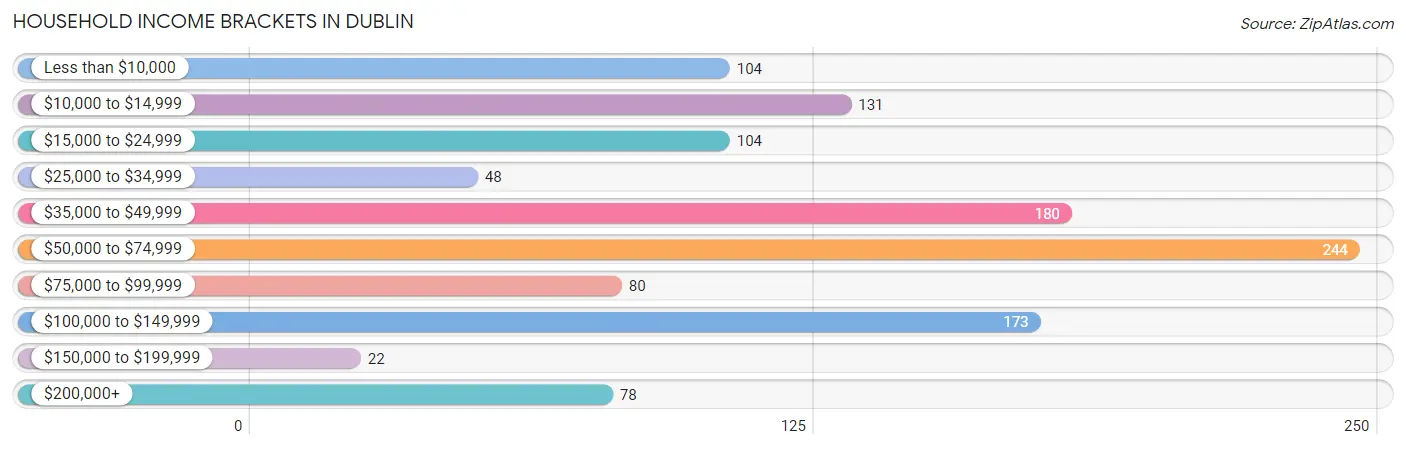
| Income Bracket | # Households | % Households |
| Less than $10,000 | 104 | 8.9% |
| $10,000 to $14,999 | 131 | 11.3% |
| $15,000 to $24,999 | 104 | 8.9% |
| $25,000 to $34,999 | 48 | 4.1% |
| $35,000 to $49,999 | 180 | 15.5% |
| $50,000 to $74,999 | 244 | 21.0% |
| $75,000 to $99,999 | 80 | 6.9% |
| $100,000 to $149,999 | 173 | 14.9% |
| $150,000 to $199,999 | 22 | 1.9% |
| $200,000+ | 78 | 6.7% |
Household Income by Householder Age in Dublin
The median household income in Dublin is $52,153, with the highest median household income of $62,708 found in the 45 to 64 years age bracket for the primary householder. A total of 412 households (35.4%) fall into this category. Meanwhile, the 15 to 24 years age bracket for the primary householder has the lowest median household income of $28,696, with 114 households (9.8%) in this group.
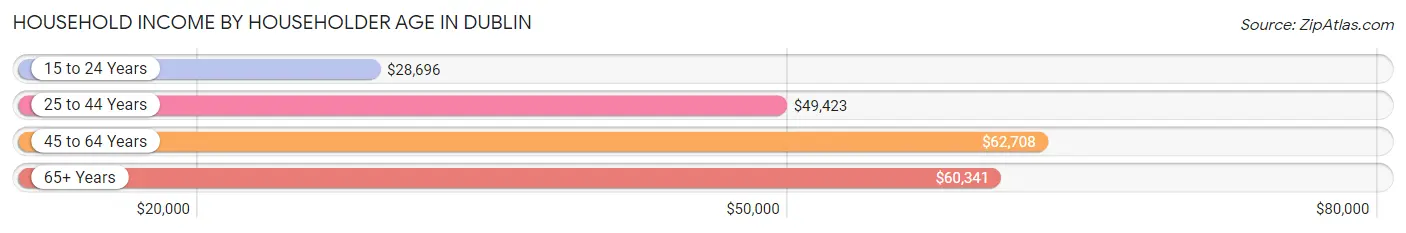
| Income Bracket | # Households | Median Income |
| 15 to 24 Years | 114 (9.8%) | $28,696 |
| 25 to 44 Years | 372 (32.0%) | $49,423 |
| 45 to 64 Years | 412 (35.4%) | $62,708 |
| 65+ Years | 265 (22.8%) | $60,341 |
| Total | 1,163 (100.0%) | $52,153 |
Poverty in Dublin
Income Below Poverty by Sex and Age in Dublin
With 39.9% poverty level for males and 15.1% for females among the residents of Dublin, 15 year old males and 18 to 24 year old females are the most vulnerable to poverty, with 32 males (100.0%) and 112 females (48.3%) in their respective age groups living below the poverty level.
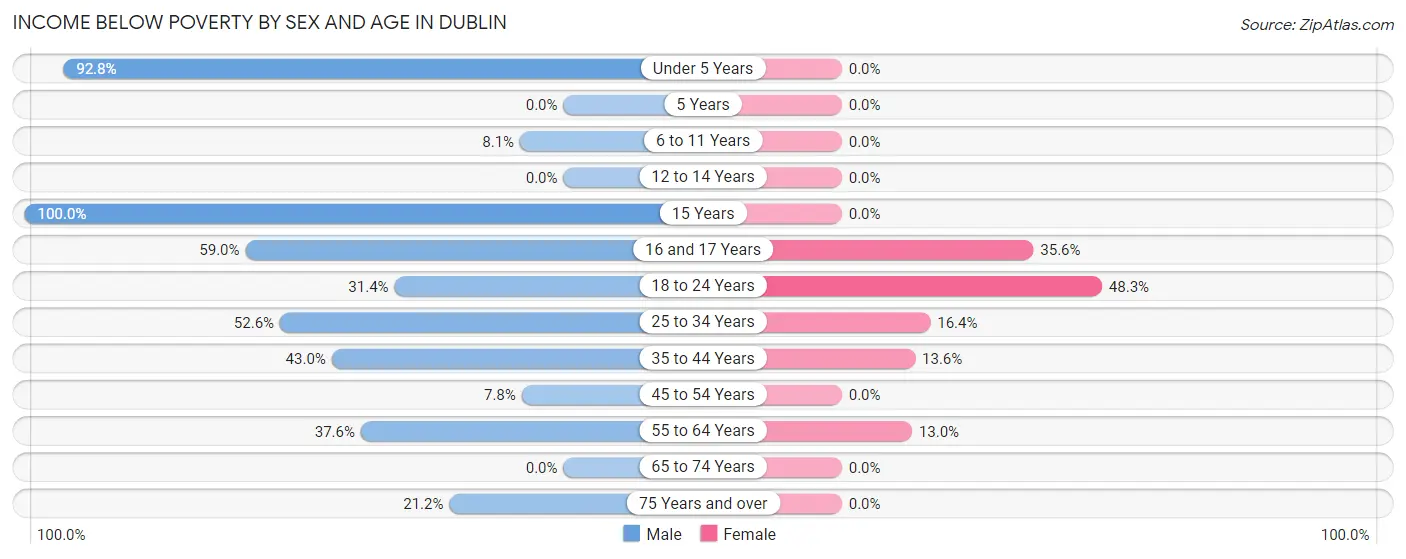
| Age Bracket | Male | Female |
| Under 5 Years | 284 (92.8%) | 0 (0.0%) |
| 5 Years | 0 (0.0%) | 0 (0.0%) |
| 6 to 11 Years | 22 (8.1%) | 0 (0.0%) |
| 12 to 14 Years | 0 (0.0%) | 0 (0.0%) |
| 15 Years | 32 (100.0%) | 0 (0.0%) |
| 16 and 17 Years | 36 (59.0%) | 16 (35.6%) |
| 18 to 24 Years | 37 (31.4%) | 112 (48.3%) |
| 25 to 34 Years | 161 (52.6%) | 22 (16.4%) |
| 35 to 44 Years | 83 (43.0%) | 26 (13.6%) |
| 45 to 54 Years | 11 (7.7%) | 0 (0.0%) |
| 55 to 64 Years | 97 (37.6%) | 28 (13.0%) |
| 65 to 74 Years | 0 (0.0%) | 0 (0.0%) |
| 75 Years and over | 29 (21.2%) | 0 (0.0%) |
| Total | 792 (39.9%) | 204 (15.1%) |
Income Above Poverty by Sex and Age in Dublin
According to the poverty statistics in Dublin, males aged 12 to 14 years and females aged under 5 years are the age groups that are most secure financially, with 100.0% of males and 100.0% of females in these age groups living above the poverty line.
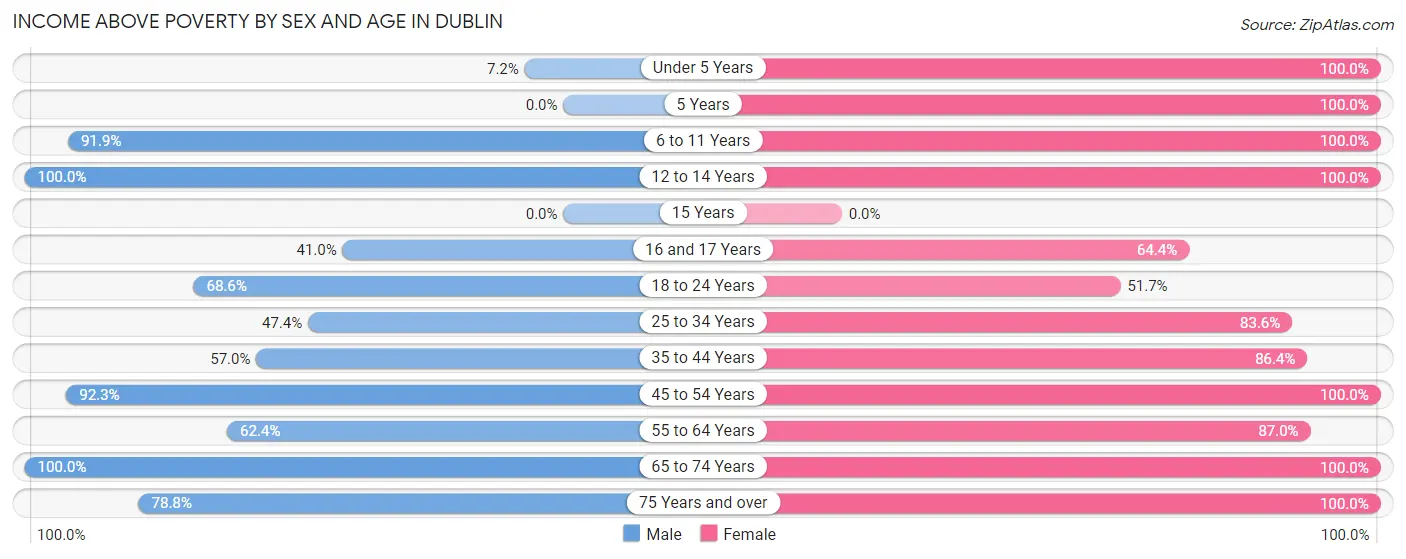
| Age Bracket | Male | Female |
| Under 5 Years | 22 (7.2%) | 123 (100.0%) |
| 5 Years | 0 (0.0%) | 11 (100.0%) |
| 6 to 11 Years | 251 (91.9%) | 79 (100.0%) |
| 12 to 14 Years | 55 (100.0%) | 87 (100.0%) |
| 15 Years | 0 (0.0%) | 0 (0.0%) |
| 16 and 17 Years | 25 (41.0%) | 29 (64.4%) |
| 18 to 24 Years | 81 (68.6%) | 120 (51.7%) |
| 25 to 34 Years | 145 (47.4%) | 112 (83.6%) |
| 35 to 44 Years | 110 (57.0%) | 165 (86.4%) |
| 45 to 54 Years | 131 (92.2%) | 101 (100.0%) |
| 55 to 64 Years | 161 (62.4%) | 187 (87.0%) |
| 65 to 74 Years | 106 (100.0%) | 76 (100.0%) |
| 75 Years and over | 108 (78.8%) | 61 (100.0%) |
| Total | 1,195 (60.1%) | 1,151 (84.9%) |
Income Below Poverty Among Married-Couple Families in Dublin
The poverty statistics for married-couple families in Dublin show that 18.0% or 120 of the total 668 families live below the poverty line. Families with 1 or 2 children have the highest poverty rate of 23.7%, comprising of 46 families. On the other hand, families with 3 or 4 children have the lowest poverty rate of 0.0%, which includes 0 families.

| Children | Above Poverty | Below Poverty |
| No Children | 240 (76.4%) | 74 (23.6%) |
| 1 or 2 Children | 148 (76.3%) | 46 (23.7%) |
| 3 or 4 Children | 160 (100.0%) | 0 (0.0%) |
| 5 or more Children | 0 (0.0%) | 0 (0.0%) |
| Total | 548 (82.0%) | 120 (18.0%) |
Income Below Poverty Among Single-Parent Households in Dublin
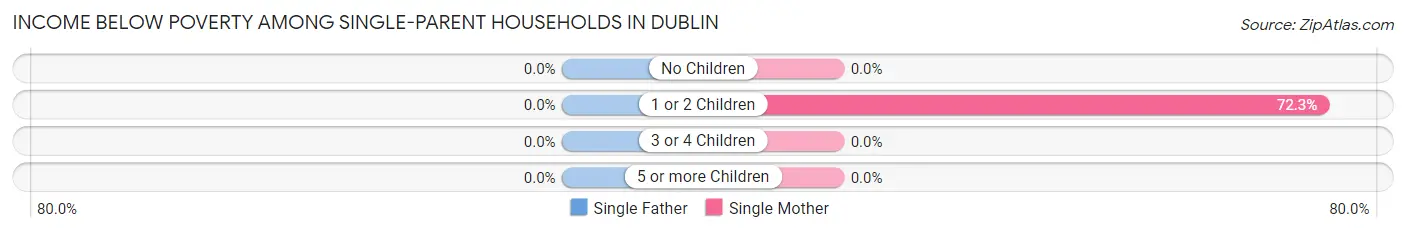
| Children | Single Father | Single Mother |
| No Children | 0 (0.0%) | 0 (0.0%) |
| 1 or 2 Children | 0 (0.0%) | 81 (72.3%) |
| 3 or 4 Children | 0 (0.0%) | 0 (0.0%) |
| 5 or more Children | 0 (0.0%) | 0 (0.0%) |
| Total | 0 (0.0%) | 81 (57.5%) |
Income Below Poverty Among Married-Couple vs Single-Parent Households in Dublin
The poverty data for Dublin shows that 120 of the married-couple family households (18.0%) and 81 of the single-parent households (52.9%) are living below the poverty level. Within the married-couple family households, those with 1 or 2 children have the highest poverty rate, with 46 households (23.7%) falling below the poverty line. Among the single-parent households, those with 1 or 2 children have the highest poverty rate, with 81 household (72.3%) living below poverty.
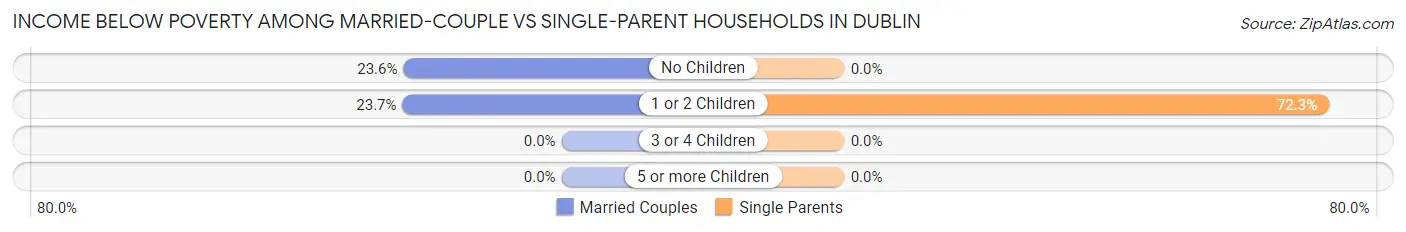
| Children | Married-Couple Families | Single-Parent Households |
| No Children | 74 (23.6%) | 0 (0.0%) |
| 1 or 2 Children | 46 (23.7%) | 81 (72.3%) |
| 3 or 4 Children | 0 (0.0%) | 0 (0.0%) |
| 5 or more Children | 0 (0.0%) | 0 (0.0%) |
| Total | 120 (18.0%) | 81 (52.9%) |
Race in Dublin
The most populous races in Dublin are White / Caucasian (2,347 | 69.1%), Hispanic or Latino (1,354 | 39.9%), and Some other Race (618 | 18.2%).
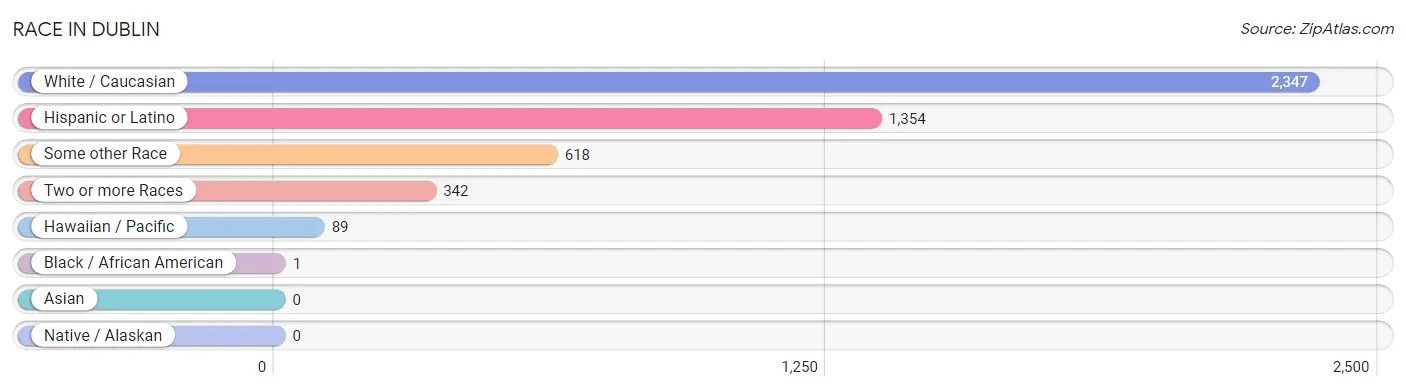
| Race | # Population | % Population |
| Asian | 0 | 0.0% |
| Black / African American | 1 | 0.0% |
| Hawaiian / Pacific | 89 | 2.6% |
| Hispanic or Latino | 1,354 | 39.9% |
| Native / Alaskan | 0 | 0.0% |
| White / Caucasian | 2,347 | 69.1% |
| Two or more Races | 342 | 10.1% |
| Some other Race | 618 | 18.2% |
| Total | 3,397 | 100.0% |
Ancestry in Dublin
The most populous ancestries reported in Dublin are Mexican (1,139 | 33.5%), English (300 | 8.8%), Irish (288 | 8.5%), American (206 | 6.1%), and German (129 | 3.8%), together accounting for 60.7% of all Dublin residents.
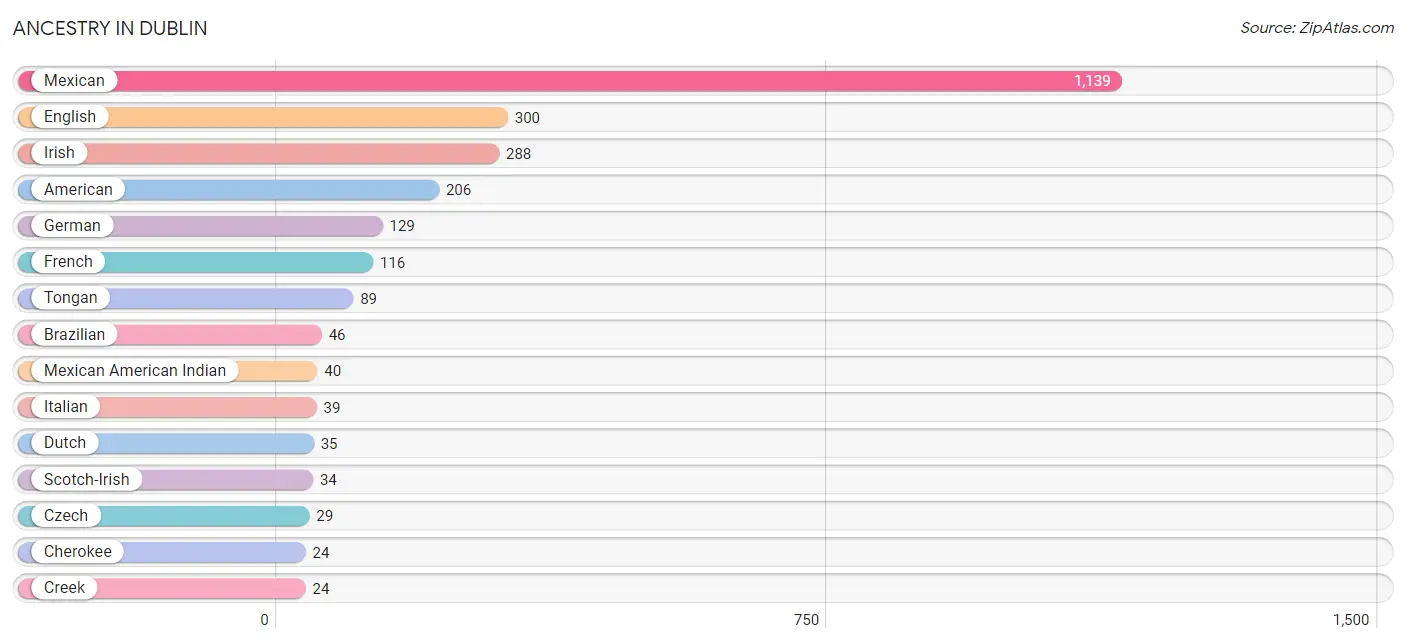
| Ancestry | # Population | % Population |
| American | 206 | 6.1% |
| Brazilian | 46 | 1.3% |
| Cherokee | 24 | 0.7% |
| Creek | 24 | 0.7% |
| Czech | 29 | 0.9% |
| Dutch | 35 | 1.0% |
| English | 300 | 8.8% |
| French | 116 | 3.4% |
| German | 129 | 3.8% |
| Irish | 288 | 8.5% |
| Italian | 39 | 1.1% |
| Mexican | 1,139 | 33.5% |
| Mexican American Indian | 40 | 1.2% |
| Polish | 21 | 0.6% |
| Portuguese | 13 | 0.4% |
| Puerto Rican | 1 | 0.0% |
| Russian | 18 | 0.5% |
| Scotch-Irish | 34 | 1.0% |
| Scottish | 11 | 0.3% |
| Spaniard | 20 | 0.6% |
| Swedish | 9 | 0.3% |
| Tongan | 89 | 2.6% | View All 22 Rows |
Immigrants in Dublin
The most numerous immigrant groups reported in Dublin came from Latin America (438 | 12.9%), Central America (392 | 11.5%), Mexico (392 | 11.5%), Oceania (89 | 2.6%), and Brazil (46 | 1.3%), together accounting for 39.9% of all Dublin residents.
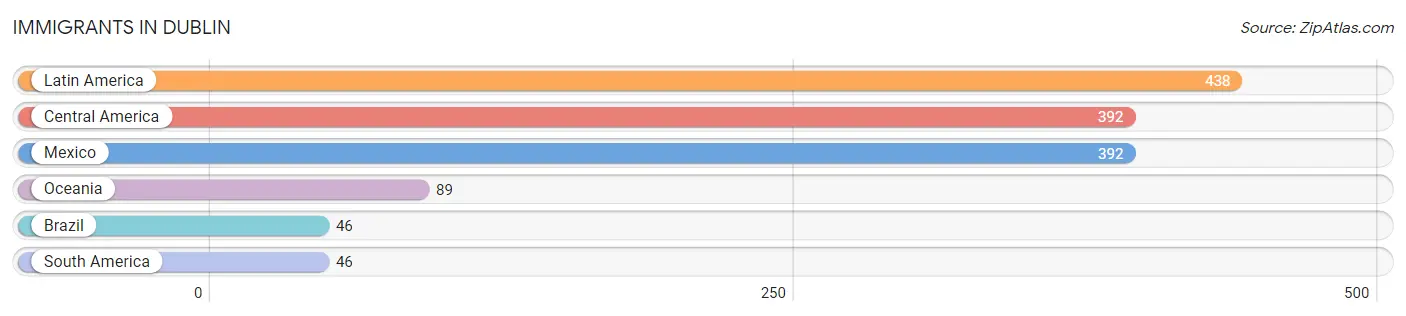
| Immigration Origin | # Population | % Population |
| Brazil | 46 | 1.3% |
| Central America | 392 | 11.5% |
| Latin America | 438 | 12.9% |
| Mexico | 392 | 11.5% |
| Oceania | 89 | 2.6% |
| South America | 46 | 1.3% | View All 6 Rows |
Sex and Age in Dublin
Sex and Age in Dublin
The most populous age groups in Dublin are Under 5 Years (306 | 15.3%) for men and 20 to 24 Years (199 | 14.2%) for women.
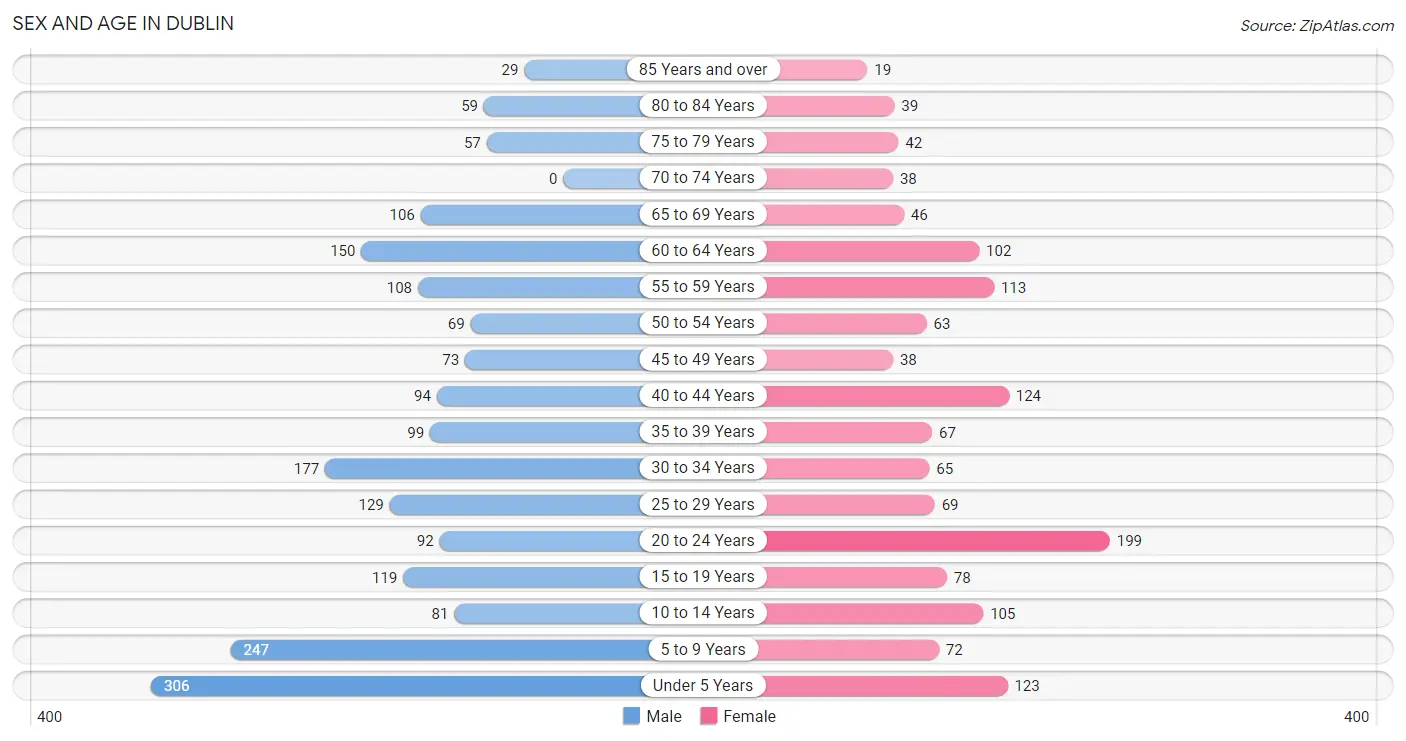
| Age Bracket | Male | Female |
| Under 5 Years | 306 (15.3%) | 123 (8.8%) |
| 5 to 9 Years | 247 (12.4%) | 72 (5.1%) |
| 10 to 14 Years | 81 (4.1%) | 105 (7.5%) |
| 15 to 19 Years | 119 (6.0%) | 78 (5.6%) |
| 20 to 24 Years | 92 (4.6%) | 199 (14.2%) |
| 25 to 29 Years | 129 (6.5%) | 69 (4.9%) |
| 30 to 34 Years | 177 (8.9%) | 65 (4.6%) |
| 35 to 39 Years | 99 (5.0%) | 67 (4.8%) |
| 40 to 44 Years | 94 (4.7%) | 124 (8.8%) |
| 45 to 49 Years | 73 (3.7%) | 38 (2.7%) |
| 50 to 54 Years | 69 (3.5%) | 63 (4.5%) |
| 55 to 59 Years | 108 (5.4%) | 113 (8.1%) |
| 60 to 64 Years | 150 (7.5%) | 102 (7.3%) |
| 65 to 69 Years | 106 (5.3%) | 46 (3.3%) |
| 70 to 74 Years | 0 (0.0%) | 38 (2.7%) |
| 75 to 79 Years | 57 (2.9%) | 42 (3.0%) |
| 80 to 84 Years | 59 (3.0%) | 39 (2.8%) |
| 85 Years and over | 29 (1.5%) | 19 (1.4%) |
| Total | 1,995 (100.0%) | 1,402 (100.0%) |
Families and Households in Dublin
Median Family Size in Dublin
The median family size in Dublin is 3.49 persons per family, with single male/father families (12 | 1.5%) accounting for the largest median family size of 5.5 persons per family. On the other hand, married-couple families (668 | 81.4%) represent the smallest median family size with 3.32 persons per family.
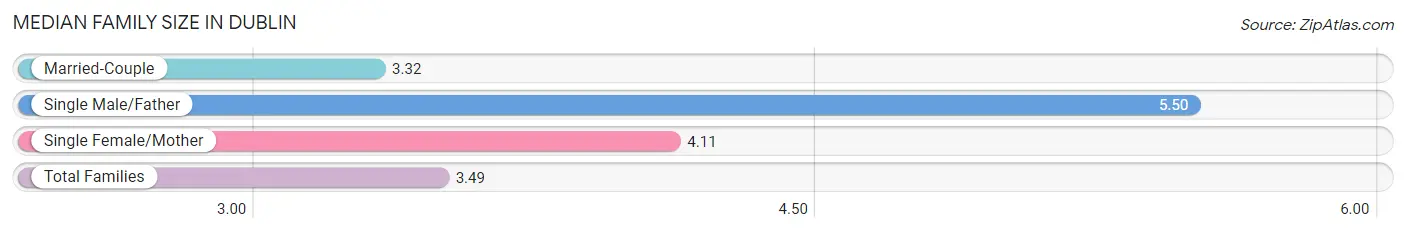
| Family Type | # Families | Family Size |
| Married-Couple | 668 (81.4%) | 3.32 |
| Single Male/Father | 12 (1.5%) | 5.50 |
| Single Female/Mother | 141 (17.2%) | 4.11 |
| Total Families | 821 (100.0%) | 3.49 |
Median Household Size in Dublin
The median household size in Dublin is 2.87 persons per household, with single male/father households (12 | 1.0%) accounting for the largest median household size of 6.58 persons per household. non-family households (342 | 29.4%) represent the smallest median household size with 1.12 persons per household.
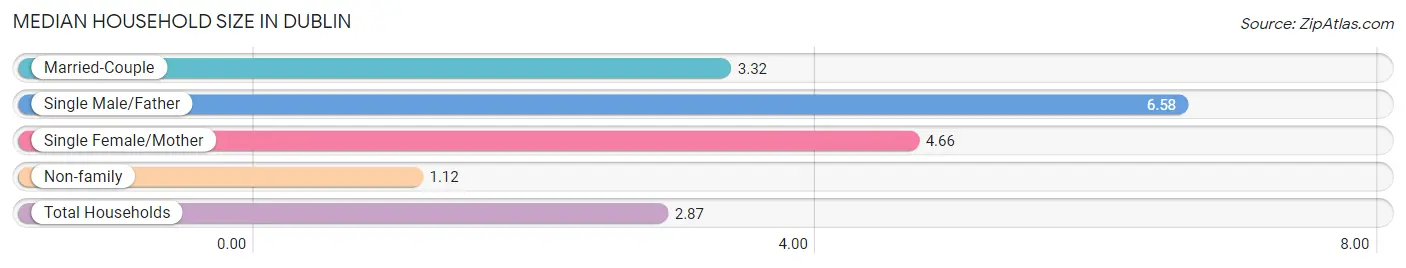
| Household Type | # Households | Household Size |
| Married-Couple | 668 (57.4%) | 3.32 |
| Single Male/Father | 12 (1.0%) | 6.58 |
| Single Female/Mother | 141 (12.1%) | 4.66 |
| Non-family | 342 (29.4%) | 1.12 |
| Total Households | 1,163 (100.0%) | 2.87 |
Household Size by Marriage Status in Dublin
Out of a total of 1,163 households in Dublin, 821 (70.6%) are family households, while 342 (29.4%) are nonfamily households. The most numerous type of family households are 2-person households, comprising 303, and the most common type of nonfamily households are 1-person households, comprising 306.
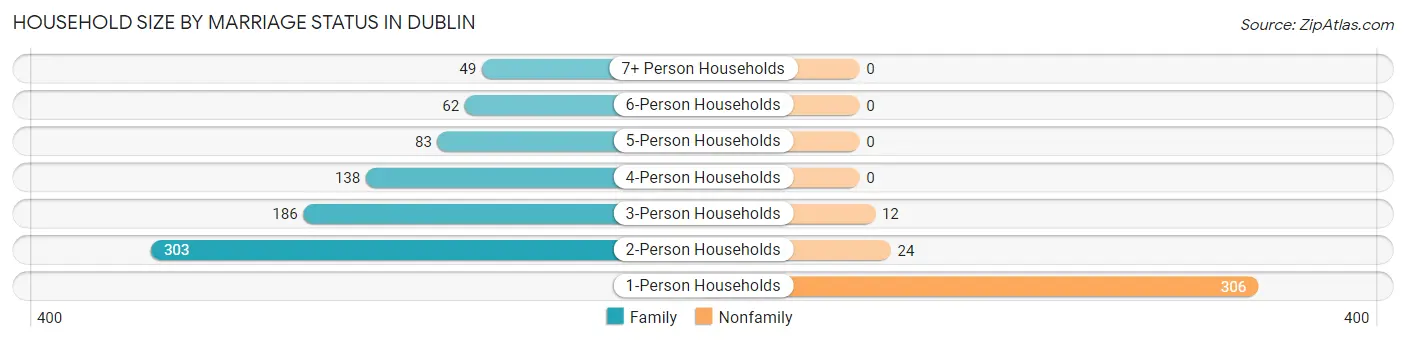
| Household Size | Family Households | Nonfamily Households |
| 1-Person Households | - | 306 (26.3%) |
| 2-Person Households | 303 (26.1%) | 24 (2.1%) |
| 3-Person Households | 186 (16.0%) | 12 (1.0%) |
| 4-Person Households | 138 (11.9%) | 0 (0.0%) |
| 5-Person Households | 83 (7.1%) | 0 (0.0%) |
| 6-Person Households | 62 (5.3%) | 0 (0.0%) |
| 7+ Person Households | 49 (4.2%) | 0 (0.0%) |
| Total | 821 (70.6%) | 342 (29.4%) |
Female Fertility in Dublin
Fertility by Age in Dublin
Average fertility rate in Dublin is 207.0 births per 1,000 women. Women in the age bracket of 20 to 34 years have the highest fertility rate with 273.0 births per 1,000 women. Women in the age bracket of 20 to 34 years acount for 66.4% of all women with births.
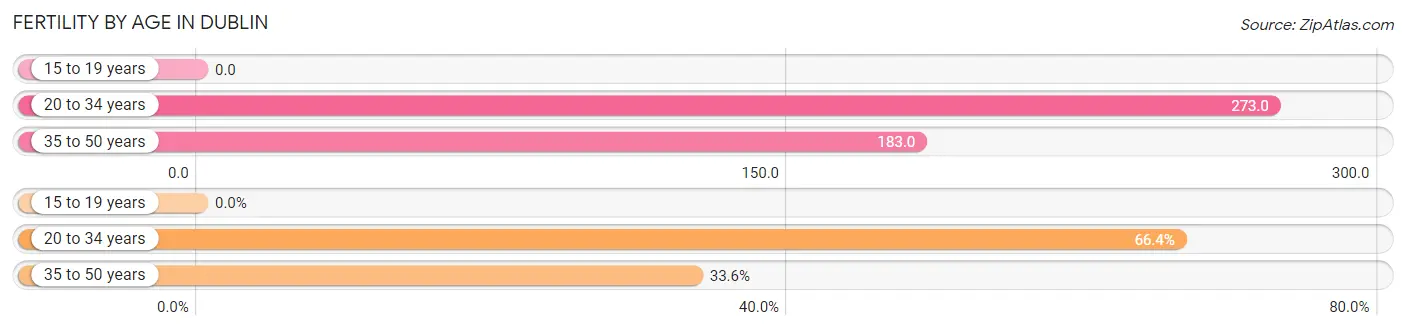
| Age Bracket | Women with Births | Births / 1,000 Women |
| 15 to 19 years | 0 (0.0%) | 0.0 |
| 20 to 34 years | 91 (66.4%) | 273.0 |
| 35 to 50 years | 46 (33.6%) | 183.0 |
| Total | 137 (100.0%) | 207.0 |
Fertility by Age by Marriage Status in Dublin
45.3% of women with births (137) in Dublin are married. The highest percentage of unmarried women with births falls into 20 to 34 years age bracket with 82.4% of them unmarried at the time of birth, while the lowest percentage of unmarried women with births belong to 35 to 50 years age bracket with 0.0% of them unmarried.
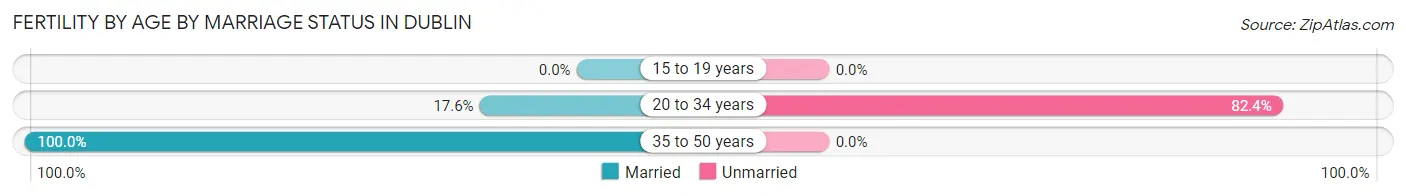
| Age Bracket | Married | Unmarried |
| 15 to 19 years | 0 (0.0%) | 0 (0.0%) |
| 20 to 34 years | 16 (17.6%) | 75 (82.4%) |
| 35 to 50 years | 46 (100.0%) | 0 (0.0%) |
| Total | 62 (45.3%) | 75 (54.7%) |
Fertility by Education in Dublin
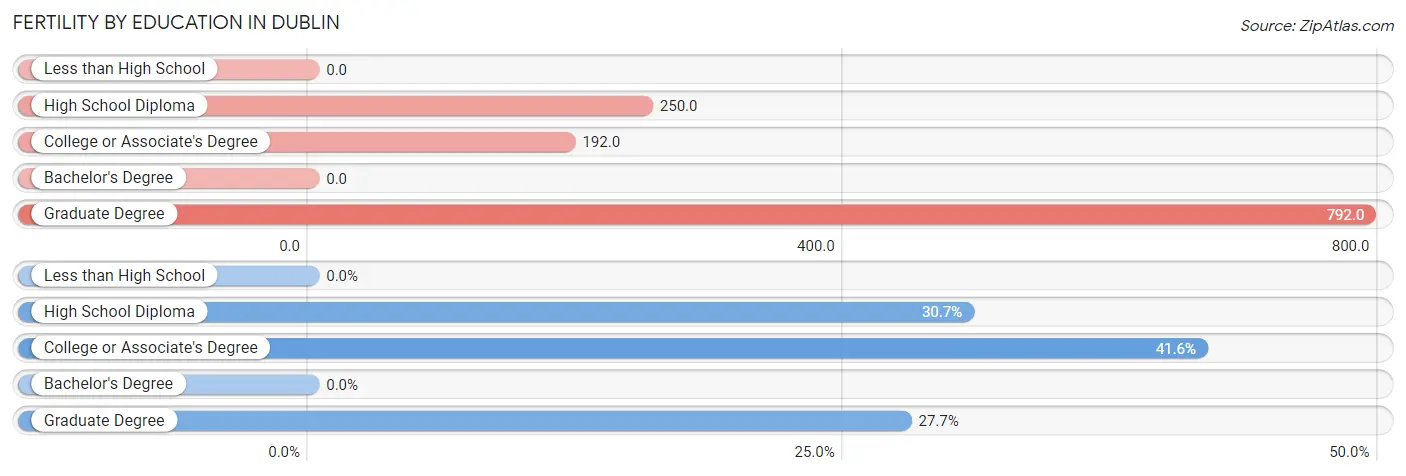
| Educational Attainment | Women with Births | Births / 1,000 Women |
| Less than High School | 0 (0.0%) | 0.0 |
| High School Diploma | 42 (30.7%) | 250.0 |
| College or Associate's Degree | 57 (41.6%) | 192.0 |
| Bachelor's Degree | 0 (0.0%) | 0.0 |
| Graduate Degree | 38 (27.7%) | 792.0 |
| Total | 137 (100.0%) | 207.0 |
Fertility by Education by Marriage Status in Dublin
54.7% of women with births in Dublin are unmarried. Women with the educational attainment of graduate degree are most likely to be married with 100.0% of them married at childbirth, while women with the educational attainment of high school diploma are least likely to be married with 100.0% of them unmarried at childbirth.
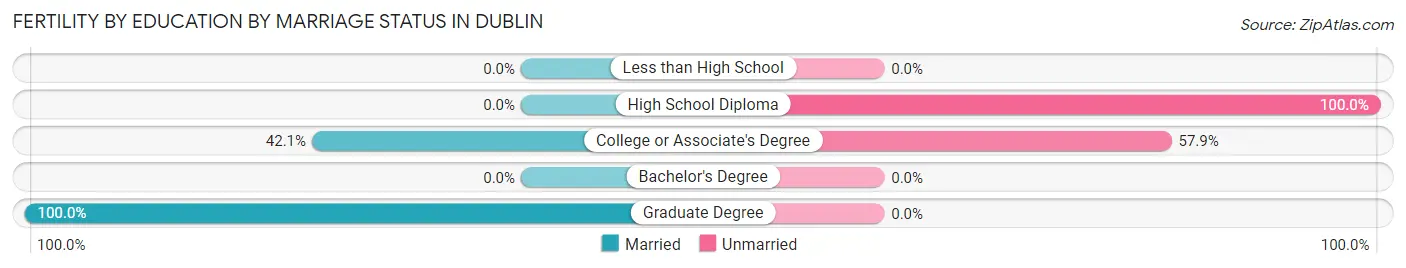
| Educational Attainment | Married | Unmarried |
| Less than High School | 0 (0.0%) | 0 (0.0%) |
| High School Diploma | 0 (0.0%) | 42 (100.0%) |
| College or Associate's Degree | 24 (42.1%) | 33 (57.9%) |
| Bachelor's Degree | 0 (0.0%) | 0 (0.0%) |
| Graduate Degree | 38 (100.0%) | 0 (0.0%) |
| Total | 62 (45.3%) | 75 (54.7%) |
Employment Characteristics in Dublin
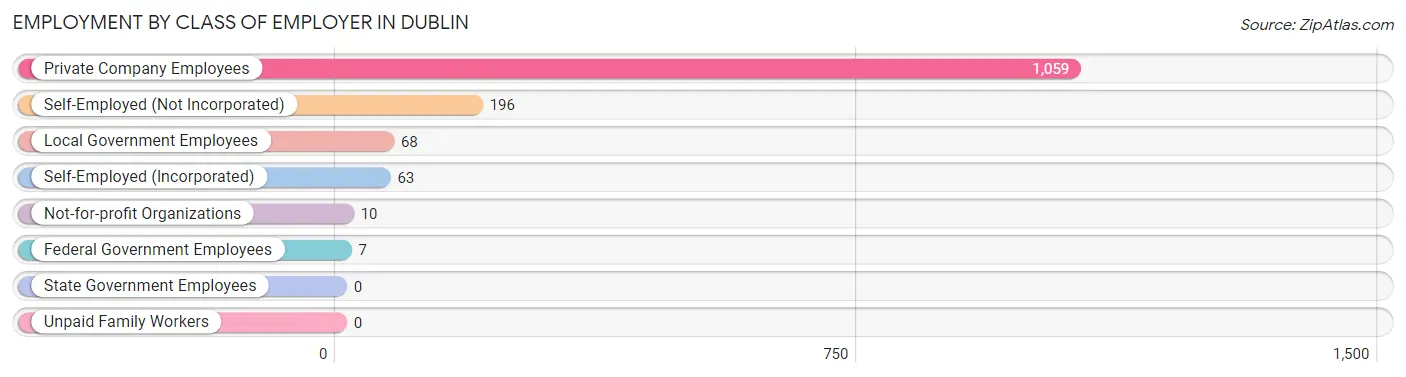
Employment by Class of Employer in Dublin
Among the 1,403 employed individuals in Dublin, private company employees (1,059 | 75.5%), self-employed (not incorporated) (196 | 14.0%), and local government employees (68 | 4.9%) make up the most common classes of employment.
| Employer Class | # Employees | % Employees |
| Private Company Employees | 1,059 | 75.5% |
| Self-Employed (Incorporated) | 63 | 4.5% |
| Self-Employed (Not Incorporated) | 196 | 14.0% |
| Not-for-profit Organizations | 10 | 0.7% |
| Local Government Employees | 68 | 4.9% |
| State Government Employees | 0 | 0.0% |
| Federal Government Employees | 7 | 0.5% |
| Unpaid Family Workers | 0 | 0.0% |
| Total | 1,403 | 100.0% |
Employment Status by Age in Dublin
According to the labor force statistics for Dublin, out of the total population over 16 years of age (2,431), 59.8% or 1,454 individuals are in the labor force, with 2.3% or 33 of them unemployed. The age group with the highest labor force participation rate is 25 to 29 years, with 100.0% or 198 individuals in the labor force. Within the labor force, the 60 to 64 years age range has the highest percentage of unemployed individuals, with 16.3% or 26 of them being unemployed.
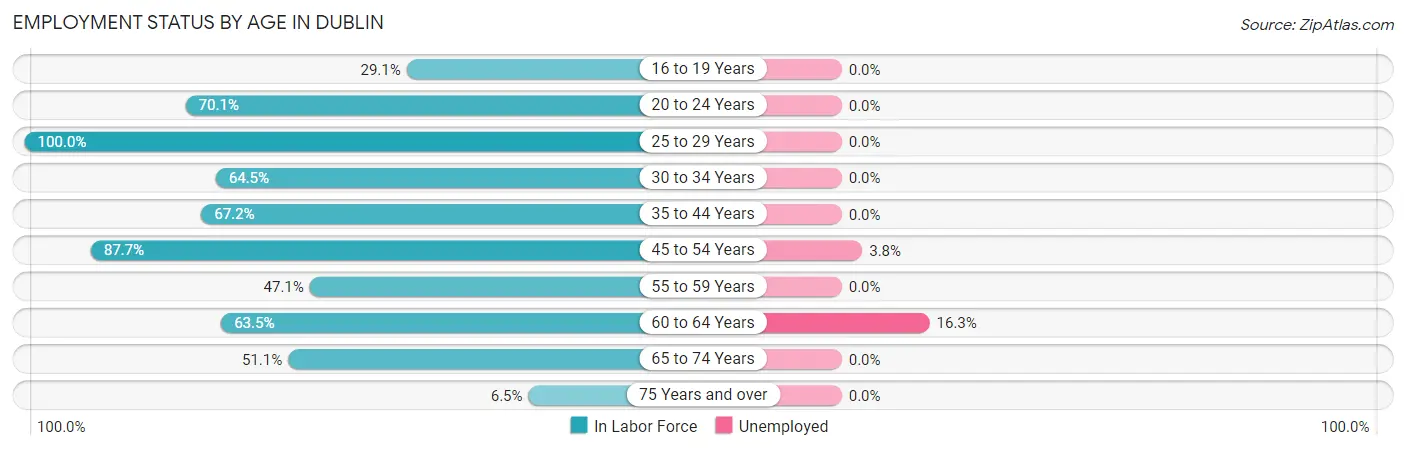
| Age Bracket | In Labor Force | Unemployed |
| 16 to 19 Years | 48 (29.1%) | 0 (0.0%) |
| 20 to 24 Years | 204 (70.1%) | 0 (0.0%) |
| 25 to 29 Years | 198 (100.0%) | 0 (0.0%) |
| 30 to 34 Years | 156 (64.5%) | 0 (0.0%) |
| 35 to 44 Years | 258 (67.2%) | 0 (0.0%) |
| 45 to 54 Years | 213 (87.7%) | 8 (3.8%) |
| 55 to 59 Years | 104 (47.1%) | 0 (0.0%) |
| 60 to 64 Years | 160 (63.5%) | 26 (16.3%) |
| 65 to 74 Years | 97 (51.1%) | 0 (0.0%) |
| 75 Years and over | 16 (6.5%) | 0 (0.0%) |
| Total | 1,454 (59.8%) | 33 (2.3%) |
Employment Status by Educational Attainment in Dublin
According to labor force statistics for Dublin, 70.7% of individuals (1,089) out of the total population between 25 and 64 years of age (1,540) are in the labor force, with 3.1% or 34 of them being unemployed. The group with the highest labor force participation rate are those with the educational attainment of bachelor's degree or higher, with 83.1% or 270 individuals in the labor force. Within the labor force, individuals with college / associate degree education have the highest percentage of unemployment, with 8.3% or 26 of them being unemployed.
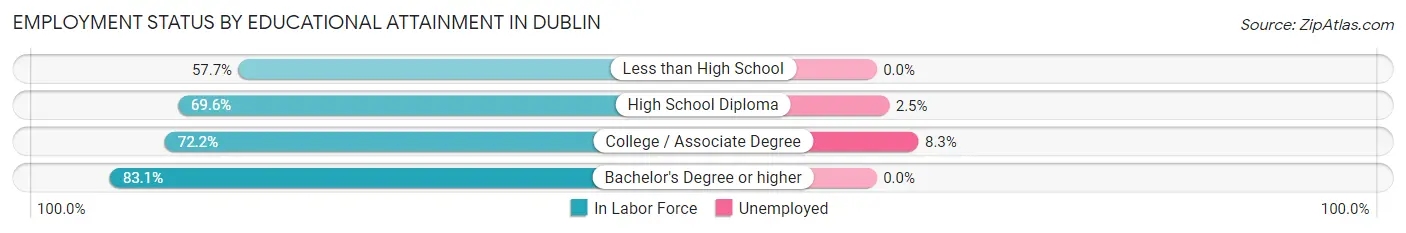
| Educational Attainment | In Labor Force | Unemployed |
| Less than High School | 184 (57.7%) | 0 (0.0%) |
| High School Diploma | 320 (69.6%) | 12 (2.5%) |
| College / Associate Degree | 315 (72.2%) | 36 (8.3%) |
| Bachelor's Degree or higher | 270 (83.1%) | 0 (0.0%) |
| Total | 1,089 (70.7%) | 48 (3.1%) |
Employment Occupations by Sex in Dublin
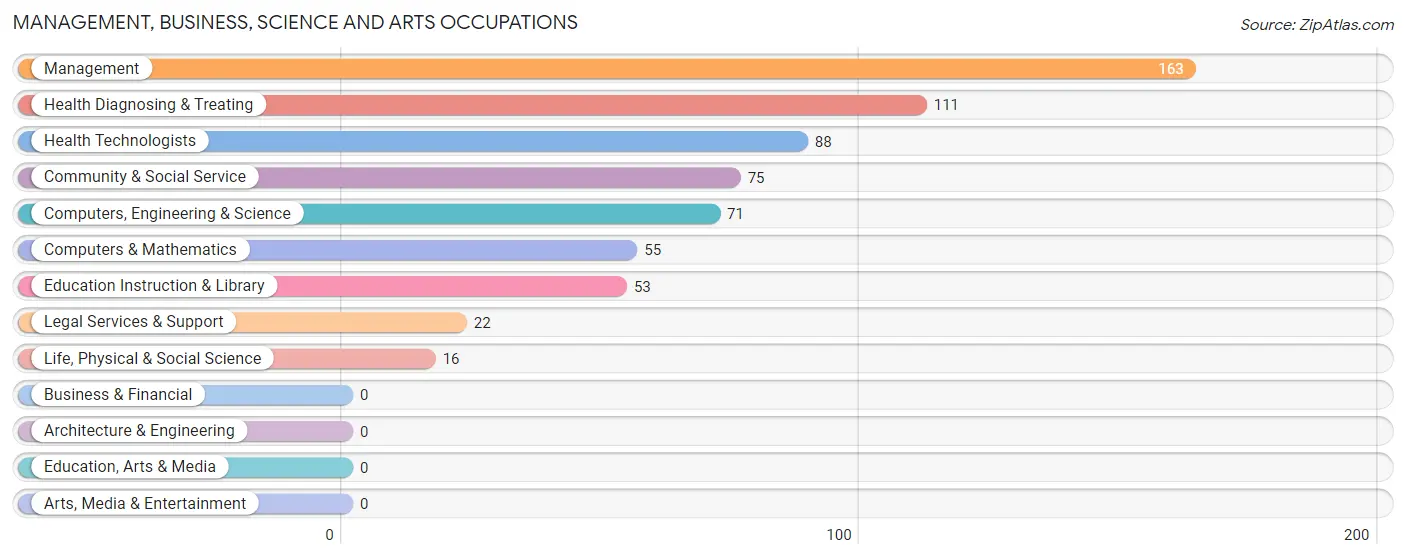
Management, Business, Science and Arts Occupations
The most common Management, Business, Science and Arts occupations in Dublin are Management (163 | 11.5%), Health Diagnosing & Treating (111 | 7.8%), Health Technologists (88 | 6.2%), Community & Social Service (75 | 5.3%), and Computers, Engineering & Science (71 | 5.0%).
Management, Business, Science and Arts Occupations by Sex
Within the Management, Business, Science and Arts occupations in Dublin, the most male-oriented occupations are Computers & Mathematics (89.1%), Education Instruction & Library (79.2%), and Computers, Engineering & Science (69.0%), while the most female-oriented occupations are Life, Physical & Social Science (100.0%), Legal Services & Support (100.0%), and Health Diagnosing & Treating (75.7%).
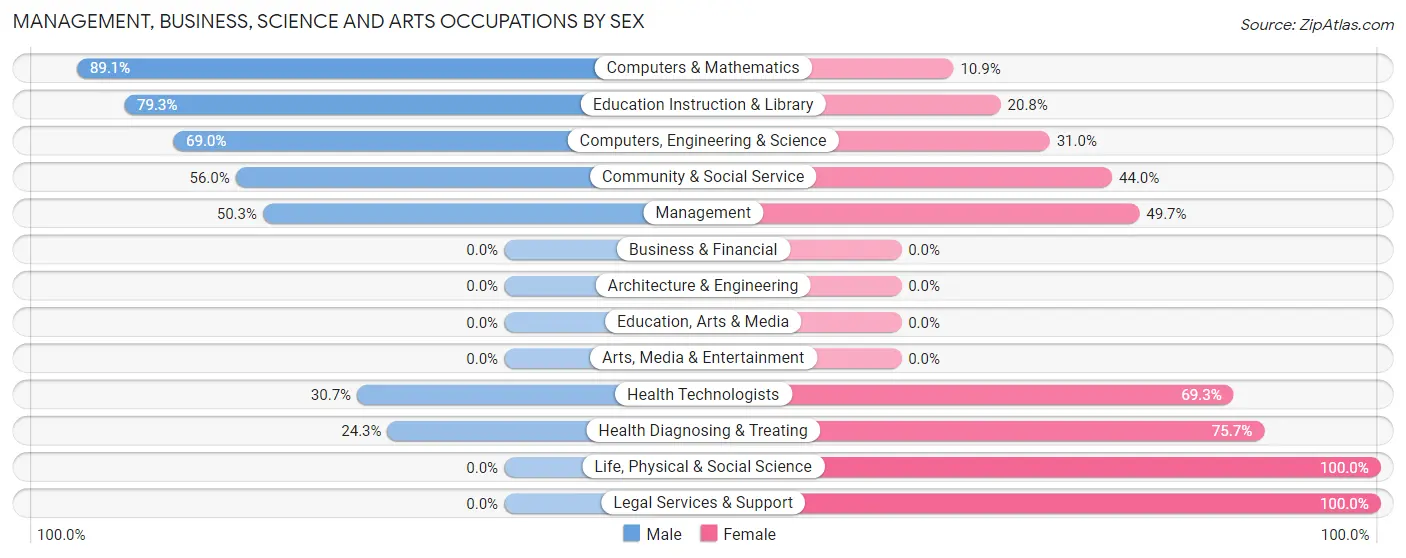
| Occupation | Male | Female |
| Management | 82 (50.3%) | 81 (49.7%) |
| Business & Financial | 0 (0.0%) | 0 (0.0%) |
| Computers, Engineering & Science | 49 (69.0%) | 22 (31.0%) |
| Computers & Mathematics | 49 (89.1%) | 6 (10.9%) |
| Architecture & Engineering | 0 (0.0%) | 0 (0.0%) |
| Life, Physical & Social Science | 0 (0.0%) | 16 (100.0%) |
| Community & Social Service | 42 (56.0%) | 33 (44.0%) |
| Education, Arts & Media | 0 (0.0%) | 0 (0.0%) |
| Legal Services & Support | 0 (0.0%) | 22 (100.0%) |
| Education Instruction & Library | 42 (79.2%) | 11 (20.7%) |
| Arts, Media & Entertainment | 0 (0.0%) | 0 (0.0%) |
| Health Diagnosing & Treating | 27 (24.3%) | 84 (75.7%) |
| Health Technologists | 27 (30.7%) | 61 (69.3%) |
| Total (Category) | 200 (47.6%) | 220 (52.4%) |
| Total (Overall) | 850 (59.9%) | 570 (40.1%) |
Services Occupations
The most common Services occupations in Dublin are Food Preparation & Serving (54 | 3.8%), Healthcare Support (49 | 3.5%), and Cleaning & Maintenance (31 | 2.2%).
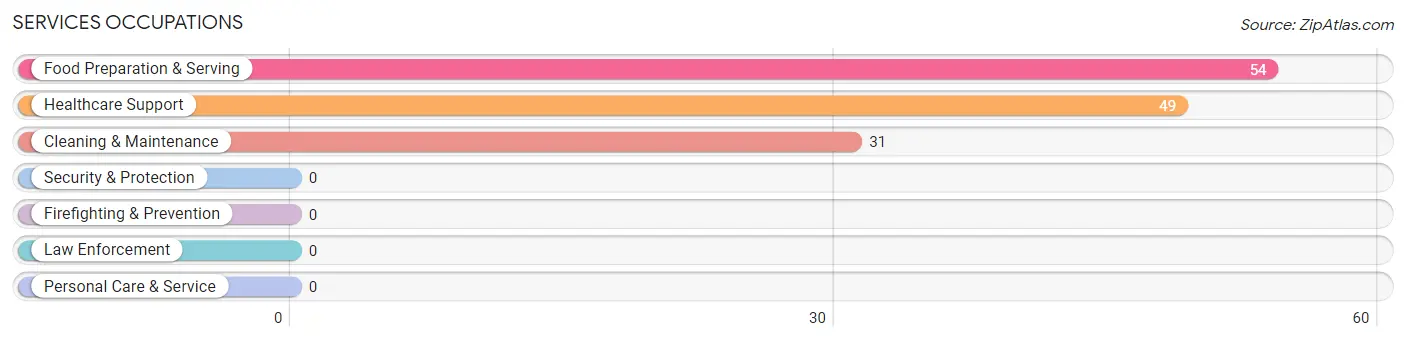
Services Occupations by Sex
Within the Services occupations in Dublin, the most male-oriented occupations are Food Preparation & Serving (68.5%), and Cleaning & Maintenance (54.8%), while the most female-oriented occupations are Healthcare Support (100.0%), Cleaning & Maintenance (45.2%), and Food Preparation & Serving (31.5%).
| Occupation | Male | Female |
| Healthcare Support | 0 (0.0%) | 49 (100.0%) |
| Security & Protection | 0 (0.0%) | 0 (0.0%) |
| Firefighting & Prevention | 0 (0.0%) | 0 (0.0%) |
| Law Enforcement | 0 (0.0%) | 0 (0.0%) |
| Food Preparation & Serving | 37 (68.5%) | 17 (31.5%) |
| Cleaning & Maintenance | 17 (54.8%) | 14 (45.2%) |
| Personal Care & Service | 0 (0.0%) | 0 (0.0%) |
| Total (Category) | 54 (40.3%) | 80 (59.7%) |
| Total (Overall) | 850 (59.9%) | 570 (40.1%) |
Sales and Office Occupations
The most common Sales and Office occupations in Dublin are Sales & Related (166 | 11.7%), and Office & Administration (77 | 5.4%).

Sales and Office Occupations by Sex

| Occupation | Male | Female |
| Sales & Related | 35 (21.1%) | 131 (78.9%) |
| Office & Administration | 0 (0.0%) | 77 (100.0%) |
| Total (Category) | 35 (14.4%) | 208 (85.6%) |
| Total (Overall) | 850 (59.9%) | 570 (40.1%) |
Natural Resources, Construction and Maintenance Occupations
The most common Natural Resources, Construction and Maintenance occupations in Dublin are Construction & Extraction (160 | 11.3%), Farming, Fishing & Forestry (56 | 3.9%), and Installation, Maintenance & Repair (26 | 1.8%).
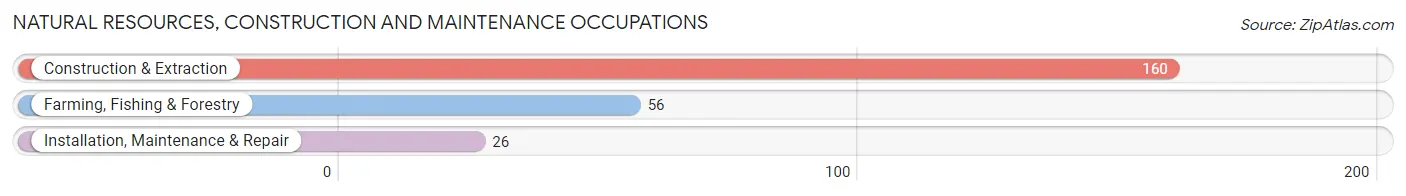
Natural Resources, Construction and Maintenance Occupations by Sex
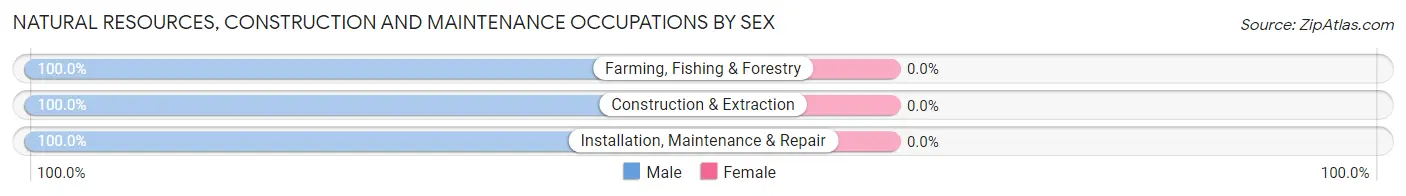
| Occupation | Male | Female |
| Farming, Fishing & Forestry | 56 (100.0%) | 0 (0.0%) |
| Construction & Extraction | 160 (100.0%) | 0 (0.0%) |
| Installation, Maintenance & Repair | 26 (100.0%) | 0 (0.0%) |
| Total (Category) | 242 (100.0%) | 0 (0.0%) |
| Total (Overall) | 850 (59.9%) | 570 (40.1%) |
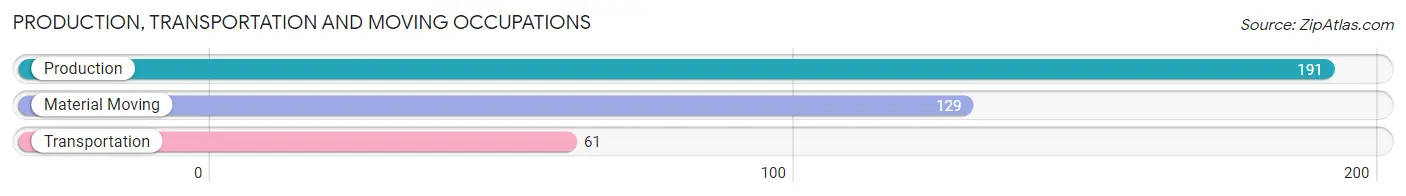
Production, Transportation and Moving Occupations
The most common Production, Transportation and Moving occupations in Dublin are Production (191 | 13.5%), Material Moving (129 | 9.1%), and Transportation (61 | 4.3%).
Production, Transportation and Moving Occupations by Sex
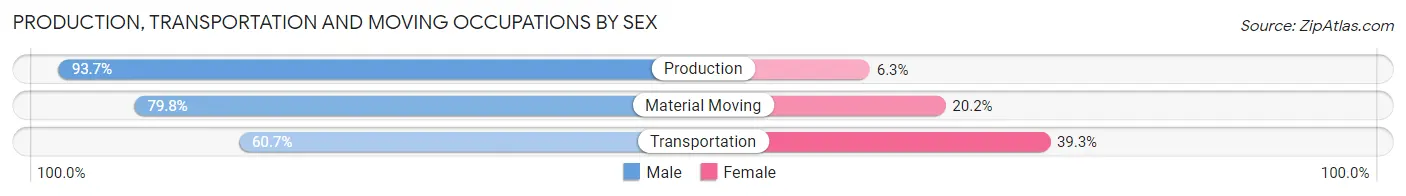
| Occupation | Male | Female |
| Production | 179 (93.7%) | 12 (6.3%) |
| Transportation | 37 (60.7%) | 24 (39.3%) |
| Material Moving | 103 (79.8%) | 26 (20.2%) |
| Total (Category) | 319 (83.7%) | 62 (16.3%) |
| Total (Overall) | 850 (59.9%) | 570 (40.1%) |
Employment Industries by Sex in Dublin
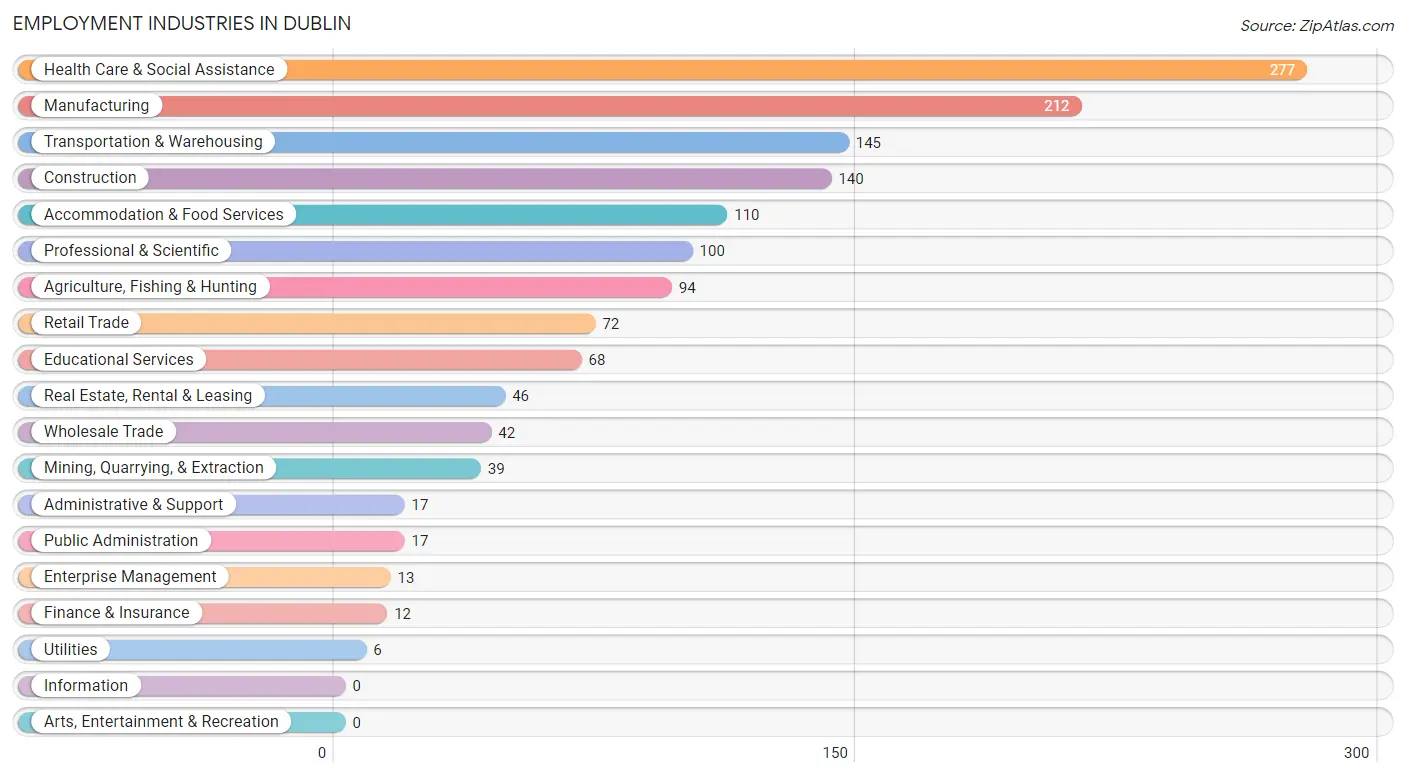
Employment Industries in Dublin
The major employment industries in Dublin include Health Care & Social Assistance (277 | 19.5%), Manufacturing (212 | 14.9%), Transportation & Warehousing (145 | 10.2%), Construction (140 | 9.9%), and Accommodation & Food Services (110 | 7.7%).
Employment Industries by Sex in Dublin
The Dublin industries that see more men than women are Agriculture, Fishing & Hunting (100.0%), Mining, Quarrying, & Extraction (100.0%), and Wholesale Trade (100.0%), whereas the industries that tend to have a higher number of women are Utilities (100.0%), Real Estate, Rental & Leasing (100.0%), and Public Administration (100.0%).
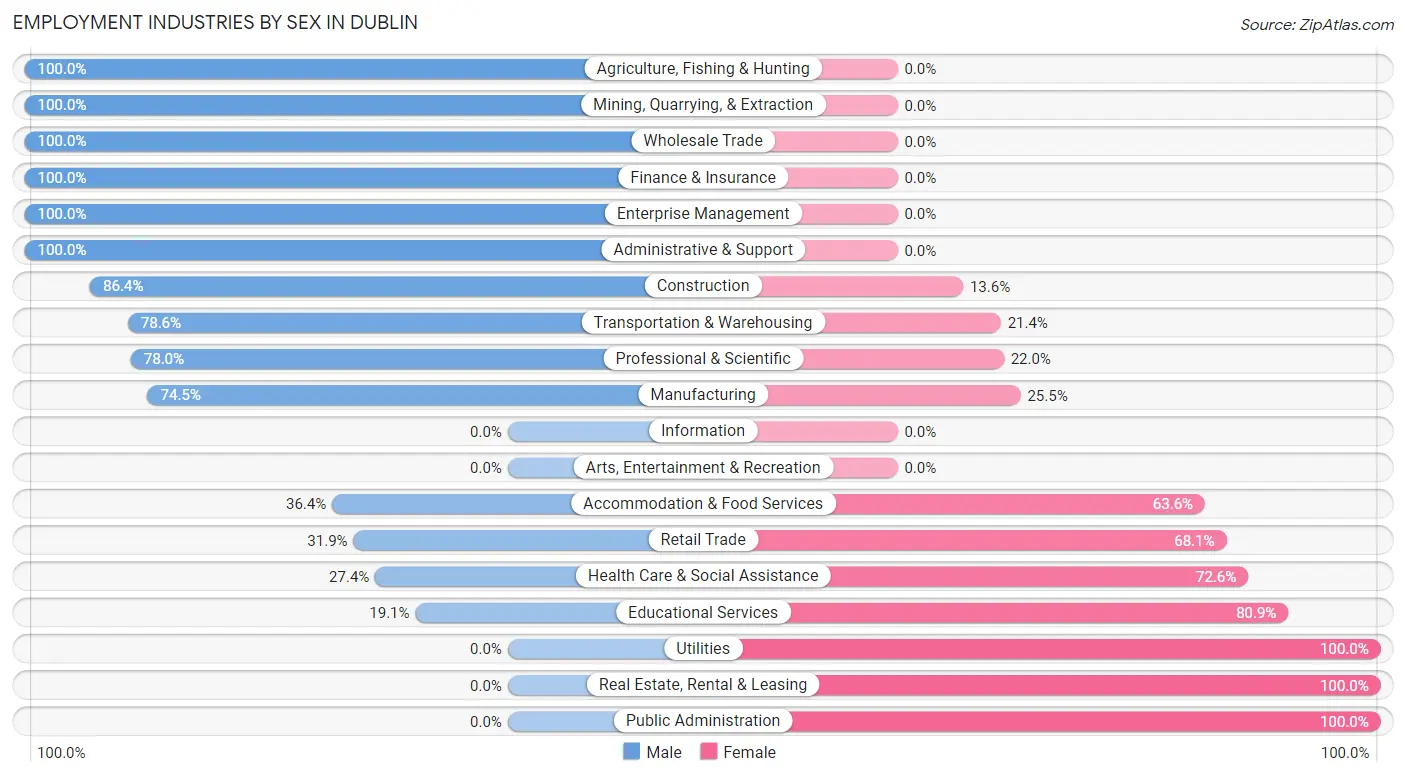
| Industry | Male | Female |
| Agriculture, Fishing & Hunting | 94 (100.0%) | 0 (0.0%) |
| Mining, Quarrying, & Extraction | 39 (100.0%) | 0 (0.0%) |
| Construction | 121 (86.4%) | 19 (13.6%) |
| Manufacturing | 158 (74.5%) | 54 (25.5%) |
| Wholesale Trade | 42 (100.0%) | 0 (0.0%) |
| Retail Trade | 23 (31.9%) | 49 (68.1%) |
| Transportation & Warehousing | 114 (78.6%) | 31 (21.4%) |
| Utilities | 0 (0.0%) | 6 (100.0%) |
| Information | 0 (0.0%) | 0 (0.0%) |
| Finance & Insurance | 12 (100.0%) | 0 (0.0%) |
| Real Estate, Rental & Leasing | 0 (0.0%) | 46 (100.0%) |
| Professional & Scientific | 78 (78.0%) | 22 (22.0%) |
| Enterprise Management | 13 (100.0%) | 0 (0.0%) |
| Administrative & Support | 17 (100.0%) | 0 (0.0%) |
| Educational Services | 13 (19.1%) | 55 (80.9%) |
| Health Care & Social Assistance | 76 (27.4%) | 201 (72.6%) |
| Arts, Entertainment & Recreation | 0 (0.0%) | 0 (0.0%) |
| Accommodation & Food Services | 40 (36.4%) | 70 (63.6%) |
| Public Administration | 0 (0.0%) | 17 (100.0%) |
| Total | 850 (59.9%) | 570 (40.1%) |
Education in Dublin
School Enrollment in Dublin
The most common levels of schooling among the 876 students in Dublin are elementary school (225 | 25.7%), college / undergraduate (209 | 23.9%), and high school (202 | 23.1%).
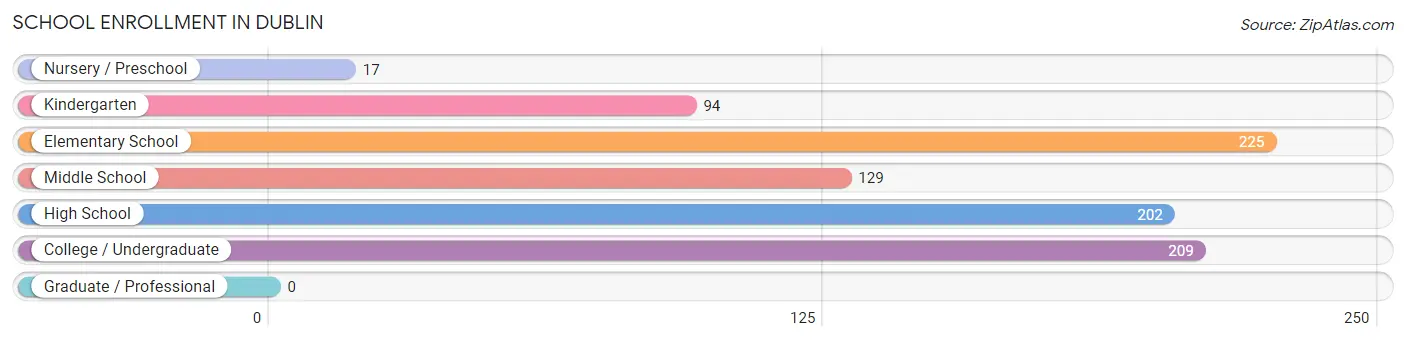
| School Level | # Students | % Students |
| Nursery / Preschool | 17 | 1.9% |
| Kindergarten | 94 | 10.7% |
| Elementary School | 225 | 25.7% |
| Middle School | 129 | 14.7% |
| High School | 202 | 23.1% |
| College / Undergraduate | 209 | 23.9% |
| Graduate / Professional | 0 | 0.0% |
| Total | 876 | 100.0% |
School Enrollment by Age by Funding Source in Dublin
Out of a total of 876 students who are enrolled in schools in Dublin, 116 (13.2%) attend a private institution, while the remaining 760 (86.8%) are enrolled in public schools. The age group of 3 to 4 year olds has the highest likelihood of being enrolled in private schools, with 8 (47.1% in the age bracket) enrolled. Conversely, the age group of 15 to 17 year olds has the lowest likelihood of being enrolled in a private school, with 138 (100.0% in the age bracket) attending a public institution.
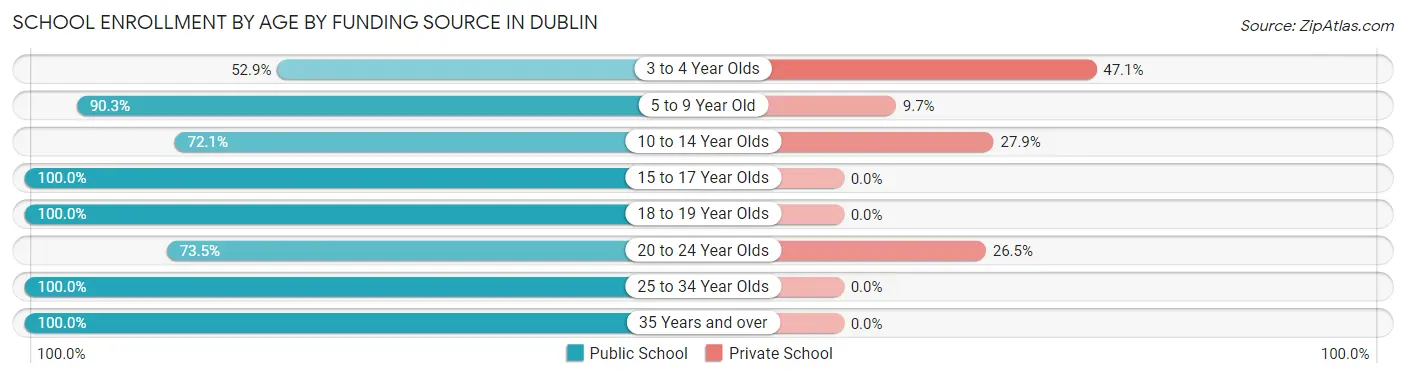
| Age Bracket | Public School | Private School |
| 3 to 4 Year Olds | 9 (52.9%) | 8 (47.1%) |
| 5 to 9 Year Old | 288 (90.3%) | 31 (9.7%) |
| 10 to 14 Year Olds | 129 (72.1%) | 50 (27.9%) |
| 15 to 17 Year Olds | 138 (100.0%) | 0 (0.0%) |
| 18 to 19 Year Olds | 36 (100.0%) | 0 (0.0%) |
| 20 to 24 Year Olds | 75 (73.5%) | 27 (26.5%) |
| 25 to 34 Year Olds | 45 (100.0%) | 0 (0.0%) |
| 35 Years and over | 40 (100.0%) | 0 (0.0%) |
| Total | 760 (86.8%) | 116 (13.2%) |
Educational Attainment by Field of Study in Dublin
Computers & mathematics (84 | 19.3%), education (79 | 18.1%), business (73 | 16.7%), science & technology (62 | 14.2%), and bio, nature & agricultural (48 | 11.0%) are the most common fields of study among 436 individuals in Dublin who have obtained a bachelor's degree or higher.
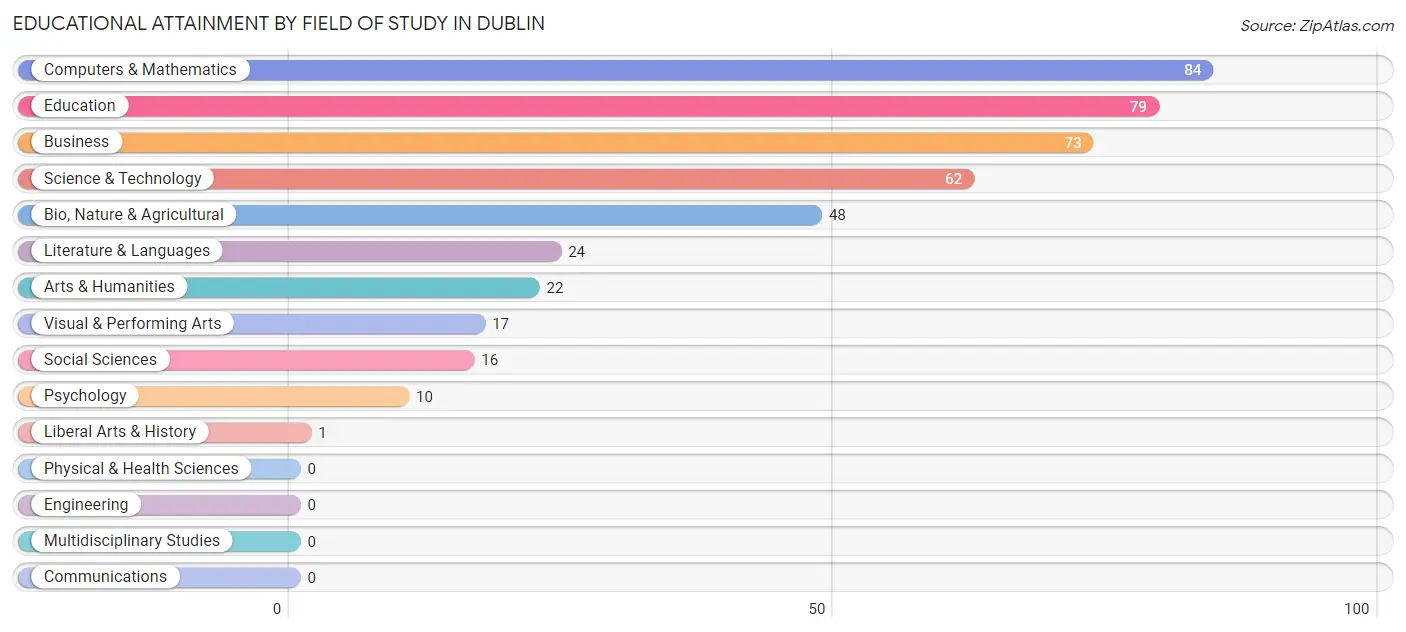
| Field of Study | # Graduates | % Graduates |
| Computers & Mathematics | 84 | 19.3% |
| Bio, Nature & Agricultural | 48 | 11.0% |
| Physical & Health Sciences | 0 | 0.0% |
| Psychology | 10 | 2.3% |
| Social Sciences | 16 | 3.7% |
| Engineering | 0 | 0.0% |
| Multidisciplinary Studies | 0 | 0.0% |
| Science & Technology | 62 | 14.2% |
| Business | 73 | 16.7% |
| Education | 79 | 18.1% |
| Literature & Languages | 24 | 5.5% |
| Liberal Arts & History | 1 | 0.2% |
| Visual & Performing Arts | 17 | 3.9% |
| Communications | 0 | 0.0% |
| Arts & Humanities | 22 | 5.1% |
| Total | 436 | 100.0% |
Transportation & Commute in Dublin
Vehicle Availability by Sex in Dublin
The most prevalent vehicle ownership categories in Dublin are males with 2 vehicles (320, accounting for 37.7%) and females with 2 vehicles (224, making up 57.9%).
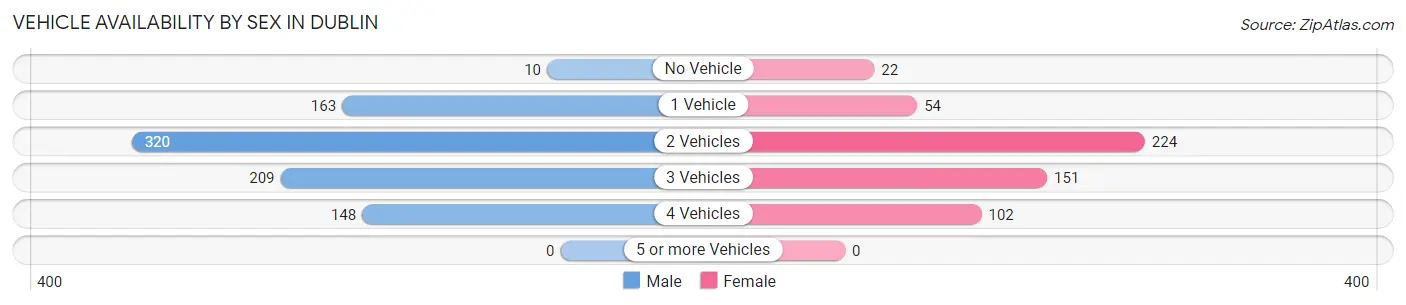
| Vehicles Available | Male | Female |
| No Vehicle | 10 (1.2%) | 22 (4.0%) |
| 1 Vehicle | 163 (19.2%) | 54 (9.8%) |
| 2 Vehicles | 320 (37.7%) | 224 (40.5%) |
| 3 Vehicles | 209 (24.6%) | 151 (27.3%) |
| 4 Vehicles | 148 (17.4%) | 102 (18.4%) |
| 5 or more Vehicles | 0 (0.0%) | 0 (0.0%) |
| Total | 850 (100.0%) | 553 (100.0%) |
Commute Time in Dublin
The most frequently occuring commute durations in Dublin are 20 to 24 minutes (313 commuters, 23.7%), 10 to 14 minutes (311 commuters, 23.6%), and 5 to 9 minutes (177 commuters, 13.4%).
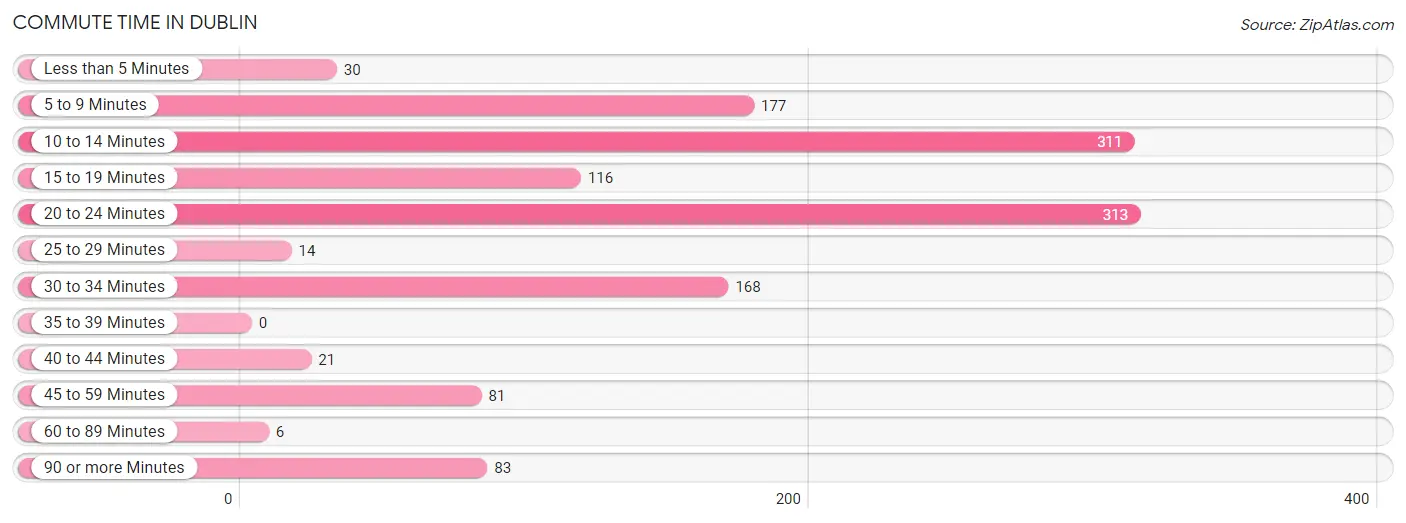
| Commute Time | # Commuters | % Commuters |
| Less than 5 Minutes | 30 | 2.3% |
| 5 to 9 Minutes | 177 | 13.4% |
| 10 to 14 Minutes | 311 | 23.6% |
| 15 to 19 Minutes | 116 | 8.8% |
| 20 to 24 Minutes | 313 | 23.7% |
| 25 to 29 Minutes | 14 | 1.1% |
| 30 to 34 Minutes | 168 | 12.7% |
| 35 to 39 Minutes | 0 | 0.0% |
| 40 to 44 Minutes | 21 | 1.6% |
| 45 to 59 Minutes | 81 | 6.1% |
| 60 to 89 Minutes | 6 | 0.4% |
| 90 or more Minutes | 83 | 6.3% |
Commute Time by Sex in Dublin
The most common commute times in Dublin are 10 to 14 minutes (292 commuters, 35.7%) for males and 20 to 24 minutes (196 commuters, 39.0%) for females.
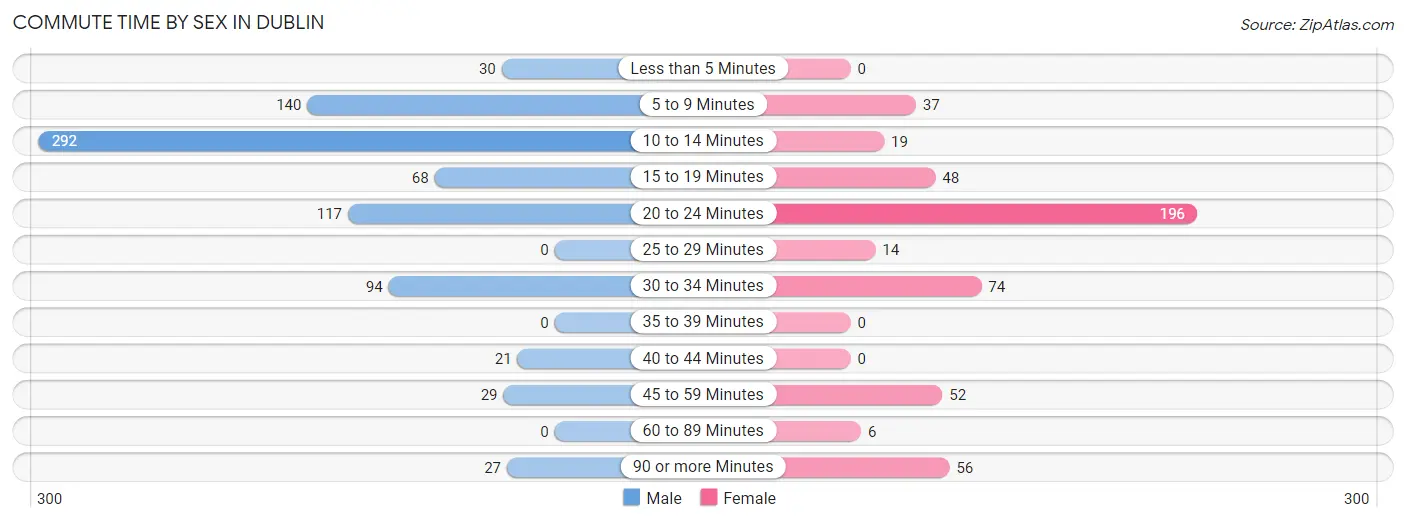
| Commute Time | Male | Female |
| Less than 5 Minutes | 30 (3.7%) | 0 (0.0%) |
| 5 to 9 Minutes | 140 (17.1%) | 37 (7.4%) |
| 10 to 14 Minutes | 292 (35.7%) | 19 (3.8%) |
| 15 to 19 Minutes | 68 (8.3%) | 48 (9.6%) |
| 20 to 24 Minutes | 117 (14.3%) | 196 (39.0%) |
| 25 to 29 Minutes | 0 (0.0%) | 14 (2.8%) |
| 30 to 34 Minutes | 94 (11.5%) | 74 (14.7%) |
| 35 to 39 Minutes | 0 (0.0%) | 0 (0.0%) |
| 40 to 44 Minutes | 21 (2.6%) | 0 (0.0%) |
| 45 to 59 Minutes | 29 (3.5%) | 52 (10.4%) |
| 60 to 89 Minutes | 0 (0.0%) | 6 (1.2%) |
| 90 or more Minutes | 27 (3.3%) | 56 (11.2%) |
Time of Departure to Work by Sex in Dublin
The most frequent times of departure to work in Dublin are 7:30 AM to 7:59 AM (194, 23.7%) for males and 9:00 AM to 9:59 AM (94, 18.7%) for females.
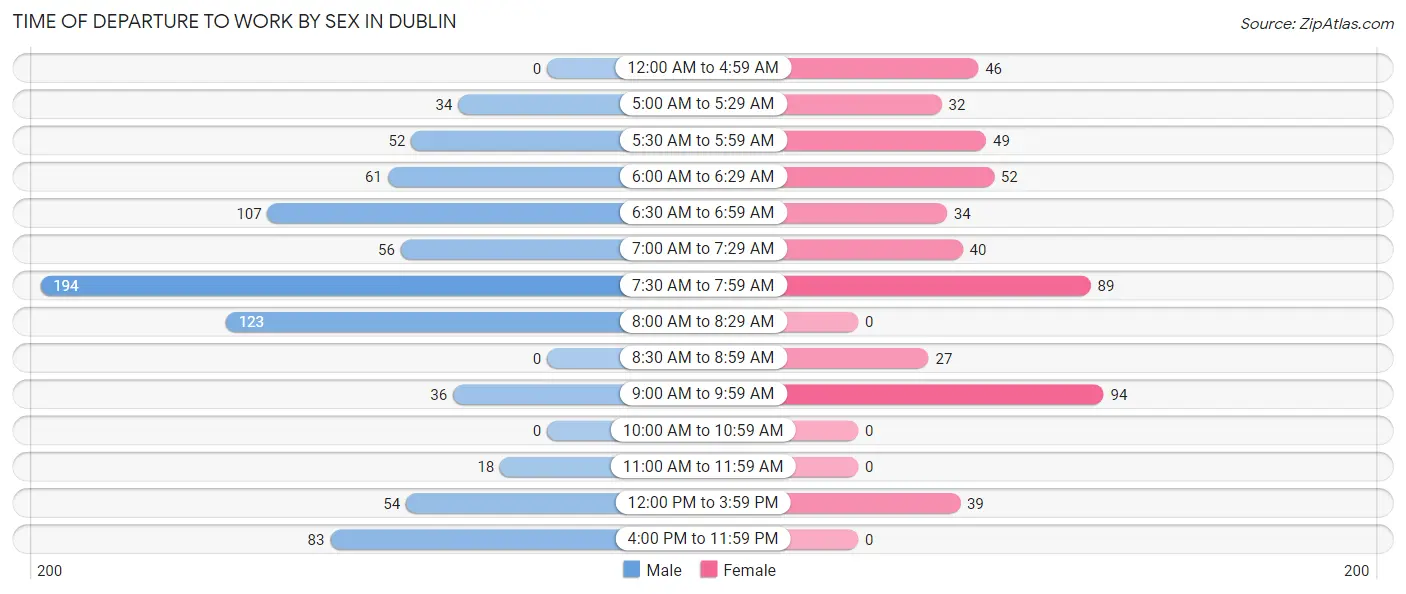
| Time of Departure | Male | Female |
| 12:00 AM to 4:59 AM | 0 (0.0%) | 46 (9.2%) |
| 5:00 AM to 5:29 AM | 34 (4.2%) | 32 (6.4%) |
| 5:30 AM to 5:59 AM | 52 (6.4%) | 49 (9.8%) |
| 6:00 AM to 6:29 AM | 61 (7.5%) | 52 (10.4%) |
| 6:30 AM to 6:59 AM | 107 (13.1%) | 34 (6.8%) |
| 7:00 AM to 7:29 AM | 56 (6.9%) | 40 (8.0%) |
| 7:30 AM to 7:59 AM | 194 (23.7%) | 89 (17.7%) |
| 8:00 AM to 8:29 AM | 123 (15.0%) | 0 (0.0%) |
| 8:30 AM to 8:59 AM | 0 (0.0%) | 27 (5.4%) |
| 9:00 AM to 9:59 AM | 36 (4.4%) | 94 (18.7%) |
| 10:00 AM to 10:59 AM | 0 (0.0%) | 0 (0.0%) |
| 11:00 AM to 11:59 AM | 18 (2.2%) | 0 (0.0%) |
| 12:00 PM to 3:59 PM | 54 (6.6%) | 39 (7.8%) |
| 4:00 PM to 11:59 PM | 83 (10.2%) | 0 (0.0%) |
| Total | 818 (100.0%) | 502 (100.0%) |
Housing Occupancy in Dublin
Occupancy by Ownership in Dublin
Of the total 1,163 dwellings in Dublin, owner-occupied units account for 894 (76.9%), while renter-occupied units make up 269 (23.1%).
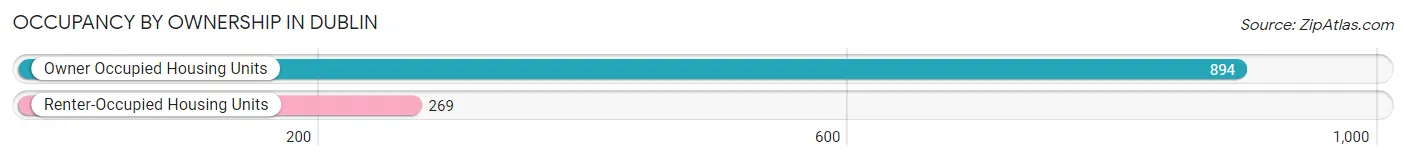
| Occupancy | # Housing Units | % Housing Units |
| Owner Occupied Housing Units | 894 | 76.9% |
| Renter-Occupied Housing Units | 269 | 23.1% |
| Total Occupied Housing Units | 1,163 | 100.0% |
Occupancy by Household Size in Dublin
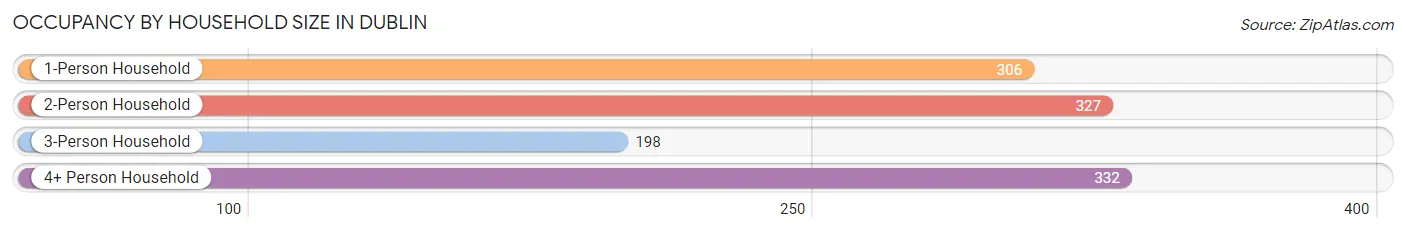
| Household Size | # Housing Units | % Housing Units |
| 1-Person Household | 306 | 26.3% |
| 2-Person Household | 327 | 28.1% |
| 3-Person Household | 198 | 17.0% |
| 4+ Person Household | 332 | 28.5% |
| Total Housing Units | 1,163 | 100.0% |
Occupancy by Ownership by Household Size in Dublin
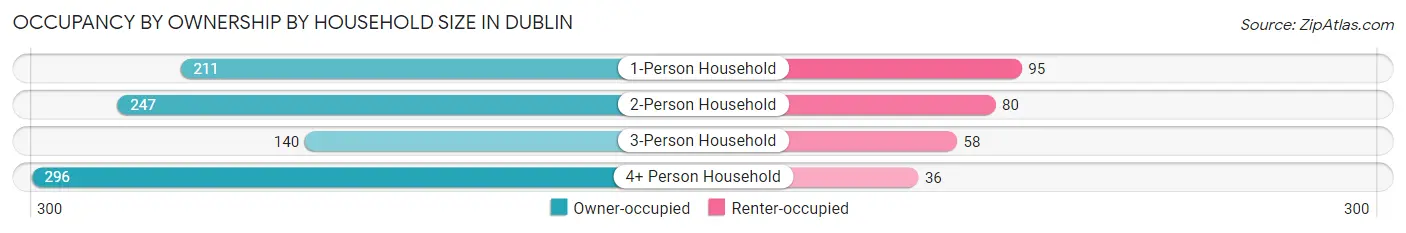
| Household Size | Owner-occupied | Renter-occupied |
| 1-Person Household | 211 (69.0%) | 95 (31.0%) |
| 2-Person Household | 247 (75.5%) | 80 (24.5%) |
| 3-Person Household | 140 (70.7%) | 58 (29.3%) |
| 4+ Person Household | 296 (89.2%) | 36 (10.8%) |
| Total Housing Units | 894 (76.9%) | 269 (23.1%) |
Occupancy by Educational Attainment in Dublin
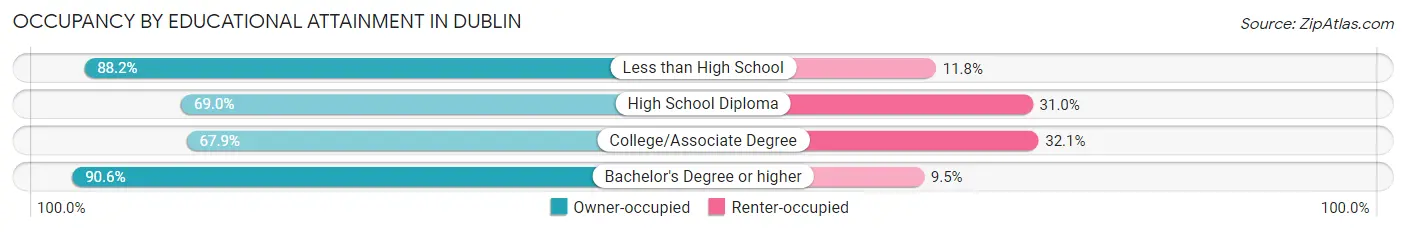
| Household Size | Owner-occupied | Renter-occupied |
| Less than High School | 194 (88.2%) | 26 (11.8%) |
| High School Diploma | 149 (69.0%) | 67 (31.0%) |
| College/Associate Degree | 321 (67.9%) | 152 (32.1%) |
| Bachelor's Degree or higher | 230 (90.5%) | 24 (9.5%) |
Occupancy by Age of Householder in Dublin
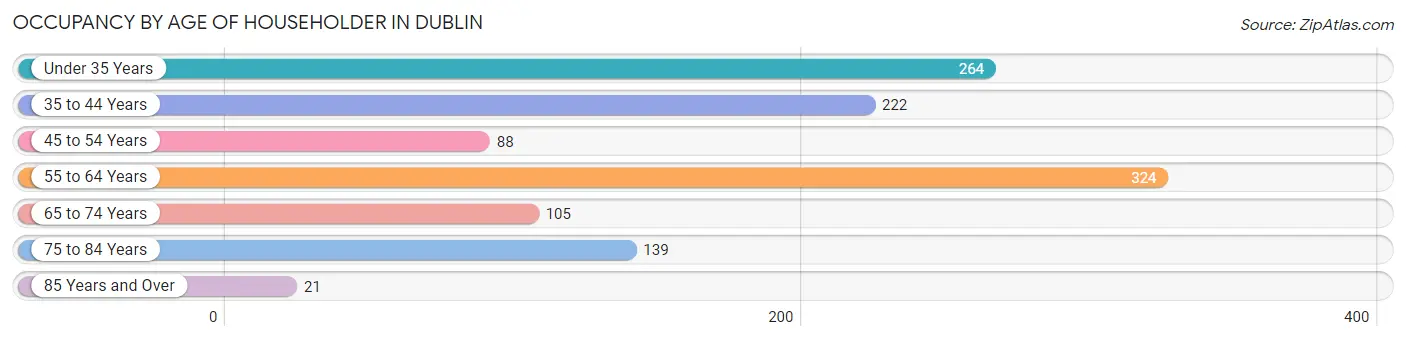
| Age Bracket | # Households | % Households |
| Under 35 Years | 264 | 22.7% |
| 35 to 44 Years | 222 | 19.1% |
| 45 to 54 Years | 88 | 7.6% |
| 55 to 64 Years | 324 | 27.9% |
| 65 to 74 Years | 105 | 9.0% |
| 75 to 84 Years | 139 | 11.9% |
| 85 Years and Over | 21 | 1.8% |
| Total | 1,163 | 100.0% |
Housing Finances in Dublin
Median Income by Occupancy in Dublin
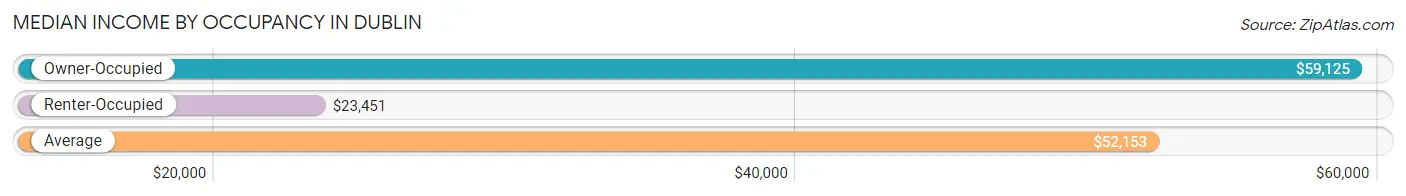
| Occupancy Type | # Households | Median Income |
| Owner-Occupied | 894 (76.9%) | $59,125 |
| Renter-Occupied | 269 (23.1%) | $23,451 |
| Average | 1,163 (100.0%) | $52,153 |
Occupancy by Householder Income Bracket in Dublin
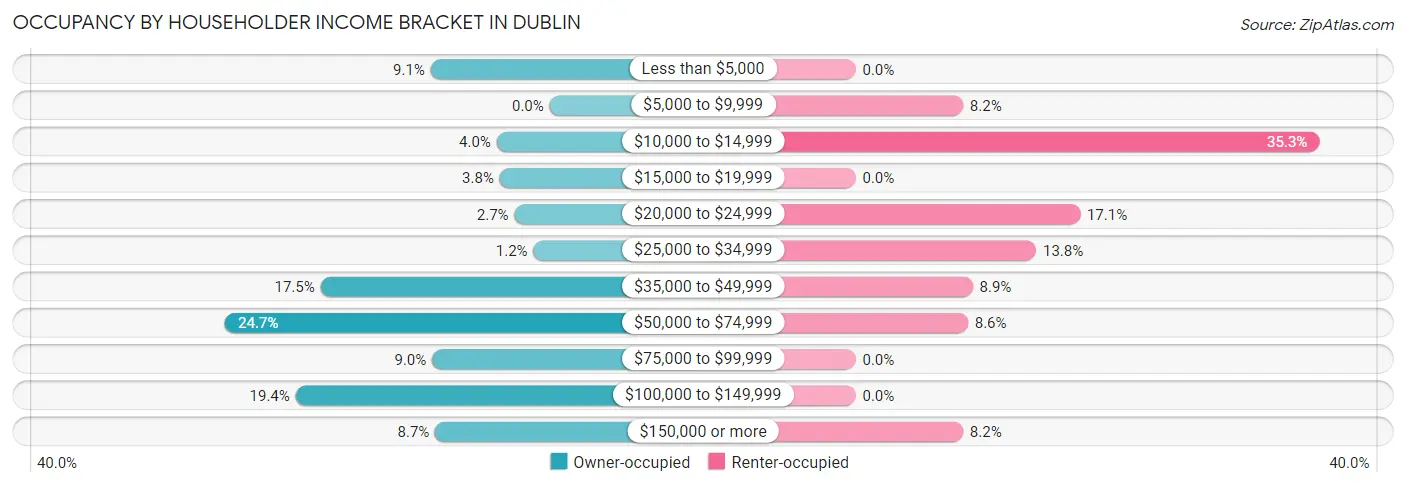
| Income Bracket | Owner-occupied | Renter-occupied |
| Less than $5,000 | 81 (9.1%) | 0 (0.0%) |
| $5,000 to $9,999 | 0 (0.0%) | 22 (8.2%) |
| $10,000 to $14,999 | 36 (4.0%) | 95 (35.3%) |
| $15,000 to $19,999 | 34 (3.8%) | 0 (0.0%) |
| $20,000 to $24,999 | 24 (2.7%) | 46 (17.1%) |
| $25,000 to $34,999 | 11 (1.2%) | 37 (13.8%) |
| $35,000 to $49,999 | 156 (17.4%) | 24 (8.9%) |
| $50,000 to $74,999 | 221 (24.7%) | 23 (8.6%) |
| $75,000 to $99,999 | 80 (8.9%) | 0 (0.0%) |
| $100,000 to $149,999 | 173 (19.4%) | 0 (0.0%) |
| $150,000 or more | 78 (8.7%) | 22 (8.2%) |
| Total | 894 (100.0%) | 269 (100.0%) |
Monthly Housing Cost Tiers in Dublin
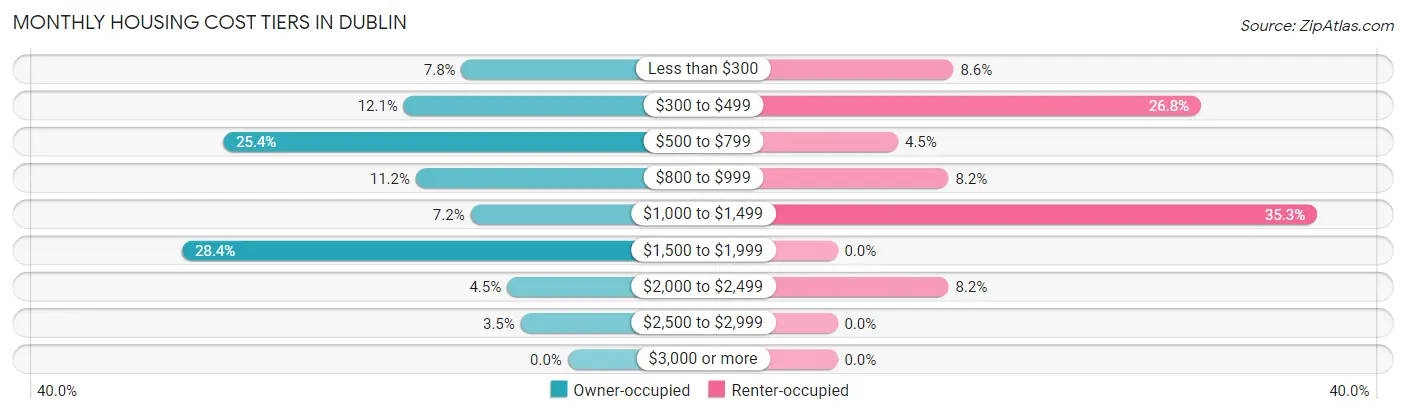
| Monthly Cost | Owner-occupied | Renter-occupied |
| Less than $300 | 70 (7.8%) | 23 (8.6%) |
| $300 to $499 | 108 (12.1%) | 72 (26.8%) |
| $500 to $799 | 227 (25.4%) | 12 (4.5%) |
| $800 to $999 | 100 (11.2%) | 22 (8.2%) |
| $1,000 to $1,499 | 64 (7.2%) | 95 (35.3%) |
| $1,500 to $1,999 | 254 (28.4%) | 0 (0.0%) |
| $2,000 to $2,499 | 40 (4.5%) | 22 (8.2%) |
| $2,500 to $2,999 | 31 (3.5%) | 0 (0.0%) |
| $3,000 or more | 0 (0.0%) | 0 (0.0%) |
| Total | 894 (100.0%) | 269 (100.0%) |
Physical Housing Characteristics in Dublin
Housing Structures in Dublin
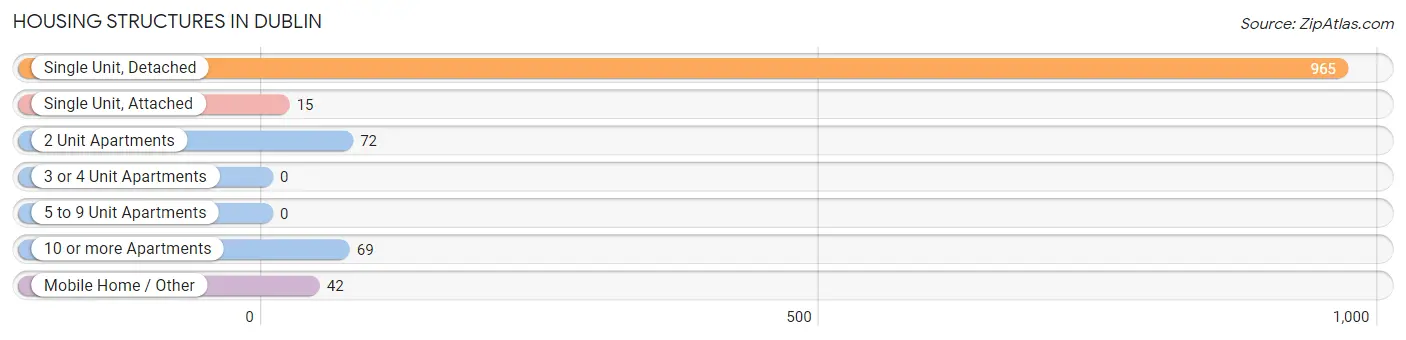
| Structure Type | # Housing Units | % Housing Units |
| Single Unit, Detached | 965 | 83.0% |
| Single Unit, Attached | 15 | 1.3% |
| 2 Unit Apartments | 72 | 6.2% |
| 3 or 4 Unit Apartments | 0 | 0.0% |
| 5 to 9 Unit Apartments | 0 | 0.0% |
| 10 or more Apartments | 69 | 5.9% |
| Mobile Home / Other | 42 | 3.6% |
| Total | 1,163 | 100.0% |
Housing Structures by Occupancy in Dublin
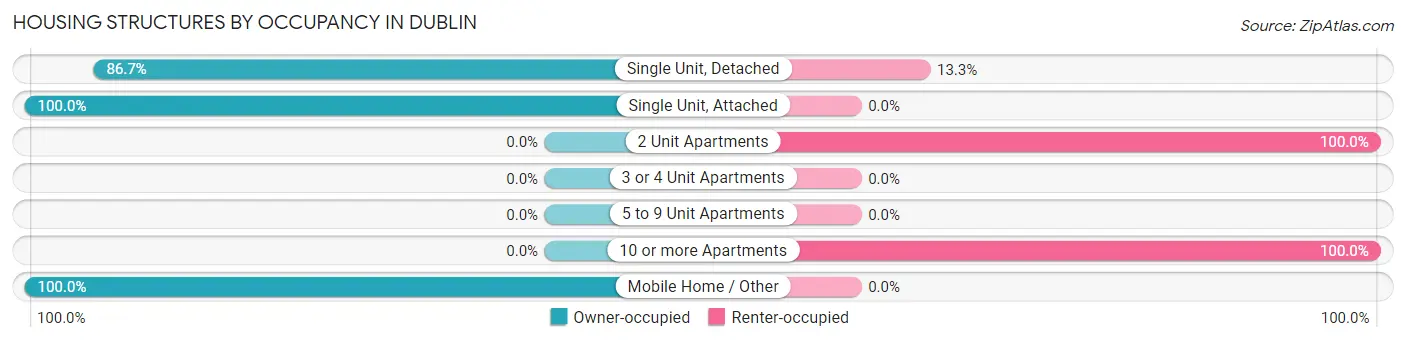
| Structure Type | Owner-occupied | Renter-occupied |
| Single Unit, Detached | 837 (86.7%) | 128 (13.3%) |
| Single Unit, Attached | 15 (100.0%) | 0 (0.0%) |
| 2 Unit Apartments | 0 (0.0%) | 72 (100.0%) |
| 3 or 4 Unit Apartments | 0 (0.0%) | 0 (0.0%) |
| 5 to 9 Unit Apartments | 0 (0.0%) | 0 (0.0%) |
| 10 or more Apartments | 0 (0.0%) | 69 (100.0%) |
| Mobile Home / Other | 42 (100.0%) | 0 (0.0%) |
| Total | 894 (76.9%) | 269 (23.1%) |
Housing Structures by Number of Rooms in Dublin
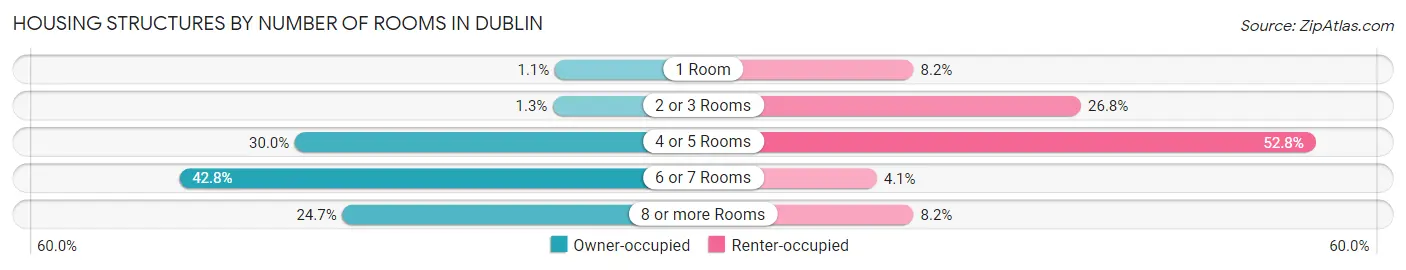
| Number of Rooms | Owner-occupied | Renter-occupied |
| 1 Room | 10 (1.1%) | 22 (8.2%) |
| 2 or 3 Rooms | 12 (1.3%) | 72 (26.8%) |
| 4 or 5 Rooms | 268 (30.0%) | 142 (52.8%) |
| 6 or 7 Rooms | 383 (42.8%) | 11 (4.1%) |
| 8 or more Rooms | 221 (24.7%) | 22 (8.2%) |
| Total | 894 (100.0%) | 269 (100.0%) |
Housing Structure by Heating Type in Dublin
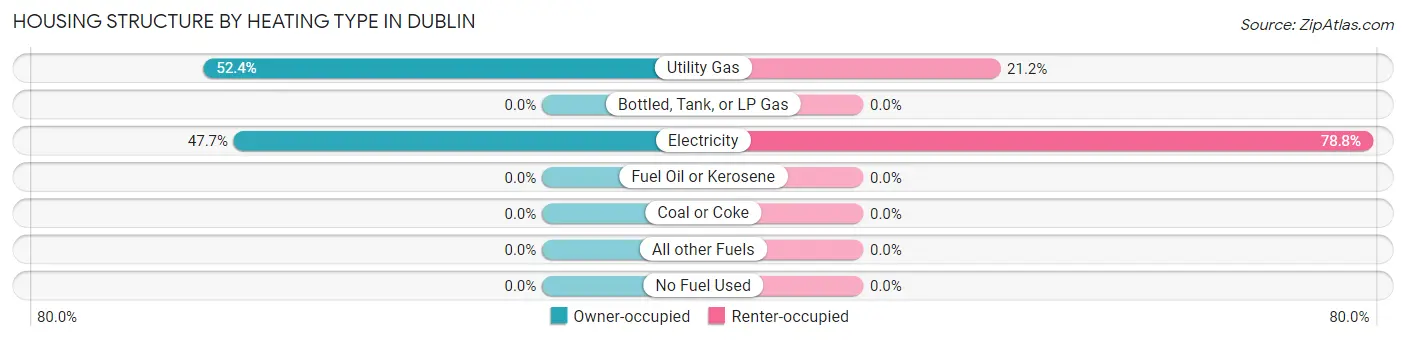
| Heating Type | Owner-occupied | Renter-occupied |
| Utility Gas | 468 (52.3%) | 57 (21.2%) |
| Bottled, Tank, or LP Gas | 0 (0.0%) | 0 (0.0%) |
| Electricity | 426 (47.6%) | 212 (78.8%) |
| Fuel Oil or Kerosene | 0 (0.0%) | 0 (0.0%) |
| Coal or Coke | 0 (0.0%) | 0 (0.0%) |
| All other Fuels | 0 (0.0%) | 0 (0.0%) |
| No Fuel Used | 0 (0.0%) | 0 (0.0%) |
| Total | 894 (100.0%) | 269 (100.0%) |
Household Vehicle Usage in Dublin
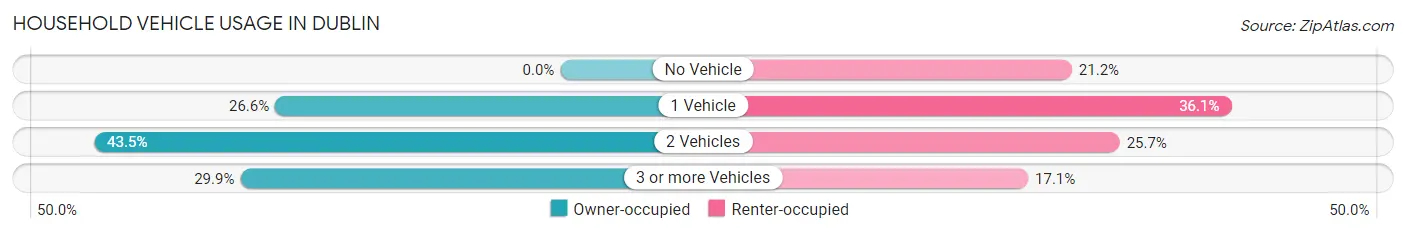
| Vehicles per Household | Owner-occupied | Renter-occupied |
| No Vehicle | 0 (0.0%) | 57 (21.2%) |
| 1 Vehicle | 238 (26.6%) | 97 (36.1%) |
| 2 Vehicles | 389 (43.5%) | 69 (25.7%) |
| 3 or more Vehicles | 267 (29.9%) | 46 (17.1%) |
| Total | 894 (100.0%) | 269 (100.0%) |
Real Estate & Mortgages in Dublin
Real Estate and Mortgage Overview in Dublin
| Characteristic | Without Mortgage | With Mortgage |
| Housing Units | 518 | 376 |
| Median Property Value | $126,100 | $188,900 |
| Median Household Income | $52,917 | $15 |
| Monthly Housing Costs | $559 | $0 |
| Real Estate Taxes | $2,195 | $0 |
Property Value by Mortgage Status in Dublin
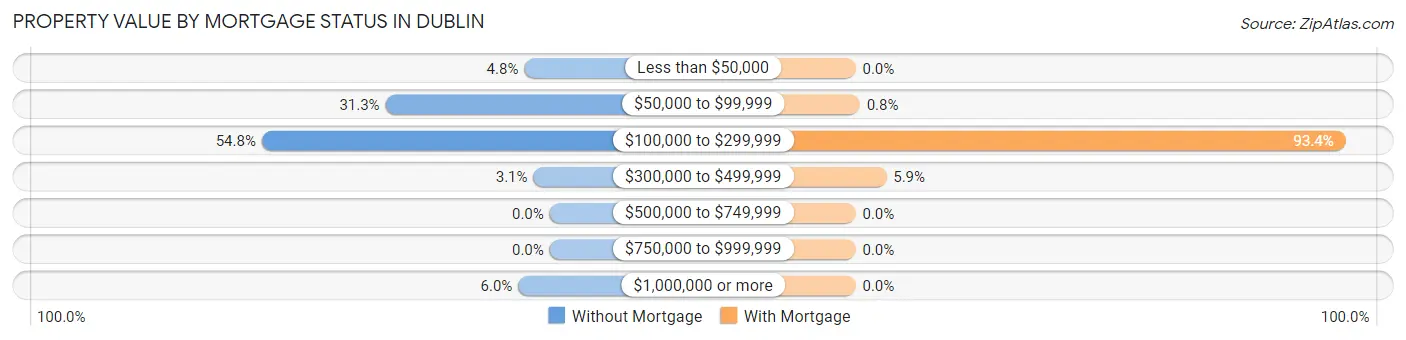
| Property Value | Without Mortgage | With Mortgage |
| Less than $50,000 | 25 (4.8%) | 0 (0.0%) |
| $50,000 to $99,999 | 162 (31.3%) | 3 (0.8%) |
| $100,000 to $299,999 | 284 (54.8%) | 351 (93.3%) |
| $300,000 to $499,999 | 16 (3.1%) | 22 (5.9%) |
| $500,000 to $749,999 | 0 (0.0%) | 0 (0.0%) |
| $750,000 to $999,999 | 0 (0.0%) | 0 (0.0%) |
| $1,000,000 or more | 31 (6.0%) | 0 (0.0%) |
| Total | 518 (100.0%) | 376 (100.0%) |
Household Income by Mortgage Status in Dublin
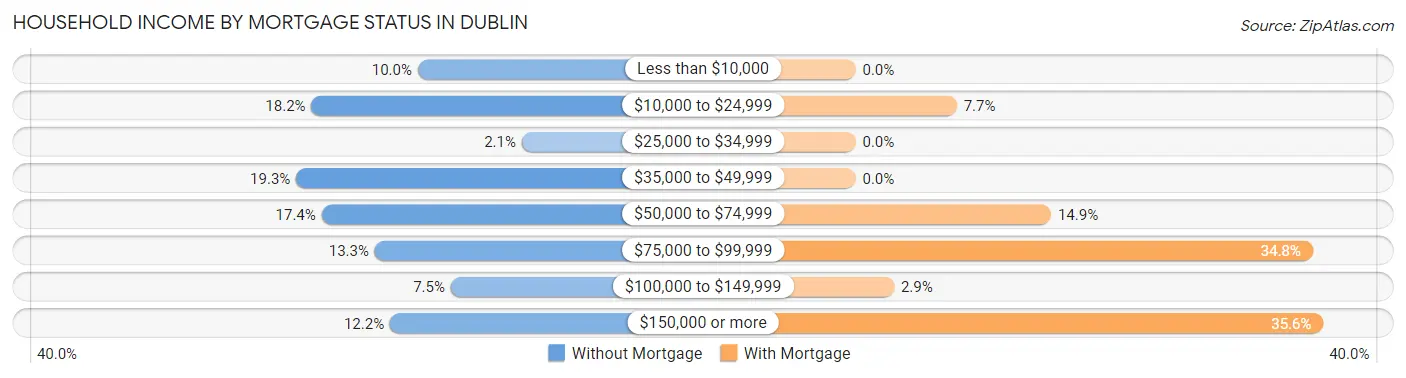
| Household Income | Without Mortgage | With Mortgage |
| Less than $10,000 | 52 (10.0%) | 0 (0.0%) |
| $10,000 to $24,999 | 94 (18.1%) | 29 (7.7%) |
| $25,000 to $34,999 | 11 (2.1%) | 0 (0.0%) |
| $35,000 to $49,999 | 100 (19.3%) | 0 (0.0%) |
| $50,000 to $74,999 | 90 (17.4%) | 56 (14.9%) |
| $75,000 to $99,999 | 69 (13.3%) | 131 (34.8%) |
| $100,000 to $149,999 | 39 (7.5%) | 11 (2.9%) |
| $150,000 or more | 63 (12.2%) | 134 (35.6%) |
| Total | 518 (100.0%) | 376 (100.0%) |
Property Value to Household Income Ratio in Dublin
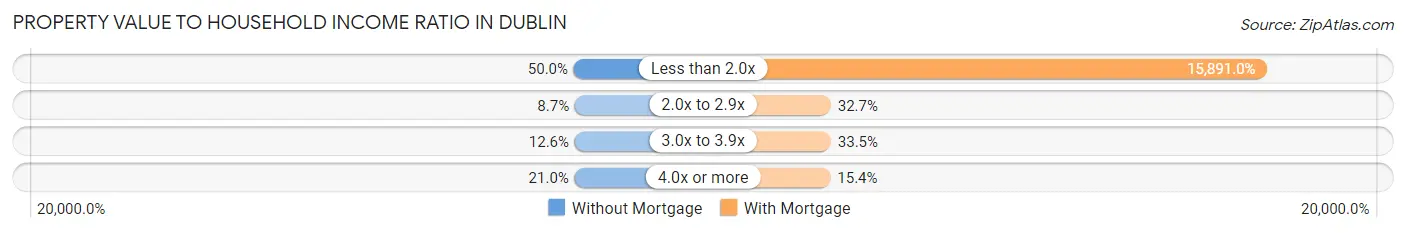
| Value-to-Income Ratio | Without Mortgage | With Mortgage |
| Less than 2.0x | 259 (50.0%) | 59,750 (15,891.0%) |
| 2.0x to 2.9x | 45 (8.7%) | 123 (32.7%) |
| 3.0x to 3.9x | 65 (12.6%) | 126 (33.5%) |
| 4.0x or more | 109 (21.0%) | 58 (15.4%) |
| Total | 518 (100.0%) | 376 (100.0%) |
Real Estate Taxes by Mortgage Status in Dublin
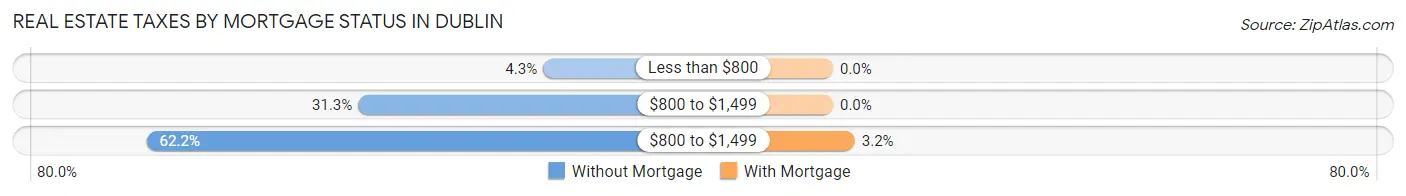
| Property Taxes | Without Mortgage | With Mortgage |
| Less than $800 | 22 (4.3%) | 0 (0.0%) |
| $800 to $1,499 | 162 (31.3%) | 0 (0.0%) |
| $800 to $1,499 | 322 (62.2%) | 12 (3.2%) |
| Total | 518 (100.0%) | 376 (100.0%) |
Health & Disability in Dublin
Health Insurance Coverage by Age in Dublin
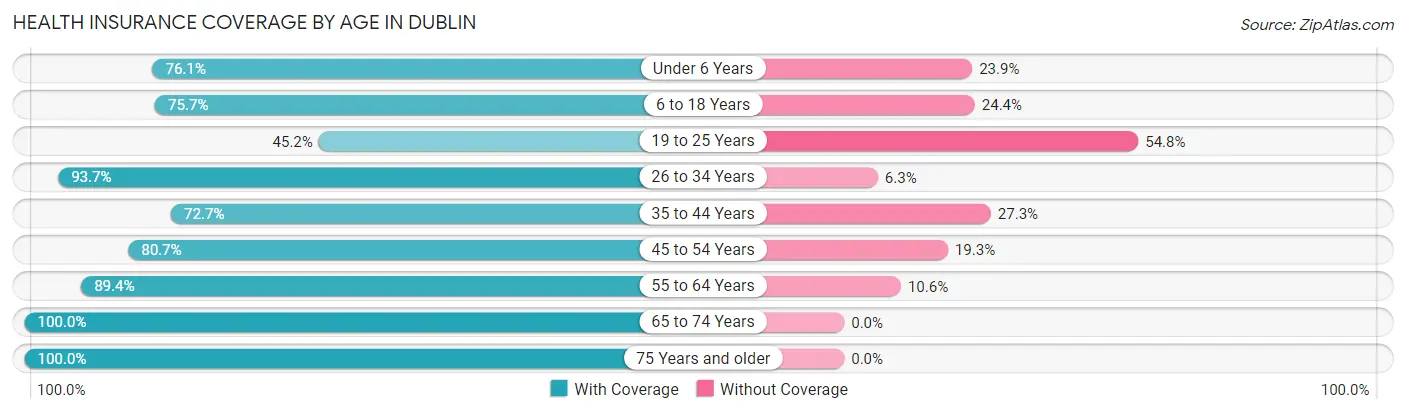
| Age Bracket | With Coverage | Without Coverage |
| Under 6 Years | 335 (76.1%) | 105 (23.9%) |
| 6 to 18 Years | 497 (75.6%) | 160 (24.3%) |
| 19 to 25 Years | 187 (45.2%) | 227 (54.8%) |
| 26 to 34 Years | 329 (93.7%) | 22 (6.3%) |
| 35 to 44 Years | 279 (72.7%) | 105 (27.3%) |
| 45 to 54 Years | 196 (80.7%) | 47 (19.3%) |
| 55 to 64 Years | 423 (89.4%) | 50 (10.6%) |
| 65 to 74 Years | 182 (100.0%) | 0 (0.0%) |
| 75 Years and older | 198 (100.0%) | 0 (0.0%) |
| Total | 2,626 (78.6%) | 716 (21.4%) |
Health Insurance Coverage by Citizenship Status in Dublin
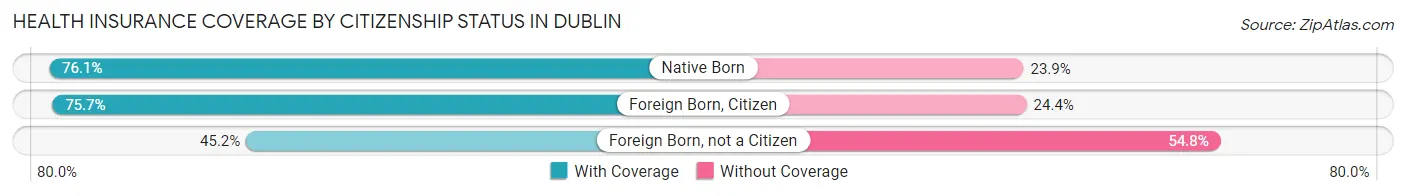
| Citizenship Status | With Coverage | Without Coverage |
| Native Born | 335 (76.1%) | 105 (23.9%) |
| Foreign Born, Citizen | 497 (75.6%) | 160 (24.3%) |
| Foreign Born, not a Citizen | 187 (45.2%) | 227 (54.8%) |
Health Insurance Coverage by Household Income in Dublin
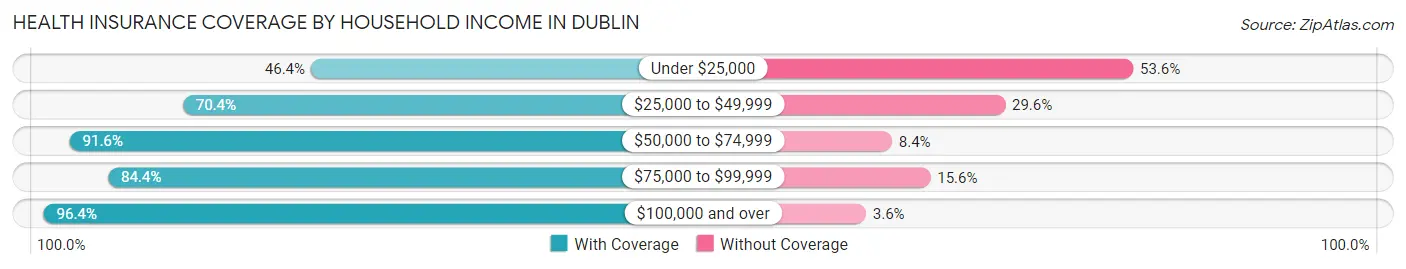
| Household Income | With Coverage | Without Coverage |
| Under $25,000 | 307 (46.4%) | 355 (53.6%) |
| $25,000 to $49,999 | 553 (70.4%) | 233 (29.6%) |
| $50,000 to $74,999 | 694 (91.6%) | 64 (8.4%) |
| $75,000 to $99,999 | 151 (84.4%) | 28 (15.6%) |
| $100,000 and over | 919 (96.4%) | 34 (3.6%) |
Public vs Private Health Insurance Coverage by Age in Dublin
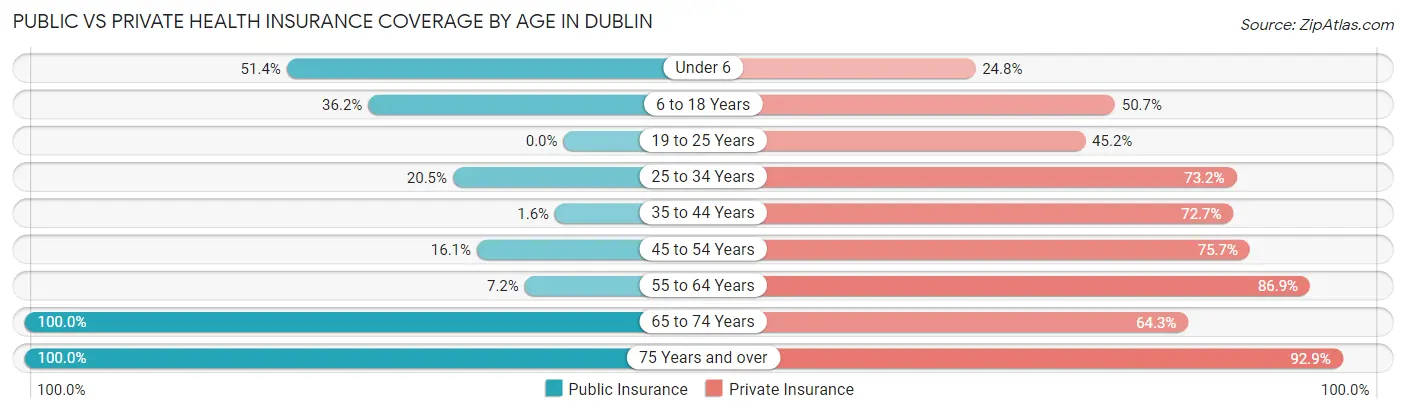
| Age Bracket | Public Insurance | Private Insurance |
| Under 6 | 226 (51.4%) | 109 (24.8%) |
| 6 to 18 Years | 238 (36.2%) | 333 (50.7%) |
| 19 to 25 Years | 0 (0.0%) | 187 (45.2%) |
| 25 to 34 Years | 72 (20.5%) | 257 (73.2%) |
| 35 to 44 Years | 6 (1.6%) | 279 (72.7%) |
| 45 to 54 Years | 39 (16.1%) | 184 (75.7%) |
| 55 to 64 Years | 34 (7.2%) | 411 (86.9%) |
| 65 to 74 Years | 182 (100.0%) | 117 (64.3%) |
| 75 Years and over | 198 (100.0%) | 184 (92.9%) |
| Total | 995 (29.8%) | 2,061 (61.7%) |
Disability Status by Sex by Age in Dublin
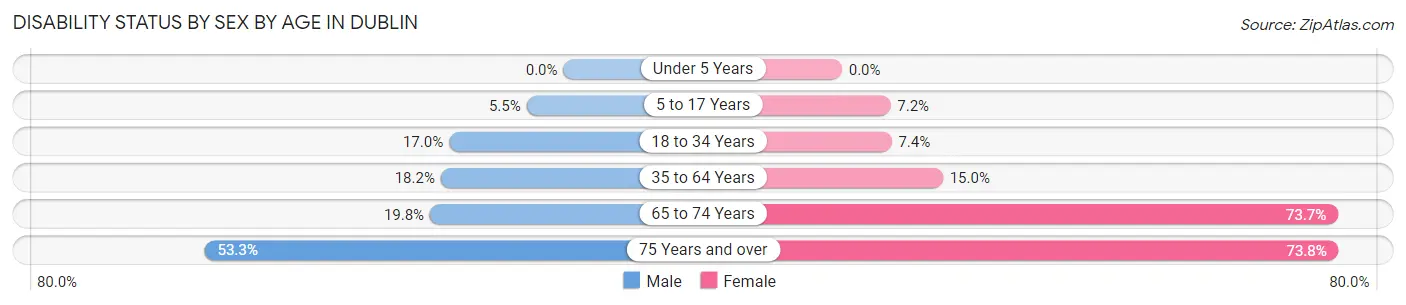
| Age Bracket | Male | Female |
| Under 5 Years | 0 (0.0%) | 0 (0.0%) |
| 5 to 17 Years | 23 (5.5%) | 16 (7.2%) |
| 18 to 34 Years | 72 (17.0%) | 27 (7.4%) |
| 35 to 64 Years | 108 (18.2%) | 76 (15.0%) |
| 65 to 74 Years | 21 (19.8%) | 56 (73.7%) |
| 75 Years and over | 73 (53.3%) | 45 (73.8%) |
Disability Class by Sex by Age in Dublin
Disability Class: Hearing Difficulty
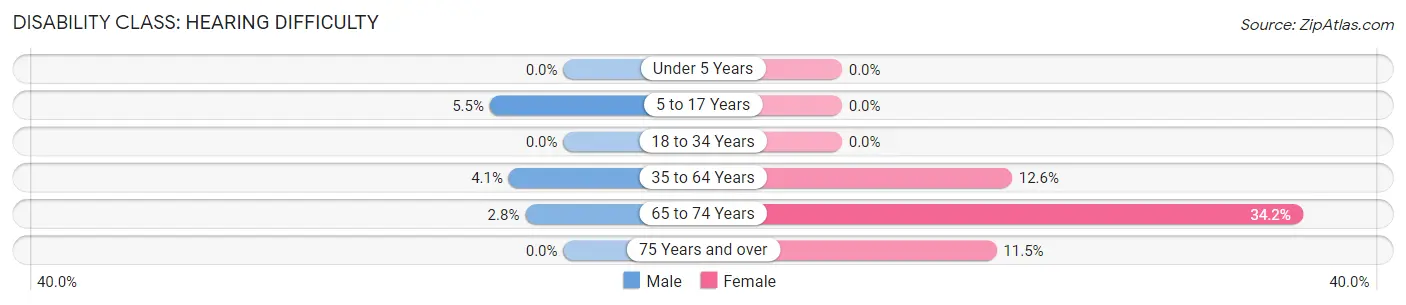
| Age Bracket | Male | Female |
| Under 5 Years | 0 (0.0%) | 0 (0.0%) |
| 5 to 17 Years | 23 (5.5%) | 0 (0.0%) |
| 18 to 34 Years | 0 (0.0%) | 0 (0.0%) |
| 35 to 64 Years | 24 (4.1%) | 64 (12.6%) |
| 65 to 74 Years | 3 (2.8%) | 26 (34.2%) |
| 75 Years and over | 0 (0.0%) | 7 (11.5%) |
Disability Class: Vision Difficulty
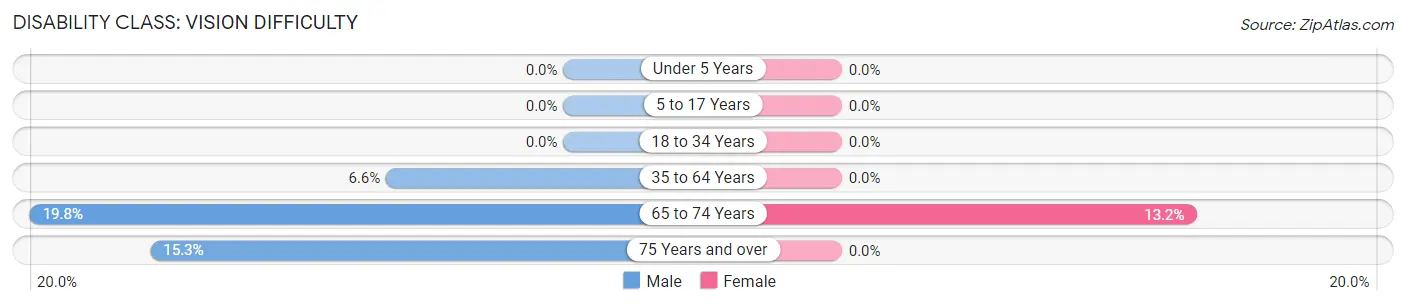
| Age Bracket | Male | Female |
| Under 5 Years | 0 (0.0%) | 0 (0.0%) |
| 5 to 17 Years | 0 (0.0%) | 0 (0.0%) |
| 18 to 34 Years | 0 (0.0%) | 0 (0.0%) |
| 35 to 64 Years | 39 (6.6%) | 0 (0.0%) |
| 65 to 74 Years | 21 (19.8%) | 10 (13.2%) |
| 75 Years and over | 21 (15.3%) | 0 (0.0%) |
Disability Class: Cognitive Difficulty
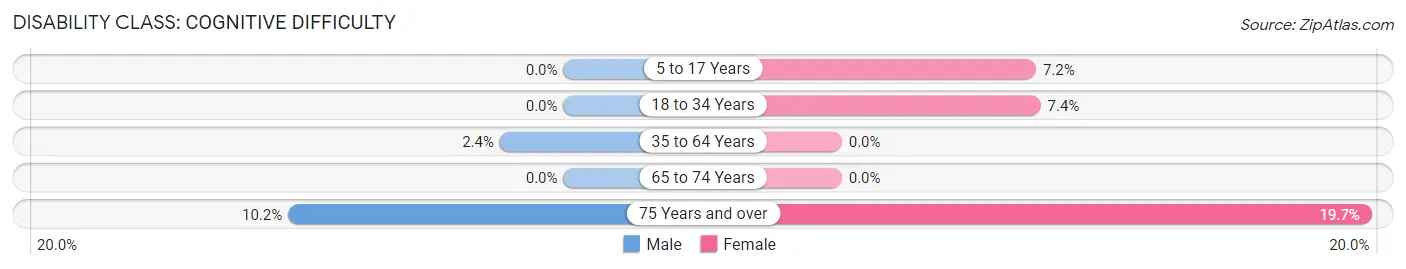
| Age Bracket | Male | Female |
| 5 to 17 Years | 0 (0.0%) | 16 (7.2%) |
| 18 to 34 Years | 0 (0.0%) | 27 (7.4%) |
| 35 to 64 Years | 14 (2.4%) | 0 (0.0%) |
| 65 to 74 Years | 0 (0.0%) | 0 (0.0%) |
| 75 Years and over | 14 (10.2%) | 12 (19.7%) |
Disability Class: Ambulatory Difficulty
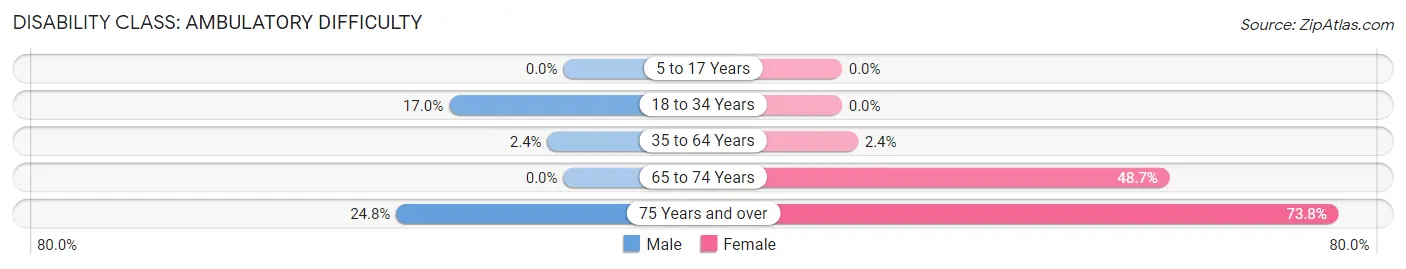
| Age Bracket | Male | Female |
| 5 to 17 Years | 0 (0.0%) | 0 (0.0%) |
| 18 to 34 Years | 72 (17.0%) | 0 (0.0%) |
| 35 to 64 Years | 14 (2.4%) | 12 (2.4%) |
| 65 to 74 Years | 0 (0.0%) | 37 (48.7%) |
| 75 Years and over | 34 (24.8%) | 45 (73.8%) |
Disability Class: Self-Care Difficulty
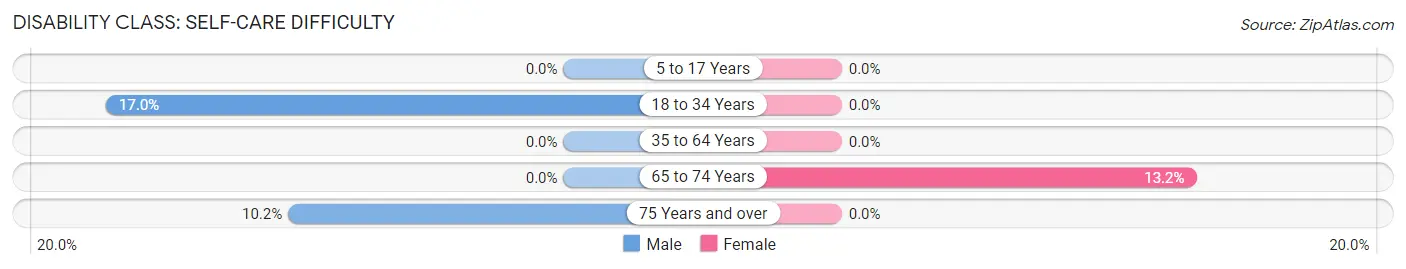
| Age Bracket | Male | Female |
| 5 to 17 Years | 0 (0.0%) | 0 (0.0%) |
| 18 to 34 Years | 72 (17.0%) | 0 (0.0%) |
| 35 to 64 Years | 0 (0.0%) | 0 (0.0%) |
| 65 to 74 Years | 0 (0.0%) | 10 (13.2%) |
| 75 Years and over | 14 (10.2%) | 0 (0.0%) |
Technology Access in Dublin
Computing Device Access in Dublin
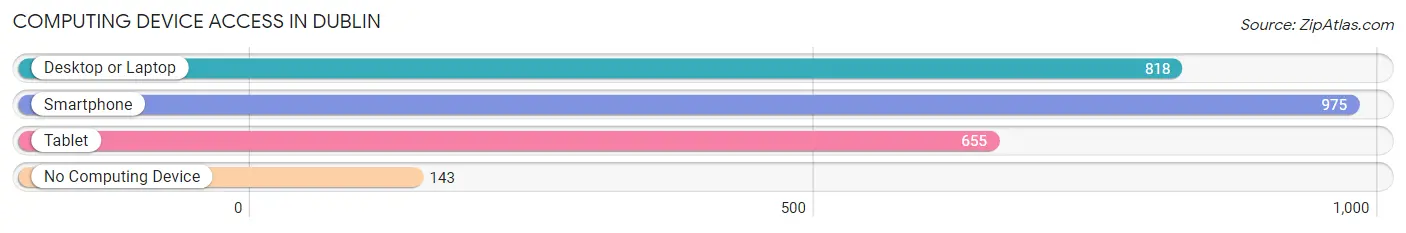
| Device Type | # Households | % Households |
| Desktop or Laptop | 818 | 70.3% |
| Smartphone | 975 | 83.8% |
| Tablet | 655 | 56.3% |
| No Computing Device | 143 | 12.3% |
| Total | 1,163 | 100.0% |
Internet Access in Dublin
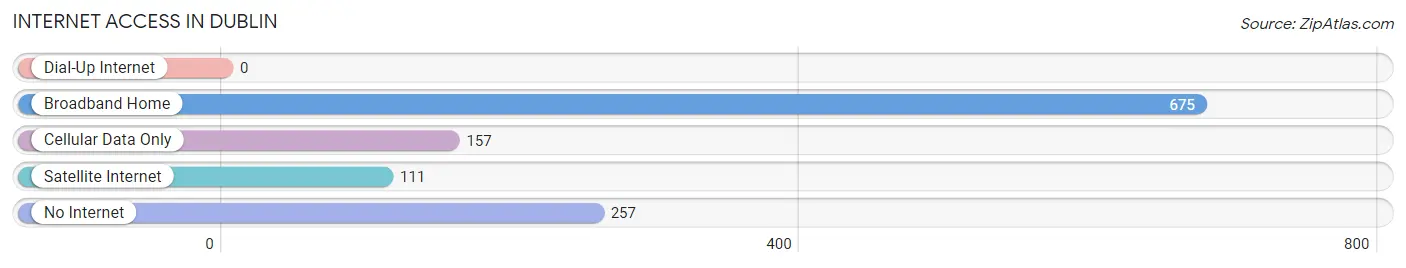
| Internet Type | # Households | % Households |
| Dial-Up Internet | 0 | 0.0% |
| Broadband Home | 675 | 58.0% |
| Cellular Data Only | 157 | 13.5% |
| Satellite Internet | 111 | 9.5% |
| No Internet | 257 | 22.1% |
| Total | 1,163 | 100.0% |
Dublin Summary
Dublin, Texas is a small city located in Erath County, Texas, United States. It is situated about 80 miles southwest of Fort Worth and is part of the Stephenville, Texas Metropolitan Statistical Area. The city has a population of 3,654 as of the 2010 census.
History
Dublin was founded in 1854 by a group of settlers from Dublin, Ireland. The settlers were led by John O'Neil, who had been a soldier in the Mexican-American War. The town was originally called "Dublin Station" because it was a stop on the stagecoach line between Austin and Fort Worth. The town was officially incorporated in 1891 and the name was changed to Dublin.
Geography
Dublin is located at the intersection of U.S. Highway 377 and State Highway 6, about 80 miles southwest of Fort Worth. The city has a total area of 3.2 square miles, all of which is land. The terrain is mostly flat with some rolling hills. The climate is semi-arid with hot summers and mild winters.
Economy
Dublin's economy is largely based on agriculture and ranching. The city is home to several large ranches, including the historic 6666 Ranch. The city also has a strong manufacturing sector, with several companies producing a variety of products, including furniture, clothing, and automotive parts.
Demographics
As of the 2010 census, Dublin had a population of 3,654. The racial makeup of the city was 79.2% White, 0.7% African American, 0.3% Native American, 0.2% Asian, 0.1% Pacific Islander, 17.3% from other races, and 2.4% from two or more races. Hispanic or Latino of any race were 33.2% of the population.
The median income for a household in the city was $31,250, and the median income for a family was $37,500. The per capita income for the city was $17,845. About 17.3% of families and 20.2% of the population were below the poverty line, including 28.3% of those under age 18 and 11.2% of those age 65 or over.
Conclusion
Dublin, Texas is a small city located in Erath County, Texas, United States. It is situated about 80 miles southwest of Fort Worth and is part of the Stephenville, Texas Metropolitan Statistical Area. The city has a population of 3,654 as of the 2010 census. Dublin was founded in 1854 by a group of settlers from Dublin, Ireland and has a total area of 3.2 square miles. The city's economy is largely based on agriculture and ranching, with a strong manufacturing sector. The racial makeup of the city is 79.2% White, 0.7% African American, 0.3% Native American, 0.2% Asian, 0.1% Pacific Islander, 17.3% from other races, and 2.4% from two or more races. The median income for a household in the city was $31,250, and the median income for a family was $37,500. About 17.3% of families and 20.2% of the population were below the poverty line.
Common Questions
What is Per Capita Income in Dublin?
Per Capita income in Dublin is $36,756.
What is the Median Family Income in Dublin?
Median Family Income in Dublin is $58,031.
What is the Median Household income in Dublin?
Median Household Income in Dublin is $52,153.
What is Income or Wage Gap in Dublin?
Income or Wage Gap in Dublin is 39.1%.
Women in Dublin earn 60.9 cents for every dollar earned by a man.
What is Family Income Deficit in Dublin?
Family Income Deficit in Dublin is $10,562.
Families that are below poverty line in Dublin earn $10,562 less on average than the poverty threshold level.
What is Inequality or Gini Index in Dublin?
Inequality or Gini Index in Dublin is 0.65.
What is the Total Population of Dublin?
Total Population of Dublin is 3,397.
What is the Total Male Population of Dublin?
Total Male Population of Dublin is 1,995.
What is the Total Female Population of Dublin?
Total Female Population of Dublin is 1,402.
What is the Ratio of Males per 100 Females in Dublin?
There are 142.30 Males per 100 Females in Dublin.
What is the Ratio of Females per 100 Males in Dublin?
There are 70.28 Females per 100 Males in Dublin.
What is the Median Population Age in Dublin?
Median Population Age in Dublin is 32.1 Years.
What is the Average Family Size in Dublin
Average Family Size in Dublin is 3.5 People.
What is the Average Household Size in Dublin
Average Household Size in Dublin is 2.9 People.
How Large is the Labor Force in Dublin?
There are 1,454 People in the Labor Forcein in Dublin.
What is the Percentage of People in the Labor Force in Dublin?
59.8% of People are in the Labor Force in Dublin.
What is the Unemployment Rate in Dublin?
Unemployment Rate in Dublin is 2.3%.