Detroit, TX Map & Demographics
Detroit Map
Detroit Overview
$18,973
PER CAPITA INCOME
$47,125
AVG FAMILY INCOME
$40,781
AVG HOUSEHOLD INCOME
12.7%
WAGE / INCOME GAP [ % ]
87.3¢/ $1
WAGE / INCOME GAP [ $ ]
0.50
INEQUALITY / GINI INDEX
628
TOTAL POPULATION
263
MALE POPULATION
365
FEMALE POPULATION
72.05
MALES / 100 FEMALES
138.78
FEMALES / 100 MALES
30.1
MEDIAN AGE
3.7
AVG FAMILY SIZE
3.1
AVG HOUSEHOLD SIZE
228
LABOR FORCE [ PEOPLE ]
46.0%
PERCENT IN LABOR FORCE
6.1%
UNEMPLOYMENT RATE
Detroit Zip Codes
Detroit Area Codes
Income in Detroit
Income Overview in Detroit
Per Capita Income in Detroit is $18,973, while median incomes of families and households are $47,125 and $40,781 respectively.
| Characteristic | Number | Measure |
| Per Capita Income | 628 | $18,973 |
| Median Family Income | 151 | $47,125 |
| Mean Family Income | 151 | $64,519 |
| Median Household Income | 205 | $40,781 |
| Mean Household Income | 205 | $54,235 |
| Income Deficit | 151 | $0 |
| Wage / Income Gap (%) | 628 | 12.74% |
| Wage / Income Gap ($) | 628 | 87.26¢ per $1 |
| Gini / Inequality Index | 628 | 0.50 |
Earnings by Sex in Detroit
Average Earnings in Detroit are $33,684, $38,000 for men and $33,158 for women, a difference of 12.7%.
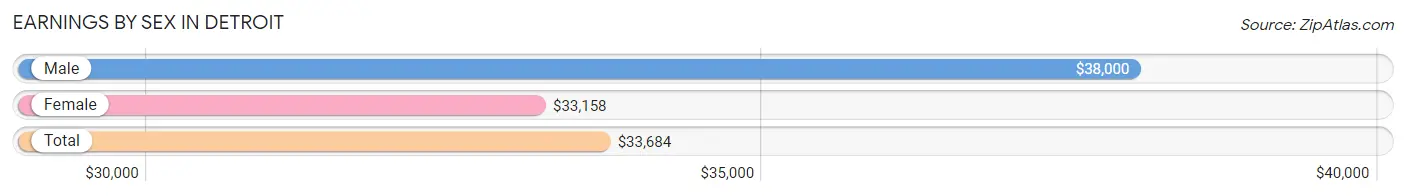
| Sex | Number | Average Earnings |
| Male | 112 (45.9%) | $38,000 |
| Female | 132 (54.1%) | $33,158 |
| Total | 244 (100.0%) | $33,684 |
Earnings by Sex by Income Bracket in Detroit
The most common earnings brackets in Detroit are $55,000 to $64,999 for men (25 | 22.3%) and $40,000 to $44,999 for women (22 | 16.7%).
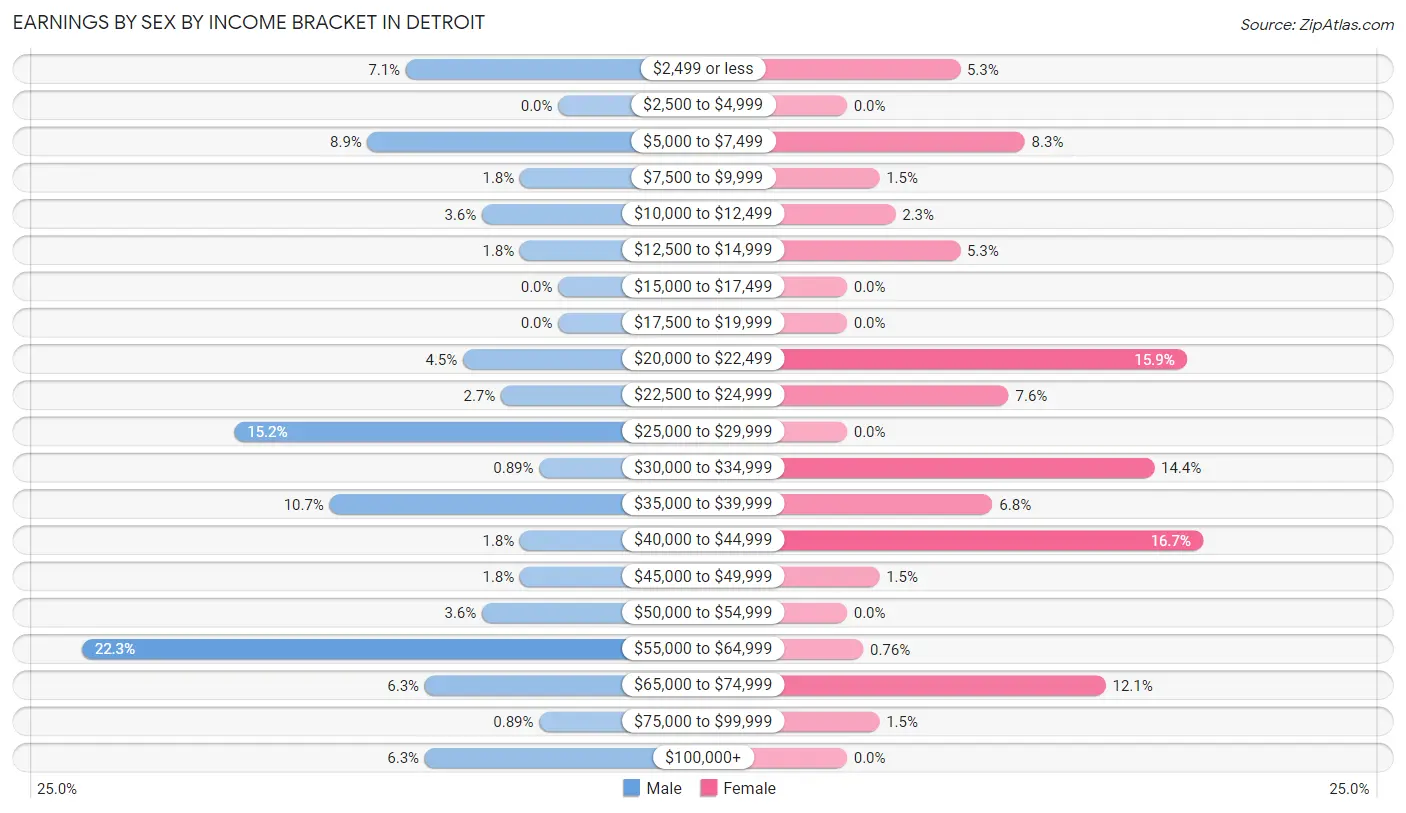
| Income | Male | Female |
| $2,499 or less | 8 (7.1%) | 7 (5.3%) |
| $2,500 to $4,999 | 0 (0.0%) | 0 (0.0%) |
| $5,000 to $7,499 | 10 (8.9%) | 11 (8.3%) |
| $7,500 to $9,999 | 2 (1.8%) | 2 (1.5%) |
| $10,000 to $12,499 | 4 (3.6%) | 3 (2.3%) |
| $12,500 to $14,999 | 2 (1.8%) | 7 (5.3%) |
| $15,000 to $17,499 | 0 (0.0%) | 0 (0.0%) |
| $17,500 to $19,999 | 0 (0.0%) | 0 (0.0%) |
| $20,000 to $22,499 | 5 (4.5%) | 21 (15.9%) |
| $22,500 to $24,999 | 3 (2.7%) | 10 (7.6%) |
| $25,000 to $29,999 | 17 (15.2%) | 0 (0.0%) |
| $30,000 to $34,999 | 1 (0.9%) | 19 (14.4%) |
| $35,000 to $39,999 | 12 (10.7%) | 9 (6.8%) |
| $40,000 to $44,999 | 2 (1.8%) | 22 (16.7%) |
| $45,000 to $49,999 | 2 (1.8%) | 2 (1.5%) |
| $50,000 to $54,999 | 4 (3.6%) | 0 (0.0%) |
| $55,000 to $64,999 | 25 (22.3%) | 1 (0.8%) |
| $65,000 to $74,999 | 7 (6.2%) | 16 (12.1%) |
| $75,000 to $99,999 | 1 (0.9%) | 2 (1.5%) |
| $100,000+ | 7 (6.2%) | 0 (0.0%) |
| Total | 112 (100.0%) | 132 (100.0%) |
Earnings by Sex by Educational Attainment in Detroit
Average earnings in Detroit are $39,875 for men and $35,139 for women, a difference of 11.9%. Men with an educational attainment of college or associate's degree enjoy the highest average annual earnings of $50,417, while those with high school diploma education earn the least with $39,250. Women with an educational attainment of college or associate's degree earn the most with the average annual earnings of $40,096, while those with high school diploma education have the smallest earnings of $34,286.
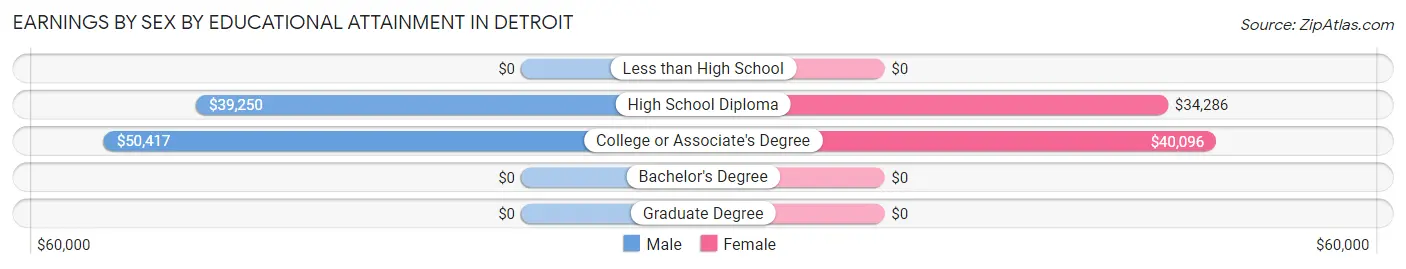
| Educational Attainment | Male Income | Female Income |
| Less than High School | - | - |
| High School Diploma | $39,250 | $34,286 |
| College or Associate's Degree | $50,417 | $40,096 |
| Bachelor's Degree | - | - |
| Graduate Degree | - | - |
| Total | $39,875 | $35,139 |
Family Income in Detroit
Family Income Brackets in Detroit
According to the Detroit family income data, there are 26 families falling into the $75,000 to $99,999 income range, which is the most common income bracket and makes up 17.2% of all families. Conversely, the $25,000 to $34,999 income bracket is the least frequent group with only 5 families (3.3%) belonging to this category.
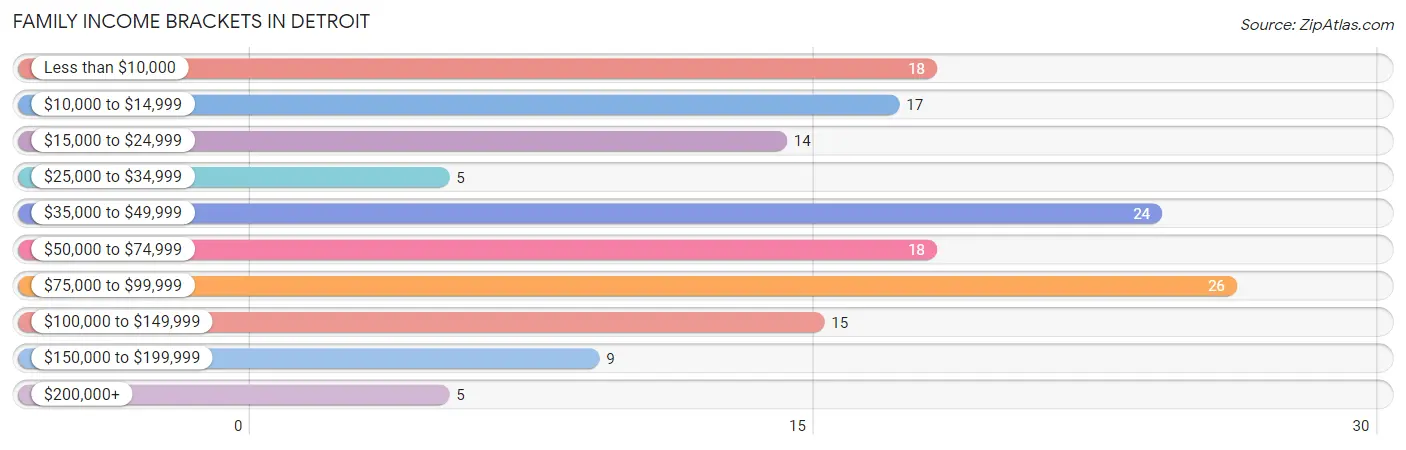
| Income Bracket | # Families | % Families |
| Less than $10,000 | 18 | 11.9% |
| $10,000 to $14,999 | 17 | 11.3% |
| $15,000 to $24,999 | 14 | 9.3% |
| $25,000 to $34,999 | 5 | 3.3% |
| $35,000 to $49,999 | 24 | 15.9% |
| $50,000 to $74,999 | 18 | 11.9% |
| $75,000 to $99,999 | 26 | 17.2% |
| $100,000 to $149,999 | 15 | 9.9% |
| $150,000 to $199,999 | 9 | 6.0% |
| $200,000+ | 5 | 3.3% |
Family Income by Famaliy Size in Detroit
5-person families (19 | 12.6%) account for the highest median family income in Detroit with $125,125 per family, while 5-person families (19 | 12.6%) have the highest median income of $25,025 per family member.
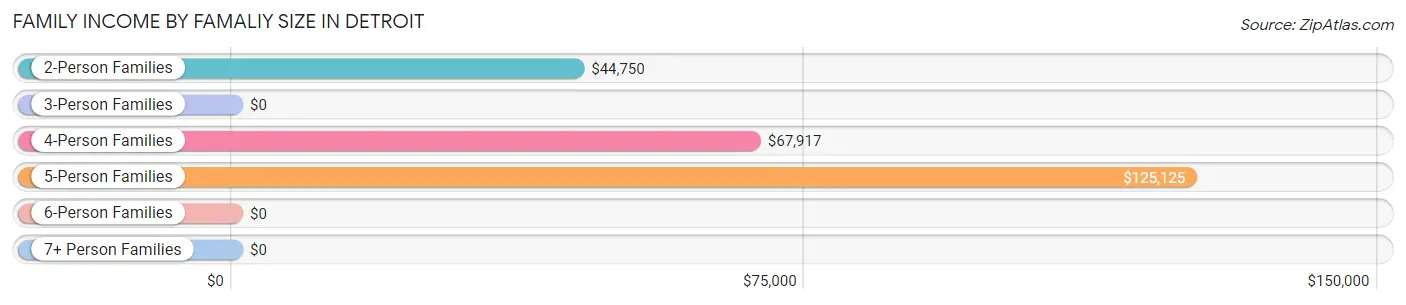
| Income Bracket | # Families | Median Income |
| 2-Person Families | 67 (44.4%) | $44,750 |
| 3-Person Families | 33 (21.8%) | $0 |
| 4-Person Families | 21 (13.9%) | $67,917 |
| 5-Person Families | 19 (12.6%) | $125,125 |
| 6-Person Families | 6 (4.0%) | $0 |
| 7+ Person Families | 5 (3.3%) | $0 |
| Total | 151 (100.0%) | $47,125 |
Family Income by Number of Earners in Detroit
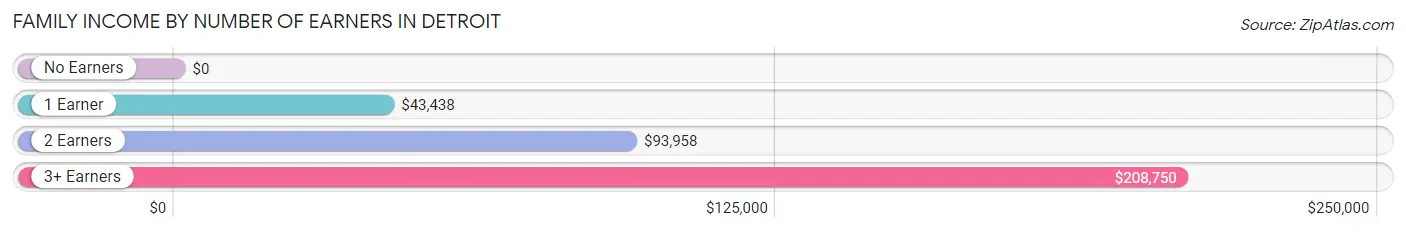
| Number of Earners | # Families | Median Income |
| No Earners | 39 (25.8%) | $0 |
| 1 Earner | 69 (45.7%) | $43,438 |
| 2 Earners | 33 (21.8%) | $93,958 |
| 3+ Earners | 10 (6.6%) | $208,750 |
| Total | 151 (100.0%) | $47,125 |
Household Income in Detroit
Household Income Brackets in Detroit
With 34 households falling in the category, the $35,000 to $49,999 income range is the most frequent in Detroit, accounting for 16.6% of all households. In contrast, only 5 households (2.4%) fall into the $200,000+ income bracket, making it the least populous group.
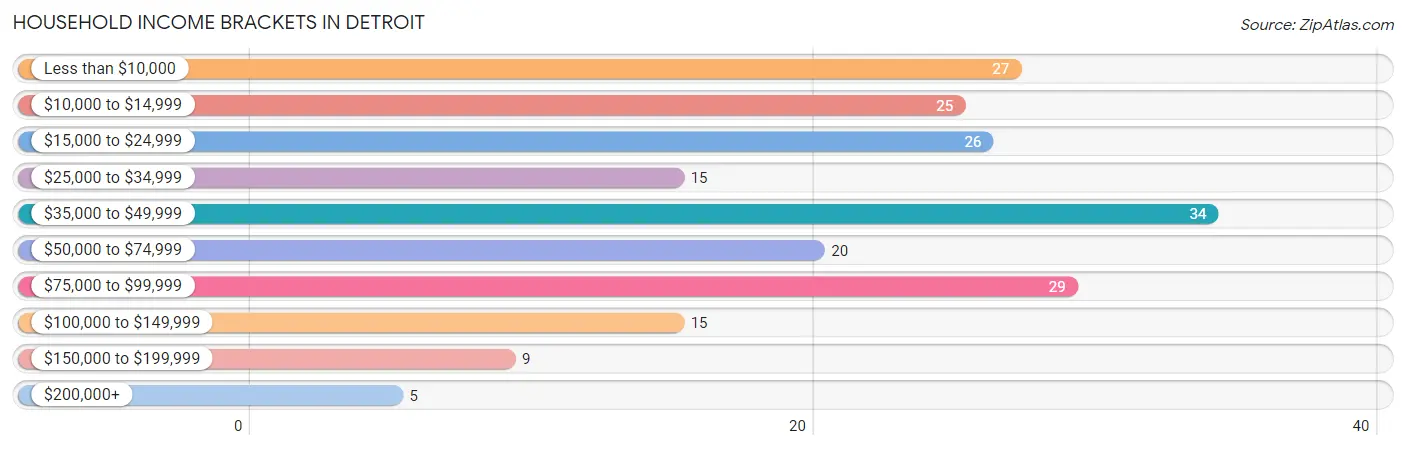
| Income Bracket | # Households | % Households |
| Less than $10,000 | 27 | 13.2% |
| $10,000 to $14,999 | 25 | 12.2% |
| $15,000 to $24,999 | 26 | 12.7% |
| $25,000 to $34,999 | 15 | 7.3% |
| $35,000 to $49,999 | 34 | 16.6% |
| $50,000 to $74,999 | 20 | 9.8% |
| $75,000 to $99,999 | 29 | 14.1% |
| $100,000 to $149,999 | 15 | 7.3% |
| $150,000 to $199,999 | 9 | 4.4% |
| $200,000+ | 5 | 2.4% |
Household Income by Householder Age in Detroit
The median household income in Detroit is $40,781, with the highest median household income of $46,667 found in the 45 to 64 years age bracket for the primary householder. A total of 78 households (38.1%) fall into this category. Meanwhile, the 15 to 24 years age bracket for the primary householder has the lowest median household income of $0, with 1 households (0.5%) in this group.
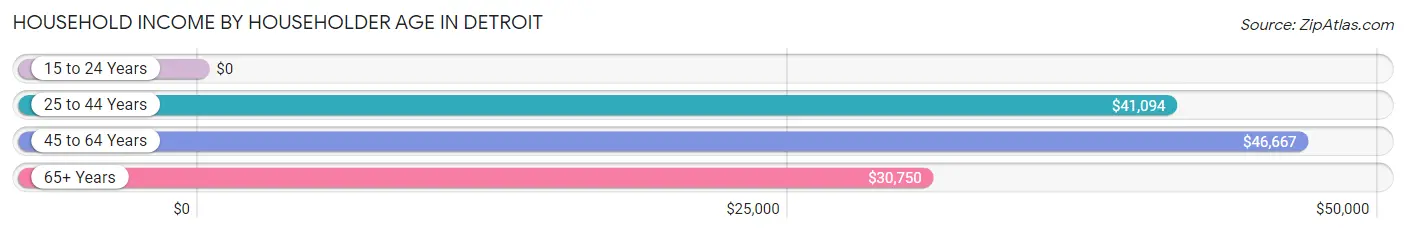
| Income Bracket | # Households | Median Income |
| 15 to 24 Years | 1 (0.5%) | $0 |
| 25 to 44 Years | 63 (30.7%) | $41,094 |
| 45 to 64 Years | 78 (38.1%) | $46,667 |
| 65+ Years | 63 (30.7%) | $30,750 |
| Total | 205 (100.0%) | $40,781 |
Poverty in Detroit
Income Below Poverty by Sex and Age in Detroit
With 28.1% poverty level for males and 23.8% for females among the residents of Detroit, 5 year old males and 16 and 17 year old females are the most vulnerable to poverty, with 6 males (85.7%) and 14 females (41.2%) in their respective age groups living below the poverty level.
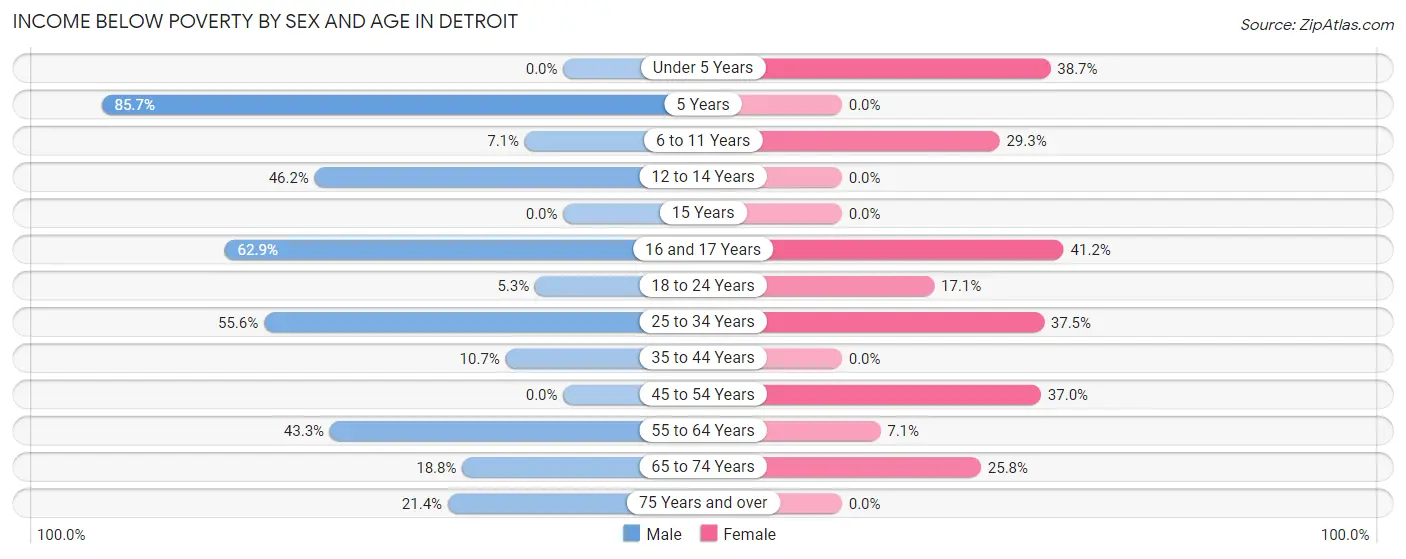
| Age Bracket | Male | Female |
| Under 5 Years | 0 (0.0%) | 12 (38.7%) |
| 5 Years | 6 (85.7%) | 0 (0.0%) |
| 6 to 11 Years | 1 (7.1%) | 12 (29.3%) |
| 12 to 14 Years | 6 (46.2%) | 0 (0.0%) |
| 15 Years | 0 (0.0%) | 0 (0.0%) |
| 16 and 17 Years | 22 (62.9%) | 14 (41.2%) |
| 18 to 24 Years | 2 (5.3%) | 6 (17.1%) |
| 25 to 34 Years | 15 (55.6%) | 15 (37.5%) |
| 35 to 44 Years | 3 (10.7%) | 0 (0.0%) |
| 45 to 54 Years | 0 (0.0%) | 17 (37.0%) |
| 55 to 64 Years | 13 (43.3%) | 3 (7.1%) |
| 65 to 74 Years | 3 (18.8%) | 8 (25.8%) |
| 75 Years and over | 3 (21.4%) | 0 (0.0%) |
| Total | 74 (28.1%) | 87 (23.8%) |
Income Above Poverty by Sex and Age in Detroit
According to the poverty statistics in Detroit, males aged under 5 years and females aged 5 years are the age groups that are most secure financially, with 100.0% of males and 100.0% of females in these age groups living above the poverty line.
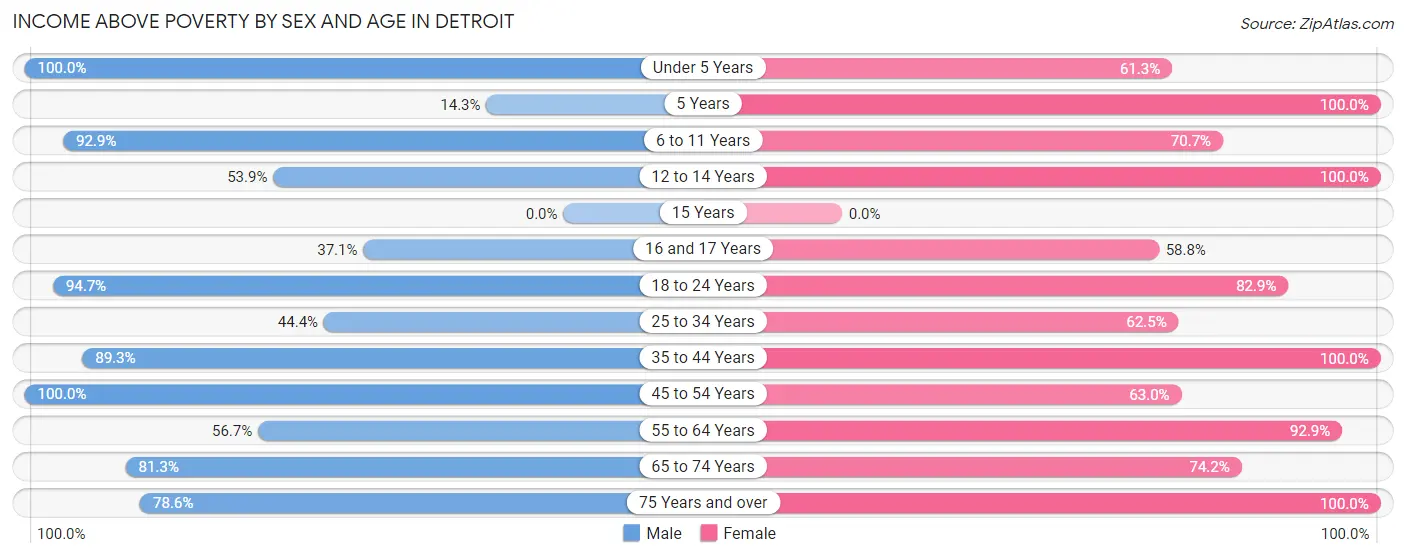
| Age Bracket | Male | Female |
| Under 5 Years | 18 (100.0%) | 19 (61.3%) |
| 5 Years | 1 (14.3%) | 2 (100.0%) |
| 6 to 11 Years | 13 (92.9%) | 29 (70.7%) |
| 12 to 14 Years | 7 (53.8%) | 6 (100.0%) |
| 15 Years | 0 (0.0%) | 0 (0.0%) |
| 16 and 17 Years | 13 (37.1%) | 20 (58.8%) |
| 18 to 24 Years | 36 (94.7%) | 29 (82.9%) |
| 25 to 34 Years | 12 (44.4%) | 25 (62.5%) |
| 35 to 44 Years | 25 (89.3%) | 32 (100.0%) |
| 45 to 54 Years | 23 (100.0%) | 29 (63.0%) |
| 55 to 64 Years | 17 (56.7%) | 39 (92.9%) |
| 65 to 74 Years | 13 (81.2%) | 23 (74.2%) |
| 75 Years and over | 11 (78.6%) | 25 (100.0%) |
| Total | 189 (71.9%) | 278 (76.2%) |
Income Below Poverty Among Married-Couple Families in Detroit
The poverty statistics for married-couple families in Detroit show that 15.4% or 12 of the total 78 families live below the poverty line. Families with 3 or 4 children have the highest poverty rate of 33.3%, comprising of 6 families. On the other hand, families with no children have the lowest poverty rate of 8.6%, which includes 3 families.
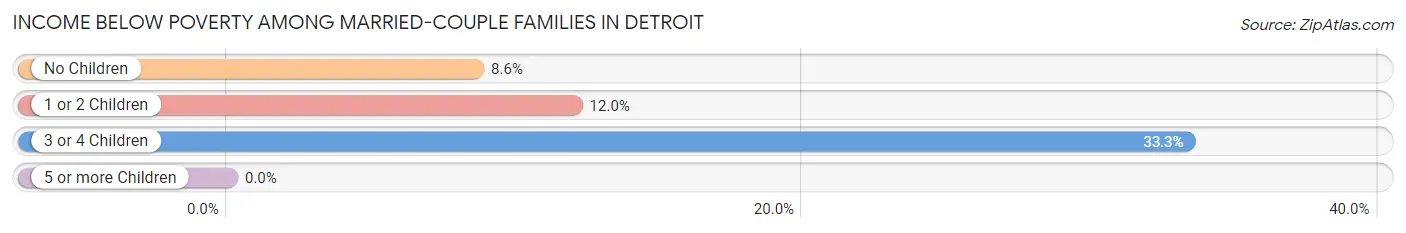
| Children | Above Poverty | Below Poverty |
| No Children | 32 (91.4%) | 3 (8.6%) |
| 1 or 2 Children | 22 (88.0%) | 3 (12.0%) |
| 3 or 4 Children | 12 (66.7%) | 6 (33.3%) |
| 5 or more Children | 0 (0.0%) | 0 (0.0%) |
| Total | 66 (84.6%) | 12 (15.4%) |
Income Below Poverty Among Single-Parent Households in Detroit
According to the poverty data in Detroit, 73.7% or 14 single-father households and 37.0% or 20 single-mother households are living below the poverty line. Among single-father households, those with no children have the highest poverty rate, with 4 households (80.0%) experiencing poverty. Likewise, among single-mother households, those with 1 or 2 children have the highest poverty rate, with 18 households (41.9%) falling below the poverty line.
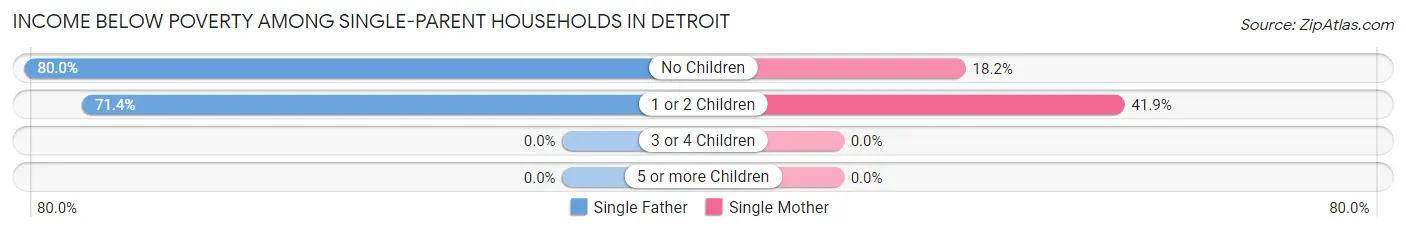
| Children | Single Father | Single Mother |
| No Children | 4 (80.0%) | 2 (18.2%) |
| 1 or 2 Children | 10 (71.4%) | 18 (41.9%) |
| 3 or 4 Children | 0 (0.0%) | 0 (0.0%) |
| 5 or more Children | 0 (0.0%) | 0 (0.0%) |
| Total | 14 (73.7%) | 20 (37.0%) |
Income Below Poverty Among Married-Couple vs Single-Parent Households in Detroit
The poverty data for Detroit shows that 12 of the married-couple family households (15.4%) and 34 of the single-parent households (46.6%) are living below the poverty level. Within the married-couple family households, those with 3 or 4 children have the highest poverty rate, with 6 households (33.3%) falling below the poverty line. Among the single-parent households, those with 1 or 2 children have the highest poverty rate, with 28 household (49.1%) living below poverty.
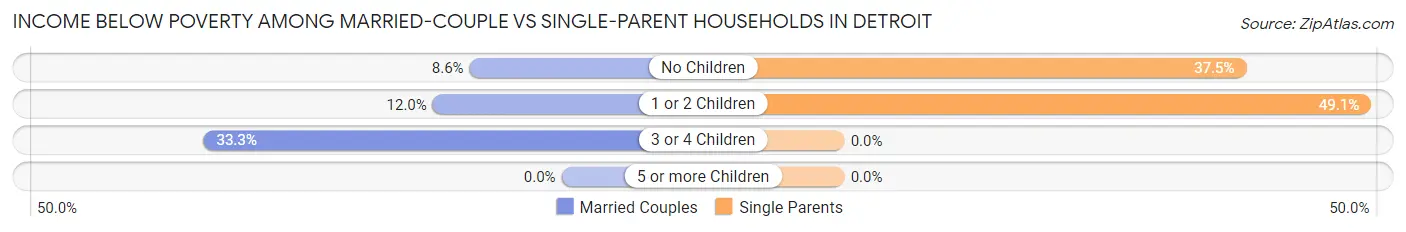
| Children | Married-Couple Families | Single-Parent Households |
| No Children | 3 (8.6%) | 6 (37.5%) |
| 1 or 2 Children | 3 (12.0%) | 28 (49.1%) |
| 3 or 4 Children | 6 (33.3%) | 0 (0.0%) |
| 5 or more Children | 0 (0.0%) | 0 (0.0%) |
| Total | 12 (15.4%) | 34 (46.6%) |
Race in Detroit
The most populous races in Detroit are White / Caucasian (528 | 84.1%), Black / African American (56 | 8.9%), and Two or more Races (23 | 3.7%).
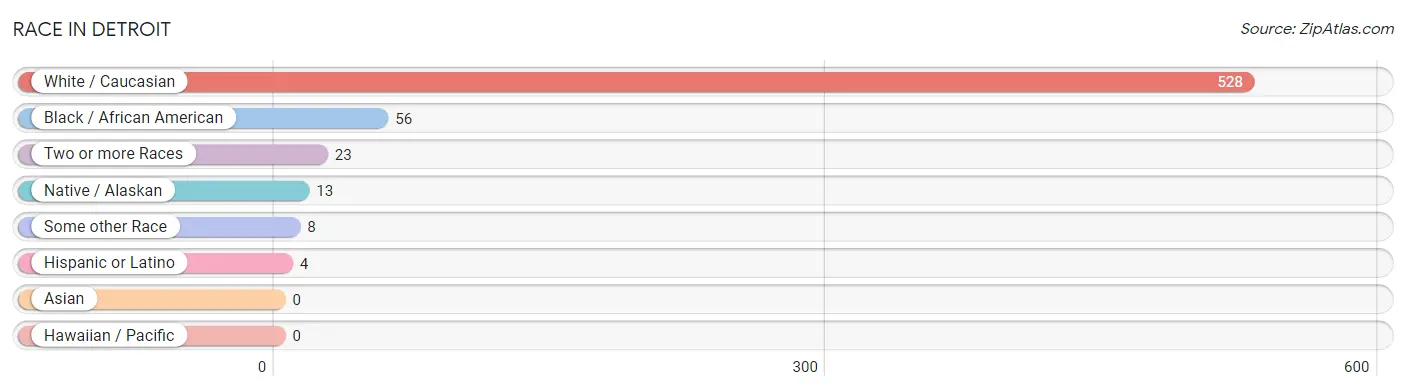
| Race | # Population | % Population |
| Asian | 0 | 0.0% |
| Black / African American | 56 | 8.9% |
| Hawaiian / Pacific | 0 | 0.0% |
| Hispanic or Latino | 4 | 0.6% |
| Native / Alaskan | 13 | 2.1% |
| White / Caucasian | 528 | 84.1% |
| Two or more Races | 23 | 3.7% |
| Some other Race | 8 | 1.3% |
| Total | 628 | 100.0% |
Ancestry in Detroit
The most populous ancestries reported in Detroit are American (343 | 54.6%), English (44 | 7.0%), Irish (31 | 4.9%), German (28 | 4.5%), and Choctaw (13 | 2.1%), together accounting for 73.1% of all Detroit residents.
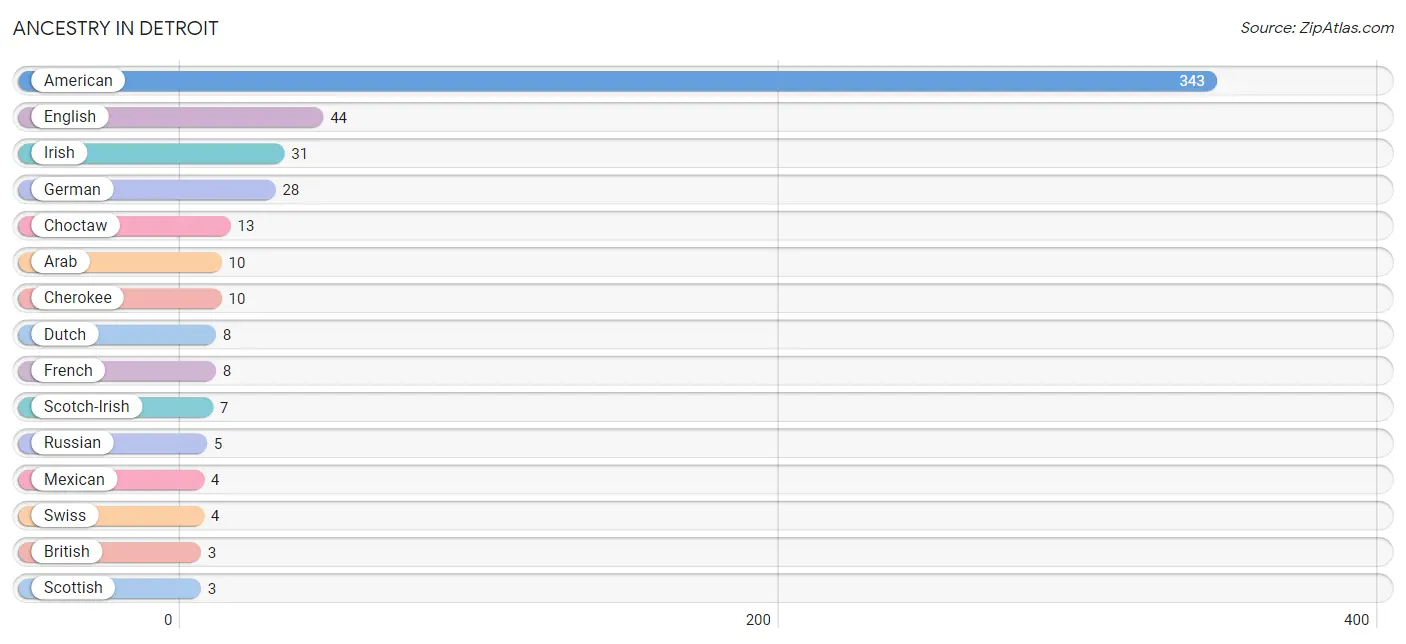
| Ancestry | # Population | % Population |
| American | 343 | 54.6% |
| Arab | 10 | 1.6% |
| British | 3 | 0.5% |
| Cherokee | 10 | 1.6% |
| Choctaw | 13 | 2.1% |
| Dutch | 8 | 1.3% |
| English | 44 | 7.0% |
| European | 2 | 0.3% |
| French | 8 | 1.3% |
| German | 28 | 4.5% |
| Irish | 31 | 4.9% |
| Mexican | 4 | 0.6% |
| Russian | 5 | 0.8% |
| Scotch-Irish | 7 | 1.1% |
| Scottish | 3 | 0.5% |
| Swiss | 4 | 0.6% |
| Welsh | 2 | 0.3% | View All 17 Rows |
Immigrants in Detroit
The most numerous immigrant groups reported in Detroit came from , and Europe (2 | 0.3%), together accounting for 0.3% of all Detroit residents.

| Immigration Origin | # Population | % Population |
| Europe | 2 | 0.3% | View All 1 Rows |
Sex and Age in Detroit
Sex and Age in Detroit
The most populous age groups in Detroit are 15 to 19 Years (42 | 16.0%) for men and 20 to 24 Years (35 | 9.6%) for women.
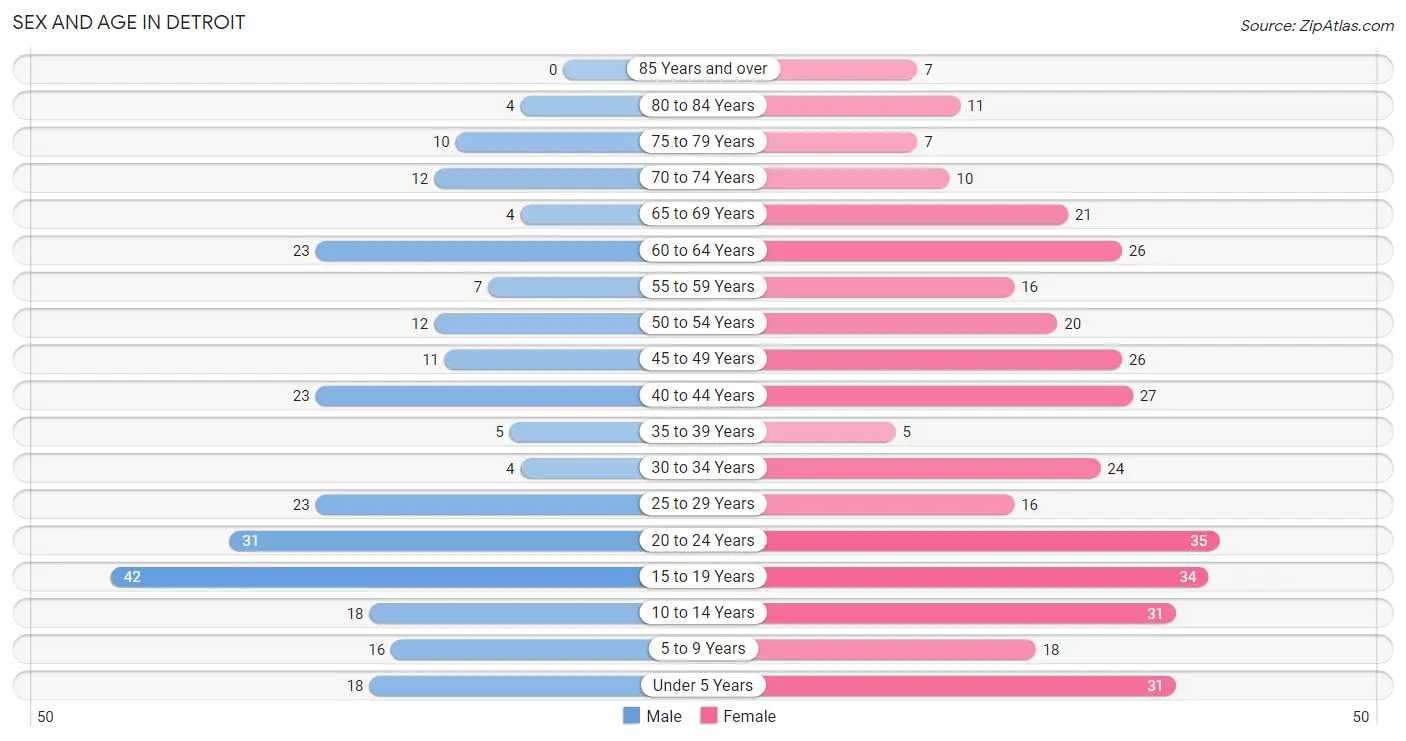
| Age Bracket | Male | Female |
| Under 5 Years | 18 (6.8%) | 31 (8.5%) |
| 5 to 9 Years | 16 (6.1%) | 18 (4.9%) |
| 10 to 14 Years | 18 (6.8%) | 31 (8.5%) |
| 15 to 19 Years | 42 (16.0%) | 34 (9.3%) |
| 20 to 24 Years | 31 (11.8%) | 35 (9.6%) |
| 25 to 29 Years | 23 (8.7%) | 16 (4.4%) |
| 30 to 34 Years | 4 (1.5%) | 24 (6.6%) |
| 35 to 39 Years | 5 (1.9%) | 5 (1.4%) |
| 40 to 44 Years | 23 (8.7%) | 27 (7.4%) |
| 45 to 49 Years | 11 (4.2%) | 26 (7.1%) |
| 50 to 54 Years | 12 (4.6%) | 20 (5.5%) |
| 55 to 59 Years | 7 (2.7%) | 16 (4.4%) |
| 60 to 64 Years | 23 (8.7%) | 26 (7.1%) |
| 65 to 69 Years | 4 (1.5%) | 21 (5.8%) |
| 70 to 74 Years | 12 (4.6%) | 10 (2.7%) |
| 75 to 79 Years | 10 (3.8%) | 7 (1.9%) |
| 80 to 84 Years | 4 (1.5%) | 11 (3.0%) |
| 85 Years and over | 0 (0.0%) | 7 (1.9%) |
| Total | 263 (100.0%) | 365 (100.0%) |
Families and Households in Detroit
Median Family Size in Detroit
The median family size in Detroit is 3.74 persons per family, with married-couple families (78 | 51.7%) accounting for the largest median family size of 4.18 persons per family. On the other hand, single male/father families (19 | 12.6%) represent the smallest median family size with 2.16 persons per family.
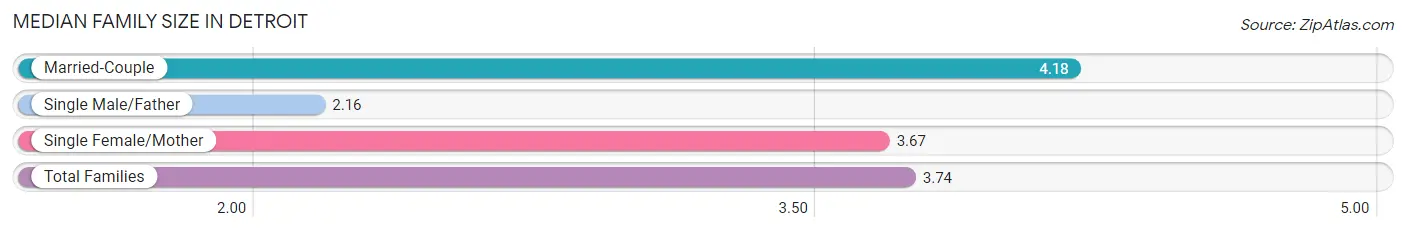
| Family Type | # Families | Family Size |
| Married-Couple | 78 (51.7%) | 4.18 |
| Single Male/Father | 19 (12.6%) | 2.16 |
| Single Female/Mother | 54 (35.8%) | 3.67 |
| Total Families | 151 (100.0%) | 3.74 |
Median Household Size in Detroit
The median household size in Detroit is 3.06 persons per household, with married-couple households (78 | 38.1%) accounting for the largest median household size of 4.18 persons per household. non-family households (54 | 26.3%) represent the smallest median household size with 1.13 persons per household.
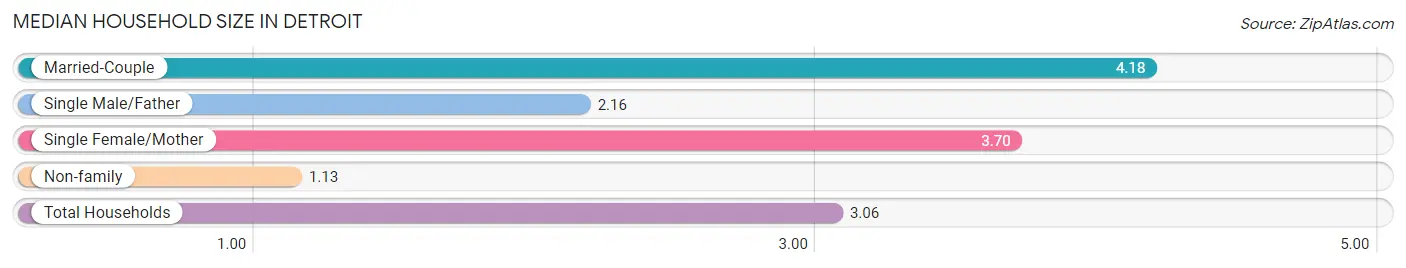
| Household Type | # Households | Household Size |
| Married-Couple | 78 (38.1%) | 4.18 |
| Single Male/Father | 19 (9.3%) | 2.16 |
| Single Female/Mother | 54 (26.3%) | 3.70 |
| Non-family | 54 (26.3%) | 1.13 |
| Total Households | 205 (100.0%) | 3.06 |
Household Size by Marriage Status in Detroit
Out of a total of 205 households in Detroit, 151 (73.7%) are family households, while 54 (26.3%) are nonfamily households. The most numerous type of family households are 2-person households, comprising 64, and the most common type of nonfamily households are 1-person households, comprising 49.
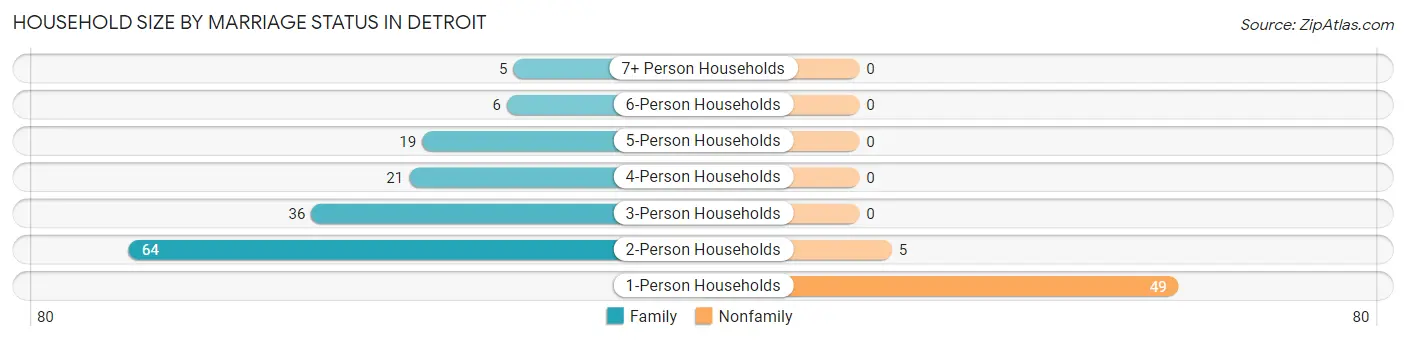
| Household Size | Family Households | Nonfamily Households |
| 1-Person Households | - | 49 (23.9%) |
| 2-Person Households | 64 (31.2%) | 5 (2.4%) |
| 3-Person Households | 36 (17.6%) | 0 (0.0%) |
| 4-Person Households | 21 (10.2%) | 0 (0.0%) |
| 5-Person Households | 19 (9.3%) | 0 (0.0%) |
| 6-Person Households | 6 (2.9%) | 0 (0.0%) |
| 7+ Person Households | 5 (2.4%) | 0 (0.0%) |
| Total | 151 (73.7%) | 54 (26.3%) |
Female Fertility in Detroit
Fertility by Age in Detroit
Average fertility rate in Detroit is 91.0 births per 1,000 women. Women in the age bracket of 20 to 34 years have the highest fertility rate with 187.0 births per 1,000 women. Women in the age bracket of 20 to 34 years acount for 87.5% of all women with births.
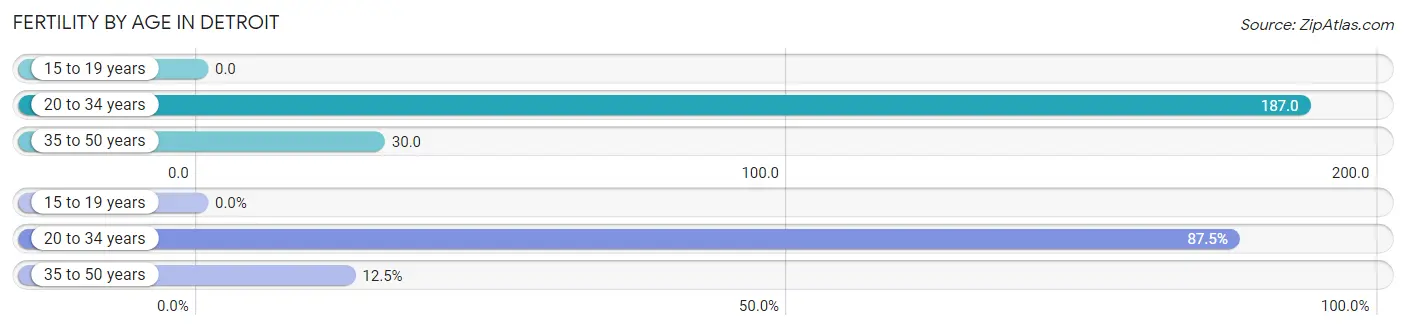
| Age Bracket | Women with Births | Births / 1,000 Women |
| 15 to 19 years | 0 (0.0%) | 0.0 |
| 20 to 34 years | 14 (87.5%) | 187.0 |
| 35 to 50 years | 2 (12.5%) | 30.0 |
| Total | 16 (100.0%) | 91.0 |
Fertility by Age by Marriage Status in Detroit
50.0% of women with births (16) in Detroit are married. The highest percentage of unmarried women with births falls into 20 to 34 years age bracket with 57.1% of them unmarried at the time of birth, while the lowest percentage of unmarried women with births belong to 35 to 50 years age bracket with 0.0% of them unmarried.
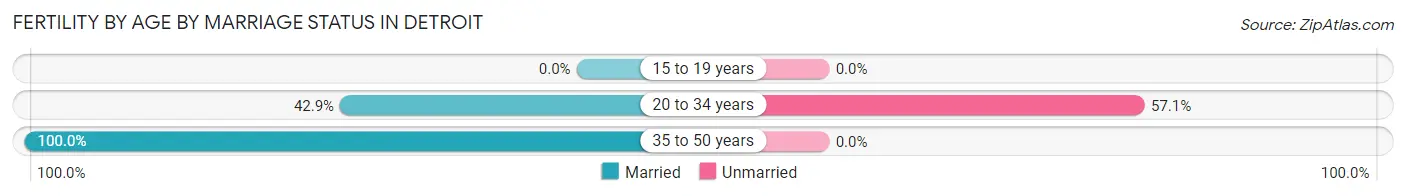
| Age Bracket | Married | Unmarried |
| 15 to 19 years | 0 (0.0%) | 0 (0.0%) |
| 20 to 34 years | 6 (42.9%) | 8 (57.1%) |
| 35 to 50 years | 2 (100.0%) | 0 (0.0%) |
| Total | 8 (50.0%) | 8 (50.0%) |
Fertility by Education in Detroit
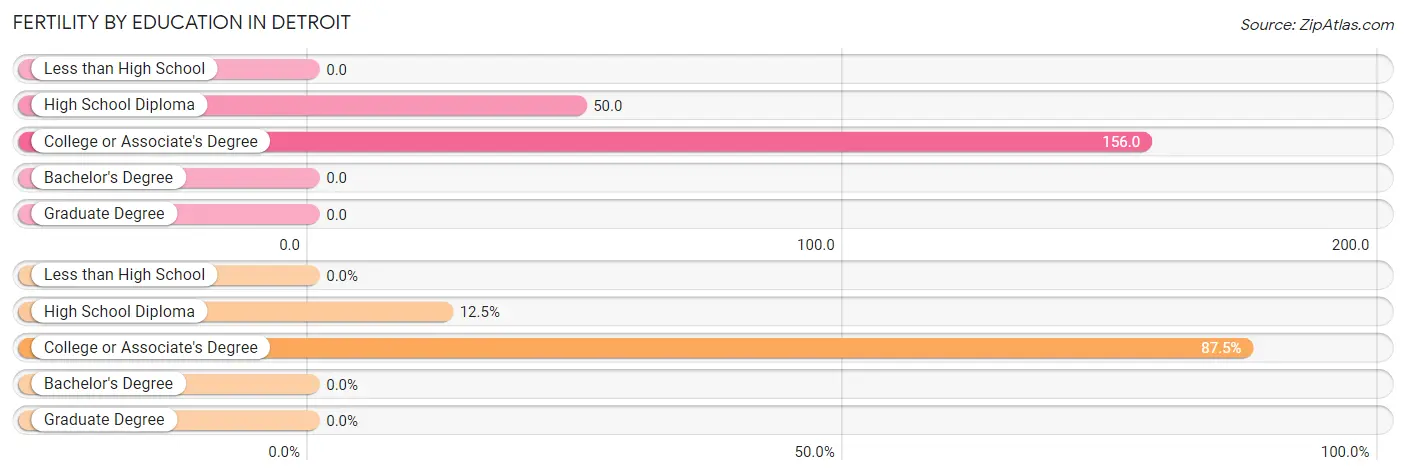
| Educational Attainment | Women with Births | Births / 1,000 Women |
| Less than High School | 0 (0.0%) | 0.0 |
| High School Diploma | 2 (12.5%) | 50.0 |
| College or Associate's Degree | 14 (87.5%) | 156.0 |
| Bachelor's Degree | 0 (0.0%) | 0.0 |
| Graduate Degree | 0 (0.0%) | 0.0 |
| Total | 16 (100.0%) | 91.0 |
Fertility by Education by Marriage Status in Detroit
50.0% of women with births in Detroit are unmarried. Women with the educational attainment of high school diploma are most likely to be married with 100.0% of them married at childbirth, while women with the educational attainment of college or associate's degree are least likely to be married with 57.1% of them unmarried at childbirth.
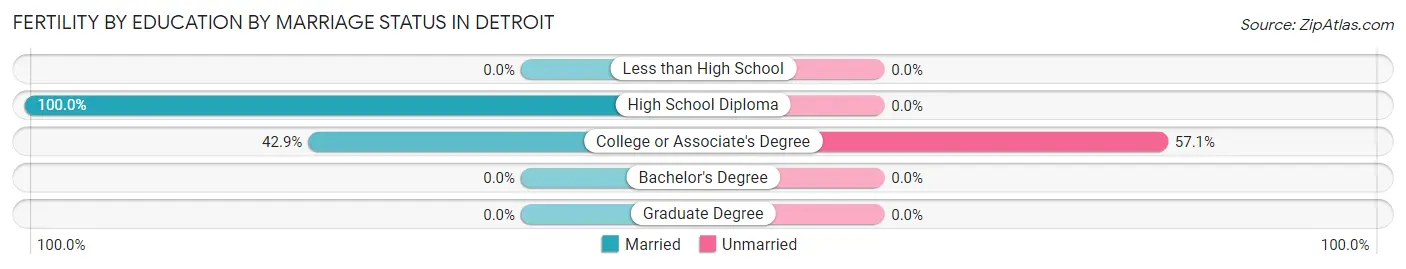
| Educational Attainment | Married | Unmarried |
| Less than High School | 0 (0.0%) | 0 (0.0%) |
| High School Diploma | 2 (100.0%) | 0 (0.0%) |
| College or Associate's Degree | 6 (42.9%) | 8 (57.1%) |
| Bachelor's Degree | 0 (0.0%) | 0 (0.0%) |
| Graduate Degree | 0 (0.0%) | 0 (0.0%) |
| Total | 8 (50.0%) | 8 (50.0%) |
Employment Characteristics in Detroit
Employment by Class of Employer in Detroit
Among the 208 employed individuals in Detroit, private company employees (180 | 86.5%), state government employees (11 | 5.3%), and not-for-profit organizations (7 | 3.4%) make up the most common classes of employment.
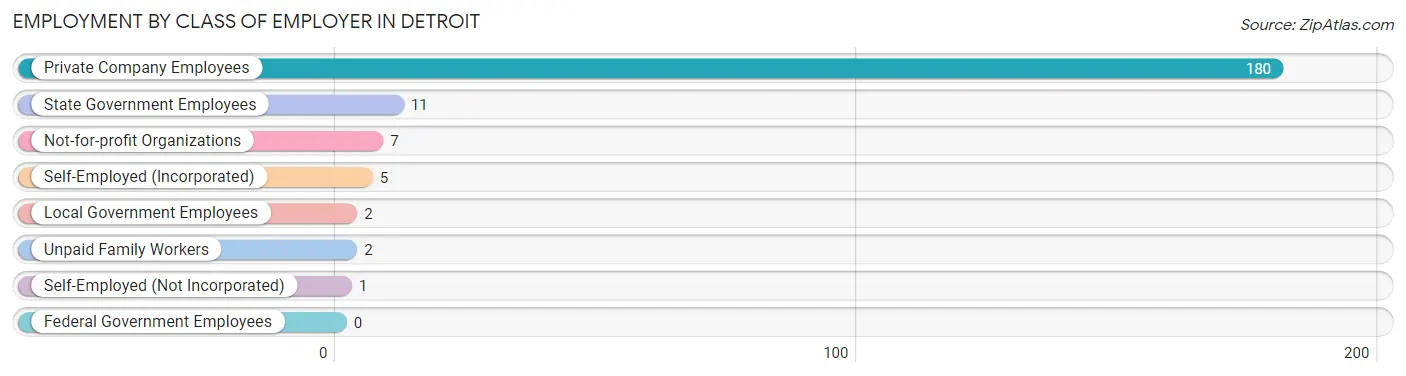
| Employer Class | # Employees | % Employees |
| Private Company Employees | 180 | 86.5% |
| Self-Employed (Incorporated) | 5 | 2.4% |
| Self-Employed (Not Incorporated) | 1 | 0.5% |
| Not-for-profit Organizations | 7 | 3.4% |
| Local Government Employees | 2 | 1.0% |
| State Government Employees | 11 | 5.3% |
| Federal Government Employees | 0 | 0.0% |
| Unpaid Family Workers | 2 | 1.0% |
| Total | 208 | 100.0% |
Employment Status by Age in Detroit
According to the labor force statistics for Detroit, out of the total population over 16 years of age (496), 46.0% or 228 individuals are in the labor force, with 6.1% or 14 of them unemployed. The age group with the highest labor force participation rate is 55 to 59 years, with 95.7% or 22 individuals in the labor force. Within the labor force, the 60 to 64 years age range has the highest percentage of unemployed individuals, with 28.0% or 7 of them being unemployed.
| Age Bracket | In Labor Force | Unemployed |
| 16 to 19 Years | 7 (9.2%) | 0 (0.0%) |
| 20 to 24 Years | 47 (71.2%) | 4 (8.5%) |
| 25 to 29 Years | 23 (59.0%) | 0 (0.0%) |
| 30 to 34 Years | 23 (82.1%) | 0 (0.0%) |
| 35 to 44 Years | 34 (56.7%) | 0 (0.0%) |
| 45 to 54 Years | 46 (66.7%) | 3 (6.5%) |
| 55 to 59 Years | 22 (95.7%) | 0 (0.0%) |
| 60 to 64 Years | 25 (51.0%) | 7 (28.0%) |
| 65 to 74 Years | 0 (0.0%) | 0 (0.0%) |
| 75 Years and over | 1 (2.6%) | 0 (0.0%) |
| Total | 228 (46.0%) | 14 (6.1%) |
Employment Status by Educational Attainment in Detroit
According to labor force statistics for Detroit, 64.6% of individuals (173) out of the total population between 25 and 64 years of age (268) are in the labor force, with 5.8% or 10 of them being unemployed. The group with the highest labor force participation rate are those with the educational attainment of bachelor's degree or higher, with 100.0% or 10 individuals in the labor force. Within the labor force, individuals with less than high school education have the highest percentage of unemployment, with 29.4% or 5 of them being unemployed.
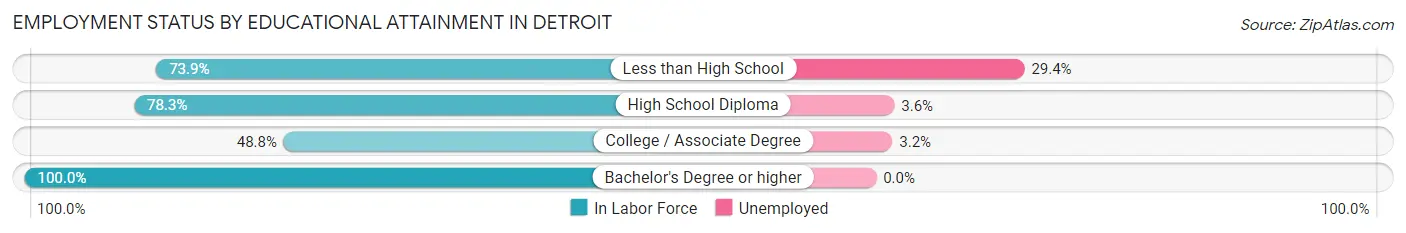
| Educational Attainment | In Labor Force | Unemployed |
| Less than High School | 17 (73.9%) | 7 (29.4%) |
| High School Diploma | 83 (78.3%) | 4 (3.6%) |
| College / Associate Degree | 63 (48.8%) | 4 (3.2%) |
| Bachelor's Degree or higher | 10 (100.0%) | 0 (0.0%) |
| Total | 173 (64.6%) | 16 (5.8%) |
Employment Occupations by Sex in Detroit
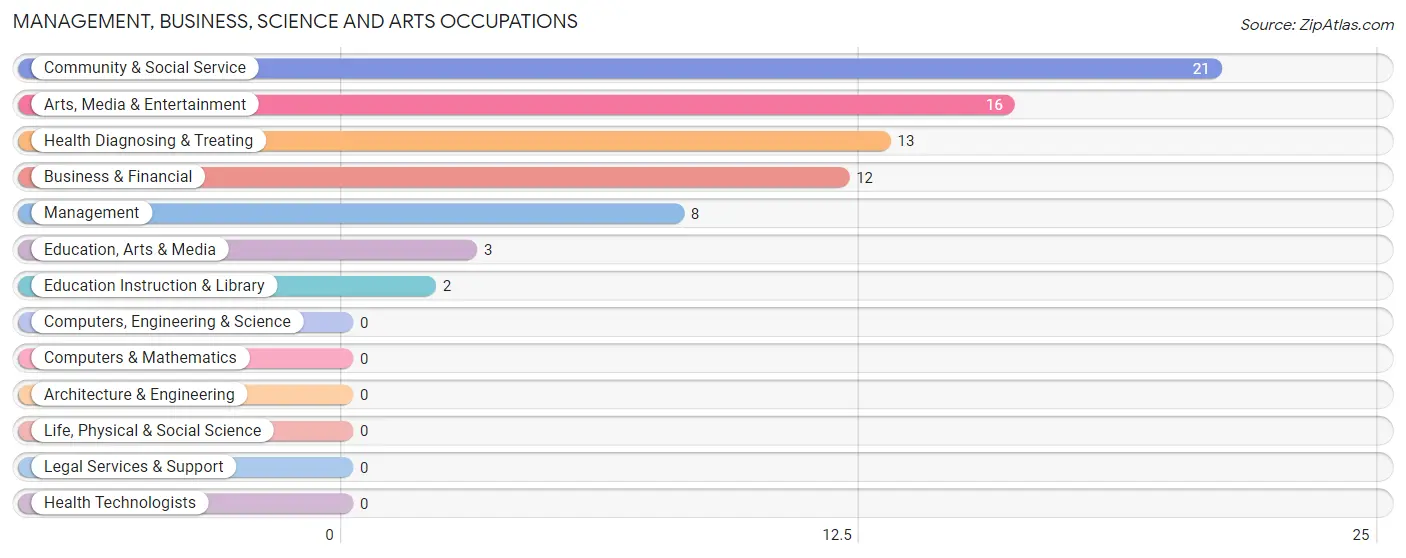
Management, Business, Science and Arts Occupations
The most common Management, Business, Science and Arts occupations in Detroit are Community & Social Service (21 | 9.8%), Arts, Media & Entertainment (16 | 7.5%), Health Diagnosing & Treating (13 | 6.1%), Business & Financial (12 | 5.6%), and Management (8 | 3.7%).
Management, Business, Science and Arts Occupations by Sex
Within the Management, Business, Science and Arts occupations in Detroit, the most male-oriented occupations are Education, Arts & Media (66.7%), Arts, Media & Entertainment (43.8%), and Community & Social Service (42.9%), while the most female-oriented occupations are Business & Financial (100.0%), Education Instruction & Library (100.0%), and Health Diagnosing & Treating (76.9%).
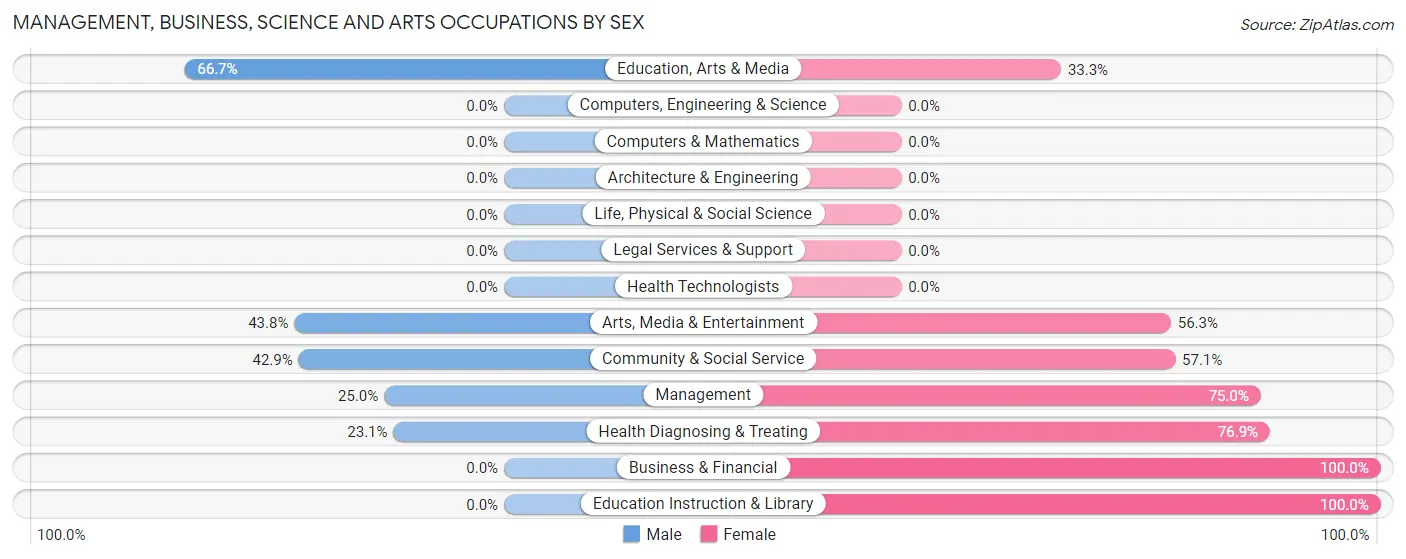
| Occupation | Male | Female |
| Management | 2 (25.0%) | 6 (75.0%) |
| Business & Financial | 0 (0.0%) | 12 (100.0%) |
| Computers, Engineering & Science | 0 (0.0%) | 0 (0.0%) |
| Computers & Mathematics | 0 (0.0%) | 0 (0.0%) |
| Architecture & Engineering | 0 (0.0%) | 0 (0.0%) |
| Life, Physical & Social Science | 0 (0.0%) | 0 (0.0%) |
| Community & Social Service | 9 (42.9%) | 12 (57.1%) |
| Education, Arts & Media | 2 (66.7%) | 1 (33.3%) |
| Legal Services & Support | 0 (0.0%) | 0 (0.0%) |
| Education Instruction & Library | 0 (0.0%) | 2 (100.0%) |
| Arts, Media & Entertainment | 7 (43.8%) | 9 (56.2%) |
| Health Diagnosing & Treating | 3 (23.1%) | 10 (76.9%) |
| Health Technologists | 0 (0.0%) | 0 (0.0%) |
| Total (Category) | 14 (25.9%) | 40 (74.1%) |
| Total (Overall) | 96 (44.9%) | 118 (55.1%) |
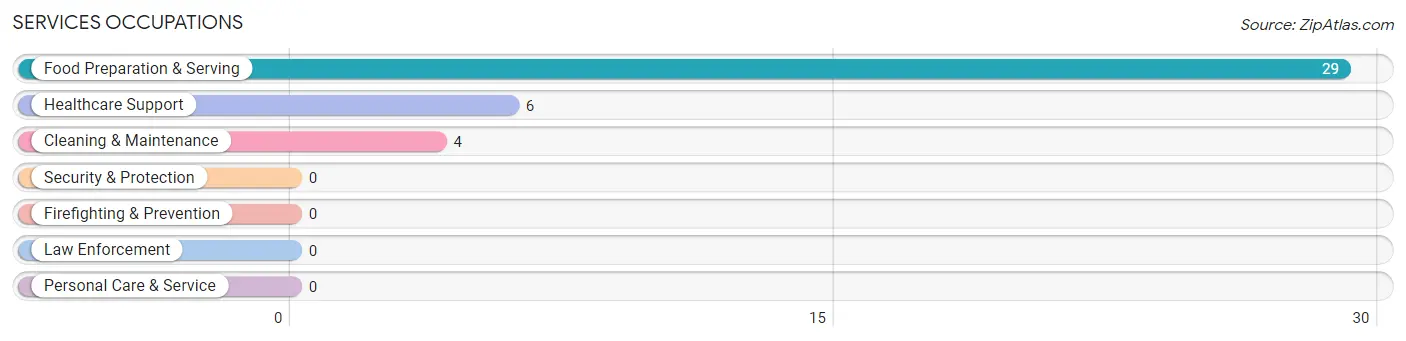
Services Occupations
The most common Services occupations in Detroit are Food Preparation & Serving (29 | 13.6%), Healthcare Support (6 | 2.8%), and Cleaning & Maintenance (4 | 1.9%).
Services Occupations by Sex
Within the Services occupations in Detroit, the most male-oriented occupations are Cleaning & Maintenance (100.0%), and Food Preparation & Serving (37.9%), while the most female-oriented occupations are Healthcare Support (100.0%), and Food Preparation & Serving (62.1%).
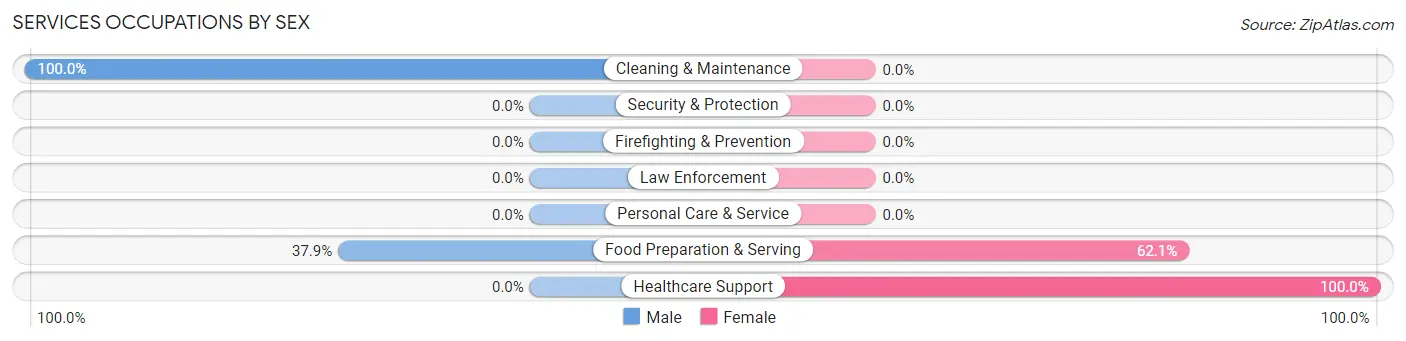
| Occupation | Male | Female |
| Healthcare Support | 0 (0.0%) | 6 (100.0%) |
| Security & Protection | 0 (0.0%) | 0 (0.0%) |
| Firefighting & Prevention | 0 (0.0%) | 0 (0.0%) |
| Law Enforcement | 0 (0.0%) | 0 (0.0%) |
| Food Preparation & Serving | 11 (37.9%) | 18 (62.1%) |
| Cleaning & Maintenance | 4 (100.0%) | 0 (0.0%) |
| Personal Care & Service | 0 (0.0%) | 0 (0.0%) |
| Total (Category) | 15 (38.5%) | 24 (61.5%) |
| Total (Overall) | 96 (44.9%) | 118 (55.1%) |
Sales and Office Occupations
The most common Sales and Office occupations in Detroit are Sales & Related (47 | 22.0%), and Office & Administration (16 | 7.5%).

Sales and Office Occupations by Sex

| Occupation | Male | Female |
| Sales & Related | 15 (31.9%) | 32 (68.1%) |
| Office & Administration | 7 (43.8%) | 9 (56.2%) |
| Total (Category) | 22 (34.9%) | 41 (65.1%) |
| Total (Overall) | 96 (44.9%) | 118 (55.1%) |
Natural Resources, Construction and Maintenance Occupations
The most common Natural Resources, Construction and Maintenance occupations in Detroit are , and Construction & Extraction (10 | 4.7%).
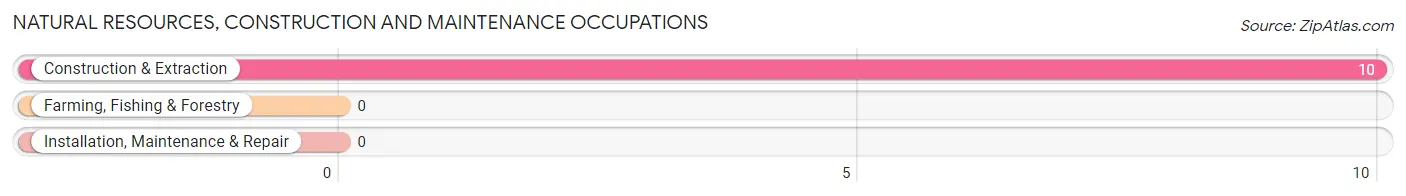
Natural Resources, Construction and Maintenance Occupations by Sex

| Occupation | Male | Female |
| Farming, Fishing & Forestry | 0 (0.0%) | 0 (0.0%) |
| Construction & Extraction | 10 (100.0%) | 0 (0.0%) |
| Installation, Maintenance & Repair | 0 (0.0%) | 0 (0.0%) |
| Total (Category) | 10 (100.0%) | 0 (0.0%) |
| Total (Overall) | 96 (44.9%) | 118 (55.1%) |
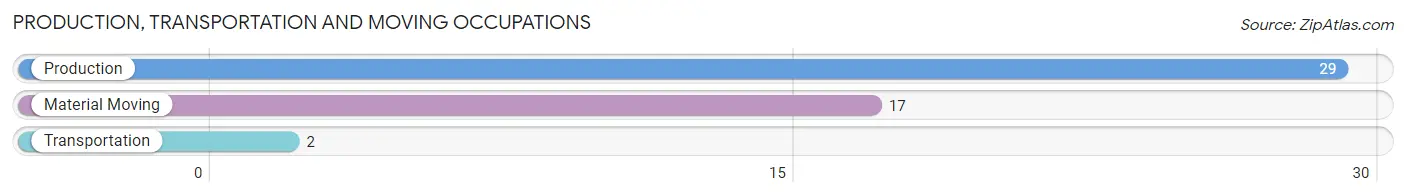
Production, Transportation and Moving Occupations
The most common Production, Transportation and Moving occupations in Detroit are Production (29 | 13.6%), Material Moving (17 | 7.9%), and Transportation (2 | 0.9%).
Production, Transportation and Moving Occupations by Sex
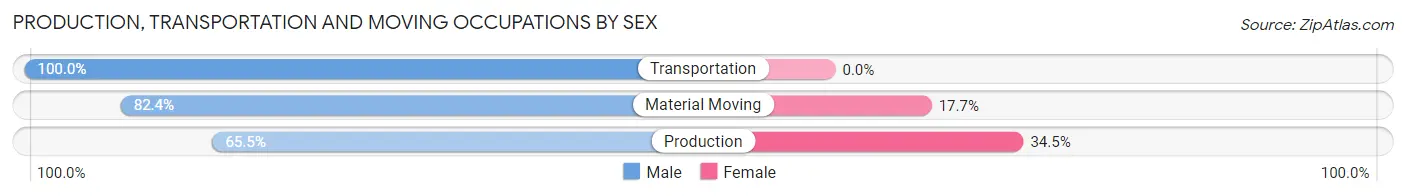
| Occupation | Male | Female |
| Production | 19 (65.5%) | 10 (34.5%) |
| Transportation | 2 (100.0%) | 0 (0.0%) |
| Material Moving | 14 (82.4%) | 3 (17.6%) |
| Total (Category) | 35 (72.9%) | 13 (27.1%) |
| Total (Overall) | 96 (44.9%) | 118 (55.1%) |
Employment Industries by Sex in Detroit
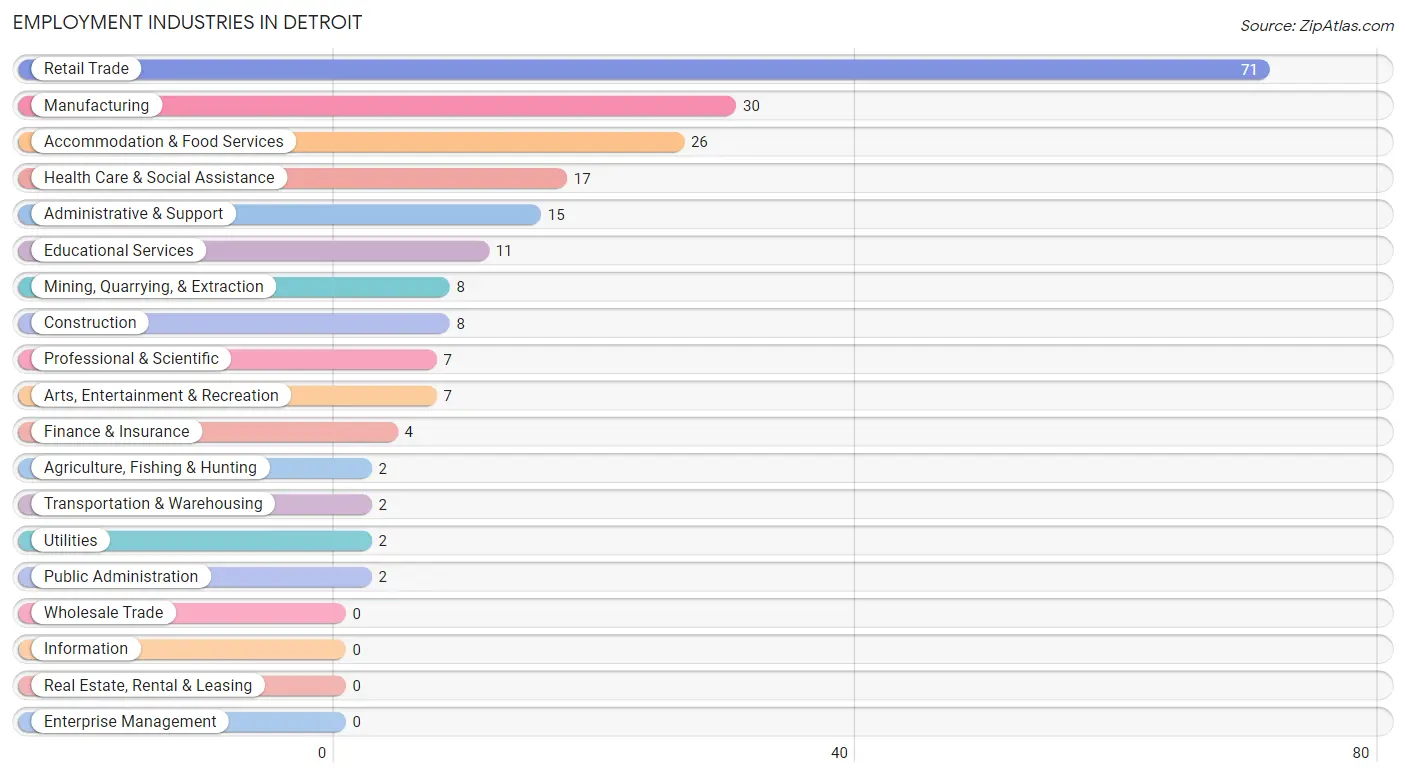
Employment Industries in Detroit
The major employment industries in Detroit include Retail Trade (71 | 33.2%), Manufacturing (30 | 14.0%), Accommodation & Food Services (26 | 12.1%), Health Care & Social Assistance (17 | 7.9%), and Administrative & Support (15 | 7.0%).
Employment Industries by Sex in Detroit
The Detroit industries that see more men than women are Agriculture, Fishing & Hunting (100.0%), Mining, Quarrying, & Extraction (100.0%), and Construction (100.0%), whereas the industries that tend to have a higher number of women are Finance & Insurance (100.0%), Professional & Scientific (100.0%), and Educational Services (100.0%).
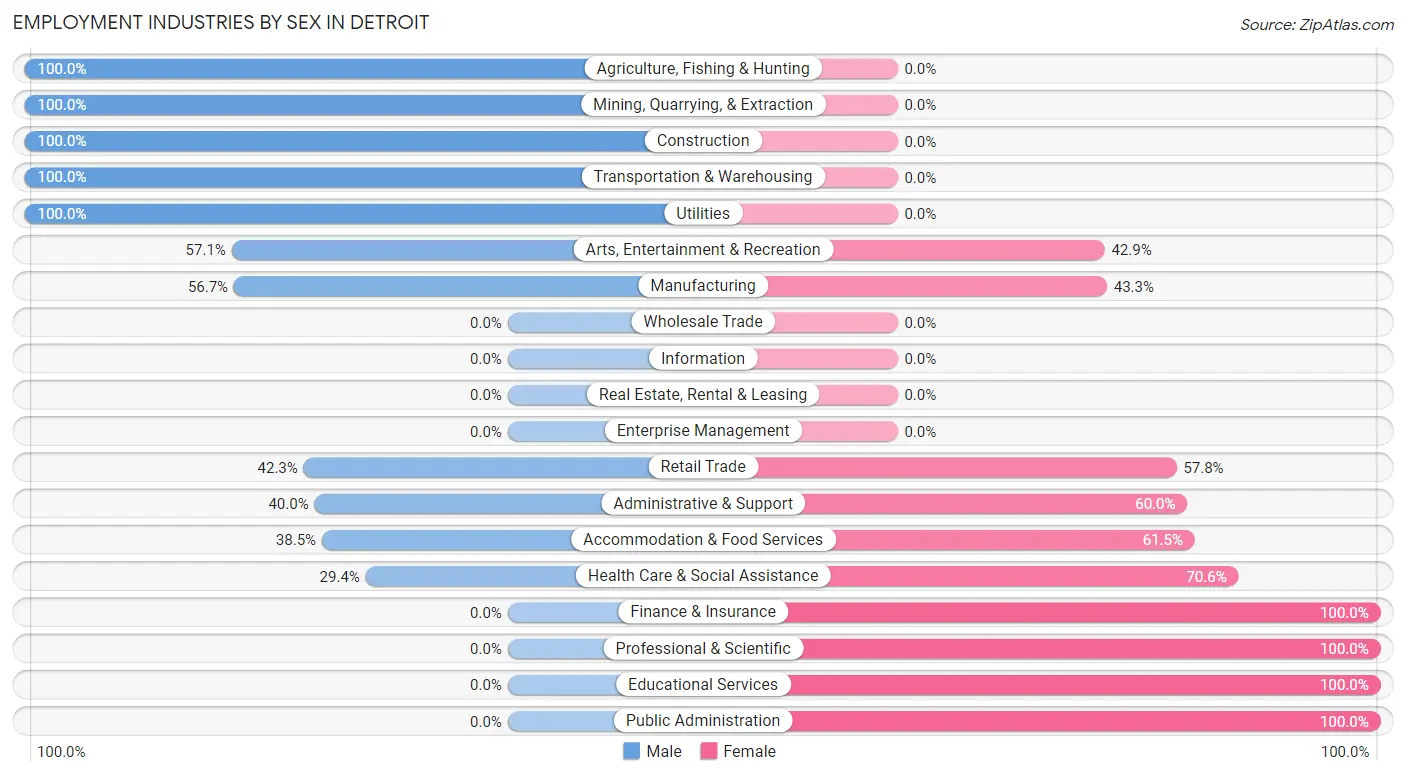
| Industry | Male | Female |
| Agriculture, Fishing & Hunting | 2 (100.0%) | 0 (0.0%) |
| Mining, Quarrying, & Extraction | 8 (100.0%) | 0 (0.0%) |
| Construction | 8 (100.0%) | 0 (0.0%) |
| Manufacturing | 17 (56.7%) | 13 (43.3%) |
| Wholesale Trade | 0 (0.0%) | 0 (0.0%) |
| Retail Trade | 30 (42.2%) | 41 (57.8%) |
| Transportation & Warehousing | 2 (100.0%) | 0 (0.0%) |
| Utilities | 2 (100.0%) | 0 (0.0%) |
| Information | 0 (0.0%) | 0 (0.0%) |
| Finance & Insurance | 0 (0.0%) | 4 (100.0%) |
| Real Estate, Rental & Leasing | 0 (0.0%) | 0 (0.0%) |
| Professional & Scientific | 0 (0.0%) | 7 (100.0%) |
| Enterprise Management | 0 (0.0%) | 0 (0.0%) |
| Administrative & Support | 6 (40.0%) | 9 (60.0%) |
| Educational Services | 0 (0.0%) | 11 (100.0%) |
| Health Care & Social Assistance | 5 (29.4%) | 12 (70.6%) |
| Arts, Entertainment & Recreation | 4 (57.1%) | 3 (42.9%) |
| Accommodation & Food Services | 10 (38.5%) | 16 (61.5%) |
| Public Administration | 0 (0.0%) | 2 (100.0%) |
| Total | 96 (44.9%) | 118 (55.1%) |
Education in Detroit
School Enrollment in Detroit
The most common levels of schooling among the 165 students in Detroit are high school (62 | 37.6%), middle school (34 | 20.6%), and college / undergraduate (32 | 19.4%).
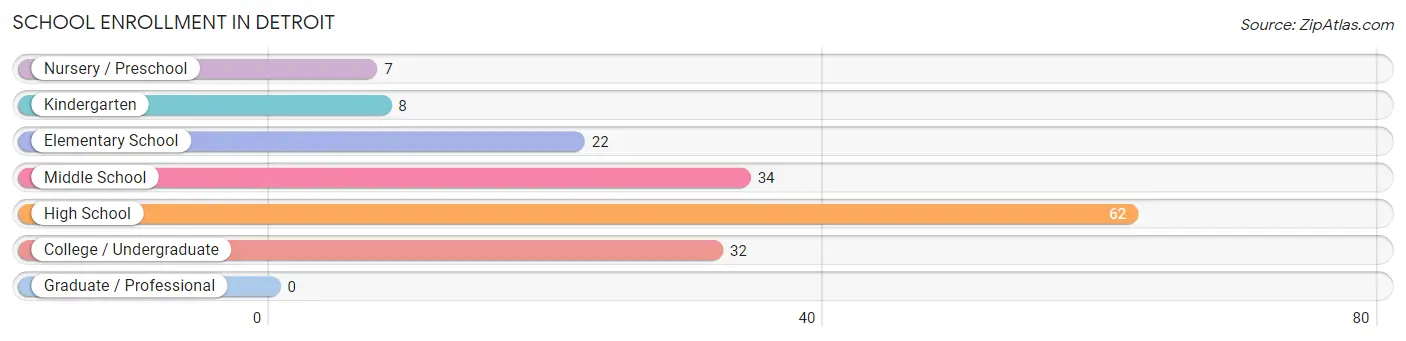
| School Level | # Students | % Students |
| Nursery / Preschool | 7 | 4.2% |
| Kindergarten | 8 | 4.9% |
| Elementary School | 22 | 13.3% |
| Middle School | 34 | 20.6% |
| High School | 62 | 37.6% |
| College / Undergraduate | 32 | 19.4% |
| Graduate / Professional | 0 | 0.0% |
| Total | 165 | 100.0% |
School Enrollment by Age by Funding Source in Detroit
Out of a total of 165 students who are enrolled in schools in Detroit, 13 (7.9%) attend a private institution, while the remaining 152 (92.1%) are enrolled in public schools. The age group of 20 to 24 year olds has the highest likelihood of being enrolled in private schools, with 13 (52.0% in the age bracket) enrolled. Conversely, the age group of 5 to 9 year old has the lowest likelihood of being enrolled in a private school, with 34 (100.0% in the age bracket) attending a public institution.
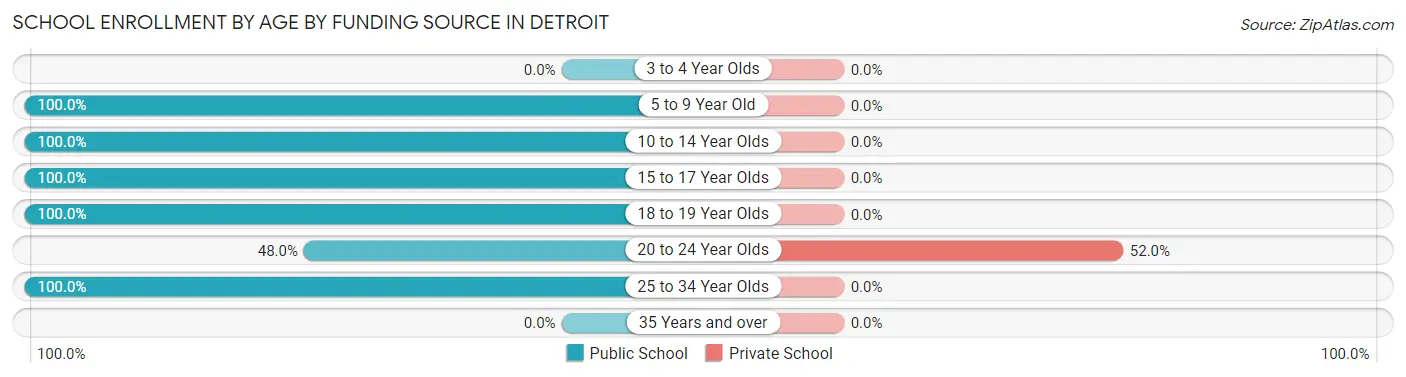
| Age Bracket | Public School | Private School |
| 3 to 4 Year Olds | 0 (0.0%) | 0 (0.0%) |
| 5 to 9 Year Old | 34 (100.0%) | 0 (0.0%) |
| 10 to 14 Year Olds | 40 (100.0%) | 0 (0.0%) |
| 15 to 17 Year Olds | 59 (100.0%) | 0 (0.0%) |
| 18 to 19 Year Olds | 2 (100.0%) | 0 (0.0%) |
| 20 to 24 Year Olds | 12 (48.0%) | 13 (52.0%) |
| 25 to 34 Year Olds | 5 (100.0%) | 0 (0.0%) |
| 35 Years and over | 0 (0.0%) | 0 (0.0%) |
| Total | 152 (92.1%) | 13 (7.9%) |
Educational Attainment by Field of Study in Detroit
Education (5 | 25.0%), business (4 | 20.0%), multidisciplinary studies (3 | 15.0%), liberal arts & history (3 | 15.0%), and bio, nature & agricultural (2 | 10.0%) are the most common fields of study among 20 individuals in Detroit who have obtained a bachelor's degree or higher.
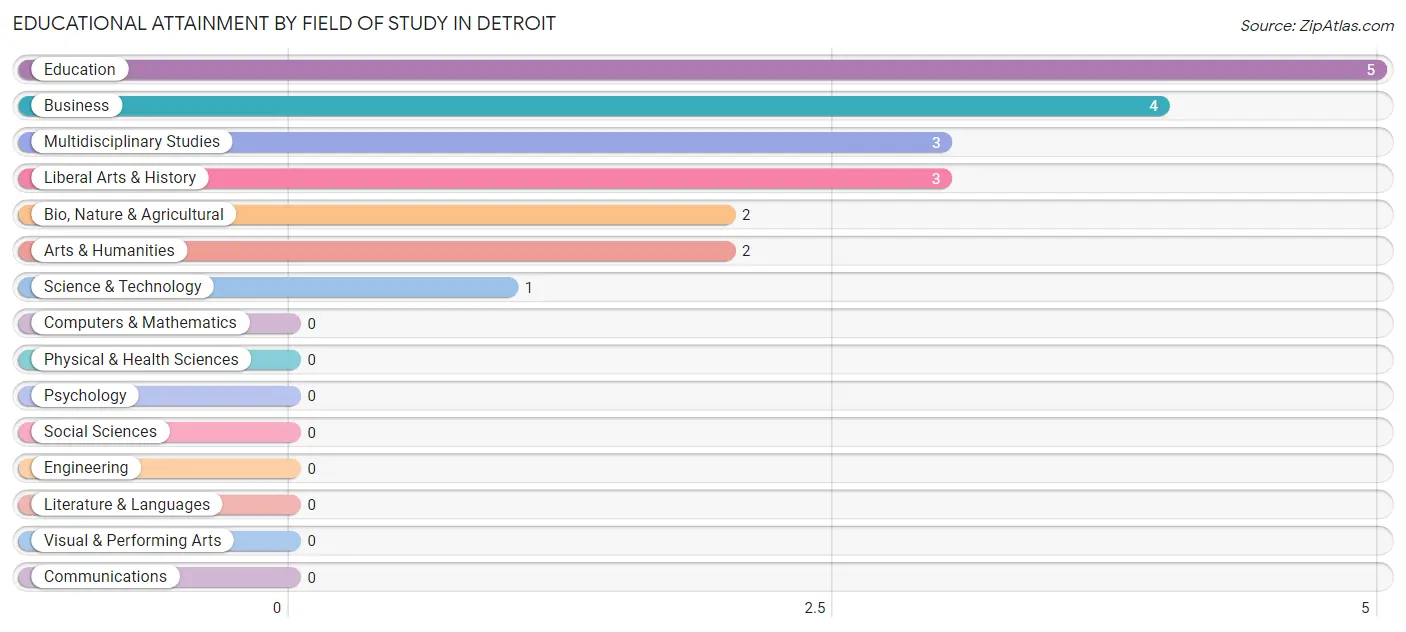
| Field of Study | # Graduates | % Graduates |
| Computers & Mathematics | 0 | 0.0% |
| Bio, Nature & Agricultural | 2 | 10.0% |
| Physical & Health Sciences | 0 | 0.0% |
| Psychology | 0 | 0.0% |
| Social Sciences | 0 | 0.0% |
| Engineering | 0 | 0.0% |
| Multidisciplinary Studies | 3 | 15.0% |
| Science & Technology | 1 | 5.0% |
| Business | 4 | 20.0% |
| Education | 5 | 25.0% |
| Literature & Languages | 0 | 0.0% |
| Liberal Arts & History | 3 | 15.0% |
| Visual & Performing Arts | 0 | 0.0% |
| Communications | 0 | 0.0% |
| Arts & Humanities | 2 | 10.0% |
| Total | 20 | 100.0% |
Transportation & Commute in Detroit
Vehicle Availability by Sex in Detroit
The most prevalent vehicle ownership categories in Detroit are males with 2 vehicles (25, accounting for 27.8%) and females with 2 vehicles (31, making up 21.2%).
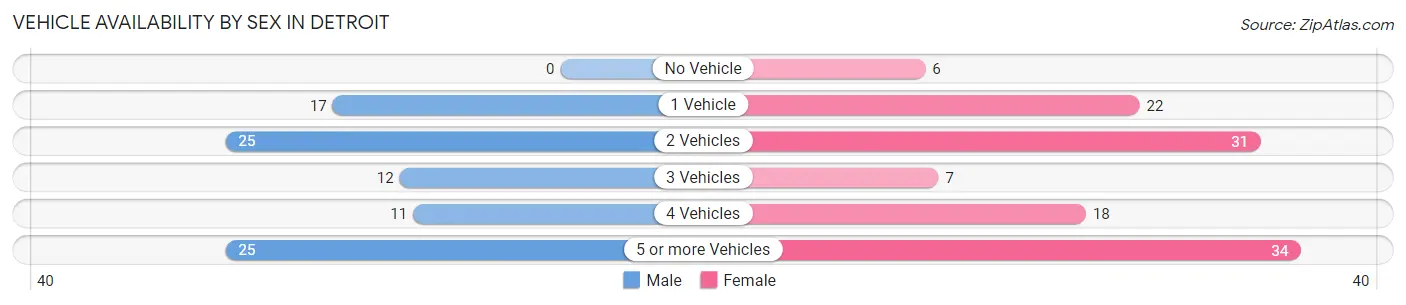
| Vehicles Available | Male | Female |
| No Vehicle | 0 (0.0%) | 6 (5.1%) |
| 1 Vehicle | 17 (18.9%) | 22 (18.6%) |
| 2 Vehicles | 25 (27.8%) | 31 (26.3%) |
| 3 Vehicles | 12 (13.3%) | 7 (5.9%) |
| 4 Vehicles | 11 (12.2%) | 18 (15.2%) |
| 5 or more Vehicles | 25 (27.8%) | 34 (28.8%) |
| Total | 90 (100.0%) | 118 (100.0%) |
Commute Time in Detroit
The most frequently occuring commute durations in Detroit are 20 to 24 minutes (76 commuters, 37.1%), 30 to 34 minutes (43 commuters, 21.0%), and 90 or more minutes (29 commuters, 14.1%).
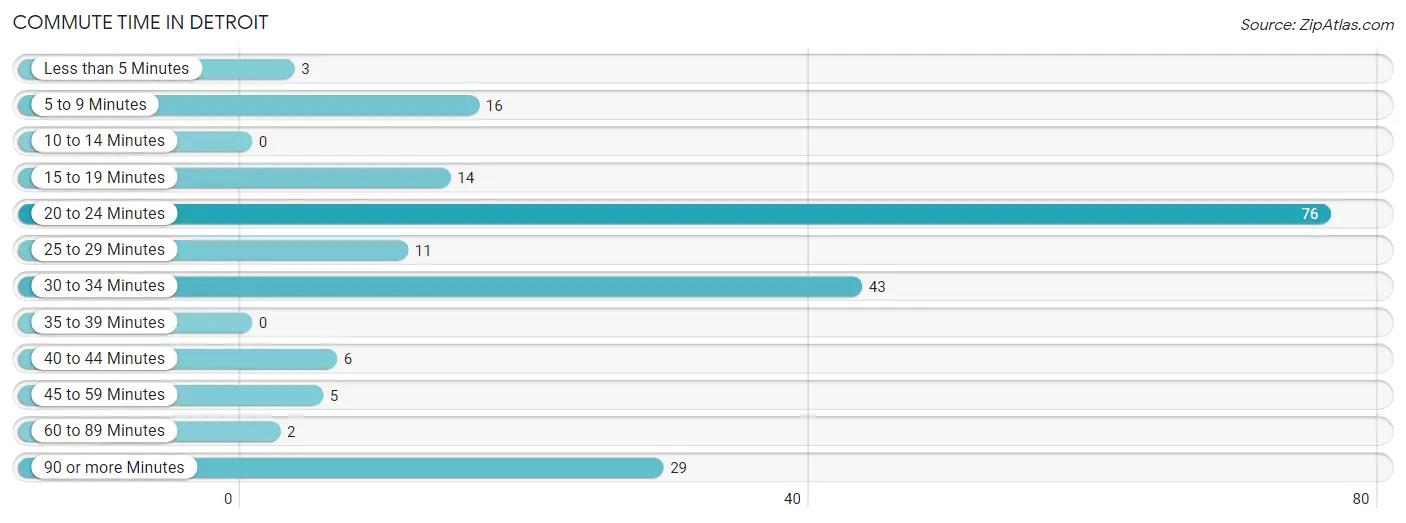
| Commute Time | # Commuters | % Commuters |
| Less than 5 Minutes | 3 | 1.5% |
| 5 to 9 Minutes | 16 | 7.8% |
| 10 to 14 Minutes | 0 | 0.0% |
| 15 to 19 Minutes | 14 | 6.8% |
| 20 to 24 Minutes | 76 | 37.1% |
| 25 to 29 Minutes | 11 | 5.4% |
| 30 to 34 Minutes | 43 | 21.0% |
| 35 to 39 Minutes | 0 | 0.0% |
| 40 to 44 Minutes | 6 | 2.9% |
| 45 to 59 Minutes | 5 | 2.4% |
| 60 to 89 Minutes | 2 | 1.0% |
| 90 or more Minutes | 29 | 14.1% |
Commute Time by Sex in Detroit
The most common commute times in Detroit are 20 to 24 minutes (32 commuters, 36.8%) for males and 20 to 24 minutes (44 commuters, 37.3%) for females.
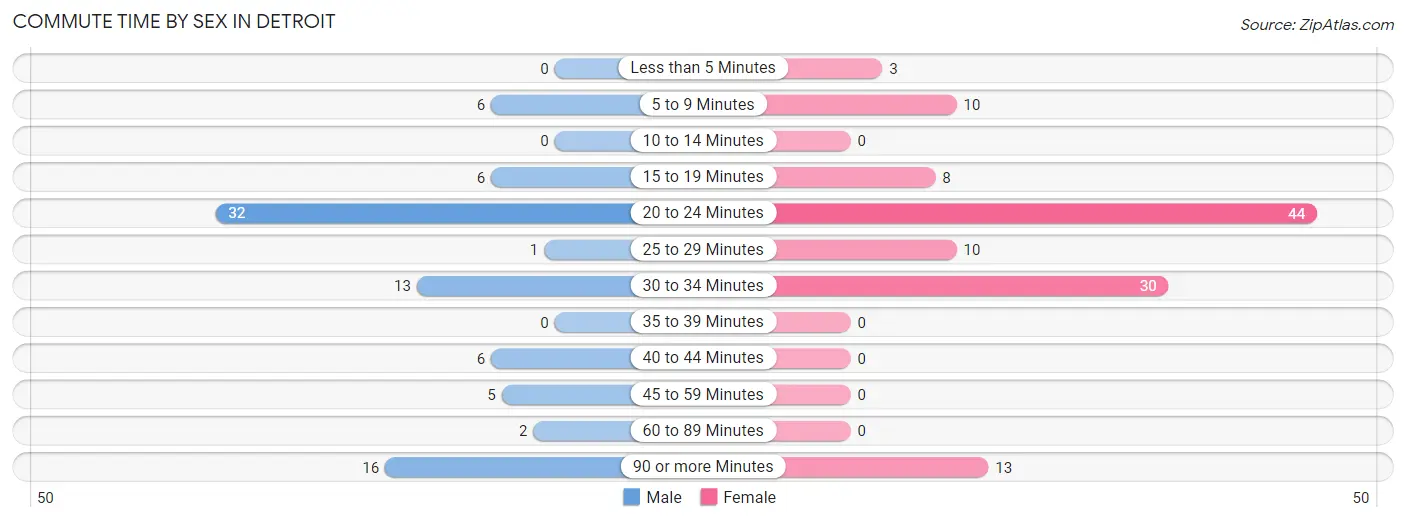
| Commute Time | Male | Female |
| Less than 5 Minutes | 0 (0.0%) | 3 (2.5%) |
| 5 to 9 Minutes | 6 (6.9%) | 10 (8.5%) |
| 10 to 14 Minutes | 0 (0.0%) | 0 (0.0%) |
| 15 to 19 Minutes | 6 (6.9%) | 8 (6.8%) |
| 20 to 24 Minutes | 32 (36.8%) | 44 (37.3%) |
| 25 to 29 Minutes | 1 (1.1%) | 10 (8.5%) |
| 30 to 34 Minutes | 13 (14.9%) | 30 (25.4%) |
| 35 to 39 Minutes | 0 (0.0%) | 0 (0.0%) |
| 40 to 44 Minutes | 6 (6.9%) | 0 (0.0%) |
| 45 to 59 Minutes | 5 (5.8%) | 0 (0.0%) |
| 60 to 89 Minutes | 2 (2.3%) | 0 (0.0%) |
| 90 or more Minutes | 16 (18.4%) | 13 (11.0%) |
Time of Departure to Work by Sex in Detroit
The most frequent times of departure to work in Detroit are 12:00 AM to 4:59 AM (18, 20.7%) for males and 5:00 AM to 5:29 AM (36, 30.5%) for females.
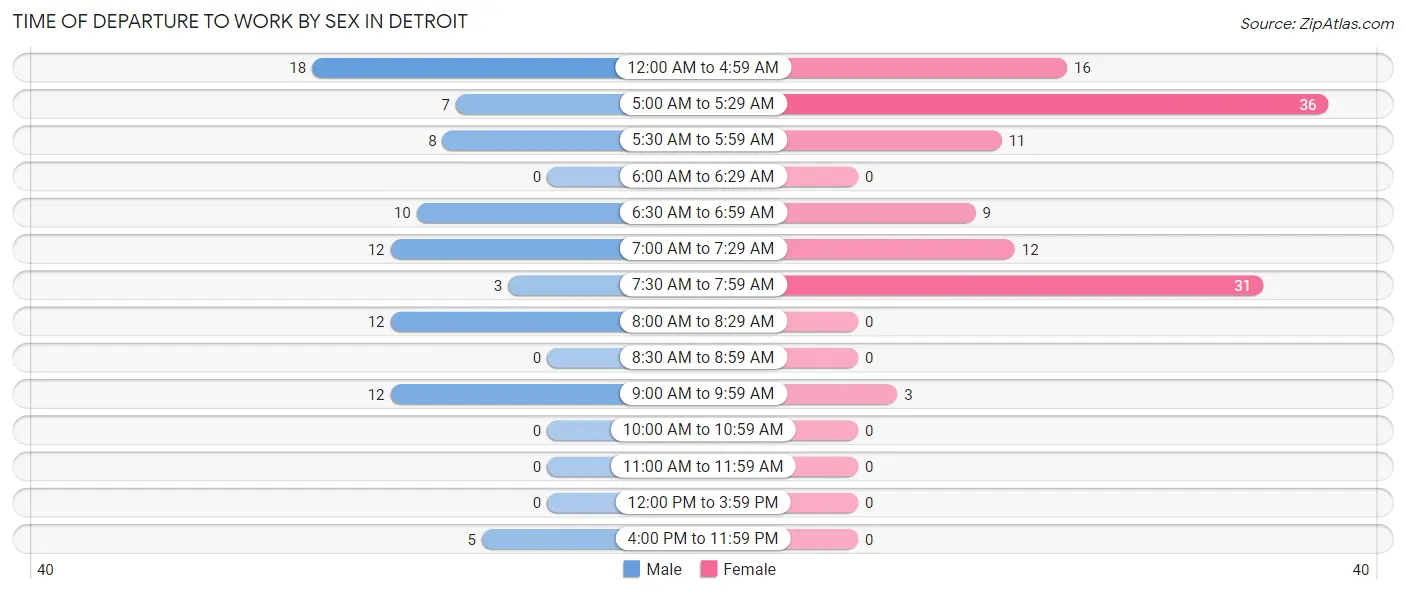
| Time of Departure | Male | Female |
| 12:00 AM to 4:59 AM | 18 (20.7%) | 16 (13.6%) |
| 5:00 AM to 5:29 AM | 7 (8.1%) | 36 (30.5%) |
| 5:30 AM to 5:59 AM | 8 (9.2%) | 11 (9.3%) |
| 6:00 AM to 6:29 AM | 0 (0.0%) | 0 (0.0%) |
| 6:30 AM to 6:59 AM | 10 (11.5%) | 9 (7.6%) |
| 7:00 AM to 7:29 AM | 12 (13.8%) | 12 (10.2%) |
| 7:30 AM to 7:59 AM | 3 (3.5%) | 31 (26.3%) |
| 8:00 AM to 8:29 AM | 12 (13.8%) | 0 (0.0%) |
| 8:30 AM to 8:59 AM | 0 (0.0%) | 0 (0.0%) |
| 9:00 AM to 9:59 AM | 12 (13.8%) | 3 (2.5%) |
| 10:00 AM to 10:59 AM | 0 (0.0%) | 0 (0.0%) |
| 11:00 AM to 11:59 AM | 0 (0.0%) | 0 (0.0%) |
| 12:00 PM to 3:59 PM | 0 (0.0%) | 0 (0.0%) |
| 4:00 PM to 11:59 PM | 5 (5.8%) | 0 (0.0%) |
| Total | 87 (100.0%) | 118 (100.0%) |
Housing Occupancy in Detroit
Occupancy by Ownership in Detroit
Of the total 205 dwellings in Detroit, owner-occupied units account for 135 (65.8%), while renter-occupied units make up 70 (34.2%).
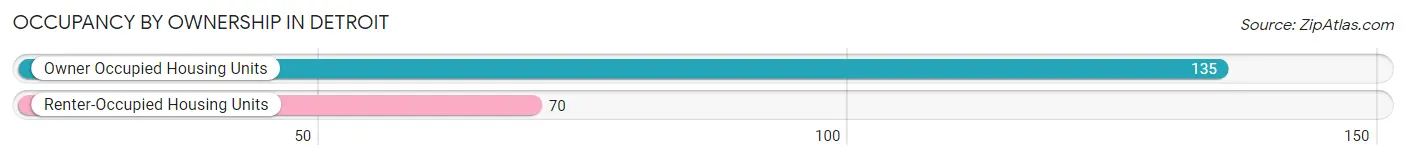
| Occupancy | # Housing Units | % Housing Units |
| Owner Occupied Housing Units | 135 | 65.8% |
| Renter-Occupied Housing Units | 70 | 34.2% |
| Total Occupied Housing Units | 205 | 100.0% |
Occupancy by Household Size in Detroit
| Household Size | # Housing Units | % Housing Units |
| 1-Person Household | 49 | 23.9% |
| 2-Person Household | 69 | 33.7% |
| 3-Person Household | 36 | 17.6% |
| 4+ Person Household | 51 | 24.9% |
| Total Housing Units | 205 | 100.0% |
Occupancy by Ownership by Household Size in Detroit
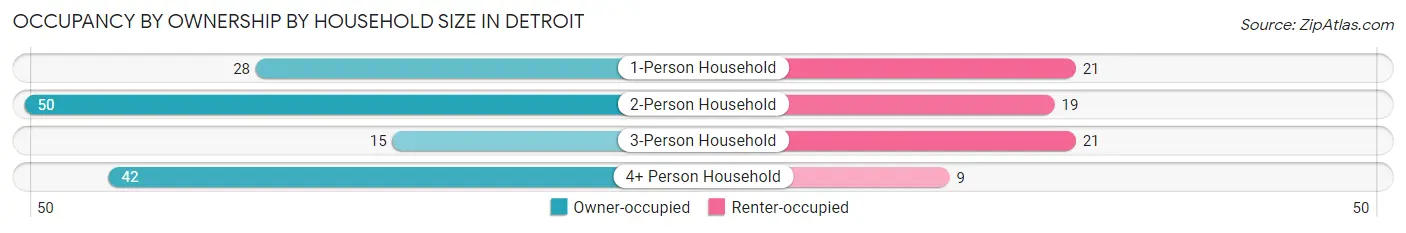
| Household Size | Owner-occupied | Renter-occupied |
| 1-Person Household | 28 (57.1%) | 21 (42.9%) |
| 2-Person Household | 50 (72.5%) | 19 (27.5%) |
| 3-Person Household | 15 (41.7%) | 21 (58.3%) |
| 4+ Person Household | 42 (82.4%) | 9 (17.6%) |
| Total Housing Units | 135 (65.8%) | 70 (34.2%) |
Occupancy by Educational Attainment in Detroit
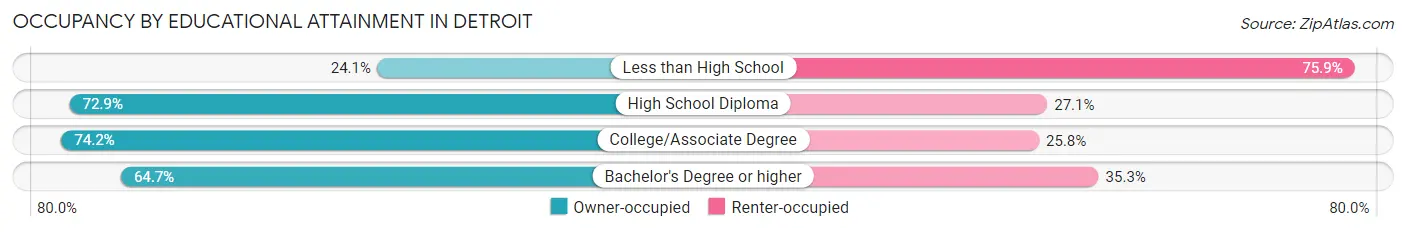
| Household Size | Owner-occupied | Renter-occupied |
| Less than High School | 7 (24.1%) | 22 (75.9%) |
| High School Diploma | 51 (72.9%) | 19 (27.1%) |
| College/Associate Degree | 66 (74.2%) | 23 (25.8%) |
| Bachelor's Degree or higher | 11 (64.7%) | 6 (35.3%) |
Occupancy by Age of Householder in Detroit
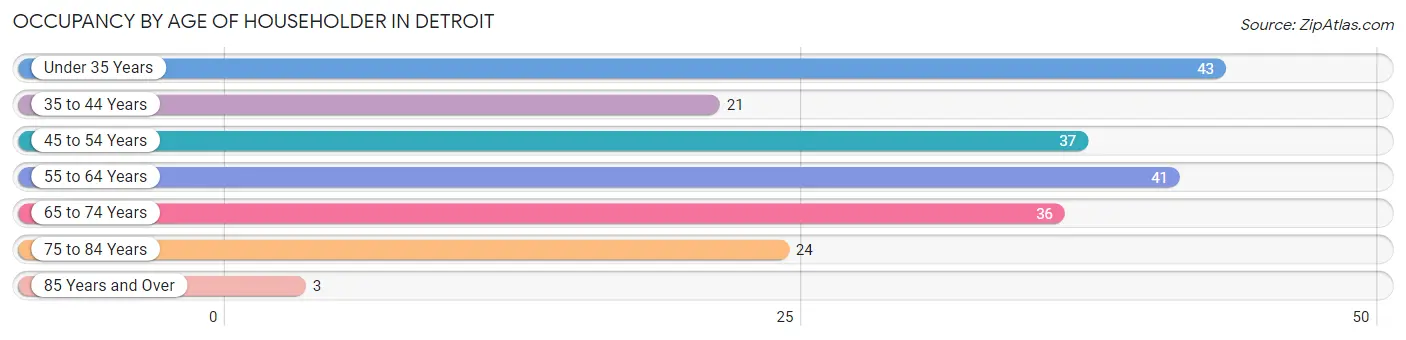
| Age Bracket | # Households | % Households |
| Under 35 Years | 43 | 21.0% |
| 35 to 44 Years | 21 | 10.2% |
| 45 to 54 Years | 37 | 18.0% |
| 55 to 64 Years | 41 | 20.0% |
| 65 to 74 Years | 36 | 17.6% |
| 75 to 84 Years | 24 | 11.7% |
| 85 Years and Over | 3 | 1.5% |
| Total | 205 | 100.0% |
Housing Finances in Detroit
Median Income by Occupancy in Detroit
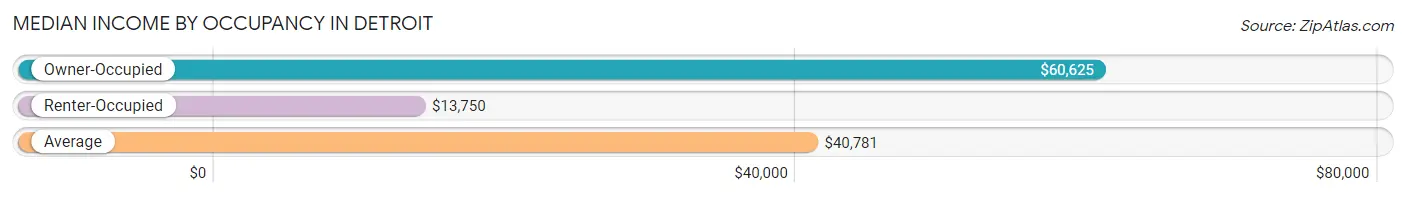
| Occupancy Type | # Households | Median Income |
| Owner-Occupied | 135 (65.8%) | $60,625 |
| Renter-Occupied | 70 (34.2%) | $13,750 |
| Average | 205 (100.0%) | $40,781 |
Occupancy by Householder Income Bracket in Detroit
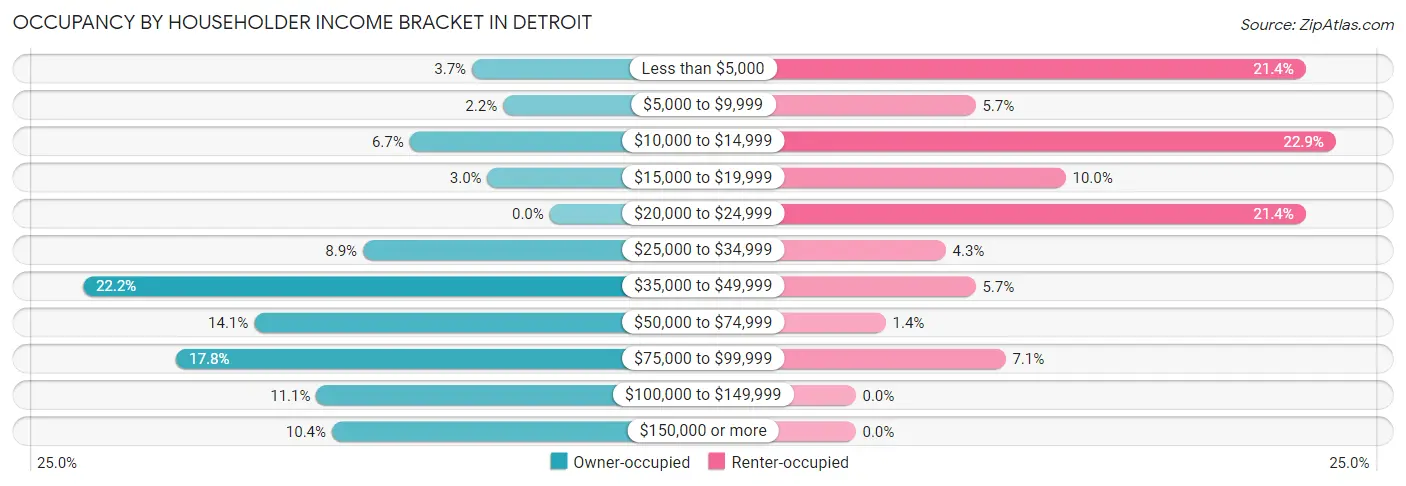
| Income Bracket | Owner-occupied | Renter-occupied |
| Less than $5,000 | 5 (3.7%) | 15 (21.4%) |
| $5,000 to $9,999 | 3 (2.2%) | 4 (5.7%) |
| $10,000 to $14,999 | 9 (6.7%) | 16 (22.9%) |
| $15,000 to $19,999 | 4 (3.0%) | 7 (10.0%) |
| $20,000 to $24,999 | 0 (0.0%) | 15 (21.4%) |
| $25,000 to $34,999 | 12 (8.9%) | 3 (4.3%) |
| $35,000 to $49,999 | 30 (22.2%) | 4 (5.7%) |
| $50,000 to $74,999 | 19 (14.1%) | 1 (1.4%) |
| $75,000 to $99,999 | 24 (17.8%) | 5 (7.1%) |
| $100,000 to $149,999 | 15 (11.1%) | 0 (0.0%) |
| $150,000 or more | 14 (10.4%) | 0 (0.0%) |
| Total | 135 (100.0%) | 70 (100.0%) |
Monthly Housing Cost Tiers in Detroit
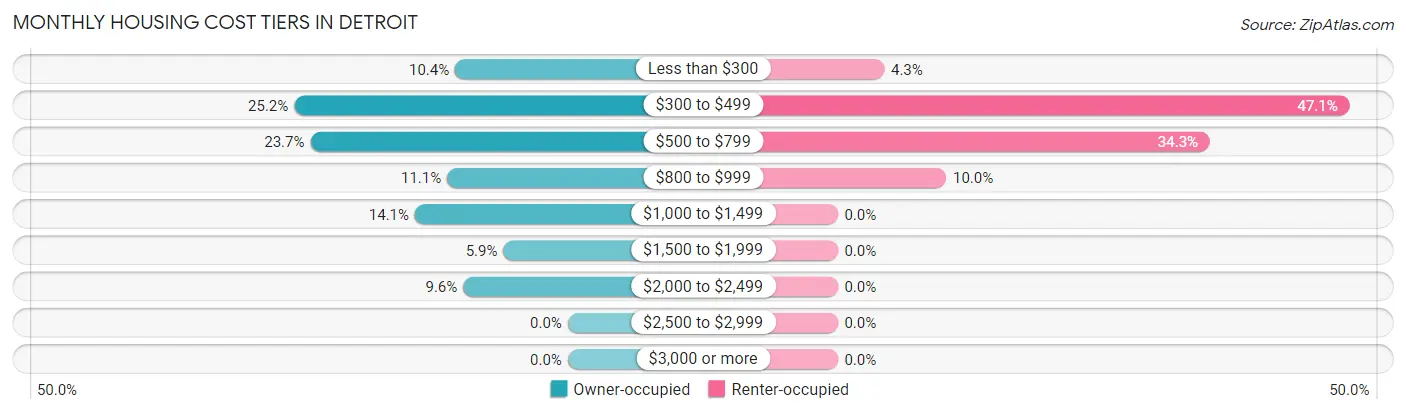
| Monthly Cost | Owner-occupied | Renter-occupied |
| Less than $300 | 14 (10.4%) | 3 (4.3%) |
| $300 to $499 | 34 (25.2%) | 33 (47.1%) |
| $500 to $799 | 32 (23.7%) | 24 (34.3%) |
| $800 to $999 | 15 (11.1%) | 7 (10.0%) |
| $1,000 to $1,499 | 19 (14.1%) | 0 (0.0%) |
| $1,500 to $1,999 | 8 (5.9%) | 0 (0.0%) |
| $2,000 to $2,499 | 13 (9.6%) | 0 (0.0%) |
| $2,500 to $2,999 | 0 (0.0%) | 0 (0.0%) |
| $3,000 or more | 0 (0.0%) | 0 (0.0%) |
| Total | 135 (100.0%) | 70 (100.0%) |
Physical Housing Characteristics in Detroit
Housing Structures in Detroit
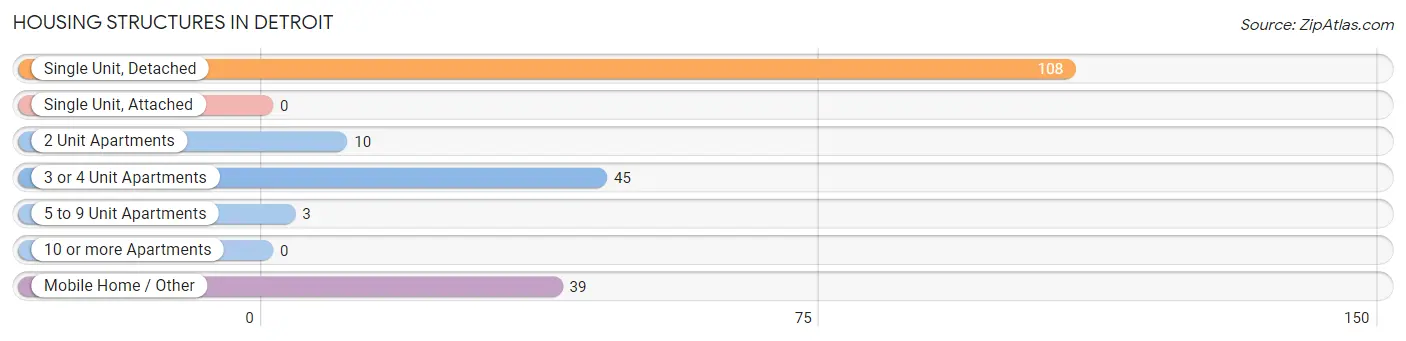
| Structure Type | # Housing Units | % Housing Units |
| Single Unit, Detached | 108 | 52.7% |
| Single Unit, Attached | 0 | 0.0% |
| 2 Unit Apartments | 10 | 4.9% |
| 3 or 4 Unit Apartments | 45 | 22.0% |
| 5 to 9 Unit Apartments | 3 | 1.5% |
| 10 or more Apartments | 0 | 0.0% |
| Mobile Home / Other | 39 | 19.0% |
| Total | 205 | 100.0% |
Housing Structures by Occupancy in Detroit
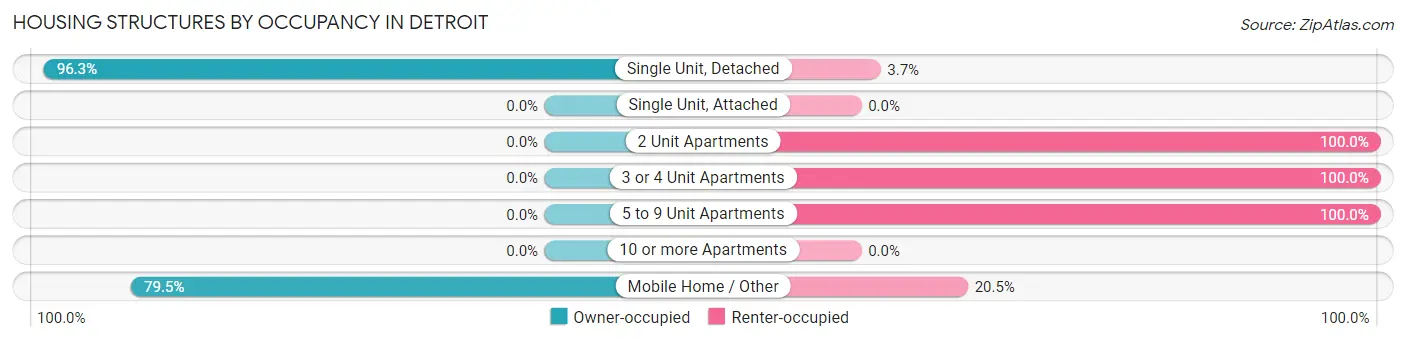
| Structure Type | Owner-occupied | Renter-occupied |
| Single Unit, Detached | 104 (96.3%) | 4 (3.7%) |
| Single Unit, Attached | 0 (0.0%) | 0 (0.0%) |
| 2 Unit Apartments | 0 (0.0%) | 10 (100.0%) |
| 3 or 4 Unit Apartments | 0 (0.0%) | 45 (100.0%) |
| 5 to 9 Unit Apartments | 0 (0.0%) | 3 (100.0%) |
| 10 or more Apartments | 0 (0.0%) | 0 (0.0%) |
| Mobile Home / Other | 31 (79.5%) | 8 (20.5%) |
| Total | 135 (65.8%) | 70 (34.2%) |
Housing Structures by Number of Rooms in Detroit
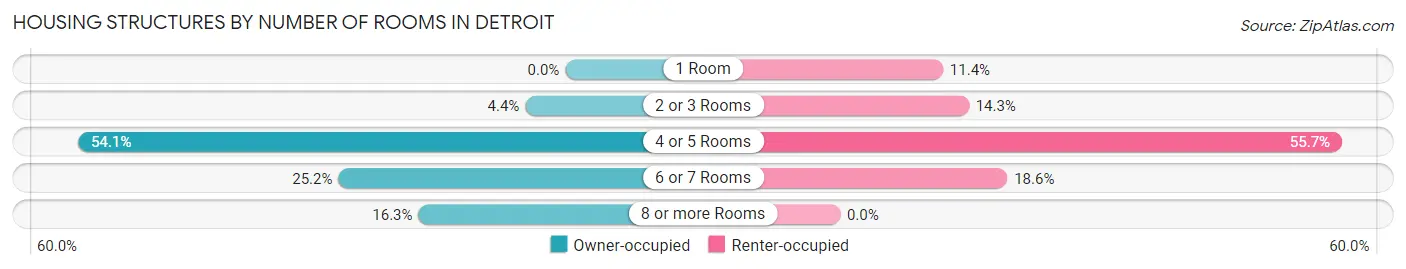
| Number of Rooms | Owner-occupied | Renter-occupied |
| 1 Room | 0 (0.0%) | 8 (11.4%) |
| 2 or 3 Rooms | 6 (4.4%) | 10 (14.3%) |
| 4 or 5 Rooms | 73 (54.1%) | 39 (55.7%) |
| 6 or 7 Rooms | 34 (25.2%) | 13 (18.6%) |
| 8 or more Rooms | 22 (16.3%) | 0 (0.0%) |
| Total | 135 (100.0%) | 70 (100.0%) |
Housing Structure by Heating Type in Detroit
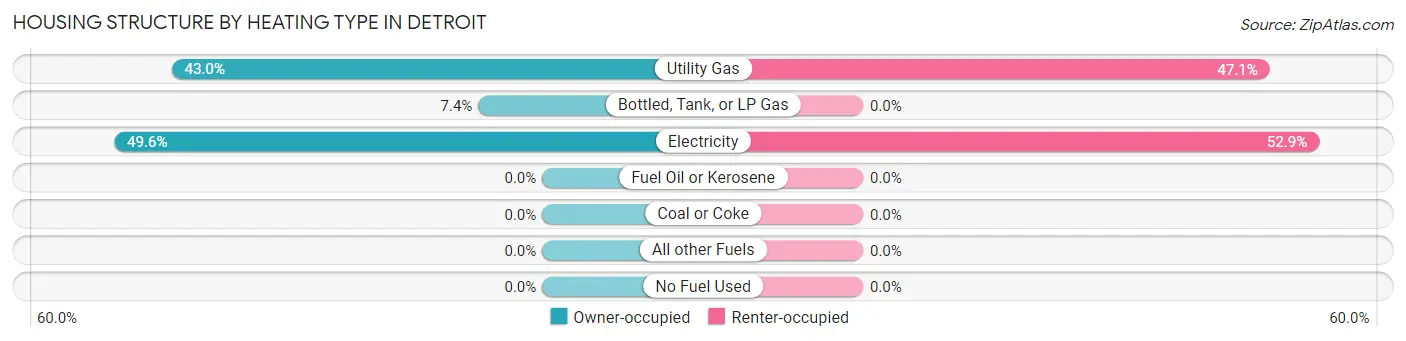
| Heating Type | Owner-occupied | Renter-occupied |
| Utility Gas | 58 (43.0%) | 33 (47.1%) |
| Bottled, Tank, or LP Gas | 10 (7.4%) | 0 (0.0%) |
| Electricity | 67 (49.6%) | 37 (52.9%) |
| Fuel Oil or Kerosene | 0 (0.0%) | 0 (0.0%) |
| Coal or Coke | 0 (0.0%) | 0 (0.0%) |
| All other Fuels | 0 (0.0%) | 0 (0.0%) |
| No Fuel Used | 0 (0.0%) | 0 (0.0%) |
| Total | 135 (100.0%) | 70 (100.0%) |
Household Vehicle Usage in Detroit
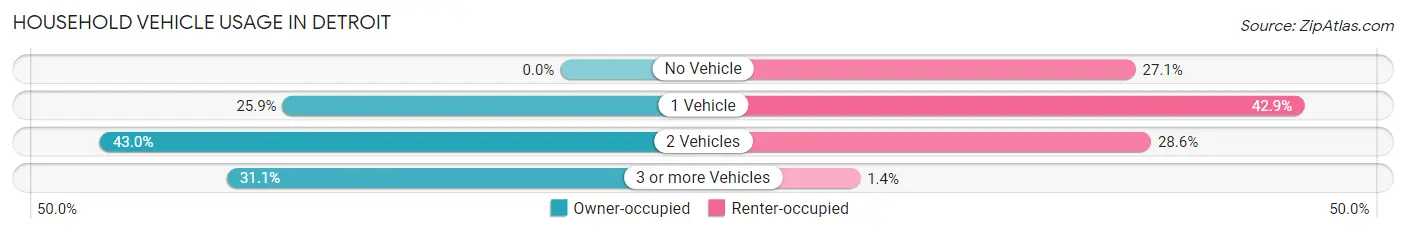
| Vehicles per Household | Owner-occupied | Renter-occupied |
| No Vehicle | 0 (0.0%) | 19 (27.1%) |
| 1 Vehicle | 35 (25.9%) | 30 (42.9%) |
| 2 Vehicles | 58 (43.0%) | 20 (28.6%) |
| 3 or more Vehicles | 42 (31.1%) | 1 (1.4%) |
| Total | 135 (100.0%) | 70 (100.0%) |
Real Estate & Mortgages in Detroit
Real Estate and Mortgage Overview in Detroit
| Characteristic | Without Mortgage | With Mortgage |
| Housing Units | 78 | 57 |
| Median Property Value | $53,800 | $132,800 |
| Median Household Income | $48,750 | $14 |
| Monthly Housing Costs | $463 | $0 |
| Real Estate Taxes | $756 | $0 |
Property Value by Mortgage Status in Detroit
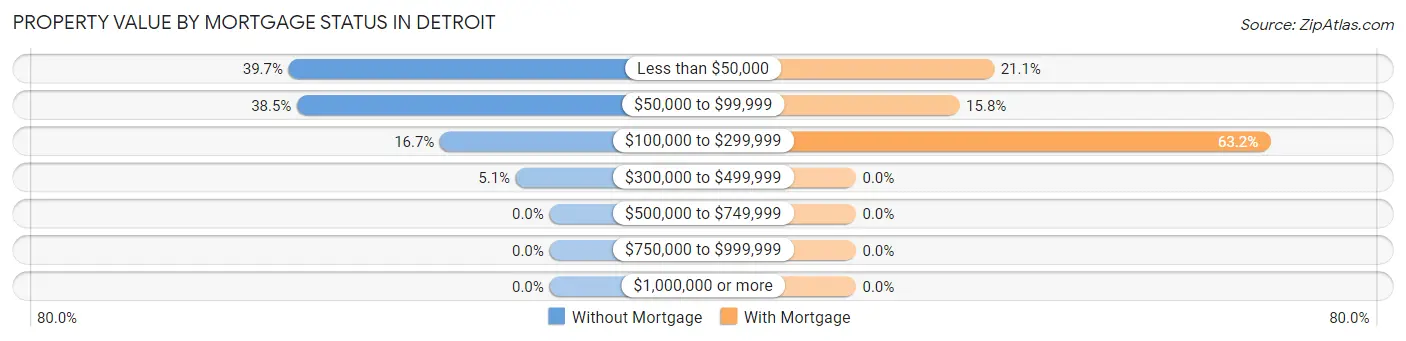
| Property Value | Without Mortgage | With Mortgage |
| Less than $50,000 | 31 (39.7%) | 12 (21.0%) |
| $50,000 to $99,999 | 30 (38.5%) | 9 (15.8%) |
| $100,000 to $299,999 | 13 (16.7%) | 36 (63.2%) |
| $300,000 to $499,999 | 4 (5.1%) | 0 (0.0%) |
| $500,000 to $749,999 | 0 (0.0%) | 0 (0.0%) |
| $750,000 to $999,999 | 0 (0.0%) | 0 (0.0%) |
| $1,000,000 or more | 0 (0.0%) | 0 (0.0%) |
| Total | 78 (100.0%) | 57 (100.0%) |
Household Income by Mortgage Status in Detroit
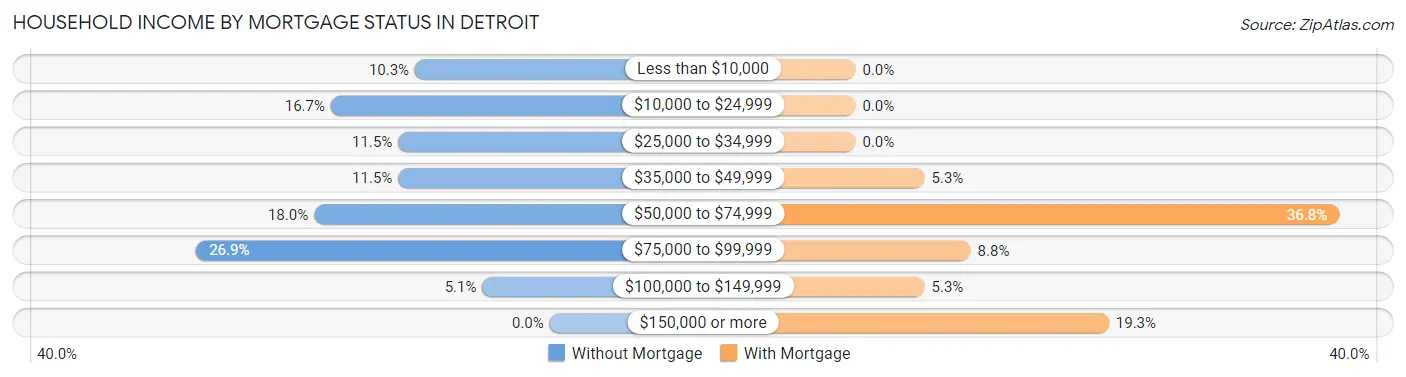
| Household Income | Without Mortgage | With Mortgage |
| Less than $10,000 | 8 (10.3%) | 0 (0.0%) |
| $10,000 to $24,999 | 13 (16.7%) | 0 (0.0%) |
| $25,000 to $34,999 | 9 (11.5%) | 0 (0.0%) |
| $35,000 to $49,999 | 9 (11.5%) | 3 (5.3%) |
| $50,000 to $74,999 | 14 (17.9%) | 21 (36.8%) |
| $75,000 to $99,999 | 21 (26.9%) | 5 (8.8%) |
| $100,000 to $149,999 | 4 (5.1%) | 3 (5.3%) |
| $150,000 or more | 0 (0.0%) | 11 (19.3%) |
| Total | 78 (100.0%) | 57 (100.0%) |
Property Value to Household Income Ratio in Detroit
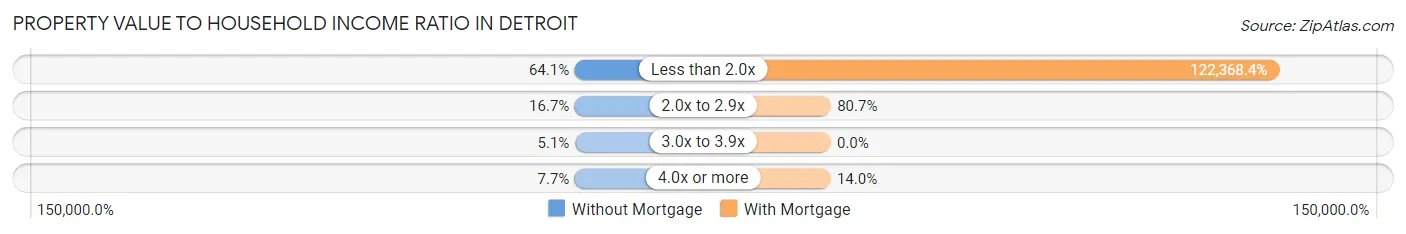
| Value-to-Income Ratio | Without Mortgage | With Mortgage |
| Less than 2.0x | 50 (64.1%) | 69,750 (122,368.4%) |
| 2.0x to 2.9x | 13 (16.7%) | 46 (80.7%) |
| 3.0x to 3.9x | 4 (5.1%) | 0 (0.0%) |
| 4.0x or more | 6 (7.7%) | 8 (14.0%) |
| Total | 78 (100.0%) | 57 (100.0%) |
Real Estate Taxes by Mortgage Status in Detroit
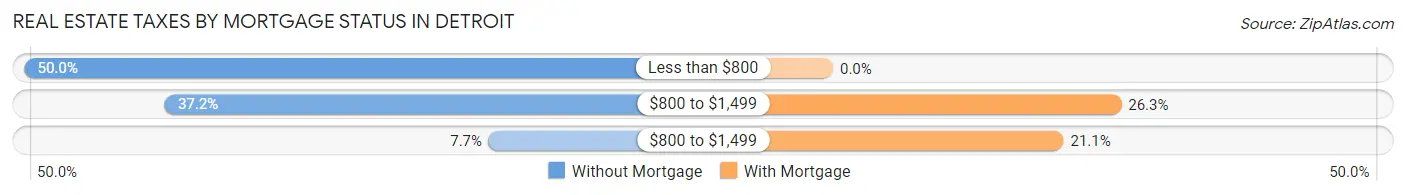
| Property Taxes | Without Mortgage | With Mortgage |
| Less than $800 | 39 (50.0%) | 0 (0.0%) |
| $800 to $1,499 | 29 (37.2%) | 15 (26.3%) |
| $800 to $1,499 | 6 (7.7%) | 12 (21.0%) |
| Total | 78 (100.0%) | 57 (100.0%) |
Health & Disability in Detroit
Health Insurance Coverage by Age in Detroit
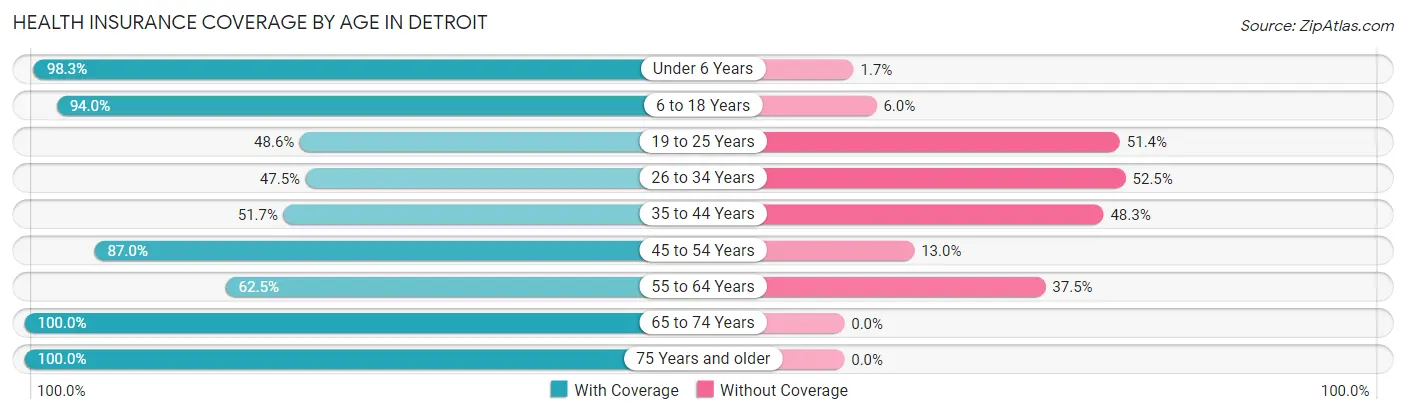
| Age Bracket | With Coverage | Without Coverage |
| Under 6 Years | 57 (98.3%) | 1 (1.7%) |
| 6 to 18 Years | 141 (94.0%) | 9 (6.0%) |
| 19 to 25 Years | 35 (48.6%) | 37 (51.4%) |
| 26 to 34 Years | 29 (47.5%) | 32 (52.5%) |
| 35 to 44 Years | 31 (51.7%) | 29 (48.3%) |
| 45 to 54 Years | 60 (87.0%) | 9 (13.0%) |
| 55 to 64 Years | 45 (62.5%) | 27 (37.5%) |
| 65 to 74 Years | 47 (100.0%) | 0 (0.0%) |
| 75 Years and older | 39 (100.0%) | 0 (0.0%) |
| Total | 484 (77.1%) | 144 (22.9%) |
Health Insurance Coverage by Citizenship Status in Detroit
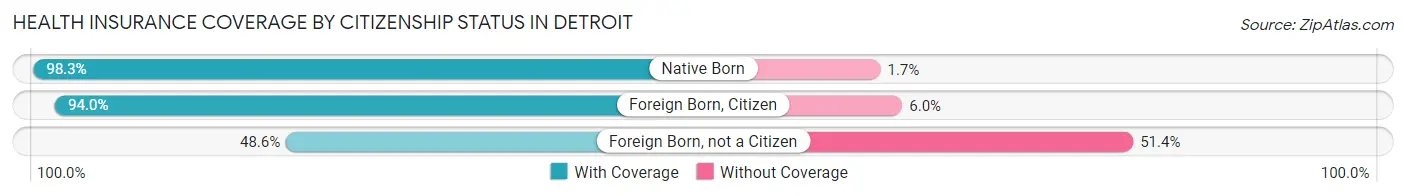
| Citizenship Status | With Coverage | Without Coverage |
| Native Born | 57 (98.3%) | 1 (1.7%) |
| Foreign Born, Citizen | 141 (94.0%) | 9 (6.0%) |
| Foreign Born, not a Citizen | 35 (48.6%) | 37 (51.4%) |
Health Insurance Coverage by Household Income in Detroit
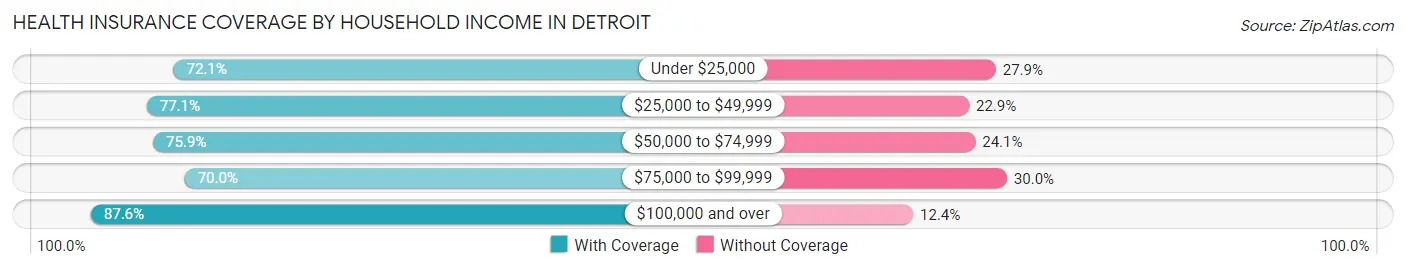
| Household Income | With Coverage | Without Coverage |
| Under $25,000 | 124 (72.1%) | 48 (27.9%) |
| $25,000 to $49,999 | 101 (77.1%) | 30 (22.9%) |
| $50,000 to $74,999 | 41 (75.9%) | 13 (24.1%) |
| $75,000 to $99,999 | 77 (70.0%) | 33 (30.0%) |
| $100,000 and over | 141 (87.6%) | 20 (12.4%) |
Public vs Private Health Insurance Coverage by Age in Detroit
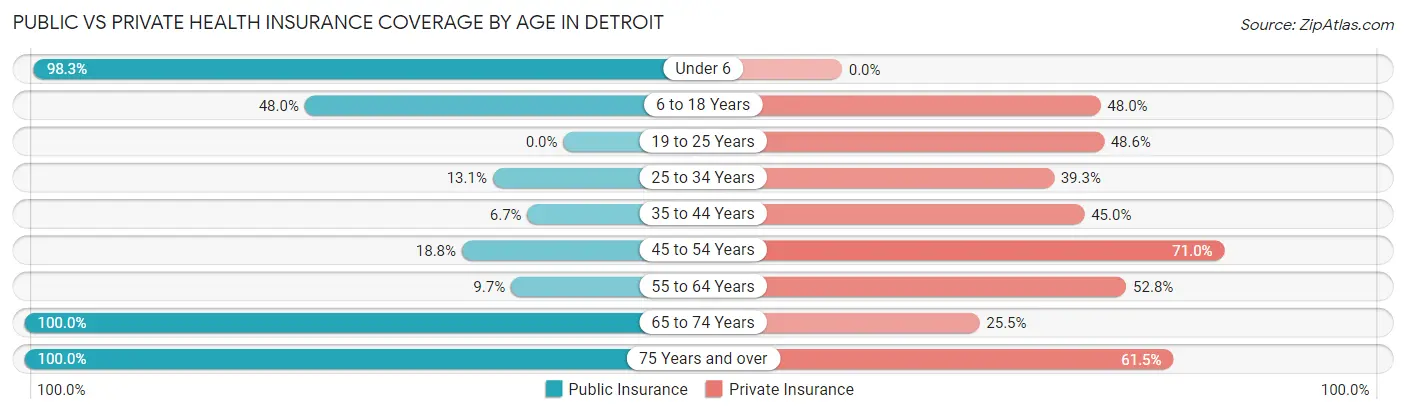
| Age Bracket | Public Insurance | Private Insurance |
| Under 6 | 57 (98.3%) | 0 (0.0%) |
| 6 to 18 Years | 72 (48.0%) | 72 (48.0%) |
| 19 to 25 Years | 0 (0.0%) | 35 (48.6%) |
| 25 to 34 Years | 8 (13.1%) | 24 (39.3%) |
| 35 to 44 Years | 4 (6.7%) | 27 (45.0%) |
| 45 to 54 Years | 13 (18.8%) | 49 (71.0%) |
| 55 to 64 Years | 7 (9.7%) | 38 (52.8%) |
| 65 to 74 Years | 47 (100.0%) | 12 (25.5%) |
| 75 Years and over | 39 (100.0%) | 24 (61.5%) |
| Total | 247 (39.3%) | 281 (44.8%) |
Disability Status by Sex by Age in Detroit
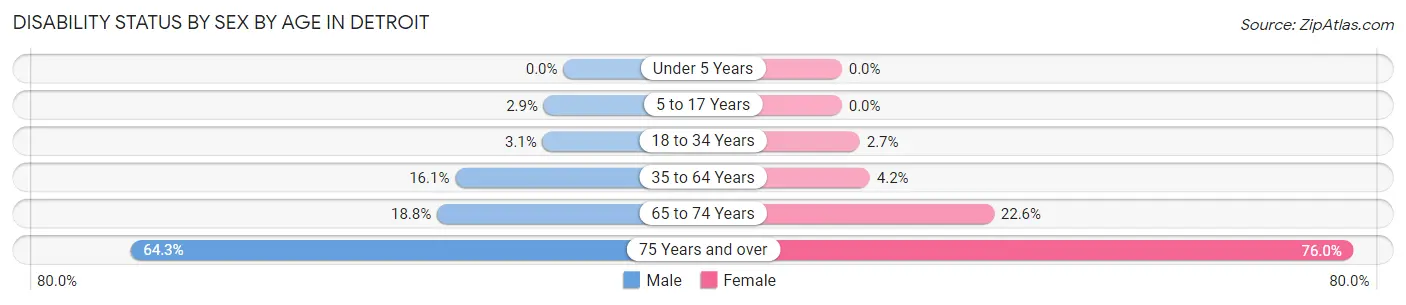
| Age Bracket | Male | Female |
| Under 5 Years | 0 (0.0%) | 0 (0.0%) |
| 5 to 17 Years | 2 (2.9%) | 0 (0.0%) |
| 18 to 34 Years | 2 (3.1%) | 2 (2.7%) |
| 35 to 64 Years | 13 (16.1%) | 5 (4.2%) |
| 65 to 74 Years | 3 (18.8%) | 7 (22.6%) |
| 75 Years and over | 9 (64.3%) | 19 (76.0%) |
Disability Class by Sex by Age in Detroit
Disability Class: Hearing Difficulty
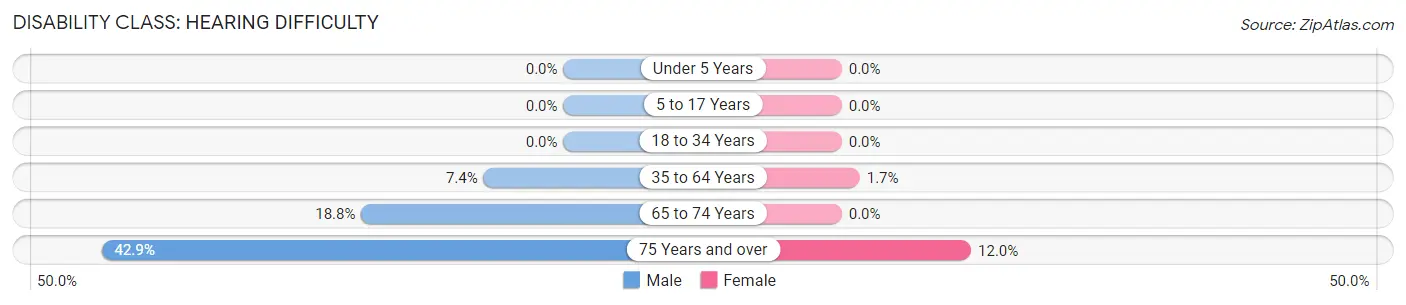
| Age Bracket | Male | Female |
| Under 5 Years | 0 (0.0%) | 0 (0.0%) |
| 5 to 17 Years | 0 (0.0%) | 0 (0.0%) |
| 18 to 34 Years | 0 (0.0%) | 0 (0.0%) |
| 35 to 64 Years | 6 (7.4%) | 2 (1.7%) |
| 65 to 74 Years | 3 (18.8%) | 0 (0.0%) |
| 75 Years and over | 6 (42.9%) | 3 (12.0%) |
Disability Class: Vision Difficulty
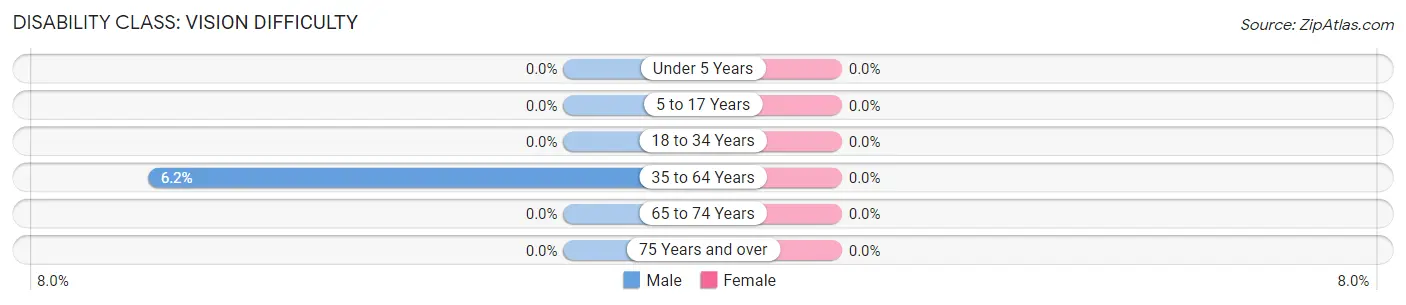
| Age Bracket | Male | Female |
| Under 5 Years | 0 (0.0%) | 0 (0.0%) |
| 5 to 17 Years | 0 (0.0%) | 0 (0.0%) |
| 18 to 34 Years | 0 (0.0%) | 0 (0.0%) |
| 35 to 64 Years | 5 (6.2%) | 0 (0.0%) |
| 65 to 74 Years | 0 (0.0%) | 0 (0.0%) |
| 75 Years and over | 0 (0.0%) | 0 (0.0%) |
Disability Class: Cognitive Difficulty
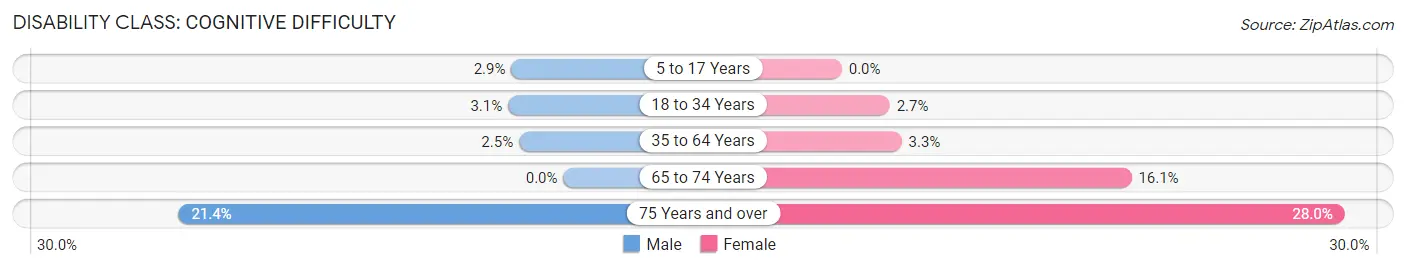
| Age Bracket | Male | Female |
| 5 to 17 Years | 2 (2.9%) | 0 (0.0%) |
| 18 to 34 Years | 2 (3.1%) | 2 (2.7%) |
| 35 to 64 Years | 2 (2.5%) | 4 (3.3%) |
| 65 to 74 Years | 0 (0.0%) | 5 (16.1%) |
| 75 Years and over | 3 (21.4%) | 7 (28.0%) |
Disability Class: Ambulatory Difficulty
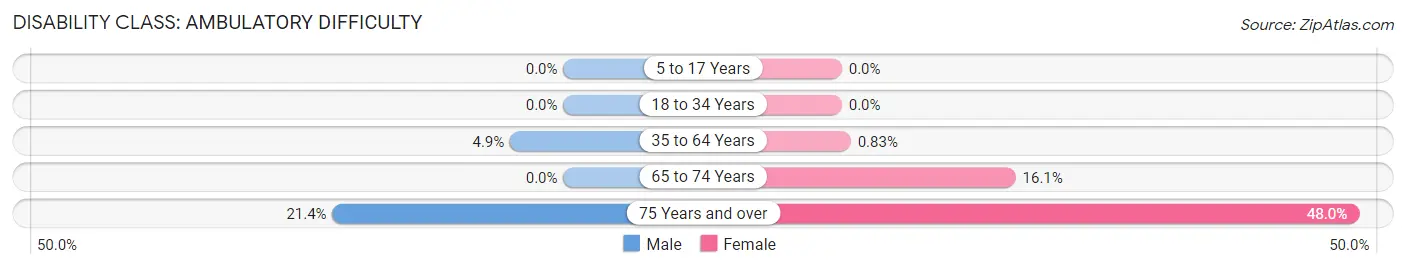
| Age Bracket | Male | Female |
| 5 to 17 Years | 0 (0.0%) | 0 (0.0%) |
| 18 to 34 Years | 0 (0.0%) | 0 (0.0%) |
| 35 to 64 Years | 4 (4.9%) | 1 (0.8%) |
| 65 to 74 Years | 0 (0.0%) | 5 (16.1%) |
| 75 Years and over | 3 (21.4%) | 12 (48.0%) |
Disability Class: Self-Care Difficulty
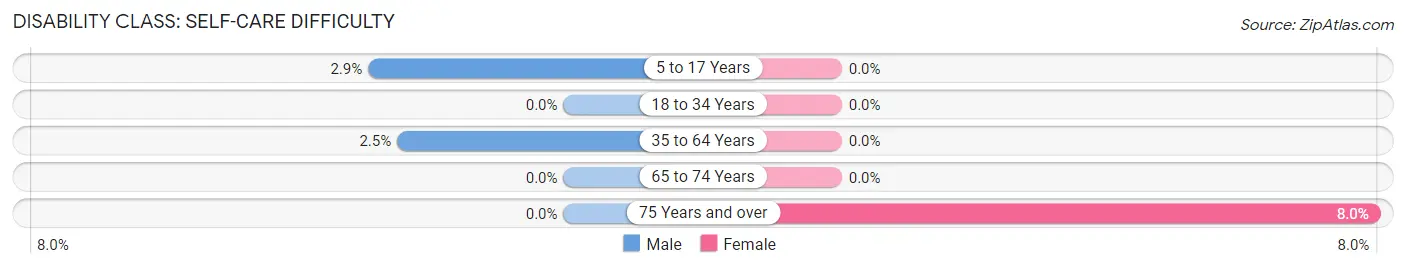
| Age Bracket | Male | Female |
| 5 to 17 Years | 2 (2.9%) | 0 (0.0%) |
| 18 to 34 Years | 0 (0.0%) | 0 (0.0%) |
| 35 to 64 Years | 2 (2.5%) | 0 (0.0%) |
| 65 to 74 Years | 0 (0.0%) | 0 (0.0%) |
| 75 Years and over | 0 (0.0%) | 2 (8.0%) |
Technology Access in Detroit
Computing Device Access in Detroit
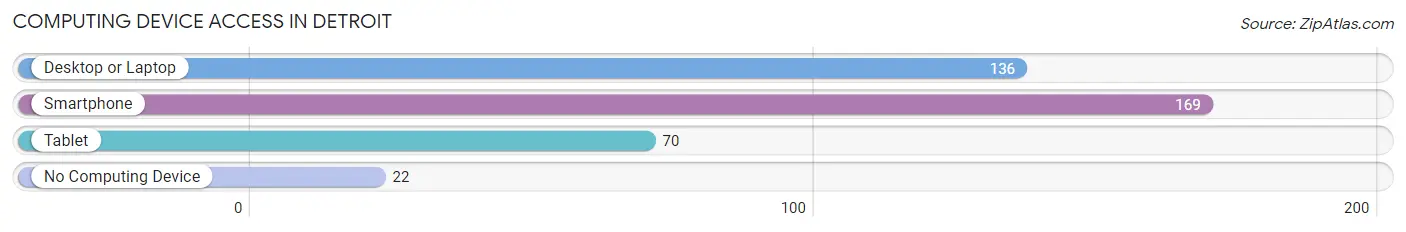
| Device Type | # Households | % Households |
| Desktop or Laptop | 136 | 66.3% |
| Smartphone | 169 | 82.4% |
| Tablet | 70 | 34.2% |
| No Computing Device | 22 | 10.7% |
| Total | 205 | 100.0% |
Internet Access in Detroit
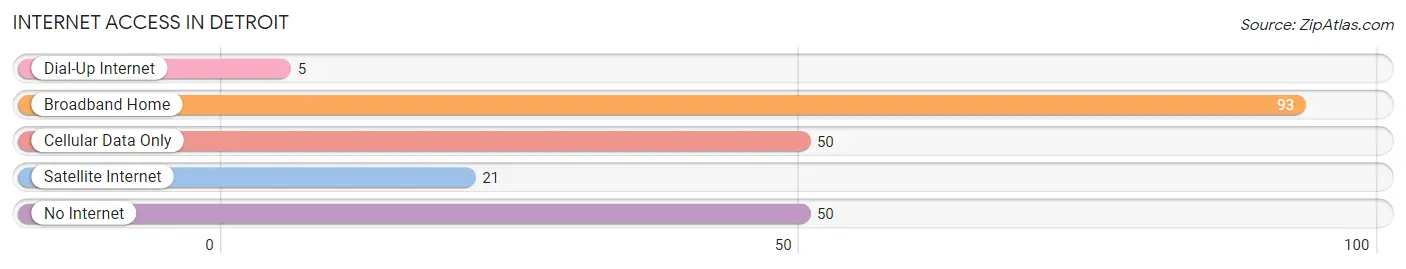
| Internet Type | # Households | % Households |
| Dial-Up Internet | 5 | 2.4% |
| Broadband Home | 93 | 45.4% |
| Cellular Data Only | 50 | 24.4% |
| Satellite Internet | 21 | 10.2% |
| No Internet | 50 | 24.4% |
| Total | 205 | 100.0% |
Detroit Summary
Detroit, Michigan is a major city located in the Midwestern United States. It is the largest city in the state of Michigan and the second-largest city in the Midwest, behind Chicago. Detroit is the county seat of Wayne County and is located on the Detroit River, which connects it to Canada. Detroit is known for its automotive industry, its music, and its sports teams.
Geography
Detroit is located in southeastern Michigan, on the Detroit River, which connects it to Canada. The city is situated on the Detroit Plateau, a flat area of land that is surrounded by the Great Lakes. Detroit is bordered by the cities of Dearborn, Hamtramck, and Highland Park to the west, and by the cities of Grosse Pointe, Grosse Pointe Park, and Grosse Pointe Farms to the east. The city is also bordered by the cities of Warren and Sterling Heights to the north, and by the cities of Dearborn Heights and Taylor to the south.
The city of Detroit covers an area of 138.8 square miles, and has a population of approximately 677,000 people. The city is divided into seven major districts: Downtown, Midtown, Eastside, Westside, Southwest, Northwest, and North End.
History
The area that is now Detroit was first settled by the French in 1701, and was later ceded to the British in 1760. The city was incorporated in 1802, and was named after the Detroit River. Detroit quickly became an important center of trade and industry, and was the site of the first automobile assembly line in the United States.
In the early 20th century, Detroit was a major center of the automotive industry, and was home to the “Big Three” automakers: Ford, General Motors, and Chrysler. The city was also a major center of the music industry, and was home to Motown Records.
In the late 20th century, Detroit experienced a period of economic decline, as the automotive industry moved out of the city and the population decreased. In 2013, Detroit declared bankruptcy, and the city is currently in the process of rebuilding its economy.
Economy
Detroit’s economy is largely based on the automotive industry, which is the city’s largest employer. The city is home to the “Big Three” automakers: Ford, General Motors, and Chrysler. The city is also home to a number of automotive suppliers, such as Delphi and Visteon.
In addition to the automotive industry, Detroit is also home to a number of other industries, such as healthcare, finance, and technology. The city is also home to a number of universities and colleges, including the University of Michigan, Wayne State University, and the College for Creative Studies.
Demographics
As of the 2010 census, the population of Detroit was 713,777. The city is racially diverse, with a population that is approximately 82% African American, 11% White, 4% Hispanic, and 3% Asian. The median household income in Detroit is $27,838, and the median home value is $42,000.
Conclusion
Detroit is a major city located in the Midwestern United States. It is the largest city in the state of Michigan and the second-largest city in the Midwest, behind Chicago. Detroit is known for its automotive industry, its music, and its sports teams. The city has a diverse population and a strong economy, and is currently in the process of rebuilding its economy.
Common Questions
What is Per Capita Income in Detroit?
Per Capita income in Detroit is $18,973.
What is the Median Family Income in Detroit?
Median Family Income in Detroit is $47,125.
What is the Median Household income in Detroit?
Median Household Income in Detroit is $40,781.
What is Income or Wage Gap in Detroit?
Income or Wage Gap in Detroit is 12.7%.
Women in Detroit earn 87.3 cents for every dollar earned by a man.
What is Inequality or Gini Index in Detroit?
Inequality or Gini Index in Detroit is 0.50.
What is the Total Population of Detroit?
Total Population of Detroit is 628.
What is the Total Male Population of Detroit?
Total Male Population of Detroit is 263.
What is the Total Female Population of Detroit?
Total Female Population of Detroit is 365.
What is the Ratio of Males per 100 Females in Detroit?
There are 72.05 Males per 100 Females in Detroit.
What is the Ratio of Females per 100 Males in Detroit?
There are 138.78 Females per 100 Males in Detroit.
What is the Median Population Age in Detroit?
Median Population Age in Detroit is 30.1 Years.
What is the Average Family Size in Detroit
Average Family Size in Detroit is 3.7 People.
What is the Average Household Size in Detroit
Average Household Size in Detroit is 3.1 People.
How Large is the Labor Force in Detroit?
There are 228 People in the Labor Forcein in Detroit.
What is the Percentage of People in the Labor Force in Detroit?
46.0% of People are in the Labor Force in Detroit.
What is the Unemployment Rate in Detroit?
Unemployment Rate in Detroit is 6.1%.