Deport, TX Map & Demographics
Deport Map
Deport Overview
$25,441
PER CAPITA INCOME
$39,345
AVG FAMILY INCOME
$38,333
AVG HOUSEHOLD INCOME
11.7%
WAGE / INCOME GAP [ % ]
88.3¢/ $1
WAGE / INCOME GAP [ $ ]
0.42
INEQUALITY / GINI INDEX
773
TOTAL POPULATION
306
MALE POPULATION
467
FEMALE POPULATION
65.52
MALES / 100 FEMALES
152.61
FEMALES / 100 MALES
52.3
MEDIAN AGE
2.7
AVG FAMILY SIZE
2.2
AVG HOUSEHOLD SIZE
335
LABOR FORCE [ PEOPLE ]
54.3%
PERCENT IN LABOR FORCE
0.9%
UNEMPLOYMENT RATE
Deport Zip Codes
Deport Area Codes
Income in Deport
Income Overview in Deport
Per Capita Income in Deport is $25,441, while median incomes of families and households are $39,345 and $38,333 respectively.
| Characteristic | Number | Measure |
| Per Capita Income | 773 | $25,441 |
| Median Family Income | 183 | $39,345 |
| Mean Family Income | 183 | $58,203 |
| Median Household Income | 350 | $38,333 |
| Mean Household Income | 350 | $51,816 |
| Income Deficit | 183 | $0 |
| Wage / Income Gap (%) | 773 | 11.75% |
| Wage / Income Gap ($) | 773 | 88.25¢ per $1 |
| Gini / Inequality Index | 773 | 0.42 |
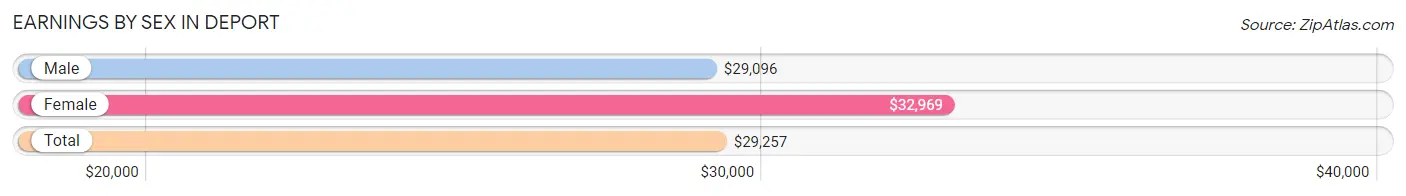
Earnings by Sex in Deport
Average Earnings in Deport are $29,257, $29,096 for men and $32,969 for women, a difference of 11.7%.
| Sex | Number | Average Earnings |
| Male | 163 (47.4%) | $29,096 |
| Female | 181 (52.6%) | $32,969 |
| Total | 344 (100.0%) | $29,257 |
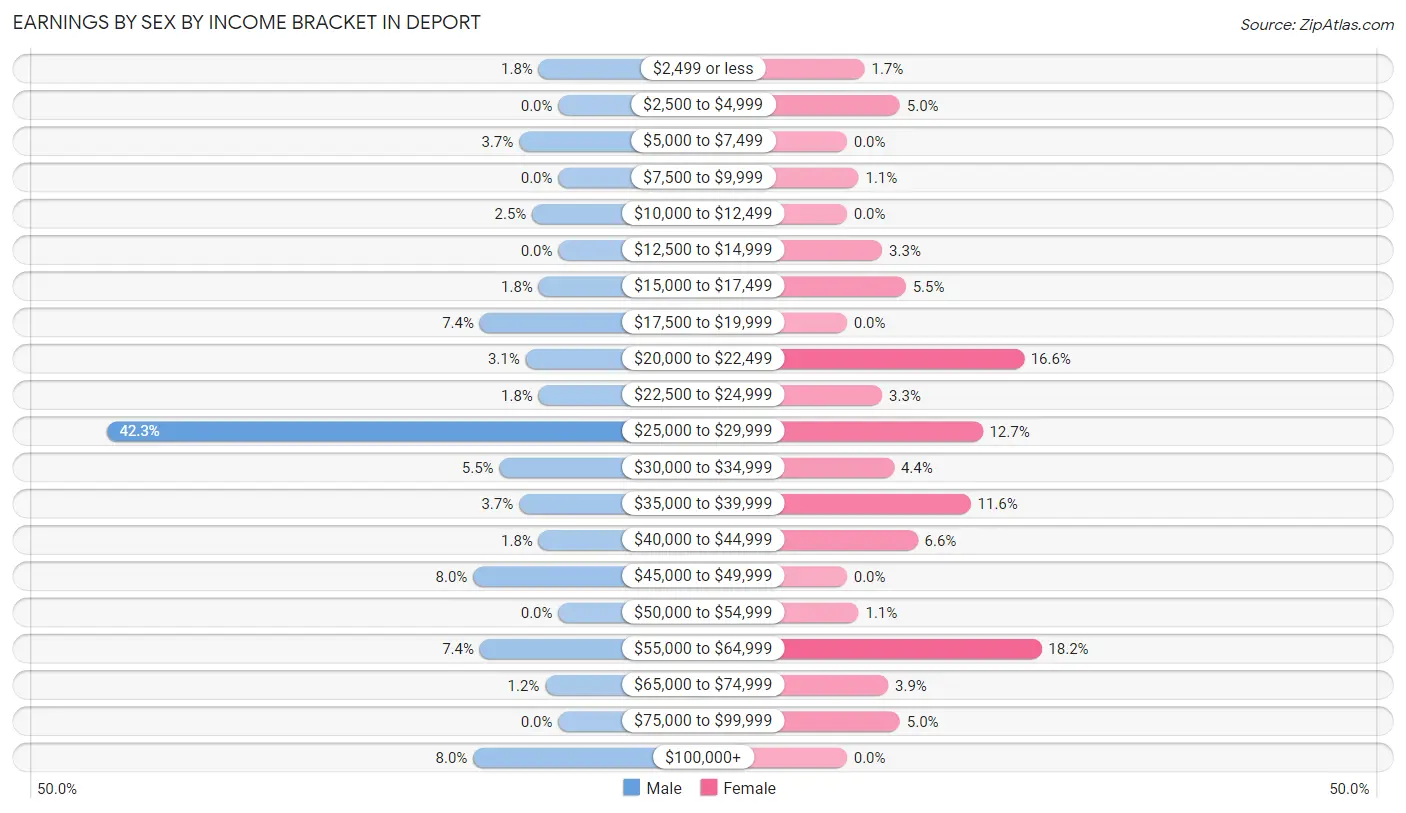
Earnings by Sex by Income Bracket in Deport
The most common earnings brackets in Deport are $25,000 to $29,999 for men (69 | 42.3%) and $55,000 to $64,999 for women (33 | 18.2%).
| Income | Male | Female |
| $2,499 or less | 3 (1.8%) | 3 (1.7%) |
| $2,500 to $4,999 | 0 (0.0%) | 9 (5.0%) |
| $5,000 to $7,499 | 6 (3.7%) | 0 (0.0%) |
| $7,500 to $9,999 | 0 (0.0%) | 2 (1.1%) |
| $10,000 to $12,499 | 4 (2.5%) | 0 (0.0%) |
| $12,500 to $14,999 | 0 (0.0%) | 6 (3.3%) |
| $15,000 to $17,499 | 3 (1.8%) | 10 (5.5%) |
| $17,500 to $19,999 | 12 (7.4%) | 0 (0.0%) |
| $20,000 to $22,499 | 5 (3.1%) | 30 (16.6%) |
| $22,500 to $24,999 | 3 (1.8%) | 6 (3.3%) |
| $25,000 to $29,999 | 69 (42.3%) | 23 (12.7%) |
| $30,000 to $34,999 | 9 (5.5%) | 8 (4.4%) |
| $35,000 to $39,999 | 6 (3.7%) | 21 (11.6%) |
| $40,000 to $44,999 | 3 (1.8%) | 12 (6.6%) |
| $45,000 to $49,999 | 13 (8.0%) | 0 (0.0%) |
| $50,000 to $54,999 | 0 (0.0%) | 2 (1.1%) |
| $55,000 to $64,999 | 12 (7.4%) | 33 (18.2%) |
| $65,000 to $74,999 | 2 (1.2%) | 7 (3.9%) |
| $75,000 to $99,999 | 0 (0.0%) | 9 (5.0%) |
| $100,000+ | 13 (8.0%) | 0 (0.0%) |
| Total | 163 (100.0%) | 181 (100.0%) |
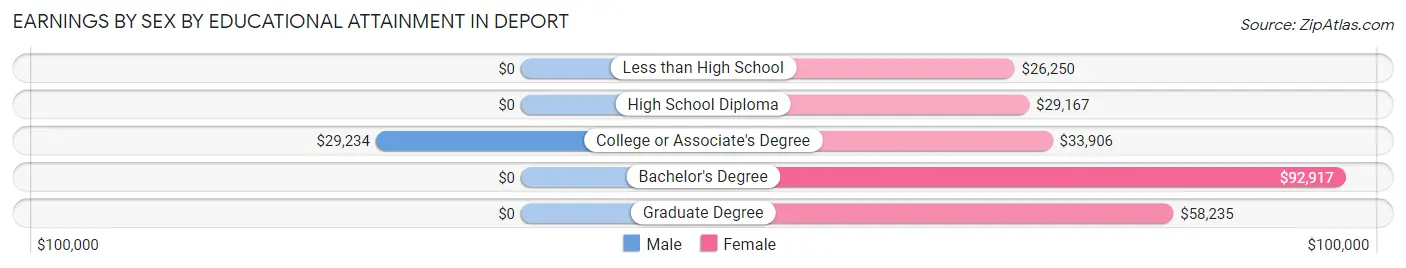
Earnings by Sex by Educational Attainment in Deport
Average earnings in Deport are $29,077 for men and $38,487 for women, a difference of 24.4%. Men with an educational attainment of college or associate's degree enjoy the highest average annual earnings of $29,234, while those with college or associate's degree education earn the least with $29,234. Women with an educational attainment of bachelor's degree earn the most with the average annual earnings of $92,917, while those with less than high school education have the smallest earnings of $26,250.
| Educational Attainment | Male Income | Female Income |
| Less than High School | - | - |
| High School Diploma | - | - |
| College or Associate's Degree | $29,234 | $33,906 |
| Bachelor's Degree | - | - |
| Graduate Degree | - | - |
| Total | $29,077 | $38,487 |
Family Income in Deport
Family Income Brackets in Deport
According to the Deport family income data, there are 33 families falling into the $35,000 to $49,999 income range, which is the most common income bracket and makes up 18.0% of all families.
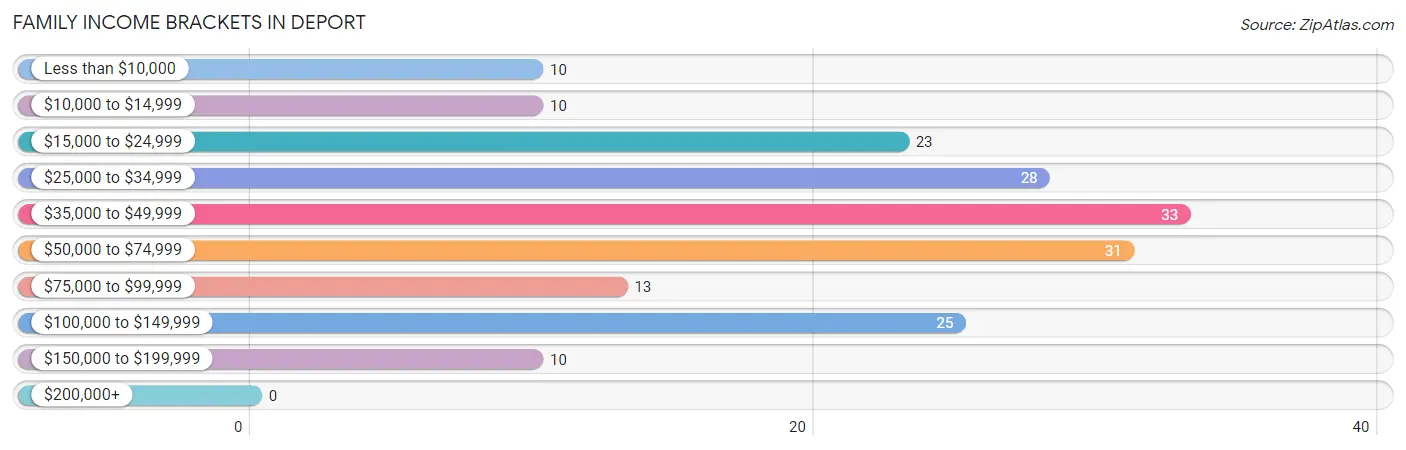
| Income Bracket | # Families | % Families |
| Less than $10,000 | 10 | 5.5% |
| $10,000 to $14,999 | 10 | 5.5% |
| $15,000 to $24,999 | 23 | 12.6% |
| $25,000 to $34,999 | 28 | 15.3% |
| $35,000 to $49,999 | 33 | 18.0% |
| $50,000 to $74,999 | 31 | 16.9% |
| $75,000 to $99,999 | 13 | 7.1% |
| $100,000 to $149,999 | 25 | 13.7% |
| $150,000 to $199,999 | 10 | 5.5% |
| $200,000+ | 0 | 0.0% |
Family Income by Famaliy Size in Deport
4-person families (19 | 10.4%) account for the highest median family income in Deport with $124,464 per family, while 4-person families (19 | 10.4%) have the highest median income of $31,116 per family member.
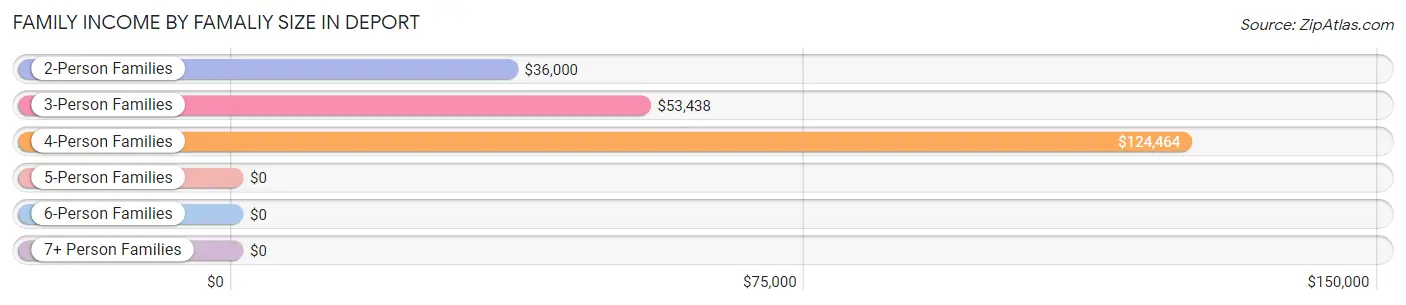
| Income Bracket | # Families | Median Income |
| 2-Person Families | 108 (59.0%) | $36,000 |
| 3-Person Families | 43 (23.5%) | $53,438 |
| 4-Person Families | 19 (10.4%) | $124,464 |
| 5-Person Families | 11 (6.0%) | $0 |
| 6-Person Families | 0 (0.0%) | $0 |
| 7+ Person Families | 2 (1.1%) | $0 |
| Total | 183 (100.0%) | $39,345 |
Family Income by Number of Earners in Deport
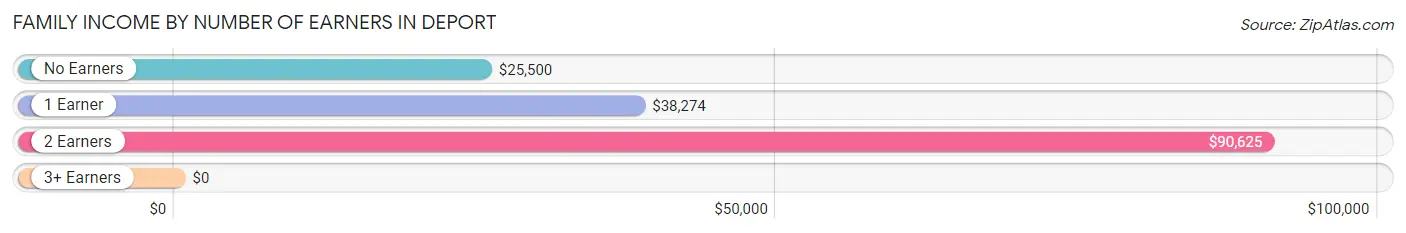
| Number of Earners | # Families | Median Income |
| No Earners | 48 (26.2%) | $25,500 |
| 1 Earner | 61 (33.3%) | $38,274 |
| 2 Earners | 72 (39.3%) | $90,625 |
| 3+ Earners | 2 (1.1%) | $0 |
| Total | 183 (100.0%) | $39,345 |
Household Income in Deport
Household Income Brackets in Deport
With 72 households falling in the category, the $75,000 to $99,999 income range is the most frequent in Deport, accounting for 20.6% of all households.
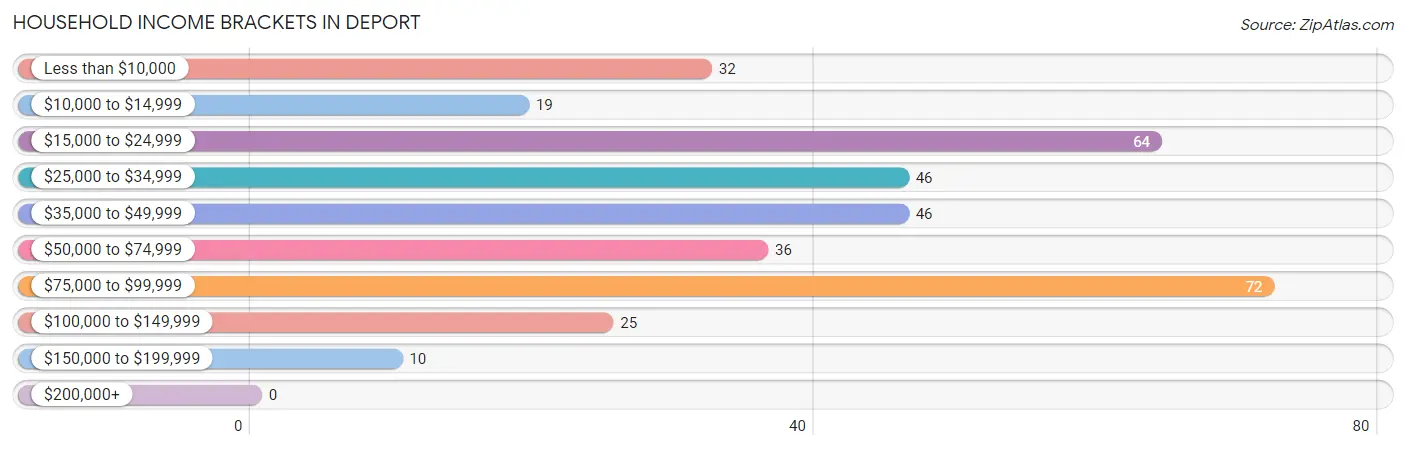
| Income Bracket | # Households | % Households |
| Less than $10,000 | 32 | 9.1% |
| $10,000 to $14,999 | 19 | 5.4% |
| $15,000 to $24,999 | 64 | 18.3% |
| $25,000 to $34,999 | 46 | 13.1% |
| $35,000 to $49,999 | 46 | 13.1% |
| $50,000 to $74,999 | 36 | 10.3% |
| $75,000 to $99,999 | 72 | 20.6% |
| $100,000 to $149,999 | 25 | 7.1% |
| $150,000 to $199,999 | 10 | 2.9% |
| $200,000+ | 0 | 0.0% |
Household Income by Householder Age in Deport
The median household income in Deport is $38,333, with the highest median household income of $58,250 found in the 25 to 44 years age bracket for the primary householder. A total of 53 households (15.1%) fall into this category. Meanwhile, the 15 to 24 years age bracket for the primary householder has the lowest median household income of $0, with 22 households (6.3%) in this group.
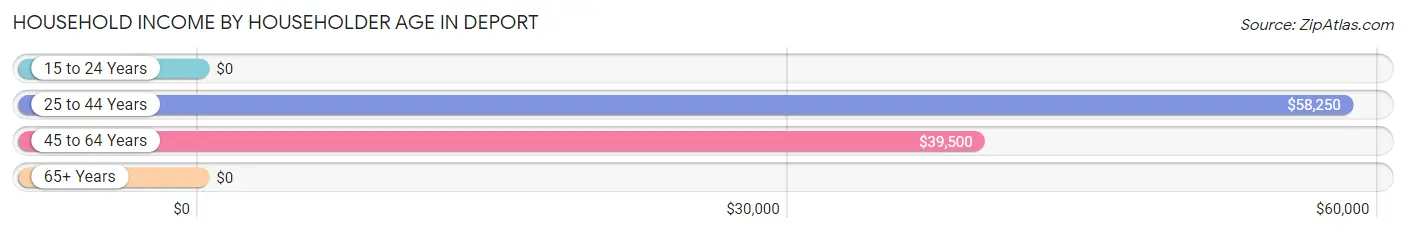
| Income Bracket | # Households | Median Income |
| 15 to 24 Years | 22 (6.3%) | $0 |
| 25 to 44 Years | 53 (15.1%) | $58,250 |
| 45 to 64 Years | 110 (31.4%) | $39,500 |
| 65+ Years | 165 (47.1%) | $0 |
| Total | 350 (100.0%) | $38,333 |
Poverty in Deport
Income Below Poverty by Sex and Age in Deport
With 17.8% poverty level for males and 17.9% for females among the residents of Deport, 6 to 11 year old males and 15 year old females are the most vulnerable to poverty, with 11 males (100.0%) and 8 females (47.1%) in their respective age groups living below the poverty level.
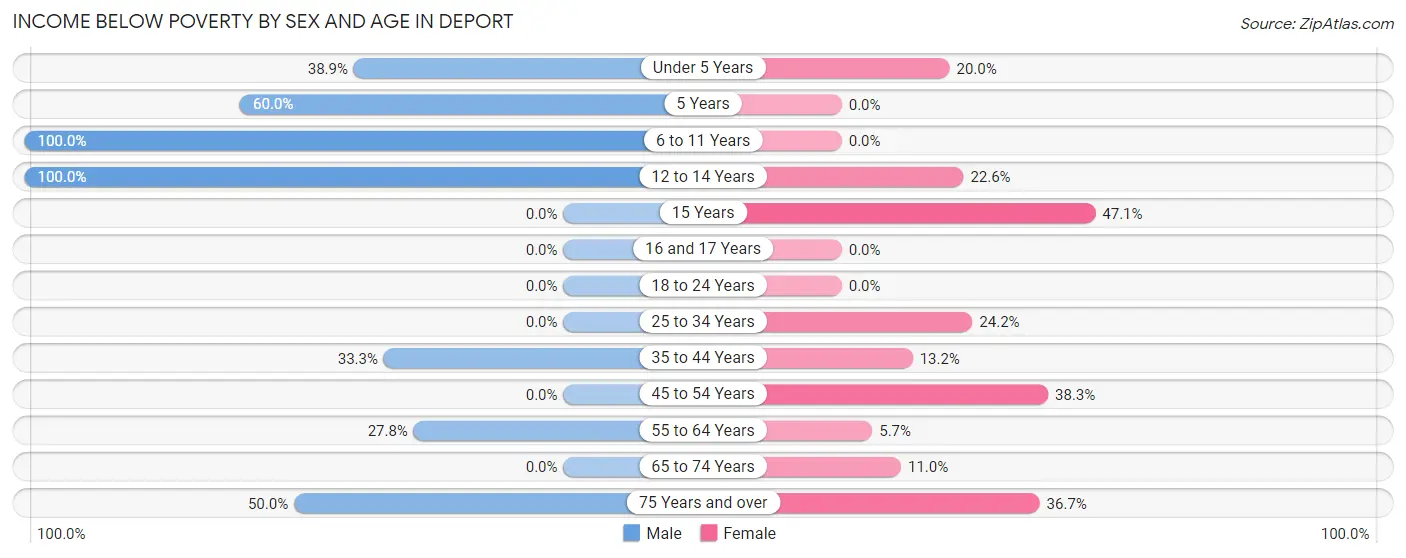
| Age Bracket | Male | Female |
| Under 5 Years | 7 (38.9%) | 3 (20.0%) |
| 5 Years | 3 (60.0%) | 0 (0.0%) |
| 6 to 11 Years | 11 (100.0%) | 0 (0.0%) |
| 12 to 14 Years | 3 (100.0%) | 7 (22.6%) |
| 15 Years | 0 (0.0%) | 8 (47.1%) |
| 16 and 17 Years | 0 (0.0%) | 0 (0.0%) |
| 18 to 24 Years | 0 (0.0%) | 0 (0.0%) |
| 25 to 34 Years | 0 (0.0%) | 8 (24.2%) |
| 35 to 44 Years | 9 (33.3%) | 5 (13.2%) |
| 45 to 54 Years | 0 (0.0%) | 18 (38.3%) |
| 55 to 64 Years | 15 (27.8%) | 3 (5.7%) |
| 65 to 74 Years | 0 (0.0%) | 11 (11.0%) |
| 75 Years and over | 6 (50.0%) | 18 (36.7%) |
| Total | 54 (17.8%) | 81 (17.9%) |
Income Above Poverty by Sex and Age in Deport
According to the poverty statistics in Deport, males aged 15 years and females aged 5 years are the age groups that are most secure financially, with 100.0% of males and 100.0% of females in these age groups living above the poverty line.
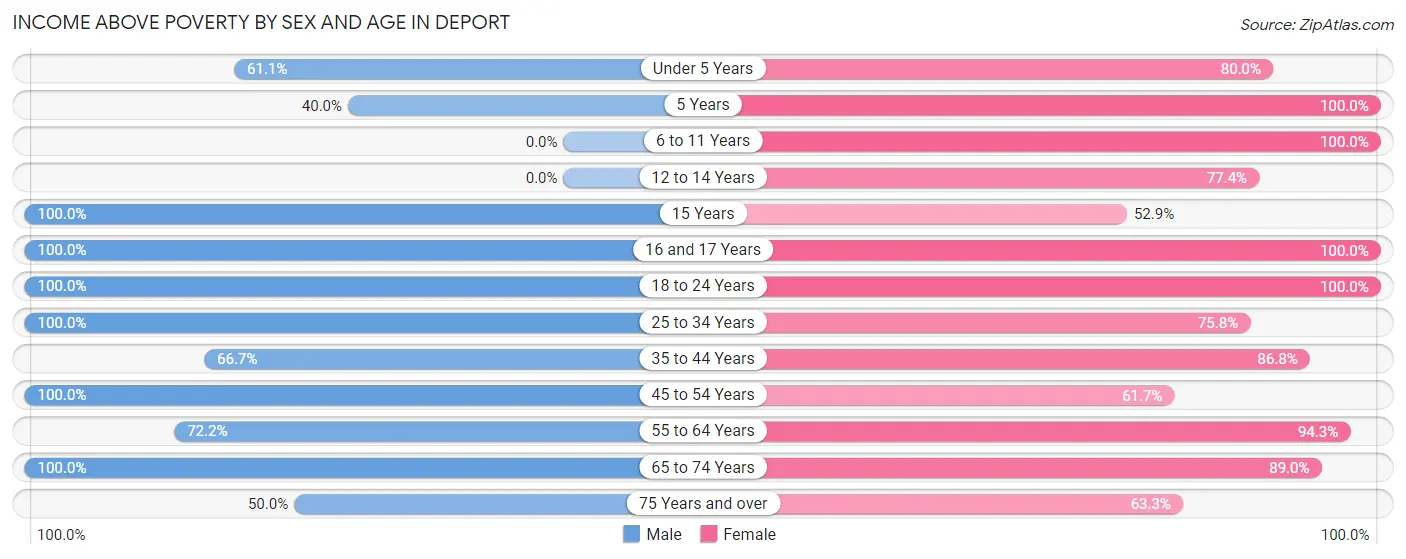
| Age Bracket | Male | Female |
| Under 5 Years | 11 (61.1%) | 12 (80.0%) |
| 5 Years | 2 (40.0%) | 12 (100.0%) |
| 6 to 11 Years | 0 (0.0%) | 22 (100.0%) |
| 12 to 14 Years | 0 (0.0%) | 24 (77.4%) |
| 15 Years | 5 (100.0%) | 9 (52.9%) |
| 16 and 17 Years | 1 (100.0%) | 3 (100.0%) |
| 18 to 24 Years | 20 (100.0%) | 33 (100.0%) |
| 25 to 34 Years | 19 (100.0%) | 25 (75.8%) |
| 35 to 44 Years | 18 (66.7%) | 33 (86.8%) |
| 45 to 54 Years | 35 (100.0%) | 29 (61.7%) |
| 55 to 64 Years | 39 (72.2%) | 50 (94.3%) |
| 65 to 74 Years | 93 (100.0%) | 89 (89.0%) |
| 75 Years and over | 6 (50.0%) | 31 (63.3%) |
| Total | 249 (82.2%) | 372 (82.1%) |
Income Below Poverty Among Married-Couple Families in Deport
The poverty statistics for married-couple families in Deport show that 10.2% or 13 of the total 127 families live below the poverty line. Families with 5 or more children have the highest poverty rate of 100.0%, comprising of 2 families. On the other hand, families with 1 or 2 children have the lowest poverty rate of 0.0%, which includes 0 families.
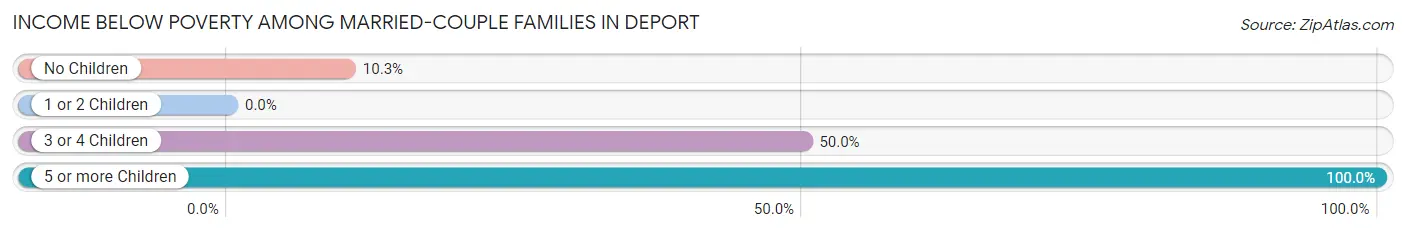
| Children | Above Poverty | Below Poverty |
| No Children | 70 (89.7%) | 8 (10.3%) |
| 1 or 2 Children | 41 (100.0%) | 0 (0.0%) |
| 3 or 4 Children | 3 (50.0%) | 3 (50.0%) |
| 5 or more Children | 0 (0.0%) | 2 (100.0%) |
| Total | 114 (89.8%) | 13 (10.2%) |
Income Below Poverty Among Single-Parent Households in Deport
According to the poverty data in Deport, 100.0% or 2 single-father households and 16.7% or 9 single-mother households are living below the poverty line. Among single-father households, those with 1 or 2 children have the highest poverty rate, with 2 households (100.0%) experiencing poverty. Likewise, among single-mother households, those with 1 or 2 children have the highest poverty rate, with 9 households (22.5%) falling below the poverty line.
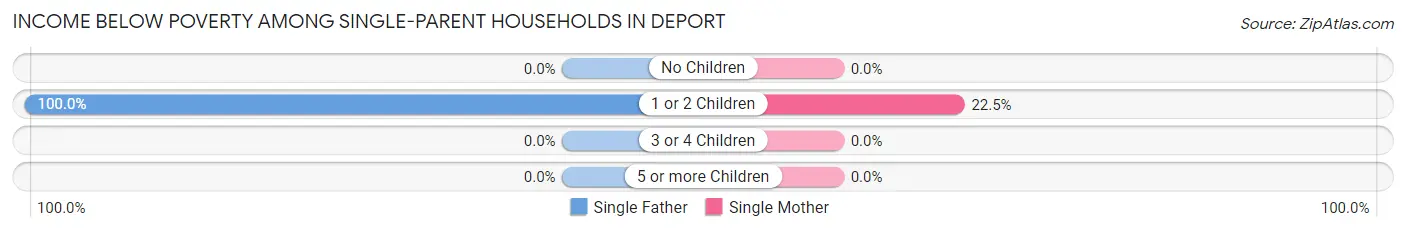
| Children | Single Father | Single Mother |
| No Children | 0 (0.0%) | 0 (0.0%) |
| 1 or 2 Children | 2 (100.0%) | 9 (22.5%) |
| 3 or 4 Children | 0 (0.0%) | 0 (0.0%) |
| 5 or more Children | 0 (0.0%) | 0 (0.0%) |
| Total | 2 (100.0%) | 9 (16.7%) |
Income Below Poverty Among Married-Couple vs Single-Parent Households in Deport
The poverty data for Deport shows that 13 of the married-couple family households (10.2%) and 11 of the single-parent households (19.6%) are living below the poverty level. Within the married-couple family households, those with 5 or more children have the highest poverty rate, with 2 households (100.0%) falling below the poverty line. Among the single-parent households, those with 1 or 2 children have the highest poverty rate, with 11 household (26.2%) living below poverty.
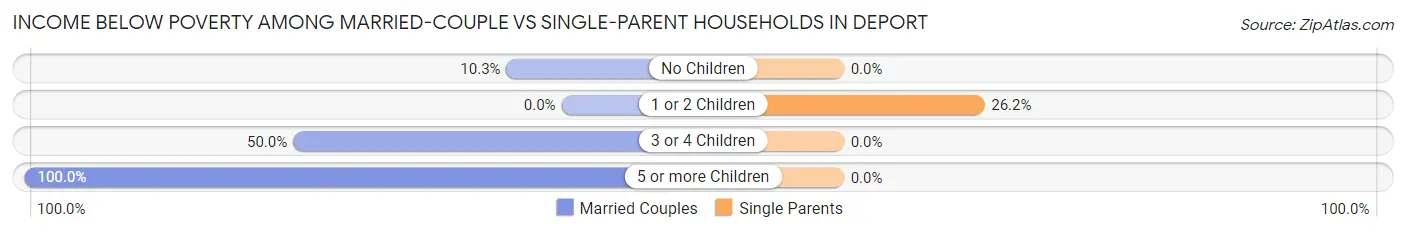
| Children | Married-Couple Families | Single-Parent Households |
| No Children | 8 (10.3%) | 0 (0.0%) |
| 1 or 2 Children | 0 (0.0%) | 11 (26.2%) |
| 3 or 4 Children | 3 (50.0%) | 0 (0.0%) |
| 5 or more Children | 2 (100.0%) | 0 (0.0%) |
| Total | 13 (10.2%) | 11 (19.6%) |
Race in Deport
The most populous races in Deport are White / Caucasian (710 | 91.8%), Black / African American (35 | 4.5%), and Hispanic or Latino (35 | 4.5%).
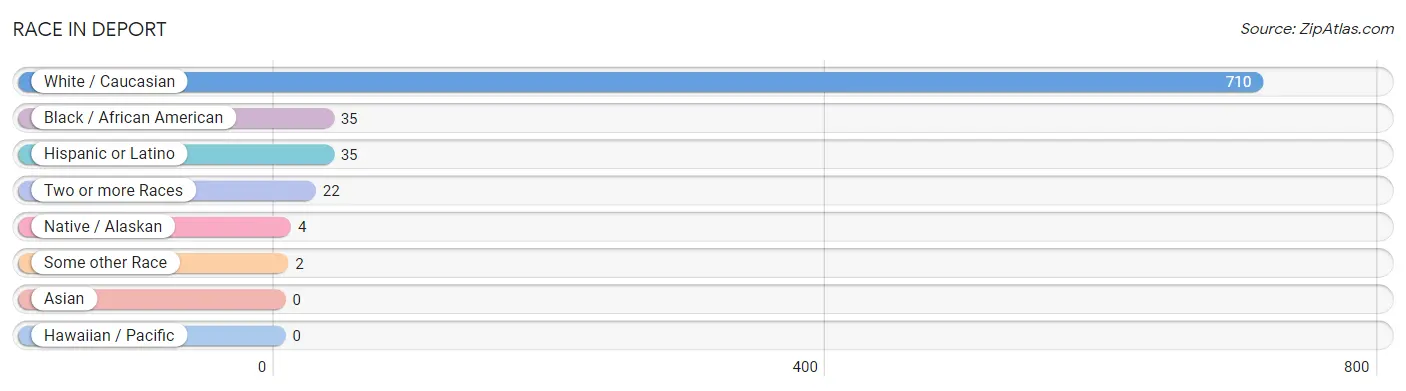
| Race | # Population | % Population |
| Asian | 0 | 0.0% |
| Black / African American | 35 | 4.5% |
| Hawaiian / Pacific | 0 | 0.0% |
| Hispanic or Latino | 35 | 4.5% |
| Native / Alaskan | 4 | 0.5% |
| White / Caucasian | 710 | 91.8% |
| Two or more Races | 22 | 2.9% |
| Some other Race | 2 | 0.3% |
| Total | 773 | 100.0% |
Ancestry in Deport
The most populous ancestries reported in Deport are American (285 | 36.9%), Irish (67 | 8.7%), Mexican (33 | 4.3%), English (24 | 3.1%), and French (22 | 2.9%), together accounting for 55.8% of all Deport residents.
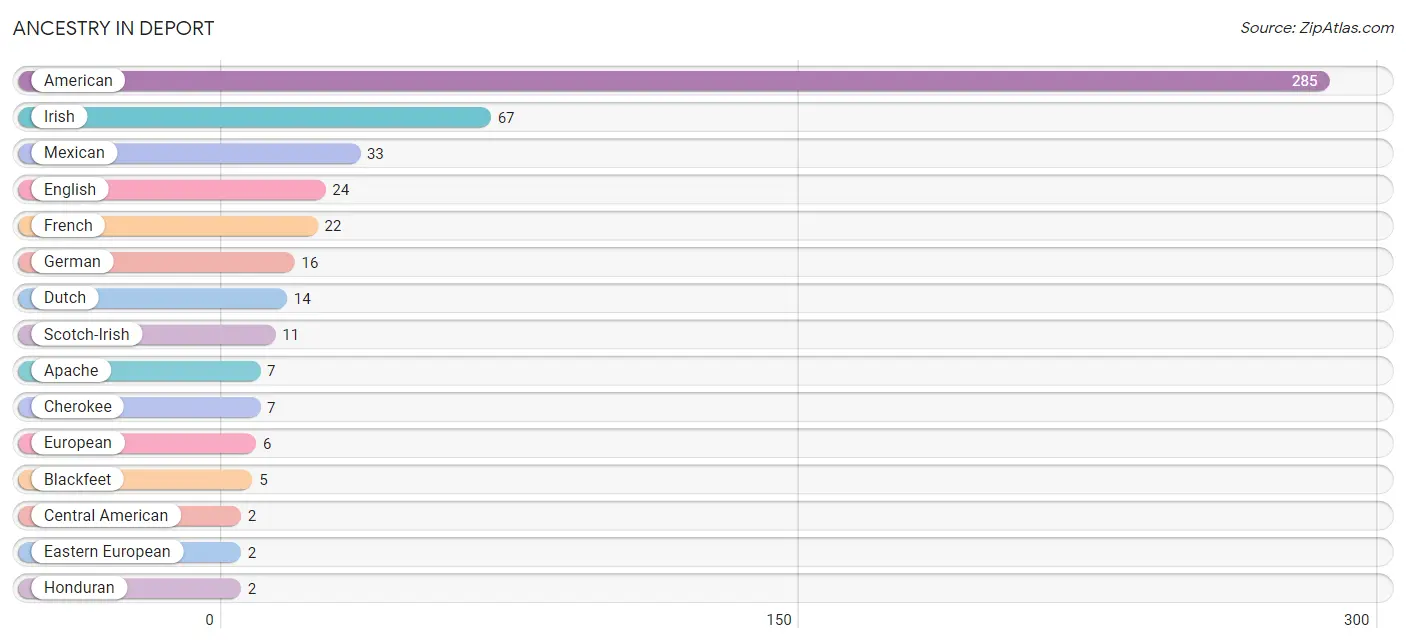
| Ancestry | # Population | % Population |
| American | 285 | 36.9% |
| Apache | 7 | 0.9% |
| Blackfeet | 5 | 0.6% |
| Central American | 2 | 0.3% |
| Cherokee | 7 | 0.9% |
| Dutch | 14 | 1.8% |
| Eastern European | 2 | 0.3% |
| English | 24 | 3.1% |
| European | 6 | 0.8% |
| French | 22 | 2.9% |
| German | 16 | 2.1% |
| Honduran | 2 | 0.3% |
| Irish | 67 | 8.7% |
| Mexican | 33 | 4.3% |
| Scandinavian | 2 | 0.3% |
| Scotch-Irish | 11 | 1.4% |
| Scottish | 2 | 0.3% | View All 17 Rows |
Immigrants in Deport
The most numerous immigrant groups reported in Deport came from Africa (12 | 1.5%), Nigeria (12 | 1.5%), Western Africa (12 | 1.5%), Central America (4 | 0.5%), and Latin America (4 | 0.5%), together accounting for 5.7% of all Deport residents.
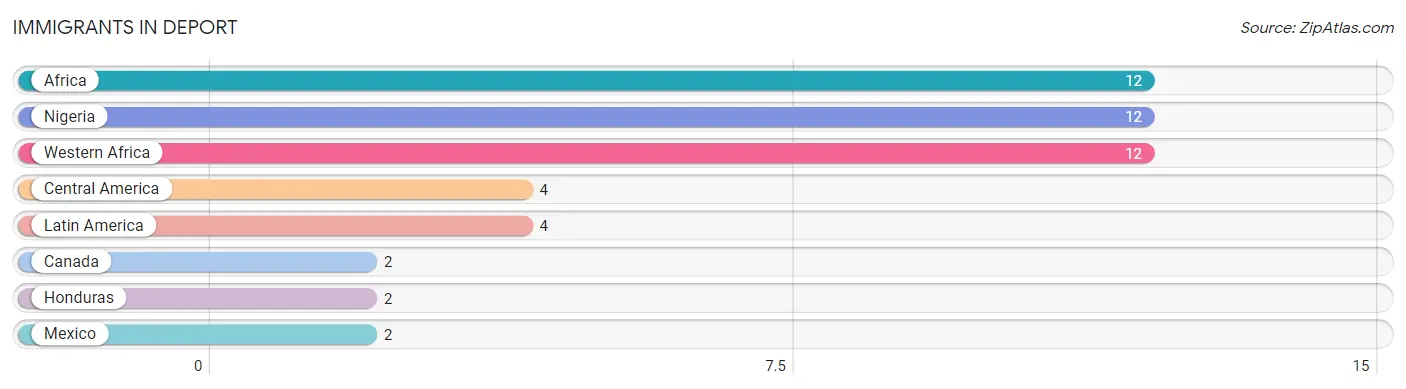
| Immigration Origin | # Population | % Population |
| Africa | 12 | 1.5% |
| Canada | 2 | 0.3% |
| Central America | 4 | 0.5% |
| Honduras | 2 | 0.3% |
| Latin America | 4 | 0.5% |
| Mexico | 2 | 0.3% |
| Nigeria | 12 | 1.5% |
| Western Africa | 12 | 1.5% | View All 8 Rows |
Sex and Age in Deport
Sex and Age in Deport
The most populous age groups in Deport are 70 to 74 Years (93 | 30.4%) for men and 65 to 69 Years (83 | 17.8%) for women.
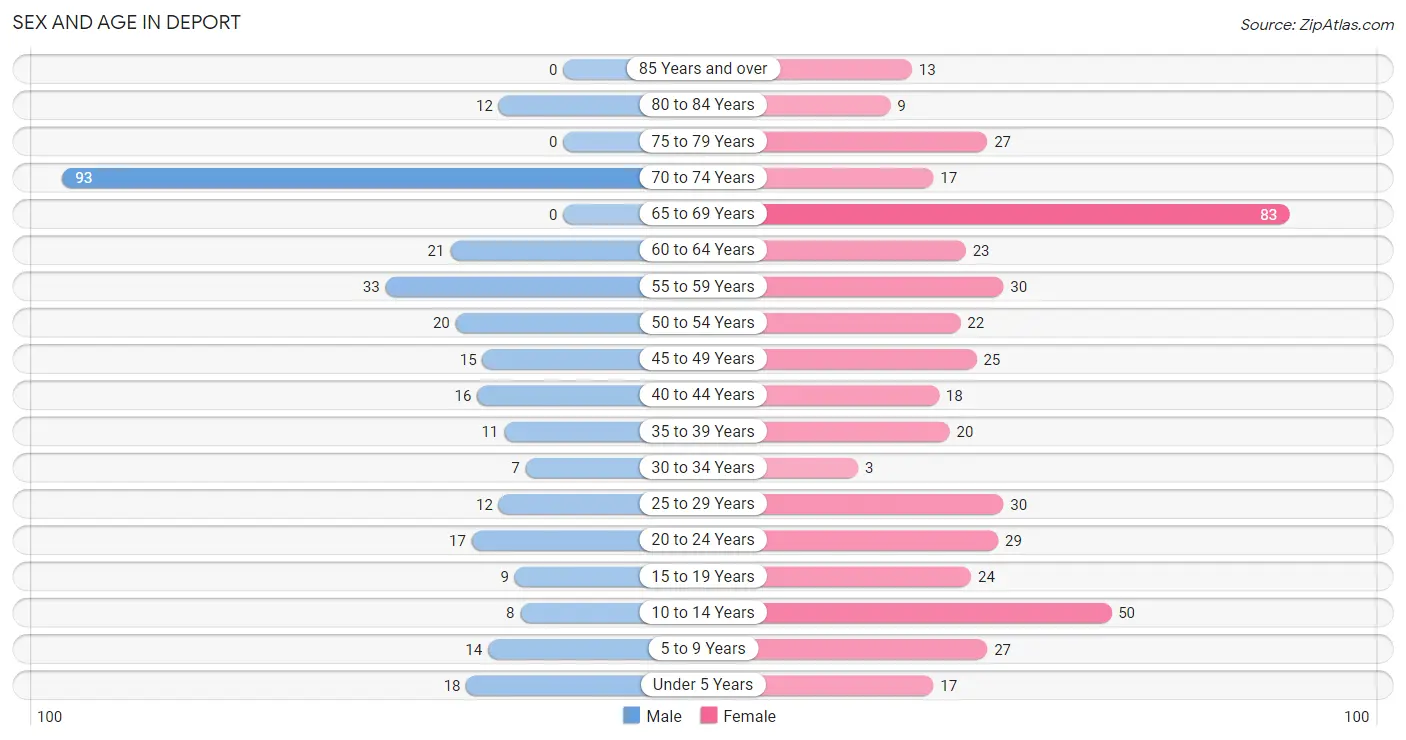
| Age Bracket | Male | Female |
| Under 5 Years | 18 (5.9%) | 17 (3.6%) |
| 5 to 9 Years | 14 (4.6%) | 27 (5.8%) |
| 10 to 14 Years | 8 (2.6%) | 50 (10.7%) |
| 15 to 19 Years | 9 (2.9%) | 24 (5.1%) |
| 20 to 24 Years | 17 (5.6%) | 29 (6.2%) |
| 25 to 29 Years | 12 (3.9%) | 30 (6.4%) |
| 30 to 34 Years | 7 (2.3%) | 3 (0.6%) |
| 35 to 39 Years | 11 (3.6%) | 20 (4.3%) |
| 40 to 44 Years | 16 (5.2%) | 18 (3.8%) |
| 45 to 49 Years | 15 (4.9%) | 25 (5.3%) |
| 50 to 54 Years | 20 (6.5%) | 22 (4.7%) |
| 55 to 59 Years | 33 (10.8%) | 30 (6.4%) |
| 60 to 64 Years | 21 (6.9%) | 23 (4.9%) |
| 65 to 69 Years | 0 (0.0%) | 83 (17.8%) |
| 70 to 74 Years | 93 (30.4%) | 17 (3.6%) |
| 75 to 79 Years | 0 (0.0%) | 27 (5.8%) |
| 80 to 84 Years | 12 (3.9%) | 9 (1.9%) |
| 85 Years and over | 0 (0.0%) | 13 (2.8%) |
| Total | 306 (100.0%) | 467 (100.0%) |
Families and Households in Deport
Median Family Size in Deport
The median family size in Deport is 2.73 persons per family, with single male/father families (2 | 1.1%) accounting for the largest median family size of 3 persons per family. On the other hand, married-couple families (127 | 69.4%) represent the smallest median family size with 2.72 persons per family.
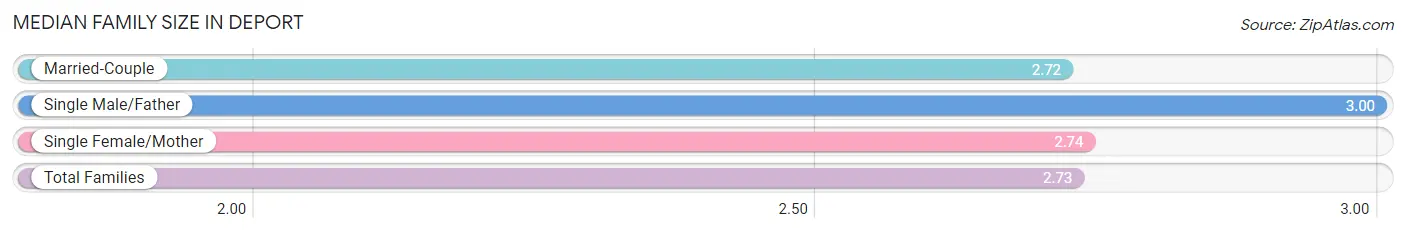
| Family Type | # Families | Family Size |
| Married-Couple | 127 (69.4%) | 2.72 |
| Single Male/Father | 2 (1.1%) | 3.00 |
| Single Female/Mother | 54 (29.5%) | 2.74 |
| Total Families | 183 (100.0%) | 2.73 |
Median Household Size in Deport
The median household size in Deport is 2.21 persons per household, with single female/mother households (54 | 15.4%) accounting for the largest median household size of 3.11 persons per household. non-family households (167 | 47.7%) represent the smallest median household size with 1.50 persons per household.
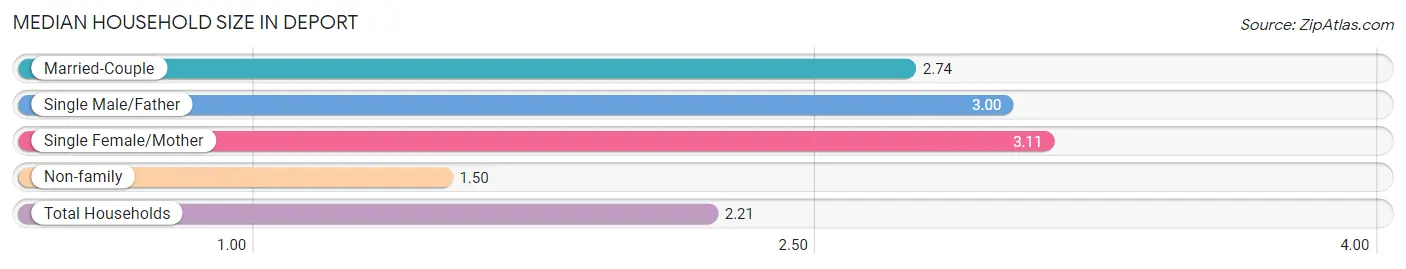
| Household Type | # Households | Household Size |
| Married-Couple | 127 (36.3%) | 2.74 |
| Single Male/Father | 2 (0.6%) | 3.00 |
| Single Female/Mother | 54 (15.4%) | 3.11 |
| Non-family | 167 (47.7%) | 1.50 |
| Total Households | 350 (100.0%) | 2.21 |
Household Size by Marriage Status in Deport
Out of a total of 350 households in Deport, 183 (52.3%) are family households, while 167 (47.7%) are nonfamily households. The most numerous type of family households are 2-person households, comprising 108, and the most common type of nonfamily households are 1-person households, comprising 121.
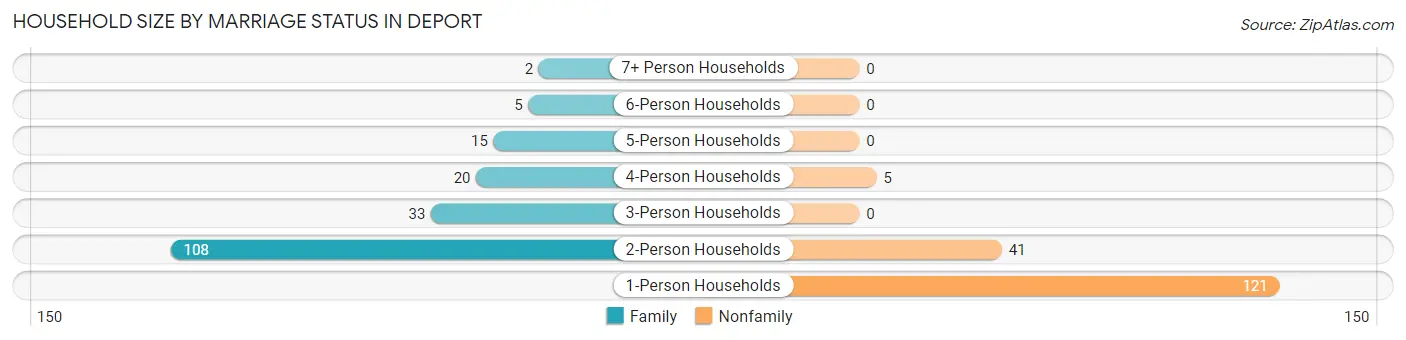
| Household Size | Family Households | Nonfamily Households |
| 1-Person Households | - | 121 (34.6%) |
| 2-Person Households | 108 (30.9%) | 41 (11.7%) |
| 3-Person Households | 33 (9.4%) | 0 (0.0%) |
| 4-Person Households | 20 (5.7%) | 5 (1.4%) |
| 5-Person Households | 15 (4.3%) | 0 (0.0%) |
| 6-Person Households | 5 (1.4%) | 0 (0.0%) |
| 7+ Person Households | 2 (0.6%) | 0 (0.0%) |
| Total | 183 (52.3%) | 167 (47.7%) |
Female Fertility in Deport
Fertility by Age in Deport
Average fertility rate in Deport is 19.0 births per 1,000 women. Women in the age bracket of 35 to 50 years have the highest fertility rate with 43.0 births per 1,000 women. Women in the age bracket of 35 to 50 years acount for 100.0% of all women with births.
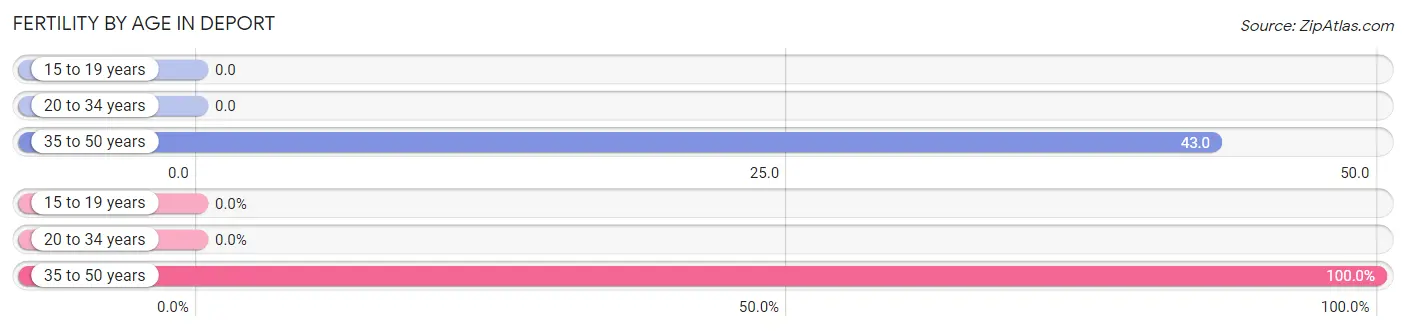
| Age Bracket | Women with Births | Births / 1,000 Women |
| 15 to 19 years | 0 (0.0%) | 0.0 |
| 20 to 34 years | 0 (0.0%) | 0.0 |
| 35 to 50 years | 3 (100.0%) | 43.0 |
| Total | 3 (100.0%) | 19.0 |
Fertility by Age by Marriage Status in Deport
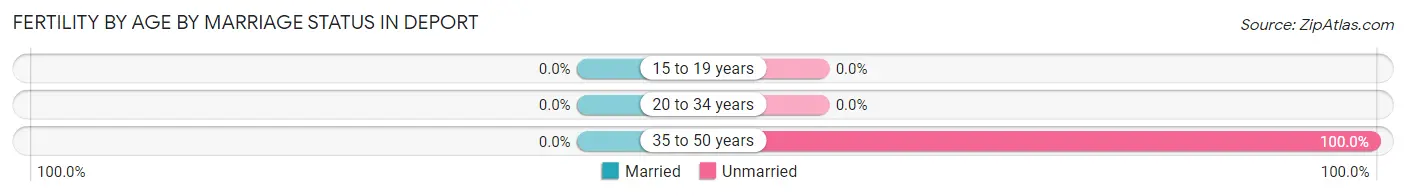
| Age Bracket | Married | Unmarried |
| 15 to 19 years | 0 (0.0%) | 0 (0.0%) |
| 20 to 34 years | 0 (0.0%) | 0 (0.0%) |
| 35 to 50 years | 0 (0.0%) | 3 (100.0%) |
| Total | 0 (0.0%) | 3 (100.0%) |
Fertility by Education in Deport
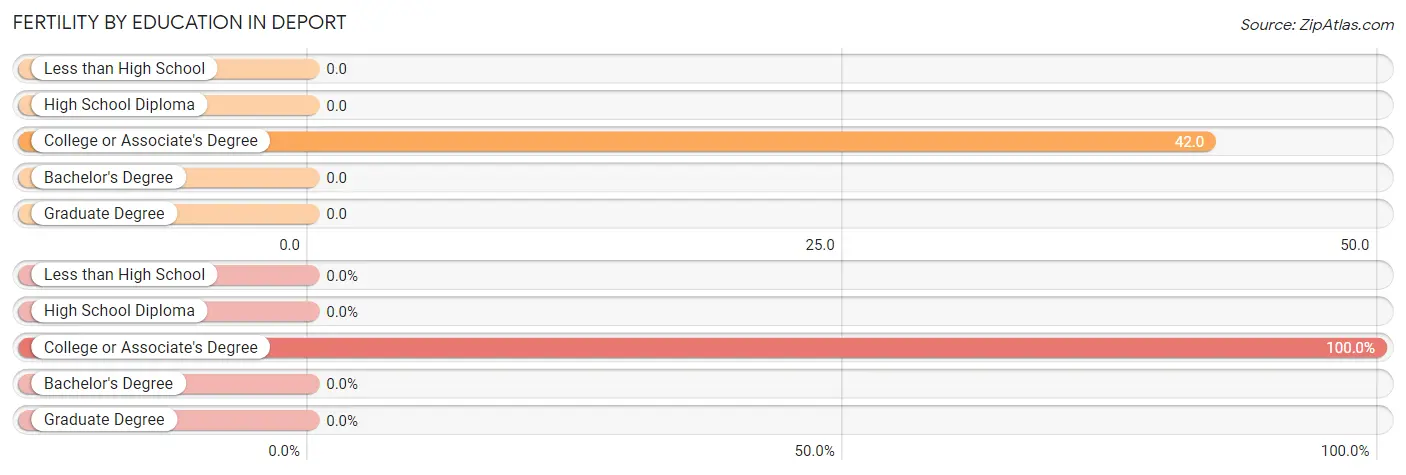
| Educational Attainment | Women with Births | Births / 1,000 Women |
| Less than High School | 0 (0.0%) | 0.0 |
| High School Diploma | 0 (0.0%) | 0.0 |
| College or Associate's Degree | 3 (100.0%) | 42.0 |
| Bachelor's Degree | 0 (0.0%) | 0.0 |
| Graduate Degree | 0 (0.0%) | 0.0 |
| Total | 3 (100.0%) | 19.0 |
Fertility by Education by Marriage Status in Deport
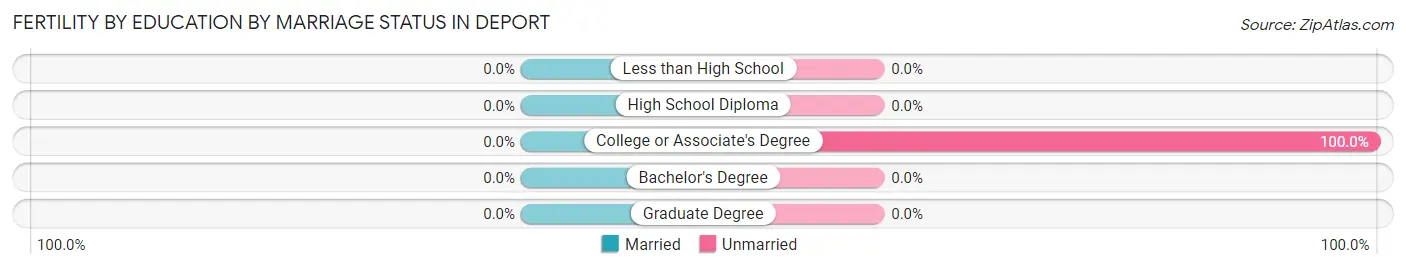
| Educational Attainment | Married | Unmarried |
| Less than High School | 0 (0.0%) | 0 (0.0%) |
| High School Diploma | 0 (0.0%) | 0 (0.0%) |
| College or Associate's Degree | 0 (0.0%) | 3 (100.0%) |
| Bachelor's Degree | 0 (0.0%) | 0 (0.0%) |
| Graduate Degree | 0 (0.0%) | 0 (0.0%) |
| Total | 0 (0.0%) | 3 (100.0%) |
Employment Characteristics in Deport
Employment by Class of Employer in Deport
Among the 323 employed individuals in Deport, private company employees (259 | 80.2%), self-employed (not incorporated) (28 | 8.7%), and local government employees (14 | 4.3%) make up the most common classes of employment.
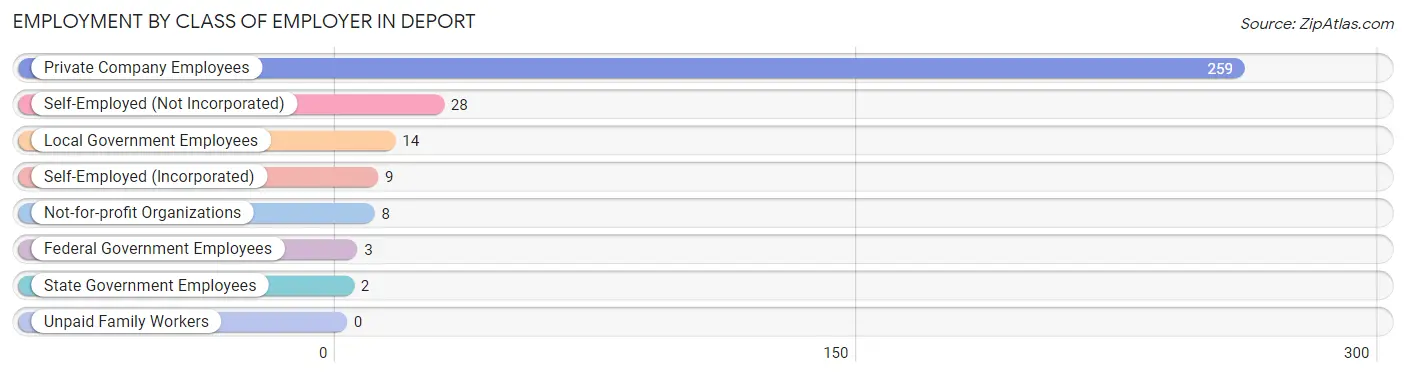
| Employer Class | # Employees | % Employees |
| Private Company Employees | 259 | 80.2% |
| Self-Employed (Incorporated) | 9 | 2.8% |
| Self-Employed (Not Incorporated) | 28 | 8.7% |
| Not-for-profit Organizations | 8 | 2.5% |
| Local Government Employees | 14 | 4.3% |
| State Government Employees | 2 | 0.6% |
| Federal Government Employees | 3 | 0.9% |
| Unpaid Family Workers | 0 | 0.0% |
| Total | 323 | 100.0% |
Employment Status by Age in Deport
According to the labor force statistics for Deport, out of the total population over 16 years of age (617), 54.3% or 335 individuals are in the labor force, with 0.9% or 3 of them unemployed. The age group with the highest labor force participation rate is 30 to 34 years, with 100.0% or 10 individuals in the labor force. Within the labor force, the 35 to 44 years age range has the highest percentage of unemployed individuals, with 6.7% or 3 of them being unemployed.
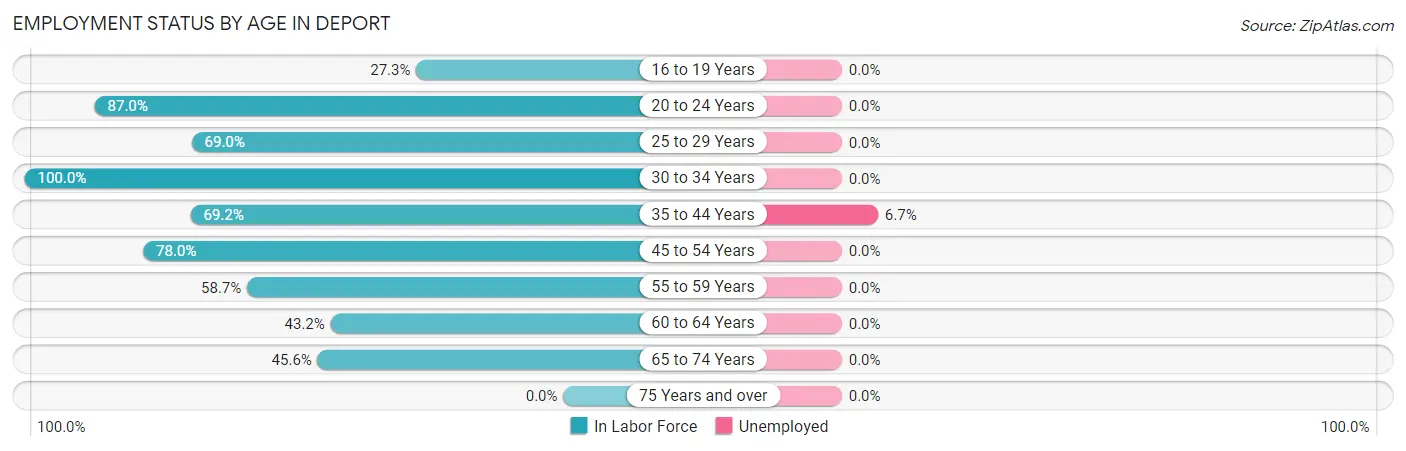
| Age Bracket | In Labor Force | Unemployed |
| 16 to 19 Years | 3 (27.3%) | 0 (0.0%) |
| 20 to 24 Years | 40 (87.0%) | 0 (0.0%) |
| 25 to 29 Years | 29 (69.0%) | 0 (0.0%) |
| 30 to 34 Years | 10 (100.0%) | 0 (0.0%) |
| 35 to 44 Years | 45 (69.2%) | 3 (6.7%) |
| 45 to 54 Years | 64 (78.0%) | 0 (0.0%) |
| 55 to 59 Years | 37 (58.7%) | 0 (0.0%) |
| 60 to 64 Years | 19 (43.2%) | 0 (0.0%) |
| 65 to 74 Years | 88 (45.6%) | 0 (0.0%) |
| 75 Years and over | 0 (0.0%) | 0 (0.0%) |
| Total | 335 (54.3%) | 3 (0.9%) |
Employment Status by Educational Attainment in Deport
According to labor force statistics for Deport, 66.7% of individuals (204) out of the total population between 25 and 64 years of age (306) are in the labor force, with 1.5% or 3 of them being unemployed. The group with the highest labor force participation rate are those with the educational attainment of bachelor's degree or higher, with 92.6% or 25 individuals in the labor force. Within the labor force, individuals with less than high school education have the highest percentage of unemployment, with 10.0% or 3 of them being unemployed.
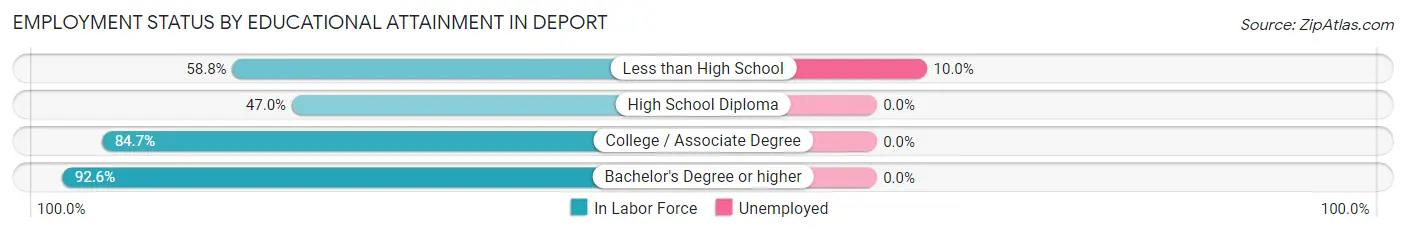
| Educational Attainment | In Labor Force | Unemployed |
| Less than High School | 30 (58.8%) | 5 (10.0%) |
| High School Diploma | 55 (47.0%) | 0 (0.0%) |
| College / Associate Degree | 94 (84.7%) | 0 (0.0%) |
| Bachelor's Degree or higher | 25 (92.6%) | 0 (0.0%) |
| Total | 204 (66.7%) | 5 (1.5%) |
Employment Occupations by Sex in Deport
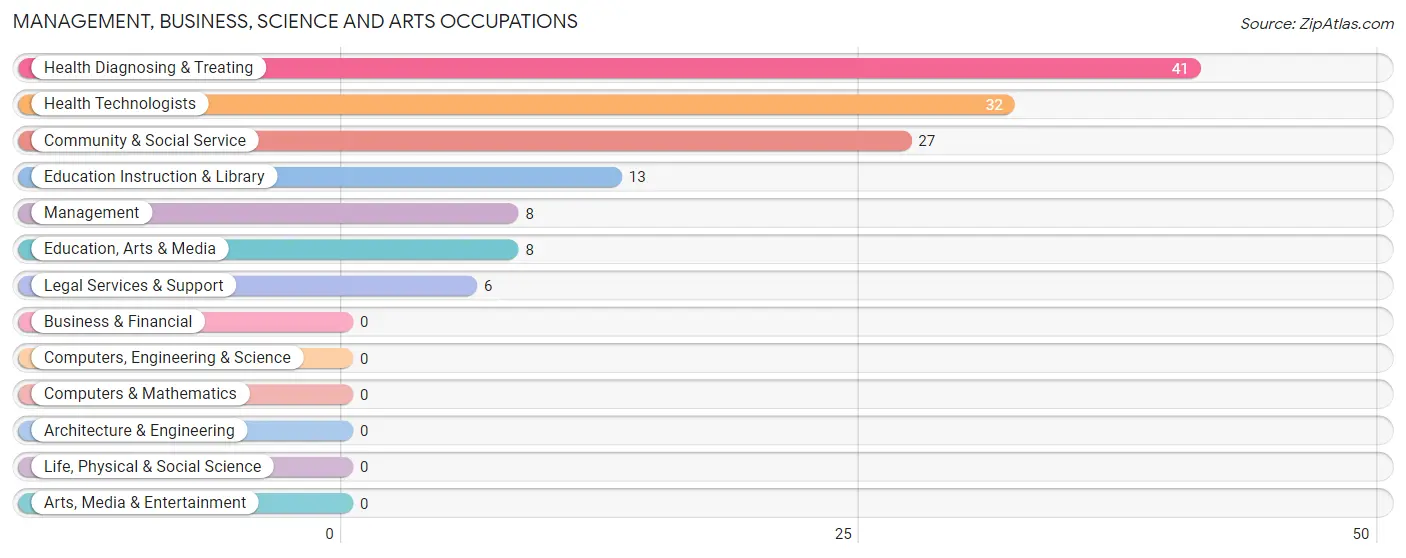
Management, Business, Science and Arts Occupations
The most common Management, Business, Science and Arts occupations in Deport are Health Diagnosing & Treating (41 | 12.3%), Health Technologists (32 | 9.6%), Community & Social Service (27 | 8.1%), Education Instruction & Library (13 | 3.9%), and Management (8 | 2.4%).
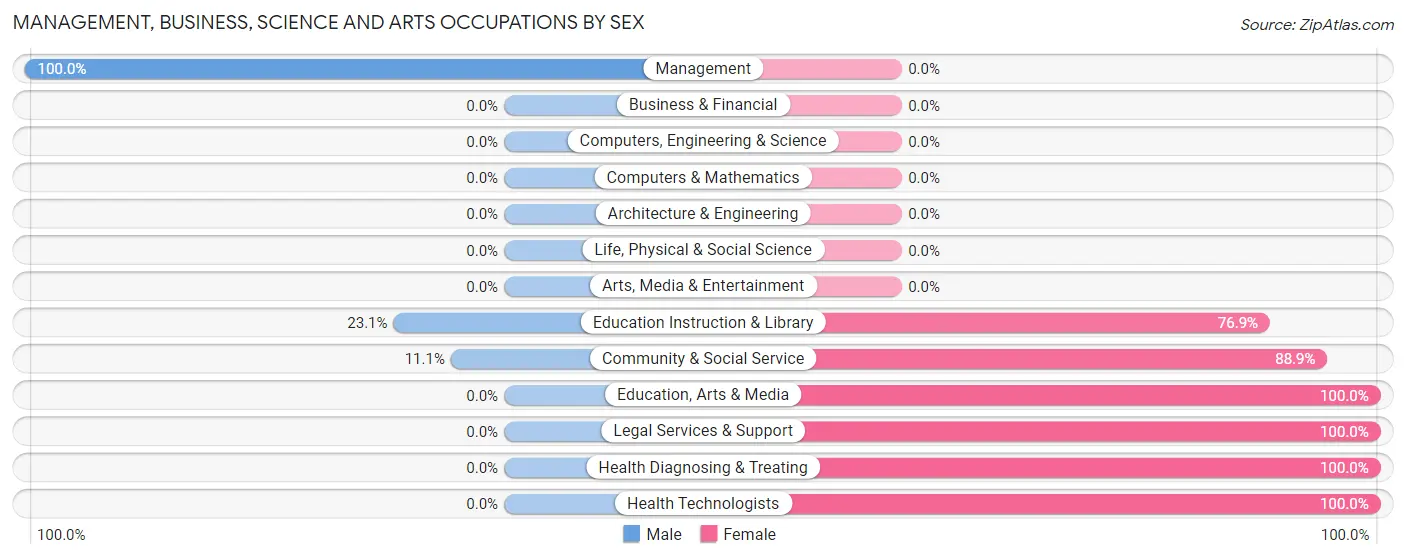
Management, Business, Science and Arts Occupations by Sex
Within the Management, Business, Science and Arts occupations in Deport, the most male-oriented occupations are Management (100.0%), Education Instruction & Library (23.1%), and Community & Social Service (11.1%), while the most female-oriented occupations are Education, Arts & Media (100.0%), Legal Services & Support (100.0%), and Health Diagnosing & Treating (100.0%).
| Occupation | Male | Female |
| Management | 8 (100.0%) | 0 (0.0%) |
| Business & Financial | 0 (0.0%) | 0 (0.0%) |
| Computers, Engineering & Science | 0 (0.0%) | 0 (0.0%) |
| Computers & Mathematics | 0 (0.0%) | 0 (0.0%) |
| Architecture & Engineering | 0 (0.0%) | 0 (0.0%) |
| Life, Physical & Social Science | 0 (0.0%) | 0 (0.0%) |
| Community & Social Service | 3 (11.1%) | 24 (88.9%) |
| Education, Arts & Media | 0 (0.0%) | 8 (100.0%) |
| Legal Services & Support | 0 (0.0%) | 6 (100.0%) |
| Education Instruction & Library | 3 (23.1%) | 10 (76.9%) |
| Arts, Media & Entertainment | 0 (0.0%) | 0 (0.0%) |
| Health Diagnosing & Treating | 0 (0.0%) | 41 (100.0%) |
| Health Technologists | 0 (0.0%) | 32 (100.0%) |
| Total (Category) | 11 (14.5%) | 65 (85.5%) |
| Total (Overall) | 163 (49.1%) | 169 (50.9%) |
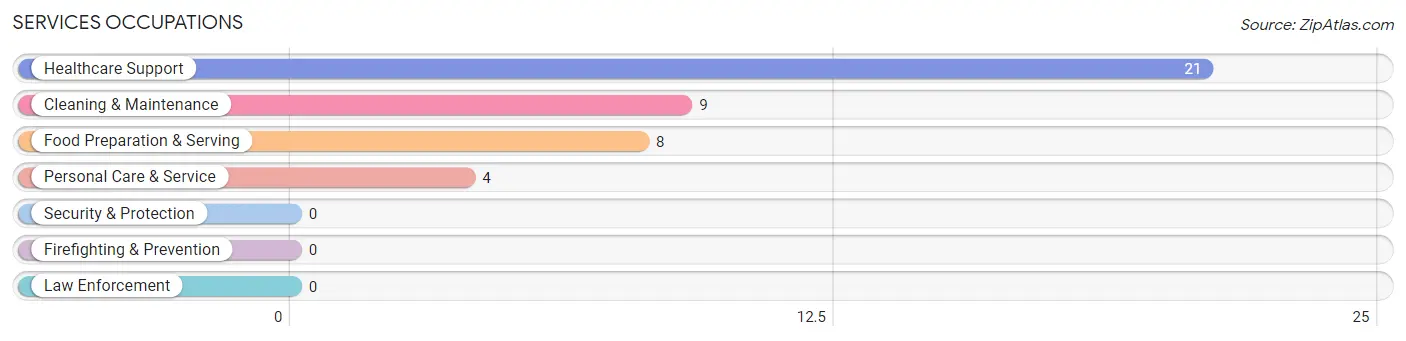
Services Occupations
The most common Services occupations in Deport are Healthcare Support (21 | 6.3%), Cleaning & Maintenance (9 | 2.7%), Food Preparation & Serving (8 | 2.4%), and Personal Care & Service (4 | 1.2%).
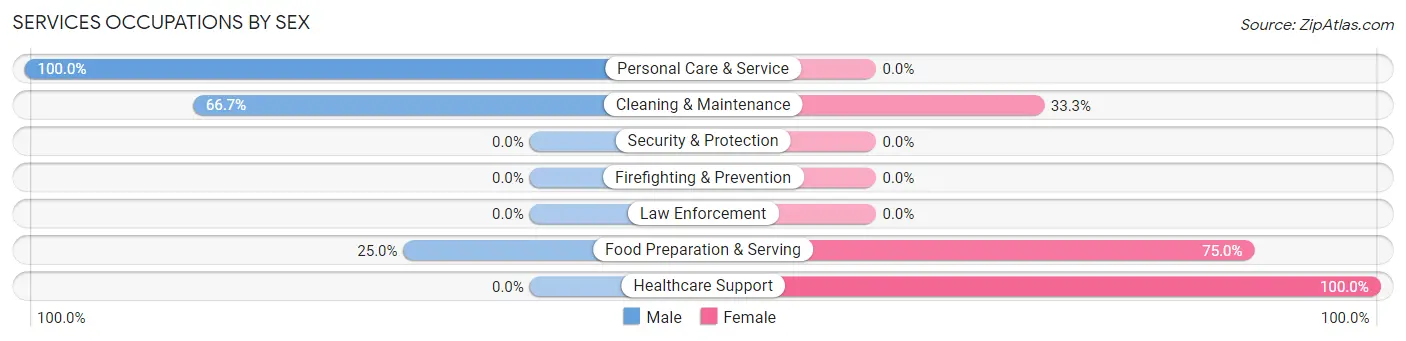
Services Occupations by Sex
Within the Services occupations in Deport, the most male-oriented occupations are Personal Care & Service (100.0%), Cleaning & Maintenance (66.7%), and Food Preparation & Serving (25.0%), while the most female-oriented occupations are Healthcare Support (100.0%), Food Preparation & Serving (75.0%), and Cleaning & Maintenance (33.3%).
| Occupation | Male | Female |
| Healthcare Support | 0 (0.0%) | 21 (100.0%) |
| Security & Protection | 0 (0.0%) | 0 (0.0%) |
| Firefighting & Prevention | 0 (0.0%) | 0 (0.0%) |
| Law Enforcement | 0 (0.0%) | 0 (0.0%) |
| Food Preparation & Serving | 2 (25.0%) | 6 (75.0%) |
| Cleaning & Maintenance | 6 (66.7%) | 3 (33.3%) |
| Personal Care & Service | 4 (100.0%) | 0 (0.0%) |
| Total (Category) | 12 (28.6%) | 30 (71.4%) |
| Total (Overall) | 163 (49.1%) | 169 (50.9%) |
Sales and Office Occupations
The most common Sales and Office occupations in Deport are Sales & Related (63 | 19.0%), and Office & Administration (20 | 6.0%).

Sales and Office Occupations by Sex

| Occupation | Male | Female |
| Sales & Related | 14 (22.2%) | 49 (77.8%) |
| Office & Administration | 0 (0.0%) | 20 (100.0%) |
| Total (Category) | 14 (16.9%) | 69 (83.1%) |
| Total (Overall) | 163 (49.1%) | 169 (50.9%) |
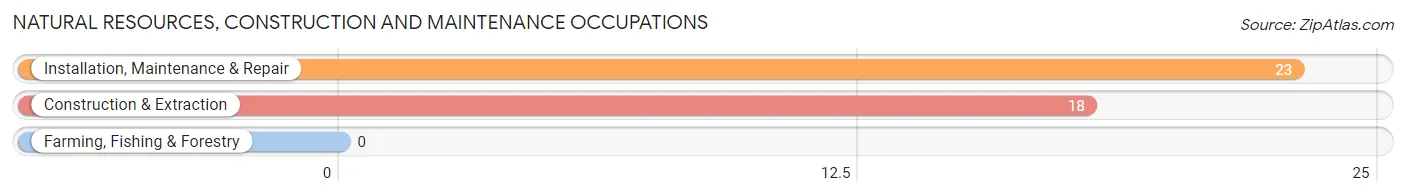
Natural Resources, Construction and Maintenance Occupations
The most common Natural Resources, Construction and Maintenance occupations in Deport are Installation, Maintenance & Repair (23 | 6.9%), and Construction & Extraction (18 | 5.4%).
Natural Resources, Construction and Maintenance Occupations by Sex
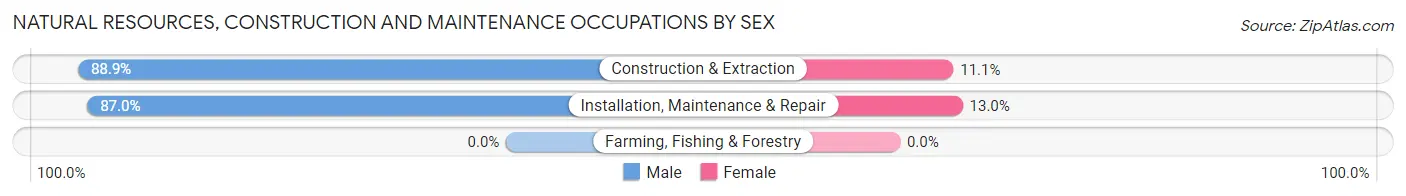
| Occupation | Male | Female |
| Farming, Fishing & Forestry | 0 (0.0%) | 0 (0.0%) |
| Construction & Extraction | 16 (88.9%) | 2 (11.1%) |
| Installation, Maintenance & Repair | 20 (87.0%) | 3 (13.0%) |
| Total (Category) | 36 (87.8%) | 5 (12.2%) |
| Total (Overall) | 163 (49.1%) | 169 (50.9%) |
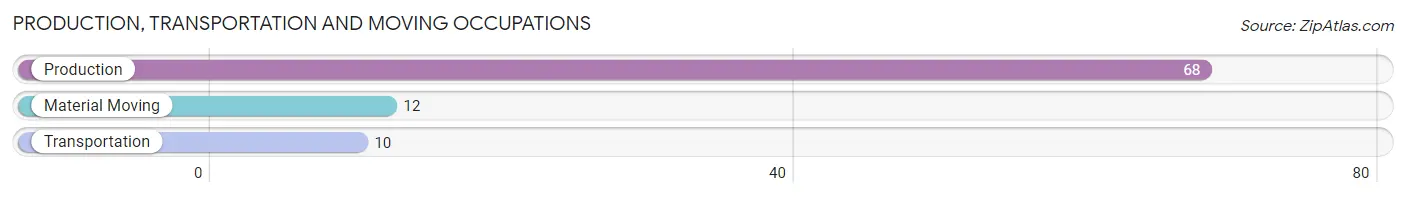
Production, Transportation and Moving Occupations
The most common Production, Transportation and Moving occupations in Deport are Production (68 | 20.5%), Material Moving (12 | 3.6%), and Transportation (10 | 3.0%).
Production, Transportation and Moving Occupations by Sex
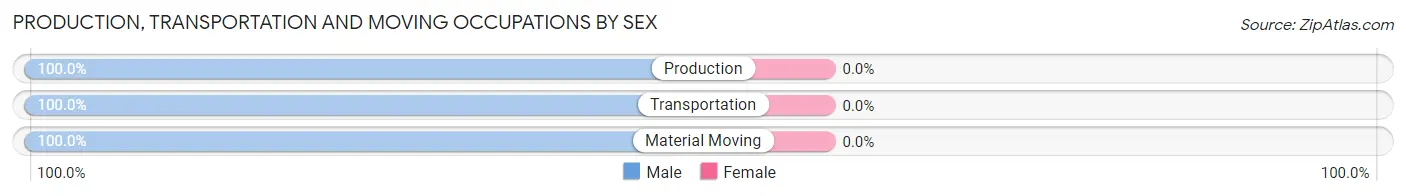
| Occupation | Male | Female |
| Production | 68 (100.0%) | 0 (0.0%) |
| Transportation | 10 (100.0%) | 0 (0.0%) |
| Material Moving | 12 (100.0%) | 0 (0.0%) |
| Total (Category) | 90 (100.0%) | 0 (0.0%) |
| Total (Overall) | 163 (49.1%) | 169 (50.9%) |
Employment Industries by Sex in Deport
Employment Industries in Deport
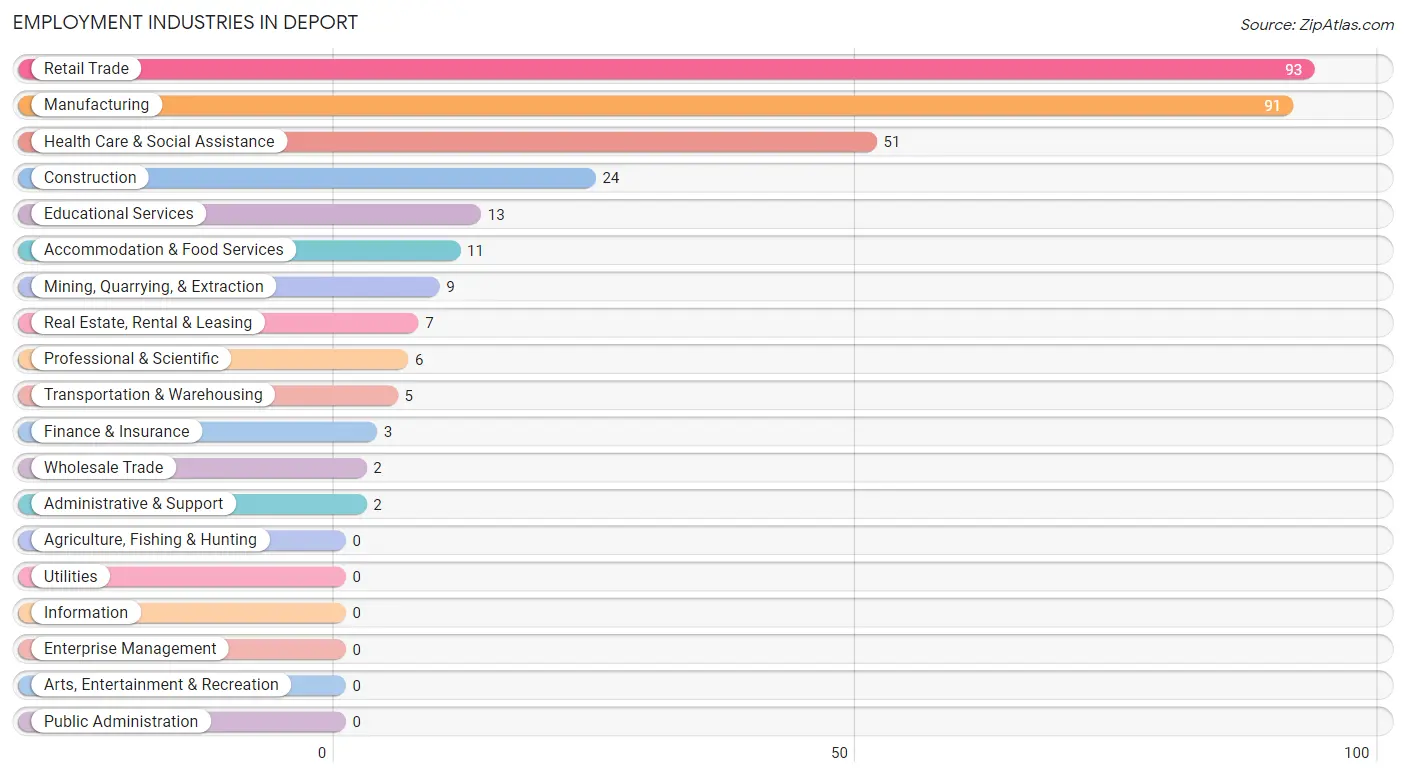
The major employment industries in Deport include Retail Trade (93 | 28.0%), Manufacturing (91 | 27.4%), Health Care & Social Assistance (51 | 15.4%), Construction (24 | 7.2%), and Educational Services (13 | 3.9%).
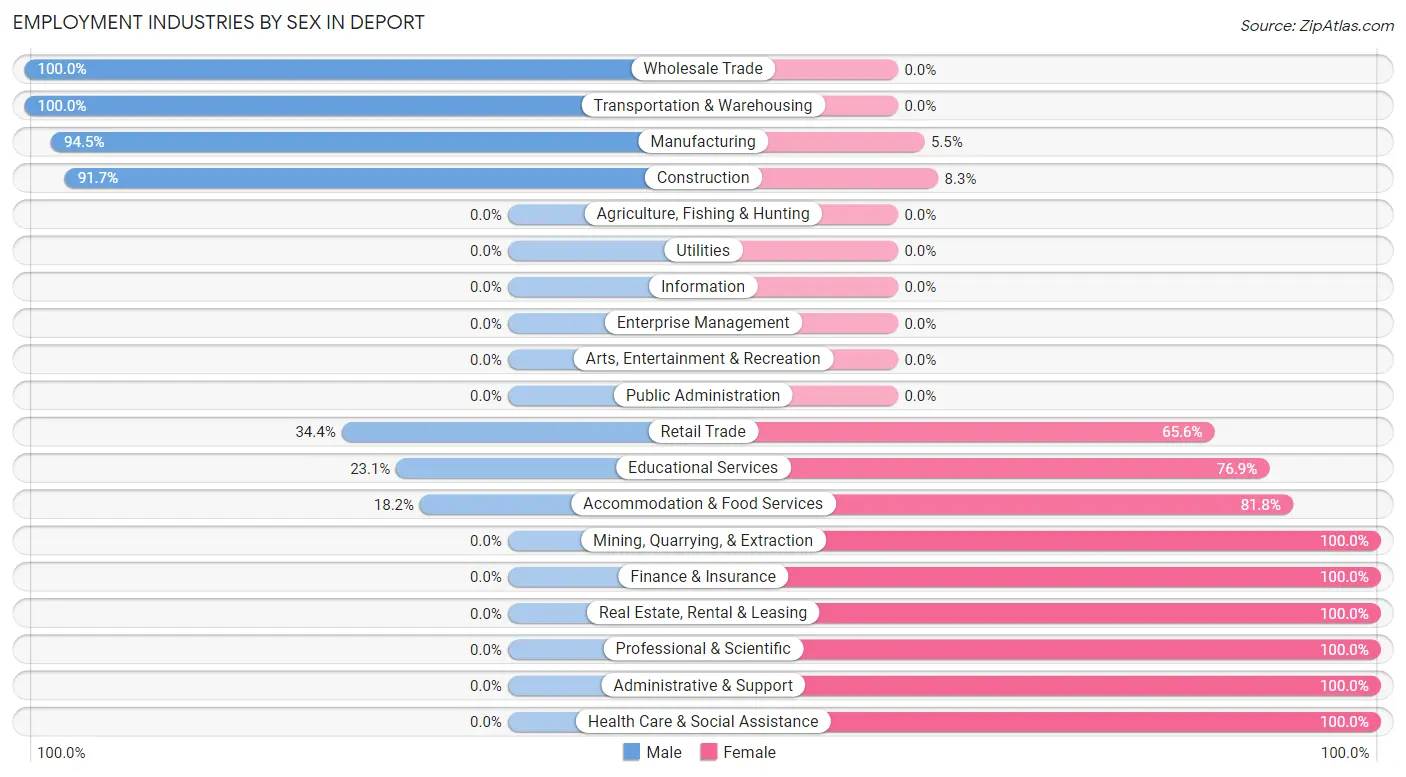
Employment Industries by Sex in Deport
The Deport industries that see more men than women are Wholesale Trade (100.0%), Transportation & Warehousing (100.0%), and Manufacturing (94.5%), whereas the industries that tend to have a higher number of women are Mining, Quarrying, & Extraction (100.0%), Finance & Insurance (100.0%), and Real Estate, Rental & Leasing (100.0%).
| Industry | Male | Female |
| Agriculture, Fishing & Hunting | 0 (0.0%) | 0 (0.0%) |
| Mining, Quarrying, & Extraction | 0 (0.0%) | 9 (100.0%) |
| Construction | 22 (91.7%) | 2 (8.3%) |
| Manufacturing | 86 (94.5%) | 5 (5.5%) |
| Wholesale Trade | 2 (100.0%) | 0 (0.0%) |
| Retail Trade | 32 (34.4%) | 61 (65.6%) |
| Transportation & Warehousing | 5 (100.0%) | 0 (0.0%) |
| Utilities | 0 (0.0%) | 0 (0.0%) |
| Information | 0 (0.0%) | 0 (0.0%) |
| Finance & Insurance | 0 (0.0%) | 3 (100.0%) |
| Real Estate, Rental & Leasing | 0 (0.0%) | 7 (100.0%) |
| Professional & Scientific | 0 (0.0%) | 6 (100.0%) |
| Enterprise Management | 0 (0.0%) | 0 (0.0%) |
| Administrative & Support | 0 (0.0%) | 2 (100.0%) |
| Educational Services | 3 (23.1%) | 10 (76.9%) |
| Health Care & Social Assistance | 0 (0.0%) | 51 (100.0%) |
| Arts, Entertainment & Recreation | 0 (0.0%) | 0 (0.0%) |
| Accommodation & Food Services | 2 (18.2%) | 9 (81.8%) |
| Public Administration | 0 (0.0%) | 0 (0.0%) |
| Total | 163 (49.1%) | 169 (50.9%) |
Education in Deport
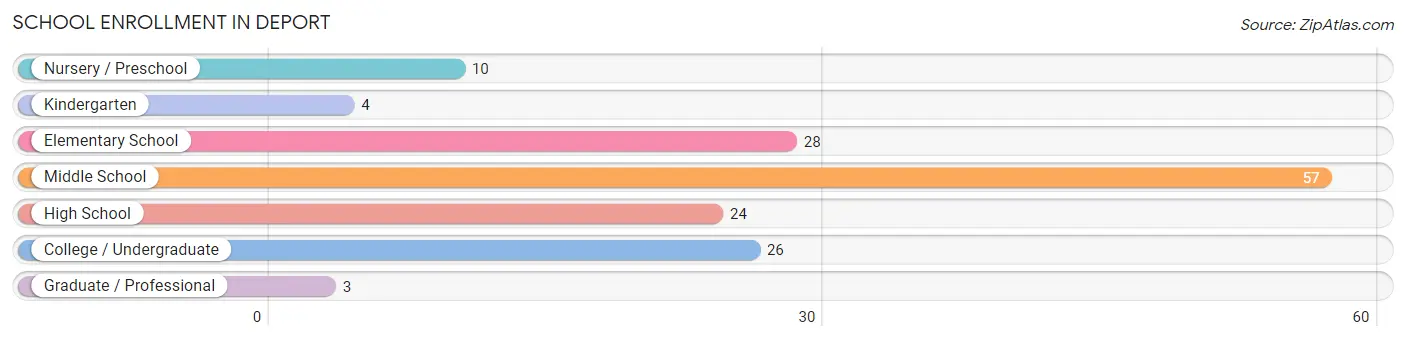
School Enrollment in Deport
The most common levels of schooling among the 152 students in Deport are middle school (57 | 37.5%), elementary school (28 | 18.4%), and college / undergraduate (26 | 17.1%).
| School Level | # Students | % Students |
| Nursery / Preschool | 10 | 6.6% |
| Kindergarten | 4 | 2.6% |
| Elementary School | 28 | 18.4% |
| Middle School | 57 | 37.5% |
| High School | 24 | 15.8% |
| College / Undergraduate | 26 | 17.1% |
| Graduate / Professional | 3 | 2.0% |
| Total | 152 | 100.0% |
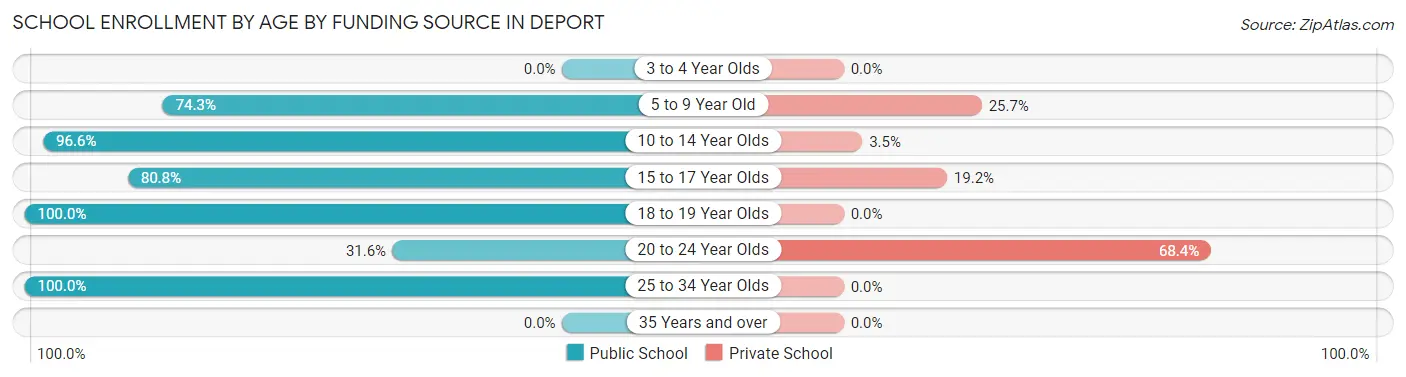
School Enrollment by Age by Funding Source in Deport
Out of a total of 152 students who are enrolled in schools in Deport, 29 (19.1%) attend a private institution, while the remaining 123 (80.9%) are enrolled in public schools. The age group of 20 to 24 year olds has the highest likelihood of being enrolled in private schools, with 13 (68.4% in the age bracket) enrolled. Conversely, the age group of 18 to 19 year olds has the lowest likelihood of being enrolled in a private school, with 7 (100.0% in the age bracket) attending a public institution.
| Age Bracket | Public School | Private School |
| 3 to 4 Year Olds | 0 (0.0%) | 0 (0.0%) |
| 5 to 9 Year Old | 26 (74.3%) | 9 (25.7%) |
| 10 to 14 Year Olds | 56 (96.6%) | 2 (3.5%) |
| 15 to 17 Year Olds | 21 (80.8%) | 5 (19.2%) |
| 18 to 19 Year Olds | 7 (100.0%) | 0 (0.0%) |
| 20 to 24 Year Olds | 6 (31.6%) | 13 (68.4%) |
| 25 to 34 Year Olds | 7 (100.0%) | 0 (0.0%) |
| 35 Years and over | 0 (0.0%) | 0 (0.0%) |
| Total | 123 (80.9%) | 29 (19.1%) |
Educational Attainment by Field of Study in Deport
Bio, nature & agricultural (20 | 33.9%), education (20 | 33.9%), computers & mathematics (6 | 10.2%), science & technology (5 | 8.5%), and business (4 | 6.8%) are the most common fields of study among 59 individuals in Deport who have obtained a bachelor's degree or higher.
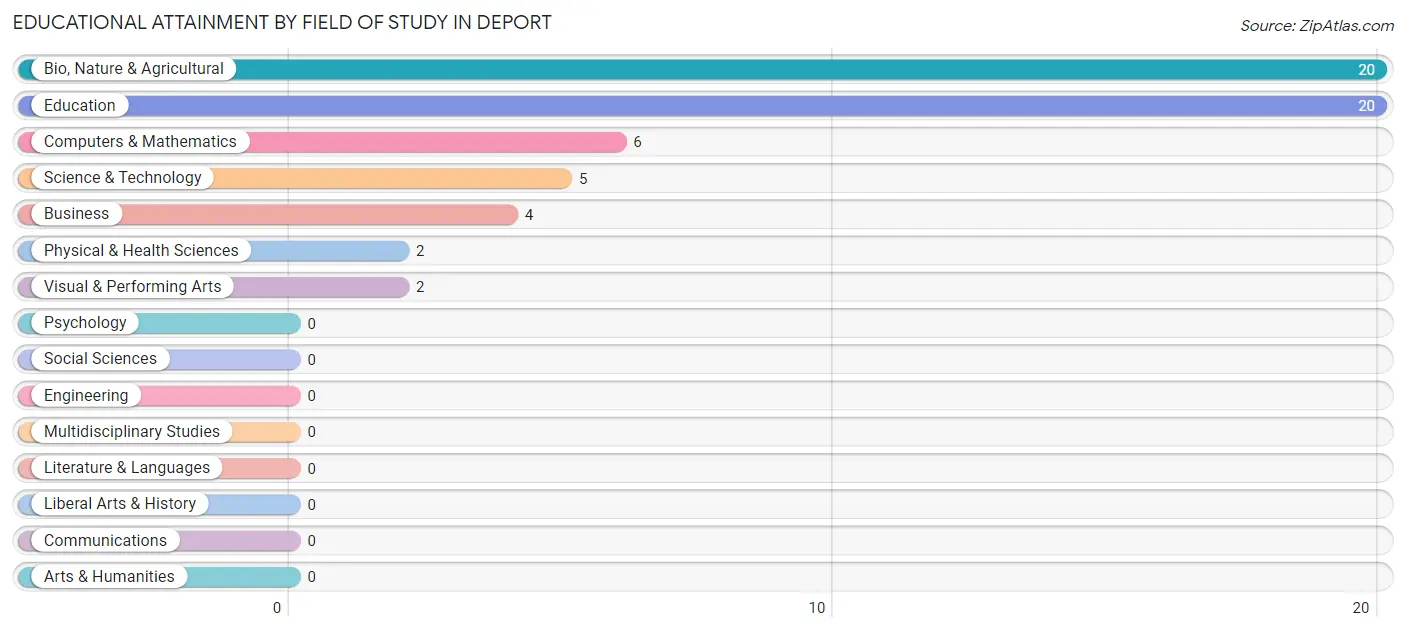
| Field of Study | # Graduates | % Graduates |
| Computers & Mathematics | 6 | 10.2% |
| Bio, Nature & Agricultural | 20 | 33.9% |
| Physical & Health Sciences | 2 | 3.4% |
| Psychology | 0 | 0.0% |
| Social Sciences | 0 | 0.0% |
| Engineering | 0 | 0.0% |
| Multidisciplinary Studies | 0 | 0.0% |
| Science & Technology | 5 | 8.5% |
| Business | 4 | 6.8% |
| Education | 20 | 33.9% |
| Literature & Languages | 0 | 0.0% |
| Liberal Arts & History | 0 | 0.0% |
| Visual & Performing Arts | 2 | 3.4% |
| Communications | 0 | 0.0% |
| Arts & Humanities | 0 | 0.0% |
| Total | 59 | 100.0% |
Transportation & Commute in Deport
Vehicle Availability by Sex in Deport
The most prevalent vehicle ownership categories in Deport are males with 2 vehicles (120, accounting for 77.9%) and females with 2 vehicles (68, making up 71.0%).
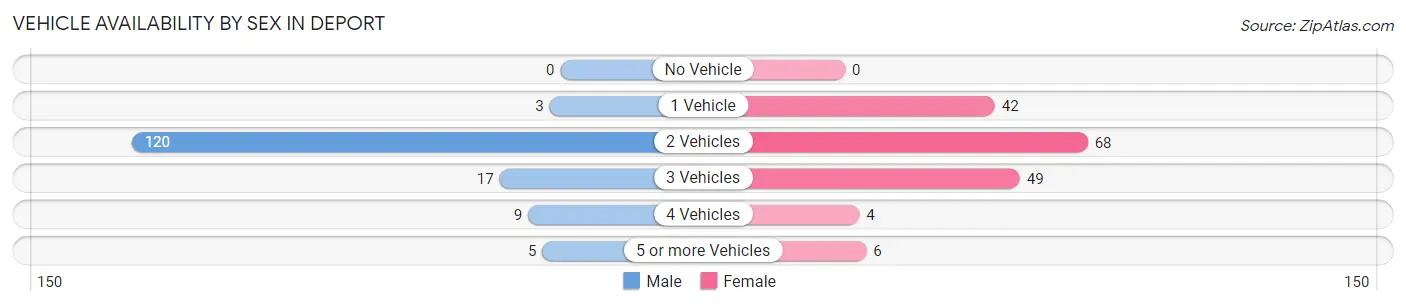
| Vehicles Available | Male | Female |
| No Vehicle | 0 (0.0%) | 0 (0.0%) |
| 1 Vehicle | 3 (1.9%) | 42 (24.8%) |
| 2 Vehicles | 120 (77.9%) | 68 (40.2%) |
| 3 Vehicles | 17 (11.0%) | 49 (29.0%) |
| 4 Vehicles | 9 (5.8%) | 4 (2.4%) |
| 5 or more Vehicles | 5 (3.3%) | 6 (3.5%) |
| Total | 154 (100.0%) | 169 (100.0%) |
Commute Time in Deport
The most frequently occuring commute durations in Deport are 20 to 24 minutes (137 commuters, 43.2%), 25 to 29 minutes (47 commuters, 14.8%), and 30 to 34 minutes (38 commuters, 12.0%).
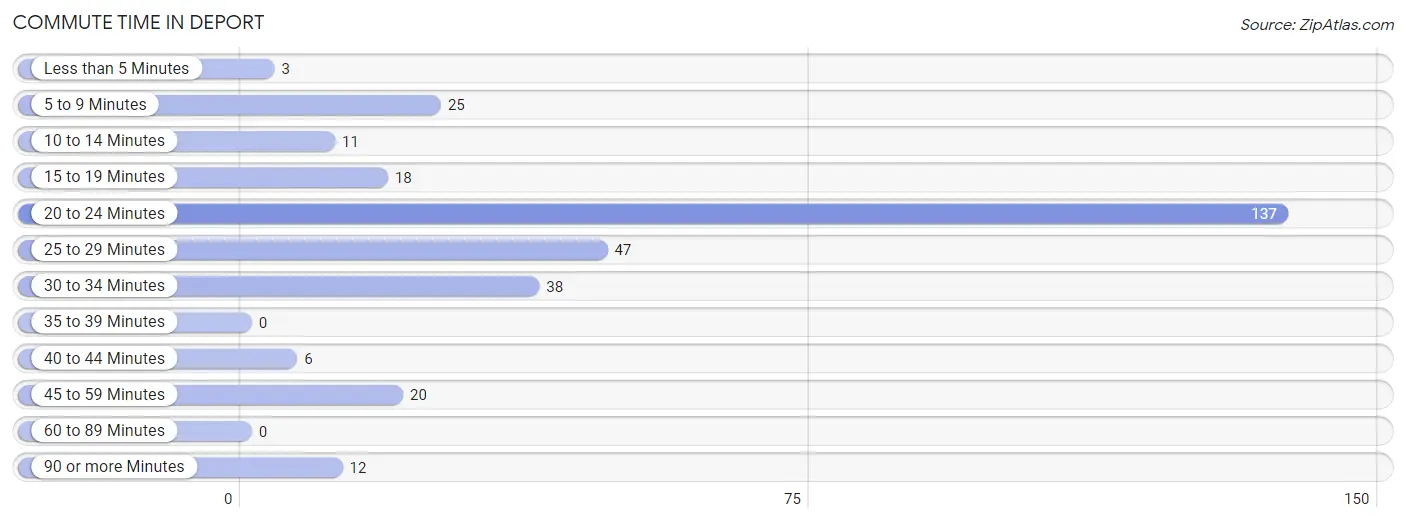
| Commute Time | # Commuters | % Commuters |
| Less than 5 Minutes | 3 | 0.9% |
| 5 to 9 Minutes | 25 | 7.9% |
| 10 to 14 Minutes | 11 | 3.5% |
| 15 to 19 Minutes | 18 | 5.7% |
| 20 to 24 Minutes | 137 | 43.2% |
| 25 to 29 Minutes | 47 | 14.8% |
| 30 to 34 Minutes | 38 | 12.0% |
| 35 to 39 Minutes | 0 | 0.0% |
| 40 to 44 Minutes | 6 | 1.9% |
| 45 to 59 Minutes | 20 | 6.3% |
| 60 to 89 Minutes | 0 | 0.0% |
| 90 or more Minutes | 12 | 3.8% |
Commute Time by Sex in Deport
The most common commute times in Deport are 20 to 24 minutes (94 commuters, 63.5%) for males and 20 to 24 minutes (43 commuters, 25.4%) for females.
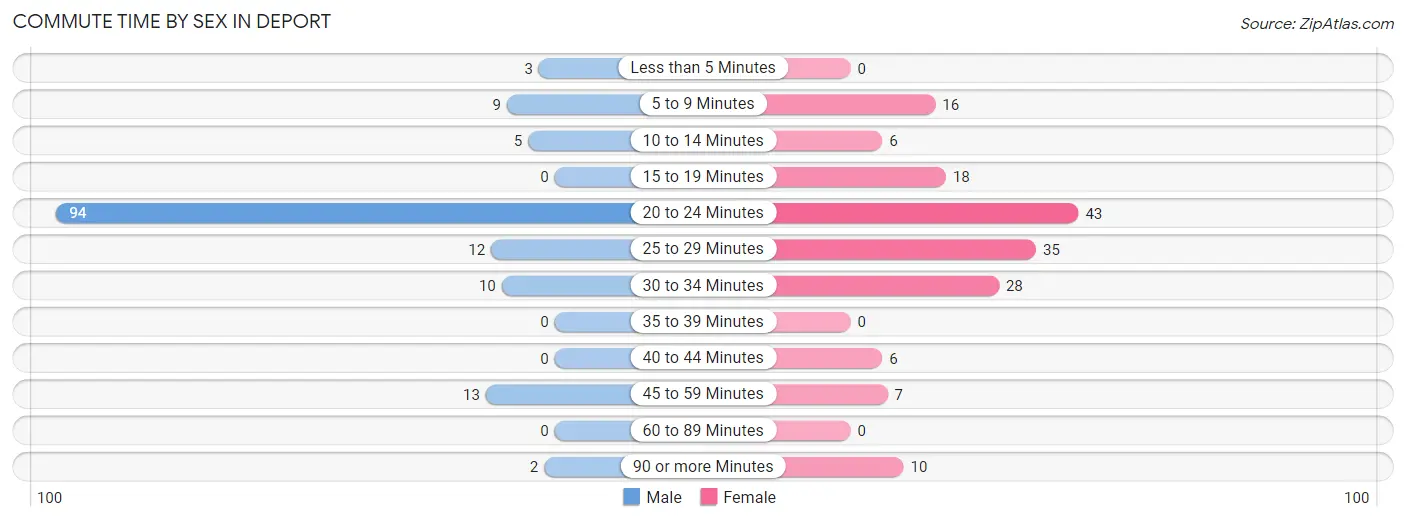
| Commute Time | Male | Female |
| Less than 5 Minutes | 3 (2.0%) | 0 (0.0%) |
| 5 to 9 Minutes | 9 (6.1%) | 16 (9.5%) |
| 10 to 14 Minutes | 5 (3.4%) | 6 (3.5%) |
| 15 to 19 Minutes | 0 (0.0%) | 18 (10.6%) |
| 20 to 24 Minutes | 94 (63.5%) | 43 (25.4%) |
| 25 to 29 Minutes | 12 (8.1%) | 35 (20.7%) |
| 30 to 34 Minutes | 10 (6.8%) | 28 (16.6%) |
| 35 to 39 Minutes | 0 (0.0%) | 0 (0.0%) |
| 40 to 44 Minutes | 0 (0.0%) | 6 (3.5%) |
| 45 to 59 Minutes | 13 (8.8%) | 7 (4.1%) |
| 60 to 89 Minutes | 0 (0.0%) | 0 (0.0%) |
| 90 or more Minutes | 2 (1.3%) | 10 (5.9%) |
Time of Departure to Work by Sex in Deport
The most frequent times of departure to work in Deport are 6:00 AM to 6:29 AM (62, 41.9%) for males and 7:30 AM to 7:59 AM (40, 23.7%) for females.
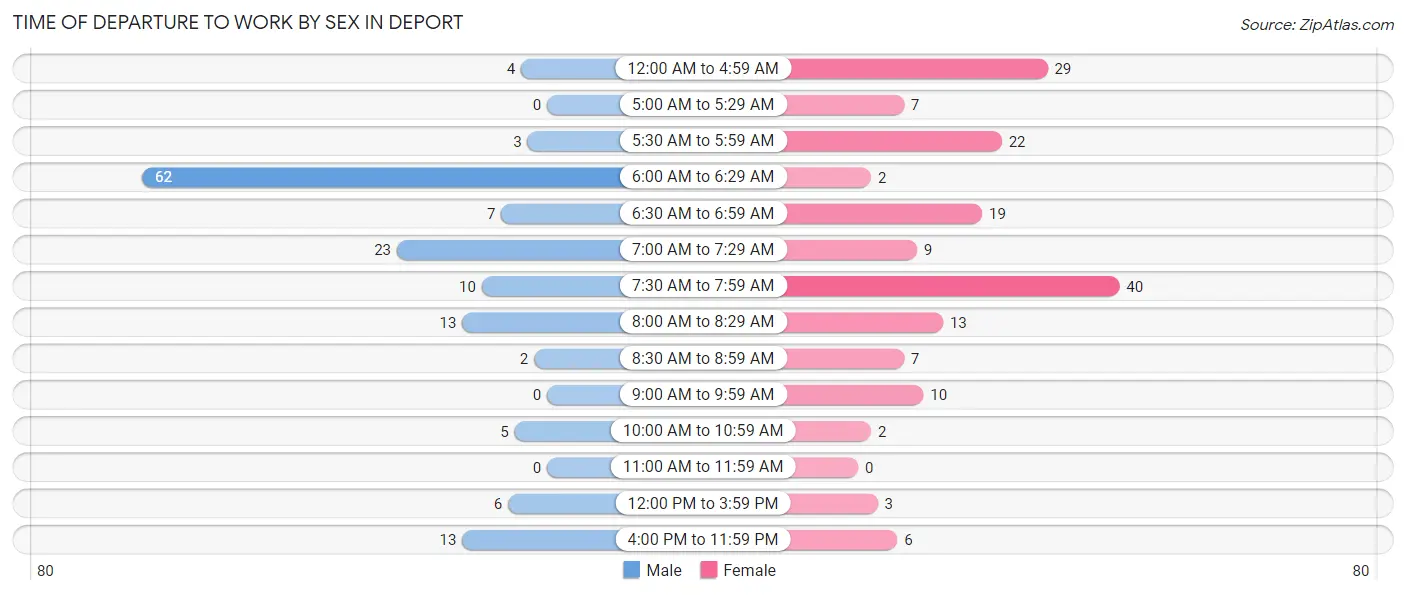
| Time of Departure | Male | Female |
| 12:00 AM to 4:59 AM | 4 (2.7%) | 29 (17.2%) |
| 5:00 AM to 5:29 AM | 0 (0.0%) | 7 (4.1%) |
| 5:30 AM to 5:59 AM | 3 (2.0%) | 22 (13.0%) |
| 6:00 AM to 6:29 AM | 62 (41.9%) | 2 (1.2%) |
| 6:30 AM to 6:59 AM | 7 (4.7%) | 19 (11.2%) |
| 7:00 AM to 7:29 AM | 23 (15.5%) | 9 (5.3%) |
| 7:30 AM to 7:59 AM | 10 (6.8%) | 40 (23.7%) |
| 8:00 AM to 8:29 AM | 13 (8.8%) | 13 (7.7%) |
| 8:30 AM to 8:59 AM | 2 (1.3%) | 7 (4.1%) |
| 9:00 AM to 9:59 AM | 0 (0.0%) | 10 (5.9%) |
| 10:00 AM to 10:59 AM | 5 (3.4%) | 2 (1.2%) |
| 11:00 AM to 11:59 AM | 0 (0.0%) | 0 (0.0%) |
| 12:00 PM to 3:59 PM | 6 (4.1%) | 3 (1.8%) |
| 4:00 PM to 11:59 PM | 13 (8.8%) | 6 (3.5%) |
| Total | 148 (100.0%) | 169 (100.0%) |
Housing Occupancy in Deport
Occupancy by Ownership in Deport
Of the total 350 dwellings in Deport, owner-occupied units account for 227 (64.9%), while renter-occupied units make up 123 (35.1%).
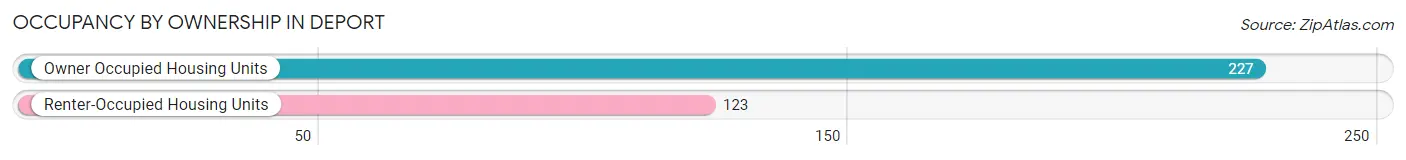
| Occupancy | # Housing Units | % Housing Units |
| Owner Occupied Housing Units | 227 | 64.9% |
| Renter-Occupied Housing Units | 123 | 35.1% |
| Total Occupied Housing Units | 350 | 100.0% |
Occupancy by Household Size in Deport
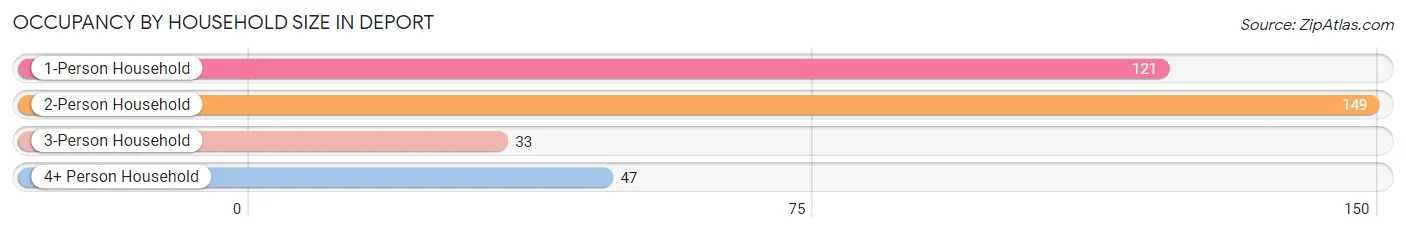
| Household Size | # Housing Units | % Housing Units |
| 1-Person Household | 121 | 34.6% |
| 2-Person Household | 149 | 42.6% |
| 3-Person Household | 33 | 9.4% |
| 4+ Person Household | 47 | 13.4% |
| Total Housing Units | 350 | 100.0% |
Occupancy by Ownership by Household Size in Deport
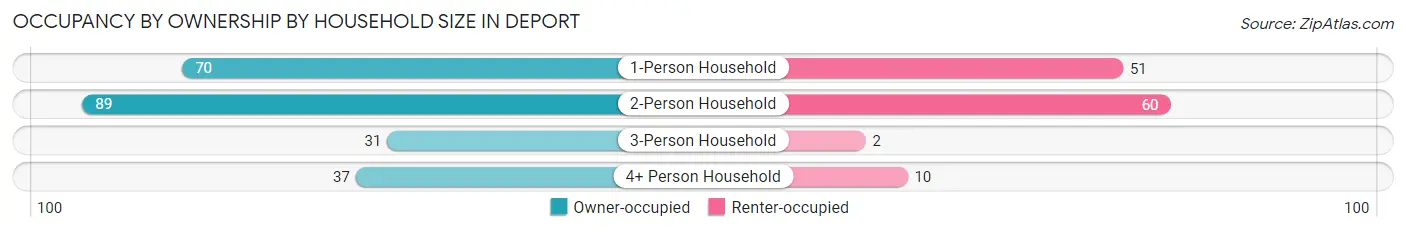
| Household Size | Owner-occupied | Renter-occupied |
| 1-Person Household | 70 (57.9%) | 51 (42.1%) |
| 2-Person Household | 89 (59.7%) | 60 (40.3%) |
| 3-Person Household | 31 (93.9%) | 2 (6.1%) |
| 4+ Person Household | 37 (78.7%) | 10 (21.3%) |
| Total Housing Units | 227 (64.9%) | 123 (35.1%) |
Occupancy by Educational Attainment in Deport
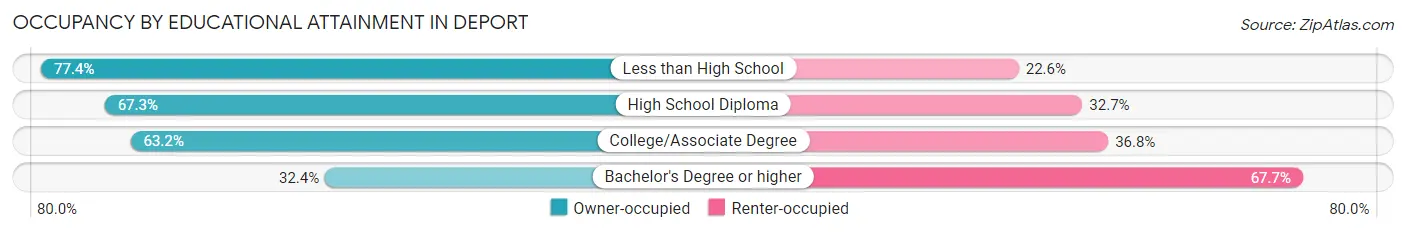
| Household Size | Owner-occupied | Renter-occupied |
| Less than High School | 65 (77.4%) | 19 (22.6%) |
| High School Diploma | 72 (67.3%) | 35 (32.7%) |
| College/Associate Degree | 79 (63.2%) | 46 (36.8%) |
| Bachelor's Degree or higher | 11 (32.4%) | 23 (67.6%) |
Occupancy by Age of Householder in Deport
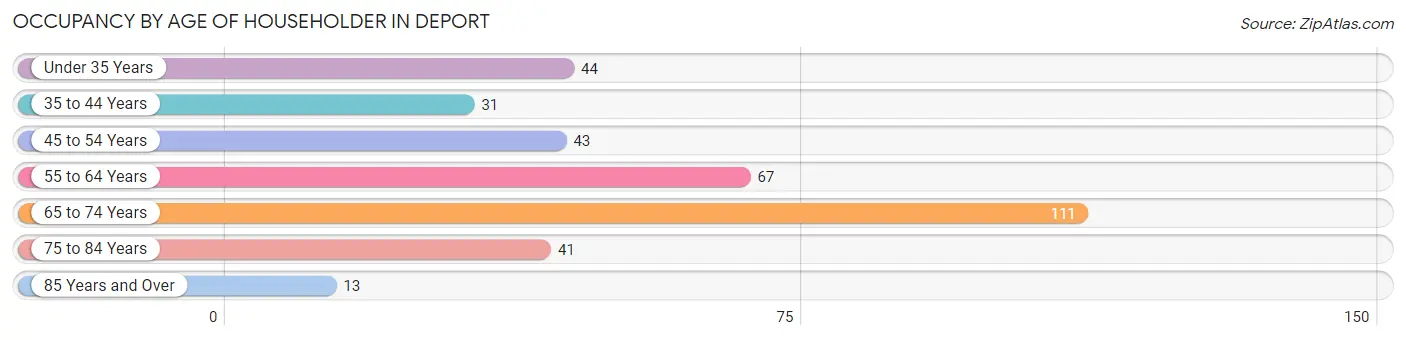
| Age Bracket | # Households | % Households |
| Under 35 Years | 44 | 12.6% |
| 35 to 44 Years | 31 | 8.9% |
| 45 to 54 Years | 43 | 12.3% |
| 55 to 64 Years | 67 | 19.1% |
| 65 to 74 Years | 111 | 31.7% |
| 75 to 84 Years | 41 | 11.7% |
| 85 Years and Over | 13 | 3.7% |
| Total | 350 | 100.0% |
Housing Finances in Deport
Median Income by Occupancy in Deport
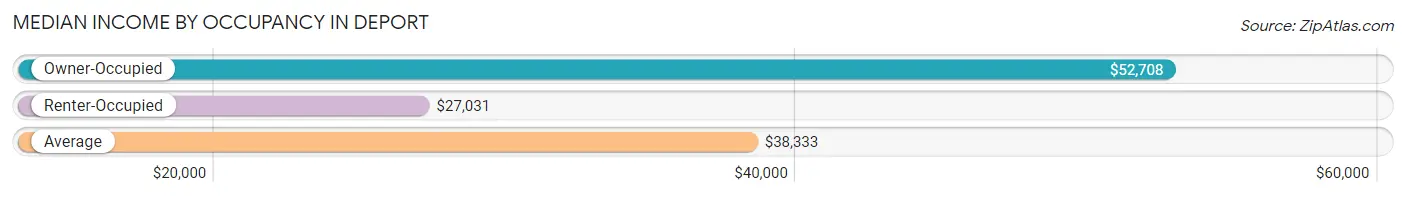
| Occupancy Type | # Households | Median Income |
| Owner-Occupied | 227 (64.9%) | $52,708 |
| Renter-Occupied | 123 (35.1%) | $27,031 |
| Average | 350 (100.0%) | $38,333 |
Occupancy by Householder Income Bracket in Deport
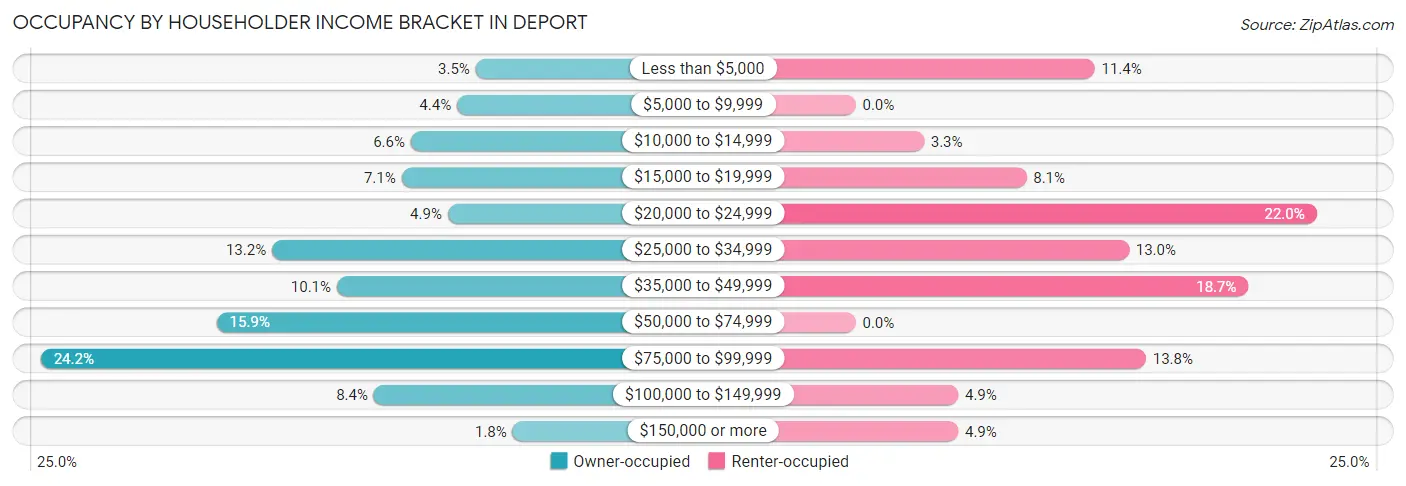
| Income Bracket | Owner-occupied | Renter-occupied |
| Less than $5,000 | 8 (3.5%) | 14 (11.4%) |
| $5,000 to $9,999 | 10 (4.4%) | 0 (0.0%) |
| $10,000 to $14,999 | 15 (6.6%) | 4 (3.3%) |
| $15,000 to $19,999 | 16 (7.0%) | 10 (8.1%) |
| $20,000 to $24,999 | 11 (4.9%) | 27 (22.0%) |
| $25,000 to $34,999 | 30 (13.2%) | 16 (13.0%) |
| $35,000 to $49,999 | 23 (10.1%) | 23 (18.7%) |
| $50,000 to $74,999 | 36 (15.9%) | 0 (0.0%) |
| $75,000 to $99,999 | 55 (24.2%) | 17 (13.8%) |
| $100,000 to $149,999 | 19 (8.4%) | 6 (4.9%) |
| $150,000 or more | 4 (1.8%) | 6 (4.9%) |
| Total | 227 (100.0%) | 123 (100.0%) |
Monthly Housing Cost Tiers in Deport
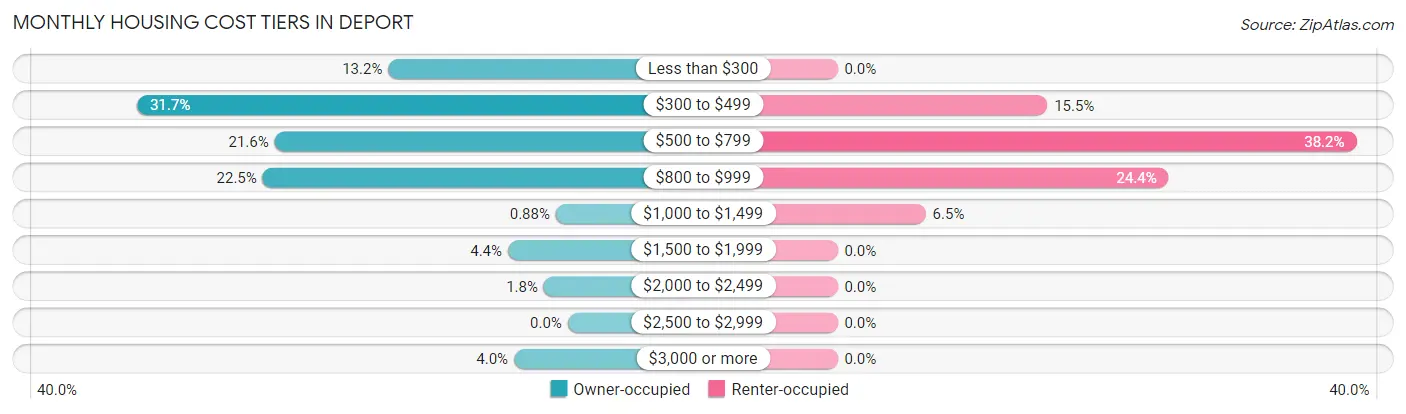
| Monthly Cost | Owner-occupied | Renter-occupied |
| Less than $300 | 30 (13.2%) | 0 (0.0%) |
| $300 to $499 | 72 (31.7%) | 19 (15.4%) |
| $500 to $799 | 49 (21.6%) | 47 (38.2%) |
| $800 to $999 | 51 (22.5%) | 30 (24.4%) |
| $1,000 to $1,499 | 2 (0.9%) | 8 (6.5%) |
| $1,500 to $1,999 | 10 (4.4%) | 0 (0.0%) |
| $2,000 to $2,499 | 4 (1.8%) | 0 (0.0%) |
| $2,500 to $2,999 | 0 (0.0%) | 0 (0.0%) |
| $3,000 or more | 9 (4.0%) | 0 (0.0%) |
| Total | 227 (100.0%) | 123 (100.0%) |
Physical Housing Characteristics in Deport
Housing Structures in Deport
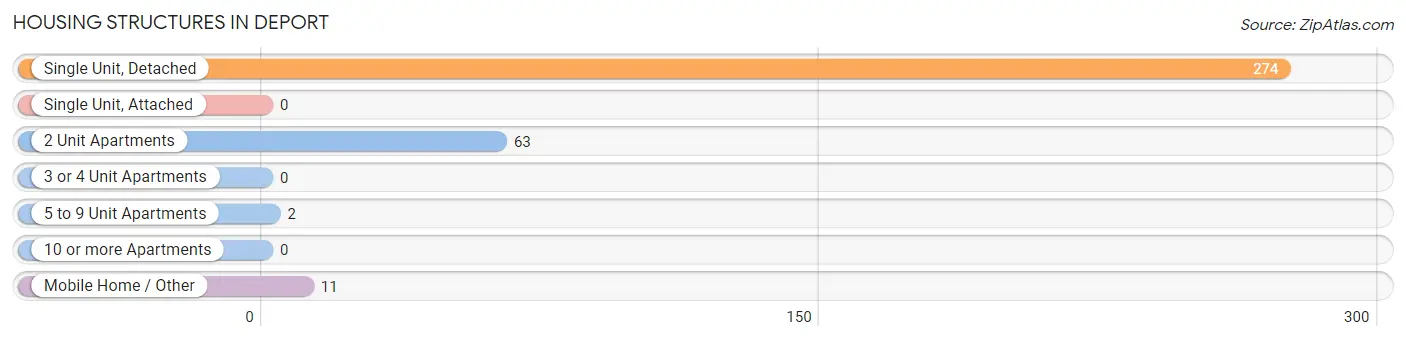
| Structure Type | # Housing Units | % Housing Units |
| Single Unit, Detached | 274 | 78.3% |
| Single Unit, Attached | 0 | 0.0% |
| 2 Unit Apartments | 63 | 18.0% |
| 3 or 4 Unit Apartments | 0 | 0.0% |
| 5 to 9 Unit Apartments | 2 | 0.6% |
| 10 or more Apartments | 0 | 0.0% |
| Mobile Home / Other | 11 | 3.1% |
| Total | 350 | 100.0% |
Housing Structures by Occupancy in Deport
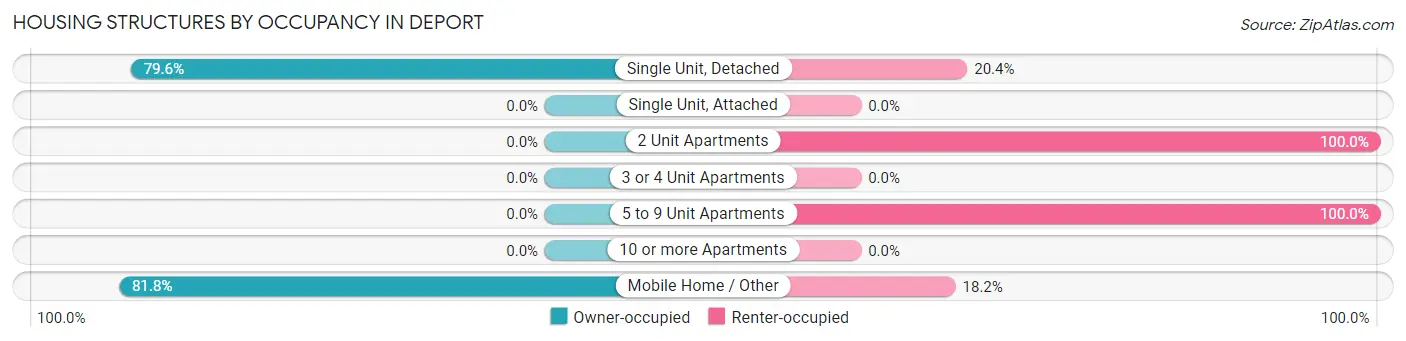
| Structure Type | Owner-occupied | Renter-occupied |
| Single Unit, Detached | 218 (79.6%) | 56 (20.4%) |
| Single Unit, Attached | 0 (0.0%) | 0 (0.0%) |
| 2 Unit Apartments | 0 (0.0%) | 63 (100.0%) |
| 3 or 4 Unit Apartments | 0 (0.0%) | 0 (0.0%) |
| 5 to 9 Unit Apartments | 0 (0.0%) | 2 (100.0%) |
| 10 or more Apartments | 0 (0.0%) | 0 (0.0%) |
| Mobile Home / Other | 9 (81.8%) | 2 (18.2%) |
| Total | 227 (64.9%) | 123 (35.1%) |
Housing Structures by Number of Rooms in Deport
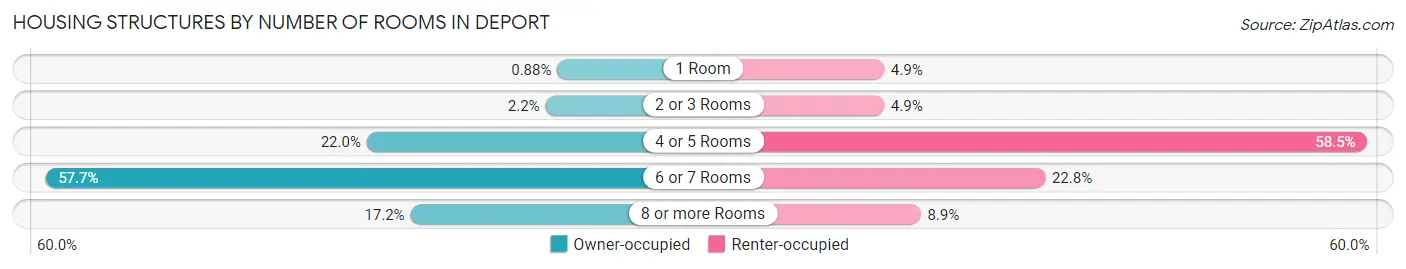
| Number of Rooms | Owner-occupied | Renter-occupied |
| 1 Room | 2 (0.9%) | 6 (4.9%) |
| 2 or 3 Rooms | 5 (2.2%) | 6 (4.9%) |
| 4 or 5 Rooms | 50 (22.0%) | 72 (58.5%) |
| 6 or 7 Rooms | 131 (57.7%) | 28 (22.8%) |
| 8 or more Rooms | 39 (17.2%) | 11 (8.9%) |
| Total | 227 (100.0%) | 123 (100.0%) |
Housing Structure by Heating Type in Deport
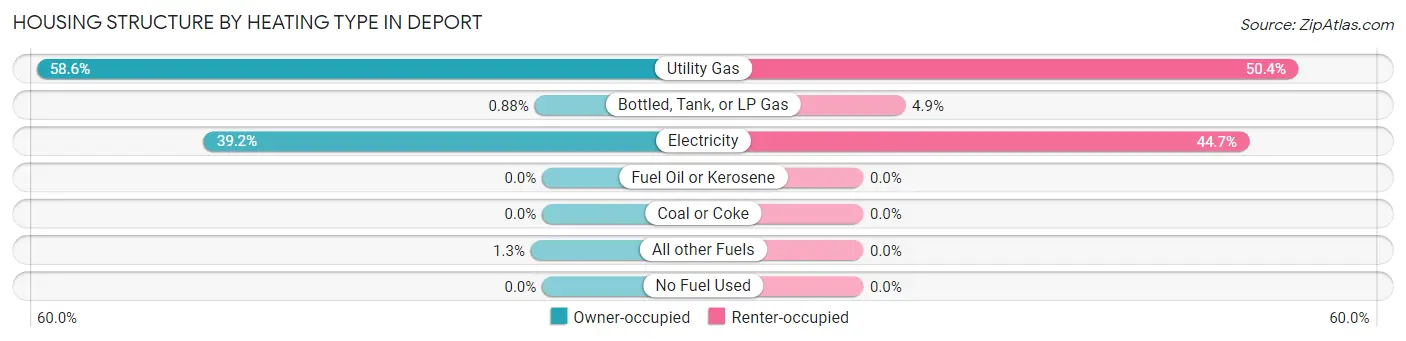
| Heating Type | Owner-occupied | Renter-occupied |
| Utility Gas | 133 (58.6%) | 62 (50.4%) |
| Bottled, Tank, or LP Gas | 2 (0.9%) | 6 (4.9%) |
| Electricity | 89 (39.2%) | 55 (44.7%) |
| Fuel Oil or Kerosene | 0 (0.0%) | 0 (0.0%) |
| Coal or Coke | 0 (0.0%) | 0 (0.0%) |
| All other Fuels | 3 (1.3%) | 0 (0.0%) |
| No Fuel Used | 0 (0.0%) | 0 (0.0%) |
| Total | 227 (100.0%) | 123 (100.0%) |
Household Vehicle Usage in Deport
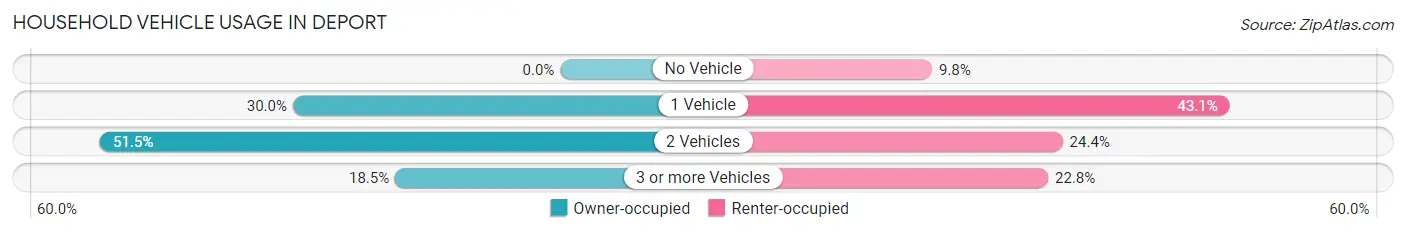
| Vehicles per Household | Owner-occupied | Renter-occupied |
| No Vehicle | 0 (0.0%) | 12 (9.8%) |
| 1 Vehicle | 68 (30.0%) | 53 (43.1%) |
| 2 Vehicles | 117 (51.5%) | 30 (24.4%) |
| 3 or more Vehicles | 42 (18.5%) | 28 (22.8%) |
| Total | 227 (100.0%) | 123 (100.0%) |
Real Estate & Mortgages in Deport
Real Estate and Mortgage Overview in Deport
| Characteristic | Without Mortgage | With Mortgage |
| Housing Units | 170 | 57 |
| Median Property Value | $58,000 | $89,200 |
| Median Household Income | $40,357 | $4 |
| Monthly Housing Costs | $460 | $9 |
| Real Estate Taxes | $500 | $9 |
Property Value by Mortgage Status in Deport
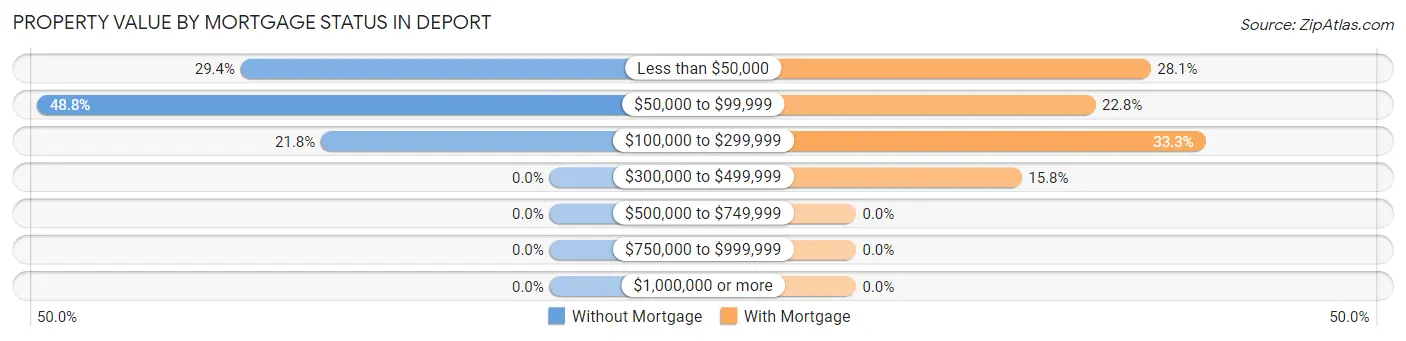
| Property Value | Without Mortgage | With Mortgage |
| Less than $50,000 | 50 (29.4%) | 16 (28.1%) |
| $50,000 to $99,999 | 83 (48.8%) | 13 (22.8%) |
| $100,000 to $299,999 | 37 (21.8%) | 19 (33.3%) |
| $300,000 to $499,999 | 0 (0.0%) | 9 (15.8%) |
| $500,000 to $749,999 | 0 (0.0%) | 0 (0.0%) |
| $750,000 to $999,999 | 0 (0.0%) | 0 (0.0%) |
| $1,000,000 or more | 0 (0.0%) | 0 (0.0%) |
| Total | 170 (100.0%) | 57 (100.0%) |
Household Income by Mortgage Status in Deport
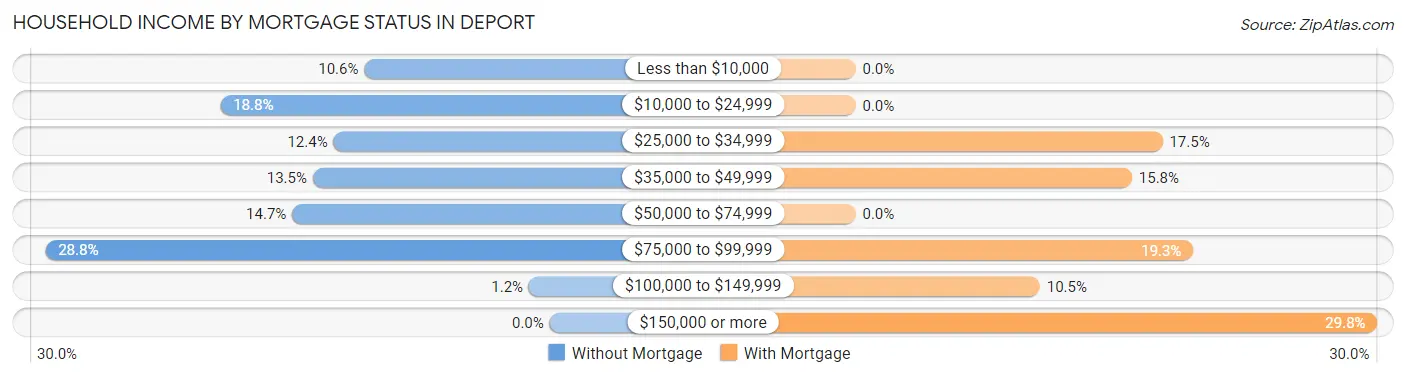
| Household Income | Without Mortgage | With Mortgage |
| Less than $10,000 | 18 (10.6%) | 0 (0.0%) |
| $10,000 to $24,999 | 32 (18.8%) | 0 (0.0%) |
| $25,000 to $34,999 | 21 (12.3%) | 10 (17.5%) |
| $35,000 to $49,999 | 23 (13.5%) | 9 (15.8%) |
| $50,000 to $74,999 | 25 (14.7%) | 0 (0.0%) |
| $75,000 to $99,999 | 49 (28.8%) | 11 (19.3%) |
| $100,000 to $149,999 | 2 (1.2%) | 6 (10.5%) |
| $150,000 or more | 0 (0.0%) | 17 (29.8%) |
| Total | 170 (100.0%) | 57 (100.0%) |
Property Value to Household Income Ratio in Deport
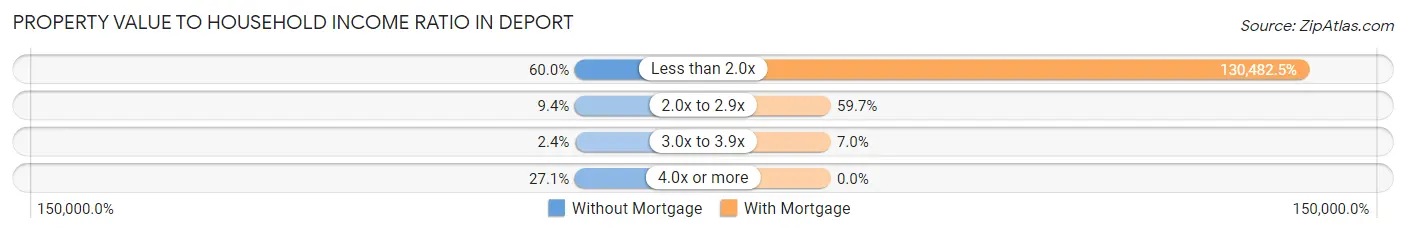
| Value-to-Income Ratio | Without Mortgage | With Mortgage |
| Less than 2.0x | 102 (60.0%) | 74,375 (130,482.5%) |
| 2.0x to 2.9x | 16 (9.4%) | 34 (59.7%) |
| 3.0x to 3.9x | 4 (2.4%) | 4 (7.0%) |
| 4.0x or more | 46 (27.1%) | 0 (0.0%) |
| Total | 170 (100.0%) | 57 (100.0%) |
Real Estate Taxes by Mortgage Status in Deport
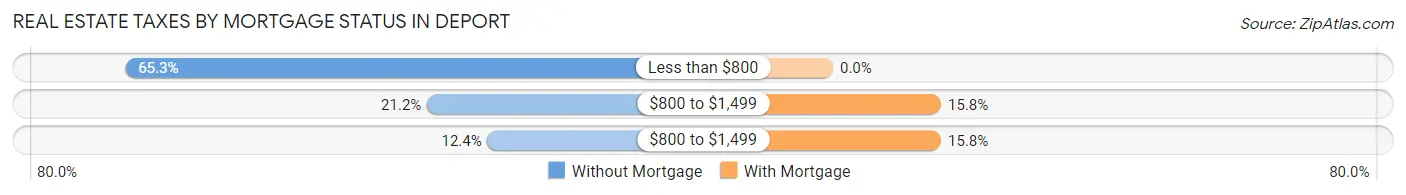
| Property Taxes | Without Mortgage | With Mortgage |
| Less than $800 | 111 (65.3%) | 0 (0.0%) |
| $800 to $1,499 | 36 (21.2%) | 9 (15.8%) |
| $800 to $1,499 | 21 (12.3%) | 9 (15.8%) |
| Total | 170 (100.0%) | 57 (100.0%) |
Health & Disability in Deport
Health Insurance Coverage by Age in Deport
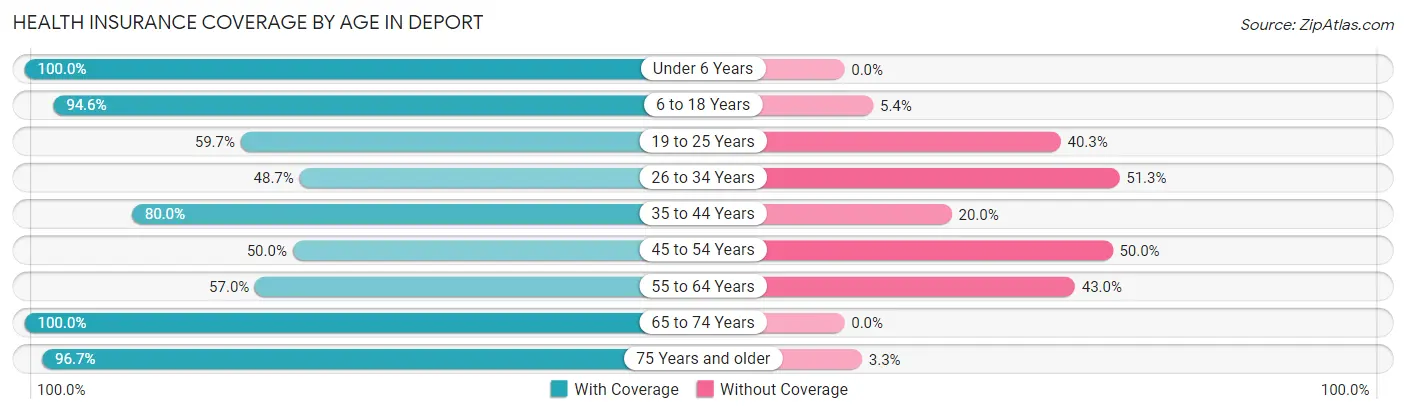
| Age Bracket | With Coverage | Without Coverage |
| Under 6 Years | 52 (100.0%) | 0 (0.0%) |
| 6 to 18 Years | 106 (94.6%) | 6 (5.4%) |
| 19 to 25 Years | 37 (59.7%) | 25 (40.3%) |
| 26 to 34 Years | 19 (48.7%) | 20 (51.3%) |
| 35 to 44 Years | 52 (80.0%) | 13 (20.0%) |
| 45 to 54 Years | 41 (50.0%) | 41 (50.0%) |
| 55 to 64 Years | 61 (57.0%) | 46 (43.0%) |
| 65 to 74 Years | 193 (100.0%) | 0 (0.0%) |
| 75 Years and older | 59 (96.7%) | 2 (3.3%) |
| Total | 620 (80.2%) | 153 (19.8%) |
Health Insurance Coverage by Citizenship Status in Deport

| Citizenship Status | With Coverage | Without Coverage |
| Native Born | 52 (100.0%) | 0 (0.0%) |
| Foreign Born, Citizen | 106 (94.6%) | 6 (5.4%) |
| Foreign Born, not a Citizen | 37 (59.7%) | 25 (40.3%) |
Health Insurance Coverage by Household Income in Deport
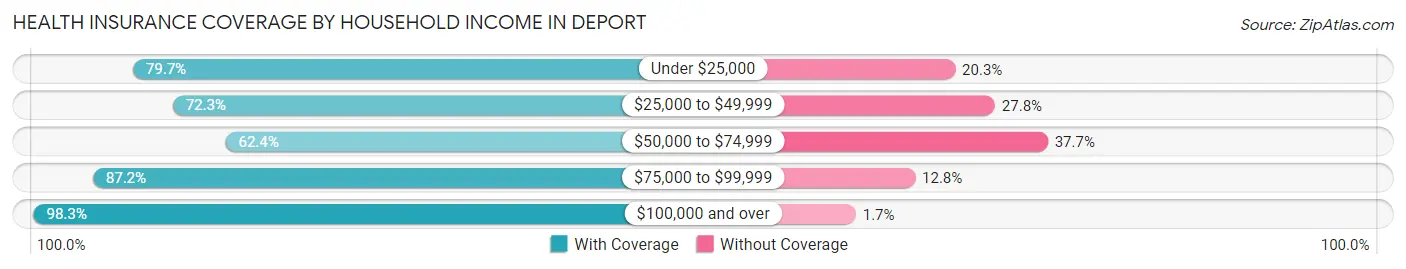
| Household Income | With Coverage | Without Coverage |
| Under $25,000 | 157 (79.7%) | 40 (20.3%) |
| $25,000 to $49,999 | 151 (72.3%) | 58 (27.8%) |
| $50,000 to $74,999 | 53 (62.4%) | 32 (37.7%) |
| $75,000 to $99,999 | 143 (87.2%) | 21 (12.8%) |
| $100,000 and over | 116 (98.3%) | 2 (1.7%) |
Public vs Private Health Insurance Coverage by Age in Deport
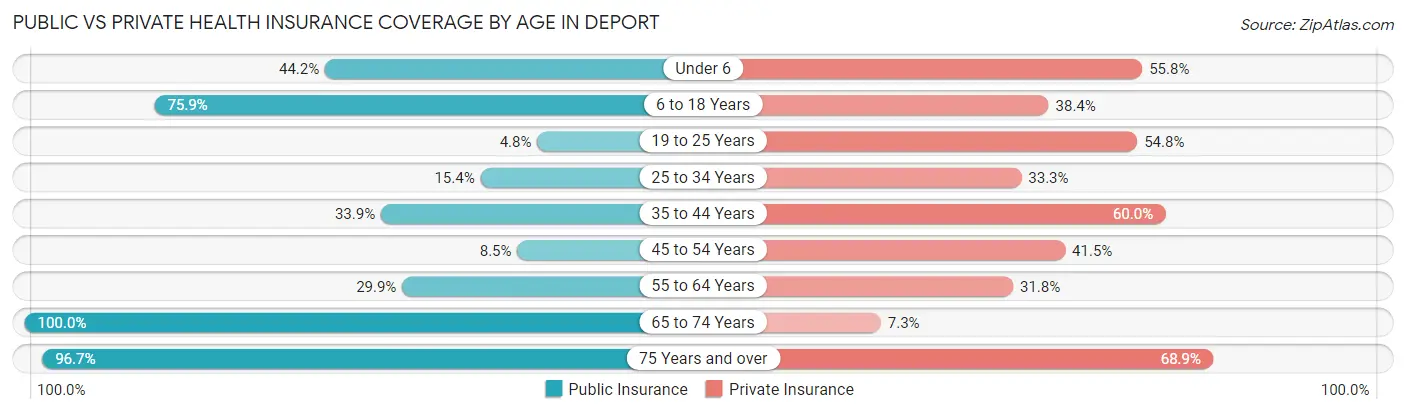
| Age Bracket | Public Insurance | Private Insurance |
| Under 6 | 23 (44.2%) | 29 (55.8%) |
| 6 to 18 Years | 85 (75.9%) | 43 (38.4%) |
| 19 to 25 Years | 3 (4.8%) | 34 (54.8%) |
| 25 to 34 Years | 6 (15.4%) | 13 (33.3%) |
| 35 to 44 Years | 22 (33.9%) | 39 (60.0%) |
| 45 to 54 Years | 7 (8.5%) | 34 (41.5%) |
| 55 to 64 Years | 32 (29.9%) | 34 (31.8%) |
| 65 to 74 Years | 193 (100.0%) | 14 (7.2%) |
| 75 Years and over | 59 (96.7%) | 42 (68.9%) |
| Total | 430 (55.6%) | 282 (36.5%) |
Disability Status by Sex by Age in Deport
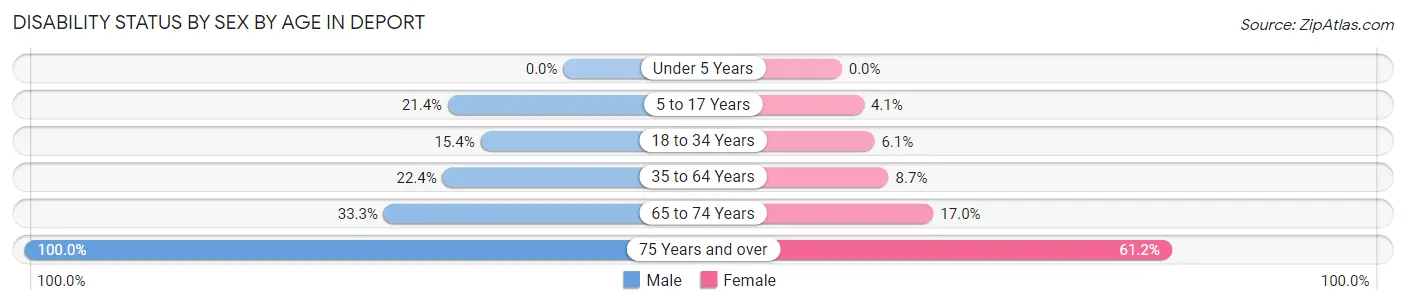
| Age Bracket | Male | Female |
| Under 5 Years | 0 (0.0%) | 0 (0.0%) |
| 5 to 17 Years | 6 (21.4%) | 4 (4.1%) |
| 18 to 34 Years | 6 (15.4%) | 4 (6.1%) |
| 35 to 64 Years | 26 (22.4%) | 12 (8.7%) |
| 65 to 74 Years | 31 (33.3%) | 17 (17.0%) |
| 75 Years and over | 12 (100.0%) | 30 (61.2%) |
Disability Class by Sex by Age in Deport
Disability Class: Hearing Difficulty
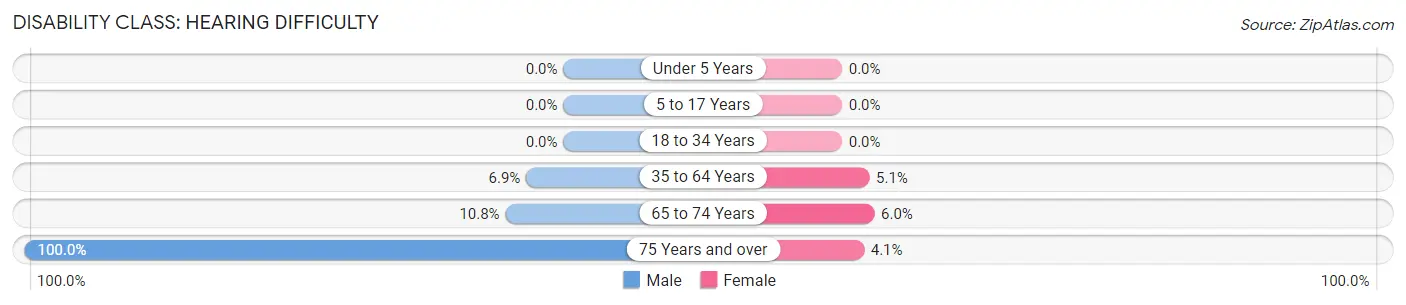
| Age Bracket | Male | Female |
| Under 5 Years | 0 (0.0%) | 0 (0.0%) |
| 5 to 17 Years | 0 (0.0%) | 0 (0.0%) |
| 18 to 34 Years | 0 (0.0%) | 0 (0.0%) |
| 35 to 64 Years | 8 (6.9%) | 7 (5.1%) |
| 65 to 74 Years | 10 (10.7%) | 6 (6.0%) |
| 75 Years and over | 12 (100.0%) | 2 (4.1%) |
Disability Class: Vision Difficulty
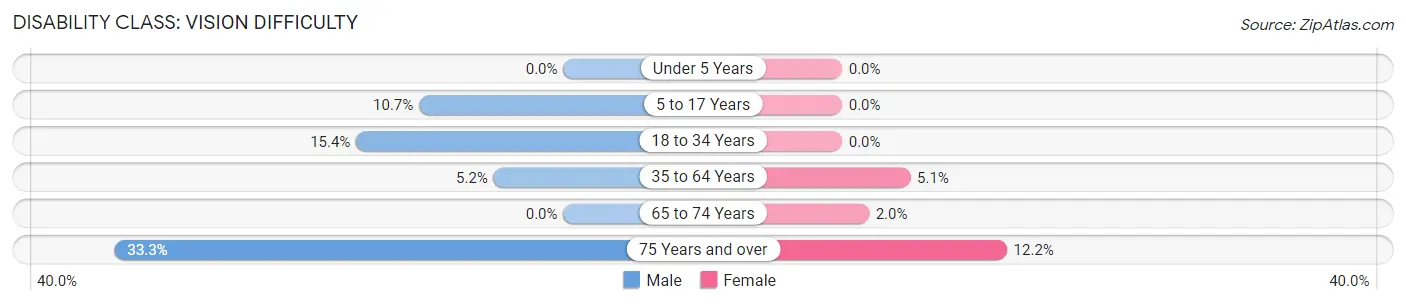
| Age Bracket | Male | Female |
| Under 5 Years | 0 (0.0%) | 0 (0.0%) |
| 5 to 17 Years | 3 (10.7%) | 0 (0.0%) |
| 18 to 34 Years | 6 (15.4%) | 0 (0.0%) |
| 35 to 64 Years | 6 (5.2%) | 7 (5.1%) |
| 65 to 74 Years | 0 (0.0%) | 2 (2.0%) |
| 75 Years and over | 4 (33.3%) | 6 (12.2%) |
Disability Class: Cognitive Difficulty
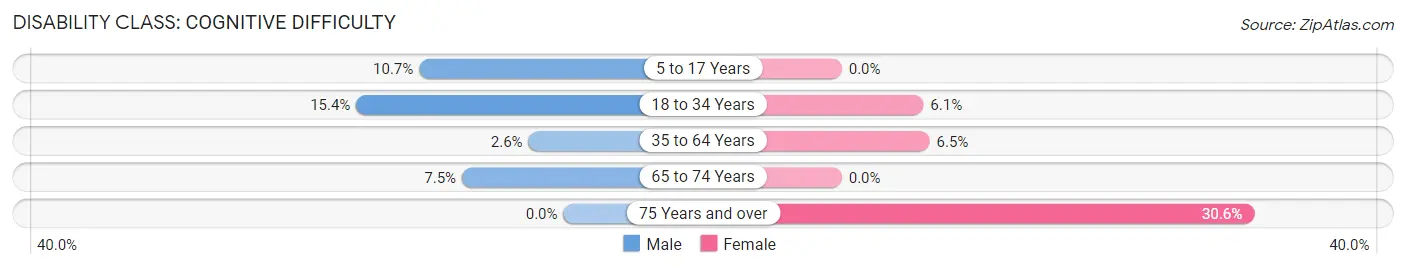
| Age Bracket | Male | Female |
| 5 to 17 Years | 3 (10.7%) | 0 (0.0%) |
| 18 to 34 Years | 6 (15.4%) | 4 (6.1%) |
| 35 to 64 Years | 3 (2.6%) | 9 (6.5%) |
| 65 to 74 Years | 7 (7.5%) | 0 (0.0%) |
| 75 Years and over | 0 (0.0%) | 15 (30.6%) |
Disability Class: Ambulatory Difficulty
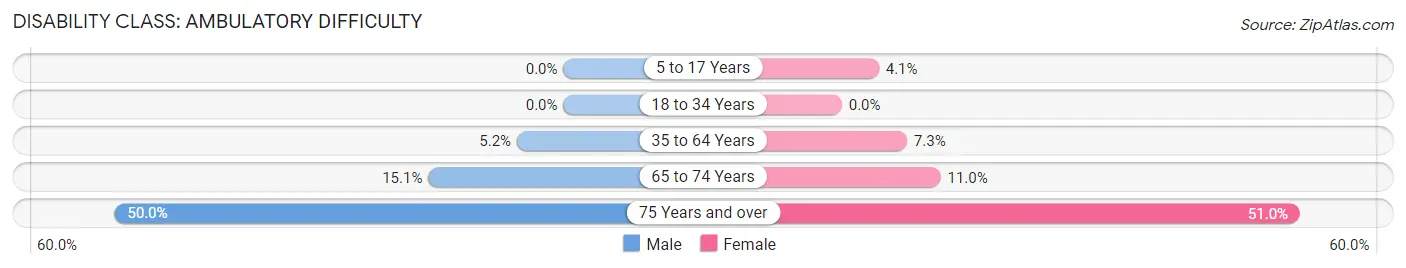
| Age Bracket | Male | Female |
| 5 to 17 Years | 0 (0.0%) | 4 (4.1%) |
| 18 to 34 Years | 0 (0.0%) | 0 (0.0%) |
| 35 to 64 Years | 6 (5.2%) | 10 (7.2%) |
| 65 to 74 Years | 14 (15.0%) | 11 (11.0%) |
| 75 Years and over | 6 (50.0%) | 25 (51.0%) |
Disability Class: Self-Care Difficulty

| Age Bracket | Male | Female |
| 5 to 17 Years | 3 (10.7%) | 0 (0.0%) |
| 18 to 34 Years | 0 (0.0%) | 0 (0.0%) |
| 35 to 64 Years | 12 (10.3%) | 7 (5.1%) |
| 65 to 74 Years | 7 (7.5%) | 0 (0.0%) |
| 75 Years and over | 0 (0.0%) | 0 (0.0%) |
Technology Access in Deport
Computing Device Access in Deport
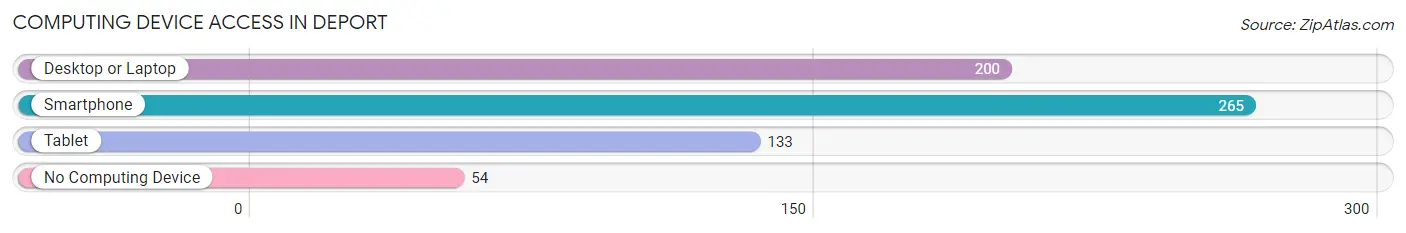
| Device Type | # Households | % Households |
| Desktop or Laptop | 200 | 57.1% |
| Smartphone | 265 | 75.7% |
| Tablet | 133 | 38.0% |
| No Computing Device | 54 | 15.4% |
| Total | 350 | 100.0% |
Internet Access in Deport
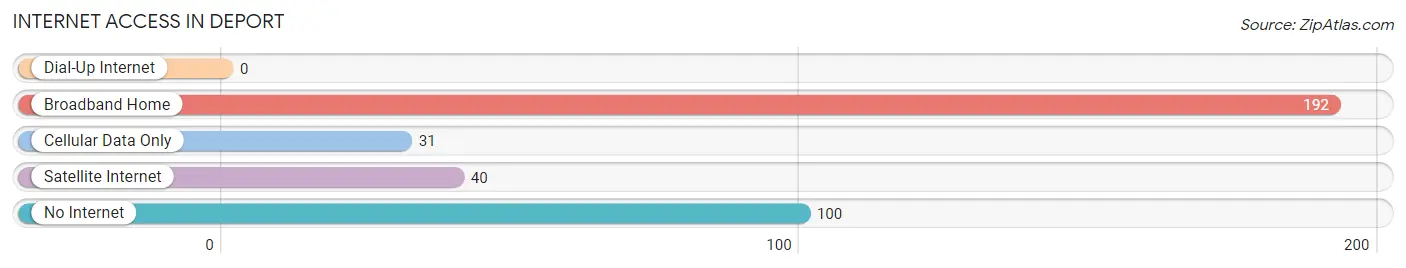
| Internet Type | # Households | % Households |
| Dial-Up Internet | 0 | 0.0% |
| Broadband Home | 192 | 54.9% |
| Cellular Data Only | 31 | 8.9% |
| Satellite Internet | 40 | 11.4% |
| No Internet | 100 | 28.6% |
| Total | 350 | 100.0% |
Deport Summary
Deport, Texas is a small town located in Lamar County, Texas. It is situated about 10 miles east of Paris, Texas and about 100 miles northeast of Dallas. The population of Deport was estimated to be 1,072 in 2019.
History
Deport was founded in 1873 by a group of settlers from Deport, Tennessee. The town was named after the Tennessee town, which was named after the French word for “deportation”. The settlers were looking for a place to start a new life and found the area to be suitable for farming and ranching.
The town was incorporated in 1876 and the first post office was established in 1877. The town grew slowly but steadily over the years and by the early 1900s, it had a population of around 500.
Deport was a thriving agricultural community in the early 1900s. Cotton was the main crop grown in the area and the town had several cotton gins and a cottonseed oil mill. The town also had a number of stores, a bank, a hotel, and a newspaper.
In the 1920s, the town began to decline as the cotton industry declined. The population dropped to around 300 by the 1940s. The town was able to survive the Great Depression and World War II, but the population continued to decline. By the 1970s, the population had dropped to around 200.
Geography
Deport is located in Lamar County, Texas. It is situated about 10 miles east of Paris, Texas and about 100 miles northeast of Dallas. The town is located in the Red River Valley, which is a fertile agricultural region. The terrain is mostly flat with some rolling hills. The climate is humid subtropical with hot summers and mild winters.
Economy
The economy of Deport is largely based on agriculture. Cotton is still the main crop grown in the area, but other crops such as corn, soybeans, and wheat are also grown. The town also has a number of small businesses, including a grocery store, a hardware store, and a few restaurants.
Demographics
The population of Deport was estimated to be 1,072 in 2019. The racial makeup of the town is 94.2% White, 2.2% African American, 0.7% Native American, 0.3% Asian, and 2.6% from other races. The median household income is $37,917 and the median home value is $90,000.
Conclusion
Deport, Texas is a small town located in Lamar County, Texas. It was founded in 1873 by a group of settlers from Deport, Tennessee and was once a thriving agricultural community. The town has a population of 1,072 and the economy is largely based on agriculture. The racial makeup of the town is 94.2% White, 2.2% African American, 0.7% Native American, 0.3% Asian, and 2.6% from other races. The median household income is $37,917 and the median home value is $90,000.
Common Questions
What is Per Capita Income in Deport?
Per Capita income in Deport is $25,441.
What is the Median Family Income in Deport?
Median Family Income in Deport is $39,345.
What is the Median Household income in Deport?
Median Household Income in Deport is $38,333.
What is Income or Wage Gap in Deport?
Income or Wage Gap in Deport is 11.7%.
Women in Deport earn 88.3 cents for every dollar earned by a man.
What is Inequality or Gini Index in Deport?
Inequality or Gini Index in Deport is 0.42.
What is the Total Population of Deport?
Total Population of Deport is 773.
What is the Total Male Population of Deport?
Total Male Population of Deport is 306.
What is the Total Female Population of Deport?
Total Female Population of Deport is 467.
What is the Ratio of Males per 100 Females in Deport?
There are 65.52 Males per 100 Females in Deport.
What is the Ratio of Females per 100 Males in Deport?
There are 152.61 Females per 100 Males in Deport.
What is the Median Population Age in Deport?
Median Population Age in Deport is 52.3 Years.
What is the Average Family Size in Deport
Average Family Size in Deport is 2.7 People.
What is the Average Household Size in Deport
Average Household Size in Deport is 2.2 People.
How Large is the Labor Force in Deport?
There are 335 People in the Labor Forcein in Deport.
What is the Percentage of People in the Labor Force in Deport?
54.3% of People are in the Labor Force in Deport.
What is the Unemployment Rate in Deport?
Unemployment Rate in Deport is 0.9%.