Dayton, TX Map & Demographics
Dayton Map
Dayton Overview
$32,719
PER CAPITA INCOME
$82,133
AVG FAMILY INCOME
$59,848
AVG HOUSEHOLD INCOME
39.8%
WAGE / INCOME GAP [ % ]
60.2¢/ $1
WAGE / INCOME GAP [ $ ]
$7,716
FAMILY INCOME DEFICIT
0.47
INEQUALITY / GINI INDEX
8,839
TOTAL POPULATION
4,164
MALE POPULATION
4,675
FEMALE POPULATION
89.07
MALES / 100 FEMALES
112.27
FEMALES / 100 MALES
32.4
MEDIAN AGE
3.5
AVG FAMILY SIZE
2.7
AVG HOUSEHOLD SIZE
4,054
LABOR FORCE [ PEOPLE ]
59.7%
PERCENT IN LABOR FORCE
3.5%
UNEMPLOYMENT RATE
Dayton Zip Codes
Income in Dayton
Income Overview in Dayton
Per Capita Income in Dayton is $32,719, while median incomes of families and households are $82,133 and $59,848 respectively.
| Characteristic | Number | Measure |
| Per Capita Income | 8,839 | $32,719 |
| Median Family Income | 2,026 | $82,133 |
| Mean Family Income | 2,026 | $104,962 |
| Median Household Income | 3,043 | $59,848 |
| Mean Household Income | 3,043 | $89,287 |
| Income Deficit | 2,026 | $7,716 |
| Wage / Income Gap (%) | 8,839 | 39.78% |
| Wage / Income Gap ($) | 8,839 | 60.22¢ per $1 |
| Gini / Inequality Index | 8,839 | 0.47 |
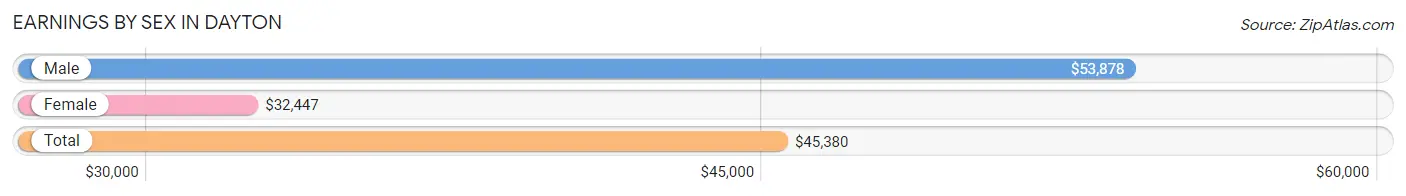
Earnings by Sex in Dayton
Average Earnings in Dayton are $45,380, $53,878 for men and $32,447 for women, a difference of 39.8%.
| Sex | Number | Average Earnings |
| Male | 2,316 (53.8%) | $53,878 |
| Female | 1,986 (46.2%) | $32,447 |
| Total | 4,302 (100.0%) | $45,380 |
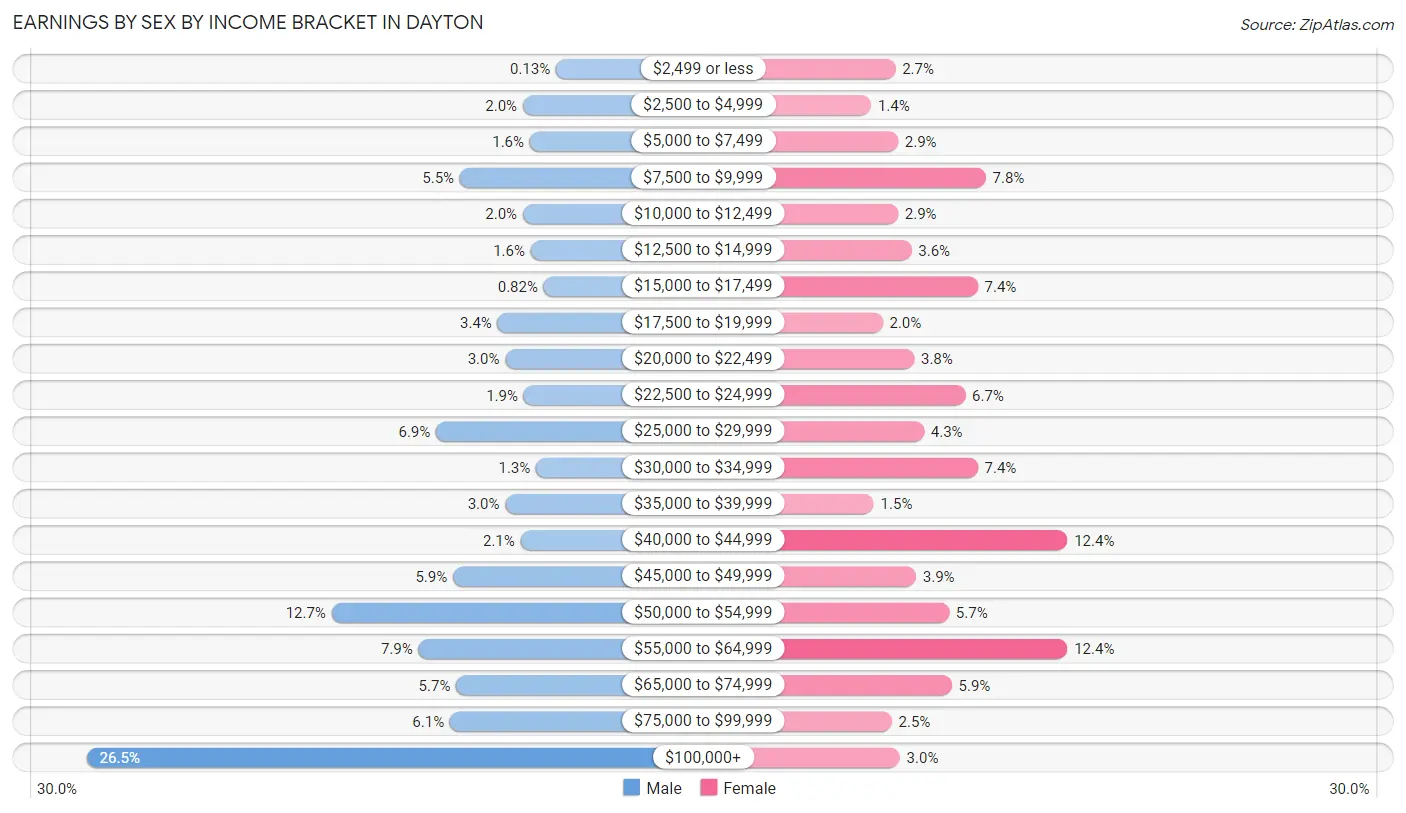
Earnings by Sex by Income Bracket in Dayton
The most common earnings brackets in Dayton are $100,000+ for men (614 | 26.5%) and $40,000 to $44,999 for women (246 | 12.4%).
| Income | Male | Female |
| $2,499 or less | 3 (0.1%) | 54 (2.7%) |
| $2,500 to $4,999 | 46 (2.0%) | 27 (1.4%) |
| $5,000 to $7,499 | 37 (1.6%) | 57 (2.9%) |
| $7,500 to $9,999 | 128 (5.5%) | 155 (7.8%) |
| $10,000 to $12,499 | 46 (2.0%) | 57 (2.9%) |
| $12,500 to $14,999 | 36 (1.5%) | 72 (3.6%) |
| $15,000 to $17,499 | 19 (0.8%) | 146 (7.3%) |
| $17,500 to $19,999 | 79 (3.4%) | 40 (2.0%) |
| $20,000 to $22,499 | 69 (3.0%) | 75 (3.8%) |
| $22,500 to $24,999 | 45 (1.9%) | 132 (6.7%) |
| $25,000 to $29,999 | 159 (6.9%) | 86 (4.3%) |
| $30,000 to $34,999 | 29 (1.3%) | 146 (7.3%) |
| $35,000 to $39,999 | 69 (3.0%) | 30 (1.5%) |
| $40,000 to $44,999 | 49 (2.1%) | 246 (12.4%) |
| $45,000 to $49,999 | 137 (5.9%) | 77 (3.9%) |
| $50,000 to $54,999 | 295 (12.7%) | 114 (5.7%) |
| $55,000 to $64,999 | 182 (7.9%) | 246 (12.4%) |
| $65,000 to $74,999 | 133 (5.7%) | 117 (5.9%) |
| $75,000 to $99,999 | 141 (6.1%) | 50 (2.5%) |
| $100,000+ | 614 (26.5%) | 59 (3.0%) |
| Total | 2,316 (100.0%) | 1,986 (100.0%) |
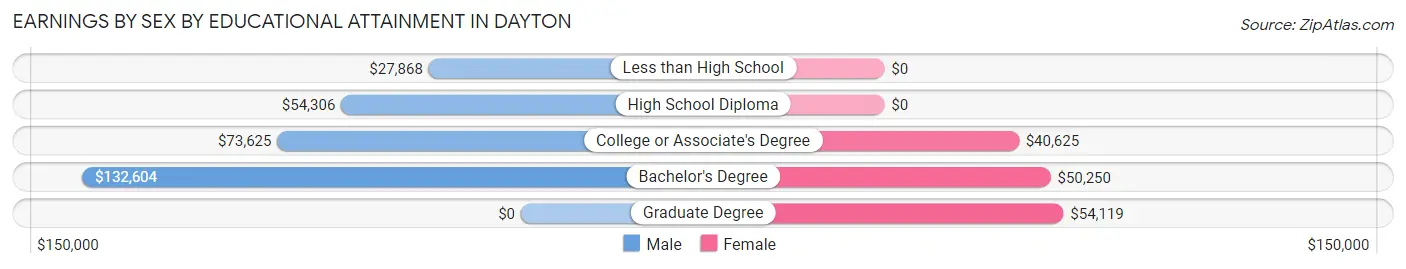
Earnings by Sex by Educational Attainment in Dayton
Average earnings in Dayton are $54,901 for men and $37,708 for women, a difference of 31.3%. Men with an educational attainment of bachelor's degree enjoy the highest average annual earnings of $132,604, while those with less than high school education earn the least with $27,868. Women with an educational attainment of graduate degree earn the most with the average annual earnings of $54,119, while those with college or associate's degree education have the smallest earnings of $40,625.
| Educational Attainment | Male Income | Female Income |
| Less than High School | $27,868 | $0 |
| High School Diploma | $54,306 | $0 |
| College or Associate's Degree | $73,625 | $40,625 |
| Bachelor's Degree | $132,604 | $50,250 |
| Graduate Degree | - | - |
| Total | $54,901 | $37,708 |
Family Income in Dayton
Family Income Brackets in Dayton
According to the Dayton family income data, there are 511 families falling into the $50,000 to $74,999 income range, which is the most common income bracket and makes up 25.2% of all families. Conversely, the $35,000 to $49,999 income bracket is the least frequent group with only 34 families (1.7%) belonging to this category.
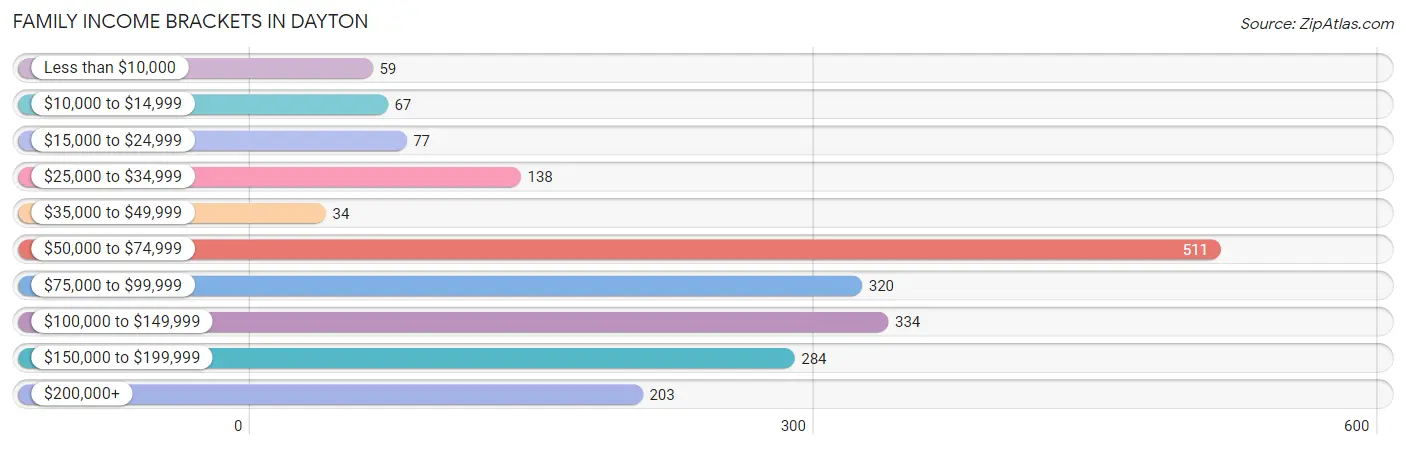
| Income Bracket | # Families | % Families |
| Less than $10,000 | 59 | 2.9% |
| $10,000 to $14,999 | 67 | 3.3% |
| $15,000 to $24,999 | 77 | 3.8% |
| $25,000 to $34,999 | 138 | 6.8% |
| $35,000 to $49,999 | 34 | 1.7% |
| $50,000 to $74,999 | 511 | 25.2% |
| $75,000 to $99,999 | 320 | 15.8% |
| $100,000 to $149,999 | 334 | 16.5% |
| $150,000 to $199,999 | 284 | 14.0% |
| $200,000+ | 203 | 10.0% |
Family Income by Famaliy Size in Dayton
6-person families (39 | 1.9%) account for the highest median family income in Dayton with $136,964 per family, while 2-person families (750 | 37.0%) have the highest median income of $46,796 per family member.
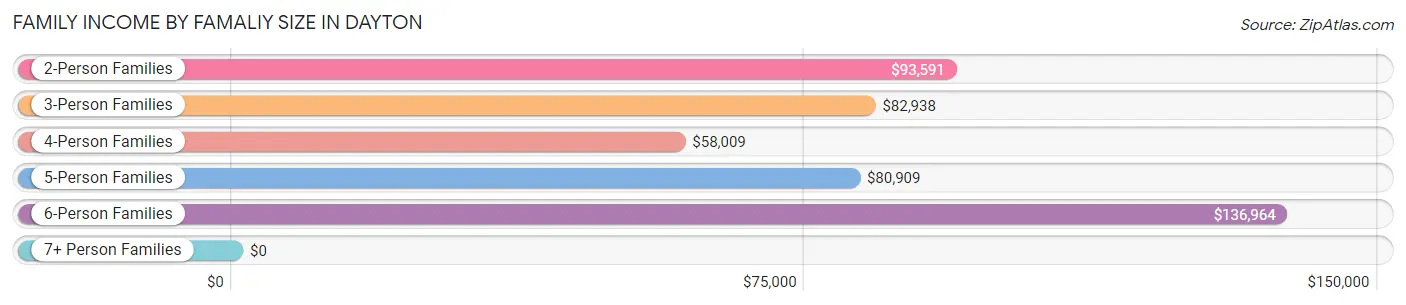
| Income Bracket | # Families | Median Income |
| 2-Person Families | 750 (37.0%) | $93,591 |
| 3-Person Families | 559 (27.6%) | $82,938 |
| 4-Person Families | 397 (19.6%) | $58,009 |
| 5-Person Families | 248 (12.2%) | $80,909 |
| 6-Person Families | 39 (1.9%) | $136,964 |
| 7+ Person Families | 33 (1.6%) | $0 |
| Total | 2,026 (100.0%) | $82,133 |
Family Income by Number of Earners in Dayton
The median family income in Dayton is $82,133, with families comprising 3+ earners (132) having the highest median family income of $234,191, while families with 1 earner (857) have the lowest median family income of $54,842, accounting for 6.5% and 42.3% of families, respectively.
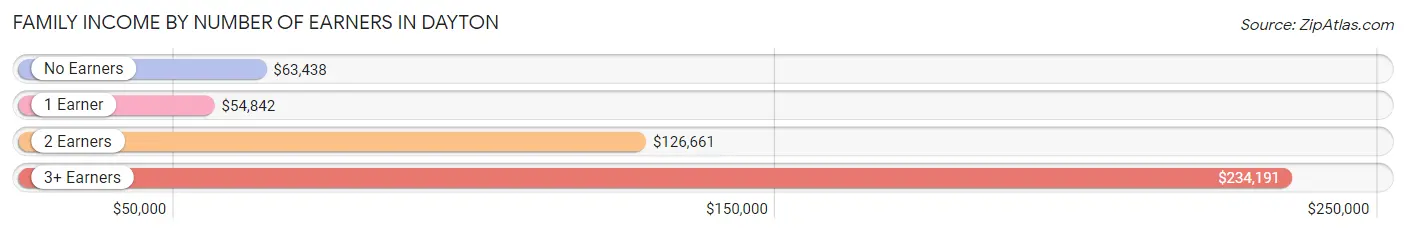
| Number of Earners | # Families | Median Income |
| No Earners | 250 (12.3%) | $63,438 |
| 1 Earner | 857 (42.3%) | $54,842 |
| 2 Earners | 787 (38.9%) | $126,661 |
| 3+ Earners | 132 (6.5%) | $234,191 |
| Total | 2,026 (100.0%) | $82,133 |
Household Income in Dayton
Household Income Brackets in Dayton
With 578 households falling in the category, the $50,000 to $74,999 income range is the most frequent in Dayton, accounting for 19.0% of all households. In contrast, only 167 households (5.5%) fall into the $35,000 to $49,999 income bracket, making it the least populous group.
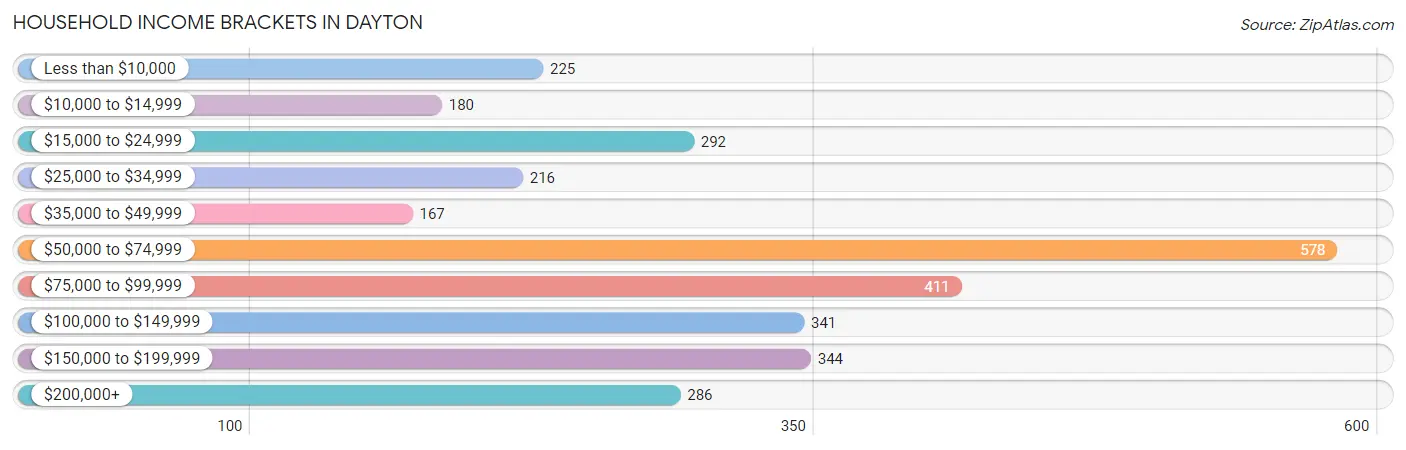
| Income Bracket | # Households | % Households |
| Less than $10,000 | 225 | 7.4% |
| $10,000 to $14,999 | 180 | 5.9% |
| $15,000 to $24,999 | 292 | 9.6% |
| $25,000 to $34,999 | 216 | 7.1% |
| $35,000 to $49,999 | 167 | 5.5% |
| $50,000 to $74,999 | 578 | 19.0% |
| $75,000 to $99,999 | 411 | 13.5% |
| $100,000 to $149,999 | 341 | 11.2% |
| $150,000 to $199,999 | 344 | 11.3% |
| $200,000+ | 286 | 9.4% |
Household Income by Householder Age in Dayton
The median household income in Dayton is $59,848, with the highest median household income of $93,227 found in the 15 to 24 years age bracket for the primary householder. A total of 78 households (2.6%) fall into this category. Meanwhile, the 65+ years age bracket for the primary householder has the lowest median household income of $54,160, with 719 households (23.6%) in this group.
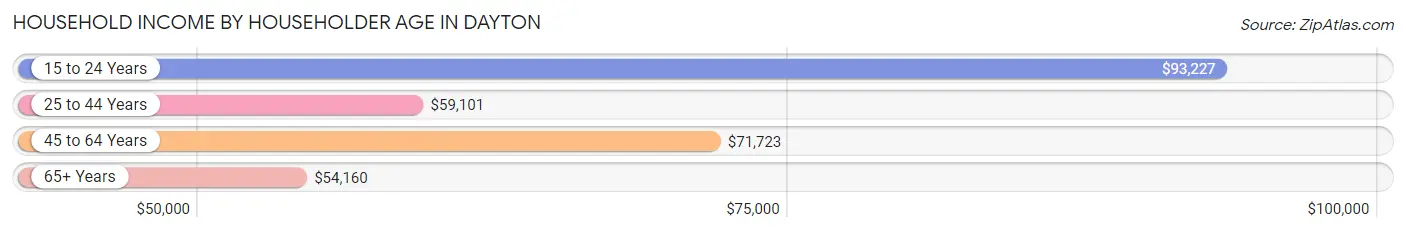
| Income Bracket | # Households | Median Income |
| 15 to 24 Years | 78 (2.6%) | $93,227 |
| 25 to 44 Years | 1,137 (37.4%) | $59,101 |
| 45 to 64 Years | 1,109 (36.4%) | $71,723 |
| 65+ Years | 719 (23.6%) | $54,160 |
| Total | 3,043 (100.0%) | $59,848 |
Poverty in Dayton
Income Below Poverty by Sex and Age in Dayton
With 15.5% poverty level for males and 18.0% for females among the residents of Dayton, 15 year old males and 6 to 11 year old females are the most vulnerable to poverty, with 33 males (61.1%) and 206 females (38.9%) in their respective age groups living below the poverty level.
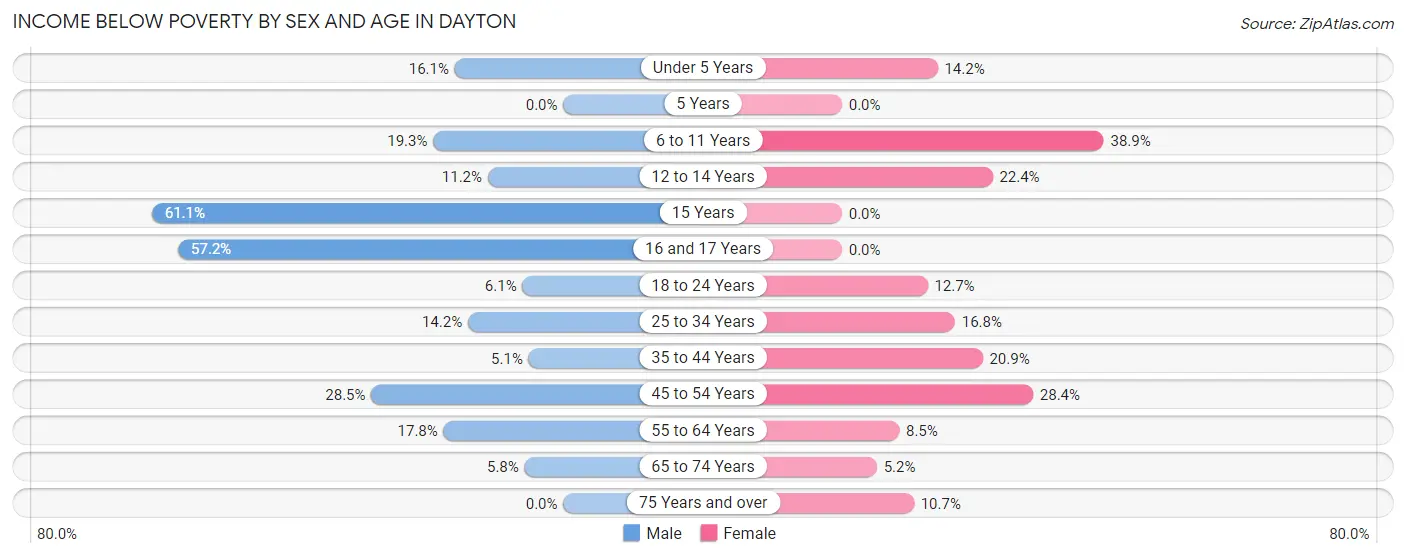
| Age Bracket | Male | Female |
| Under 5 Years | 74 (16.1%) | 27 (14.2%) |
| 5 Years | 0 (0.0%) | 0 (0.0%) |
| 6 to 11 Years | 28 (19.3%) | 206 (38.9%) |
| 12 to 14 Years | 24 (11.2%) | 51 (22.4%) |
| 15 Years | 33 (61.1%) | 0 (0.0%) |
| 16 and 17 Years | 91 (57.2%) | 0 (0.0%) |
| 18 to 24 Years | 21 (6.1%) | 29 (12.7%) |
| 25 to 34 Years | 115 (14.2%) | 142 (16.8%) |
| 35 to 44 Years | 19 (5.1%) | 108 (20.9%) |
| 45 to 54 Years | 128 (28.5%) | 120 (28.4%) |
| 55 to 64 Years | 72 (17.8%) | 39 (8.5%) |
| 65 to 74 Years | 25 (5.8%) | 26 (5.2%) |
| 75 Years and over | 0 (0.0%) | 22 (10.7%) |
| Total | 630 (15.5%) | 770 (18.0%) |
Income Above Poverty by Sex and Age in Dayton
According to the poverty statistics in Dayton, males aged 5 years and females aged 5 years are the age groups that are most secure financially, with 100.0% of males and 100.0% of females in these age groups living above the poverty line.
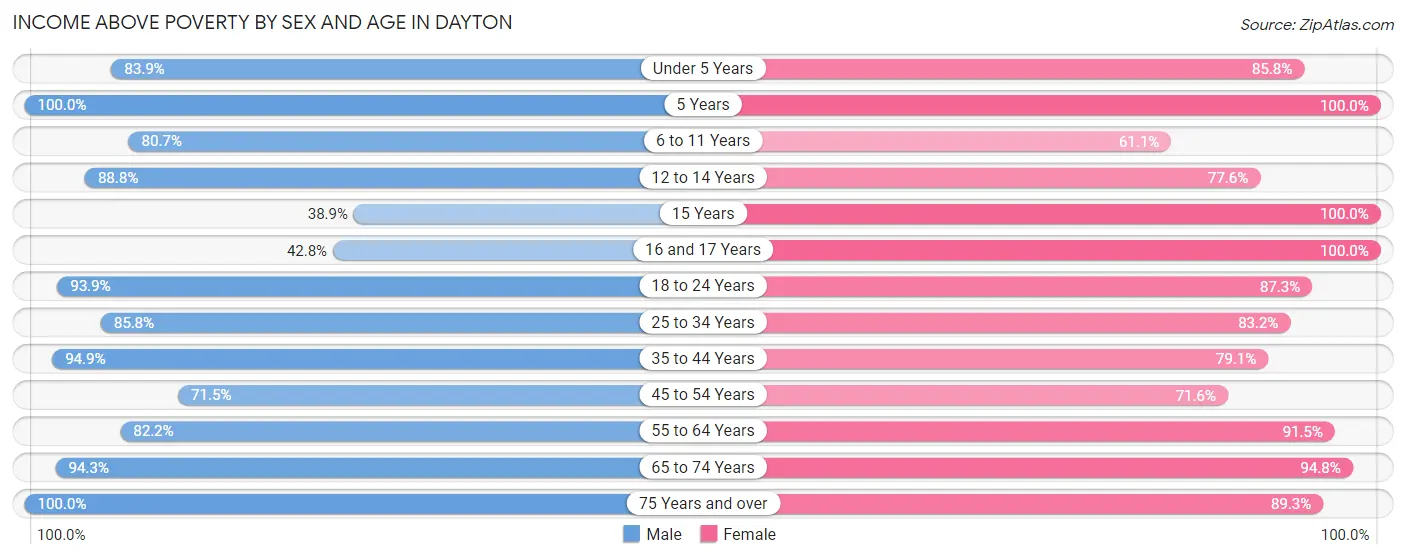
| Age Bracket | Male | Female |
| Under 5 Years | 385 (83.9%) | 163 (85.8%) |
| 5 Years | 160 (100.0%) | 46 (100.0%) |
| 6 to 11 Years | 117 (80.7%) | 324 (61.1%) |
| 12 to 14 Years | 190 (88.8%) | 177 (77.6%) |
| 15 Years | 21 (38.9%) | 23 (100.0%) |
| 16 and 17 Years | 68 (42.8%) | 76 (100.0%) |
| 18 to 24 Years | 325 (93.9%) | 199 (87.3%) |
| 25 to 34 Years | 697 (85.8%) | 704 (83.2%) |
| 35 to 44 Years | 351 (94.9%) | 409 (79.1%) |
| 45 to 54 Years | 321 (71.5%) | 303 (71.6%) |
| 55 to 64 Years | 333 (82.2%) | 420 (91.5%) |
| 65 to 74 Years | 410 (94.3%) | 475 (94.8%) |
| 75 Years and over | 64 (100.0%) | 184 (89.3%) |
| Total | 3,442 (84.5%) | 3,503 (82.0%) |
Income Below Poverty Among Married-Couple Families in Dayton
The poverty statistics for married-couple families in Dayton show that 8.9% or 138 of the total 1,550 families live below the poverty line. Families with 3 or 4 children have the highest poverty rate of 39.9%, comprising of 79 families. On the other hand, families with 1 or 2 children have the lowest poverty rate of 0.0%, which includes 0 families.
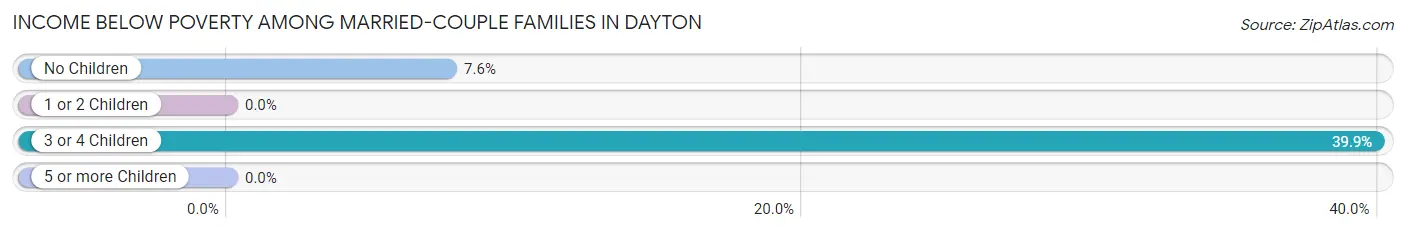
| Children | Above Poverty | Below Poverty |
| No Children | 714 (92.4%) | 59 (7.6%) |
| 1 or 2 Children | 579 (100.0%) | 0 (0.0%) |
| 3 or 4 Children | 119 (60.1%) | 79 (39.9%) |
| 5 or more Children | 0 (0.0%) | 0 (0.0%) |
| Total | 1,412 (91.1%) | 138 (8.9%) |
Income Below Poverty Among Single-Parent Households in Dayton
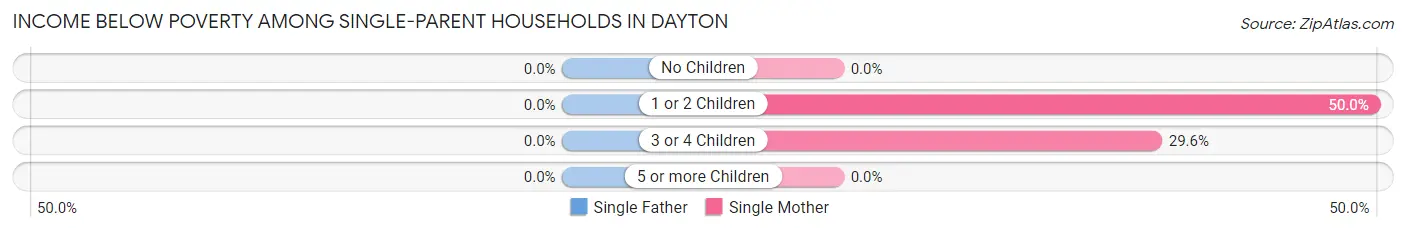
| Children | Single Father | Single Mother |
| No Children | 0 (0.0%) | 0 (0.0%) |
| 1 or 2 Children | 0 (0.0%) | 119 (50.0%) |
| 3 or 4 Children | 0 (0.0%) | 24 (29.6%) |
| 5 or more Children | 0 (0.0%) | 0 (0.0%) |
| Total | 0 (0.0%) | 143 (30.0%) |
Income Below Poverty Among Married-Couple vs Single-Parent Households in Dayton
The poverty data for Dayton shows that 138 of the married-couple family households (8.9%) and 143 of the single-parent households (30.0%) are living below the poverty level. Within the married-couple family households, those with 3 or 4 children have the highest poverty rate, with 79 households (39.9%) falling below the poverty line. Among the single-parent households, those with 1 or 2 children have the highest poverty rate, with 119 household (50.0%) living below poverty.
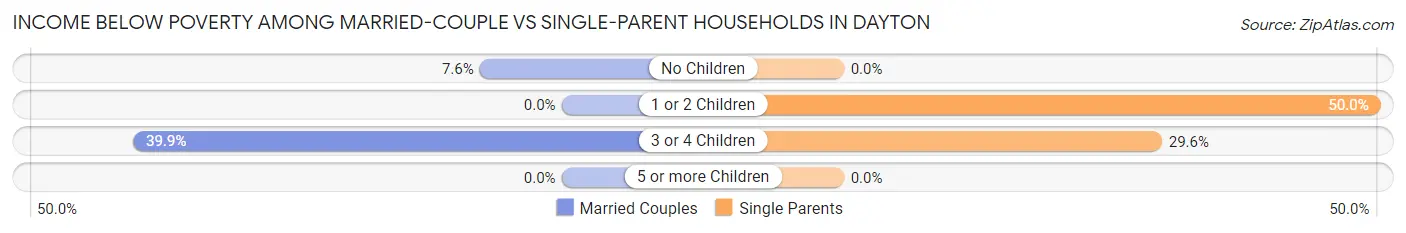
| Children | Married-Couple Families | Single-Parent Households |
| No Children | 59 (7.6%) | 0 (0.0%) |
| 1 or 2 Children | 0 (0.0%) | 119 (50.0%) |
| 3 or 4 Children | 79 (39.9%) | 24 (29.6%) |
| 5 or more Children | 0 (0.0%) | 0 (0.0%) |
| Total | 138 (8.9%) | 143 (30.0%) |
Race in Dayton
The most populous races in Dayton are White / Caucasian (6,000 | 67.9%), Hispanic or Latino (2,165 | 24.5%), and Black / African American (1,086 | 12.3%).
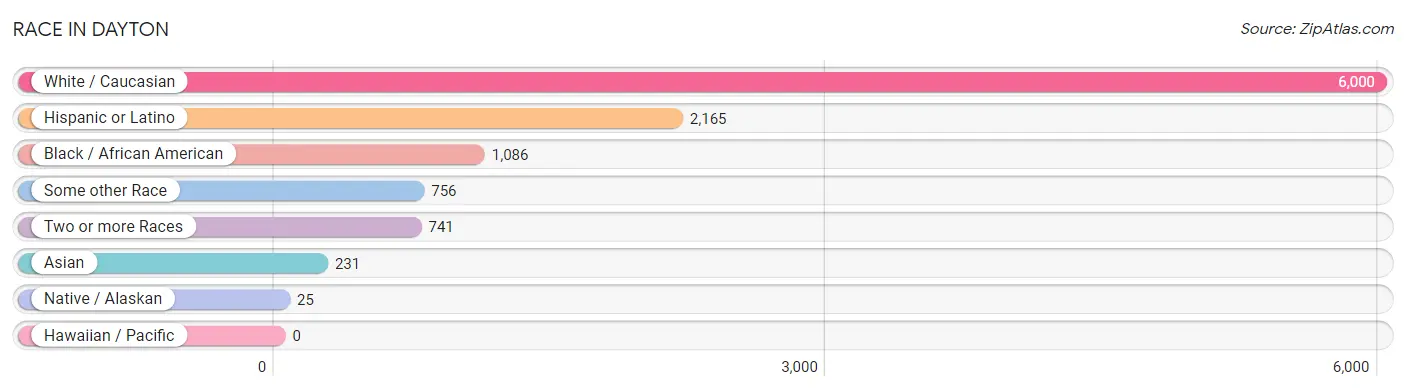
| Race | # Population | % Population |
| Asian | 231 | 2.6% |
| Black / African American | 1,086 | 12.3% |
| Hawaiian / Pacific | 0 | 0.0% |
| Hispanic or Latino | 2,165 | 24.5% |
| Native / Alaskan | 25 | 0.3% |
| White / Caucasian | 6,000 | 67.9% |
| Two or more Races | 741 | 8.4% |
| Some other Race | 756 | 8.6% |
| Total | 8,839 | 100.0% |
Ancestry in Dayton
The most populous ancestries reported in Dayton are Mexican (1,819 | 20.6%), English (673 | 7.6%), German (606 | 6.9%), Irish (573 | 6.5%), and American (484 | 5.5%), together accounting for 47.0% of all Dayton residents.
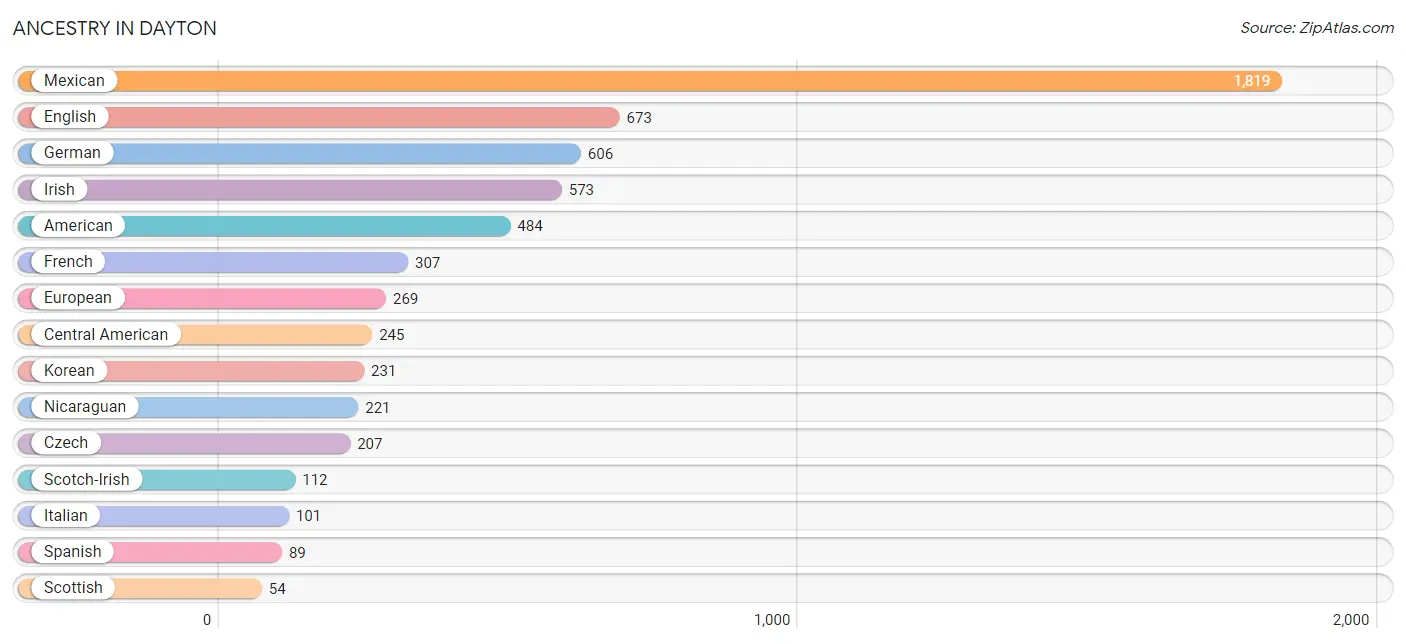
| Ancestry | # Population | % Population |
| American | 484 | 5.5% |
| British | 37 | 0.4% |
| Central American | 245 | 2.8% |
| Cherokee | 21 | 0.2% |
| Czech | 207 | 2.3% |
| Dutch | 4 | 0.1% |
| English | 673 | 7.6% |
| European | 269 | 3.0% |
| French | 307 | 3.5% |
| French Canadian | 18 | 0.2% |
| German | 606 | 6.9% |
| Haitian | 17 | 0.2% |
| Honduran | 24 | 0.3% |
| Irish | 573 | 6.5% |
| Italian | 101 | 1.1% |
| Korean | 231 | 2.6% |
| Mexican | 1,819 | 20.6% |
| Mexican American Indian | 16 | 0.2% |
| Navajo | 12 | 0.1% |
| Nicaraguan | 221 | 2.5% |
| Nigerian | 29 | 0.3% |
| Polish | 6 | 0.1% |
| Scotch-Irish | 112 | 1.3% |
| Scottish | 54 | 0.6% |
| Spaniard | 12 | 0.1% |
| Spanish | 89 | 1.0% |
| Subsaharan African | 29 | 0.3% |
| Swedish | 29 | 0.3% |
| Welsh | 18 | 0.2% | View All 29 Rows |
Immigrants in Dayton
The most numerous immigrant groups reported in Dayton came from Latin America (811 | 9.2%), Central America (781 | 8.8%), Mexico (702 | 7.9%), Asia (231 | 2.6%), and Philippines (231 | 2.6%), together accounting for 31.2% of all Dayton residents.
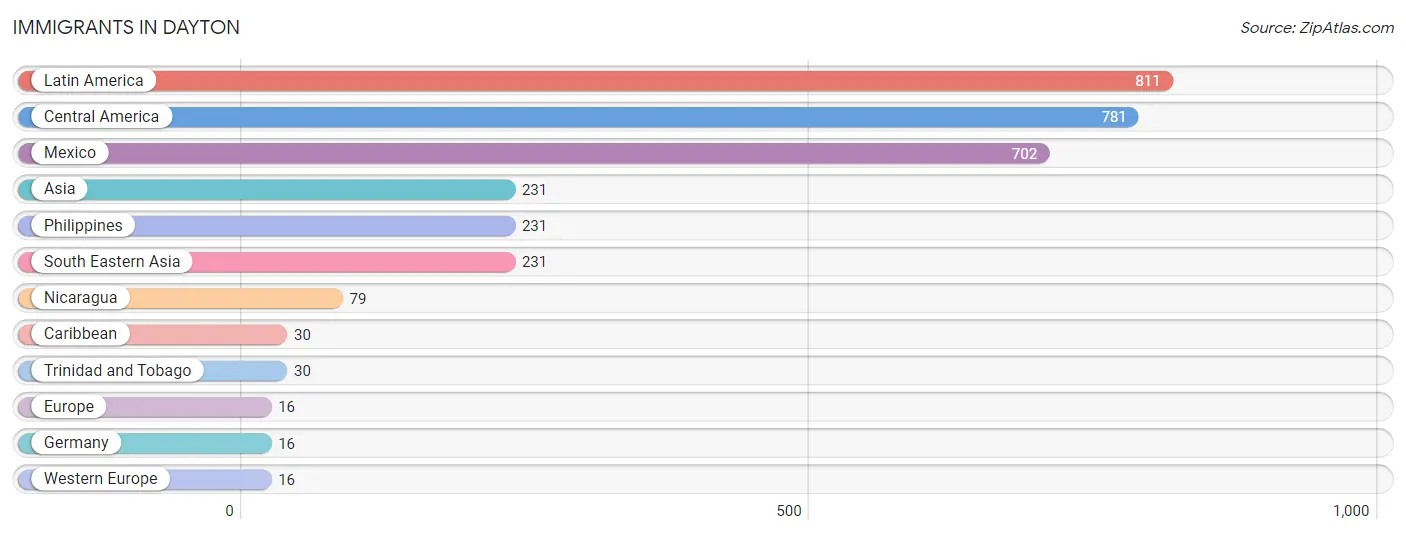
| Immigration Origin | # Population | % Population |
| Asia | 231 | 2.6% |
| Caribbean | 30 | 0.3% |
| Central America | 781 | 8.8% |
| Europe | 16 | 0.2% |
| Germany | 16 | 0.2% |
| Latin America | 811 | 9.2% |
| Mexico | 702 | 7.9% |
| Nicaragua | 79 | 0.9% |
| Philippines | 231 | 2.6% |
| South Eastern Asia | 231 | 2.6% |
| Trinidad and Tobago | 30 | 0.3% |
| Western Europe | 16 | 0.2% | View All 12 Rows |
Sex and Age in Dayton
Sex and Age in Dayton
The most populous age groups in Dayton are 30 to 34 Years (535 | 12.9%) for men and 25 to 29 Years (535 | 11.4%) for women.
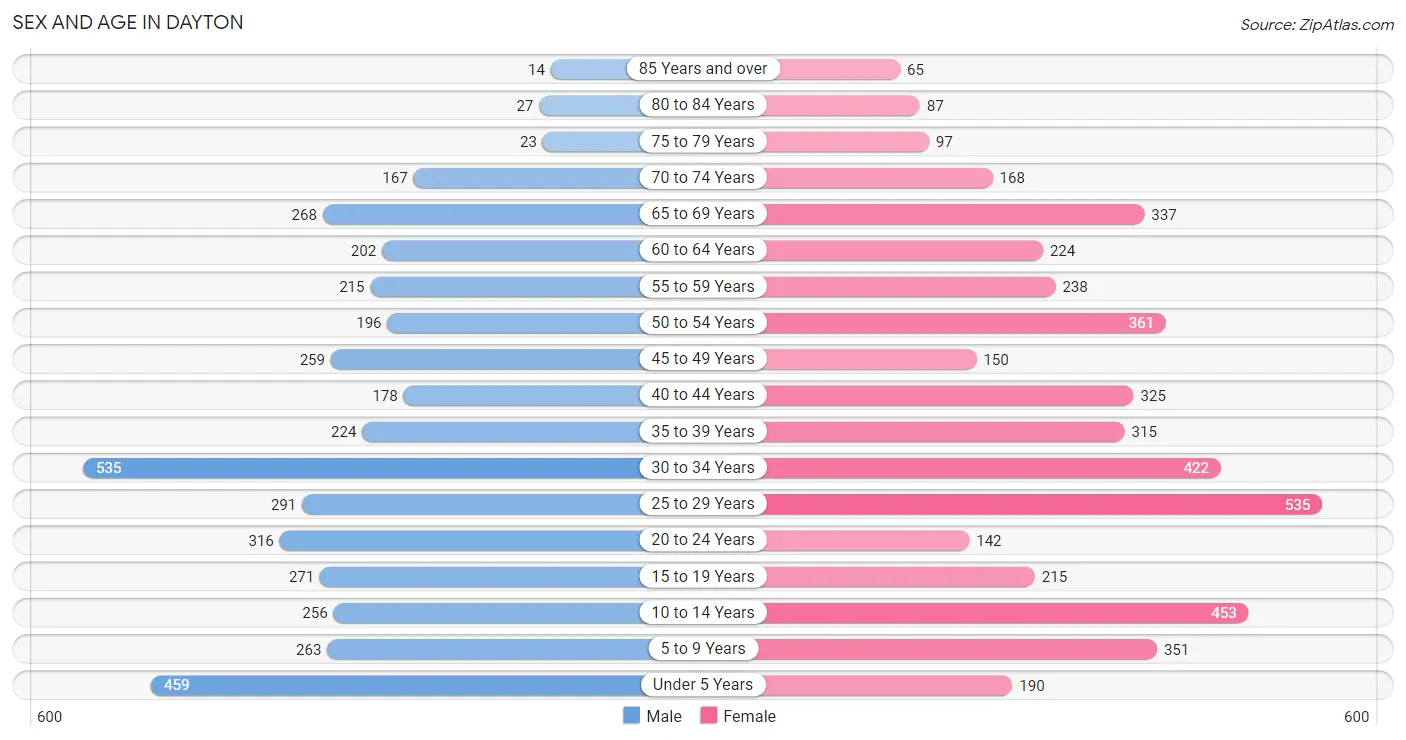
| Age Bracket | Male | Female |
| Under 5 Years | 459 (11.0%) | 190 (4.1%) |
| 5 to 9 Years | 263 (6.3%) | 351 (7.5%) |
| 10 to 14 Years | 256 (6.1%) | 453 (9.7%) |
| 15 to 19 Years | 271 (6.5%) | 215 (4.6%) |
| 20 to 24 Years | 316 (7.6%) | 142 (3.0%) |
| 25 to 29 Years | 291 (7.0%) | 535 (11.4%) |
| 30 to 34 Years | 535 (12.9%) | 422 (9.0%) |
| 35 to 39 Years | 224 (5.4%) | 315 (6.7%) |
| 40 to 44 Years | 178 (4.3%) | 325 (7.0%) |
| 45 to 49 Years | 259 (6.2%) | 150 (3.2%) |
| 50 to 54 Years | 196 (4.7%) | 361 (7.7%) |
| 55 to 59 Years | 215 (5.2%) | 238 (5.1%) |
| 60 to 64 Years | 202 (4.9%) | 224 (4.8%) |
| 65 to 69 Years | 268 (6.4%) | 337 (7.2%) |
| 70 to 74 Years | 167 (4.0%) | 168 (3.6%) |
| 75 to 79 Years | 23 (0.5%) | 97 (2.1%) |
| 80 to 84 Years | 27 (0.6%) | 87 (1.9%) |
| 85 Years and over | 14 (0.3%) | 65 (1.4%) |
| Total | 4,164 (100.0%) | 4,675 (100.0%) |
Families and Households in Dayton
Median Family Size in Dayton
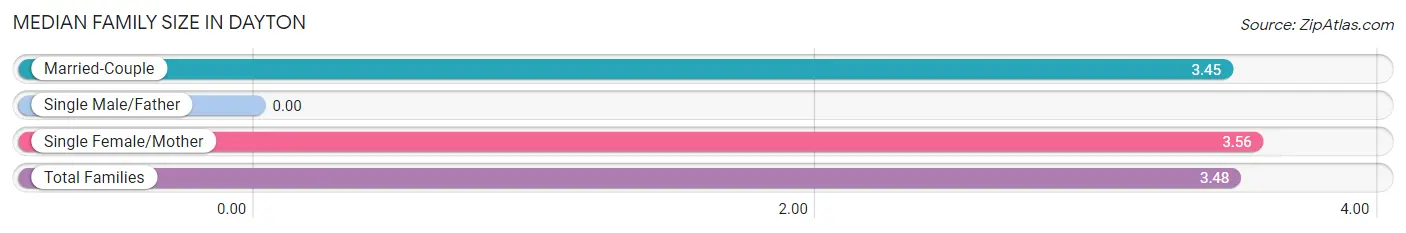
| Family Type | # Families | Family Size |
| Married-Couple | 1,550 (76.5%) | 3.45 |
| Single Male/Father | 0 (0.0%) | - |
| Single Female/Mother | 476 (23.5%) | 3.56 |
| Total Families | 2,026 (100.0%) | 3.48 |
Median Household Size in Dayton
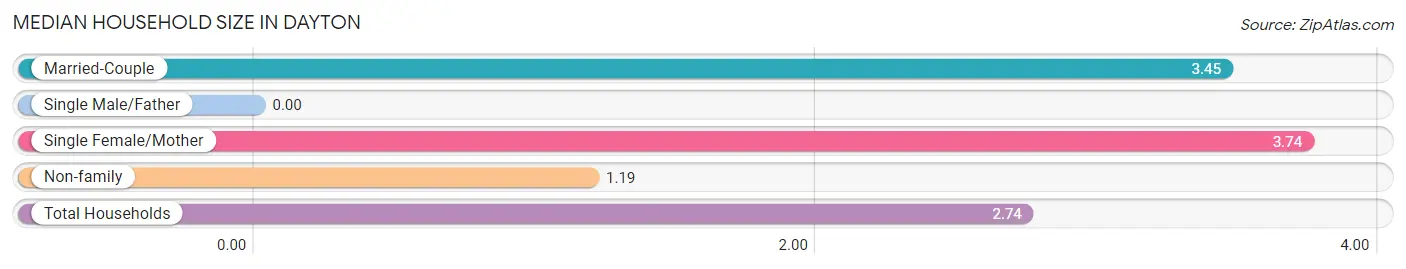
| Household Type | # Households | Household Size |
| Married-Couple | 1,550 (50.9%) | 3.45 |
| Single Male/Father | 0 (0.0%) | - |
| Single Female/Mother | 476 (15.6%) | 3.74 |
| Non-family | 1,017 (33.4%) | 1.19 |
| Total Households | 3,043 (100.0%) | 2.74 |
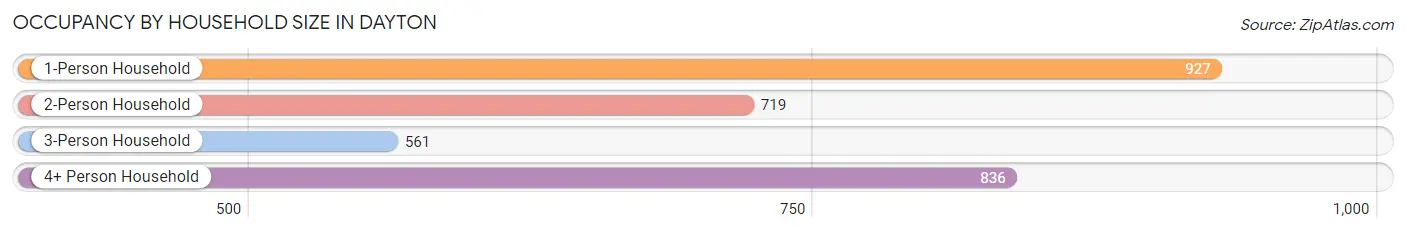
Household Size by Marriage Status in Dayton
Out of a total of 3,043 households in Dayton, 2,026 (66.6%) are family households, while 1,017 (33.4%) are nonfamily households. The most numerous type of family households are 2-person households, comprising 719, and the most common type of nonfamily households are 1-person households, comprising 927.
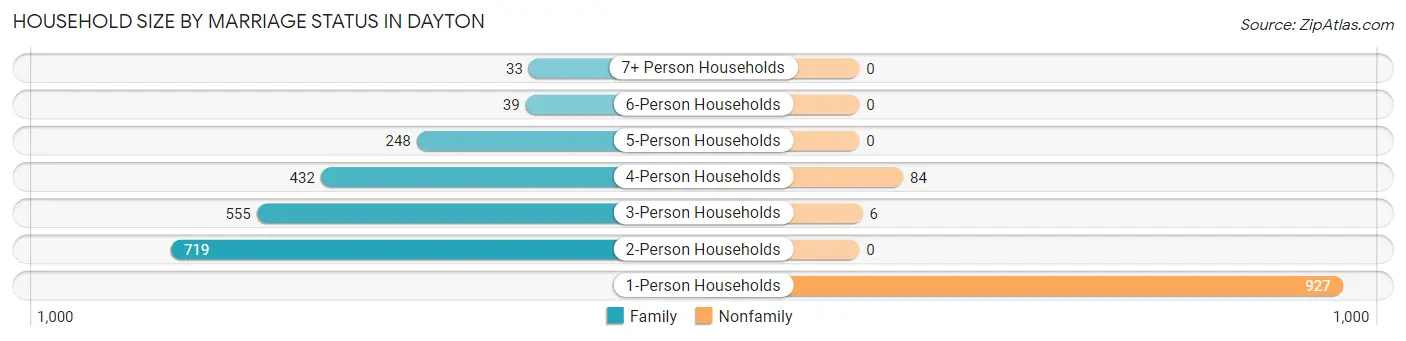
| Household Size | Family Households | Nonfamily Households |
| 1-Person Households | - | 927 (30.5%) |
| 2-Person Households | 719 (23.6%) | 0 (0.0%) |
| 3-Person Households | 555 (18.2%) | 6 (0.2%) |
| 4-Person Households | 432 (14.2%) | 84 (2.8%) |
| 5-Person Households | 248 (8.2%) | 0 (0.0%) |
| 6-Person Households | 39 (1.3%) | 0 (0.0%) |
| 7+ Person Households | 33 (1.1%) | 0 (0.0%) |
| Total | 2,026 (66.6%) | 1,017 (33.4%) |
Female Fertility in Dayton
Fertility by Age in Dayton
Average fertility rate in Dayton is 53.0 births per 1,000 women. Women in the age bracket of 15 to 19 years have the highest fertility rate with 340.0 births per 1,000 women. Women in the age bracket of 15 to 19 years acount for 60.3% of all women with births.
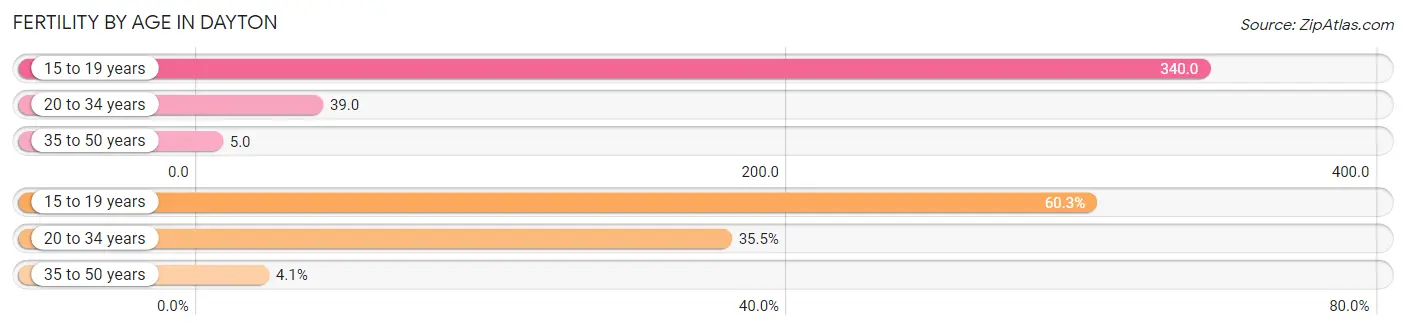
| Age Bracket | Women with Births | Births / 1,000 Women |
| 15 to 19 years | 73 (60.3%) | 340.0 |
| 20 to 34 years | 43 (35.5%) | 39.0 |
| 35 to 50 years | 5 (4.1%) | 5.0 |
| Total | 121 (100.0%) | 53.0 |
Fertility by Age by Marriage Status in Dayton
5.8% of women with births (121) in Dayton are married. The highest percentage of unmarried women with births falls into 15 to 19 years age bracket with 100.0% of them unmarried at the time of birth, while the lowest percentage of unmarried women with births belong to 20 to 34 years age bracket with 83.7% of them unmarried.
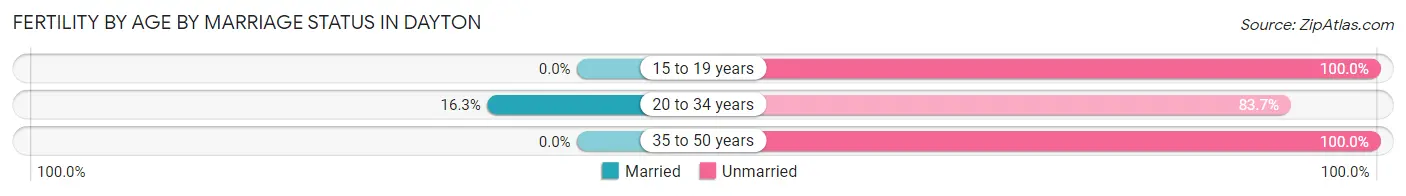
| Age Bracket | Married | Unmarried |
| 15 to 19 years | 0 (0.0%) | 73 (100.0%) |
| 20 to 34 years | 7 (16.3%) | 36 (83.7%) |
| 35 to 50 years | 0 (0.0%) | 5 (100.0%) |
| Total | 7 (5.8%) | 114 (94.2%) |
Fertility by Education in Dayton
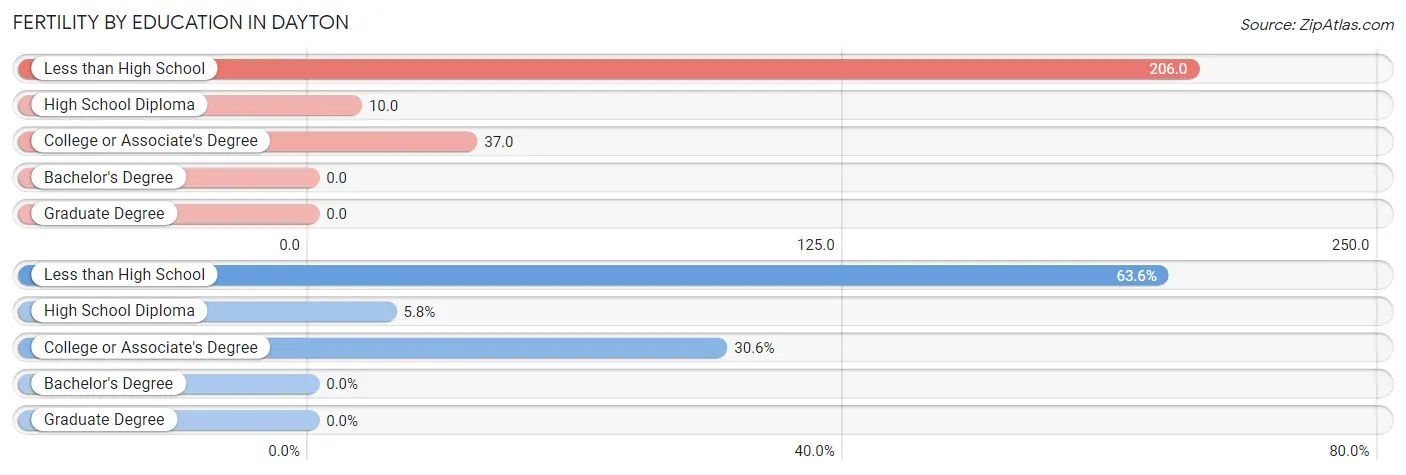
| Educational Attainment | Women with Births | Births / 1,000 Women |
| Less than High School | 77 (63.6%) | 206.0 |
| High School Diploma | 7 (5.8%) | 10.0 |
| College or Associate's Degree | 37 (30.6%) | 37.0 |
| Bachelor's Degree | 0 (0.0%) | 0.0 |
| Graduate Degree | 0 (0.0%) | 0.0 |
| Total | 121 (100.0%) | 53.0 |
Fertility by Education by Marriage Status in Dayton
94.2% of women with births in Dayton are unmarried. Women with the educational attainment of high school diploma are most likely to be married with 100.0% of them married at childbirth, while women with the educational attainment of less than high school are least likely to be married with 100.0% of them unmarried at childbirth.
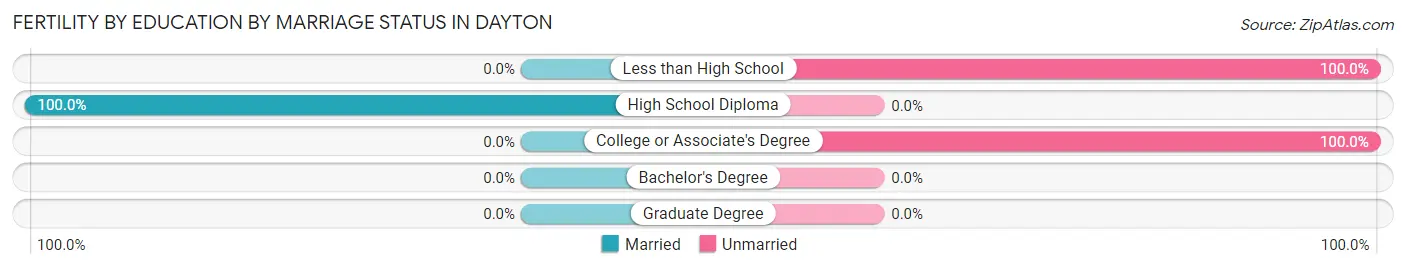
| Educational Attainment | Married | Unmarried |
| Less than High School | 0 (0.0%) | 77 (100.0%) |
| High School Diploma | 7 (100.0%) | 0 (0.0%) |
| College or Associate's Degree | 0 (0.0%) | 37 (100.0%) |
| Bachelor's Degree | 0 (0.0%) | 0 (0.0%) |
| Graduate Degree | 0 (0.0%) | 0 (0.0%) |
| Total | 7 (5.8%) | 114 (94.2%) |
Employment Characteristics in Dayton
Employment by Class of Employer in Dayton
Among the 3,910 employed individuals in Dayton, private company employees (2,997 | 76.6%), local government employees (348 | 8.9%), and self-employed (not incorporated) (249 | 6.4%) make up the most common classes of employment.
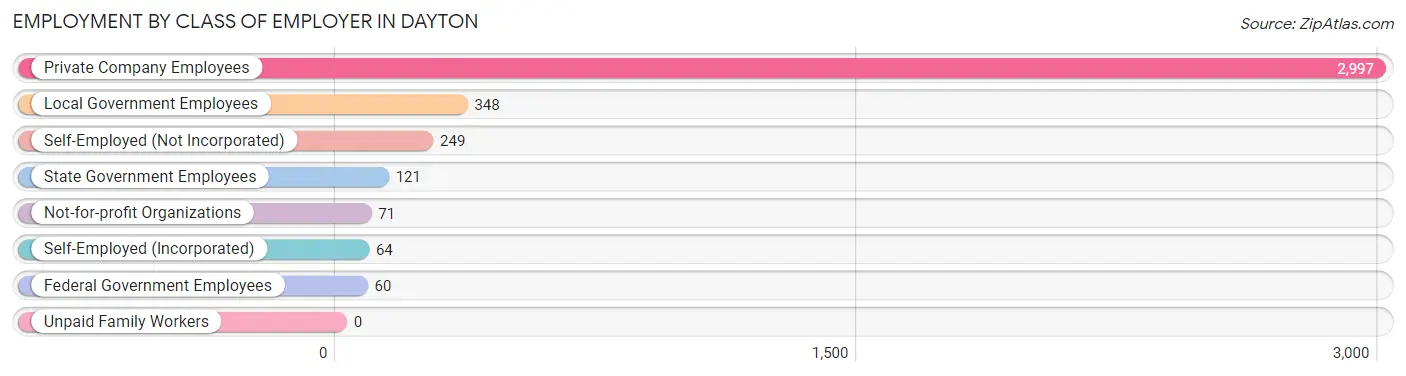
| Employer Class | # Employees | % Employees |
| Private Company Employees | 2,997 | 76.6% |
| Self-Employed (Incorporated) | 64 | 1.6% |
| Self-Employed (Not Incorporated) | 249 | 6.4% |
| Not-for-profit Organizations | 71 | 1.8% |
| Local Government Employees | 348 | 8.9% |
| State Government Employees | 121 | 3.1% |
| Federal Government Employees | 60 | 1.5% |
| Unpaid Family Workers | 0 | 0.0% |
| Total | 3,910 | 100.0% |
Employment Status by Age in Dayton
According to the labor force statistics for Dayton, out of the total population over 16 years of age (6,790), 59.7% or 4,054 individuals are in the labor force, with 3.5% or 142 of them unemployed. The age group with the highest labor force participation rate is 30 to 34 years, with 78.0% or 746 individuals in the labor force. Within the labor force, the 65 to 74 years age range has the highest percentage of unemployed individuals, with 11.2% or 33 of them being unemployed.
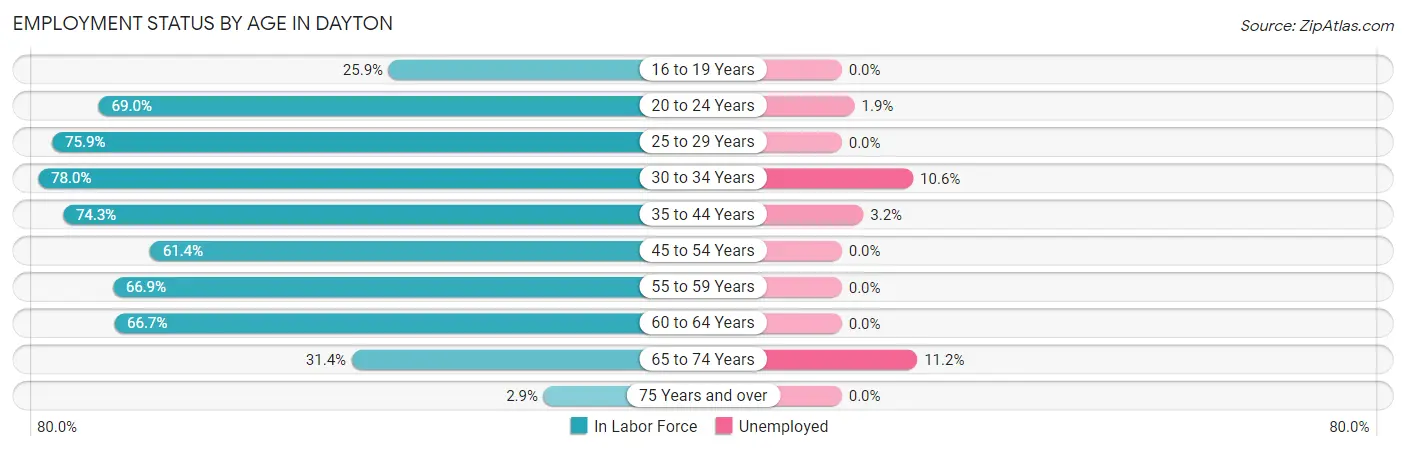
| Age Bracket | In Labor Force | Unemployed |
| 16 to 19 Years | 106 (25.9%) | 0 (0.0%) |
| 20 to 24 Years | 316 (69.0%) | 6 (1.9%) |
| 25 to 29 Years | 627 (75.9%) | 0 (0.0%) |
| 30 to 34 Years | 746 (78.0%) | 79 (10.6%) |
| 35 to 44 Years | 774 (74.3%) | 25 (3.2%) |
| 45 to 54 Years | 593 (61.4%) | 0 (0.0%) |
| 55 to 59 Years | 303 (66.9%) | 0 (0.0%) |
| 60 to 64 Years | 284 (66.7%) | 0 (0.0%) |
| 65 to 74 Years | 295 (31.4%) | 33 (11.2%) |
| 75 Years and over | 9 (2.9%) | 0 (0.0%) |
| Total | 4,054 (59.7%) | 142 (3.5%) |
Employment Status by Educational Attainment in Dayton
According to labor force statistics for Dayton, 71.2% of individuals (3,325) out of the total population between 25 and 64 years of age (4,670) are in the labor force, with 3.1% or 103 of them being unemployed. The group with the highest labor force participation rate are those with the educational attainment of bachelor's degree or higher, with 81.7% or 374 individuals in the labor force. Within the labor force, individuals with less than high school education have the highest percentage of unemployment, with 16.1% or 79 of them being unemployed.
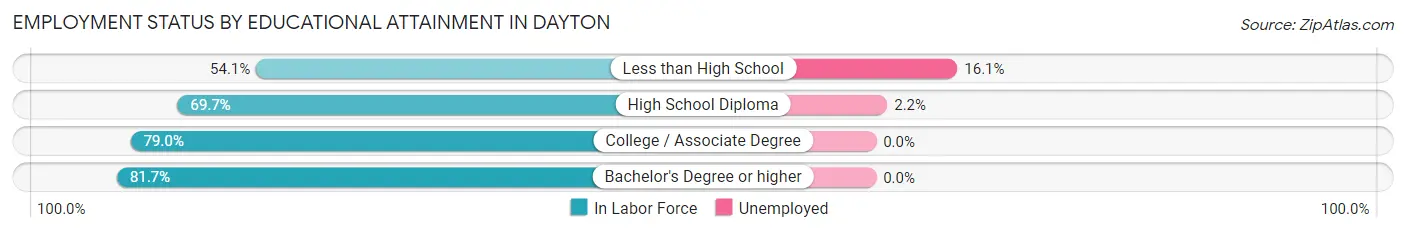
| Educational Attainment | In Labor Force | Unemployed |
| Less than High School | 491 (54.1%) | 146 (16.1%) |
| High School Diploma | 1,115 (69.7%) | 35 (2.2%) |
| College / Associate Degree | 1,347 (79.0%) | 0 (0.0%) |
| Bachelor's Degree or higher | 374 (81.7%) | 0 (0.0%) |
| Total | 3,325 (71.2%) | 145 (3.1%) |
Employment Occupations by Sex in Dayton
Management, Business, Science and Arts Occupations
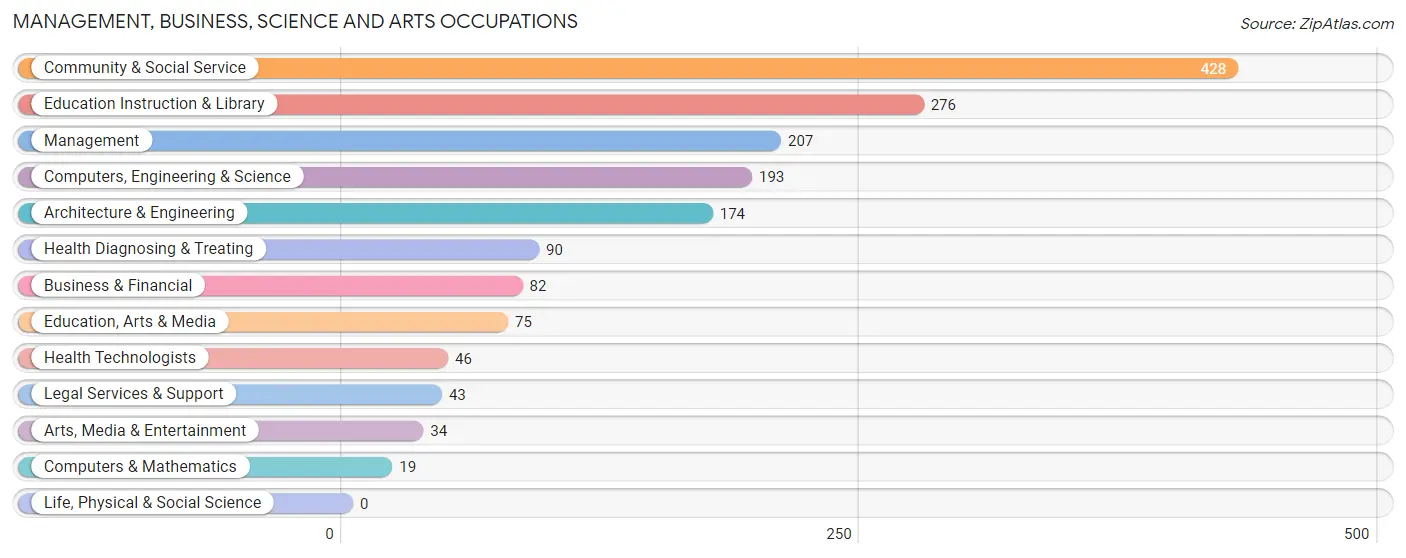
The most common Management, Business, Science and Arts occupations in Dayton are Community & Social Service (428 | 11.0%), Education Instruction & Library (276 | 7.1%), Management (207 | 5.3%), Computers, Engineering & Science (193 | 4.9%), and Architecture & Engineering (174 | 4.4%).
Management, Business, Science and Arts Occupations by Sex
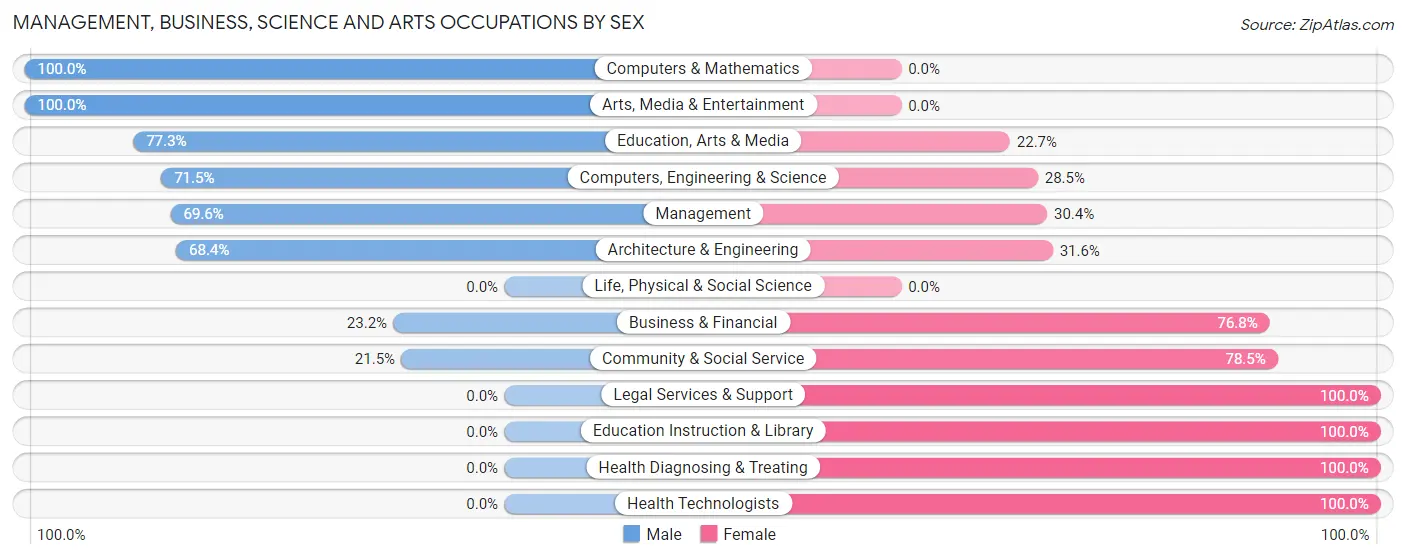
Within the Management, Business, Science and Arts occupations in Dayton, the most male-oriented occupations are Computers & Mathematics (100.0%), Arts, Media & Entertainment (100.0%), and Education, Arts & Media (77.3%), while the most female-oriented occupations are Legal Services & Support (100.0%), Education Instruction & Library (100.0%), and Health Diagnosing & Treating (100.0%).
| Occupation | Male | Female |
| Management | 144 (69.6%) | 63 (30.4%) |
| Business & Financial | 19 (23.2%) | 63 (76.8%) |
| Computers, Engineering & Science | 138 (71.5%) | 55 (28.5%) |
| Computers & Mathematics | 19 (100.0%) | 0 (0.0%) |
| Architecture & Engineering | 119 (68.4%) | 55 (31.6%) |
| Life, Physical & Social Science | 0 (0.0%) | 0 (0.0%) |
| Community & Social Service | 92 (21.5%) | 336 (78.5%) |
| Education, Arts & Media | 58 (77.3%) | 17 (22.7%) |
| Legal Services & Support | 0 (0.0%) | 43 (100.0%) |
| Education Instruction & Library | 0 (0.0%) | 276 (100.0%) |
| Arts, Media & Entertainment | 34 (100.0%) | 0 (0.0%) |
| Health Diagnosing & Treating | 0 (0.0%) | 90 (100.0%) |
| Health Technologists | 0 (0.0%) | 46 (100.0%) |
| Total (Category) | 393 (39.3%) | 607 (60.7%) |
| Total (Overall) | 2,077 (53.1%) | 1,833 (46.9%) |
Services Occupations
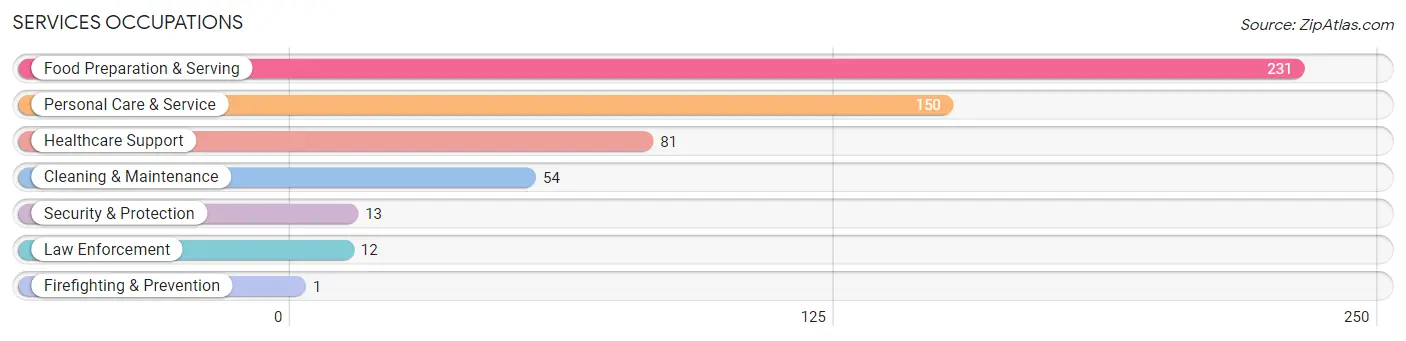
The most common Services occupations in Dayton are Food Preparation & Serving (231 | 5.9%), Personal Care & Service (150 | 3.8%), Healthcare Support (81 | 2.1%), Cleaning & Maintenance (54 | 1.4%), and Security & Protection (13 | 0.3%).
Services Occupations by Sex
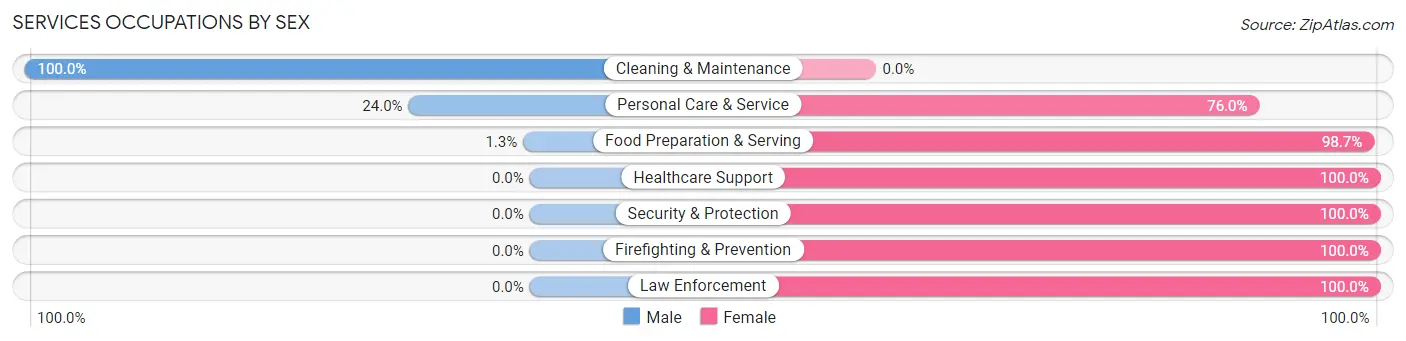
Within the Services occupations in Dayton, the most male-oriented occupations are Cleaning & Maintenance (100.0%), Personal Care & Service (24.0%), and Food Preparation & Serving (1.3%), while the most female-oriented occupations are Healthcare Support (100.0%), Security & Protection (100.0%), and Firefighting & Prevention (100.0%).
| Occupation | Male | Female |
| Healthcare Support | 0 (0.0%) | 81 (100.0%) |
| Security & Protection | 0 (0.0%) | 13 (100.0%) |
| Firefighting & Prevention | 0 (0.0%) | 1 (100.0%) |
| Law Enforcement | 0 (0.0%) | 12 (100.0%) |
| Food Preparation & Serving | 3 (1.3%) | 228 (98.7%) |
| Cleaning & Maintenance | 54 (100.0%) | 0 (0.0%) |
| Personal Care & Service | 36 (24.0%) | 114 (76.0%) |
| Total (Category) | 93 (17.6%) | 436 (82.4%) |
| Total (Overall) | 2,077 (53.1%) | 1,833 (46.9%) |
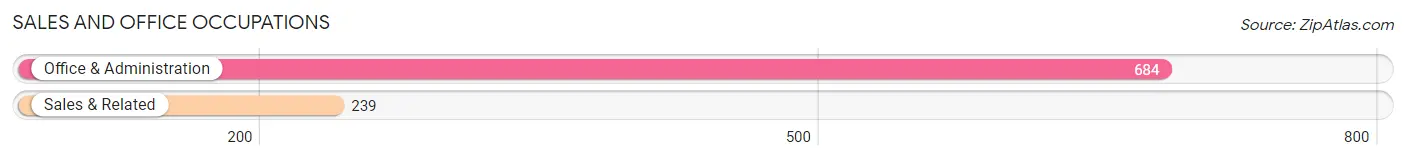
Sales and Office Occupations
The most common Sales and Office occupations in Dayton are Office & Administration (684 | 17.5%), and Sales & Related (239 | 6.1%).
Sales and Office Occupations by Sex
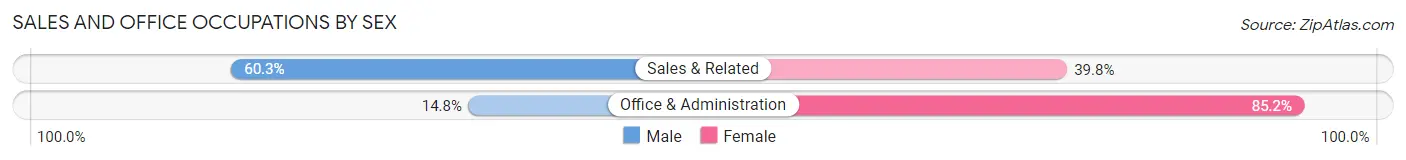
| Occupation | Male | Female |
| Sales & Related | 144 (60.3%) | 95 (39.8%) |
| Office & Administration | 101 (14.8%) | 583 (85.2%) |
| Total (Category) | 245 (26.5%) | 678 (73.5%) |
| Total (Overall) | 2,077 (53.1%) | 1,833 (46.9%) |
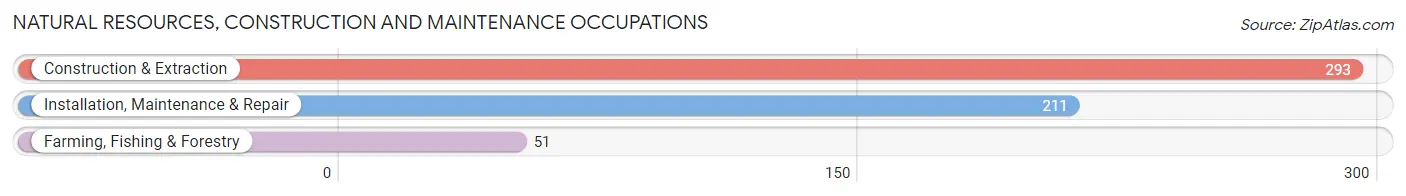
Natural Resources, Construction and Maintenance Occupations
The most common Natural Resources, Construction and Maintenance occupations in Dayton are Construction & Extraction (293 | 7.5%), Installation, Maintenance & Repair (211 | 5.4%), and Farming, Fishing & Forestry (51 | 1.3%).
Natural Resources, Construction and Maintenance Occupations by Sex
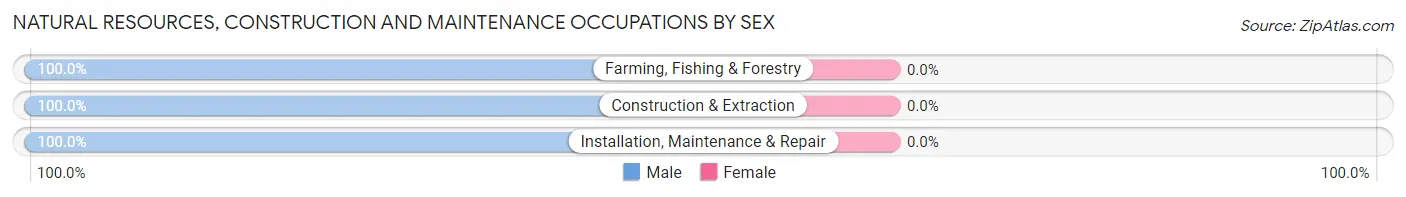
| Occupation | Male | Female |
| Farming, Fishing & Forestry | 51 (100.0%) | 0 (0.0%) |
| Construction & Extraction | 293 (100.0%) | 0 (0.0%) |
| Installation, Maintenance & Repair | 211 (100.0%) | 0 (0.0%) |
| Total (Category) | 555 (100.0%) | 0 (0.0%) |
| Total (Overall) | 2,077 (53.1%) | 1,833 (46.9%) |
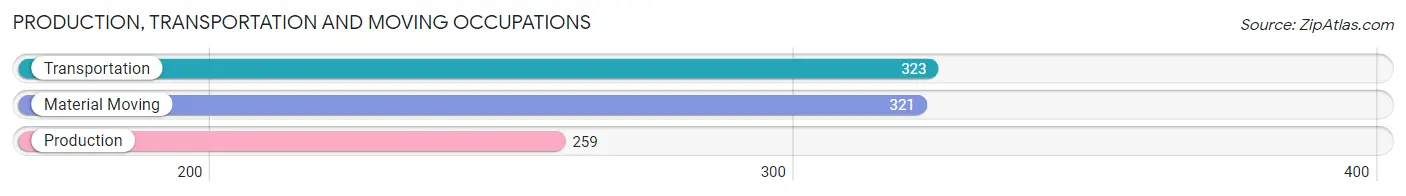
Production, Transportation and Moving Occupations
The most common Production, Transportation and Moving occupations in Dayton are Transportation (323 | 8.3%), Material Moving (321 | 8.2%), and Production (259 | 6.6%).
Production, Transportation and Moving Occupations by Sex
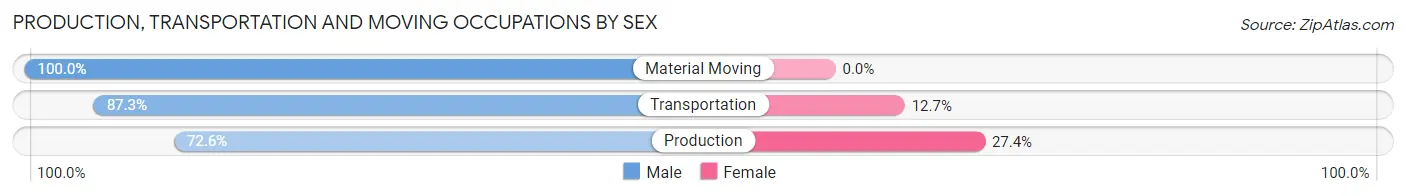
| Occupation | Male | Female |
| Production | 188 (72.6%) | 71 (27.4%) |
| Transportation | 282 (87.3%) | 41 (12.7%) |
| Material Moving | 321 (100.0%) | 0 (0.0%) |
| Total (Category) | 791 (87.6%) | 112 (12.4%) |
| Total (Overall) | 2,077 (53.1%) | 1,833 (46.9%) |
Employment Industries by Sex in Dayton
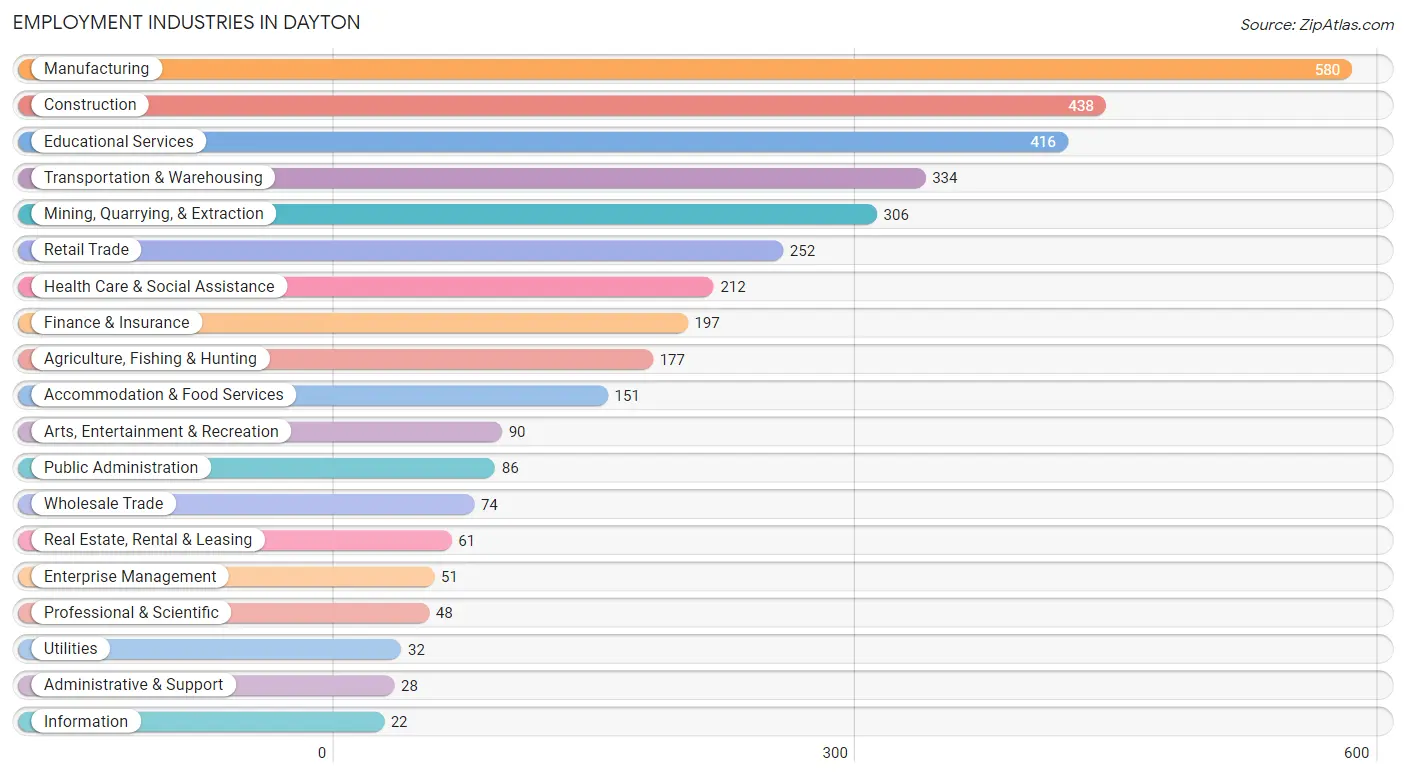
Employment Industries in Dayton
The major employment industries in Dayton include Manufacturing (580 | 14.8%), Construction (438 | 11.2%), Educational Services (416 | 10.6%), Transportation & Warehousing (334 | 8.5%), and Mining, Quarrying, & Extraction (306 | 7.8%).
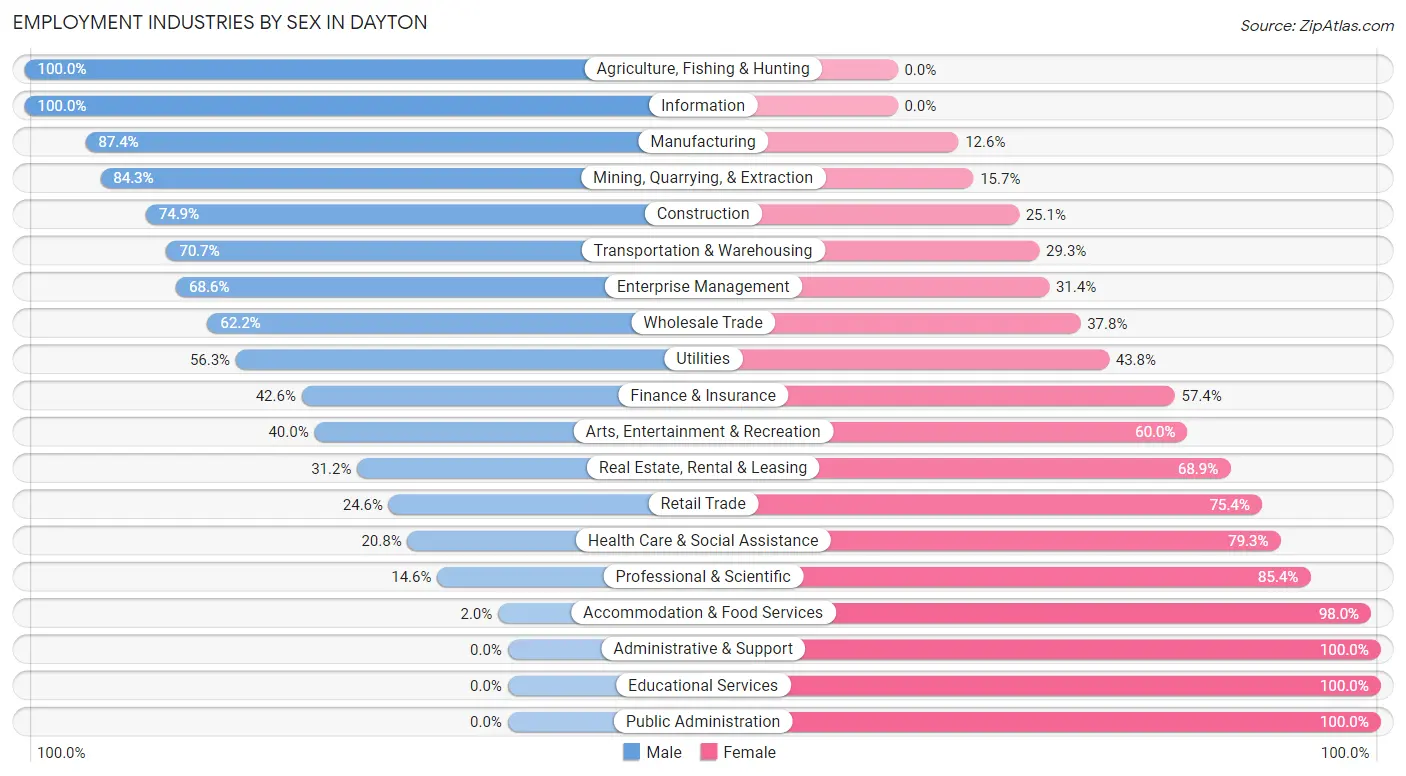
Employment Industries by Sex in Dayton
The Dayton industries that see more men than women are Agriculture, Fishing & Hunting (100.0%), Information (100.0%), and Manufacturing (87.4%), whereas the industries that tend to have a higher number of women are Administrative & Support (100.0%), Educational Services (100.0%), and Public Administration (100.0%).
| Industry | Male | Female |
| Agriculture, Fishing & Hunting | 177 (100.0%) | 0 (0.0%) |
| Mining, Quarrying, & Extraction | 258 (84.3%) | 48 (15.7%) |
| Construction | 328 (74.9%) | 110 (25.1%) |
| Manufacturing | 507 (87.4%) | 73 (12.6%) |
| Wholesale Trade | 46 (62.2%) | 28 (37.8%) |
| Retail Trade | 62 (24.6%) | 190 (75.4%) |
| Transportation & Warehousing | 236 (70.7%) | 98 (29.3%) |
| Utilities | 18 (56.2%) | 14 (43.8%) |
| Information | 22 (100.0%) | 0 (0.0%) |
| Finance & Insurance | 84 (42.6%) | 113 (57.4%) |
| Real Estate, Rental & Leasing | 19 (31.1%) | 42 (68.9%) |
| Professional & Scientific | 7 (14.6%) | 41 (85.4%) |
| Enterprise Management | 35 (68.6%) | 16 (31.4%) |
| Administrative & Support | 0 (0.0%) | 28 (100.0%) |
| Educational Services | 0 (0.0%) | 416 (100.0%) |
| Health Care & Social Assistance | 44 (20.7%) | 168 (79.2%) |
| Arts, Entertainment & Recreation | 36 (40.0%) | 54 (60.0%) |
| Accommodation & Food Services | 3 (2.0%) | 148 (98.0%) |
| Public Administration | 0 (0.0%) | 86 (100.0%) |
| Total | 2,077 (53.1%) | 1,833 (46.9%) |
Education in Dayton
School Enrollment in Dayton
The most common levels of schooling among the 2,238 students in Dayton are middle school (627 | 28.0%), high school (437 | 19.5%), and elementary school (389 | 17.4%).
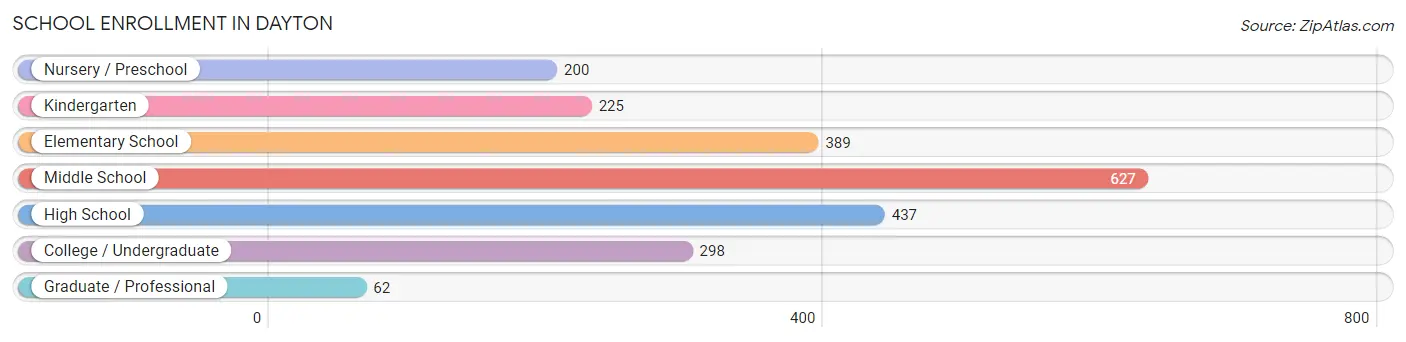
| School Level | # Students | % Students |
| Nursery / Preschool | 200 | 8.9% |
| Kindergarten | 225 | 10.1% |
| Elementary School | 389 | 17.4% |
| Middle School | 627 | 28.0% |
| High School | 437 | 19.5% |
| College / Undergraduate | 298 | 13.3% |
| Graduate / Professional | 62 | 2.8% |
| Total | 2,238 | 100.0% |
School Enrollment by Age by Funding Source in Dayton
Out of a total of 2,238 students who are enrolled in schools in Dayton, 210 (9.4%) attend a private institution, while the remaining 2,028 (90.6%) are enrolled in public schools. The age group of 20 to 24 year olds has the highest likelihood of being enrolled in private schools, with 62 (60.8% in the age bracket) enrolled. Conversely, the age group of 5 to 9 year old has the lowest likelihood of being enrolled in a private school, with 614 (100.0% in the age bracket) attending a public institution.
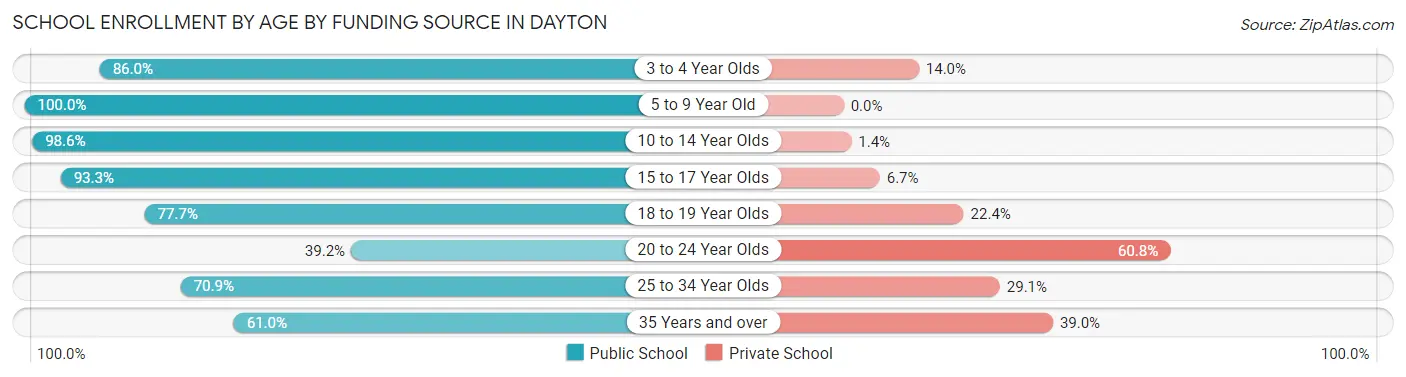
| Age Bracket | Public School | Private School |
| 3 to 4 Year Olds | 172 (86.0%) | 28 (14.0%) |
| 5 to 9 Year Old | 614 (100.0%) | 0 (0.0%) |
| 10 to 14 Year Olds | 691 (98.6%) | 10 (1.4%) |
| 15 to 17 Year Olds | 291 (93.3%) | 21 (6.7%) |
| 18 to 19 Year Olds | 66 (77.6%) | 19 (22.4%) |
| 20 to 24 Year Olds | 40 (39.2%) | 62 (60.8%) |
| 25 to 34 Year Olds | 117 (70.9%) | 48 (29.1%) |
| 35 Years and over | 36 (61.0%) | 23 (39.0%) |
| Total | 2,028 (90.6%) | 210 (9.4%) |
Educational Attainment by Field of Study in Dayton
Business (189 | 28.5%), education (182 | 27.4%), science & technology (116 | 17.5%), engineering (48 | 7.2%), and visual & performing arts (46 | 6.9%) are the most common fields of study among 664 individuals in Dayton who have obtained a bachelor's degree or higher.
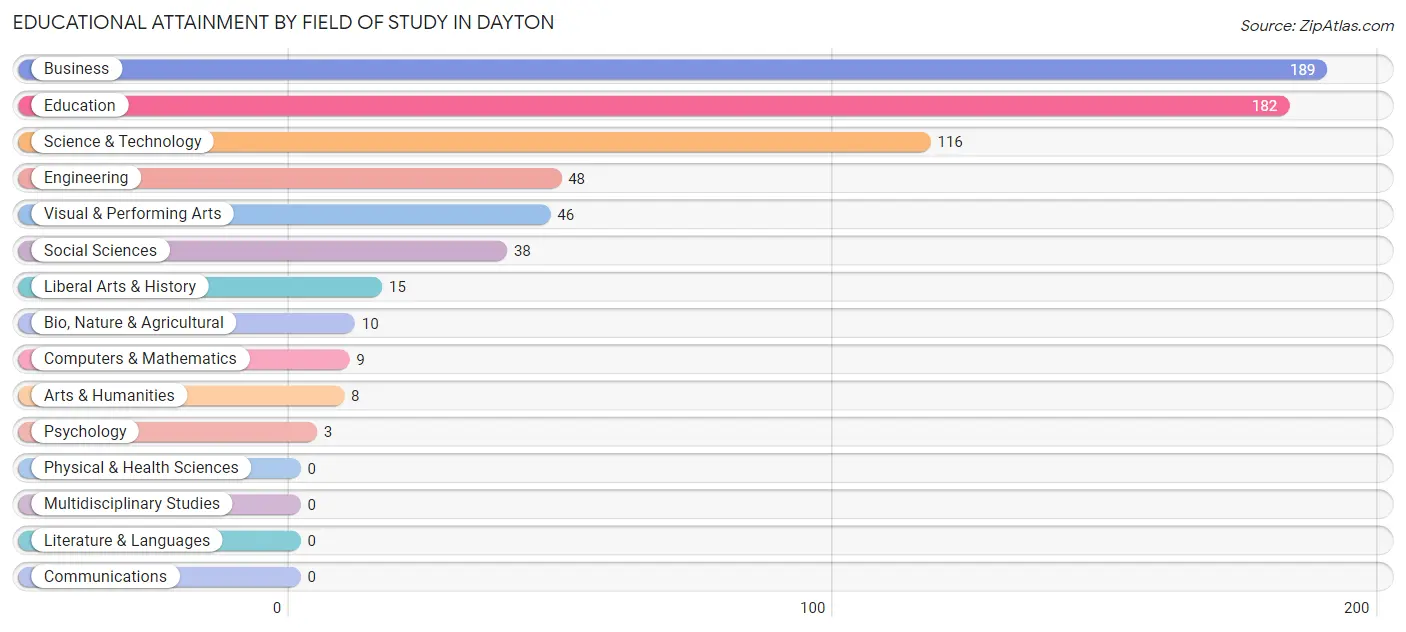
| Field of Study | # Graduates | % Graduates |
| Computers & Mathematics | 9 | 1.4% |
| Bio, Nature & Agricultural | 10 | 1.5% |
| Physical & Health Sciences | 0 | 0.0% |
| Psychology | 3 | 0.4% |
| Social Sciences | 38 | 5.7% |
| Engineering | 48 | 7.2% |
| Multidisciplinary Studies | 0 | 0.0% |
| Science & Technology | 116 | 17.5% |
| Business | 189 | 28.5% |
| Education | 182 | 27.4% |
| Literature & Languages | 0 | 0.0% |
| Liberal Arts & History | 15 | 2.3% |
| Visual & Performing Arts | 46 | 6.9% |
| Communications | 0 | 0.0% |
| Arts & Humanities | 8 | 1.2% |
| Total | 664 | 100.0% |
Transportation & Commute in Dayton
Vehicle Availability by Sex in Dayton
The most prevalent vehicle ownership categories in Dayton are males with 2 vehicles (692, accounting for 33.3%) and females with 2 vehicles (688, making up 37.8%).
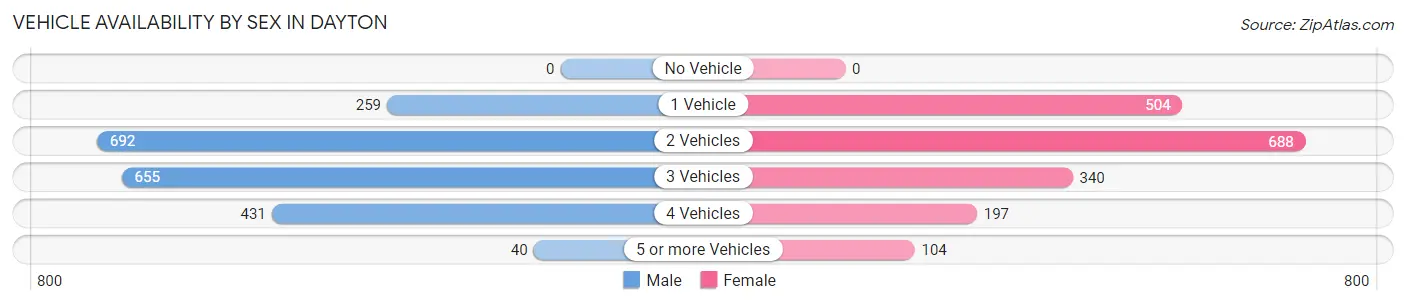
| Vehicles Available | Male | Female |
| No Vehicle | 0 (0.0%) | 0 (0.0%) |
| 1 Vehicle | 259 (12.5%) | 504 (27.5%) |
| 2 Vehicles | 692 (33.3%) | 688 (37.5%) |
| 3 Vehicles | 655 (31.5%) | 340 (18.5%) |
| 4 Vehicles | 431 (20.7%) | 197 (10.7%) |
| 5 or more Vehicles | 40 (1.9%) | 104 (5.7%) |
| Total | 2,077 (100.0%) | 1,833 (100.0%) |
Commute Time in Dayton
The most frequently occuring commute durations in Dayton are 30 to 34 minutes (736 commuters, 20.7%), 45 to 59 minutes (652 commuters, 18.3%), and 60 to 89 minutes (493 commuters, 13.8%).
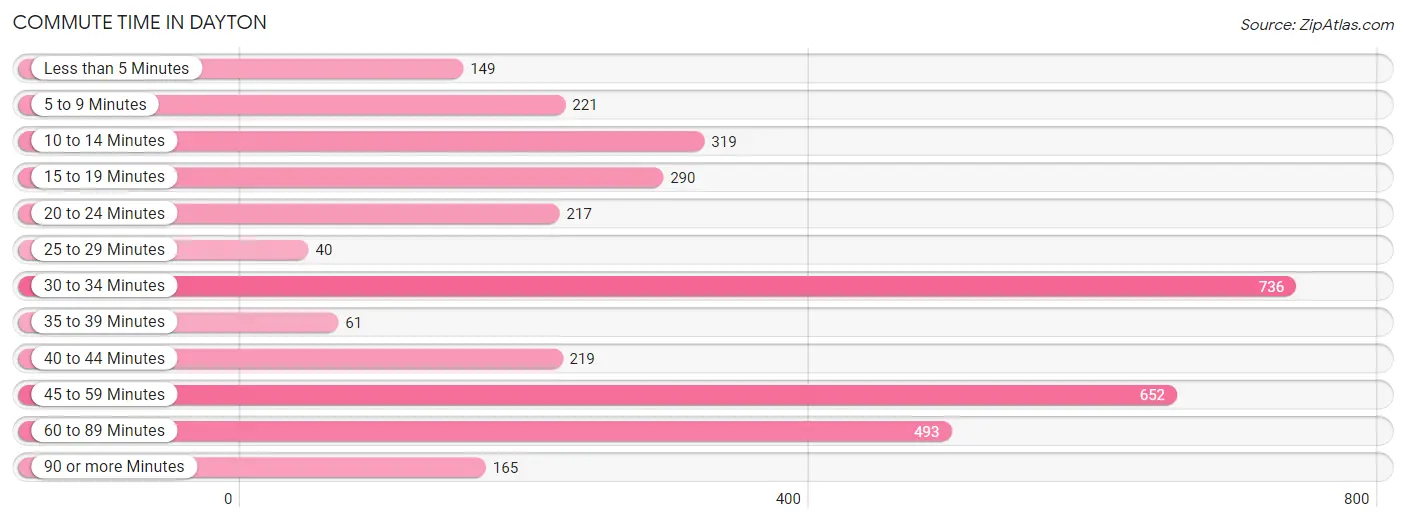
| Commute Time | # Commuters | % Commuters |
| Less than 5 Minutes | 149 | 4.2% |
| 5 to 9 Minutes | 221 | 6.2% |
| 10 to 14 Minutes | 319 | 9.0% |
| 15 to 19 Minutes | 290 | 8.1% |
| 20 to 24 Minutes | 217 | 6.1% |
| 25 to 29 Minutes | 40 | 1.1% |
| 30 to 34 Minutes | 736 | 20.7% |
| 35 to 39 Minutes | 61 | 1.7% |
| 40 to 44 Minutes | 219 | 6.1% |
| 45 to 59 Minutes | 652 | 18.3% |
| 60 to 89 Minutes | 493 | 13.8% |
| 90 or more Minutes | 165 | 4.6% |
Commute Time by Sex in Dayton
The most common commute times in Dayton are 30 to 34 minutes (630 commuters, 32.8%) for males and 10 to 14 minutes (319 commuters, 19.4%) for females.
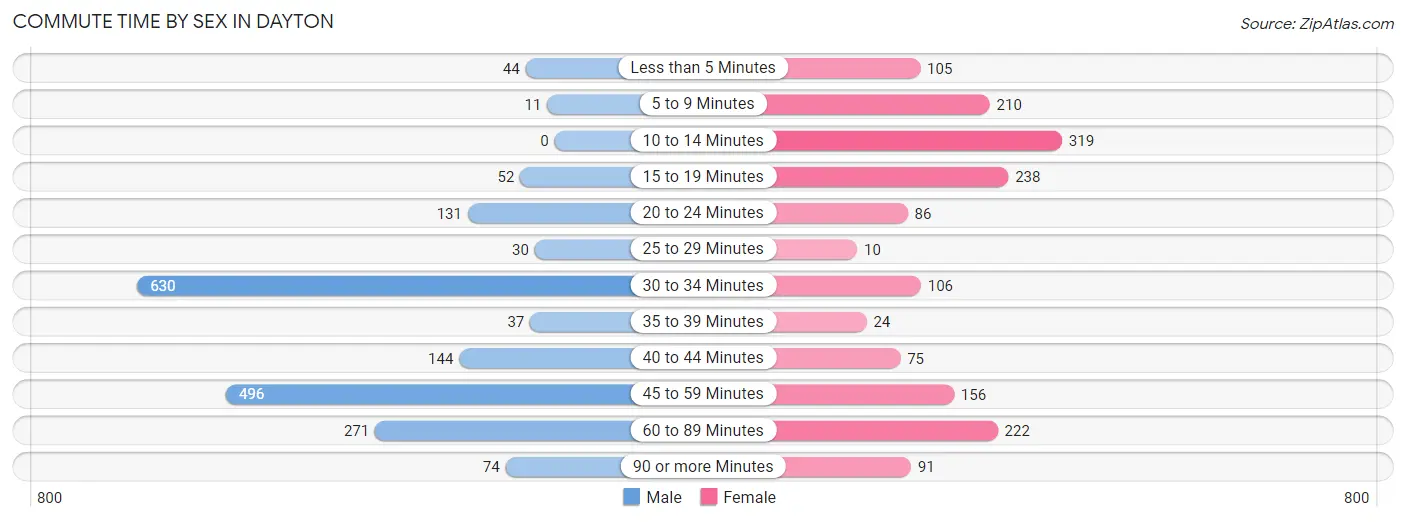
| Commute Time | Male | Female |
| Less than 5 Minutes | 44 (2.3%) | 105 (6.4%) |
| 5 to 9 Minutes | 11 (0.6%) | 210 (12.8%) |
| 10 to 14 Minutes | 0 (0.0%) | 319 (19.4%) |
| 15 to 19 Minutes | 52 (2.7%) | 238 (14.5%) |
| 20 to 24 Minutes | 131 (6.8%) | 86 (5.2%) |
| 25 to 29 Minutes | 30 (1.6%) | 10 (0.6%) |
| 30 to 34 Minutes | 630 (32.8%) | 106 (6.5%) |
| 35 to 39 Minutes | 37 (1.9%) | 24 (1.5%) |
| 40 to 44 Minutes | 144 (7.5%) | 75 (4.6%) |
| 45 to 59 Minutes | 496 (25.8%) | 156 (9.5%) |
| 60 to 89 Minutes | 271 (14.1%) | 222 (13.5%) |
| 90 or more Minutes | 74 (3.8%) | 91 (5.5%) |
Time of Departure to Work by Sex in Dayton
The most frequent times of departure to work in Dayton are 5:00 AM to 5:29 AM (400, 20.8%) for males and 7:00 AM to 7:29 AM (296, 18.0%) for females.
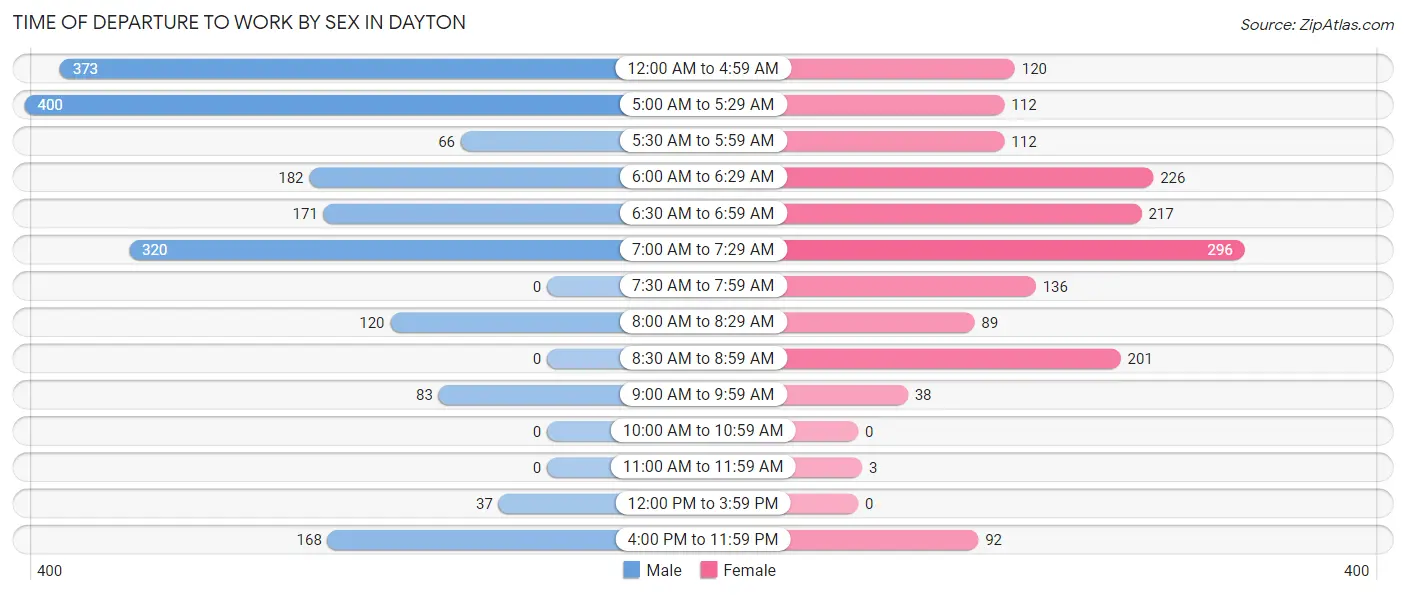
| Time of Departure | Male | Female |
| 12:00 AM to 4:59 AM | 373 (19.4%) | 120 (7.3%) |
| 5:00 AM to 5:29 AM | 400 (20.8%) | 112 (6.8%) |
| 5:30 AM to 5:59 AM | 66 (3.4%) | 112 (6.8%) |
| 6:00 AM to 6:29 AM | 182 (9.5%) | 226 (13.8%) |
| 6:30 AM to 6:59 AM | 171 (8.9%) | 217 (13.2%) |
| 7:00 AM to 7:29 AM | 320 (16.7%) | 296 (18.0%) |
| 7:30 AM to 7:59 AM | 0 (0.0%) | 136 (8.3%) |
| 8:00 AM to 8:29 AM | 120 (6.2%) | 89 (5.4%) |
| 8:30 AM to 8:59 AM | 0 (0.0%) | 201 (12.2%) |
| 9:00 AM to 9:59 AM | 83 (4.3%) | 38 (2.3%) |
| 10:00 AM to 10:59 AM | 0 (0.0%) | 0 (0.0%) |
| 11:00 AM to 11:59 AM | 0 (0.0%) | 3 (0.2%) |
| 12:00 PM to 3:59 PM | 37 (1.9%) | 0 (0.0%) |
| 4:00 PM to 11:59 PM | 168 (8.7%) | 92 (5.6%) |
| Total | 1,920 (100.0%) | 1,642 (100.0%) |
Housing Occupancy in Dayton
Occupancy by Ownership in Dayton
Of the total 3,043 dwellings in Dayton, owner-occupied units account for 2,036 (66.9%), while renter-occupied units make up 1,007 (33.1%).
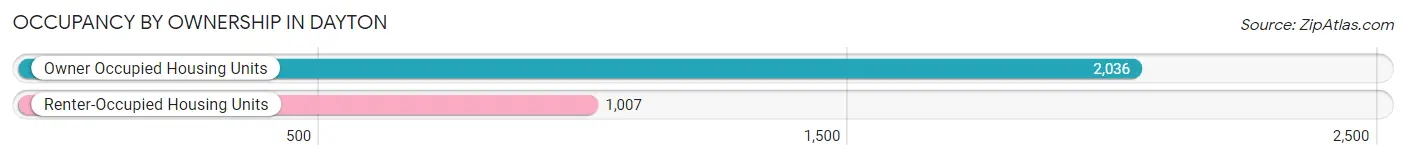
| Occupancy | # Housing Units | % Housing Units |
| Owner Occupied Housing Units | 2,036 | 66.9% |
| Renter-Occupied Housing Units | 1,007 | 33.1% |
| Total Occupied Housing Units | 3,043 | 100.0% |
Occupancy by Household Size in Dayton
| Household Size | # Housing Units | % Housing Units |
| 1-Person Household | 927 | 30.5% |
| 2-Person Household | 719 | 23.6% |
| 3-Person Household | 561 | 18.4% |
| 4+ Person Household | 836 | 27.5% |
| Total Housing Units | 3,043 | 100.0% |
Occupancy by Ownership by Household Size in Dayton
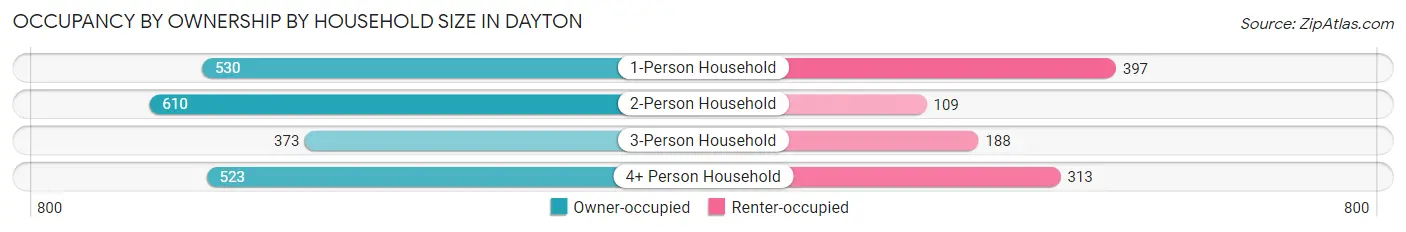
| Household Size | Owner-occupied | Renter-occupied |
| 1-Person Household | 530 (57.2%) | 397 (42.8%) |
| 2-Person Household | 610 (84.8%) | 109 (15.2%) |
| 3-Person Household | 373 (66.5%) | 188 (33.5%) |
| 4+ Person Household | 523 (62.6%) | 313 (37.4%) |
| Total Housing Units | 2,036 (66.9%) | 1,007 (33.1%) |
Occupancy by Educational Attainment in Dayton
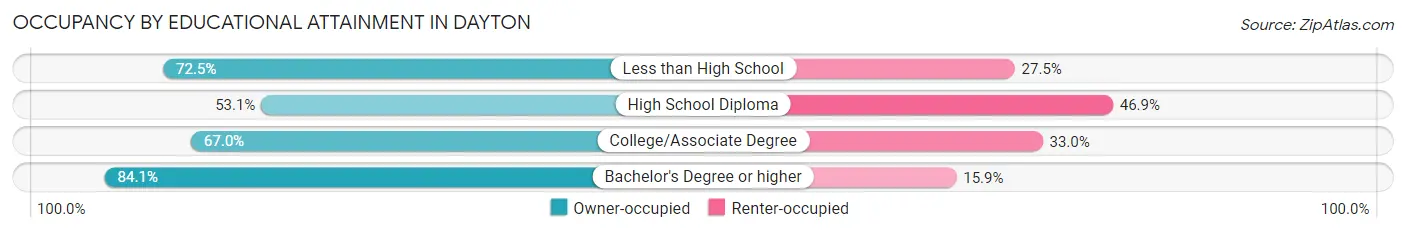
| Household Size | Owner-occupied | Renter-occupied |
| Less than High School | 391 (72.5%) | 148 (27.5%) |
| High School Diploma | 430 (53.1%) | 380 (46.9%) |
| College/Associate Degree | 823 (67.0%) | 405 (33.0%) |
| Bachelor's Degree or higher | 392 (84.1%) | 74 (15.9%) |
Occupancy by Age of Householder in Dayton
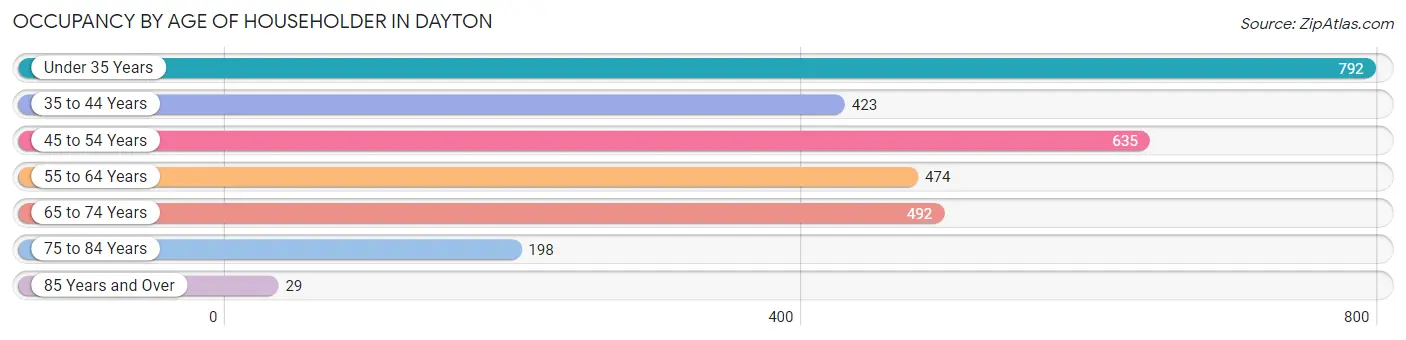
| Age Bracket | # Households | % Households |
| Under 35 Years | 792 | 26.0% |
| 35 to 44 Years | 423 | 13.9% |
| 45 to 54 Years | 635 | 20.9% |
| 55 to 64 Years | 474 | 15.6% |
| 65 to 74 Years | 492 | 16.2% |
| 75 to 84 Years | 198 | 6.5% |
| 85 Years and Over | 29 | 0.9% |
| Total | 3,043 | 100.0% |
Housing Finances in Dayton
Median Income by Occupancy in Dayton
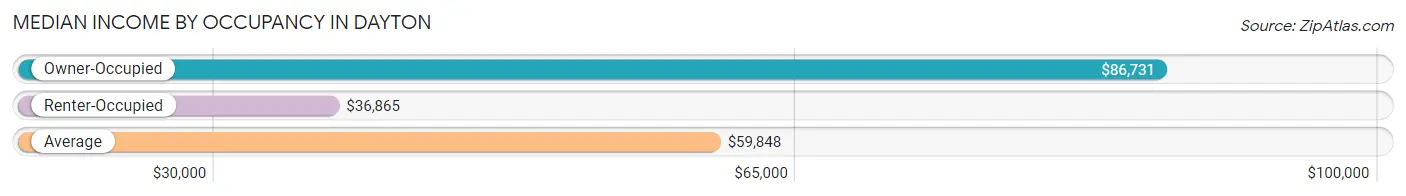
| Occupancy Type | # Households | Median Income |
| Owner-Occupied | 2,036 (66.9%) | $86,731 |
| Renter-Occupied | 1,007 (33.1%) | $36,865 |
| Average | 3,043 (100.0%) | $59,848 |
Occupancy by Householder Income Bracket in Dayton
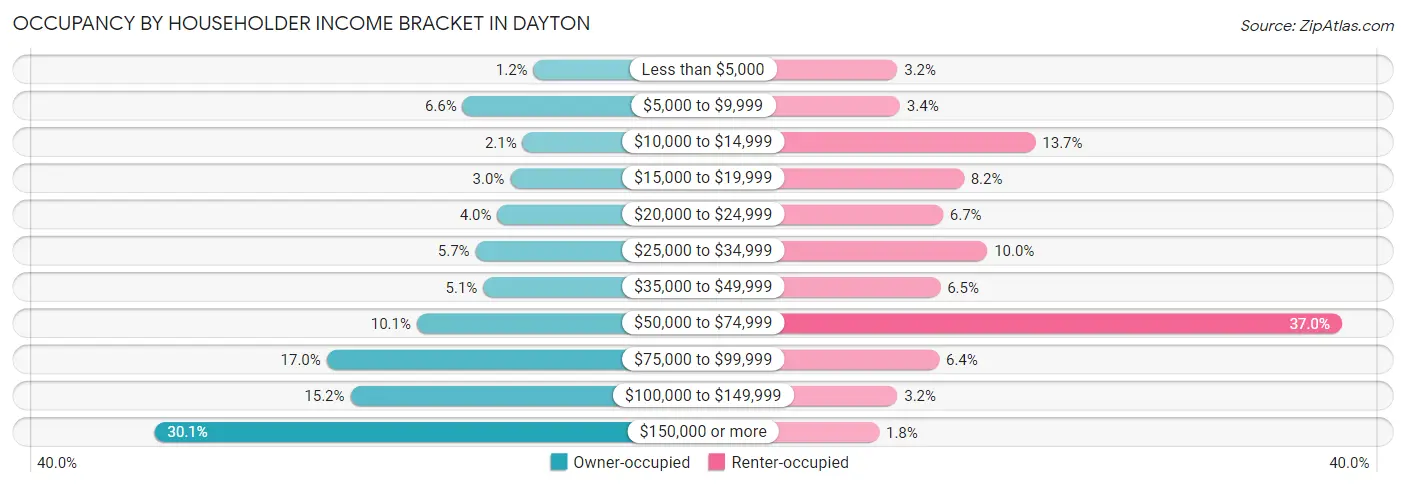
| Income Bracket | Owner-occupied | Renter-occupied |
| Less than $5,000 | 25 (1.2%) | 32 (3.2%) |
| $5,000 to $9,999 | 135 (6.6%) | 34 (3.4%) |
| $10,000 to $14,999 | 42 (2.1%) | 138 (13.7%) |
| $15,000 to $19,999 | 61 (3.0%) | 83 (8.2%) |
| $20,000 to $24,999 | 81 (4.0%) | 67 (6.7%) |
| $25,000 to $34,999 | 115 (5.7%) | 101 (10.0%) |
| $35,000 to $49,999 | 103 (5.1%) | 65 (6.5%) |
| $50,000 to $74,999 | 206 (10.1%) | 373 (37.0%) |
| $75,000 to $99,999 | 346 (17.0%) | 64 (6.4%) |
| $100,000 to $149,999 | 309 (15.2%) | 32 (3.2%) |
| $150,000 or more | 613 (30.1%) | 18 (1.8%) |
| Total | 2,036 (100.0%) | 1,007 (100.0%) |
Monthly Housing Cost Tiers in Dayton
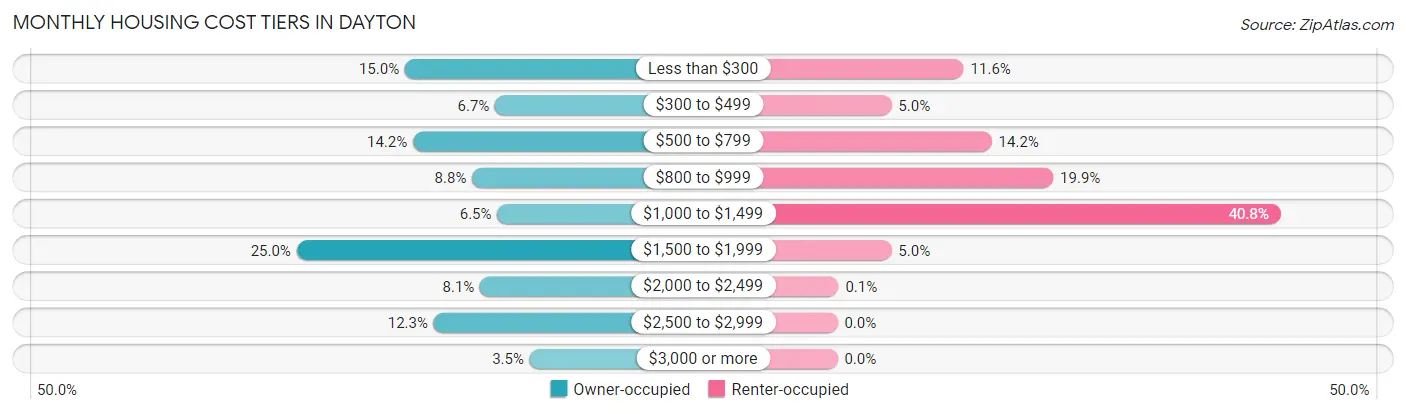
| Monthly Cost | Owner-occupied | Renter-occupied |
| Less than $300 | 305 (15.0%) | 117 (11.6%) |
| $300 to $499 | 136 (6.7%) | 50 (5.0%) |
| $500 to $799 | 290 (14.2%) | 143 (14.2%) |
| $800 to $999 | 179 (8.8%) | 200 (19.9%) |
| $1,000 to $1,499 | 132 (6.5%) | 411 (40.8%) |
| $1,500 to $1,999 | 508 (24.9%) | 50 (5.0%) |
| $2,000 to $2,499 | 164 (8.1%) | 1 (0.1%) |
| $2,500 to $2,999 | 251 (12.3%) | 0 (0.0%) |
| $3,000 or more | 71 (3.5%) | 0 (0.0%) |
| Total | 2,036 (100.0%) | 1,007 (100.0%) |
Physical Housing Characteristics in Dayton
Housing Structures in Dayton
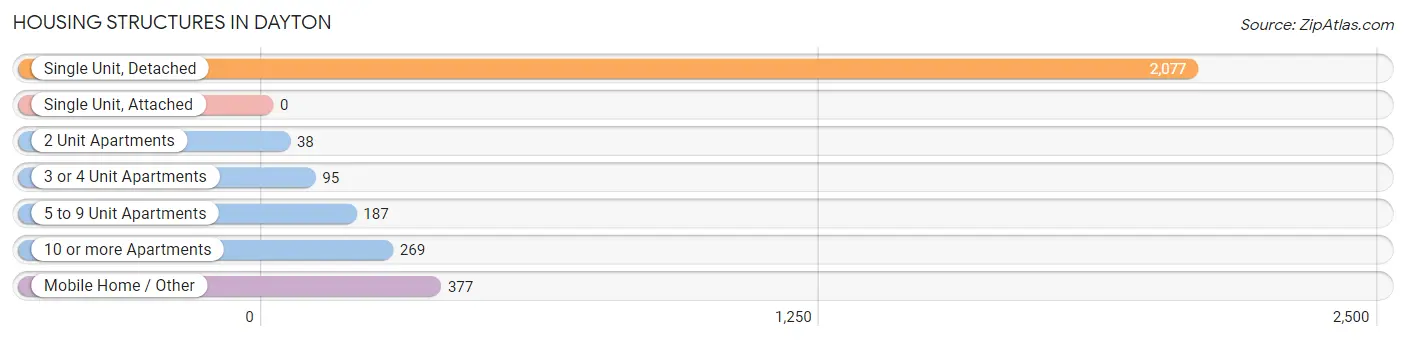
| Structure Type | # Housing Units | % Housing Units |
| Single Unit, Detached | 2,077 | 68.3% |
| Single Unit, Attached | 0 | 0.0% |
| 2 Unit Apartments | 38 | 1.3% |
| 3 or 4 Unit Apartments | 95 | 3.1% |
| 5 to 9 Unit Apartments | 187 | 6.1% |
| 10 or more Apartments | 269 | 8.8% |
| Mobile Home / Other | 377 | 12.4% |
| Total | 3,043 | 100.0% |
Housing Structures by Occupancy in Dayton
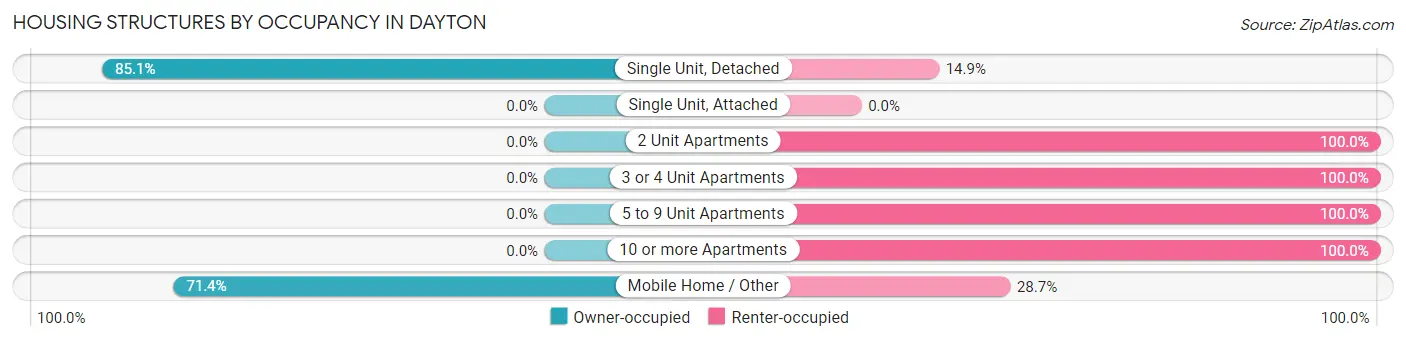
| Structure Type | Owner-occupied | Renter-occupied |
| Single Unit, Detached | 1,767 (85.1%) | 310 (14.9%) |
| Single Unit, Attached | 0 (0.0%) | 0 (0.0%) |
| 2 Unit Apartments | 0 (0.0%) | 38 (100.0%) |
| 3 or 4 Unit Apartments | 0 (0.0%) | 95 (100.0%) |
| 5 to 9 Unit Apartments | 0 (0.0%) | 187 (100.0%) |
| 10 or more Apartments | 0 (0.0%) | 269 (100.0%) |
| Mobile Home / Other | 269 (71.4%) | 108 (28.6%) |
| Total | 2,036 (66.9%) | 1,007 (33.1%) |
Housing Structures by Number of Rooms in Dayton
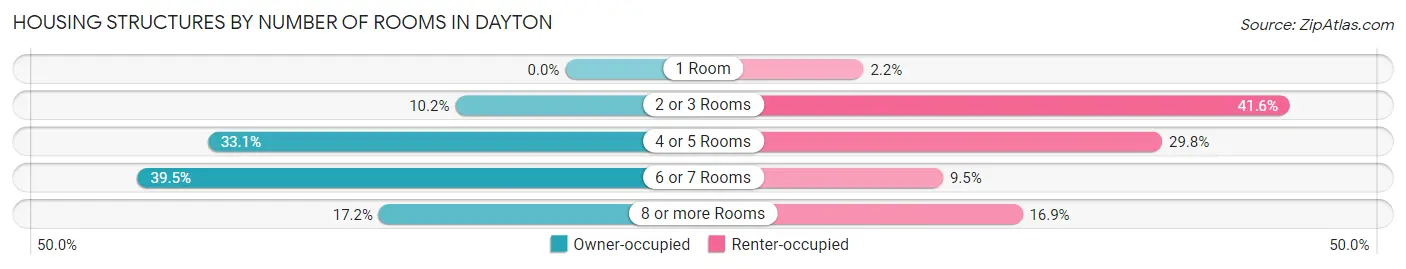
| Number of Rooms | Owner-occupied | Renter-occupied |
| 1 Room | 0 (0.0%) | 22 (2.2%) |
| 2 or 3 Rooms | 207 (10.2%) | 419 (41.6%) |
| 4 or 5 Rooms | 673 (33.1%) | 300 (29.8%) |
| 6 or 7 Rooms | 805 (39.5%) | 96 (9.5%) |
| 8 or more Rooms | 351 (17.2%) | 170 (16.9%) |
| Total | 2,036 (100.0%) | 1,007 (100.0%) |
Housing Structure by Heating Type in Dayton
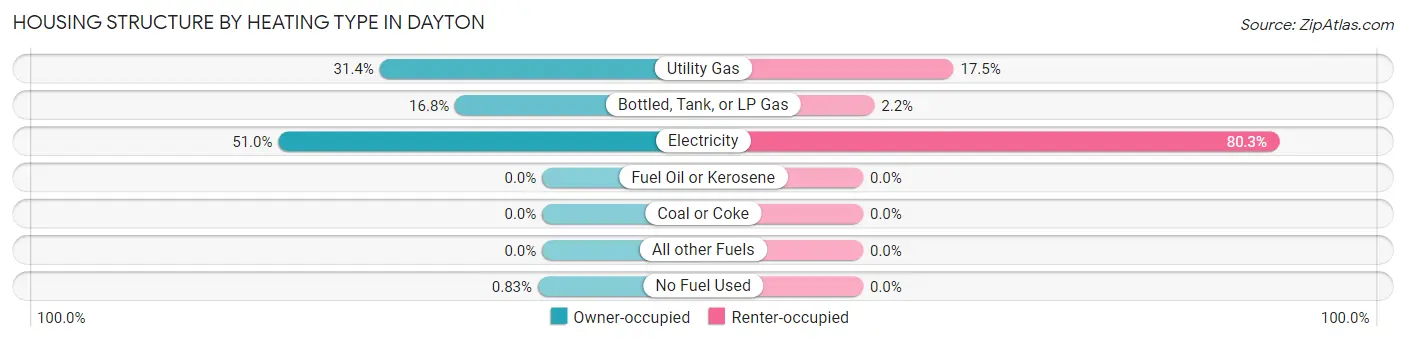
| Heating Type | Owner-occupied | Renter-occupied |
| Utility Gas | 639 (31.4%) | 176 (17.5%) |
| Bottled, Tank, or LP Gas | 342 (16.8%) | 22 (2.2%) |
| Electricity | 1,038 (51.0%) | 809 (80.3%) |
| Fuel Oil or Kerosene | 0 (0.0%) | 0 (0.0%) |
| Coal or Coke | 0 (0.0%) | 0 (0.0%) |
| All other Fuels | 0 (0.0%) | 0 (0.0%) |
| No Fuel Used | 17 (0.8%) | 0 (0.0%) |
| Total | 2,036 (100.0%) | 1,007 (100.0%) |
Household Vehicle Usage in Dayton
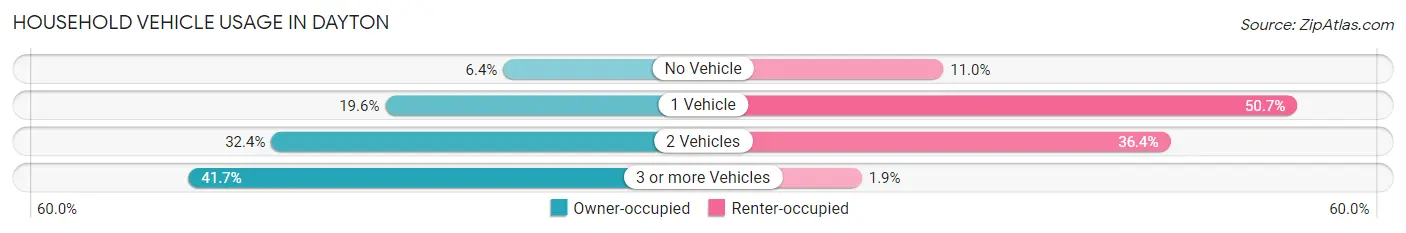
| Vehicles per Household | Owner-occupied | Renter-occupied |
| No Vehicle | 130 (6.4%) | 111 (11.0%) |
| 1 Vehicle | 399 (19.6%) | 510 (50.6%) |
| 2 Vehicles | 659 (32.4%) | 367 (36.4%) |
| 3 or more Vehicles | 848 (41.6%) | 19 (1.9%) |
| Total | 2,036 (100.0%) | 1,007 (100.0%) |
Real Estate & Mortgages in Dayton
Real Estate and Mortgage Overview in Dayton
| Characteristic | Without Mortgage | With Mortgage |
| Housing Units | 884 | 1,152 |
| Median Property Value | $98,100 | $233,900 |
| Median Household Income | $51,754 | $464 |
| Monthly Housing Costs | $501 | $71 |
| Real Estate Taxes | $2,389 | $49 |
Property Value by Mortgage Status in Dayton
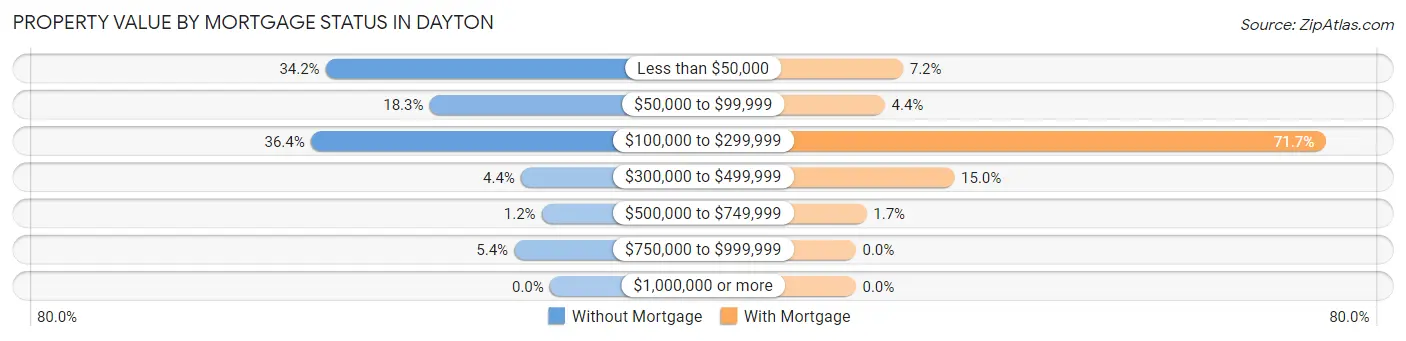
| Property Value | Without Mortgage | With Mortgage |
| Less than $50,000 | 302 (34.2%) | 83 (7.2%) |
| $50,000 to $99,999 | 162 (18.3%) | 51 (4.4%) |
| $100,000 to $299,999 | 322 (36.4%) | 826 (71.7%) |
| $300,000 to $499,999 | 39 (4.4%) | 173 (15.0%) |
| $500,000 to $749,999 | 11 (1.2%) | 19 (1.7%) |
| $750,000 to $999,999 | 48 (5.4%) | 0 (0.0%) |
| $1,000,000 or more | 0 (0.0%) | 0 (0.0%) |
| Total | 884 (100.0%) | 1,152 (100.0%) |
Household Income by Mortgage Status in Dayton
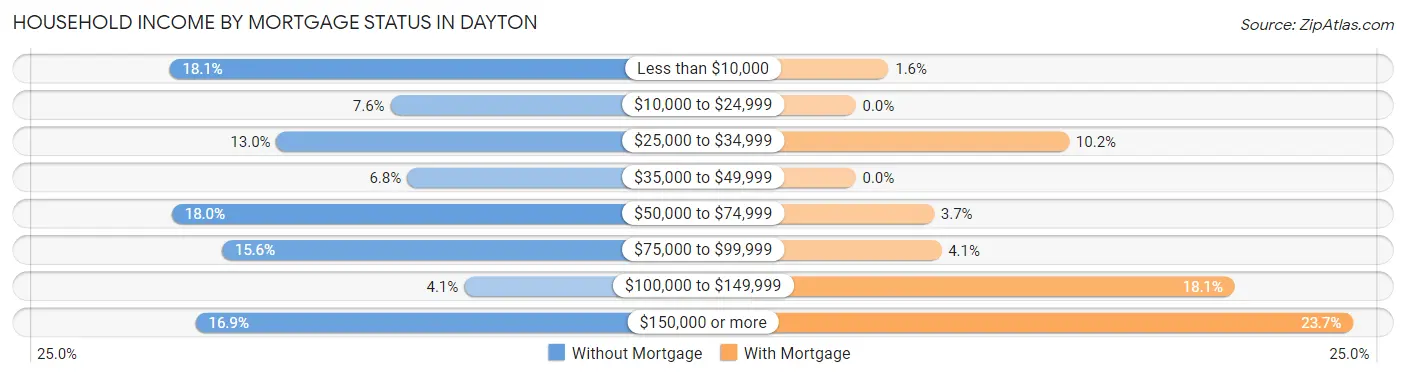
| Household Income | Without Mortgage | With Mortgage |
| Less than $10,000 | 160 (18.1%) | 18 (1.6%) |
| $10,000 to $24,999 | 67 (7.6%) | 0 (0.0%) |
| $25,000 to $34,999 | 115 (13.0%) | 117 (10.2%) |
| $35,000 to $49,999 | 60 (6.8%) | 0 (0.0%) |
| $50,000 to $74,999 | 159 (18.0%) | 43 (3.7%) |
| $75,000 to $99,999 | 138 (15.6%) | 47 (4.1%) |
| $100,000 to $149,999 | 36 (4.1%) | 208 (18.1%) |
| $150,000 or more | 149 (16.9%) | 273 (23.7%) |
| Total | 884 (100.0%) | 1,152 (100.0%) |
Property Value to Household Income Ratio in Dayton
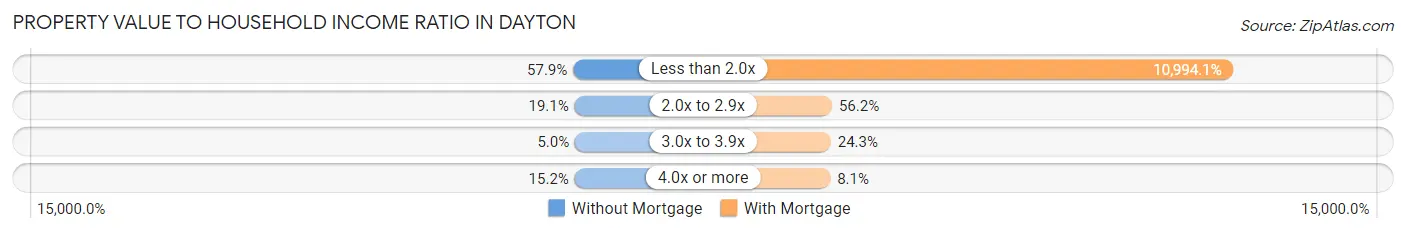
| Value-to-Income Ratio | Without Mortgage | With Mortgage |
| Less than 2.0x | 512 (57.9%) | 126,652 (10,994.1%) |
| 2.0x to 2.9x | 169 (19.1%) | 647 (56.2%) |
| 3.0x to 3.9x | 44 (5.0%) | 280 (24.3%) |
| 4.0x or more | 134 (15.2%) | 93 (8.1%) |
| Total | 884 (100.0%) | 1,152 (100.0%) |
Real Estate Taxes by Mortgage Status in Dayton
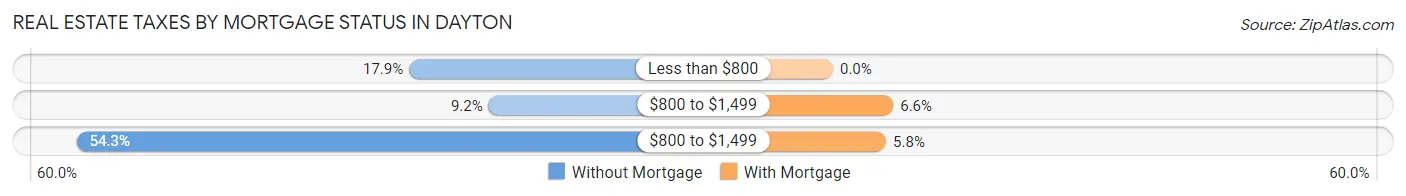
| Property Taxes | Without Mortgage | With Mortgage |
| Less than $800 | 158 (17.9%) | 0 (0.0%) |
| $800 to $1,499 | 81 (9.2%) | 76 (6.6%) |
| $800 to $1,499 | 480 (54.3%) | 67 (5.8%) |
| Total | 884 (100.0%) | 1,152 (100.0%) |
Health & Disability in Dayton
Health Insurance Coverage by Age in Dayton
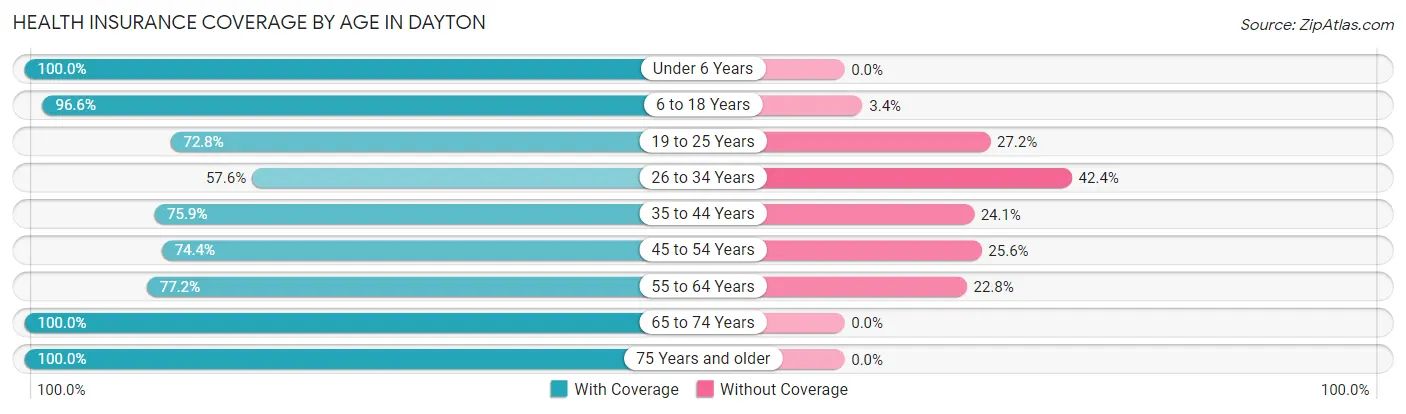
| Age Bracket | With Coverage | Without Coverage |
| Under 6 Years | 855 (100.0%) | 0 (0.0%) |
| 6 to 18 Years | 1,409 (96.6%) | 49 (3.4%) |
| 19 to 25 Years | 560 (72.8%) | 209 (27.2%) |
| 26 to 34 Years | 826 (57.6%) | 608 (42.4%) |
| 35 to 44 Years | 673 (75.9%) | 214 (24.1%) |
| 45 to 54 Years | 649 (74.4%) | 223 (25.6%) |
| 55 to 64 Years | 667 (77.2%) | 197 (22.8%) |
| 65 to 74 Years | 936 (100.0%) | 0 (0.0%) |
| 75 Years and older | 270 (100.0%) | 0 (0.0%) |
| Total | 6,845 (82.0%) | 1,500 (18.0%) |
Health Insurance Coverage by Citizenship Status in Dayton
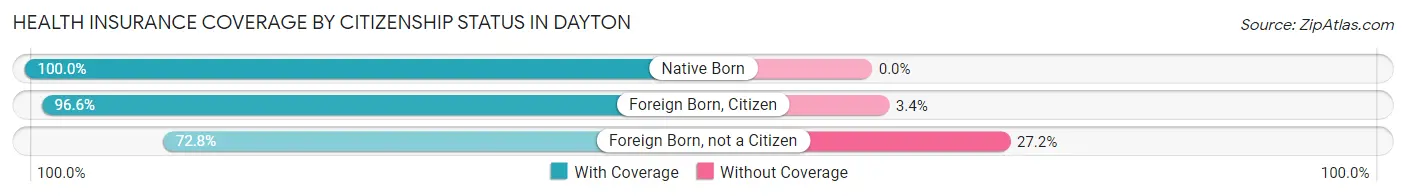
| Citizenship Status | With Coverage | Without Coverage |
| Native Born | 855 (100.0%) | 0 (0.0%) |
| Foreign Born, Citizen | 1,409 (96.6%) | 49 (3.4%) |
| Foreign Born, not a Citizen | 560 (72.8%) | 209 (27.2%) |
Health Insurance Coverage by Household Income in Dayton
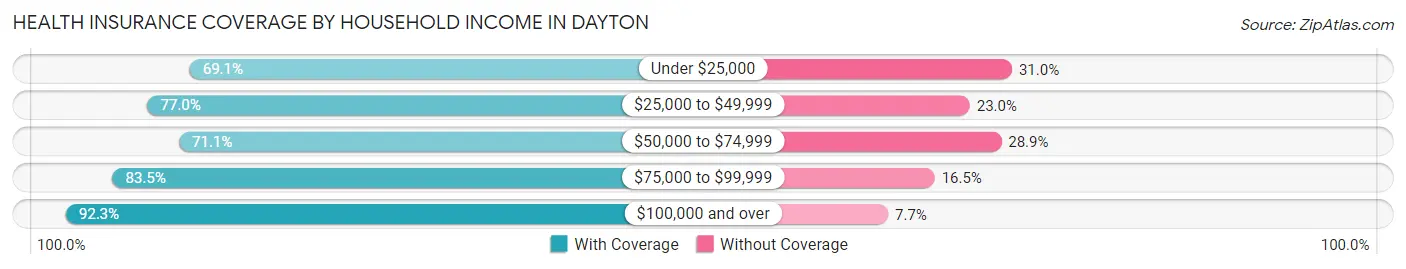
| Household Income | With Coverage | Without Coverage |
| Under $25,000 | 810 (69.1%) | 363 (30.9%) |
| $25,000 to $49,999 | 618 (77.0%) | 185 (23.0%) |
| $50,000 to $74,999 | 1,169 (71.1%) | 476 (28.9%) |
| $75,000 to $99,999 | 1,055 (83.5%) | 208 (16.5%) |
| $100,000 and over | 3,193 (92.3%) | 268 (7.7%) |
Public vs Private Health Insurance Coverage by Age in Dayton
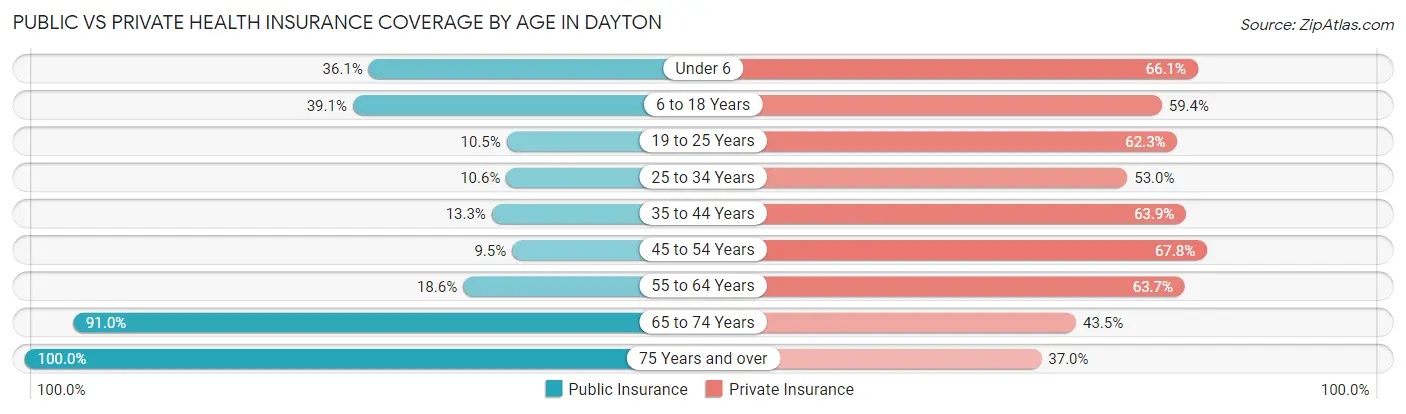
| Age Bracket | Public Insurance | Private Insurance |
| Under 6 | 309 (36.1%) | 565 (66.1%) |
| 6 to 18 Years | 570 (39.1%) | 866 (59.4%) |
| 19 to 25 Years | 81 (10.5%) | 479 (62.3%) |
| 25 to 34 Years | 152 (10.6%) | 760 (53.0%) |
| 35 to 44 Years | 118 (13.3%) | 567 (63.9%) |
| 45 to 54 Years | 83 (9.5%) | 591 (67.8%) |
| 55 to 64 Years | 161 (18.6%) | 550 (63.7%) |
| 65 to 74 Years | 852 (91.0%) | 407 (43.5%) |
| 75 Years and over | 270 (100.0%) | 100 (37.0%) |
| Total | 2,596 (31.1%) | 4,885 (58.5%) |
Disability Status by Sex by Age in Dayton
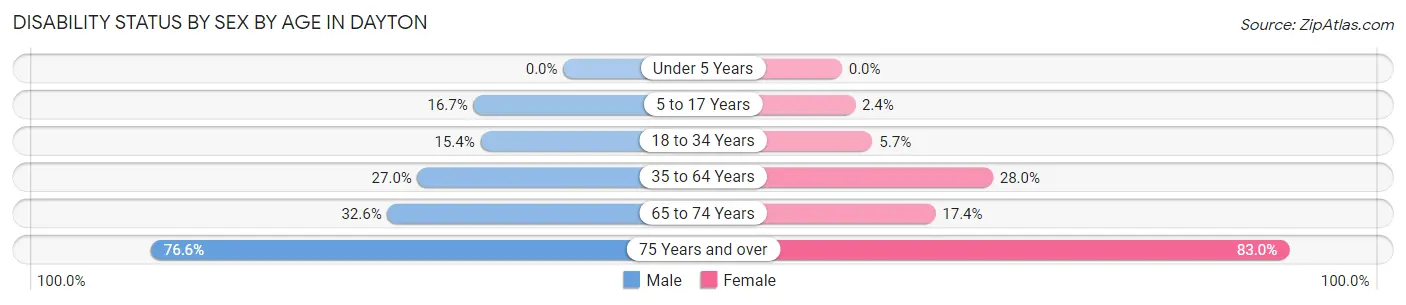
| Age Bracket | Male | Female |
| Under 5 Years | 0 (0.0%) | 0 (0.0%) |
| 5 to 17 Years | 122 (16.7%) | 22 (2.4%) |
| 18 to 34 Years | 178 (15.4%) | 61 (5.7%) |
| 35 to 64 Years | 331 (27.0%) | 392 (28.0%) |
| 65 to 74 Years | 142 (32.6%) | 87 (17.4%) |
| 75 Years and over | 49 (76.6%) | 171 (83.0%) |
Disability Class by Sex by Age in Dayton
Disability Class: Hearing Difficulty
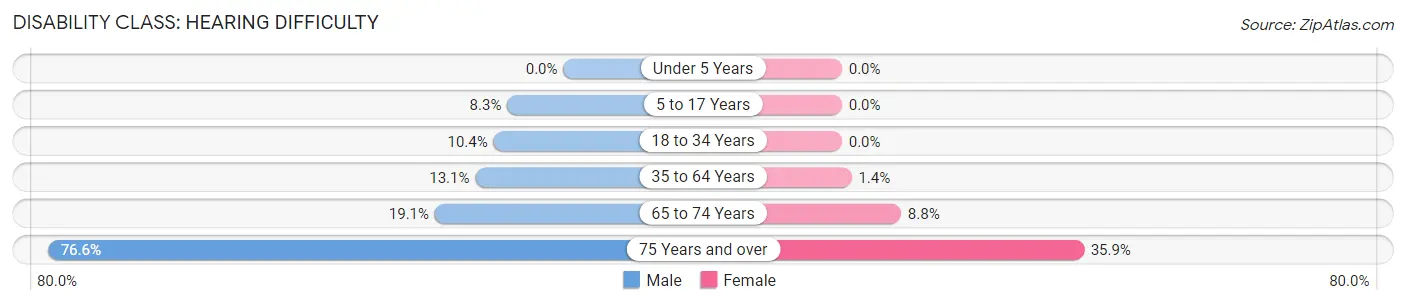
| Age Bracket | Male | Female |
| Under 5 Years | 0 (0.0%) | 0 (0.0%) |
| 5 to 17 Years | 61 (8.3%) | 0 (0.0%) |
| 18 to 34 Years | 120 (10.4%) | 0 (0.0%) |
| 35 to 64 Years | 160 (13.1%) | 20 (1.4%) |
| 65 to 74 Years | 83 (19.1%) | 44 (8.8%) |
| 75 Years and over | 49 (76.6%) | 74 (35.9%) |
Disability Class: Vision Difficulty
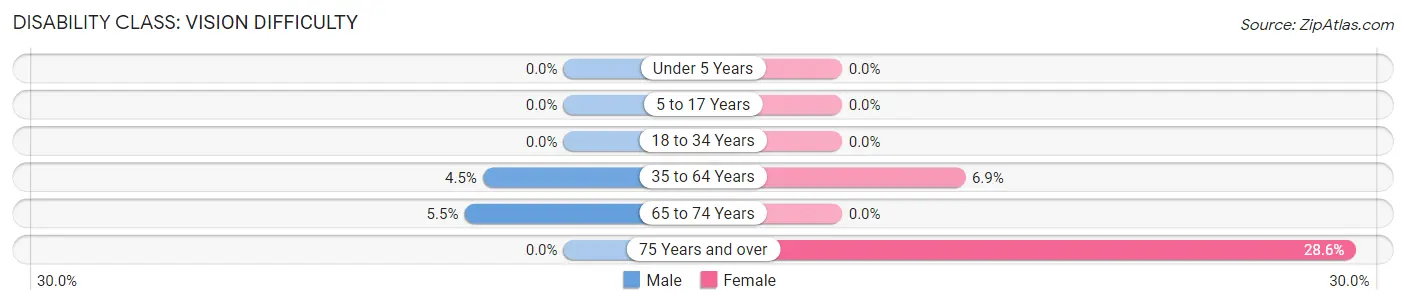
| Age Bracket | Male | Female |
| Under 5 Years | 0 (0.0%) | 0 (0.0%) |
| 5 to 17 Years | 0 (0.0%) | 0 (0.0%) |
| 18 to 34 Years | 0 (0.0%) | 0 (0.0%) |
| 35 to 64 Years | 55 (4.5%) | 96 (6.9%) |
| 65 to 74 Years | 24 (5.5%) | 0 (0.0%) |
| 75 Years and over | 0 (0.0%) | 59 (28.6%) |
Disability Class: Cognitive Difficulty
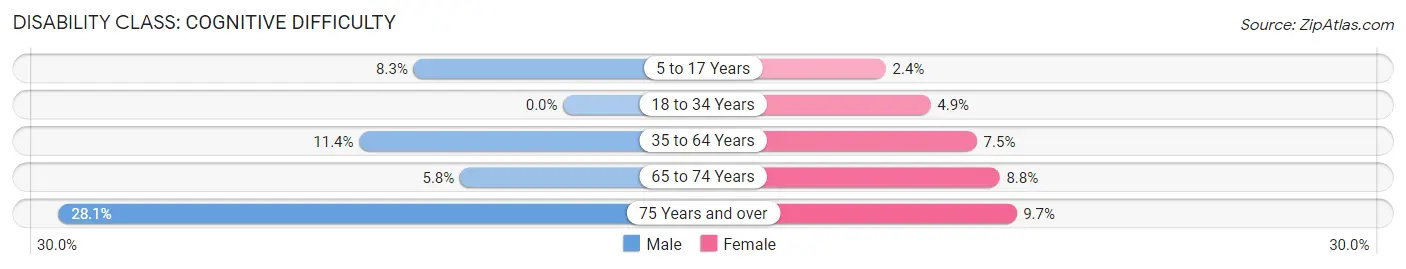
| Age Bracket | Male | Female |
| 5 to 17 Years | 61 (8.3%) | 22 (2.4%) |
| 18 to 34 Years | 0 (0.0%) | 53 (4.9%) |
| 35 to 64 Years | 139 (11.4%) | 105 (7.5%) |
| 65 to 74 Years | 25 (5.8%) | 44 (8.8%) |
| 75 Years and over | 18 (28.1%) | 20 (9.7%) |
Disability Class: Ambulatory Difficulty
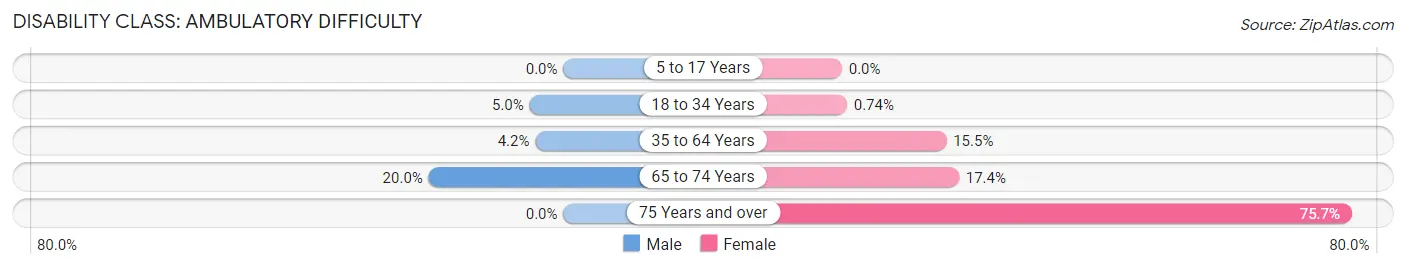
| Age Bracket | Male | Female |
| 5 to 17 Years | 0 (0.0%) | 0 (0.0%) |
| 18 to 34 Years | 58 (5.0%) | 8 (0.7%) |
| 35 to 64 Years | 51 (4.2%) | 217 (15.5%) |
| 65 to 74 Years | 87 (20.0%) | 87 (17.4%) |
| 75 Years and over | 0 (0.0%) | 156 (75.7%) |
Disability Class: Self-Care Difficulty
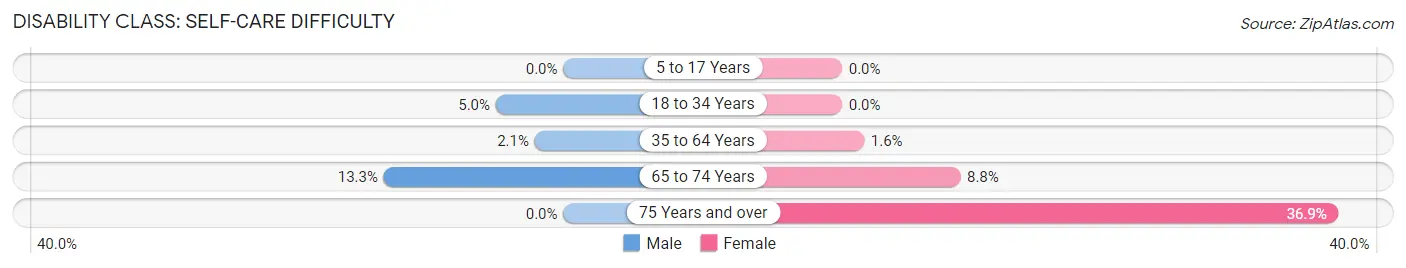
| Age Bracket | Male | Female |
| 5 to 17 Years | 0 (0.0%) | 0 (0.0%) |
| 18 to 34 Years | 58 (5.0%) | 0 (0.0%) |
| 35 to 64 Years | 26 (2.1%) | 23 (1.6%) |
| 65 to 74 Years | 58 (13.3%) | 44 (8.8%) |
| 75 Years and over | 0 (0.0%) | 76 (36.9%) |
Technology Access in Dayton
Computing Device Access in Dayton
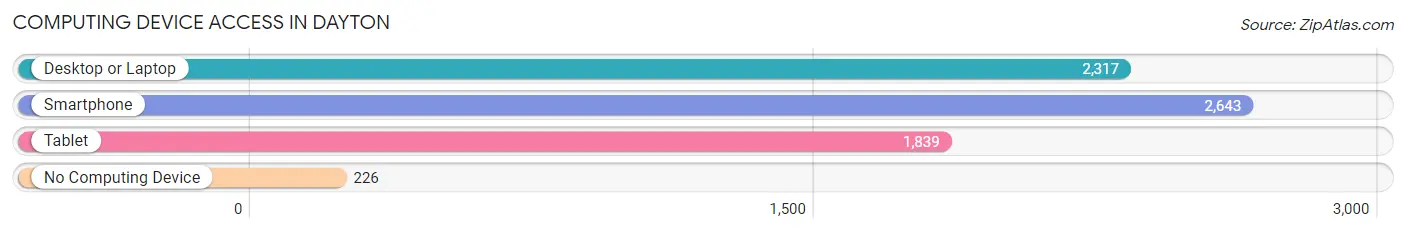
| Device Type | # Households | % Households |
| Desktop or Laptop | 2,317 | 76.1% |
| Smartphone | 2,643 | 86.9% |
| Tablet | 1,839 | 60.4% |
| No Computing Device | 226 | 7.4% |
| Total | 3,043 | 100.0% |
Internet Access in Dayton
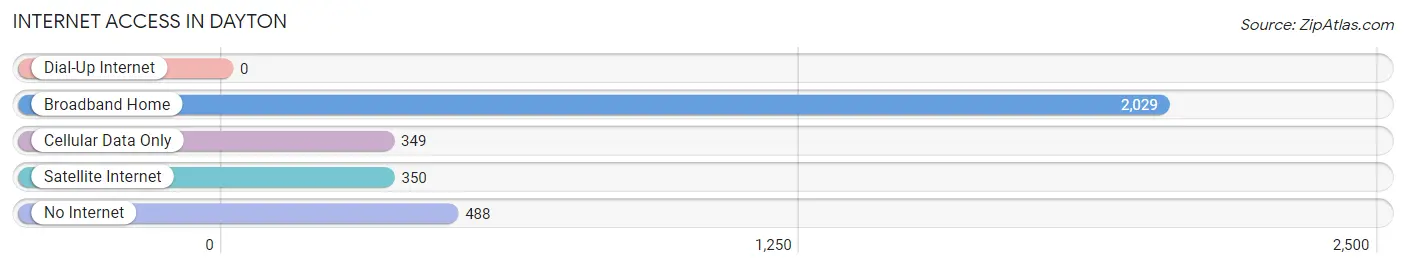
| Internet Type | # Households | % Households |
| Dial-Up Internet | 0 | 0.0% |
| Broadband Home | 2,029 | 66.7% |
| Cellular Data Only | 349 | 11.5% |
| Satellite Internet | 350 | 11.5% |
| No Internet | 488 | 16.0% |
| Total | 3,043 | 100.0% |
Dayton Summary
Dayton, Texas is a small city located in Liberty County, Texas, United States. It is situated on the banks of the Trinity River, about 40 miles northeast of Houston. The city has a population of approximately 7,000 people and is the county seat of Liberty County.
History
Dayton was founded in 1877 by John H. Dayton, a former Confederate soldier. He purchased land from the local Atascosito Indians and established a trading post. The town was originally called West Liberty, but was later changed to Dayton in honor of its founder.
In 1891, the town was incorporated and the first mayor was elected. The town grew rapidly and by 1900, it had a population of 1,000. The town was a major shipping point for cotton and other agricultural products.
In the early 1900s, the town was a major center for oil production. The first oil well was drilled in Dayton in 1901 and by the 1920s, the town was producing more than 1 million barrels of oil a year.
The town continued to grow and by the 1950s, it had a population of over 5,000. The town was also home to several manufacturing plants, including a paper mill and a furniture factory.
Geography
Dayton is located in Liberty County, Texas, United States. It is situated on the banks of the Trinity River, about 40 miles northeast of Houston. The city has a total area of 4.3 square miles, all of which is land.
The climate in Dayton is humid subtropical, with hot summers and mild winters. The average annual temperature is 68°F and the average annual precipitation is 48 inches.
Economy
Dayton’s economy is largely based on agriculture and oil production. The town is home to several large farms that produce cotton, corn, soybeans, and other crops. The town is also home to several oil and gas companies, including Chevron and ExxonMobil.
The town is also home to several manufacturing plants, including a paper mill and a furniture factory. The town is also home to several retail stores, restaurants, and other businesses.
Demographics
As of the 2010 census, Dayton had a population of 7,000 people. The racial makeup of the town was 75.3% White, 17.2% African American, 0.7% Native American, 0.3% Asian, and 6.5% from other races. Hispanic or Latino of any race were 11.2% of the population.
The median income for a household in Dayton was $37,500 and the median income for a family was $45,000. The per capita income for the town was $18,000. About 17.2% of the population was below the poverty line.
Dayton is a small town with a rich history and a diverse economy. The town is home to several large farms, oil and gas companies, and manufacturing plants. The town is also home to several retail stores, restaurants, and other businesses. The town has a population of approximately 7,000 people and is the county seat of Liberty County.
Common Questions
What is Per Capita Income in Dayton?
Per Capita income in Dayton is $32,719.
What is the Median Family Income in Dayton?
Median Family Income in Dayton is $82,133.
What is the Median Household income in Dayton?
Median Household Income in Dayton is $59,848.
What is Income or Wage Gap in Dayton?
Income or Wage Gap in Dayton is 39.8%.
Women in Dayton earn 60.2 cents for every dollar earned by a man.
What is Family Income Deficit in Dayton?
Family Income Deficit in Dayton is $7,716.
Families that are below poverty line in Dayton earn $7,716 less on average than the poverty threshold level.
What is Inequality or Gini Index in Dayton?
Inequality or Gini Index in Dayton is 0.47.
What is the Total Population of Dayton?
Total Population of Dayton is 8,839.
What is the Total Male Population of Dayton?
Total Male Population of Dayton is 4,164.
What is the Total Female Population of Dayton?
Total Female Population of Dayton is 4,675.
What is the Ratio of Males per 100 Females in Dayton?
There are 89.07 Males per 100 Females in Dayton.
What is the Ratio of Females per 100 Males in Dayton?
There are 112.27 Females per 100 Males in Dayton.
What is the Median Population Age in Dayton?
Median Population Age in Dayton is 32.4 Years.
What is the Average Family Size in Dayton
Average Family Size in Dayton is 3.5 People.
What is the Average Household Size in Dayton
Average Household Size in Dayton is 2.7 People.
How Large is the Labor Force in Dayton?
There are 4,054 People in the Labor Forcein in Dayton.
What is the Percentage of People in the Labor Force in Dayton?
59.7% of People are in the Labor Force in Dayton.
What is the Unemployment Rate in Dayton?
Unemployment Rate in Dayton is 3.5%.