Cuney, TX Map & Demographics
Cuney Map
Cuney Overview
$15,967
PER CAPITA INCOME
$26,406
AVG HOUSEHOLD INCOME
0.49
INEQUALITY / GINI INDEX
163
TOTAL POPULATION
57
MALE POPULATION
106
FEMALE POPULATION
53.77
MALES / 100 FEMALES
185.96
FEMALES / 100 MALES
46.4
MEDIAN AGE
3.4
AVG FAMILY SIZE
2.9
AVG HOUSEHOLD SIZE
68
LABOR FORCE [ PEOPLE ]
49.6%
PERCENT IN LABOR FORCE
1.5%
UNEMPLOYMENT RATE
Cuney Zip Codes
Income in Cuney
Income Overview in Cuney
| Characteristic | Number | Measure |
| Per Capita Income | 163 | $15,967 |
| Median Family Income | 45 | $0 |
| Mean Family Income | 45 | $60,633 |
| Median Household Income | 57 | $26,406 |
| Mean Household Income | 57 | $50,030 |
| Income Deficit | 45 | $0 |
| Wage / Income Gap (%) | 163 | 0.00% |
| Wage / Income Gap ($) | 163 | 100.00¢ per $1 |
| Gini / Inequality Index | 163 | 0.49 |
Earnings by Sex in Cuney
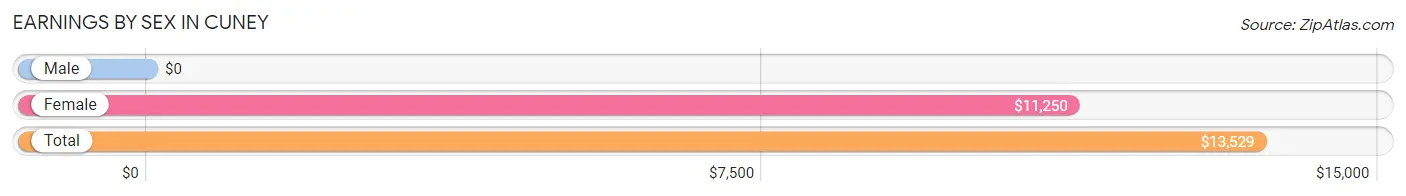
| Sex | Number | Average Earnings |
| Male | 14 (18.9%) | $0 |
| Female | 60 (81.1%) | $11,250 |
| Total | 74 (100.0%) | $13,529 |
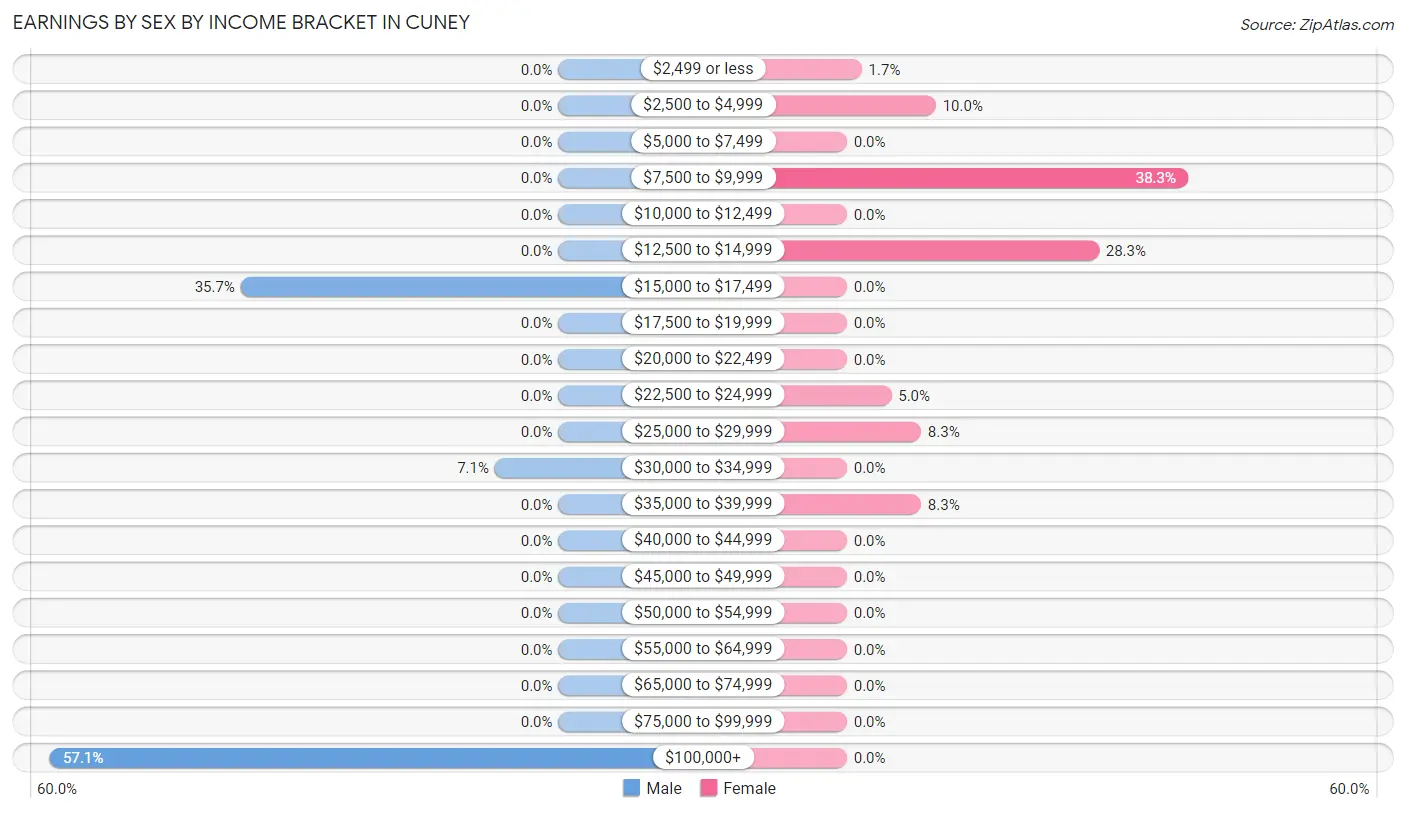
Earnings by Sex by Income Bracket in Cuney
The most common earnings brackets in Cuney are $100,000+ for men (8 | 57.1%) and $7,500 to $9,999 for women (23 | 38.3%).
| Income | Male | Female |
| $2,499 or less | 0 (0.0%) | 1 (1.7%) |
| $2,500 to $4,999 | 0 (0.0%) | 6 (10.0%) |
| $5,000 to $7,499 | 0 (0.0%) | 0 (0.0%) |
| $7,500 to $9,999 | 0 (0.0%) | 23 (38.3%) |
| $10,000 to $12,499 | 0 (0.0%) | 0 (0.0%) |
| $12,500 to $14,999 | 0 (0.0%) | 17 (28.3%) |
| $15,000 to $17,499 | 5 (35.7%) | 0 (0.0%) |
| $17,500 to $19,999 | 0 (0.0%) | 0 (0.0%) |
| $20,000 to $22,499 | 0 (0.0%) | 0 (0.0%) |
| $22,500 to $24,999 | 0 (0.0%) | 3 (5.0%) |
| $25,000 to $29,999 | 0 (0.0%) | 5 (8.3%) |
| $30,000 to $34,999 | 1 (7.1%) | 0 (0.0%) |
| $35,000 to $39,999 | 0 (0.0%) | 5 (8.3%) |
| $40,000 to $44,999 | 0 (0.0%) | 0 (0.0%) |
| $45,000 to $49,999 | 0 (0.0%) | 0 (0.0%) |
| $50,000 to $54,999 | 0 (0.0%) | 0 (0.0%) |
| $55,000 to $64,999 | 0 (0.0%) | 0 (0.0%) |
| $65,000 to $74,999 | 0 (0.0%) | 0 (0.0%) |
| $75,000 to $99,999 | 0 (0.0%) | 0 (0.0%) |
| $100,000+ | 8 (57.1%) | 0 (0.0%) |
| Total | 14 (100.0%) | 60 (100.0%) |
Earnings by Sex by Educational Attainment in Cuney
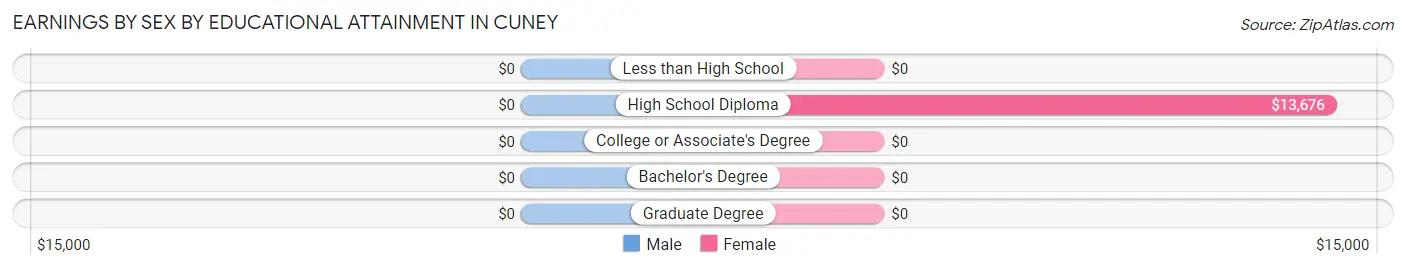
| Educational Attainment | Male Income | Female Income |
| Less than High School | - | - |
| High School Diploma | - | - |
| College or Associate's Degree | - | - |
| Bachelor's Degree | - | - |
| Graduate Degree | - | - |
| Total | - | - |
Family Income in Cuney
Family Income Brackets in Cuney
According to the Cuney family income data, there are 15 families falling into the $15,000 to $24,999 income range, which is the most common income bracket and makes up 33.3% of all families.
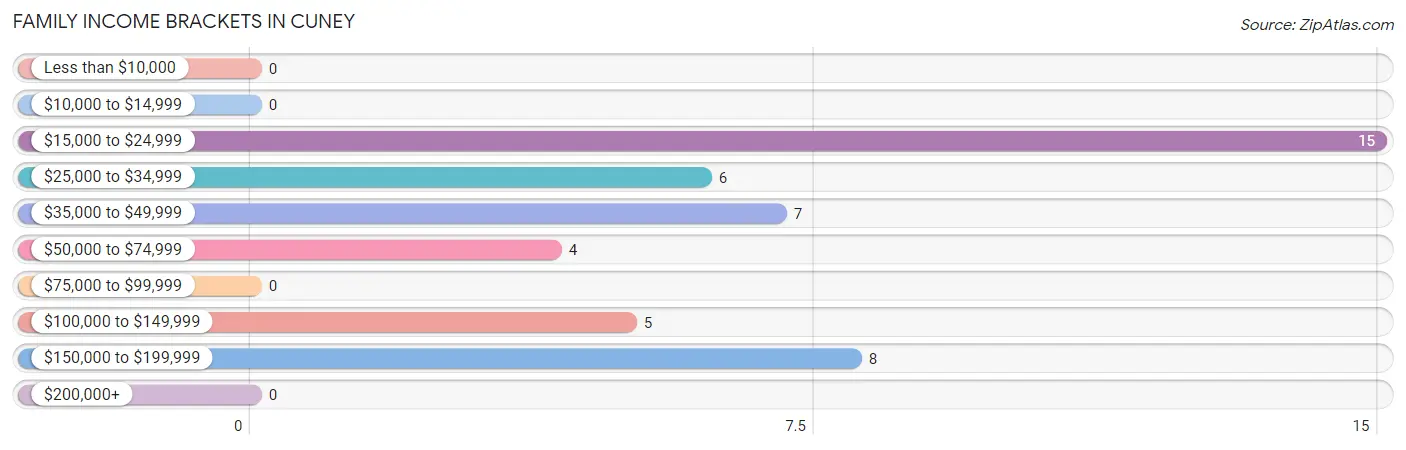
| Income Bracket | # Families | % Families |
| Less than $10,000 | 0 | 0.0% |
| $10,000 to $14,999 | 0 | 0.0% |
| $15,000 to $24,999 | 15 | 33.3% |
| $25,000 to $34,999 | 6 | 13.3% |
| $35,000 to $49,999 | 7 | 15.6% |
| $50,000 to $74,999 | 4 | 8.9% |
| $75,000 to $99,999 | 0 | 0.0% |
| $100,000 to $149,999 | 5 | 11.1% |
| $150,000 to $199,999 | 8 | 17.8% |
| $200,000+ | 0 | 0.0% |
Family Income by Famaliy Size in Cuney
3-person families (25 | 55.6%) account for the highest median family income in Cuney with $24,583 per family, while 3-person families (25 | 55.6%) have the highest median income of $8,194 per family member.
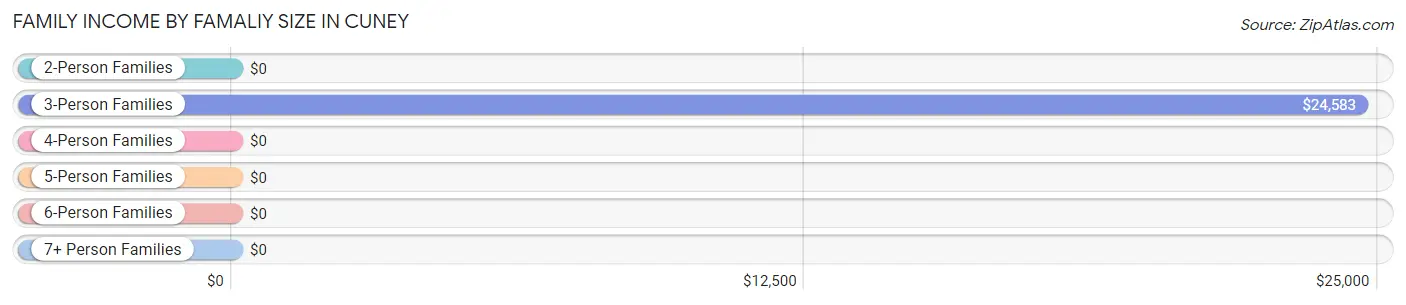
| Income Bracket | # Families | Median Income |
| 2-Person Families | 11 (24.4%) | $0 |
| 3-Person Families | 25 (55.6%) | $24,583 |
| 4-Person Families | 9 (20.0%) | $0 |
| 5-Person Families | 0 (0.0%) | $0 |
| 6-Person Families | 0 (0.0%) | $0 |
| 7+ Person Families | 0 (0.0%) | $0 |
| Total | 45 (100.0%) | $0 |
Family Income by Number of Earners in Cuney
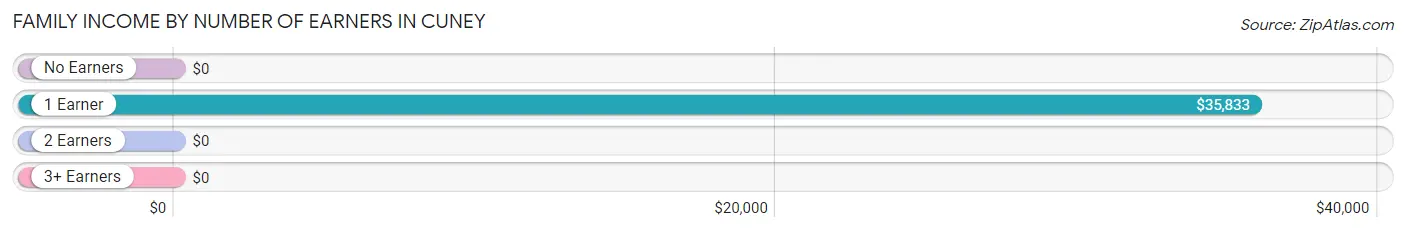
| Number of Earners | # Families | Median Income |
| No Earners | 0 (0.0%) | $0 |
| 1 Earner | 16 (35.6%) | $35,833 |
| 2 Earners | 29 (64.4%) | $0 |
| 3+ Earners | 0 (0.0%) | $0 |
| Total | 45 (100.0%) | $0 |
Household Income in Cuney
Household Income Brackets in Cuney
With 15 households falling in the category, the $15,000 to $24,999 income range is the most frequent in Cuney, accounting for 26.3% of all households.
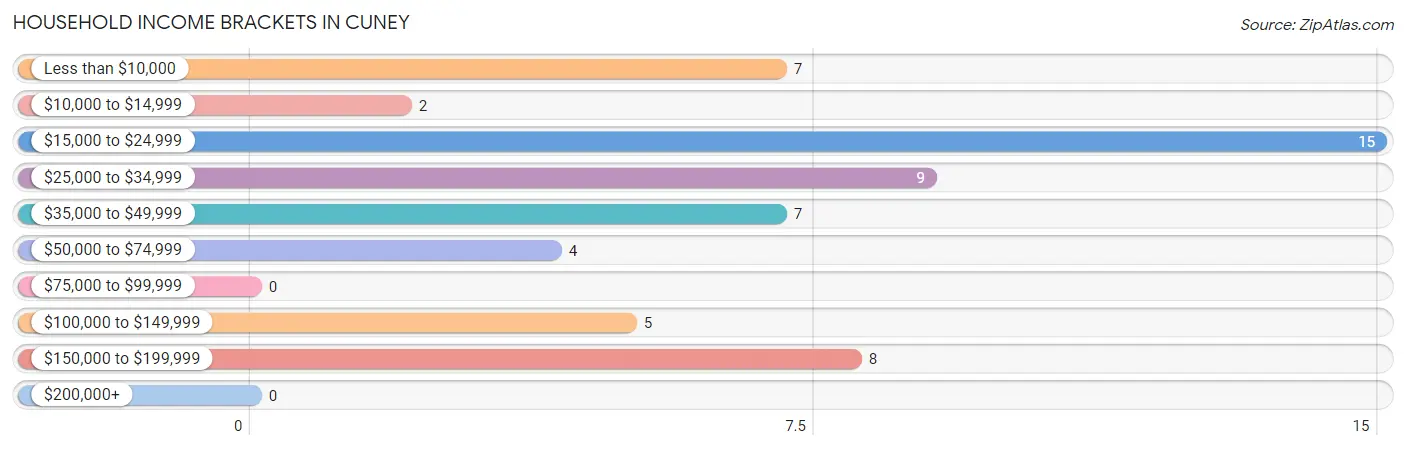
| Income Bracket | # Households | % Households |
| Less than $10,000 | 7 | 12.3% |
| $10,000 to $14,999 | 2 | 3.5% |
| $15,000 to $24,999 | 15 | 26.3% |
| $25,000 to $34,999 | 9 | 15.8% |
| $35,000 to $49,999 | 7 | 12.3% |
| $50,000 to $74,999 | 4 | 7.0% |
| $75,000 to $99,999 | 0 | 0.0% |
| $100,000 to $149,999 | 5 | 8.8% |
| $150,000 to $199,999 | 8 | 14.0% |
| $200,000+ | 0 | 0.0% |
Household Income by Householder Age in Cuney
The median household income in Cuney is $26,406, with the highest median household income of $35,179 found in the 65+ years age bracket for the primary householder. A total of 21 households (36.8%) fall into this category.
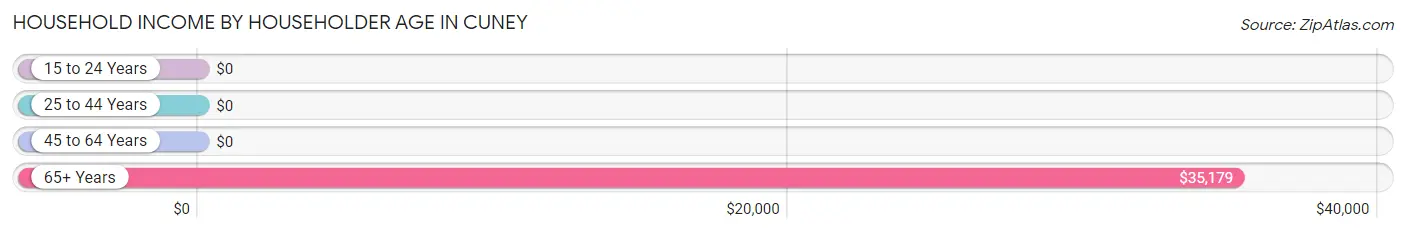
| Income Bracket | # Households | Median Income |
| 15 to 24 Years | 0 (0.0%) | $0 |
| 25 to 44 Years | 0 (0.0%) | $0 |
| 45 to 64 Years | 36 (63.2%) | $0 |
| 65+ Years | 21 (36.8%) | $35,179 |
| Total | 57 (100.0%) | $26,406 |
Poverty in Cuney
Income Below Poverty by Sex and Age in Cuney
With 12.3% poverty level for males and 49.1% for females among the residents of Cuney, 45 to 54 year old males and 12 to 14 year old females are the most vulnerable to poverty, with 6 males (100.0%) and 18 females (100.0%) in their respective age groups living below the poverty level.
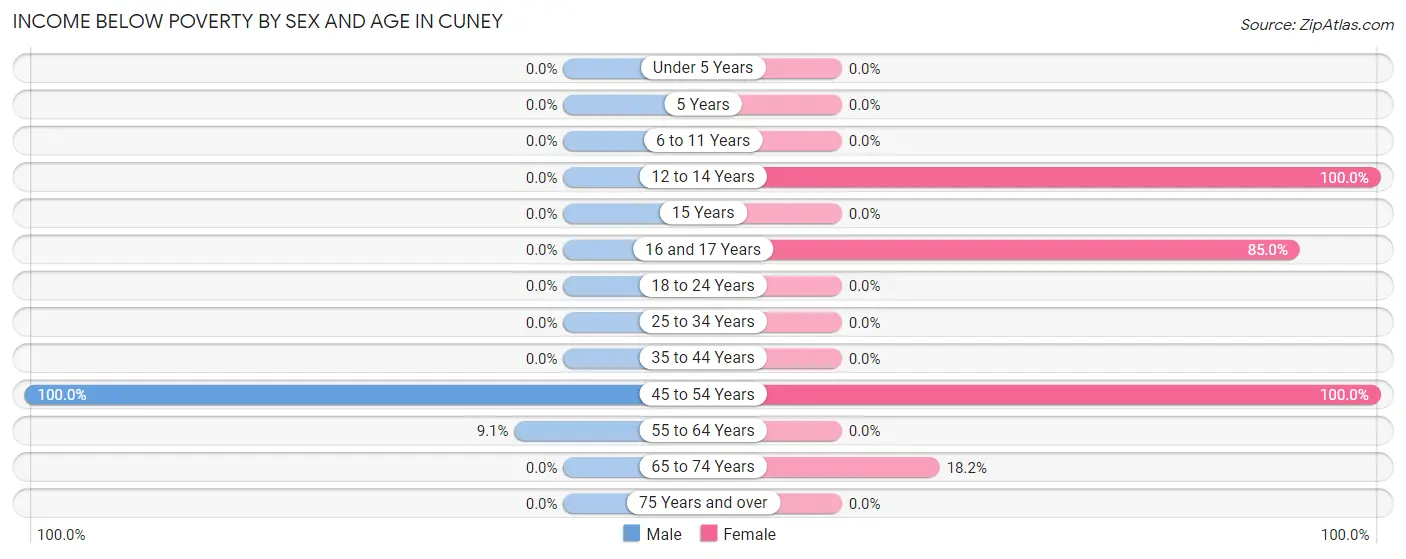
| Age Bracket | Male | Female |
| Under 5 Years | 0 (0.0%) | 0 (0.0%) |
| 5 Years | 0 (0.0%) | 0 (0.0%) |
| 6 to 11 Years | 0 (0.0%) | 0 (0.0%) |
| 12 to 14 Years | 0 (0.0%) | 18 (100.0%) |
| 15 Years | 0 (0.0%) | 0 (0.0%) |
| 16 and 17 Years | 0 (0.0%) | 17 (85.0%) |
| 18 to 24 Years | 0 (0.0%) | 0 (0.0%) |
| 25 to 34 Years | 0 (0.0%) | 0 (0.0%) |
| 35 to 44 Years | 0 (0.0%) | 0 (0.0%) |
| 45 to 54 Years | 6 (100.0%) | 15 (100.0%) |
| 55 to 64 Years | 1 (9.1%) | 0 (0.0%) |
| 65 to 74 Years | 0 (0.0%) | 2 (18.2%) |
| 75 Years and over | 0 (0.0%) | 0 (0.0%) |
| Total | 7 (12.3%) | 52 (49.1%) |
Income Above Poverty by Sex and Age in Cuney
According to the poverty statistics in Cuney, males aged 6 to 11 years and females aged 6 to 11 years are the age groups that are most secure financially, with 100.0% of males and 100.0% of females in these age groups living above the poverty line.
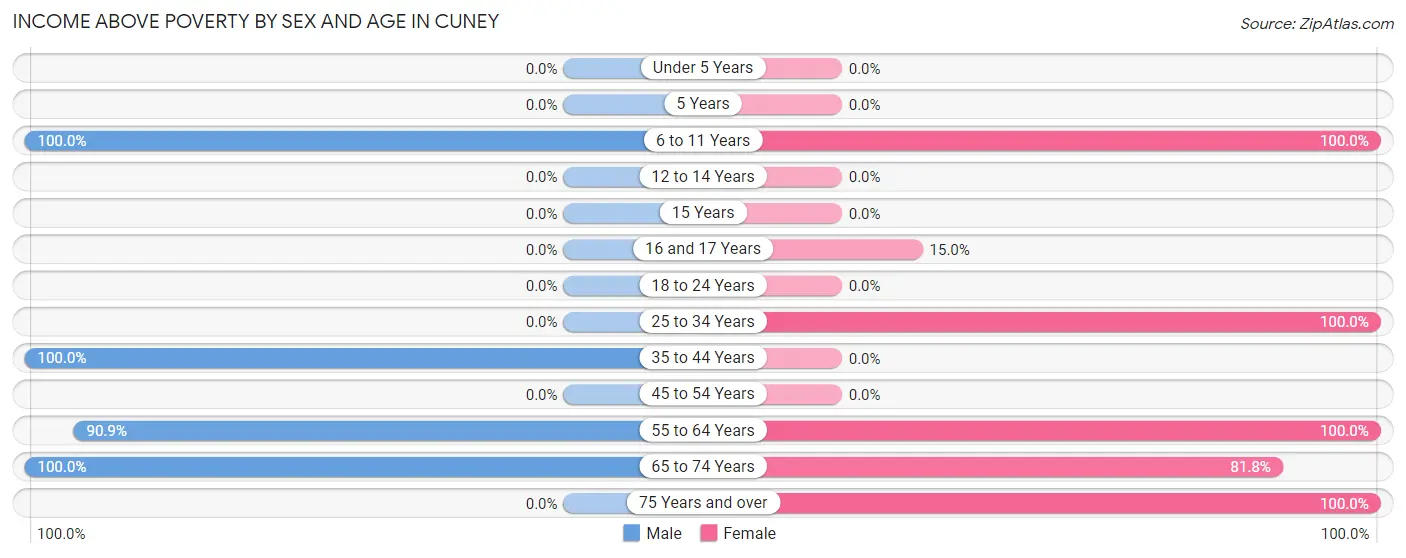
| Age Bracket | Male | Female |
| Under 5 Years | 0 (0.0%) | 0 (0.0%) |
| 5 Years | 0 (0.0%) | 0 (0.0%) |
| 6 to 11 Years | 2 (100.0%) | 6 (100.0%) |
| 12 to 14 Years | 0 (0.0%) | 0 (0.0%) |
| 15 Years | 0 (0.0%) | 0 (0.0%) |
| 16 and 17 Years | 0 (0.0%) | 3 (15.0%) |
| 18 to 24 Years | 0 (0.0%) | 0 (0.0%) |
| 25 to 34 Years | 0 (0.0%) | 6 (100.0%) |
| 35 to 44 Years | 23 (100.0%) | 0 (0.0%) |
| 45 to 54 Years | 0 (0.0%) | 0 (0.0%) |
| 55 to 64 Years | 10 (90.9%) | 17 (100.0%) |
| 65 to 74 Years | 15 (100.0%) | 9 (81.8%) |
| 75 Years and over | 0 (0.0%) | 13 (100.0%) |
| Total | 50 (87.7%) | 54 (50.9%) |
Income Below Poverty Among Married-Couple Families in Cuney
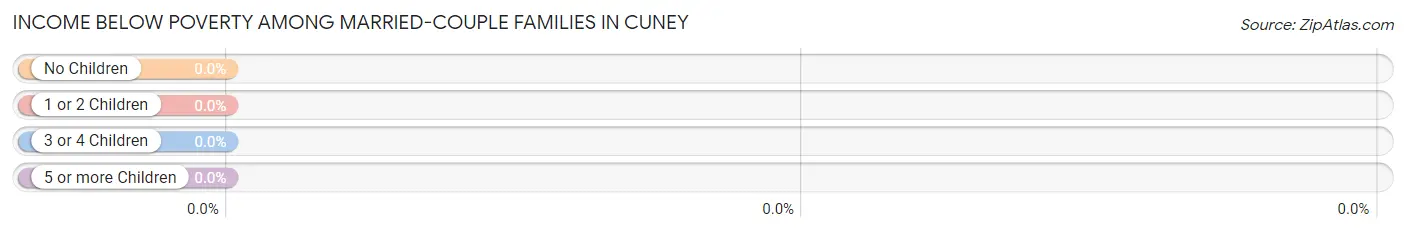
| Children | Above Poverty | Below Poverty |
| No Children | 23 (100.0%) | 0 (0.0%) |
| 1 or 2 Children | 0 (0.0%) | 0 (0.0%) |
| 3 or 4 Children | 0 (0.0%) | 0 (0.0%) |
| 5 or more Children | 0 (0.0%) | 0 (0.0%) |
| Total | 23 (100.0%) | 0 (0.0%) |
Income Below Poverty Among Single-Parent Households in Cuney
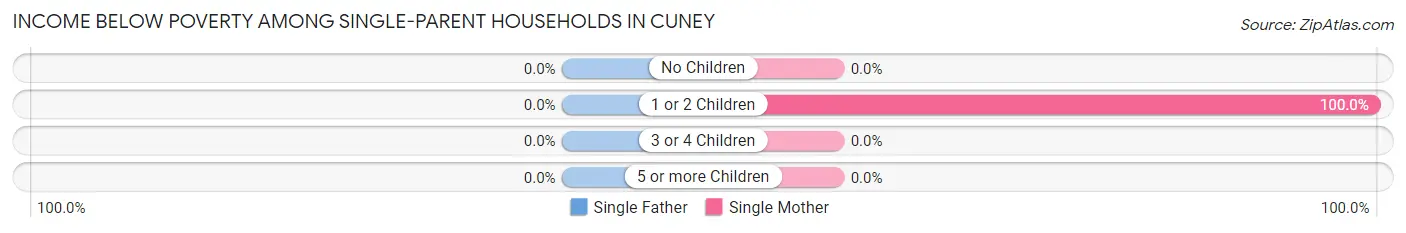
| Children | Single Father | Single Mother |
| No Children | 0 (0.0%) | 0 (0.0%) |
| 1 or 2 Children | 0 (0.0%) | 15 (100.0%) |
| 3 or 4 Children | 0 (0.0%) | 0 (0.0%) |
| 5 or more Children | 0 (0.0%) | 0 (0.0%) |
| Total | 0 (0.0%) | 15 (68.2%) |
Income Below Poverty Among Married-Couple vs Single-Parent Households in Cuney
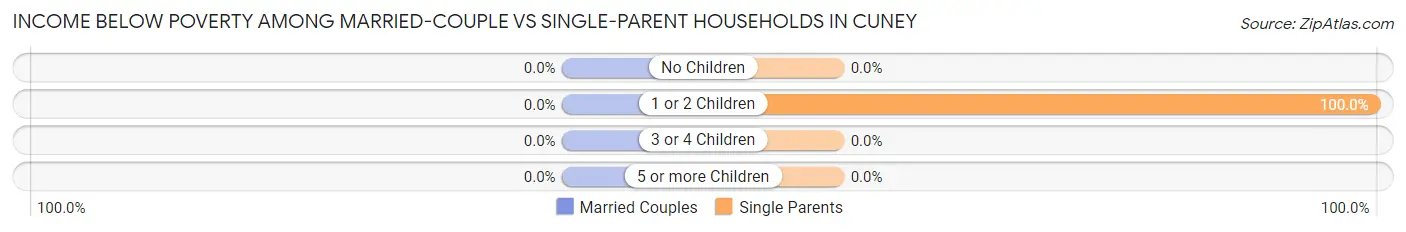
| Children | Married-Couple Families | Single-Parent Households |
| No Children | 0 (0.0%) | 0 (0.0%) |
| 1 or 2 Children | 0 (0.0%) | 15 (100.0%) |
| 3 or 4 Children | 0 (0.0%) | 0 (0.0%) |
| 5 or more Children | 0 (0.0%) | 0 (0.0%) |
| Total | 0 (0.0%) | 15 (68.2%) |
Race in Cuney
The most populous races in Cuney are Hispanic or Latino (63 | 38.7%), Black / African American (59 | 36.2%), and White / Caucasian (54 | 33.1%).
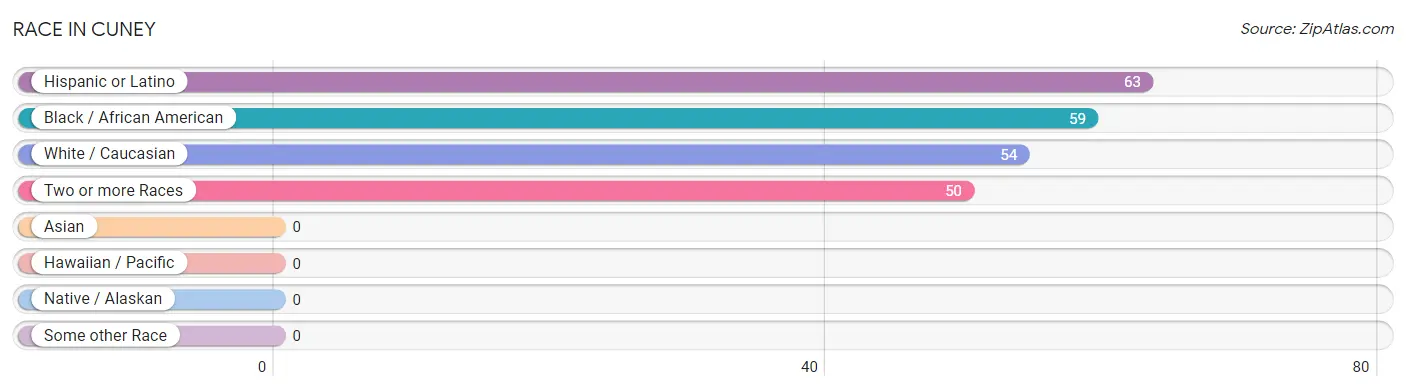
| Race | # Population | % Population |
| Asian | 0 | 0.0% |
| Black / African American | 59 | 36.2% |
| Hawaiian / Pacific | 0 | 0.0% |
| Hispanic or Latino | 63 | 38.7% |
| Native / Alaskan | 0 | 0.0% |
| White / Caucasian | 54 | 33.1% |
| Two or more Races | 50 | 30.7% |
| Some other Race | 0 | 0.0% |
| Total | 163 | 100.0% |
Ancestry in Cuney
The most populous ancestries reported in Cuney are Mexican (63 | 38.7%), American (17 | 10.4%), German (13 | 8.0%), Irish (12 | 7.4%), and Dutch (11 | 6.8%), together accounting for 71.2% of all Cuney residents.
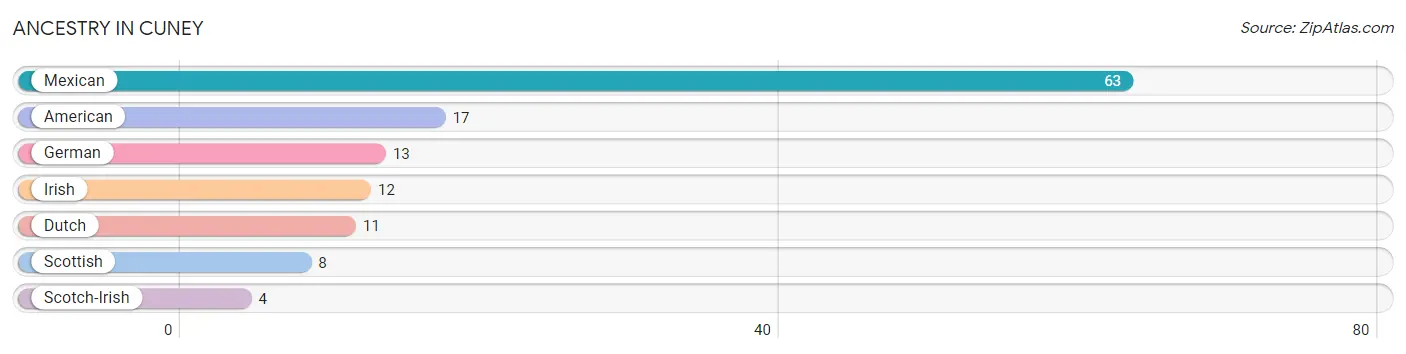
| Ancestry | # Population | % Population |
| American | 17 | 10.4% |
| Dutch | 11 | 6.8% |
| German | 13 | 8.0% |
| Irish | 12 | 7.4% |
| Mexican | 63 | 38.7% |
| Scotch-Irish | 4 | 2.5% |
| Scottish | 8 | 4.9% | View All 7 Rows |
Immigrants in Cuney

| Immigration Origin | # Population | % Population | View All 0 Rows |
Sex and Age in Cuney
Sex and Age in Cuney
The most populous age groups in Cuney are 35 to 39 Years (23 | 40.4%) for men and 15 to 19 Years (20 | 18.9%) for women.
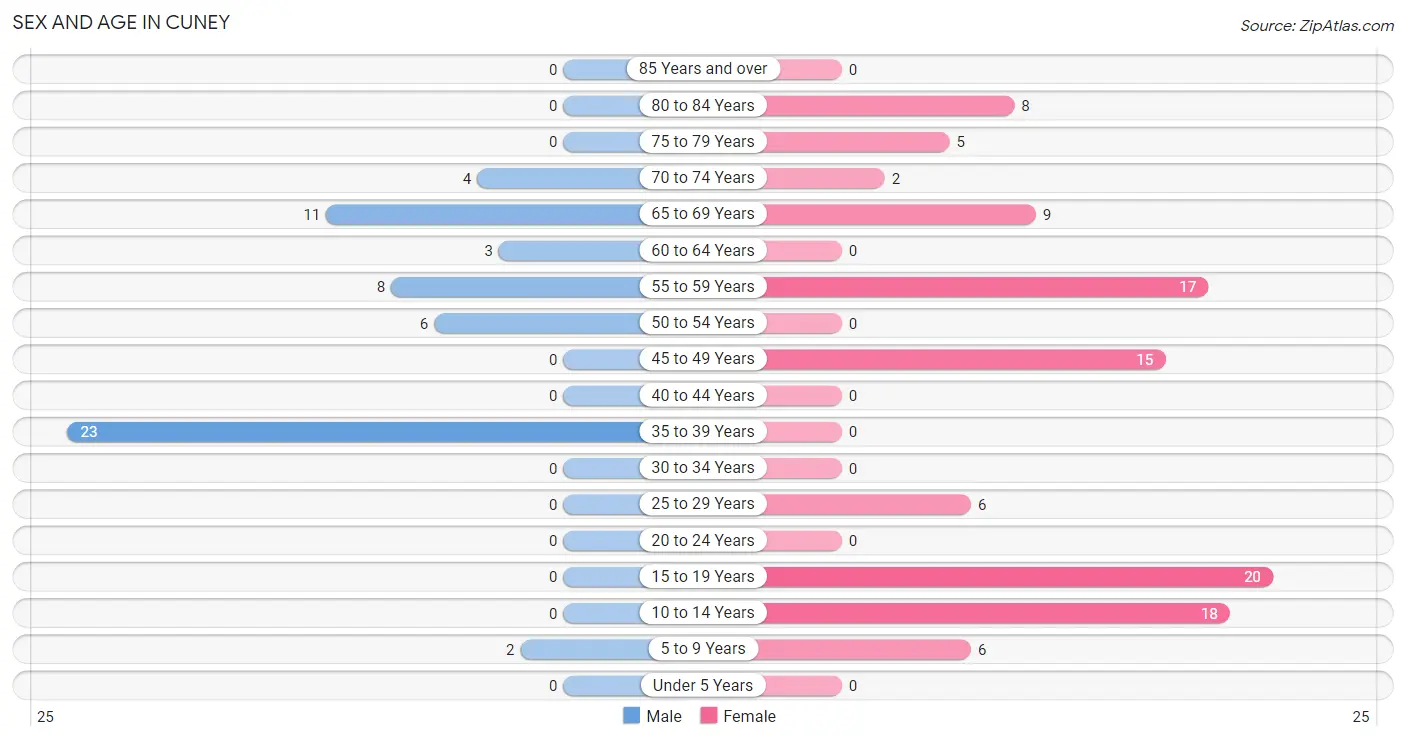
| Age Bracket | Male | Female |
| Under 5 Years | 0 (0.0%) | 0 (0.0%) |
| 5 to 9 Years | 2 (3.5%) | 6 (5.7%) |
| 10 to 14 Years | 0 (0.0%) | 18 (17.0%) |
| 15 to 19 Years | 0 (0.0%) | 20 (18.9%) |
| 20 to 24 Years | 0 (0.0%) | 0 (0.0%) |
| 25 to 29 Years | 0 (0.0%) | 6 (5.7%) |
| 30 to 34 Years | 0 (0.0%) | 0 (0.0%) |
| 35 to 39 Years | 23 (40.4%) | 0 (0.0%) |
| 40 to 44 Years | 0 (0.0%) | 0 (0.0%) |
| 45 to 49 Years | 0 (0.0%) | 15 (14.1%) |
| 50 to 54 Years | 6 (10.5%) | 0 (0.0%) |
| 55 to 59 Years | 8 (14.0%) | 17 (16.0%) |
| 60 to 64 Years | 3 (5.3%) | 0 (0.0%) |
| 65 to 69 Years | 11 (19.3%) | 9 (8.5%) |
| 70 to 74 Years | 4 (7.0%) | 2 (1.9%) |
| 75 to 79 Years | 0 (0.0%) | 5 (4.7%) |
| 80 to 84 Years | 0 (0.0%) | 8 (7.5%) |
| 85 Years and over | 0 (0.0%) | 0 (0.0%) |
| Total | 57 (100.0%) | 106 (100.0%) |
Families and Households in Cuney
Median Family Size in Cuney
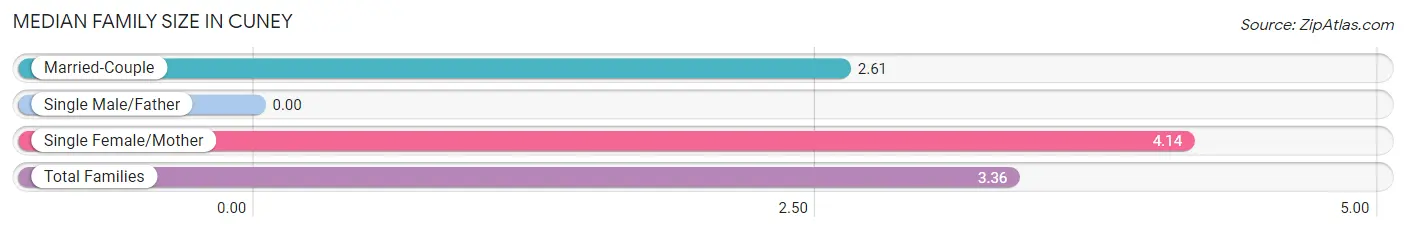
| Family Type | # Families | Family Size |
| Married-Couple | 23 (51.1%) | 2.61 |
| Single Male/Father | 0 (0.0%) | - |
| Single Female/Mother | 22 (48.9%) | 4.14 |
| Total Families | 45 (100.0%) | 3.36 |
Median Household Size in Cuney
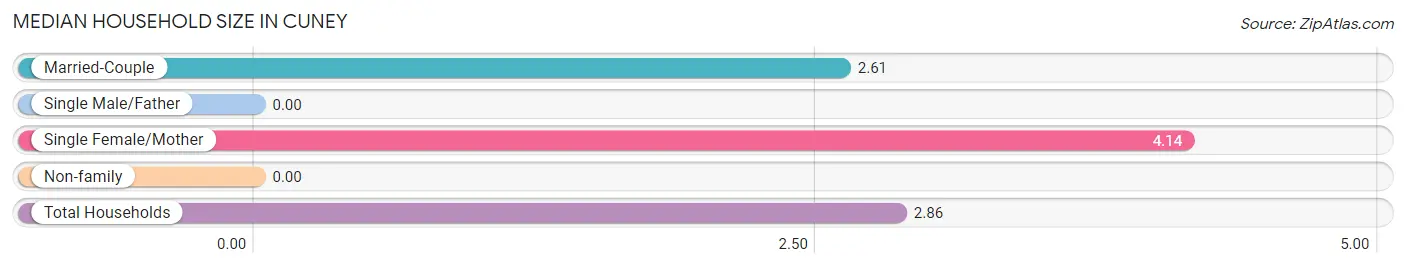
| Household Type | # Households | Household Size |
| Married-Couple | 23 (40.4%) | 2.61 |
| Single Male/Father | 0 (0.0%) | - |
| Single Female/Mother | 22 (38.6%) | 4.14 |
| Non-family | 12 (21.0%) | - |
| Total Households | 57 (100.0%) | 2.86 |
Household Size by Marriage Status in Cuney
Out of a total of 57 households in Cuney, 45 (78.9%) are family households, while 12 (21.0%) are nonfamily households. The most numerous type of family households are 3-person households, comprising 25, and the most common type of nonfamily households are 1-person households, comprising 12.
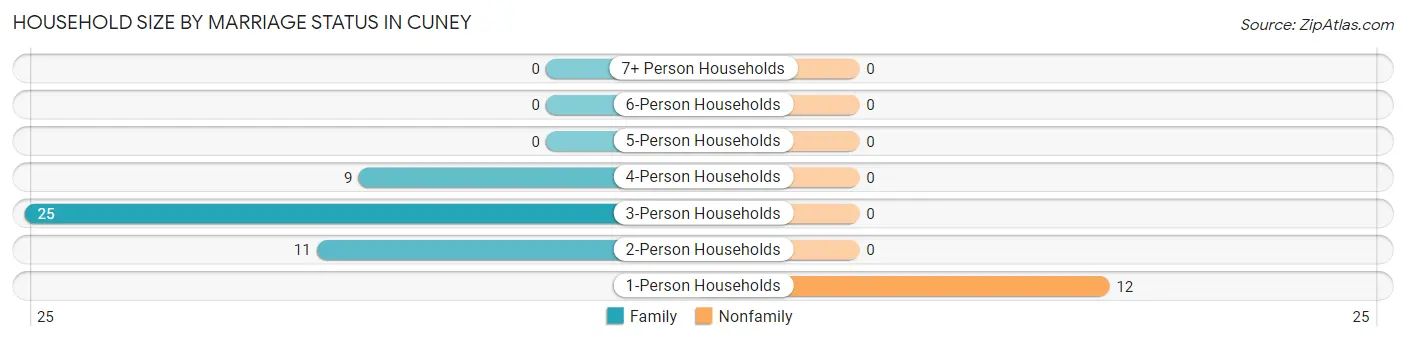
| Household Size | Family Households | Nonfamily Households |
| 1-Person Households | - | 12 (21.0%) |
| 2-Person Households | 11 (19.3%) | 0 (0.0%) |
| 3-Person Households | 25 (43.9%) | 0 (0.0%) |
| 4-Person Households | 9 (15.8%) | 0 (0.0%) |
| 5-Person Households | 0 (0.0%) | 0 (0.0%) |
| 6-Person Households | 0 (0.0%) | 0 (0.0%) |
| 7+ Person Households | 0 (0.0%) | 0 (0.0%) |
| Total | 45 (78.9%) | 12 (21.0%) |
Female Fertility in Cuney
Fertility by Age in Cuney
| Age Bracket | Women with Births | Births / 1,000 Women |
| 15 to 19 years | 0 (0.0%) | 0.0 |
| 20 to 34 years | 0 (0.0%) | 0.0 |
| 35 to 50 years | 0 (0.0%) | 0.0 |
| Total | 0 (0.0%) | 0.0 |
Fertility by Age by Marriage Status in Cuney
| Age Bracket | Married | Unmarried |
| 15 to 19 years | 0 (0.0%) | 0 (0.0%) |
| 20 to 34 years | 0 (0.0%) | 0 (0.0%) |
| 35 to 50 years | 0 (0.0%) | 0 (0.0%) |
| Total | 0 (0.0%) | 0 (0.0%) |
Fertility by Education in Cuney
| Educational Attainment | Women with Births | Births / 1,000 Women |
| Less than High School | 0 (0.0%) | 0.0 |
| High School Diploma | 0 (0.0%) | 0.0 |
| College or Associate's Degree | 0 (0.0%) | 0.0 |
| Bachelor's Degree | 0 (0.0%) | 0.0 |
| Graduate Degree | 0 (0.0%) | 0.0 |
| Total | 0 (0.0%) | 0.0 |
Fertility by Education by Marriage Status in Cuney
| Educational Attainment | Married | Unmarried |
| Less than High School | 0 (0.0%) | 0 (0.0%) |
| High School Diploma | 0 (0.0%) | 0 (0.0%) |
| College or Associate's Degree | 0 (0.0%) | 0 (0.0%) |
| Bachelor's Degree | 0 (0.0%) | 0 (0.0%) |
| Graduate Degree | 0 (0.0%) | 0 (0.0%) |
| Total | 0 (0.0%) | 0 (0.0%) |
Employment Characteristics in Cuney
Employment by Class of Employer in Cuney
Among the 67 employed individuals in Cuney, private company employees (41 | 61.2%), not-for-profit organizations (15 | 22.4%), and local government employees (6 | 9.0%) make up the most common classes of employment.
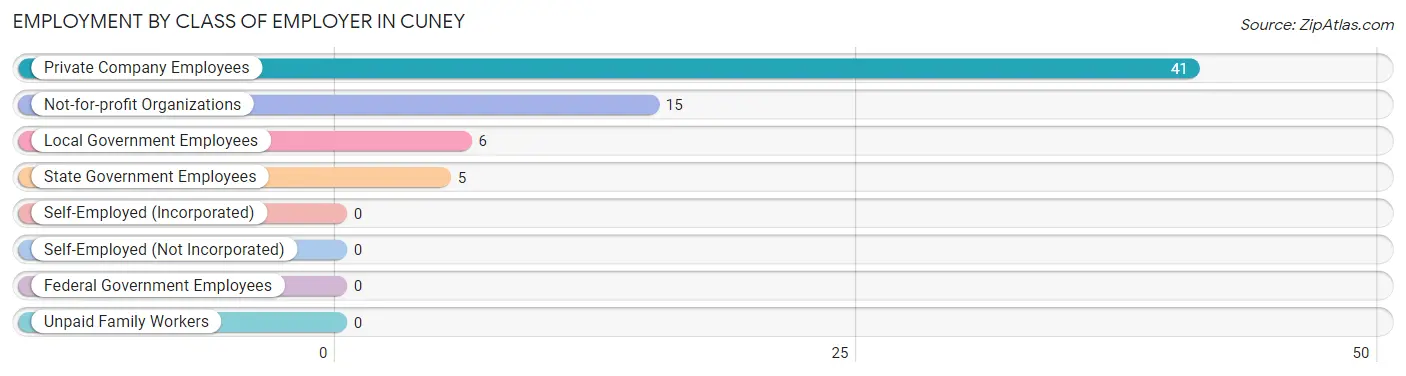
| Employer Class | # Employees | % Employees |
| Private Company Employees | 41 | 61.2% |
| Self-Employed (Incorporated) | 0 | 0.0% |
| Self-Employed (Not Incorporated) | 0 | 0.0% |
| Not-for-profit Organizations | 15 | 22.4% |
| Local Government Employees | 6 | 9.0% |
| State Government Employees | 5 | 7.5% |
| Federal Government Employees | 0 | 0.0% |
| Unpaid Family Workers | 0 | 0.0% |
| Total | 67 | 100.0% |
Employment Status by Age in Cuney
According to the labor force statistics for Cuney, out of the total population over 16 years of age (137), 49.6% or 68 individuals are in the labor force, with 1.5% or 1 of them unemployed. The age group with the highest labor force participation rate is 16 to 19 years, with 100.0% or 20 individuals in the labor force. Within the labor force, the 65 to 74 years age range has the highest percentage of unemployed individuals, with 7.1% or 1 of them being unemployed.
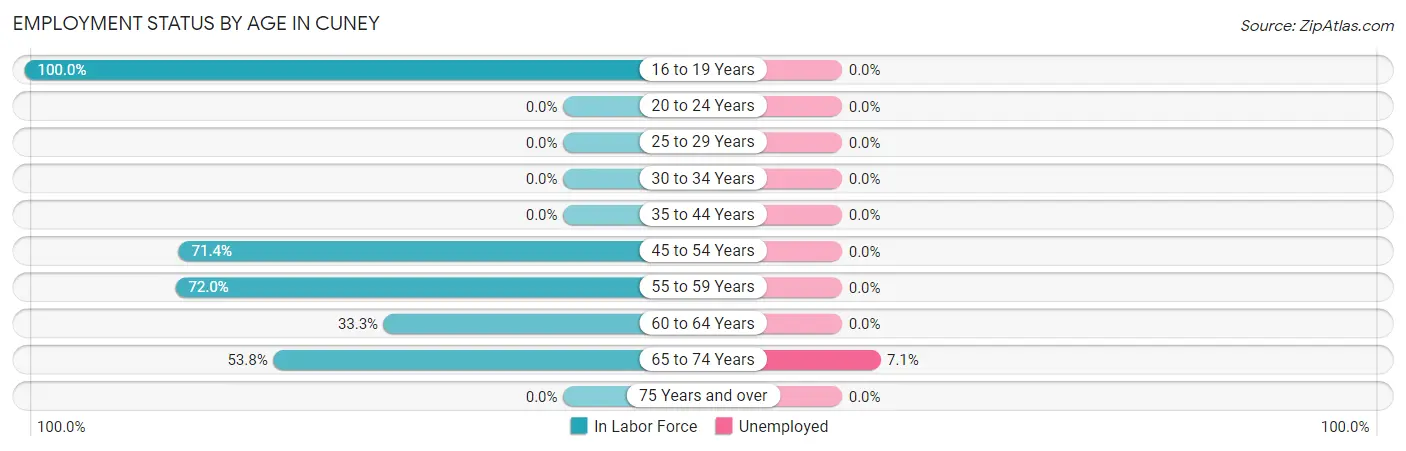
| Age Bracket | In Labor Force | Unemployed |
| 16 to 19 Years | 20 (100.0%) | 0 (0.0%) |
| 20 to 24 Years | 0 (0.0%) | 0 (0.0%) |
| 25 to 29 Years | 0 (0.0%) | 0 (0.0%) |
| 30 to 34 Years | 0 (0.0%) | 0 (0.0%) |
| 35 to 44 Years | 0 (0.0%) | 0 (0.0%) |
| 45 to 54 Years | 15 (71.4%) | 0 (0.0%) |
| 55 to 59 Years | 18 (72.0%) | 0 (0.0%) |
| 60 to 64 Years | 1 (33.3%) | 0 (0.0%) |
| 65 to 74 Years | 14 (53.8%) | 1 (7.1%) |
| 75 Years and over | 0 (0.0%) | 0 (0.0%) |
| Total | 68 (49.6%) | 1 (1.5%) |
Employment Status by Educational Attainment in Cuney
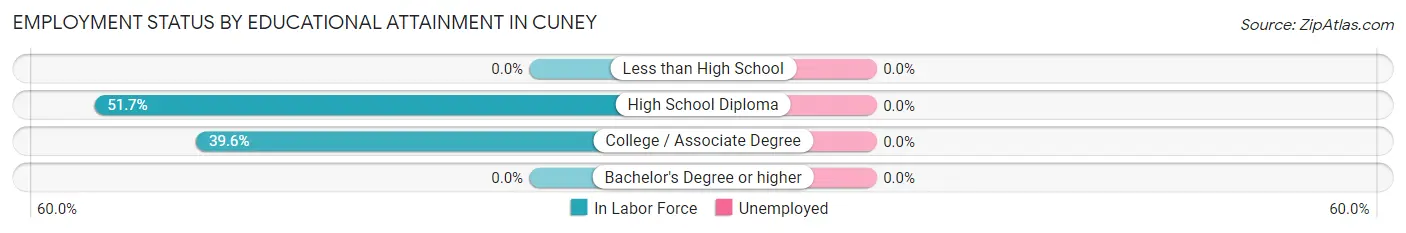
| Educational Attainment | In Labor Force | Unemployed |
| Less than High School | 0 (0.0%) | 0 (0.0%) |
| High School Diploma | 15 (51.7%) | 0 (0.0%) |
| College / Associate Degree | 19 (39.6%) | 0 (0.0%) |
| Bachelor's Degree or higher | 0 (0.0%) | 0 (0.0%) |
| Total | 34 (43.6%) | 0 (0.0%) |
Employment Occupations by Sex in Cuney
Management, Business, Science and Arts Occupations
The most common Management, Business, Science and Arts occupations in Cuney are Community & Social Service (6 | 9.0%), Education Instruction & Library (6 | 9.0%), and Management (5 | 7.5%).
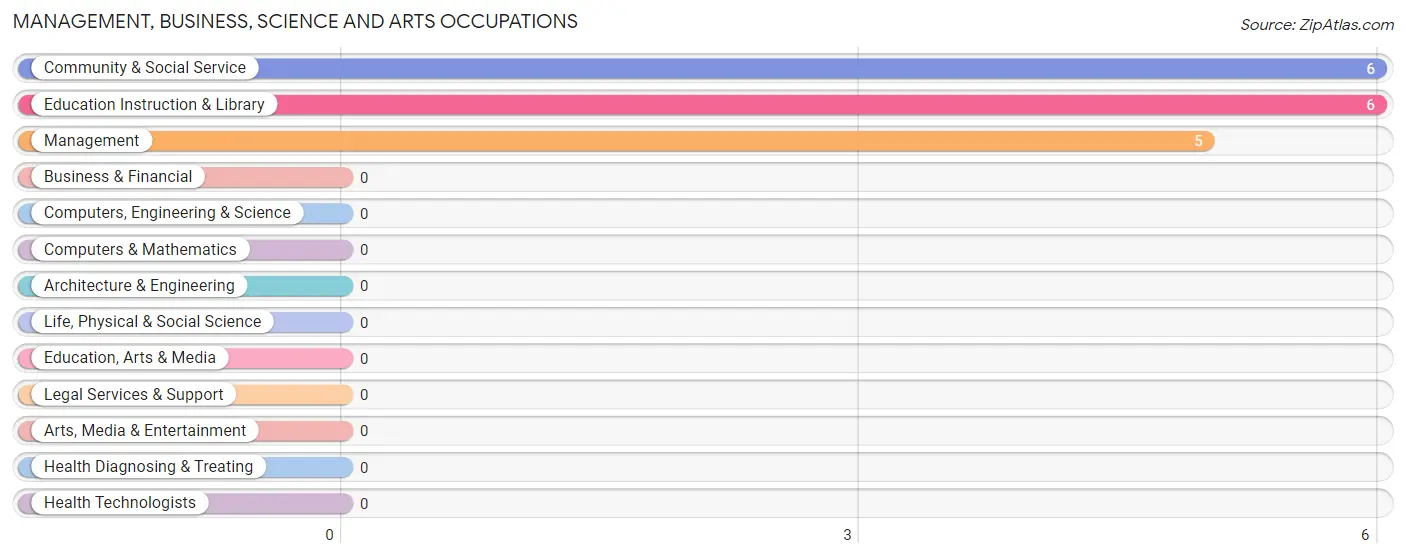
Management, Business, Science and Arts Occupations by Sex
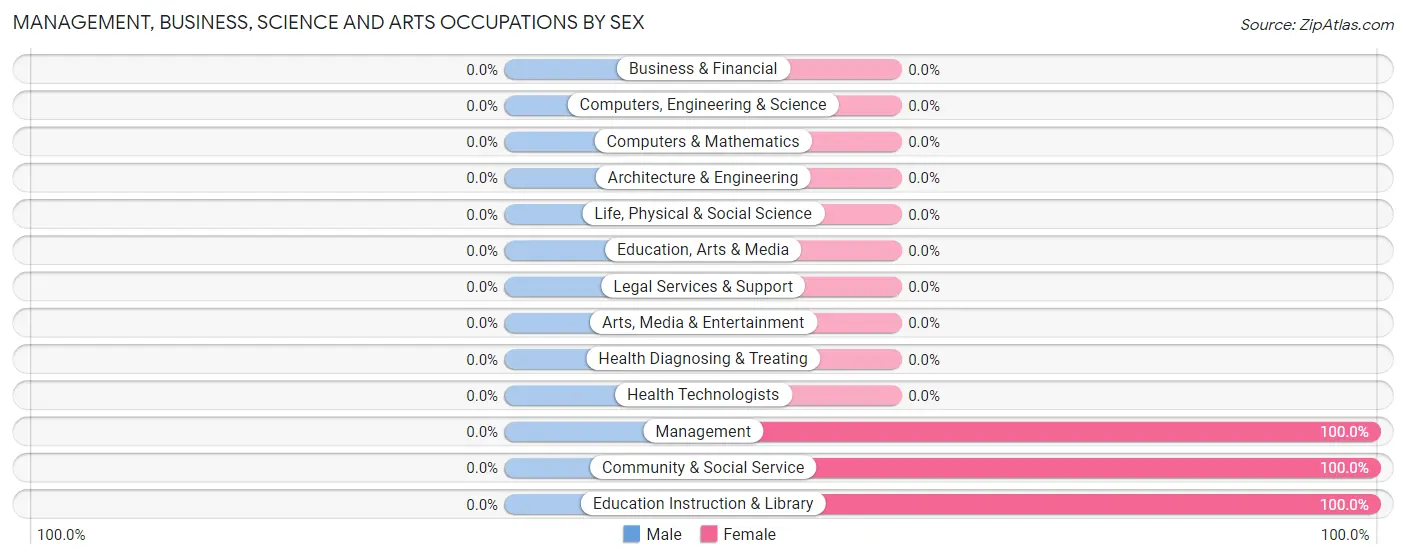
| Occupation | Male | Female |
| Management | 0 (0.0%) | 5 (100.0%) |
| Business & Financial | 0 (0.0%) | 0 (0.0%) |
| Computers, Engineering & Science | 0 (0.0%) | 0 (0.0%) |
| Computers & Mathematics | 0 (0.0%) | 0 (0.0%) |
| Architecture & Engineering | 0 (0.0%) | 0 (0.0%) |
| Life, Physical & Social Science | 0 (0.0%) | 0 (0.0%) |
| Community & Social Service | 0 (0.0%) | 6 (100.0%) |
| Education, Arts & Media | 0 (0.0%) | 0 (0.0%) |
| Legal Services & Support | 0 (0.0%) | 0 (0.0%) |
| Education Instruction & Library | 0 (0.0%) | 6 (100.0%) |
| Arts, Media & Entertainment | 0 (0.0%) | 0 (0.0%) |
| Health Diagnosing & Treating | 0 (0.0%) | 0 (0.0%) |
| Health Technologists | 0 (0.0%) | 0 (0.0%) |
| Total (Category) | 0 (0.0%) | 11 (100.0%) |
| Total (Overall) | 14 (20.9%) | 53 (79.1%) |
Services Occupations
The most common Services occupations in Cuney are , and Healthcare Support (15 | 22.4%).
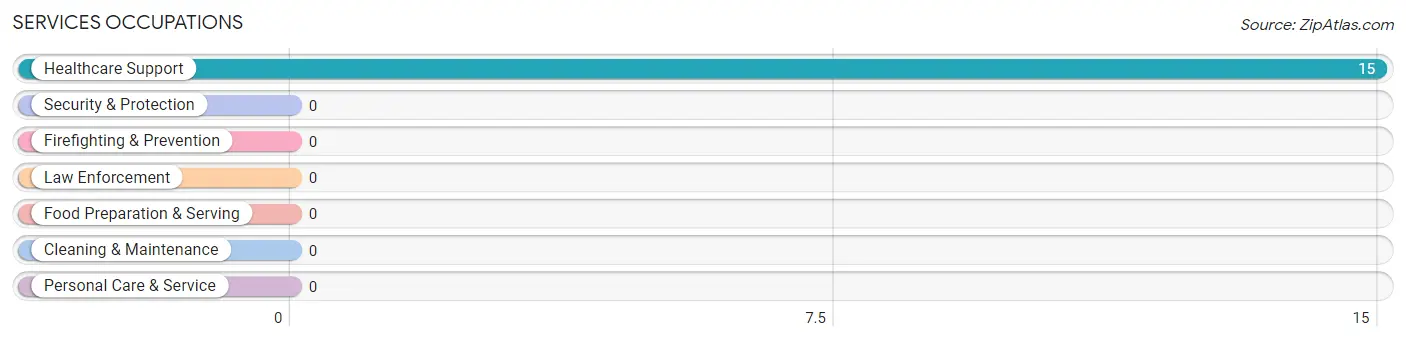
Services Occupations by Sex
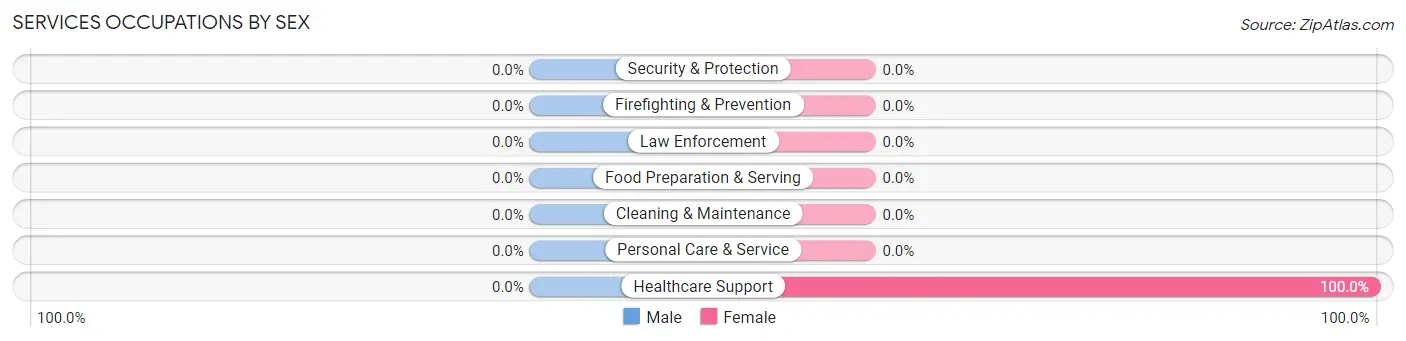
| Occupation | Male | Female |
| Healthcare Support | 0 (0.0%) | 15 (100.0%) |
| Security & Protection | 0 (0.0%) | 0 (0.0%) |
| Firefighting & Prevention | 0 (0.0%) | 0 (0.0%) |
| Law Enforcement | 0 (0.0%) | 0 (0.0%) |
| Food Preparation & Serving | 0 (0.0%) | 0 (0.0%) |
| Cleaning & Maintenance | 0 (0.0%) | 0 (0.0%) |
| Personal Care & Service | 0 (0.0%) | 0 (0.0%) |
| Total (Category) | 0 (0.0%) | 15 (100.0%) |
| Total (Overall) | 14 (20.9%) | 53 (79.1%) |
Sales and Office Occupations
The most common Sales and Office occupations in Cuney are Office & Administration (22 | 32.8%), and Sales & Related (3 | 4.5%).

Sales and Office Occupations by Sex

| Occupation | Male | Female |
| Sales & Related | 0 (0.0%) | 3 (100.0%) |
| Office & Administration | 0 (0.0%) | 22 (100.0%) |
| Total (Category) | 0 (0.0%) | 25 (100.0%) |
| Total (Overall) | 14 (20.9%) | 53 (79.1%) |
Natural Resources, Construction and Maintenance Occupations
The most common Natural Resources, Construction and Maintenance occupations in Cuney are , and Construction & Extraction (8 | 11.9%).
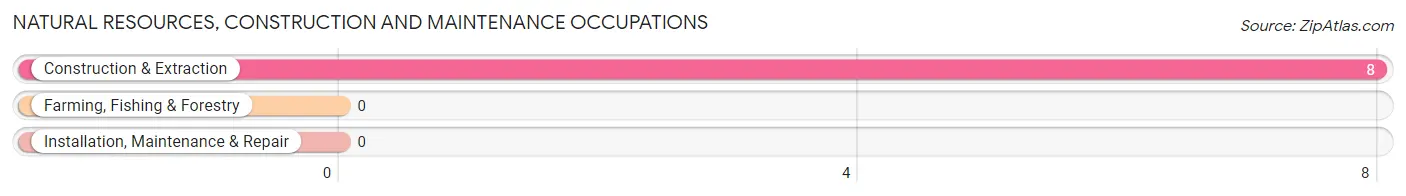
Natural Resources, Construction and Maintenance Occupations by Sex
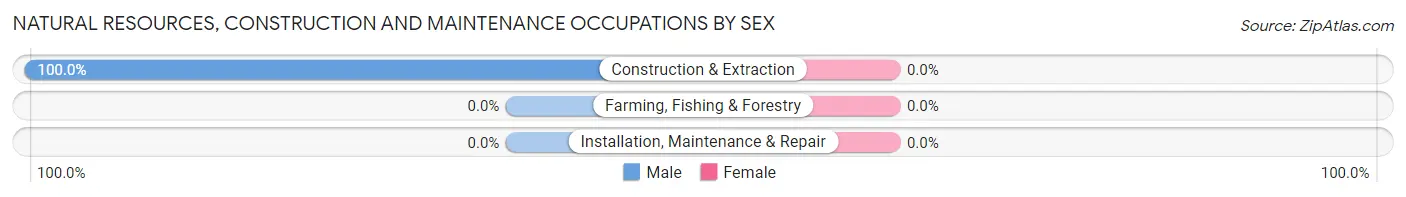
| Occupation | Male | Female |
| Farming, Fishing & Forestry | 0 (0.0%) | 0 (0.0%) |
| Construction & Extraction | 8 (100.0%) | 0 (0.0%) |
| Installation, Maintenance & Repair | 0 (0.0%) | 0 (0.0%) |
| Total (Category) | 8 (100.0%) | 0 (0.0%) |
| Total (Overall) | 14 (20.9%) | 53 (79.1%) |
Production, Transportation and Moving Occupations
The most common Production, Transportation and Moving occupations in Cuney are Transportation (6 | 9.0%), and Material Moving (2 | 3.0%).
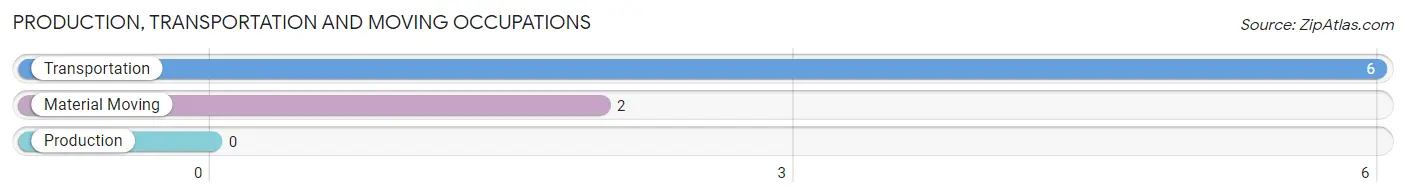
Production, Transportation and Moving Occupations by Sex
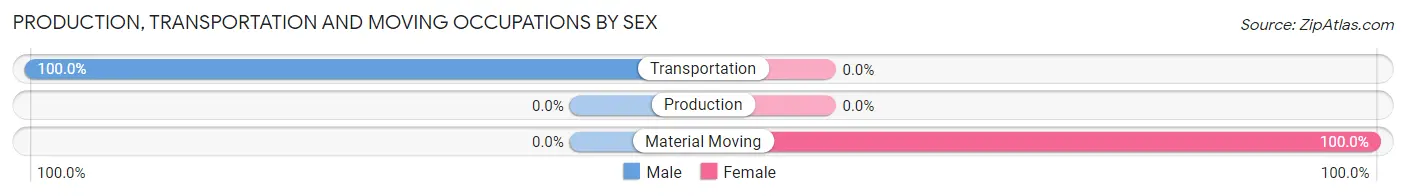
| Occupation | Male | Female |
| Production | 0 (0.0%) | 0 (0.0%) |
| Transportation | 6 (100.0%) | 0 (0.0%) |
| Material Moving | 0 (0.0%) | 2 (100.0%) |
| Total (Category) | 6 (75.0%) | 2 (25.0%) |
| Total (Overall) | 14 (20.9%) | 53 (79.1%) |
Employment Industries by Sex in Cuney
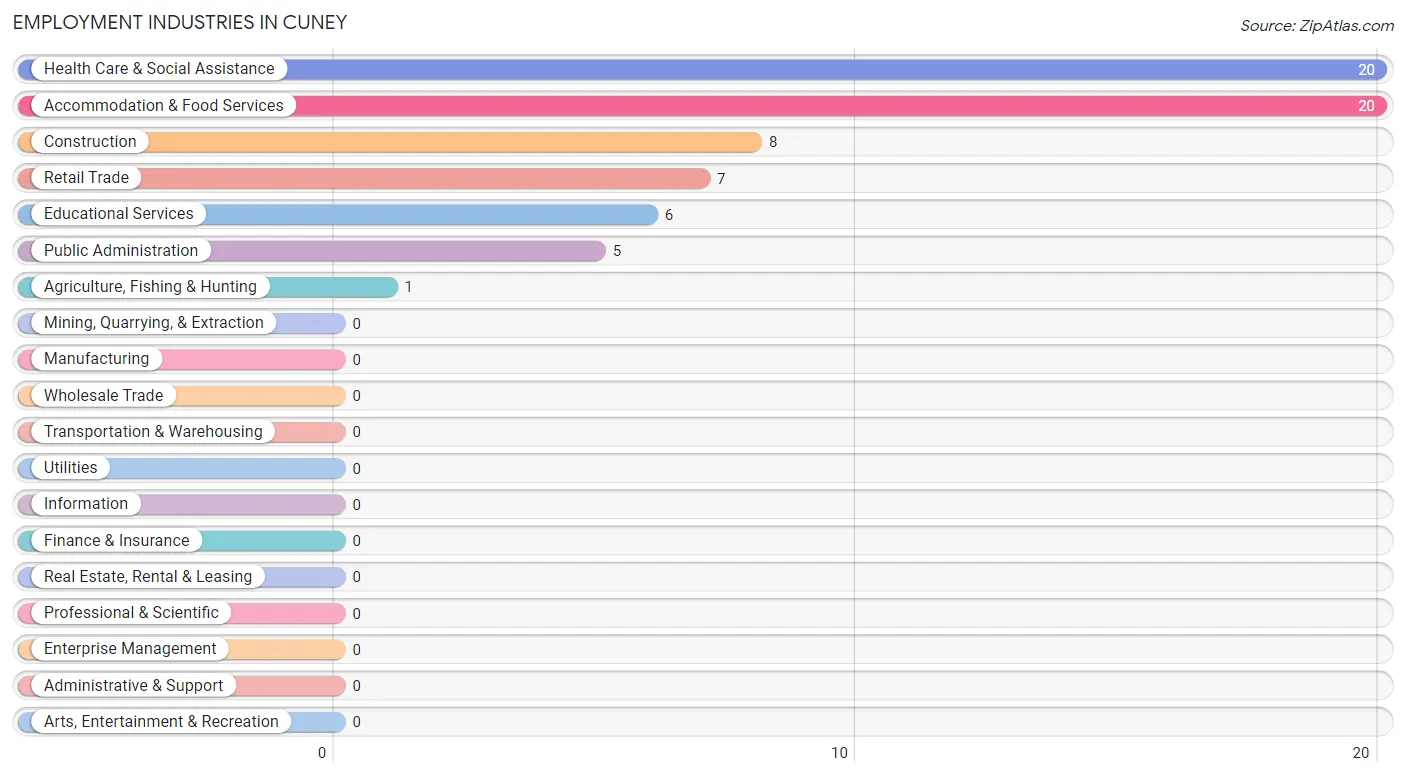
Employment Industries in Cuney
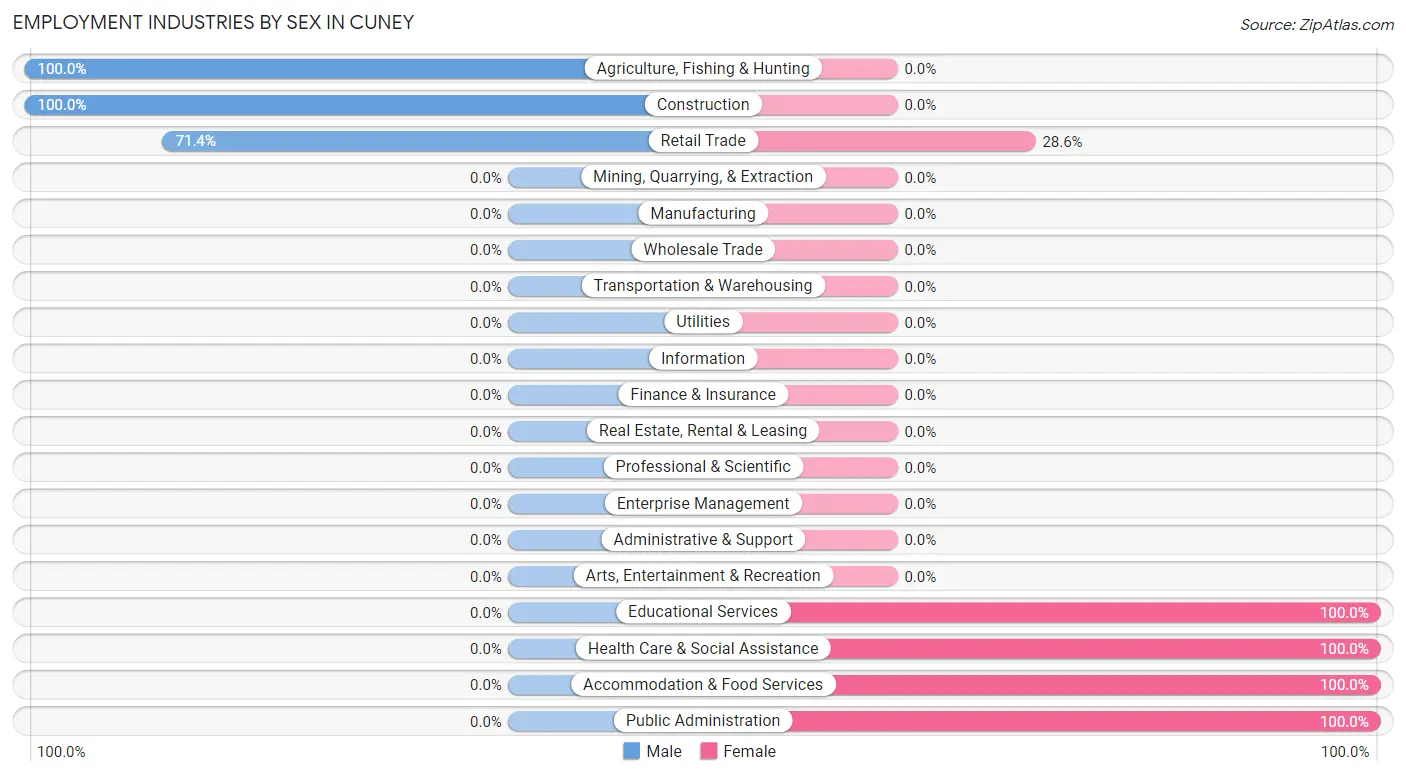
The major employment industries in Cuney include Health Care & Social Assistance (20 | 29.8%), Accommodation & Food Services (20 | 29.8%), Construction (8 | 11.9%), Retail Trade (7 | 10.4%), and Educational Services (6 | 9.0%).
Employment Industries by Sex in Cuney
The Cuney industries that see more men than women are Agriculture, Fishing & Hunting (100.0%), Construction (100.0%), and Retail Trade (71.4%), whereas the industries that tend to have a higher number of women are Educational Services (100.0%), Health Care & Social Assistance (100.0%), and Accommodation & Food Services (100.0%).
| Industry | Male | Female |
| Agriculture, Fishing & Hunting | 1 (100.0%) | 0 (0.0%) |
| Mining, Quarrying, & Extraction | 0 (0.0%) | 0 (0.0%) |
| Construction | 8 (100.0%) | 0 (0.0%) |
| Manufacturing | 0 (0.0%) | 0 (0.0%) |
| Wholesale Trade | 0 (0.0%) | 0 (0.0%) |
| Retail Trade | 5 (71.4%) | 2 (28.6%) |
| Transportation & Warehousing | 0 (0.0%) | 0 (0.0%) |
| Utilities | 0 (0.0%) | 0 (0.0%) |
| Information | 0 (0.0%) | 0 (0.0%) |
| Finance & Insurance | 0 (0.0%) | 0 (0.0%) |
| Real Estate, Rental & Leasing | 0 (0.0%) | 0 (0.0%) |
| Professional & Scientific | 0 (0.0%) | 0 (0.0%) |
| Enterprise Management | 0 (0.0%) | 0 (0.0%) |
| Administrative & Support | 0 (0.0%) | 0 (0.0%) |
| Educational Services | 0 (0.0%) | 6 (100.0%) |
| Health Care & Social Assistance | 0 (0.0%) | 20 (100.0%) |
| Arts, Entertainment & Recreation | 0 (0.0%) | 0 (0.0%) |
| Accommodation & Food Services | 0 (0.0%) | 20 (100.0%) |
| Public Administration | 0 (0.0%) | 5 (100.0%) |
| Total | 14 (20.9%) | 53 (79.1%) |
Education in Cuney
School Enrollment in Cuney
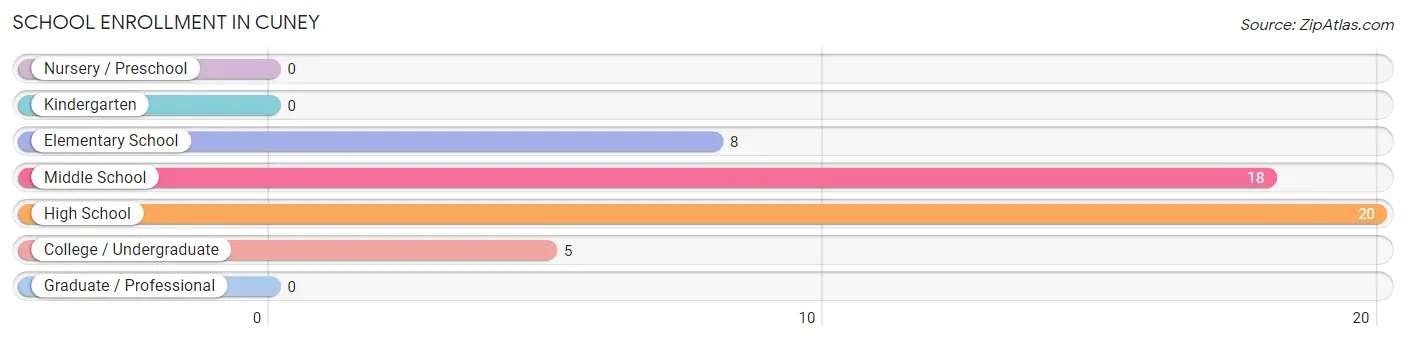
The most common levels of schooling among the 51 students in Cuney are high school (20 | 39.2%), middle school (18 | 35.3%), and elementary school (8 | 15.7%).
| School Level | # Students | % Students |
| Nursery / Preschool | 0 | 0.0% |
| Kindergarten | 0 | 0.0% |
| Elementary School | 8 | 15.7% |
| Middle School | 18 | 35.3% |
| High School | 20 | 39.2% |
| College / Undergraduate | 5 | 9.8% |
| Graduate / Professional | 0 | 0.0% |
| Total | 51 | 100.0% |
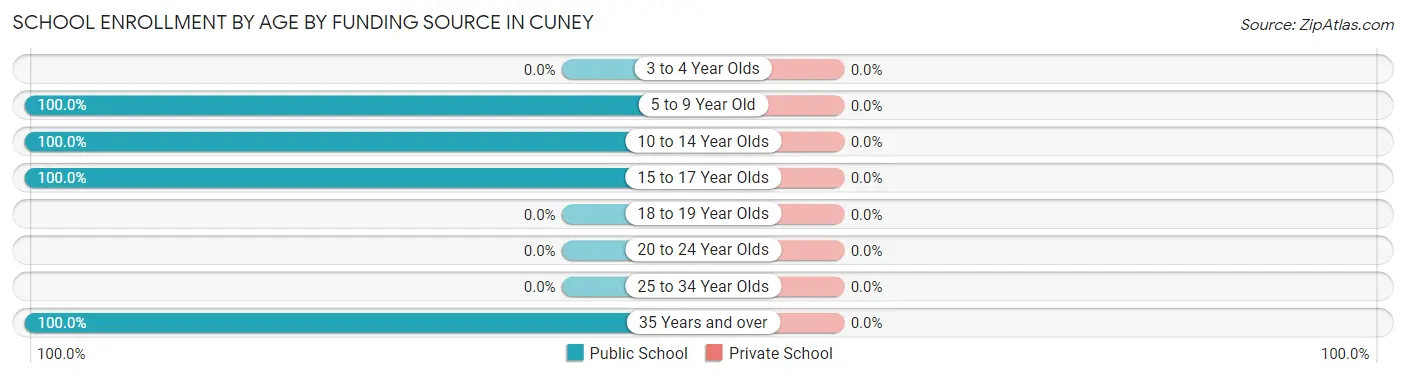
School Enrollment by Age by Funding Source in Cuney
| Age Bracket | Public School | Private School |
| 3 to 4 Year Olds | 0 (0.0%) | 0 (0.0%) |
| 5 to 9 Year Old | 8 (100.0%) | 0 (0.0%) |
| 10 to 14 Year Olds | 18 (100.0%) | 0 (0.0%) |
| 15 to 17 Year Olds | 20 (100.0%) | 0 (0.0%) |
| 18 to 19 Year Olds | 0 (0.0%) | 0 (0.0%) |
| 20 to 24 Year Olds | 0 (0.0%) | 0 (0.0%) |
| 25 to 34 Year Olds | 0 (0.0%) | 0 (0.0%) |
| 35 Years and over | 5 (100.0%) | 0 (0.0%) |
| Total | 51 (100.0%) | 0 (0.0%) |
Educational Attainment by Field of Study in Cuney
| Field of Study | # Graduates | % Graduates |
| Computers & Mathematics | 0 | 0.0% |
| Bio, Nature & Agricultural | 0 | 0.0% |
| Physical & Health Sciences | 0 | 0.0% |
| Psychology | 0 | 0.0% |
| Social Sciences | 0 | 0.0% |
| Engineering | 0 | 0.0% |
| Multidisciplinary Studies | 0 | 0.0% |
| Science & Technology | 0 | 0.0% |
| Business | 0 | 0.0% |
| Education | 0 | 0.0% |
| Literature & Languages | 0 | 0.0% |
| Liberal Arts & History | 0 | 0.0% |
| Visual & Performing Arts | 0 | 0.0% |
| Communications | 0 | 0.0% |
| Arts & Humanities | 0 | 0.0% |
| Total | 0 | 0.0% |
Transportation & Commute in Cuney
Vehicle Availability by Sex in Cuney
The most prevalent vehicle ownership categories in Cuney are males with 5 or more vehicles (8, accounting for 57.1%) and females with 5 or more vehicles (5, making up 15.1%).
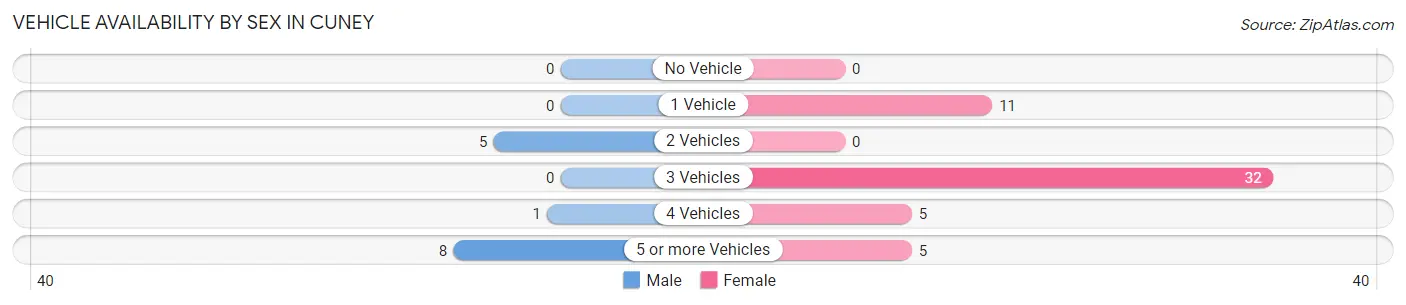
| Vehicles Available | Male | Female |
| No Vehicle | 0 (0.0%) | 0 (0.0%) |
| 1 Vehicle | 0 (0.0%) | 11 (20.7%) |
| 2 Vehicles | 5 (35.7%) | 0 (0.0%) |
| 3 Vehicles | 0 (0.0%) | 32 (60.4%) |
| 4 Vehicles | 1 (7.1%) | 5 (9.4%) |
| 5 or more Vehicles | 8 (57.1%) | 5 (9.4%) |
| Total | 14 (100.0%) | 53 (100.0%) |
Commute Time in Cuney
The most frequently occuring commute durations in Cuney are 30 to 34 minutes (21 commuters, 31.3%), 20 to 24 minutes (17 commuters, 25.4%), and 15 to 19 minutes (13 commuters, 19.4%).
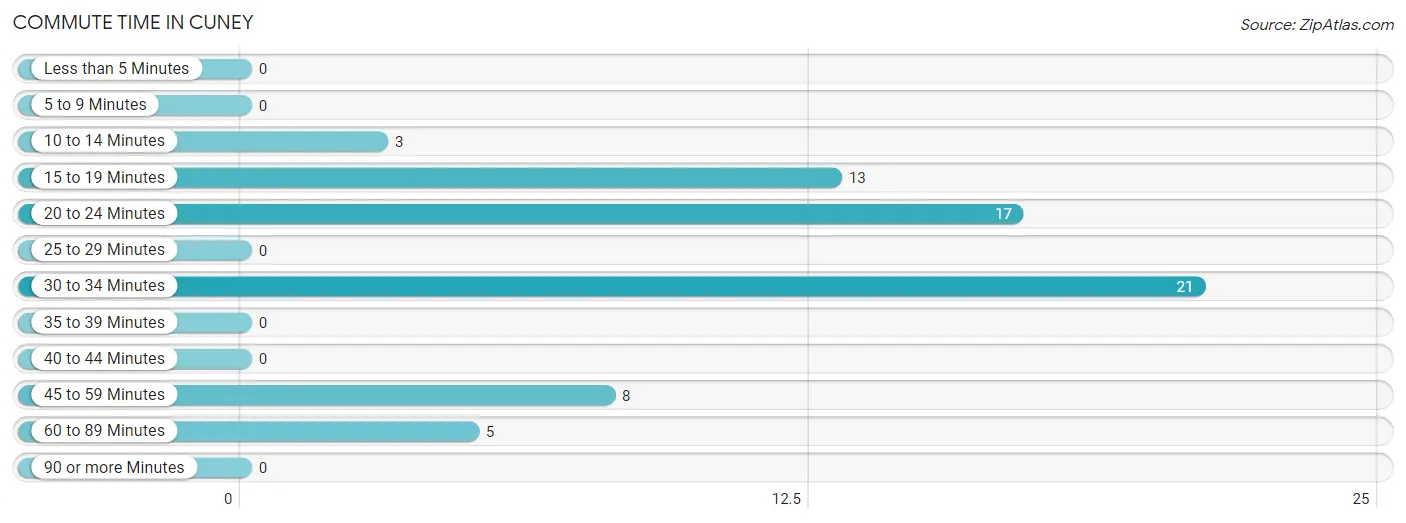
| Commute Time | # Commuters | % Commuters |
| Less than 5 Minutes | 0 | 0.0% |
| 5 to 9 Minutes | 0 | 0.0% |
| 10 to 14 Minutes | 3 | 4.5% |
| 15 to 19 Minutes | 13 | 19.4% |
| 20 to 24 Minutes | 17 | 25.4% |
| 25 to 29 Minutes | 0 | 0.0% |
| 30 to 34 Minutes | 21 | 31.3% |
| 35 to 39 Minutes | 0 | 0.0% |
| 40 to 44 Minutes | 0 | 0.0% |
| 45 to 59 Minutes | 8 | 11.9% |
| 60 to 89 Minutes | 5 | 7.5% |
| 90 or more Minutes | 0 | 0.0% |
Commute Time by Sex in Cuney
The most common commute times in Cuney are 45 to 59 minutes (8 commuters, 57.1%) for males and 20 to 24 minutes (17 commuters, 32.1%) for females.
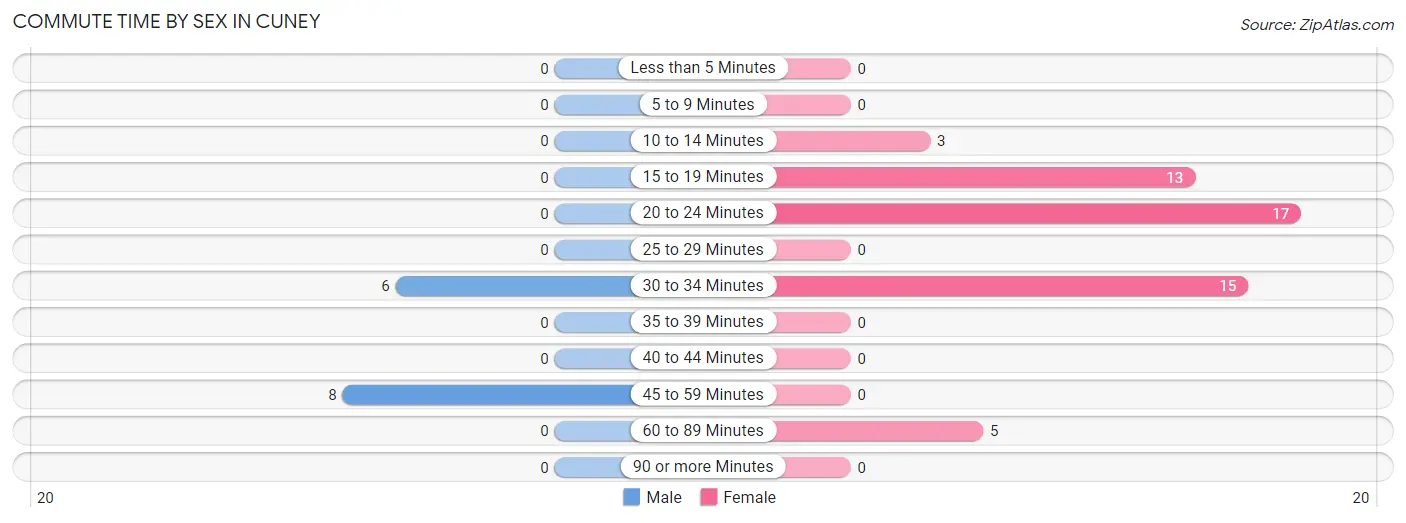
| Commute Time | Male | Female |
| Less than 5 Minutes | 0 (0.0%) | 0 (0.0%) |
| 5 to 9 Minutes | 0 (0.0%) | 0 (0.0%) |
| 10 to 14 Minutes | 0 (0.0%) | 3 (5.7%) |
| 15 to 19 Minutes | 0 (0.0%) | 13 (24.5%) |
| 20 to 24 Minutes | 0 (0.0%) | 17 (32.1%) |
| 25 to 29 Minutes | 0 (0.0%) | 0 (0.0%) |
| 30 to 34 Minutes | 6 (42.9%) | 15 (28.3%) |
| 35 to 39 Minutes | 0 (0.0%) | 0 (0.0%) |
| 40 to 44 Minutes | 0 (0.0%) | 0 (0.0%) |
| 45 to 59 Minutes | 8 (57.1%) | 0 (0.0%) |
| 60 to 89 Minutes | 0 (0.0%) | 5 (9.4%) |
| 90 or more Minutes | 0 (0.0%) | 0 (0.0%) |
Time of Departure to Work by Sex in Cuney
The most frequent times of departure to work in Cuney are 7:00 AM to 7:29 AM (8, 57.1%) for males and 4:00 PM to 11:59 PM (32, 60.4%) for females.
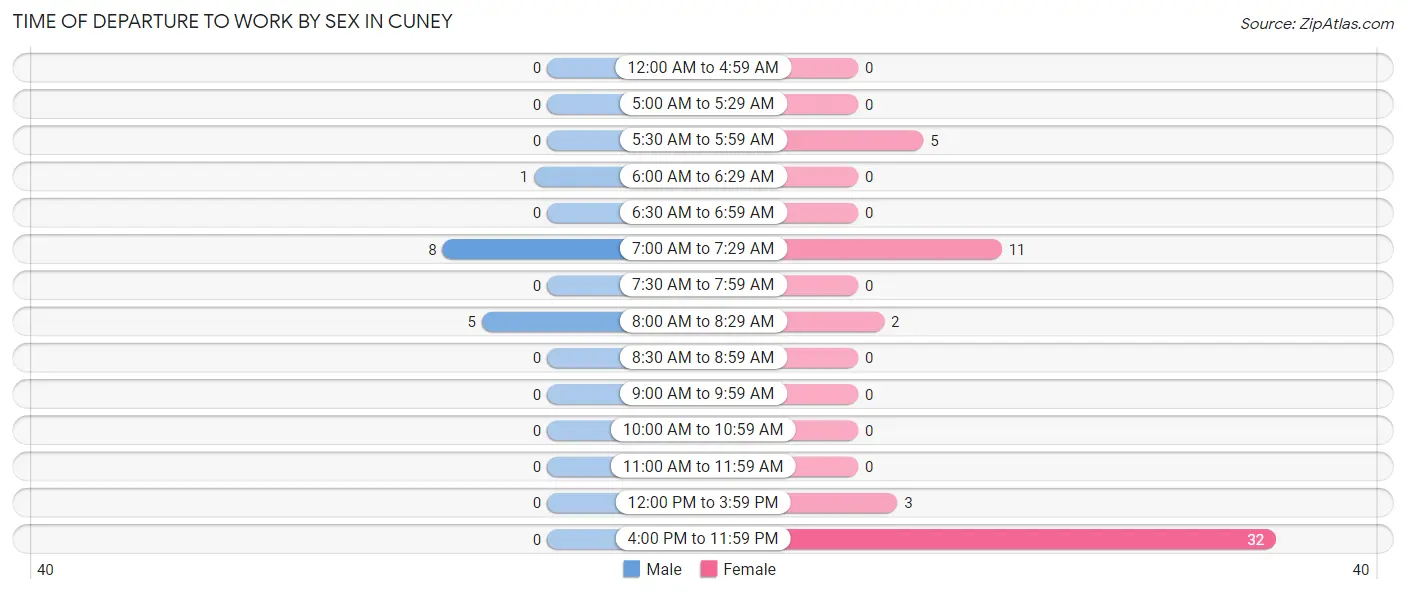
| Time of Departure | Male | Female |
| 12:00 AM to 4:59 AM | 0 (0.0%) | 0 (0.0%) |
| 5:00 AM to 5:29 AM | 0 (0.0%) | 0 (0.0%) |
| 5:30 AM to 5:59 AM | 0 (0.0%) | 5 (9.4%) |
| 6:00 AM to 6:29 AM | 1 (7.1%) | 0 (0.0%) |
| 6:30 AM to 6:59 AM | 0 (0.0%) | 0 (0.0%) |
| 7:00 AM to 7:29 AM | 8 (57.1%) | 11 (20.7%) |
| 7:30 AM to 7:59 AM | 0 (0.0%) | 0 (0.0%) |
| 8:00 AM to 8:29 AM | 5 (35.7%) | 2 (3.8%) |
| 8:30 AM to 8:59 AM | 0 (0.0%) | 0 (0.0%) |
| 9:00 AM to 9:59 AM | 0 (0.0%) | 0 (0.0%) |
| 10:00 AM to 10:59 AM | 0 (0.0%) | 0 (0.0%) |
| 11:00 AM to 11:59 AM | 0 (0.0%) | 0 (0.0%) |
| 12:00 PM to 3:59 PM | 0 (0.0%) | 3 (5.7%) |
| 4:00 PM to 11:59 PM | 0 (0.0%) | 32 (60.4%) |
| Total | 14 (100.0%) | 53 (100.0%) |
Housing Occupancy in Cuney
Occupancy by Ownership in Cuney
Of the total 57 dwellings in Cuney, owner-occupied units account for 51 (89.5%), while renter-occupied units make up 6 (10.5%).
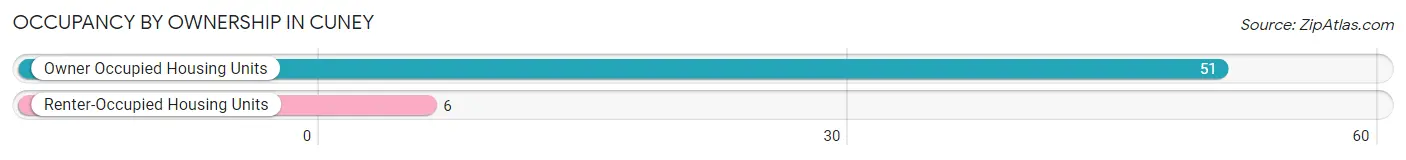
| Occupancy | # Housing Units | % Housing Units |
| Owner Occupied Housing Units | 51 | 89.5% |
| Renter-Occupied Housing Units | 6 | 10.5% |
| Total Occupied Housing Units | 57 | 100.0% |
Occupancy by Household Size in Cuney
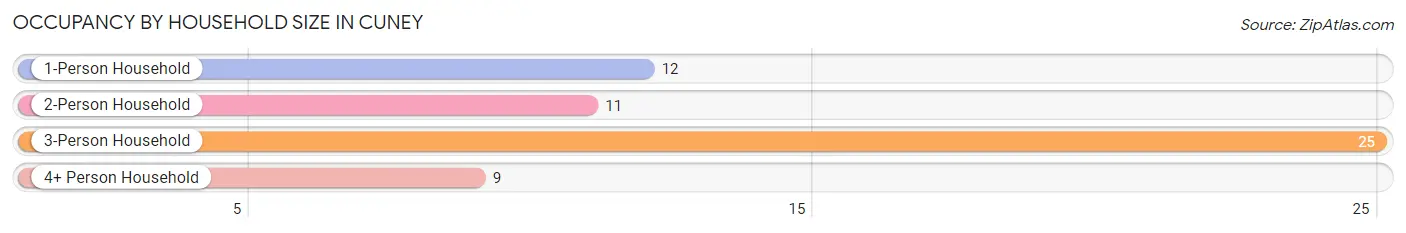
| Household Size | # Housing Units | % Housing Units |
| 1-Person Household | 12 | 21.0% |
| 2-Person Household | 11 | 19.3% |
| 3-Person Household | 25 | 43.9% |
| 4+ Person Household | 9 | 15.8% |
| Total Housing Units | 57 | 100.0% |
Occupancy by Ownership by Household Size in Cuney
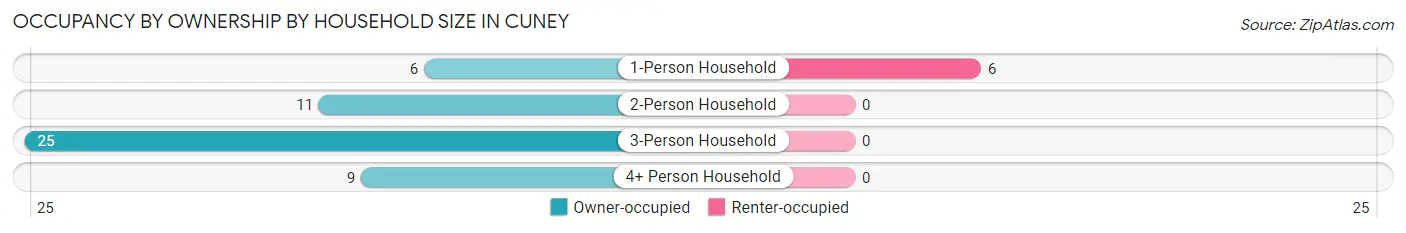
| Household Size | Owner-occupied | Renter-occupied |
| 1-Person Household | 6 (50.0%) | 6 (50.0%) |
| 2-Person Household | 11 (100.0%) | 0 (0.0%) |
| 3-Person Household | 25 (100.0%) | 0 (0.0%) |
| 4+ Person Household | 9 (100.0%) | 0 (0.0%) |
| Total Housing Units | 51 (89.5%) | 6 (10.5%) |
Occupancy by Educational Attainment in Cuney
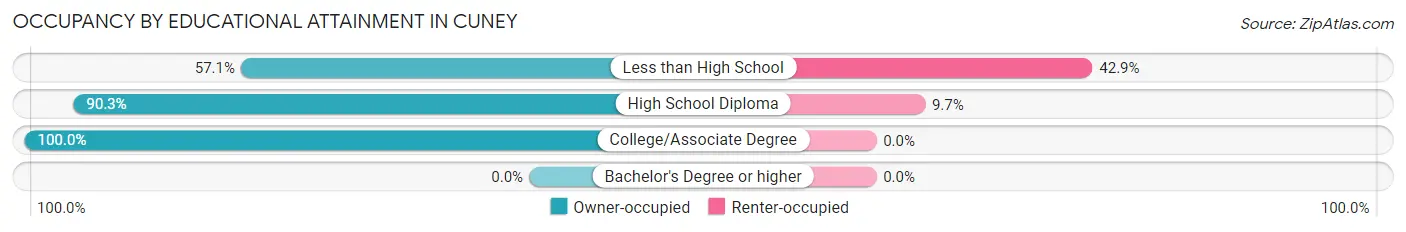
| Household Size | Owner-occupied | Renter-occupied |
| Less than High School | 4 (57.1%) | 3 (42.9%) |
| High School Diploma | 28 (90.3%) | 3 (9.7%) |
| College/Associate Degree | 19 (100.0%) | 0 (0.0%) |
| Bachelor's Degree or higher | 0 (0.0%) | 0 (0.0%) |
Occupancy by Age of Householder in Cuney
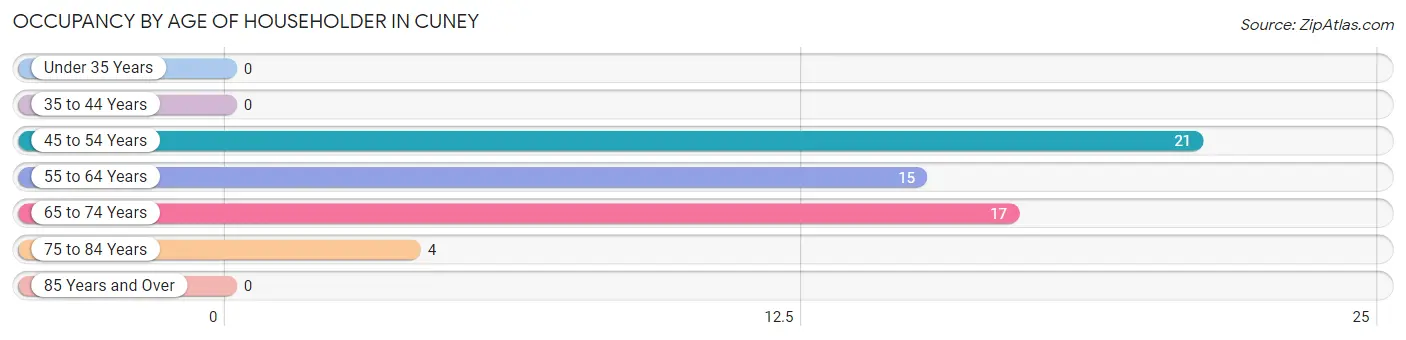
| Age Bracket | # Households | % Households |
| Under 35 Years | 0 | 0.0% |
| 35 to 44 Years | 0 | 0.0% |
| 45 to 54 Years | 21 | 36.8% |
| 55 to 64 Years | 15 | 26.3% |
| 65 to 74 Years | 17 | 29.8% |
| 75 to 84 Years | 4 | 7.0% |
| 85 Years and Over | 0 | 0.0% |
| Total | 57 | 100.0% |
Housing Finances in Cuney
Median Income by Occupancy in Cuney
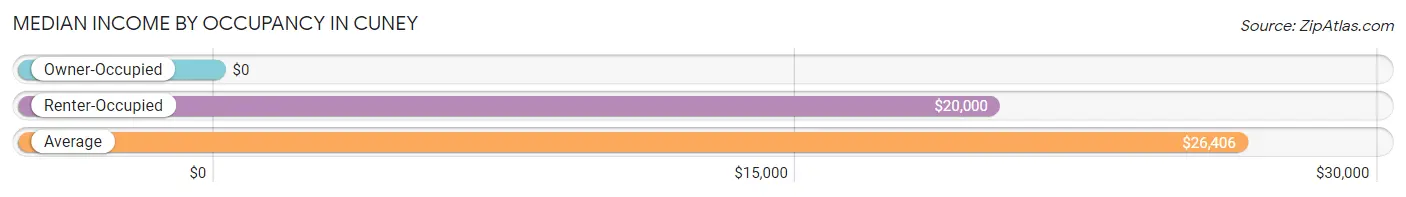
| Occupancy Type | # Households | Median Income |
| Owner-Occupied | 51 (89.5%) | $0 |
| Renter-Occupied | 6 (10.5%) | $20,000 |
| Average | 57 (100.0%) | $26,406 |
Occupancy by Householder Income Bracket in Cuney
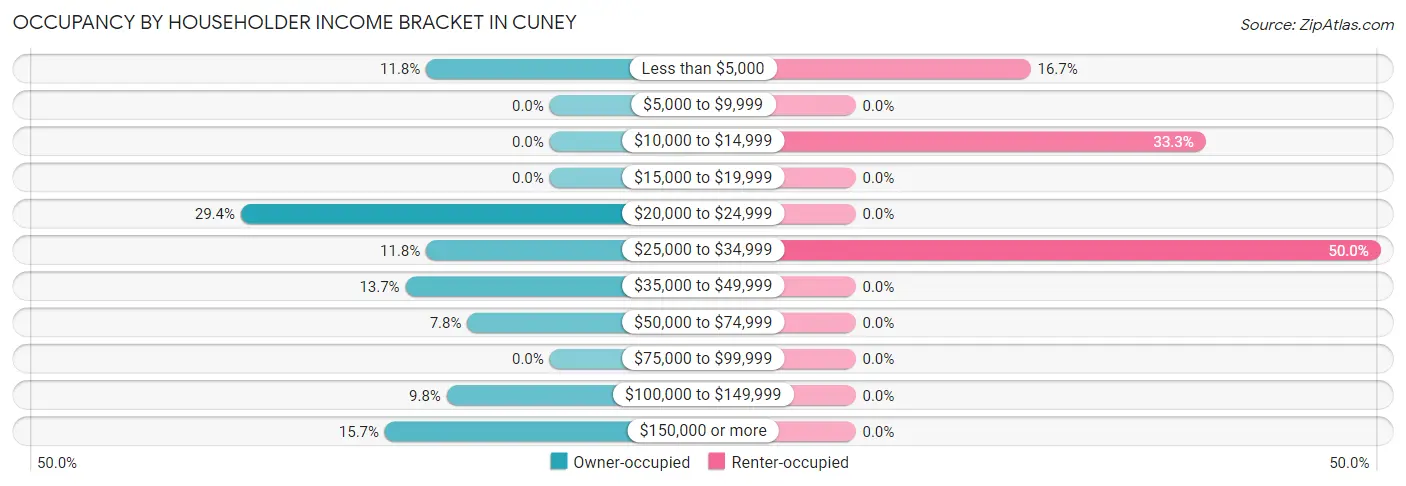
| Income Bracket | Owner-occupied | Renter-occupied |
| Less than $5,000 | 6 (11.8%) | 1 (16.7%) |
| $5,000 to $9,999 | 0 (0.0%) | 0 (0.0%) |
| $10,000 to $14,999 | 0 (0.0%) | 2 (33.3%) |
| $15,000 to $19,999 | 0 (0.0%) | 0 (0.0%) |
| $20,000 to $24,999 | 15 (29.4%) | 0 (0.0%) |
| $25,000 to $34,999 | 6 (11.8%) | 3 (50.0%) |
| $35,000 to $49,999 | 7 (13.7%) | 0 (0.0%) |
| $50,000 to $74,999 | 4 (7.8%) | 0 (0.0%) |
| $75,000 to $99,999 | 0 (0.0%) | 0 (0.0%) |
| $100,000 to $149,999 | 5 (9.8%) | 0 (0.0%) |
| $150,000 or more | 8 (15.7%) | 0 (0.0%) |
| Total | 51 (100.0%) | 6 (100.0%) |
Monthly Housing Cost Tiers in Cuney
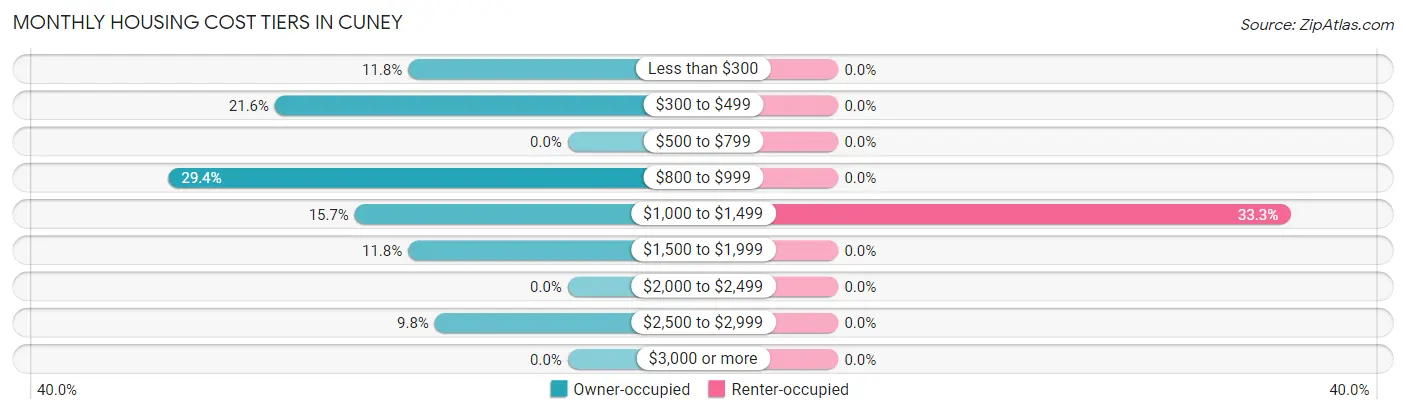
| Monthly Cost | Owner-occupied | Renter-occupied |
| Less than $300 | 6 (11.8%) | 0 (0.0%) |
| $300 to $499 | 11 (21.6%) | 0 (0.0%) |
| $500 to $799 | 0 (0.0%) | 0 (0.0%) |
| $800 to $999 | 15 (29.4%) | 0 (0.0%) |
| $1,000 to $1,499 | 8 (15.7%) | 2 (33.3%) |
| $1,500 to $1,999 | 6 (11.8%) | 0 (0.0%) |
| $2,000 to $2,499 | 0 (0.0%) | 0 (0.0%) |
| $2,500 to $2,999 | 5 (9.8%) | 0 (0.0%) |
| $3,000 or more | 0 (0.0%) | 0 (0.0%) |
| Total | 51 (100.0%) | 6 (100.0%) |
Physical Housing Characteristics in Cuney
Housing Structures in Cuney
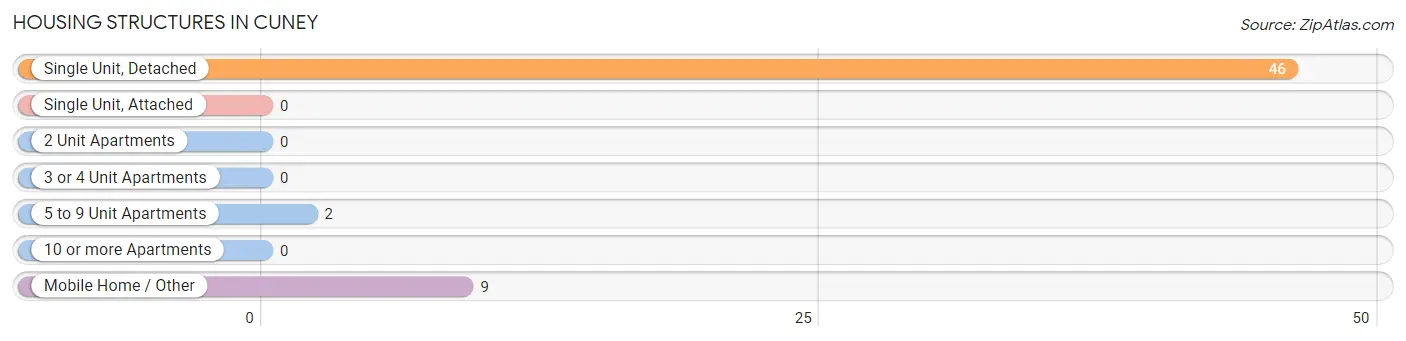
| Structure Type | # Housing Units | % Housing Units |
| Single Unit, Detached | 46 | 80.7% |
| Single Unit, Attached | 0 | 0.0% |
| 2 Unit Apartments | 0 | 0.0% |
| 3 or 4 Unit Apartments | 0 | 0.0% |
| 5 to 9 Unit Apartments | 2 | 3.5% |
| 10 or more Apartments | 0 | 0.0% |
| Mobile Home / Other | 9 | 15.8% |
| Total | 57 | 100.0% |
Housing Structures by Occupancy in Cuney
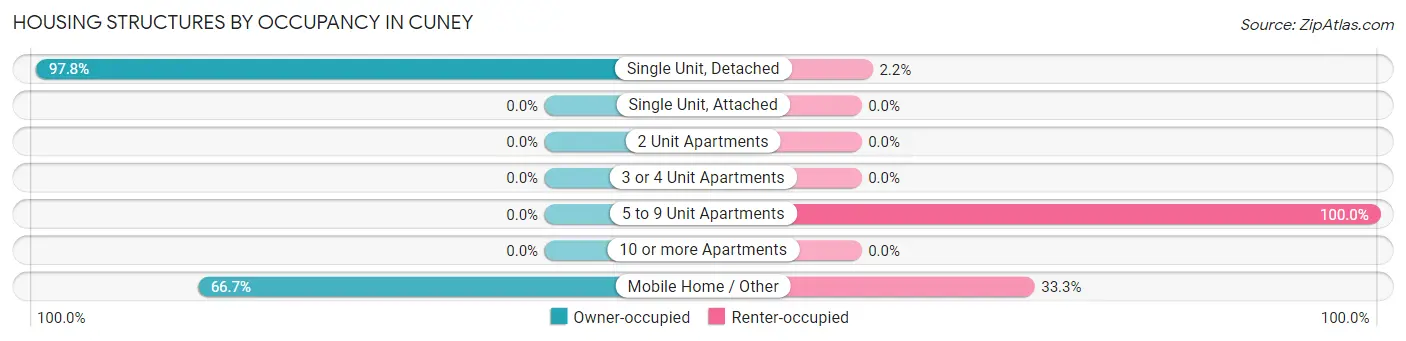
| Structure Type | Owner-occupied | Renter-occupied |
| Single Unit, Detached | 45 (97.8%) | 1 (2.2%) |
| Single Unit, Attached | 0 (0.0%) | 0 (0.0%) |
| 2 Unit Apartments | 0 (0.0%) | 0 (0.0%) |
| 3 or 4 Unit Apartments | 0 (0.0%) | 0 (0.0%) |
| 5 to 9 Unit Apartments | 0 (0.0%) | 2 (100.0%) |
| 10 or more Apartments | 0 (0.0%) | 0 (0.0%) |
| Mobile Home / Other | 6 (66.7%) | 3 (33.3%) |
| Total | 51 (89.5%) | 6 (10.5%) |
Housing Structures by Number of Rooms in Cuney
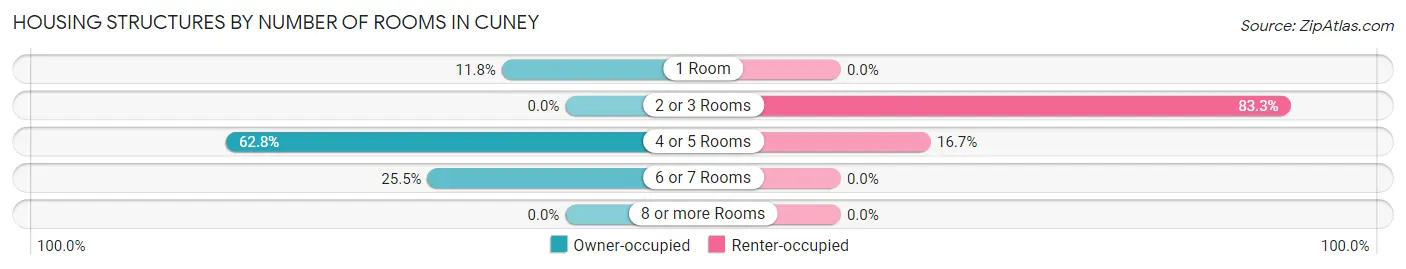
| Number of Rooms | Owner-occupied | Renter-occupied |
| 1 Room | 6 (11.8%) | 0 (0.0%) |
| 2 or 3 Rooms | 0 (0.0%) | 5 (83.3%) |
| 4 or 5 Rooms | 32 (62.7%) | 1 (16.7%) |
| 6 or 7 Rooms | 13 (25.5%) | 0 (0.0%) |
| 8 or more Rooms | 0 (0.0%) | 0 (0.0%) |
| Total | 51 (100.0%) | 6 (100.0%) |
Housing Structure by Heating Type in Cuney
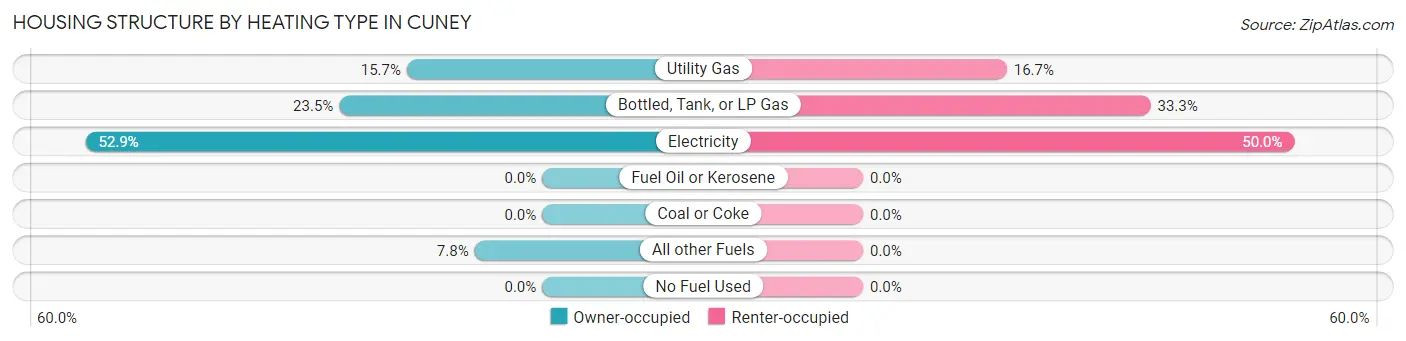
| Heating Type | Owner-occupied | Renter-occupied |
| Utility Gas | 8 (15.7%) | 1 (16.7%) |
| Bottled, Tank, or LP Gas | 12 (23.5%) | 2 (33.3%) |
| Electricity | 27 (52.9%) | 3 (50.0%) |
| Fuel Oil or Kerosene | 0 (0.0%) | 0 (0.0%) |
| Coal or Coke | 0 (0.0%) | 0 (0.0%) |
| All other Fuels | 4 (7.8%) | 0 (0.0%) |
| No Fuel Used | 0 (0.0%) | 0 (0.0%) |
| Total | 51 (100.0%) | 6 (100.0%) |
Household Vehicle Usage in Cuney
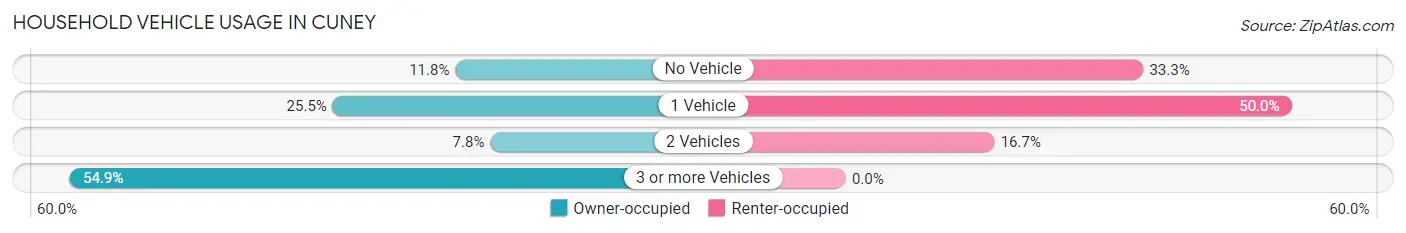
| Vehicles per Household | Owner-occupied | Renter-occupied |
| No Vehicle | 6 (11.8%) | 2 (33.3%) |
| 1 Vehicle | 13 (25.5%) | 3 (50.0%) |
| 2 Vehicles | 4 (7.8%) | 1 (16.7%) |
| 3 or more Vehicles | 28 (54.9%) | 0 (0.0%) |
| Total | 51 (100.0%) | 6 (100.0%) |
Real Estate & Mortgages in Cuney
Real Estate and Mortgage Overview in Cuney
| Characteristic | Without Mortgage | With Mortgage |
| Housing Units | 17 | 34 |
| Median Property Value | $21,300 | $0 |
| Median Household Income | - | - |
| Monthly Housing Costs | $313 | $0 |
| Real Estate Taxes | $308 | $0 |
Property Value by Mortgage Status in Cuney
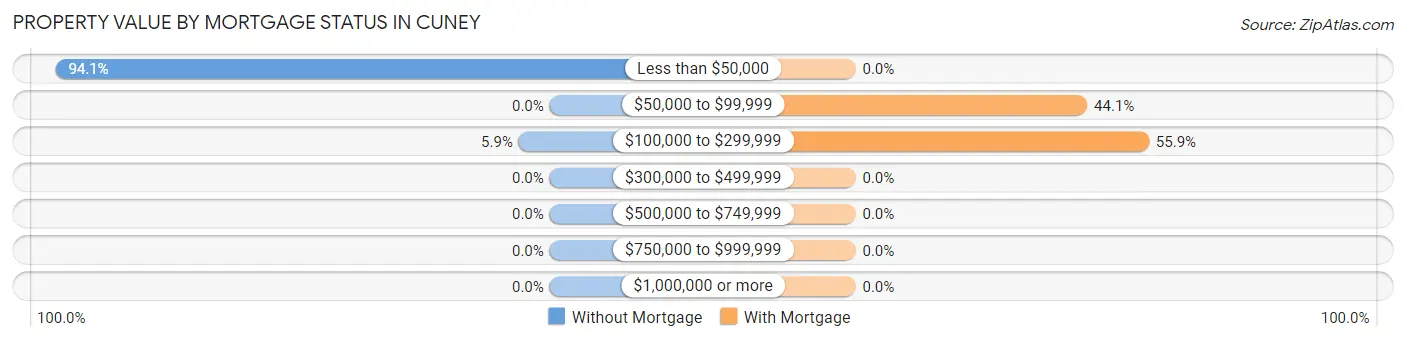
| Property Value | Without Mortgage | With Mortgage |
| Less than $50,000 | 16 (94.1%) | 0 (0.0%) |
| $50,000 to $99,999 | 0 (0.0%) | 15 (44.1%) |
| $100,000 to $299,999 | 1 (5.9%) | 19 (55.9%) |
| $300,000 to $499,999 | 0 (0.0%) | 0 (0.0%) |
| $500,000 to $749,999 | 0 (0.0%) | 0 (0.0%) |
| $750,000 to $999,999 | 0 (0.0%) | 0 (0.0%) |
| $1,000,000 or more | 0 (0.0%) | 0 (0.0%) |
| Total | 17 (100.0%) | 34 (100.0%) |
Household Income by Mortgage Status in Cuney
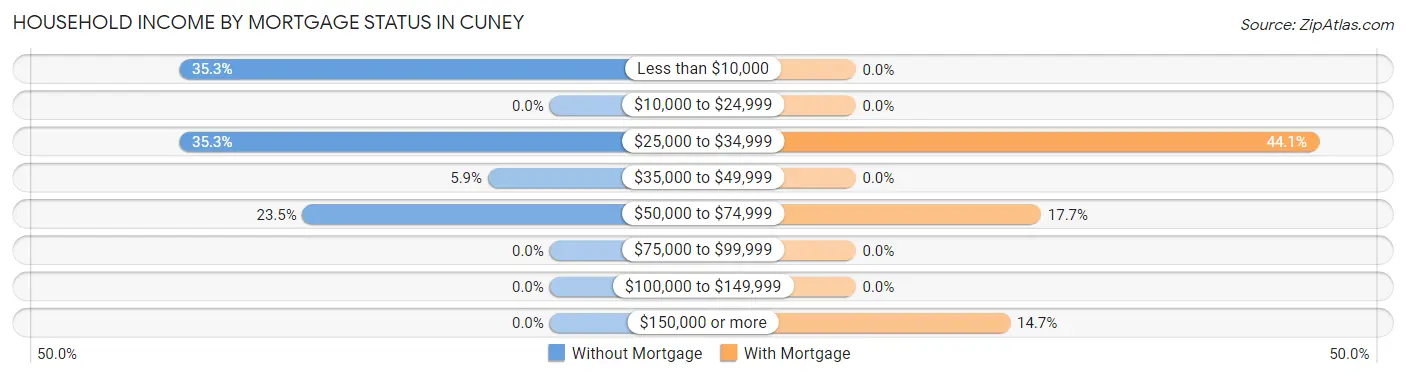
| Household Income | Without Mortgage | With Mortgage |
| Less than $10,000 | 6 (35.3%) | 0 (0.0%) |
| $10,000 to $24,999 | 0 (0.0%) | 0 (0.0%) |
| $25,000 to $34,999 | 6 (35.3%) | 15 (44.1%) |
| $35,000 to $49,999 | 1 (5.9%) | 0 (0.0%) |
| $50,000 to $74,999 | 4 (23.5%) | 6 (17.6%) |
| $75,000 to $99,999 | 0 (0.0%) | 0 (0.0%) |
| $100,000 to $149,999 | 0 (0.0%) | 0 (0.0%) |
| $150,000 or more | 0 (0.0%) | 5 (14.7%) |
| Total | 17 (100.0%) | 34 (100.0%) |
Property Value to Household Income Ratio in Cuney
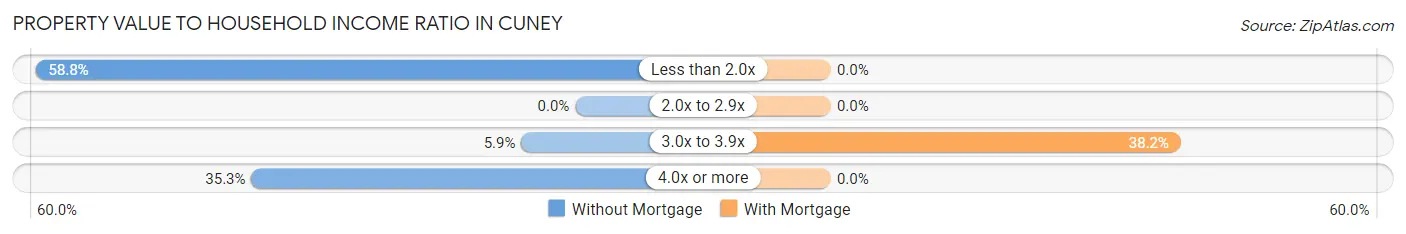
| Value-to-Income Ratio | Without Mortgage | With Mortgage |
| Less than 2.0x | 10 (58.8%) | 0 (0.0%) |
| 2.0x to 2.9x | 0 (0.0%) | 0 (0.0%) |
| 3.0x to 3.9x | 1 (5.9%) | 13 (38.2%) |
| 4.0x or more | 6 (35.3%) | 0 (0.0%) |
| Total | 17 (100.0%) | 34 (100.0%) |
Real Estate Taxes by Mortgage Status in Cuney
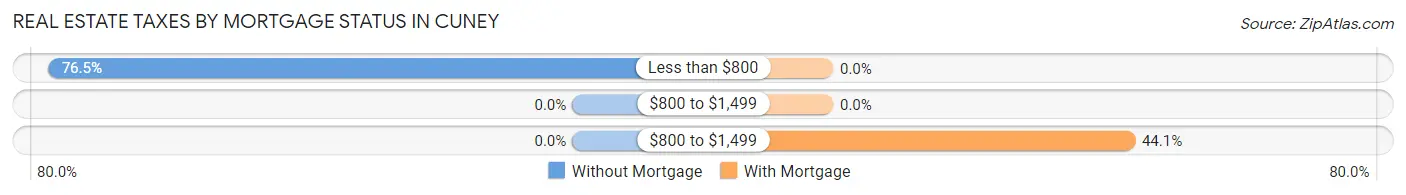
| Property Taxes | Without Mortgage | With Mortgage |
| Less than $800 | 13 (76.5%) | 0 (0.0%) |
| $800 to $1,499 | 0 (0.0%) | 0 (0.0%) |
| $800 to $1,499 | 0 (0.0%) | 15 (44.1%) |
| Total | 17 (100.0%) | 34 (100.0%) |
Health & Disability in Cuney
Health Insurance Coverage by Age in Cuney
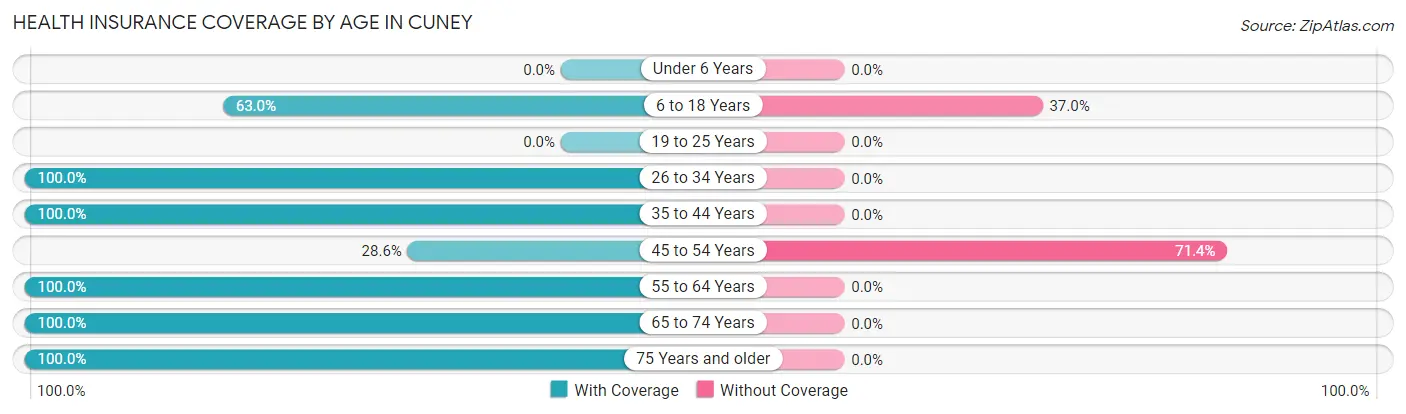
| Age Bracket | With Coverage | Without Coverage |
| Under 6 Years | 0 (0.0%) | 0 (0.0%) |
| 6 to 18 Years | 29 (63.0%) | 17 (37.0%) |
| 19 to 25 Years | 0 (0.0%) | 0 (0.0%) |
| 26 to 34 Years | 6 (100.0%) | 0 (0.0%) |
| 35 to 44 Years | 23 (100.0%) | 0 (0.0%) |
| 45 to 54 Years | 6 (28.6%) | 15 (71.4%) |
| 55 to 64 Years | 28 (100.0%) | 0 (0.0%) |
| 65 to 74 Years | 26 (100.0%) | 0 (0.0%) |
| 75 Years and older | 13 (100.0%) | 0 (0.0%) |
| Total | 131 (80.4%) | 32 (19.6%) |
Health Insurance Coverage by Citizenship Status in Cuney
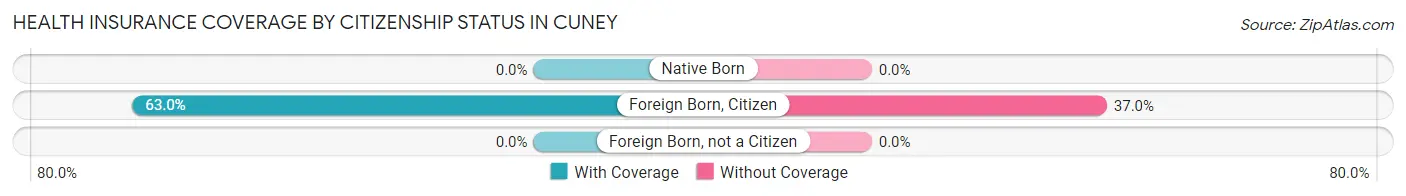
| Citizenship Status | With Coverage | Without Coverage |
| Native Born | 0 (0.0%) | 0 (0.0%) |
| Foreign Born, Citizen | 29 (63.0%) | 17 (37.0%) |
| Foreign Born, not a Citizen | 0 (0.0%) | 0 (0.0%) |
Health Insurance Coverage by Household Income in Cuney
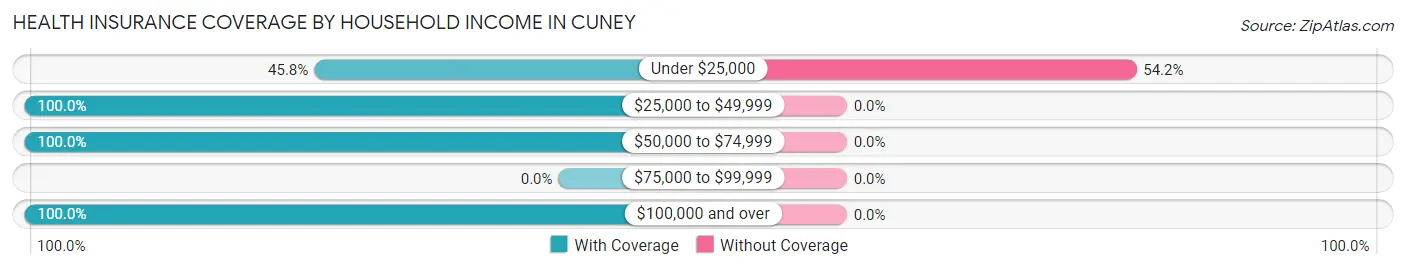
| Household Income | With Coverage | Without Coverage |
| Under $25,000 | 27 (45.8%) | 32 (54.2%) |
| $25,000 to $49,999 | 61 (100.0%) | 0 (0.0%) |
| $50,000 to $74,999 | 13 (100.0%) | 0 (0.0%) |
| $75,000 to $99,999 | 0 (0.0%) | 0 (0.0%) |
| $100,000 and over | 30 (100.0%) | 0 (0.0%) |
Public vs Private Health Insurance Coverage by Age in Cuney
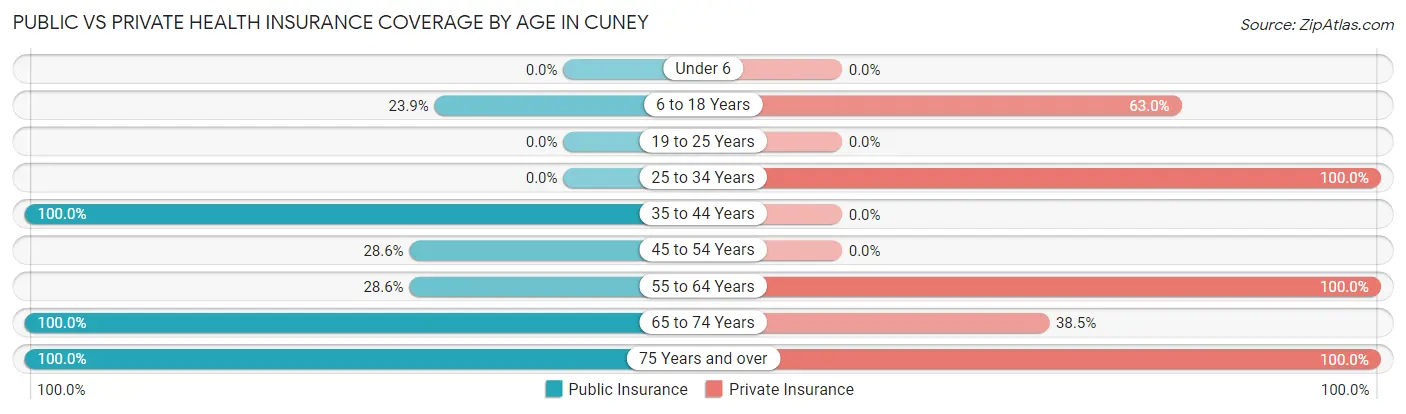
| Age Bracket | Public Insurance | Private Insurance |
| Under 6 | 0 (0.0%) | 0 (0.0%) |
| 6 to 18 Years | 11 (23.9%) | 29 (63.0%) |
| 19 to 25 Years | 0 (0.0%) | 0 (0.0%) |
| 25 to 34 Years | 0 (0.0%) | 6 (100.0%) |
| 35 to 44 Years | 23 (100.0%) | 0 (0.0%) |
| 45 to 54 Years | 6 (28.6%) | 0 (0.0%) |
| 55 to 64 Years | 8 (28.6%) | 28 (100.0%) |
| 65 to 74 Years | 26 (100.0%) | 10 (38.5%) |
| 75 Years and over | 13 (100.0%) | 13 (100.0%) |
| Total | 87 (53.4%) | 86 (52.8%) |
Disability Status by Sex by Age in Cuney
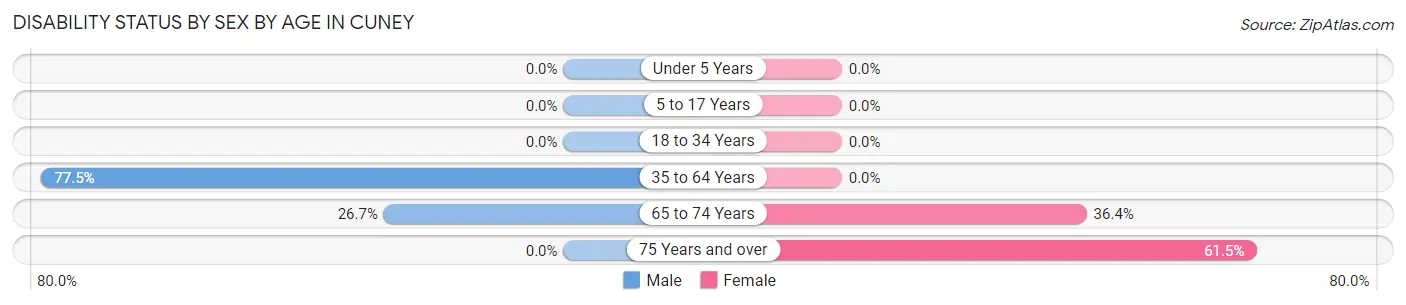
| Age Bracket | Male | Female |
| Under 5 Years | 0 (0.0%) | 0 (0.0%) |
| 5 to 17 Years | 0 (0.0%) | 0 (0.0%) |
| 18 to 34 Years | 0 (0.0%) | 0 (0.0%) |
| 35 to 64 Years | 31 (77.5%) | 0 (0.0%) |
| 65 to 74 Years | 4 (26.7%) | 4 (36.4%) |
| 75 Years and over | 0 (0.0%) | 8 (61.5%) |
Disability Class by Sex by Age in Cuney
Disability Class: Hearing Difficulty
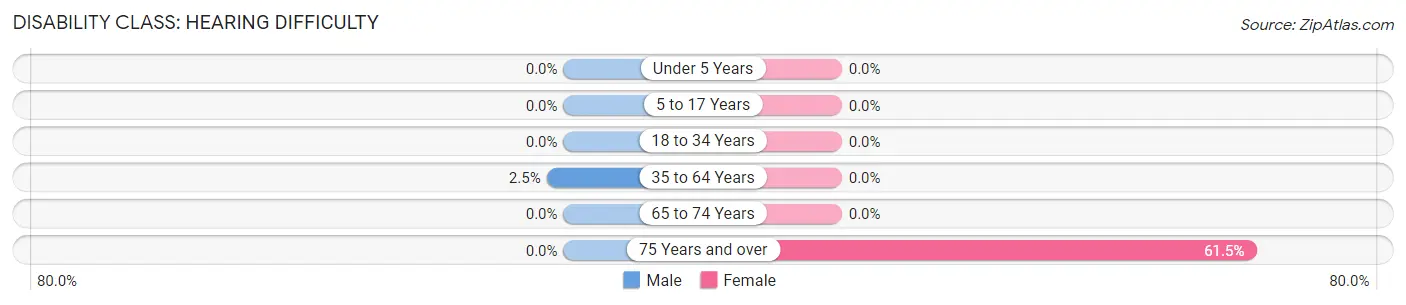
| Age Bracket | Male | Female |
| Under 5 Years | 0 (0.0%) | 0 (0.0%) |
| 5 to 17 Years | 0 (0.0%) | 0 (0.0%) |
| 18 to 34 Years | 0 (0.0%) | 0 (0.0%) |
| 35 to 64 Years | 1 (2.5%) | 0 (0.0%) |
| 65 to 74 Years | 0 (0.0%) | 0 (0.0%) |
| 75 Years and over | 0 (0.0%) | 8 (61.5%) |
Disability Class: Vision Difficulty
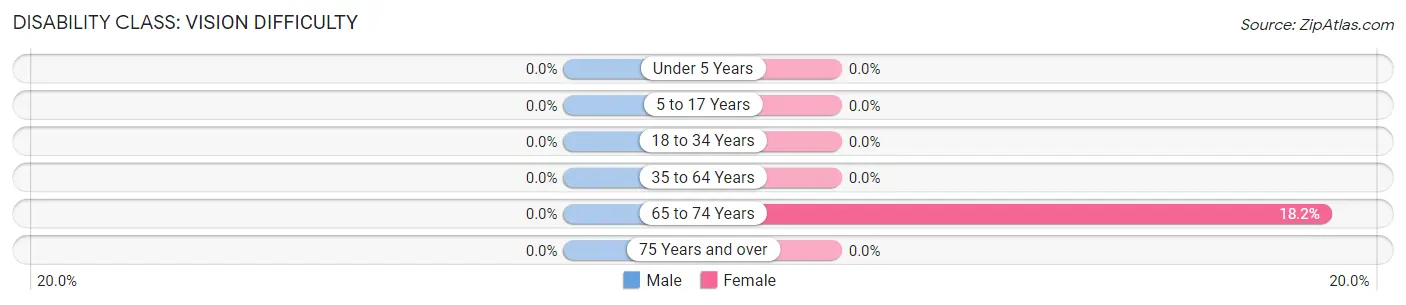
| Age Bracket | Male | Female |
| Under 5 Years | 0 (0.0%) | 0 (0.0%) |
| 5 to 17 Years | 0 (0.0%) | 0 (0.0%) |
| 18 to 34 Years | 0 (0.0%) | 0 (0.0%) |
| 35 to 64 Years | 0 (0.0%) | 0 (0.0%) |
| 65 to 74 Years | 0 (0.0%) | 2 (18.2%) |
| 75 Years and over | 0 (0.0%) | 0 (0.0%) |
Disability Class: Cognitive Difficulty
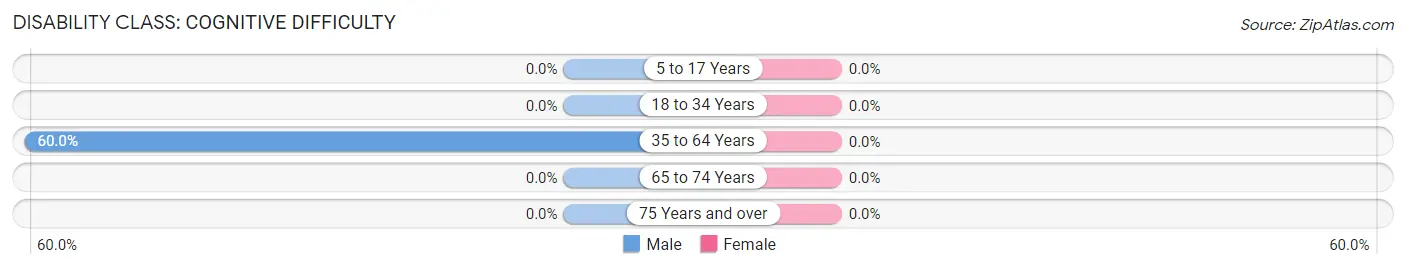
| Age Bracket | Male | Female |
| 5 to 17 Years | 0 (0.0%) | 0 (0.0%) |
| 18 to 34 Years | 0 (0.0%) | 0 (0.0%) |
| 35 to 64 Years | 24 (60.0%) | 0 (0.0%) |
| 65 to 74 Years | 0 (0.0%) | 0 (0.0%) |
| 75 Years and over | 0 (0.0%) | 0 (0.0%) |
Disability Class: Ambulatory Difficulty
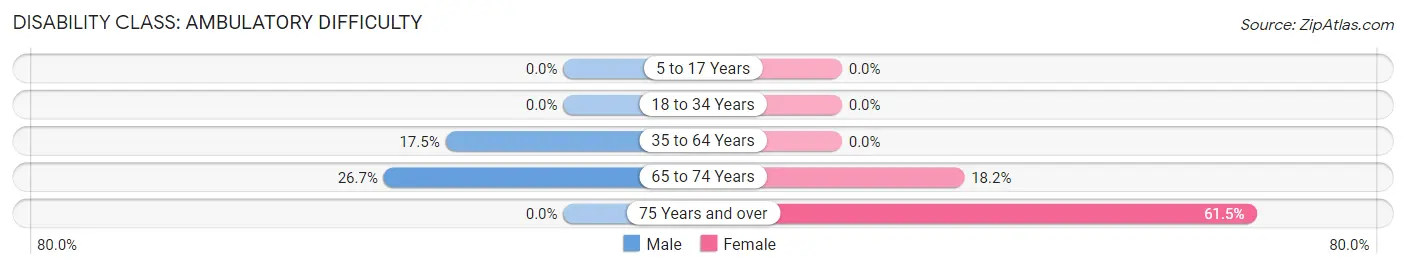
| Age Bracket | Male | Female |
| 5 to 17 Years | 0 (0.0%) | 0 (0.0%) |
| 18 to 34 Years | 0 (0.0%) | 0 (0.0%) |
| 35 to 64 Years | 7 (17.5%) | 0 (0.0%) |
| 65 to 74 Years | 4 (26.7%) | 2 (18.2%) |
| 75 Years and over | 0 (0.0%) | 8 (61.5%) |
Disability Class: Self-Care Difficulty
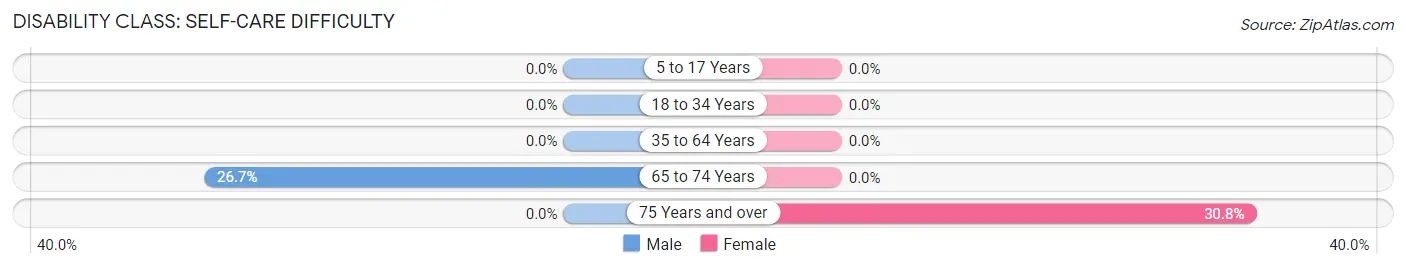
| Age Bracket | Male | Female |
| 5 to 17 Years | 0 (0.0%) | 0 (0.0%) |
| 18 to 34 Years | 0 (0.0%) | 0 (0.0%) |
| 35 to 64 Years | 0 (0.0%) | 0 (0.0%) |
| 65 to 74 Years | 4 (26.7%) | 0 (0.0%) |
| 75 Years and over | 0 (0.0%) | 4 (30.8%) |
Technology Access in Cuney
Computing Device Access in Cuney
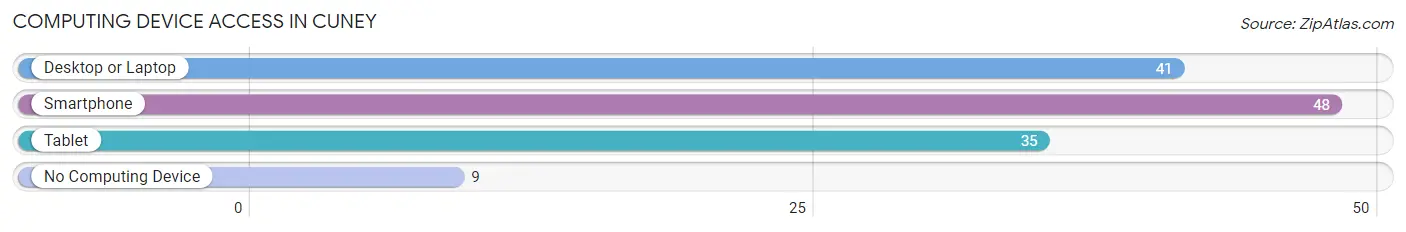
| Device Type | # Households | % Households |
| Desktop or Laptop | 41 | 71.9% |
| Smartphone | 48 | 84.2% |
| Tablet | 35 | 61.4% |
| No Computing Device | 9 | 15.8% |
| Total | 57 | 100.0% |
Internet Access in Cuney
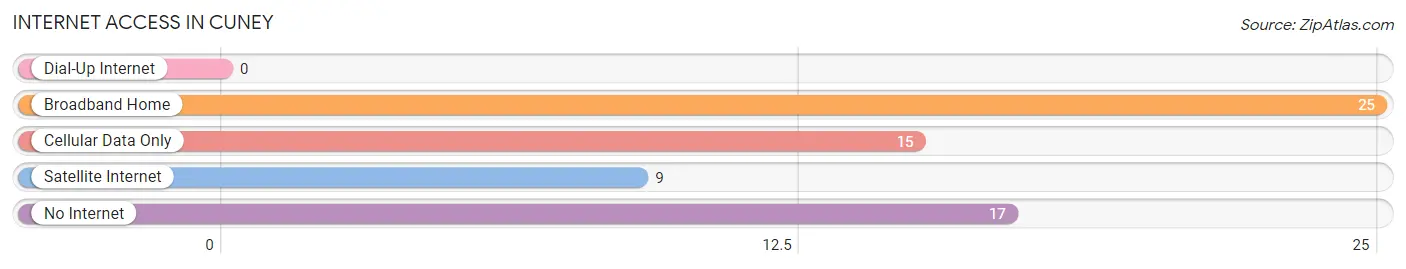
| Internet Type | # Households | % Households |
| Dial-Up Internet | 0 | 0.0% |
| Broadband Home | 25 | 43.9% |
| Cellular Data Only | 15 | 26.3% |
| Satellite Internet | 9 | 15.8% |
| No Internet | 17 | 29.8% |
| Total | 57 | 100.0% |
Cuney Summary
Cuney is a small town located in Cherokee County, Texas. It is situated about 10 miles south of the city of Jacksonville, and is part of the larger East Texas region. The town was founded in 1872 by freed slaves, and is named after William Cuney, a prominent African-American businessman and politician.
Geography
Cuney is located in the rolling hills of East Texas, and is surrounded by pine forests and small farms. The town is situated at the intersection of State Highway 135 and Farm-to-Market Road 855. The nearest major cities are Tyler, Longview, and Palestine, all of which are about an hour away. The town is located in the Neches River watershed, and is part of the Neches-Trinity aquifer system.
The climate in Cuney is humid subtropical, with hot summers and mild winters. The average annual temperature is around 70 degrees Fahrenheit, and the average annual precipitation is around 45 inches.
Economy
The economy of Cuney is largely based on agriculture and timber. The town is home to several small farms, and the surrounding area is known for its production of cotton, soybeans, and other crops. The timber industry is also an important part of the local economy, with several sawmills and wood-processing plants located in the area.
In addition to agriculture and timber, Cuney is home to several small businesses, including a grocery store, a hardware store, and a few restaurants. The town also has a post office, a library, and a few churches.
Demographics
As of the 2010 census, the population of Cuney was 1,093. The racial makeup of the town was 79.3% White, 17.2% African American, 0.7% Native American, 0.3% Asian, and 2.5% from other races. The median household income was $30,000, and the median family income was $35,000.
The town is served by the Cuney Independent School District, which includes an elementary school, a middle school, and a high school. The town is also home to the Cuney Community Center, which provides a variety of services and programs for the local community.
Conclusion
Cuney is a small town located in Cherokee County, Texas. It was founded in 1872 by freed slaves, and is named after William Cuney, a prominent African-American businessman and politician. The town is situated in the rolling hills of East Texas, and is surrounded by pine forests and small farms. The economy of Cuney is largely based on agriculture and timber, and the town is home to several small businesses. As of the 2010 census, the population of Cuney was 1,093, and the median household income was $30,000. The town is served by the Cuney Independent School District, and is home to the Cuney Community Center.
Common Questions
What is Per Capita Income in Cuney?
Per Capita income in Cuney is $15,967.
What is the Median Household income in Cuney?
Median Household Income in Cuney is $26,406.
What is Inequality or Gini Index in Cuney?
Inequality or Gini Index in Cuney is 0.49.
What is the Total Population of Cuney?
Total Population of Cuney is 163.
What is the Total Male Population of Cuney?
Total Male Population of Cuney is 57.
What is the Total Female Population of Cuney?
Total Female Population of Cuney is 106.
What is the Ratio of Males per 100 Females in Cuney?
There are 53.77 Males per 100 Females in Cuney.
What is the Ratio of Females per 100 Males in Cuney?
There are 185.96 Females per 100 Males in Cuney.
What is the Median Population Age in Cuney?
Median Population Age in Cuney is 46.4 Years.
What is the Average Family Size in Cuney
Average Family Size in Cuney is 3.4 People.
What is the Average Household Size in Cuney
Average Household Size in Cuney is 2.9 People.
How Large is the Labor Force in Cuney?
There are 68 People in the Labor Forcein in Cuney.
What is the Percentage of People in the Labor Force in Cuney?
49.6% of People are in the Labor Force in Cuney.
What is the Unemployment Rate in Cuney?
Unemployment Rate in Cuney is 1.5%.