Cross Plains, TX Map & Demographics
Cross Plains Map
Cross Plains Overview
$20,232
PER CAPITA INCOME
$57,736
AVG FAMILY INCOME
$48,516
AVG HOUSEHOLD INCOME
61.7%
WAGE / INCOME GAP [ % ]
38.3¢/ $1
WAGE / INCOME GAP [ $ ]
$11,195
FAMILY INCOME DEFICIT
0.36
INEQUALITY / GINI INDEX
1,143
TOTAL POPULATION
591
MALE POPULATION
552
FEMALE POPULATION
107.07
MALES / 100 FEMALES
93.40
FEMALES / 100 MALES
28.3
MEDIAN AGE
3.6
AVG FAMILY SIZE
2.7
AVG HOUSEHOLD SIZE
420
LABOR FORCE [ PEOPLE ]
56.5%
PERCENT IN LABOR FORCE
1.0%
UNEMPLOYMENT RATE
Cross Plains Zip Codes
Cross Plains Area Codes
Income in Cross Plains
Income Overview in Cross Plains
Per Capita Income in Cross Plains is $20,232, while median incomes of families and households are $57,736 and $48,516 respectively.
| Characteristic | Number | Measure |
| Per Capita Income | 1,143 | $20,232 |
| Median Family Income | 275 | $57,736 |
| Mean Family Income | 275 | $57,377 |
| Median Household Income | 424 | $48,516 |
| Mean Household Income | 424 | $52,890 |
| Income Deficit | 275 | $11,195 |
| Wage / Income Gap (%) | 1,143 | 61.73% |
| Wage / Income Gap ($) | 1,143 | 38.27¢ per $1 |
| Gini / Inequality Index | 1,143 | 0.36 |
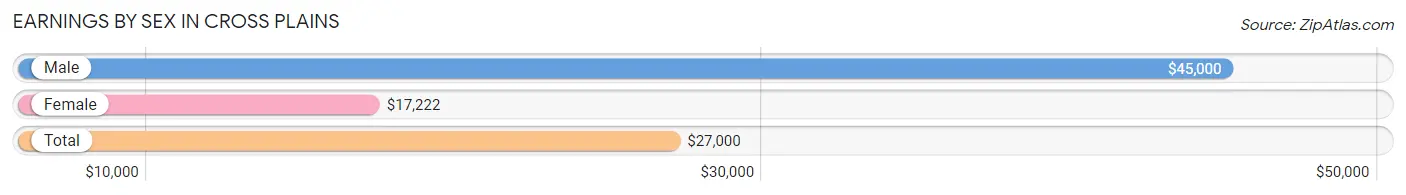
Earnings by Sex in Cross Plains
Average Earnings in Cross Plains are $27,000, $45,000 for men and $17,222 for women, a difference of 61.7%.
| Sex | Number | Average Earnings |
| Male | 254 (54.7%) | $45,000 |
| Female | 210 (45.3%) | $17,222 |
| Total | 464 (100.0%) | $27,000 |
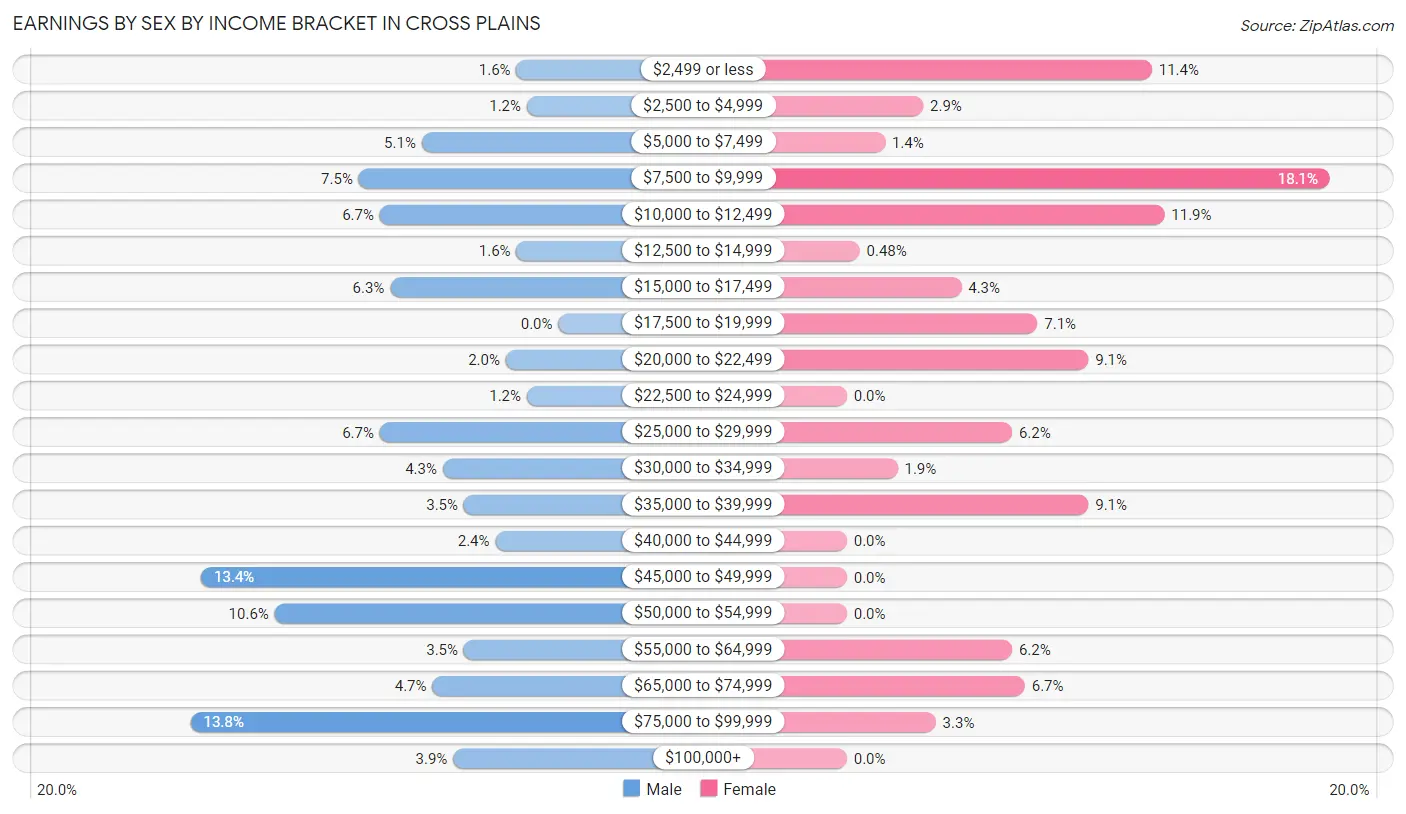
Earnings by Sex by Income Bracket in Cross Plains
The most common earnings brackets in Cross Plains are $75,000 to $99,999 for men (35 | 13.8%) and $7,500 to $9,999 for women (38 | 18.1%).
| Income | Male | Female |
| $2,499 or less | 4 (1.6%) | 24 (11.4%) |
| $2,500 to $4,999 | 3 (1.2%) | 6 (2.9%) |
| $5,000 to $7,499 | 13 (5.1%) | 3 (1.4%) |
| $7,500 to $9,999 | 19 (7.5%) | 38 (18.1%) |
| $10,000 to $12,499 | 17 (6.7%) | 25 (11.9%) |
| $12,500 to $14,999 | 4 (1.6%) | 1 (0.5%) |
| $15,000 to $17,499 | 16 (6.3%) | 9 (4.3%) |
| $17,500 to $19,999 | 0 (0.0%) | 15 (7.1%) |
| $20,000 to $22,499 | 5 (2.0%) | 19 (9.0%) |
| $22,500 to $24,999 | 3 (1.2%) | 0 (0.0%) |
| $25,000 to $29,999 | 17 (6.7%) | 13 (6.2%) |
| $30,000 to $34,999 | 11 (4.3%) | 4 (1.9%) |
| $35,000 to $39,999 | 9 (3.5%) | 19 (9.0%) |
| $40,000 to $44,999 | 6 (2.4%) | 0 (0.0%) |
| $45,000 to $49,999 | 34 (13.4%) | 0 (0.0%) |
| $50,000 to $54,999 | 27 (10.6%) | 0 (0.0%) |
| $55,000 to $64,999 | 9 (3.5%) | 13 (6.2%) |
| $65,000 to $74,999 | 12 (4.7%) | 14 (6.7%) |
| $75,000 to $99,999 | 35 (13.8%) | 7 (3.3%) |
| $100,000+ | 10 (3.9%) | 0 (0.0%) |
| Total | 254 (100.0%) | 210 (100.0%) |
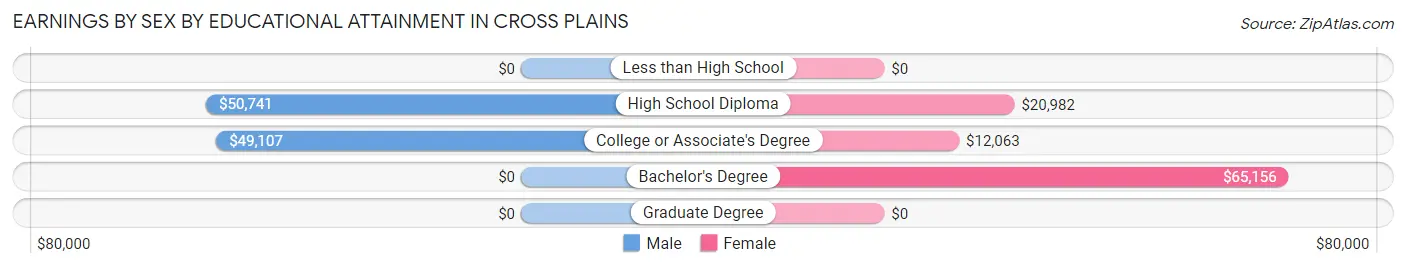
Earnings by Sex by Educational Attainment in Cross Plains
Average earnings in Cross Plains are $49,196 for men and $20,536 for women, a difference of 58.3%. Men with an educational attainment of high school diploma enjoy the highest average annual earnings of $50,741, while those with college or associate's degree education earn the least with $49,107. Women with an educational attainment of bachelor's degree earn the most with the average annual earnings of $65,156, while those with college or associate's degree education have the smallest earnings of $12,063.
| Educational Attainment | Male Income | Female Income |
| Less than High School | - | - |
| High School Diploma | $50,741 | $20,982 |
| College or Associate's Degree | $49,107 | $12,063 |
| Bachelor's Degree | - | - |
| Graduate Degree | - | - |
| Total | $49,196 | $20,536 |
Family Income in Cross Plains
Family Income Brackets in Cross Plains
According to the Cross Plains family income data, there are 101 families falling into the $50,000 to $74,999 income range, which is the most common income bracket and makes up 36.7% of all families. Conversely, the $10,000 to $14,999 income bracket is the least frequent group with only 2 families (0.7%) belonging to this category.
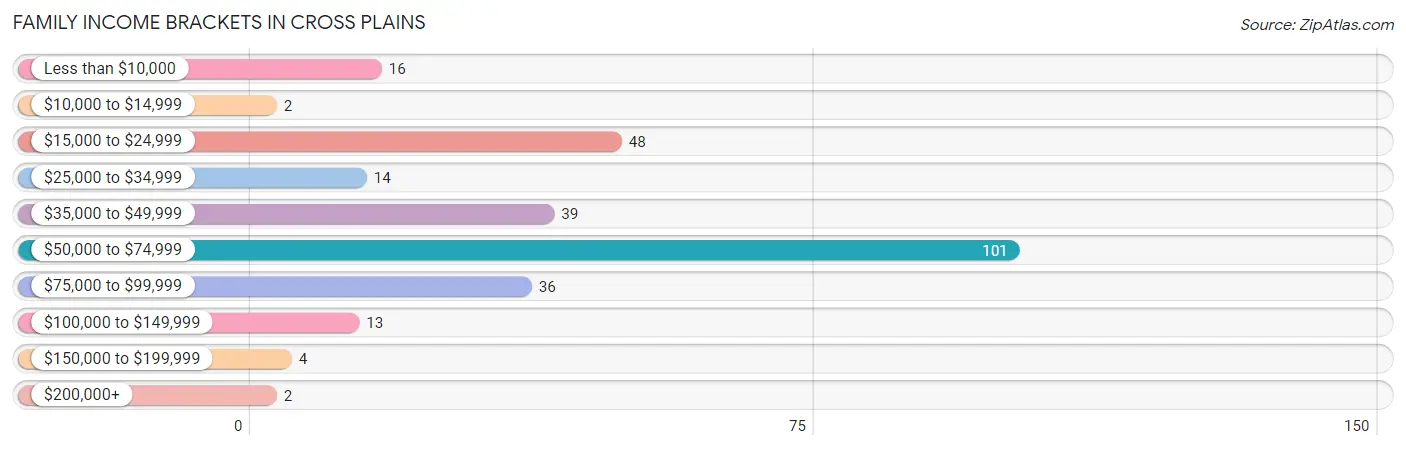
| Income Bracket | # Families | % Families |
| Less than $10,000 | 16 | 5.8% |
| $10,000 to $14,999 | 2 | 0.7% |
| $15,000 to $24,999 | 48 | 17.5% |
| $25,000 to $34,999 | 14 | 5.1% |
| $35,000 to $49,999 | 39 | 14.2% |
| $50,000 to $74,999 | 101 | 36.7% |
| $75,000 to $99,999 | 36 | 13.1% |
| $100,000 to $149,999 | 13 | 4.7% |
| $150,000 to $199,999 | 4 | 1.5% |
| $200,000+ | 2 | 0.7% |
Family Income by Famaliy Size in Cross Plains
5-person families (69 | 25.1%) account for the highest median family income in Cross Plains with $73,482 per family, while 2-person families (132 | 48.0%) have the highest median income of $27,361 per family member.
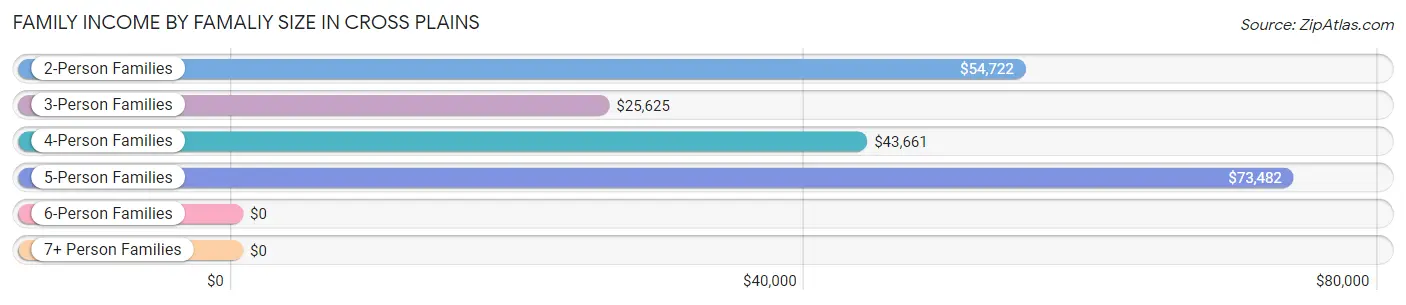
| Income Bracket | # Families | Median Income |
| 2-Person Families | 132 (48.0%) | $54,722 |
| 3-Person Families | 21 (7.6%) | $25,625 |
| 4-Person Families | 53 (19.3%) | $43,661 |
| 5-Person Families | 69 (25.1%) | $73,482 |
| 6-Person Families | 0 (0.0%) | $0 |
| 7+ Person Families | 0 (0.0%) | $0 |
| Total | 275 (100.0%) | $57,736 |
Family Income by Number of Earners in Cross Plains
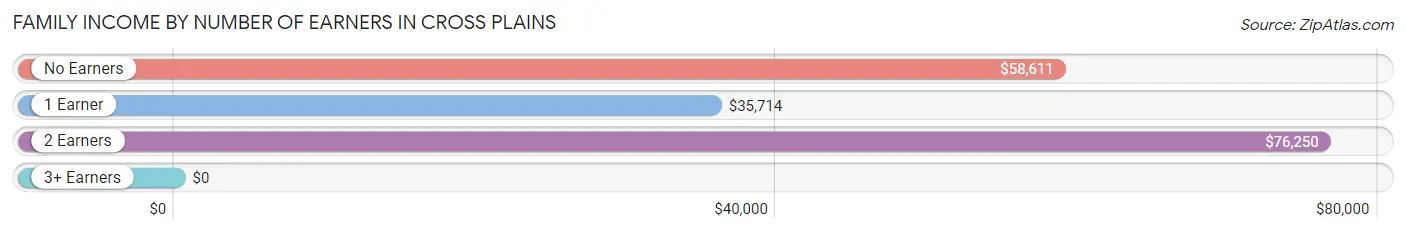
| Number of Earners | # Families | Median Income |
| No Earners | 70 (25.5%) | $58,611 |
| 1 Earner | 108 (39.3%) | $35,714 |
| 2 Earners | 88 (32.0%) | $76,250 |
| 3+ Earners | 9 (3.3%) | $0 |
| Total | 275 (100.0%) | $57,736 |
Household Income in Cross Plains
Household Income Brackets in Cross Plains
With 123 households falling in the category, the $50,000 to $74,999 income range is the most frequent in Cross Plains, accounting for 29.0% of all households. In contrast, only 2 households (0.5%) fall into the $200,000+ income bracket, making it the least populous group.
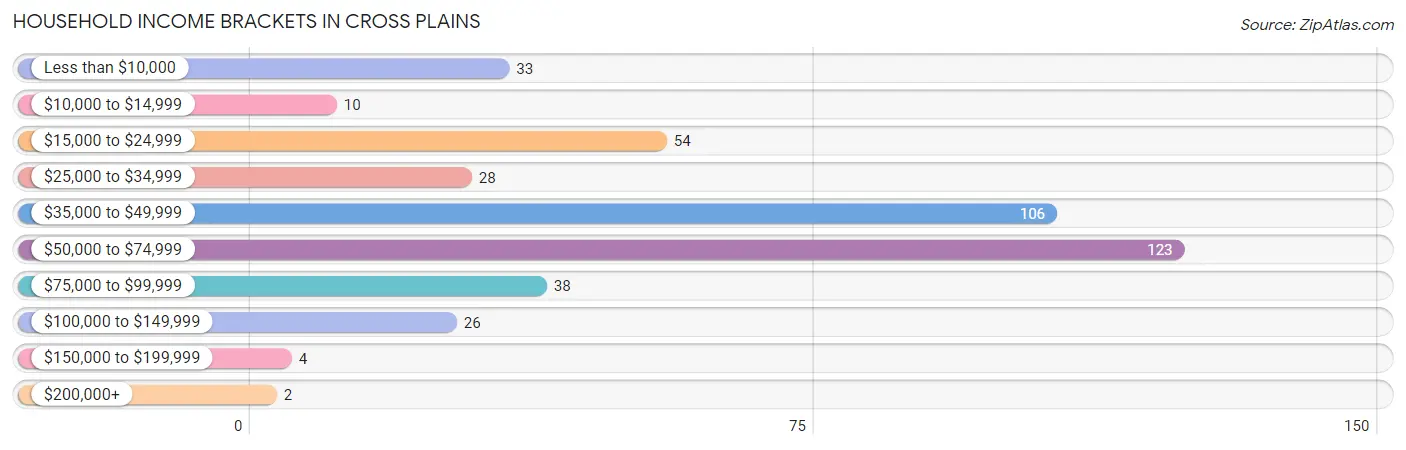
| Income Bracket | # Households | % Households |
| Less than $10,000 | 33 | 7.8% |
| $10,000 to $14,999 | 10 | 2.4% |
| $15,000 to $24,999 | 54 | 12.7% |
| $25,000 to $34,999 | 28 | 6.6% |
| $35,000 to $49,999 | 106 | 25.0% |
| $50,000 to $74,999 | 123 | 29.0% |
| $75,000 to $99,999 | 38 | 9.0% |
| $100,000 to $149,999 | 26 | 6.1% |
| $150,000 to $199,999 | 4 | 0.9% |
| $200,000+ | 2 | 0.5% |
Household Income by Householder Age in Cross Plains
The median household income in Cross Plains is $48,516, with the highest median household income of $55,000 found in the 45 to 64 years age bracket for the primary householder. A total of 104 households (24.5%) fall into this category. Meanwhile, the 15 to 24 years age bracket for the primary householder has the lowest median household income of $0, with 28 households (6.6%) in this group.
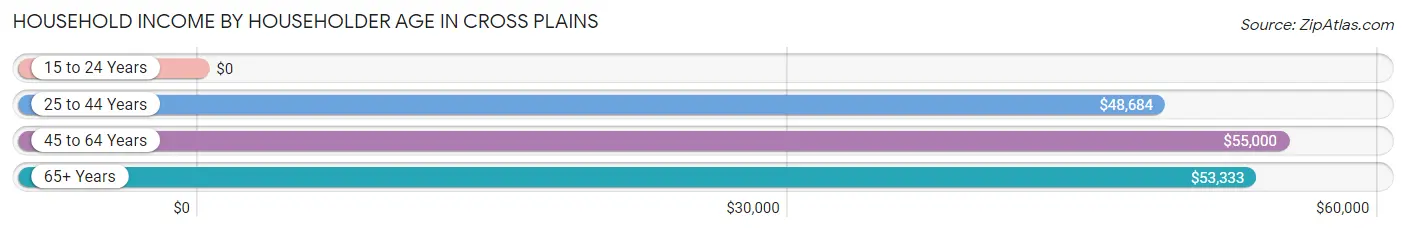
| Income Bracket | # Households | Median Income |
| 15 to 24 Years | 28 (6.6%) | $0 |
| 25 to 44 Years | 162 (38.2%) | $48,684 |
| 45 to 64 Years | 104 (24.5%) | $55,000 |
| 65+ Years | 130 (30.7%) | $53,333 |
| Total | 424 (100.0%) | $48,516 |
Poverty in Cross Plains
Income Below Poverty by Sex and Age in Cross Plains
With 12.7% poverty level for males and 11.6% for females among the residents of Cross Plains, 18 to 24 year old males and 12 to 14 year old females are the most vulnerable to poverty, with 22 males (44.0%) and 10 females (55.6%) in their respective age groups living below the poverty level.
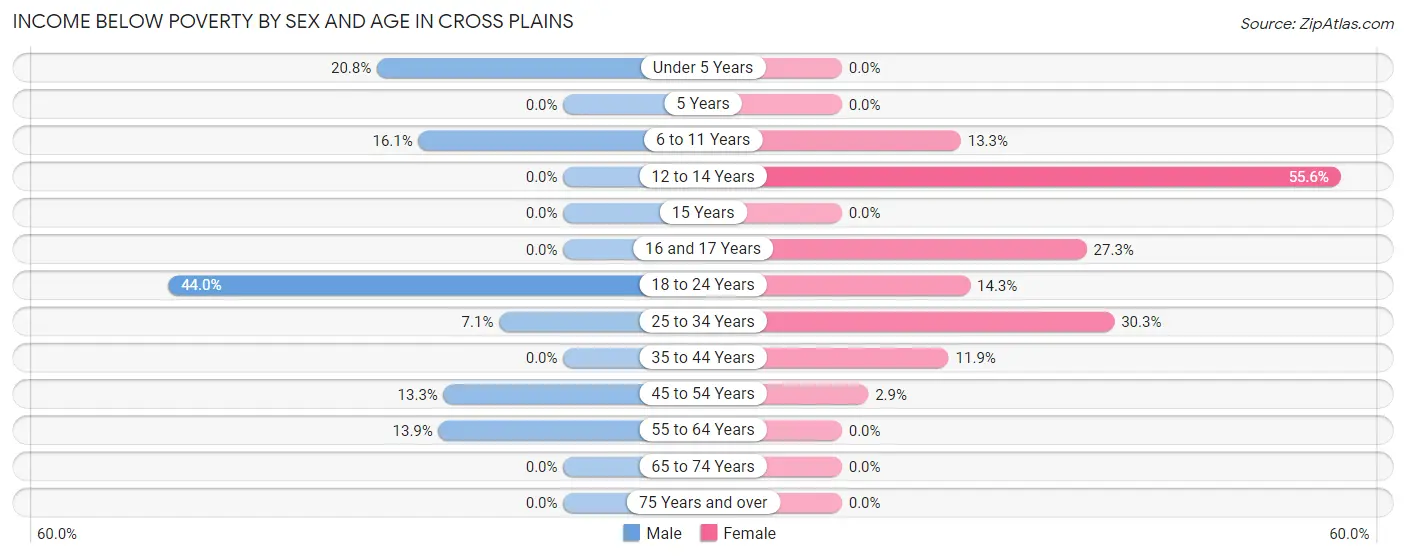
| Age Bracket | Male | Female |
| Under 5 Years | 22 (20.7%) | 0 (0.0%) |
| 5 Years | 0 (0.0%) | 0 (0.0%) |
| 6 to 11 Years | 10 (16.1%) | 11 (13.3%) |
| 12 to 14 Years | 0 (0.0%) | 10 (55.6%) |
| 15 Years | 0 (0.0%) | 0 (0.0%) |
| 16 and 17 Years | 0 (0.0%) | 3 (27.3%) |
| 18 to 24 Years | 22 (44.0%) | 7 (14.3%) |
| 25 to 34 Years | 7 (7.1%) | 27 (30.3%) |
| 35 to 44 Years | 0 (0.0%) | 5 (11.9%) |
| 45 to 54 Years | 4 (13.3%) | 1 (2.9%) |
| 55 to 64 Years | 10 (13.9%) | 0 (0.0%) |
| 65 to 74 Years | 0 (0.0%) | 0 (0.0%) |
| 75 Years and over | 0 (0.0%) | 0 (0.0%) |
| Total | 75 (12.7%) | 64 (11.6%) |
Income Above Poverty by Sex and Age in Cross Plains
According to the poverty statistics in Cross Plains, males aged 5 years and females aged under 5 years are the age groups that are most secure financially, with 100.0% of males and 100.0% of females in these age groups living above the poverty line.
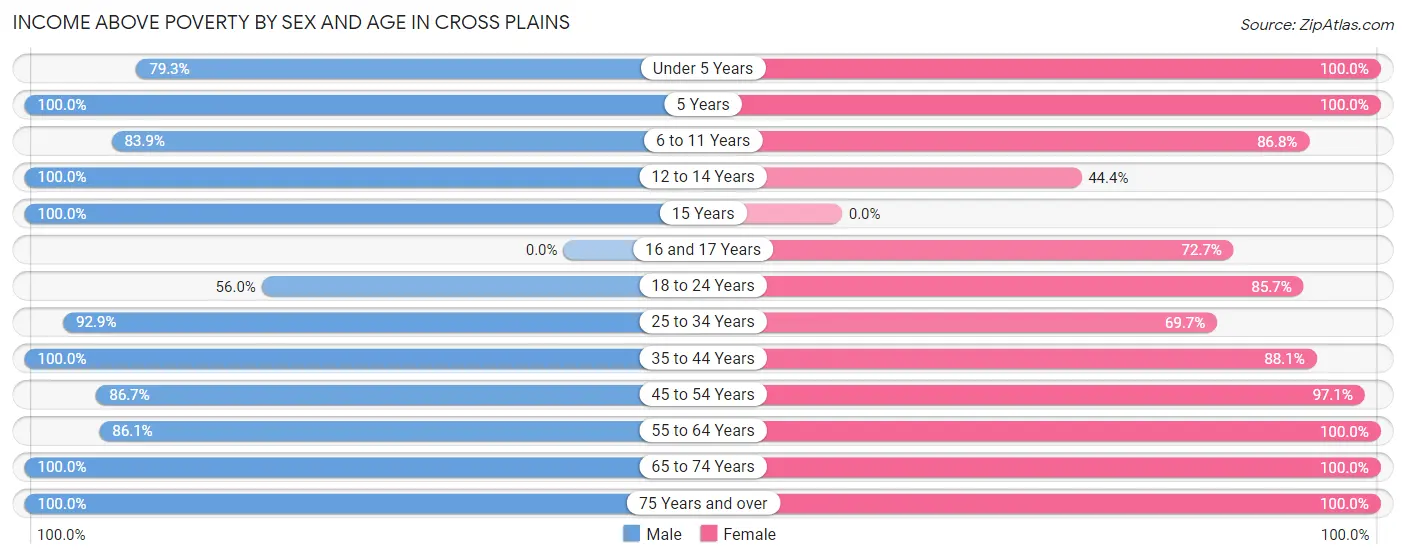
| Age Bracket | Male | Female |
| Under 5 Years | 84 (79.2%) | 90 (100.0%) |
| 5 Years | 8 (100.0%) | 7 (100.0%) |
| 6 to 11 Years | 52 (83.9%) | 72 (86.8%) |
| 12 to 14 Years | 16 (100.0%) | 8 (44.4%) |
| 15 Years | 10 (100.0%) | 0 (0.0%) |
| 16 and 17 Years | 0 (0.0%) | 8 (72.7%) |
| 18 to 24 Years | 28 (56.0%) | 42 (85.7%) |
| 25 to 34 Years | 91 (92.9%) | 62 (69.7%) |
| 35 to 44 Years | 46 (100.0%) | 37 (88.1%) |
| 45 to 54 Years | 26 (86.7%) | 33 (97.1%) |
| 55 to 64 Years | 62 (86.1%) | 39 (100.0%) |
| 65 to 74 Years | 37 (100.0%) | 43 (100.0%) |
| 75 Years and over | 56 (100.0%) | 47 (100.0%) |
| Total | 516 (87.3%) | 488 (88.4%) |
Income Below Poverty Among Married-Couple Families in Cross Plains
The poverty statistics for married-couple families in Cross Plains show that 6.6% or 14 of the total 212 families live below the poverty line. Families with 1 or 2 children have the highest poverty rate of 10.0%, comprising of 5 families. On the other hand, families with 3 or 4 children have the lowest poverty rate of 3.2%, which includes 2 families.
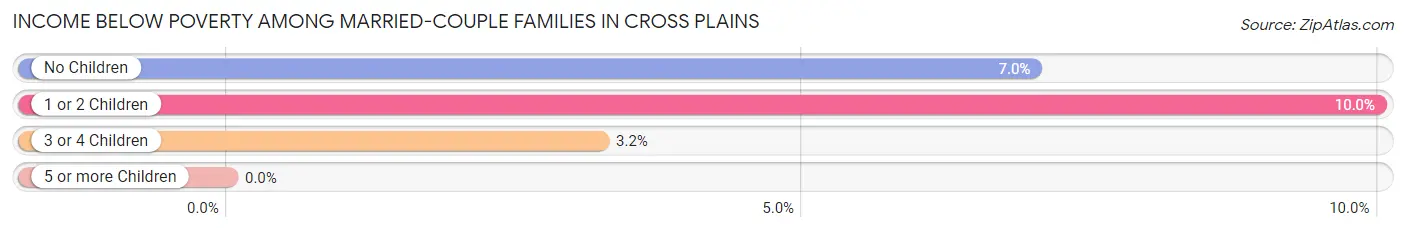
| Children | Above Poverty | Below Poverty |
| No Children | 93 (93.0%) | 7 (7.0%) |
| 1 or 2 Children | 45 (90.0%) | 5 (10.0%) |
| 3 or 4 Children | 60 (96.8%) | 2 (3.2%) |
| 5 or more Children | 0 (0.0%) | 0 (0.0%) |
| Total | 198 (93.4%) | 14 (6.6%) |
Income Below Poverty Among Single-Parent Households in Cross Plains
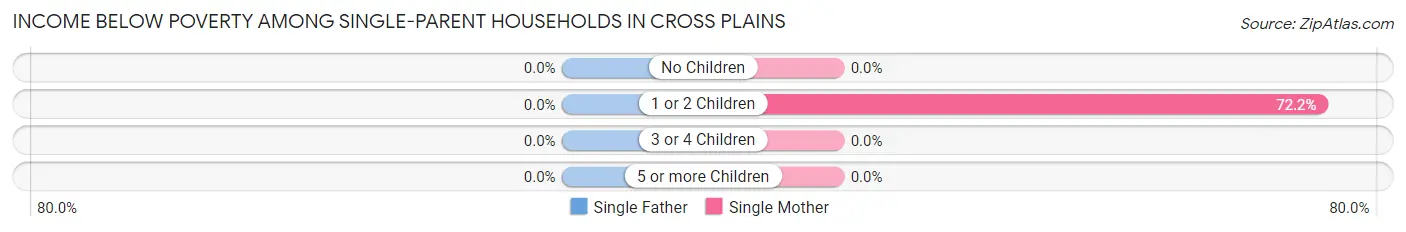
| Children | Single Father | Single Mother |
| No Children | 0 (0.0%) | 0 (0.0%) |
| 1 or 2 Children | 0 (0.0%) | 26 (72.2%) |
| 3 or 4 Children | 0 (0.0%) | 0 (0.0%) |
| 5 or more Children | 0 (0.0%) | 0 (0.0%) |
| Total | 0 (0.0%) | 26 (51.0%) |
Income Below Poverty Among Married-Couple vs Single-Parent Households in Cross Plains
The poverty data for Cross Plains shows that 14 of the married-couple family households (6.6%) and 26 of the single-parent households (41.3%) are living below the poverty level. Within the married-couple family households, those with 1 or 2 children have the highest poverty rate, with 5 households (10.0%) falling below the poverty line. Among the single-parent households, those with 1 or 2 children have the highest poverty rate, with 26 household (63.4%) living below poverty.
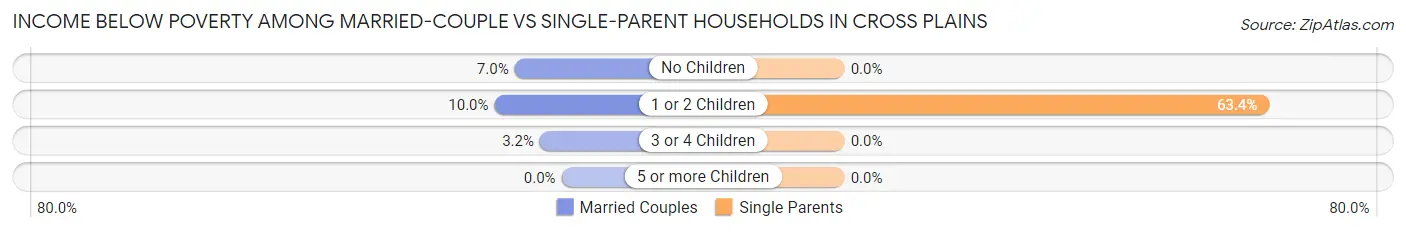
| Children | Married-Couple Families | Single-Parent Households |
| No Children | 7 (7.0%) | 0 (0.0%) |
| 1 or 2 Children | 5 (10.0%) | 26 (63.4%) |
| 3 or 4 Children | 2 (3.2%) | 0 (0.0%) |
| 5 or more Children | 0 (0.0%) | 0 (0.0%) |
| Total | 14 (6.6%) | 26 (41.3%) |
Race in Cross Plains
The most populous races in Cross Plains are White / Caucasian (1,106 | 96.8%), Hispanic or Latino (57 | 5.0%), and Two or more Races (36 | 3.2%).
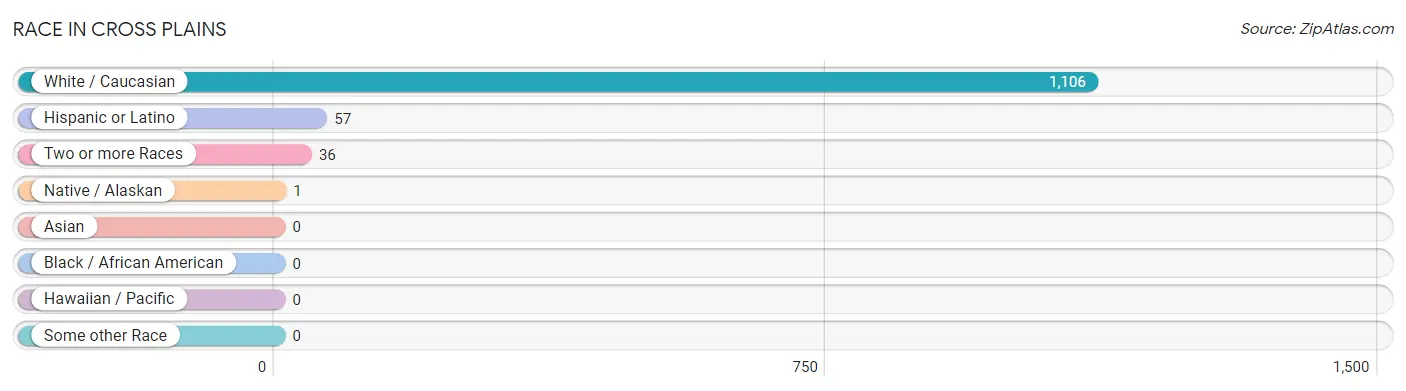
| Race | # Population | % Population |
| Asian | 0 | 0.0% |
| Black / African American | 0 | 0.0% |
| Hawaiian / Pacific | 0 | 0.0% |
| Hispanic or Latino | 57 | 5.0% |
| Native / Alaskan | 1 | 0.1% |
| White / Caucasian | 1,106 | 96.8% |
| Two or more Races | 36 | 3.2% |
| Some other Race | 0 | 0.0% |
| Total | 1,143 | 100.0% |
Ancestry in Cross Plains
The most populous ancestries reported in Cross Plains are European (329 | 28.8%), Irish (238 | 20.8%), German (171 | 15.0%), English (83 | 7.3%), and American (65 | 5.7%), together accounting for 77.5% of all Cross Plains residents.
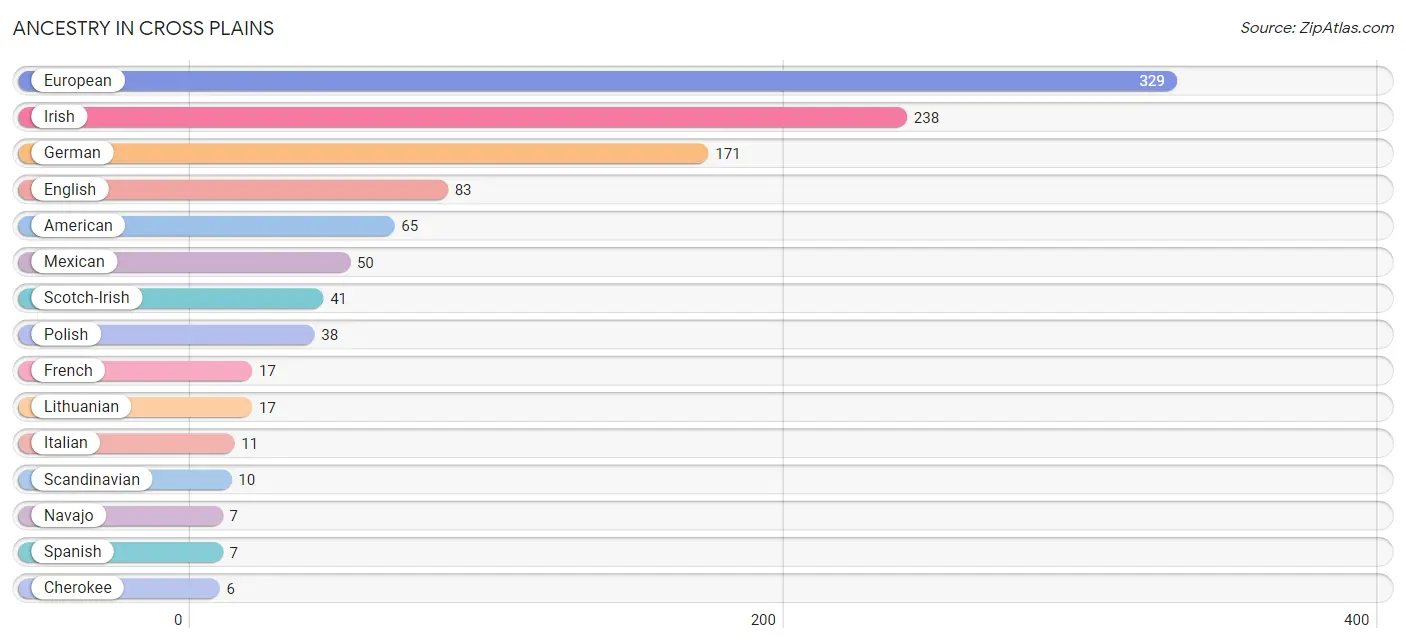
| Ancestry | # Population | % Population |
| American | 65 | 5.7% |
| British | 4 | 0.4% |
| Cherokee | 6 | 0.5% |
| Choctaw | 1 | 0.1% |
| Eastern European | 3 | 0.3% |
| English | 83 | 7.3% |
| European | 329 | 28.8% |
| French | 17 | 1.5% |
| French Canadian | 2 | 0.2% |
| German | 171 | 15.0% |
| Hungarian | 4 | 0.4% |
| Irish | 238 | 20.8% |
| Italian | 11 | 1.0% |
| Lithuanian | 17 | 1.5% |
| Mexican | 50 | 4.4% |
| Navajo | 7 | 0.6% |
| Polish | 38 | 3.3% |
| Portuguese | 1 | 0.1% |
| Scandinavian | 10 | 0.9% |
| Scotch-Irish | 41 | 3.6% |
| Spanish | 7 | 0.6% | View All 21 Rows |
Immigrants in Cross Plains
The most numerous immigrant groups reported in Cross Plains came from Central America (13 | 1.1%), Latin America (13 | 1.1%), and Mexico (13 | 1.1%), together accounting for 3.4% of all Cross Plains residents.
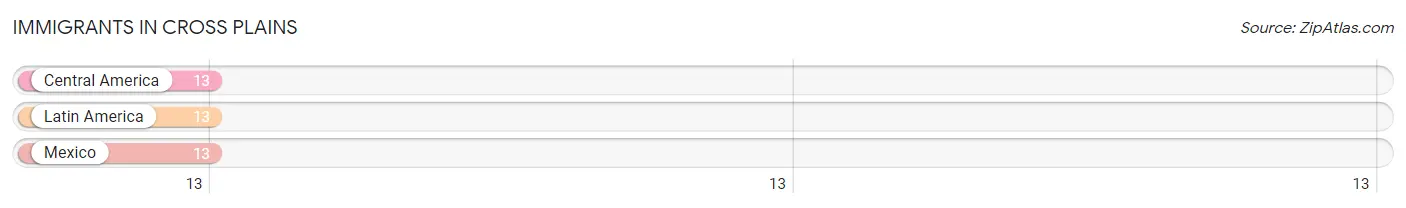
| Immigration Origin | # Population | % Population |
| Central America | 13 | 1.1% |
| Latin America | 13 | 1.1% |
| Mexico | 13 | 1.1% | View All 3 Rows |
Sex and Age in Cross Plains
Sex and Age in Cross Plains
The most populous age groups in Cross Plains are Under 5 Years (106 | 17.9%) for men and Under 5 Years (90 | 16.3%) for women.
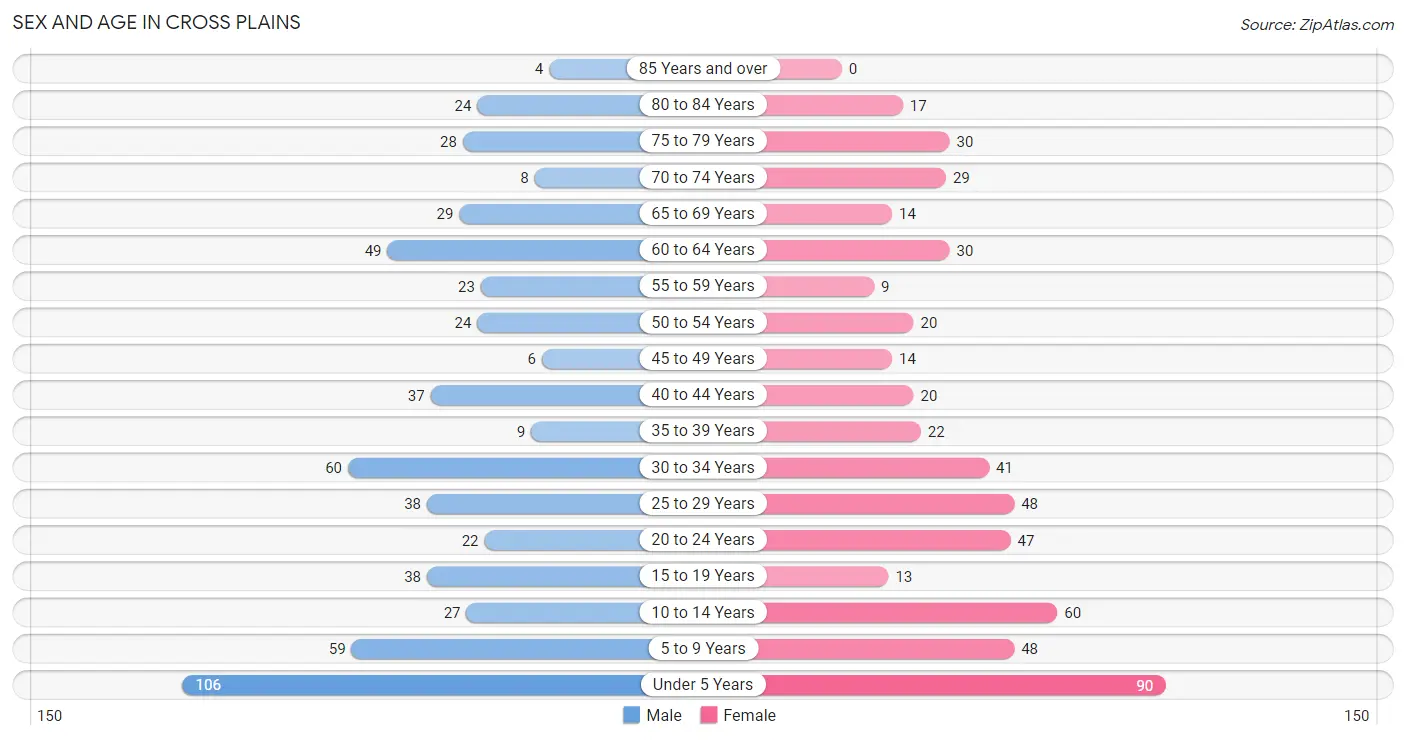
| Age Bracket | Male | Female |
| Under 5 Years | 106 (17.9%) | 90 (16.3%) |
| 5 to 9 Years | 59 (10.0%) | 48 (8.7%) |
| 10 to 14 Years | 27 (4.6%) | 60 (10.9%) |
| 15 to 19 Years | 38 (6.4%) | 13 (2.4%) |
| 20 to 24 Years | 22 (3.7%) | 47 (8.5%) |
| 25 to 29 Years | 38 (6.4%) | 48 (8.7%) |
| 30 to 34 Years | 60 (10.2%) | 41 (7.4%) |
| 35 to 39 Years | 9 (1.5%) | 22 (4.0%) |
| 40 to 44 Years | 37 (6.3%) | 20 (3.6%) |
| 45 to 49 Years | 6 (1.0%) | 14 (2.5%) |
| 50 to 54 Years | 24 (4.1%) | 20 (3.6%) |
| 55 to 59 Years | 23 (3.9%) | 9 (1.6%) |
| 60 to 64 Years | 49 (8.3%) | 30 (5.4%) |
| 65 to 69 Years | 29 (4.9%) | 14 (2.5%) |
| 70 to 74 Years | 8 (1.3%) | 29 (5.2%) |
| 75 to 79 Years | 28 (4.7%) | 30 (5.4%) |
| 80 to 84 Years | 24 (4.1%) | 17 (3.1%) |
| 85 Years and over | 4 (0.7%) | 0 (0.0%) |
| Total | 591 (100.0%) | 552 (100.0%) |
Families and Households in Cross Plains
Median Family Size in Cross Plains
The median family size in Cross Plains is 3.57 persons per family, with single male/father families (12 | 4.4%) accounting for the largest median family size of 4.33 persons per family. On the other hand, single female/mother families (51 | 18.5%) represent the smallest median family size with 3.16 persons per family.
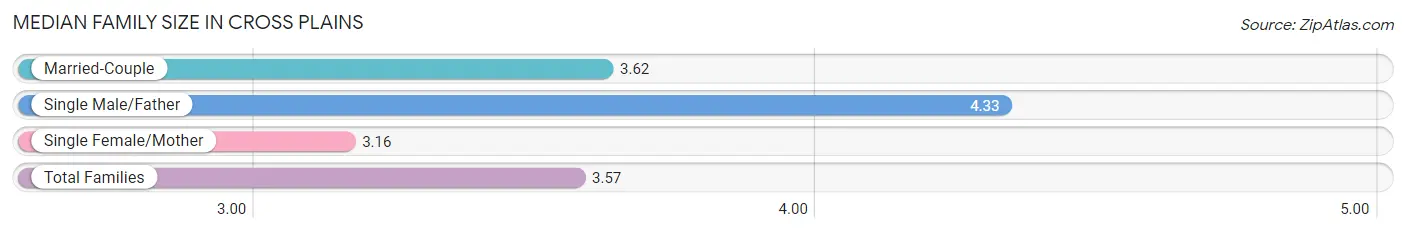
| Family Type | # Families | Family Size |
| Married-Couple | 212 (77.1%) | 3.62 |
| Single Male/Father | 12 (4.4%) | 4.33 |
| Single Female/Mother | 51 (18.5%) | 3.16 |
| Total Families | 275 (100.0%) | 3.57 |
Median Household Size in Cross Plains
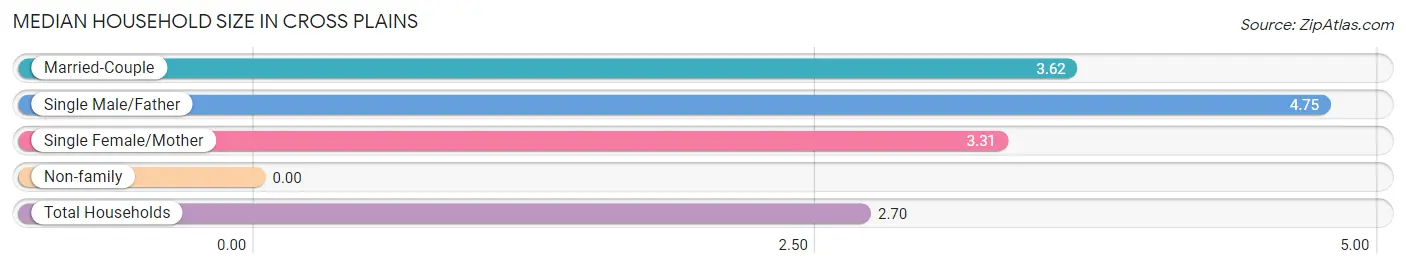
| Household Type | # Households | Household Size |
| Married-Couple | 212 (50.0%) | 3.62 |
| Single Male/Father | 12 (2.8%) | 4.75 |
| Single Female/Mother | 51 (12.0%) | 3.31 |
| Non-family | 149 (35.1%) | - |
| Total Households | 424 (100.0%) | 2.70 |
Household Size by Marriage Status in Cross Plains
Out of a total of 424 households in Cross Plains, 275 (64.9%) are family households, while 149 (35.1%) are nonfamily households. The most numerous type of family households are 2-person households, comprising 128, and the most common type of nonfamily households are 1-person households, comprising 149.
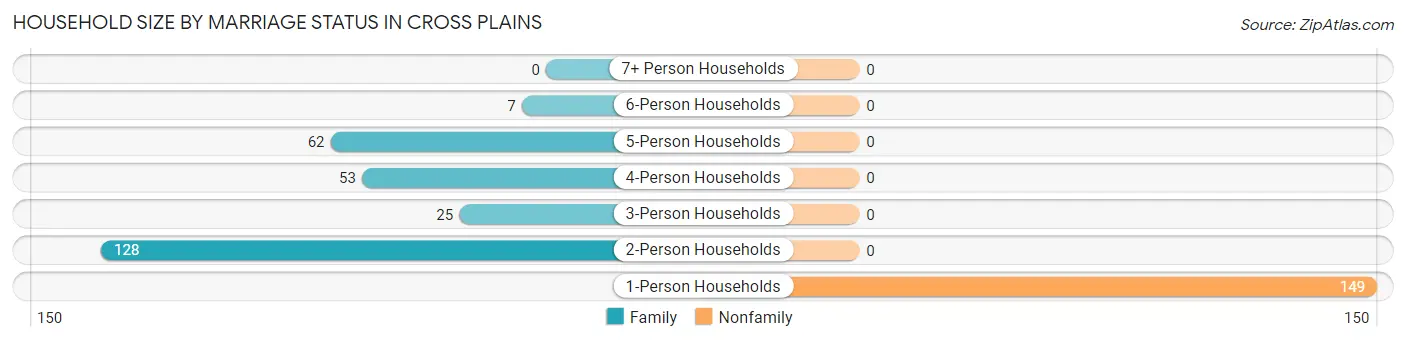
| Household Size | Family Households | Nonfamily Households |
| 1-Person Households | - | 149 (35.1%) |
| 2-Person Households | 128 (30.2%) | 0 (0.0%) |
| 3-Person Households | 25 (5.9%) | 0 (0.0%) |
| 4-Person Households | 53 (12.5%) | 0 (0.0%) |
| 5-Person Households | 62 (14.6%) | 0 (0.0%) |
| 6-Person Households | 7 (1.7%) | 0 (0.0%) |
| 7+ Person Households | 0 (0.0%) | 0 (0.0%) |
| Total | 275 (64.9%) | 149 (35.1%) |
Female Fertility in Cross Plains
Fertility by Age in Cross Plains
Average fertility rate in Cross Plains is 278.0 births per 1,000 women. Women in the age bracket of 20 to 34 years have the highest fertility rate with 426.0 births per 1,000 women. Women in the age bracket of 20 to 34 years acount for 100.0% of all women with births.
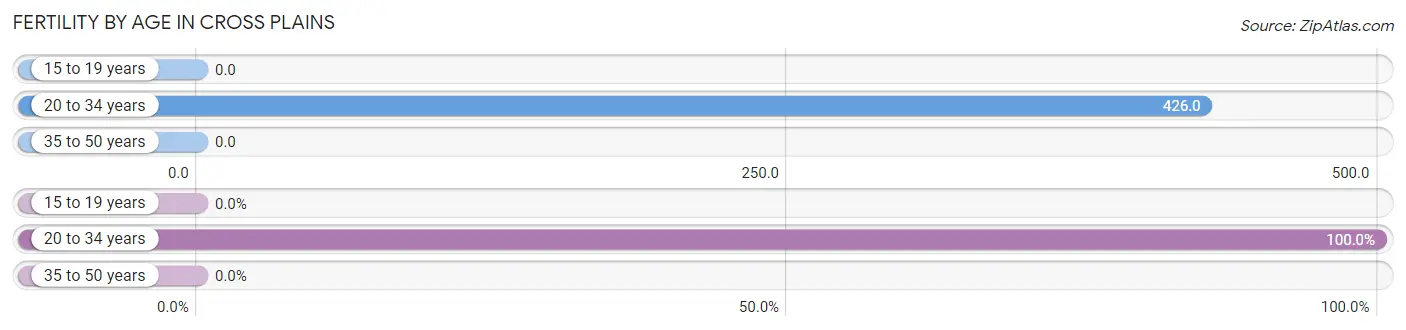
| Age Bracket | Women with Births | Births / 1,000 Women |
| 15 to 19 years | 0 (0.0%) | 0.0 |
| 20 to 34 years | 58 (100.0%) | 426.0 |
| 35 to 50 years | 0 (0.0%) | 0.0 |
| Total | 58 (100.0%) | 278.0 |
Fertility by Age by Marriage Status in Cross Plains
72.4% of women with births (58) in Cross Plains are married. The highest percentage of unmarried women with births falls into 20 to 34 years age bracket with 27.6% of them unmarried at the time of birth, while the lowest percentage of unmarried women with births belong to 20 to 34 years age bracket with 27.6% of them unmarried.
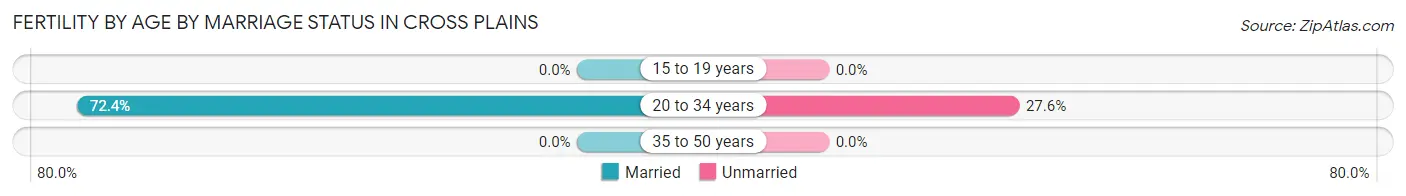
| Age Bracket | Married | Unmarried |
| 15 to 19 years | 0 (0.0%) | 0 (0.0%) |
| 20 to 34 years | 42 (72.4%) | 16 (27.6%) |
| 35 to 50 years | 0 (0.0%) | 0 (0.0%) |
| Total | 42 (72.4%) | 16 (27.6%) |
Fertility by Education in Cross Plains
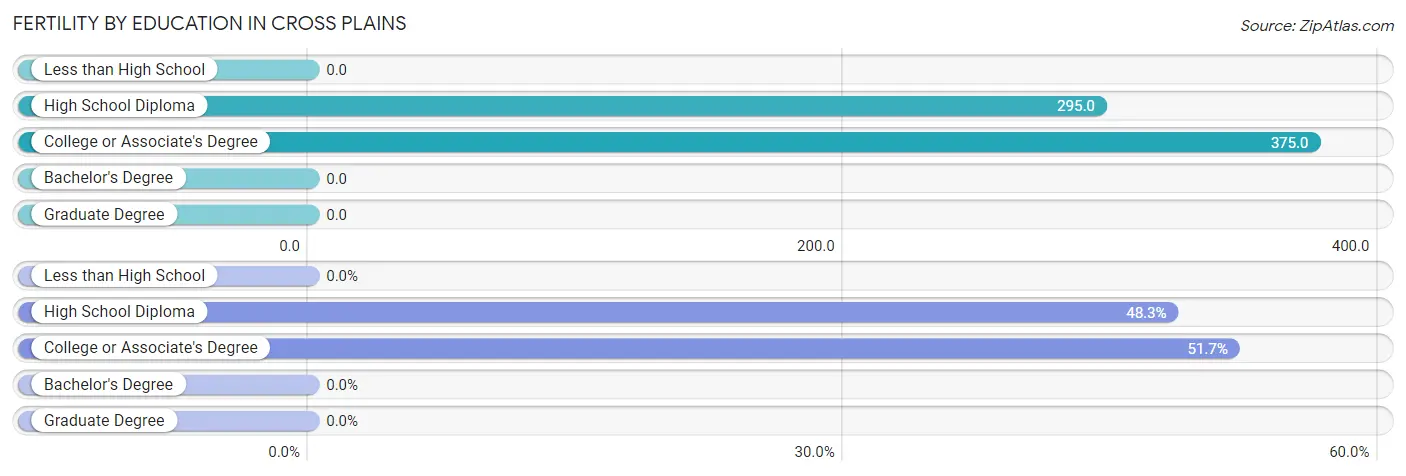
| Educational Attainment | Women with Births | Births / 1,000 Women |
| Less than High School | 0 (0.0%) | 0.0 |
| High School Diploma | 28 (48.3%) | 295.0 |
| College or Associate's Degree | 30 (51.7%) | 375.0 |
| Bachelor's Degree | 0 (0.0%) | 0.0 |
| Graduate Degree | 0 (0.0%) | 0.0 |
| Total | 58 (100.0%) | 278.0 |
Fertility by Education by Marriage Status in Cross Plains
27.6% of women with births in Cross Plains are unmarried. Women with the educational attainment of high school diploma are most likely to be married with 100.0% of them married at childbirth, while women with the educational attainment of college or associate's degree are least likely to be married with 53.3% of them unmarried at childbirth.
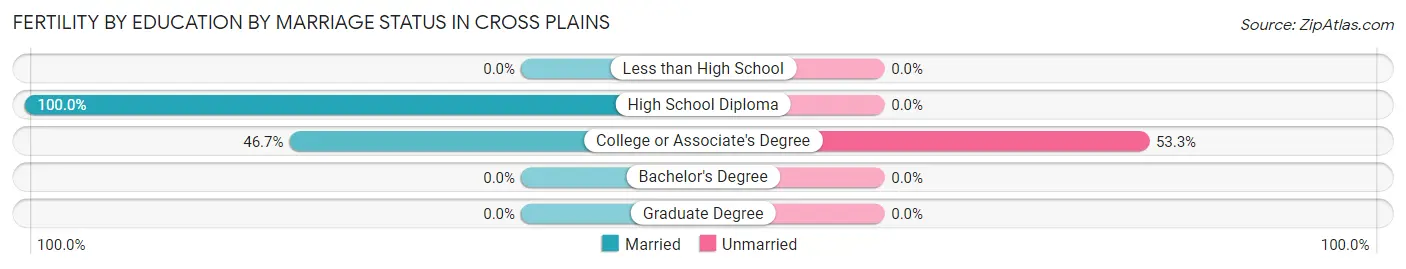
| Educational Attainment | Married | Unmarried |
| Less than High School | 0 (0.0%) | 0 (0.0%) |
| High School Diploma | 28 (100.0%) | 0 (0.0%) |
| College or Associate's Degree | 14 (46.7%) | 16 (53.3%) |
| Bachelor's Degree | 0 (0.0%) | 0 (0.0%) |
| Graduate Degree | 0 (0.0%) | 0 (0.0%) |
| Total | 42 (72.4%) | 16 (27.6%) |
Employment Characteristics in Cross Plains
Employment by Class of Employer in Cross Plains
Among the 398 employed individuals in Cross Plains, private company employees (272 | 68.3%), self-employed (not incorporated) (81 | 20.3%), and state government employees (24 | 6.0%) make up the most common classes of employment.
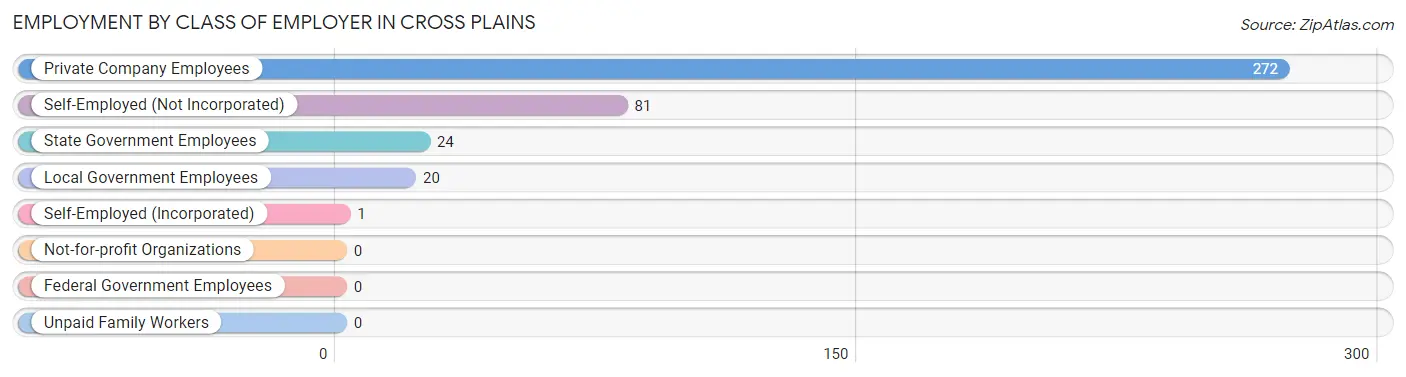
| Employer Class | # Employees | % Employees |
| Private Company Employees | 272 | 68.3% |
| Self-Employed (Incorporated) | 1 | 0.3% |
| Self-Employed (Not Incorporated) | 81 | 20.3% |
| Not-for-profit Organizations | 0 | 0.0% |
| Local Government Employees | 20 | 5.0% |
| State Government Employees | 24 | 6.0% |
| Federal Government Employees | 0 | 0.0% |
| Unpaid Family Workers | 0 | 0.0% |
| Total | 398 | 100.0% |
Employment Status by Age in Cross Plains
According to the labor force statistics for Cross Plains, out of the total population over 16 years of age (743), 56.5% or 420 individuals are in the labor force, with 1.0% or 4 of them unemployed. The age group with the highest labor force participation rate is 35 to 44 years, with 100.0% or 88 individuals in the labor force. Within the labor force, the 35 to 44 years age range has the highest percentage of unemployed individuals, with 4.5% or 4 of them being unemployed.
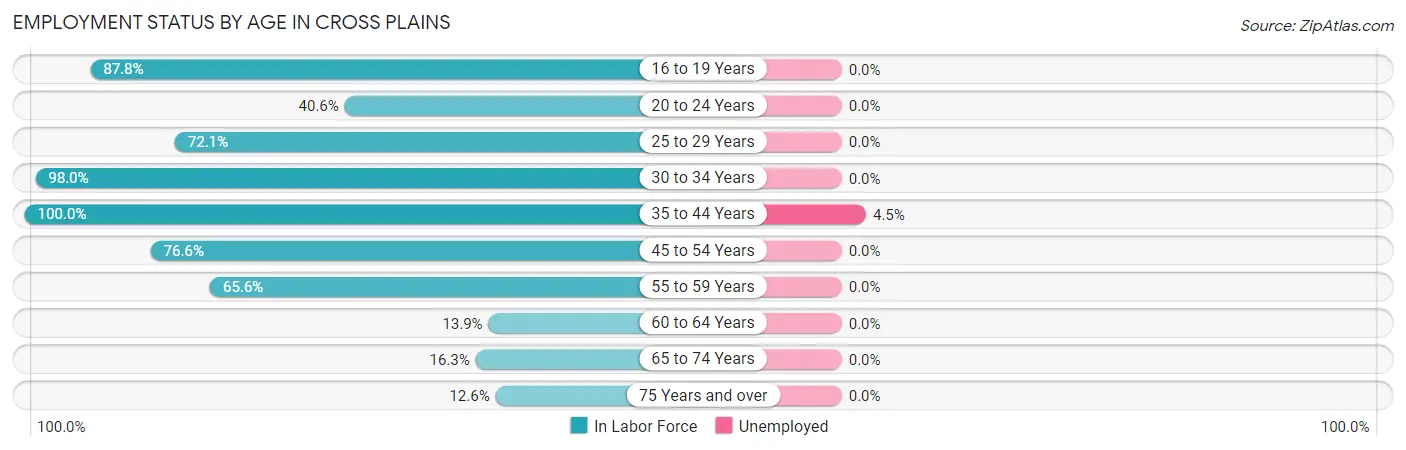
| Age Bracket | In Labor Force | Unemployed |
| 16 to 19 Years | 36 (87.8%) | 0 (0.0%) |
| 20 to 24 Years | 28 (40.6%) | 0 (0.0%) |
| 25 to 29 Years | 62 (72.1%) | 0 (0.0%) |
| 30 to 34 Years | 99 (98.0%) | 0 (0.0%) |
| 35 to 44 Years | 88 (100.0%) | 4 (4.5%) |
| 45 to 54 Years | 49 (76.6%) | 0 (0.0%) |
| 55 to 59 Years | 21 (65.6%) | 0 (0.0%) |
| 60 to 64 Years | 11 (13.9%) | 0 (0.0%) |
| 65 to 74 Years | 13 (16.3%) | 0 (0.0%) |
| 75 Years and over | 13 (12.6%) | 0 (0.0%) |
| Total | 420 (56.5%) | 4 (1.0%) |
Employment Status by Educational Attainment in Cross Plains
According to labor force statistics for Cross Plains, 73.3% of individuals (330) out of the total population between 25 and 64 years of age (450) are in the labor force, with 1.2% or 4 of them being unemployed. The group with the highest labor force participation rate are those with the educational attainment of bachelor's degree or higher, with 100.0% or 61 individuals in the labor force. Within the labor force, individuals with college / associate degree education have the highest percentage of unemployment, with 3.1% or 4 of them being unemployed.
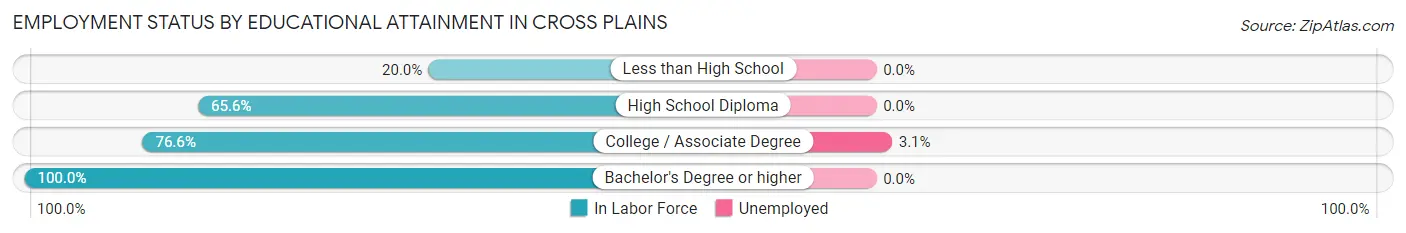
| Educational Attainment | In Labor Force | Unemployed |
| Less than High School | 2 (20.0%) | 0 (0.0%) |
| High School Diploma | 139 (65.6%) | 0 (0.0%) |
| College / Associate Degree | 128 (76.6%) | 5 (3.1%) |
| Bachelor's Degree or higher | 61 (100.0%) | 0 (0.0%) |
| Total | 330 (73.3%) | 5 (1.2%) |
Employment Occupations by Sex in Cross Plains
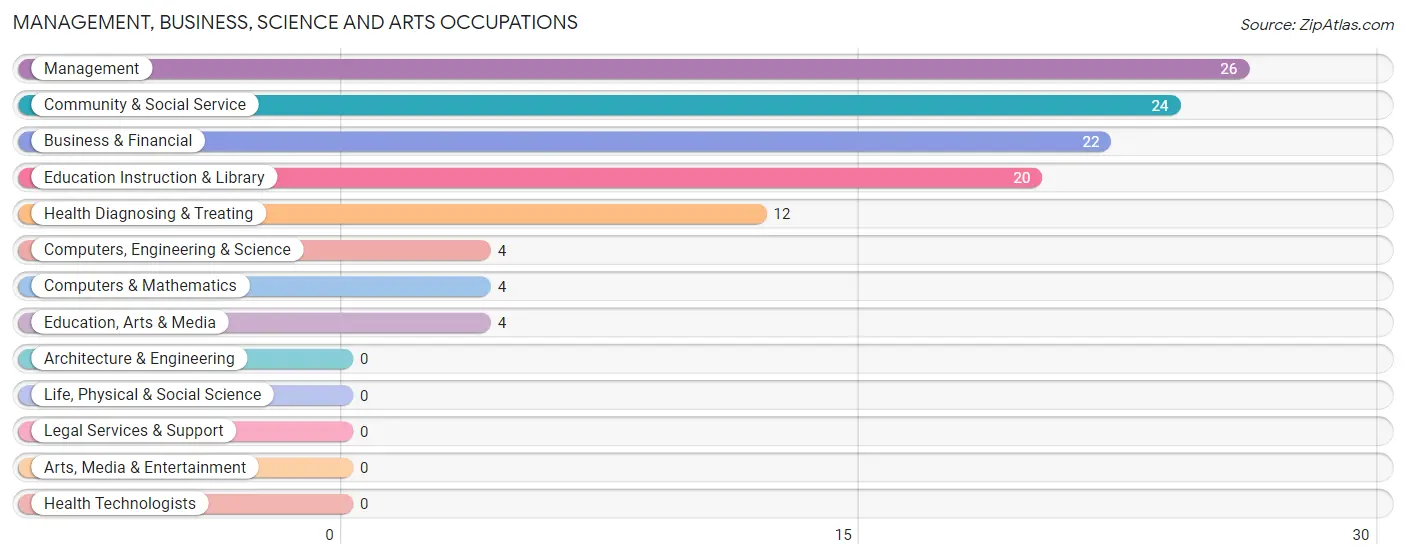
Management, Business, Science and Arts Occupations
The most common Management, Business, Science and Arts occupations in Cross Plains are Management (26 | 6.2%), Community & Social Service (24 | 5.8%), Business & Financial (22 | 5.3%), Education Instruction & Library (20 | 4.8%), and Health Diagnosing & Treating (12 | 2.9%).
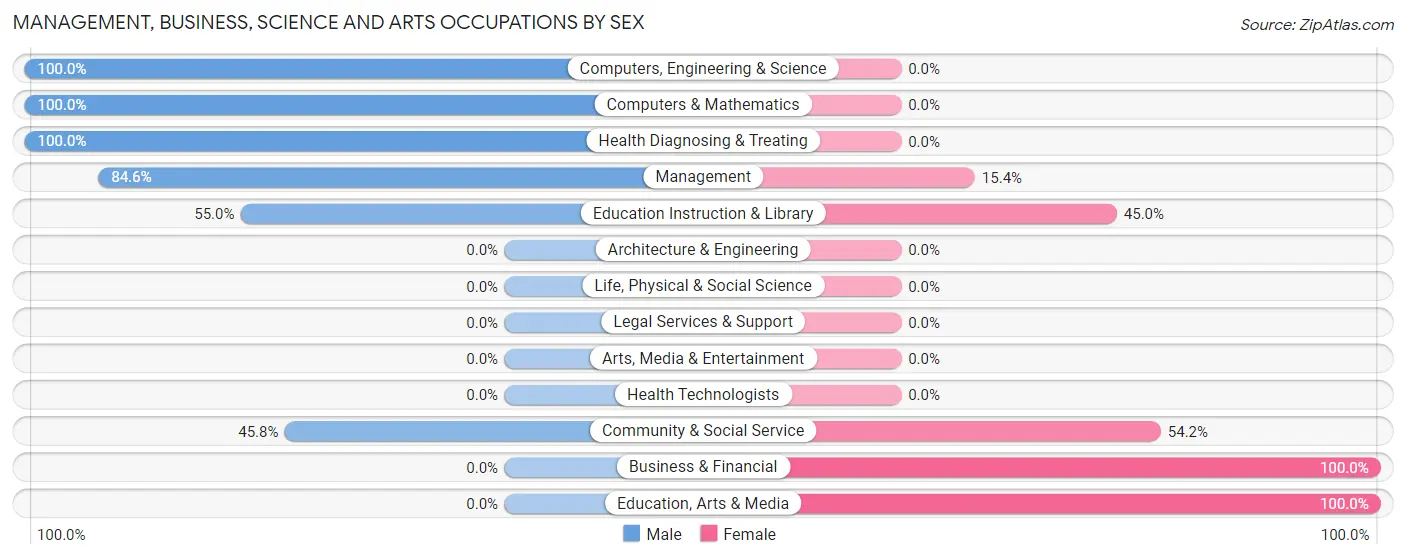
Management, Business, Science and Arts Occupations by Sex
Within the Management, Business, Science and Arts occupations in Cross Plains, the most male-oriented occupations are Computers, Engineering & Science (100.0%), Computers & Mathematics (100.0%), and Health Diagnosing & Treating (100.0%), while the most female-oriented occupations are Business & Financial (100.0%), Education, Arts & Media (100.0%), and Community & Social Service (54.2%).
| Occupation | Male | Female |
| Management | 22 (84.6%) | 4 (15.4%) |
| Business & Financial | 0 (0.0%) | 22 (100.0%) |
| Computers, Engineering & Science | 4 (100.0%) | 0 (0.0%) |
| Computers & Mathematics | 4 (100.0%) | 0 (0.0%) |
| Architecture & Engineering | 0 (0.0%) | 0 (0.0%) |
| Life, Physical & Social Science | 0 (0.0%) | 0 (0.0%) |
| Community & Social Service | 11 (45.8%) | 13 (54.2%) |
| Education, Arts & Media | 0 (0.0%) | 4 (100.0%) |
| Legal Services & Support | 0 (0.0%) | 0 (0.0%) |
| Education Instruction & Library | 11 (55.0%) | 9 (45.0%) |
| Arts, Media & Entertainment | 0 (0.0%) | 0 (0.0%) |
| Health Diagnosing & Treating | 12 (100.0%) | 0 (0.0%) |
| Health Technologists | 0 (0.0%) | 0 (0.0%) |
| Total (Category) | 49 (55.7%) | 39 (44.3%) |
| Total (Overall) | 250 (60.1%) | 166 (39.9%) |
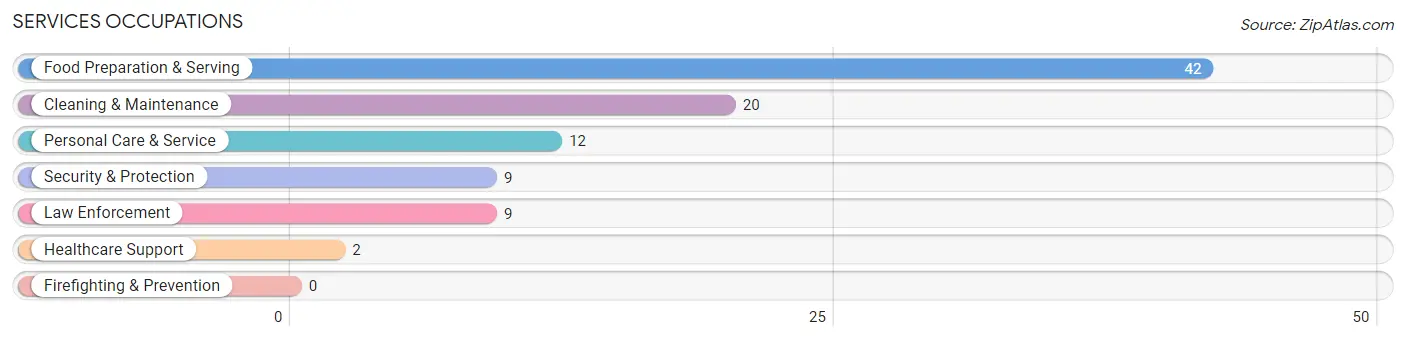
Services Occupations
The most common Services occupations in Cross Plains are Food Preparation & Serving (42 | 10.1%), Cleaning & Maintenance (20 | 4.8%), Personal Care & Service (12 | 2.9%), Security & Protection (9 | 2.2%), and Law Enforcement (9 | 2.2%).
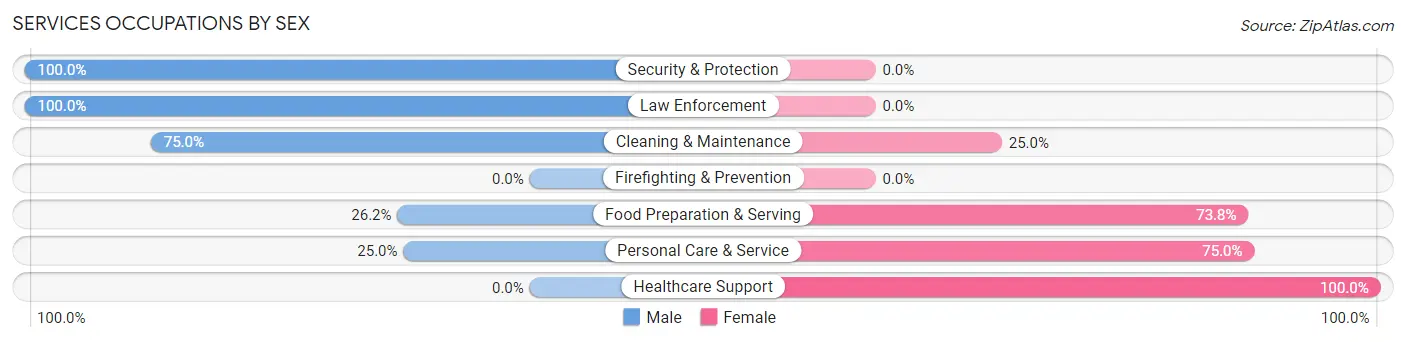
Services Occupations by Sex
Within the Services occupations in Cross Plains, the most male-oriented occupations are Security & Protection (100.0%), Law Enforcement (100.0%), and Cleaning & Maintenance (75.0%), while the most female-oriented occupations are Healthcare Support (100.0%), Personal Care & Service (75.0%), and Food Preparation & Serving (73.8%).
| Occupation | Male | Female |
| Healthcare Support | 0 (0.0%) | 2 (100.0%) |
| Security & Protection | 9 (100.0%) | 0 (0.0%) |
| Firefighting & Prevention | 0 (0.0%) | 0 (0.0%) |
| Law Enforcement | 9 (100.0%) | 0 (0.0%) |
| Food Preparation & Serving | 11 (26.2%) | 31 (73.8%) |
| Cleaning & Maintenance | 15 (75.0%) | 5 (25.0%) |
| Personal Care & Service | 3 (25.0%) | 9 (75.0%) |
| Total (Category) | 38 (44.7%) | 47 (55.3%) |
| Total (Overall) | 250 (60.1%) | 166 (39.9%) |
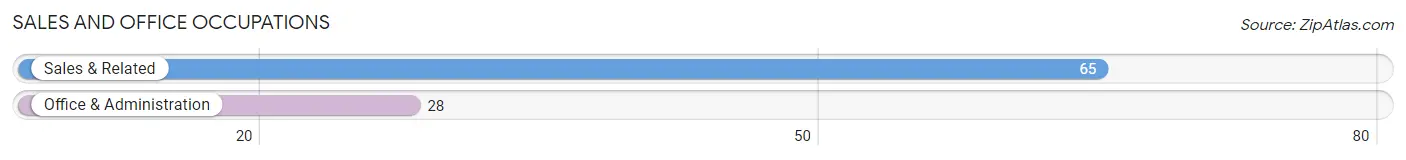
Sales and Office Occupations
The most common Sales and Office occupations in Cross Plains are Sales & Related (65 | 15.6%), and Office & Administration (28 | 6.7%).
Sales and Office Occupations by Sex
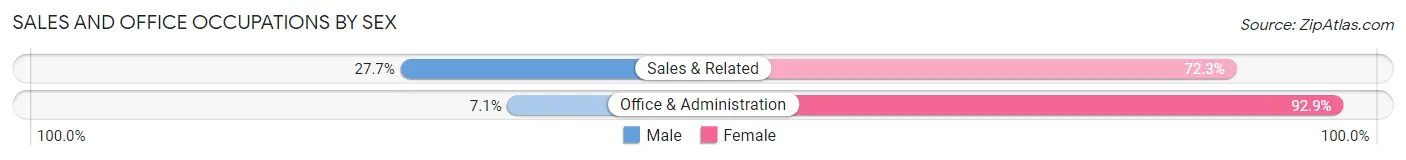
| Occupation | Male | Female |
| Sales & Related | 18 (27.7%) | 47 (72.3%) |
| Office & Administration | 2 (7.1%) | 26 (92.9%) |
| Total (Category) | 20 (21.5%) | 73 (78.5%) |
| Total (Overall) | 250 (60.1%) | 166 (39.9%) |
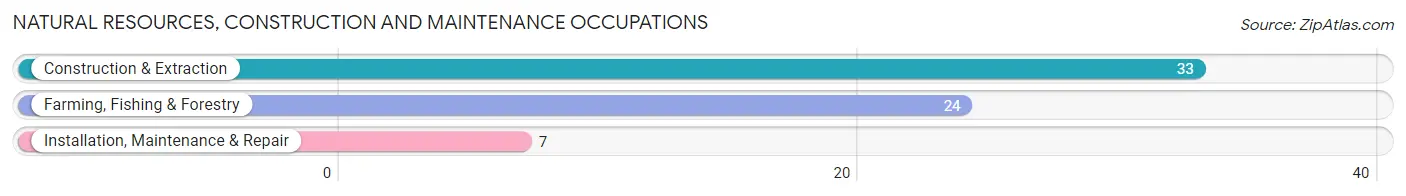
Natural Resources, Construction and Maintenance Occupations
The most common Natural Resources, Construction and Maintenance occupations in Cross Plains are Construction & Extraction (33 | 7.9%), Farming, Fishing & Forestry (24 | 5.8%), and Installation, Maintenance & Repair (7 | 1.7%).
Natural Resources, Construction and Maintenance Occupations by Sex
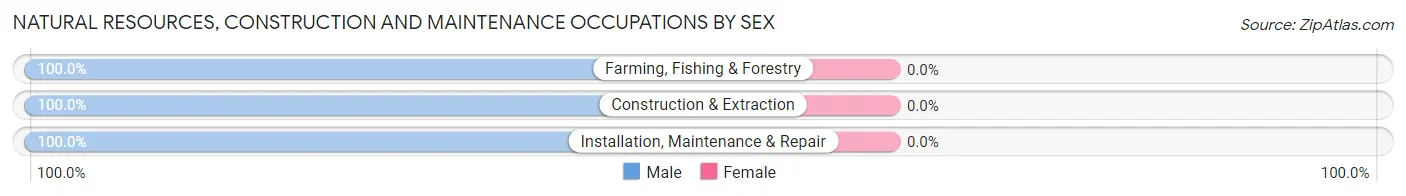
| Occupation | Male | Female |
| Farming, Fishing & Forestry | 24 (100.0%) | 0 (0.0%) |
| Construction & Extraction | 33 (100.0%) | 0 (0.0%) |
| Installation, Maintenance & Repair | 7 (100.0%) | 0 (0.0%) |
| Total (Category) | 64 (100.0%) | 0 (0.0%) |
| Total (Overall) | 250 (60.1%) | 166 (39.9%) |
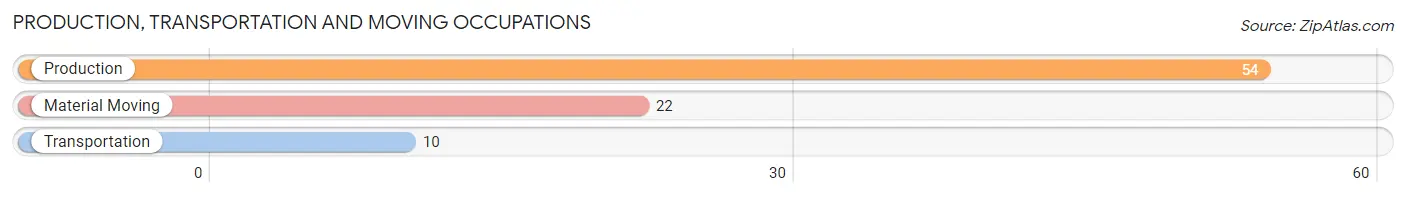
Production, Transportation and Moving Occupations
The most common Production, Transportation and Moving occupations in Cross Plains are Production (54 | 13.0%), Material Moving (22 | 5.3%), and Transportation (10 | 2.4%).
Production, Transportation and Moving Occupations by Sex
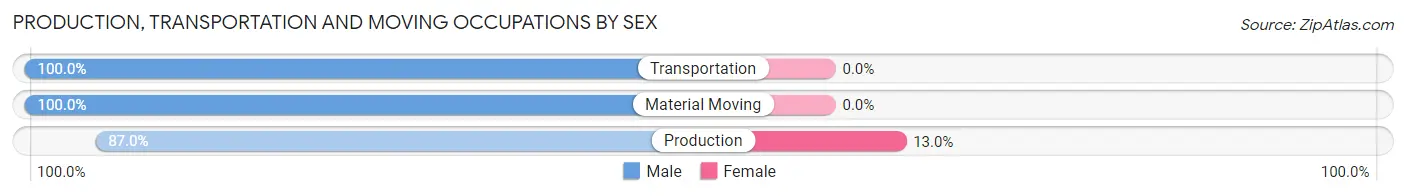
| Occupation | Male | Female |
| Production | 47 (87.0%) | 7 (13.0%) |
| Transportation | 10 (100.0%) | 0 (0.0%) |
| Material Moving | 22 (100.0%) | 0 (0.0%) |
| Total (Category) | 79 (91.9%) | 7 (8.1%) |
| Total (Overall) | 250 (60.1%) | 166 (39.9%) |
Employment Industries by Sex in Cross Plains
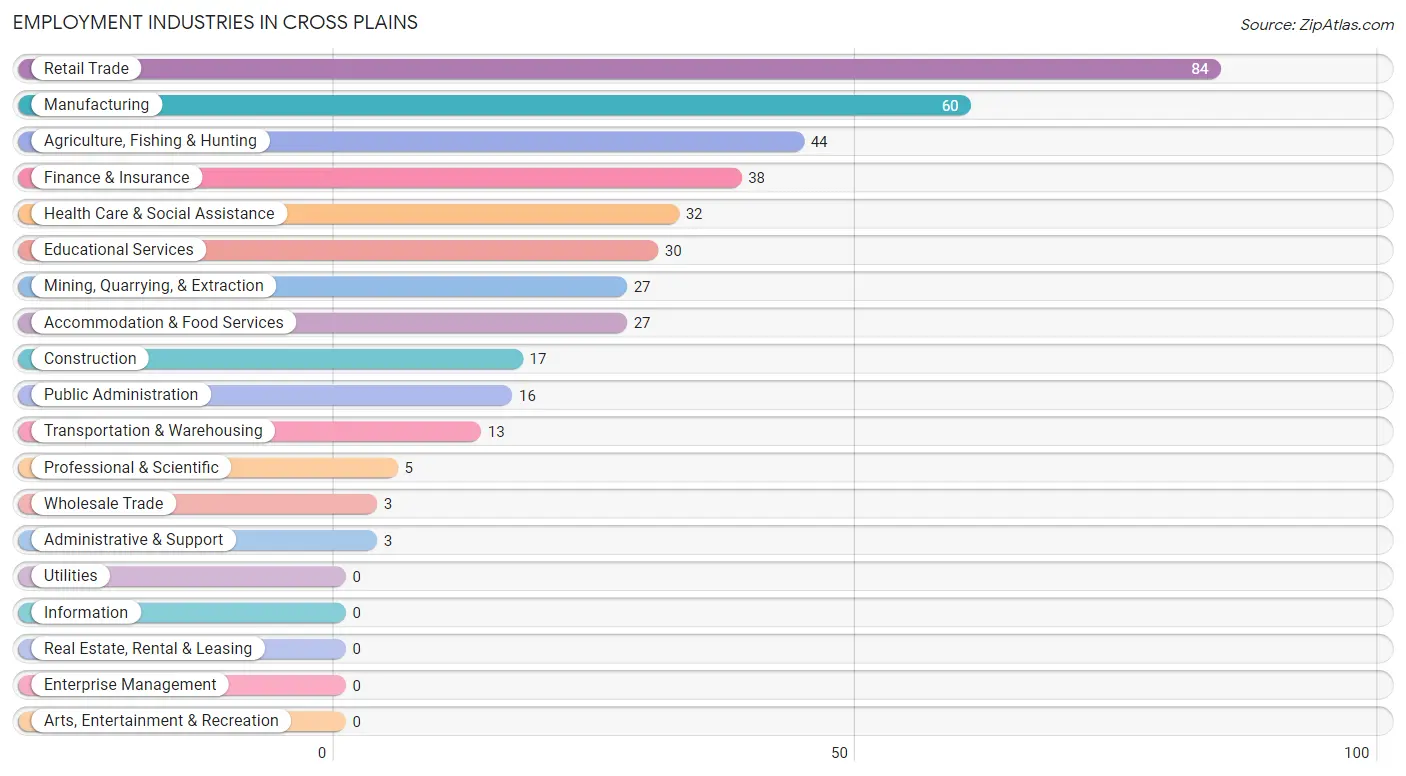
Employment Industries in Cross Plains
The major employment industries in Cross Plains include Retail Trade (84 | 20.2%), Manufacturing (60 | 14.4%), Agriculture, Fishing & Hunting (44 | 10.6%), Finance & Insurance (38 | 9.1%), and Health Care & Social Assistance (32 | 7.7%).
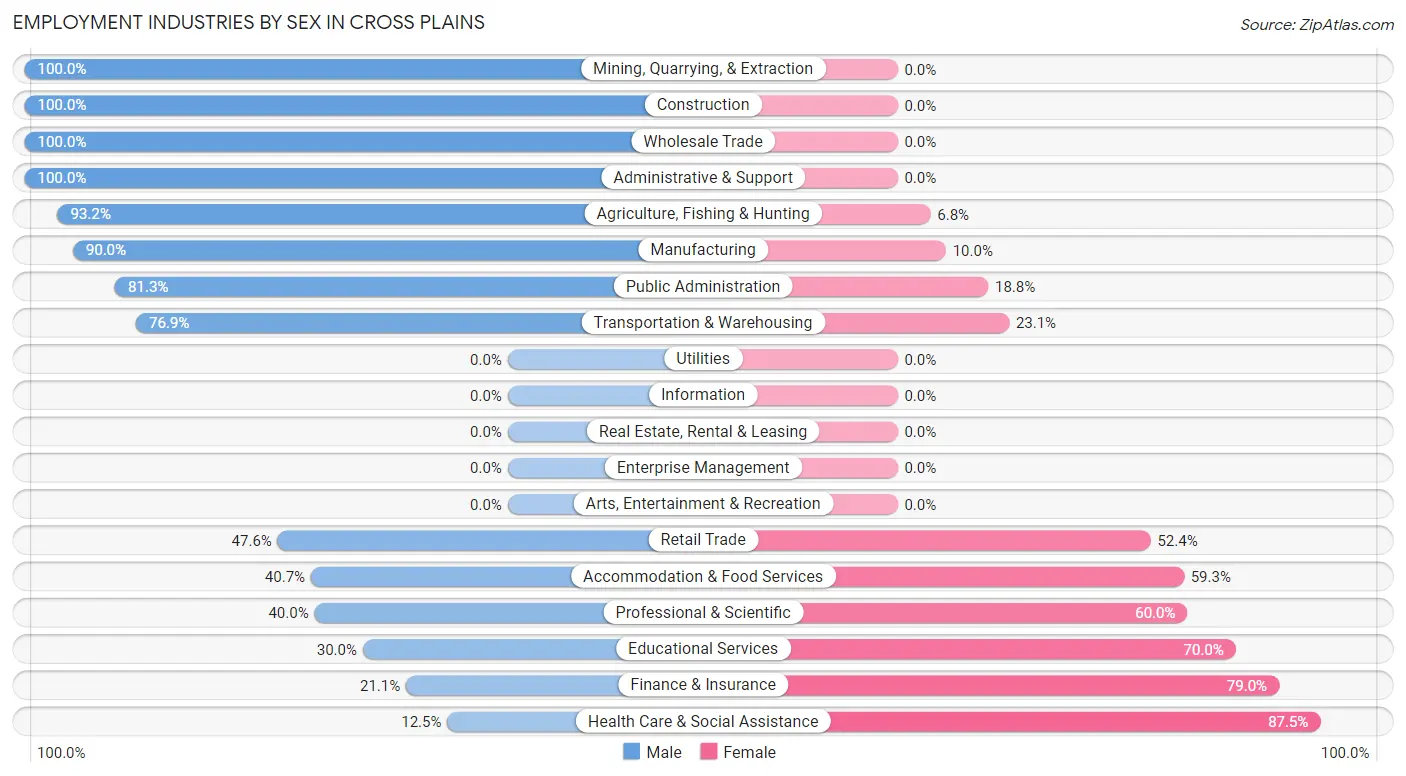
Employment Industries by Sex in Cross Plains
The Cross Plains industries that see more men than women are Mining, Quarrying, & Extraction (100.0%), Construction (100.0%), and Wholesale Trade (100.0%), whereas the industries that tend to have a higher number of women are Health Care & Social Assistance (87.5%), Finance & Insurance (78.9%), and Educational Services (70.0%).
| Industry | Male | Female |
| Agriculture, Fishing & Hunting | 41 (93.2%) | 3 (6.8%) |
| Mining, Quarrying, & Extraction | 27 (100.0%) | 0 (0.0%) |
| Construction | 17 (100.0%) | 0 (0.0%) |
| Manufacturing | 54 (90.0%) | 6 (10.0%) |
| Wholesale Trade | 3 (100.0%) | 0 (0.0%) |
| Retail Trade | 40 (47.6%) | 44 (52.4%) |
| Transportation & Warehousing | 10 (76.9%) | 3 (23.1%) |
| Utilities | 0 (0.0%) | 0 (0.0%) |
| Information | 0 (0.0%) | 0 (0.0%) |
| Finance & Insurance | 8 (21.0%) | 30 (78.9%) |
| Real Estate, Rental & Leasing | 0 (0.0%) | 0 (0.0%) |
| Professional & Scientific | 2 (40.0%) | 3 (60.0%) |
| Enterprise Management | 0 (0.0%) | 0 (0.0%) |
| Administrative & Support | 3 (100.0%) | 0 (0.0%) |
| Educational Services | 9 (30.0%) | 21 (70.0%) |
| Health Care & Social Assistance | 4 (12.5%) | 28 (87.5%) |
| Arts, Entertainment & Recreation | 0 (0.0%) | 0 (0.0%) |
| Accommodation & Food Services | 11 (40.7%) | 16 (59.3%) |
| Public Administration | 13 (81.2%) | 3 (18.8%) |
| Total | 250 (60.1%) | 166 (39.9%) |
Education in Cross Plains
School Enrollment in Cross Plains
The most common levels of schooling among the 307 students in Cross Plains are elementary school (91 | 29.6%), nursery / preschool (65 | 21.2%), and middle school (58 | 18.9%).
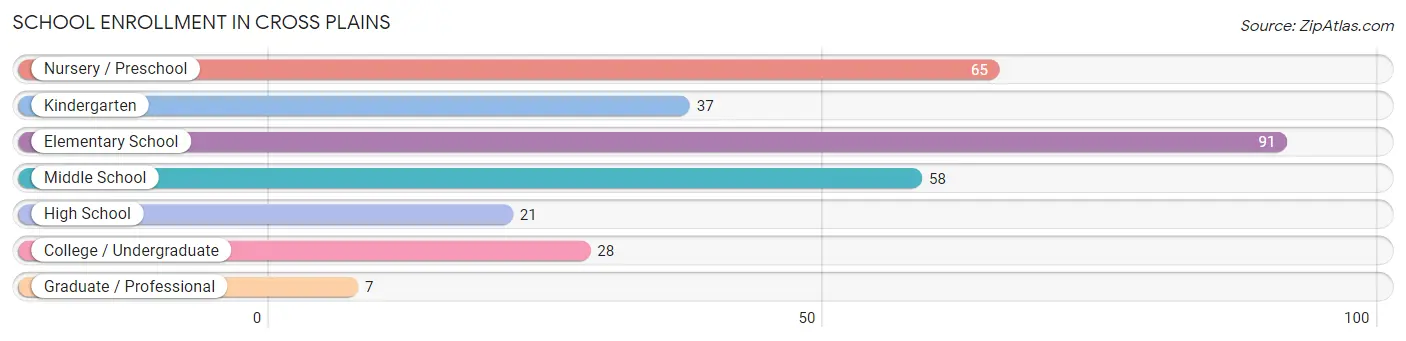
| School Level | # Students | % Students |
| Nursery / Preschool | 65 | 21.2% |
| Kindergarten | 37 | 12.0% |
| Elementary School | 91 | 29.6% |
| Middle School | 58 | 18.9% |
| High School | 21 | 6.8% |
| College / Undergraduate | 28 | 9.1% |
| Graduate / Professional | 7 | 2.3% |
| Total | 307 | 100.0% |
School Enrollment by Age by Funding Source in Cross Plains
Out of a total of 307 students who are enrolled in schools in Cross Plains, 26 (8.5%) attend a private institution, while the remaining 281 (91.5%) are enrolled in public schools. The age group of 25 to 34 year olds has the highest likelihood of being enrolled in private schools, with 26 (86.7% in the age bracket) enrolled. Conversely, the age group of 3 to 4 year olds has the lowest likelihood of being enrolled in a private school, with 57 (100.0% in the age bracket) attending a public institution.
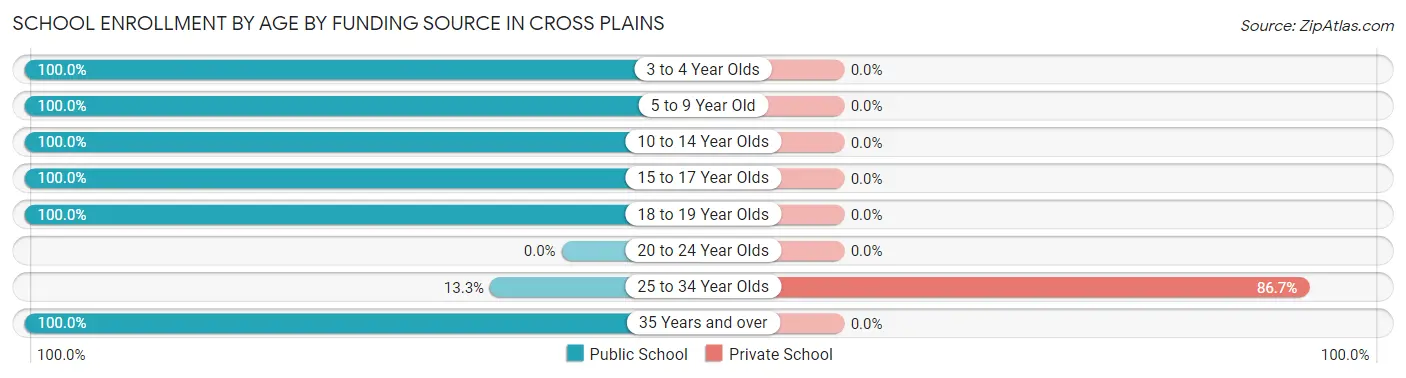
| Age Bracket | Public School | Private School |
| 3 to 4 Year Olds | 57 (100.0%) | 0 (0.0%) |
| 5 to 9 Year Old | 107 (100.0%) | 0 (0.0%) |
| 10 to 14 Year Olds | 87 (100.0%) | 0 (0.0%) |
| 15 to 17 Year Olds | 21 (100.0%) | 0 (0.0%) |
| 18 to 19 Year Olds | 2 (100.0%) | 0 (0.0%) |
| 20 to 24 Year Olds | 0 (0.0%) | 0 (0.0%) |
| 25 to 34 Year Olds | 4 (13.3%) | 26 (86.7%) |
| 35 Years and over | 3 (100.0%) | 0 (0.0%) |
| Total | 281 (91.5%) | 26 (8.5%) |
Educational Attainment by Field of Study in Cross Plains
Business (37 | 43.5%), arts & humanities (13 | 15.3%), social sciences (8 | 9.4%), education (8 | 9.4%), and literature & languages (7 | 8.2%) are the most common fields of study among 85 individuals in Cross Plains who have obtained a bachelor's degree or higher.
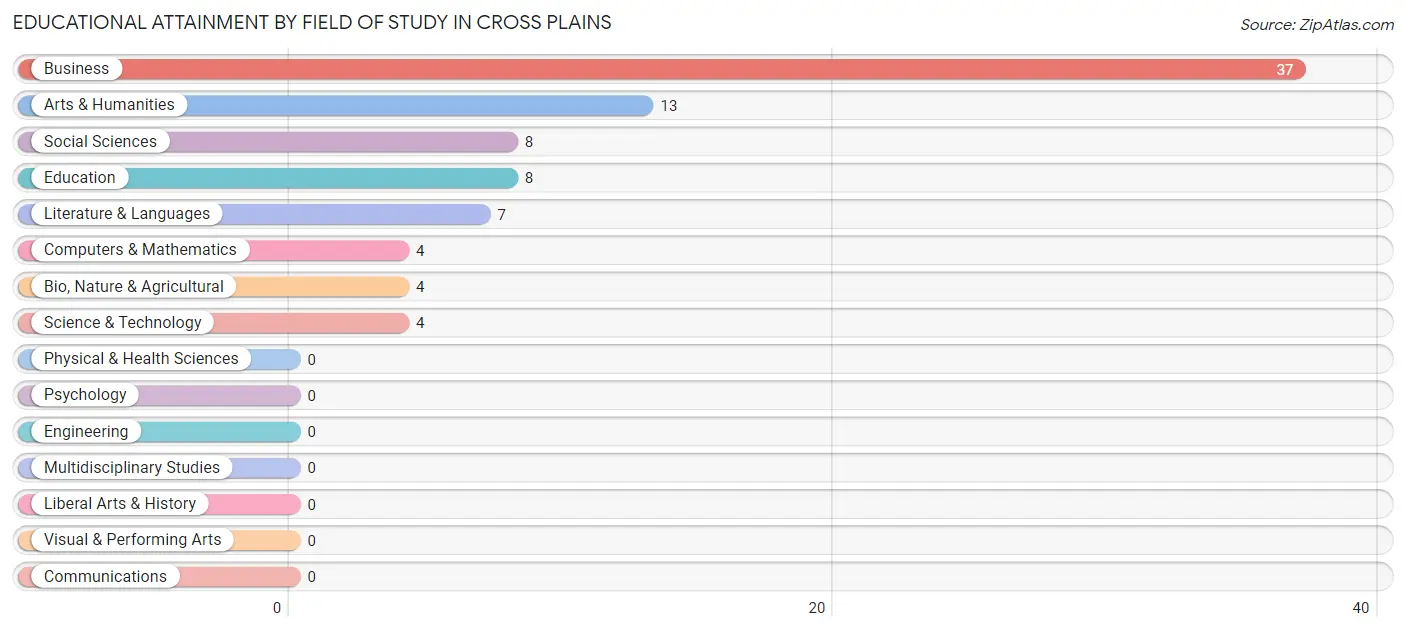
| Field of Study | # Graduates | % Graduates |
| Computers & Mathematics | 4 | 4.7% |
| Bio, Nature & Agricultural | 4 | 4.7% |
| Physical & Health Sciences | 0 | 0.0% |
| Psychology | 0 | 0.0% |
| Social Sciences | 8 | 9.4% |
| Engineering | 0 | 0.0% |
| Multidisciplinary Studies | 0 | 0.0% |
| Science & Technology | 4 | 4.7% |
| Business | 37 | 43.5% |
| Education | 8 | 9.4% |
| Literature & Languages | 7 | 8.2% |
| Liberal Arts & History | 0 | 0.0% |
| Visual & Performing Arts | 0 | 0.0% |
| Communications | 0 | 0.0% |
| Arts & Humanities | 13 | 15.3% |
| Total | 85 | 100.0% |
Transportation & Commute in Cross Plains
Vehicle Availability by Sex in Cross Plains
The most prevalent vehicle ownership categories in Cross Plains are males with 1 vehicle (65, accounting for 28.0%) and females with 1 vehicle (91, making up 39.2%).
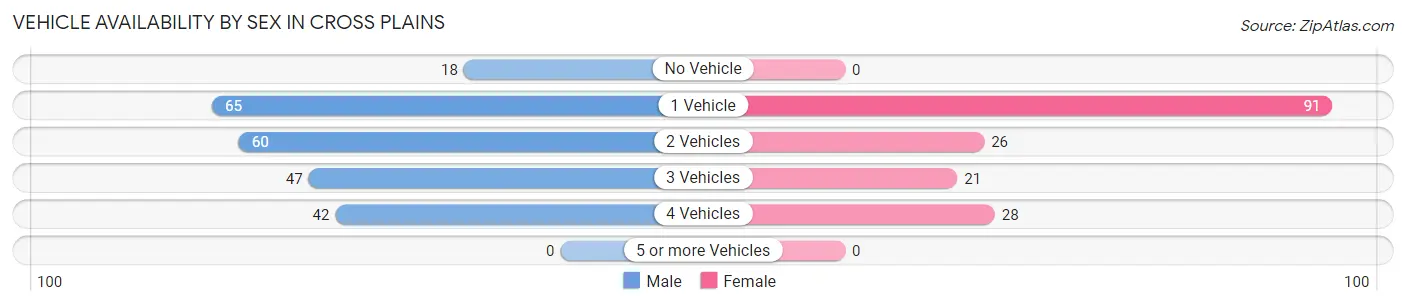
| Vehicles Available | Male | Female |
| No Vehicle | 18 (7.8%) | 0 (0.0%) |
| 1 Vehicle | 65 (28.0%) | 91 (54.8%) |
| 2 Vehicles | 60 (25.9%) | 26 (15.7%) |
| 3 Vehicles | 47 (20.3%) | 21 (12.7%) |
| 4 Vehicles | 42 (18.1%) | 28 (16.9%) |
| 5 or more Vehicles | 0 (0.0%) | 0 (0.0%) |
| Total | 232 (100.0%) | 166 (100.0%) |
Commute Time in Cross Plains
The most frequently occuring commute durations in Cross Plains are 45 to 59 minutes (84 commuters, 21.6%), 5 to 9 minutes (78 commuters, 20.1%), and less than 5 minutes (53 commuters, 13.6%).
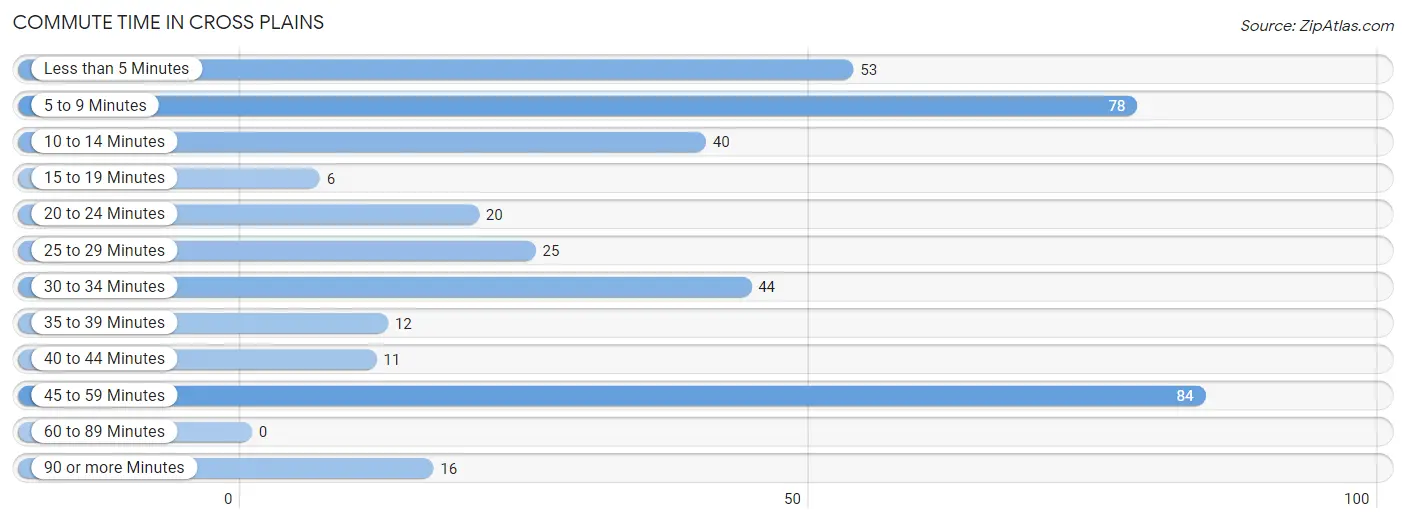
| Commute Time | # Commuters | % Commuters |
| Less than 5 Minutes | 53 | 13.6% |
| 5 to 9 Minutes | 78 | 20.1% |
| 10 to 14 Minutes | 40 | 10.3% |
| 15 to 19 Minutes | 6 | 1.5% |
| 20 to 24 Minutes | 20 | 5.1% |
| 25 to 29 Minutes | 25 | 6.4% |
| 30 to 34 Minutes | 44 | 11.3% |
| 35 to 39 Minutes | 12 | 3.1% |
| 40 to 44 Minutes | 11 | 2.8% |
| 45 to 59 Minutes | 84 | 21.6% |
| 60 to 89 Minutes | 0 | 0.0% |
| 90 or more Minutes | 16 | 4.1% |
Commute Time by Sex in Cross Plains
The most common commute times in Cross Plains are 45 to 59 minutes (50 commuters, 21.5%) for males and 5 to 9 minutes (62 commuters, 39.5%) for females.
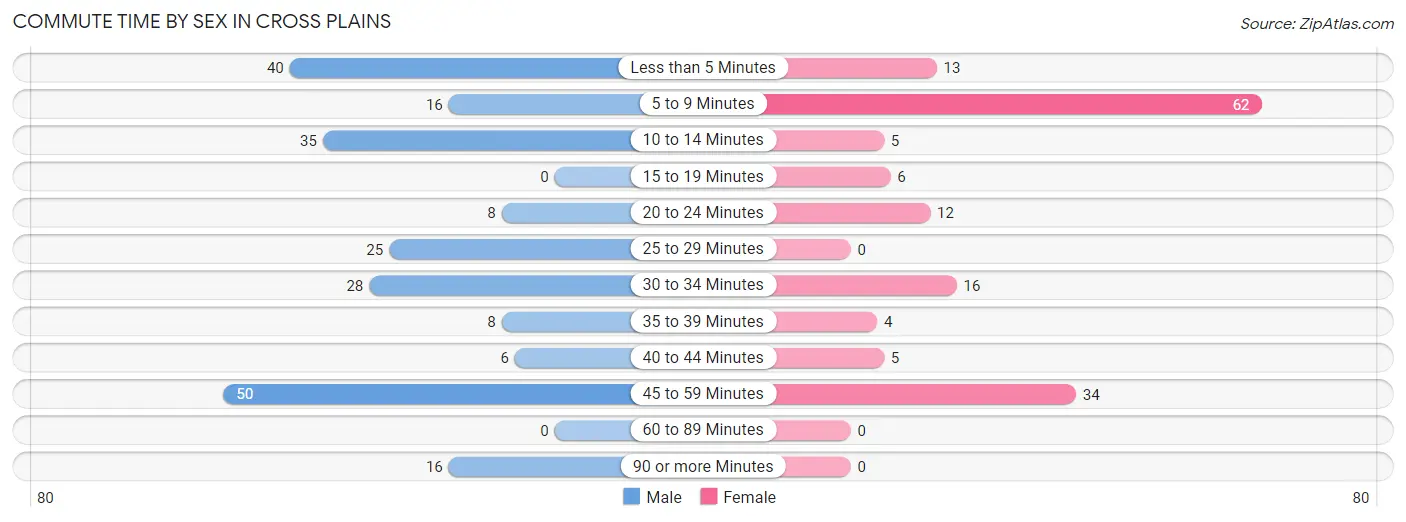
| Commute Time | Male | Female |
| Less than 5 Minutes | 40 (17.2%) | 13 (8.3%) |
| 5 to 9 Minutes | 16 (6.9%) | 62 (39.5%) |
| 10 to 14 Minutes | 35 (15.1%) | 5 (3.2%) |
| 15 to 19 Minutes | 0 (0.0%) | 6 (3.8%) |
| 20 to 24 Minutes | 8 (3.5%) | 12 (7.6%) |
| 25 to 29 Minutes | 25 (10.8%) | 0 (0.0%) |
| 30 to 34 Minutes | 28 (12.1%) | 16 (10.2%) |
| 35 to 39 Minutes | 8 (3.5%) | 4 (2.5%) |
| 40 to 44 Minutes | 6 (2.6%) | 5 (3.2%) |
| 45 to 59 Minutes | 50 (21.5%) | 34 (21.7%) |
| 60 to 89 Minutes | 0 (0.0%) | 0 (0.0%) |
| 90 or more Minutes | 16 (6.9%) | 0 (0.0%) |
Time of Departure to Work by Sex in Cross Plains
The most frequent times of departure to work in Cross Plains are 7:30 AM to 7:59 AM (45, 19.4%) for males and 7:00 AM to 7:29 AM (42, 26.8%) for females.
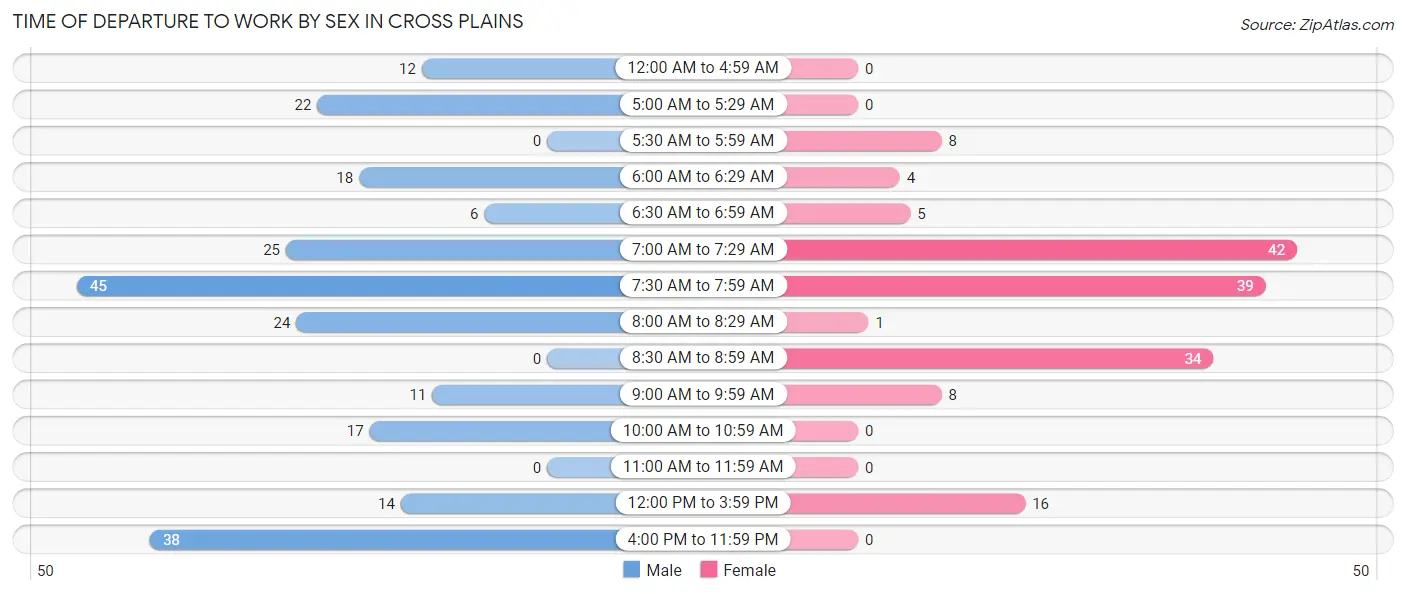
| Time of Departure | Male | Female |
| 12:00 AM to 4:59 AM | 12 (5.2%) | 0 (0.0%) |
| 5:00 AM to 5:29 AM | 22 (9.5%) | 0 (0.0%) |
| 5:30 AM to 5:59 AM | 0 (0.0%) | 8 (5.1%) |
| 6:00 AM to 6:29 AM | 18 (7.8%) | 4 (2.5%) |
| 6:30 AM to 6:59 AM | 6 (2.6%) | 5 (3.2%) |
| 7:00 AM to 7:29 AM | 25 (10.8%) | 42 (26.8%) |
| 7:30 AM to 7:59 AM | 45 (19.4%) | 39 (24.8%) |
| 8:00 AM to 8:29 AM | 24 (10.3%) | 1 (0.6%) |
| 8:30 AM to 8:59 AM | 0 (0.0%) | 34 (21.7%) |
| 9:00 AM to 9:59 AM | 11 (4.7%) | 8 (5.1%) |
| 10:00 AM to 10:59 AM | 17 (7.3%) | 0 (0.0%) |
| 11:00 AM to 11:59 AM | 0 (0.0%) | 0 (0.0%) |
| 12:00 PM to 3:59 PM | 14 (6.0%) | 16 (10.2%) |
| 4:00 PM to 11:59 PM | 38 (16.4%) | 0 (0.0%) |
| Total | 232 (100.0%) | 157 (100.0%) |
Housing Occupancy in Cross Plains
Occupancy by Ownership in Cross Plains
Of the total 424 dwellings in Cross Plains, owner-occupied units account for 250 (59.0%), while renter-occupied units make up 174 (41.0%).
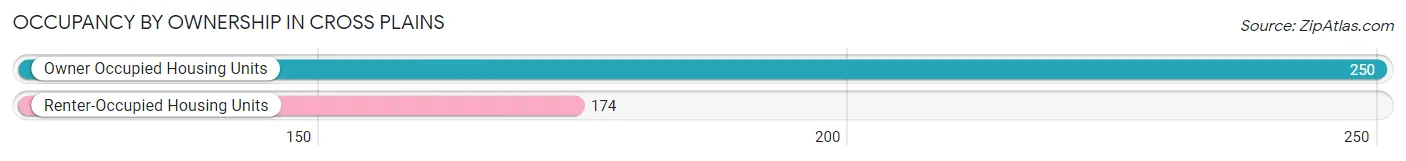
| Occupancy | # Housing Units | % Housing Units |
| Owner Occupied Housing Units | 250 | 59.0% |
| Renter-Occupied Housing Units | 174 | 41.0% |
| Total Occupied Housing Units | 424 | 100.0% |
Occupancy by Household Size in Cross Plains
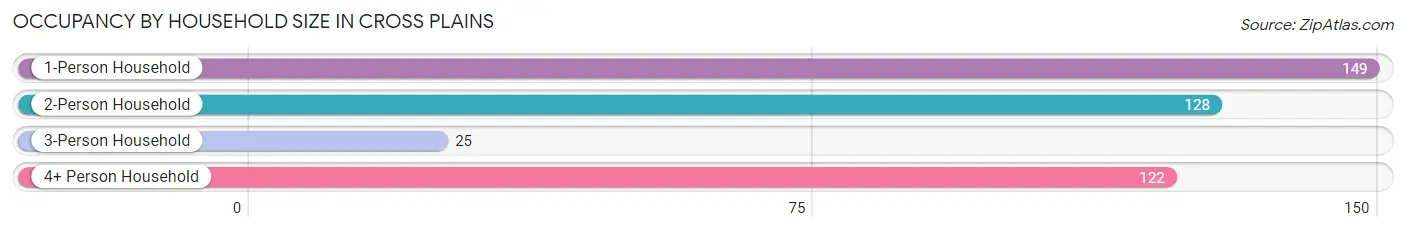
| Household Size | # Housing Units | % Housing Units |
| 1-Person Household | 149 | 35.1% |
| 2-Person Household | 128 | 30.2% |
| 3-Person Household | 25 | 5.9% |
| 4+ Person Household | 122 | 28.8% |
| Total Housing Units | 424 | 100.0% |
Occupancy by Ownership by Household Size in Cross Plains
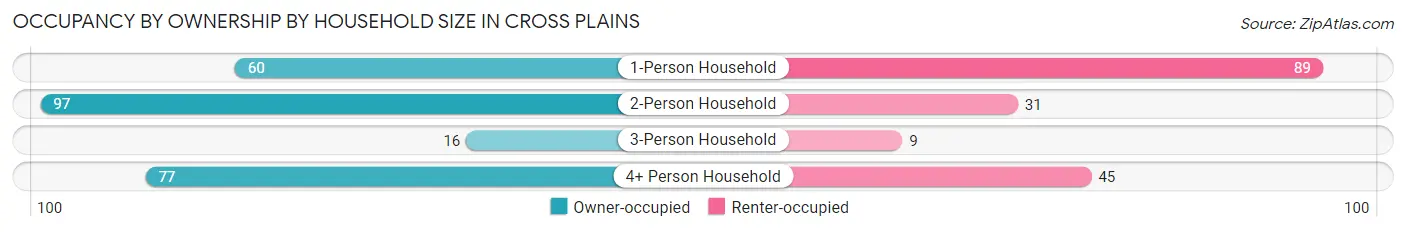
| Household Size | Owner-occupied | Renter-occupied |
| 1-Person Household | 60 (40.3%) | 89 (59.7%) |
| 2-Person Household | 97 (75.8%) | 31 (24.2%) |
| 3-Person Household | 16 (64.0%) | 9 (36.0%) |
| 4+ Person Household | 77 (63.1%) | 45 (36.9%) |
| Total Housing Units | 250 (59.0%) | 174 (41.0%) |
Occupancy by Educational Attainment in Cross Plains
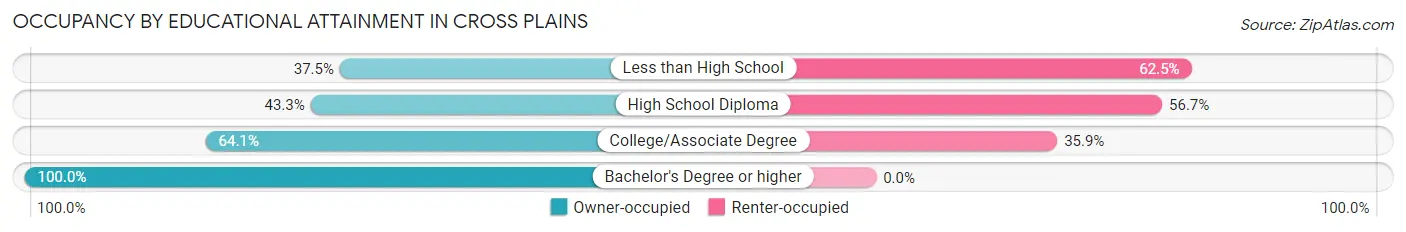
| Household Size | Owner-occupied | Renter-occupied |
| Less than High School | 6 (37.5%) | 10 (62.5%) |
| High School Diploma | 68 (43.3%) | 89 (56.7%) |
| College/Associate Degree | 134 (64.1%) | 75 (35.9%) |
| Bachelor's Degree or higher | 42 (100.0%) | 0 (0.0%) |
Occupancy by Age of Householder in Cross Plains
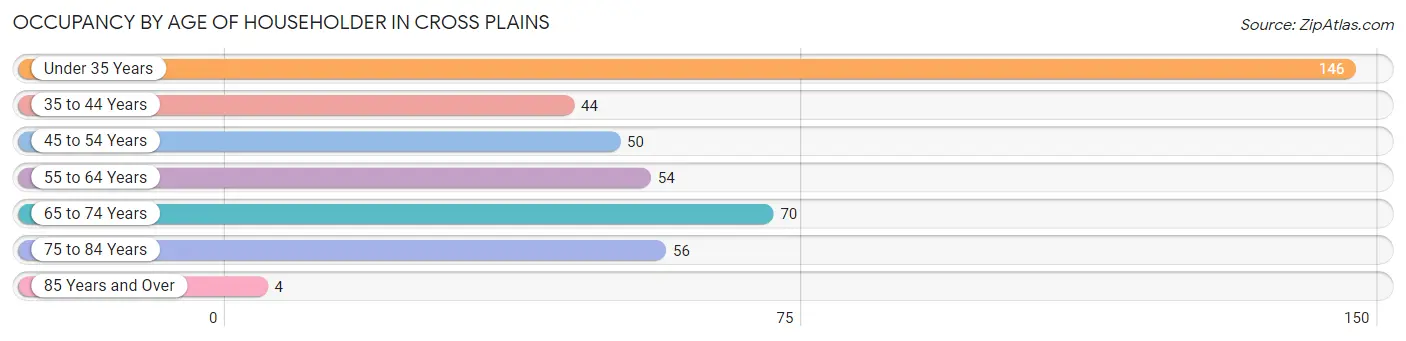
| Age Bracket | # Households | % Households |
| Under 35 Years | 146 | 34.4% |
| 35 to 44 Years | 44 | 10.4% |
| 45 to 54 Years | 50 | 11.8% |
| 55 to 64 Years | 54 | 12.7% |
| 65 to 74 Years | 70 | 16.5% |
| 75 to 84 Years | 56 | 13.2% |
| 85 Years and Over | 4 | 0.9% |
| Total | 424 | 100.0% |
Housing Finances in Cross Plains
Median Income by Occupancy in Cross Plains
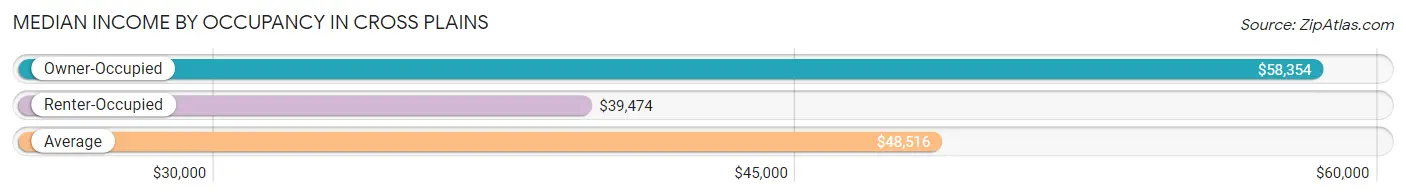
| Occupancy Type | # Households | Median Income |
| Owner-Occupied | 250 (59.0%) | $58,354 |
| Renter-Occupied | 174 (41.0%) | $39,474 |
| Average | 424 (100.0%) | $48,516 |
Occupancy by Householder Income Bracket in Cross Plains
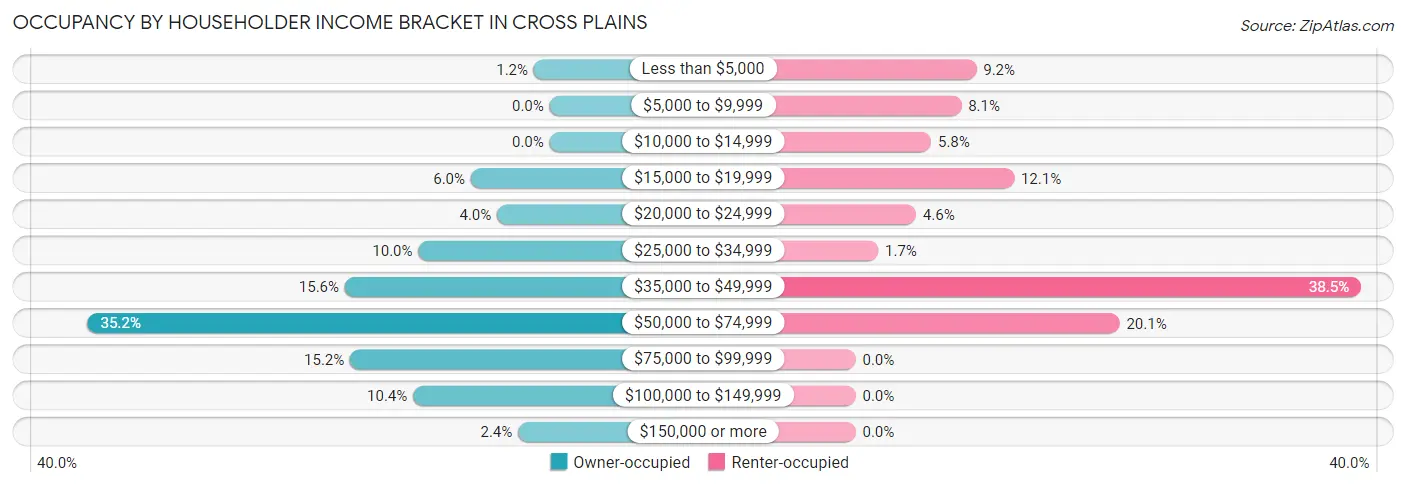
| Income Bracket | Owner-occupied | Renter-occupied |
| Less than $5,000 | 3 (1.2%) | 16 (9.2%) |
| $5,000 to $9,999 | 0 (0.0%) | 14 (8.1%) |
| $10,000 to $14,999 | 0 (0.0%) | 10 (5.8%) |
| $15,000 to $19,999 | 15 (6.0%) | 21 (12.1%) |
| $20,000 to $24,999 | 10 (4.0%) | 8 (4.6%) |
| $25,000 to $34,999 | 25 (10.0%) | 3 (1.7%) |
| $35,000 to $49,999 | 39 (15.6%) | 67 (38.5%) |
| $50,000 to $74,999 | 88 (35.2%) | 35 (20.1%) |
| $75,000 to $99,999 | 38 (15.2%) | 0 (0.0%) |
| $100,000 to $149,999 | 26 (10.4%) | 0 (0.0%) |
| $150,000 or more | 6 (2.4%) | 0 (0.0%) |
| Total | 250 (100.0%) | 174 (100.0%) |
Monthly Housing Cost Tiers in Cross Plains
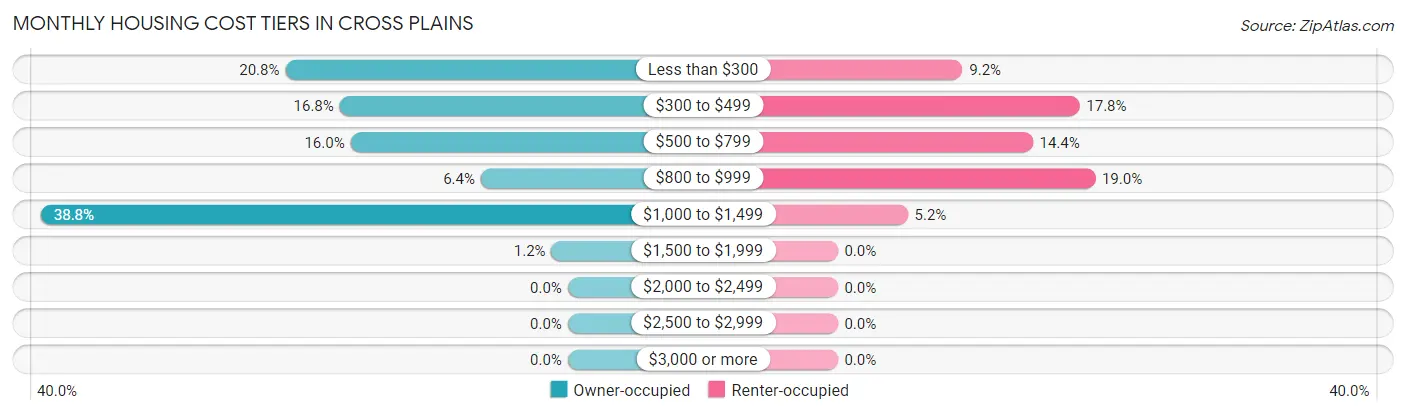
| Monthly Cost | Owner-occupied | Renter-occupied |
| Less than $300 | 52 (20.8%) | 16 (9.2%) |
| $300 to $499 | 42 (16.8%) | 31 (17.8%) |
| $500 to $799 | 40 (16.0%) | 25 (14.4%) |
| $800 to $999 | 16 (6.4%) | 33 (19.0%) |
| $1,000 to $1,499 | 97 (38.8%) | 9 (5.2%) |
| $1,500 to $1,999 | 3 (1.2%) | 0 (0.0%) |
| $2,000 to $2,499 | 0 (0.0%) | 0 (0.0%) |
| $2,500 to $2,999 | 0 (0.0%) | 0 (0.0%) |
| $3,000 or more | 0 (0.0%) | 0 (0.0%) |
| Total | 250 (100.0%) | 174 (100.0%) |
Physical Housing Characteristics in Cross Plains
Housing Structures in Cross Plains
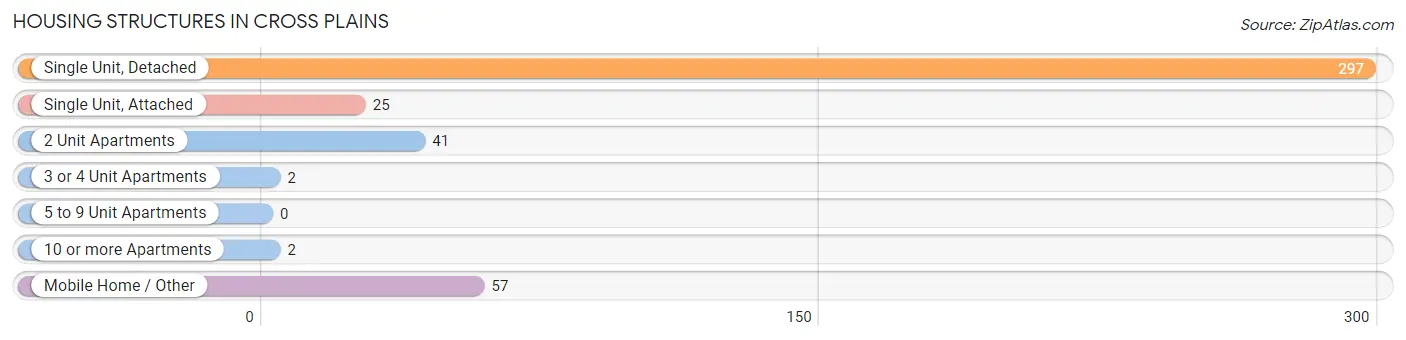
| Structure Type | # Housing Units | % Housing Units |
| Single Unit, Detached | 297 | 70.1% |
| Single Unit, Attached | 25 | 5.9% |
| 2 Unit Apartments | 41 | 9.7% |
| 3 or 4 Unit Apartments | 2 | 0.5% |
| 5 to 9 Unit Apartments | 0 | 0.0% |
| 10 or more Apartments | 2 | 0.5% |
| Mobile Home / Other | 57 | 13.4% |
| Total | 424 | 100.0% |
Housing Structures by Occupancy in Cross Plains
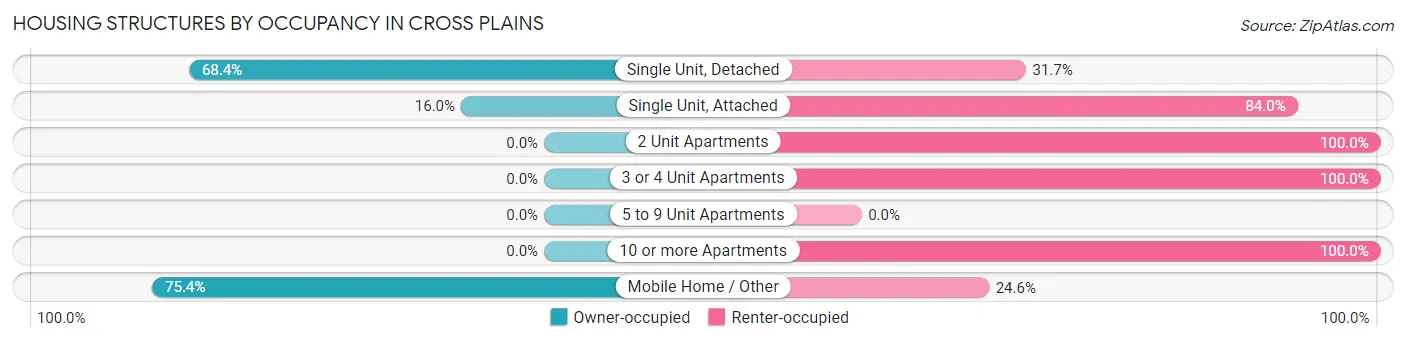
| Structure Type | Owner-occupied | Renter-occupied |
| Single Unit, Detached | 203 (68.3%) | 94 (31.7%) |
| Single Unit, Attached | 4 (16.0%) | 21 (84.0%) |
| 2 Unit Apartments | 0 (0.0%) | 41 (100.0%) |
| 3 or 4 Unit Apartments | 0 (0.0%) | 2 (100.0%) |
| 5 to 9 Unit Apartments | 0 (0.0%) | 0 (0.0%) |
| 10 or more Apartments | 0 (0.0%) | 2 (100.0%) |
| Mobile Home / Other | 43 (75.4%) | 14 (24.6%) |
| Total | 250 (59.0%) | 174 (41.0%) |
Housing Structures by Number of Rooms in Cross Plains
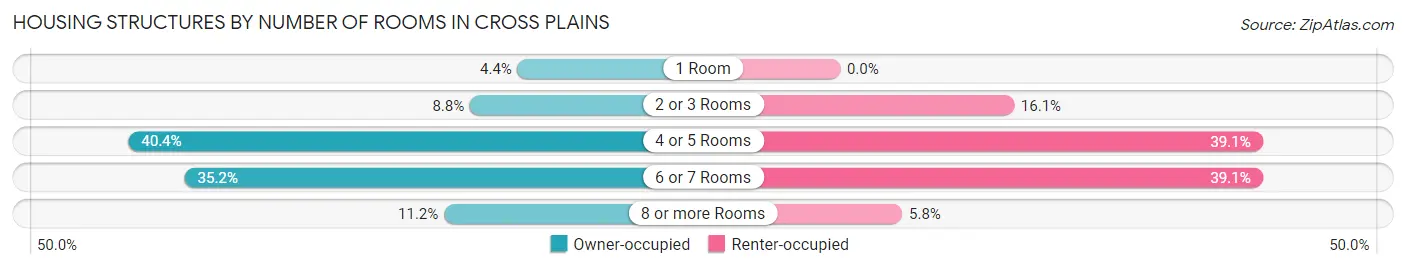
| Number of Rooms | Owner-occupied | Renter-occupied |
| 1 Room | 11 (4.4%) | 0 (0.0%) |
| 2 or 3 Rooms | 22 (8.8%) | 28 (16.1%) |
| 4 or 5 Rooms | 101 (40.4%) | 68 (39.1%) |
| 6 or 7 Rooms | 88 (35.2%) | 68 (39.1%) |
| 8 or more Rooms | 28 (11.2%) | 10 (5.8%) |
| Total | 250 (100.0%) | 174 (100.0%) |
Housing Structure by Heating Type in Cross Plains
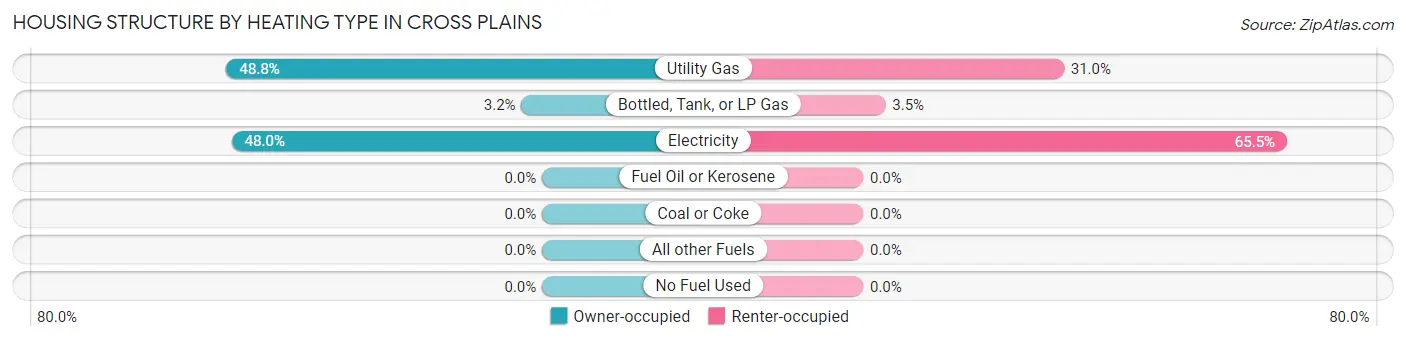
| Heating Type | Owner-occupied | Renter-occupied |
| Utility Gas | 122 (48.8%) | 54 (31.0%) |
| Bottled, Tank, or LP Gas | 8 (3.2%) | 6 (3.5%) |
| Electricity | 120 (48.0%) | 114 (65.5%) |
| Fuel Oil or Kerosene | 0 (0.0%) | 0 (0.0%) |
| Coal or Coke | 0 (0.0%) | 0 (0.0%) |
| All other Fuels | 0 (0.0%) | 0 (0.0%) |
| No Fuel Used | 0 (0.0%) | 0 (0.0%) |
| Total | 250 (100.0%) | 174 (100.0%) |
Household Vehicle Usage in Cross Plains
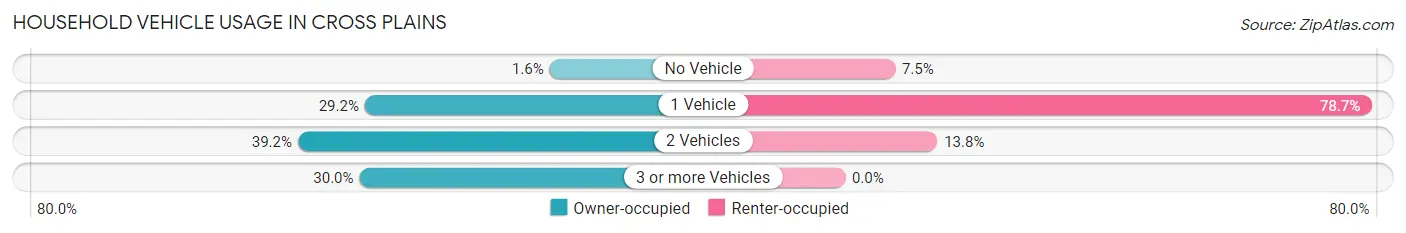
| Vehicles per Household | Owner-occupied | Renter-occupied |
| No Vehicle | 4 (1.6%) | 13 (7.5%) |
| 1 Vehicle | 73 (29.2%) | 137 (78.7%) |
| 2 Vehicles | 98 (39.2%) | 24 (13.8%) |
| 3 or more Vehicles | 75 (30.0%) | 0 (0.0%) |
| Total | 250 (100.0%) | 174 (100.0%) |
Real Estate & Mortgages in Cross Plains
Real Estate and Mortgage Overview in Cross Plains
| Characteristic | Without Mortgage | With Mortgage |
| Housing Units | 147 | 103 |
| Median Property Value | $65,000 | $109,700 |
| Median Household Income | $58,105 | $4 |
| Monthly Housing Costs | $349 | $0 |
| Real Estate Taxes | $800 | $0 |
Property Value by Mortgage Status in Cross Plains
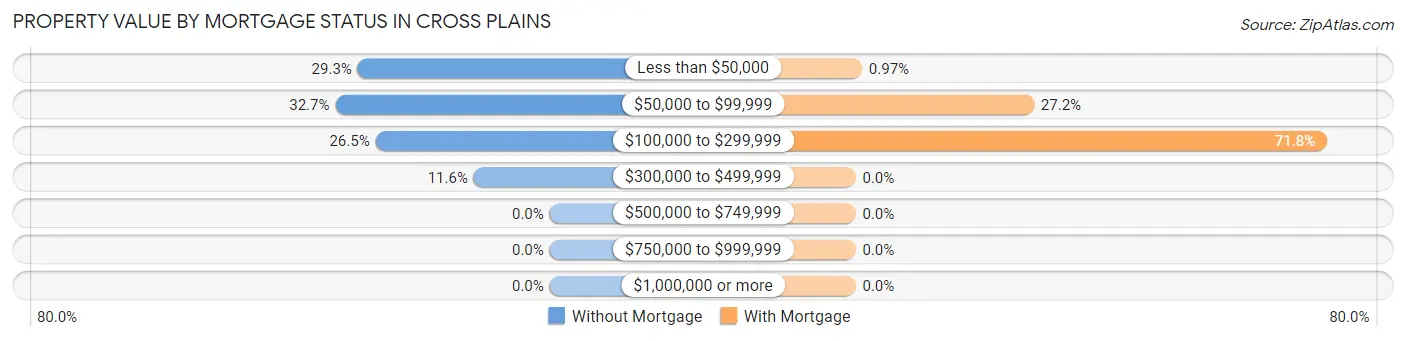
| Property Value | Without Mortgage | With Mortgage |
| Less than $50,000 | 43 (29.2%) | 1 (1.0%) |
| $50,000 to $99,999 | 48 (32.7%) | 28 (27.2%) |
| $100,000 to $299,999 | 39 (26.5%) | 74 (71.8%) |
| $300,000 to $499,999 | 17 (11.6%) | 0 (0.0%) |
| $500,000 to $749,999 | 0 (0.0%) | 0 (0.0%) |
| $750,000 to $999,999 | 0 (0.0%) | 0 (0.0%) |
| $1,000,000 or more | 0 (0.0%) | 0 (0.0%) |
| Total | 147 (100.0%) | 103 (100.0%) |
Household Income by Mortgage Status in Cross Plains
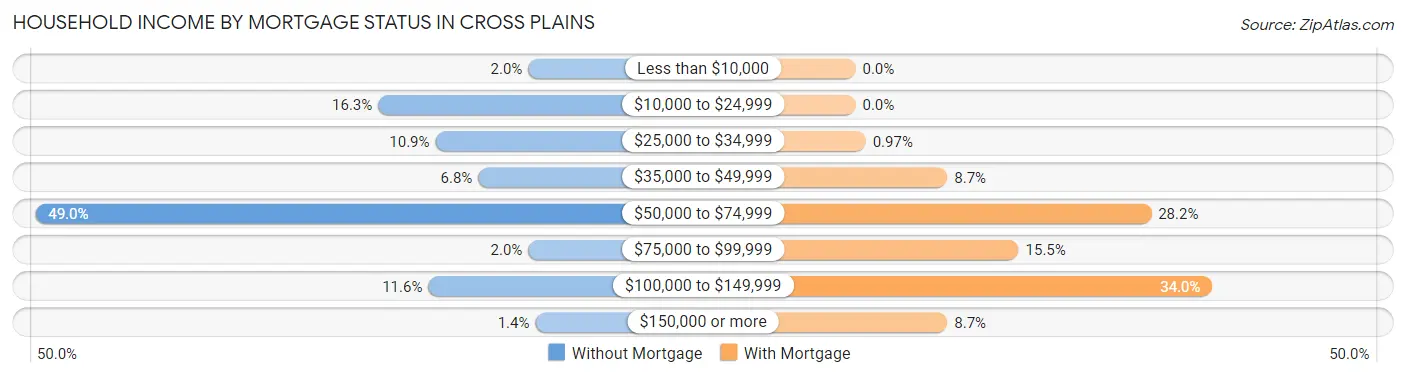
| Household Income | Without Mortgage | With Mortgage |
| Less than $10,000 | 3 (2.0%) | 0 (0.0%) |
| $10,000 to $24,999 | 24 (16.3%) | 0 (0.0%) |
| $25,000 to $34,999 | 16 (10.9%) | 1 (1.0%) |
| $35,000 to $49,999 | 10 (6.8%) | 9 (8.7%) |
| $50,000 to $74,999 | 72 (49.0%) | 29 (28.2%) |
| $75,000 to $99,999 | 3 (2.0%) | 16 (15.5%) |
| $100,000 to $149,999 | 17 (11.6%) | 35 (34.0%) |
| $150,000 or more | 2 (1.4%) | 9 (8.7%) |
| Total | 147 (100.0%) | 103 (100.0%) |
Property Value to Household Income Ratio in Cross Plains
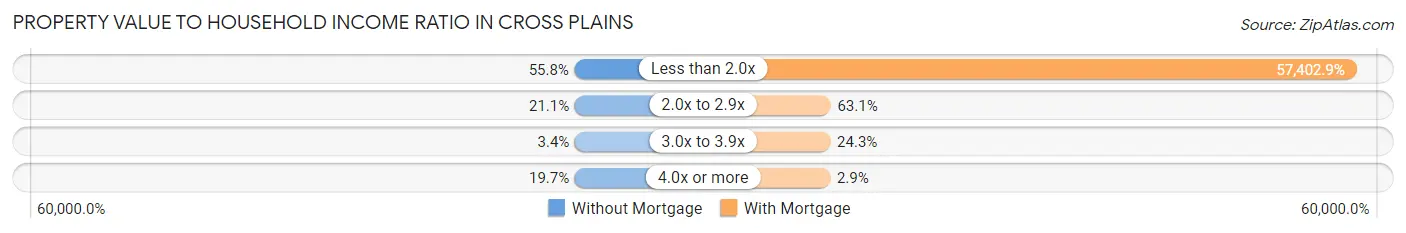
| Value-to-Income Ratio | Without Mortgage | With Mortgage |
| Less than 2.0x | 82 (55.8%) | 59,125 (57,402.9%) |
| 2.0x to 2.9x | 31 (21.1%) | 65 (63.1%) |
| 3.0x to 3.9x | 5 (3.4%) | 25 (24.3%) |
| 4.0x or more | 29 (19.7%) | 3 (2.9%) |
| Total | 147 (100.0%) | 103 (100.0%) |
Real Estate Taxes by Mortgage Status in Cross Plains
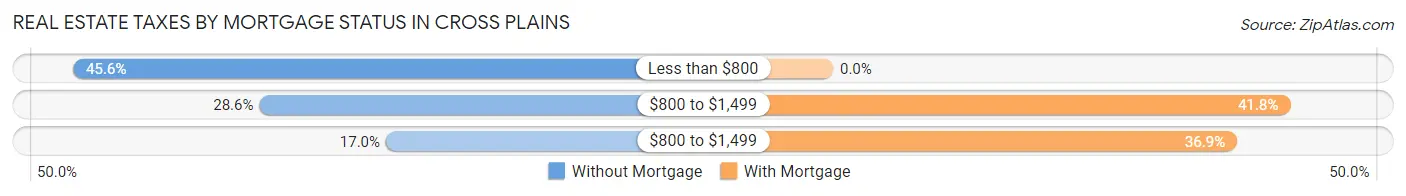
| Property Taxes | Without Mortgage | With Mortgage |
| Less than $800 | 67 (45.6%) | 0 (0.0%) |
| $800 to $1,499 | 42 (28.6%) | 43 (41.7%) |
| $800 to $1,499 | 25 (17.0%) | 38 (36.9%) |
| Total | 147 (100.0%) | 103 (100.0%) |
Health & Disability in Cross Plains
Health Insurance Coverage by Age in Cross Plains
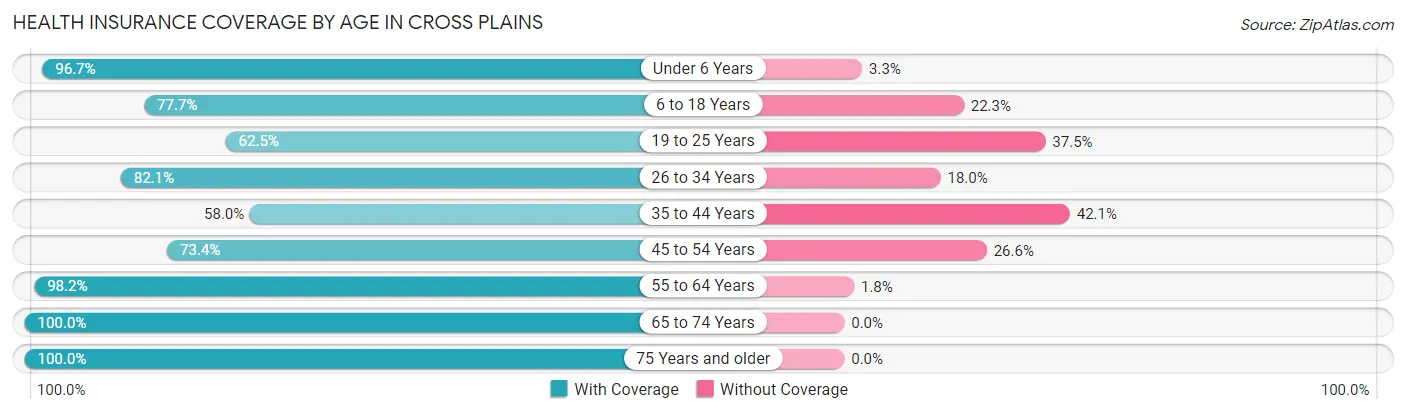
| Age Bracket | With Coverage | Without Coverage |
| Under 6 Years | 204 (96.7%) | 7 (3.3%) |
| 6 to 18 Years | 157 (77.7%) | 45 (22.3%) |
| 19 to 25 Years | 80 (62.5%) | 48 (37.5%) |
| 26 to 34 Years | 128 (82.1%) | 28 (17.9%) |
| 35 to 44 Years | 51 (58.0%) | 37 (42.0%) |
| 45 to 54 Years | 47 (73.4%) | 17 (26.6%) |
| 55 to 64 Years | 109 (98.2%) | 2 (1.8%) |
| 65 to 74 Years | 80 (100.0%) | 0 (0.0%) |
| 75 Years and older | 103 (100.0%) | 0 (0.0%) |
| Total | 959 (83.9%) | 184 (16.1%) |
Health Insurance Coverage by Citizenship Status in Cross Plains
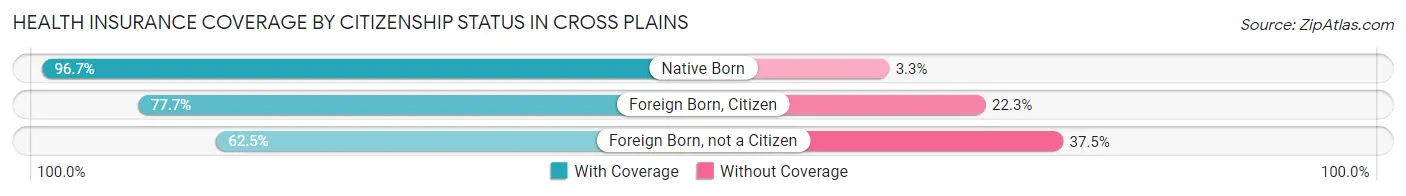
| Citizenship Status | With Coverage | Without Coverage |
| Native Born | 204 (96.7%) | 7 (3.3%) |
| Foreign Born, Citizen | 157 (77.7%) | 45 (22.3%) |
| Foreign Born, not a Citizen | 80 (62.5%) | 48 (37.5%) |
Health Insurance Coverage by Household Income in Cross Plains
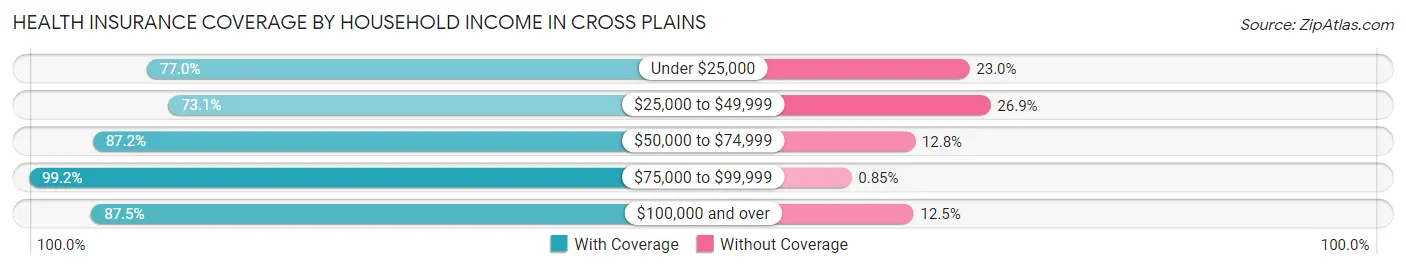
| Household Income | With Coverage | Without Coverage |
| Under $25,000 | 151 (77.0%) | 45 (23.0%) |
| $25,000 to $49,999 | 239 (73.1%) | 88 (26.9%) |
| $50,000 to $74,999 | 280 (87.2%) | 41 (12.8%) |
| $75,000 to $99,999 | 233 (99.2%) | 2 (0.9%) |
| $100,000 and over | 56 (87.5%) | 8 (12.5%) |
Public vs Private Health Insurance Coverage by Age in Cross Plains
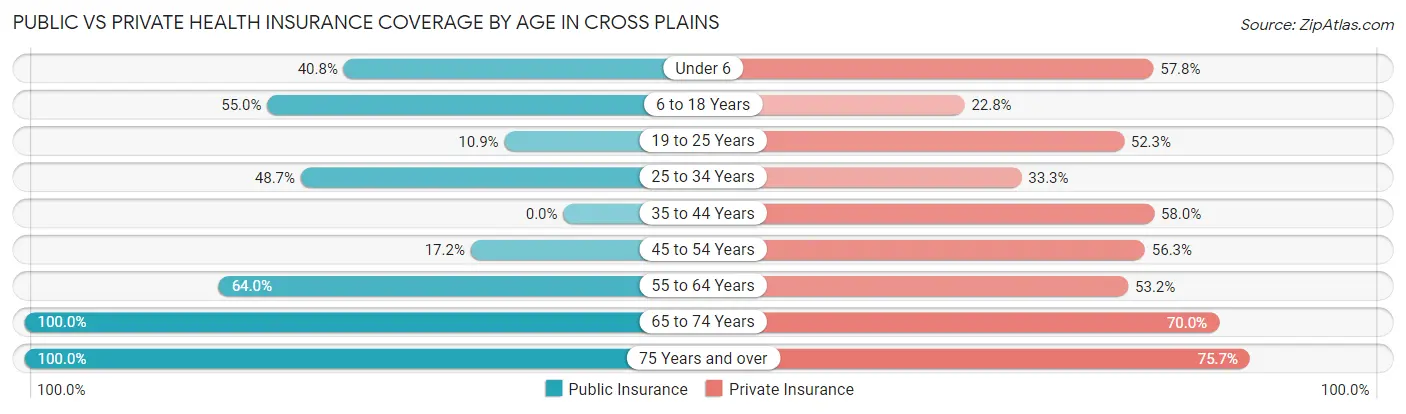
| Age Bracket | Public Insurance | Private Insurance |
| Under 6 | 86 (40.8%) | 122 (57.8%) |
| 6 to 18 Years | 111 (54.9%) | 46 (22.8%) |
| 19 to 25 Years | 14 (10.9%) | 67 (52.3%) |
| 25 to 34 Years | 76 (48.7%) | 52 (33.3%) |
| 35 to 44 Years | 0 (0.0%) | 51 (58.0%) |
| 45 to 54 Years | 11 (17.2%) | 36 (56.2%) |
| 55 to 64 Years | 71 (64.0%) | 59 (53.1%) |
| 65 to 74 Years | 80 (100.0%) | 56 (70.0%) |
| 75 Years and over | 103 (100.0%) | 78 (75.7%) |
| Total | 552 (48.3%) | 567 (49.6%) |
Disability Status by Sex by Age in Cross Plains
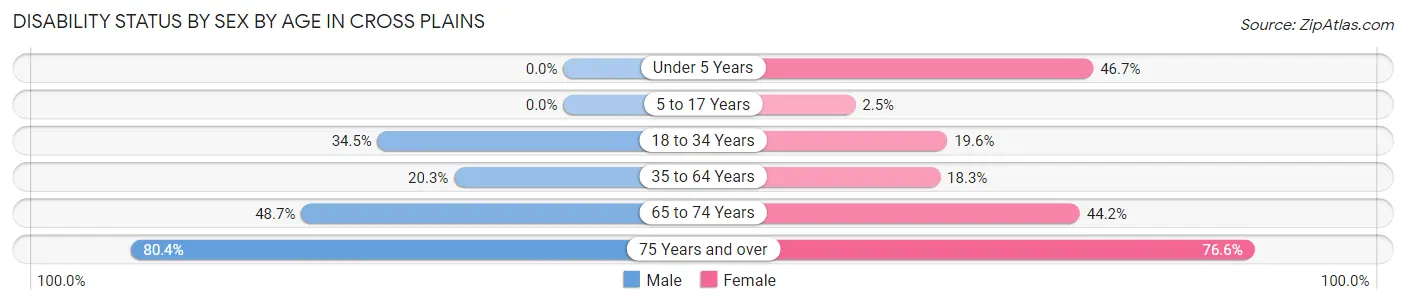
| Age Bracket | Male | Female |
| Under 5 Years | 0 (0.0%) | 42 (46.7%) |
| 5 to 17 Years | 0 (0.0%) | 3 (2.5%) |
| 18 to 34 Years | 51 (34.5%) | 27 (19.6%) |
| 35 to 64 Years | 30 (20.3%) | 21 (18.3%) |
| 65 to 74 Years | 18 (48.6%) | 19 (44.2%) |
| 75 Years and over | 45 (80.4%) | 36 (76.6%) |
Disability Class by Sex by Age in Cross Plains
Disability Class: Hearing Difficulty
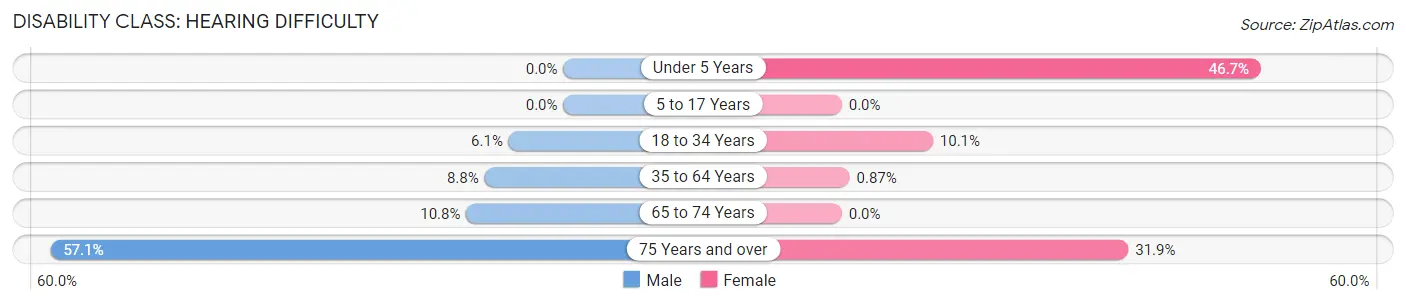
| Age Bracket | Male | Female |
| Under 5 Years | 0 (0.0%) | 42 (46.7%) |
| 5 to 17 Years | 0 (0.0%) | 0 (0.0%) |
| 18 to 34 Years | 9 (6.1%) | 14 (10.1%) |
| 35 to 64 Years | 13 (8.8%) | 1 (0.9%) |
| 65 to 74 Years | 4 (10.8%) | 0 (0.0%) |
| 75 Years and over | 32 (57.1%) | 15 (31.9%) |
Disability Class: Vision Difficulty
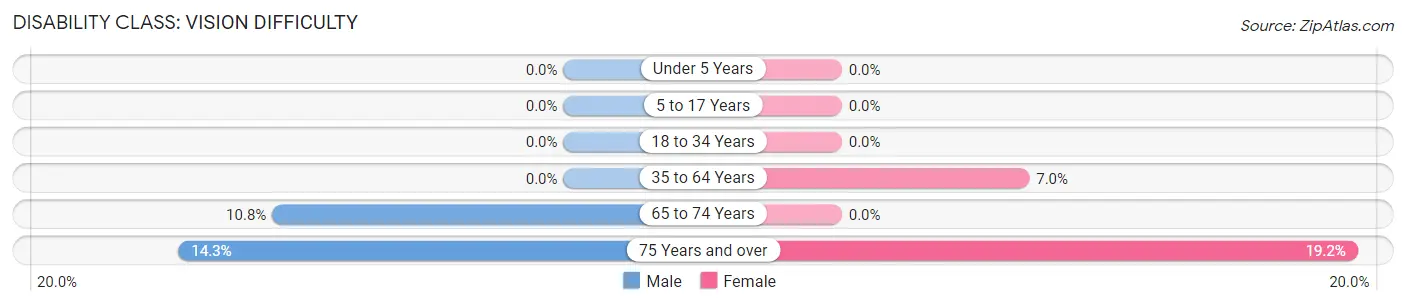
| Age Bracket | Male | Female |
| Under 5 Years | 0 (0.0%) | 0 (0.0%) |
| 5 to 17 Years | 0 (0.0%) | 0 (0.0%) |
| 18 to 34 Years | 0 (0.0%) | 0 (0.0%) |
| 35 to 64 Years | 0 (0.0%) | 8 (7.0%) |
| 65 to 74 Years | 4 (10.8%) | 0 (0.0%) |
| 75 Years and over | 8 (14.3%) | 9 (19.2%) |
Disability Class: Cognitive Difficulty
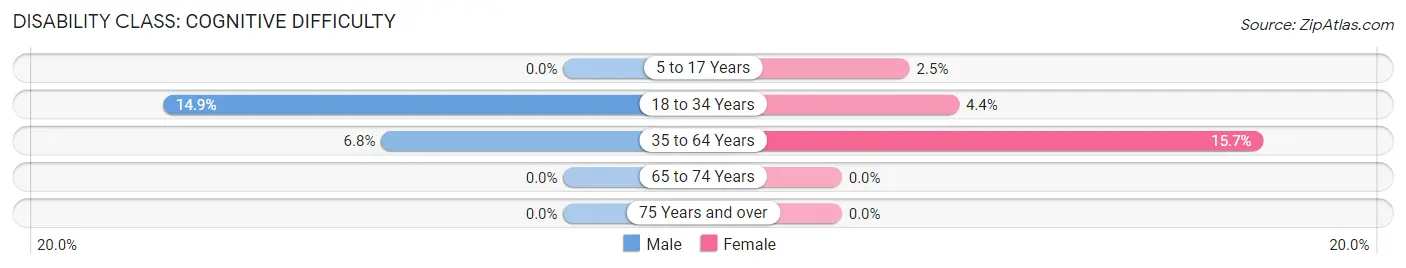
| Age Bracket | Male | Female |
| 5 to 17 Years | 0 (0.0%) | 3 (2.5%) |
| 18 to 34 Years | 22 (14.9%) | 6 (4.3%) |
| 35 to 64 Years | 10 (6.8%) | 18 (15.7%) |
| 65 to 74 Years | 0 (0.0%) | 0 (0.0%) |
| 75 Years and over | 0 (0.0%) | 0 (0.0%) |
Disability Class: Ambulatory Difficulty
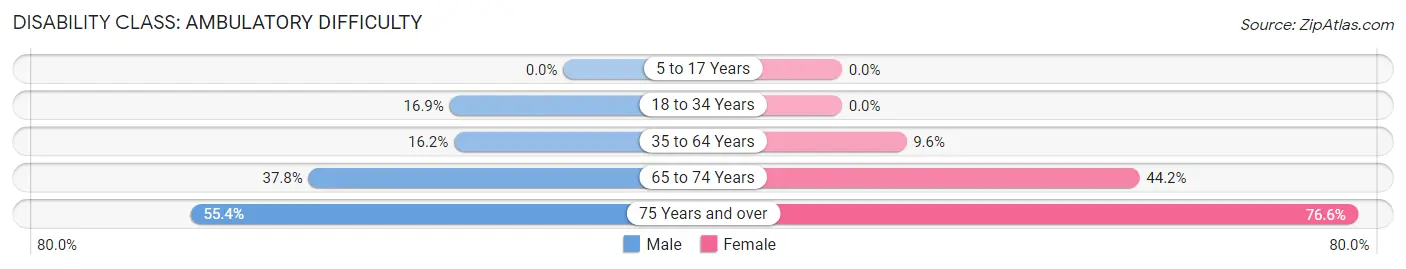
| Age Bracket | Male | Female |
| 5 to 17 Years | 0 (0.0%) | 0 (0.0%) |
| 18 to 34 Years | 25 (16.9%) | 0 (0.0%) |
| 35 to 64 Years | 24 (16.2%) | 11 (9.6%) |
| 65 to 74 Years | 14 (37.8%) | 19 (44.2%) |
| 75 Years and over | 31 (55.4%) | 36 (76.6%) |
Disability Class: Self-Care Difficulty
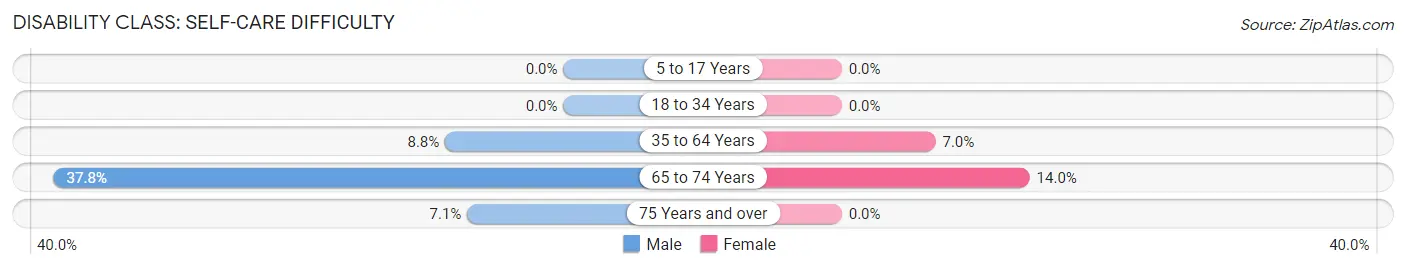
| Age Bracket | Male | Female |
| 5 to 17 Years | 0 (0.0%) | 0 (0.0%) |
| 18 to 34 Years | 0 (0.0%) | 0 (0.0%) |
| 35 to 64 Years | 13 (8.8%) | 8 (7.0%) |
| 65 to 74 Years | 14 (37.8%) | 6 (14.0%) |
| 75 Years and over | 4 (7.1%) | 0 (0.0%) |
Technology Access in Cross Plains
Computing Device Access in Cross Plains
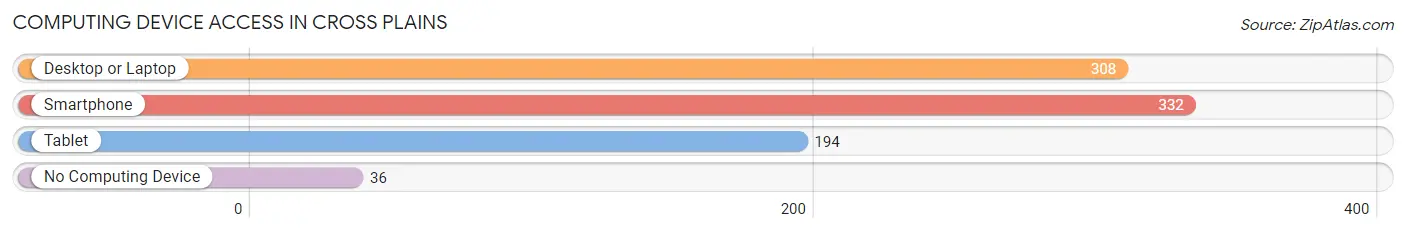
| Device Type | # Households | % Households |
| Desktop or Laptop | 308 | 72.6% |
| Smartphone | 332 | 78.3% |
| Tablet | 194 | 45.8% |
| No Computing Device | 36 | 8.5% |
| Total | 424 | 100.0% |
Internet Access in Cross Plains
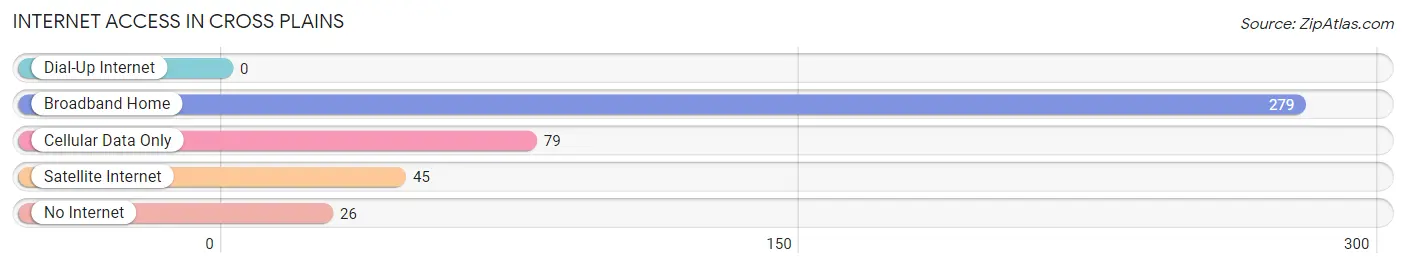
| Internet Type | # Households | % Households |
| Dial-Up Internet | 0 | 0.0% |
| Broadband Home | 279 | 65.8% |
| Cellular Data Only | 79 | 18.6% |
| Satellite Internet | 45 | 10.6% |
| No Internet | 26 | 6.1% |
| Total | 424 | 100.0% |
Cross Plains Summary
History
Cross Plains is a small town located in Callahan County, Texas. It is situated about 25 miles east of Abilene and is part of the Abilene Metropolitan Statistical Area. The town was founded in 1877 by a group of settlers from Kentucky and Tennessee. The town was named after the nearby crossroads of two major trails, the Great Western Trail and the Chisholm Trail.
The town was originally a farming community, but in the early 1900s, the discovery of oil in the area changed the economy of the town. Oil production in the area peaked in the 1920s and 1930s, and the town became a center for oil production and related industries. The town also became a center for ranching and farming, and the population grew steadily throughout the 20th century.
In the late 20th century, Cross Plains began to diversify its economy. The town is now home to a variety of businesses, including a winery, a brewery, a distillery, and a variety of retail stores. The town is also home to a number of historic sites, including the Cross Plains Museum, which houses artifacts from the town's history.
Geography
Cross Plains is located in Callahan County, Texas, about 25 miles east of Abilene. The town is situated at the intersection of two major trails, the Great Western Trail and the Chisholm Trail. The town is located in the rolling hills of the Edwards Plateau, and the terrain is mostly flat. The town is located at an elevation of 1,400 feet above sea level.
The climate in Cross Plains is semi-arid, with hot summers and mild winters. The average annual temperature is around 68 degrees Fahrenheit, and the average annual precipitation is around 22 inches.
Economy
Cross Plains is a small town with a population of just over 1,000 people. The town's economy is largely based on agriculture and oil production. The town is home to a number of businesses, including a winery, a brewery, a distillery, and a variety of retail stores. The town is also home to a number of historic sites, including the Cross Plains Museum, which houses artifacts from the town's history.
The town is also home to a number of oil and gas companies, including Chevron, ExxonMobil, and ConocoPhillips. The town is also home to a number of agricultural businesses, including cattle ranches, cotton farms, and wheat farms.
Demographics
As of the 2010 census, the population of Cross Plains was 1,072. The racial makeup of the town was 94.3% White, 0.7% African American, 0.2% Native American, 0.2% Asian, 0.1% Pacific Islander, 3.2% from other races, and 1.4% from two or more races. Hispanic or Latino of any race were 6.2% of the population.
The median income for a household in the town was $37,500, and the median income for a family was $45,000. The per capita income for the town was $19,000. About 11.3% of families and 14.2% of the population were below the poverty line, including 18.2% of those under age 18 and 8.3% of those age 65 or over.
Common Questions
What is Per Capita Income in Cross Plains?
Per Capita income in Cross Plains is $20,232.
What is the Median Family Income in Cross Plains?
Median Family Income in Cross Plains is $57,736.
What is the Median Household income in Cross Plains?
Median Household Income in Cross Plains is $48,516.
What is Income or Wage Gap in Cross Plains?
Income or Wage Gap in Cross Plains is 61.7%.
Women in Cross Plains earn 38.3 cents for every dollar earned by a man.
What is Family Income Deficit in Cross Plains?
Family Income Deficit in Cross Plains is $11,195.
Families that are below poverty line in Cross Plains earn $11,195 less on average than the poverty threshold level.
What is Inequality or Gini Index in Cross Plains?
Inequality or Gini Index in Cross Plains is 0.36.
What is the Total Population of Cross Plains?
Total Population of Cross Plains is 1,143.
What is the Total Male Population of Cross Plains?
Total Male Population of Cross Plains is 591.
What is the Total Female Population of Cross Plains?
Total Female Population of Cross Plains is 552.
What is the Ratio of Males per 100 Females in Cross Plains?
There are 107.07 Males per 100 Females in Cross Plains.
What is the Ratio of Females per 100 Males in Cross Plains?
There are 93.40 Females per 100 Males in Cross Plains.
What is the Median Population Age in Cross Plains?
Median Population Age in Cross Plains is 28.3 Years.
What is the Average Family Size in Cross Plains
Average Family Size in Cross Plains is 3.6 People.
What is the Average Household Size in Cross Plains
Average Household Size in Cross Plains is 2.7 People.
How Large is the Labor Force in Cross Plains?
There are 420 People in the Labor Forcein in Cross Plains.
What is the Percentage of People in the Labor Force in Cross Plains?
56.5% of People are in the Labor Force in Cross Plains.
What is the Unemployment Rate in Cross Plains?
Unemployment Rate in Cross Plains is 1.0%.