Crockett, TX Map & Demographics
Crockett Map
Crockett Overview
$26,307
PER CAPITA INCOME
$53,547
AVG FAMILY INCOME
$37,500
AVG HOUSEHOLD INCOME
40.6%
WAGE / INCOME GAP [ % ]
59.4¢/ $1
WAGE / INCOME GAP [ $ ]
$13,802
FAMILY INCOME DEFICIT
0.54
INEQUALITY / GINI INDEX
6,365
TOTAL POPULATION
2,940
MALE POPULATION
3,425
FEMALE POPULATION
85.84
MALES / 100 FEMALES
116.50
FEMALES / 100 MALES
38.1
MEDIAN AGE
3.6
AVG FAMILY SIZE
2.5
AVG HOUSEHOLD SIZE
2,603
LABOR FORCE [ PEOPLE ]
52.9%
PERCENT IN LABOR FORCE
2.4%
UNEMPLOYMENT RATE
Crockett Zip Codes
Crockett Area Codes
Income in Crockett
Income Overview in Crockett
Per Capita Income in Crockett is $26,307, while median incomes of families and households are $53,547 and $37,500 respectively.
| Characteristic | Number | Measure |
| Per Capita Income | 6,365 | $26,307 |
| Median Family Income | 1,308 | $53,547 |
| Mean Family Income | 1,308 | $68,666 |
| Median Household Income | 2,368 | $37,500 |
| Mean Household Income | 2,368 | $65,738 |
| Income Deficit | 1,308 | $13,802 |
| Wage / Income Gap (%) | 6,365 | 40.60% |
| Wage / Income Gap ($) | 6,365 | 59.40¢ per $1 |
| Gini / Inequality Index | 6,365 | 0.54 |
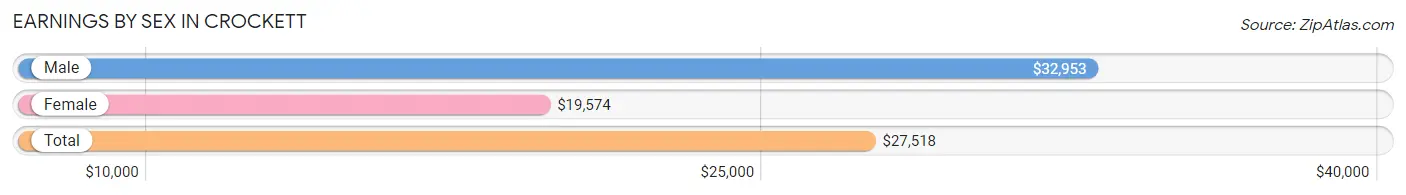
Earnings by Sex in Crockett
Average Earnings in Crockett are $27,518, $32,953 for men and $19,574 for women, a difference of 40.6%.
| Sex | Number | Average Earnings |
| Male | 1,192 (43.7%) | $32,953 |
| Female | 1,535 (56.3%) | $19,574 |
| Total | 2,727 (100.0%) | $27,518 |
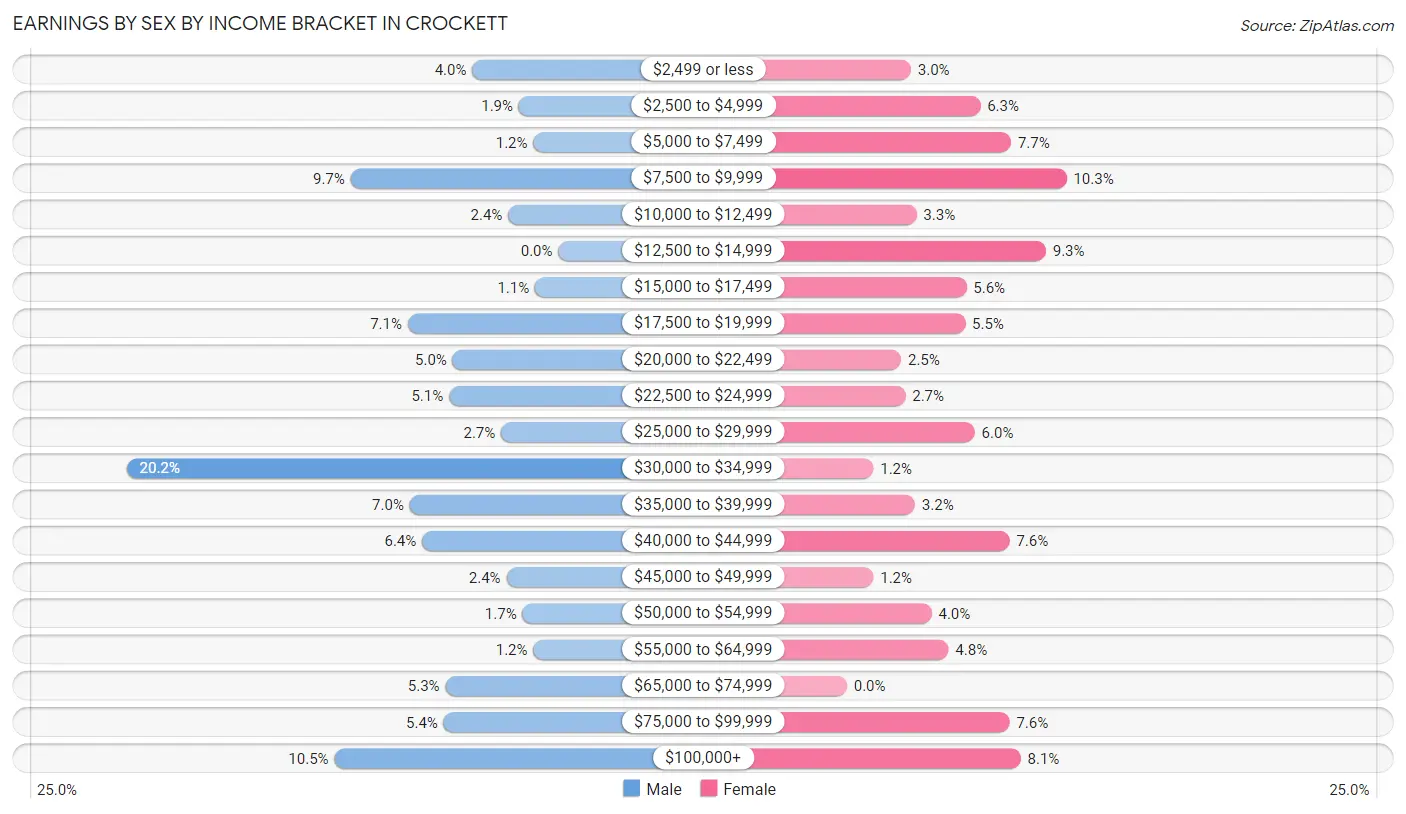
Earnings by Sex by Income Bracket in Crockett
The most common earnings brackets in Crockett are $30,000 to $34,999 for men (241 | 20.2%) and $7,500 to $9,999 for women (158 | 10.3%).
| Income | Male | Female |
| $2,499 or less | 48 (4.0%) | 46 (3.0%) |
| $2,500 to $4,999 | 22 (1.8%) | 96 (6.2%) |
| $5,000 to $7,499 | 14 (1.2%) | 118 (7.7%) |
| $7,500 to $9,999 | 116 (9.7%) | 158 (10.3%) |
| $10,000 to $12,499 | 28 (2.4%) | 50 (3.3%) |
| $12,500 to $14,999 | 0 (0.0%) | 143 (9.3%) |
| $15,000 to $17,499 | 13 (1.1%) | 86 (5.6%) |
| $17,500 to $19,999 | 84 (7.0%) | 85 (5.5%) |
| $20,000 to $22,499 | 59 (5.0%) | 39 (2.5%) |
| $22,500 to $24,999 | 61 (5.1%) | 42 (2.7%) |
| $25,000 to $29,999 | 32 (2.7%) | 92 (6.0%) |
| $30,000 to $34,999 | 241 (20.2%) | 19 (1.2%) |
| $35,000 to $39,999 | 83 (7.0%) | 49 (3.2%) |
| $40,000 to $44,999 | 76 (6.4%) | 117 (7.6%) |
| $45,000 to $49,999 | 29 (2.4%) | 19 (1.2%) |
| $50,000 to $54,999 | 20 (1.7%) | 61 (4.0%) |
| $55,000 to $64,999 | 14 (1.2%) | 73 (4.8%) |
| $65,000 to $74,999 | 63 (5.3%) | 0 (0.0%) |
| $75,000 to $99,999 | 64 (5.4%) | 117 (7.6%) |
| $100,000+ | 125 (10.5%) | 125 (8.1%) |
| Total | 1,192 (100.0%) | 1,535 (100.0%) |
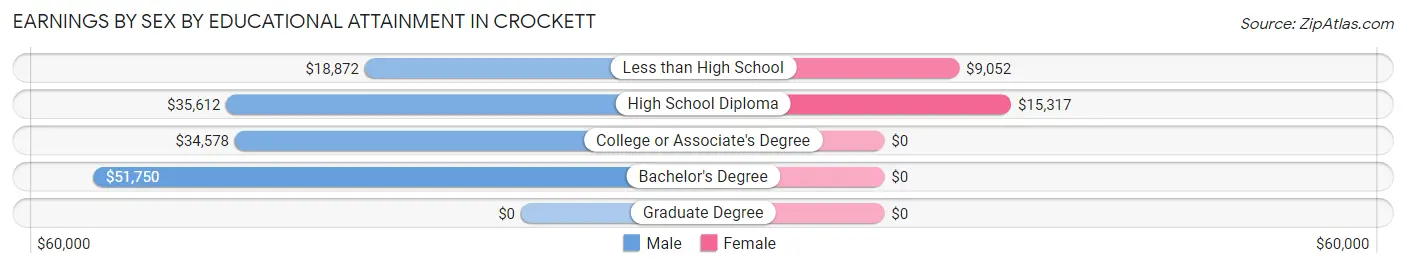
Earnings by Sex by Educational Attainment in Crockett
Average earnings in Crockett are $34,312 for men and $24,519 for women, a difference of 28.5%. Men with an educational attainment of bachelor's degree enjoy the highest average annual earnings of $51,750, while those with less than high school education earn the least with $18,872. Women with an educational attainment of high school diploma earn the most with the average annual earnings of $15,317, while those with less than high school education have the smallest earnings of $9,052.
| Educational Attainment | Male Income | Female Income |
| Less than High School | $18,872 | $9,052 |
| High School Diploma | $35,612 | $15,317 |
| College or Associate's Degree | $34,578 | $0 |
| Bachelor's Degree | $51,750 | $0 |
| Graduate Degree | - | - |
| Total | $34,312 | $24,519 |
Family Income in Crockett
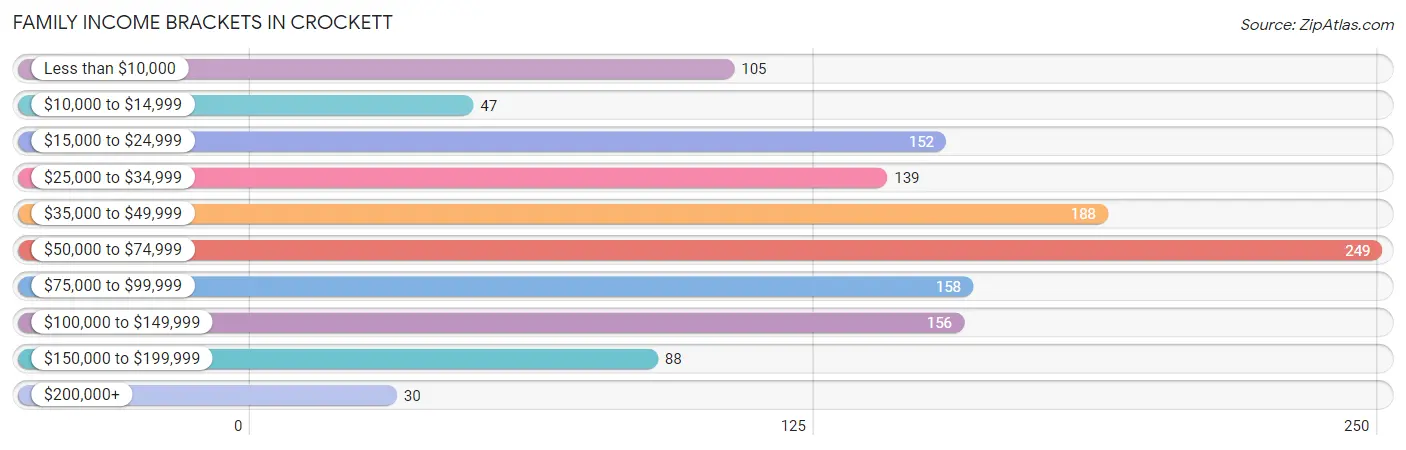
Family Income Brackets in Crockett
According to the Crockett family income data, there are 249 families falling into the $50,000 to $74,999 income range, which is the most common income bracket and makes up 19.0% of all families. Conversely, the $200,000+ income bracket is the least frequent group with only 30 families (2.3%) belonging to this category.
| Income Bracket | # Families | % Families |
| Less than $10,000 | 105 | 8.0% |
| $10,000 to $14,999 | 47 | 3.6% |
| $15,000 to $24,999 | 152 | 11.6% |
| $25,000 to $34,999 | 139 | 10.6% |
| $35,000 to $49,999 | 188 | 14.4% |
| $50,000 to $74,999 | 249 | 19.0% |
| $75,000 to $99,999 | 158 | 12.1% |
| $100,000 to $149,999 | 156 | 11.9% |
| $150,000 to $199,999 | 88 | 6.7% |
| $200,000+ | 30 | 2.3% |
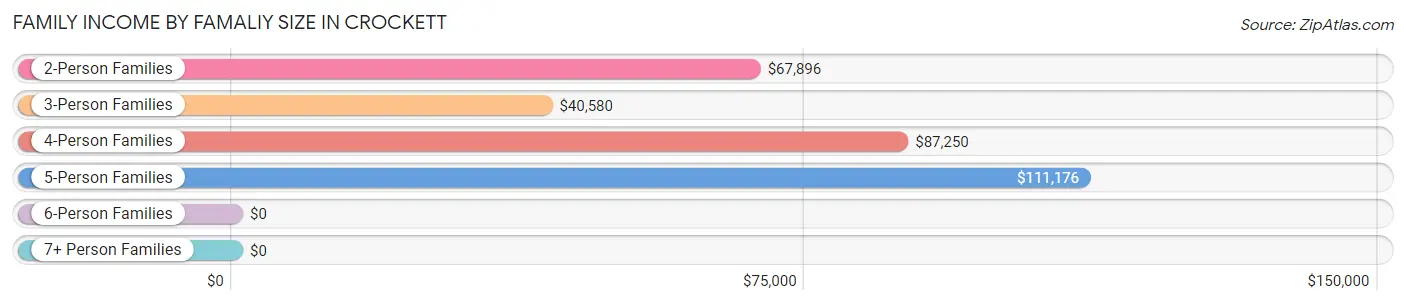
Family Income by Famaliy Size in Crockett
5-person families (76 | 5.8%) account for the highest median family income in Crockett with $111,176 per family, while 2-person families (598 | 45.7%) have the highest median income of $33,948 per family member.
| Income Bracket | # Families | Median Income |
| 2-Person Families | 598 (45.7%) | $67,896 |
| 3-Person Families | 373 (28.5%) | $40,580 |
| 4-Person Families | 149 (11.4%) | $87,250 |
| 5-Person Families | 76 (5.8%) | $111,176 |
| 6-Person Families | 102 (7.8%) | $0 |
| 7+ Person Families | 10 (0.8%) | $0 |
| Total | 1,308 (100.0%) | $53,547 |
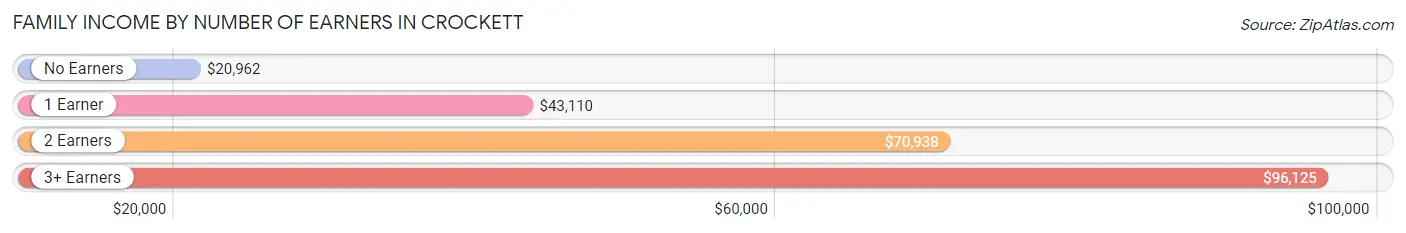
Family Income by Number of Earners in Crockett
The median family income in Crockett is $53,547, with families comprising 3+ earners (38) having the highest median family income of $96,125, while families with no earners (248) have the lowest median family income of $20,962, accounting for 2.9% and 19.0% of families, respectively.
| Number of Earners | # Families | Median Income |
| No Earners | 248 (19.0%) | $20,962 |
| 1 Earner | 436 (33.3%) | $43,110 |
| 2 Earners | 586 (44.8%) | $70,938 |
| 3+ Earners | 38 (2.9%) | $96,125 |
| Total | 1,308 (100.0%) | $53,547 |
Household Income in Crockett
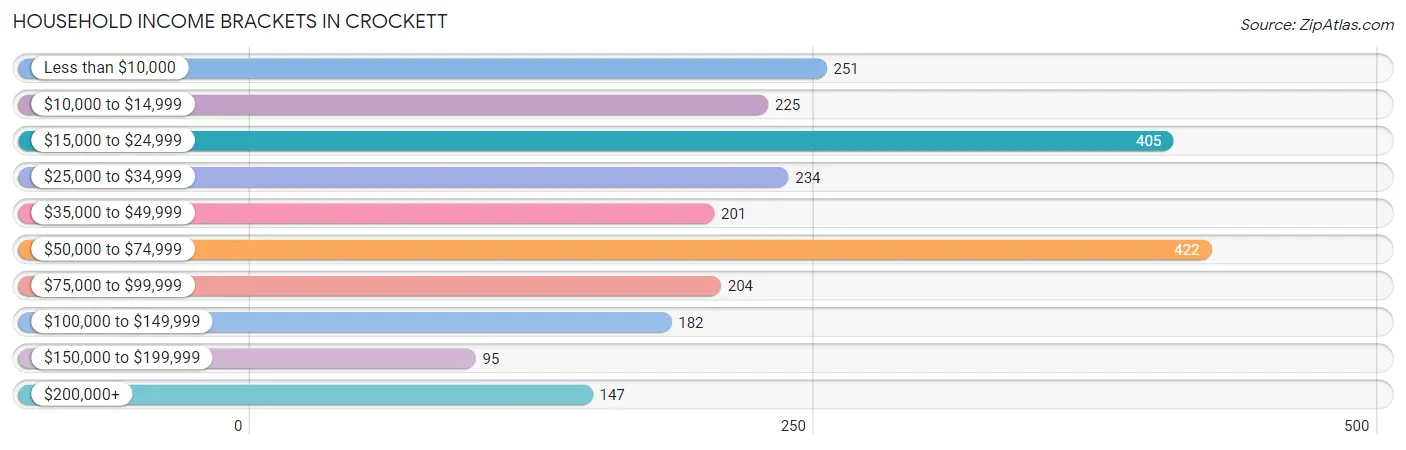
Household Income Brackets in Crockett
With 422 households falling in the category, the $50,000 to $74,999 income range is the most frequent in Crockett, accounting for 17.8% of all households. In contrast, only 95 households (4.0%) fall into the $150,000 to $199,999 income bracket, making it the least populous group.
| Income Bracket | # Households | % Households |
| Less than $10,000 | 251 | 10.6% |
| $10,000 to $14,999 | 225 | 9.5% |
| $15,000 to $24,999 | 405 | 17.1% |
| $25,000 to $34,999 | 234 | 9.9% |
| $35,000 to $49,999 | 201 | 8.5% |
| $50,000 to $74,999 | 422 | 17.8% |
| $75,000 to $99,999 | 204 | 8.6% |
| $100,000 to $149,999 | 182 | 7.7% |
| $150,000 to $199,999 | 95 | 4.0% |
| $200,000+ | 147 | 6.2% |
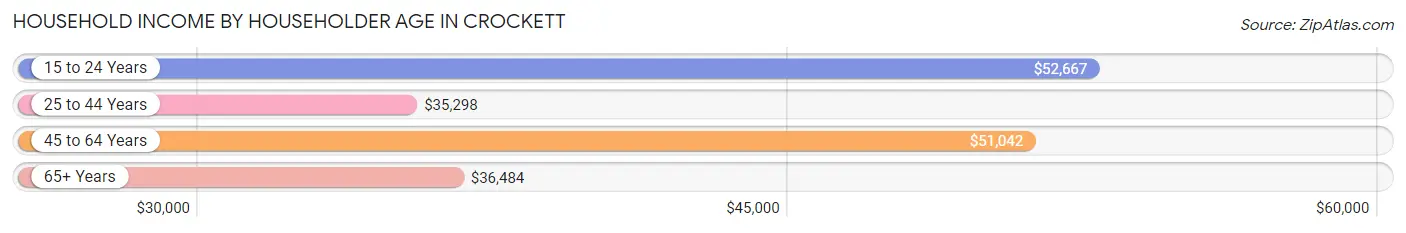
Household Income by Householder Age in Crockett
The median household income in Crockett is $37,500, with the highest median household income of $52,667 found in the 15 to 24 years age bracket for the primary householder. A total of 112 households (4.7%) fall into this category. Meanwhile, the 25 to 44 years age bracket for the primary householder has the lowest median household income of $35,298, with 646 households (27.3%) in this group.
| Income Bracket | # Households | Median Income |
| 15 to 24 Years | 112 (4.7%) | $52,667 |
| 25 to 44 Years | 646 (27.3%) | $35,298 |
| 45 to 64 Years | 851 (35.9%) | $51,042 |
| 65+ Years | 759 (32.1%) | $36,484 |
| Total | 2,368 (100.0%) | $37,500 |
Poverty in Crockett
Income Below Poverty by Sex and Age in Crockett
With 25.2% poverty level for males and 29.0% for females among the residents of Crockett, under 5 year old males and 5 year old females are the most vulnerable to poverty, with 164 males (81.6%) and 85 females (88.5%) in their respective age groups living below the poverty level.
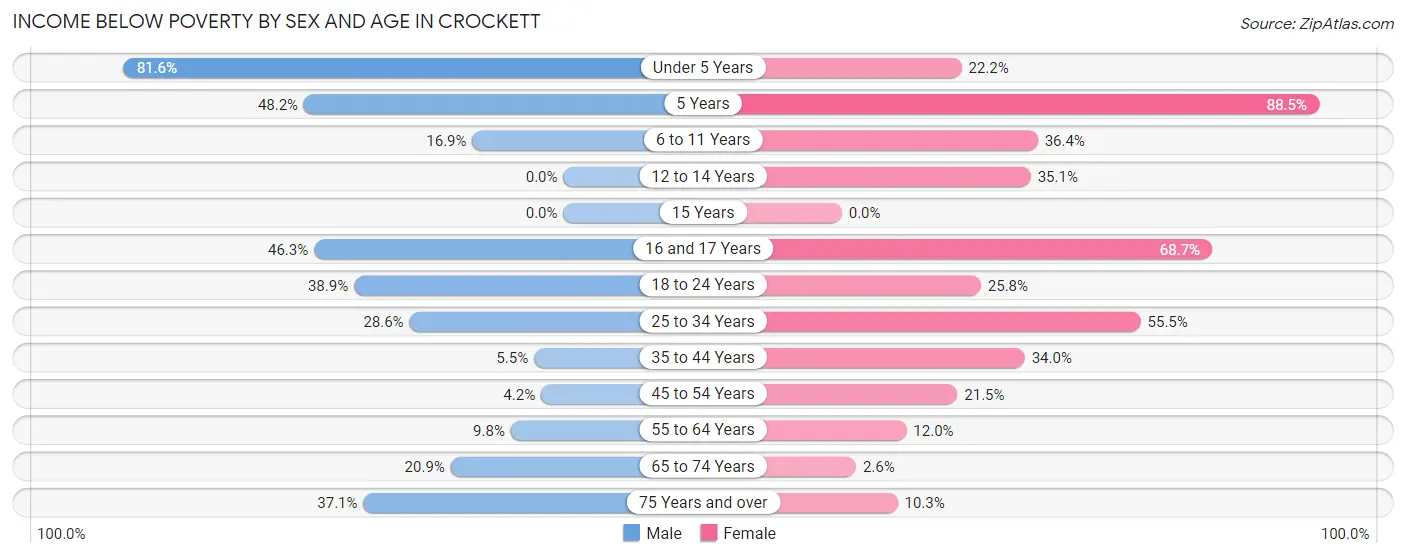
| Age Bracket | Male | Female |
| Under 5 Years | 164 (81.6%) | 42 (22.2%) |
| 5 Years | 52 (48.1%) | 85 (88.5%) |
| 6 to 11 Years | 37 (16.9%) | 120 (36.4%) |
| 12 to 14 Years | 0 (0.0%) | 47 (35.1%) |
| 15 Years | 0 (0.0%) | 0 (0.0%) |
| 16 and 17 Years | 31 (46.3%) | 68 (68.7%) |
| 18 to 24 Years | 82 (38.9%) | 96 (25.8%) |
| 25 to 34 Years | 98 (28.6%) | 223 (55.5%) |
| 35 to 44 Years | 14 (5.4%) | 109 (34.0%) |
| 45 to 54 Years | 12 (4.2%) | 74 (21.4%) |
| 55 to 64 Years | 30 (9.8%) | 56 (12.0%) |
| 65 to 74 Years | 82 (20.9%) | 6 (2.6%) |
| 75 Years and over | 85 (37.1%) | 27 (10.3%) |
| Total | 687 (25.2%) | 953 (29.0%) |
Income Above Poverty by Sex and Age in Crockett
According to the poverty statistics in Crockett, males aged 12 to 14 years and females aged 15 years are the age groups that are most secure financially, with 100.0% of males and 100.0% of females in these age groups living above the poverty line.
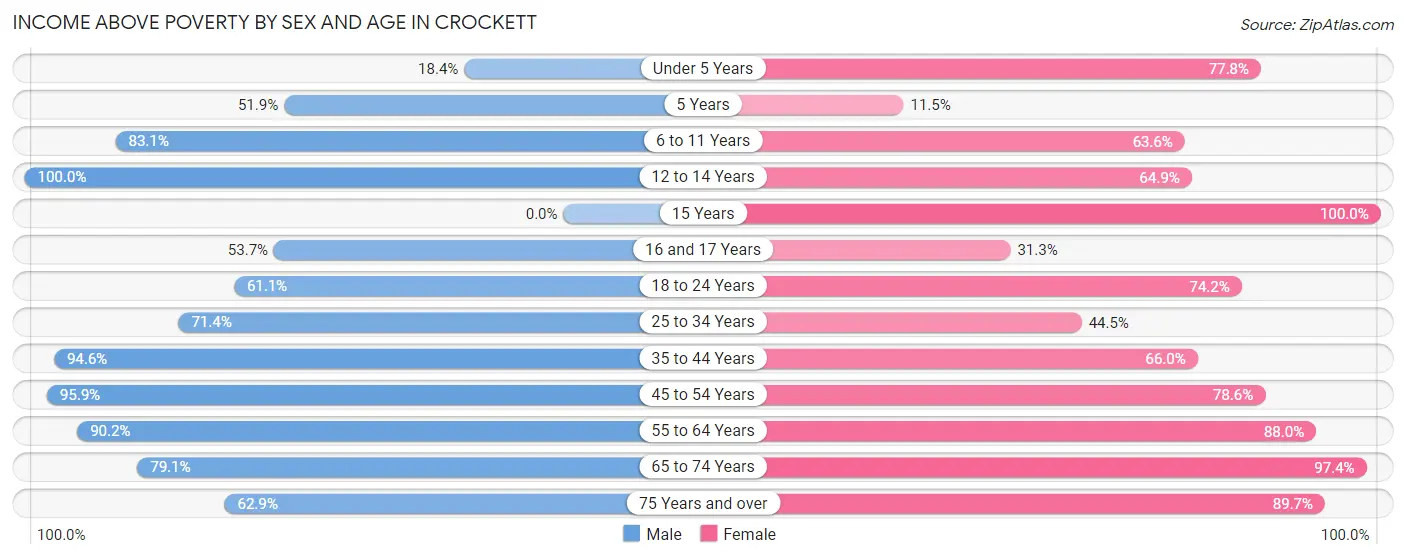
| Age Bracket | Male | Female |
| Under 5 Years | 37 (18.4%) | 147 (77.8%) |
| 5 Years | 56 (51.8%) | 11 (11.5%) |
| 6 to 11 Years | 182 (83.1%) | 210 (63.6%) |
| 12 to 14 Years | 106 (100.0%) | 87 (64.9%) |
| 15 Years | 0 (0.0%) | 46 (100.0%) |
| 16 and 17 Years | 36 (53.7%) | 31 (31.3%) |
| 18 to 24 Years | 129 (61.1%) | 276 (74.2%) |
| 25 to 34 Years | 245 (71.4%) | 179 (44.5%) |
| 35 to 44 Years | 243 (94.6%) | 212 (66.0%) |
| 45 to 54 Years | 277 (95.9%) | 271 (78.5%) |
| 55 to 64 Years | 277 (90.2%) | 411 (88.0%) |
| 65 to 74 Years | 310 (79.1%) | 222 (97.4%) |
| 75 Years and over | 144 (62.9%) | 234 (89.7%) |
| Total | 2,042 (74.8%) | 2,337 (71.0%) |
Income Below Poverty Among Married-Couple Families in Crockett
The poverty statistics for married-couple families in Crockett show that 10.6% or 75 of the total 709 families live below the poverty line. Families with 3 or 4 children have the highest poverty rate of 48.8%, comprising of 63 families. On the other hand, families with no children have the lowest poverty rate of 0.0%, which includes 0 families.
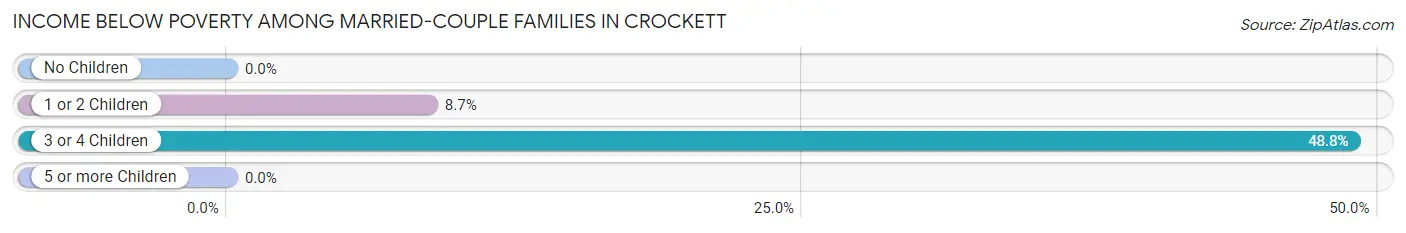
| Children | Above Poverty | Below Poverty |
| No Children | 442 (100.0%) | 0 (0.0%) |
| 1 or 2 Children | 126 (91.3%) | 12 (8.7%) |
| 3 or 4 Children | 66 (51.2%) | 63 (48.8%) |
| 5 or more Children | 0 (0.0%) | 0 (0.0%) |
| Total | 634 (89.4%) | 75 (10.6%) |
Income Below Poverty Among Single-Parent Households in Crockett
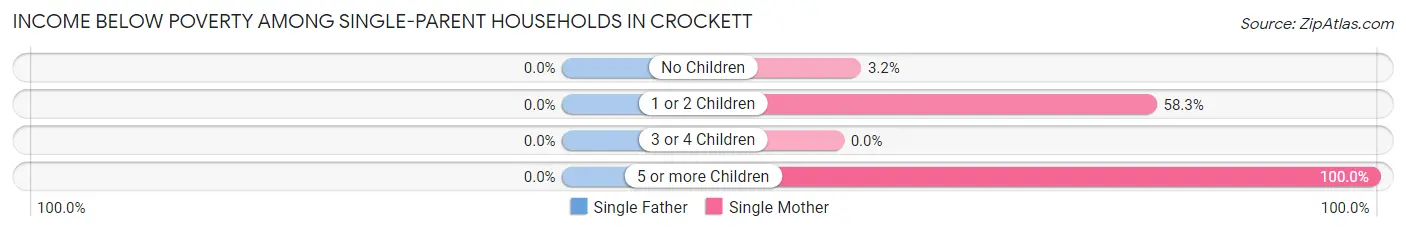
| Children | Single Father | Single Mother |
| No Children | 0 (0.0%) | 6 (3.2%) |
| 1 or 2 Children | 0 (0.0%) | 162 (58.3%) |
| 3 or 4 Children | 0 (0.0%) | 0 (0.0%) |
| 5 or more Children | 0 (0.0%) | 16 (100.0%) |
| Total | 0 (0.0%) | 184 (37.6%) |
Income Below Poverty Among Married-Couple vs Single-Parent Households in Crockett
The poverty data for Crockett shows that 75 of the married-couple family households (10.6%) and 184 of the single-parent households (30.7%) are living below the poverty level. Within the married-couple family households, those with 3 or 4 children have the highest poverty rate, with 63 households (48.8%) falling below the poverty line. Among the single-parent households, those with 5 or more children have the highest poverty rate, with 16 household (100.0%) living below poverty.
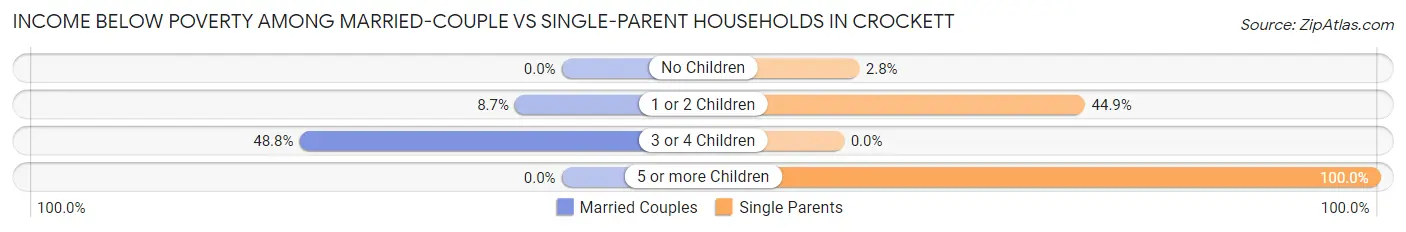
| Children | Married-Couple Families | Single-Parent Households |
| No Children | 0 (0.0%) | 6 (2.8%) |
| 1 or 2 Children | 12 (8.7%) | 162 (44.9%) |
| 3 or 4 Children | 63 (48.8%) | 0 (0.0%) |
| 5 or more Children | 0 (0.0%) | 16 (100.0%) |
| Total | 75 (10.6%) | 184 (30.7%) |
Race in Crockett
The most populous races in Crockett are White / Caucasian (2,970 | 46.7%), Black / African American (2,790 | 43.8%), and Hispanic or Latino (772 | 12.1%).
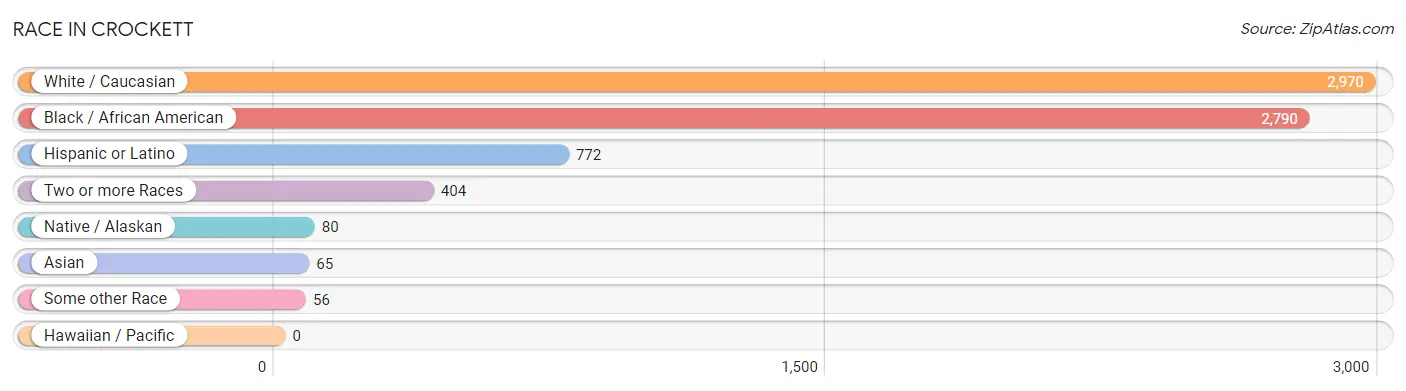
| Race | # Population | % Population |
| Asian | 65 | 1.0% |
| Black / African American | 2,790 | 43.8% |
| Hawaiian / Pacific | 0 | 0.0% |
| Hispanic or Latino | 772 | 12.1% |
| Native / Alaskan | 80 | 1.3% |
| White / Caucasian | 2,970 | 46.7% |
| Two or more Races | 404 | 6.4% |
| Some other Race | 56 | 0.9% |
| Total | 6,365 | 100.0% |
Ancestry in Crockett
The most populous ancestries reported in Crockett are Mexican (678 | 10.6%), Irish (493 | 7.7%), English (441 | 6.9%), German (264 | 4.2%), and African (262 | 4.1%), together accounting for 33.6% of all Crockett residents.
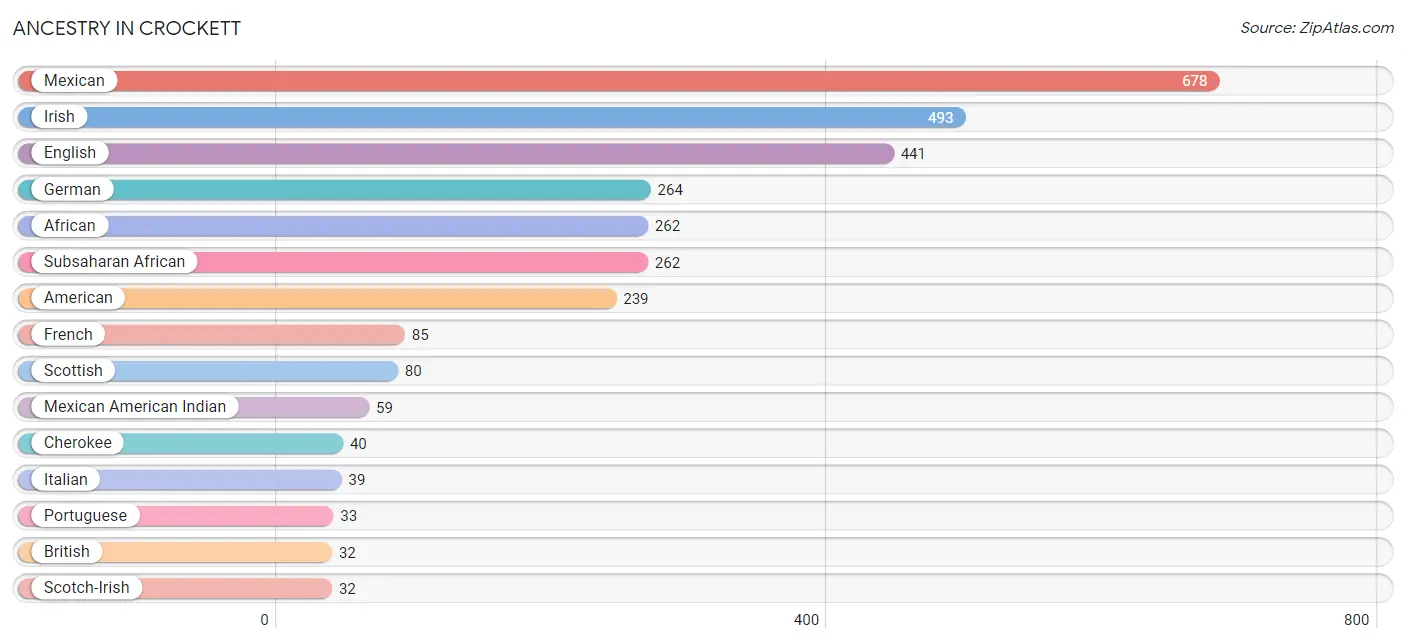
| Ancestry | # Population | % Population |
| African | 262 | 4.1% |
| American | 239 | 3.7% |
| British | 32 | 0.5% |
| Burmese | 5 | 0.1% |
| Cherokee | 40 | 0.6% |
| Czech | 20 | 0.3% |
| Dutch | 16 | 0.3% |
| English | 441 | 6.9% |
| European | 7 | 0.1% |
| French | 85 | 1.3% |
| German | 264 | 4.2% |
| Indian (Asian) | 12 | 0.2% |
| Irish | 493 | 7.7% |
| Italian | 39 | 0.6% |
| Jamaican | 9 | 0.1% |
| Japanese | 10 | 0.2% |
| Korean | 29 | 0.5% |
| Lithuanian | 6 | 0.1% |
| Mexican | 678 | 10.6% |
| Mexican American Indian | 59 | 0.9% |
| Norwegian | 7 | 0.1% |
| Pakistani | 9 | 0.1% |
| Peruvian | 7 | 0.1% |
| Polish | 12 | 0.2% |
| Portuguese | 33 | 0.5% |
| Puerto Rican | 6 | 0.1% |
| Scotch-Irish | 32 | 0.5% |
| Scottish | 80 | 1.3% |
| South American | 7 | 0.1% |
| Subsaharan African | 262 | 4.1% |
| Swedish | 26 | 0.4% |
| Welsh | 12 | 0.2% | View All 32 Rows |
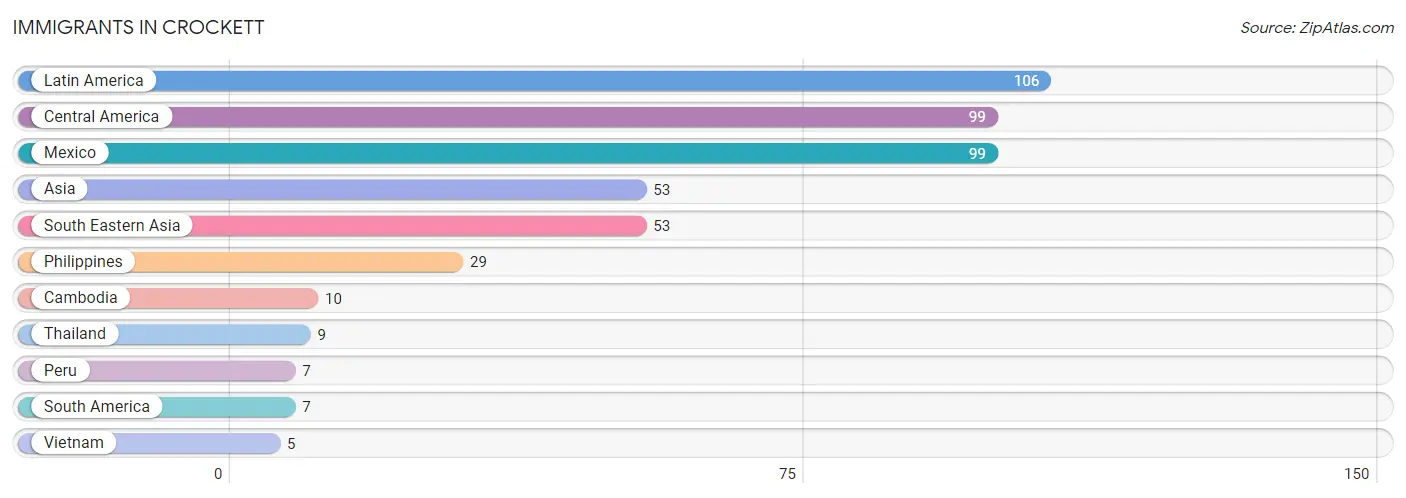
Immigrants in Crockett
The most numerous immigrant groups reported in Crockett came from Latin America (106 | 1.7%), Central America (99 | 1.6%), Mexico (99 | 1.6%), Asia (53 | 0.8%), and South Eastern Asia (53 | 0.8%), together accounting for 6.5% of all Crockett residents.
| Immigration Origin | # Population | % Population |
| Asia | 53 | 0.8% |
| Cambodia | 10 | 0.2% |
| Central America | 99 | 1.6% |
| Latin America | 106 | 1.7% |
| Mexico | 99 | 1.6% |
| Peru | 7 | 0.1% |
| Philippines | 29 | 0.5% |
| South America | 7 | 0.1% |
| South Eastern Asia | 53 | 0.8% |
| Thailand | 9 | 0.1% |
| Vietnam | 5 | 0.1% | View All 11 Rows |
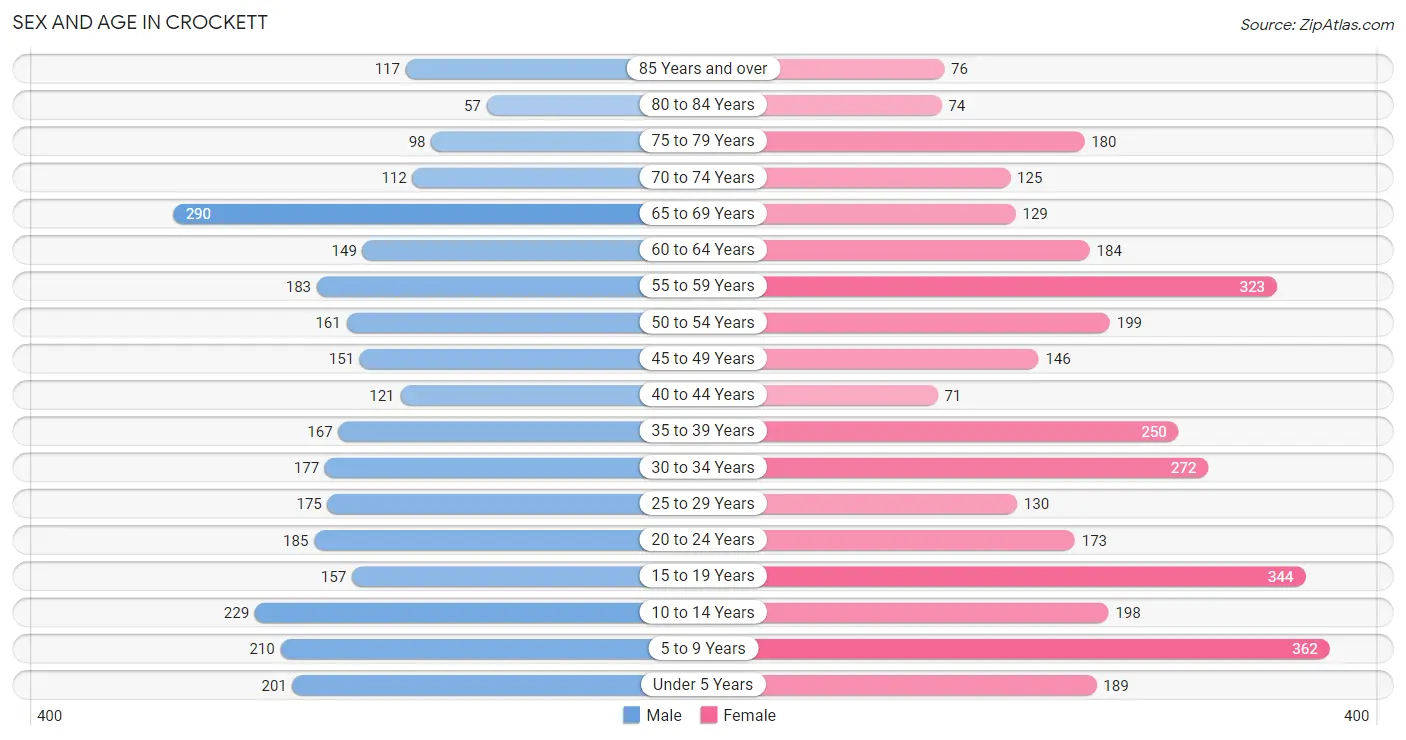
Sex and Age in Crockett
Sex and Age in Crockett
The most populous age groups in Crockett are 65 to 69 Years (290 | 9.9%) for men and 5 to 9 Years (362 | 10.6%) for women.
| Age Bracket | Male | Female |
| Under 5 Years | 201 (6.8%) | 189 (5.5%) |
| 5 to 9 Years | 210 (7.1%) | 362 (10.6%) |
| 10 to 14 Years | 229 (7.8%) | 198 (5.8%) |
| 15 to 19 Years | 157 (5.3%) | 344 (10.0%) |
| 20 to 24 Years | 185 (6.3%) | 173 (5.1%) |
| 25 to 29 Years | 175 (5.9%) | 130 (3.8%) |
| 30 to 34 Years | 177 (6.0%) | 272 (7.9%) |
| 35 to 39 Years | 167 (5.7%) | 250 (7.3%) |
| 40 to 44 Years | 121 (4.1%) | 71 (2.1%) |
| 45 to 49 Years | 151 (5.1%) | 146 (4.3%) |
| 50 to 54 Years | 161 (5.5%) | 199 (5.8%) |
| 55 to 59 Years | 183 (6.2%) | 323 (9.4%) |
| 60 to 64 Years | 149 (5.1%) | 184 (5.4%) |
| 65 to 69 Years | 290 (9.9%) | 129 (3.8%) |
| 70 to 74 Years | 112 (3.8%) | 125 (3.6%) |
| 75 to 79 Years | 98 (3.3%) | 180 (5.3%) |
| 80 to 84 Years | 57 (1.9%) | 74 (2.2%) |
| 85 Years and over | 117 (4.0%) | 76 (2.2%) |
| Total | 2,940 (100.0%) | 3,425 (100.0%) |
Families and Households in Crockett
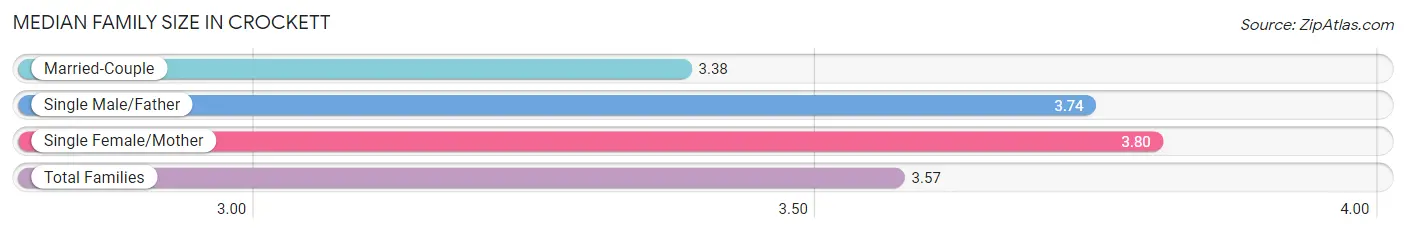
Median Family Size in Crockett
The median family size in Crockett is 3.57 persons per family, with single female/mother families (490 | 37.5%) accounting for the largest median family size of 3.8 persons per family. On the other hand, married-couple families (709 | 54.2%) represent the smallest median family size with 3.38 persons per family.
| Family Type | # Families | Family Size |
| Married-Couple | 709 (54.2%) | 3.38 |
| Single Male/Father | 109 (8.3%) | 3.74 |
| Single Female/Mother | 490 (37.5%) | 3.80 |
| Total Families | 1,308 (100.0%) | 3.57 |
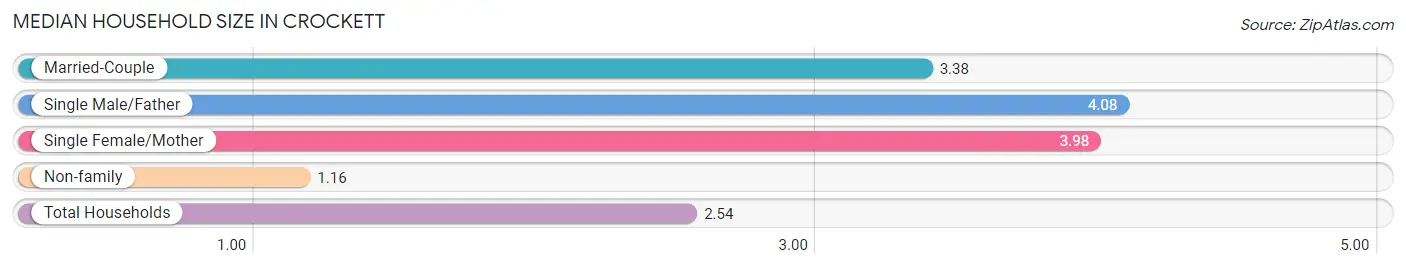
Median Household Size in Crockett
The median household size in Crockett is 2.54 persons per household, with single male/father households (109 | 4.6%) accounting for the largest median household size of 4.08 persons per household. non-family households (1,060 | 44.8%) represent the smallest median household size with 1.16 persons per household.
| Household Type | # Households | Household Size |
| Married-Couple | 709 (29.9%) | 3.38 |
| Single Male/Father | 109 (4.6%) | 4.08 |
| Single Female/Mother | 490 (20.7%) | 3.98 |
| Non-family | 1,060 (44.8%) | 1.16 |
| Total Households | 2,368 (100.0%) | 2.54 |
Household Size by Marriage Status in Crockett
Out of a total of 2,368 households in Crockett, 1,308 (55.2%) are family households, while 1,060 (44.8%) are nonfamily households. The most numerous type of family households are 2-person households, comprising 592, and the most common type of nonfamily households are 1-person households, comprising 955.
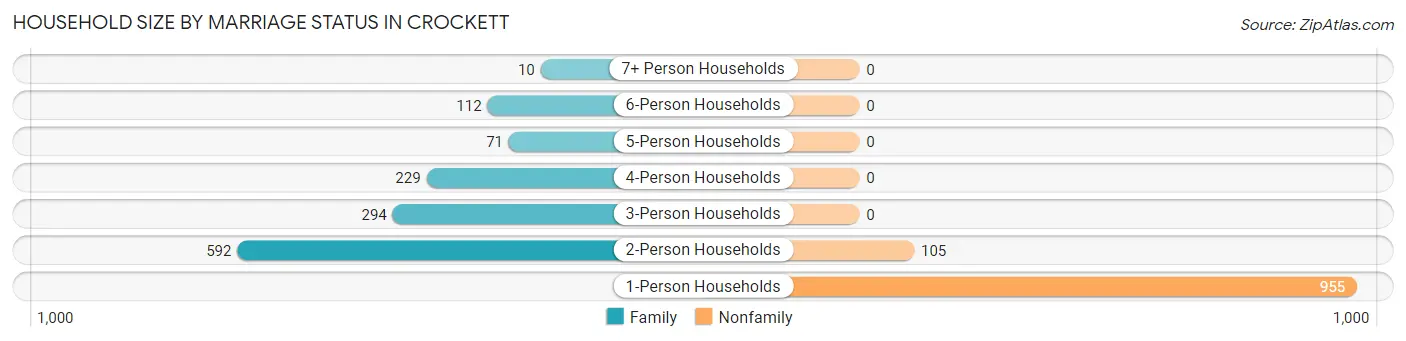
| Household Size | Family Households | Nonfamily Households |
| 1-Person Households | - | 955 (40.3%) |
| 2-Person Households | 592 (25.0%) | 105 (4.4%) |
| 3-Person Households | 294 (12.4%) | 0 (0.0%) |
| 4-Person Households | 229 (9.7%) | 0 (0.0%) |
| 5-Person Households | 71 (3.0%) | 0 (0.0%) |
| 6-Person Households | 112 (4.7%) | 0 (0.0%) |
| 7+ Person Households | 10 (0.4%) | 0 (0.0%) |
| Total | 1,308 (55.2%) | 1,060 (44.8%) |
Female Fertility in Crockett
Fertility by Age in Crockett
Average fertility rate in Crockett is 64.0 births per 1,000 women. Women in the age bracket of 20 to 34 years have the highest fertility rate with 158.0 births per 1,000 women. Women in the age bracket of 20 to 34 years acount for 100.0% of all women with births.
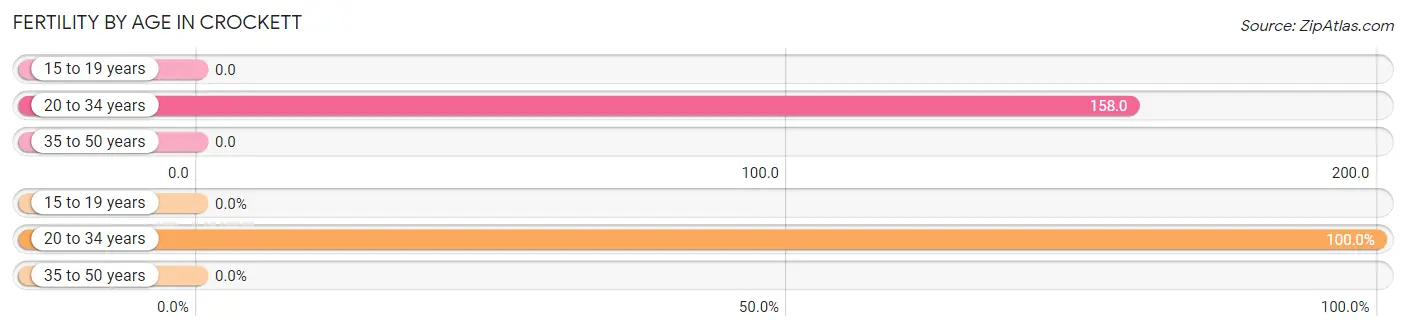
| Age Bracket | Women with Births | Births / 1,000 Women |
| 15 to 19 years | 0 (0.0%) | 0.0 |
| 20 to 34 years | 91 (100.0%) | 158.0 |
| 35 to 50 years | 0 (0.0%) | 0.0 |
| Total | 91 (100.0%) | 64.0 |
Fertility by Age by Marriage Status in Crockett
64.8% of women with births (91) in Crockett are married. The highest percentage of unmarried women with births falls into 20 to 34 years age bracket with 35.2% of them unmarried at the time of birth, while the lowest percentage of unmarried women with births belong to 20 to 34 years age bracket with 35.2% of them unmarried.
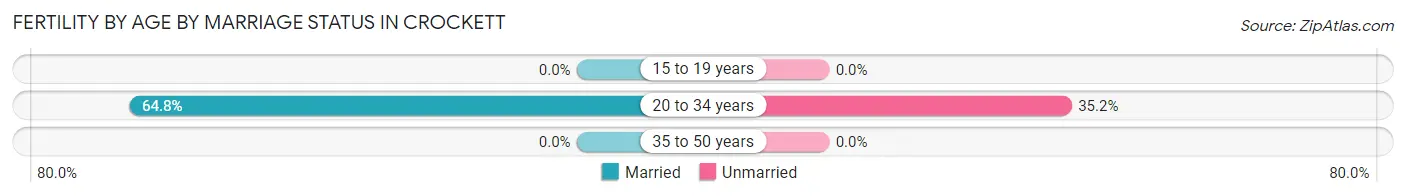
| Age Bracket | Married | Unmarried |
| 15 to 19 years | 0 (0.0%) | 0 (0.0%) |
| 20 to 34 years | 59 (64.8%) | 32 (35.2%) |
| 35 to 50 years | 0 (0.0%) | 0 (0.0%) |
| Total | 59 (64.8%) | 32 (35.2%) |
Fertility by Education in Crockett
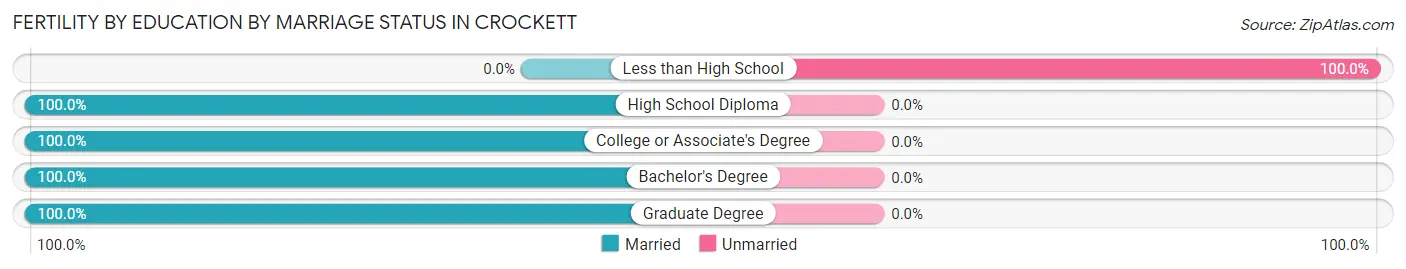
Average fertility rate in Crockett is 64.0 births per 1,000 women. Women with the education attainment of graduate degree have the highest fertility rate of 190.0 births per 1,000 women, while women with the education attainment of college or associate's degree have the lowest fertility at 43.0 births per 1,000 women. Women with the education attainment of less than high school represent 35.2% of all women with births.
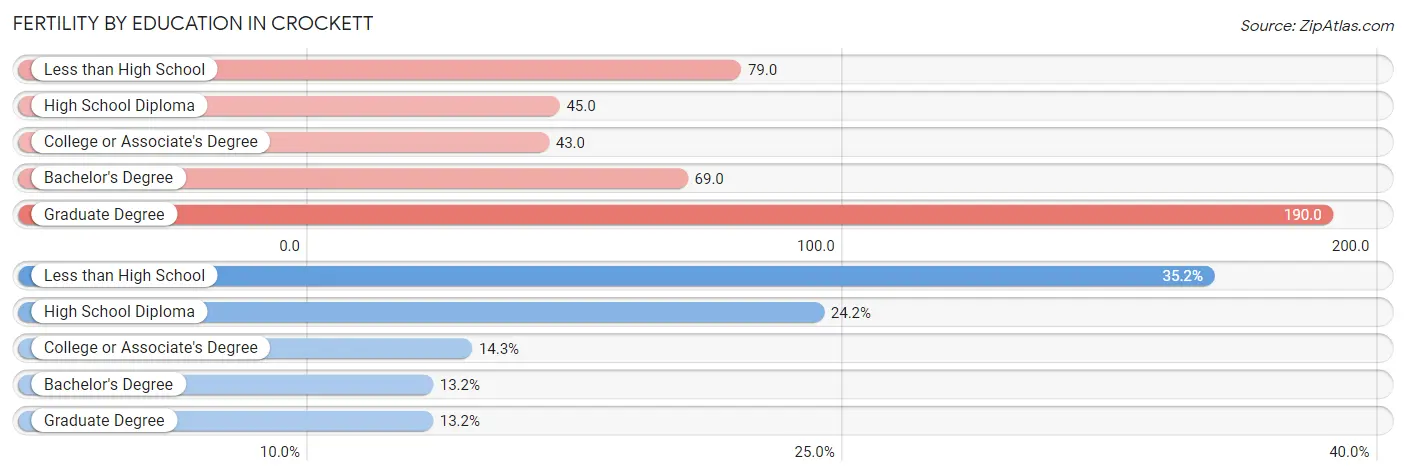
| Educational Attainment | Women with Births | Births / 1,000 Women |
| Less than High School | 32 (35.2%) | 79.0 |
| High School Diploma | 22 (24.2%) | 45.0 |
| College or Associate's Degree | 13 (14.3%) | 43.0 |
| Bachelor's Degree | 12 (13.2%) | 69.0 |
| Graduate Degree | 12 (13.2%) | 190.0 |
| Total | 91 (100.0%) | 64.0 |
Fertility by Education by Marriage Status in Crockett
35.2% of women with births in Crockett are unmarried. Women with the educational attainment of high school diploma are most likely to be married with 100.0% of them married at childbirth, while women with the educational attainment of less than high school are least likely to be married with 100.0% of them unmarried at childbirth.
| Educational Attainment | Married | Unmarried |
| Less than High School | 0 (0.0%) | 32 (100.0%) |
| High School Diploma | 22 (100.0%) | 0 (0.0%) |
| College or Associate's Degree | 13 (100.0%) | 0 (0.0%) |
| Bachelor's Degree | 12 (100.0%) | 0 (0.0%) |
| Graduate Degree | 12 (100.0%) | 0 (0.0%) |
| Total | 59 (64.8%) | 32 (35.2%) |
Employment Characteristics in Crockett
Employment by Class of Employer in Crockett
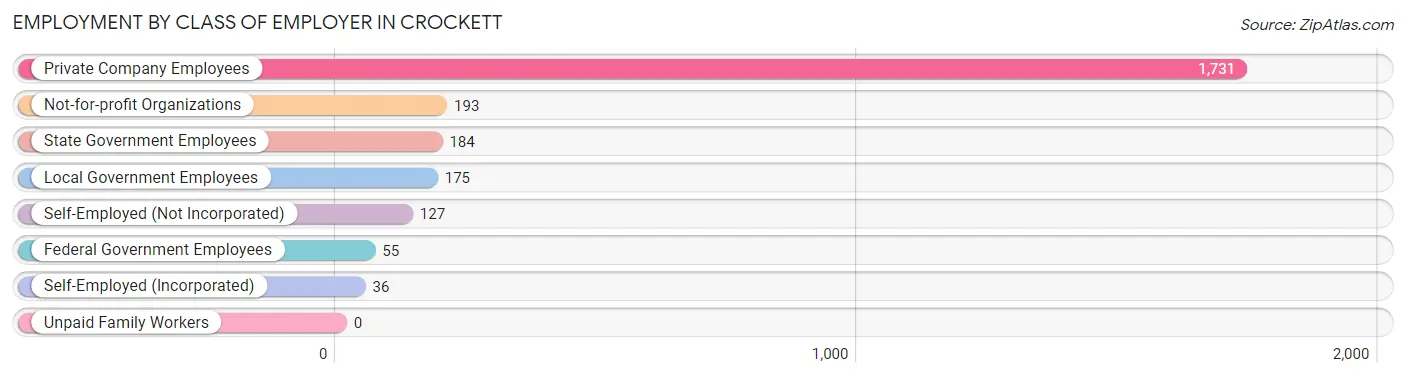
Among the 2,501 employed individuals in Crockett, private company employees (1,731 | 69.2%), not-for-profit organizations (193 | 7.7%), and state government employees (184 | 7.4%) make up the most common classes of employment.
| Employer Class | # Employees | % Employees |
| Private Company Employees | 1,731 | 69.2% |
| Self-Employed (Incorporated) | 36 | 1.4% |
| Self-Employed (Not Incorporated) | 127 | 5.1% |
| Not-for-profit Organizations | 193 | 7.7% |
| Local Government Employees | 175 | 7.0% |
| State Government Employees | 184 | 7.4% |
| Federal Government Employees | 55 | 2.2% |
| Unpaid Family Workers | 0 | 0.0% |
| Total | 2,501 | 100.0% |
Employment Status by Age in Crockett
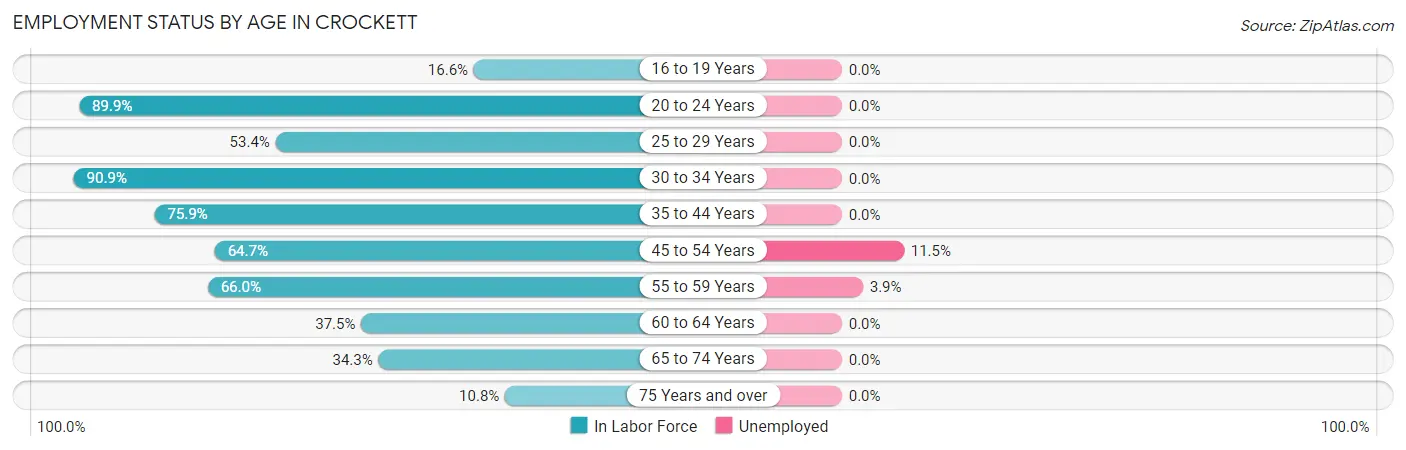
According to the labor force statistics for Crockett, out of the total population over 16 years of age (4,920), 52.9% or 2,603 individuals are in the labor force, with 2.4% or 62 of them unemployed. The age group with the highest labor force participation rate is 30 to 34 years, with 90.9% or 408 individuals in the labor force. Within the labor force, the 45 to 54 years age range has the highest percentage of unemployed individuals, with 11.5% or 49 of them being unemployed.
| Age Bracket | In Labor Force | Unemployed |
| 16 to 19 Years | 74 (16.6%) | 0 (0.0%) |
| 20 to 24 Years | 322 (89.9%) | 0 (0.0%) |
| 25 to 29 Years | 163 (53.4%) | 0 (0.0%) |
| 30 to 34 Years | 408 (90.9%) | 0 (0.0%) |
| 35 to 44 Years | 462 (75.9%) | 0 (0.0%) |
| 45 to 54 Years | 425 (64.7%) | 49 (11.5%) |
| 55 to 59 Years | 334 (66.0%) | 13 (3.9%) |
| 60 to 64 Years | 125 (37.5%) | 0 (0.0%) |
| 65 to 74 Years | 225 (34.3%) | 0 (0.0%) |
| 75 Years and over | 65 (10.8%) | 0 (0.0%) |
| Total | 2,603 (52.9%) | 62 (2.4%) |
Employment Status by Educational Attainment in Crockett
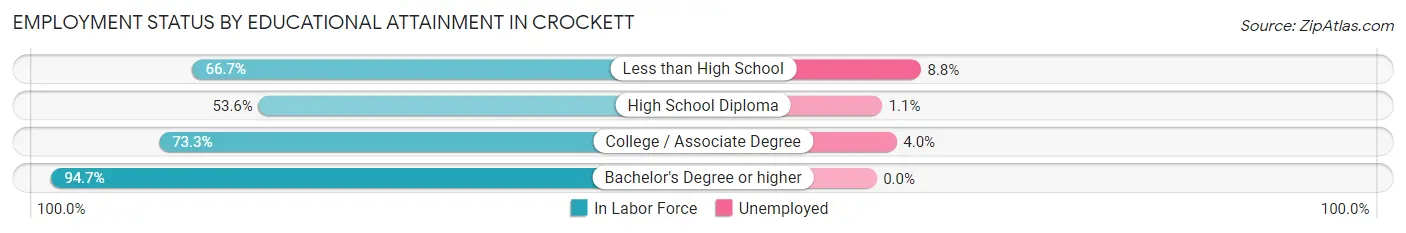
According to labor force statistics for Crockett, 67.1% of individuals (1,918) out of the total population between 25 and 64 years of age (2,859) are in the labor force, with 3.2% or 61 of them being unemployed. The group with the highest labor force participation rate are those with the educational attainment of bachelor's degree or higher, with 94.7% or 413 individuals in the labor force. Within the labor force, individuals with less than high school education have the highest percentage of unemployment, with 8.8% or 37 of them being unemployed.
| Educational Attainment | In Labor Force | Unemployed |
| Less than High School | 421 (66.7%) | 56 (8.8%) |
| High School Diploma | 628 (53.6%) | 13 (1.1%) |
| College / Associate Degree | 455 (73.3%) | 25 (4.0%) |
| Bachelor's Degree or higher | 413 (94.7%) | 0 (0.0%) |
| Total | 1,918 (67.1%) | 91 (3.2%) |
Employment Occupations by Sex in Crockett
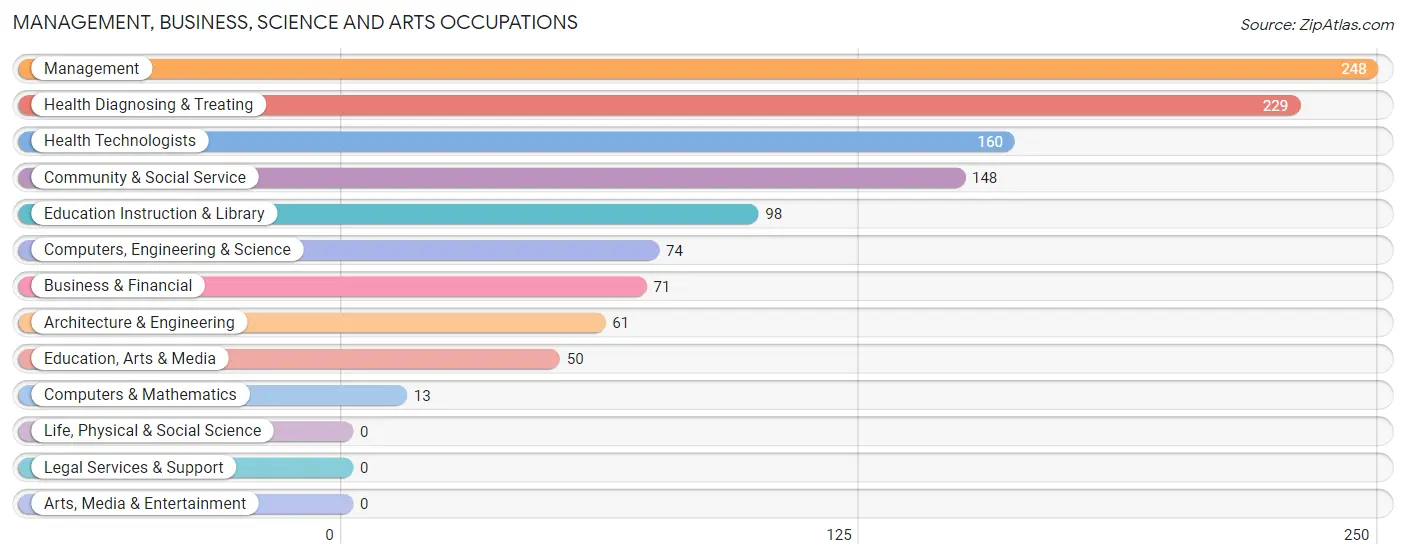
Management, Business, Science and Arts Occupations
The most common Management, Business, Science and Arts occupations in Crockett are Management (248 | 9.8%), Health Diagnosing & Treating (229 | 9.0%), Health Technologists (160 | 6.3%), Community & Social Service (148 | 5.8%), and Education Instruction & Library (98 | 3.9%).
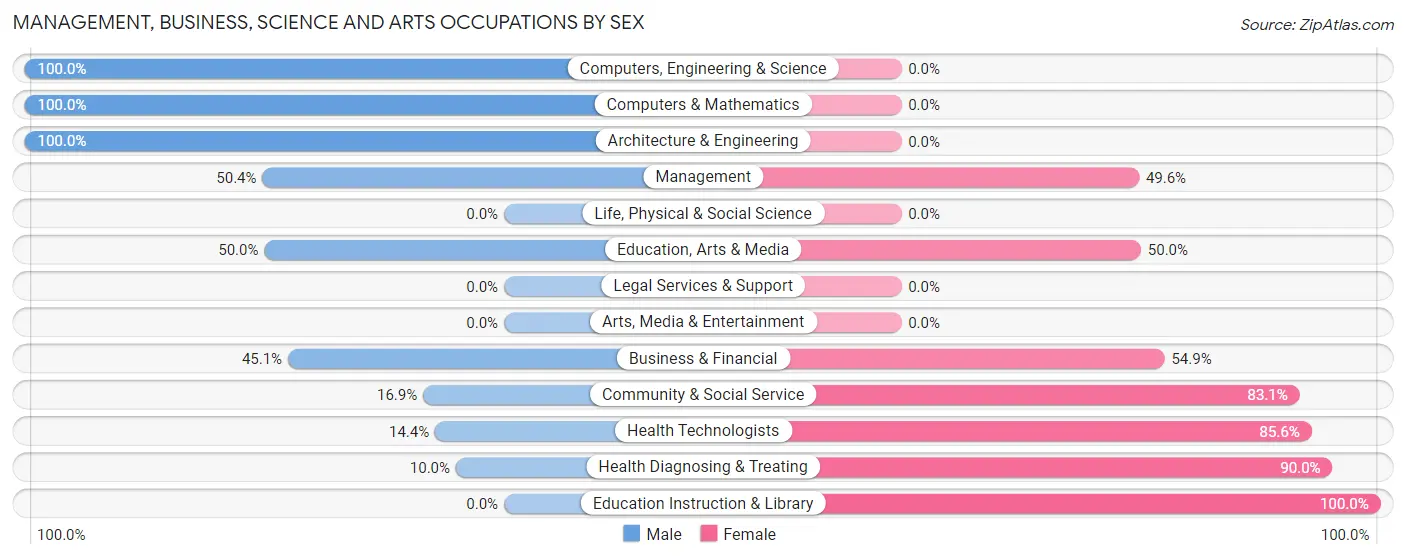
Management, Business, Science and Arts Occupations by Sex
Within the Management, Business, Science and Arts occupations in Crockett, the most male-oriented occupations are Computers, Engineering & Science (100.0%), Computers & Mathematics (100.0%), and Architecture & Engineering (100.0%), while the most female-oriented occupations are Education Instruction & Library (100.0%), Health Diagnosing & Treating (90.0%), and Health Technologists (85.6%).
| Occupation | Male | Female |
| Management | 125 (50.4%) | 123 (49.6%) |
| Business & Financial | 32 (45.1%) | 39 (54.9%) |
| Computers, Engineering & Science | 74 (100.0%) | 0 (0.0%) |
| Computers & Mathematics | 13 (100.0%) | 0 (0.0%) |
| Architecture & Engineering | 61 (100.0%) | 0 (0.0%) |
| Life, Physical & Social Science | 0 (0.0%) | 0 (0.0%) |
| Community & Social Service | 25 (16.9%) | 123 (83.1%) |
| Education, Arts & Media | 25 (50.0%) | 25 (50.0%) |
| Legal Services & Support | 0 (0.0%) | 0 (0.0%) |
| Education Instruction & Library | 0 (0.0%) | 98 (100.0%) |
| Arts, Media & Entertainment | 0 (0.0%) | 0 (0.0%) |
| Health Diagnosing & Treating | 23 (10.0%) | 206 (90.0%) |
| Health Technologists | 23 (14.4%) | 137 (85.6%) |
| Total (Category) | 279 (36.2%) | 491 (63.8%) |
| Total (Overall) | 1,080 (42.5%) | 1,461 (57.5%) |
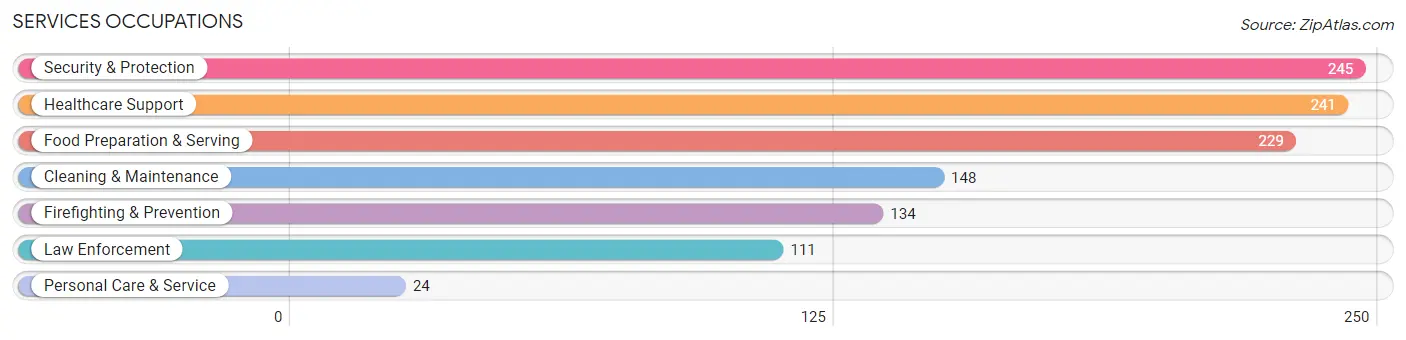
Services Occupations
The most common Services occupations in Crockett are Security & Protection (245 | 9.6%), Healthcare Support (241 | 9.5%), Food Preparation & Serving (229 | 9.0%), Cleaning & Maintenance (148 | 5.8%), and Firefighting & Prevention (134 | 5.3%).
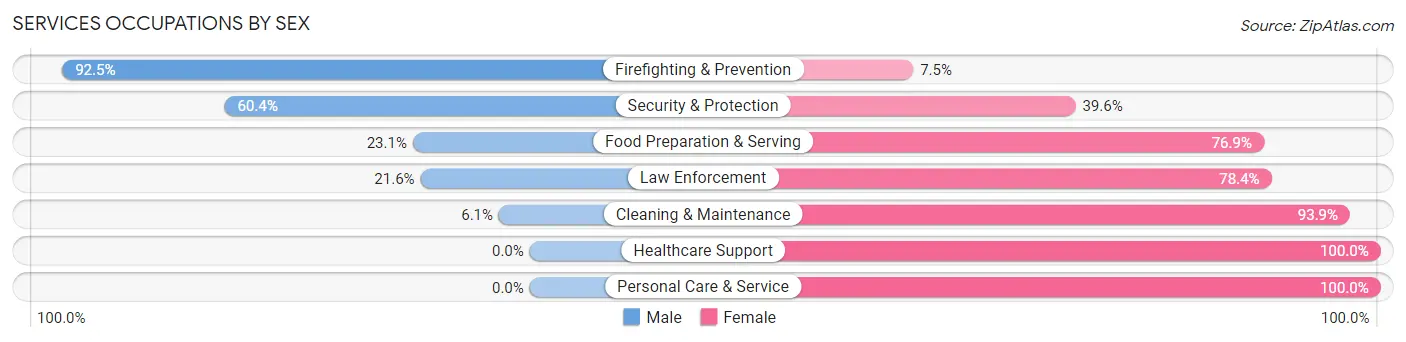
Services Occupations by Sex
Within the Services occupations in Crockett, the most male-oriented occupations are Firefighting & Prevention (92.5%), Security & Protection (60.4%), and Food Preparation & Serving (23.1%), while the most female-oriented occupations are Healthcare Support (100.0%), Personal Care & Service (100.0%), and Cleaning & Maintenance (93.9%).
| Occupation | Male | Female |
| Healthcare Support | 0 (0.0%) | 241 (100.0%) |
| Security & Protection | 148 (60.4%) | 97 (39.6%) |
| Firefighting & Prevention | 124 (92.5%) | 10 (7.5%) |
| Law Enforcement | 24 (21.6%) | 87 (78.4%) |
| Food Preparation & Serving | 53 (23.1%) | 176 (76.9%) |
| Cleaning & Maintenance | 9 (6.1%) | 139 (93.9%) |
| Personal Care & Service | 0 (0.0%) | 24 (100.0%) |
| Total (Category) | 210 (23.7%) | 677 (76.3%) |
| Total (Overall) | 1,080 (42.5%) | 1,461 (57.5%) |
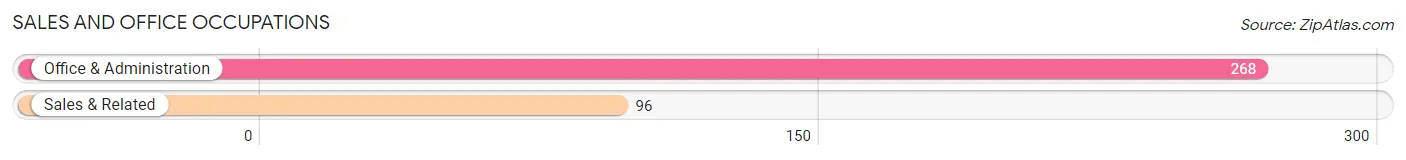
Sales and Office Occupations
The most common Sales and Office occupations in Crockett are Office & Administration (268 | 10.5%), and Sales & Related (96 | 3.8%).
Sales and Office Occupations by Sex
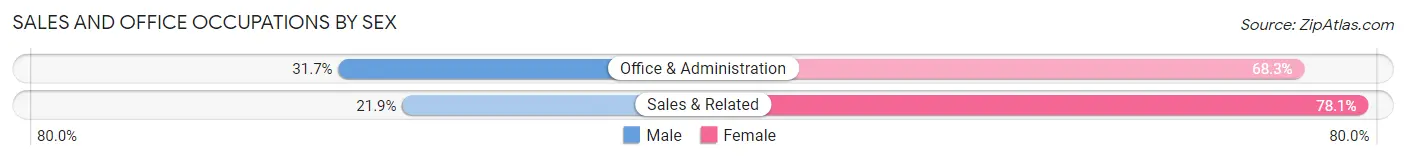
| Occupation | Male | Female |
| Sales & Related | 21 (21.9%) | 75 (78.1%) |
| Office & Administration | 85 (31.7%) | 183 (68.3%) |
| Total (Category) | 106 (29.1%) | 258 (70.9%) |
| Total (Overall) | 1,080 (42.5%) | 1,461 (57.5%) |
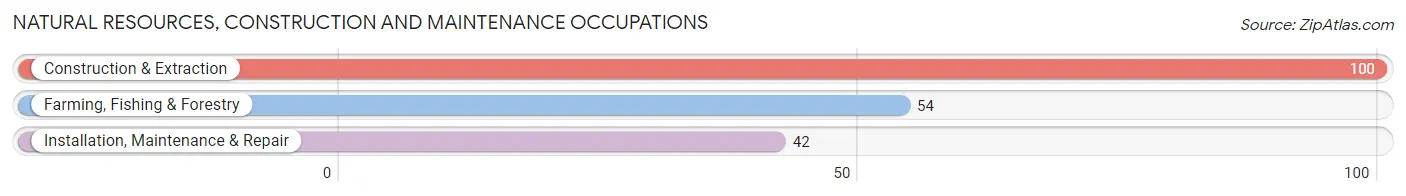
Natural Resources, Construction and Maintenance Occupations
The most common Natural Resources, Construction and Maintenance occupations in Crockett are Construction & Extraction (100 | 3.9%), Farming, Fishing & Forestry (54 | 2.1%), and Installation, Maintenance & Repair (42 | 1.7%).
Natural Resources, Construction and Maintenance Occupations by Sex
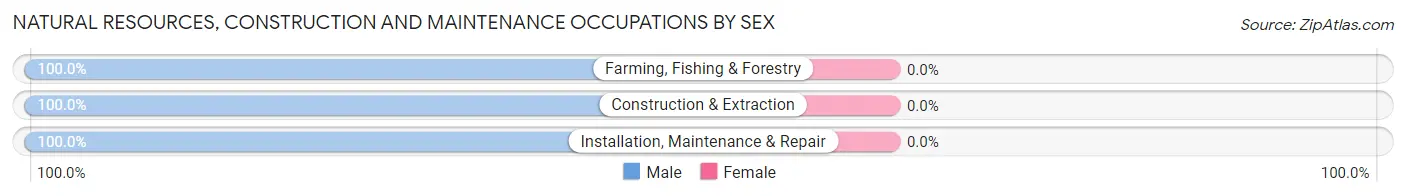
| Occupation | Male | Female |
| Farming, Fishing & Forestry | 54 (100.0%) | 0 (0.0%) |
| Construction & Extraction | 100 (100.0%) | 0 (0.0%) |
| Installation, Maintenance & Repair | 42 (100.0%) | 0 (0.0%) |
| Total (Category) | 196 (100.0%) | 0 (0.0%) |
| Total (Overall) | 1,080 (42.5%) | 1,461 (57.5%) |
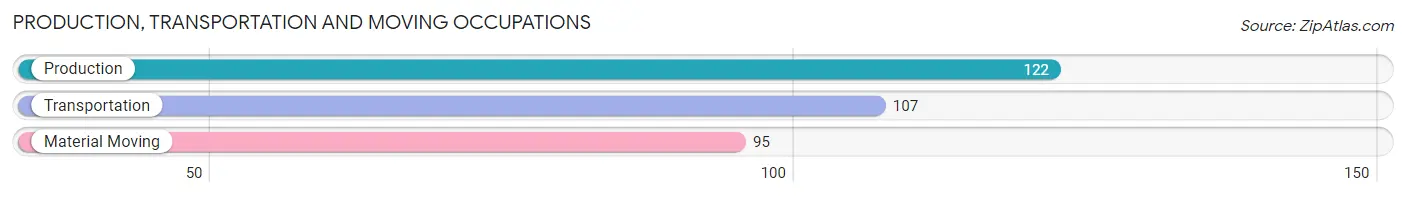
Production, Transportation and Moving Occupations
The most common Production, Transportation and Moving occupations in Crockett are Production (122 | 4.8%), Transportation (107 | 4.2%), and Material Moving (95 | 3.7%).
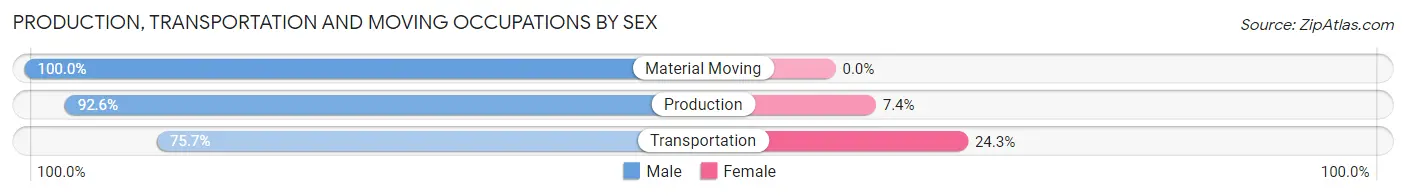
Production, Transportation and Moving Occupations by Sex
| Occupation | Male | Female |
| Production | 113 (92.6%) | 9 (7.4%) |
| Transportation | 81 (75.7%) | 26 (24.3%) |
| Material Moving | 95 (100.0%) | 0 (0.0%) |
| Total (Category) | 289 (89.2%) | 35 (10.8%) |
| Total (Overall) | 1,080 (42.5%) | 1,461 (57.5%) |
Employment Industries by Sex in Crockett
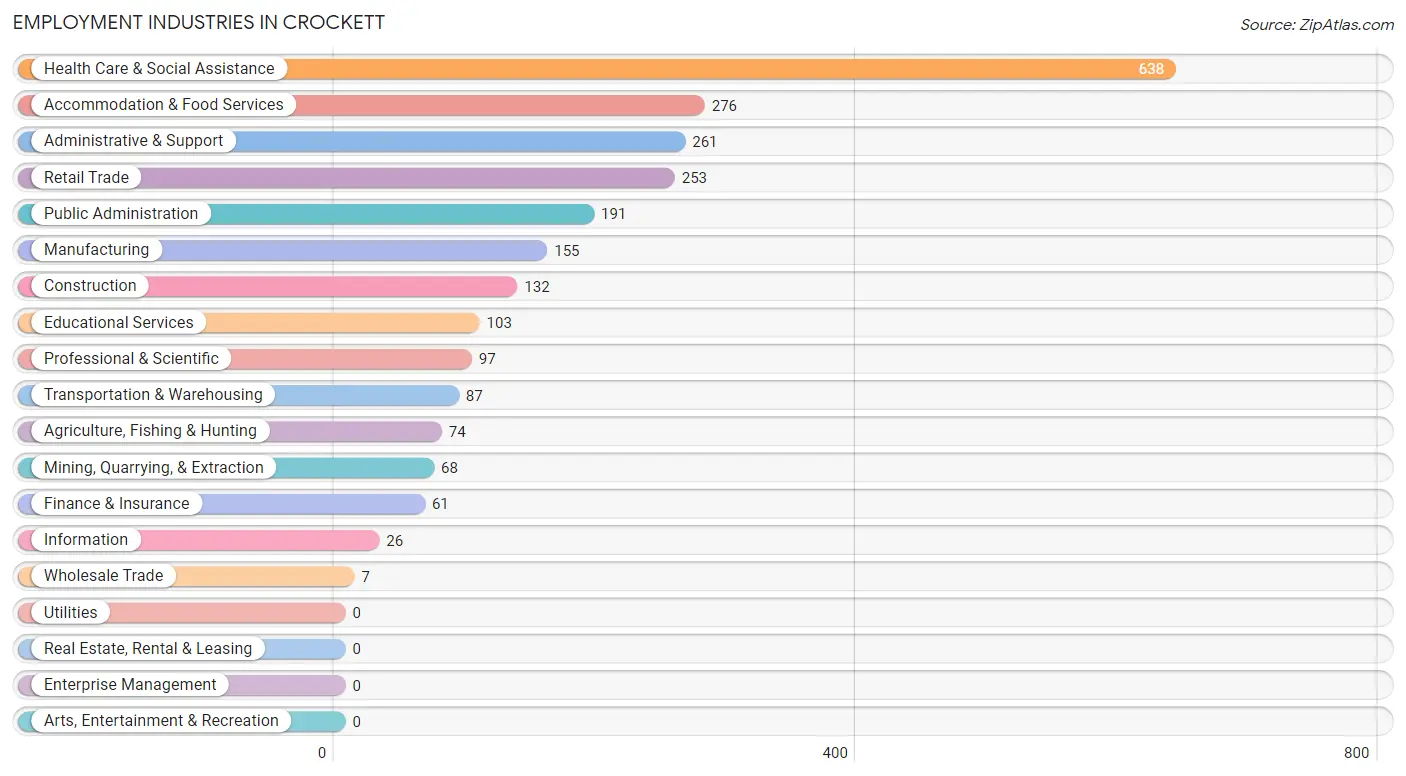
Employment Industries in Crockett
The major employment industries in Crockett include Health Care & Social Assistance (638 | 25.1%), Accommodation & Food Services (276 | 10.9%), Administrative & Support (261 | 10.3%), Retail Trade (253 | 10.0%), and Public Administration (191 | 7.5%).
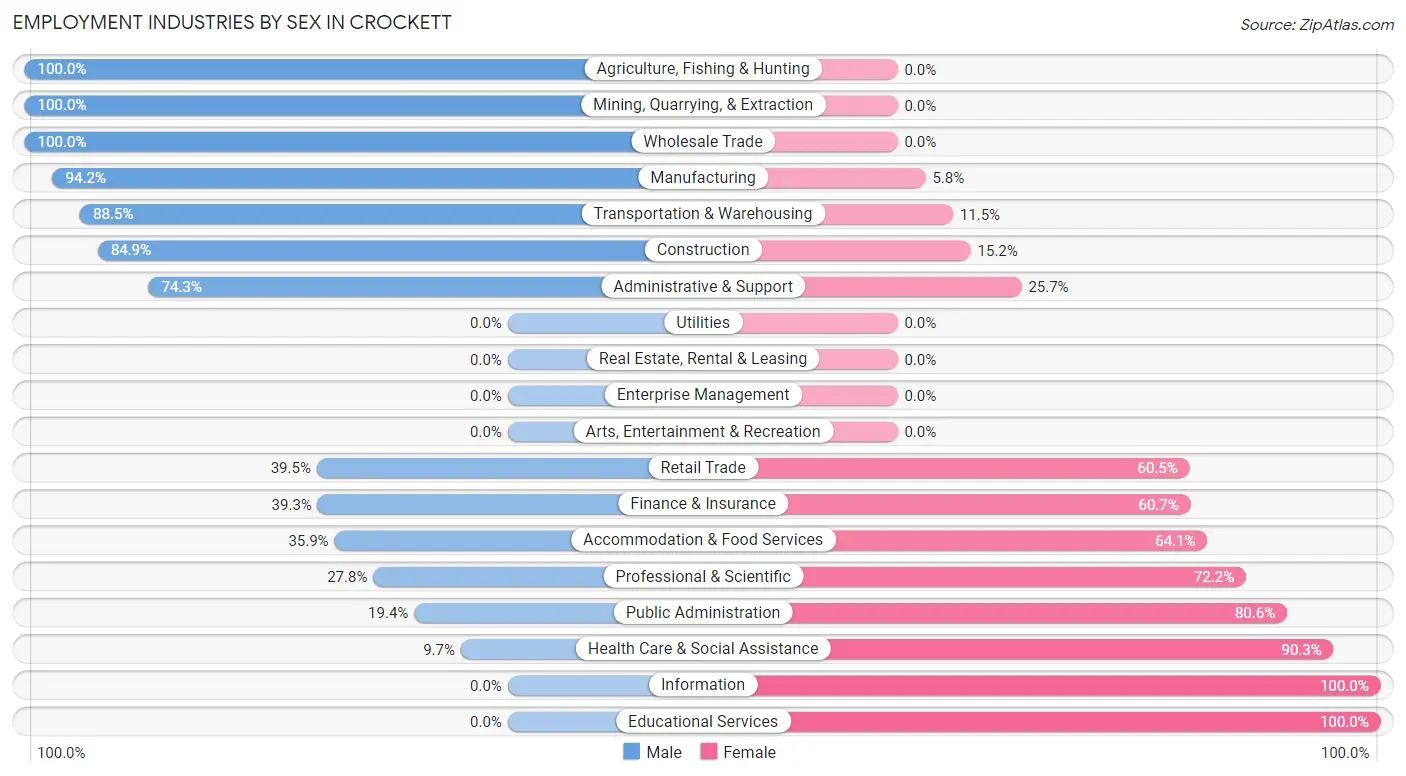
Employment Industries by Sex in Crockett
The Crockett industries that see more men than women are Agriculture, Fishing & Hunting (100.0%), Mining, Quarrying, & Extraction (100.0%), and Wholesale Trade (100.0%), whereas the industries that tend to have a higher number of women are Information (100.0%), Educational Services (100.0%), and Health Care & Social Assistance (90.3%).
| Industry | Male | Female |
| Agriculture, Fishing & Hunting | 74 (100.0%) | 0 (0.0%) |
| Mining, Quarrying, & Extraction | 68 (100.0%) | 0 (0.0%) |
| Construction | 112 (84.9%) | 20 (15.1%) |
| Manufacturing | 146 (94.2%) | 9 (5.8%) |
| Wholesale Trade | 7 (100.0%) | 0 (0.0%) |
| Retail Trade | 100 (39.5%) | 153 (60.5%) |
| Transportation & Warehousing | 77 (88.5%) | 10 (11.5%) |
| Utilities | 0 (0.0%) | 0 (0.0%) |
| Information | 0 (0.0%) | 26 (100.0%) |
| Finance & Insurance | 24 (39.3%) | 37 (60.7%) |
| Real Estate, Rental & Leasing | 0 (0.0%) | 0 (0.0%) |
| Professional & Scientific | 27 (27.8%) | 70 (72.2%) |
| Enterprise Management | 0 (0.0%) | 0 (0.0%) |
| Administrative & Support | 194 (74.3%) | 67 (25.7%) |
| Educational Services | 0 (0.0%) | 103 (100.0%) |
| Health Care & Social Assistance | 62 (9.7%) | 576 (90.3%) |
| Arts, Entertainment & Recreation | 0 (0.0%) | 0 (0.0%) |
| Accommodation & Food Services | 99 (35.9%) | 177 (64.1%) |
| Public Administration | 37 (19.4%) | 154 (80.6%) |
| Total | 1,080 (42.5%) | 1,461 (57.5%) |
Education in Crockett
School Enrollment in Crockett
The most common levels of schooling among the 1,555 students in Crockett are high school (409 | 26.3%), elementary school (356 | 22.9%), and middle school (297 | 19.1%).
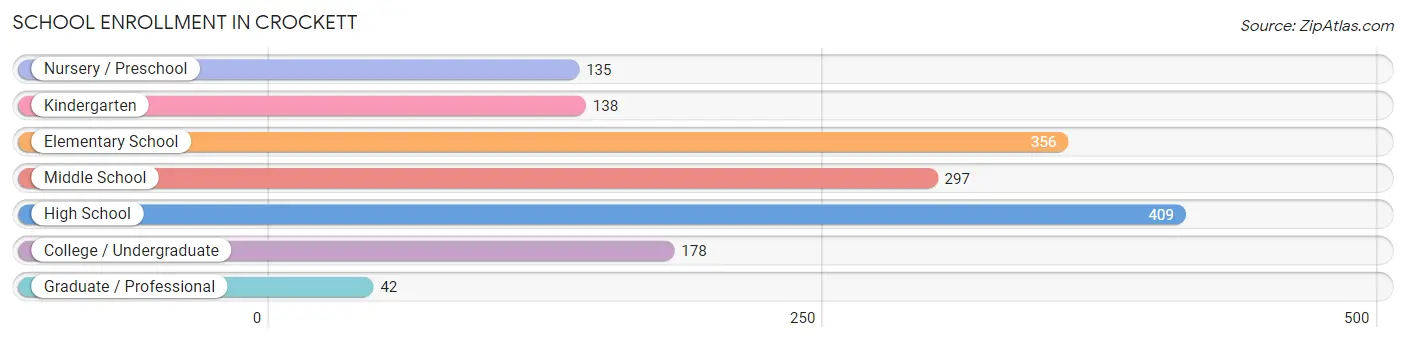
| School Level | # Students | % Students |
| Nursery / Preschool | 135 | 8.7% |
| Kindergarten | 138 | 8.9% |
| Elementary School | 356 | 22.9% |
| Middle School | 297 | 19.1% |
| High School | 409 | 26.3% |
| College / Undergraduate | 178 | 11.5% |
| Graduate / Professional | 42 | 2.7% |
| Total | 1,555 | 100.0% |
School Enrollment by Age by Funding Source in Crockett
Out of a total of 1,555 students who are enrolled in schools in Crockett, 72 (4.6%) attend a private institution, while the remaining 1,483 (95.4%) are enrolled in public schools. The age group of 25 to 34 year olds has the highest likelihood of being enrolled in private schools, with 18 (64.3% in the age bracket) enrolled. Conversely, the age group of 3 to 4 year olds has the lowest likelihood of being enrolled in a private school, with 79 (100.0% in the age bracket) attending a public institution.
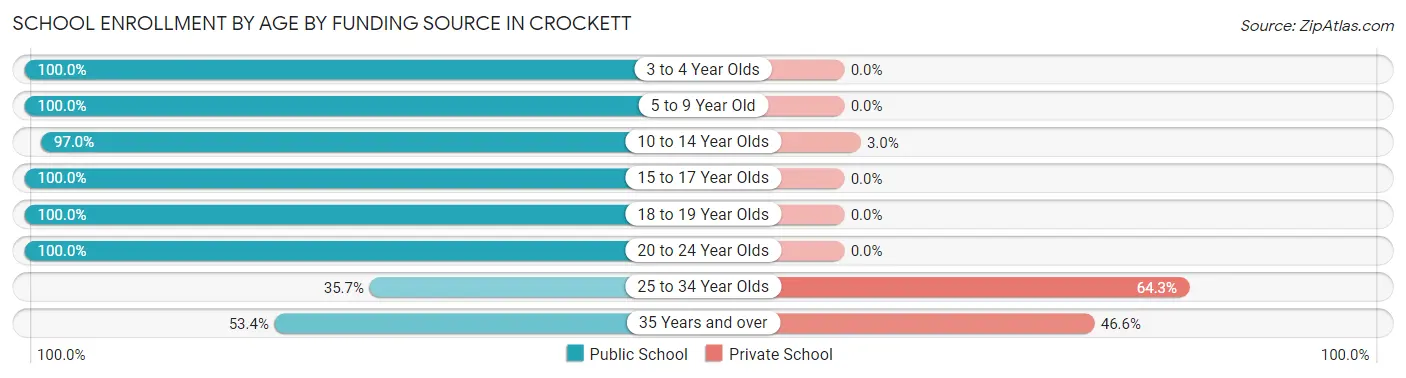
| Age Bracket | Public School | Private School |
| 3 to 4 Year Olds | 79 (100.0%) | 0 (0.0%) |
| 5 to 9 Year Old | 509 (100.0%) | 0 (0.0%) |
| 10 to 14 Year Olds | 414 (97.0%) | 13 (3.0%) |
| 15 to 17 Year Olds | 224 (100.0%) | 0 (0.0%) |
| 18 to 19 Year Olds | 160 (100.0%) | 0 (0.0%) |
| 20 to 24 Year Olds | 40 (100.0%) | 0 (0.0%) |
| 25 to 34 Year Olds | 10 (35.7%) | 18 (64.3%) |
| 35 Years and over | 47 (53.4%) | 41 (46.6%) |
| Total | 1,483 (95.4%) | 72 (4.6%) |
Educational Attainment by Field of Study in Crockett
Science & technology (201 | 30.3%), education (118 | 17.8%), business (81 | 12.2%), bio, nature & agricultural (57 | 8.6%), and arts & humanities (42 | 6.3%) are the most common fields of study among 663 individuals in Crockett who have obtained a bachelor's degree or higher.
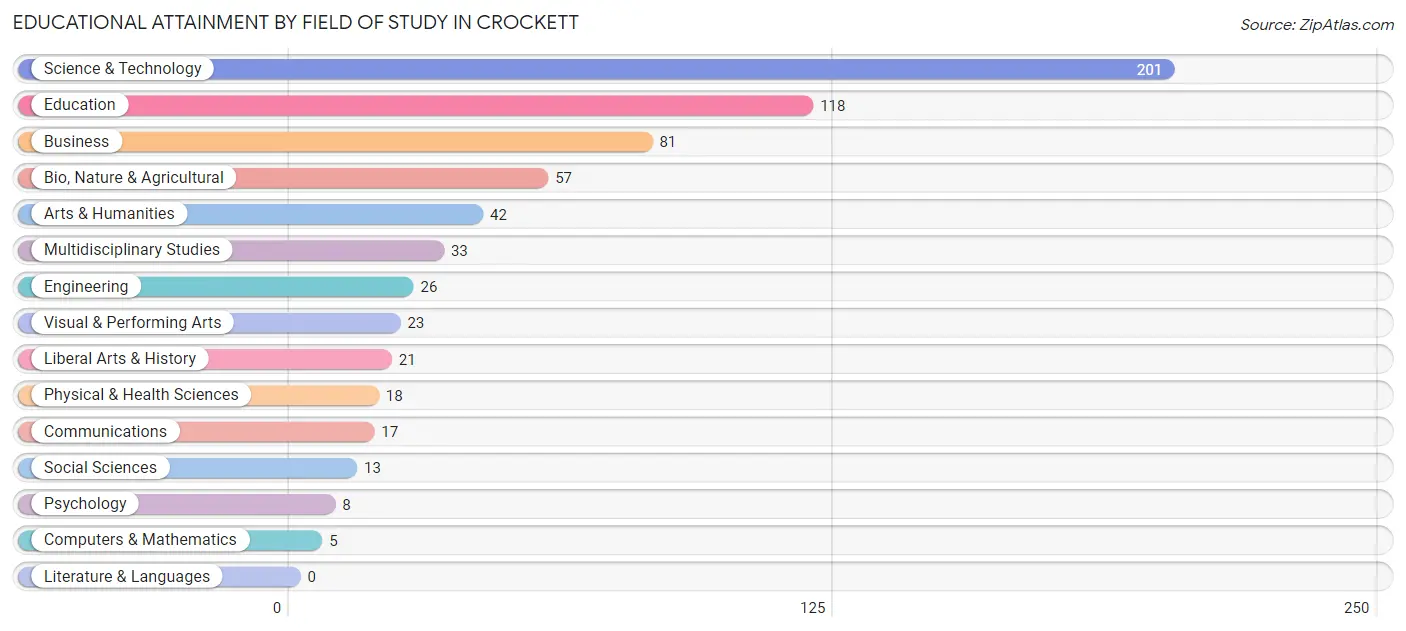
| Field of Study | # Graduates | % Graduates |
| Computers & Mathematics | 5 | 0.7% |
| Bio, Nature & Agricultural | 57 | 8.6% |
| Physical & Health Sciences | 18 | 2.7% |
| Psychology | 8 | 1.2% |
| Social Sciences | 13 | 2.0% |
| Engineering | 26 | 3.9% |
| Multidisciplinary Studies | 33 | 5.0% |
| Science & Technology | 201 | 30.3% |
| Business | 81 | 12.2% |
| Education | 118 | 17.8% |
| Literature & Languages | 0 | 0.0% |
| Liberal Arts & History | 21 | 3.2% |
| Visual & Performing Arts | 23 | 3.5% |
| Communications | 17 | 2.6% |
| Arts & Humanities | 42 | 6.3% |
| Total | 663 | 100.0% |
Transportation & Commute in Crockett
Vehicle Availability by Sex in Crockett
The most prevalent vehicle ownership categories in Crockett are males with 2 vehicles (465, accounting for 43.9%) and females with 2 vehicles (445, making up 32.3%).
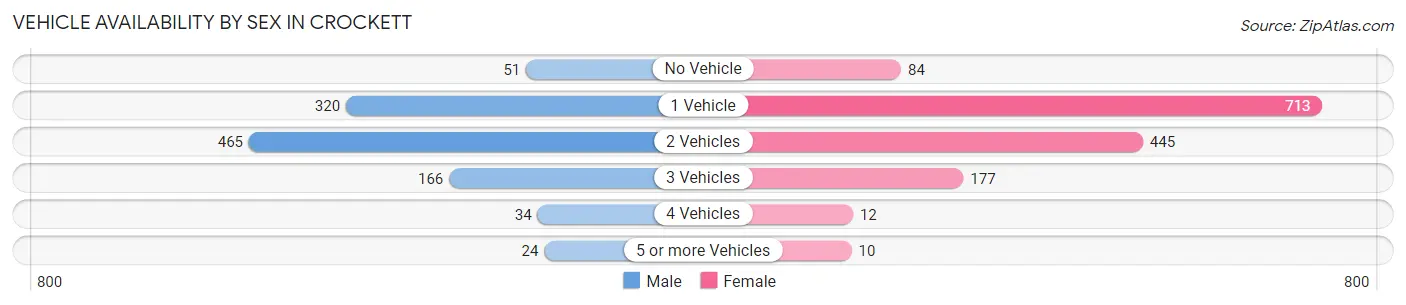
| Vehicles Available | Male | Female |
| No Vehicle | 51 (4.8%) | 84 (5.8%) |
| 1 Vehicle | 320 (30.2%) | 713 (49.5%) |
| 2 Vehicles | 465 (43.9%) | 445 (30.9%) |
| 3 Vehicles | 166 (15.7%) | 177 (12.3%) |
| 4 Vehicles | 34 (3.2%) | 12 (0.8%) |
| 5 or more Vehicles | 24 (2.3%) | 10 (0.7%) |
| Total | 1,060 (100.0%) | 1,441 (100.0%) |
Commute Time in Crockett
The most frequently occuring commute durations in Crockett are 5 to 9 minutes (676 commuters, 27.6%), 10 to 14 minutes (566 commuters, 23.1%), and 45 to 59 minutes (335 commuters, 13.7%).
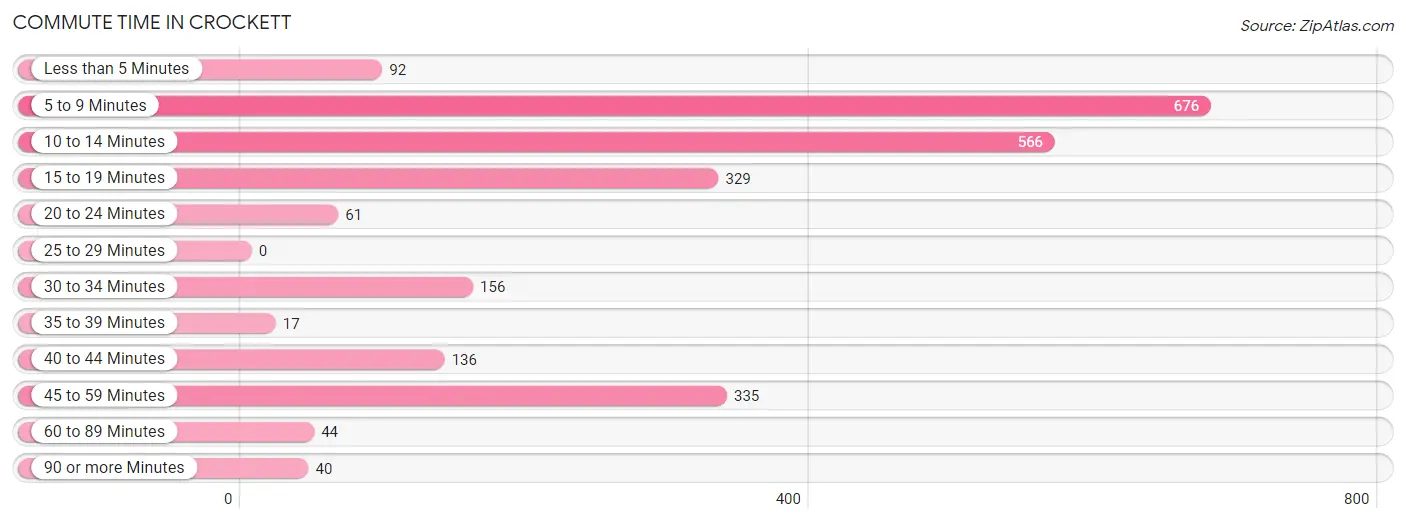
| Commute Time | # Commuters | % Commuters |
| Less than 5 Minutes | 92 | 3.7% |
| 5 to 9 Minutes | 676 | 27.6% |
| 10 to 14 Minutes | 566 | 23.1% |
| 15 to 19 Minutes | 329 | 13.4% |
| 20 to 24 Minutes | 61 | 2.5% |
| 25 to 29 Minutes | 0 | 0.0% |
| 30 to 34 Minutes | 156 | 6.4% |
| 35 to 39 Minutes | 17 | 0.7% |
| 40 to 44 Minutes | 136 | 5.6% |
| 45 to 59 Minutes | 335 | 13.7% |
| 60 to 89 Minutes | 44 | 1.8% |
| 90 or more Minutes | 40 | 1.6% |
Commute Time by Sex in Crockett
The most common commute times in Crockett are 5 to 9 minutes (246 commuters, 23.9%) for males and 5 to 9 minutes (430 commuters, 30.3%) for females.
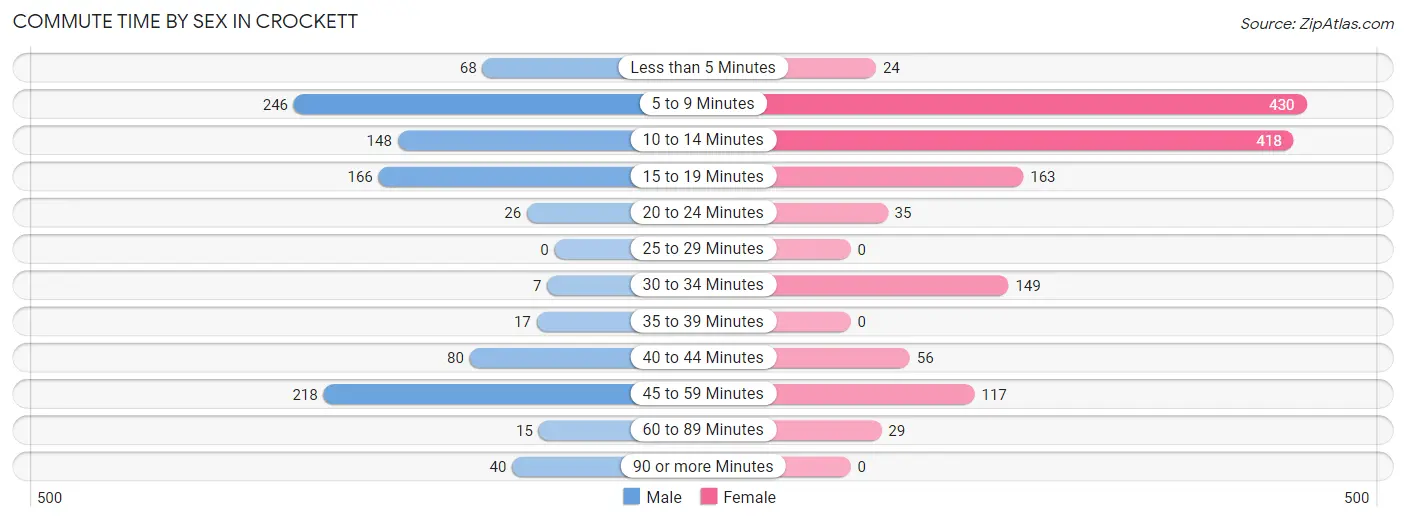
| Commute Time | Male | Female |
| Less than 5 Minutes | 68 (6.6%) | 24 (1.7%) |
| 5 to 9 Minutes | 246 (23.9%) | 430 (30.3%) |
| 10 to 14 Minutes | 148 (14.3%) | 418 (29.4%) |
| 15 to 19 Minutes | 166 (16.1%) | 163 (11.5%) |
| 20 to 24 Minutes | 26 (2.5%) | 35 (2.5%) |
| 25 to 29 Minutes | 0 (0.0%) | 0 (0.0%) |
| 30 to 34 Minutes | 7 (0.7%) | 149 (10.5%) |
| 35 to 39 Minutes | 17 (1.7%) | 0 (0.0%) |
| 40 to 44 Minutes | 80 (7.8%) | 56 (3.9%) |
| 45 to 59 Minutes | 218 (21.1%) | 117 (8.2%) |
| 60 to 89 Minutes | 15 (1.5%) | 29 (2.0%) |
| 90 or more Minutes | 40 (3.9%) | 0 (0.0%) |
Time of Departure to Work by Sex in Crockett
The most frequent times of departure to work in Crockett are 12:00 AM to 4:59 AM (252, 24.4%) for males and 7:00 AM to 7:29 AM (279, 19.6%) for females.
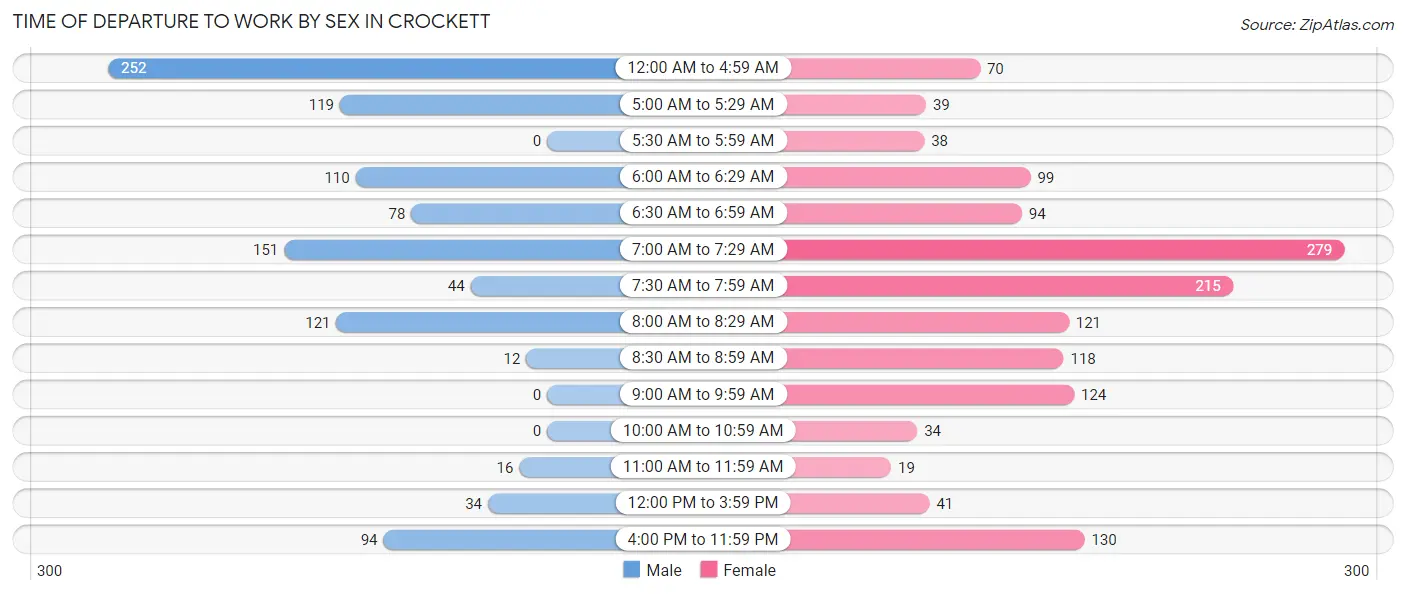
| Time of Departure | Male | Female |
| 12:00 AM to 4:59 AM | 252 (24.4%) | 70 (4.9%) |
| 5:00 AM to 5:29 AM | 119 (11.5%) | 39 (2.7%) |
| 5:30 AM to 5:59 AM | 0 (0.0%) | 38 (2.7%) |
| 6:00 AM to 6:29 AM | 110 (10.7%) | 99 (7.0%) |
| 6:30 AM to 6:59 AM | 78 (7.6%) | 94 (6.6%) |
| 7:00 AM to 7:29 AM | 151 (14.6%) | 279 (19.6%) |
| 7:30 AM to 7:59 AM | 44 (4.3%) | 215 (15.1%) |
| 8:00 AM to 8:29 AM | 121 (11.7%) | 121 (8.5%) |
| 8:30 AM to 8:59 AM | 12 (1.2%) | 118 (8.3%) |
| 9:00 AM to 9:59 AM | 0 (0.0%) | 124 (8.7%) |
| 10:00 AM to 10:59 AM | 0 (0.0%) | 34 (2.4%) |
| 11:00 AM to 11:59 AM | 16 (1.5%) | 19 (1.3%) |
| 12:00 PM to 3:59 PM | 34 (3.3%) | 41 (2.9%) |
| 4:00 PM to 11:59 PM | 94 (9.1%) | 130 (9.1%) |
| Total | 1,031 (100.0%) | 1,421 (100.0%) |
Housing Occupancy in Crockett
Occupancy by Ownership in Crockett
Of the total 2,368 dwellings in Crockett, owner-occupied units account for 1,101 (46.5%), while renter-occupied units make up 1,267 (53.5%).
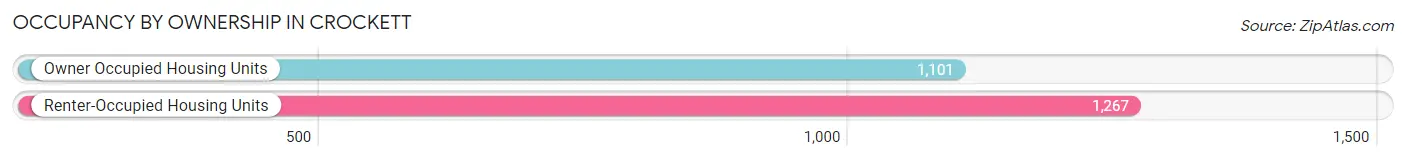
| Occupancy | # Housing Units | % Housing Units |
| Owner Occupied Housing Units | 1,101 | 46.5% |
| Renter-Occupied Housing Units | 1,267 | 53.5% |
| Total Occupied Housing Units | 2,368 | 100.0% |
Occupancy by Household Size in Crockett
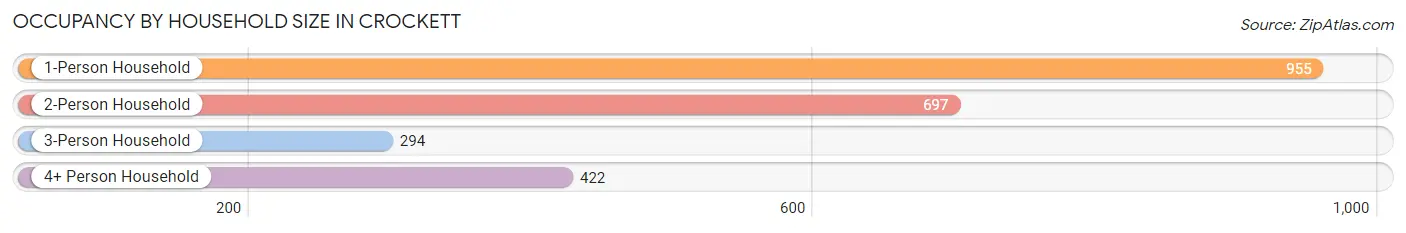
| Household Size | # Housing Units | % Housing Units |
| 1-Person Household | 955 | 40.3% |
| 2-Person Household | 697 | 29.4% |
| 3-Person Household | 294 | 12.4% |
| 4+ Person Household | 422 | 17.8% |
| Total Housing Units | 2,368 | 100.0% |
Occupancy by Ownership by Household Size in Crockett
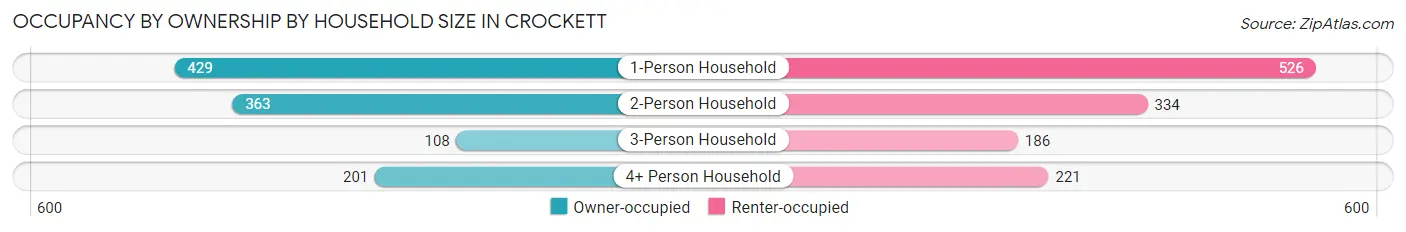
| Household Size | Owner-occupied | Renter-occupied |
| 1-Person Household | 429 (44.9%) | 526 (55.1%) |
| 2-Person Household | 363 (52.1%) | 334 (47.9%) |
| 3-Person Household | 108 (36.7%) | 186 (63.3%) |
| 4+ Person Household | 201 (47.6%) | 221 (52.4%) |
| Total Housing Units | 1,101 (46.5%) | 1,267 (53.5%) |
Occupancy by Educational Attainment in Crockett
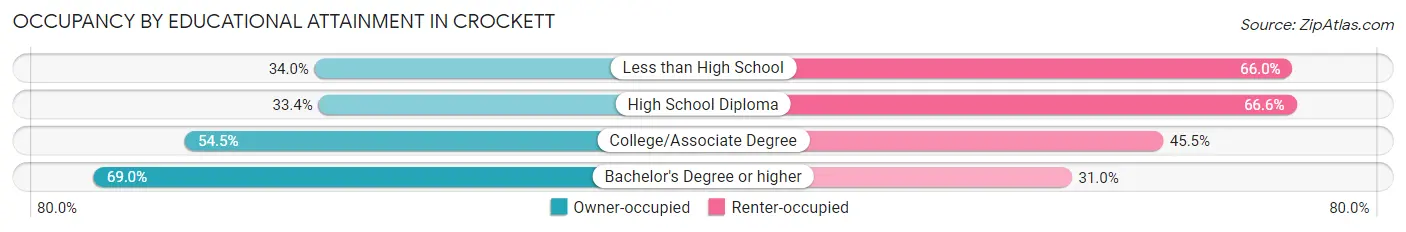
| Household Size | Owner-occupied | Renter-occupied |
| Less than High School | 156 (34.0%) | 303 (66.0%) |
| High School Diploma | 265 (33.4%) | 529 (66.6%) |
| College/Associate Degree | 337 (54.5%) | 281 (45.5%) |
| Bachelor's Degree or higher | 343 (69.0%) | 154 (31.0%) |
Occupancy by Age of Householder in Crockett
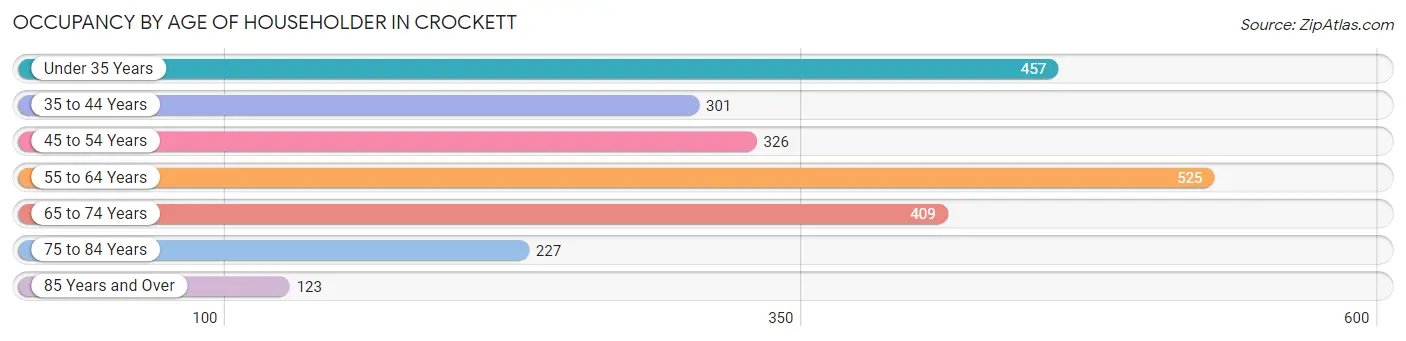
| Age Bracket | # Households | % Households |
| Under 35 Years | 457 | 19.3% |
| 35 to 44 Years | 301 | 12.7% |
| 45 to 54 Years | 326 | 13.8% |
| 55 to 64 Years | 525 | 22.2% |
| 65 to 74 Years | 409 | 17.3% |
| 75 to 84 Years | 227 | 9.6% |
| 85 Years and Over | 123 | 5.2% |
| Total | 2,368 | 100.0% |
Housing Finances in Crockett
Median Income by Occupancy in Crockett
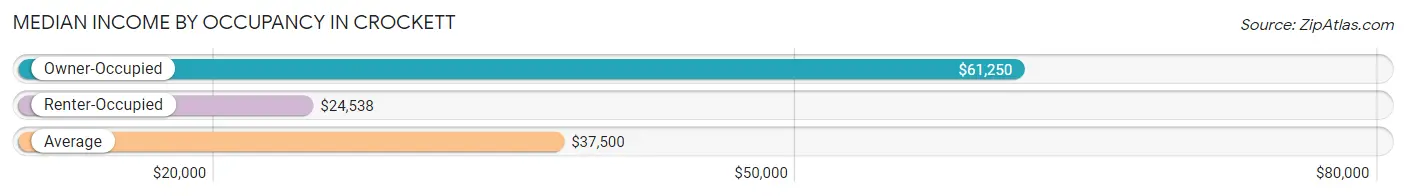
| Occupancy Type | # Households | Median Income |
| Owner-Occupied | 1,101 (46.5%) | $61,250 |
| Renter-Occupied | 1,267 (53.5%) | $24,538 |
| Average | 2,368 (100.0%) | $37,500 |
Occupancy by Householder Income Bracket in Crockett
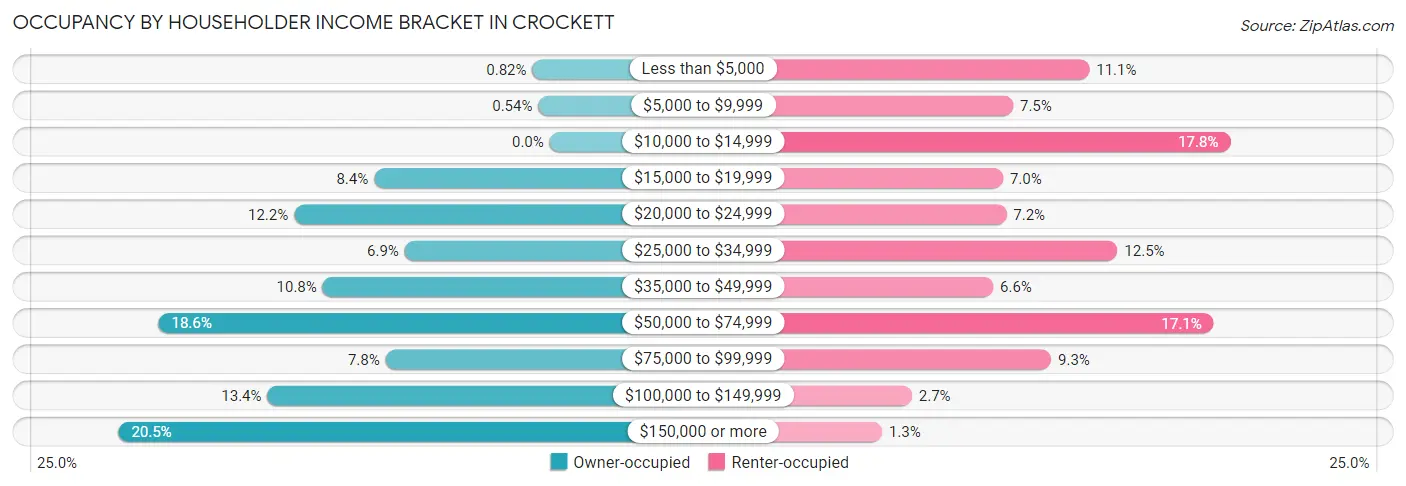
| Income Bracket | Owner-occupied | Renter-occupied |
| Less than $5,000 | 9 (0.8%) | 141 (11.1%) |
| $5,000 to $9,999 | 6 (0.5%) | 95 (7.5%) |
| $10,000 to $14,999 | 0 (0.0%) | 226 (17.8%) |
| $15,000 to $19,999 | 92 (8.4%) | 89 (7.0%) |
| $20,000 to $24,999 | 134 (12.2%) | 91 (7.2%) |
| $25,000 to $34,999 | 76 (6.9%) | 158 (12.5%) |
| $35,000 to $49,999 | 119 (10.8%) | 83 (6.6%) |
| $50,000 to $74,999 | 205 (18.6%) | 216 (17.1%) |
| $75,000 to $99,999 | 86 (7.8%) | 118 (9.3%) |
| $100,000 to $149,999 | 148 (13.4%) | 34 (2.7%) |
| $150,000 or more | 226 (20.5%) | 16 (1.3%) |
| Total | 1,101 (100.0%) | 1,267 (100.0%) |
Monthly Housing Cost Tiers in Crockett
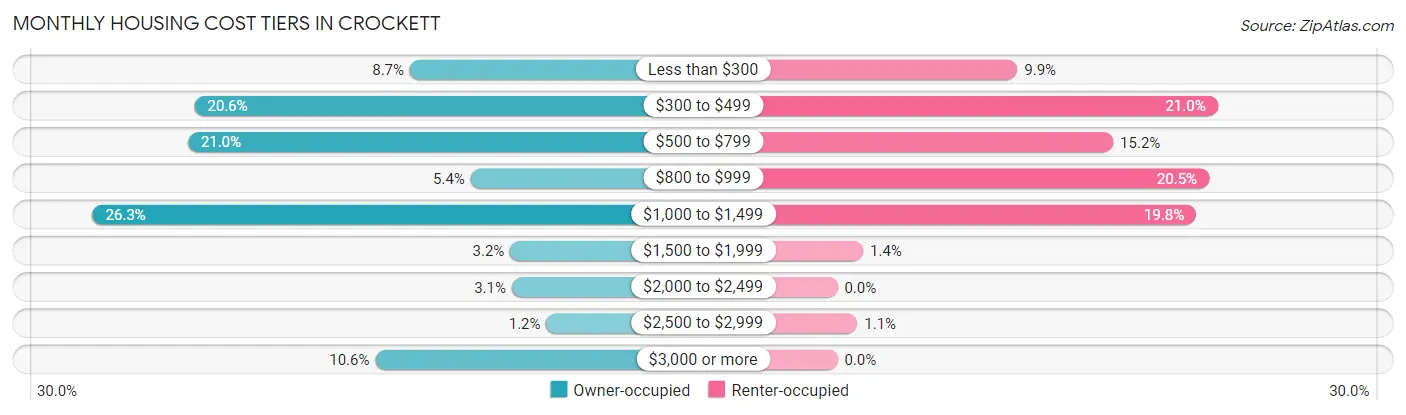
| Monthly Cost | Owner-occupied | Renter-occupied |
| Less than $300 | 96 (8.7%) | 126 (9.9%) |
| $300 to $499 | 227 (20.6%) | 266 (21.0%) |
| $500 to $799 | 231 (21.0%) | 193 (15.2%) |
| $800 to $999 | 59 (5.4%) | 260 (20.5%) |
| $1,000 to $1,499 | 289 (26.3%) | 251 (19.8%) |
| $1,500 to $1,999 | 35 (3.2%) | 18 (1.4%) |
| $2,000 to $2,499 | 34 (3.1%) | 0 (0.0%) |
| $2,500 to $2,999 | 13 (1.2%) | 14 (1.1%) |
| $3,000 or more | 117 (10.6%) | 0 (0.0%) |
| Total | 1,101 (100.0%) | 1,267 (100.0%) |
Physical Housing Characteristics in Crockett
Housing Structures in Crockett
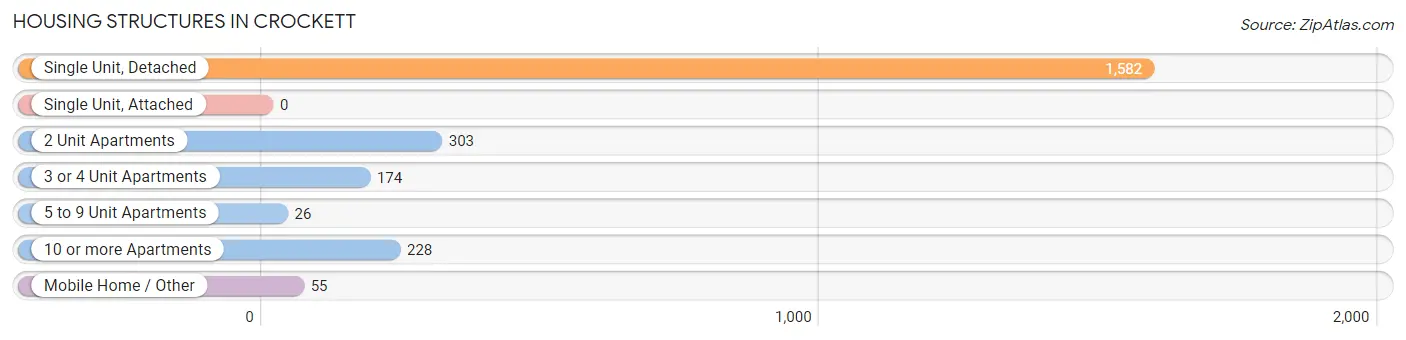
| Structure Type | # Housing Units | % Housing Units |
| Single Unit, Detached | 1,582 | 66.8% |
| Single Unit, Attached | 0 | 0.0% |
| 2 Unit Apartments | 303 | 12.8% |
| 3 or 4 Unit Apartments | 174 | 7.3% |
| 5 to 9 Unit Apartments | 26 | 1.1% |
| 10 or more Apartments | 228 | 9.6% |
| Mobile Home / Other | 55 | 2.3% |
| Total | 2,368 | 100.0% |
Housing Structures by Occupancy in Crockett
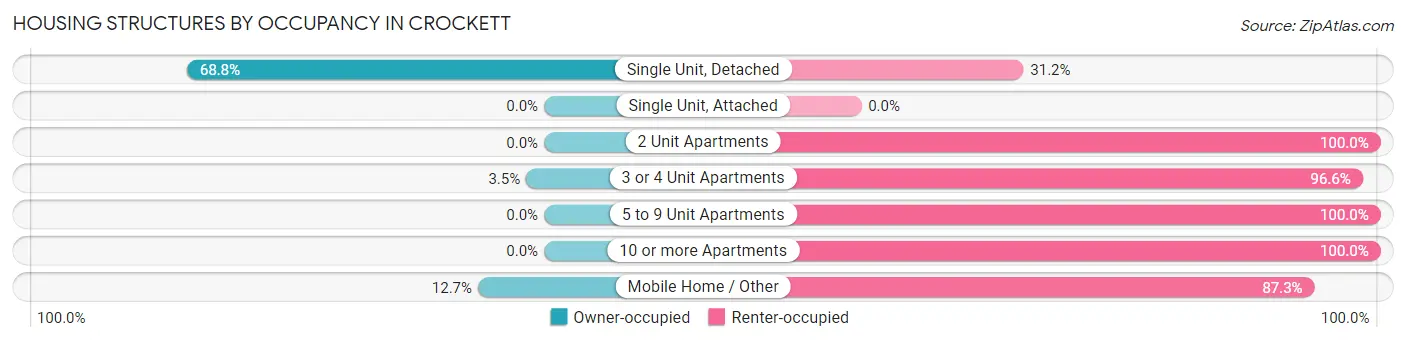
| Structure Type | Owner-occupied | Renter-occupied |
| Single Unit, Detached | 1,088 (68.8%) | 494 (31.2%) |
| Single Unit, Attached | 0 (0.0%) | 0 (0.0%) |
| 2 Unit Apartments | 0 (0.0%) | 303 (100.0%) |
| 3 or 4 Unit Apartments | 6 (3.5%) | 168 (96.6%) |
| 5 to 9 Unit Apartments | 0 (0.0%) | 26 (100.0%) |
| 10 or more Apartments | 0 (0.0%) | 228 (100.0%) |
| Mobile Home / Other | 7 (12.7%) | 48 (87.3%) |
| Total | 1,101 (46.5%) | 1,267 (53.5%) |
Housing Structures by Number of Rooms in Crockett
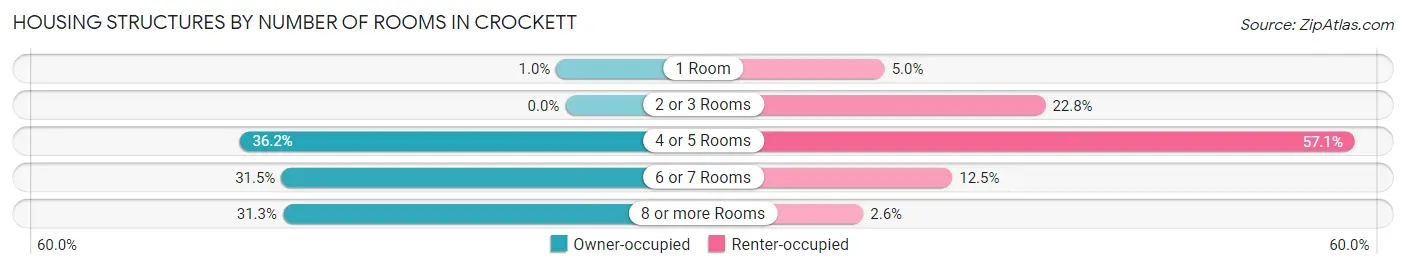
| Number of Rooms | Owner-occupied | Renter-occupied |
| 1 Room | 11 (1.0%) | 63 (5.0%) |
| 2 or 3 Rooms | 0 (0.0%) | 289 (22.8%) |
| 4 or 5 Rooms | 398 (36.1%) | 724 (57.1%) |
| 6 or 7 Rooms | 347 (31.5%) | 158 (12.5%) |
| 8 or more Rooms | 345 (31.3%) | 33 (2.6%) |
| Total | 1,101 (100.0%) | 1,267 (100.0%) |
Housing Structure by Heating Type in Crockett
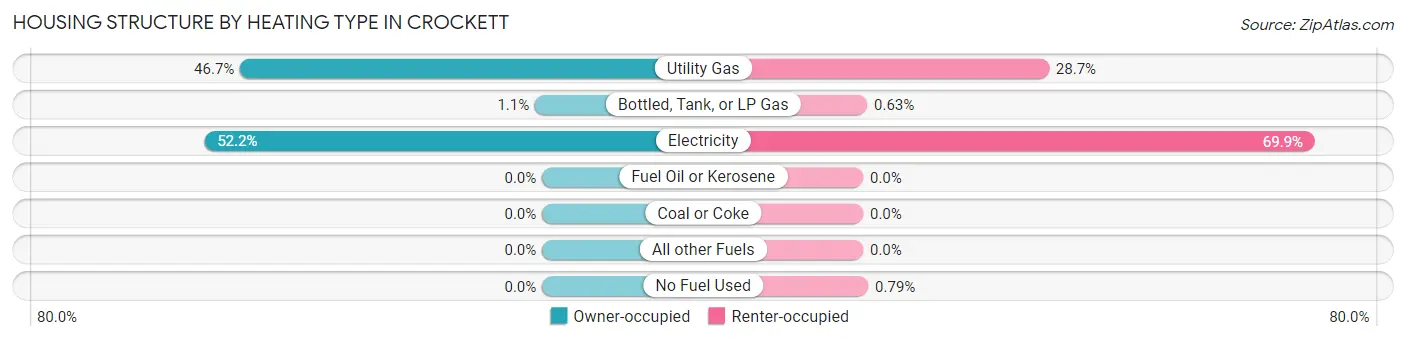
| Heating Type | Owner-occupied | Renter-occupied |
| Utility Gas | 514 (46.7%) | 364 (28.7%) |
| Bottled, Tank, or LP Gas | 12 (1.1%) | 8 (0.6%) |
| Electricity | 575 (52.2%) | 885 (69.9%) |
| Fuel Oil or Kerosene | 0 (0.0%) | 0 (0.0%) |
| Coal or Coke | 0 (0.0%) | 0 (0.0%) |
| All other Fuels | 0 (0.0%) | 0 (0.0%) |
| No Fuel Used | 0 (0.0%) | 10 (0.8%) |
| Total | 1,101 (100.0%) | 1,267 (100.0%) |
Household Vehicle Usage in Crockett
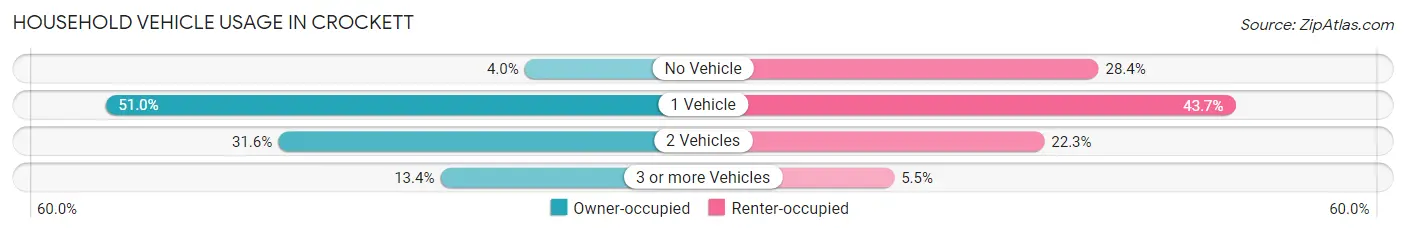
| Vehicles per Household | Owner-occupied | Renter-occupied |
| No Vehicle | 44 (4.0%) | 360 (28.4%) |
| 1 Vehicle | 561 (50.9%) | 554 (43.7%) |
| 2 Vehicles | 348 (31.6%) | 283 (22.3%) |
| 3 or more Vehicles | 148 (13.4%) | 70 (5.5%) |
| Total | 1,101 (100.0%) | 1,267 (100.0%) |
Real Estate & Mortgages in Crockett
Real Estate and Mortgage Overview in Crockett
| Characteristic | Without Mortgage | With Mortgage |
| Housing Units | 662 | 439 |
| Median Property Value | $108,800 | $124,900 |
| Median Household Income | $46,316 | $180 |
| Monthly Housing Costs | $517 | $117 |
| Real Estate Taxes | $1,411 | $22 |
Property Value by Mortgage Status in Crockett
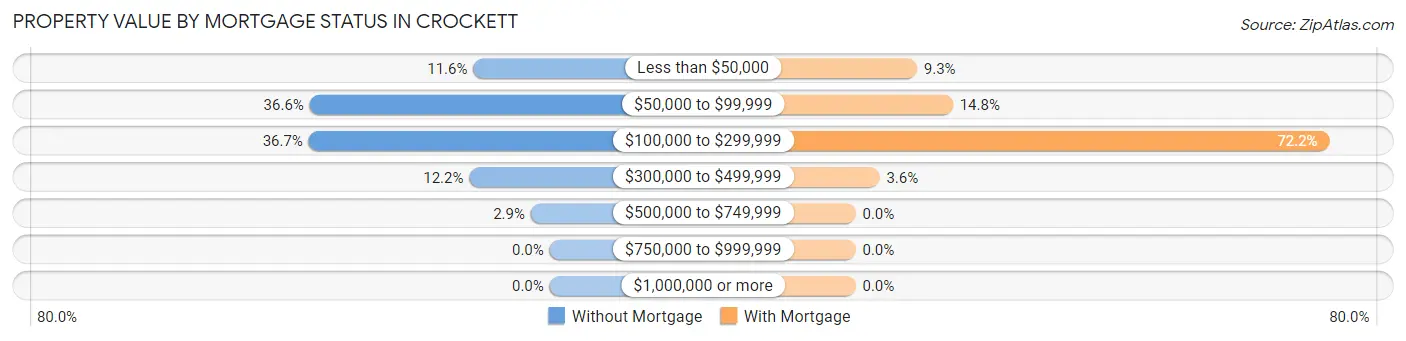
| Property Value | Without Mortgage | With Mortgage |
| Less than $50,000 | 77 (11.6%) | 41 (9.3%) |
| $50,000 to $99,999 | 242 (36.6%) | 65 (14.8%) |
| $100,000 to $299,999 | 243 (36.7%) | 317 (72.2%) |
| $300,000 to $499,999 | 81 (12.2%) | 16 (3.6%) |
| $500,000 to $749,999 | 19 (2.9%) | 0 (0.0%) |
| $750,000 to $999,999 | 0 (0.0%) | 0 (0.0%) |
| $1,000,000 or more | 0 (0.0%) | 0 (0.0%) |
| Total | 662 (100.0%) | 439 (100.0%) |
Household Income by Mortgage Status in Crockett
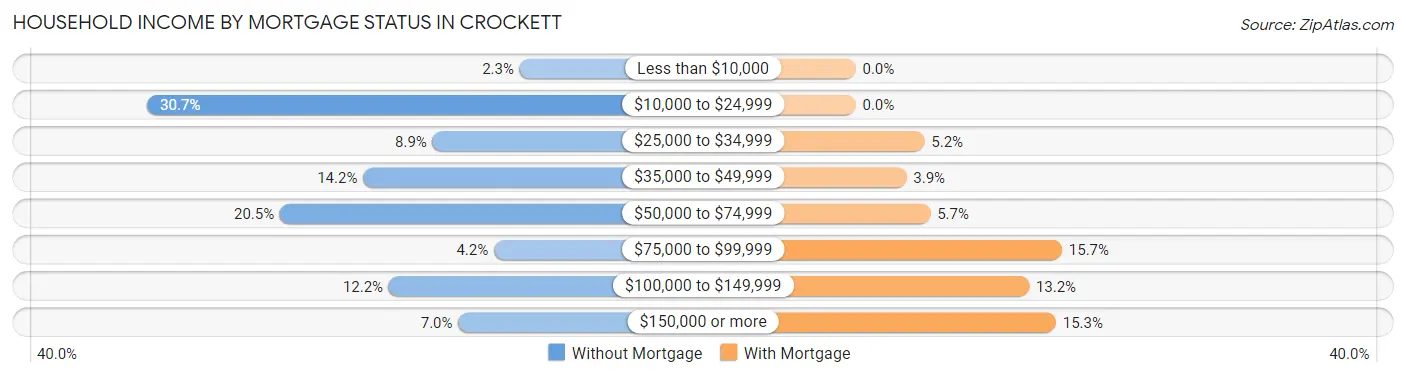
| Household Income | Without Mortgage | With Mortgage |
| Less than $10,000 | 15 (2.3%) | 0 (0.0%) |
| $10,000 to $24,999 | 203 (30.7%) | 0 (0.0%) |
| $25,000 to $34,999 | 59 (8.9%) | 23 (5.2%) |
| $35,000 to $49,999 | 94 (14.2%) | 17 (3.9%) |
| $50,000 to $74,999 | 136 (20.5%) | 25 (5.7%) |
| $75,000 to $99,999 | 28 (4.2%) | 69 (15.7%) |
| $100,000 to $149,999 | 81 (12.2%) | 58 (13.2%) |
| $150,000 or more | 46 (7.0%) | 67 (15.3%) |
| Total | 662 (100.0%) | 439 (100.0%) |
Property Value to Household Income Ratio in Crockett
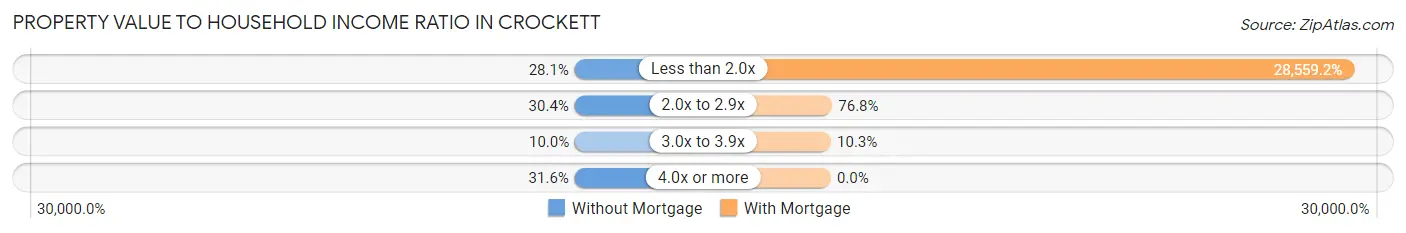
| Value-to-Income Ratio | Without Mortgage | With Mortgage |
| Less than 2.0x | 186 (28.1%) | 125,375 (28,559.2%) |
| 2.0x to 2.9x | 201 (30.4%) | 337 (76.8%) |
| 3.0x to 3.9x | 66 (10.0%) | 45 (10.2%) |
| 4.0x or more | 209 (31.6%) | 0 (0.0%) |
| Total | 662 (100.0%) | 439 (100.0%) |
Real Estate Taxes by Mortgage Status in Crockett
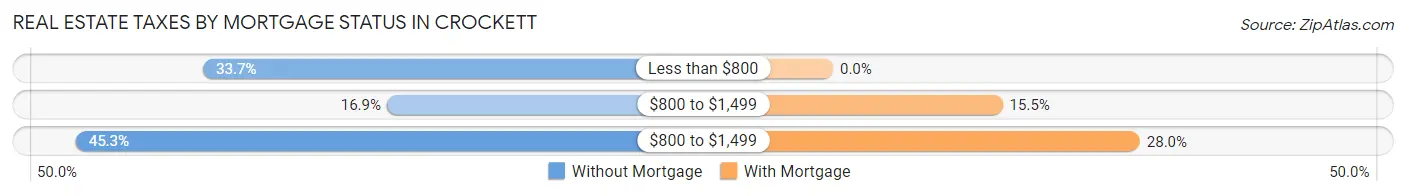
| Property Taxes | Without Mortgage | With Mortgage |
| Less than $800 | 223 (33.7%) | 0 (0.0%) |
| $800 to $1,499 | 112 (16.9%) | 68 (15.5%) |
| $800 to $1,499 | 300 (45.3%) | 123 (28.0%) |
| Total | 662 (100.0%) | 439 (100.0%) |
Health & Disability in Crockett
Health Insurance Coverage by Age in Crockett
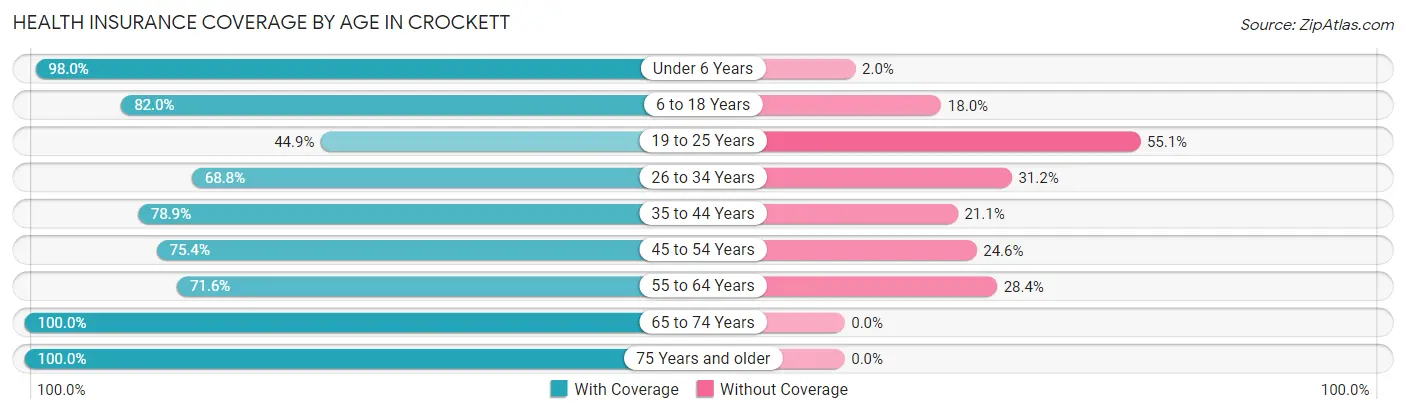
| Age Bracket | With Coverage | Without Coverage |
| Under 6 Years | 582 (98.0%) | 12 (2.0%) |
| 6 to 18 Years | 901 (82.0%) | 198 (18.0%) |
| 19 to 25 Years | 267 (44.9%) | 328 (55.1%) |
| 26 to 34 Years | 437 (68.8%) | 198 (31.2%) |
| 35 to 44 Years | 456 (78.9%) | 122 (21.1%) |
| 45 to 54 Years | 478 (75.4%) | 156 (24.6%) |
| 55 to 64 Years | 554 (71.6%) | 220 (28.4%) |
| 65 to 74 Years | 620 (100.0%) | 0 (0.0%) |
| 75 Years and older | 490 (100.0%) | 0 (0.0%) |
| Total | 4,785 (79.5%) | 1,234 (20.5%) |
Health Insurance Coverage by Citizenship Status in Crockett
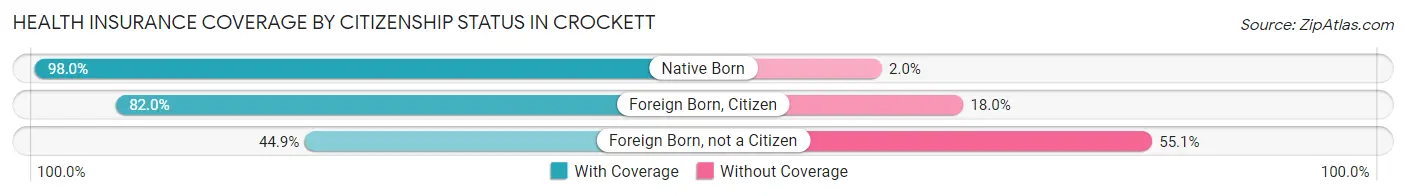
| Citizenship Status | With Coverage | Without Coverage |
| Native Born | 582 (98.0%) | 12 (2.0%) |
| Foreign Born, Citizen | 901 (82.0%) | 198 (18.0%) |
| Foreign Born, not a Citizen | 267 (44.9%) | 328 (55.1%) |
Health Insurance Coverage by Household Income in Crockett
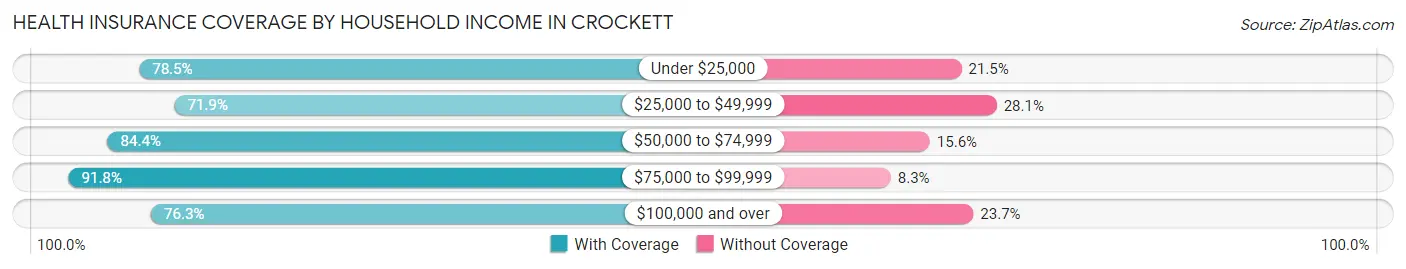
| Household Income | With Coverage | Without Coverage |
| Under $25,000 | 1,329 (78.5%) | 364 (21.5%) |
| $25,000 to $49,999 | 845 (71.9%) | 330 (28.1%) |
| $50,000 to $74,999 | 1,041 (84.4%) | 192 (15.6%) |
| $75,000 to $99,999 | 634 (91.7%) | 57 (8.3%) |
| $100,000 and over | 936 (76.3%) | 291 (23.7%) |
Public vs Private Health Insurance Coverage by Age in Crockett
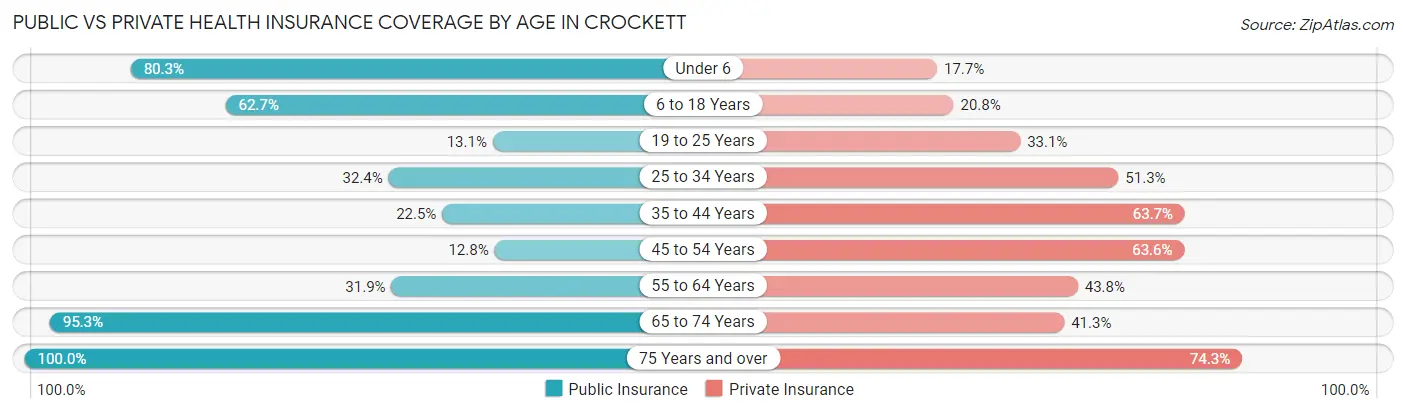
| Age Bracket | Public Insurance | Private Insurance |
| Under 6 | 477 (80.3%) | 105 (17.7%) |
| 6 to 18 Years | 689 (62.7%) | 228 (20.7%) |
| 19 to 25 Years | 78 (13.1%) | 197 (33.1%) |
| 25 to 34 Years | 206 (32.4%) | 326 (51.3%) |
| 35 to 44 Years | 130 (22.5%) | 368 (63.7%) |
| 45 to 54 Years | 81 (12.8%) | 403 (63.6%) |
| 55 to 64 Years | 247 (31.9%) | 339 (43.8%) |
| 65 to 74 Years | 591 (95.3%) | 256 (41.3%) |
| 75 Years and over | 490 (100.0%) | 364 (74.3%) |
| Total | 2,989 (49.7%) | 2,586 (43.0%) |
Disability Status by Sex by Age in Crockett
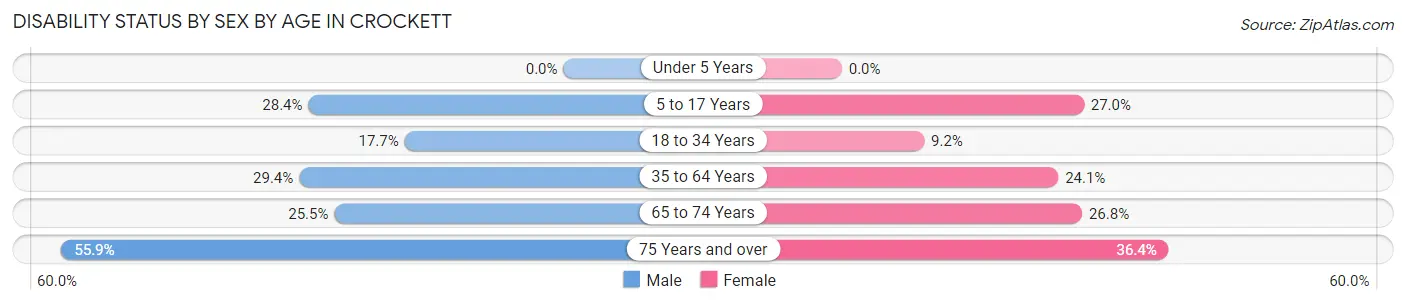
| Age Bracket | Male | Female |
| Under 5 Years | 0 (0.0%) | 0 (0.0%) |
| 5 to 17 Years | 142 (28.4%) | 190 (27.0%) |
| 18 to 34 Years | 98 (17.7%) | 71 (9.2%) |
| 35 to 64 Years | 251 (29.4%) | 273 (24.1%) |
| 65 to 74 Years | 100 (25.5%) | 61 (26.8%) |
| 75 Years and over | 128 (55.9%) | 95 (36.4%) |
Disability Class by Sex by Age in Crockett
Disability Class: Hearing Difficulty
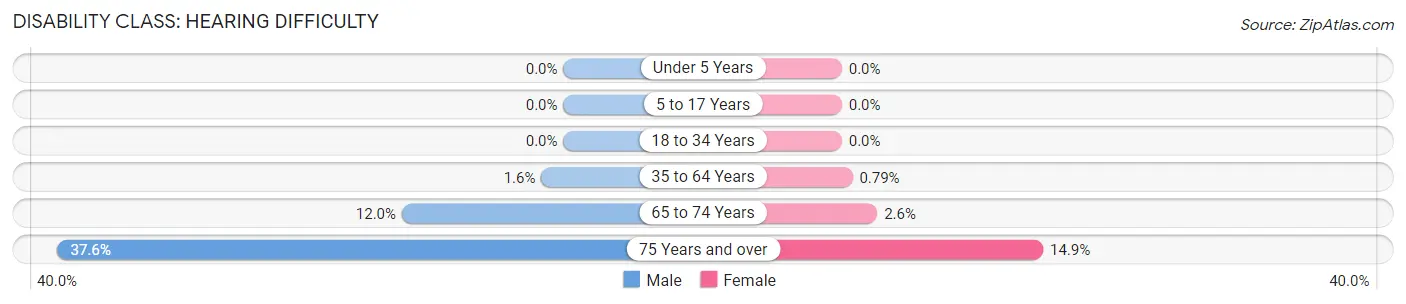
| Age Bracket | Male | Female |
| Under 5 Years | 0 (0.0%) | 0 (0.0%) |
| 5 to 17 Years | 0 (0.0%) | 0 (0.0%) |
| 18 to 34 Years | 0 (0.0%) | 0 (0.0%) |
| 35 to 64 Years | 14 (1.6%) | 9 (0.8%) |
| 65 to 74 Years | 47 (12.0%) | 6 (2.6%) |
| 75 Years and over | 86 (37.6%) | 39 (14.9%) |
Disability Class: Vision Difficulty
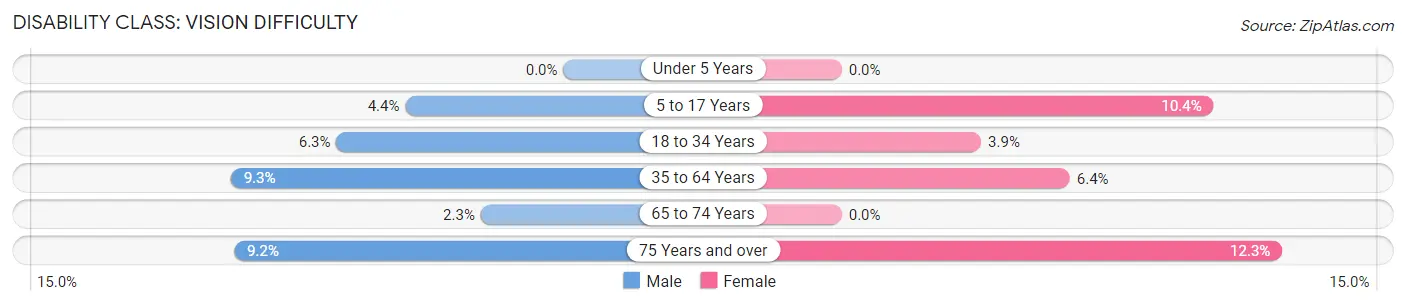
| Age Bracket | Male | Female |
| Under 5 Years | 0 (0.0%) | 0 (0.0%) |
| 5 to 17 Years | 22 (4.4%) | 73 (10.3%) |
| 18 to 34 Years | 35 (6.3%) | 30 (3.9%) |
| 35 to 64 Years | 79 (9.3%) | 72 (6.4%) |
| 65 to 74 Years | 9 (2.3%) | 0 (0.0%) |
| 75 Years and over | 21 (9.2%) | 32 (12.3%) |
Disability Class: Cognitive Difficulty
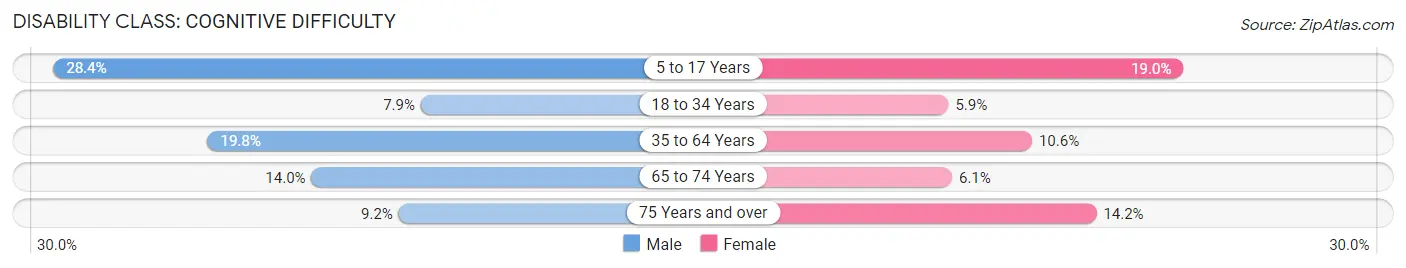
| Age Bracket | Male | Female |
| 5 to 17 Years | 142 (28.4%) | 134 (19.0%) |
| 18 to 34 Years | 44 (7.9%) | 46 (5.9%) |
| 35 to 64 Years | 169 (19.8%) | 120 (10.6%) |
| 65 to 74 Years | 55 (14.0%) | 14 (6.1%) |
| 75 Years and over | 21 (9.2%) | 37 (14.2%) |
Disability Class: Ambulatory Difficulty
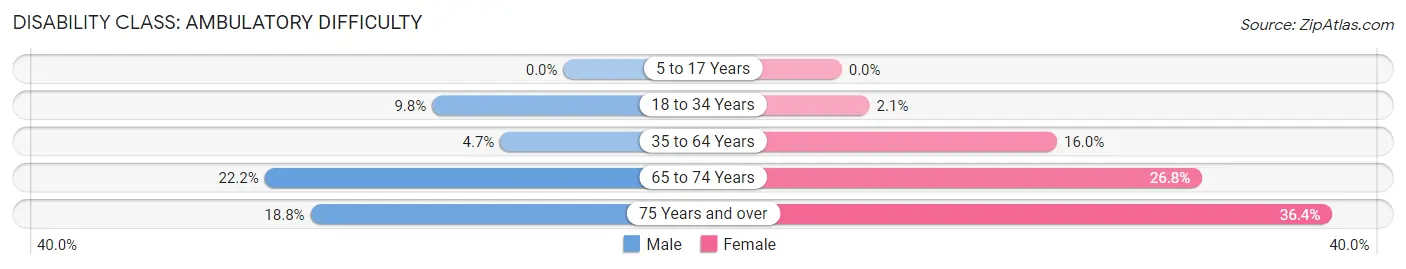
| Age Bracket | Male | Female |
| 5 to 17 Years | 0 (0.0%) | 0 (0.0%) |
| 18 to 34 Years | 54 (9.8%) | 16 (2.1%) |
| 35 to 64 Years | 40 (4.7%) | 181 (16.0%) |
| 65 to 74 Years | 87 (22.2%) | 61 (26.8%) |
| 75 Years and over | 43 (18.8%) | 95 (36.4%) |
Disability Class: Self-Care Difficulty
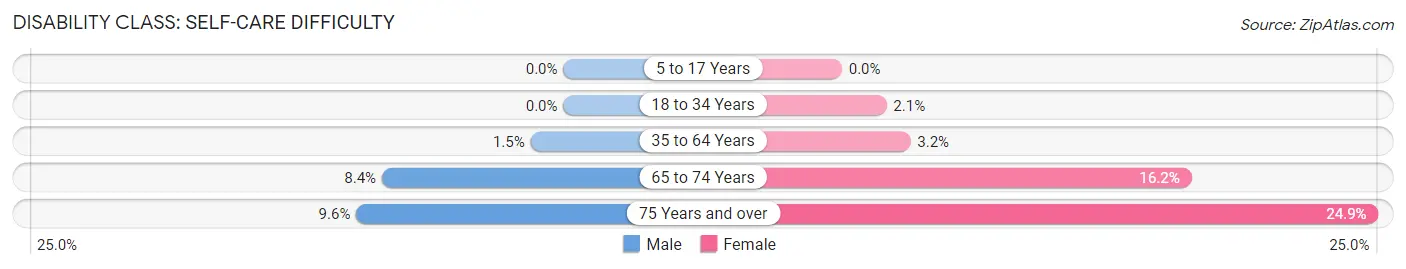
| Age Bracket | Male | Female |
| 5 to 17 Years | 0 (0.0%) | 0 (0.0%) |
| 18 to 34 Years | 0 (0.0%) | 16 (2.1%) |
| 35 to 64 Years | 13 (1.5%) | 36 (3.2%) |
| 65 to 74 Years | 33 (8.4%) | 37 (16.2%) |
| 75 Years and over | 22 (9.6%) | 65 (24.9%) |
Technology Access in Crockett
Computing Device Access in Crockett
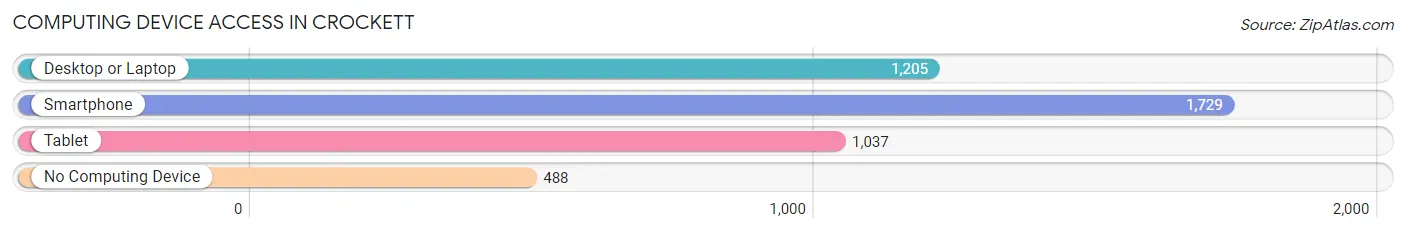
| Device Type | # Households | % Households |
| Desktop or Laptop | 1,205 | 50.9% |
| Smartphone | 1,729 | 73.0% |
| Tablet | 1,037 | 43.8% |
| No Computing Device | 488 | 20.6% |
| Total | 2,368 | 100.0% |
Internet Access in Crockett
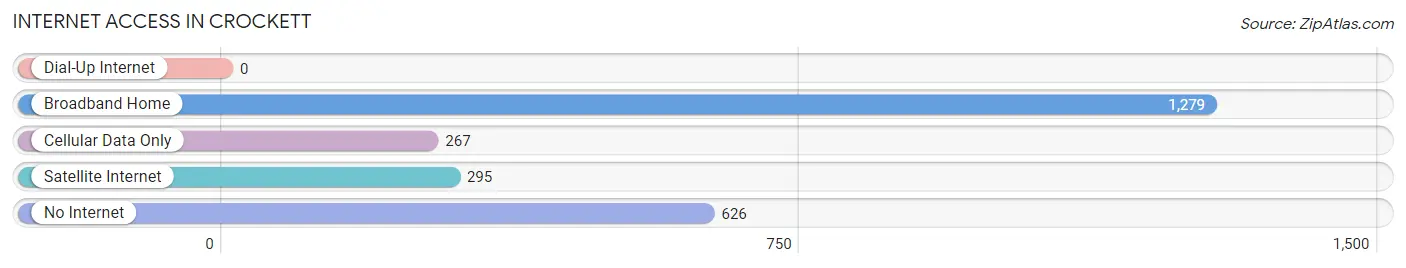
| Internet Type | # Households | % Households |
| Dial-Up Internet | 0 | 0.0% |
| Broadband Home | 1,279 | 54.0% |
| Cellular Data Only | 267 | 11.3% |
| Satellite Internet | 295 | 12.5% |
| No Internet | 626 | 26.4% |
| Total | 2,368 | 100.0% |
Crockett Summary
Crockett, Texas is a small city located in Houston County, Texas. It is situated in the eastern part of the state, approximately 100 miles north of Houston. The city has a population of approximately 6,000 people and is the county seat of Houston County.
History
Crockett was founded in 1837 by a group of settlers led by Davy Crockett, a famous frontiersman and politician. The town was named after him and was the first settlement in Houston County. The settlers built a log cabin and a fort, which served as a refuge from Native American attacks. The town was incorporated in 1846 and was the first county seat of Houston County.
In the late 1800s, Crockett became a major center for the lumber industry. The town was home to several sawmills and lumber yards, and the population grew rapidly. The town also became a major railroad hub, with several lines running through the city.
In the early 1900s, Crockett experienced a period of economic decline. The lumber industry declined, and the railroad lines were abandoned. The population decreased, and the town became a quiet, rural community.
Geography
Crockett is located in the eastern part of Texas, approximately 100 miles north of Houston. The city is situated in the Piney Woods region of the state, and is surrounded by forests and rolling hills. The city is located on the banks of the Trinity River, and is home to several lakes and reservoirs.
The climate in Crockett is humid subtropical, with hot summers and mild winters. The average annual temperature is around 70 degrees Fahrenheit, and the average annual precipitation is around 40 inches.
Economy
Crockett’s economy is largely based on agriculture and tourism. The city is home to several farms and ranches, and the surrounding area is known for its production of cotton, soybeans, and other crops. The city is also home to several tourist attractions, including the Davy Crockett National Forest and the Houston County Historical Museum.
The city is also home to several manufacturing companies, including a paper mill and a furniture factory. The city is also home to several retail stores, restaurants, and other businesses.
Demographics
As of the 2010 census, the population of Crockett was 6,000. The racial makeup of the city was 79.3% White, 16.2% African American, 0.7% Native American, 0.4% Asian, and 3.4% from other races. The median household income was $30,000, and the median age was 37.
Crockett is a small, rural city with a rich history and a diverse economy. The city is home to several tourist attractions, and the surrounding area is known for its production of crops and other agricultural products. The city is also home to several manufacturing companies, retail stores, and other businesses. The population of Crockett is diverse, and the city is a great place to live and work.
Common Questions
What is Per Capita Income in Crockett?
Per Capita income in Crockett is $26,307.
What is the Median Family Income in Crockett?
Median Family Income in Crockett is $53,547.
What is the Median Household income in Crockett?
Median Household Income in Crockett is $37,500.
What is Income or Wage Gap in Crockett?
Income or Wage Gap in Crockett is 40.6%.
Women in Crockett earn 59.4 cents for every dollar earned by a man.
What is Family Income Deficit in Crockett?
Family Income Deficit in Crockett is $13,802.
Families that are below poverty line in Crockett earn $13,802 less on average than the poverty threshold level.
What is Inequality or Gini Index in Crockett?
Inequality or Gini Index in Crockett is 0.54.
What is the Total Population of Crockett?
Total Population of Crockett is 6,365.
What is the Total Male Population of Crockett?
Total Male Population of Crockett is 2,940.
What is the Total Female Population of Crockett?
Total Female Population of Crockett is 3,425.
What is the Ratio of Males per 100 Females in Crockett?
There are 85.84 Males per 100 Females in Crockett.
What is the Ratio of Females per 100 Males in Crockett?
There are 116.50 Females per 100 Males in Crockett.
What is the Median Population Age in Crockett?
Median Population Age in Crockett is 38.1 Years.
What is the Average Family Size in Crockett
Average Family Size in Crockett is 3.6 People.
What is the Average Household Size in Crockett
Average Household Size in Crockett is 2.5 People.
How Large is the Labor Force in Crockett?
There are 2,603 People in the Labor Forcein in Crockett.
What is the Percentage of People in the Labor Force in Crockett?
52.9% of People are in the Labor Force in Crockett.
What is the Unemployment Rate in Crockett?
Unemployment Rate in Crockett is 2.4%.