Covington, TX Map & Demographics
Covington Map
Covington Overview
$33,645
PER CAPITA INCOME
0.49
INEQUALITY / GINI INDEX
298
TOTAL POPULATION
118
MALE POPULATION
180
FEMALE POPULATION
65.56
MALES / 100 FEMALES
152.54
FEMALES / 100 MALES
28.7
MEDIAN AGE
3.8
AVG FAMILY SIZE
3.4
AVG HOUSEHOLD SIZE
137
LABOR FORCE [ PEOPLE ]
64.0%
PERCENT IN LABOR FORCE
Covington Zip Codes
Covington Area Codes
Income in Covington
Income Overview in Covington
| Characteristic | Number | Measure |
| Per Capita Income | 298 | $33,645 |
| Median Family Income | 60 | $0 |
| Mean Family Income | 60 | $137,037 |
| Median Household Income | 88 | $0 |
| Mean Household Income | 88 | $113,322 |
| Income Deficit | 60 | $0 |
| Wage / Income Gap (%) | 298 | 0.00% |
| Wage / Income Gap ($) | 298 | 100.00¢ per $1 |
| Gini / Inequality Index | 298 | 0.49 |
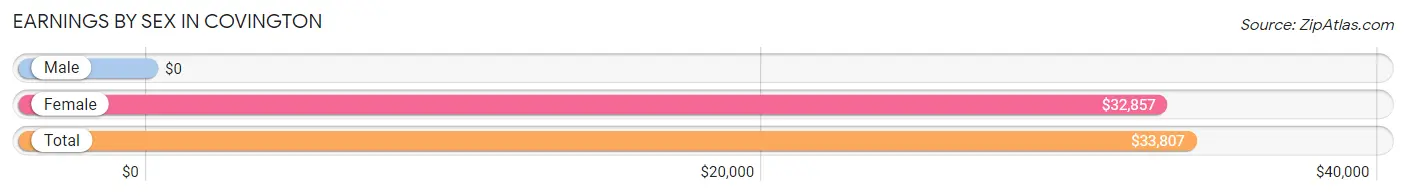
Earnings by Sex in Covington
| Sex | Number | Average Earnings |
| Male | 45 (32.4%) | $0 |
| Female | 94 (67.6%) | $32,857 |
| Total | 139 (100.0%) | $33,807 |
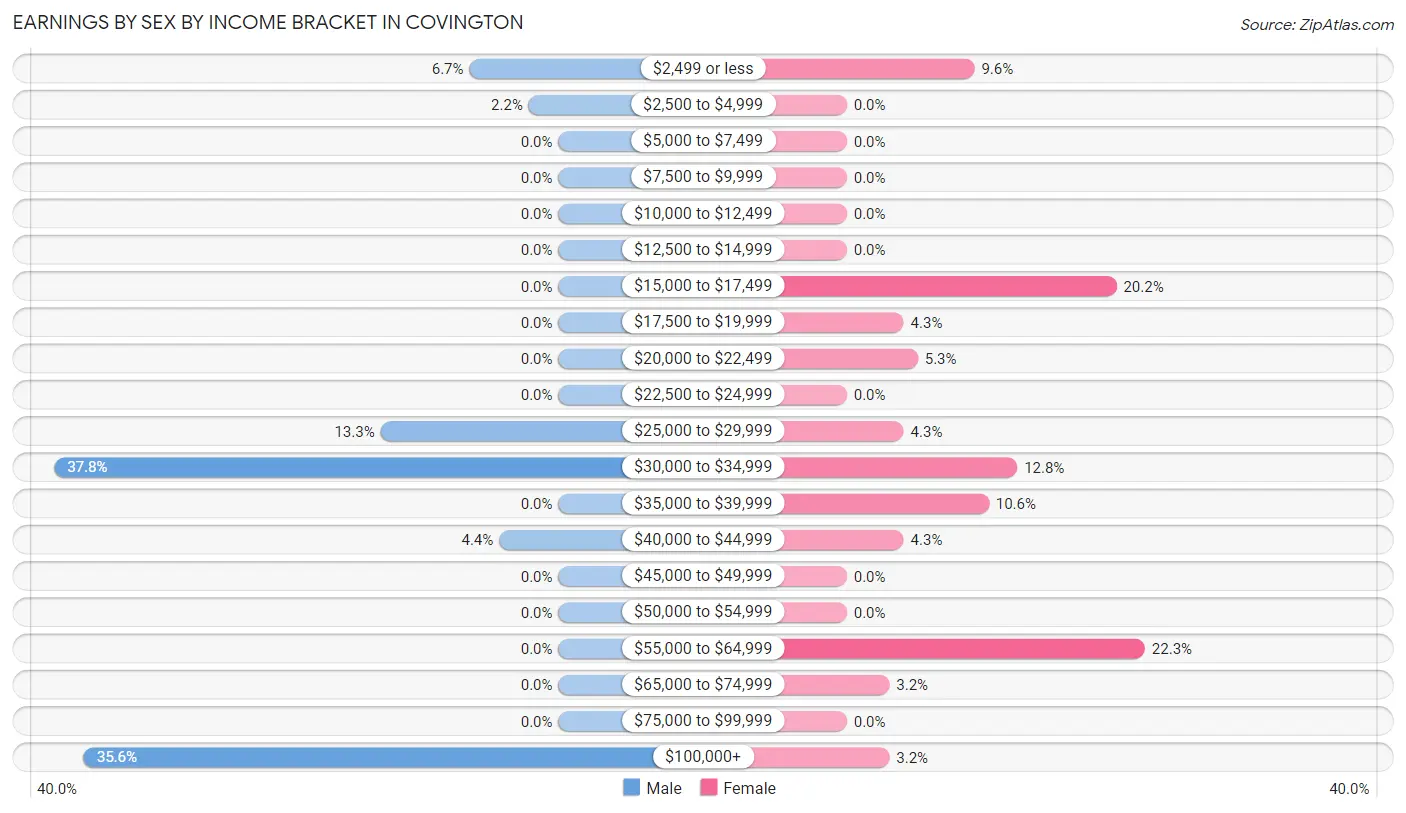
Earnings by Sex by Income Bracket in Covington
The most common earnings brackets in Covington are $30,000 to $34,999 for men (17 | 37.8%) and $55,000 to $64,999 for women (21 | 22.3%).
| Income | Male | Female |
| $2,499 or less | 3 (6.7%) | 9 (9.6%) |
| $2,500 to $4,999 | 1 (2.2%) | 0 (0.0%) |
| $5,000 to $7,499 | 0 (0.0%) | 0 (0.0%) |
| $7,500 to $9,999 | 0 (0.0%) | 0 (0.0%) |
| $10,000 to $12,499 | 0 (0.0%) | 0 (0.0%) |
| $12,500 to $14,999 | 0 (0.0%) | 0 (0.0%) |
| $15,000 to $17,499 | 0 (0.0%) | 19 (20.2%) |
| $17,500 to $19,999 | 0 (0.0%) | 4 (4.3%) |
| $20,000 to $22,499 | 0 (0.0%) | 5 (5.3%) |
| $22,500 to $24,999 | 0 (0.0%) | 0 (0.0%) |
| $25,000 to $29,999 | 6 (13.3%) | 4 (4.3%) |
| $30,000 to $34,999 | 17 (37.8%) | 12 (12.8%) |
| $35,000 to $39,999 | 0 (0.0%) | 10 (10.6%) |
| $40,000 to $44,999 | 2 (4.4%) | 4 (4.3%) |
| $45,000 to $49,999 | 0 (0.0%) | 0 (0.0%) |
| $50,000 to $54,999 | 0 (0.0%) | 0 (0.0%) |
| $55,000 to $64,999 | 0 (0.0%) | 21 (22.3%) |
| $65,000 to $74,999 | 0 (0.0%) | 3 (3.2%) |
| $75,000 to $99,999 | 0 (0.0%) | 0 (0.0%) |
| $100,000+ | 16 (35.6%) | 3 (3.2%) |
| Total | 45 (100.0%) | 94 (100.0%) |
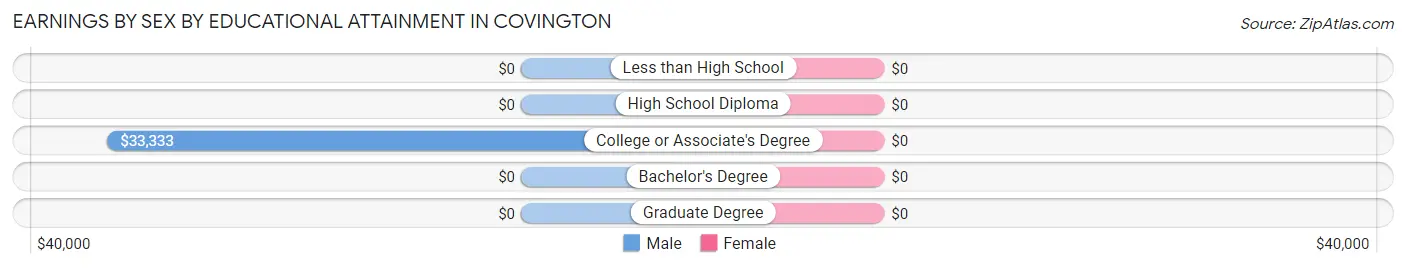
Earnings by Sex by Educational Attainment in Covington
| Educational Attainment | Male Income | Female Income |
| Less than High School | - | - |
| High School Diploma | - | - |
| College or Associate's Degree | $33,333 | $0 |
| Bachelor's Degree | - | - |
| Graduate Degree | - | - |
| Total | - | - |
Family Income in Covington
Family Income Brackets in Covington
According to the Covington family income data, there are 20 families falling into the $200,000+ income range, which is the most common income bracket and makes up 33.3% of all families.
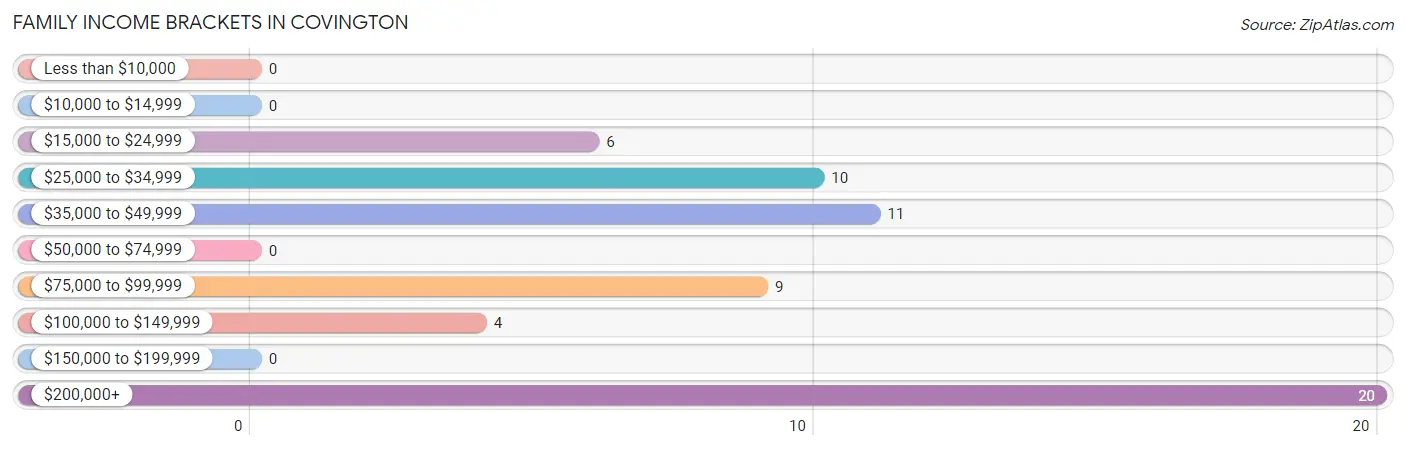
| Income Bracket | # Families | % Families |
| Less than $10,000 | 0 | 0.0% |
| $10,000 to $14,999 | 0 | 0.0% |
| $15,000 to $24,999 | 6 | 10.0% |
| $25,000 to $34,999 | 10 | 16.7% |
| $35,000 to $49,999 | 11 | 18.3% |
| $50,000 to $74,999 | 0 | 0.0% |
| $75,000 to $99,999 | 9 | 15.0% |
| $100,000 to $149,999 | 4 | 6.7% |
| $150,000 to $199,999 | 0 | 0.0% |
| $200,000+ | 20 | 33.3% |
Family Income by Famaliy Size in Covington
2-person families (21 | 35.0%) account for the highest median family income in Covington with $33,125 per family, while 2-person families (21 | 35.0%) have the highest median income of $16,562 per family member.
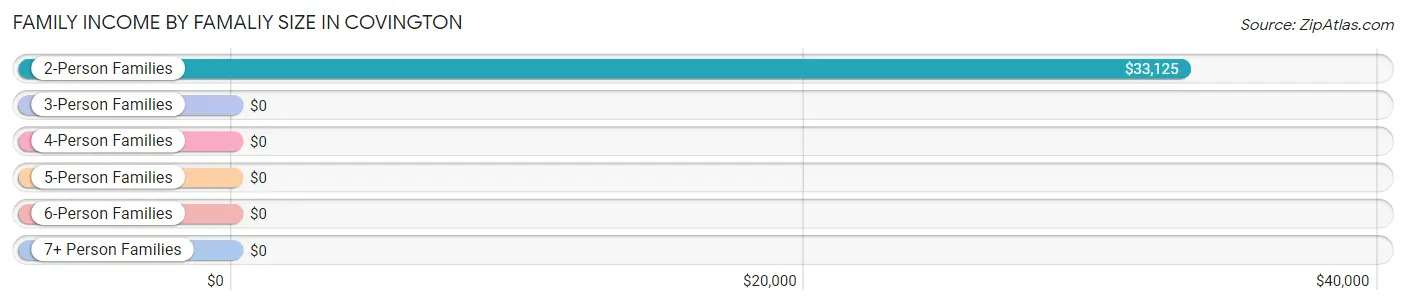
| Income Bracket | # Families | Median Income |
| 2-Person Families | 21 (35.0%) | $33,125 |
| 3-Person Families | 11 (18.3%) | $0 |
| 4-Person Families | 9 (15.0%) | $0 |
| 5-Person Families | 19 (31.7%) | $0 |
| 6-Person Families | 0 (0.0%) | $0 |
| 7+ Person Families | 0 (0.0%) | $0 |
| Total | 60 (100.0%) | $0 |
Family Income by Number of Earners in Covington
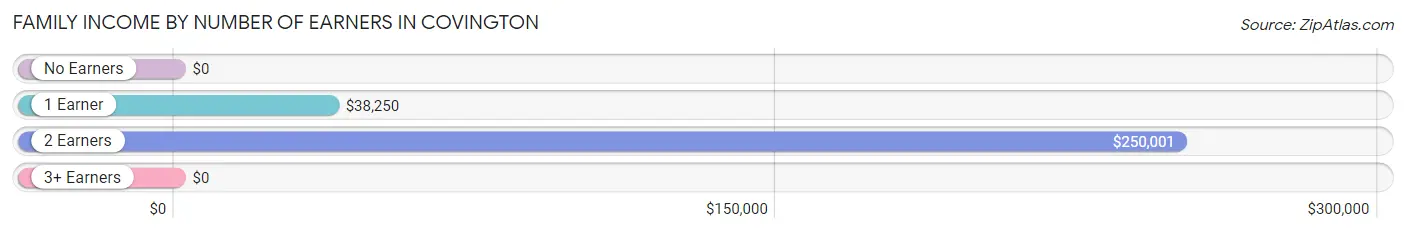
| Number of Earners | # Families | Median Income |
| No Earners | 8 (13.3%) | $0 |
| 1 Earner | 19 (31.7%) | $38,250 |
| 2 Earners | 29 (48.3%) | $250,001 |
| 3+ Earners | 4 (6.7%) | $0 |
| Total | 60 (100.0%) | $0 |
Household Income in Covington
Household Income Brackets in Covington
With 20 households falling in the category, the $200,000+ income range is the most frequent in Covington, accounting for 22.7% of all households.
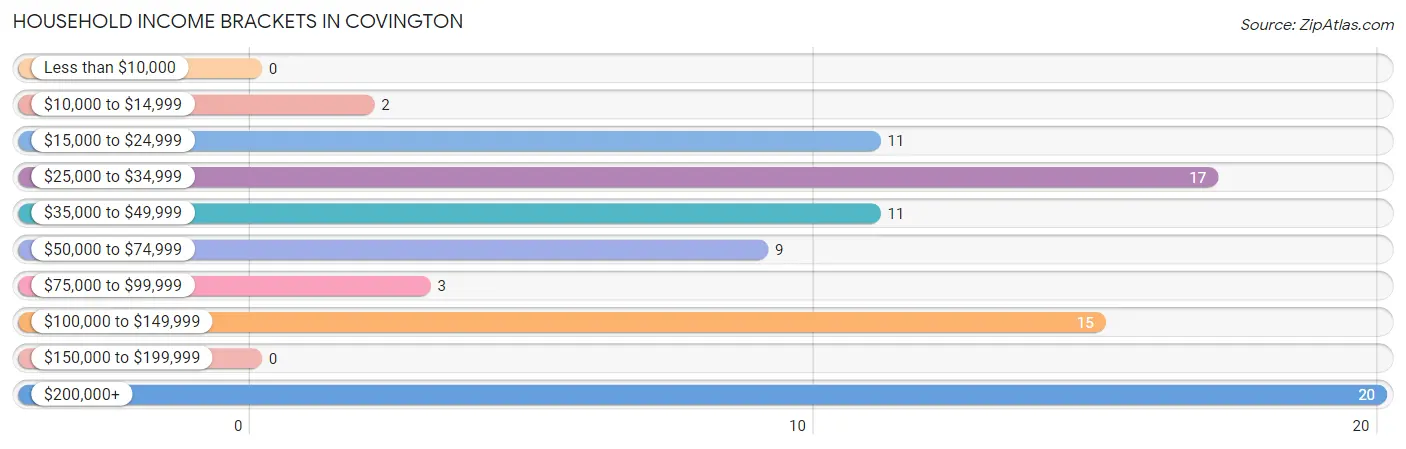
| Income Bracket | # Households | % Households |
| Less than $10,000 | 0 | 0.0% |
| $10,000 to $14,999 | 2 | 2.3% |
| $15,000 to $24,999 | 11 | 12.5% |
| $25,000 to $34,999 | 17 | 19.3% |
| $35,000 to $49,999 | 11 | 12.5% |
| $50,000 to $74,999 | 9 | 10.2% |
| $75,000 to $99,999 | 3 | 3.4% |
| $100,000 to $149,999 | 15 | 17.0% |
| $150,000 to $199,999 | 0 | 0.0% |
| $200,000+ | 20 | 22.7% |
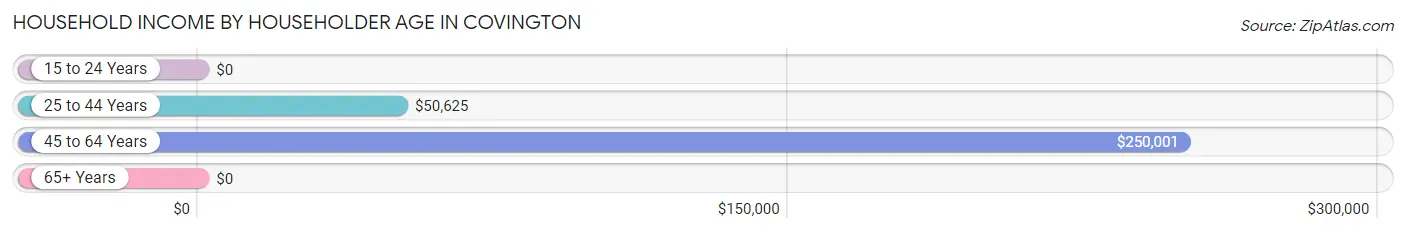
Household Income by Householder Age in Covington
The median household income in Covington is $0, with the highest median household income of $250,001 found in the 45 to 64 years age bracket for the primary householder. A total of 35 households (39.8%) fall into this category.
| Income Bracket | # Households | Median Income |
| 15 to 24 Years | 0 (0.0%) | $0 |
| 25 to 44 Years | 20 (22.7%) | $50,625 |
| 45 to 64 Years | 35 (39.8%) | $250,001 |
| 65+ Years | 33 (37.5%) | $0 |
| Total | 88 (100.0%) | $0 |
Poverty in Covington
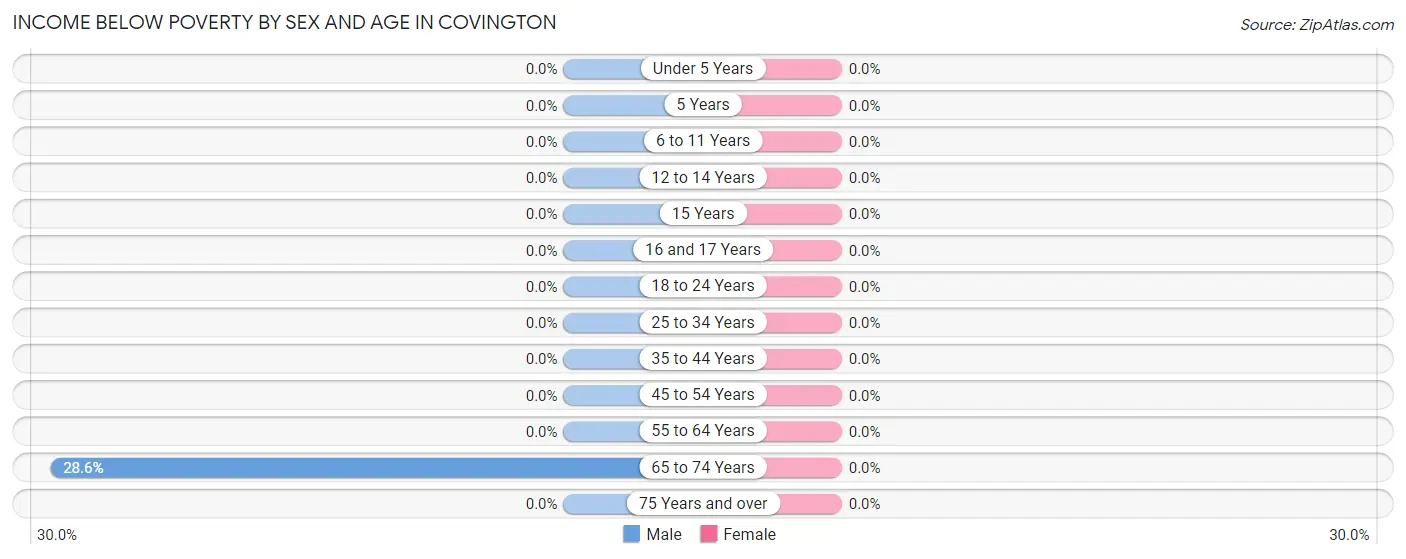
Income Below Poverty by Sex and Age in Covington
| Age Bracket | Male | Female |
| Under 5 Years | 0 (0.0%) | 0 (0.0%) |
| 5 Years | 0 (0.0%) | 0 (0.0%) |
| 6 to 11 Years | 0 (0.0%) | 0 (0.0%) |
| 12 to 14 Years | 0 (0.0%) | 0 (0.0%) |
| 15 Years | 0 (0.0%) | 0 (0.0%) |
| 16 and 17 Years | 0 (0.0%) | 0 (0.0%) |
| 18 to 24 Years | 0 (0.0%) | 0 (0.0%) |
| 25 to 34 Years | 0 (0.0%) | 0 (0.0%) |
| 35 to 44 Years | 0 (0.0%) | 0 (0.0%) |
| 45 to 54 Years | 0 (0.0%) | 0 (0.0%) |
| 55 to 64 Years | 0 (0.0%) | 0 (0.0%) |
| 65 to 74 Years | 2 (28.6%) | 0 (0.0%) |
| 75 Years and over | 0 (0.0%) | 0 (0.0%) |
| Total | 2 (1.7%) | 0 (0.0%) |
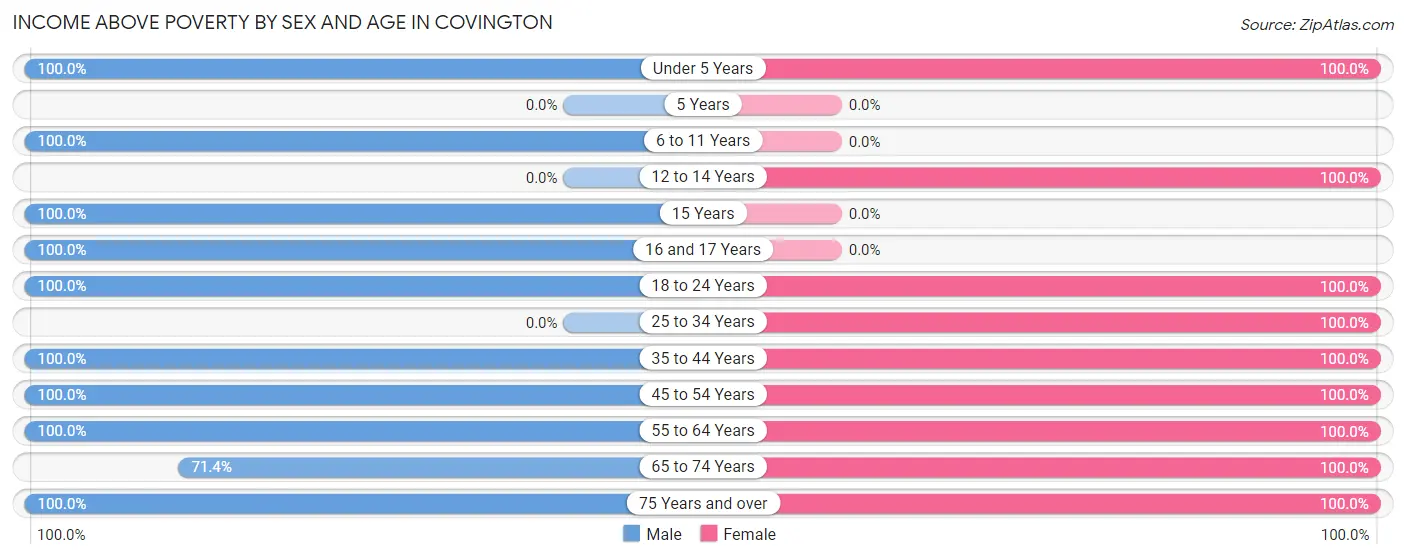
Income Above Poverty by Sex and Age in Covington
According to the poverty statistics in Covington, males aged under 5 years and females aged under 5 years are the age groups that are most secure financially, with 100.0% of males and 100.0% of females in these age groups living above the poverty line.
| Age Bracket | Male | Female |
| Under 5 Years | 5 (100.0%) | 19 (100.0%) |
| 5 Years | 0 (0.0%) | 0 (0.0%) |
| 6 to 11 Years | 22 (100.0%) | 0 (0.0%) |
| 12 to 14 Years | 0 (0.0%) | 19 (100.0%) |
| 15 Years | 2 (100.0%) | 0 (0.0%) |
| 16 and 17 Years | 6 (100.0%) | 0 (0.0%) |
| 18 to 24 Years | 22 (100.0%) | 17 (100.0%) |
| 25 to 34 Years | 0 (0.0%) | 25 (100.0%) |
| 35 to 44 Years | 32 (100.0%) | 16 (100.0%) |
| 45 to 54 Years | 7 (100.0%) | 21 (100.0%) |
| 55 to 64 Years | 9 (100.0%) | 14 (100.0%) |
| 65 to 74 Years | 5 (71.4%) | 10 (100.0%) |
| 75 Years and over | 6 (100.0%) | 22 (100.0%) |
| Total | 116 (98.3%) | 163 (100.0%) |
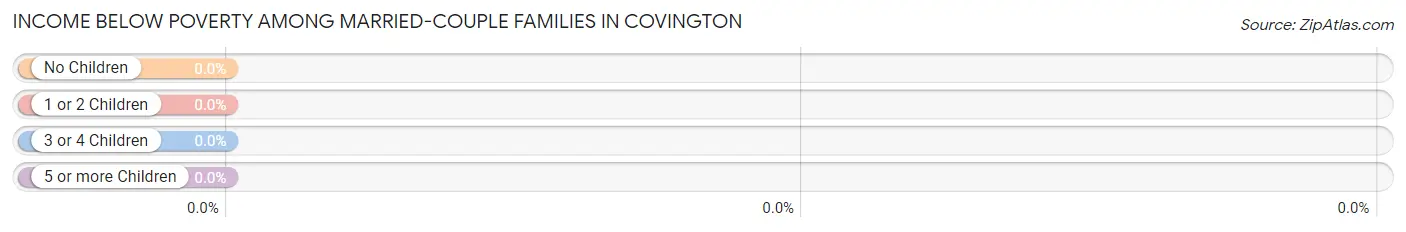
Income Below Poverty Among Married-Couple Families in Covington
| Children | Above Poverty | Below Poverty |
| No Children | 14 (100.0%) | 0 (0.0%) |
| 1 or 2 Children | 26 (100.0%) | 0 (0.0%) |
| 3 or 4 Children | 0 (0.0%) | 0 (0.0%) |
| 5 or more Children | 0 (0.0%) | 0 (0.0%) |
| Total | 40 (100.0%) | 0 (0.0%) |
Income Below Poverty Among Single-Parent Households in Covington
| Children | Single Father | Single Mother |
| No Children | 0 (0.0%) | 0 (0.0%) |
| 1 or 2 Children | 0 (0.0%) | 0 (0.0%) |
| 3 or 4 Children | 0 (0.0%) | 0 (0.0%) |
| 5 or more Children | 0 (0.0%) | 0 (0.0%) |
| Total | 0 (0.0%) | 0 (0.0%) |
Income Below Poverty Among Married-Couple vs Single-Parent Households in Covington
| Children | Married-Couple Families | Single-Parent Households |
| No Children | 0 (0.0%) | 0 (0.0%) |
| 1 or 2 Children | 0 (0.0%) | 0 (0.0%) |
| 3 or 4 Children | 0 (0.0%) | 0 (0.0%) |
| 5 or more Children | 0 (0.0%) | 0 (0.0%) |
| Total | 0 (0.0%) | 0 (0.0%) |
Race in Covington
The most populous races in Covington are White / Caucasian (272 | 91.3%), Hispanic or Latino (42 | 14.1%), and Two or more Races (23 | 7.7%).
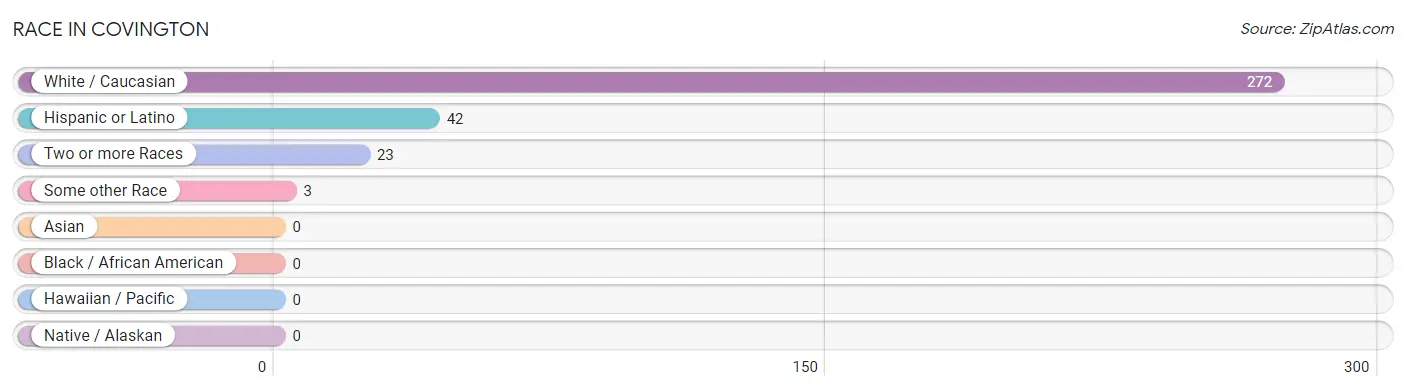
| Race | # Population | % Population |
| Asian | 0 | 0.0% |
| Black / African American | 0 | 0.0% |
| Hawaiian / Pacific | 0 | 0.0% |
| Hispanic or Latino | 42 | 14.1% |
| Native / Alaskan | 0 | 0.0% |
| White / Caucasian | 272 | 91.3% |
| Two or more Races | 23 | 7.7% |
| Some other Race | 3 | 1.0% |
| Total | 298 | 100.0% |
Ancestry in Covington
The most populous ancestries reported in Covington are German (102 | 34.2%), Irish (60 | 20.1%), Mexican (42 | 14.1%), American (26 | 8.7%), and English (21 | 7.0%), together accounting for 84.2% of all Covington residents.
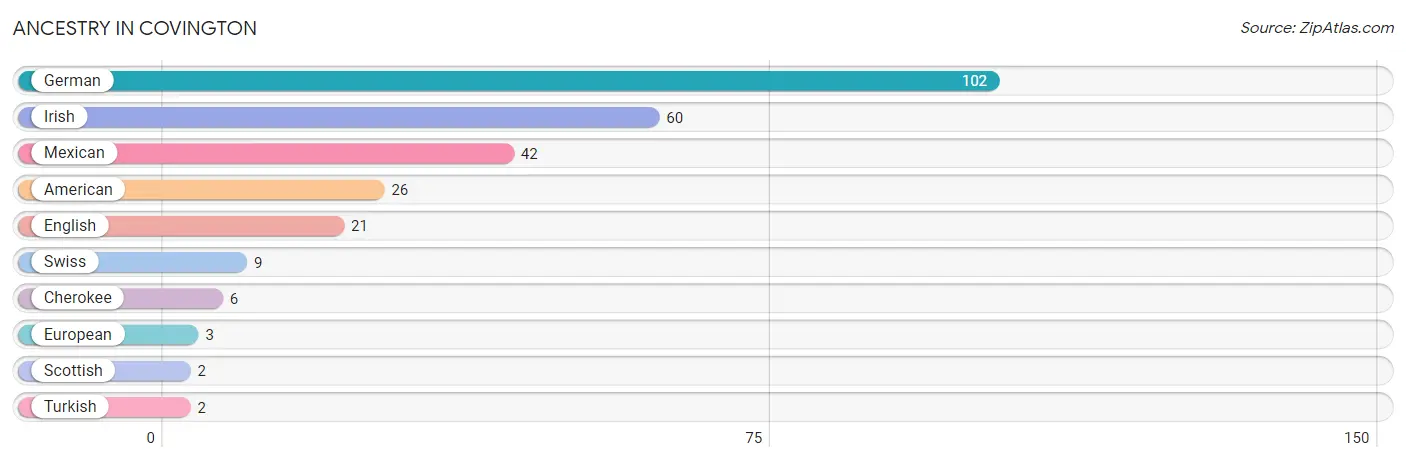
| Ancestry | # Population | % Population |
| American | 26 | 8.7% |
| Cherokee | 6 | 2.0% |
| English | 21 | 7.0% |
| European | 3 | 1.0% |
| German | 102 | 34.2% |
| Irish | 60 | 20.1% |
| Mexican | 42 | 14.1% |
| Scottish | 2 | 0.7% |
| Swiss | 9 | 3.0% |
| Turkish | 2 | 0.7% | View All 10 Rows |
Immigrants in Covington
The most numerous immigrant groups reported in Covington came from Canada (4 | 1.3%), Asia (2 | 0.7%), Turkey (2 | 0.7%), and Western Asia (2 | 0.7%), together accounting for 3.4% of all Covington residents.
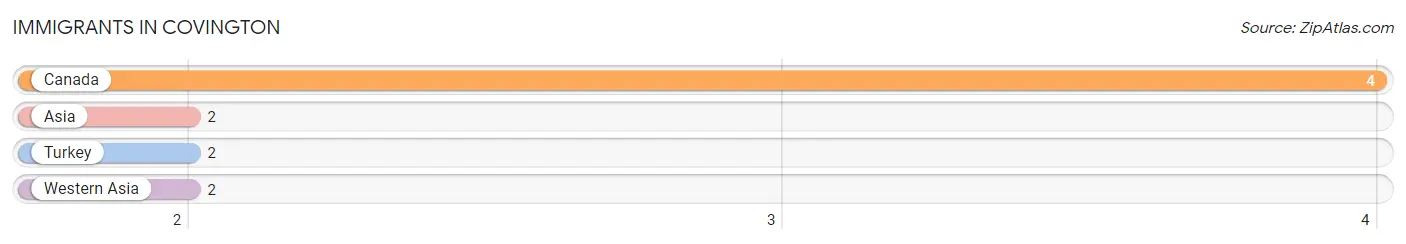
| Immigration Origin | # Population | % Population |
| Asia | 2 | 0.7% |
| Canada | 4 | 1.3% |
| Turkey | 2 | 0.7% |
| Western Asia | 2 | 0.7% | View All 4 Rows |
Sex and Age in Covington
Sex and Age in Covington
The most populous age groups in Covington are 40 to 44 Years (32 | 27.1%) for men and 10 to 14 Years (36 | 20.0%) for women.
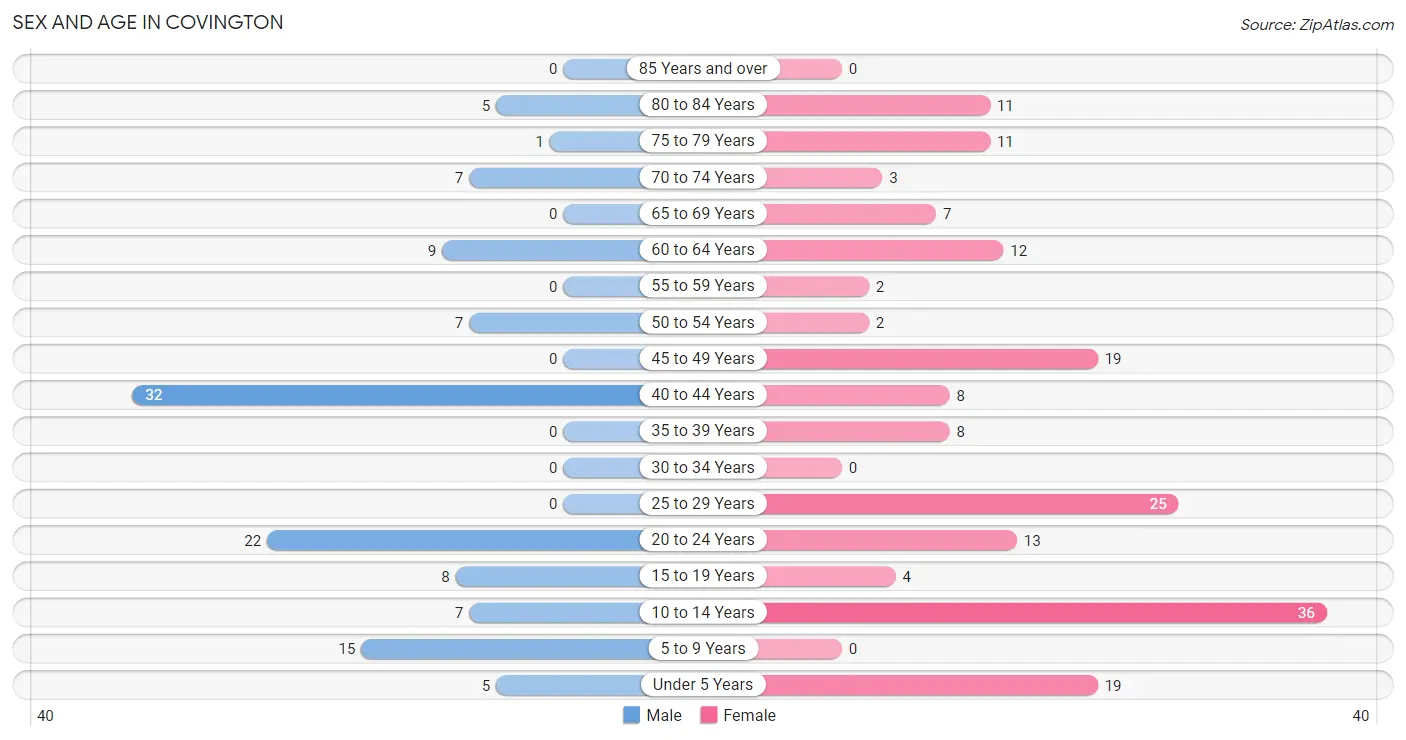
| Age Bracket | Male | Female |
| Under 5 Years | 5 (4.2%) | 19 (10.6%) |
| 5 to 9 Years | 15 (12.7%) | 0 (0.0%) |
| 10 to 14 Years | 7 (5.9%) | 36 (20.0%) |
| 15 to 19 Years | 8 (6.8%) | 4 (2.2%) |
| 20 to 24 Years | 22 (18.6%) | 13 (7.2%) |
| 25 to 29 Years | 0 (0.0%) | 25 (13.9%) |
| 30 to 34 Years | 0 (0.0%) | 0 (0.0%) |
| 35 to 39 Years | 0 (0.0%) | 8 (4.4%) |
| 40 to 44 Years | 32 (27.1%) | 8 (4.4%) |
| 45 to 49 Years | 0 (0.0%) | 19 (10.6%) |
| 50 to 54 Years | 7 (5.9%) | 2 (1.1%) |
| 55 to 59 Years | 0 (0.0%) | 2 (1.1%) |
| 60 to 64 Years | 9 (7.6%) | 12 (6.7%) |
| 65 to 69 Years | 0 (0.0%) | 7 (3.9%) |
| 70 to 74 Years | 7 (5.9%) | 3 (1.7%) |
| 75 to 79 Years | 1 (0.9%) | 11 (6.1%) |
| 80 to 84 Years | 5 (4.2%) | 11 (6.1%) |
| 85 Years and over | 0 (0.0%) | 0 (0.0%) |
| Total | 118 (100.0%) | 180 (100.0%) |
Families and Households in Covington
Median Family Size in Covington
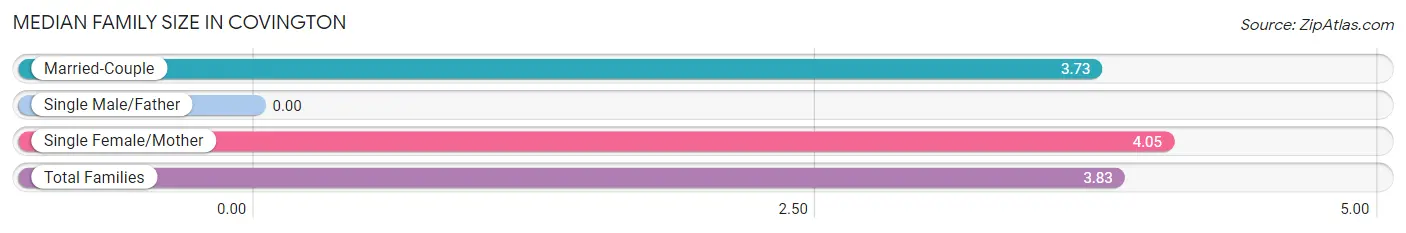
| Family Type | # Families | Family Size |
| Married-Couple | 40 (66.7%) | 3.73 |
| Single Male/Father | 0 (0.0%) | - |
| Single Female/Mother | 20 (33.3%) | 4.05 |
| Total Families | 60 (100.0%) | 3.83 |
Median Household Size in Covington
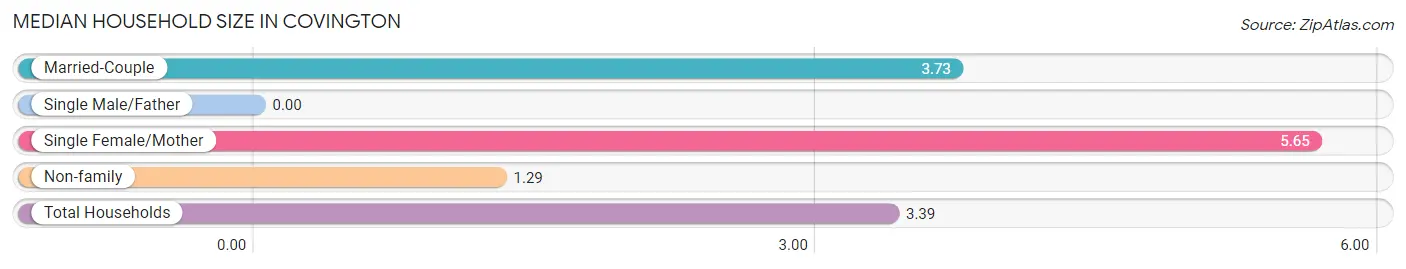
| Household Type | # Households | Household Size |
| Married-Couple | 40 (45.5%) | 3.73 |
| Single Male/Father | 0 (0.0%) | - |
| Single Female/Mother | 20 (22.7%) | 5.65 |
| Non-family | 28 (31.8%) | 1.29 |
| Total Households | 88 (100.0%) | 3.39 |
Household Size by Marriage Status in Covington
Out of a total of 88 households in Covington, 60 (68.2%) are family households, while 28 (31.8%) are nonfamily households. The most numerous type of family households are 5-person households, comprising 28, and the most common type of nonfamily households are 1-person households, comprising 22.
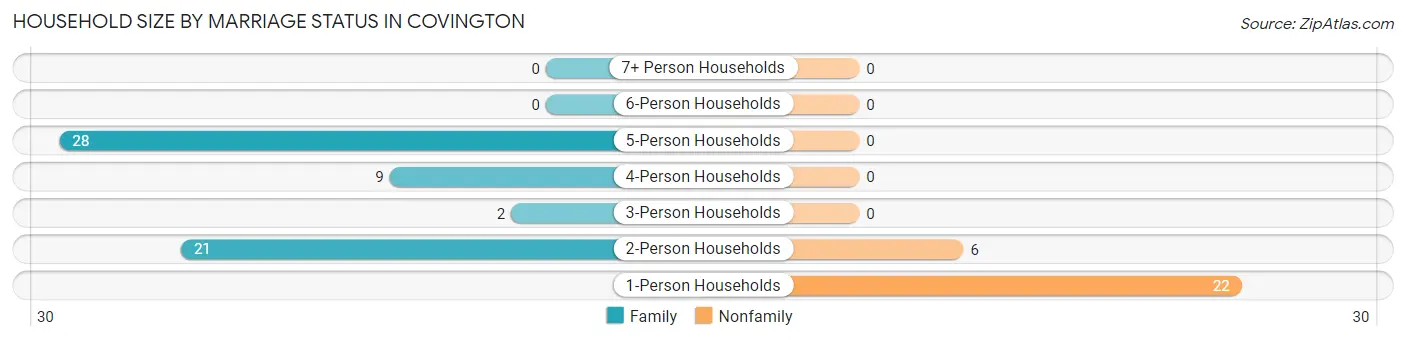
| Household Size | Family Households | Nonfamily Households |
| 1-Person Households | - | 22 (25.0%) |
| 2-Person Households | 21 (23.9%) | 6 (6.8%) |
| 3-Person Households | 2 (2.3%) | 0 (0.0%) |
| 4-Person Households | 9 (10.2%) | 0 (0.0%) |
| 5-Person Households | 28 (31.8%) | 0 (0.0%) |
| 6-Person Households | 0 (0.0%) | 0 (0.0%) |
| 7+ Person Households | 0 (0.0%) | 0 (0.0%) |
| Total | 60 (68.2%) | 28 (31.8%) |
Female Fertility in Covington
Fertility by Age in Covington
| Age Bracket | Women with Births | Births / 1,000 Women |
| 15 to 19 years | 0 (0.0%) | 0.0 |
| 20 to 34 years | 0 (0.0%) | 0.0 |
| 35 to 50 years | 0 (0.0%) | 0.0 |
| Total | 0 (0.0%) | 0.0 |
Fertility by Age by Marriage Status in Covington
| Age Bracket | Married | Unmarried |
| 15 to 19 years | 0 (0.0%) | 0 (0.0%) |
| 20 to 34 years | 0 (0.0%) | 0 (0.0%) |
| 35 to 50 years | 0 (0.0%) | 0 (0.0%) |
| Total | 0 (0.0%) | 0 (0.0%) |
Fertility by Education in Covington
| Educational Attainment | Women with Births | Births / 1,000 Women |
| Less than High School | 0 (0.0%) | 0.0 |
| High School Diploma | 0 (0.0%) | 0.0 |
| College or Associate's Degree | 0 (0.0%) | 0.0 |
| Bachelor's Degree | 0 (0.0%) | 0.0 |
| Graduate Degree | 0 (0.0%) | 0.0 |
| Total | 0 (0.0%) | 0.0 |
Fertility by Education by Marriage Status in Covington
| Educational Attainment | Married | Unmarried |
| Less than High School | 0 (0.0%) | 0 (0.0%) |
| High School Diploma | 0 (0.0%) | 0 (0.0%) |
| College or Associate's Degree | 0 (0.0%) | 0 (0.0%) |
| Bachelor's Degree | 0 (0.0%) | 0 (0.0%) |
| Graduate Degree | 0 (0.0%) | 0 (0.0%) |
| Total | 0 (0.0%) | 0 (0.0%) |
Employment Characteristics in Covington
Employment by Class of Employer in Covington
Among the 137 employed individuals in Covington, private company employees (97 | 70.8%), not-for-profit organizations (13 | 9.5%), and self-employed (not incorporated) (11 | 8.0%) make up the most common classes of employment.
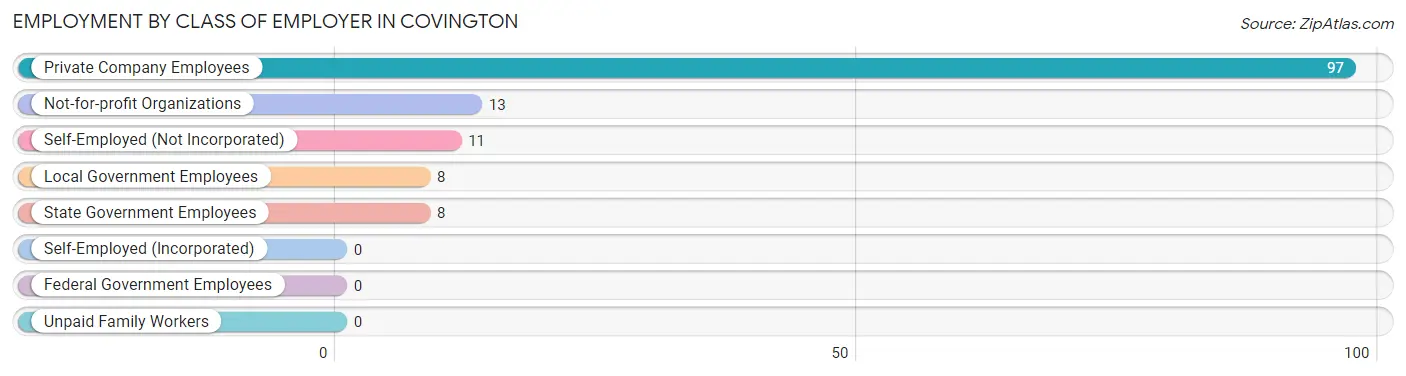
| Employer Class | # Employees | % Employees |
| Private Company Employees | 97 | 70.8% |
| Self-Employed (Incorporated) | 0 | 0.0% |
| Self-Employed (Not Incorporated) | 11 | 8.0% |
| Not-for-profit Organizations | 13 | 9.5% |
| Local Government Employees | 8 | 5.8% |
| State Government Employees | 8 | 5.8% |
| Federal Government Employees | 0 | 0.0% |
| Unpaid Family Workers | 0 | 0.0% |
| Total | 137 | 100.0% |
Employment Status by Age in Covington
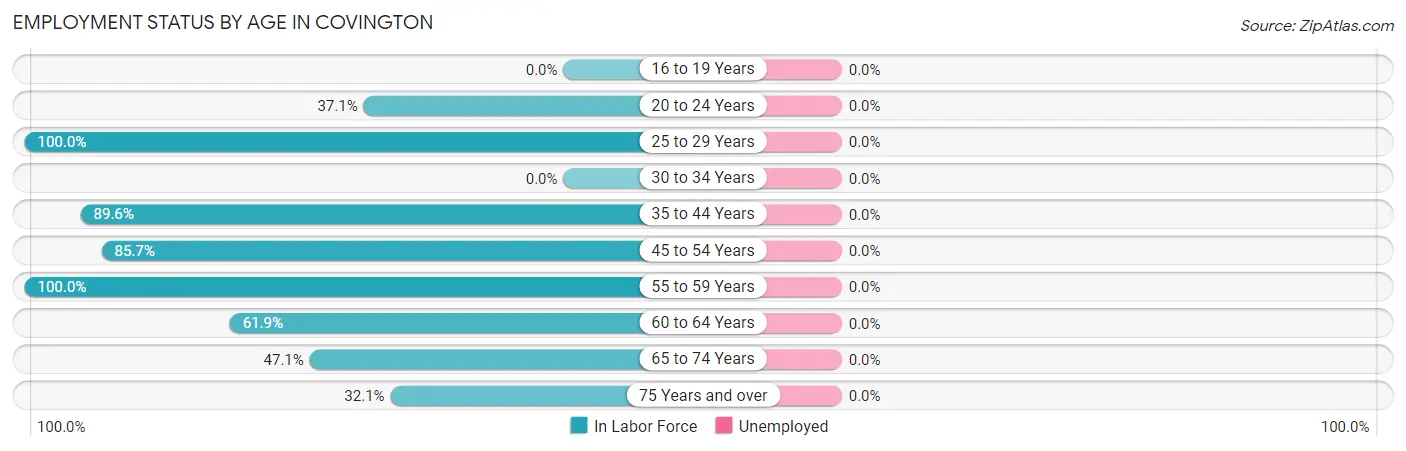
| Age Bracket | In Labor Force | Unemployed |
| 16 to 19 Years | 0 (0.0%) | 0 (0.0%) |
| 20 to 24 Years | 13 (37.1%) | 0 (0.0%) |
| 25 to 29 Years | 25 (100.0%) | 0 (0.0%) |
| 30 to 34 Years | 0 (0.0%) | 0 (0.0%) |
| 35 to 44 Years | 43 (89.6%) | 0 (0.0%) |
| 45 to 54 Years | 24 (85.7%) | 0 (0.0%) |
| 55 to 59 Years | 2 (100.0%) | 0 (0.0%) |
| 60 to 64 Years | 13 (61.9%) | 0 (0.0%) |
| 65 to 74 Years | 8 (47.1%) | 0 (0.0%) |
| 75 Years and over | 9 (32.1%) | 0 (0.0%) |
| Total | 137 (64.0%) | 0 (0.0%) |
Employment Status by Educational Attainment in Covington
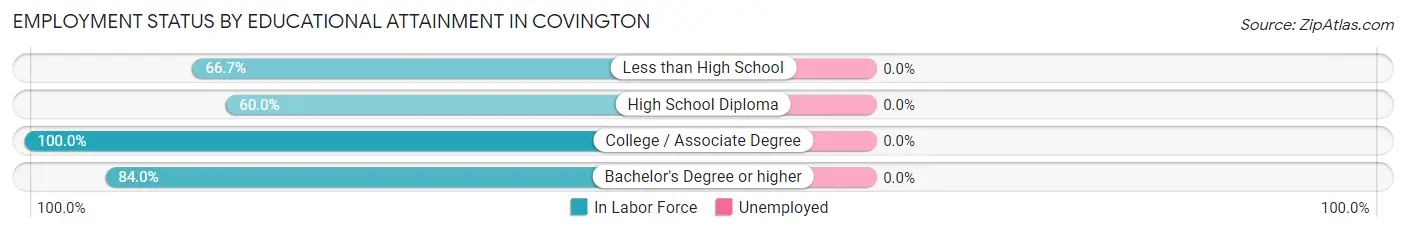
| Educational Attainment | In Labor Force | Unemployed |
| Less than High School | 6 (66.7%) | 0 (0.0%) |
| High School Diploma | 15 (60.0%) | 0 (0.0%) |
| College / Associate Degree | 65 (100.0%) | 0 (0.0%) |
| Bachelor's Degree or higher | 21 (84.0%) | 0 (0.0%) |
| Total | 107 (86.3%) | 0 (0.0%) |
Employment Occupations by Sex in Covington
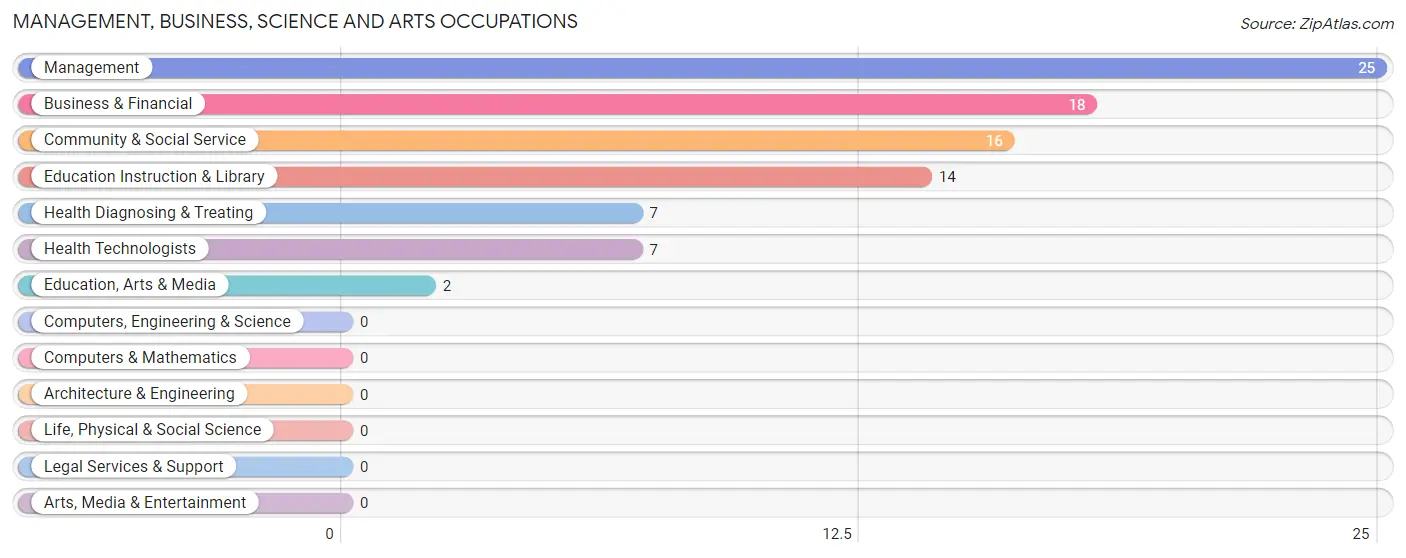
Management, Business, Science and Arts Occupations
The most common Management, Business, Science and Arts occupations in Covington are Management (25 | 18.2%), Business & Financial (18 | 13.1%), Community & Social Service (16 | 11.7%), Education Instruction & Library (14 | 10.2%), and Health Diagnosing & Treating (7 | 5.1%).
Management, Business, Science and Arts Occupations by Sex
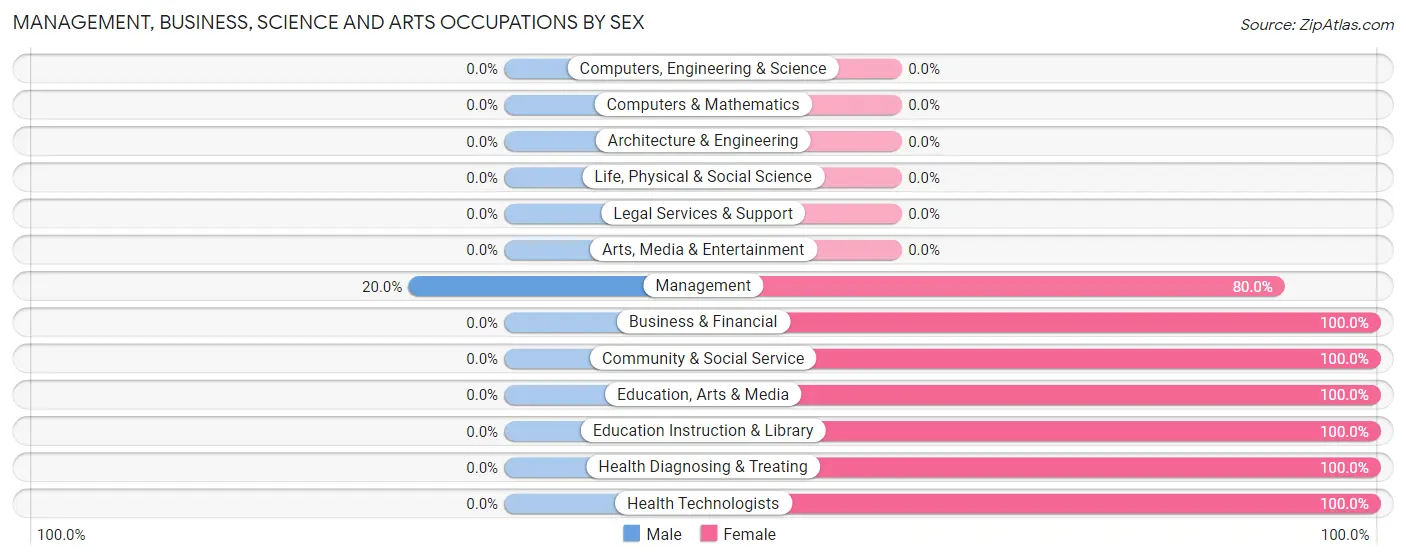
| Occupation | Male | Female |
| Management | 5 (20.0%) | 20 (80.0%) |
| Business & Financial | 0 (0.0%) | 18 (100.0%) |
| Computers, Engineering & Science | 0 (0.0%) | 0 (0.0%) |
| Computers & Mathematics | 0 (0.0%) | 0 (0.0%) |
| Architecture & Engineering | 0 (0.0%) | 0 (0.0%) |
| Life, Physical & Social Science | 0 (0.0%) | 0 (0.0%) |
| Community & Social Service | 0 (0.0%) | 16 (100.0%) |
| Education, Arts & Media | 0 (0.0%) | 2 (100.0%) |
| Legal Services & Support | 0 (0.0%) | 0 (0.0%) |
| Education Instruction & Library | 0 (0.0%) | 14 (100.0%) |
| Arts, Media & Entertainment | 0 (0.0%) | 0 (0.0%) |
| Health Diagnosing & Treating | 0 (0.0%) | 7 (100.0%) |
| Health Technologists | 0 (0.0%) | 7 (100.0%) |
| Total (Category) | 5 (7.6%) | 61 (92.4%) |
| Total (Overall) | 43 (31.4%) | 94 (68.6%) |
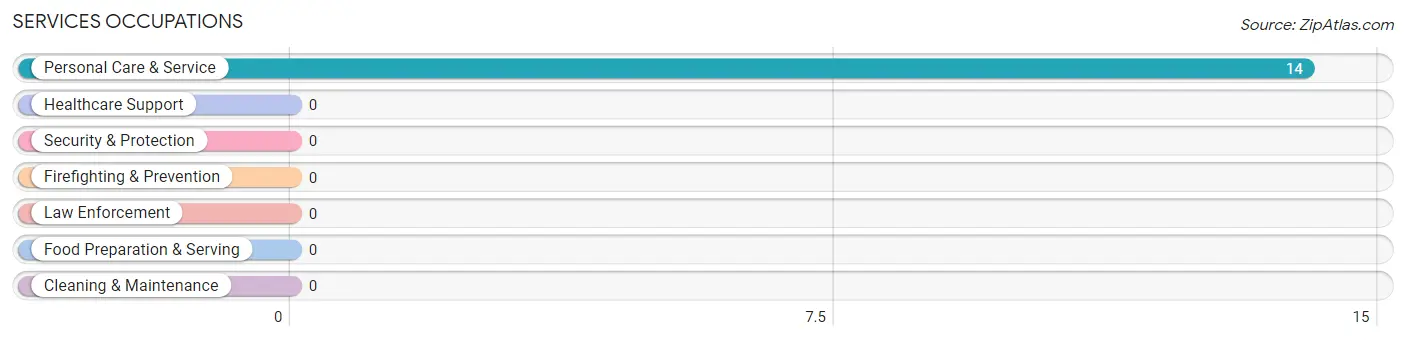
Services Occupations
The most common Services occupations in Covington are , and Personal Care & Service (14 | 10.2%).
Services Occupations by Sex
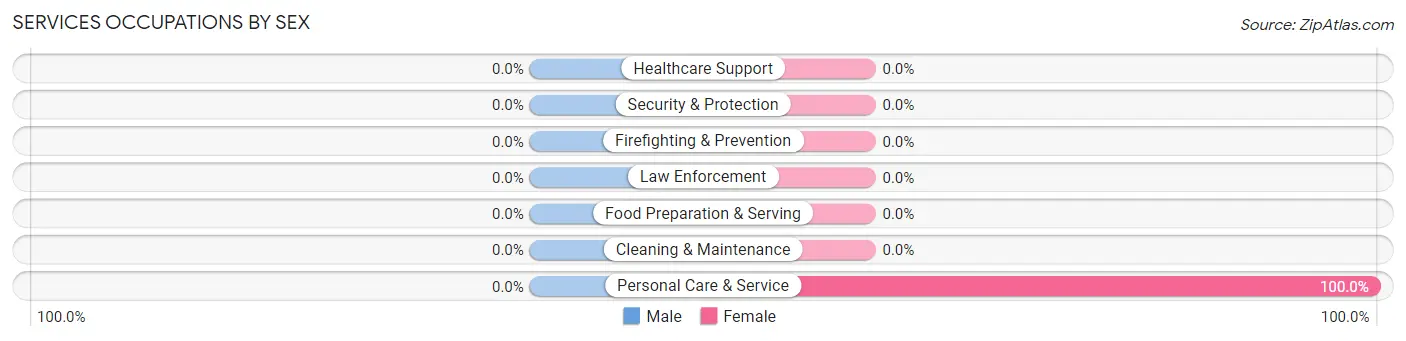
| Occupation | Male | Female |
| Healthcare Support | 0 (0.0%) | 0 (0.0%) |
| Security & Protection | 0 (0.0%) | 0 (0.0%) |
| Firefighting & Prevention | 0 (0.0%) | 0 (0.0%) |
| Law Enforcement | 0 (0.0%) | 0 (0.0%) |
| Food Preparation & Serving | 0 (0.0%) | 0 (0.0%) |
| Cleaning & Maintenance | 0 (0.0%) | 0 (0.0%) |
| Personal Care & Service | 0 (0.0%) | 14 (100.0%) |
| Total (Category) | 0 (0.0%) | 14 (100.0%) |
| Total (Overall) | 43 (31.4%) | 94 (68.6%) |
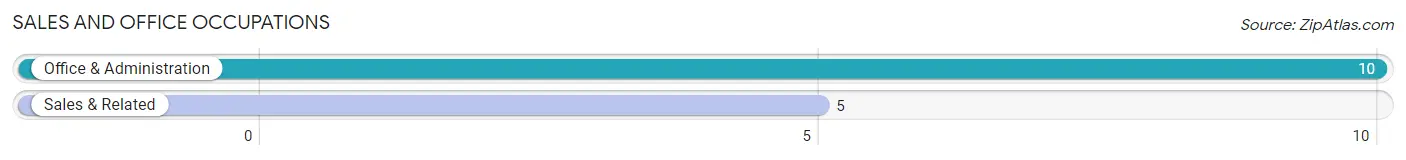
Sales and Office Occupations
The most common Sales and Office occupations in Covington are Office & Administration (10 | 7.3%), and Sales & Related (5 | 3.6%).
Sales and Office Occupations by Sex
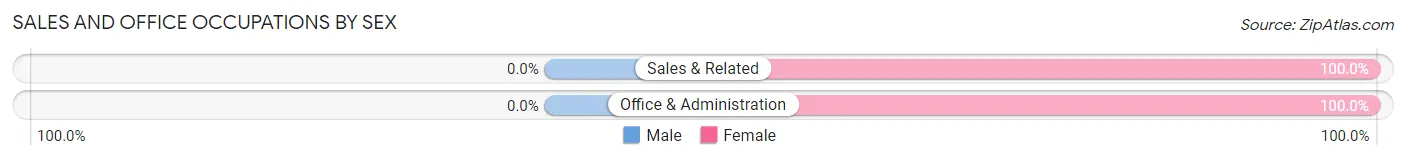
| Occupation | Male | Female |
| Sales & Related | 0 (0.0%) | 5 (100.0%) |
| Office & Administration | 0 (0.0%) | 10 (100.0%) |
| Total (Category) | 0 (0.0%) | 15 (100.0%) |
| Total (Overall) | 43 (31.4%) | 94 (68.6%) |
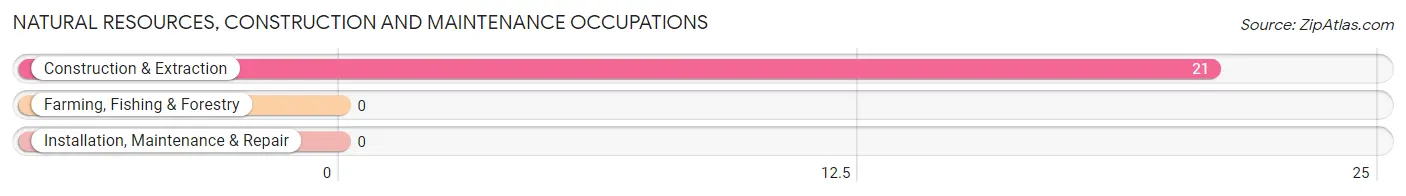
Natural Resources, Construction and Maintenance Occupations
The most common Natural Resources, Construction and Maintenance occupations in Covington are , and Construction & Extraction (21 | 15.3%).
Natural Resources, Construction and Maintenance Occupations by Sex
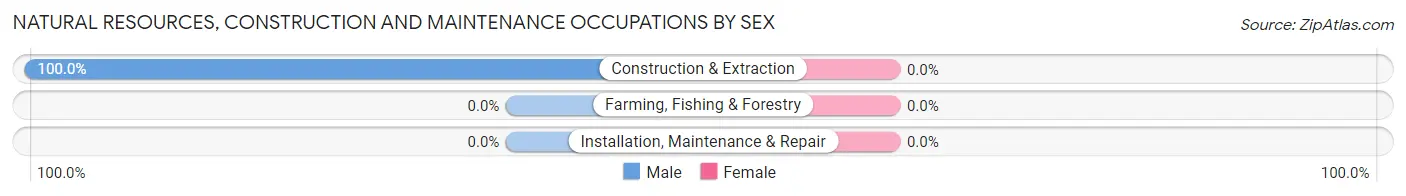
| Occupation | Male | Female |
| Farming, Fishing & Forestry | 0 (0.0%) | 0 (0.0%) |
| Construction & Extraction | 21 (100.0%) | 0 (0.0%) |
| Installation, Maintenance & Repair | 0 (0.0%) | 0 (0.0%) |
| Total (Category) | 21 (100.0%) | 0 (0.0%) |
| Total (Overall) | 43 (31.4%) | 94 (68.6%) |
Production, Transportation and Moving Occupations
The most common Production, Transportation and Moving occupations in Covington are Production (17 | 12.4%), and Material Moving (4 | 2.9%).
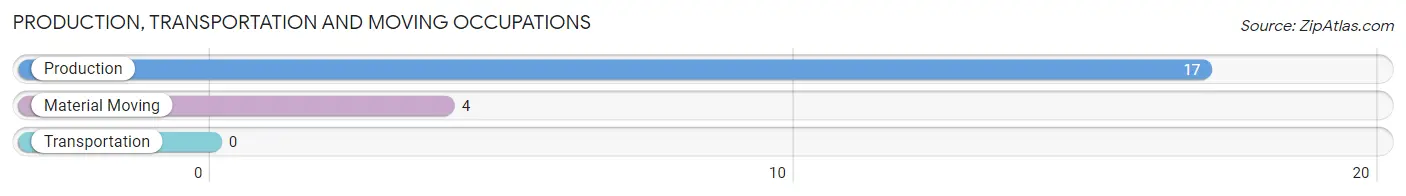
Production, Transportation and Moving Occupations by Sex
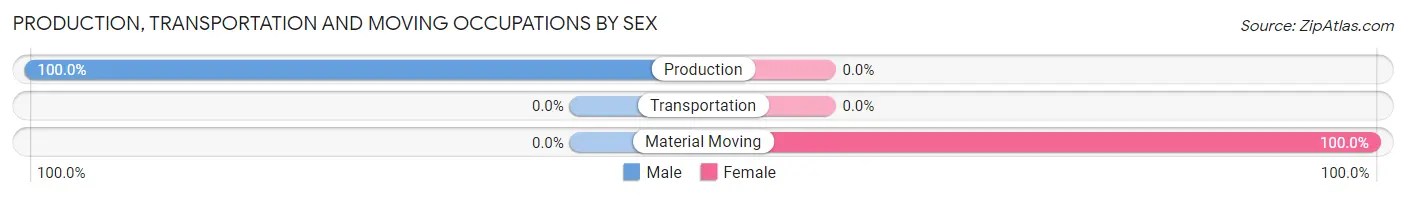
| Occupation | Male | Female |
| Production | 17 (100.0%) | 0 (0.0%) |
| Transportation | 0 (0.0%) | 0 (0.0%) |
| Material Moving | 0 (0.0%) | 4 (100.0%) |
| Total (Category) | 17 (80.9%) | 4 (19.1%) |
| Total (Overall) | 43 (31.4%) | 94 (68.6%) |
Employment Industries by Sex in Covington
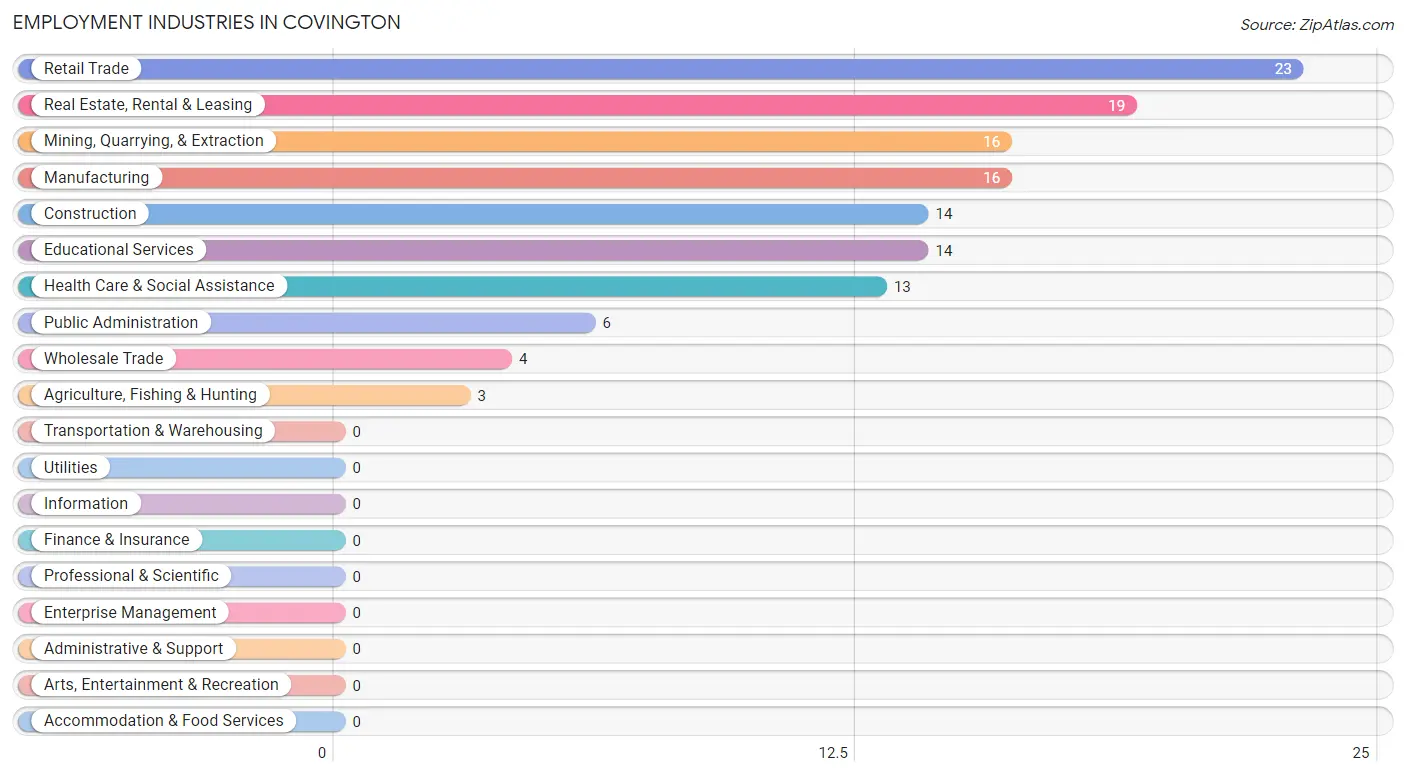
Employment Industries in Covington
The major employment industries in Covington include Retail Trade (23 | 16.8%), Real Estate, Rental & Leasing (19 | 13.9%), Mining, Quarrying, & Extraction (16 | 11.7%), Manufacturing (16 | 11.7%), and Construction (14 | 10.2%).
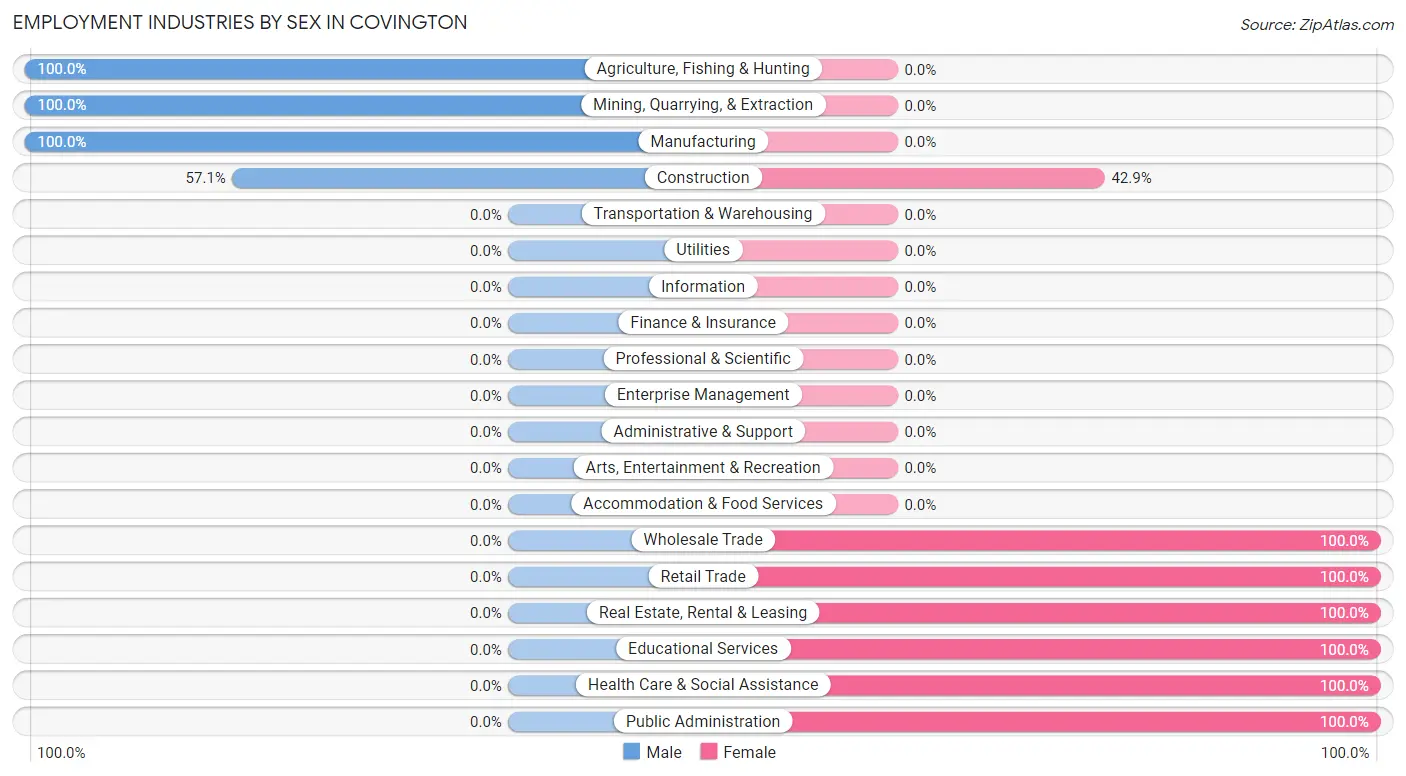
Employment Industries by Sex in Covington
The Covington industries that see more men than women are Agriculture, Fishing & Hunting (100.0%), Mining, Quarrying, & Extraction (100.0%), and Manufacturing (100.0%), whereas the industries that tend to have a higher number of women are Wholesale Trade (100.0%), Retail Trade (100.0%), and Real Estate, Rental & Leasing (100.0%).
| Industry | Male | Female |
| Agriculture, Fishing & Hunting | 3 (100.0%) | 0 (0.0%) |
| Mining, Quarrying, & Extraction | 16 (100.0%) | 0 (0.0%) |
| Construction | 8 (57.1%) | 6 (42.9%) |
| Manufacturing | 16 (100.0%) | 0 (0.0%) |
| Wholesale Trade | 0 (0.0%) | 4 (100.0%) |
| Retail Trade | 0 (0.0%) | 23 (100.0%) |
| Transportation & Warehousing | 0 (0.0%) | 0 (0.0%) |
| Utilities | 0 (0.0%) | 0 (0.0%) |
| Information | 0 (0.0%) | 0 (0.0%) |
| Finance & Insurance | 0 (0.0%) | 0 (0.0%) |
| Real Estate, Rental & Leasing | 0 (0.0%) | 19 (100.0%) |
| Professional & Scientific | 0 (0.0%) | 0 (0.0%) |
| Enterprise Management | 0 (0.0%) | 0 (0.0%) |
| Administrative & Support | 0 (0.0%) | 0 (0.0%) |
| Educational Services | 0 (0.0%) | 14 (100.0%) |
| Health Care & Social Assistance | 0 (0.0%) | 13 (100.0%) |
| Arts, Entertainment & Recreation | 0 (0.0%) | 0 (0.0%) |
| Accommodation & Food Services | 0 (0.0%) | 0 (0.0%) |
| Public Administration | 0 (0.0%) | 6 (100.0%) |
| Total | 43 (31.4%) | 94 (68.6%) |
Education in Covington
School Enrollment in Covington
The most common levels of schooling among the 77 students in Covington are elementary school (32 | 41.6%), high school (31 | 40.3%), and middle school (7 | 9.1%).
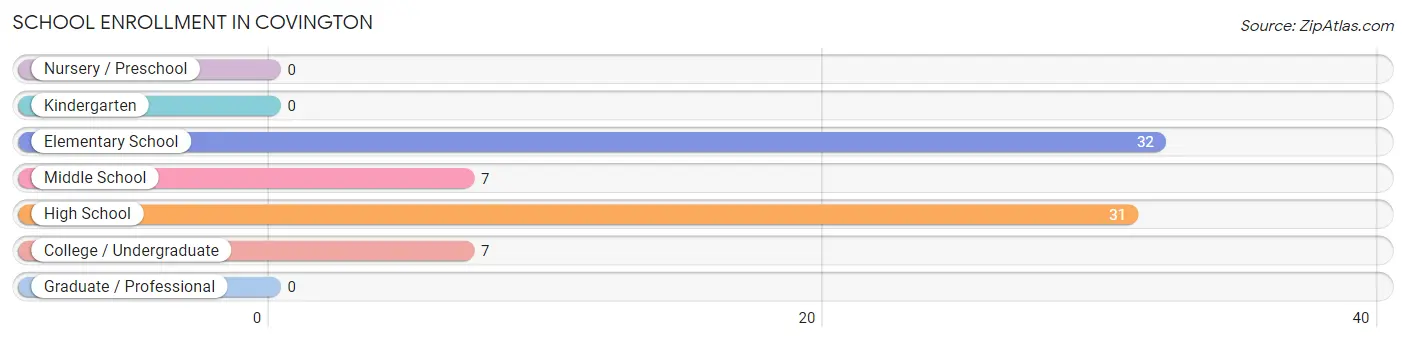
| School Level | # Students | % Students |
| Nursery / Preschool | 0 | 0.0% |
| Kindergarten | 0 | 0.0% |
| Elementary School | 32 | 41.6% |
| Middle School | 7 | 9.1% |
| High School | 31 | 40.3% |
| College / Undergraduate | 7 | 9.1% |
| Graduate / Professional | 0 | 0.0% |
| Total | 77 | 100.0% |
School Enrollment by Age by Funding Source in Covington
Out of a total of 77 students who are enrolled in schools in Covington, 17 (22.1%) attend a private institution, while the remaining 60 (77.9%) are enrolled in public schools. The age group of 10 to 14 year olds has the highest likelihood of being enrolled in private schools, with 17 (39.5% in the age bracket) enrolled. Conversely, the age group of 5 to 9 year old has the lowest likelihood of being enrolled in a private school, with 15 (100.0% in the age bracket) attending a public institution.
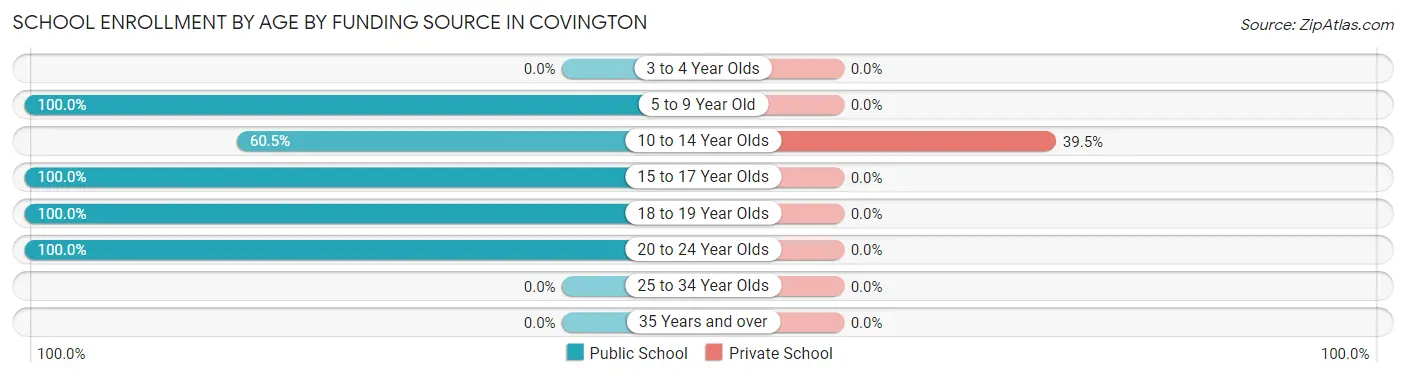
| Age Bracket | Public School | Private School |
| 3 to 4 Year Olds | 0 (0.0%) | 0 (0.0%) |
| 5 to 9 Year Old | 15 (100.0%) | 0 (0.0%) |
| 10 to 14 Year Olds | 26 (60.5%) | 17 (39.5%) |
| 15 to 17 Year Olds | 8 (100.0%) | 0 (0.0%) |
| 18 to 19 Year Olds | 4 (100.0%) | 0 (0.0%) |
| 20 to 24 Year Olds | 7 (100.0%) | 0 (0.0%) |
| 25 to 34 Year Olds | 0 (0.0%) | 0 (0.0%) |
| 35 Years and over | 0 (0.0%) | 0 (0.0%) |
| Total | 60 (77.9%) | 17 (22.1%) |
Educational Attainment by Field of Study in Covington
Bio, nature & agricultural (16 | 47.1%), education (3 | 8.8%), visual & performing arts (3 | 8.8%), arts & humanities (3 | 8.8%), and psychology (2 | 5.9%) are the most common fields of study among 34 individuals in Covington who have obtained a bachelor's degree or higher.
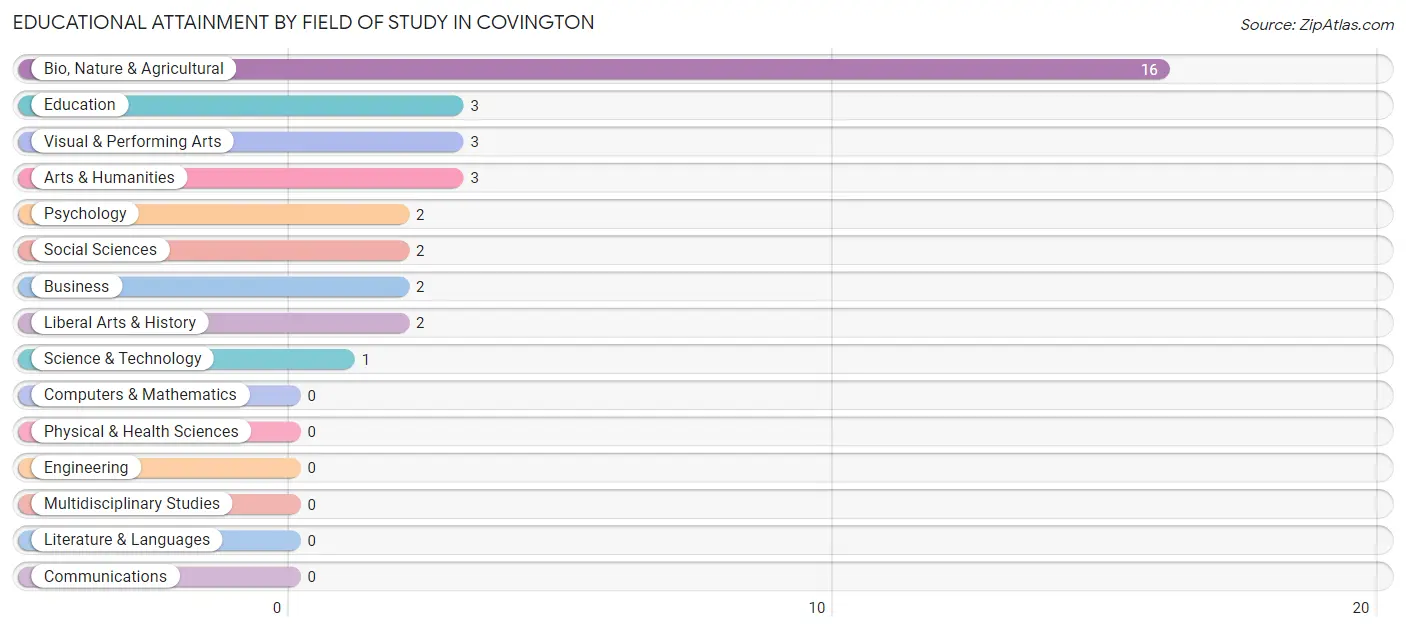
| Field of Study | # Graduates | % Graduates |
| Computers & Mathematics | 0 | 0.0% |
| Bio, Nature & Agricultural | 16 | 47.1% |
| Physical & Health Sciences | 0 | 0.0% |
| Psychology | 2 | 5.9% |
| Social Sciences | 2 | 5.9% |
| Engineering | 0 | 0.0% |
| Multidisciplinary Studies | 0 | 0.0% |
| Science & Technology | 1 | 2.9% |
| Business | 2 | 5.9% |
| Education | 3 | 8.8% |
| Literature & Languages | 0 | 0.0% |
| Liberal Arts & History | 2 | 5.9% |
| Visual & Performing Arts | 3 | 8.8% |
| Communications | 0 | 0.0% |
| Arts & Humanities | 3 | 8.8% |
| Total | 34 | 100.0% |
Transportation & Commute in Covington
Vehicle Availability by Sex in Covington
The most prevalent vehicle ownership categories in Covington are males with 3 vehicles (33, accounting for 76.7%) and females with 3 vehicles (45, making up 35.1%).
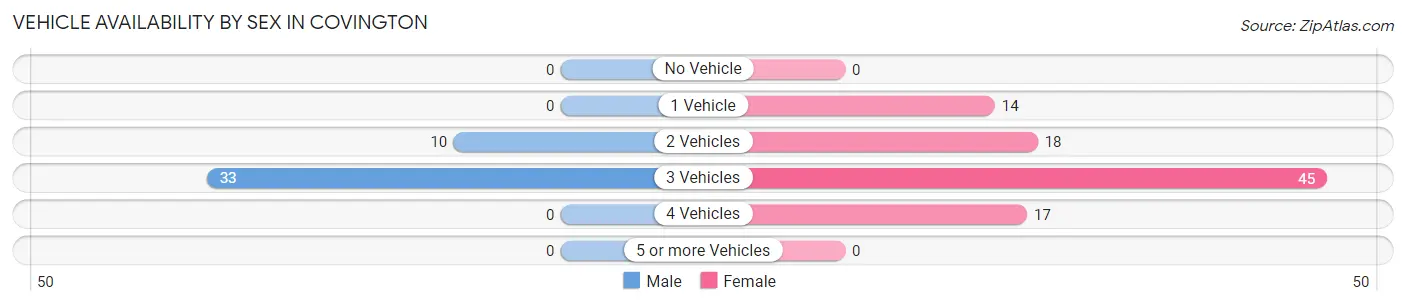
| Vehicles Available | Male | Female |
| No Vehicle | 0 (0.0%) | 0 (0.0%) |
| 1 Vehicle | 0 (0.0%) | 14 (14.9%) |
| 2 Vehicles | 10 (23.3%) | 18 (19.2%) |
| 3 Vehicles | 33 (76.7%) | 45 (47.9%) |
| 4 Vehicles | 0 (0.0%) | 17 (18.1%) |
| 5 or more Vehicles | 0 (0.0%) | 0 (0.0%) |
| Total | 43 (100.0%) | 94 (100.0%) |
Commute Time in Covington
The most frequently occuring commute durations in Covington are 20 to 24 minutes (45 commuters, 32.9%), 10 to 14 minutes (29 commuters, 21.2%), and 30 to 34 minutes (19 commuters, 13.9%).
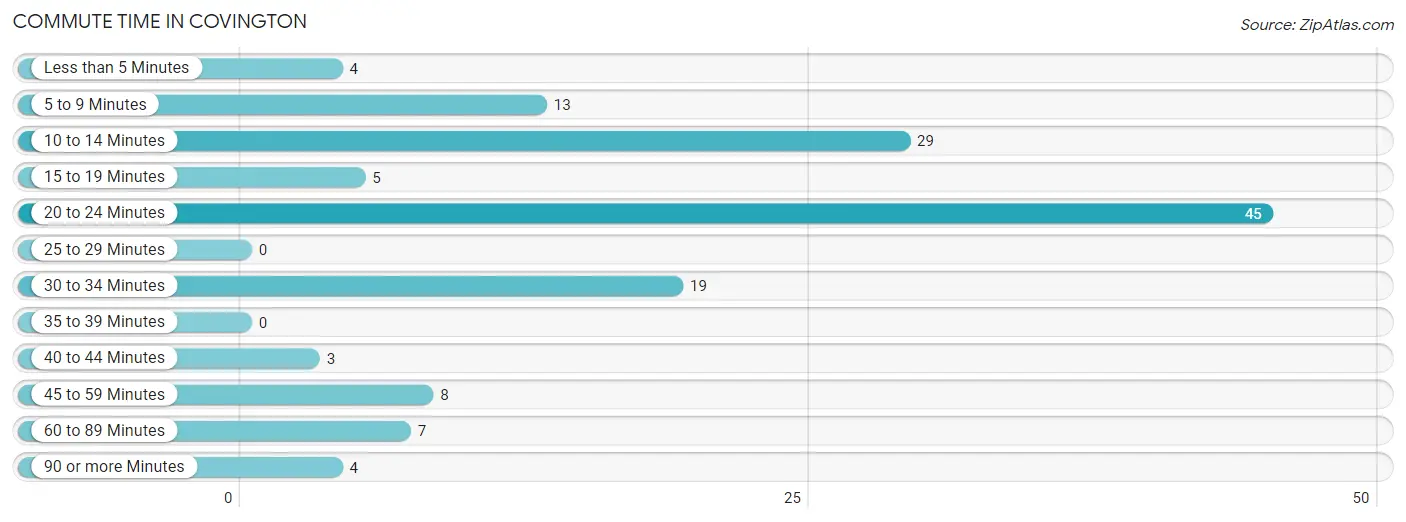
| Commute Time | # Commuters | % Commuters |
| Less than 5 Minutes | 4 | 2.9% |
| 5 to 9 Minutes | 13 | 9.5% |
| 10 to 14 Minutes | 29 | 21.2% |
| 15 to 19 Minutes | 5 | 3.6% |
| 20 to 24 Minutes | 45 | 32.9% |
| 25 to 29 Minutes | 0 | 0.0% |
| 30 to 34 Minutes | 19 | 13.9% |
| 35 to 39 Minutes | 0 | 0.0% |
| 40 to 44 Minutes | 3 | 2.2% |
| 45 to 59 Minutes | 8 | 5.8% |
| 60 to 89 Minutes | 7 | 5.1% |
| 90 or more Minutes | 4 | 2.9% |
Commute Time by Sex in Covington
The most common commute times in Covington are 10 to 14 minutes (21 commuters, 48.8%) for males and 20 to 24 minutes (45 commuters, 47.9%) for females.
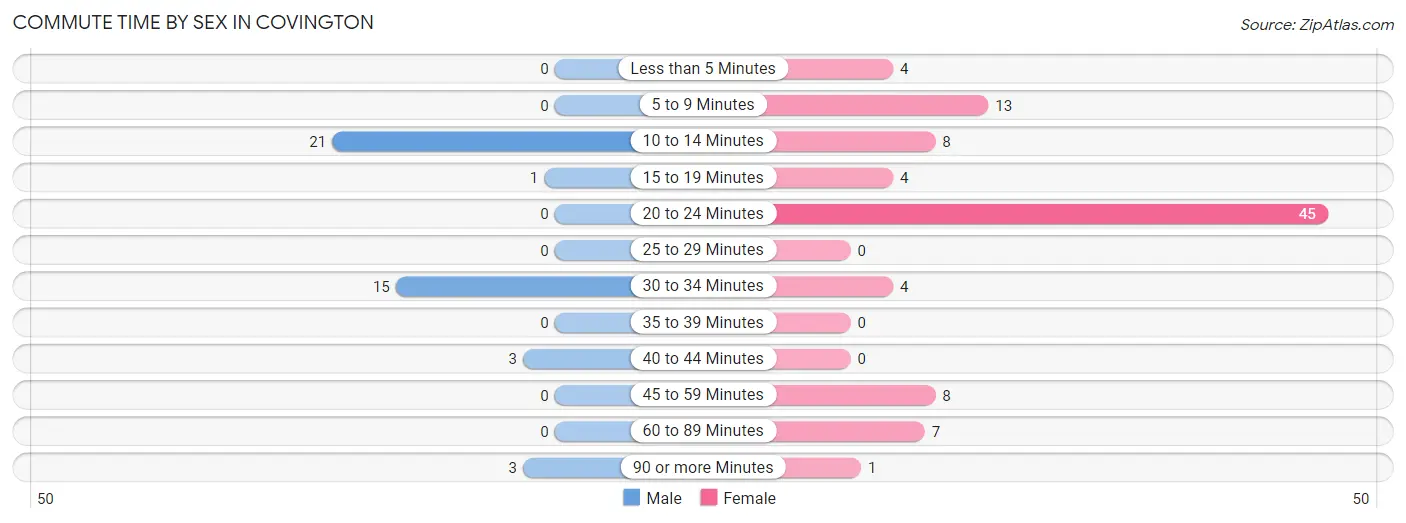
| Commute Time | Male | Female |
| Less than 5 Minutes | 0 (0.0%) | 4 (4.3%) |
| 5 to 9 Minutes | 0 (0.0%) | 13 (13.8%) |
| 10 to 14 Minutes | 21 (48.8%) | 8 (8.5%) |
| 15 to 19 Minutes | 1 (2.3%) | 4 (4.3%) |
| 20 to 24 Minutes | 0 (0.0%) | 45 (47.9%) |
| 25 to 29 Minutes | 0 (0.0%) | 0 (0.0%) |
| 30 to 34 Minutes | 15 (34.9%) | 4 (4.3%) |
| 35 to 39 Minutes | 0 (0.0%) | 0 (0.0%) |
| 40 to 44 Minutes | 3 (7.0%) | 0 (0.0%) |
| 45 to 59 Minutes | 0 (0.0%) | 8 (8.5%) |
| 60 to 89 Minutes | 0 (0.0%) | 7 (7.4%) |
| 90 or more Minutes | 3 (7.0%) | 1 (1.1%) |
Time of Departure to Work by Sex in Covington
The most frequent times of departure to work in Covington are 5:30 AM to 5:59 AM (17, 39.5%) for males and 6:00 AM to 6:29 AM (23, 24.5%) for females.
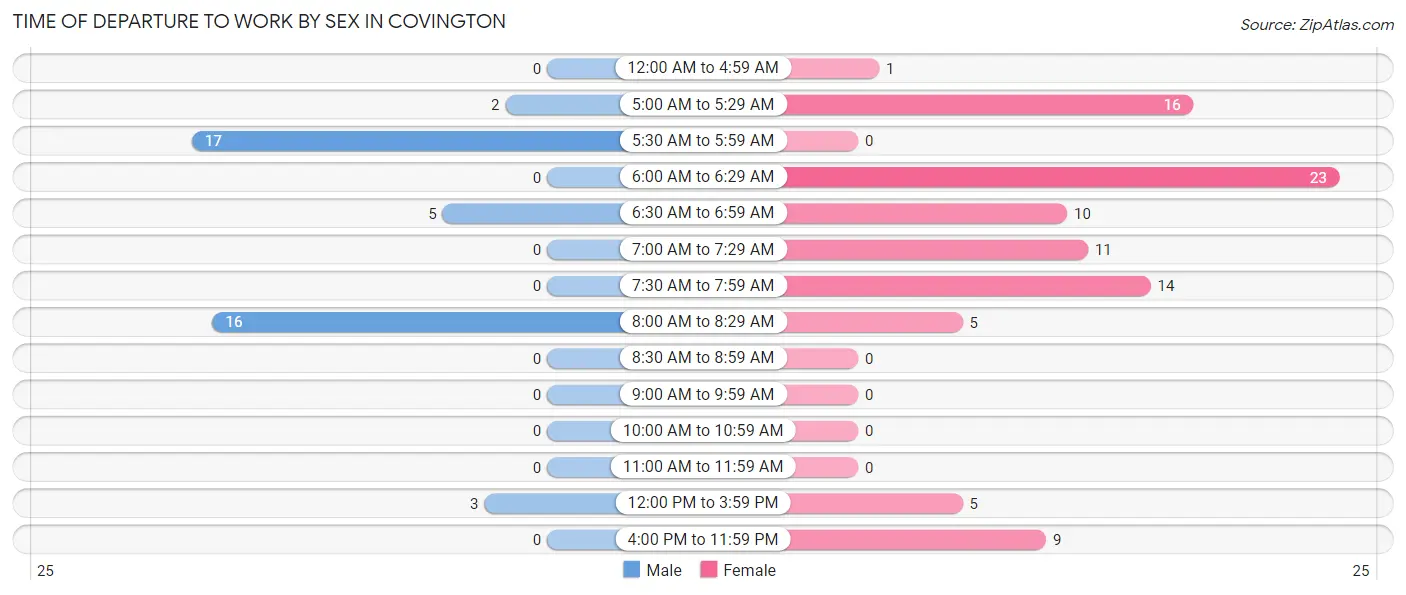
| Time of Departure | Male | Female |
| 12:00 AM to 4:59 AM | 0 (0.0%) | 1 (1.1%) |
| 5:00 AM to 5:29 AM | 2 (4.6%) | 16 (17.0%) |
| 5:30 AM to 5:59 AM | 17 (39.5%) | 0 (0.0%) |
| 6:00 AM to 6:29 AM | 0 (0.0%) | 23 (24.5%) |
| 6:30 AM to 6:59 AM | 5 (11.6%) | 10 (10.6%) |
| 7:00 AM to 7:29 AM | 0 (0.0%) | 11 (11.7%) |
| 7:30 AM to 7:59 AM | 0 (0.0%) | 14 (14.9%) |
| 8:00 AM to 8:29 AM | 16 (37.2%) | 5 (5.3%) |
| 8:30 AM to 8:59 AM | 0 (0.0%) | 0 (0.0%) |
| 9:00 AM to 9:59 AM | 0 (0.0%) | 0 (0.0%) |
| 10:00 AM to 10:59 AM | 0 (0.0%) | 0 (0.0%) |
| 11:00 AM to 11:59 AM | 0 (0.0%) | 0 (0.0%) |
| 12:00 PM to 3:59 PM | 3 (7.0%) | 5 (5.3%) |
| 4:00 PM to 11:59 PM | 0 (0.0%) | 9 (9.6%) |
| Total | 43 (100.0%) | 94 (100.0%) |
Housing Occupancy in Covington
Occupancy by Ownership in Covington
Of the total 88 dwellings in Covington, owner-occupied units account for 70 (79.5%), while renter-occupied units make up 18 (20.4%).
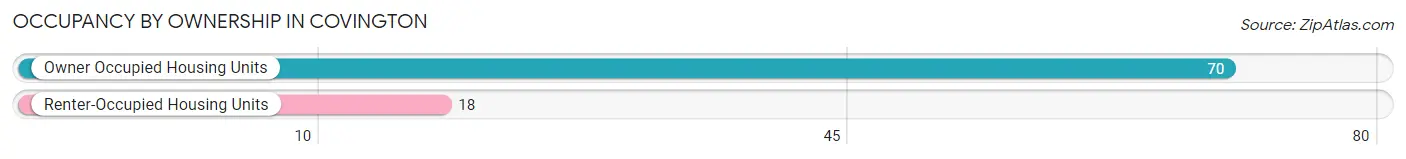
| Occupancy | # Housing Units | % Housing Units |
| Owner Occupied Housing Units | 70 | 79.5% |
| Renter-Occupied Housing Units | 18 | 20.4% |
| Total Occupied Housing Units | 88 | 100.0% |
Occupancy by Household Size in Covington
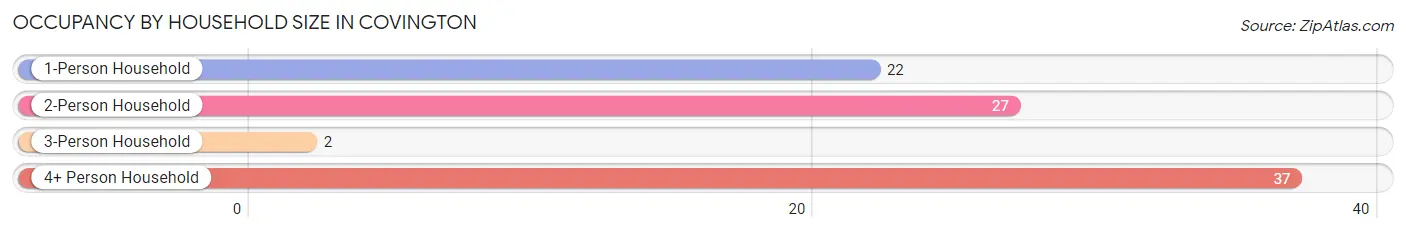
| Household Size | # Housing Units | % Housing Units |
| 1-Person Household | 22 | 25.0% |
| 2-Person Household | 27 | 30.7% |
| 3-Person Household | 2 | 2.3% |
| 4+ Person Household | 37 | 42.0% |
| Total Housing Units | 88 | 100.0% |
Occupancy by Ownership by Household Size in Covington
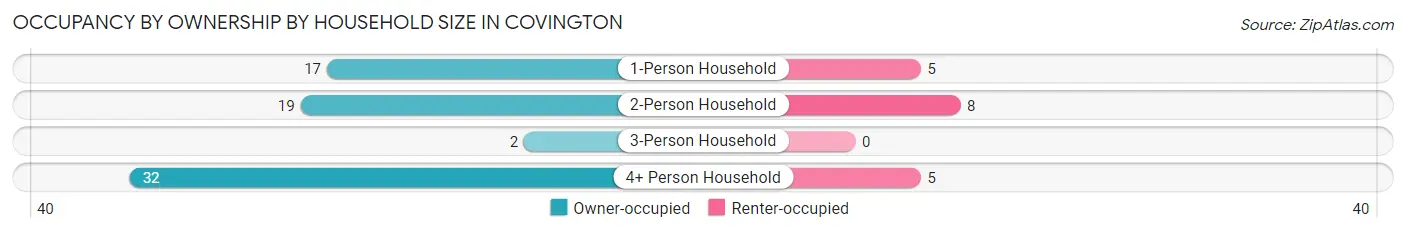
| Household Size | Owner-occupied | Renter-occupied |
| 1-Person Household | 17 (77.3%) | 5 (22.7%) |
| 2-Person Household | 19 (70.4%) | 8 (29.6%) |
| 3-Person Household | 2 (100.0%) | 0 (0.0%) |
| 4+ Person Household | 32 (86.5%) | 5 (13.5%) |
| Total Housing Units | 70 (79.5%) | 18 (20.4%) |
Occupancy by Educational Attainment in Covington
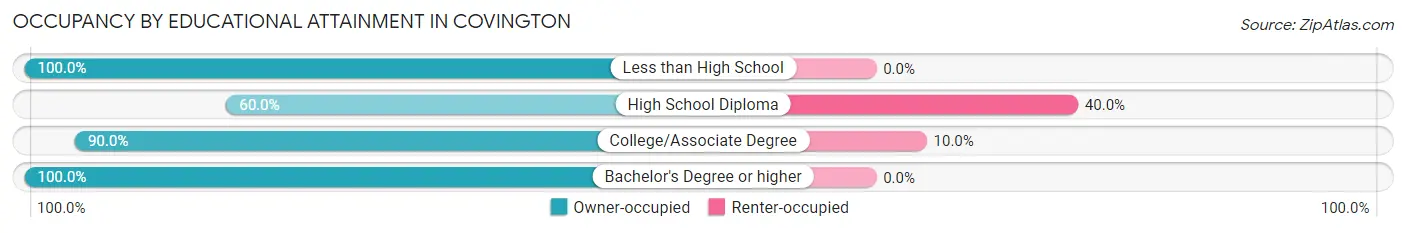
| Household Size | Owner-occupied | Renter-occupied |
| Less than High School | 2 (100.0%) | 0 (0.0%) |
| High School Diploma | 21 (60.0%) | 14 (40.0%) |
| College/Associate Degree | 36 (90.0%) | 4 (10.0%) |
| Bachelor's Degree or higher | 11 (100.0%) | 0 (0.0%) |
Occupancy by Age of Householder in Covington
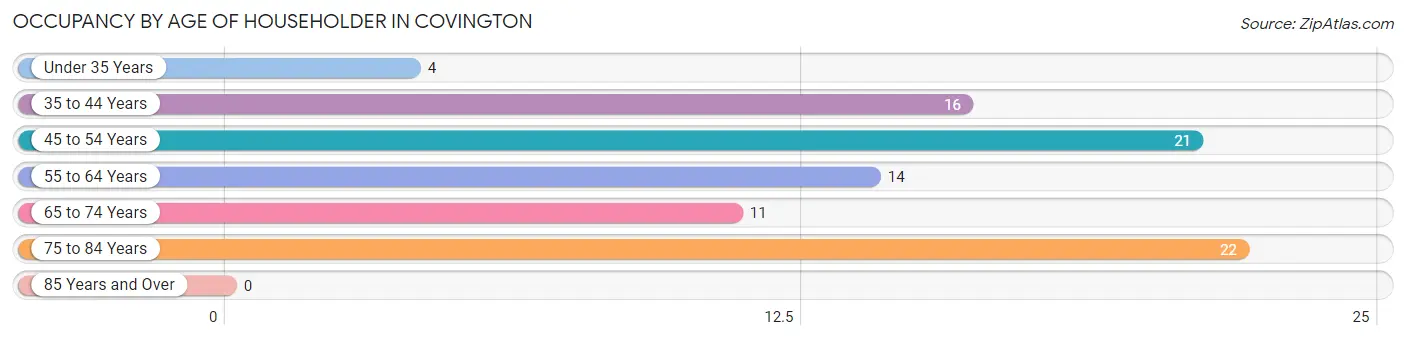
| Age Bracket | # Households | % Households |
| Under 35 Years | 4 | 4.5% |
| 35 to 44 Years | 16 | 18.2% |
| 45 to 54 Years | 21 | 23.9% |
| 55 to 64 Years | 14 | 15.9% |
| 65 to 74 Years | 11 | 12.5% |
| 75 to 84 Years | 22 | 25.0% |
| 85 Years and Over | 0 | 0.0% |
| Total | 88 | 100.0% |
Housing Finances in Covington
Median Income by Occupancy in Covington
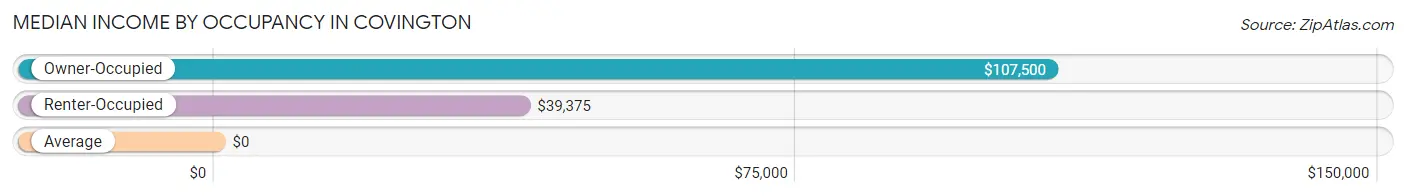
| Occupancy Type | # Households | Median Income |
| Owner-Occupied | 70 (79.5%) | $107,500 |
| Renter-Occupied | 18 (20.4%) | $39,375 |
| Average | 88 (100.0%) | $0 |
Occupancy by Householder Income Bracket in Covington
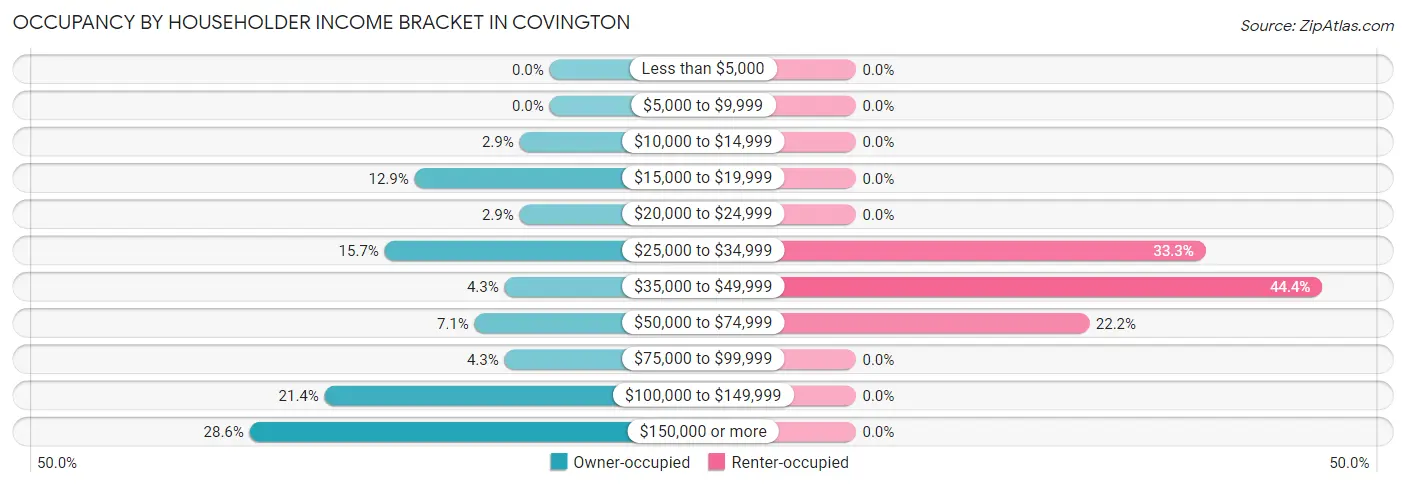
| Income Bracket | Owner-occupied | Renter-occupied |
| Less than $5,000 | 0 (0.0%) | 0 (0.0%) |
| $5,000 to $9,999 | 0 (0.0%) | 0 (0.0%) |
| $10,000 to $14,999 | 2 (2.9%) | 0 (0.0%) |
| $15,000 to $19,999 | 9 (12.9%) | 0 (0.0%) |
| $20,000 to $24,999 | 2 (2.9%) | 0 (0.0%) |
| $25,000 to $34,999 | 11 (15.7%) | 6 (33.3%) |
| $35,000 to $49,999 | 3 (4.3%) | 8 (44.4%) |
| $50,000 to $74,999 | 5 (7.1%) | 4 (22.2%) |
| $75,000 to $99,999 | 3 (4.3%) | 0 (0.0%) |
| $100,000 to $149,999 | 15 (21.4%) | 0 (0.0%) |
| $150,000 or more | 20 (28.6%) | 0 (0.0%) |
| Total | 70 (100.0%) | 18 (100.0%) |
Monthly Housing Cost Tiers in Covington
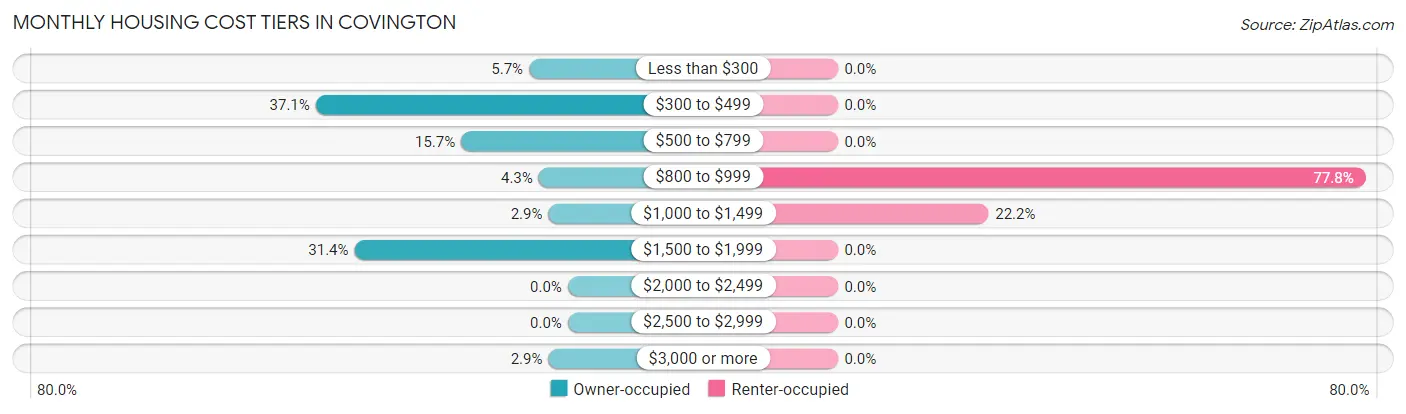
| Monthly Cost | Owner-occupied | Renter-occupied |
| Less than $300 | 4 (5.7%) | 0 (0.0%) |
| $300 to $499 | 26 (37.1%) | 0 (0.0%) |
| $500 to $799 | 11 (15.7%) | 0 (0.0%) |
| $800 to $999 | 3 (4.3%) | 14 (77.8%) |
| $1,000 to $1,499 | 2 (2.9%) | 4 (22.2%) |
| $1,500 to $1,999 | 22 (31.4%) | 0 (0.0%) |
| $2,000 to $2,499 | 0 (0.0%) | 0 (0.0%) |
| $2,500 to $2,999 | 0 (0.0%) | 0 (0.0%) |
| $3,000 or more | 2 (2.9%) | 0 (0.0%) |
| Total | 70 (100.0%) | 18 (100.0%) |
Physical Housing Characteristics in Covington
Housing Structures in Covington
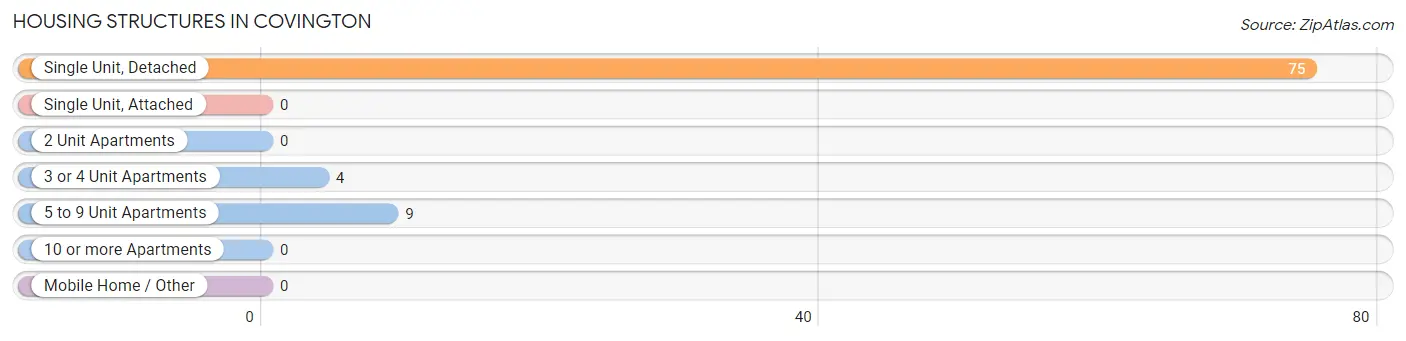
| Structure Type | # Housing Units | % Housing Units |
| Single Unit, Detached | 75 | 85.2% |
| Single Unit, Attached | 0 | 0.0% |
| 2 Unit Apartments | 0 | 0.0% |
| 3 or 4 Unit Apartments | 4 | 4.5% |
| 5 to 9 Unit Apartments | 9 | 10.2% |
| 10 or more Apartments | 0 | 0.0% |
| Mobile Home / Other | 0 | 0.0% |
| Total | 88 | 100.0% |
Housing Structures by Occupancy in Covington
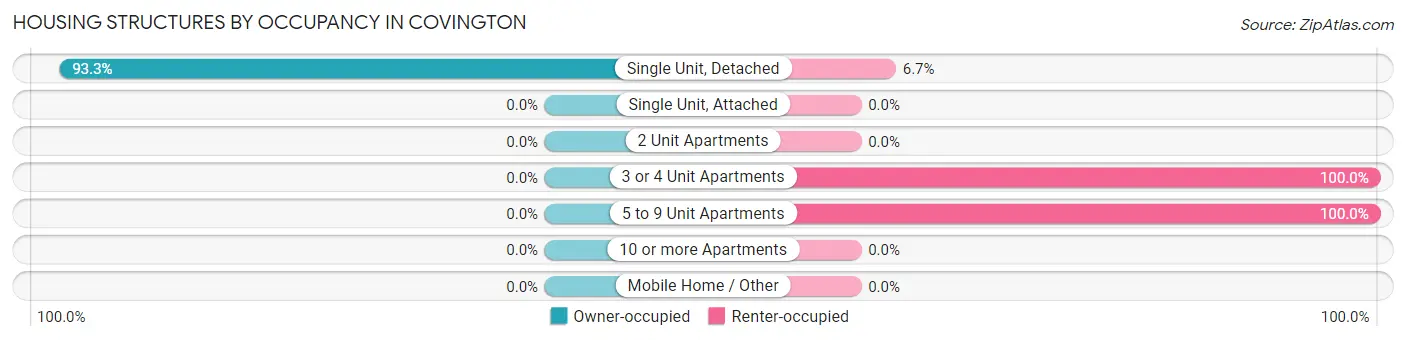
| Structure Type | Owner-occupied | Renter-occupied |
| Single Unit, Detached | 70 (93.3%) | 5 (6.7%) |
| Single Unit, Attached | 0 (0.0%) | 0 (0.0%) |
| 2 Unit Apartments | 0 (0.0%) | 0 (0.0%) |
| 3 or 4 Unit Apartments | 0 (0.0%) | 4 (100.0%) |
| 5 to 9 Unit Apartments | 0 (0.0%) | 9 (100.0%) |
| 10 or more Apartments | 0 (0.0%) | 0 (0.0%) |
| Mobile Home / Other | 0 (0.0%) | 0 (0.0%) |
| Total | 70 (79.5%) | 18 (20.4%) |
Housing Structures by Number of Rooms in Covington
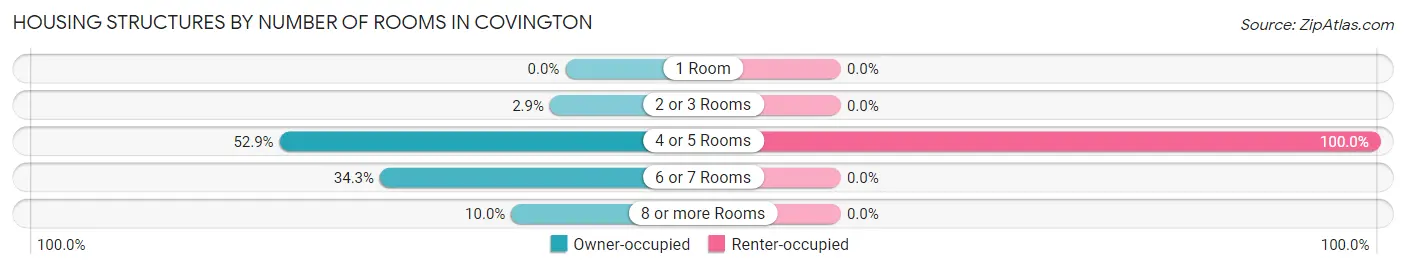
| Number of Rooms | Owner-occupied | Renter-occupied |
| 1 Room | 0 (0.0%) | 0 (0.0%) |
| 2 or 3 Rooms | 2 (2.9%) | 0 (0.0%) |
| 4 or 5 Rooms | 37 (52.9%) | 18 (100.0%) |
| 6 or 7 Rooms | 24 (34.3%) | 0 (0.0%) |
| 8 or more Rooms | 7 (10.0%) | 0 (0.0%) |
| Total | 70 (100.0%) | 18 (100.0%) |
Housing Structure by Heating Type in Covington
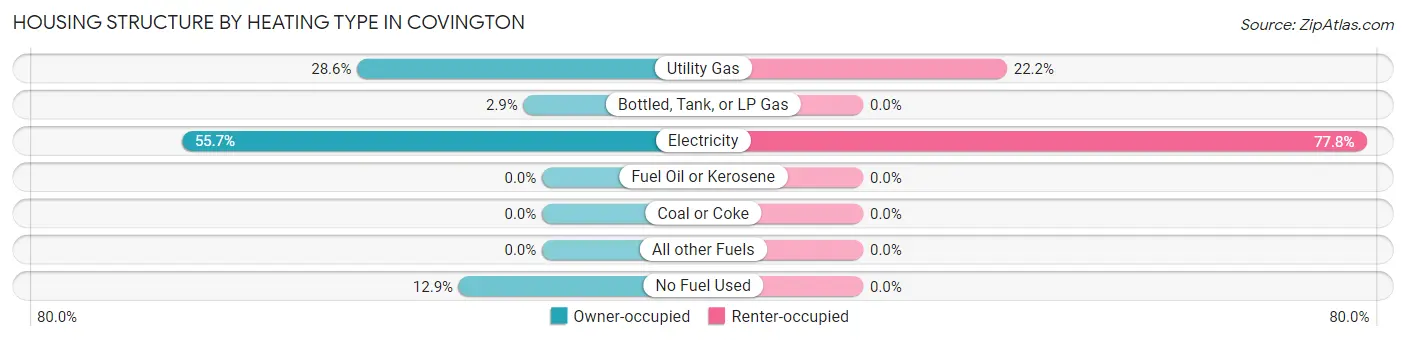
| Heating Type | Owner-occupied | Renter-occupied |
| Utility Gas | 20 (28.6%) | 4 (22.2%) |
| Bottled, Tank, or LP Gas | 2 (2.9%) | 0 (0.0%) |
| Electricity | 39 (55.7%) | 14 (77.8%) |
| Fuel Oil or Kerosene | 0 (0.0%) | 0 (0.0%) |
| Coal or Coke | 0 (0.0%) | 0 (0.0%) |
| All other Fuels | 0 (0.0%) | 0 (0.0%) |
| No Fuel Used | 9 (12.9%) | 0 (0.0%) |
| Total | 70 (100.0%) | 18 (100.0%) |
Household Vehicle Usage in Covington
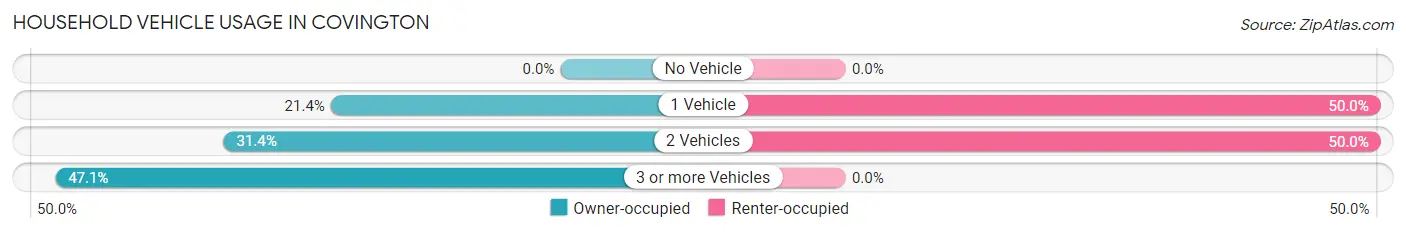
| Vehicles per Household | Owner-occupied | Renter-occupied |
| No Vehicle | 0 (0.0%) | 0 (0.0%) |
| 1 Vehicle | 15 (21.4%) | 9 (50.0%) |
| 2 Vehicles | 22 (31.4%) | 9 (50.0%) |
| 3 or more Vehicles | 33 (47.1%) | 0 (0.0%) |
| Total | 70 (100.0%) | 18 (100.0%) |
Real Estate & Mortgages in Covington
Real Estate and Mortgage Overview in Covington
| Characteristic | Without Mortgage | With Mortgage |
| Housing Units | 43 | 27 |
| Median Property Value | $105,400 | $439,500 |
| Median Household Income | - | - |
| Monthly Housing Costs | $455 | $2 |
| Real Estate Taxes | $940 | $0 |
Property Value by Mortgage Status in Covington
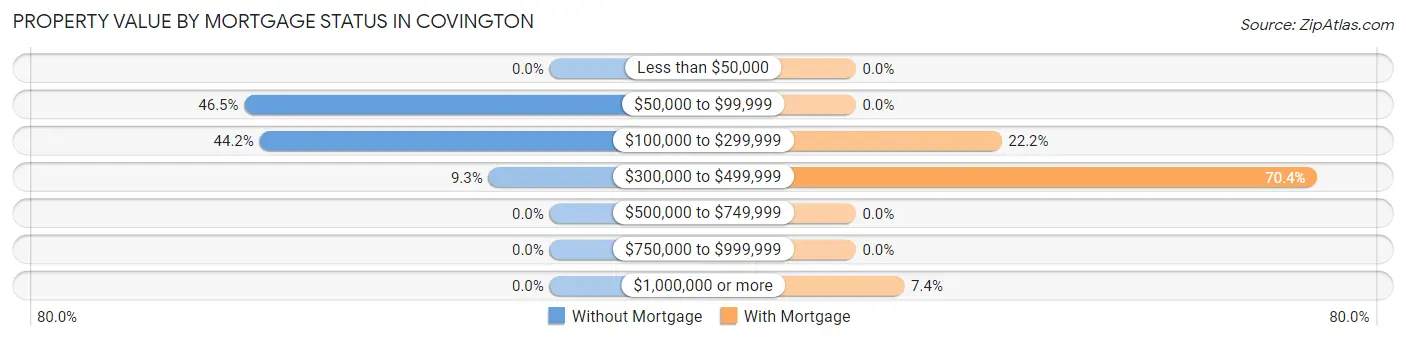
| Property Value | Without Mortgage | With Mortgage |
| Less than $50,000 | 0 (0.0%) | 0 (0.0%) |
| $50,000 to $99,999 | 20 (46.5%) | 0 (0.0%) |
| $100,000 to $299,999 | 19 (44.2%) | 6 (22.2%) |
| $300,000 to $499,999 | 4 (9.3%) | 19 (70.4%) |
| $500,000 to $749,999 | 0 (0.0%) | 0 (0.0%) |
| $750,000 to $999,999 | 0 (0.0%) | 0 (0.0%) |
| $1,000,000 or more | 0 (0.0%) | 2 (7.4%) |
| Total | 43 (100.0%) | 27 (100.0%) |
Household Income by Mortgage Status in Covington
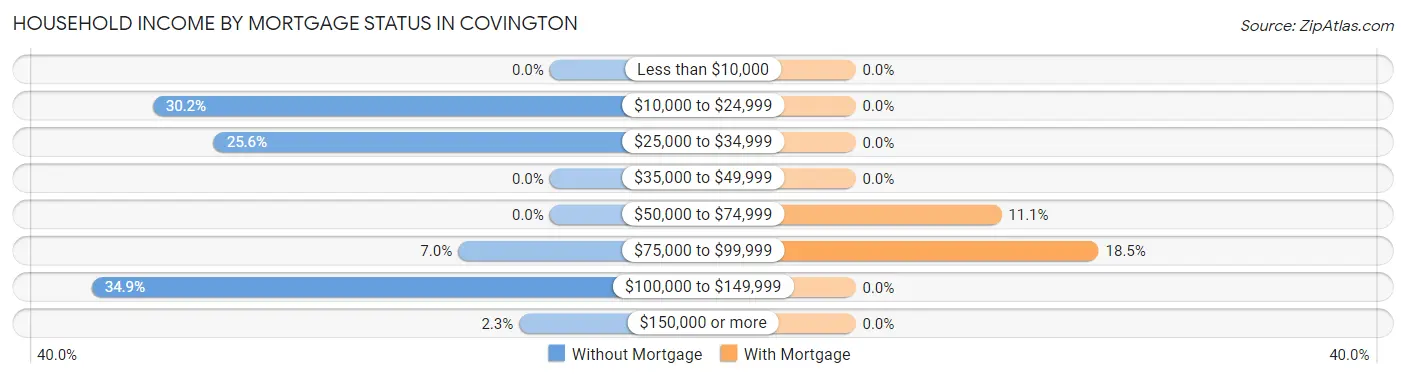
| Household Income | Without Mortgage | With Mortgage |
| Less than $10,000 | 0 (0.0%) | 0 (0.0%) |
| $10,000 to $24,999 | 13 (30.2%) | 0 (0.0%) |
| $25,000 to $34,999 | 11 (25.6%) | 0 (0.0%) |
| $35,000 to $49,999 | 0 (0.0%) | 0 (0.0%) |
| $50,000 to $74,999 | 0 (0.0%) | 3 (11.1%) |
| $75,000 to $99,999 | 3 (7.0%) | 5 (18.5%) |
| $100,000 to $149,999 | 15 (34.9%) | 0 (0.0%) |
| $150,000 or more | 1 (2.3%) | 0 (0.0%) |
| Total | 43 (100.0%) | 27 (100.0%) |
Property Value to Household Income Ratio in Covington
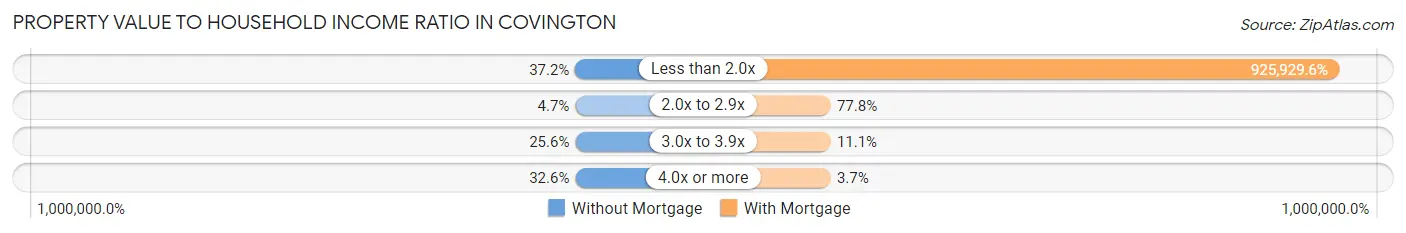
| Value-to-Income Ratio | Without Mortgage | With Mortgage |
| Less than 2.0x | 16 (37.2%) | 250,001 (925,929.6%) |
| 2.0x to 2.9x | 2 (4.6%) | 21 (77.8%) |
| 3.0x to 3.9x | 11 (25.6%) | 3 (11.1%) |
| 4.0x or more | 14 (32.6%) | 1 (3.7%) |
| Total | 43 (100.0%) | 27 (100.0%) |
Real Estate Taxes by Mortgage Status in Covington
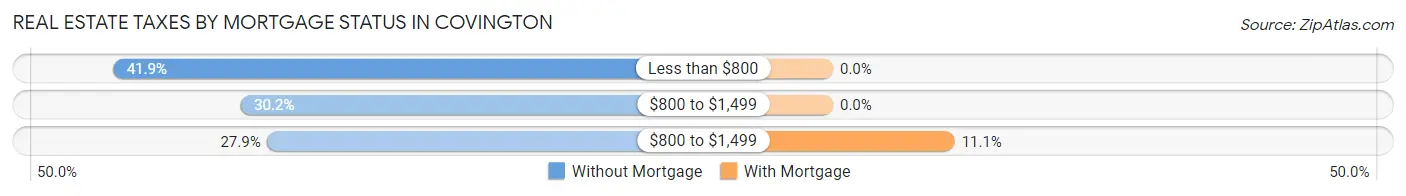
| Property Taxes | Without Mortgage | With Mortgage |
| Less than $800 | 18 (41.9%) | 0 (0.0%) |
| $800 to $1,499 | 13 (30.2%) | 0 (0.0%) |
| $800 to $1,499 | 12 (27.9%) | 3 (11.1%) |
| Total | 43 (100.0%) | 27 (100.0%) |
Health & Disability in Covington
Health Insurance Coverage by Age in Covington
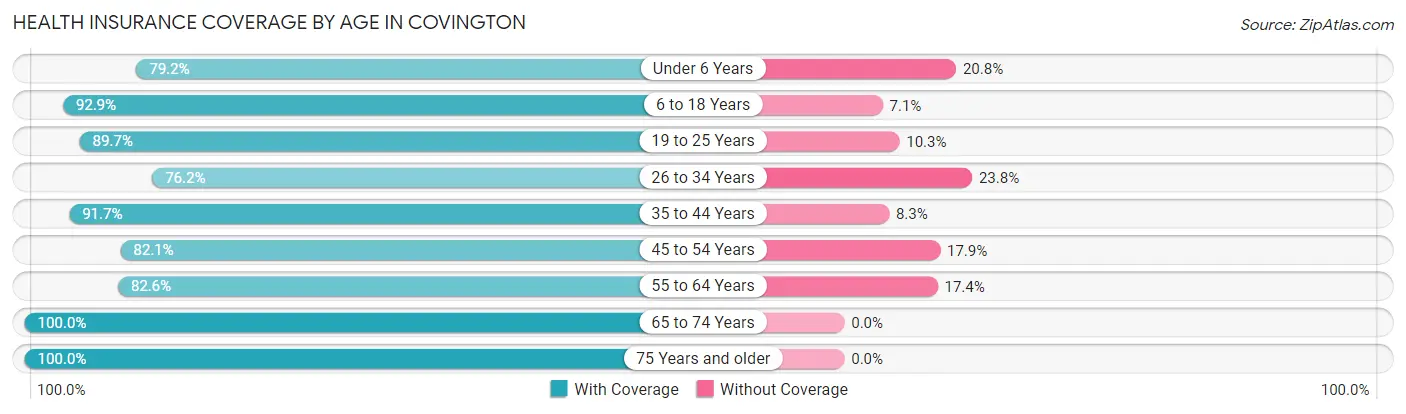
| Age Bracket | With Coverage | Without Coverage |
| Under 6 Years | 19 (79.2%) | 5 (20.8%) |
| 6 to 18 Years | 65 (92.9%) | 5 (7.1%) |
| 19 to 25 Years | 35 (89.7%) | 4 (10.3%) |
| 26 to 34 Years | 16 (76.2%) | 5 (23.8%) |
| 35 to 44 Years | 44 (91.7%) | 4 (8.3%) |
| 45 to 54 Years | 23 (82.1%) | 5 (17.9%) |
| 55 to 64 Years | 19 (82.6%) | 4 (17.4%) |
| 65 to 74 Years | 17 (100.0%) | 0 (0.0%) |
| 75 Years and older | 28 (100.0%) | 0 (0.0%) |
| Total | 266 (89.3%) | 32 (10.7%) |
Health Insurance Coverage by Citizenship Status in Covington
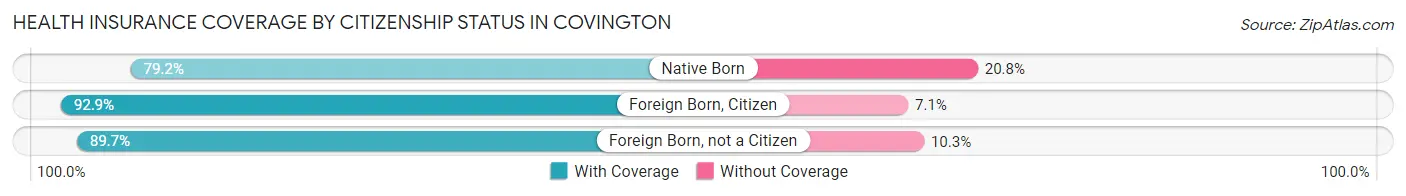
| Citizenship Status | With Coverage | Without Coverage |
| Native Born | 19 (79.2%) | 5 (20.8%) |
| Foreign Born, Citizen | 65 (92.9%) | 5 (7.1%) |
| Foreign Born, not a Citizen | 35 (89.7%) | 4 (10.3%) |
Health Insurance Coverage by Household Income in Covington
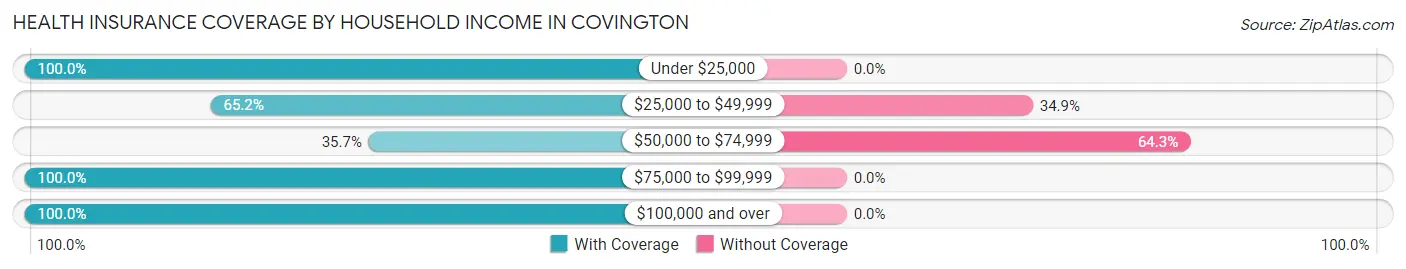
| Household Income | With Coverage | Without Coverage |
| Under $25,000 | 19 (100.0%) | 0 (0.0%) |
| $25,000 to $49,999 | 43 (65.1%) | 23 (34.8%) |
| $50,000 to $74,999 | 5 (35.7%) | 9 (64.3%) |
| $75,000 to $99,999 | 3 (100.0%) | 0 (0.0%) |
| $100,000 and over | 196 (100.0%) | 0 (0.0%) |
Public vs Private Health Insurance Coverage by Age in Covington
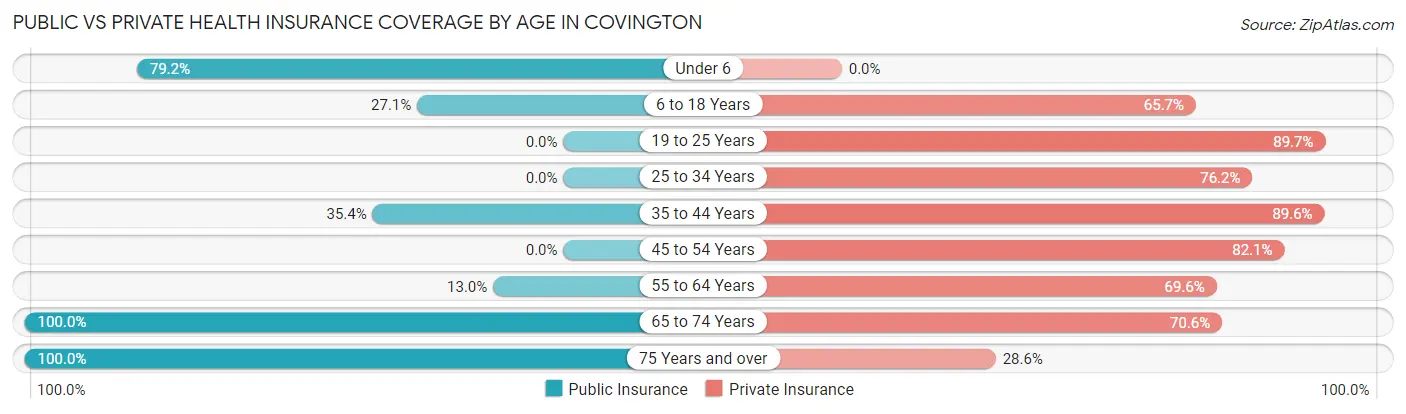
| Age Bracket | Public Insurance | Private Insurance |
| Under 6 | 19 (79.2%) | 0 (0.0%) |
| 6 to 18 Years | 19 (27.1%) | 46 (65.7%) |
| 19 to 25 Years | 0 (0.0%) | 35 (89.7%) |
| 25 to 34 Years | 0 (0.0%) | 16 (76.2%) |
| 35 to 44 Years | 17 (35.4%) | 43 (89.6%) |
| 45 to 54 Years | 0 (0.0%) | 23 (82.1%) |
| 55 to 64 Years | 3 (13.0%) | 16 (69.6%) |
| 65 to 74 Years | 17 (100.0%) | 12 (70.6%) |
| 75 Years and over | 28 (100.0%) | 8 (28.6%) |
| Total | 103 (34.6%) | 199 (66.8%) |
Disability Status by Sex by Age in Covington
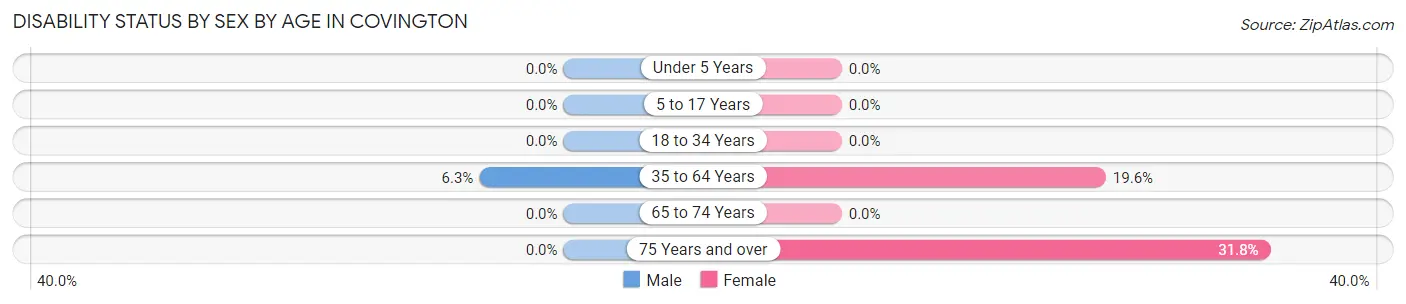
| Age Bracket | Male | Female |
| Under 5 Years | 0 (0.0%) | 0 (0.0%) |
| 5 to 17 Years | 0 (0.0%) | 0 (0.0%) |
| 18 to 34 Years | 0 (0.0%) | 0 (0.0%) |
| 35 to 64 Years | 3 (6.2%) | 10 (19.6%) |
| 65 to 74 Years | 0 (0.0%) | 0 (0.0%) |
| 75 Years and over | 0 (0.0%) | 7 (31.8%) |
Disability Class by Sex by Age in Covington
Disability Class: Hearing Difficulty
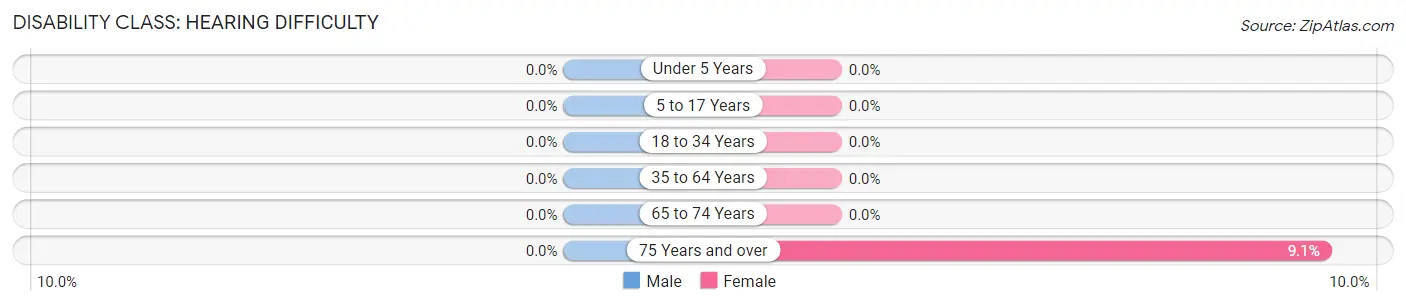
| Age Bracket | Male | Female |
| Under 5 Years | 0 (0.0%) | 0 (0.0%) |
| 5 to 17 Years | 0 (0.0%) | 0 (0.0%) |
| 18 to 34 Years | 0 (0.0%) | 0 (0.0%) |
| 35 to 64 Years | 0 (0.0%) | 0 (0.0%) |
| 65 to 74 Years | 0 (0.0%) | 0 (0.0%) |
| 75 Years and over | 0 (0.0%) | 2 (9.1%) |
Disability Class: Vision Difficulty
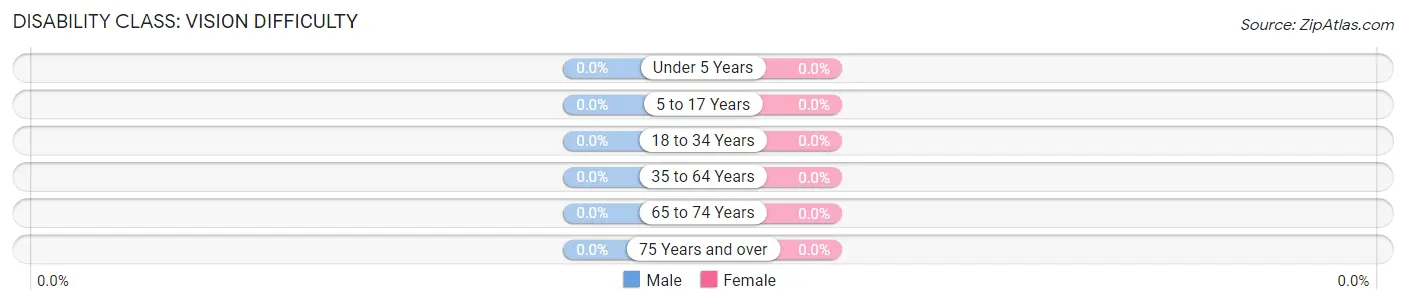
| Age Bracket | Male | Female |
| Under 5 Years | 0 (0.0%) | 0 (0.0%) |
| 5 to 17 Years | 0 (0.0%) | 0 (0.0%) |
| 18 to 34 Years | 0 (0.0%) | 0 (0.0%) |
| 35 to 64 Years | 0 (0.0%) | 0 (0.0%) |
| 65 to 74 Years | 0 (0.0%) | 0 (0.0%) |
| 75 Years and over | 0 (0.0%) | 0 (0.0%) |
Disability Class: Cognitive Difficulty
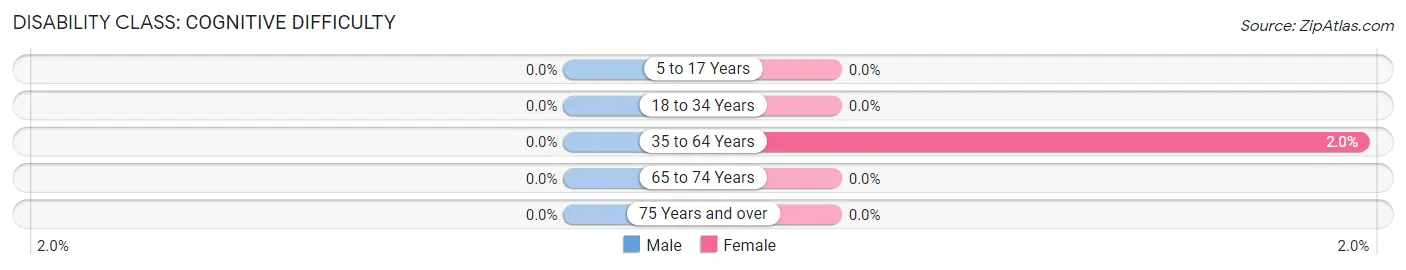
| Age Bracket | Male | Female |
| 5 to 17 Years | 0 (0.0%) | 0 (0.0%) |
| 18 to 34 Years | 0 (0.0%) | 0 (0.0%) |
| 35 to 64 Years | 0 (0.0%) | 1 (2.0%) |
| 65 to 74 Years | 0 (0.0%) | 0 (0.0%) |
| 75 Years and over | 0 (0.0%) | 0 (0.0%) |
Disability Class: Ambulatory Difficulty
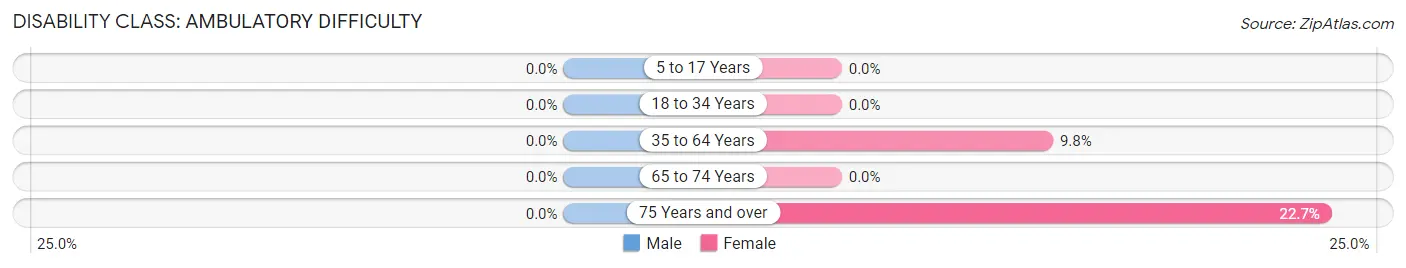
| Age Bracket | Male | Female |
| 5 to 17 Years | 0 (0.0%) | 0 (0.0%) |
| 18 to 34 Years | 0 (0.0%) | 0 (0.0%) |
| 35 to 64 Years | 0 (0.0%) | 5 (9.8%) |
| 65 to 74 Years | 0 (0.0%) | 0 (0.0%) |
| 75 Years and over | 0 (0.0%) | 5 (22.7%) |
Disability Class: Self-Care Difficulty
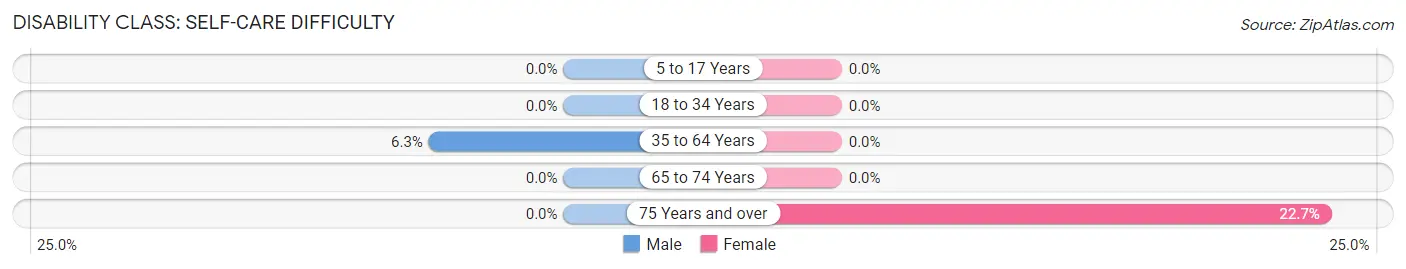
| Age Bracket | Male | Female |
| 5 to 17 Years | 0 (0.0%) | 0 (0.0%) |
| 18 to 34 Years | 0 (0.0%) | 0 (0.0%) |
| 35 to 64 Years | 3 (6.2%) | 0 (0.0%) |
| 65 to 74 Years | 0 (0.0%) | 0 (0.0%) |
| 75 Years and over | 0 (0.0%) | 5 (22.7%) |
Technology Access in Covington
Computing Device Access in Covington
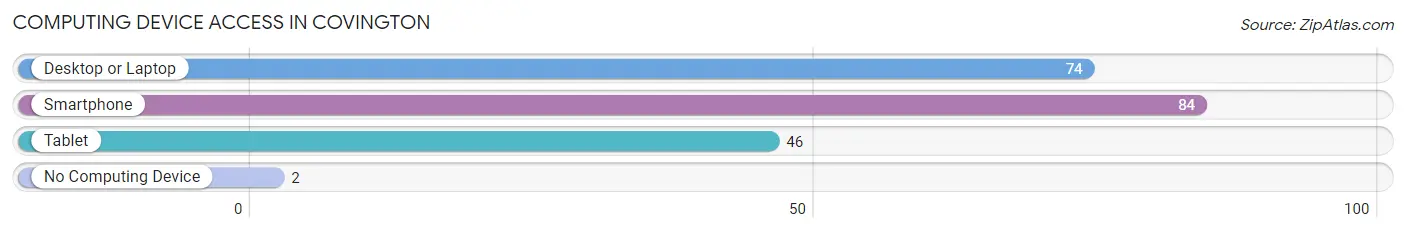
| Device Type | # Households | % Households |
| Desktop or Laptop | 74 | 84.1% |
| Smartphone | 84 | 95.5% |
| Tablet | 46 | 52.3% |
| No Computing Device | 2 | 2.3% |
| Total | 88 | 100.0% |
Internet Access in Covington
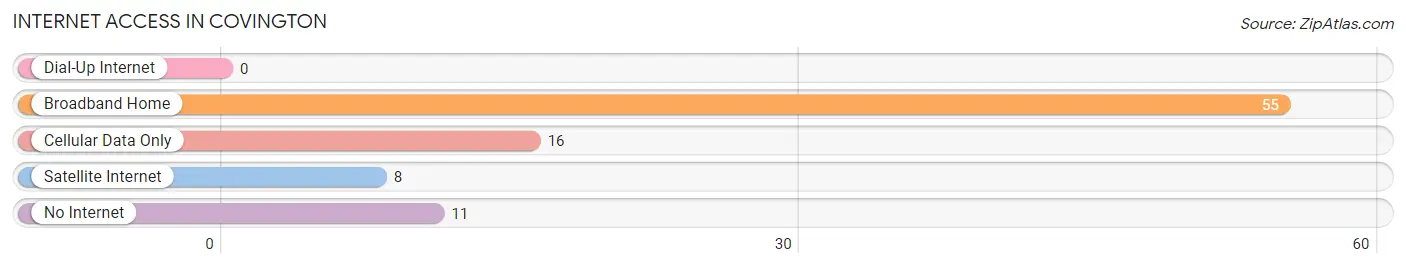
| Internet Type | # Households | % Households |
| Dial-Up Internet | 0 | 0.0% |
| Broadband Home | 55 | 62.5% |
| Cellular Data Only | 16 | 18.2% |
| Satellite Internet | 8 | 9.1% |
| No Internet | 11 | 12.5% |
| Total | 88 | 100.0% |
Covington Summary
Covington is a small town located in Tarrant County, Texas. It is situated about 25 miles northwest of Fort Worth and is part of the Dallas-Fort Worth-Arlington metropolitan area. The town has a population of approximately 1,400 people and is known for its rural charm and small-town atmosphere.
History
Covington was founded in 1876 by a group of settlers from Kentucky. The town was named after the county seat of Covington, Kentucky. The settlers were attracted to the area due to its fertile soil and abundant water supply. The town quickly grew and by the early 1900s, it had become a thriving agricultural community.
In the 1920s, the town began to experience a period of growth and development. The population increased and new businesses were established. The town also became a popular destination for tourists, who were drawn to the area’s natural beauty and rural charm.
In the 1950s, Covington began to experience a decline in population as many of its residents moved to larger cities in search of better job opportunities. The town’s economy suffered as a result and many of its businesses closed.
In the late 1970s, the town began to experience a resurgence in population and economic activity. The population increased and new businesses opened. The town also began to attract new residents who were drawn to its rural charm and small-town atmosphere.
Geography
Covington is located in Tarrant County, Texas. It is situated about 25 miles northwest of Fort Worth and is part of the Dallas-Fort Worth-Arlington metropolitan area. The town is located in the eastern part of the county and is bordered by the cities of Azle, Springtown, and Weatherford.
The town is situated on the banks of the Trinity River and is surrounded by rolling hills and lush green pastures. The town is also home to several small lakes and ponds, which provide a variety of recreational activities.
Economy
Covington’s economy is largely based on agriculture. The town is home to several farms and ranches, which produce a variety of crops and livestock. The town is also home to several small businesses, including restaurants, retail stores, and service providers.
The town is also home to several manufacturing companies, which produce a variety of products, including furniture, clothing, and electronics. The town is also home to several oil and gas companies, which provide jobs to many of the town’s residents.
Demographics
As of the 2010 census, Covington had a population of 1,400 people. The town is predominantly white, with approximately 85% of the population identifying as such. The town is also home to a small Hispanic population, with approximately 10% of the population identifying as such.
The median household income in Covington is approximately $45,000, which is slightly lower than the national average. The town also has a higher than average poverty rate, with approximately 20% of the population living below the poverty line.
Conclusion
Covington is a small town located in Tarrant County, Texas. It is situated about 25 miles northwest of Fort Worth and is part of the Dallas-Fort Worth-Arlington metropolitan area. The town has a population of approximately 1,400 people and is known for its rural charm and small-town atmosphere. The town’s economy is largely based on agriculture and manufacturing, and it is home to several small businesses. The town is predominantly white, with a small Hispanic population. The median household income in Covington is slightly lower than the national average, and the town has a higher than average poverty rate.
Common Questions
What is Per Capita Income in Covington?
Per Capita income in Covington is $33,645.
What is Inequality or Gini Index in Covington?
Inequality or Gini Index in Covington is 0.49.
What is the Total Population of Covington?
Total Population of Covington is 298.
What is the Total Male Population of Covington?
Total Male Population of Covington is 118.
What is the Total Female Population of Covington?
Total Female Population of Covington is 180.
What is the Ratio of Males per 100 Females in Covington?
There are 65.56 Males per 100 Females in Covington.
What is the Ratio of Females per 100 Males in Covington?
There are 152.54 Females per 100 Males in Covington.
What is the Median Population Age in Covington?
Median Population Age in Covington is 28.7 Years.
What is the Average Family Size in Covington
Average Family Size in Covington is 3.8 People.
What is the Average Household Size in Covington
Average Household Size in Covington is 3.4 People.
How Large is the Labor Force in Covington?
There are 137 People in the Labor Forcein in Covington.
What is the Percentage of People in the Labor Force in Covington?
64.0% of People are in the Labor Force in Covington.