Corrigan, TX Map & Demographics
Corrigan Map
Corrigan Overview
$19,979
PER CAPITA INCOME
$46,607
AVG FAMILY INCOME
$42,212
AVG HOUSEHOLD INCOME
54.4%
WAGE / INCOME GAP [ % ]
45.6¢/ $1
WAGE / INCOME GAP [ $ ]
0.45
INEQUALITY / GINI INDEX
2,018
TOTAL POPULATION
969
MALE POPULATION
1,049
FEMALE POPULATION
92.37
MALES / 100 FEMALES
108.26
FEMALES / 100 MALES
35.2
MEDIAN AGE
3.3
AVG FAMILY SIZE
2.8
AVG HOUSEHOLD SIZE
886
LABOR FORCE [ PEOPLE ]
57.2%
PERCENT IN LABOR FORCE
15.9%
UNEMPLOYMENT RATE
Corrigan Zip Codes
Corrigan Area Codes
Income in Corrigan
Income Overview in Corrigan
Per Capita Income in Corrigan is $19,979, while median incomes of families and households are $46,607 and $42,212 respectively.
| Characteristic | Number | Measure |
| Per Capita Income | 2,018 | $19,979 |
| Median Family Income | 473 | $46,607 |
| Mean Family Income | 473 | $57,961 |
| Median Household Income | 710 | $42,212 |
| Mean Household Income | 710 | $52,616 |
| Income Deficit | 473 | $0 |
| Wage / Income Gap (%) | 2,018 | 54.42% |
| Wage / Income Gap ($) | 2,018 | 45.58¢ per $1 |
| Gini / Inequality Index | 2,018 | 0.45 |
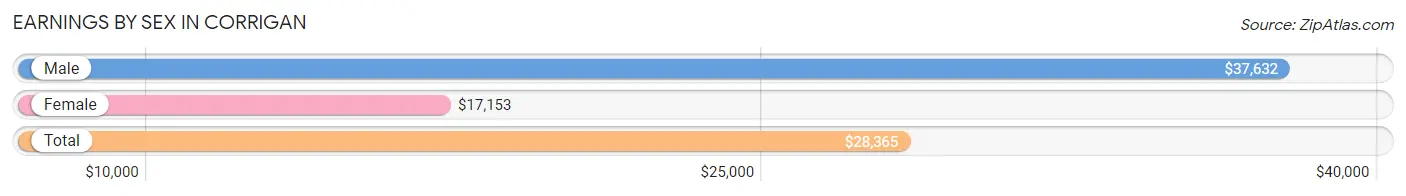
Earnings by Sex in Corrigan
Average Earnings in Corrigan are $28,365, $37,632 for men and $17,153 for women, a difference of 54.4%.
| Sex | Number | Average Earnings |
| Male | 410 (46.9%) | $37,632 |
| Female | 465 (53.1%) | $17,153 |
| Total | 875 (100.0%) | $28,365 |
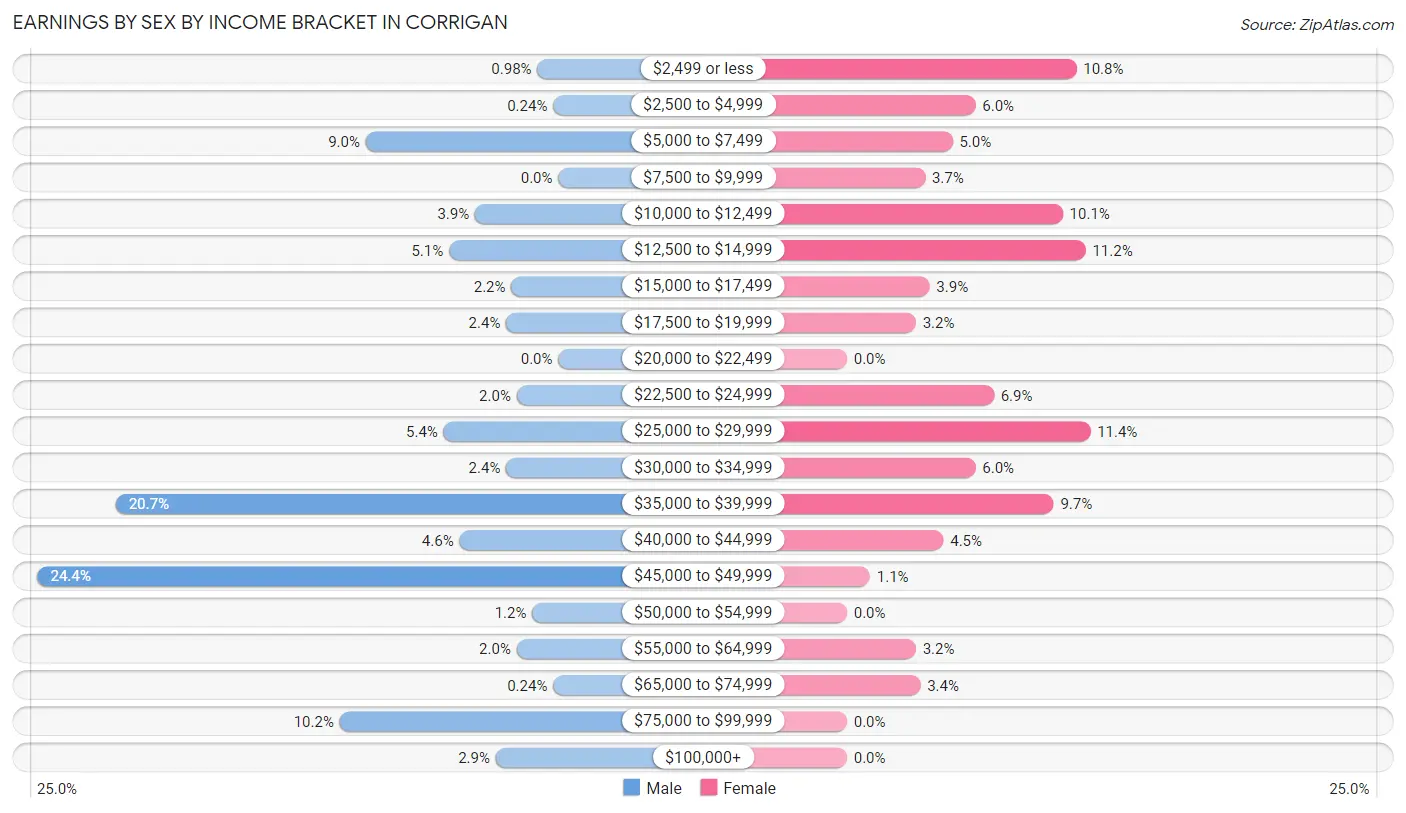
Earnings by Sex by Income Bracket in Corrigan
The most common earnings brackets in Corrigan are $45,000 to $49,999 for men (100 | 24.4%) and $25,000 to $29,999 for women (53 | 11.4%).
| Income | Male | Female |
| $2,499 or less | 4 (1.0%) | 50 (10.7%) |
| $2,500 to $4,999 | 1 (0.2%) | 28 (6.0%) |
| $5,000 to $7,499 | 37 (9.0%) | 23 (5.0%) |
| $7,500 to $9,999 | 0 (0.0%) | 17 (3.7%) |
| $10,000 to $12,499 | 16 (3.9%) | 47 (10.1%) |
| $12,500 to $14,999 | 21 (5.1%) | 52 (11.2%) |
| $15,000 to $17,499 | 9 (2.2%) | 18 (3.9%) |
| $17,500 to $19,999 | 10 (2.4%) | 15 (3.2%) |
| $20,000 to $22,499 | 0 (0.0%) | 0 (0.0%) |
| $22,500 to $24,999 | 8 (1.9%) | 32 (6.9%) |
| $25,000 to $29,999 | 22 (5.4%) | 53 (11.4%) |
| $30,000 to $34,999 | 10 (2.4%) | 28 (6.0%) |
| $35,000 to $39,999 | 85 (20.7%) | 45 (9.7%) |
| $40,000 to $44,999 | 19 (4.6%) | 21 (4.5%) |
| $45,000 to $49,999 | 100 (24.4%) | 5 (1.1%) |
| $50,000 to $54,999 | 5 (1.2%) | 0 (0.0%) |
| $55,000 to $64,999 | 8 (1.9%) | 15 (3.2%) |
| $65,000 to $74,999 | 1 (0.2%) | 16 (3.4%) |
| $75,000 to $99,999 | 42 (10.2%) | 0 (0.0%) |
| $100,000+ | 12 (2.9%) | 0 (0.0%) |
| Total | 410 (100.0%) | 465 (100.0%) |
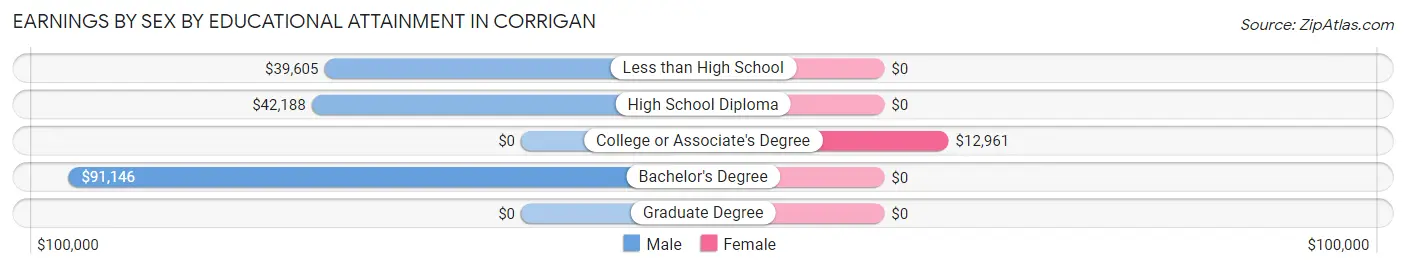
Earnings by Sex by Educational Attainment in Corrigan
Average earnings in Corrigan are $45,040 for men and $16,250 for women, a difference of 63.9%. Men with an educational attainment of bachelor's degree enjoy the highest average annual earnings of $91,146, while those with less than high school education earn the least with $39,605. Women with an educational attainment of college or associate's degree earn the most with the average annual earnings of $12,961, while those with college or associate's degree education have the smallest earnings of $12,961.
| Educational Attainment | Male Income | Female Income |
| Less than High School | $39,605 | $0 |
| High School Diploma | $42,188 | $0 |
| College or Associate's Degree | - | - |
| Bachelor's Degree | $91,146 | $0 |
| Graduate Degree | - | - |
| Total | $45,040 | $16,250 |
Family Income in Corrigan
Family Income Brackets in Corrigan
According to the Corrigan family income data, there are 137 families falling into the $35,000 to $49,999 income range, which is the most common income bracket and makes up 29.0% of all families. Conversely, the $200,000+ income bracket is the least frequent group with only 2 families (0.4%) belonging to this category.
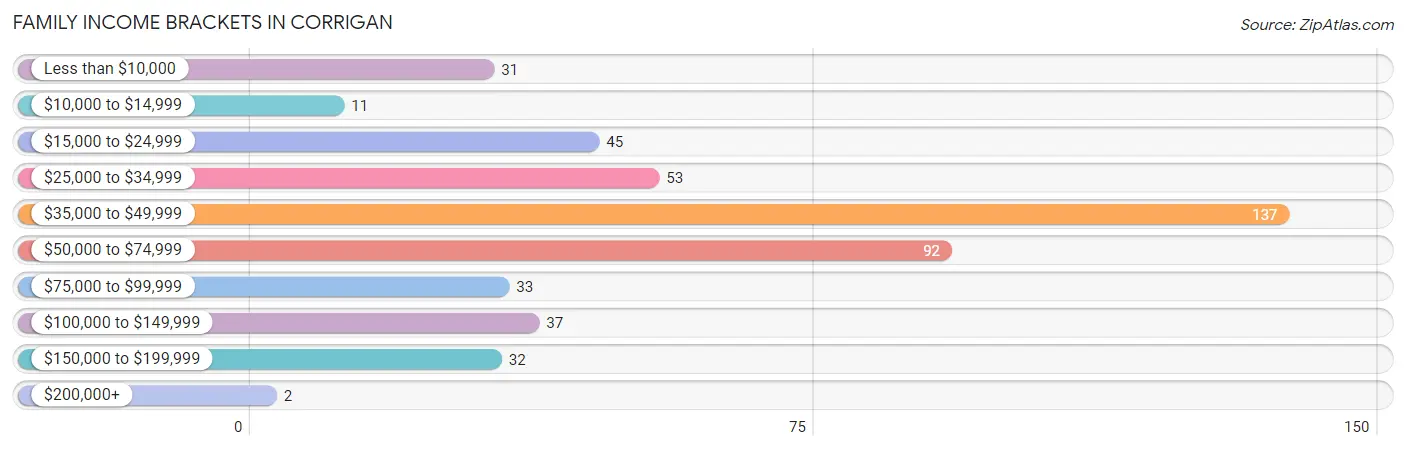
| Income Bracket | # Families | % Families |
| Less than $10,000 | 31 | 6.6% |
| $10,000 to $14,999 | 11 | 2.3% |
| $15,000 to $24,999 | 45 | 9.5% |
| $25,000 to $34,999 | 53 | 11.2% |
| $35,000 to $49,999 | 137 | 29.0% |
| $50,000 to $74,999 | 92 | 19.5% |
| $75,000 to $99,999 | 33 | 7.0% |
| $100,000 to $149,999 | 37 | 7.8% |
| $150,000 to $199,999 | 32 | 6.8% |
| $200,000+ | 2 | 0.4% |
Family Income by Famaliy Size in Corrigan
5-person families (42 | 8.9%) account for the highest median family income in Corrigan with $143,250 per family, while 5-person families (42 | 8.9%) have the highest median income of $28,650 per family member.
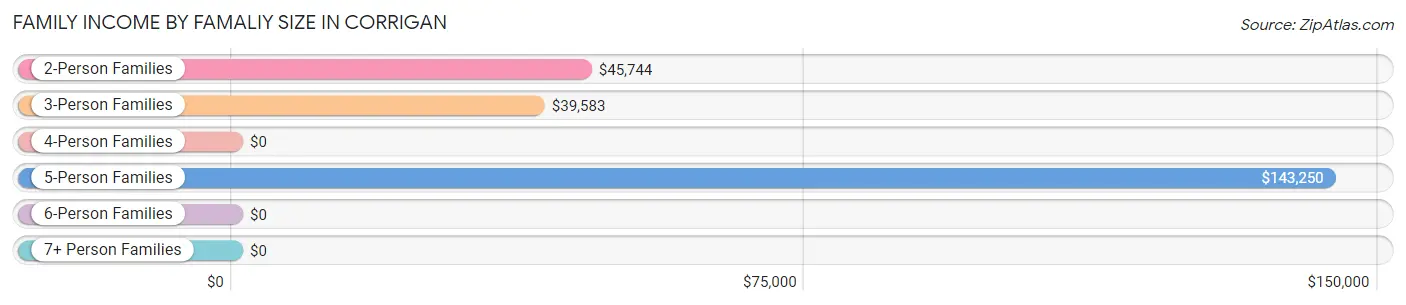
| Income Bracket | # Families | Median Income |
| 2-Person Families | 215 (45.5%) | $45,744 |
| 3-Person Families | 104 (22.0%) | $39,583 |
| 4-Person Families | 81 (17.1%) | $0 |
| 5-Person Families | 42 (8.9%) | $143,250 |
| 6-Person Families | 27 (5.7%) | $0 |
| 7+ Person Families | 4 (0.9%) | $0 |
| Total | 473 (100.0%) | $46,607 |
Family Income by Number of Earners in Corrigan
The median family income in Corrigan is $46,607, with families comprising 3+ earners (70) having the highest median family income of $144,250, while families with no earners (109) have the lowest median family income of $31,544, accounting for 14.8% and 23.0% of families, respectively.
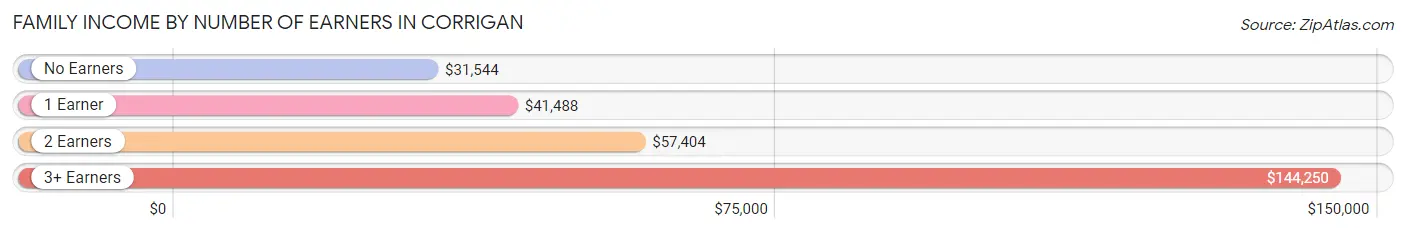
| Number of Earners | # Families | Median Income |
| No Earners | 109 (23.0%) | $31,544 |
| 1 Earner | 195 (41.2%) | $41,488 |
| 2 Earners | 99 (20.9%) | $57,404 |
| 3+ Earners | 70 (14.8%) | $144,250 |
| Total | 473 (100.0%) | $46,607 |
Household Income in Corrigan
Household Income Brackets in Corrigan
With 161 households falling in the category, the $35,000 to $49,999 income range is the most frequent in Corrigan, accounting for 22.7% of all households. In contrast, only 4 households (0.6%) fall into the $200,000+ income bracket, making it the least populous group.
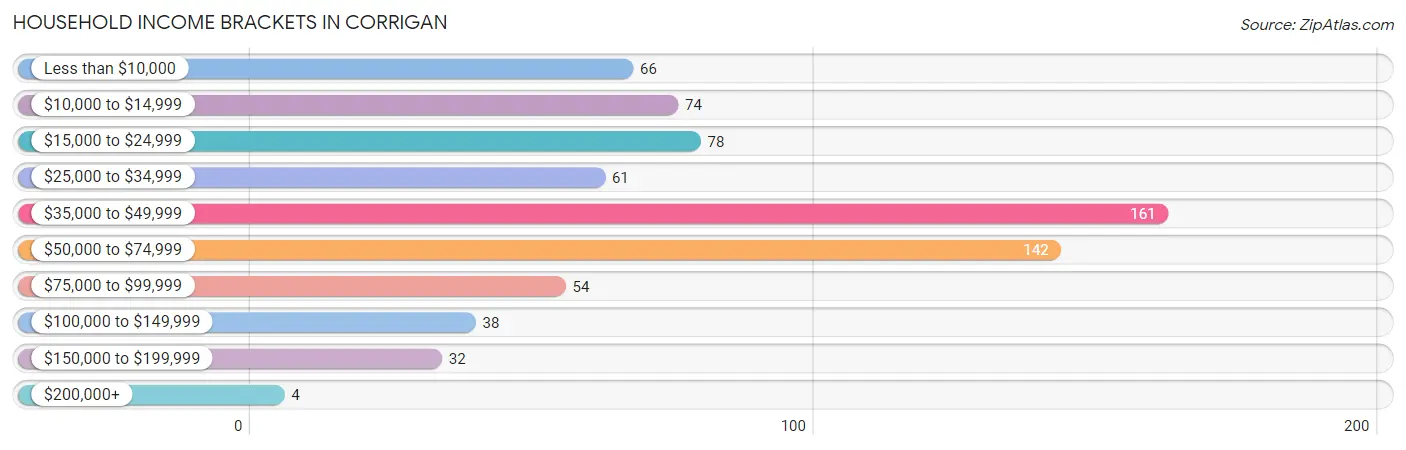
| Income Bracket | # Households | % Households |
| Less than $10,000 | 66 | 9.3% |
| $10,000 to $14,999 | 74 | 10.4% |
| $15,000 to $24,999 | 78 | 11.0% |
| $25,000 to $34,999 | 61 | 8.6% |
| $35,000 to $49,999 | 161 | 22.7% |
| $50,000 to $74,999 | 142 | 20.0% |
| $75,000 to $99,999 | 54 | 7.6% |
| $100,000 to $149,999 | 38 | 5.4% |
| $150,000 to $199,999 | 32 | 4.5% |
| $200,000+ | 4 | 0.6% |
Household Income by Householder Age in Corrigan
The median household income in Corrigan is $42,212, with the highest median household income of $47,443 found in the 45 to 64 years age bracket for the primary householder. A total of 351 households (49.4%) fall into this category. Meanwhile, the 15 to 24 years age bracket for the primary householder has the lowest median household income of $0, with 32 households (4.5%) in this group.
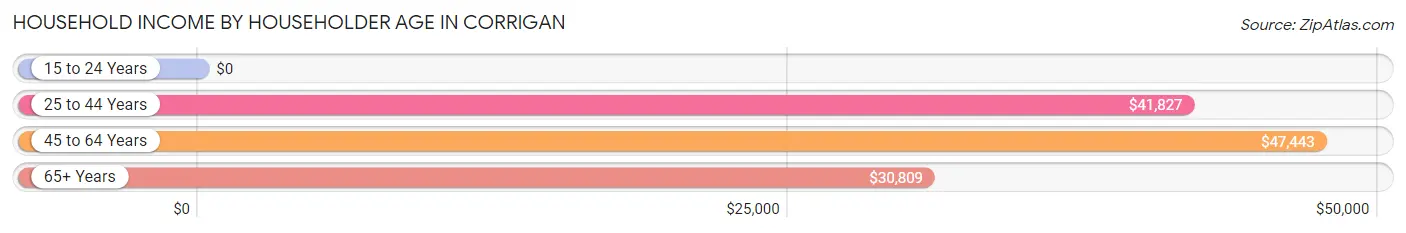
| Income Bracket | # Households | Median Income |
| 15 to 24 Years | 32 (4.5%) | $0 |
| 25 to 44 Years | 194 (27.3%) | $41,827 |
| 45 to 64 Years | 351 (49.4%) | $47,443 |
| 65+ Years | 133 (18.7%) | $30,809 |
| Total | 710 (100.0%) | $42,212 |
Poverty in Corrigan
Income Below Poverty by Sex and Age in Corrigan
With 19.6% poverty level for males and 32.2% for females among the residents of Corrigan, 12 to 14 year old males and 15 year old females are the most vulnerable to poverty, with 44 males (84.6%) and 10 females (90.9%) in their respective age groups living below the poverty level.
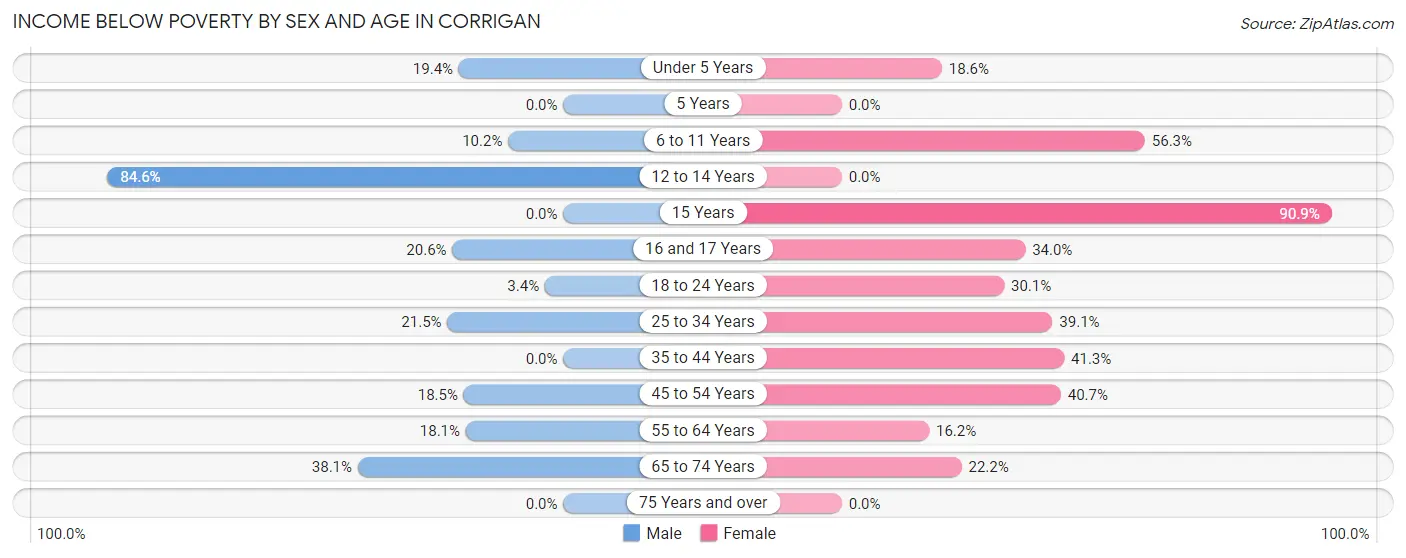
| Age Bracket | Male | Female |
| Under 5 Years | 19 (19.4%) | 13 (18.6%) |
| 5 Years | 0 (0.0%) | 0 (0.0%) |
| 6 to 11 Years | 9 (10.2%) | 54 (56.2%) |
| 12 to 14 Years | 44 (84.6%) | 0 (0.0%) |
| 15 Years | 0 (0.0%) | 10 (90.9%) |
| 16 and 17 Years | 7 (20.6%) | 16 (34.0%) |
| 18 to 24 Years | 3 (3.4%) | 53 (30.1%) |
| 25 to 34 Years | 17 (21.5%) | 43 (39.1%) |
| 35 to 44 Years | 0 (0.0%) | 26 (41.3%) |
| 45 to 54 Years | 17 (18.5%) | 63 (40.6%) |
| 55 to 64 Years | 21 (18.1%) | 23 (16.2%) |
| 65 to 74 Years | 45 (38.1%) | 22 (22.2%) |
| 75 Years and over | 0 (0.0%) | 0 (0.0%) |
| Total | 182 (19.6%) | 323 (32.2%) |
Income Above Poverty by Sex and Age in Corrigan
According to the poverty statistics in Corrigan, males aged 5 years and females aged 12 to 14 years are the age groups that are most secure financially, with 100.0% of males and 100.0% of females in these age groups living above the poverty line.
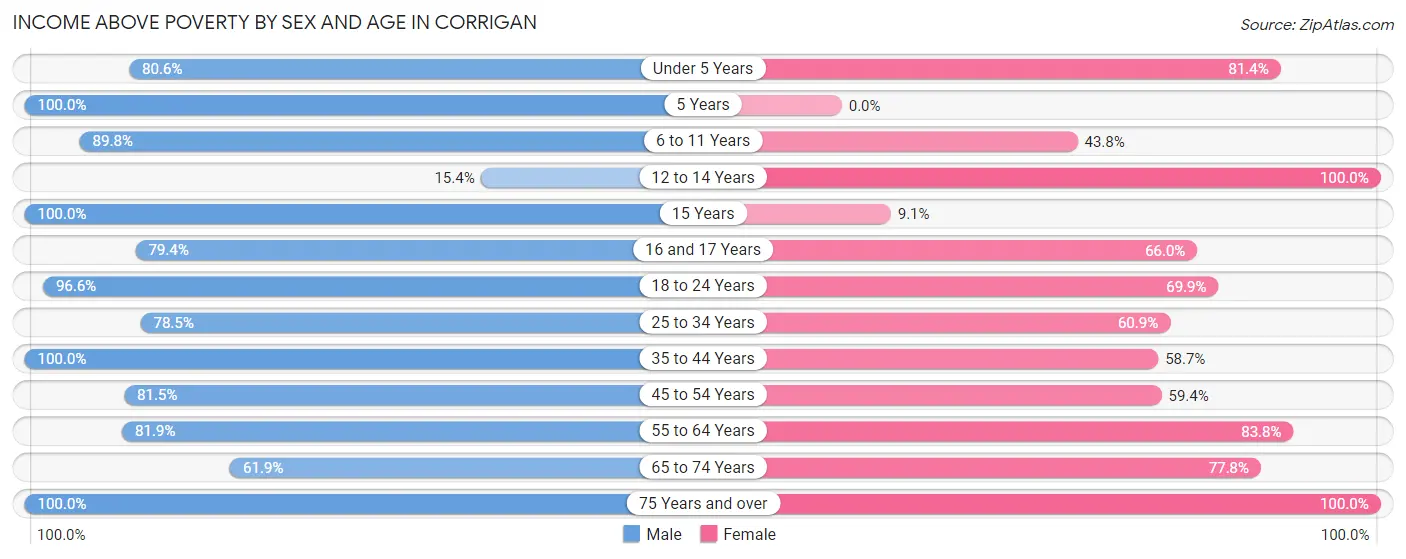
| Age Bracket | Male | Female |
| Under 5 Years | 79 (80.6%) | 57 (81.4%) |
| 5 Years | 10 (100.0%) | 0 (0.0%) |
| 6 to 11 Years | 79 (89.8%) | 42 (43.8%) |
| 12 to 14 Years | 8 (15.4%) | 19 (100.0%) |
| 15 Years | 4 (100.0%) | 1 (9.1%) |
| 16 and 17 Years | 27 (79.4%) | 31 (66.0%) |
| 18 to 24 Years | 85 (96.6%) | 123 (69.9%) |
| 25 to 34 Years | 62 (78.5%) | 67 (60.9%) |
| 35 to 44 Years | 139 (100.0%) | 37 (58.7%) |
| 45 to 54 Years | 75 (81.5%) | 92 (59.4%) |
| 55 to 64 Years | 95 (81.9%) | 119 (83.8%) |
| 65 to 74 Years | 73 (61.9%) | 77 (77.8%) |
| 75 Years and over | 11 (100.0%) | 14 (100.0%) |
| Total | 747 (80.4%) | 679 (67.8%) |
Income Below Poverty Among Married-Couple Families in Corrigan
The poverty statistics for married-couple families in Corrigan show that 6.2% or 17 of the total 274 families live below the poverty line. Families with no children have the highest poverty rate of 7.1%, comprising of 11 families. On the other hand, families with 3 or 4 children have the lowest poverty rate of 0.0%, which includes 0 families.
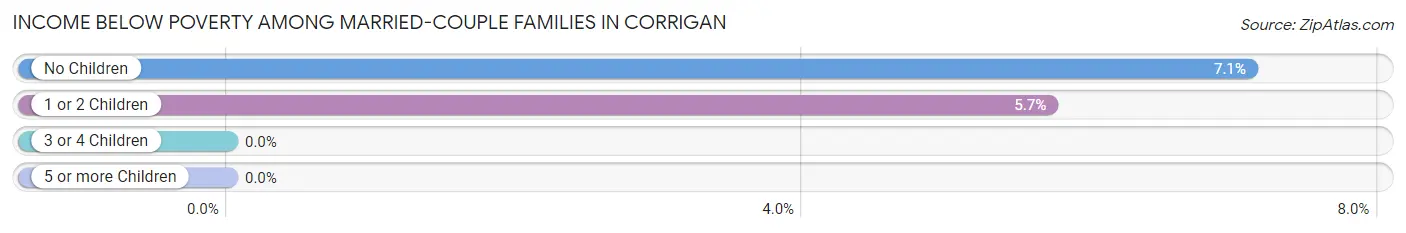
| Children | Above Poverty | Below Poverty |
| No Children | 144 (92.9%) | 11 (7.1%) |
| 1 or 2 Children | 99 (94.3%) | 6 (5.7%) |
| 3 or 4 Children | 14 (100.0%) | 0 (0.0%) |
| 5 or more Children | 0 (0.0%) | 0 (0.0%) |
| Total | 257 (93.8%) | 17 (6.2%) |
Income Below Poverty Among Single-Parent Households in Corrigan
According to the poverty data in Corrigan, 19.6% or 9 single-father households and 50.3% or 77 single-mother households are living below the poverty line. Among single-father households, those with 1 or 2 children have the highest poverty rate, with 9 households (36.0%) experiencing poverty. Likewise, among single-mother households, those with 1 or 2 children have the highest poverty rate, with 56 households (63.6%) falling below the poverty line.
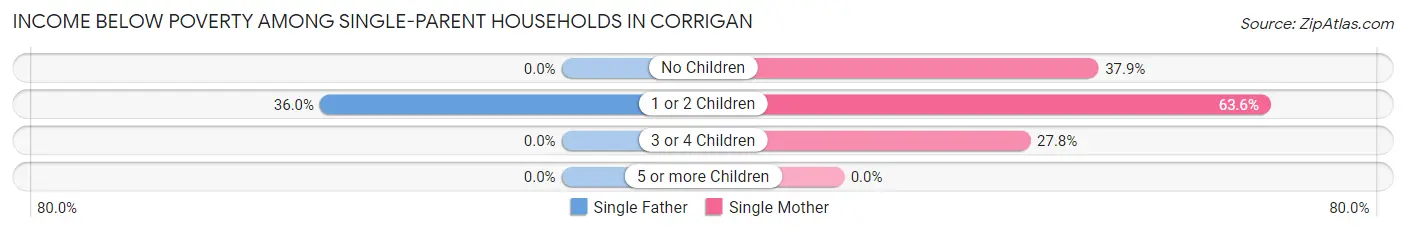
| Children | Single Father | Single Mother |
| No Children | 0 (0.0%) | 11 (37.9%) |
| 1 or 2 Children | 9 (36.0%) | 56 (63.6%) |
| 3 or 4 Children | 0 (0.0%) | 10 (27.8%) |
| 5 or more Children | 0 (0.0%) | 0 (0.0%) |
| Total | 9 (19.6%) | 77 (50.3%) |
Income Below Poverty Among Married-Couple vs Single-Parent Households in Corrigan
The poverty data for Corrigan shows that 17 of the married-couple family households (6.2%) and 86 of the single-parent households (43.2%) are living below the poverty level. Within the married-couple family households, those with no children have the highest poverty rate, with 11 households (7.1%) falling below the poverty line. Among the single-parent households, those with 1 or 2 children have the highest poverty rate, with 65 household (57.5%) living below poverty.
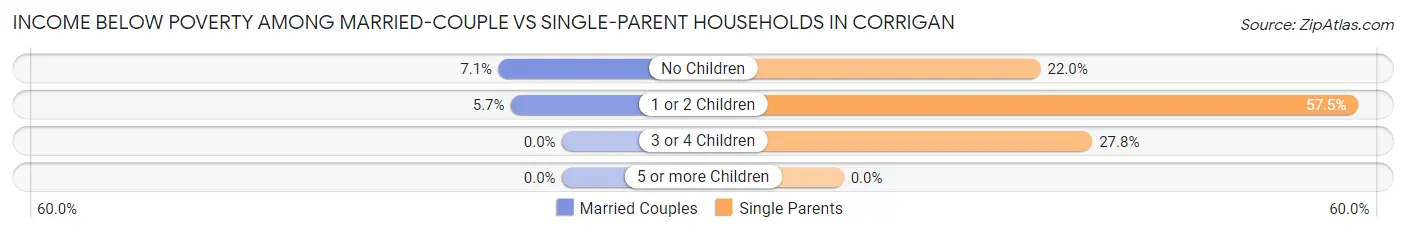
| Children | Married-Couple Families | Single-Parent Households |
| No Children | 11 (7.1%) | 11 (22.0%) |
| 1 or 2 Children | 6 (5.7%) | 65 (57.5%) |
| 3 or 4 Children | 0 (0.0%) | 10 (27.8%) |
| 5 or more Children | 0 (0.0%) | 0 (0.0%) |
| Total | 17 (6.2%) | 86 (43.2%) |
Race in Corrigan
The most populous races in Corrigan are White / Caucasian (1,044 | 51.7%), Black / African American (567 | 28.1%), and Hispanic or Latino (511 | 25.3%).
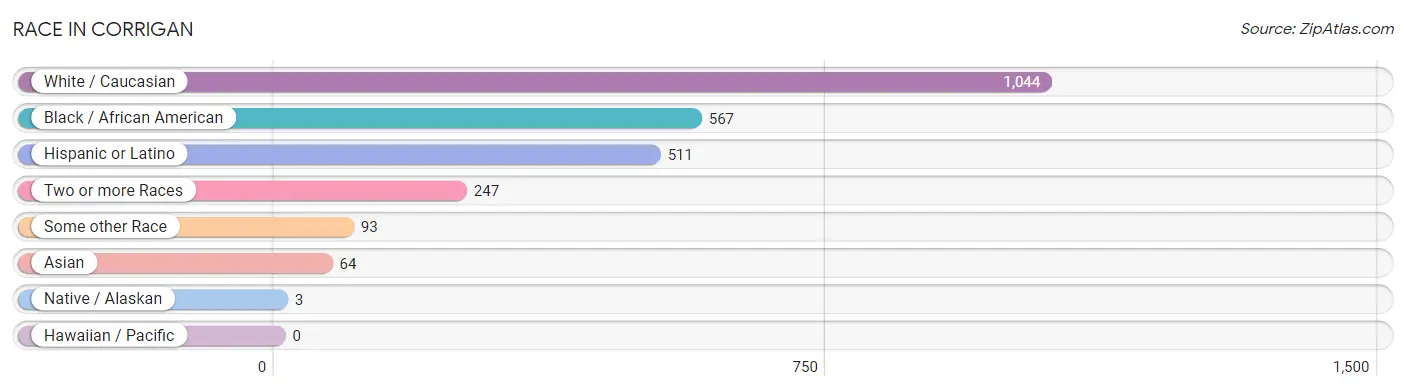
| Race | # Population | % Population |
| Asian | 64 | 3.2% |
| Black / African American | 567 | 28.1% |
| Hawaiian / Pacific | 0 | 0.0% |
| Hispanic or Latino | 511 | 25.3% |
| Native / Alaskan | 3 | 0.2% |
| White / Caucasian | 1,044 | 51.7% |
| Two or more Races | 247 | 12.2% |
| Some other Race | 93 | 4.6% |
| Total | 2,018 | 100.0% |
Ancestry in Corrigan
The most populous ancestries reported in Corrigan are American (417 | 20.7%), Mexican (407 | 20.2%), German (100 | 5.0%), Central American (87 | 4.3%), and Salvadoran (76 | 3.8%), together accounting for 53.9% of all Corrigan residents.
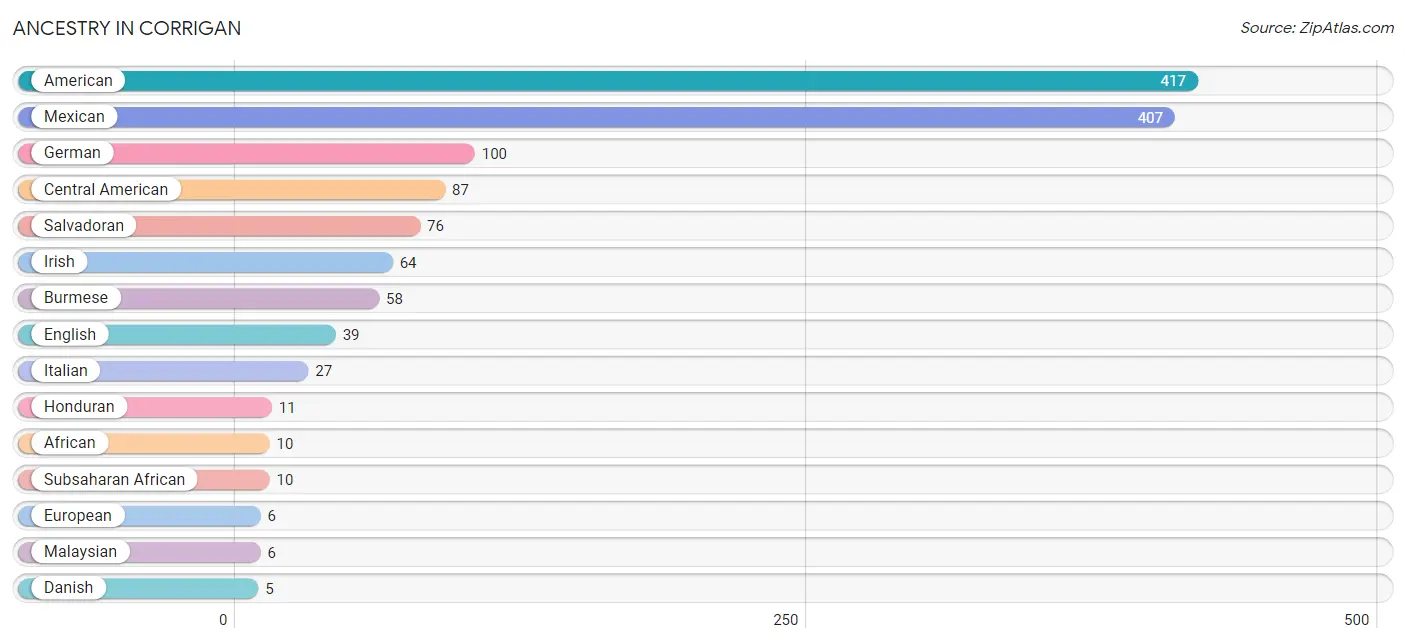
| Ancestry | # Population | % Population |
| African | 10 | 0.5% |
| American | 417 | 20.7% |
| Burmese | 58 | 2.9% |
| Central American | 87 | 4.3% |
| Chickasaw | 2 | 0.1% |
| Danish | 5 | 0.3% |
| English | 39 | 1.9% |
| European | 6 | 0.3% |
| French | 5 | 0.3% |
| German | 100 | 5.0% |
| Greek | 3 | 0.2% |
| Honduran | 11 | 0.5% |
| Irish | 64 | 3.2% |
| Italian | 27 | 1.3% |
| Malaysian | 6 | 0.3% |
| Mexican | 407 | 20.2% |
| Salvadoran | 76 | 3.8% |
| Subsaharan African | 10 | 0.5% | View All 18 Rows |
Immigrants in Corrigan
The most numerous immigrant groups reported in Corrigan came from Central America (141 | 7.0%), Latin America (141 | 7.0%), El Salvador (65 | 3.2%), Mexico (65 | 3.2%), and Asia (23 | 1.1%), together accounting for 21.6% of all Corrigan residents.
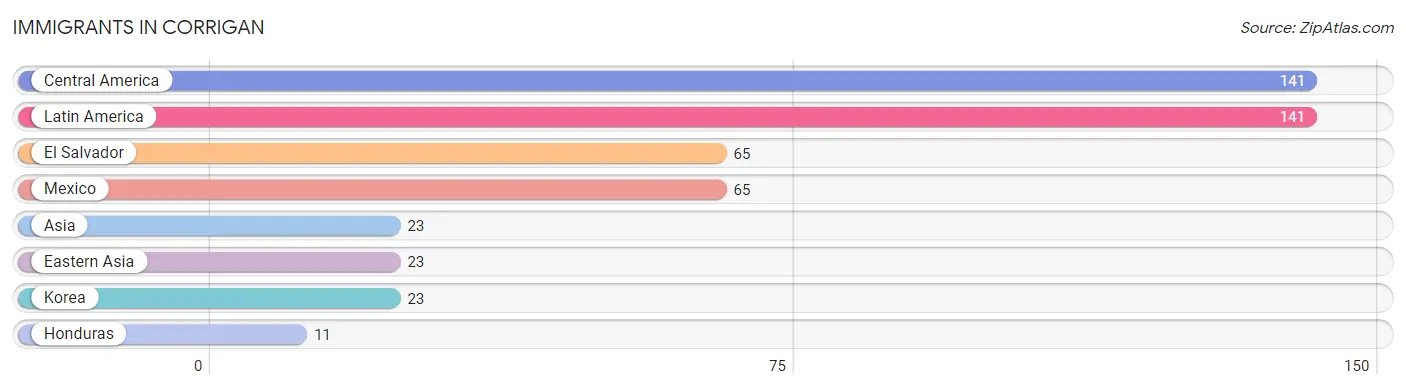
| Immigration Origin | # Population | % Population |
| Asia | 23 | 1.1% |
| Central America | 141 | 7.0% |
| Eastern Asia | 23 | 1.1% |
| El Salvador | 65 | 3.2% |
| Honduras | 11 | 0.5% |
| Korea | 23 | 1.1% |
| Latin America | 141 | 7.0% |
| Mexico | 65 | 3.2% | View All 8 Rows |
Sex and Age in Corrigan
Sex and Age in Corrigan
The most populous age groups in Corrigan are 40 to 44 Years (108 | 11.2%) for men and 20 to 24 Years (142 | 13.5%) for women.
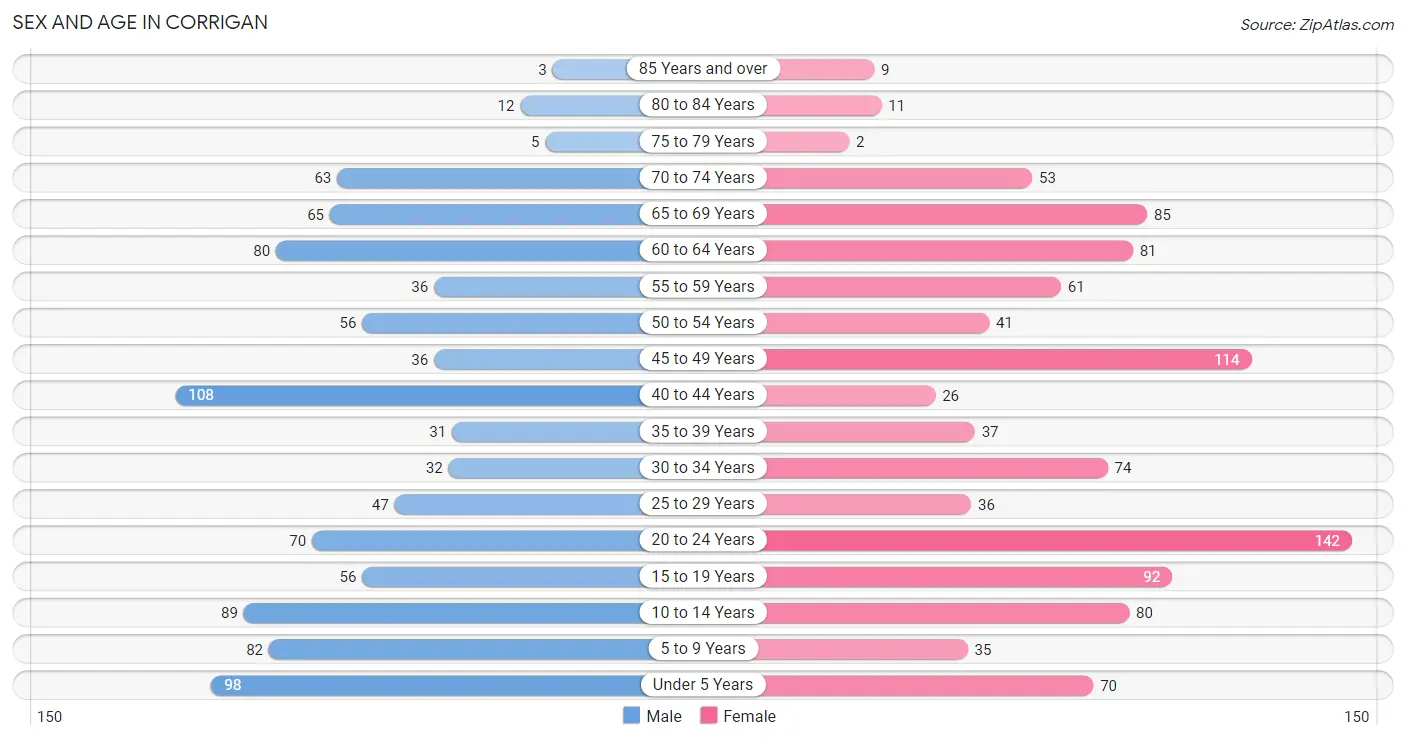
| Age Bracket | Male | Female |
| Under 5 Years | 98 (10.1%) | 70 (6.7%) |
| 5 to 9 Years | 82 (8.5%) | 35 (3.3%) |
| 10 to 14 Years | 89 (9.2%) | 80 (7.6%) |
| 15 to 19 Years | 56 (5.8%) | 92 (8.8%) |
| 20 to 24 Years | 70 (7.2%) | 142 (13.5%) |
| 25 to 29 Years | 47 (4.9%) | 36 (3.4%) |
| 30 to 34 Years | 32 (3.3%) | 74 (7.0%) |
| 35 to 39 Years | 31 (3.2%) | 37 (3.5%) |
| 40 to 44 Years | 108 (11.2%) | 26 (2.5%) |
| 45 to 49 Years | 36 (3.7%) | 114 (10.9%) |
| 50 to 54 Years | 56 (5.8%) | 41 (3.9%) |
| 55 to 59 Years | 36 (3.7%) | 61 (5.8%) |
| 60 to 64 Years | 80 (8.3%) | 81 (7.7%) |
| 65 to 69 Years | 65 (6.7%) | 85 (8.1%) |
| 70 to 74 Years | 63 (6.5%) | 53 (5.1%) |
| 75 to 79 Years | 5 (0.5%) | 2 (0.2%) |
| 80 to 84 Years | 12 (1.2%) | 11 (1.1%) |
| 85 Years and over | 3 (0.3%) | 9 (0.9%) |
| Total | 969 (100.0%) | 1,049 (100.0%) |
Families and Households in Corrigan
Median Family Size in Corrigan
The median family size in Corrigan is 3.30 persons per family, with single female/mother families (153 | 32.4%) accounting for the largest median family size of 3.53 persons per family. On the other hand, single male/father families (46 | 9.7%) represent the smallest median family size with 2.11 persons per family.
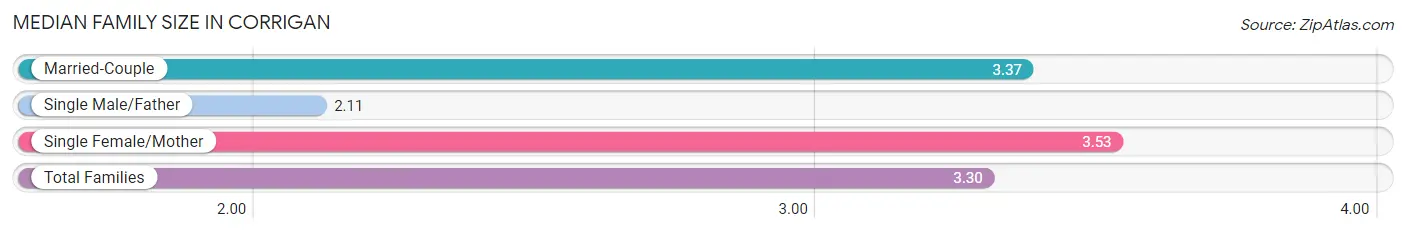
| Family Type | # Families | Family Size |
| Married-Couple | 274 (57.9%) | 3.37 |
| Single Male/Father | 46 (9.7%) | 2.11 |
| Single Female/Mother | 153 (32.4%) | 3.53 |
| Total Families | 473 (100.0%) | 3.30 |
Median Household Size in Corrigan
The median household size in Corrigan is 2.75 persons per household, with single female/mother households (153 | 21.5%) accounting for the largest median household size of 3.55 persons per household. non-family households (237 | 33.4%) represent the smallest median household size with 1.35 persons per household.
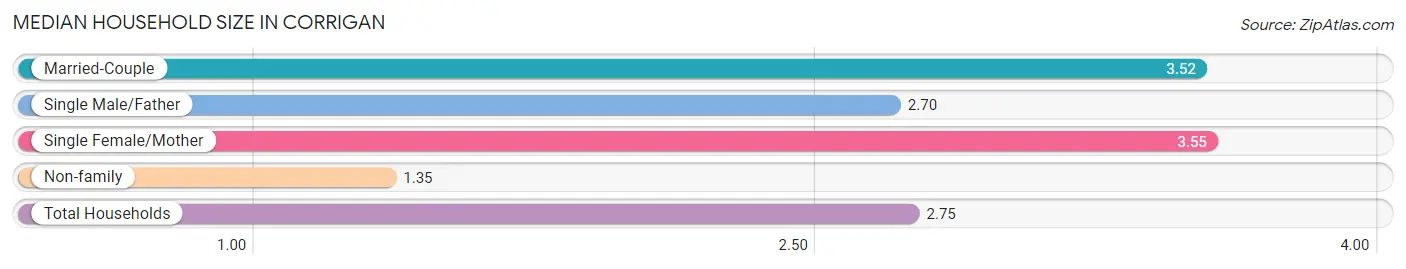
| Household Type | # Households | Household Size |
| Married-Couple | 274 (38.6%) | 3.52 |
| Single Male/Father | 46 (6.5%) | 2.70 |
| Single Female/Mother | 153 (21.5%) | 3.55 |
| Non-family | 237 (33.4%) | 1.35 |
| Total Households | 710 (100.0%) | 2.75 |
Household Size by Marriage Status in Corrigan
Out of a total of 710 households in Corrigan, 473 (66.6%) are family households, while 237 (33.4%) are nonfamily households. The most numerous type of family households are 2-person households, comprising 185, and the most common type of nonfamily households are 1-person households, comprising 165.
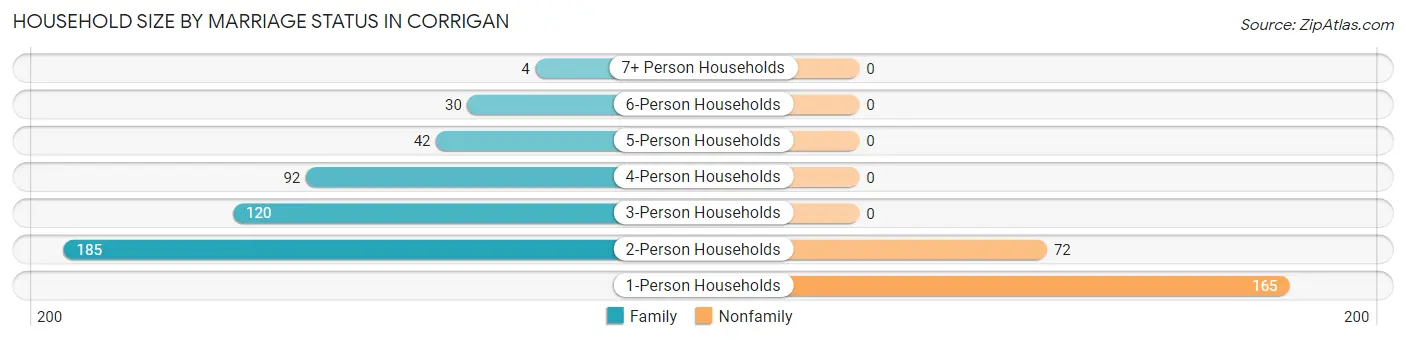
| Household Size | Family Households | Nonfamily Households |
| 1-Person Households | - | 165 (23.2%) |
| 2-Person Households | 185 (26.1%) | 72 (10.1%) |
| 3-Person Households | 120 (16.9%) | 0 (0.0%) |
| 4-Person Households | 92 (13.0%) | 0 (0.0%) |
| 5-Person Households | 42 (5.9%) | 0 (0.0%) |
| 6-Person Households | 30 (4.2%) | 0 (0.0%) |
| 7+ Person Households | 4 (0.6%) | 0 (0.0%) |
| Total | 473 (66.6%) | 237 (33.4%) |
Female Fertility in Corrigan
Fertility by Age in Corrigan
Average fertility rate in Corrigan is 38.0 births per 1,000 women. Women in the age bracket of 20 to 34 years have the highest fertility rate with 79.0 births per 1,000 women. Women in the age bracket of 20 to 34 years acount for 100.0% of all women with births.
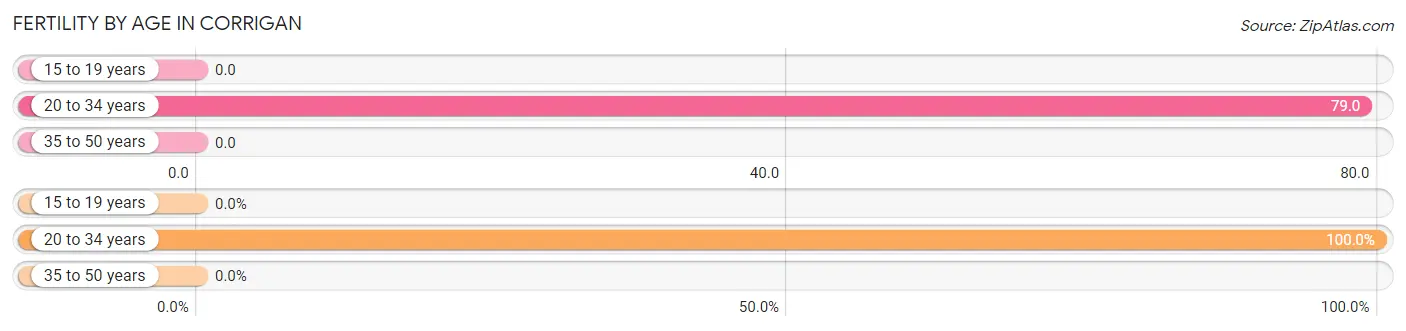
| Age Bracket | Women with Births | Births / 1,000 Women |
| 15 to 19 years | 0 (0.0%) | 0.0 |
| 20 to 34 years | 20 (100.0%) | 79.0 |
| 35 to 50 years | 0 (0.0%) | 0.0 |
| Total | 20 (100.0%) | 38.0 |
Fertility by Age by Marriage Status in Corrigan
25.0% of women with births (20) in Corrigan are married. The highest percentage of unmarried women with births falls into 20 to 34 years age bracket with 75.0% of them unmarried at the time of birth, while the lowest percentage of unmarried women with births belong to 20 to 34 years age bracket with 75.0% of them unmarried.
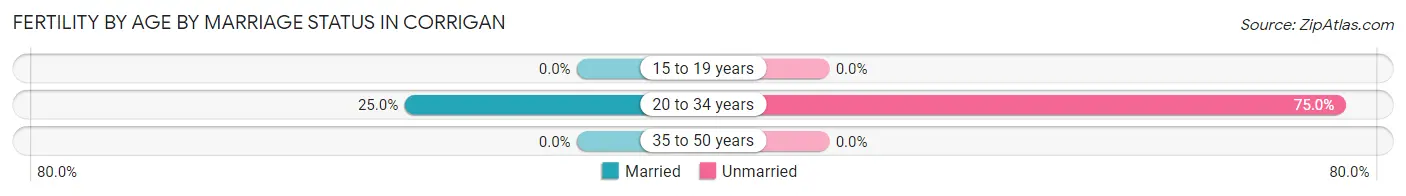
| Age Bracket | Married | Unmarried |
| 15 to 19 years | 0 (0.0%) | 0 (0.0%) |
| 20 to 34 years | 5 (25.0%) | 15 (75.0%) |
| 35 to 50 years | 0 (0.0%) | 0 (0.0%) |
| Total | 5 (25.0%) | 15 (75.0%) |
Fertility by Education in Corrigan
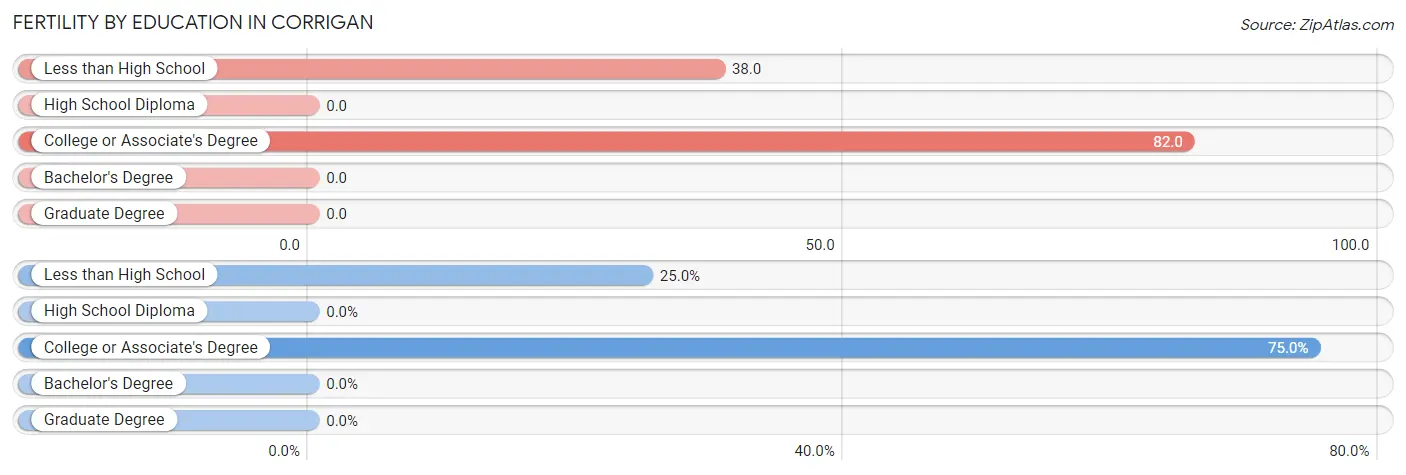
| Educational Attainment | Women with Births | Births / 1,000 Women |
| Less than High School | 5 (25.0%) | 38.0 |
| High School Diploma | 0 (0.0%) | 0.0 |
| College or Associate's Degree | 15 (75.0%) | 82.0 |
| Bachelor's Degree | 0 (0.0%) | 0.0 |
| Graduate Degree | 0 (0.0%) | 0.0 |
| Total | 20 (100.0%) | 38.0 |
Fertility by Education by Marriage Status in Corrigan
75.0% of women with births in Corrigan are unmarried. Women with the educational attainment of less than high school are most likely to be married with 100.0% of them married at childbirth, while women with the educational attainment of college or associate's degree are least likely to be married with 100.0% of them unmarried at childbirth.
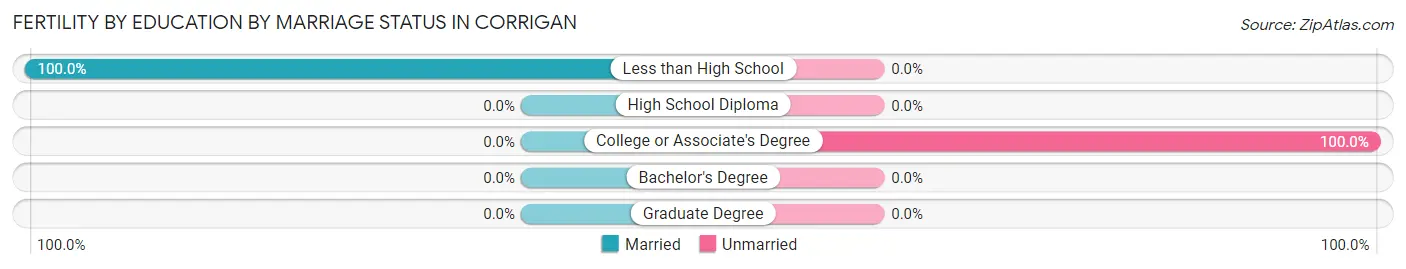
| Educational Attainment | Married | Unmarried |
| Less than High School | 5 (100.0%) | 0 (0.0%) |
| High School Diploma | 0 (0.0%) | 0 (0.0%) |
| College or Associate's Degree | 0 (0.0%) | 15 (100.0%) |
| Bachelor's Degree | 0 (0.0%) | 0 (0.0%) |
| Graduate Degree | 0 (0.0%) | 0 (0.0%) |
| Total | 5 (25.0%) | 15 (75.0%) |
Employment Characteristics in Corrigan
Employment by Class of Employer in Corrigan
Among the 706 employed individuals in Corrigan, private company employees (519 | 73.5%), state government employees (56 | 7.9%), and self-employed (not incorporated) (47 | 6.7%) make up the most common classes of employment.
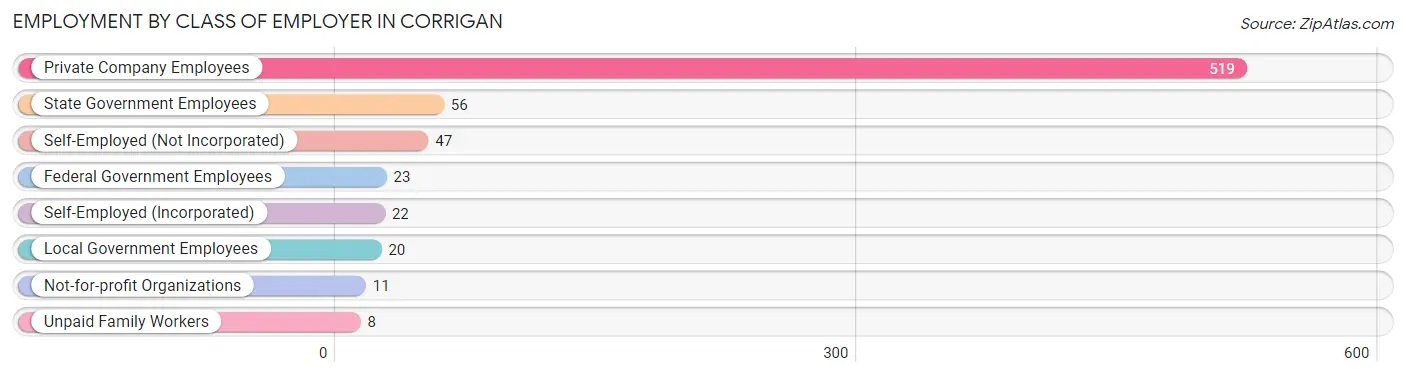
| Employer Class | # Employees | % Employees |
| Private Company Employees | 519 | 73.5% |
| Self-Employed (Incorporated) | 22 | 3.1% |
| Self-Employed (Not Incorporated) | 47 | 6.7% |
| Not-for-profit Organizations | 11 | 1.6% |
| Local Government Employees | 20 | 2.8% |
| State Government Employees | 56 | 7.9% |
| Federal Government Employees | 23 | 3.3% |
| Unpaid Family Workers | 8 | 1.1% |
| Total | 706 | 100.0% |
Employment Status by Age in Corrigan
According to the labor force statistics for Corrigan, out of the total population over 16 years of age (1,549), 57.2% or 886 individuals are in the labor force, with 15.9% or 141 of them unemployed. The age group with the highest labor force participation rate is 30 to 34 years, with 88.7% or 94 individuals in the labor force. Within the labor force, the 16 to 19 years age range has the highest percentage of unemployed individuals, with 43.1% or 31 of them being unemployed.
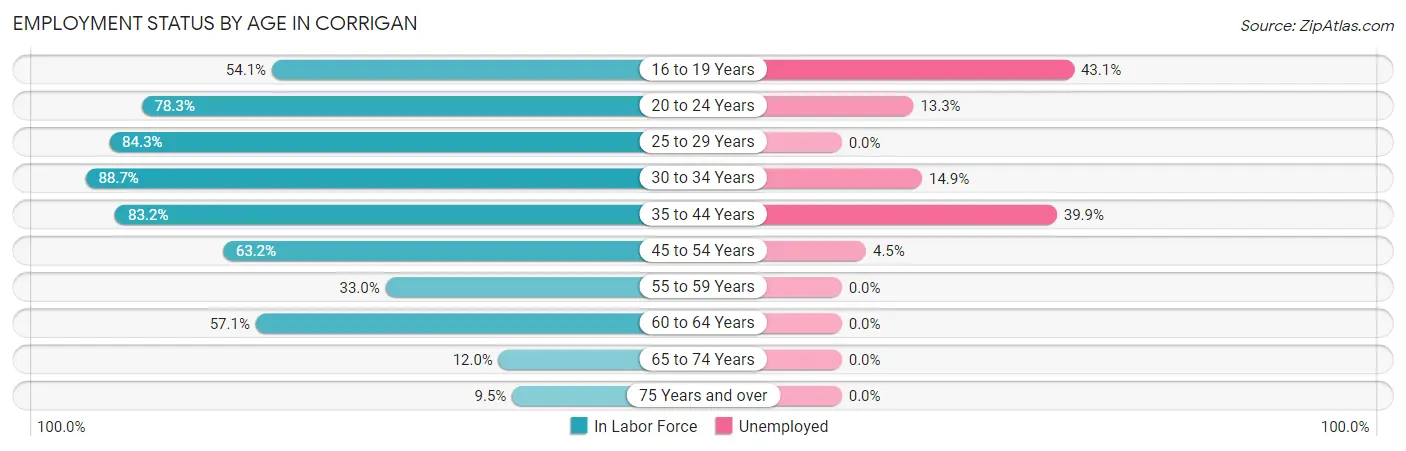
| Age Bracket | In Labor Force | Unemployed |
| 16 to 19 Years | 72 (54.1%) | 31 (43.1%) |
| 20 to 24 Years | 166 (78.3%) | 22 (13.3%) |
| 25 to 29 Years | 70 (84.3%) | 0 (0.0%) |
| 30 to 34 Years | 94 (88.7%) | 14 (14.9%) |
| 35 to 44 Years | 168 (83.2%) | 67 (39.9%) |
| 45 to 54 Years | 156 (63.2%) | 7 (4.5%) |
| 55 to 59 Years | 32 (33.0%) | 0 (0.0%) |
| 60 to 64 Years | 92 (57.1%) | 0 (0.0%) |
| 65 to 74 Years | 32 (12.0%) | 0 (0.0%) |
| 75 Years and over | 4 (9.5%) | 0 (0.0%) |
| Total | 886 (57.2%) | 141 (15.9%) |
Employment Status by Educational Attainment in Corrigan
According to labor force statistics for Corrigan, 68.3% of individuals (612) out of the total population between 25 and 64 years of age (896) are in the labor force, with 14.4% or 88 of them being unemployed. The group with the highest labor force participation rate are those with the educational attainment of bachelor's degree or higher, with 77.2% or 61 individuals in the labor force. Within the labor force, individuals with high school diploma education have the highest percentage of unemployment, with 23.2% or 74 of them being unemployed.
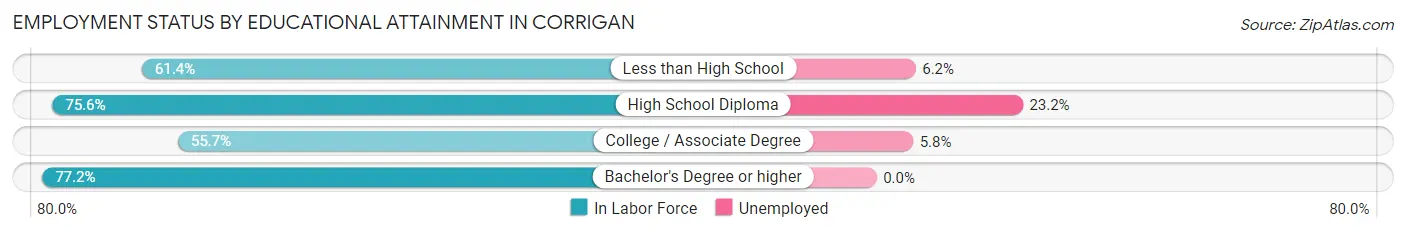
| Educational Attainment | In Labor Force | Unemployed |
| Less than High School | 129 (61.4%) | 13 (6.2%) |
| High School Diploma | 319 (75.6%) | 98 (23.2%) |
| College / Associate Degree | 103 (55.7%) | 11 (5.8%) |
| Bachelor's Degree or higher | 61 (77.2%) | 0 (0.0%) |
| Total | 612 (68.3%) | 129 (14.4%) |
Employment Occupations by Sex in Corrigan
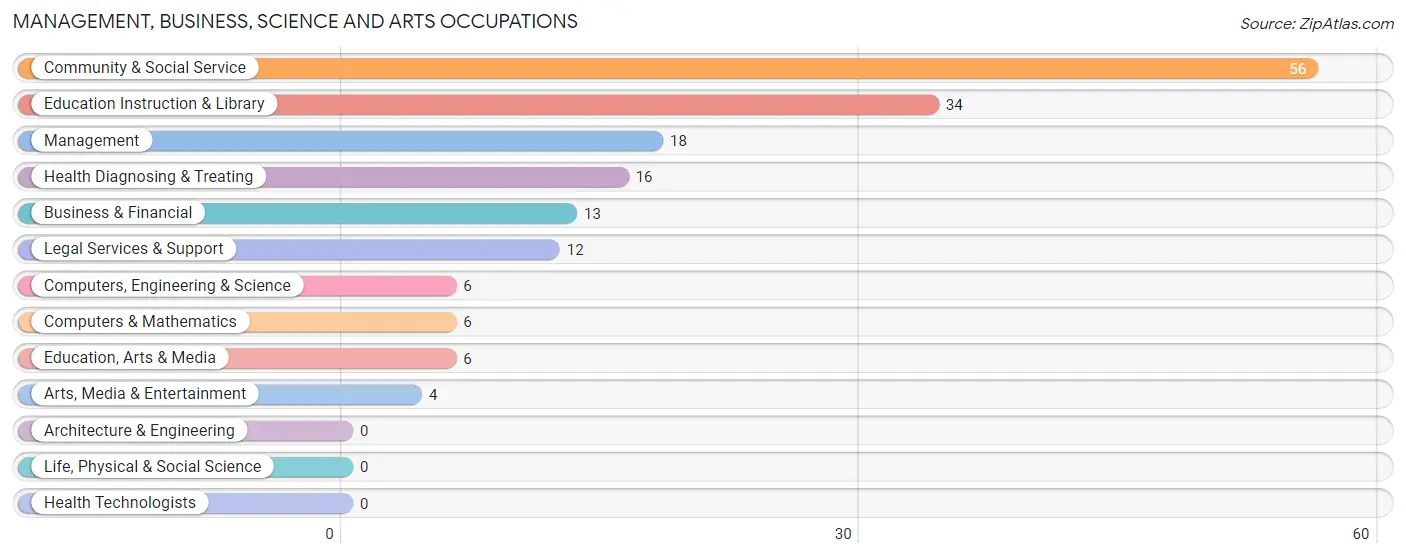
Management, Business, Science and Arts Occupations
The most common Management, Business, Science and Arts occupations in Corrigan are Community & Social Service (56 | 7.5%), Education Instruction & Library (34 | 4.6%), Management (18 | 2.4%), Health Diagnosing & Treating (16 | 2.1%), and Business & Financial (13 | 1.7%).
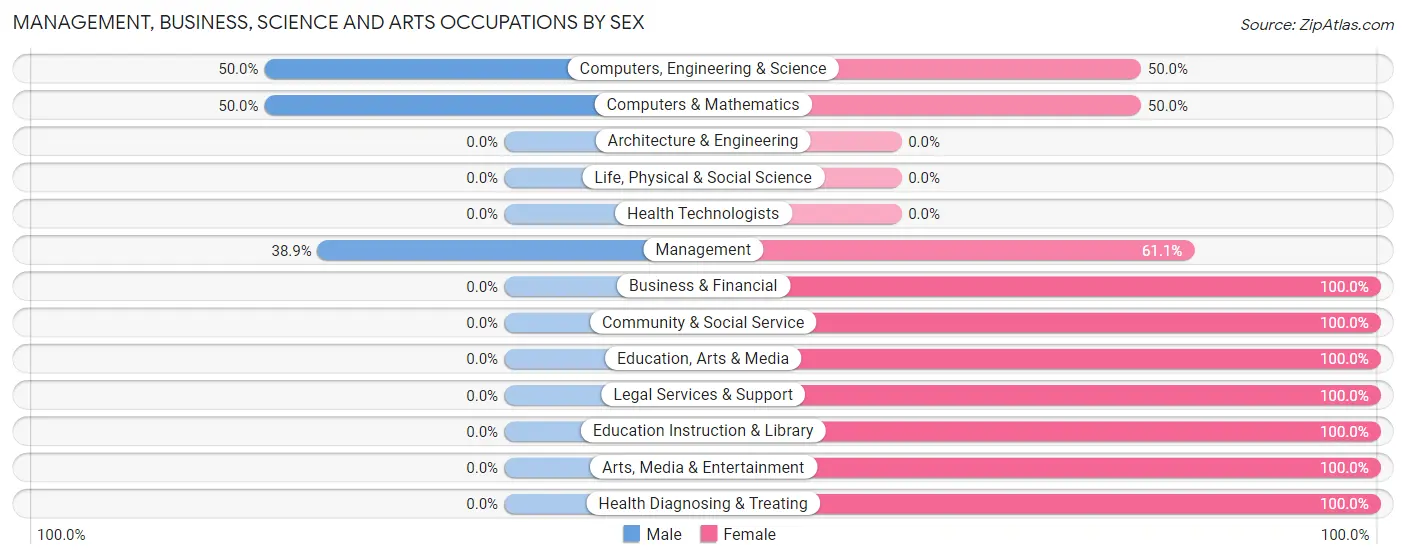
Management, Business, Science and Arts Occupations by Sex
Within the Management, Business, Science and Arts occupations in Corrigan, the most male-oriented occupations are Computers, Engineering & Science (50.0%), Computers & Mathematics (50.0%), and Management (38.9%), while the most female-oriented occupations are Business & Financial (100.0%), Community & Social Service (100.0%), and Education, Arts & Media (100.0%).
| Occupation | Male | Female |
| Management | 7 (38.9%) | 11 (61.1%) |
| Business & Financial | 0 (0.0%) | 13 (100.0%) |
| Computers, Engineering & Science | 3 (50.0%) | 3 (50.0%) |
| Computers & Mathematics | 3 (50.0%) | 3 (50.0%) |
| Architecture & Engineering | 0 (0.0%) | 0 (0.0%) |
| Life, Physical & Social Science | 0 (0.0%) | 0 (0.0%) |
| Community & Social Service | 0 (0.0%) | 56 (100.0%) |
| Education, Arts & Media | 0 (0.0%) | 6 (100.0%) |
| Legal Services & Support | 0 (0.0%) | 12 (100.0%) |
| Education Instruction & Library | 0 (0.0%) | 34 (100.0%) |
| Arts, Media & Entertainment | 0 (0.0%) | 4 (100.0%) |
| Health Diagnosing & Treating | 0 (0.0%) | 16 (100.0%) |
| Health Technologists | 0 (0.0%) | 0 (0.0%) |
| Total (Category) | 10 (9.2%) | 99 (90.8%) |
| Total (Overall) | 384 (51.5%) | 361 (48.5%) |
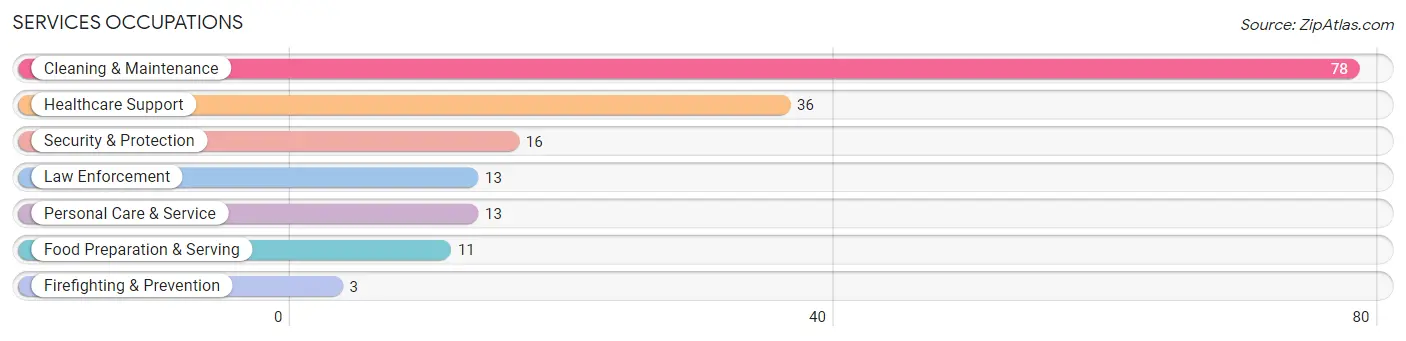
Services Occupations
The most common Services occupations in Corrigan are Cleaning & Maintenance (78 | 10.5%), Healthcare Support (36 | 4.8%), Security & Protection (16 | 2.1%), Law Enforcement (13 | 1.7%), and Personal Care & Service (13 | 1.7%).
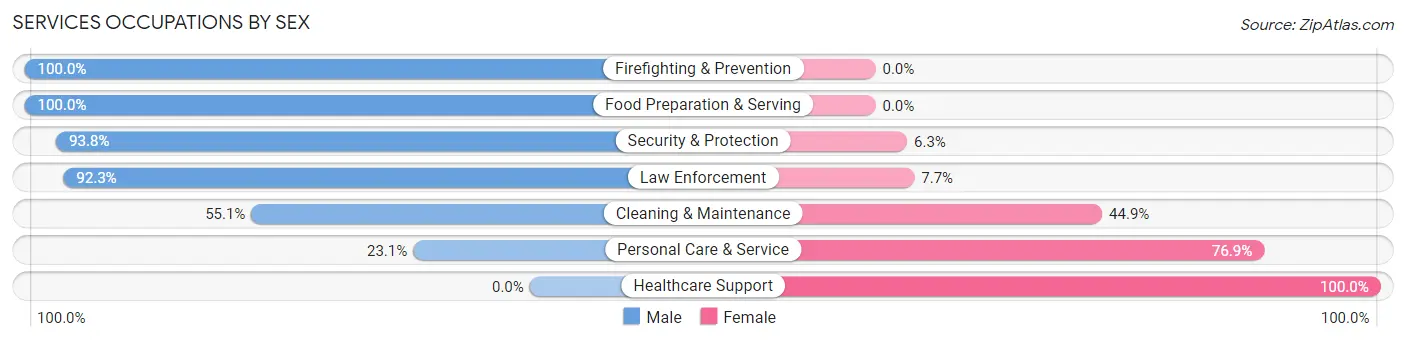
Services Occupations by Sex
Within the Services occupations in Corrigan, the most male-oriented occupations are Firefighting & Prevention (100.0%), Food Preparation & Serving (100.0%), and Security & Protection (93.8%), while the most female-oriented occupations are Healthcare Support (100.0%), Personal Care & Service (76.9%), and Cleaning & Maintenance (44.9%).
| Occupation | Male | Female |
| Healthcare Support | 0 (0.0%) | 36 (100.0%) |
| Security & Protection | 15 (93.8%) | 1 (6.2%) |
| Firefighting & Prevention | 3 (100.0%) | 0 (0.0%) |
| Law Enforcement | 12 (92.3%) | 1 (7.7%) |
| Food Preparation & Serving | 11 (100.0%) | 0 (0.0%) |
| Cleaning & Maintenance | 43 (55.1%) | 35 (44.9%) |
| Personal Care & Service | 3 (23.1%) | 10 (76.9%) |
| Total (Category) | 72 (46.8%) | 82 (53.2%) |
| Total (Overall) | 384 (51.5%) | 361 (48.5%) |
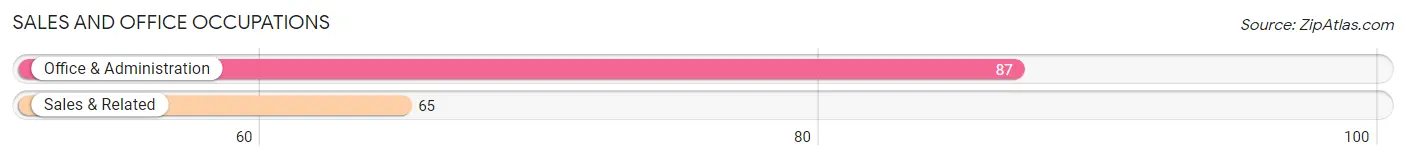
Sales and Office Occupations
The most common Sales and Office occupations in Corrigan are Office & Administration (87 | 11.7%), and Sales & Related (65 | 8.7%).
Sales and Office Occupations by Sex
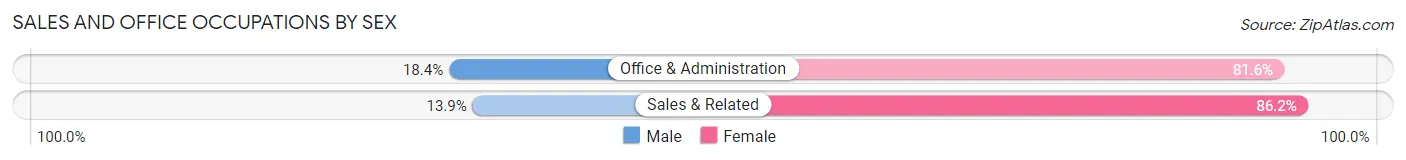
| Occupation | Male | Female |
| Sales & Related | 9 (13.9%) | 56 (86.2%) |
| Office & Administration | 16 (18.4%) | 71 (81.6%) |
| Total (Category) | 25 (16.5%) | 127 (83.6%) |
| Total (Overall) | 384 (51.5%) | 361 (48.5%) |
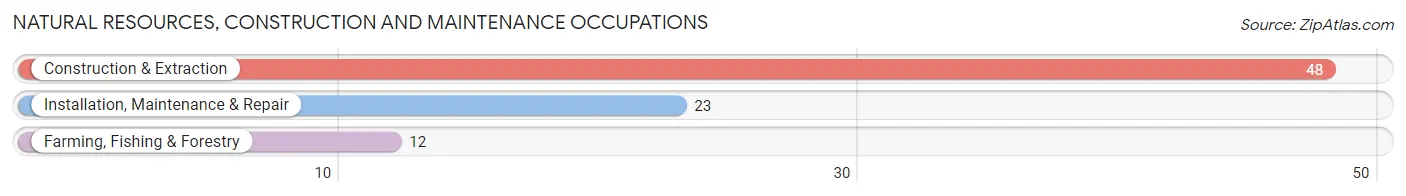
Natural Resources, Construction and Maintenance Occupations
The most common Natural Resources, Construction and Maintenance occupations in Corrigan are Construction & Extraction (48 | 6.4%), Installation, Maintenance & Repair (23 | 3.1%), and Farming, Fishing & Forestry (12 | 1.6%).
Natural Resources, Construction and Maintenance Occupations by Sex
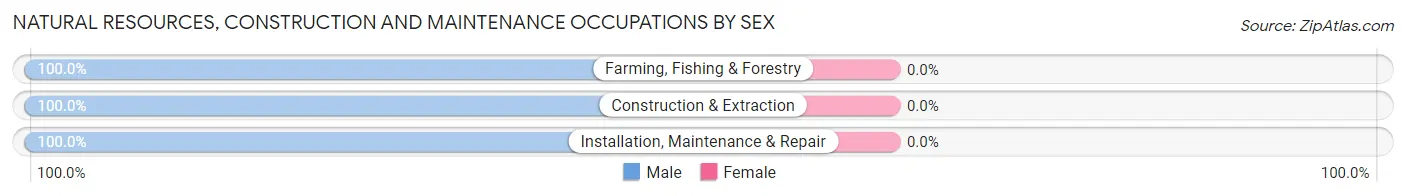
| Occupation | Male | Female |
| Farming, Fishing & Forestry | 12 (100.0%) | 0 (0.0%) |
| Construction & Extraction | 48 (100.0%) | 0 (0.0%) |
| Installation, Maintenance & Repair | 23 (100.0%) | 0 (0.0%) |
| Total (Category) | 83 (100.0%) | 0 (0.0%) |
| Total (Overall) | 384 (51.5%) | 361 (48.5%) |
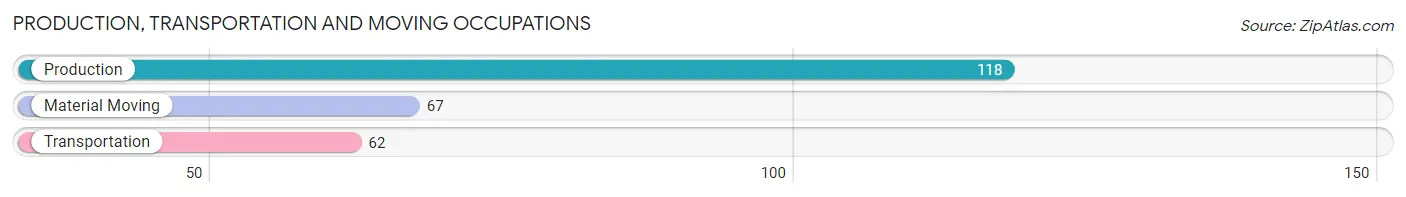
Production, Transportation and Moving Occupations
The most common Production, Transportation and Moving occupations in Corrigan are Production (118 | 15.8%), Material Moving (67 | 9.0%), and Transportation (62 | 8.3%).
Production, Transportation and Moving Occupations by Sex
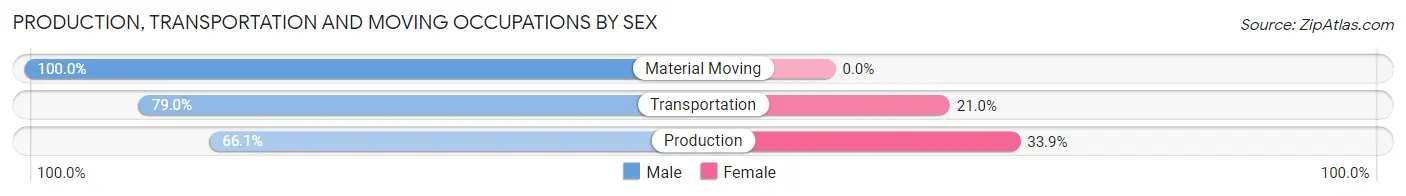
| Occupation | Male | Female |
| Production | 78 (66.1%) | 40 (33.9%) |
| Transportation | 49 (79.0%) | 13 (21.0%) |
| Material Moving | 67 (100.0%) | 0 (0.0%) |
| Total (Category) | 194 (78.5%) | 53 (21.5%) |
| Total (Overall) | 384 (51.5%) | 361 (48.5%) |
Employment Industries by Sex in Corrigan
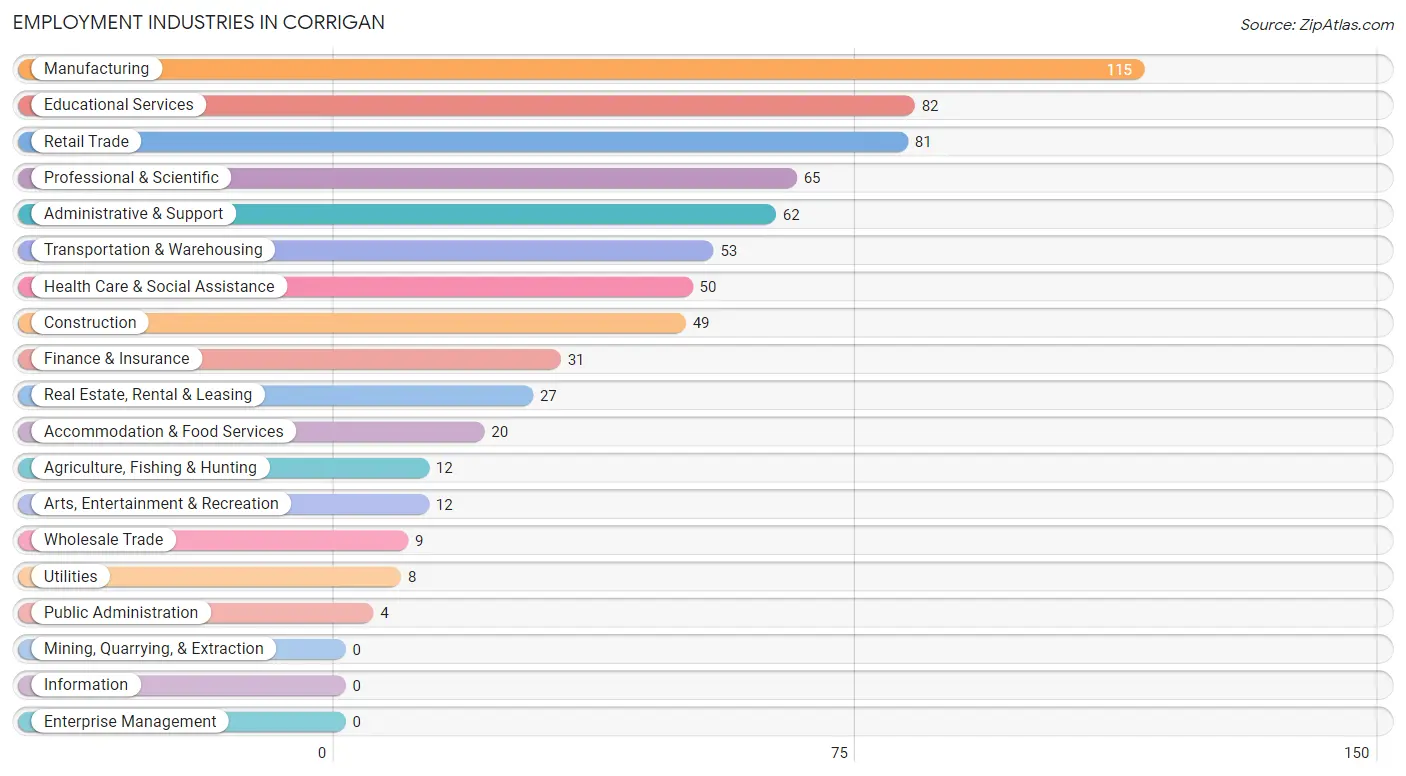
Employment Industries in Corrigan
The major employment industries in Corrigan include Manufacturing (115 | 15.4%), Educational Services (82 | 11.0%), Retail Trade (81 | 10.9%), Professional & Scientific (65 | 8.7%), and Administrative & Support (62 | 8.3%).
Employment Industries by Sex in Corrigan
The Corrigan industries that see more men than women are Agriculture, Fishing & Hunting (100.0%), Construction (100.0%), and Wholesale Trade (100.0%), whereas the industries that tend to have a higher number of women are Professional & Scientific (100.0%), Health Care & Social Assistance (100.0%), and Finance & Insurance (93.5%).
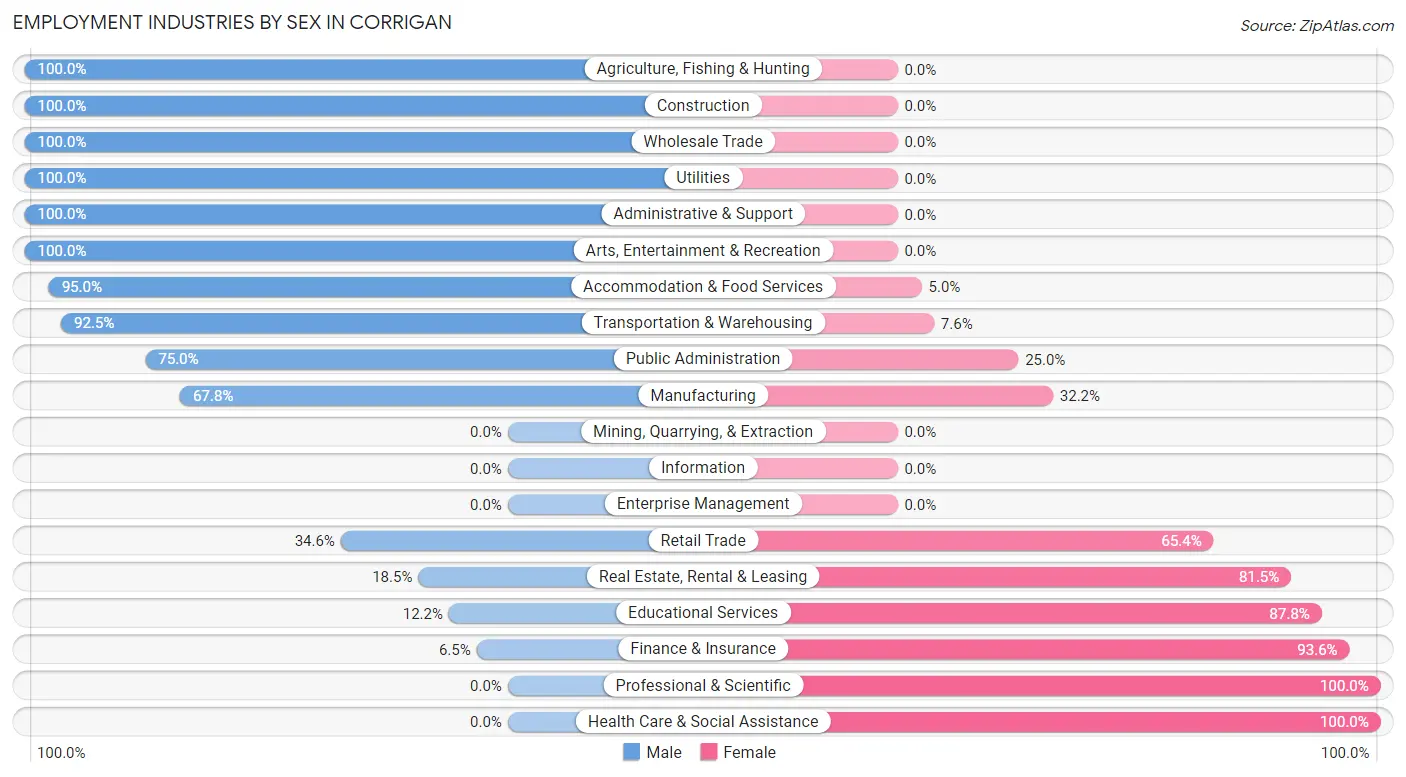
| Industry | Male | Female |
| Agriculture, Fishing & Hunting | 12 (100.0%) | 0 (0.0%) |
| Mining, Quarrying, & Extraction | 0 (0.0%) | 0 (0.0%) |
| Construction | 49 (100.0%) | 0 (0.0%) |
| Manufacturing | 78 (67.8%) | 37 (32.2%) |
| Wholesale Trade | 9 (100.0%) | 0 (0.0%) |
| Retail Trade | 28 (34.6%) | 53 (65.4%) |
| Transportation & Warehousing | 49 (92.4%) | 4 (7.5%) |
| Utilities | 8 (100.0%) | 0 (0.0%) |
| Information | 0 (0.0%) | 0 (0.0%) |
| Finance & Insurance | 2 (6.5%) | 29 (93.5%) |
| Real Estate, Rental & Leasing | 5 (18.5%) | 22 (81.5%) |
| Professional & Scientific | 0 (0.0%) | 65 (100.0%) |
| Enterprise Management | 0 (0.0%) | 0 (0.0%) |
| Administrative & Support | 62 (100.0%) | 0 (0.0%) |
| Educational Services | 10 (12.2%) | 72 (87.8%) |
| Health Care & Social Assistance | 0 (0.0%) | 50 (100.0%) |
| Arts, Entertainment & Recreation | 12 (100.0%) | 0 (0.0%) |
| Accommodation & Food Services | 19 (95.0%) | 1 (5.0%) |
| Public Administration | 3 (75.0%) | 1 (25.0%) |
| Total | 384 (51.5%) | 361 (48.5%) |
Education in Corrigan
School Enrollment in Corrigan
The most common levels of schooling among the 498 students in Corrigan are middle school (135 | 27.1%), elementary school (122 | 24.5%), and high school (122 | 24.5%).
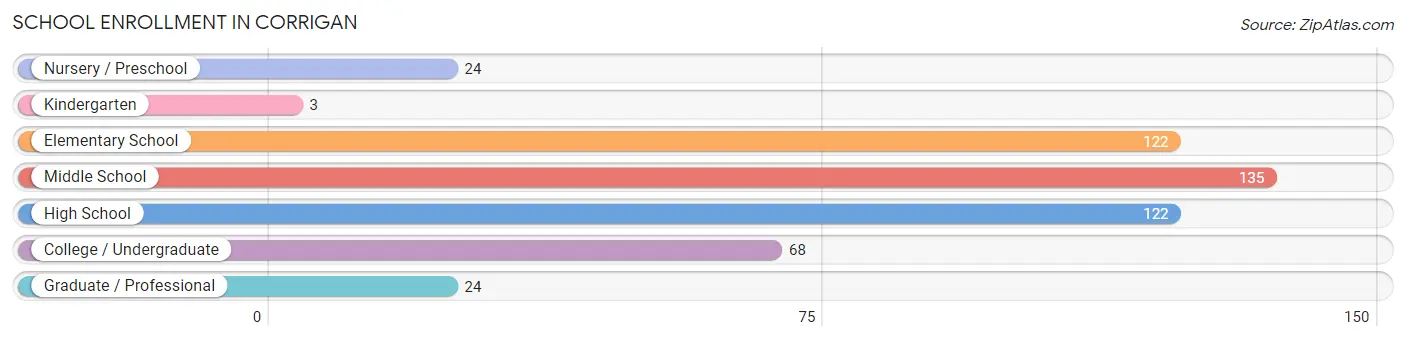
| School Level | # Students | % Students |
| Nursery / Preschool | 24 | 4.8% |
| Kindergarten | 3 | 0.6% |
| Elementary School | 122 | 24.5% |
| Middle School | 135 | 27.1% |
| High School | 122 | 24.5% |
| College / Undergraduate | 68 | 13.7% |
| Graduate / Professional | 24 | 4.8% |
| Total | 498 | 100.0% |
School Enrollment by Age by Funding Source in Corrigan
Out of a total of 498 students who are enrolled in schools in Corrigan, 36 (7.2%) attend a private institution, while the remaining 462 (92.8%) are enrolled in public schools. The age group of 25 to 34 year olds has the highest likelihood of being enrolled in private schools, with 10 (62.5% in the age bracket) enrolled. Conversely, the age group of 3 to 4 year olds has the lowest likelihood of being enrolled in a private school, with 14 (100.0% in the age bracket) attending a public institution.
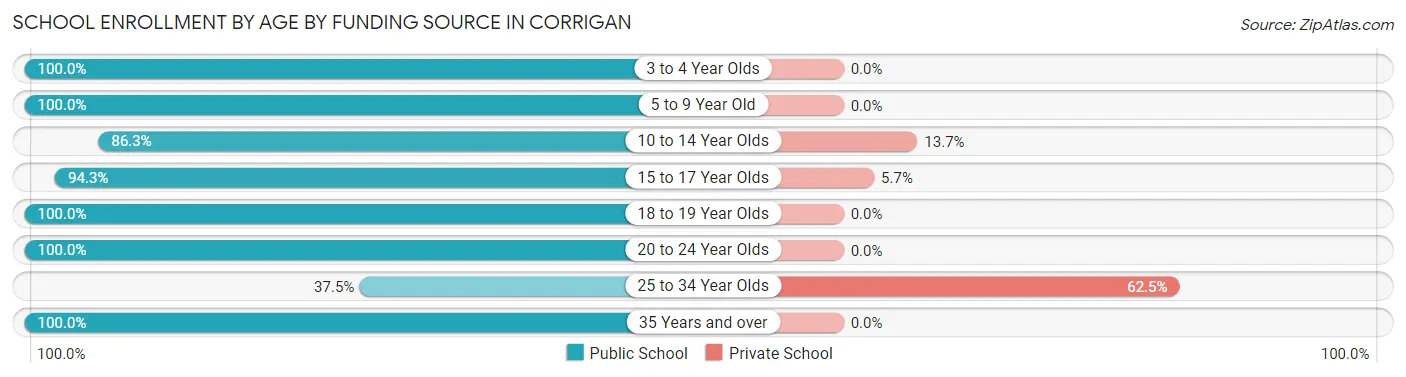
| Age Bracket | Public School | Private School |
| 3 to 4 Year Olds | 14 (100.0%) | 0 (0.0%) |
| 5 to 9 Year Old | 117 (100.0%) | 0 (0.0%) |
| 10 to 14 Year Olds | 132 (86.3%) | 21 (13.7%) |
| 15 to 17 Year Olds | 83 (94.3%) | 5 (5.7%) |
| 18 to 19 Year Olds | 34 (100.0%) | 0 (0.0%) |
| 20 to 24 Year Olds | 60 (100.0%) | 0 (0.0%) |
| 25 to 34 Year Olds | 6 (37.5%) | 10 (62.5%) |
| 35 Years and over | 16 (100.0%) | 0 (0.0%) |
| Total | 462 (92.8%) | 36 (7.2%) |
Educational Attainment by Field of Study in Corrigan
Physical & health sciences (23 | 25.6%), liberal arts & history (21 | 23.3%), education (10 | 11.1%), visual & performing arts (10 | 11.1%), and arts & humanities (6 | 6.7%) are the most common fields of study among 90 individuals in Corrigan who have obtained a bachelor's degree or higher.
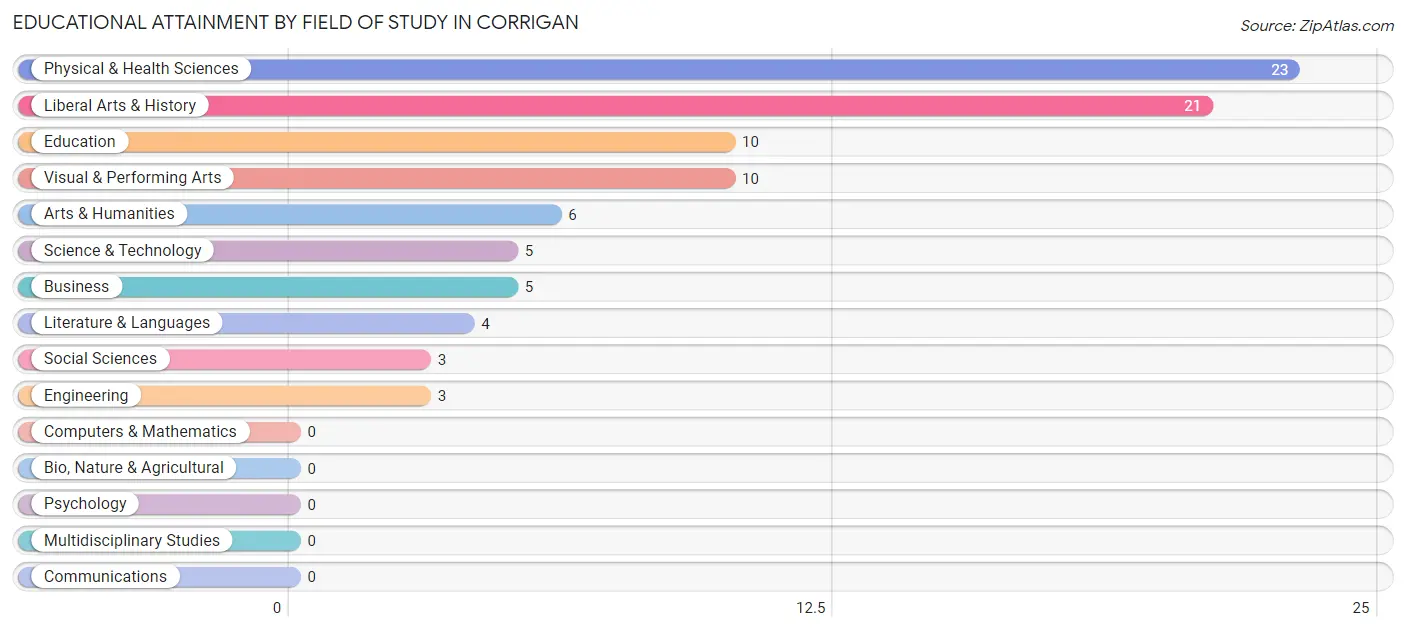
| Field of Study | # Graduates | % Graduates |
| Computers & Mathematics | 0 | 0.0% |
| Bio, Nature & Agricultural | 0 | 0.0% |
| Physical & Health Sciences | 23 | 25.6% |
| Psychology | 0 | 0.0% |
| Social Sciences | 3 | 3.3% |
| Engineering | 3 | 3.3% |
| Multidisciplinary Studies | 0 | 0.0% |
| Science & Technology | 5 | 5.6% |
| Business | 5 | 5.6% |
| Education | 10 | 11.1% |
| Literature & Languages | 4 | 4.4% |
| Liberal Arts & History | 21 | 23.3% |
| Visual & Performing Arts | 10 | 11.1% |
| Communications | 0 | 0.0% |
| Arts & Humanities | 6 | 6.7% |
| Total | 90 | 100.0% |
Transportation & Commute in Corrigan
Vehicle Availability by Sex in Corrigan
The most prevalent vehicle ownership categories in Corrigan are males with 2 vehicles (208, accounting for 55.6%) and females with 2 vehicles (82, making up 62.6%).
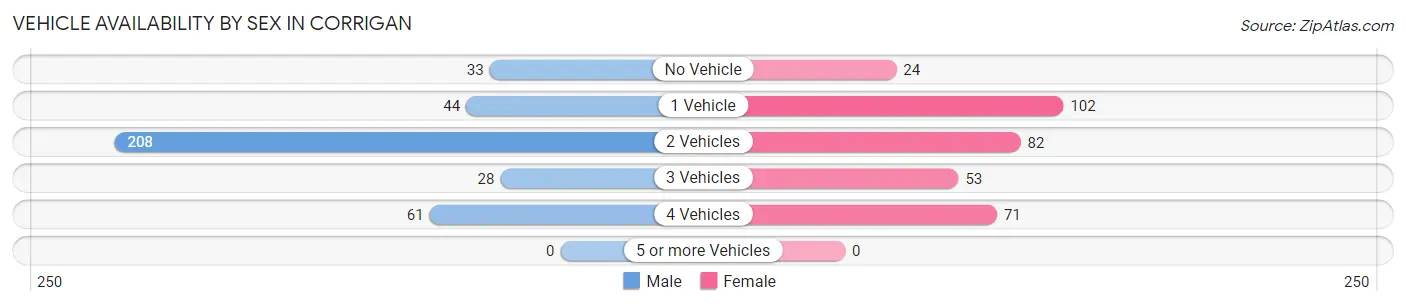
| Vehicles Available | Male | Female |
| No Vehicle | 33 (8.8%) | 24 (7.2%) |
| 1 Vehicle | 44 (11.8%) | 102 (30.7%) |
| 2 Vehicles | 208 (55.6%) | 82 (24.7%) |
| 3 Vehicles | 28 (7.5%) | 53 (16.0%) |
| 4 Vehicles | 61 (16.3%) | 71 (21.4%) |
| 5 or more Vehicles | 0 (0.0%) | 0 (0.0%) |
| Total | 374 (100.0%) | 332 (100.0%) |
Commute Time in Corrigan
The most frequently occuring commute durations in Corrigan are 30 to 34 minutes (131 commuters, 19.6%), 10 to 14 minutes (118 commuters, 17.6%), and 5 to 9 minutes (112 commuters, 16.7%).
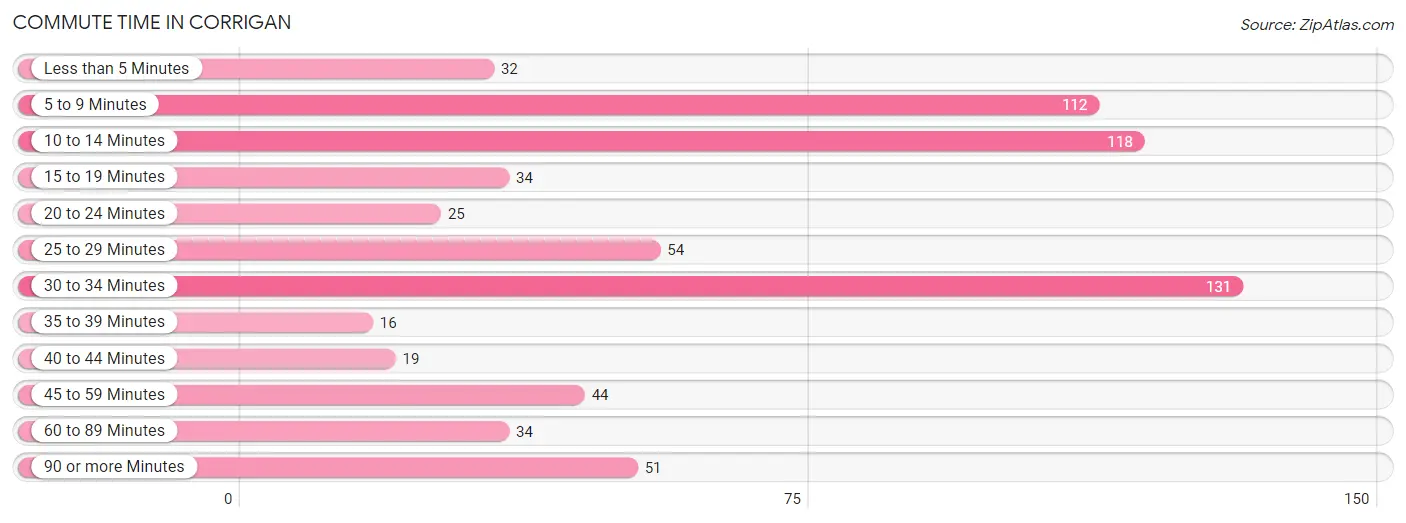
| Commute Time | # Commuters | % Commuters |
| Less than 5 Minutes | 32 | 4.8% |
| 5 to 9 Minutes | 112 | 16.7% |
| 10 to 14 Minutes | 118 | 17.6% |
| 15 to 19 Minutes | 34 | 5.1% |
| 20 to 24 Minutes | 25 | 3.7% |
| 25 to 29 Minutes | 54 | 8.1% |
| 30 to 34 Minutes | 131 | 19.6% |
| 35 to 39 Minutes | 16 | 2.4% |
| 40 to 44 Minutes | 19 | 2.8% |
| 45 to 59 Minutes | 44 | 6.6% |
| 60 to 89 Minutes | 34 | 5.1% |
| 90 or more Minutes | 51 | 7.6% |
Commute Time by Sex in Corrigan
The most common commute times in Corrigan are 10 to 14 minutes (82 commuters, 21.9%) for males and 30 to 34 minutes (104 commuters, 35.1%) for females.
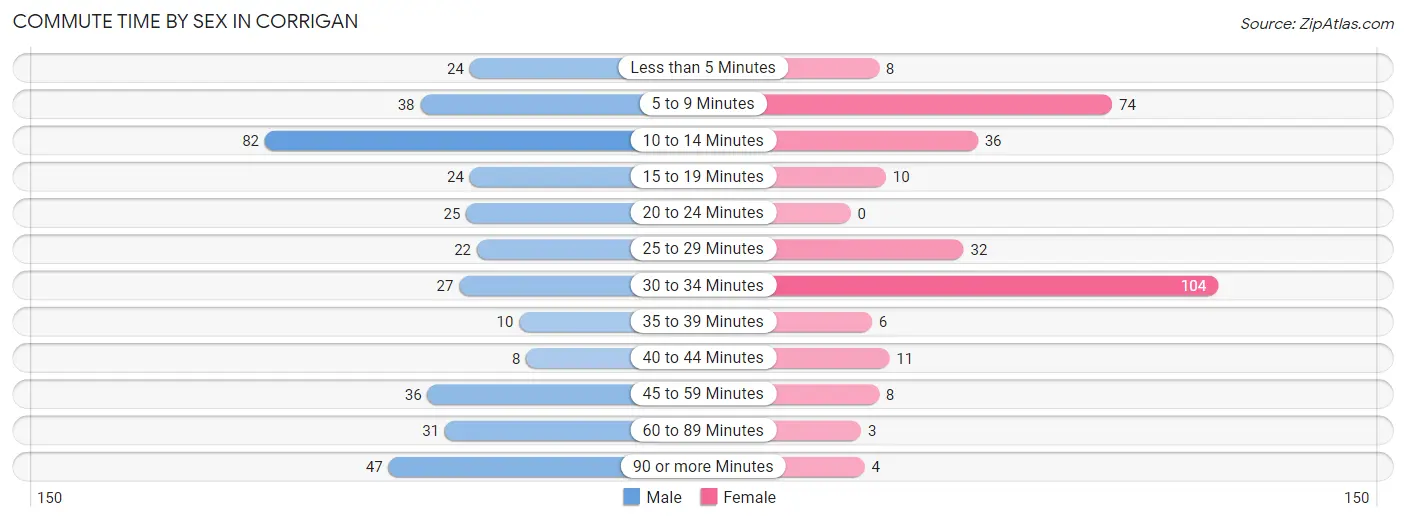
| Commute Time | Male | Female |
| Less than 5 Minutes | 24 (6.4%) | 8 (2.7%) |
| 5 to 9 Minutes | 38 (10.2%) | 74 (25.0%) |
| 10 to 14 Minutes | 82 (21.9%) | 36 (12.2%) |
| 15 to 19 Minutes | 24 (6.4%) | 10 (3.4%) |
| 20 to 24 Minutes | 25 (6.7%) | 0 (0.0%) |
| 25 to 29 Minutes | 22 (5.9%) | 32 (10.8%) |
| 30 to 34 Minutes | 27 (7.2%) | 104 (35.1%) |
| 35 to 39 Minutes | 10 (2.7%) | 6 (2.0%) |
| 40 to 44 Minutes | 8 (2.1%) | 11 (3.7%) |
| 45 to 59 Minutes | 36 (9.6%) | 8 (2.7%) |
| 60 to 89 Minutes | 31 (8.3%) | 3 (1.0%) |
| 90 or more Minutes | 47 (12.6%) | 4 (1.3%) |
Time of Departure to Work by Sex in Corrigan
The most frequent times of departure to work in Corrigan are 5:30 AM to 5:59 AM (71, 19.0%) for males and 7:00 AM to 7:29 AM (86, 29.0%) for females.
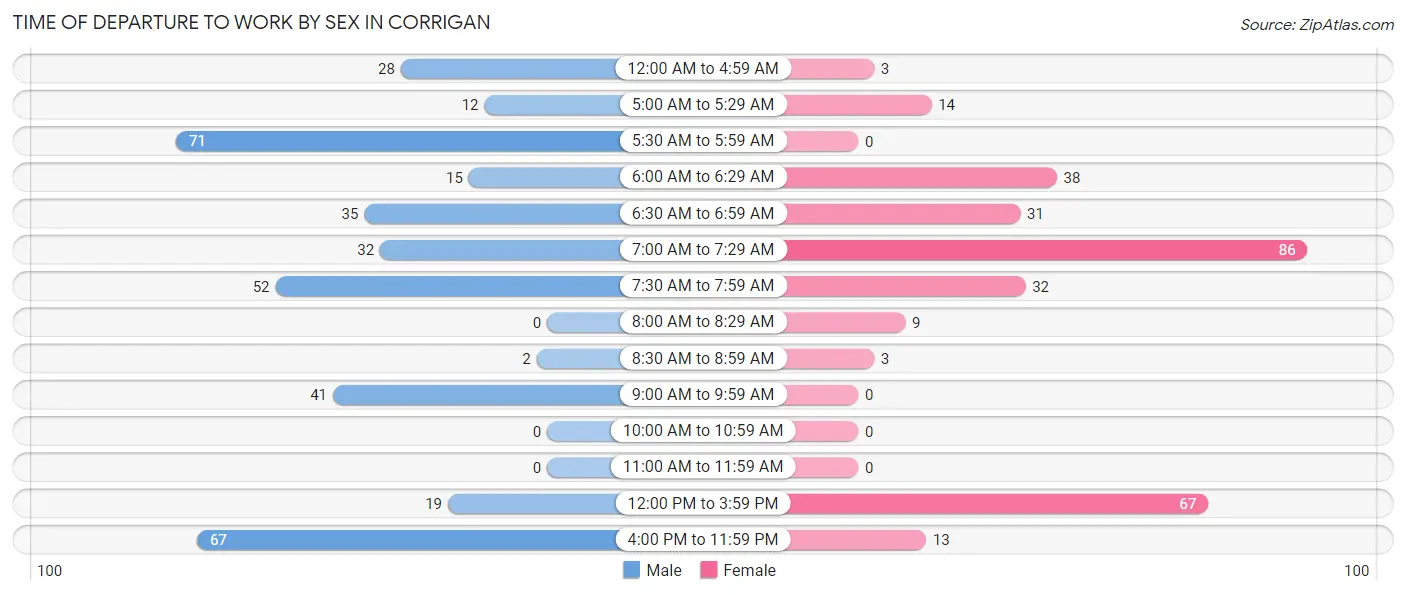
| Time of Departure | Male | Female |
| 12:00 AM to 4:59 AM | 28 (7.5%) | 3 (1.0%) |
| 5:00 AM to 5:29 AM | 12 (3.2%) | 14 (4.7%) |
| 5:30 AM to 5:59 AM | 71 (19.0%) | 0 (0.0%) |
| 6:00 AM to 6:29 AM | 15 (4.0%) | 38 (12.8%) |
| 6:30 AM to 6:59 AM | 35 (9.4%) | 31 (10.5%) |
| 7:00 AM to 7:29 AM | 32 (8.6%) | 86 (29.0%) |
| 7:30 AM to 7:59 AM | 52 (13.9%) | 32 (10.8%) |
| 8:00 AM to 8:29 AM | 0 (0.0%) | 9 (3.0%) |
| 8:30 AM to 8:59 AM | 2 (0.5%) | 3 (1.0%) |
| 9:00 AM to 9:59 AM | 41 (11.0%) | 0 (0.0%) |
| 10:00 AM to 10:59 AM | 0 (0.0%) | 0 (0.0%) |
| 11:00 AM to 11:59 AM | 0 (0.0%) | 0 (0.0%) |
| 12:00 PM to 3:59 PM | 19 (5.1%) | 67 (22.6%) |
| 4:00 PM to 11:59 PM | 67 (17.9%) | 13 (4.4%) |
| Total | 374 (100.0%) | 296 (100.0%) |
Housing Occupancy in Corrigan
Occupancy by Ownership in Corrigan
Of the total 710 dwellings in Corrigan, owner-occupied units account for 309 (43.5%), while renter-occupied units make up 401 (56.5%).
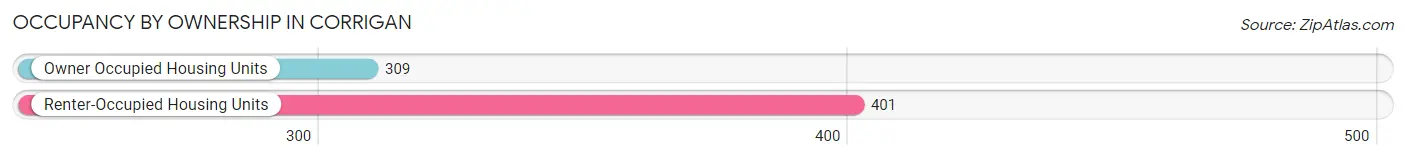
| Occupancy | # Housing Units | % Housing Units |
| Owner Occupied Housing Units | 309 | 43.5% |
| Renter-Occupied Housing Units | 401 | 56.5% |
| Total Occupied Housing Units | 710 | 100.0% |
Occupancy by Household Size in Corrigan
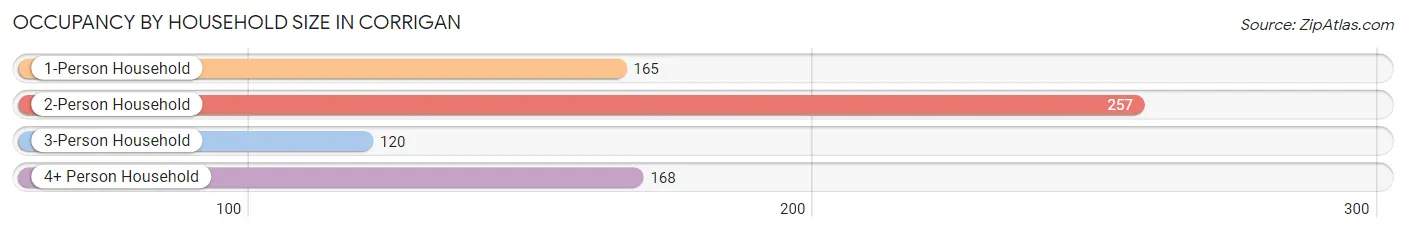
| Household Size | # Housing Units | % Housing Units |
| 1-Person Household | 165 | 23.2% |
| 2-Person Household | 257 | 36.2% |
| 3-Person Household | 120 | 16.9% |
| 4+ Person Household | 168 | 23.7% |
| Total Housing Units | 710 | 100.0% |
Occupancy by Ownership by Household Size in Corrigan
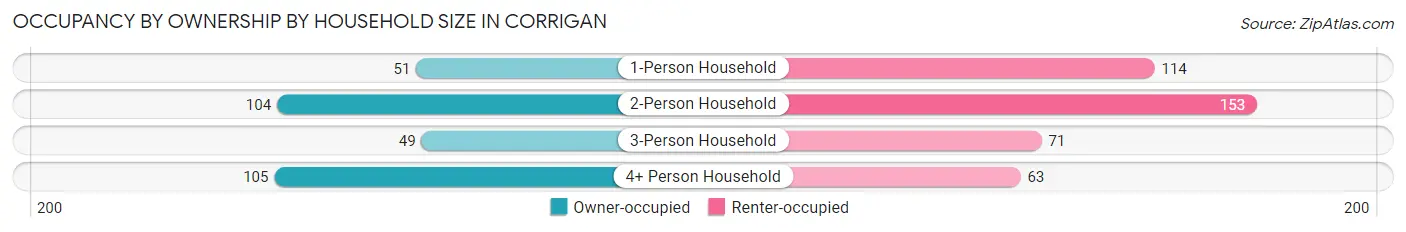
| Household Size | Owner-occupied | Renter-occupied |
| 1-Person Household | 51 (30.9%) | 114 (69.1%) |
| 2-Person Household | 104 (40.5%) | 153 (59.5%) |
| 3-Person Household | 49 (40.8%) | 71 (59.2%) |
| 4+ Person Household | 105 (62.5%) | 63 (37.5%) |
| Total Housing Units | 309 (43.5%) | 401 (56.5%) |
Occupancy by Educational Attainment in Corrigan
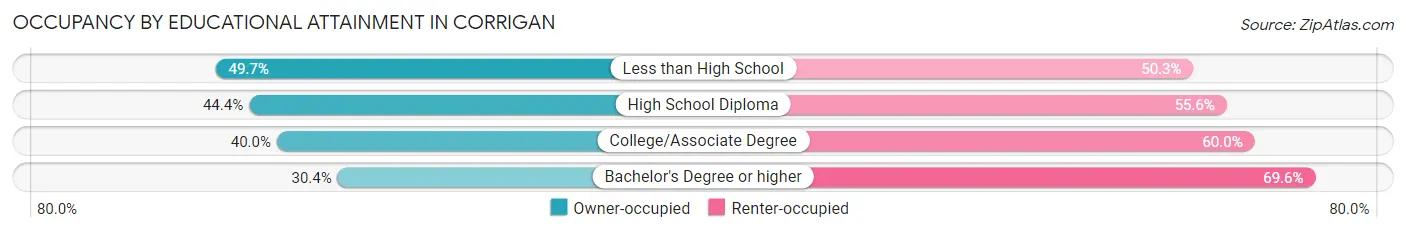
| Household Size | Owner-occupied | Renter-occupied |
| Less than High School | 85 (49.7%) | 86 (50.3%) |
| High School Diploma | 139 (44.4%) | 174 (55.6%) |
| College/Associate Degree | 68 (40.0%) | 102 (60.0%) |
| Bachelor's Degree or higher | 17 (30.4%) | 39 (69.6%) |
Occupancy by Age of Householder in Corrigan
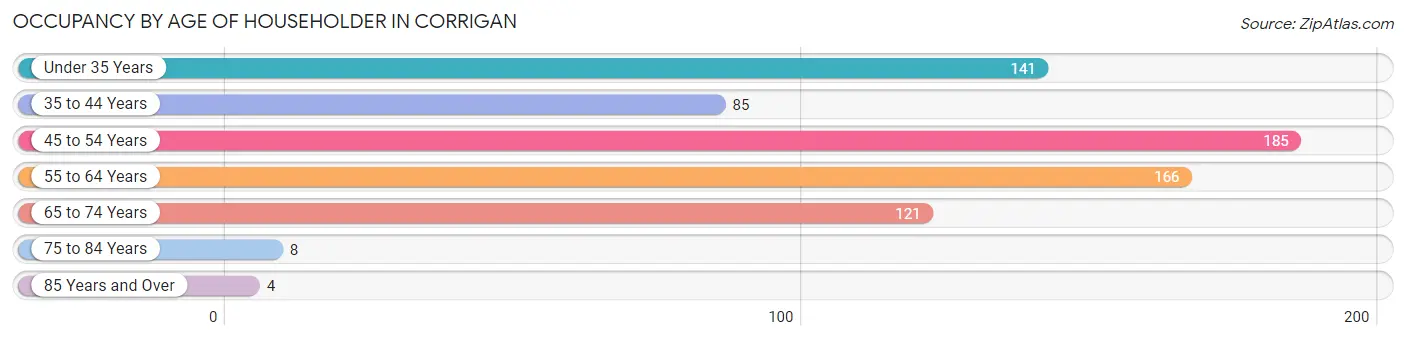
| Age Bracket | # Households | % Households |
| Under 35 Years | 141 | 19.9% |
| 35 to 44 Years | 85 | 12.0% |
| 45 to 54 Years | 185 | 26.1% |
| 55 to 64 Years | 166 | 23.4% |
| 65 to 74 Years | 121 | 17.0% |
| 75 to 84 Years | 8 | 1.1% |
| 85 Years and Over | 4 | 0.6% |
| Total | 710 | 100.0% |
Housing Finances in Corrigan
Median Income by Occupancy in Corrigan
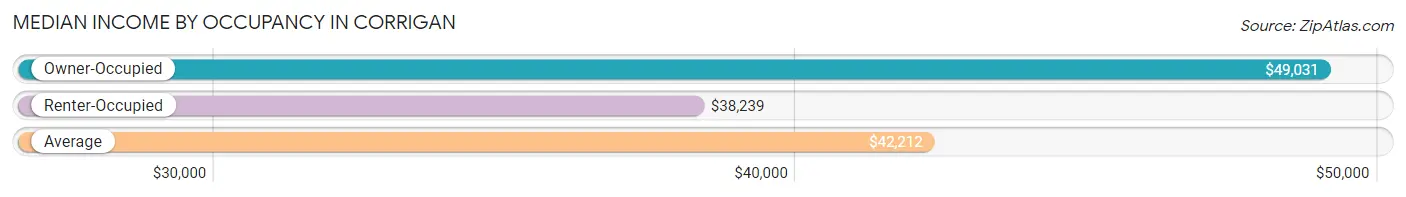
| Occupancy Type | # Households | Median Income |
| Owner-Occupied | 309 (43.5%) | $49,031 |
| Renter-Occupied | 401 (56.5%) | $38,239 |
| Average | 710 (100.0%) | $42,212 |
Occupancy by Householder Income Bracket in Corrigan
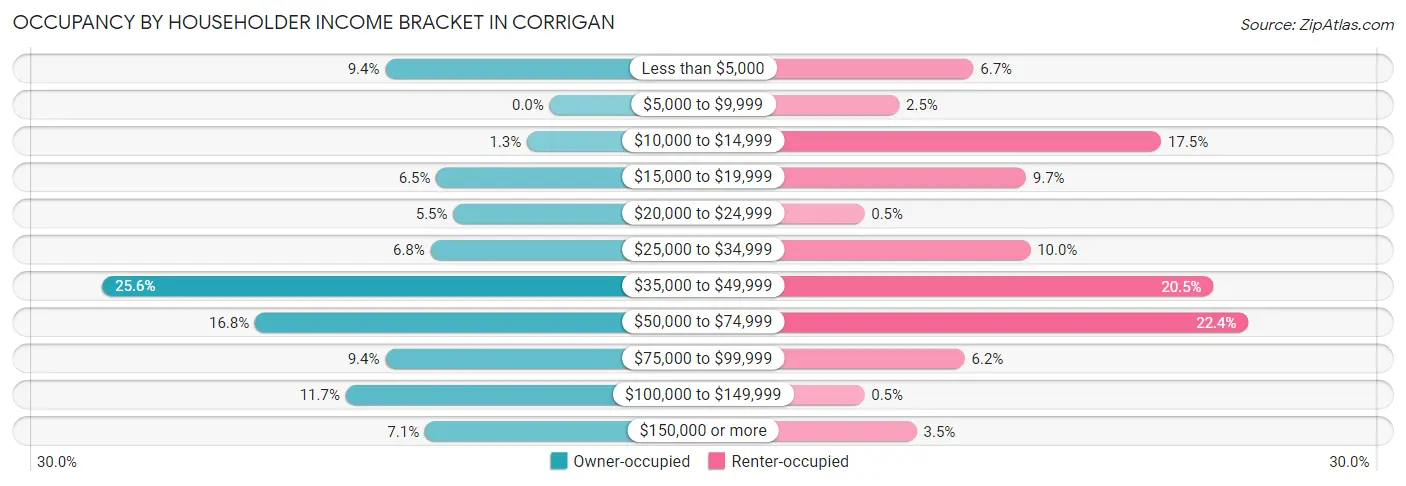
| Income Bracket | Owner-occupied | Renter-occupied |
| Less than $5,000 | 29 (9.4%) | 27 (6.7%) |
| $5,000 to $9,999 | 0 (0.0%) | 10 (2.5%) |
| $10,000 to $14,999 | 4 (1.3%) | 70 (17.5%) |
| $15,000 to $19,999 | 20 (6.5%) | 39 (9.7%) |
| $20,000 to $24,999 | 17 (5.5%) | 2 (0.5%) |
| $25,000 to $34,999 | 21 (6.8%) | 40 (10.0%) |
| $35,000 to $49,999 | 79 (25.6%) | 82 (20.4%) |
| $50,000 to $74,999 | 52 (16.8%) | 90 (22.4%) |
| $75,000 to $99,999 | 29 (9.4%) | 25 (6.2%) |
| $100,000 to $149,999 | 36 (11.7%) | 2 (0.5%) |
| $150,000 or more | 22 (7.1%) | 14 (3.5%) |
| Total | 309 (100.0%) | 401 (100.0%) |
Monthly Housing Cost Tiers in Corrigan
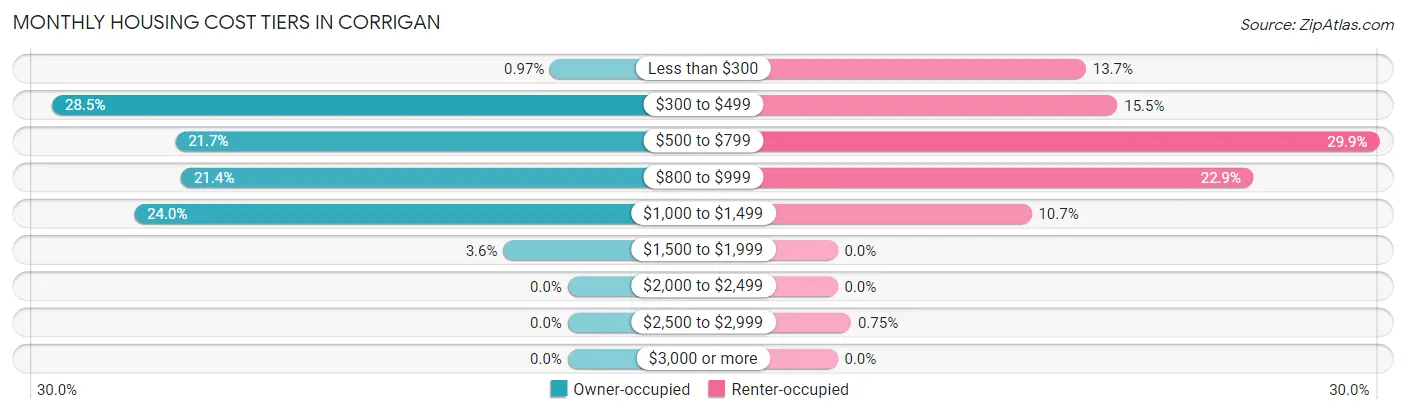
| Monthly Cost | Owner-occupied | Renter-occupied |
| Less than $300 | 3 (1.0%) | 55 (13.7%) |
| $300 to $499 | 88 (28.5%) | 62 (15.5%) |
| $500 to $799 | 67 (21.7%) | 120 (29.9%) |
| $800 to $999 | 66 (21.4%) | 92 (22.9%) |
| $1,000 to $1,499 | 74 (23.9%) | 43 (10.7%) |
| $1,500 to $1,999 | 11 (3.6%) | 0 (0.0%) |
| $2,000 to $2,499 | 0 (0.0%) | 0 (0.0%) |
| $2,500 to $2,999 | 0 (0.0%) | 3 (0.7%) |
| $3,000 or more | 0 (0.0%) | 0 (0.0%) |
| Total | 309 (100.0%) | 401 (100.0%) |
Physical Housing Characteristics in Corrigan
Housing Structures in Corrigan
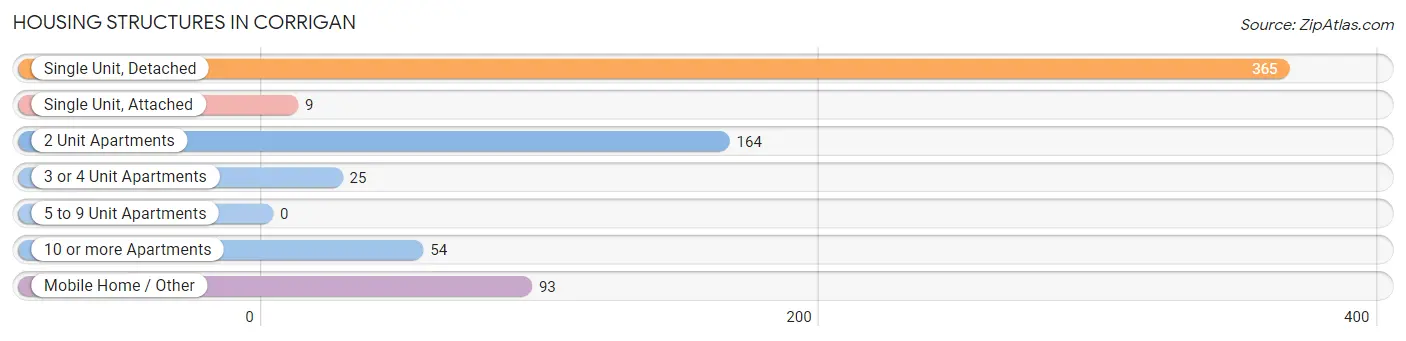
| Structure Type | # Housing Units | % Housing Units |
| Single Unit, Detached | 365 | 51.4% |
| Single Unit, Attached | 9 | 1.3% |
| 2 Unit Apartments | 164 | 23.1% |
| 3 or 4 Unit Apartments | 25 | 3.5% |
| 5 to 9 Unit Apartments | 0 | 0.0% |
| 10 or more Apartments | 54 | 7.6% |
| Mobile Home / Other | 93 | 13.1% |
| Total | 710 | 100.0% |
Housing Structures by Occupancy in Corrigan
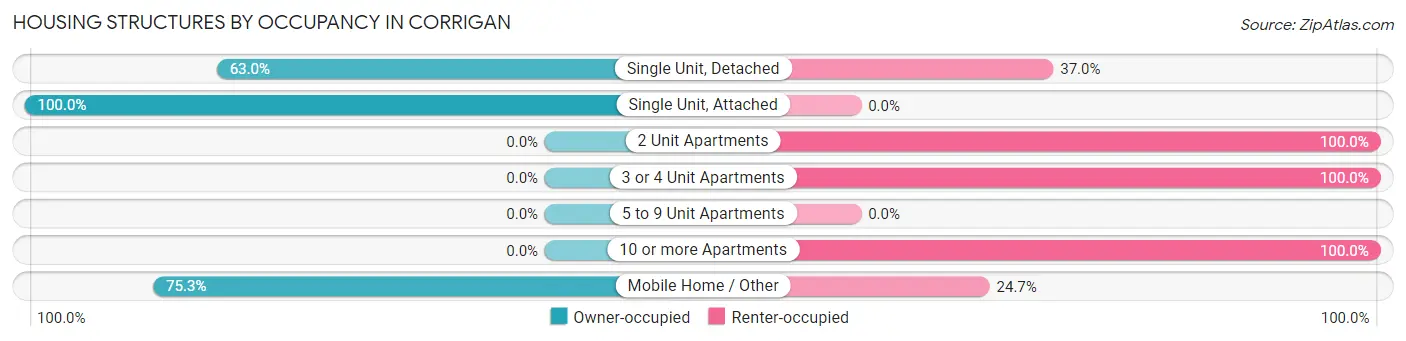
| Structure Type | Owner-occupied | Renter-occupied |
| Single Unit, Detached | 230 (63.0%) | 135 (37.0%) |
| Single Unit, Attached | 9 (100.0%) | 0 (0.0%) |
| 2 Unit Apartments | 0 (0.0%) | 164 (100.0%) |
| 3 or 4 Unit Apartments | 0 (0.0%) | 25 (100.0%) |
| 5 to 9 Unit Apartments | 0 (0.0%) | 0 (0.0%) |
| 10 or more Apartments | 0 (0.0%) | 54 (100.0%) |
| Mobile Home / Other | 70 (75.3%) | 23 (24.7%) |
| Total | 309 (43.5%) | 401 (56.5%) |
Housing Structures by Number of Rooms in Corrigan
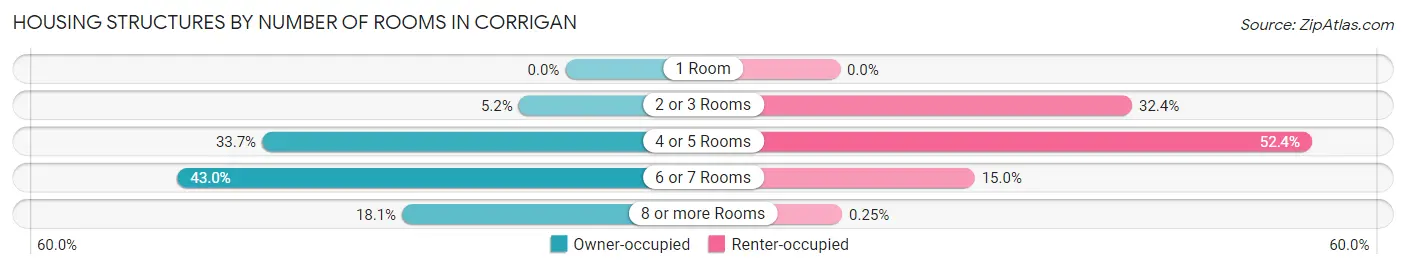
| Number of Rooms | Owner-occupied | Renter-occupied |
| 1 Room | 0 (0.0%) | 0 (0.0%) |
| 2 or 3 Rooms | 16 (5.2%) | 130 (32.4%) |
| 4 or 5 Rooms | 104 (33.7%) | 210 (52.4%) |
| 6 or 7 Rooms | 133 (43.0%) | 60 (15.0%) |
| 8 or more Rooms | 56 (18.1%) | 1 (0.3%) |
| Total | 309 (100.0%) | 401 (100.0%) |
Housing Structure by Heating Type in Corrigan
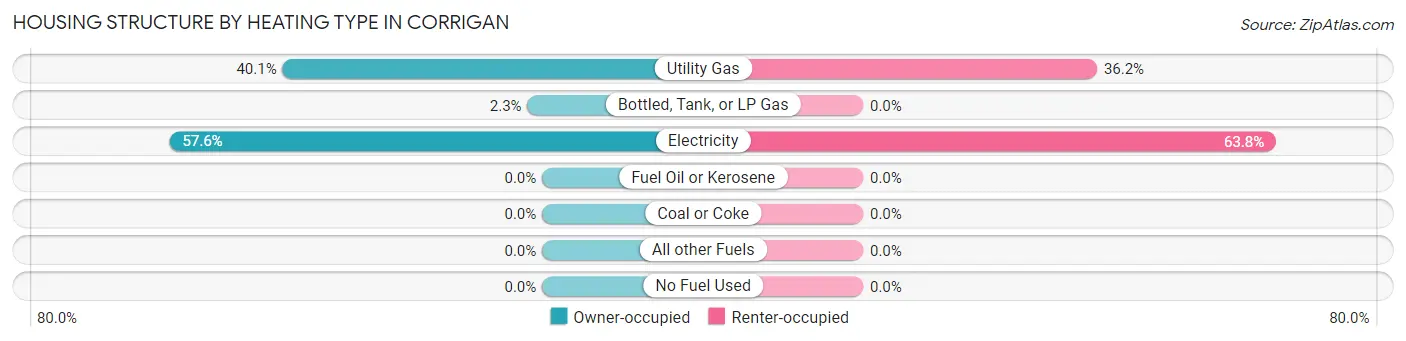
| Heating Type | Owner-occupied | Renter-occupied |
| Utility Gas | 124 (40.1%) | 145 (36.2%) |
| Bottled, Tank, or LP Gas | 7 (2.3%) | 0 (0.0%) |
| Electricity | 178 (57.6%) | 256 (63.8%) |
| Fuel Oil or Kerosene | 0 (0.0%) | 0 (0.0%) |
| Coal or Coke | 0 (0.0%) | 0 (0.0%) |
| All other Fuels | 0 (0.0%) | 0 (0.0%) |
| No Fuel Used | 0 (0.0%) | 0 (0.0%) |
| Total | 309 (100.0%) | 401 (100.0%) |
Household Vehicle Usage in Corrigan
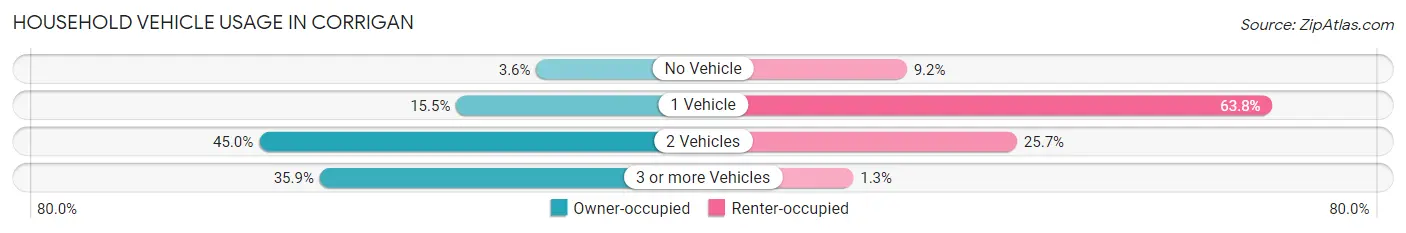
| Vehicles per Household | Owner-occupied | Renter-occupied |
| No Vehicle | 11 (3.6%) | 37 (9.2%) |
| 1 Vehicle | 48 (15.5%) | 256 (63.8%) |
| 2 Vehicles | 139 (45.0%) | 103 (25.7%) |
| 3 or more Vehicles | 111 (35.9%) | 5 (1.3%) |
| Total | 309 (100.0%) | 401 (100.0%) |
Real Estate & Mortgages in Corrigan
Real Estate and Mortgage Overview in Corrigan
| Characteristic | Without Mortgage | With Mortgage |
| Housing Units | 152 | 157 |
| Median Property Value | $80,600 | $133,800 |
| Median Household Income | $55,804 | $2 |
| Monthly Housing Costs | $471 | $0 |
| Real Estate Taxes | $1,205 | $2 |
Property Value by Mortgage Status in Corrigan
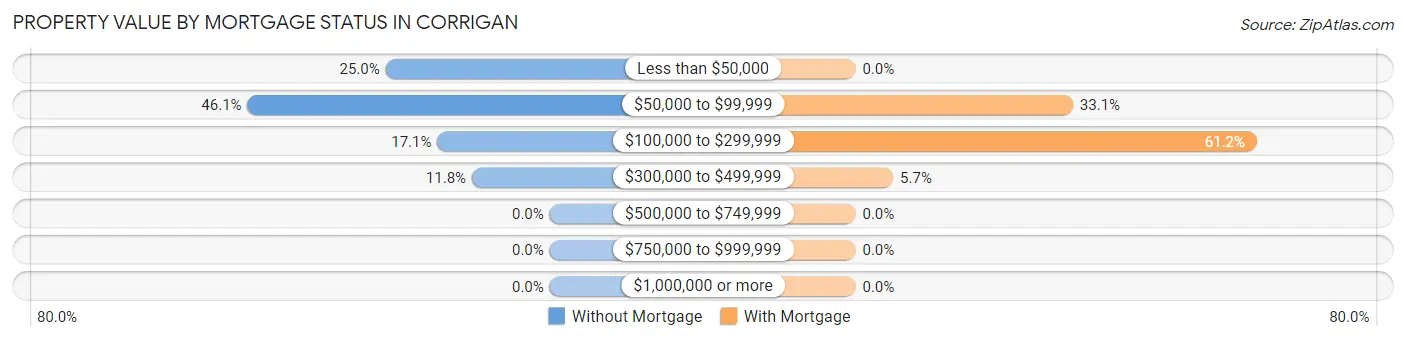
| Property Value | Without Mortgage | With Mortgage |
| Less than $50,000 | 38 (25.0%) | 0 (0.0%) |
| $50,000 to $99,999 | 70 (46.1%) | 52 (33.1%) |
| $100,000 to $299,999 | 26 (17.1%) | 96 (61.2%) |
| $300,000 to $499,999 | 18 (11.8%) | 9 (5.7%) |
| $500,000 to $749,999 | 0 (0.0%) | 0 (0.0%) |
| $750,000 to $999,999 | 0 (0.0%) | 0 (0.0%) |
| $1,000,000 or more | 0 (0.0%) | 0 (0.0%) |
| Total | 152 (100.0%) | 157 (100.0%) |
Household Income by Mortgage Status in Corrigan
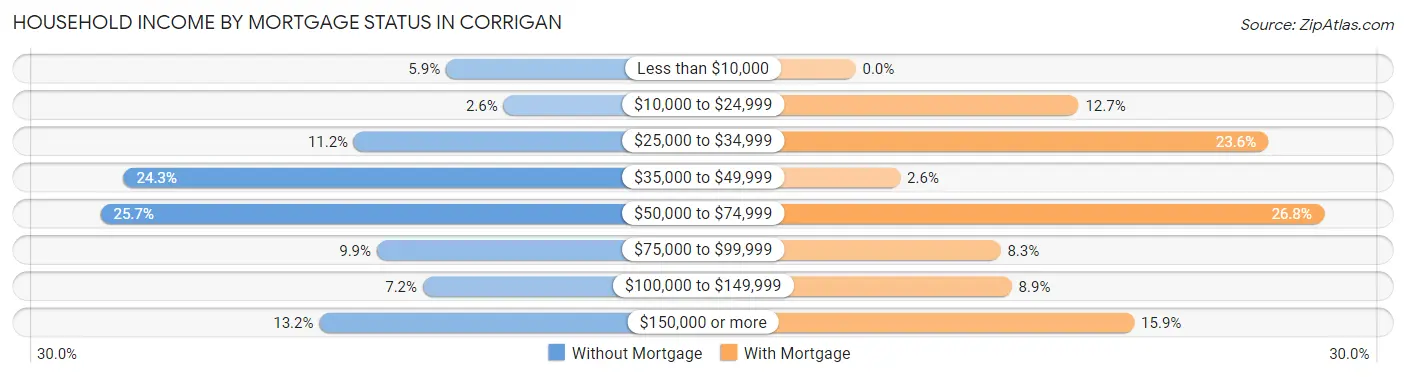
| Household Income | Without Mortgage | With Mortgage |
| Less than $10,000 | 9 (5.9%) | 0 (0.0%) |
| $10,000 to $24,999 | 4 (2.6%) | 20 (12.7%) |
| $25,000 to $34,999 | 17 (11.2%) | 37 (23.6%) |
| $35,000 to $49,999 | 37 (24.3%) | 4 (2.5%) |
| $50,000 to $74,999 | 39 (25.7%) | 42 (26.8%) |
| $75,000 to $99,999 | 15 (9.9%) | 13 (8.3%) |
| $100,000 to $149,999 | 11 (7.2%) | 14 (8.9%) |
| $150,000 or more | 20 (13.2%) | 25 (15.9%) |
| Total | 152 (100.0%) | 157 (100.0%) |
Property Value to Household Income Ratio in Corrigan
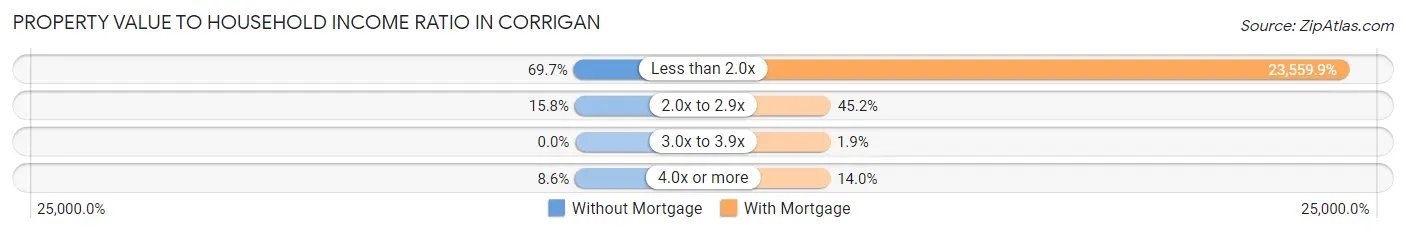
| Value-to-Income Ratio | Without Mortgage | With Mortgage |
| Less than 2.0x | 106 (69.7%) | 36,989 (23,559.9%) |
| 2.0x to 2.9x | 24 (15.8%) | 71 (45.2%) |
| 3.0x to 3.9x | 0 (0.0%) | 3 (1.9%) |
| 4.0x or more | 13 (8.6%) | 22 (14.0%) |
| Total | 152 (100.0%) | 157 (100.0%) |
Real Estate Taxes by Mortgage Status in Corrigan
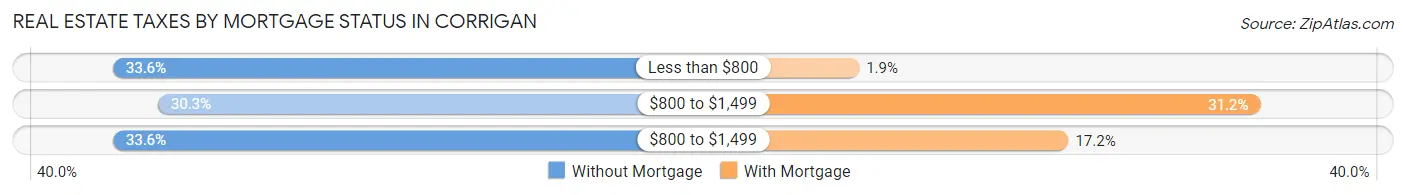
| Property Taxes | Without Mortgage | With Mortgage |
| Less than $800 | 51 (33.6%) | 3 (1.9%) |
| $800 to $1,499 | 46 (30.3%) | 49 (31.2%) |
| $800 to $1,499 | 51 (33.6%) | 27 (17.2%) |
| Total | 152 (100.0%) | 157 (100.0%) |
Health & Disability in Corrigan
Health Insurance Coverage by Age in Corrigan
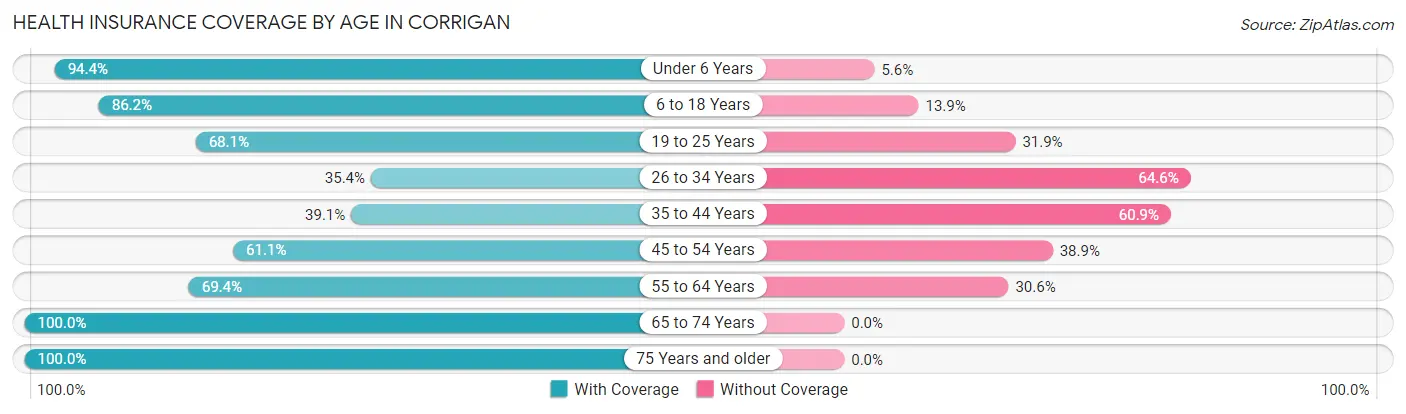
| Age Bracket | With Coverage | Without Coverage |
| Under 6 Years | 168 (94.4%) | 10 (5.6%) |
| 6 to 18 Years | 336 (86.2%) | 54 (13.9%) |
| 19 to 25 Years | 177 (68.1%) | 83 (31.9%) |
| 26 to 34 Years | 62 (35.4%) | 113 (64.6%) |
| 35 to 44 Years | 79 (39.1%) | 123 (60.9%) |
| 45 to 54 Years | 151 (61.1%) | 96 (38.9%) |
| 55 to 64 Years | 179 (69.4%) | 79 (30.6%) |
| 65 to 74 Years | 217 (100.0%) | 0 (0.0%) |
| 75 Years and older | 25 (100.0%) | 0 (0.0%) |
| Total | 1,394 (71.4%) | 558 (28.6%) |
Health Insurance Coverage by Citizenship Status in Corrigan
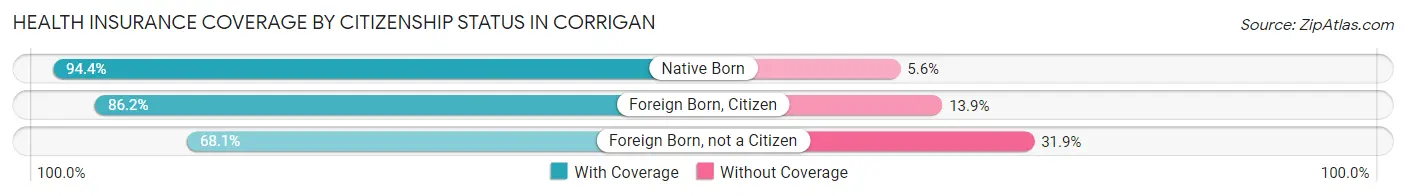
| Citizenship Status | With Coverage | Without Coverage |
| Native Born | 168 (94.4%) | 10 (5.6%) |
| Foreign Born, Citizen | 336 (86.2%) | 54 (13.9%) |
| Foreign Born, not a Citizen | 177 (68.1%) | 83 (31.9%) |
Health Insurance Coverage by Household Income in Corrigan
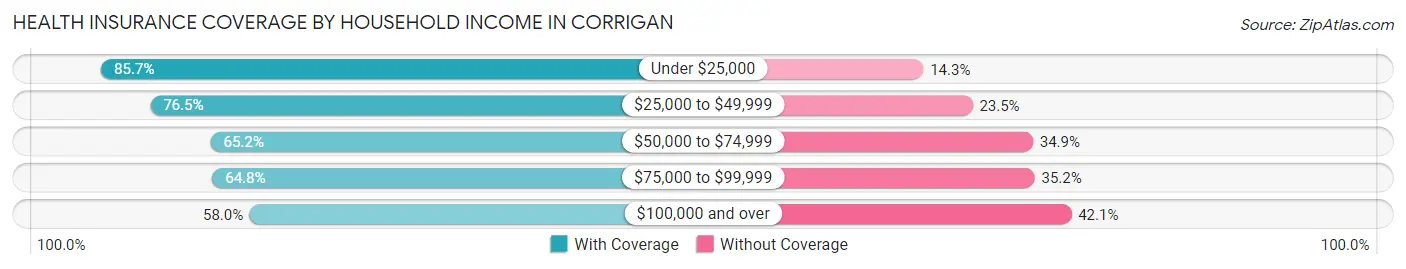
| Household Income | With Coverage | Without Coverage |
| Under $25,000 | 329 (85.7%) | 55 (14.3%) |
| $25,000 to $49,999 | 445 (76.5%) | 137 (23.5%) |
| $50,000 to $74,999 | 316 (65.1%) | 169 (34.8%) |
| $75,000 to $99,999 | 129 (64.8%) | 70 (35.2%) |
| $100,000 and over | 175 (58.0%) | 127 (42.0%) |
Public vs Private Health Insurance Coverage by Age in Corrigan
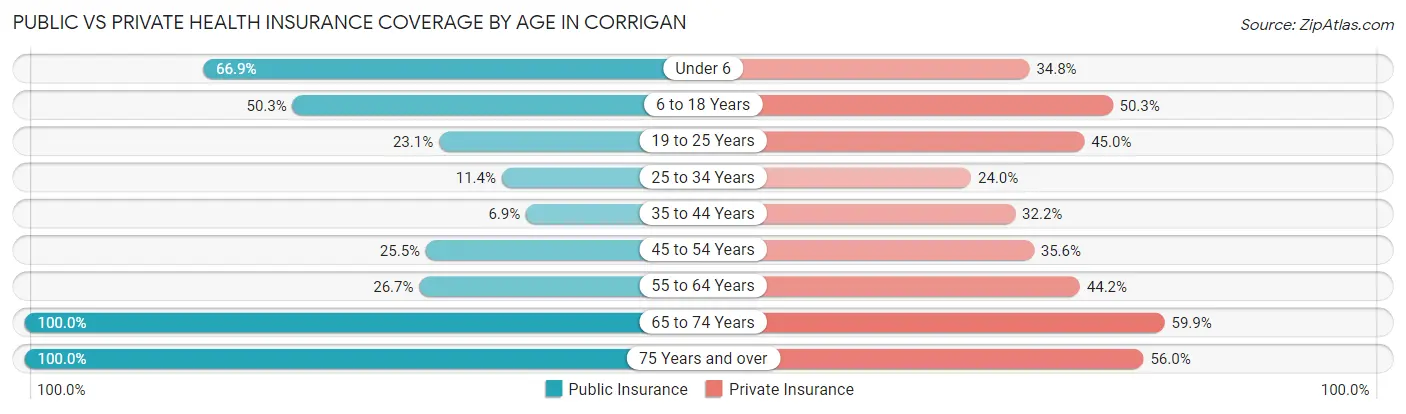
| Age Bracket | Public Insurance | Private Insurance |
| Under 6 | 119 (66.8%) | 62 (34.8%) |
| 6 to 18 Years | 196 (50.3%) | 196 (50.3%) |
| 19 to 25 Years | 60 (23.1%) | 117 (45.0%) |
| 25 to 34 Years | 20 (11.4%) | 42 (24.0%) |
| 35 to 44 Years | 14 (6.9%) | 65 (32.2%) |
| 45 to 54 Years | 63 (25.5%) | 88 (35.6%) |
| 55 to 64 Years | 69 (26.7%) | 114 (44.2%) |
| 65 to 74 Years | 217 (100.0%) | 130 (59.9%) |
| 75 Years and over | 25 (100.0%) | 14 (56.0%) |
| Total | 783 (40.1%) | 828 (42.4%) |
Disability Status by Sex by Age in Corrigan
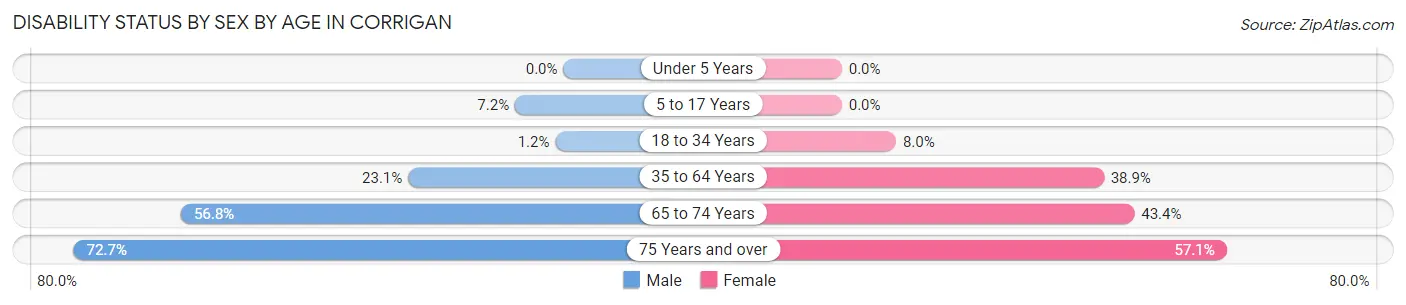
| Age Bracket | Male | Female |
| Under 5 Years | 0 (0.0%) | 0 (0.0%) |
| 5 to 17 Years | 15 (7.2%) | 0 (0.0%) |
| 18 to 34 Years | 2 (1.2%) | 23 (8.0%) |
| 35 to 64 Years | 80 (23.1%) | 140 (38.9%) |
| 65 to 74 Years | 67 (56.8%) | 43 (43.4%) |
| 75 Years and over | 8 (72.7%) | 8 (57.1%) |
Disability Class by Sex by Age in Corrigan
Disability Class: Hearing Difficulty
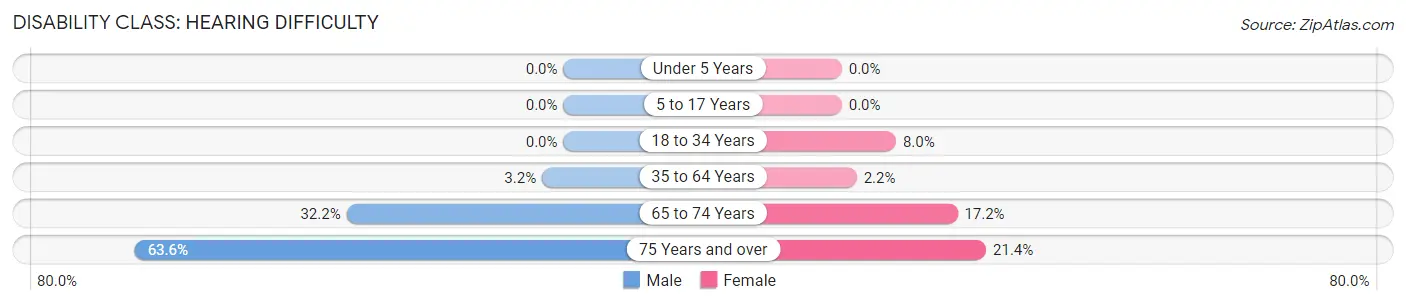
| Age Bracket | Male | Female |
| Under 5 Years | 0 (0.0%) | 0 (0.0%) |
| 5 to 17 Years | 0 (0.0%) | 0 (0.0%) |
| 18 to 34 Years | 0 (0.0%) | 23 (8.0%) |
| 35 to 64 Years | 11 (3.2%) | 8 (2.2%) |
| 65 to 74 Years | 38 (32.2%) | 17 (17.2%) |
| 75 Years and over | 7 (63.6%) | 3 (21.4%) |
Disability Class: Vision Difficulty
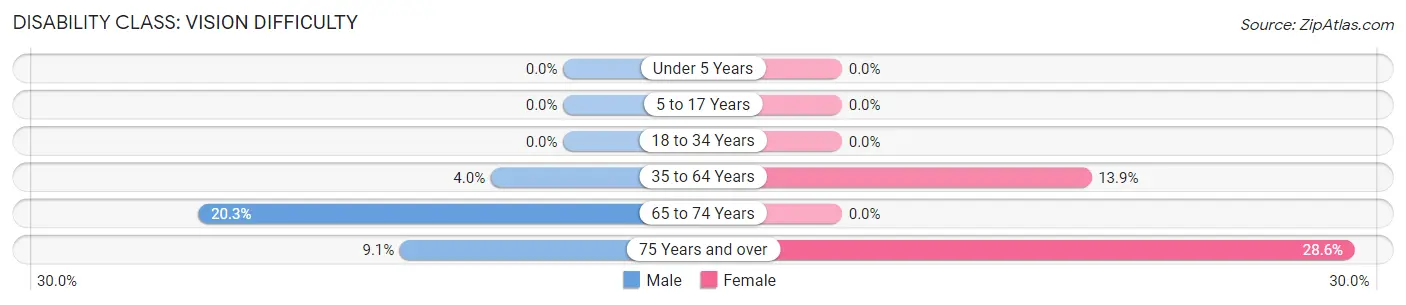
| Age Bracket | Male | Female |
| Under 5 Years | 0 (0.0%) | 0 (0.0%) |
| 5 to 17 Years | 0 (0.0%) | 0 (0.0%) |
| 18 to 34 Years | 0 (0.0%) | 0 (0.0%) |
| 35 to 64 Years | 14 (4.0%) | 50 (13.9%) |
| 65 to 74 Years | 24 (20.3%) | 0 (0.0%) |
| 75 Years and over | 1 (9.1%) | 4 (28.6%) |
Disability Class: Cognitive Difficulty
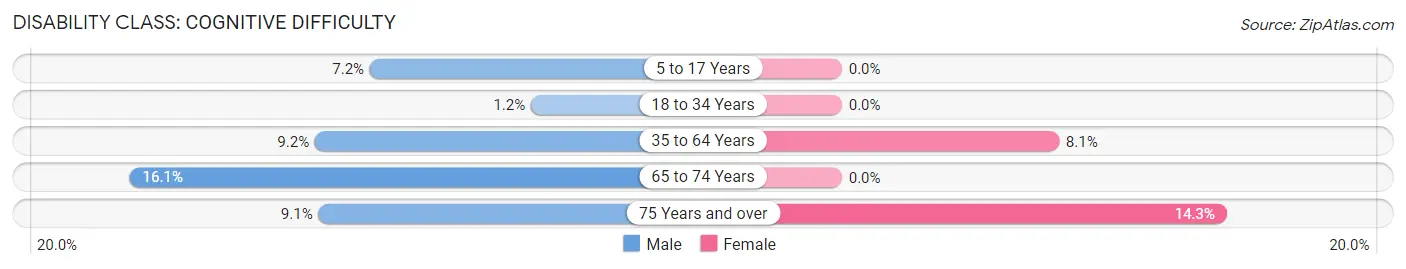
| Age Bracket | Male | Female |
| 5 to 17 Years | 15 (7.2%) | 0 (0.0%) |
| 18 to 34 Years | 2 (1.2%) | 0 (0.0%) |
| 35 to 64 Years | 32 (9.2%) | 29 (8.1%) |
| 65 to 74 Years | 19 (16.1%) | 0 (0.0%) |
| 75 Years and over | 1 (9.1%) | 2 (14.3%) |
Disability Class: Ambulatory Difficulty
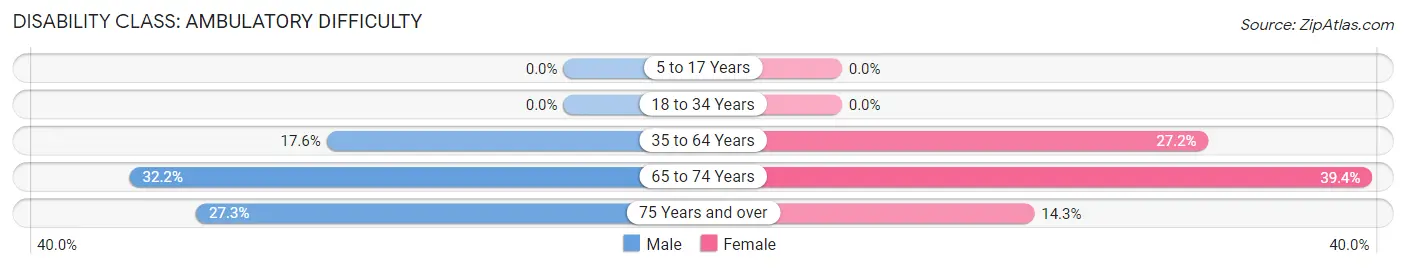
| Age Bracket | Male | Female |
| 5 to 17 Years | 0 (0.0%) | 0 (0.0%) |
| 18 to 34 Years | 0 (0.0%) | 0 (0.0%) |
| 35 to 64 Years | 61 (17.6%) | 98 (27.2%) |
| 65 to 74 Years | 38 (32.2%) | 39 (39.4%) |
| 75 Years and over | 3 (27.3%) | 2 (14.3%) |
Disability Class: Self-Care Difficulty
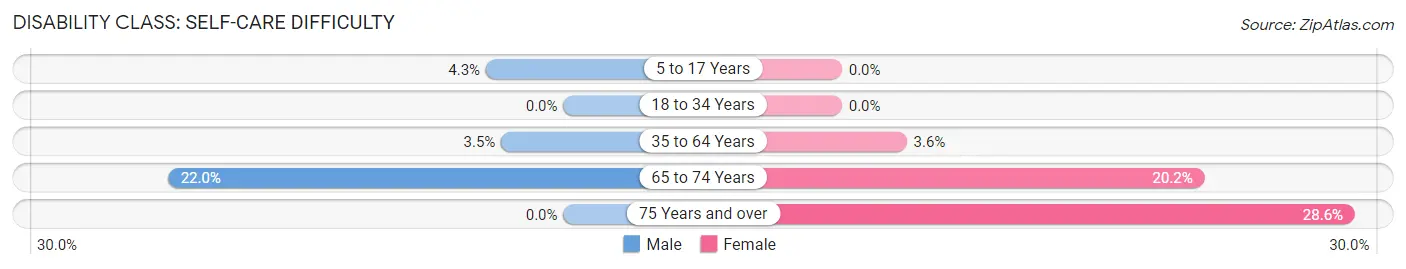
| Age Bracket | Male | Female |
| 5 to 17 Years | 9 (4.3%) | 0 (0.0%) |
| 18 to 34 Years | 0 (0.0%) | 0 (0.0%) |
| 35 to 64 Years | 12 (3.5%) | 13 (3.6%) |
| 65 to 74 Years | 26 (22.0%) | 20 (20.2%) |
| 75 Years and over | 0 (0.0%) | 4 (28.6%) |
Technology Access in Corrigan
Computing Device Access in Corrigan
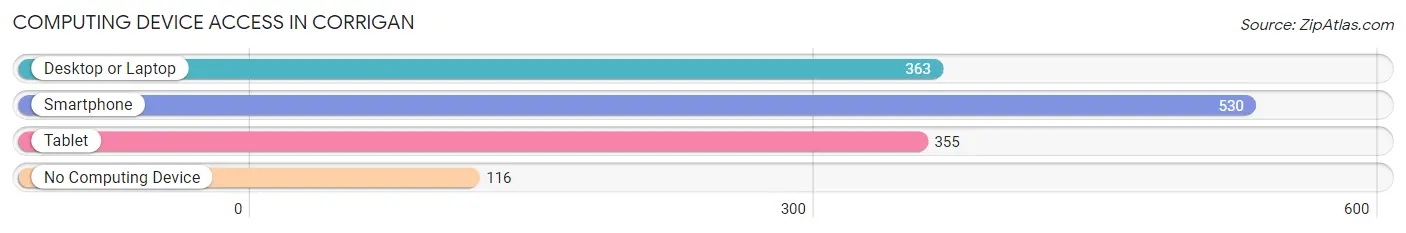
| Device Type | # Households | % Households |
| Desktop or Laptop | 363 | 51.1% |
| Smartphone | 530 | 74.7% |
| Tablet | 355 | 50.0% |
| No Computing Device | 116 | 16.3% |
| Total | 710 | 100.0% |
Internet Access in Corrigan
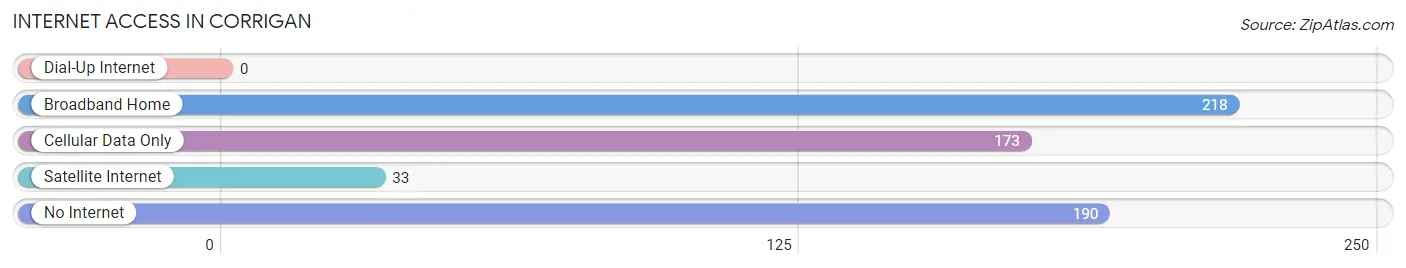
| Internet Type | # Households | % Households |
| Dial-Up Internet | 0 | 0.0% |
| Broadband Home | 218 | 30.7% |
| Cellular Data Only | 173 | 24.4% |
| Satellite Internet | 33 | 4.6% |
| No Internet | 190 | 26.8% |
| Total | 710 | 100.0% |
Corrigan Summary
Corrigan, Texas is a small town located in Polk County, Texas. It is situated about 75 miles north of Houston and is part of the Lufkin-Nacogdoches Metropolitan Statistical Area. The town was founded in 1872 and was named after James Corrigan, a local landowner. As of the 2010 census, the population of Corrigan was 1,817.
History
The area that is now Corrigan was originally inhabited by the Atakapan Indians. The first European settlers arrived in the area in the early 1800s. The town was founded in 1872 and was named after James Corrigan, a local landowner. The town was incorporated in 1891 and was the first town in Polk County to be incorporated.
The town grew rapidly in the late 19th century and early 20th century. The town was home to several businesses, including a sawmill, a cotton gin, a grist mill, and a blacksmith shop. The town also had a school, a bank, and a post office.
In the early 20th century, the town began to decline. The Great Depression hit the town hard and many businesses closed. The population of the town decreased from 1,817 in 1930 to 1,541 in 1940.
Geography
Corrigan is located in Polk County, Texas. It is situated about 75 miles north of Houston and is part of the Lufkin-Nacogdoches Metropolitan Statistical Area. The town is located at the intersection of U.S. Highway 59 and State Highway 287.
The town has a total area of 2.2 square miles, all of which is land. The town is located in a hilly area and is surrounded by pine forests. The town is located near the Neches River and is about 25 miles from the Sam Rayburn Reservoir.
Economy
The economy of Corrigan is largely based on agriculture and timber. The town is home to several farms and ranches, as well as several timber companies. The town is also home to several small businesses, including restaurants, convenience stores, and auto repair shops.
The town is also home to several manufacturing companies, including Corrigan Manufacturing, which produces industrial equipment, and Corrigan Industries, which produces plastic products.
Demographics
As of the 2010 census, the population of Corrigan was 1,817. The population is largely white (90.2%) and Hispanic (7.2%). The median household income is $31,250 and the median age is 37.
The town is served by the Corrigan-Camden Independent School District. The town is also home to several churches, including the First Baptist Church, the First United Methodist Church, and the Church of Christ.
Conclusion
Corrigan, Texas is a small town located in Polk County, Texas. It is situated about 75 miles north of Houston and is part of the Lufkin-Nacogdoches Metropolitan Statistical Area. The town was founded in 1872 and was named after James Corrigan, a local landowner. As of the 2010 census, the population of Corrigan was 1,817. The economy of Corrigan is largely based on agriculture and timber. The town is also home to several small businesses, including restaurants, convenience stores, and auto repair shops. The population is largely white (90.2%) and Hispanic (7.2%). The median household income is $31,250 and the median age is 37.
Common Questions
What is Per Capita Income in Corrigan?
Per Capita income in Corrigan is $19,979.
What is the Median Family Income in Corrigan?
Median Family Income in Corrigan is $46,607.
What is the Median Household income in Corrigan?
Median Household Income in Corrigan is $42,212.
What is Income or Wage Gap in Corrigan?
Income or Wage Gap in Corrigan is 54.4%.
Women in Corrigan earn 45.6 cents for every dollar earned by a man.
What is Inequality or Gini Index in Corrigan?
Inequality or Gini Index in Corrigan is 0.45.
What is the Total Population of Corrigan?
Total Population of Corrigan is 2,018.
What is the Total Male Population of Corrigan?
Total Male Population of Corrigan is 969.
What is the Total Female Population of Corrigan?
Total Female Population of Corrigan is 1,049.
What is the Ratio of Males per 100 Females in Corrigan?
There are 92.37 Males per 100 Females in Corrigan.
What is the Ratio of Females per 100 Males in Corrigan?
There are 108.26 Females per 100 Males in Corrigan.
What is the Median Population Age in Corrigan?
Median Population Age in Corrigan is 35.2 Years.
What is the Average Family Size in Corrigan
Average Family Size in Corrigan is 3.3 People.
What is the Average Household Size in Corrigan
Average Household Size in Corrigan is 2.8 People.
How Large is the Labor Force in Corrigan?
There are 886 People in the Labor Forcein in Corrigan.
What is the Percentage of People in the Labor Force in Corrigan?
57.2% of People are in the Labor Force in Corrigan.
What is the Unemployment Rate in Corrigan?
Unemployment Rate in Corrigan is 15.9%.