Coolidge, TX Map & Demographics
Coolidge Map
Coolidge Overview
$20,755
PER CAPITA INCOME
$56,250
AVG FAMILY INCOME
$42,222
AVG HOUSEHOLD INCOME
47.0%
WAGE / INCOME GAP [ % ]
53.0¢/ $1
WAGE / INCOME GAP [ $ ]
$10,595
FAMILY INCOME DEFICIT
0.47
INEQUALITY / GINI INDEX
850
TOTAL POPULATION
443
MALE POPULATION
407
FEMALE POPULATION
108.85
MALES / 100 FEMALES
91.87
FEMALES / 100 MALES
27.1
MEDIAN AGE
3.6
AVG FAMILY SIZE
2.9
AVG HOUSEHOLD SIZE
320
LABOR FORCE [ PEOPLE ]
57.6%
PERCENT IN LABOR FORCE
1.3%
UNEMPLOYMENT RATE
Coolidge Zip Codes
Coolidge Area Codes
Income in Coolidge
Income Overview in Coolidge
Per Capita Income in Coolidge is $20,755, while median incomes of families and households are $56,250 and $42,222 respectively.
| Characteristic | Number | Measure |
| Per Capita Income | 850 | $20,755 |
| Median Family Income | 209 | $56,250 |
| Mean Family Income | 209 | $66,811 |
| Median Household Income | 296 | $42,222 |
| Mean Household Income | 296 | $60,302 |
| Income Deficit | 209 | $10,595 |
| Wage / Income Gap (%) | 850 | 47.01% |
| Wage / Income Gap ($) | 850 | 52.99¢ per $1 |
| Gini / Inequality Index | 850 | 0.47 |
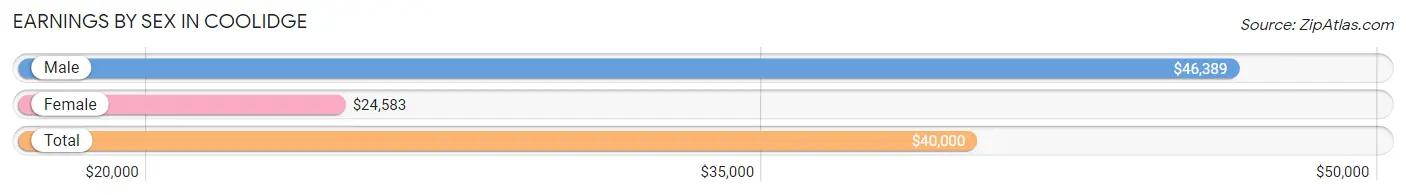
Earnings by Sex in Coolidge
Average Earnings in Coolidge are $40,000, $46,389 for men and $24,583 for women, a difference of 47.0%.
| Sex | Number | Average Earnings |
| Male | 218 (66.5%) | $46,389 |
| Female | 110 (33.5%) | $24,583 |
| Total | 328 (100.0%) | $40,000 |
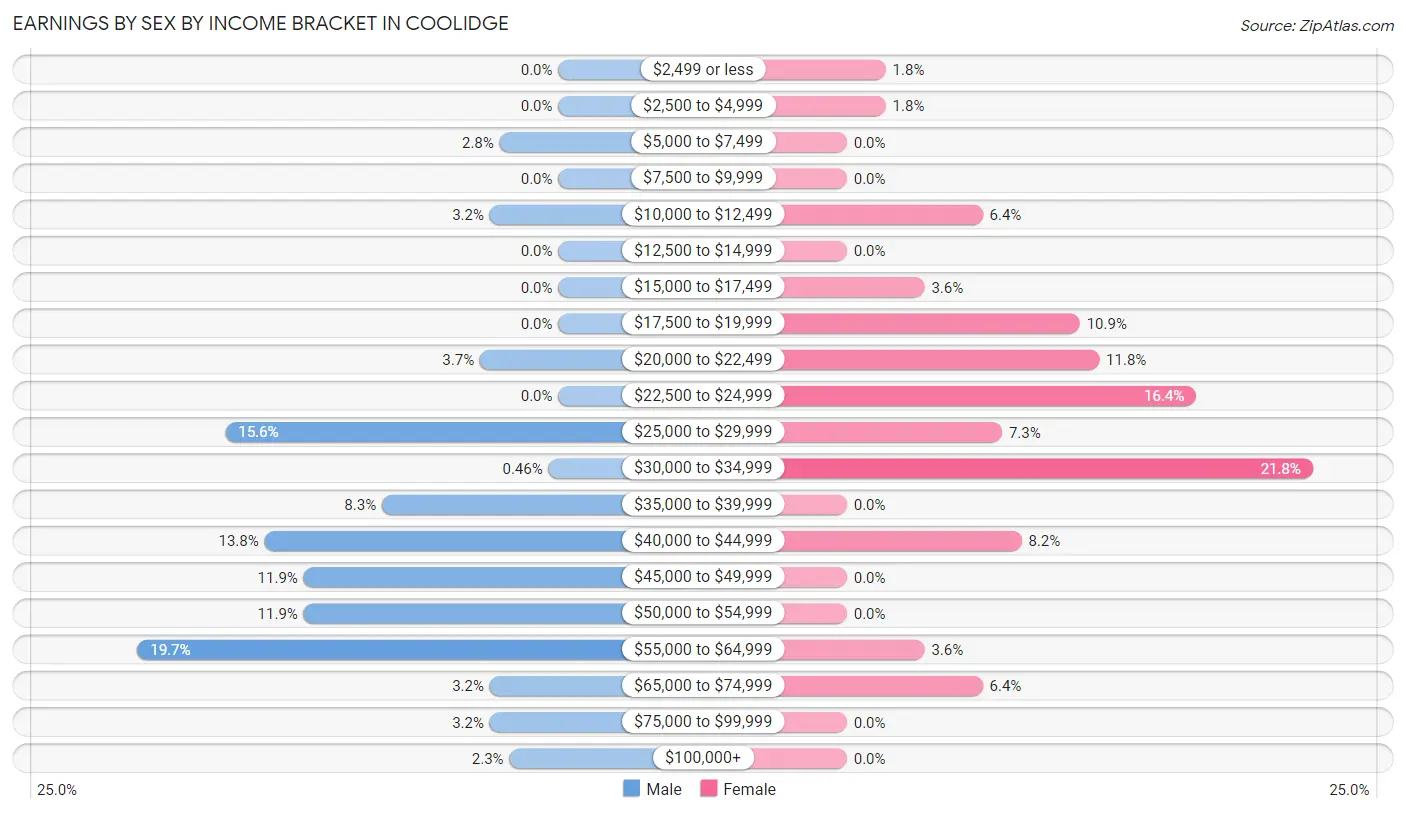
Earnings by Sex by Income Bracket in Coolidge
The most common earnings brackets in Coolidge are $55,000 to $64,999 for men (43 | 19.7%) and $30,000 to $34,999 for women (24 | 21.8%).
| Income | Male | Female |
| $2,499 or less | 0 (0.0%) | 2 (1.8%) |
| $2,500 to $4,999 | 0 (0.0%) | 2 (1.8%) |
| $5,000 to $7,499 | 6 (2.8%) | 0 (0.0%) |
| $7,500 to $9,999 | 0 (0.0%) | 0 (0.0%) |
| $10,000 to $12,499 | 7 (3.2%) | 7 (6.4%) |
| $12,500 to $14,999 | 0 (0.0%) | 0 (0.0%) |
| $15,000 to $17,499 | 0 (0.0%) | 4 (3.6%) |
| $17,500 to $19,999 | 0 (0.0%) | 12 (10.9%) |
| $20,000 to $22,499 | 8 (3.7%) | 13 (11.8%) |
| $22,500 to $24,999 | 0 (0.0%) | 18 (16.4%) |
| $25,000 to $29,999 | 34 (15.6%) | 8 (7.3%) |
| $30,000 to $34,999 | 1 (0.5%) | 24 (21.8%) |
| $35,000 to $39,999 | 18 (8.3%) | 0 (0.0%) |
| $40,000 to $44,999 | 30 (13.8%) | 9 (8.2%) |
| $45,000 to $49,999 | 26 (11.9%) | 0 (0.0%) |
| $50,000 to $54,999 | 26 (11.9%) | 0 (0.0%) |
| $55,000 to $64,999 | 43 (19.7%) | 4 (3.6%) |
| $65,000 to $74,999 | 7 (3.2%) | 7 (6.4%) |
| $75,000 to $99,999 | 7 (3.2%) | 0 (0.0%) |
| $100,000+ | 5 (2.3%) | 0 (0.0%) |
| Total | 218 (100.0%) | 110 (100.0%) |
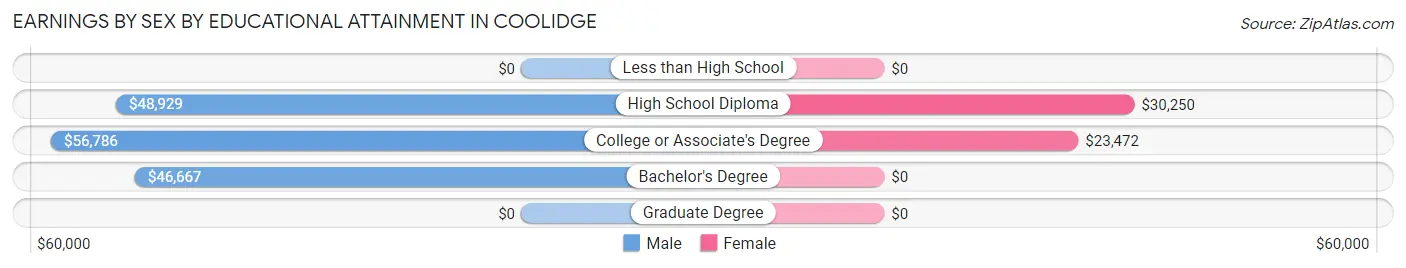
Earnings by Sex by Educational Attainment in Coolidge
Average earnings in Coolidge are $48,456 for men and $24,028 for women, a difference of 50.4%. Men with an educational attainment of college or associate's degree enjoy the highest average annual earnings of $56,786, while those with bachelor's degree education earn the least with $46,667. Women with an educational attainment of high school diploma earn the most with the average annual earnings of $30,250, while those with college or associate's degree education have the smallest earnings of $23,472.
| Educational Attainment | Male Income | Female Income |
| Less than High School | - | - |
| High School Diploma | $48,929 | $30,250 |
| College or Associate's Degree | $56,786 | $23,472 |
| Bachelor's Degree | $46,667 | $0 |
| Graduate Degree | - | - |
| Total | $48,456 | $24,028 |
Family Income in Coolidge
Family Income Brackets in Coolidge
According to the Coolidge family income data, there are 49 families falling into the $35,000 to $49,999 income range, which is the most common income bracket and makes up 23.4% of all families.
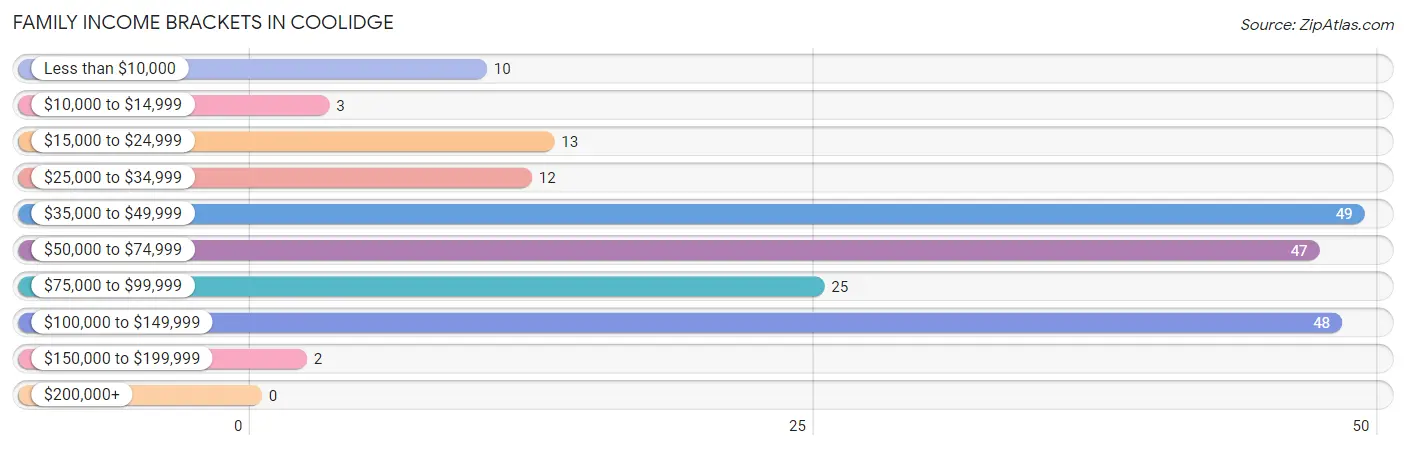
| Income Bracket | # Families | % Families |
| Less than $10,000 | 10 | 4.8% |
| $10,000 to $14,999 | 3 | 1.4% |
| $15,000 to $24,999 | 13 | 6.2% |
| $25,000 to $34,999 | 12 | 5.7% |
| $35,000 to $49,999 | 49 | 23.4% |
| $50,000 to $74,999 | 47 | 22.5% |
| $75,000 to $99,999 | 25 | 12.0% |
| $100,000 to $149,999 | 48 | 23.0% |
| $150,000 to $199,999 | 2 | 1.0% |
| $200,000+ | 0 | 0.0% |
Family Income by Famaliy Size in Coolidge
4-person families (68 | 32.5%) account for the highest median family income in Coolidge with $114,167 per family, while 4-person families (68 | 32.5%) have the highest median income of $28,542 per family member.
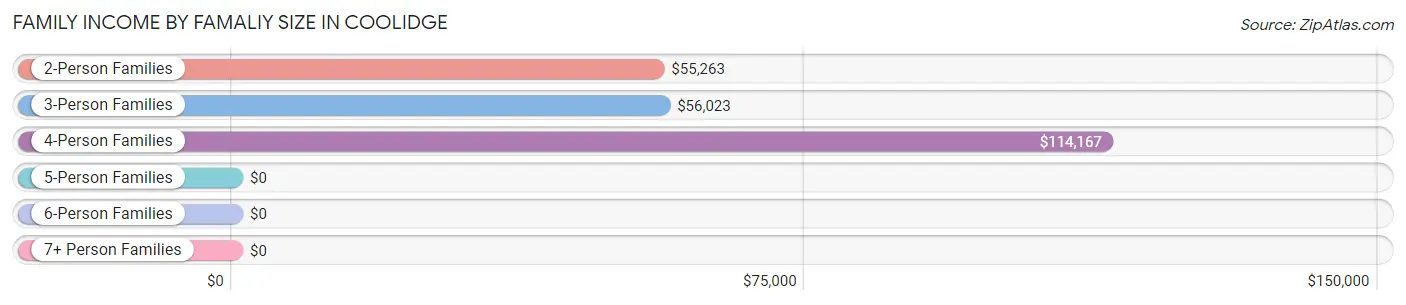
| Income Bracket | # Families | Median Income |
| 2-Person Families | 68 (32.5%) | $55,263 |
| 3-Person Families | 45 (21.5%) | $56,023 |
| 4-Person Families | 68 (32.5%) | $114,167 |
| 5-Person Families | 11 (5.3%) | $0 |
| 6-Person Families | 15 (7.2%) | $0 |
| 7+ Person Families | 2 (1.0%) | $0 |
| Total | 209 (100.0%) | $56,250 |
Family Income by Number of Earners in Coolidge
The median family income in Coolidge is $56,250, with families comprising 3+ earners (17) having the highest median family income of $120,729, while families with no earners (29) have the lowest median family income of $21,607, accounting for 8.1% and 13.9% of families, respectively.
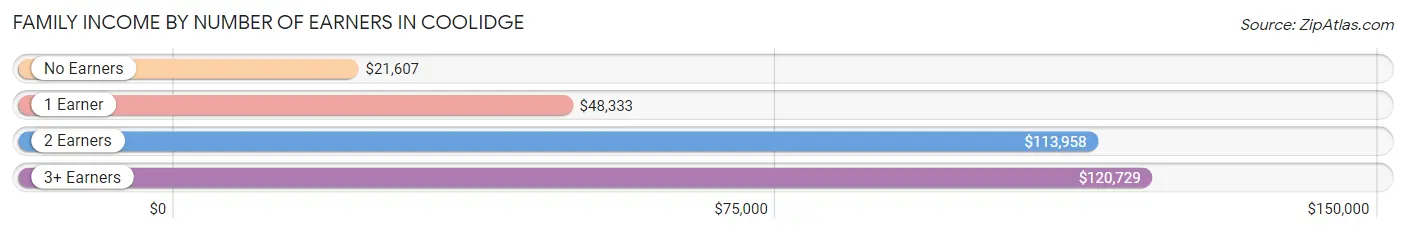
| Number of Earners | # Families | Median Income |
| No Earners | 29 (13.9%) | $21,607 |
| 1 Earner | 100 (47.8%) | $48,333 |
| 2 Earners | 63 (30.1%) | $113,958 |
| 3+ Earners | 17 (8.1%) | $120,729 |
| Total | 209 (100.0%) | $56,250 |
Household Income in Coolidge
Household Income Brackets in Coolidge
With 64 households falling in the category, the $35,000 to $49,999 income range is the most frequent in Coolidge, accounting for 21.6% of all households. In contrast, only 2 households (0.7%) fall into the $150,000 to $199,999 income bracket, making it the least populous group.
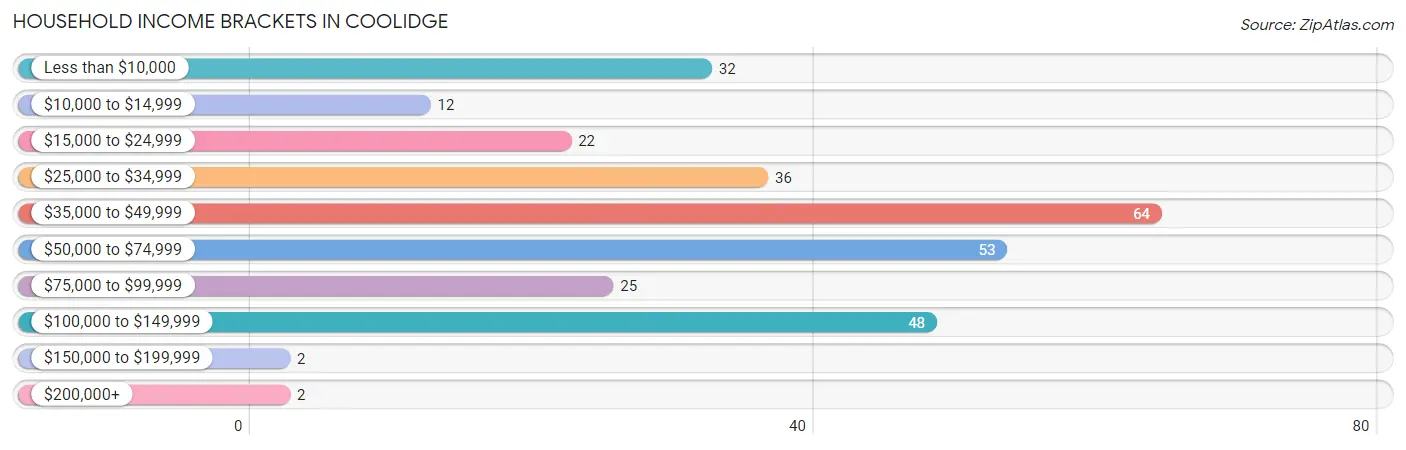
| Income Bracket | # Households | % Households |
| Less than $10,000 | 32 | 10.8% |
| $10,000 to $14,999 | 12 | 4.1% |
| $15,000 to $24,999 | 22 | 7.4% |
| $25,000 to $34,999 | 36 | 12.2% |
| $35,000 to $49,999 | 64 | 21.6% |
| $50,000 to $74,999 | 53 | 17.9% |
| $75,000 to $99,999 | 25 | 8.4% |
| $100,000 to $149,999 | 48 | 16.2% |
| $150,000 to $199,999 | 2 | 0.7% |
| $200,000+ | 2 | 0.7% |
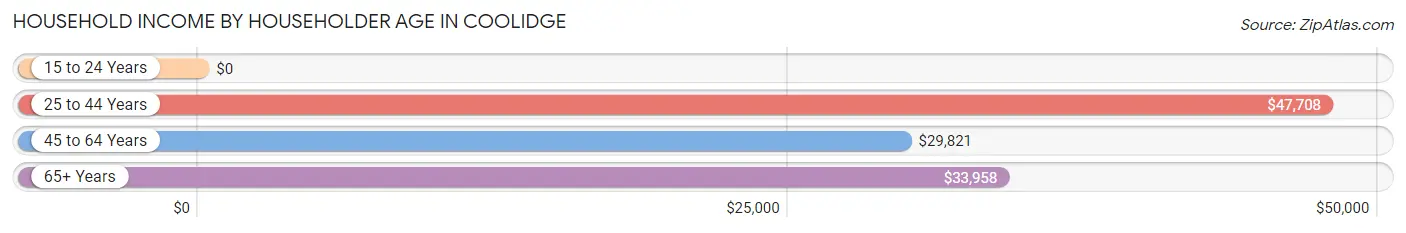
Household Income by Householder Age in Coolidge
The median household income in Coolidge is $42,222, with the highest median household income of $47,708 found in the 25 to 44 years age bracket for the primary householder. A total of 139 households (47.0%) fall into this category. Meanwhile, the 15 to 24 years age bracket for the primary householder has the lowest median household income of $0, with 15 households (5.1%) in this group.
| Income Bracket | # Households | Median Income |
| 15 to 24 Years | 15 (5.1%) | $0 |
| 25 to 44 Years | 139 (47.0%) | $47,708 |
| 45 to 64 Years | 95 (32.1%) | $29,821 |
| 65+ Years | 47 (15.9%) | $33,958 |
| Total | 296 (100.0%) | $42,222 |
Poverty in Coolidge
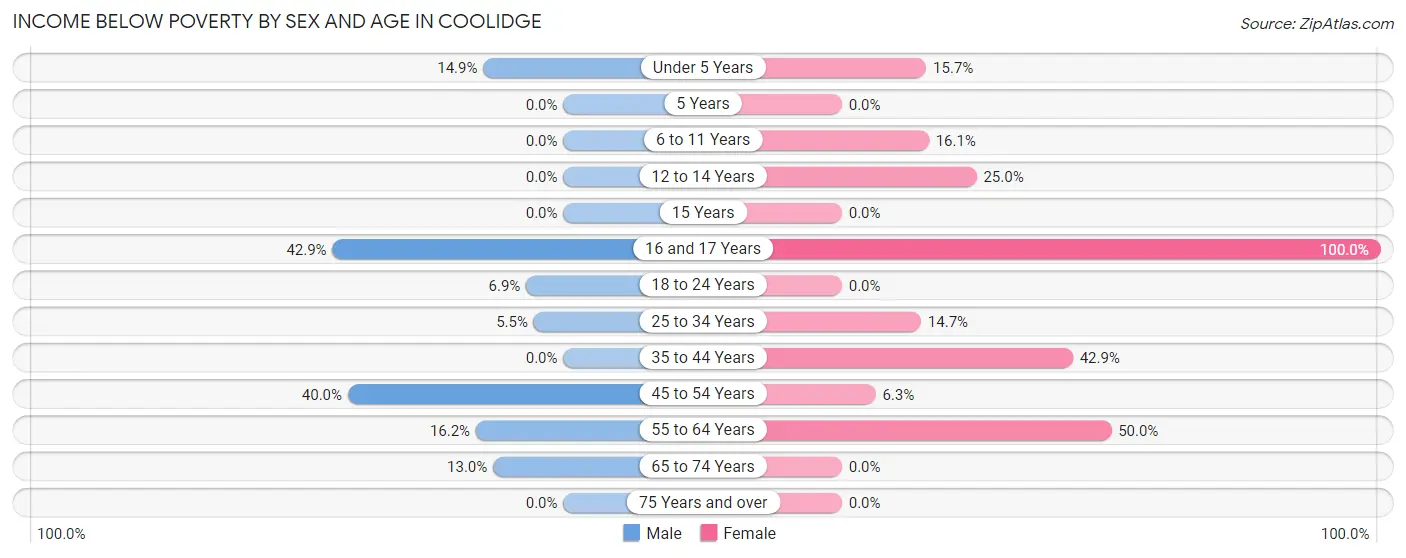
Income Below Poverty by Sex and Age in Coolidge
With 12.0% poverty level for males and 14.0% for females among the residents of Coolidge, 16 and 17 year old males and 16 and 17 year old females are the most vulnerable to poverty, with 6 males (42.9%) and 4 females (100.0%) in their respective age groups living below the poverty level.
| Age Bracket | Male | Female |
| Under 5 Years | 11 (14.9%) | 13 (15.7%) |
| 5 Years | 0 (0.0%) | 0 (0.0%) |
| 6 to 11 Years | 0 (0.0%) | 5 (16.1%) |
| 12 to 14 Years | 0 (0.0%) | 5 (25.0%) |
| 15 Years | 0 (0.0%) | 0 (0.0%) |
| 16 and 17 Years | 6 (42.9%) | 4 (100.0%) |
| 18 to 24 Years | 2 (6.9%) | 0 (0.0%) |
| 25 to 34 Years | 5 (5.5%) | 16 (14.7%) |
| 35 to 44 Years | 0 (0.0%) | 3 (42.9%) |
| 45 to 54 Years | 20 (40.0%) | 2 (6.2%) |
| 55 to 64 Years | 6 (16.2%) | 9 (50.0%) |
| 65 to 74 Years | 3 (13.0%) | 0 (0.0%) |
| 75 Years and over | 0 (0.0%) | 0 (0.0%) |
| Total | 53 (12.0%) | 57 (14.0%) |
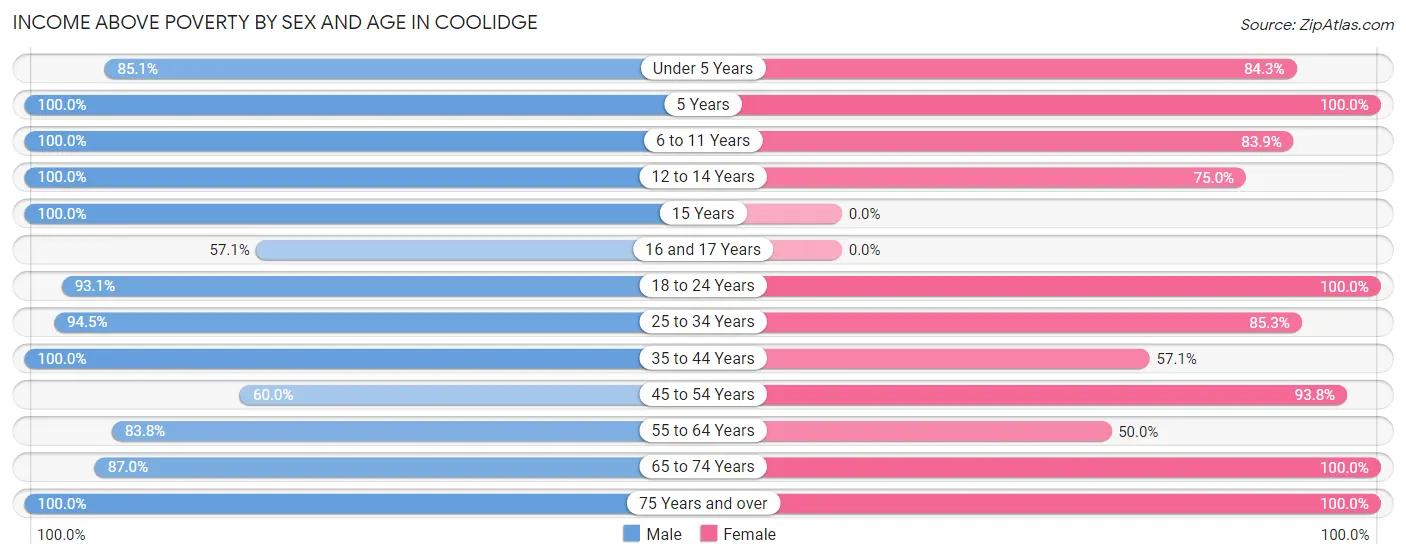
Income Above Poverty by Sex and Age in Coolidge
According to the poverty statistics in Coolidge, males aged 5 years and females aged 5 years are the age groups that are most secure financially, with 100.0% of males and 100.0% of females in these age groups living above the poverty line.
| Age Bracket | Male | Female |
| Under 5 Years | 63 (85.1%) | 70 (84.3%) |
| 5 Years | 12 (100.0%) | 11 (100.0%) |
| 6 to 11 Years | 54 (100.0%) | 26 (83.9%) |
| 12 to 14 Years | 5 (100.0%) | 15 (75.0%) |
| 15 Years | 4 (100.0%) | 0 (0.0%) |
| 16 and 17 Years | 8 (57.1%) | 0 (0.0%) |
| 18 to 24 Years | 27 (93.1%) | 55 (100.0%) |
| 25 to 34 Years | 86 (94.5%) | 93 (85.3%) |
| 35 to 44 Years | 27 (100.0%) | 4 (57.1%) |
| 45 to 54 Years | 30 (60.0%) | 30 (93.8%) |
| 55 to 64 Years | 31 (83.8%) | 9 (50.0%) |
| 65 to 74 Years | 20 (87.0%) | 29 (100.0%) |
| 75 Years and over | 23 (100.0%) | 8 (100.0%) |
| Total | 390 (88.0%) | 350 (86.0%) |
Income Below Poverty Among Married-Couple Families in Coolidge
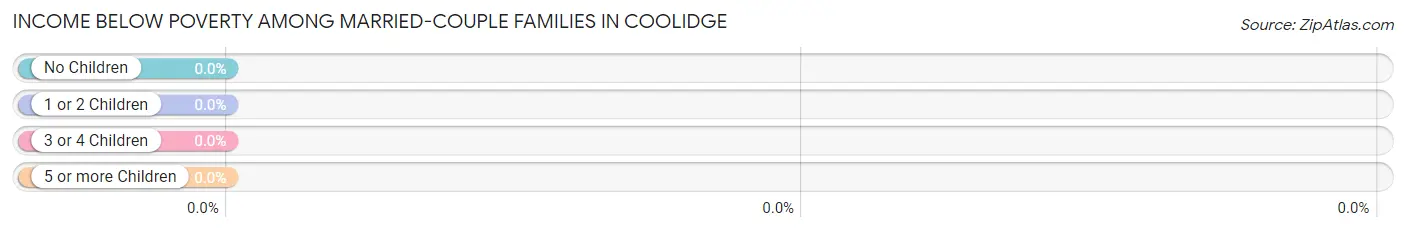
| Children | Above Poverty | Below Poverty |
| No Children | 48 (100.0%) | 0 (0.0%) |
| 1 or 2 Children | 73 (100.0%) | 0 (0.0%) |
| 3 or 4 Children | 20 (100.0%) | 0 (0.0%) |
| 5 or more Children | 2 (100.0%) | 0 (0.0%) |
| Total | 143 (100.0%) | 0 (0.0%) |
Income Below Poverty Among Single-Parent Households in Coolidge
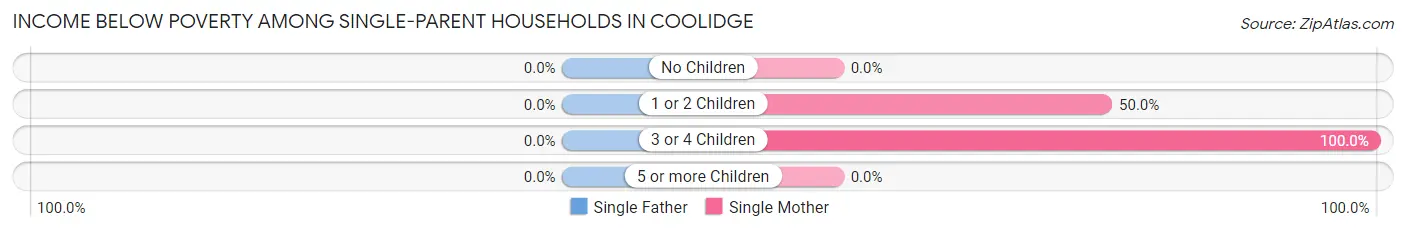
| Children | Single Father | Single Mother |
| No Children | 0 (0.0%) | 0 (0.0%) |
| 1 or 2 Children | 0 (0.0%) | 13 (50.0%) |
| 3 or 4 Children | 0 (0.0%) | 6 (100.0%) |
| 5 or more Children | 0 (0.0%) | 0 (0.0%) |
| Total | 0 (0.0%) | 19 (59.4%) |
Income Below Poverty Among Married-Couple vs Single-Parent Households in Coolidge
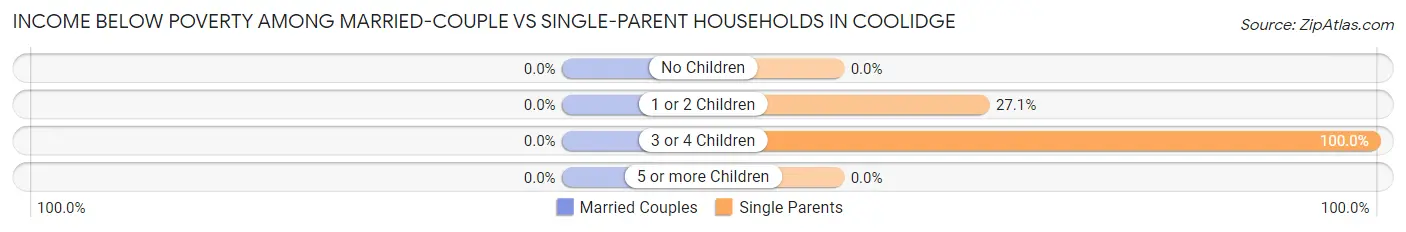
| Children | Married-Couple Families | Single-Parent Households |
| No Children | 0 (0.0%) | 0 (0.0%) |
| 1 or 2 Children | 0 (0.0%) | 13 (27.1%) |
| 3 or 4 Children | 0 (0.0%) | 6 (100.0%) |
| 5 or more Children | 0 (0.0%) | 0 (0.0%) |
| Total | 0 (0.0%) | 19 (28.8%) |
Race in Coolidge
The most populous races in Coolidge are White / Caucasian (556 | 65.4%), Hispanic or Latino (533 | 62.7%), and Two or more Races (154 | 18.1%).
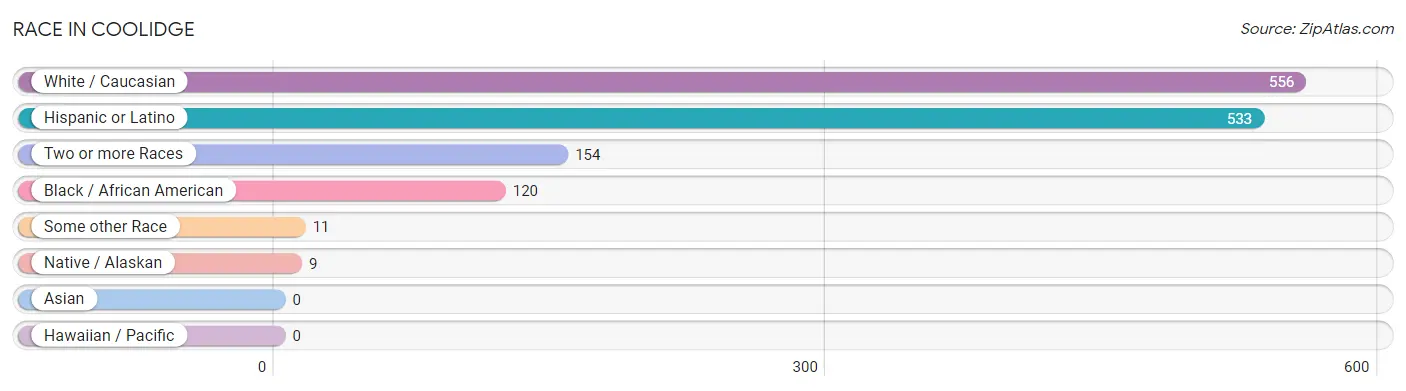
| Race | # Population | % Population |
| Asian | 0 | 0.0% |
| Black / African American | 120 | 14.1% |
| Hawaiian / Pacific | 0 | 0.0% |
| Hispanic or Latino | 533 | 62.7% |
| Native / Alaskan | 9 | 1.1% |
| White / Caucasian | 556 | 65.4% |
| Two or more Races | 154 | 18.1% |
| Some other Race | 11 | 1.3% |
| Total | 850 | 100.0% |
Ancestry in Coolidge
The most populous ancestries reported in Coolidge are Mexican (533 | 62.7%), Nigerian (34 | 4.0%), Subsaharan African (34 | 4.0%), English (30 | 3.5%), and American (26 | 3.1%), together accounting for 77.3% of all Coolidge residents.
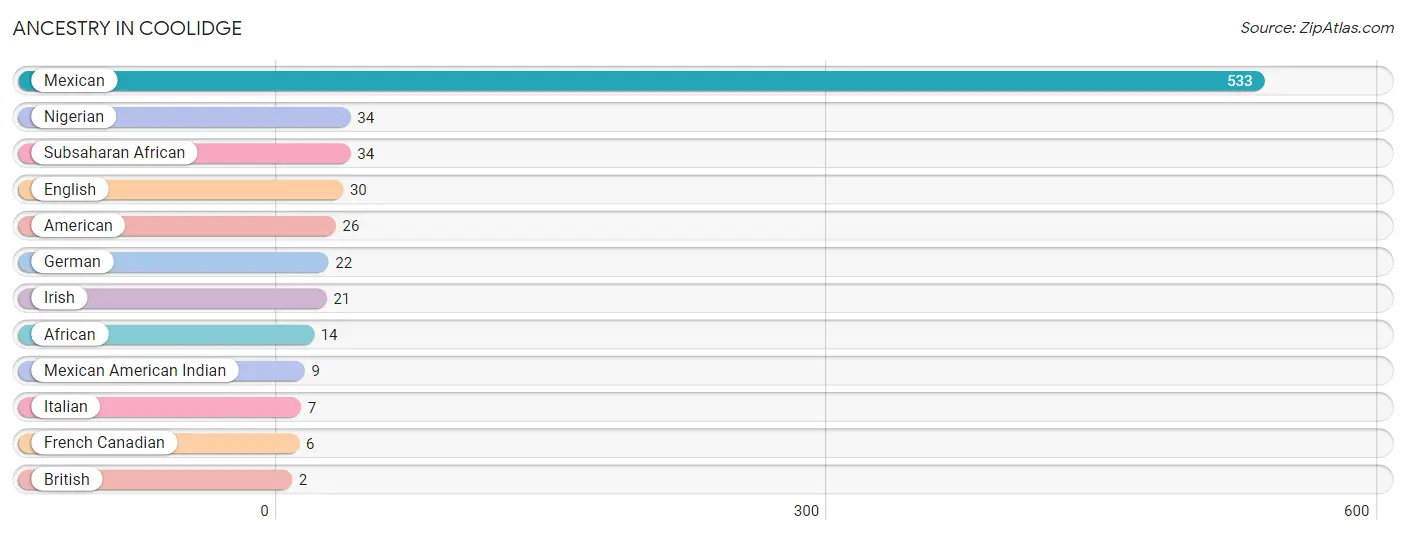
| Ancestry | # Population | % Population |
| African | 14 | 1.7% |
| American | 26 | 3.1% |
| British | 2 | 0.2% |
| English | 30 | 3.5% |
| French Canadian | 6 | 0.7% |
| German | 22 | 2.6% |
| Irish | 21 | 2.5% |
| Italian | 7 | 0.8% |
| Mexican | 533 | 62.7% |
| Mexican American Indian | 9 | 1.1% |
| Nigerian | 34 | 4.0% |
| Subsaharan African | 34 | 4.0% | View All 12 Rows |
Immigrants in Coolidge
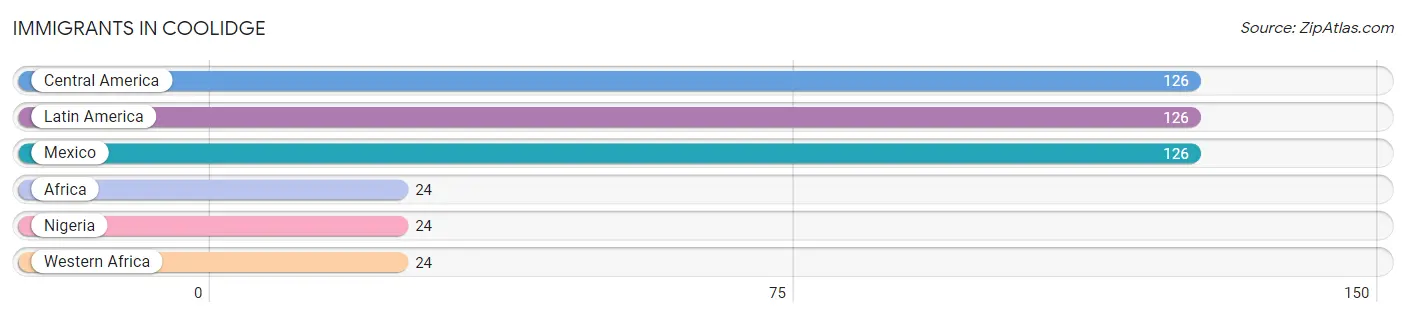
The most numerous immigrant groups reported in Coolidge came from Central America (126 | 14.8%), Latin America (126 | 14.8%), Mexico (126 | 14.8%), Africa (24 | 2.8%), and Nigeria (24 | 2.8%), together accounting for 50.1% of all Coolidge residents.
| Immigration Origin | # Population | % Population |
| Africa | 24 | 2.8% |
| Central America | 126 | 14.8% |
| Latin America | 126 | 14.8% |
| Mexico | 126 | 14.8% |
| Nigeria | 24 | 2.8% |
| Western Africa | 24 | 2.8% | View All 6 Rows |
Sex and Age in Coolidge
Sex and Age in Coolidge
The most populous age groups in Coolidge are Under 5 Years (74 | 16.7%) for men and Under 5 Years (83 | 20.4%) for women.

| Age Bracket | Male | Female |
| Under 5 Years | 74 (16.7%) | 83 (20.4%) |
| 5 to 9 Years | 42 (9.5%) | 26 (6.4%) |
| 10 to 14 Years | 29 (6.6%) | 36 (8.8%) |
| 15 to 19 Years | 31 (7.0%) | 17 (4.2%) |
| 20 to 24 Years | 16 (3.6%) | 42 (10.3%) |
| 25 to 29 Years | 37 (8.4%) | 72 (17.7%) |
| 30 to 34 Years | 54 (12.2%) | 37 (9.1%) |
| 35 to 39 Years | 27 (6.1%) | 4 (1.0%) |
| 40 to 44 Years | 0 (0.0%) | 3 (0.7%) |
| 45 to 49 Years | 25 (5.6%) | 5 (1.2%) |
| 50 to 54 Years | 25 (5.6%) | 27 (6.6%) |
| 55 to 59 Years | 23 (5.2%) | 6 (1.5%) |
| 60 to 64 Years | 14 (3.2%) | 12 (2.9%) |
| 65 to 69 Years | 23 (5.2%) | 12 (2.9%) |
| 70 to 74 Years | 0 (0.0%) | 17 (4.2%) |
| 75 to 79 Years | 10 (2.3%) | 0 (0.0%) |
| 80 to 84 Years | 2 (0.4%) | 0 (0.0%) |
| 85 Years and over | 11 (2.5%) | 8 (2.0%) |
| Total | 443 (100.0%) | 407 (100.0%) |
Families and Households in Coolidge
Median Family Size in Coolidge
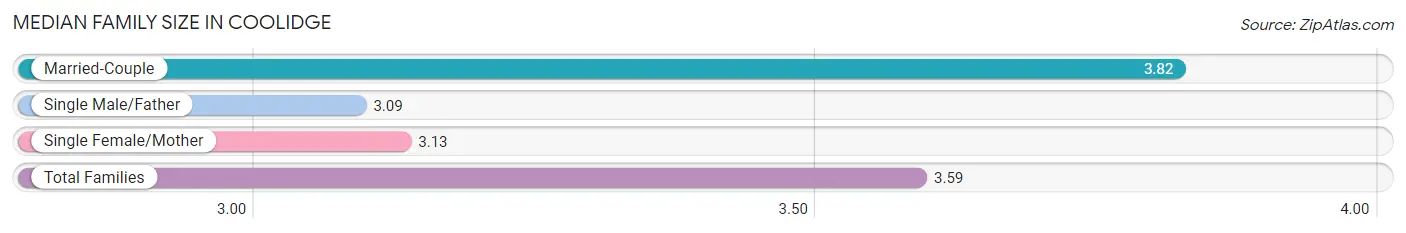
The median family size in Coolidge is 3.59 persons per family, with married-couple families (143 | 68.4%) accounting for the largest median family size of 3.82 persons per family. On the other hand, single male/father families (34 | 16.3%) represent the smallest median family size with 3.09 persons per family.
| Family Type | # Families | Family Size |
| Married-Couple | 143 (68.4%) | 3.82 |
| Single Male/Father | 34 (16.3%) | 3.09 |
| Single Female/Mother | 32 (15.3%) | 3.13 |
| Total Families | 209 (100.0%) | 3.59 |
Median Household Size in Coolidge
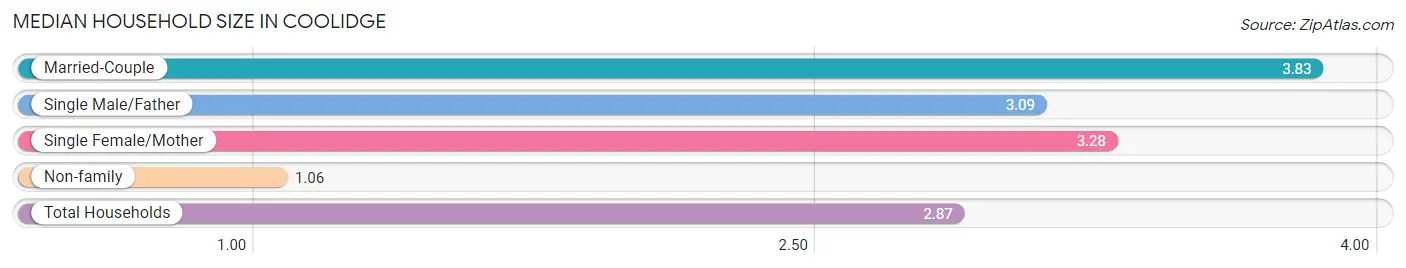
The median household size in Coolidge is 2.87 persons per household, with married-couple households (143 | 48.3%) accounting for the largest median household size of 3.83 persons per household. non-family households (87 | 29.4%) represent the smallest median household size with 1.06 persons per household.
| Household Type | # Households | Household Size |
| Married-Couple | 143 (48.3%) | 3.83 |
| Single Male/Father | 34 (11.5%) | 3.09 |
| Single Female/Mother | 32 (10.8%) | 3.28 |
| Non-family | 87 (29.4%) | 1.06 |
| Total Households | 296 (100.0%) | 2.87 |
Household Size by Marriage Status in Coolidge
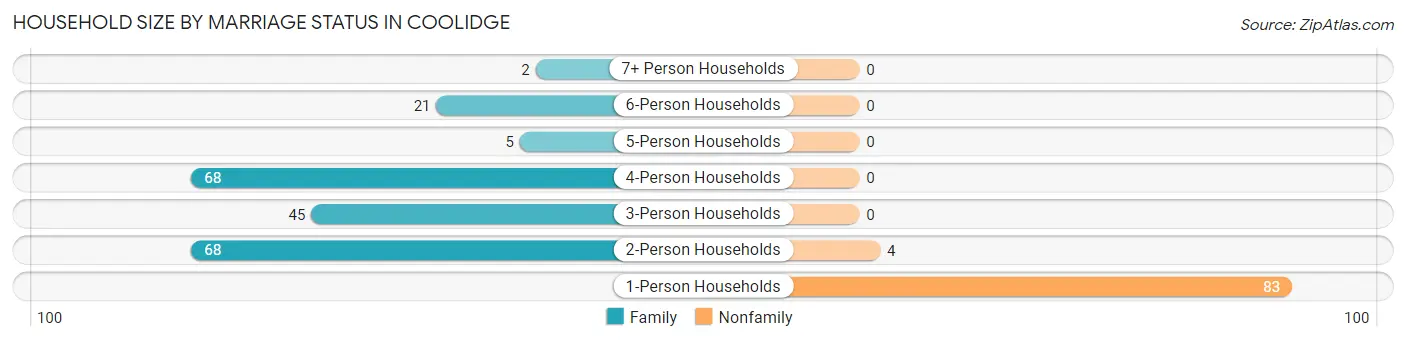
Out of a total of 296 households in Coolidge, 209 (70.6%) are family households, while 87 (29.4%) are nonfamily households. The most numerous type of family households are 2-person households, comprising 68, and the most common type of nonfamily households are 1-person households, comprising 83.
| Household Size | Family Households | Nonfamily Households |
| 1-Person Households | - | 83 (28.0%) |
| 2-Person Households | 68 (23.0%) | 4 (1.3%) |
| 3-Person Households | 45 (15.2%) | 0 (0.0%) |
| 4-Person Households | 68 (23.0%) | 0 (0.0%) |
| 5-Person Households | 5 (1.7%) | 0 (0.0%) |
| 6-Person Households | 21 (7.1%) | 0 (0.0%) |
| 7+ Person Households | 2 (0.7%) | 0 (0.0%) |
| Total | 209 (70.6%) | 87 (29.4%) |
Female Fertility in Coolidge
Fertility by Age in Coolidge
Average fertility rate in Coolidge is 178.0 births per 1,000 women. Women in the age bracket of 20 to 34 years have the highest fertility rate with 212.0 births per 1,000 women. Women in the age bracket of 20 to 34 years acount for 100.0% of all women with births.
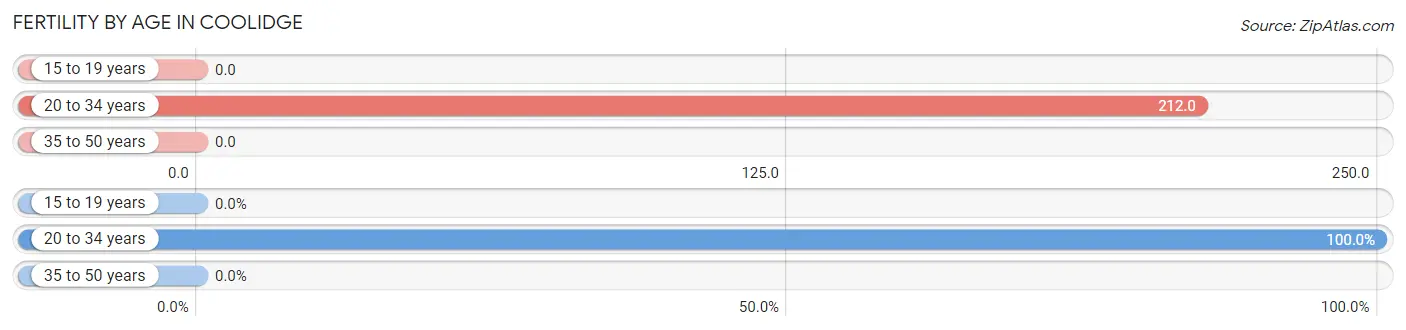
| Age Bracket | Women with Births | Births / 1,000 Women |
| 15 to 19 years | 0 (0.0%) | 0.0 |
| 20 to 34 years | 32 (100.0%) | 212.0 |
| 35 to 50 years | 0 (0.0%) | 0.0 |
| Total | 32 (100.0%) | 178.0 |
Fertility by Age by Marriage Status in Coolidge
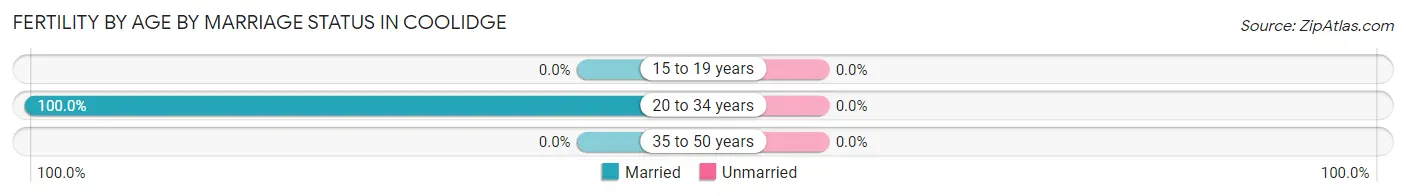
| Age Bracket | Married | Unmarried |
| 15 to 19 years | 0 (0.0%) | 0 (0.0%) |
| 20 to 34 years | 32 (100.0%) | 0 (0.0%) |
| 35 to 50 years | 0 (0.0%) | 0 (0.0%) |
| Total | 32 (100.0%) | 0 (0.0%) |
Fertility by Education in Coolidge
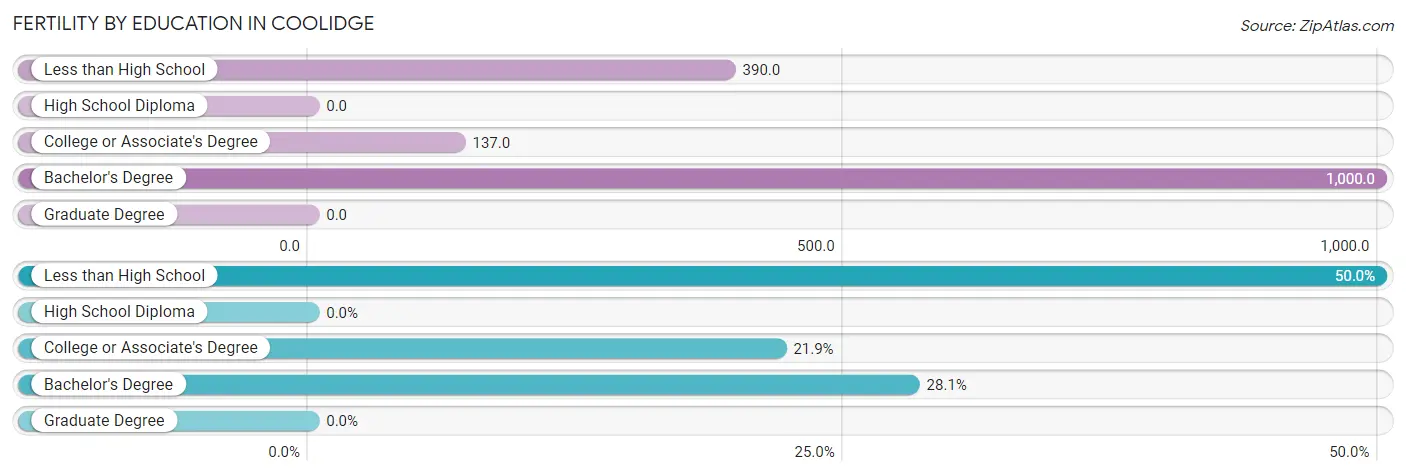
| Educational Attainment | Women with Births | Births / 1,000 Women |
| Less than High School | 16 (50.0%) | 390.0 |
| High School Diploma | 0 (0.0%) | 0.0 |
| College or Associate's Degree | 7 (21.9%) | 137.0 |
| Bachelor's Degree | 9 (28.1%) | 1,000.0 |
| Graduate Degree | 0 (0.0%) | 0.0 |
| Total | 32 (100.0%) | 178.0 |
Fertility by Education by Marriage Status in Coolidge
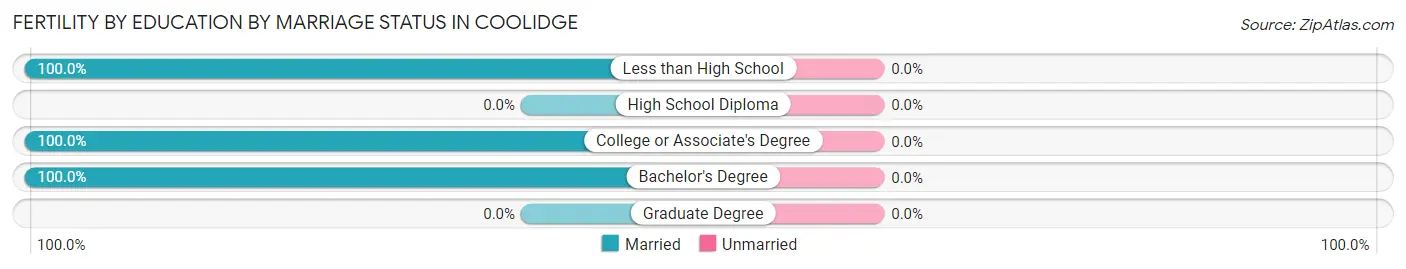
| Educational Attainment | Married | Unmarried |
| Less than High School | 16 (100.0%) | 0 (0.0%) |
| High School Diploma | 0 (0.0%) | 0 (0.0%) |
| College or Associate's Degree | 7 (100.0%) | 0 (0.0%) |
| Bachelor's Degree | 9 (100.0%) | 0 (0.0%) |
| Graduate Degree | 0 (0.0%) | 0 (0.0%) |
| Total | 32 (100.0%) | 0 (0.0%) |
Employment Characteristics in Coolidge
Employment by Class of Employer in Coolidge
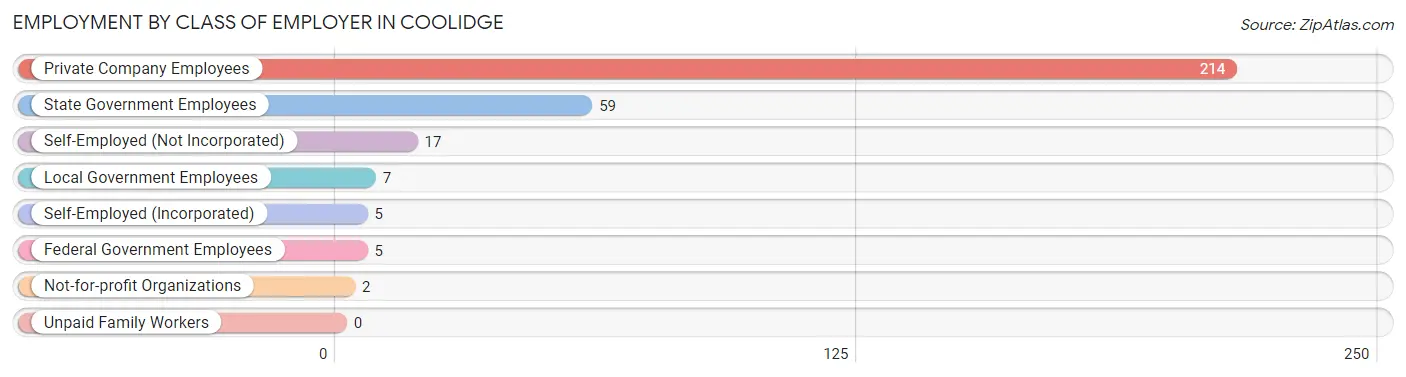
Among the 309 employed individuals in Coolidge, private company employees (214 | 69.3%), state government employees (59 | 19.1%), and self-employed (not incorporated) (17 | 5.5%) make up the most common classes of employment.
| Employer Class | # Employees | % Employees |
| Private Company Employees | 214 | 69.3% |
| Self-Employed (Incorporated) | 5 | 1.6% |
| Self-Employed (Not Incorporated) | 17 | 5.5% |
| Not-for-profit Organizations | 2 | 0.6% |
| Local Government Employees | 7 | 2.3% |
| State Government Employees | 59 | 19.1% |
| Federal Government Employees | 5 | 1.6% |
| Unpaid Family Workers | 0 | 0.0% |
| Total | 309 | 100.0% |
Employment Status by Age in Coolidge
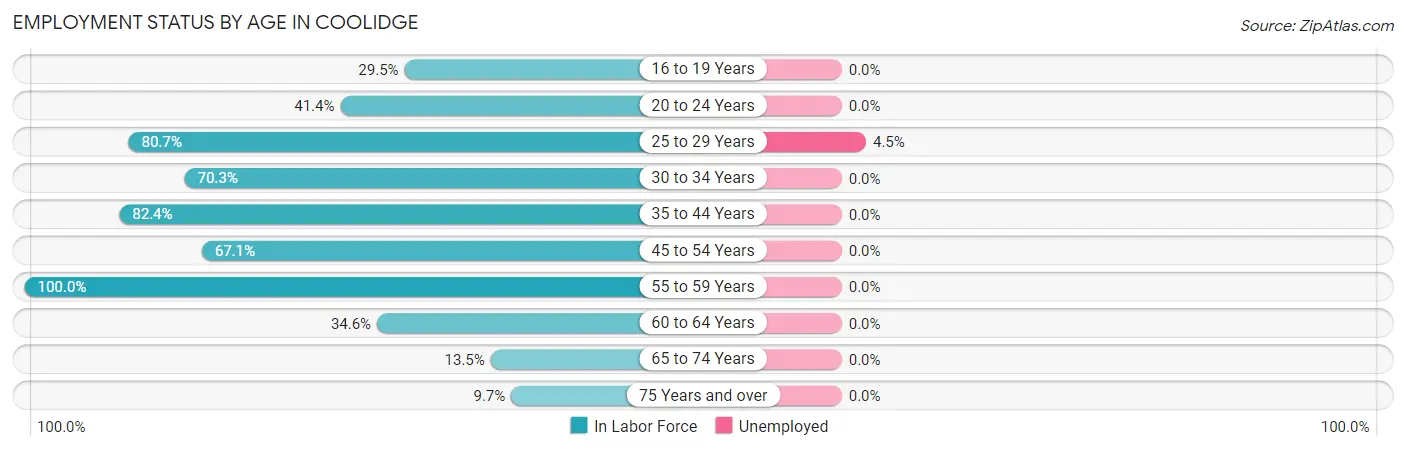
According to the labor force statistics for Coolidge, out of the total population over 16 years of age (556), 57.6% or 320 individuals are in the labor force, with 1.3% or 4 of them unemployed. The age group with the highest labor force participation rate is 55 to 59 years, with 100.0% or 29 individuals in the labor force. Within the labor force, the 25 to 29 years age range has the highest percentage of unemployed individuals, with 4.5% or 4 of them being unemployed.
| Age Bracket | In Labor Force | Unemployed |
| 16 to 19 Years | 13 (29.5%) | 0 (0.0%) |
| 20 to 24 Years | 24 (41.4%) | 0 (0.0%) |
| 25 to 29 Years | 88 (80.7%) | 4 (4.5%) |
| 30 to 34 Years | 64 (70.3%) | 0 (0.0%) |
| 35 to 44 Years | 28 (82.4%) | 0 (0.0%) |
| 45 to 54 Years | 55 (67.1%) | 0 (0.0%) |
| 55 to 59 Years | 29 (100.0%) | 0 (0.0%) |
| 60 to 64 Years | 9 (34.6%) | 0 (0.0%) |
| 65 to 74 Years | 7 (13.5%) | 0 (0.0%) |
| 75 Years and over | 3 (9.7%) | 0 (0.0%) |
| Total | 320 (57.6%) | 4 (1.3%) |
Employment Status by Educational Attainment in Coolidge
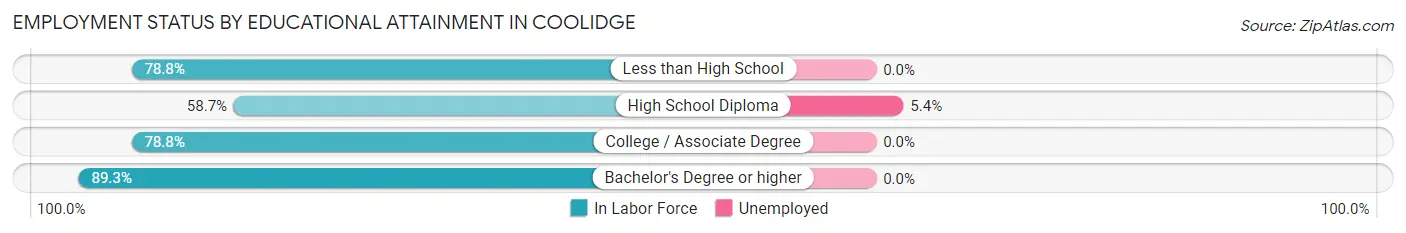
According to labor force statistics for Coolidge, 73.6% of individuals (273) out of the total population between 25 and 64 years of age (371) are in the labor force, with 1.5% or 4 of them being unemployed. The group with the highest labor force participation rate are those with the educational attainment of bachelor's degree or higher, with 89.3% or 50 individuals in the labor force. Within the labor force, individuals with high school diploma education have the highest percentage of unemployment, with 5.4% or 4 of them being unemployed.
| Educational Attainment | In Labor Force | Unemployed |
| Less than High School | 67 (78.8%) | 0 (0.0%) |
| High School Diploma | 74 (58.7%) | 7 (5.4%) |
| College / Associate Degree | 82 (78.8%) | 0 (0.0%) |
| Bachelor's Degree or higher | 50 (89.3%) | 0 (0.0%) |
| Total | 273 (73.6%) | 6 (1.5%) |
Employment Occupations by Sex in Coolidge
Management, Business, Science and Arts Occupations
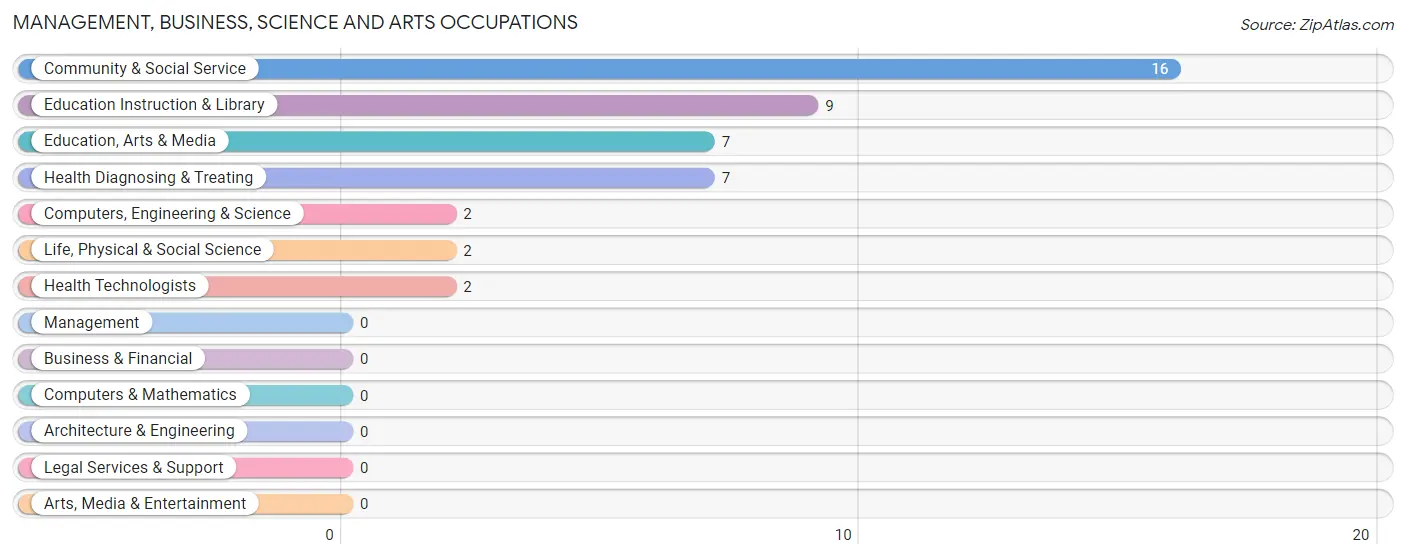
The most common Management, Business, Science and Arts occupations in Coolidge are Community & Social Service (16 | 5.1%), Education Instruction & Library (9 | 2.9%), Education, Arts & Media (7 | 2.2%), Health Diagnosing & Treating (7 | 2.2%), and Computers, Engineering & Science (2 | 0.6%).
Management, Business, Science and Arts Occupations by Sex
Within the Management, Business, Science and Arts occupations in Coolidge, the most male-oriented occupations are Computers, Engineering & Science (100.0%), Life, Physical & Social Science (100.0%), and Health Diagnosing & Treating (71.4%), while the most female-oriented occupations are Education Instruction & Library (100.0%), Health Technologists (100.0%), and Community & Social Service (87.5%).
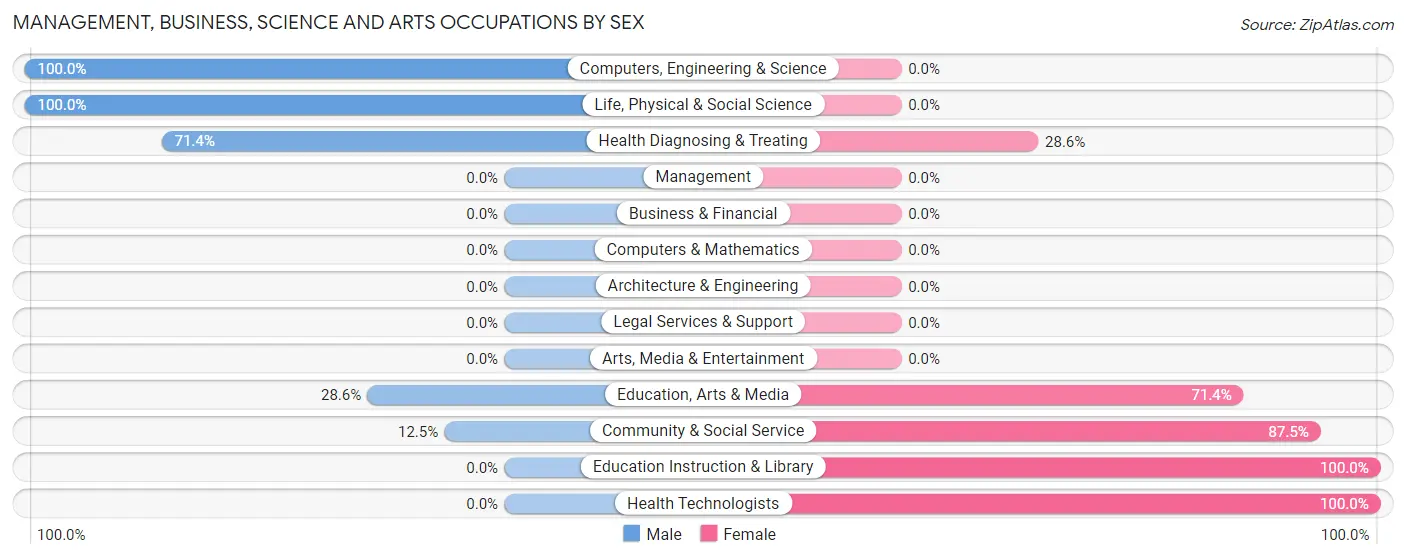
| Occupation | Male | Female |
| Management | 0 (0.0%) | 0 (0.0%) |
| Business & Financial | 0 (0.0%) | 0 (0.0%) |
| Computers, Engineering & Science | 2 (100.0%) | 0 (0.0%) |
| Computers & Mathematics | 0 (0.0%) | 0 (0.0%) |
| Architecture & Engineering | 0 (0.0%) | 0 (0.0%) |
| Life, Physical & Social Science | 2 (100.0%) | 0 (0.0%) |
| Community & Social Service | 2 (12.5%) | 14 (87.5%) |
| Education, Arts & Media | 2 (28.6%) | 5 (71.4%) |
| Legal Services & Support | 0 (0.0%) | 0 (0.0%) |
| Education Instruction & Library | 0 (0.0%) | 9 (100.0%) |
| Arts, Media & Entertainment | 0 (0.0%) | 0 (0.0%) |
| Health Diagnosing & Treating | 5 (71.4%) | 2 (28.6%) |
| Health Technologists | 0 (0.0%) | 2 (100.0%) |
| Total (Category) | 9 (36.0%) | 16 (64.0%) |
| Total (Overall) | 212 (67.1%) | 104 (32.9%) |
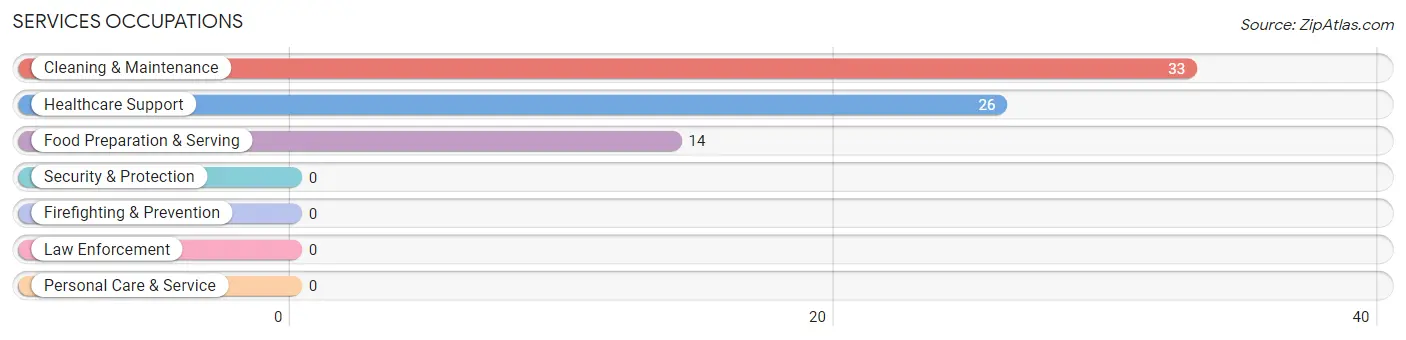
Services Occupations
The most common Services occupations in Coolidge are Cleaning & Maintenance (33 | 10.4%), Healthcare Support (26 | 8.2%), and Food Preparation & Serving (14 | 4.4%).
Services Occupations by Sex
Within the Services occupations in Coolidge, the most male-oriented occupations are Healthcare Support (53.8%), and Cleaning & Maintenance (45.5%), while the most female-oriented occupations are Food Preparation & Serving (100.0%), Cleaning & Maintenance (54.5%), and Healthcare Support (46.2%).
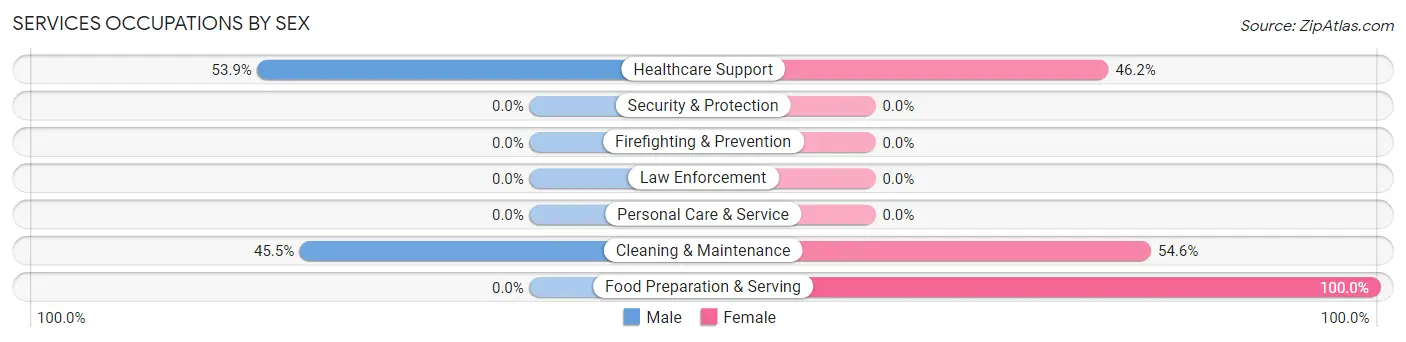
| Occupation | Male | Female |
| Healthcare Support | 14 (53.8%) | 12 (46.2%) |
| Security & Protection | 0 (0.0%) | 0 (0.0%) |
| Firefighting & Prevention | 0 (0.0%) | 0 (0.0%) |
| Law Enforcement | 0 (0.0%) | 0 (0.0%) |
| Food Preparation & Serving | 0 (0.0%) | 14 (100.0%) |
| Cleaning & Maintenance | 15 (45.5%) | 18 (54.5%) |
| Personal Care & Service | 0 (0.0%) | 0 (0.0%) |
| Total (Category) | 29 (39.7%) | 44 (60.3%) |
| Total (Overall) | 212 (67.1%) | 104 (32.9%) |
Sales and Office Occupations
The most common Sales and Office occupations in Coolidge are Office & Administration (41 | 13.0%), and Sales & Related (23 | 7.3%).
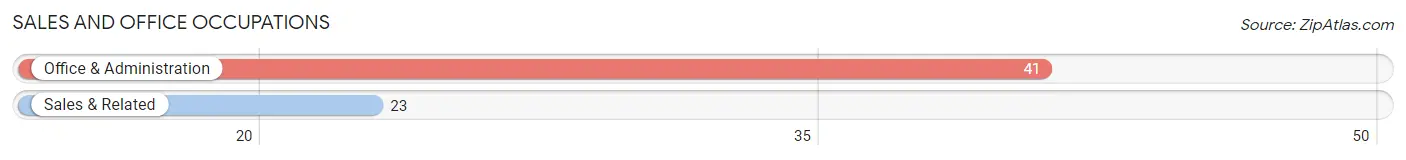
Sales and Office Occupations by Sex
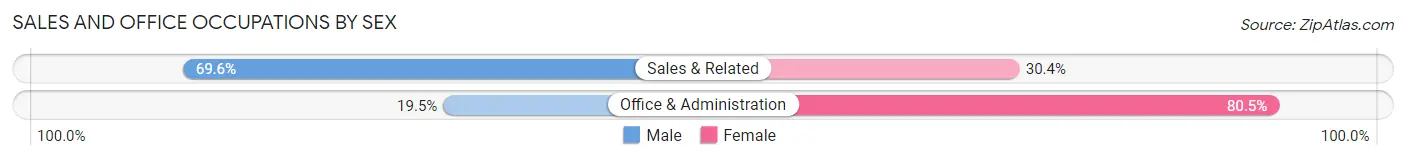
| Occupation | Male | Female |
| Sales & Related | 16 (69.6%) | 7 (30.4%) |
| Office & Administration | 8 (19.5%) | 33 (80.5%) |
| Total (Category) | 24 (37.5%) | 40 (62.5%) |
| Total (Overall) | 212 (67.1%) | 104 (32.9%) |
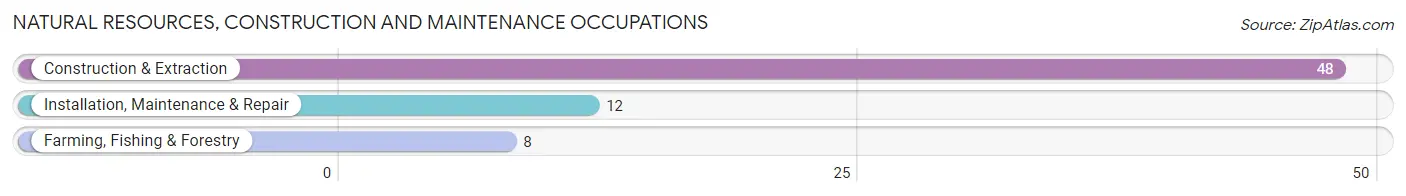
Natural Resources, Construction and Maintenance Occupations
The most common Natural Resources, Construction and Maintenance occupations in Coolidge are Construction & Extraction (48 | 15.2%), Installation, Maintenance & Repair (12 | 3.8%), and Farming, Fishing & Forestry (8 | 2.5%).
Natural Resources, Construction and Maintenance Occupations by Sex
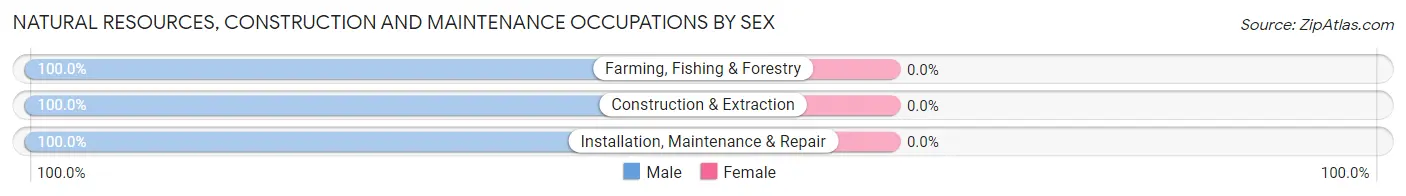
| Occupation | Male | Female |
| Farming, Fishing & Forestry | 8 (100.0%) | 0 (0.0%) |
| Construction & Extraction | 48 (100.0%) | 0 (0.0%) |
| Installation, Maintenance & Repair | 12 (100.0%) | 0 (0.0%) |
| Total (Category) | 68 (100.0%) | 0 (0.0%) |
| Total (Overall) | 212 (67.1%) | 104 (32.9%) |
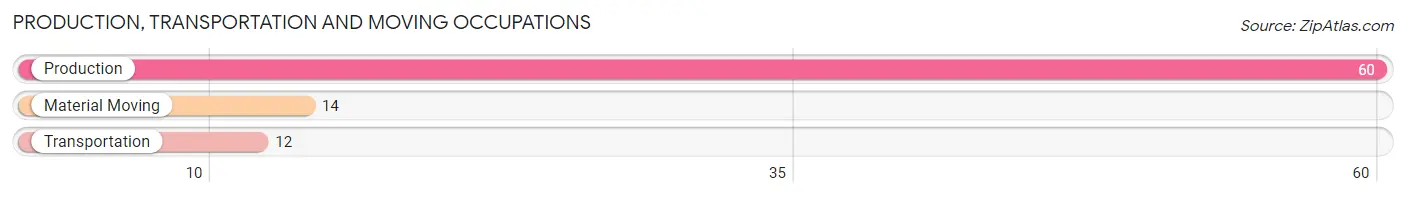
Production, Transportation and Moving Occupations
The most common Production, Transportation and Moving occupations in Coolidge are Production (60 | 19.0%), Material Moving (14 | 4.4%), and Transportation (12 | 3.8%).
Production, Transportation and Moving Occupations by Sex
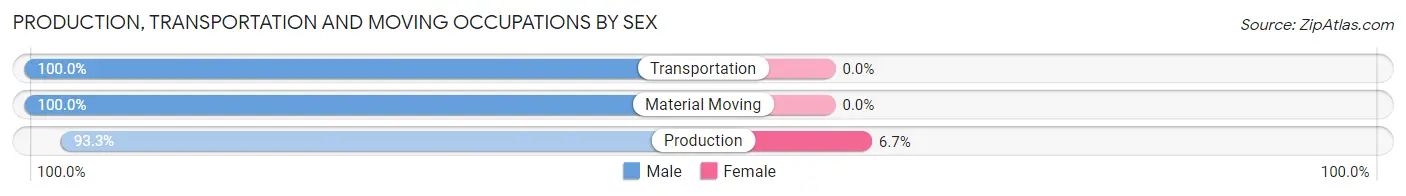
| Occupation | Male | Female |
| Production | 56 (93.3%) | 4 (6.7%) |
| Transportation | 12 (100.0%) | 0 (0.0%) |
| Material Moving | 14 (100.0%) | 0 (0.0%) |
| Total (Category) | 82 (95.4%) | 4 (4.6%) |
| Total (Overall) | 212 (67.1%) | 104 (32.9%) |
Employment Industries by Sex in Coolidge
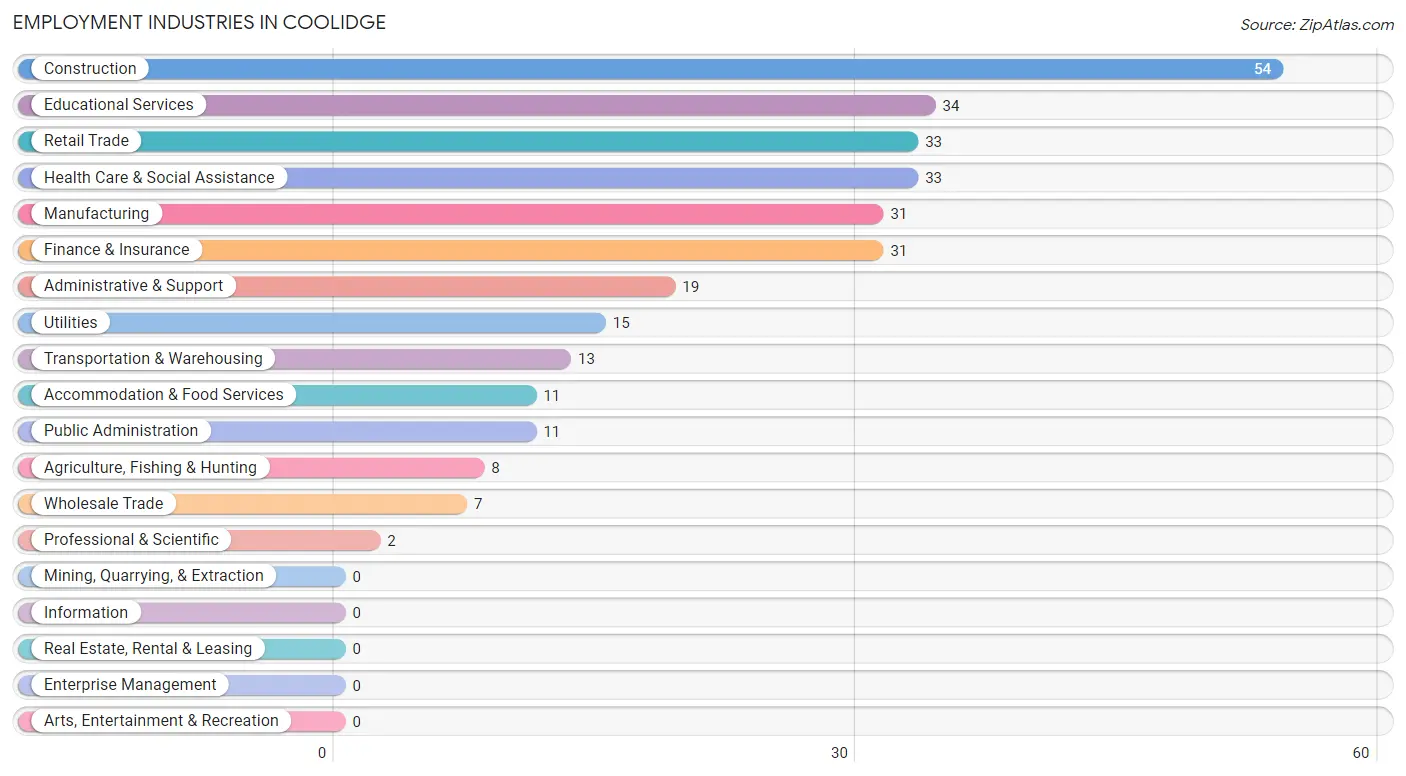
Employment Industries in Coolidge
The major employment industries in Coolidge include Construction (54 | 17.1%), Educational Services (34 | 10.8%), Retail Trade (33 | 10.4%), Health Care & Social Assistance (33 | 10.4%), and Manufacturing (31 | 9.8%).
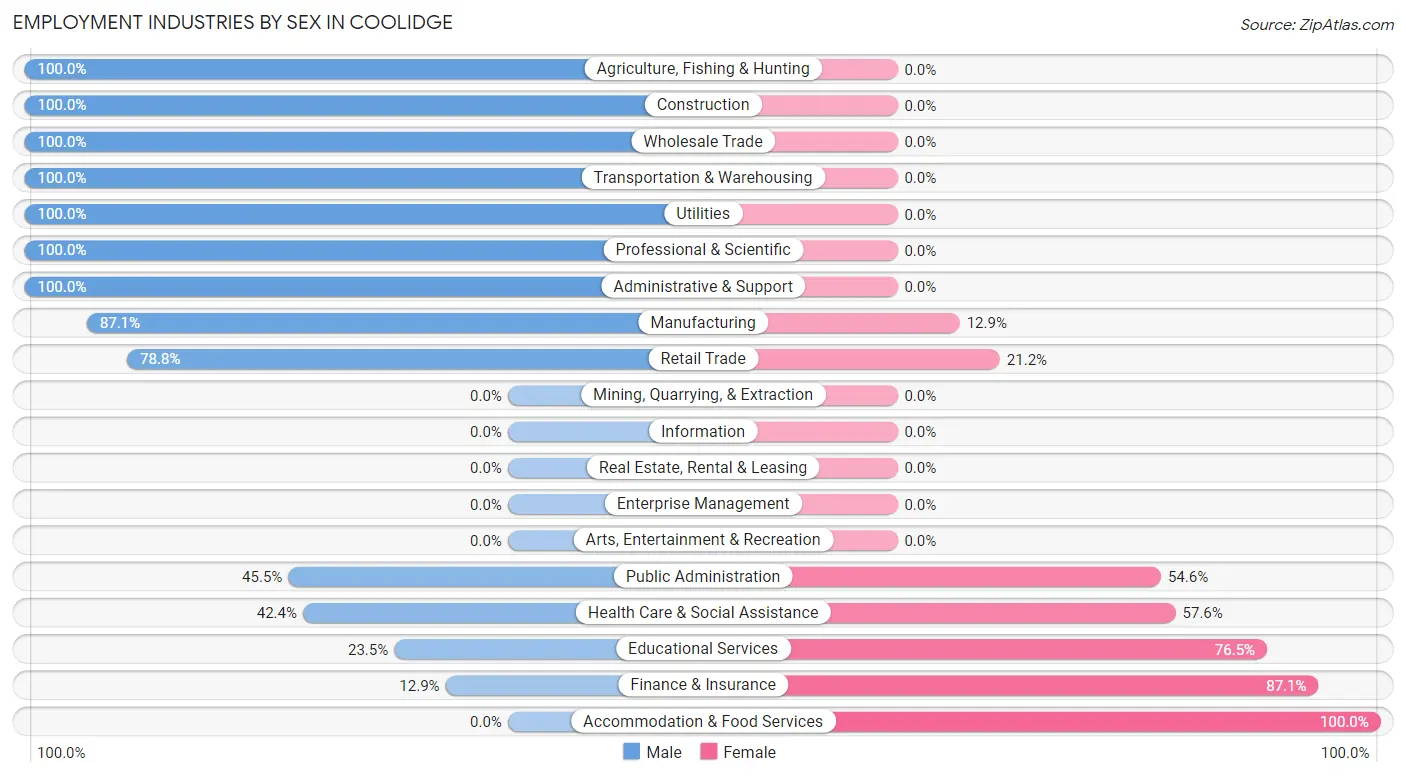
Employment Industries by Sex in Coolidge
The Coolidge industries that see more men than women are Agriculture, Fishing & Hunting (100.0%), Construction (100.0%), and Wholesale Trade (100.0%), whereas the industries that tend to have a higher number of women are Accommodation & Food Services (100.0%), Finance & Insurance (87.1%), and Educational Services (76.5%).
| Industry | Male | Female |
| Agriculture, Fishing & Hunting | 8 (100.0%) | 0 (0.0%) |
| Mining, Quarrying, & Extraction | 0 (0.0%) | 0 (0.0%) |
| Construction | 54 (100.0%) | 0 (0.0%) |
| Manufacturing | 27 (87.1%) | 4 (12.9%) |
| Wholesale Trade | 7 (100.0%) | 0 (0.0%) |
| Retail Trade | 26 (78.8%) | 7 (21.2%) |
| Transportation & Warehousing | 13 (100.0%) | 0 (0.0%) |
| Utilities | 15 (100.0%) | 0 (0.0%) |
| Information | 0 (0.0%) | 0 (0.0%) |
| Finance & Insurance | 4 (12.9%) | 27 (87.1%) |
| Real Estate, Rental & Leasing | 0 (0.0%) | 0 (0.0%) |
| Professional & Scientific | 2 (100.0%) | 0 (0.0%) |
| Enterprise Management | 0 (0.0%) | 0 (0.0%) |
| Administrative & Support | 19 (100.0%) | 0 (0.0%) |
| Educational Services | 8 (23.5%) | 26 (76.5%) |
| Health Care & Social Assistance | 14 (42.4%) | 19 (57.6%) |
| Arts, Entertainment & Recreation | 0 (0.0%) | 0 (0.0%) |
| Accommodation & Food Services | 0 (0.0%) | 11 (100.0%) |
| Public Administration | 5 (45.5%) | 6 (54.5%) |
| Total | 212 (67.1%) | 104 (32.9%) |
Education in Coolidge
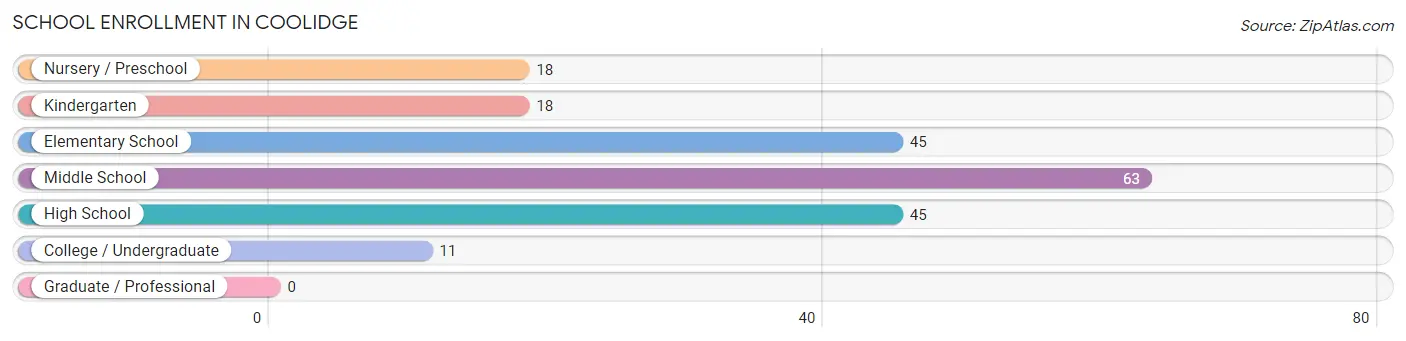
School Enrollment in Coolidge
The most common levels of schooling among the 200 students in Coolidge are middle school (63 | 31.5%), elementary school (45 | 22.5%), and high school (45 | 22.5%).
| School Level | # Students | % Students |
| Nursery / Preschool | 18 | 9.0% |
| Kindergarten | 18 | 9.0% |
| Elementary School | 45 | 22.5% |
| Middle School | 63 | 31.5% |
| High School | 45 | 22.5% |
| College / Undergraduate | 11 | 5.5% |
| Graduate / Professional | 0 | 0.0% |
| Total | 200 | 100.0% |
School Enrollment by Age by Funding Source in Coolidge
Out of a total of 200 students who are enrolled in schools in Coolidge, 6 (3.0%) attend a private institution, while the remaining 194 (97.0%) are enrolled in public schools. The age group of 10 to 14 year olds has the highest likelihood of being enrolled in private schools, with 4 (6.1% in the age bracket) enrolled. Conversely, the age group of 3 to 4 year olds has the lowest likelihood of being enrolled in a private school, with 13 (100.0% in the age bracket) attending a public institution.
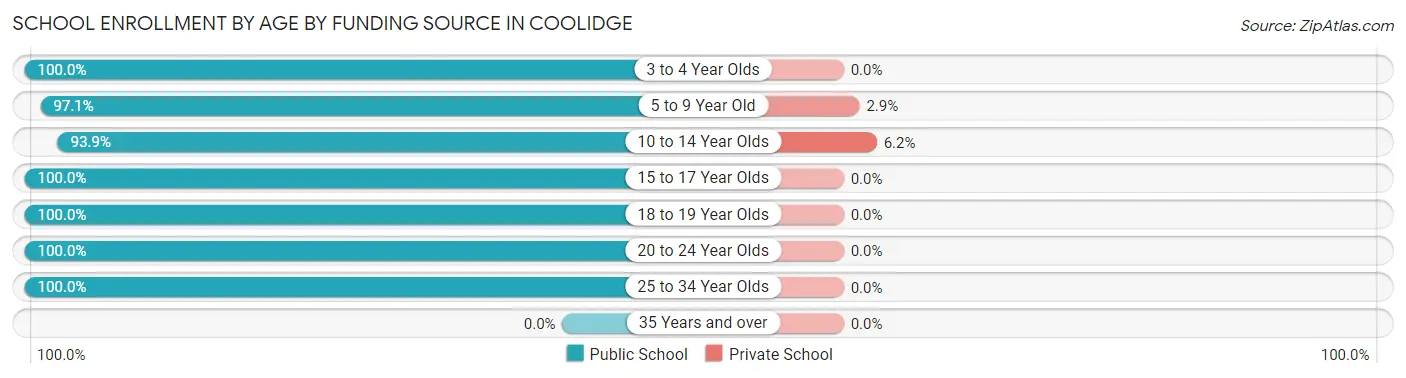
| Age Bracket | Public School | Private School |
| 3 to 4 Year Olds | 13 (100.0%) | 0 (0.0%) |
| 5 to 9 Year Old | 66 (97.1%) | 2 (2.9%) |
| 10 to 14 Year Olds | 61 (93.9%) | 4 (6.1%) |
| 15 to 17 Year Olds | 22 (100.0%) | 0 (0.0%) |
| 18 to 19 Year Olds | 19 (100.0%) | 0 (0.0%) |
| 20 to 24 Year Olds | 8 (100.0%) | 0 (0.0%) |
| 25 to 34 Year Olds | 5 (100.0%) | 0 (0.0%) |
| 35 Years and over | 0 (0.0%) | 0 (0.0%) |
| Total | 194 (97.0%) | 6 (3.0%) |
Educational Attainment by Field of Study in Coolidge
Education (32 | 30.5%), physical & health sciences (23 | 21.9%), liberal arts & history (19 | 18.1%), business (14 | 13.3%), and engineering (9 | 8.6%) are the most common fields of study among 105 individuals in Coolidge who have obtained a bachelor's degree or higher.
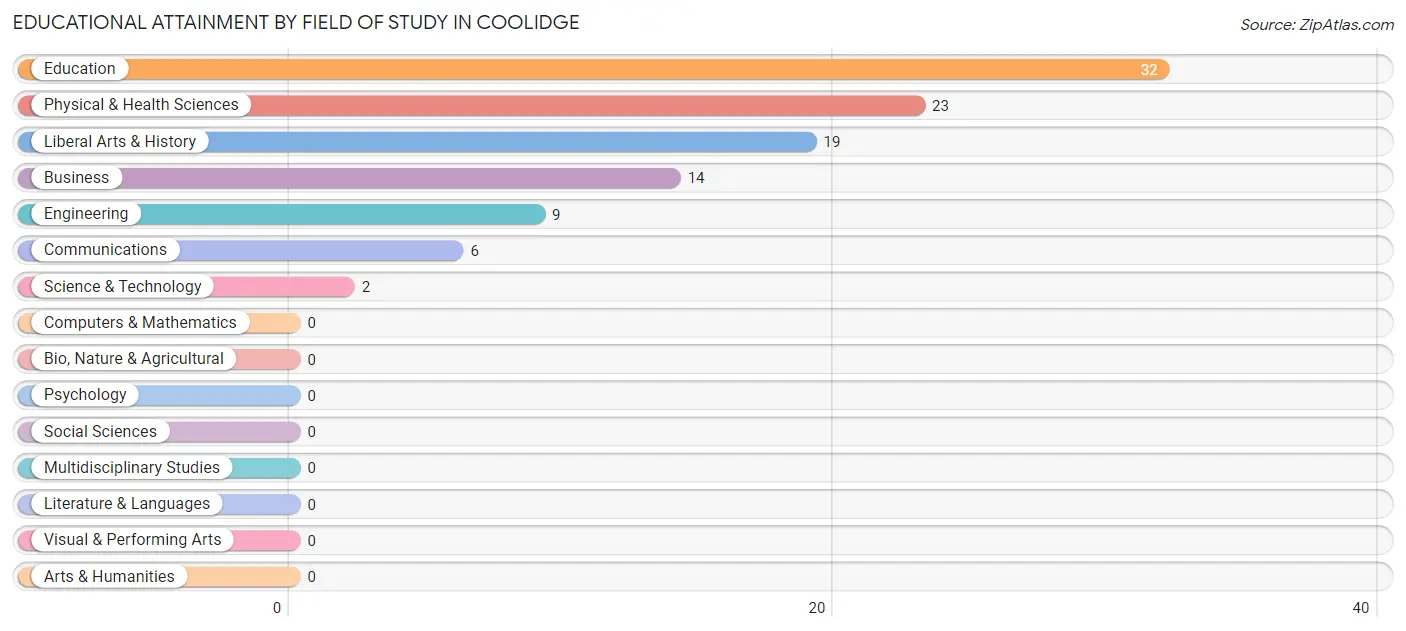
| Field of Study | # Graduates | % Graduates |
| Computers & Mathematics | 0 | 0.0% |
| Bio, Nature & Agricultural | 0 | 0.0% |
| Physical & Health Sciences | 23 | 21.9% |
| Psychology | 0 | 0.0% |
| Social Sciences | 0 | 0.0% |
| Engineering | 9 | 8.6% |
| Multidisciplinary Studies | 0 | 0.0% |
| Science & Technology | 2 | 1.9% |
| Business | 14 | 13.3% |
| Education | 32 | 30.5% |
| Literature & Languages | 0 | 0.0% |
| Liberal Arts & History | 19 | 18.1% |
| Visual & Performing Arts | 0 | 0.0% |
| Communications | 6 | 5.7% |
| Arts & Humanities | 0 | 0.0% |
| Total | 105 | 100.0% |
Transportation & Commute in Coolidge
Vehicle Availability by Sex in Coolidge
The most prevalent vehicle ownership categories in Coolidge are males with 2 vehicles (77, accounting for 36.8%) and females with 2 vehicles (22, making up 77.0%).
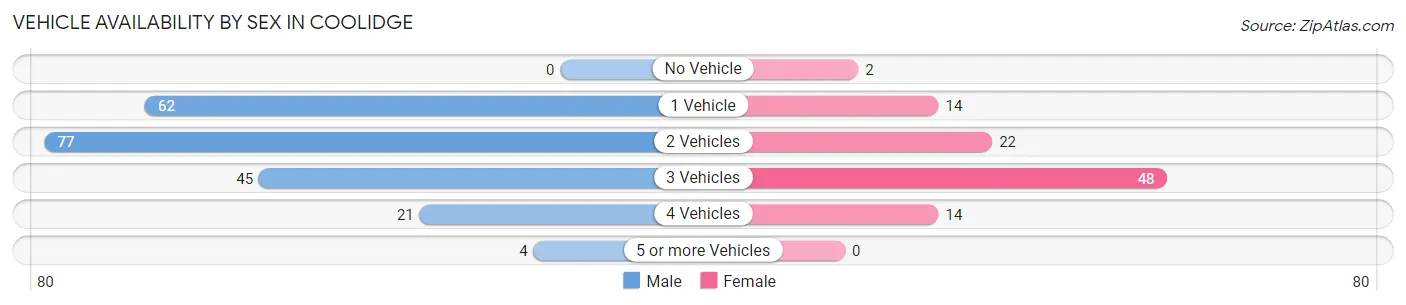
| Vehicles Available | Male | Female |
| No Vehicle | 0 (0.0%) | 2 (2.0%) |
| 1 Vehicle | 62 (29.7%) | 14 (14.0%) |
| 2 Vehicles | 77 (36.8%) | 22 (22.0%) |
| 3 Vehicles | 45 (21.5%) | 48 (48.0%) |
| 4 Vehicles | 21 (10.1%) | 14 (14.0%) |
| 5 or more Vehicles | 4 (1.9%) | 0 (0.0%) |
| Total | 209 (100.0%) | 100 (100.0%) |
Commute Time in Coolidge
The most frequently occuring commute durations in Coolidge are 15 to 19 minutes (76 commuters, 24.6%), 30 to 34 minutes (69 commuters, 22.3%), and 20 to 24 minutes (41 commuters, 13.3%).
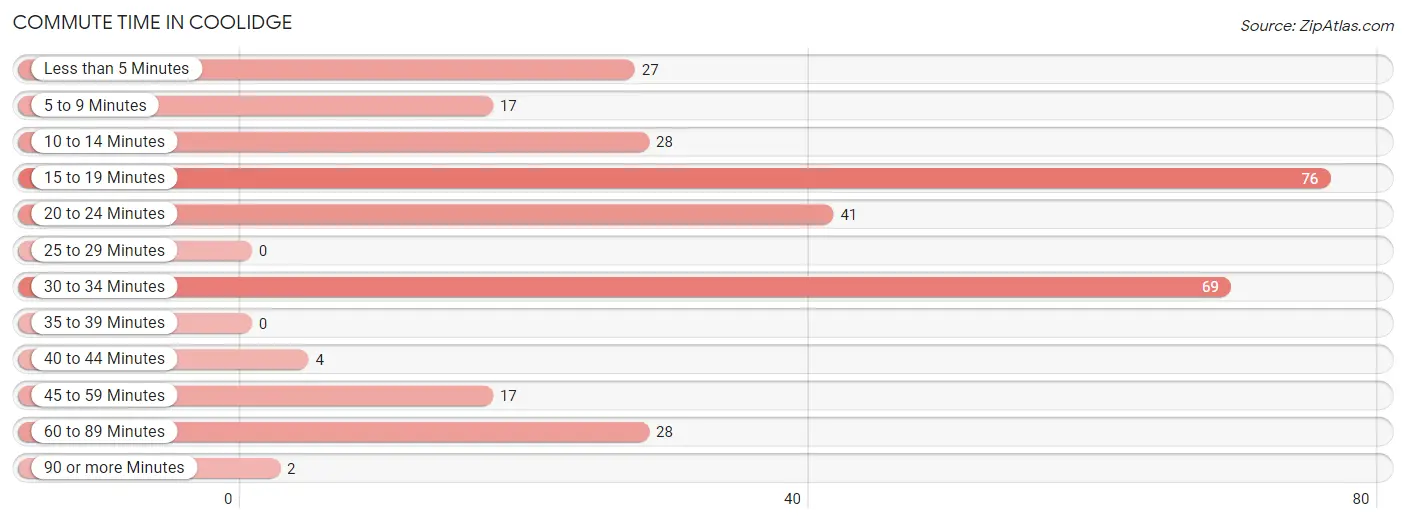
| Commute Time | # Commuters | % Commuters |
| Less than 5 Minutes | 27 | 8.7% |
| 5 to 9 Minutes | 17 | 5.5% |
| 10 to 14 Minutes | 28 | 9.1% |
| 15 to 19 Minutes | 76 | 24.6% |
| 20 to 24 Minutes | 41 | 13.3% |
| 25 to 29 Minutes | 0 | 0.0% |
| 30 to 34 Minutes | 69 | 22.3% |
| 35 to 39 Minutes | 0 | 0.0% |
| 40 to 44 Minutes | 4 | 1.3% |
| 45 to 59 Minutes | 17 | 5.5% |
| 60 to 89 Minutes | 28 | 9.1% |
| 90 or more Minutes | 2 | 0.6% |
Commute Time by Sex in Coolidge
The most common commute times in Coolidge are 30 to 34 minutes (64 commuters, 30.6%) for males and 15 to 19 minutes (39 commuters, 39.0%) for females.
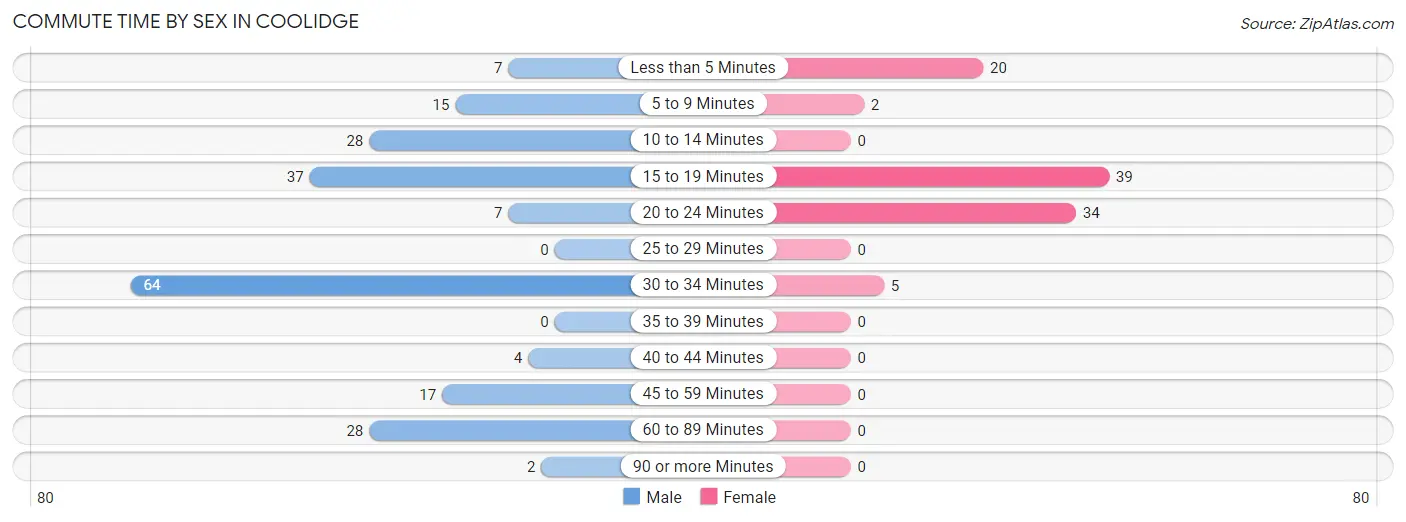
| Commute Time | Male | Female |
| Less than 5 Minutes | 7 (3.4%) | 20 (20.0%) |
| 5 to 9 Minutes | 15 (7.2%) | 2 (2.0%) |
| 10 to 14 Minutes | 28 (13.4%) | 0 (0.0%) |
| 15 to 19 Minutes | 37 (17.7%) | 39 (39.0%) |
| 20 to 24 Minutes | 7 (3.4%) | 34 (34.0%) |
| 25 to 29 Minutes | 0 (0.0%) | 0 (0.0%) |
| 30 to 34 Minutes | 64 (30.6%) | 5 (5.0%) |
| 35 to 39 Minutes | 0 (0.0%) | 0 (0.0%) |
| 40 to 44 Minutes | 4 (1.9%) | 0 (0.0%) |
| 45 to 59 Minutes | 17 (8.1%) | 0 (0.0%) |
| 60 to 89 Minutes | 28 (13.4%) | 0 (0.0%) |
| 90 or more Minutes | 2 (1.0%) | 0 (0.0%) |
Time of Departure to Work by Sex in Coolidge
The most frequent times of departure to work in Coolidge are 5:00 AM to 5:29 AM (47, 22.5%) for males and 5:30 AM to 5:59 AM (25, 25.0%) for females.
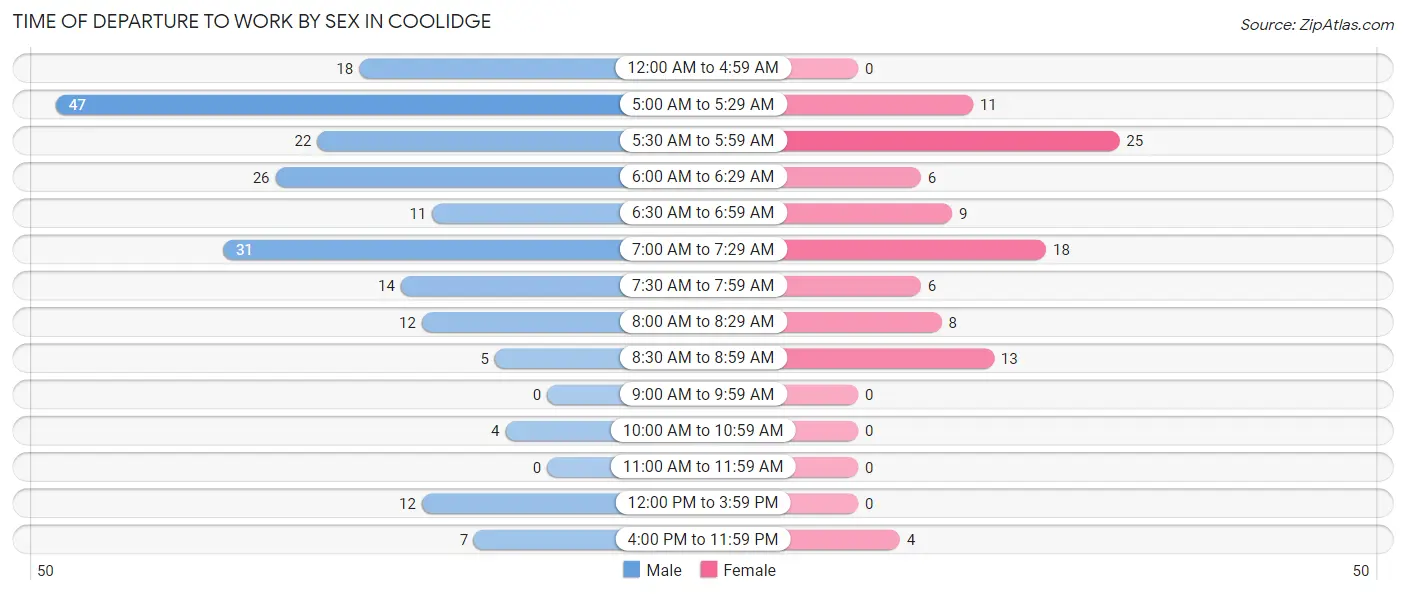
| Time of Departure | Male | Female |
| 12:00 AM to 4:59 AM | 18 (8.6%) | 0 (0.0%) |
| 5:00 AM to 5:29 AM | 47 (22.5%) | 11 (11.0%) |
| 5:30 AM to 5:59 AM | 22 (10.5%) | 25 (25.0%) |
| 6:00 AM to 6:29 AM | 26 (12.4%) | 6 (6.0%) |
| 6:30 AM to 6:59 AM | 11 (5.3%) | 9 (9.0%) |
| 7:00 AM to 7:29 AM | 31 (14.8%) | 18 (18.0%) |
| 7:30 AM to 7:59 AM | 14 (6.7%) | 6 (6.0%) |
| 8:00 AM to 8:29 AM | 12 (5.7%) | 8 (8.0%) |
| 8:30 AM to 8:59 AM | 5 (2.4%) | 13 (13.0%) |
| 9:00 AM to 9:59 AM | 0 (0.0%) | 0 (0.0%) |
| 10:00 AM to 10:59 AM | 4 (1.9%) | 0 (0.0%) |
| 11:00 AM to 11:59 AM | 0 (0.0%) | 0 (0.0%) |
| 12:00 PM to 3:59 PM | 12 (5.7%) | 0 (0.0%) |
| 4:00 PM to 11:59 PM | 7 (3.4%) | 4 (4.0%) |
| Total | 209 (100.0%) | 100 (100.0%) |
Housing Occupancy in Coolidge
Occupancy by Ownership in Coolidge
Of the total 296 dwellings in Coolidge, owner-occupied units account for 184 (62.2%), while renter-occupied units make up 112 (37.8%).
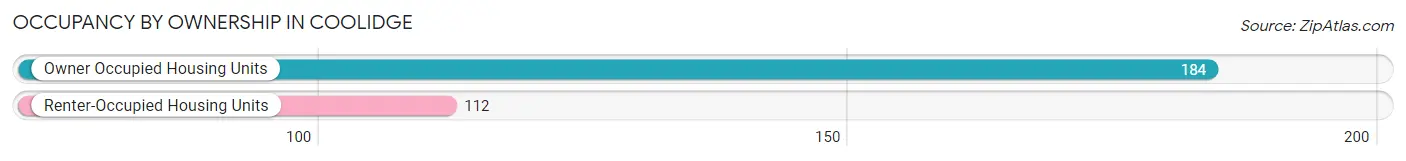
| Occupancy | # Housing Units | % Housing Units |
| Owner Occupied Housing Units | 184 | 62.2% |
| Renter-Occupied Housing Units | 112 | 37.8% |
| Total Occupied Housing Units | 296 | 100.0% |
Occupancy by Household Size in Coolidge
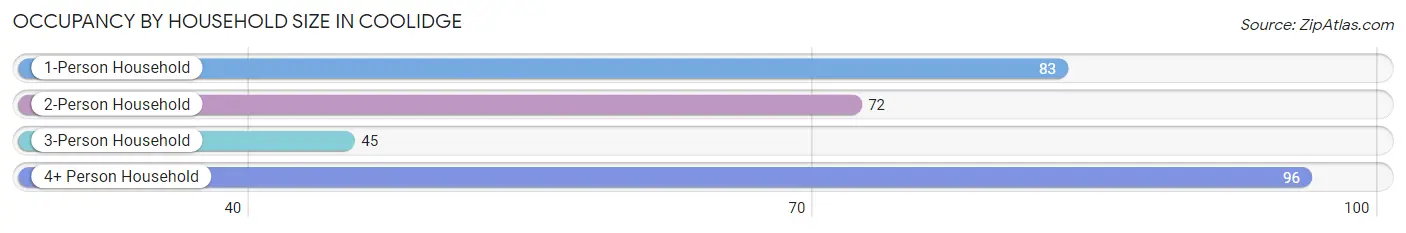
| Household Size | # Housing Units | % Housing Units |
| 1-Person Household | 83 | 28.0% |
| 2-Person Household | 72 | 24.3% |
| 3-Person Household | 45 | 15.2% |
| 4+ Person Household | 96 | 32.4% |
| Total Housing Units | 296 | 100.0% |
Occupancy by Ownership by Household Size in Coolidge
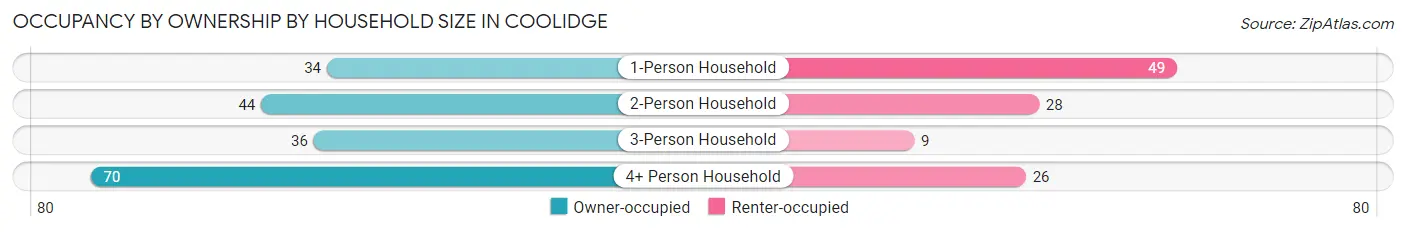
| Household Size | Owner-occupied | Renter-occupied |
| 1-Person Household | 34 (41.0%) | 49 (59.0%) |
| 2-Person Household | 44 (61.1%) | 28 (38.9%) |
| 3-Person Household | 36 (80.0%) | 9 (20.0%) |
| 4+ Person Household | 70 (72.9%) | 26 (27.1%) |
| Total Housing Units | 184 (62.2%) | 112 (37.8%) |
Occupancy by Educational Attainment in Coolidge
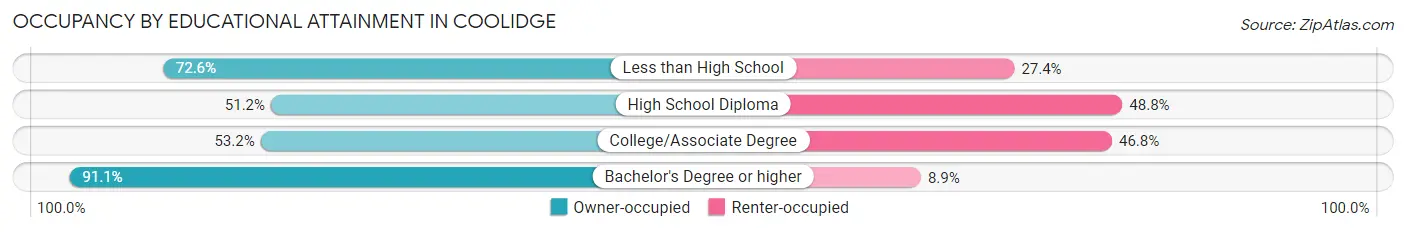
| Household Size | Owner-occupied | Renter-occupied |
| Less than High School | 45 (72.6%) | 17 (27.4%) |
| High School Diploma | 65 (51.2%) | 62 (48.8%) |
| College/Associate Degree | 33 (53.2%) | 29 (46.8%) |
| Bachelor's Degree or higher | 41 (91.1%) | 4 (8.9%) |
Occupancy by Age of Householder in Coolidge
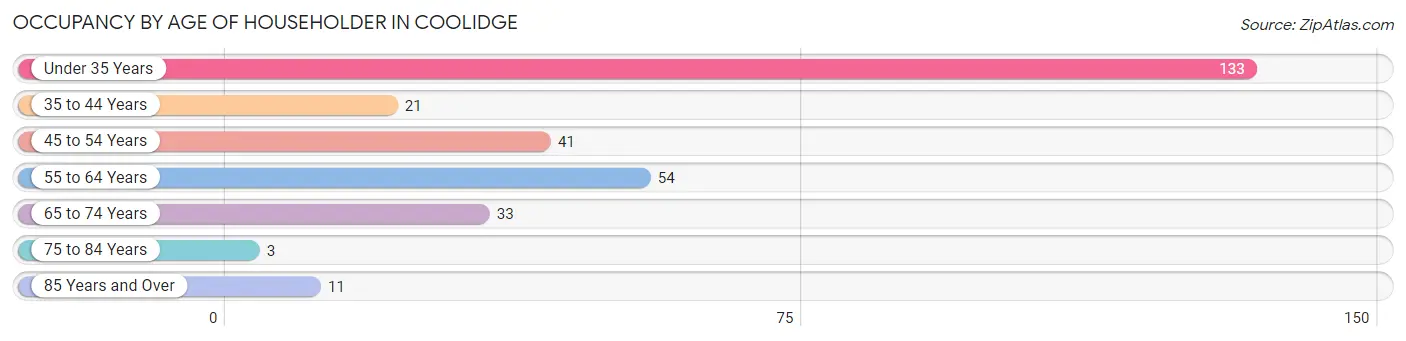
| Age Bracket | # Households | % Households |
| Under 35 Years | 133 | 44.9% |
| 35 to 44 Years | 21 | 7.1% |
| 45 to 54 Years | 41 | 13.9% |
| 55 to 64 Years | 54 | 18.2% |
| 65 to 74 Years | 33 | 11.2% |
| 75 to 84 Years | 3 | 1.0% |
| 85 Years and Over | 11 | 3.7% |
| Total | 296 | 100.0% |
Housing Finances in Coolidge
Median Income by Occupancy in Coolidge
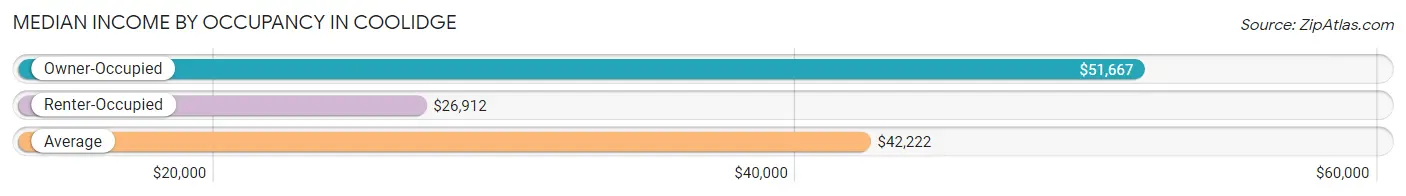
| Occupancy Type | # Households | Median Income |
| Owner-Occupied | 184 (62.2%) | $51,667 |
| Renter-Occupied | 112 (37.8%) | $26,912 |
| Average | 296 (100.0%) | $42,222 |
Occupancy by Householder Income Bracket in Coolidge
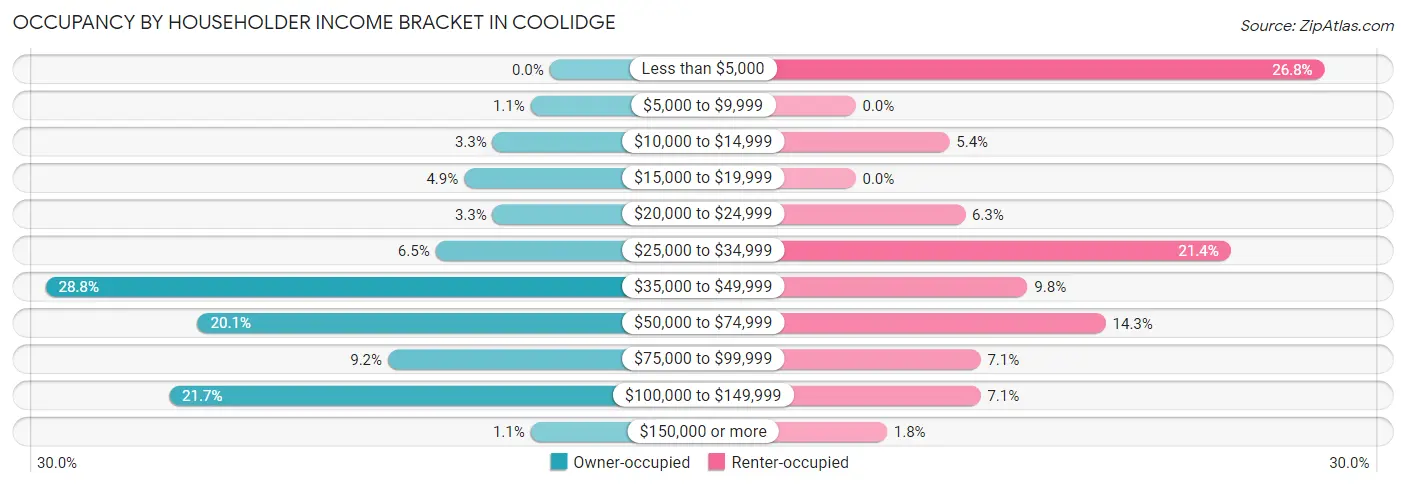
| Income Bracket | Owner-occupied | Renter-occupied |
| Less than $5,000 | 0 (0.0%) | 30 (26.8%) |
| $5,000 to $9,999 | 2 (1.1%) | 0 (0.0%) |
| $10,000 to $14,999 | 6 (3.3%) | 6 (5.4%) |
| $15,000 to $19,999 | 9 (4.9%) | 0 (0.0%) |
| $20,000 to $24,999 | 6 (3.3%) | 7 (6.2%) |
| $25,000 to $34,999 | 12 (6.5%) | 24 (21.4%) |
| $35,000 to $49,999 | 53 (28.8%) | 11 (9.8%) |
| $50,000 to $74,999 | 37 (20.1%) | 16 (14.3%) |
| $75,000 to $99,999 | 17 (9.2%) | 8 (7.1%) |
| $100,000 to $149,999 | 40 (21.7%) | 8 (7.1%) |
| $150,000 or more | 2 (1.1%) | 2 (1.8%) |
| Total | 184 (100.0%) | 112 (100.0%) |
Monthly Housing Cost Tiers in Coolidge
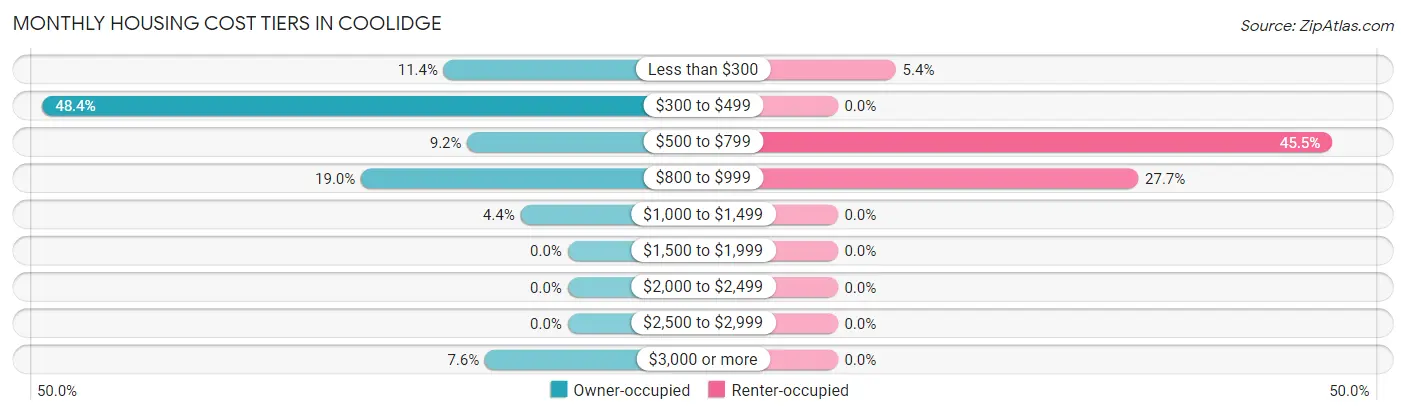
| Monthly Cost | Owner-occupied | Renter-occupied |
| Less than $300 | 21 (11.4%) | 6 (5.4%) |
| $300 to $499 | 89 (48.4%) | 0 (0.0%) |
| $500 to $799 | 17 (9.2%) | 51 (45.5%) |
| $800 to $999 | 35 (19.0%) | 31 (27.7%) |
| $1,000 to $1,499 | 8 (4.3%) | 0 (0.0%) |
| $1,500 to $1,999 | 0 (0.0%) | 0 (0.0%) |
| $2,000 to $2,499 | 0 (0.0%) | 0 (0.0%) |
| $2,500 to $2,999 | 0 (0.0%) | 0 (0.0%) |
| $3,000 or more | 14 (7.6%) | 0 (0.0%) |
| Total | 184 (100.0%) | 112 (100.0%) |
Physical Housing Characteristics in Coolidge
Housing Structures in Coolidge
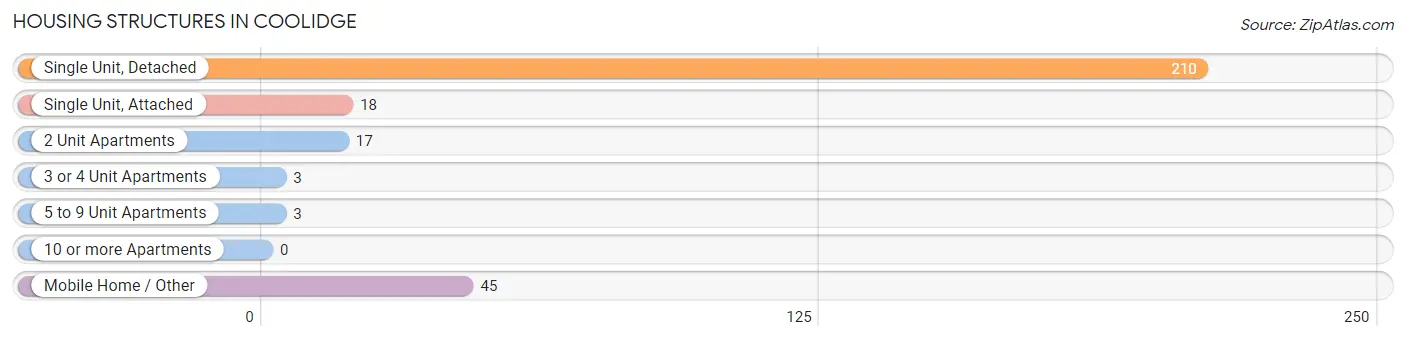
| Structure Type | # Housing Units | % Housing Units |
| Single Unit, Detached | 210 | 71.0% |
| Single Unit, Attached | 18 | 6.1% |
| 2 Unit Apartments | 17 | 5.7% |
| 3 or 4 Unit Apartments | 3 | 1.0% |
| 5 to 9 Unit Apartments | 3 | 1.0% |
| 10 or more Apartments | 0 | 0.0% |
| Mobile Home / Other | 45 | 15.2% |
| Total | 296 | 100.0% |
Housing Structures by Occupancy in Coolidge
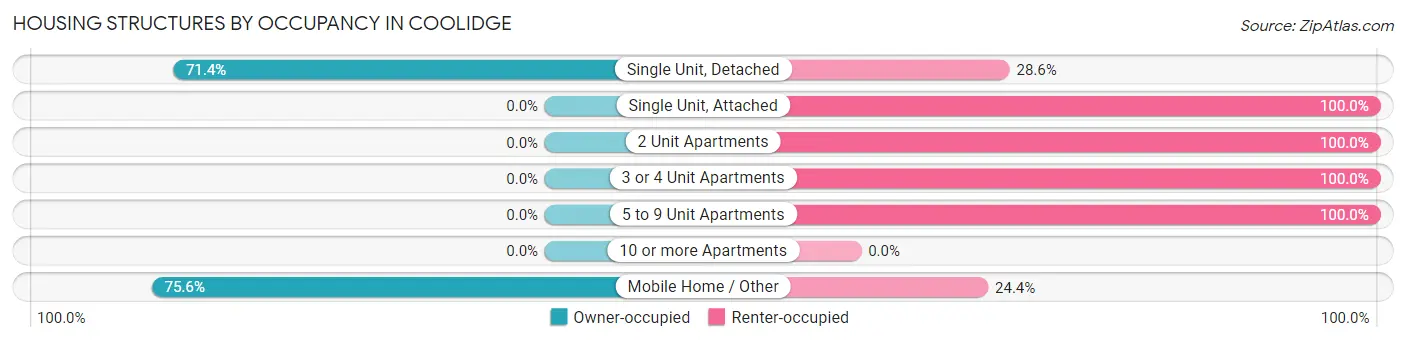
| Structure Type | Owner-occupied | Renter-occupied |
| Single Unit, Detached | 150 (71.4%) | 60 (28.6%) |
| Single Unit, Attached | 0 (0.0%) | 18 (100.0%) |
| 2 Unit Apartments | 0 (0.0%) | 17 (100.0%) |
| 3 or 4 Unit Apartments | 0 (0.0%) | 3 (100.0%) |
| 5 to 9 Unit Apartments | 0 (0.0%) | 3 (100.0%) |
| 10 or more Apartments | 0 (0.0%) | 0 (0.0%) |
| Mobile Home / Other | 34 (75.6%) | 11 (24.4%) |
| Total | 184 (62.2%) | 112 (37.8%) |
Housing Structures by Number of Rooms in Coolidge
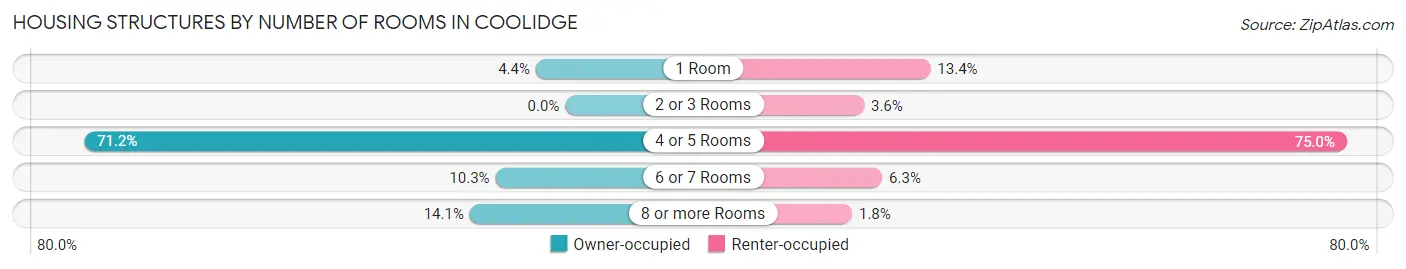
| Number of Rooms | Owner-occupied | Renter-occupied |
| 1 Room | 8 (4.3%) | 15 (13.4%) |
| 2 or 3 Rooms | 0 (0.0%) | 4 (3.6%) |
| 4 or 5 Rooms | 131 (71.2%) | 84 (75.0%) |
| 6 or 7 Rooms | 19 (10.3%) | 7 (6.2%) |
| 8 or more Rooms | 26 (14.1%) | 2 (1.8%) |
| Total | 184 (100.0%) | 112 (100.0%) |
Housing Structure by Heating Type in Coolidge
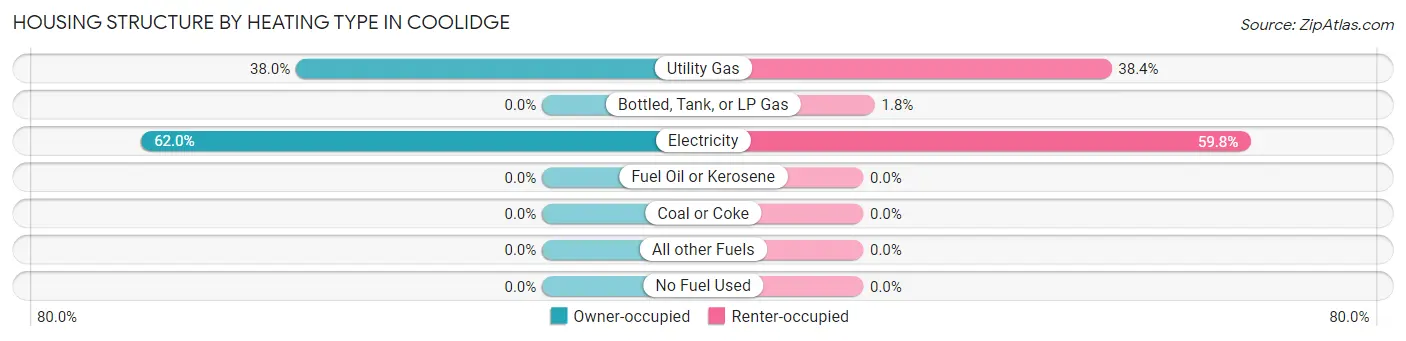
| Heating Type | Owner-occupied | Renter-occupied |
| Utility Gas | 70 (38.0%) | 43 (38.4%) |
| Bottled, Tank, or LP Gas | 0 (0.0%) | 2 (1.8%) |
| Electricity | 114 (62.0%) | 67 (59.8%) |
| Fuel Oil or Kerosene | 0 (0.0%) | 0 (0.0%) |
| Coal or Coke | 0 (0.0%) | 0 (0.0%) |
| All other Fuels | 0 (0.0%) | 0 (0.0%) |
| No Fuel Used | 0 (0.0%) | 0 (0.0%) |
| Total | 184 (100.0%) | 112 (100.0%) |
Household Vehicle Usage in Coolidge
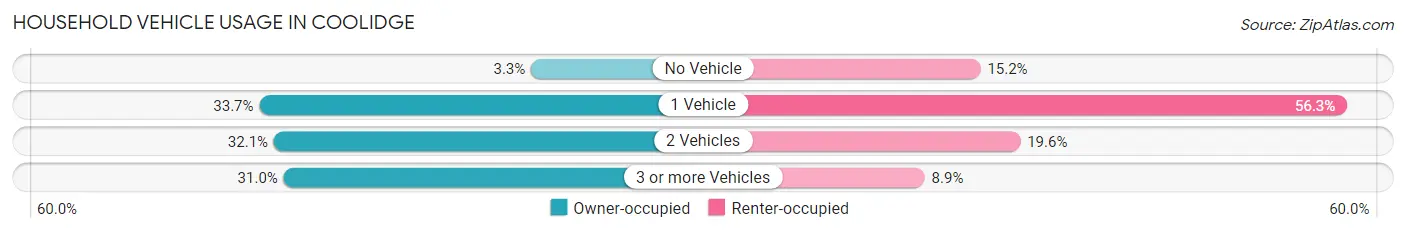
| Vehicles per Household | Owner-occupied | Renter-occupied |
| No Vehicle | 6 (3.3%) | 17 (15.2%) |
| 1 Vehicle | 62 (33.7%) | 63 (56.2%) |
| 2 Vehicles | 59 (32.1%) | 22 (19.6%) |
| 3 or more Vehicles | 57 (31.0%) | 10 (8.9%) |
| Total | 184 (100.0%) | 112 (100.0%) |
Real Estate & Mortgages in Coolidge
Real Estate and Mortgage Overview in Coolidge
| Characteristic | Without Mortgage | With Mortgage |
| Housing Units | 140 | 44 |
| Median Property Value | $52,900 | $0 |
| Median Household Income | $53,750 | $0 |
| Monthly Housing Costs | $396 | $14 |
| Real Estate Taxes | $882 | $0 |
Property Value by Mortgage Status in Coolidge
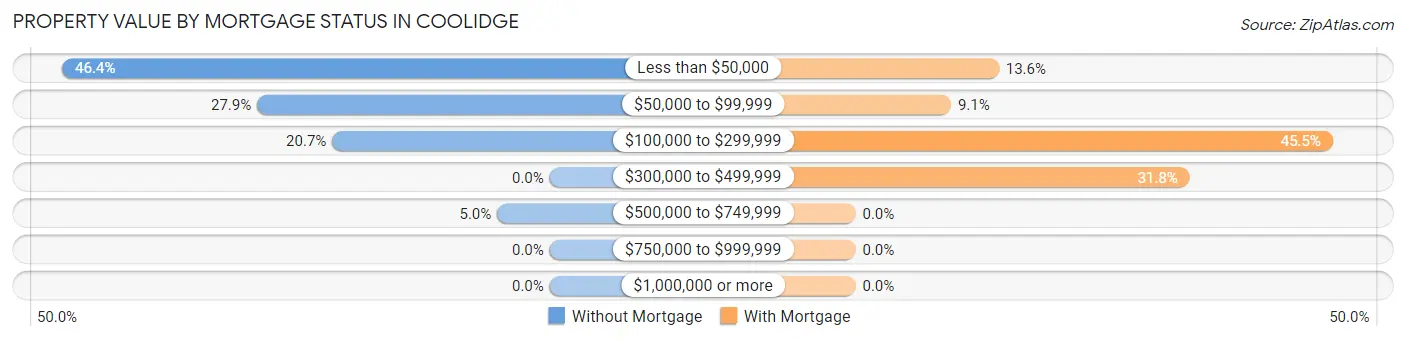
| Property Value | Without Mortgage | With Mortgage |
| Less than $50,000 | 65 (46.4%) | 6 (13.6%) |
| $50,000 to $99,999 | 39 (27.9%) | 4 (9.1%) |
| $100,000 to $299,999 | 29 (20.7%) | 20 (45.5%) |
| $300,000 to $499,999 | 0 (0.0%) | 14 (31.8%) |
| $500,000 to $749,999 | 7 (5.0%) | 0 (0.0%) |
| $750,000 to $999,999 | 0 (0.0%) | 0 (0.0%) |
| $1,000,000 or more | 0 (0.0%) | 0 (0.0%) |
| Total | 140 (100.0%) | 44 (100.0%) |
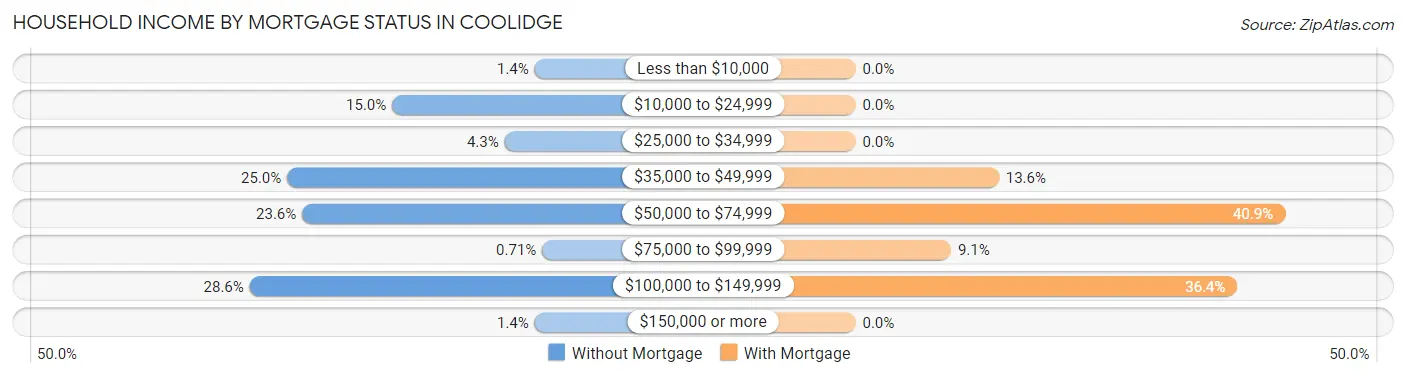
Household Income by Mortgage Status in Coolidge
| Household Income | Without Mortgage | With Mortgage |
| Less than $10,000 | 2 (1.4%) | 0 (0.0%) |
| $10,000 to $24,999 | 21 (15.0%) | 0 (0.0%) |
| $25,000 to $34,999 | 6 (4.3%) | 0 (0.0%) |
| $35,000 to $49,999 | 35 (25.0%) | 6 (13.6%) |
| $50,000 to $74,999 | 33 (23.6%) | 18 (40.9%) |
| $75,000 to $99,999 | 1 (0.7%) | 4 (9.1%) |
| $100,000 to $149,999 | 40 (28.6%) | 16 (36.4%) |
| $150,000 or more | 2 (1.4%) | 0 (0.0%) |
| Total | 140 (100.0%) | 44 (100.0%) |
Property Value to Household Income Ratio in Coolidge
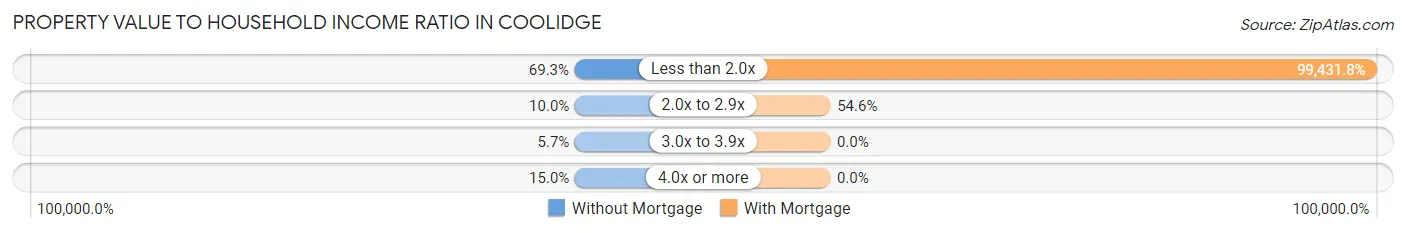
| Value-to-Income Ratio | Without Mortgage | With Mortgage |
| Less than 2.0x | 97 (69.3%) | 43,750 (99,431.8%) |
| 2.0x to 2.9x | 14 (10.0%) | 24 (54.5%) |
| 3.0x to 3.9x | 8 (5.7%) | 0 (0.0%) |
| 4.0x or more | 21 (15.0%) | 0 (0.0%) |
| Total | 140 (100.0%) | 44 (100.0%) |
Real Estate Taxes by Mortgage Status in Coolidge
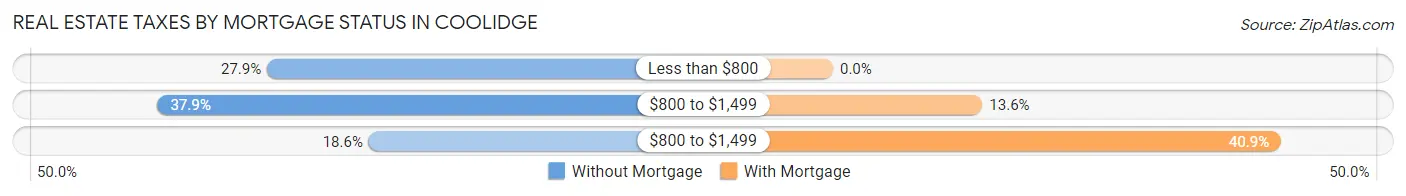
| Property Taxes | Without Mortgage | With Mortgage |
| Less than $800 | 39 (27.9%) | 0 (0.0%) |
| $800 to $1,499 | 53 (37.9%) | 6 (13.6%) |
| $800 to $1,499 | 26 (18.6%) | 18 (40.9%) |
| Total | 140 (100.0%) | 44 (100.0%) |
Health & Disability in Coolidge
Health Insurance Coverage by Age in Coolidge
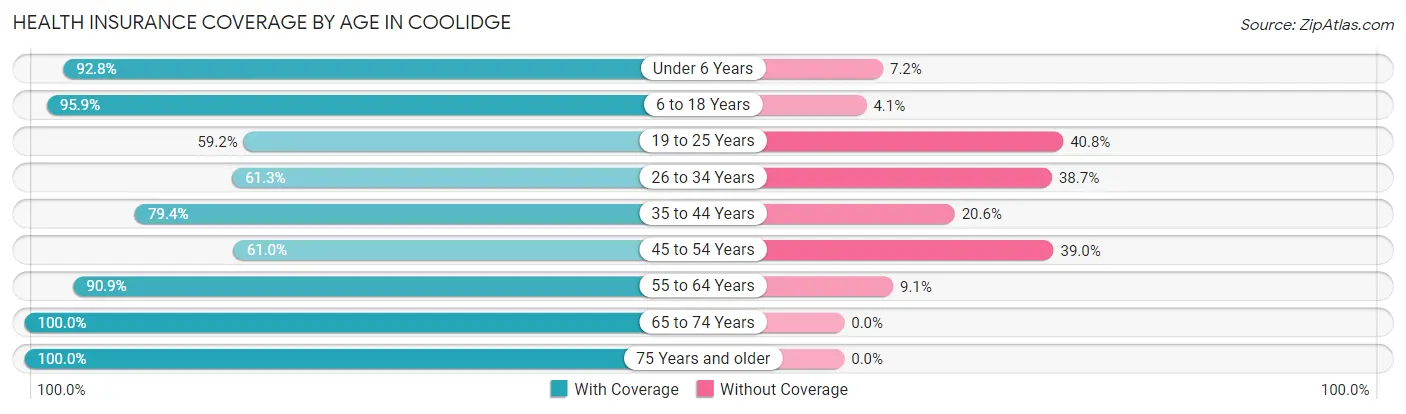
| Age Bracket | With Coverage | Without Coverage |
| Under 6 Years | 167 (92.8%) | 13 (7.2%) |
| 6 to 18 Years | 139 (95.9%) | 6 (4.1%) |
| 19 to 25 Years | 58 (59.2%) | 40 (40.8%) |
| 26 to 34 Years | 106 (61.3%) | 67 (38.7%) |
| 35 to 44 Years | 27 (79.4%) | 7 (20.6%) |
| 45 to 54 Years | 50 (61.0%) | 32 (39.0%) |
| 55 to 64 Years | 50 (90.9%) | 5 (9.1%) |
| 65 to 74 Years | 52 (100.0%) | 0 (0.0%) |
| 75 Years and older | 31 (100.0%) | 0 (0.0%) |
| Total | 680 (80.0%) | 170 (20.0%) |
Health Insurance Coverage by Citizenship Status in Coolidge
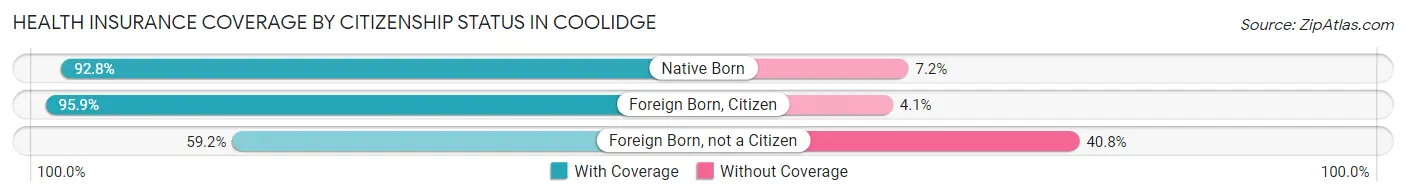
| Citizenship Status | With Coverage | Without Coverage |
| Native Born | 167 (92.8%) | 13 (7.2%) |
| Foreign Born, Citizen | 139 (95.9%) | 6 (4.1%) |
| Foreign Born, not a Citizen | 58 (59.2%) | 40 (40.8%) |
Health Insurance Coverage by Household Income in Coolidge
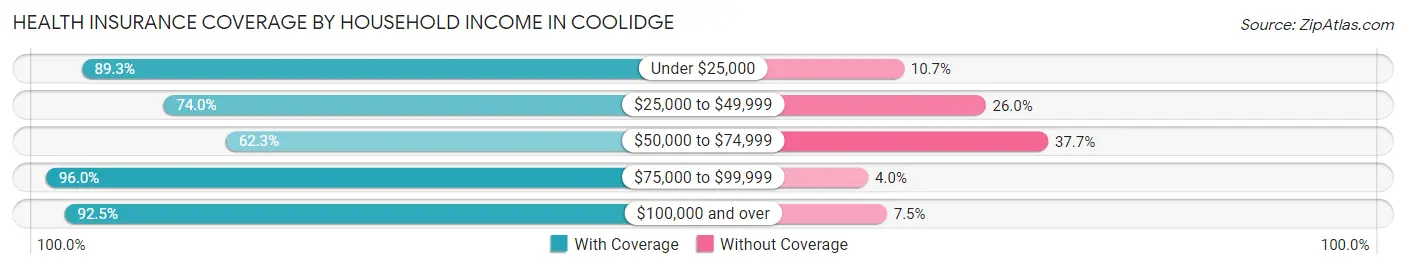
| Household Income | With Coverage | Without Coverage |
| Under $25,000 | 92 (89.3%) | 11 (10.7%) |
| $25,000 to $49,999 | 205 (74.0%) | 72 (26.0%) |
| $50,000 to $74,999 | 114 (62.3%) | 69 (37.7%) |
| $75,000 to $99,999 | 96 (96.0%) | 4 (4.0%) |
| $100,000 and over | 173 (92.5%) | 14 (7.5%) |
Public vs Private Health Insurance Coverage by Age in Coolidge
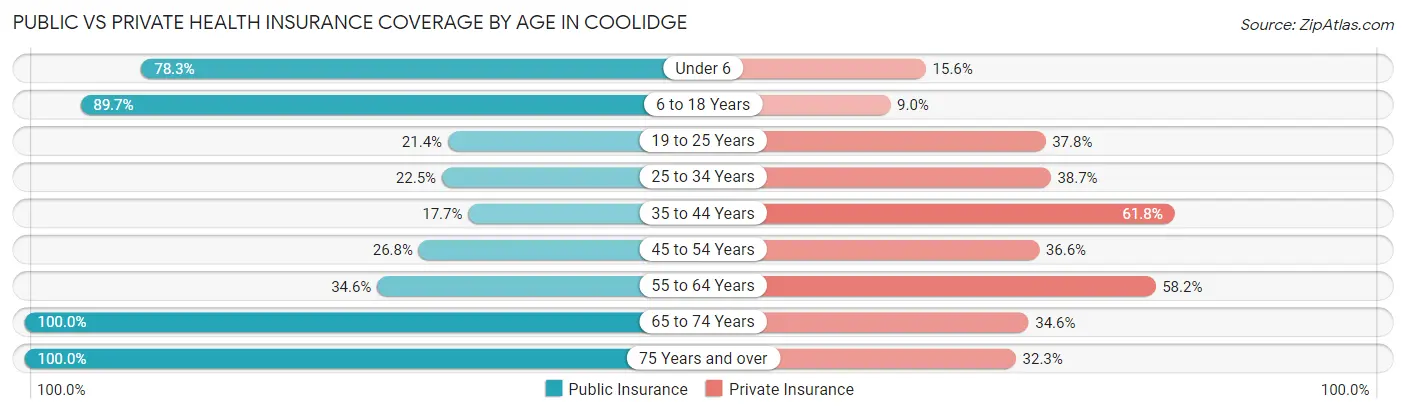
| Age Bracket | Public Insurance | Private Insurance |
| Under 6 | 141 (78.3%) | 28 (15.6%) |
| 6 to 18 Years | 130 (89.7%) | 13 (9.0%) |
| 19 to 25 Years | 21 (21.4%) | 37 (37.8%) |
| 25 to 34 Years | 39 (22.5%) | 67 (38.7%) |
| 35 to 44 Years | 6 (17.6%) | 21 (61.8%) |
| 45 to 54 Years | 22 (26.8%) | 30 (36.6%) |
| 55 to 64 Years | 19 (34.5%) | 32 (58.2%) |
| 65 to 74 Years | 52 (100.0%) | 18 (34.6%) |
| 75 Years and over | 31 (100.0%) | 10 (32.3%) |
| Total | 461 (54.2%) | 256 (30.1%) |
Disability Status by Sex by Age in Coolidge
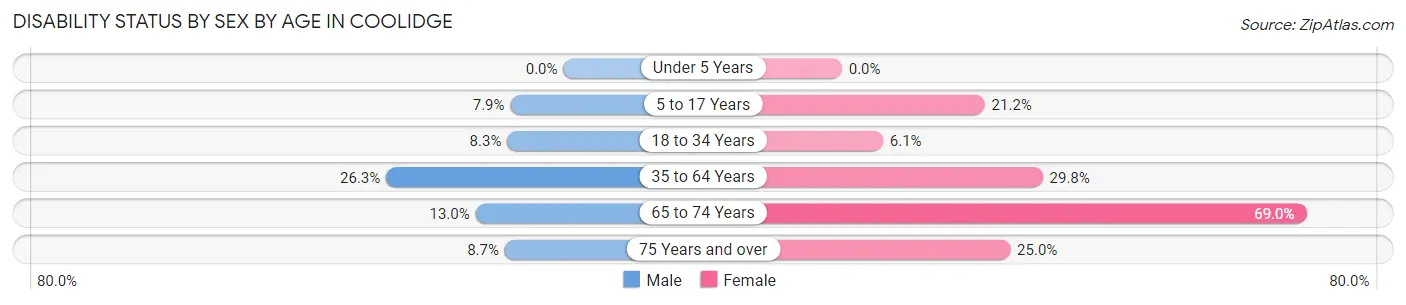
| Age Bracket | Male | Female |
| Under 5 Years | 0 (0.0%) | 0 (0.0%) |
| 5 to 17 Years | 7 (7.9%) | 14 (21.2%) |
| 18 to 34 Years | 10 (8.3%) | 10 (6.1%) |
| 35 to 64 Years | 30 (26.3%) | 17 (29.8%) |
| 65 to 74 Years | 3 (13.0%) | 20 (69.0%) |
| 75 Years and over | 2 (8.7%) | 2 (25.0%) |
Disability Class by Sex by Age in Coolidge
Disability Class: Hearing Difficulty
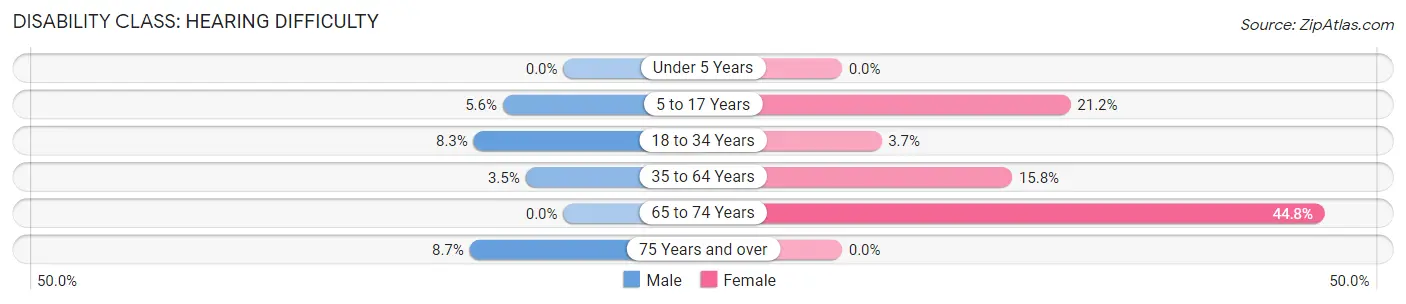
| Age Bracket | Male | Female |
| Under 5 Years | 0 (0.0%) | 0 (0.0%) |
| 5 to 17 Years | 5 (5.6%) | 14 (21.2%) |
| 18 to 34 Years | 10 (8.3%) | 6 (3.7%) |
| 35 to 64 Years | 4 (3.5%) | 9 (15.8%) |
| 65 to 74 Years | 0 (0.0%) | 13 (44.8%) |
| 75 Years and over | 2 (8.7%) | 0 (0.0%) |
Disability Class: Vision Difficulty
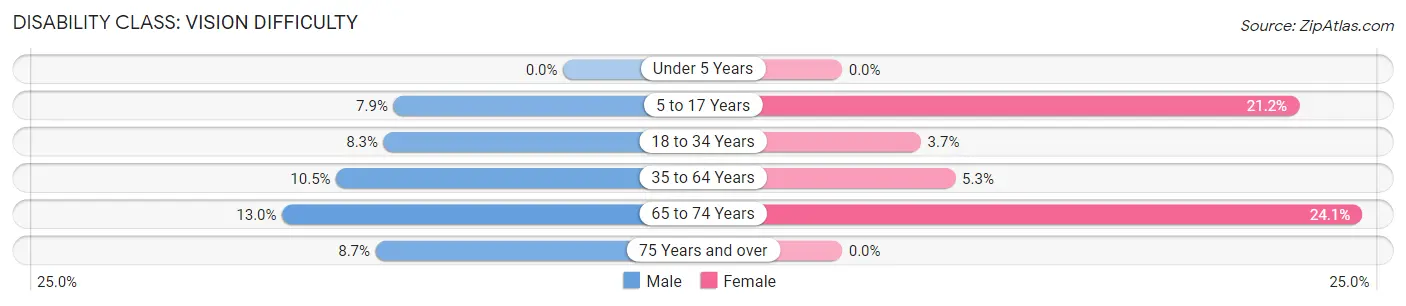
| Age Bracket | Male | Female |
| Under 5 Years | 0 (0.0%) | 0 (0.0%) |
| 5 to 17 Years | 7 (7.9%) | 14 (21.2%) |
| 18 to 34 Years | 10 (8.3%) | 6 (3.7%) |
| 35 to 64 Years | 12 (10.5%) | 3 (5.3%) |
| 65 to 74 Years | 3 (13.0%) | 7 (24.1%) |
| 75 Years and over | 2 (8.7%) | 0 (0.0%) |
Disability Class: Cognitive Difficulty
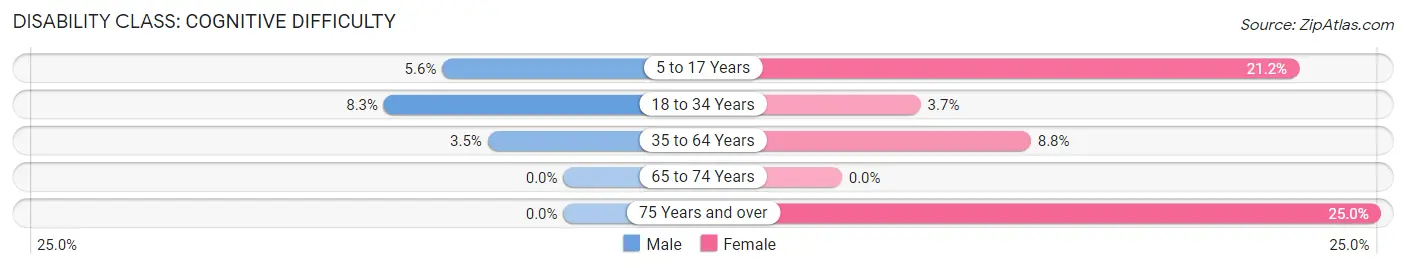
| Age Bracket | Male | Female |
| 5 to 17 Years | 5 (5.6%) | 14 (21.2%) |
| 18 to 34 Years | 10 (8.3%) | 6 (3.7%) |
| 35 to 64 Years | 4 (3.5%) | 5 (8.8%) |
| 65 to 74 Years | 0 (0.0%) | 0 (0.0%) |
| 75 Years and over | 0 (0.0%) | 2 (25.0%) |
Disability Class: Ambulatory Difficulty
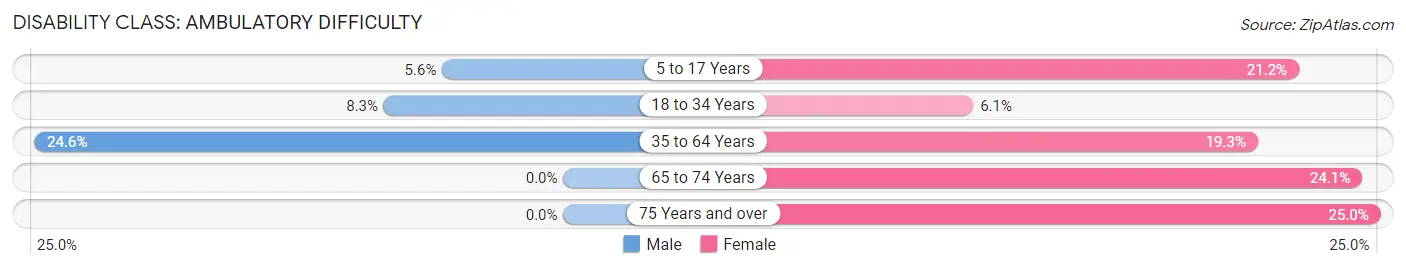
| Age Bracket | Male | Female |
| 5 to 17 Years | 5 (5.6%) | 14 (21.2%) |
| 18 to 34 Years | 10 (8.3%) | 10 (6.1%) |
| 35 to 64 Years | 28 (24.6%) | 11 (19.3%) |
| 65 to 74 Years | 0 (0.0%) | 7 (24.1%) |
| 75 Years and over | 0 (0.0%) | 2 (25.0%) |
Disability Class: Self-Care Difficulty
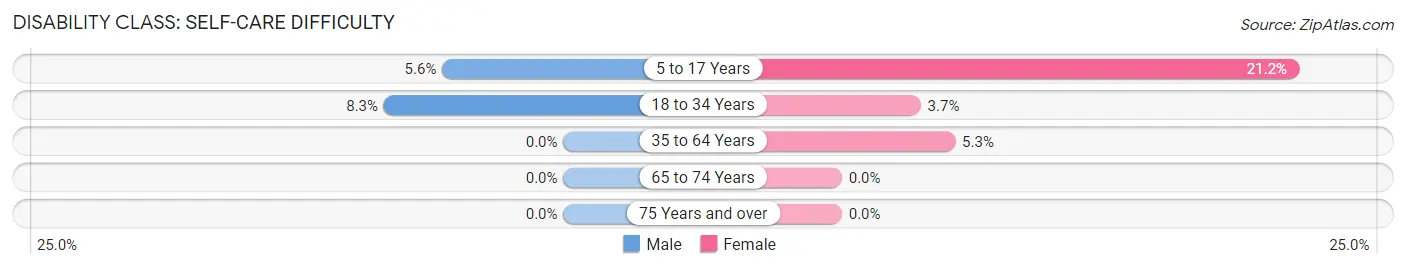
| Age Bracket | Male | Female |
| 5 to 17 Years | 5 (5.6%) | 14 (21.2%) |
| 18 to 34 Years | 10 (8.3%) | 6 (3.7%) |
| 35 to 64 Years | 0 (0.0%) | 3 (5.3%) |
| 65 to 74 Years | 0 (0.0%) | 0 (0.0%) |
| 75 Years and over | 0 (0.0%) | 0 (0.0%) |
Technology Access in Coolidge
Computing Device Access in Coolidge
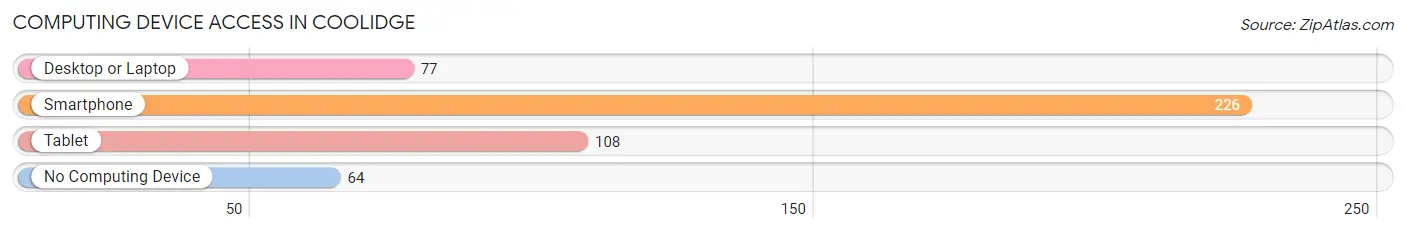
| Device Type | # Households | % Households |
| Desktop or Laptop | 77 | 26.0% |
| Smartphone | 226 | 76.3% |
| Tablet | 108 | 36.5% |
| No Computing Device | 64 | 21.6% |
| Total | 296 | 100.0% |
Internet Access in Coolidge
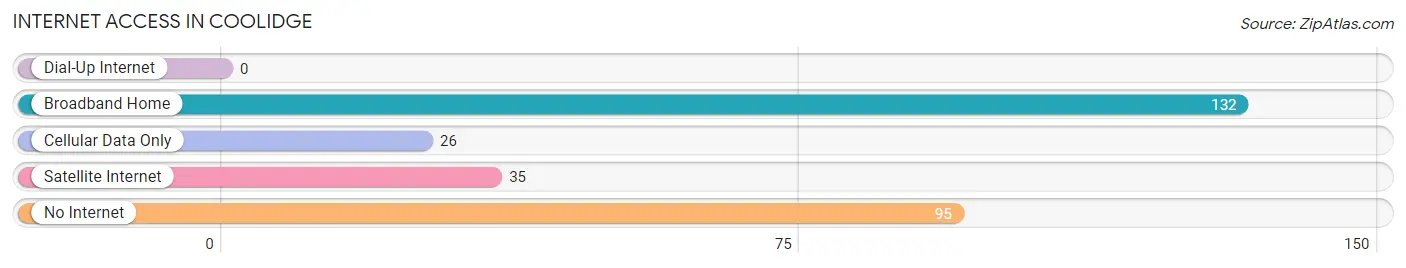
| Internet Type | # Households | % Households |
| Dial-Up Internet | 0 | 0.0% |
| Broadband Home | 132 | 44.6% |
| Cellular Data Only | 26 | 8.8% |
| Satellite Internet | 35 | 11.8% |
| No Internet | 95 | 32.1% |
| Total | 296 | 100.0% |
Coolidge Summary
History
The small town of Coolidge, Texas is located in Limestone County, about an hour and a half south of Dallas. The town was founded in 1881 by a group of settlers from Tennessee, led by William Coolidge. The town was named after him, and the first post office was established in 1882.
The town grew slowly, but steadily, and by the early 1900s, it had become a thriving agricultural community. Cotton was the main crop, and the town was home to several cotton gins. The town also had a few stores, a bank, and a hotel.
In the 1920s, the town began to experience a period of growth and prosperity. The population increased, and new businesses opened. The town also had its own newspaper, the Coolidge Courier.
In the 1940s, the town experienced a decline in population as many of its residents moved away to find work in larger cities. However, the town remained a small, rural community.
Geography
Coolidge is located in Limestone County, Texas, about an hour and a half south of Dallas. The town is situated on the banks of the Navasota River, and is surrounded by rolling hills and farmland. The climate is generally mild, with hot summers and cool winters.
The town covers an area of 1.2 square miles, and has a population of around 500 people. The town is served by two highways, US Highway 84 and State Highway 14.
Economy
The economy of Coolidge is largely based on agriculture. Cotton is the main crop, and the town is home to several cotton gins. Other crops grown in the area include corn, soybeans, and wheat.
The town also has a few small businesses, including a grocery store, a hardware store, and a few restaurants. There is also a bank and a post office.
Demographics
As of the 2010 census, the population of Coolidge was 498 people. The racial makeup of the town was 97.2% White, 0.6% African American, 0.2% Native American, 0.2% Asian, 0.2% from other races, and 1.8% from two or more races. Hispanic or Latino of any race were 1.2% of the population.
The median household income in Coolidge was $31,250, and the median family income was $37,500. The per capita income was $15,945. About 16.2% of families and 19.2% of the population were below the poverty line, including 25.2% of those under age 18 and 10.2% of those age 65 or over.
Common Questions
What is Per Capita Income in Coolidge?
Per Capita income in Coolidge is $20,755.
What is the Median Family Income in Coolidge?
Median Family Income in Coolidge is $56,250.
What is the Median Household income in Coolidge?
Median Household Income in Coolidge is $42,222.
What is Income or Wage Gap in Coolidge?
Income or Wage Gap in Coolidge is 47.0%.
Women in Coolidge earn 53.0 cents for every dollar earned by a man.
What is Family Income Deficit in Coolidge?
Family Income Deficit in Coolidge is $10,595.
Families that are below poverty line in Coolidge earn $10,595 less on average than the poverty threshold level.
What is Inequality or Gini Index in Coolidge?
Inequality or Gini Index in Coolidge is 0.47.
What is the Total Population of Coolidge?
Total Population of Coolidge is 850.
What is the Total Male Population of Coolidge?
Total Male Population of Coolidge is 443.
What is the Total Female Population of Coolidge?
Total Female Population of Coolidge is 407.
What is the Ratio of Males per 100 Females in Coolidge?
There are 108.85 Males per 100 Females in Coolidge.
What is the Ratio of Females per 100 Males in Coolidge?
There are 91.87 Females per 100 Males in Coolidge.
What is the Median Population Age in Coolidge?
Median Population Age in Coolidge is 27.1 Years.
What is the Average Family Size in Coolidge
Average Family Size in Coolidge is 3.6 People.
What is the Average Household Size in Coolidge
Average Household Size in Coolidge is 2.9 People.
How Large is the Labor Force in Coolidge?
There are 320 People in the Labor Forcein in Coolidge.
What is the Percentage of People in the Labor Force in Coolidge?
57.6% of People are in the Labor Force in Coolidge.
What is the Unemployment Rate in Coolidge?
Unemployment Rate in Coolidge is 1.3%.