Combine, TX Map & Demographics
Combine Map
Combine Overview
$36,374
PER CAPITA INCOME
$96,382
AVG FAMILY INCOME
$90,313
AVG HOUSEHOLD INCOME
42.2%
WAGE / INCOME GAP [ % ]
57.8¢/ $1
WAGE / INCOME GAP [ $ ]
0.36
INEQUALITY / GINI INDEX
2,609
TOTAL POPULATION
1,284
MALE POPULATION
1,325
FEMALE POPULATION
96.91
MALES / 100 FEMALES
103.19
FEMALES / 100 MALES
42.2
MEDIAN AGE
3.4
AVG FAMILY SIZE
3.1
AVG HOUSEHOLD SIZE
1,349
LABOR FORCE [ PEOPLE ]
65.5%
PERCENT IN LABOR FORCE
6.3%
UNEMPLOYMENT RATE
Income in Combine
Income Overview in Combine
Per Capita Income in Combine is $36,374, while median incomes of families and households are $96,382 and $90,313 respectively.
| Characteristic | Number | Measure |
| Per Capita Income | 2,609 | $36,374 |
| Median Family Income | 711 | $96,382 |
| Mean Family Income | 711 | $121,227 |
| Median Household Income | 824 | $90,313 |
| Mean Household Income | 824 | $112,342 |
| Income Deficit | 711 | $0 |
| Wage / Income Gap (%) | 2,609 | 42.19% |
| Wage / Income Gap ($) | 2,609 | 57.81¢ per $1 |
| Gini / Inequality Index | 2,609 | 0.36 |
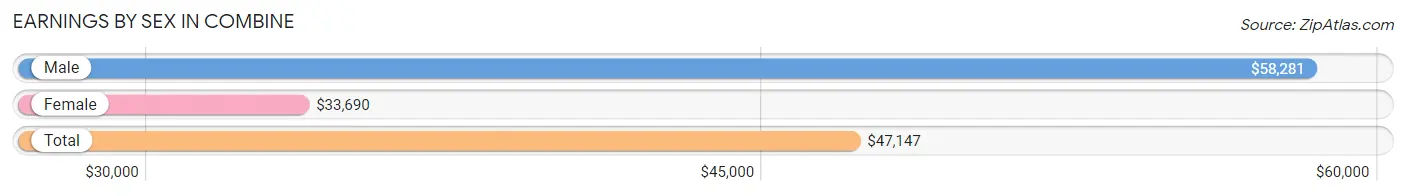
Earnings by Sex in Combine
Average Earnings in Combine are $47,147, $58,281 for men and $33,690 for women, a difference of 42.2%.
| Sex | Number | Average Earnings |
| Male | 769 (54.9%) | $58,281 |
| Female | 632 (45.1%) | $33,690 |
| Total | 1,401 (100.0%) | $47,147 |
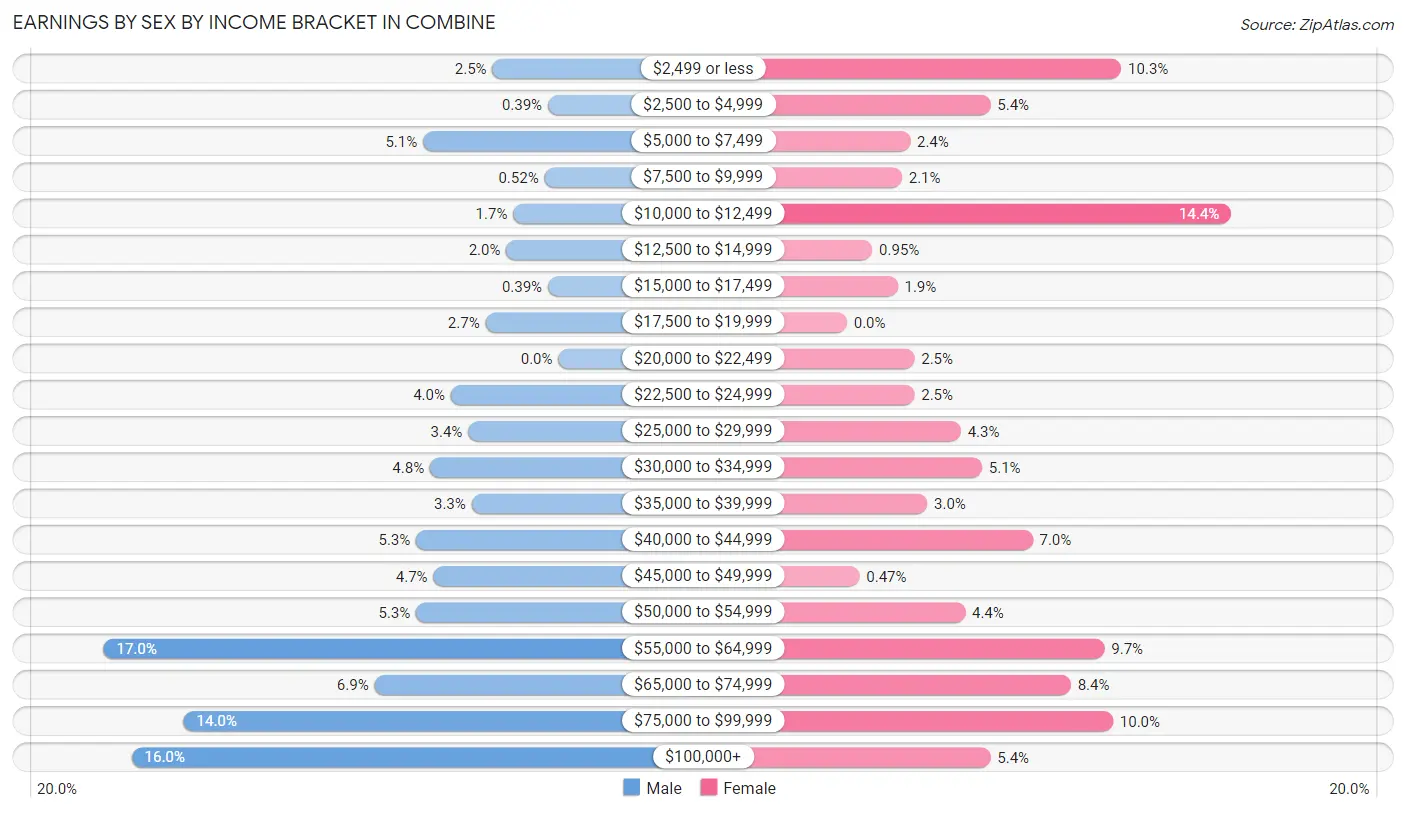
Earnings by Sex by Income Bracket in Combine
The most common earnings brackets in Combine are $55,000 to $64,999 for men (131 | 17.0%) and $10,000 to $12,499 for women (91 | 14.4%).
| Income | Male | Female |
| $2,499 or less | 19 (2.5%) | 65 (10.3%) |
| $2,500 to $4,999 | 3 (0.4%) | 34 (5.4%) |
| $5,000 to $7,499 | 39 (5.1%) | 15 (2.4%) |
| $7,500 to $9,999 | 4 (0.5%) | 13 (2.1%) |
| $10,000 to $12,499 | 13 (1.7%) | 91 (14.4%) |
| $12,500 to $14,999 | 15 (1.9%) | 6 (0.9%) |
| $15,000 to $17,499 | 3 (0.4%) | 12 (1.9%) |
| $17,500 to $19,999 | 21 (2.7%) | 0 (0.0%) |
| $20,000 to $22,499 | 0 (0.0%) | 16 (2.5%) |
| $22,500 to $24,999 | 31 (4.0%) | 16 (2.5%) |
| $25,000 to $29,999 | 26 (3.4%) | 27 (4.3%) |
| $30,000 to $34,999 | 37 (4.8%) | 32 (5.1%) |
| $35,000 to $39,999 | 25 (3.3%) | 19 (3.0%) |
| $40,000 to $44,999 | 41 (5.3%) | 44 (7.0%) |
| $45,000 to $49,999 | 36 (4.7%) | 3 (0.5%) |
| $50,000 to $54,999 | 41 (5.3%) | 28 (4.4%) |
| $55,000 to $64,999 | 131 (17.0%) | 61 (9.7%) |
| $65,000 to $74,999 | 53 (6.9%) | 53 (8.4%) |
| $75,000 to $99,999 | 108 (14.0%) | 63 (10.0%) |
| $100,000+ | 123 (16.0%) | 34 (5.4%) |
| Total | 769 (100.0%) | 632 (100.0%) |
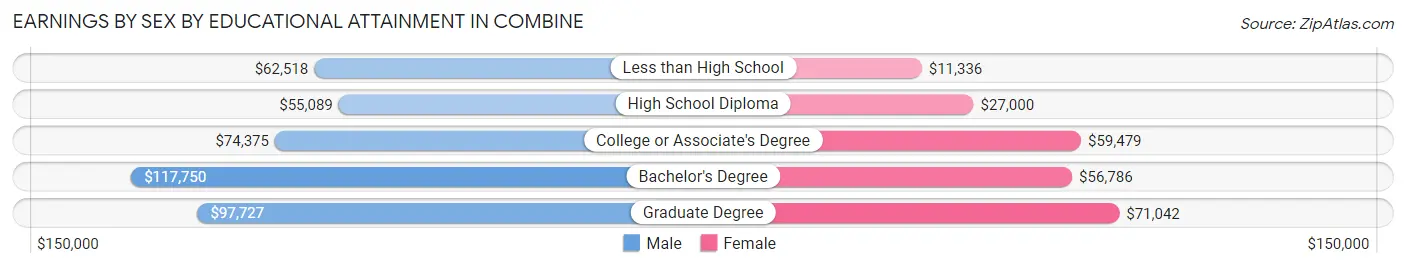
Earnings by Sex by Educational Attainment in Combine
Average earnings in Combine are $63,003 for men and $42,218 for women, a difference of 33.0%. Men with an educational attainment of bachelor's degree enjoy the highest average annual earnings of $117,750, while those with high school diploma education earn the least with $55,089. Women with an educational attainment of graduate degree earn the most with the average annual earnings of $71,042, while those with less than high school education have the smallest earnings of $11,336.
| Educational Attainment | Male Income | Female Income |
| Less than High School | $62,518 | $11,336 |
| High School Diploma | $55,089 | $27,000 |
| College or Associate's Degree | $74,375 | $59,479 |
| Bachelor's Degree | $117,750 | $56,786 |
| Graduate Degree | $97,727 | $71,042 |
| Total | $63,003 | $42,218 |
Family Income in Combine
Family Income Brackets in Combine
According to the Combine family income data, there are 154 families falling into the $75,000 to $99,999 income range, which is the most common income bracket and makes up 21.7% of all families.
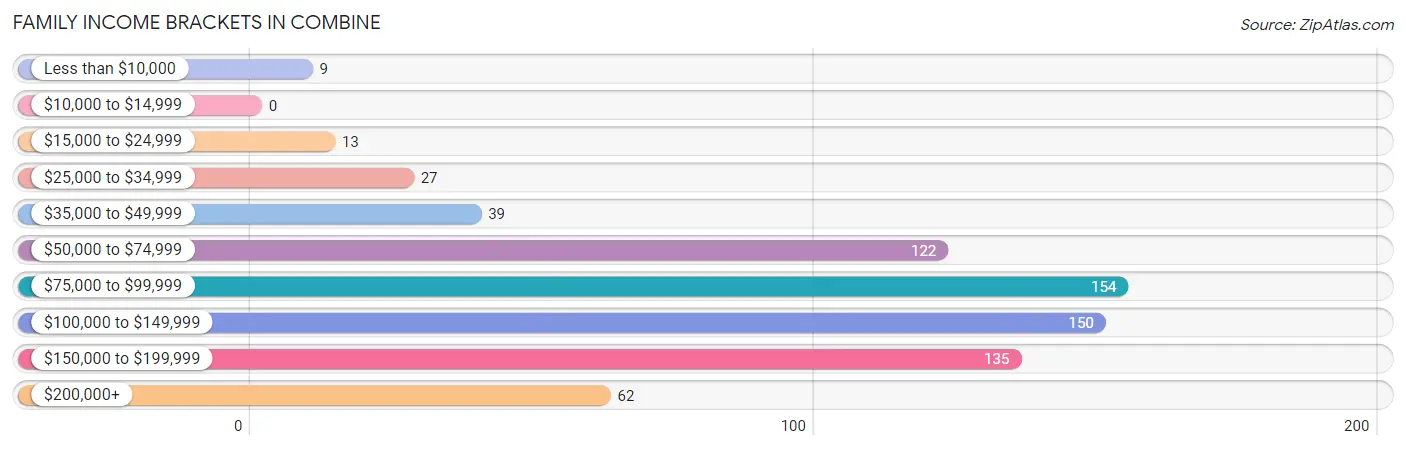
| Income Bracket | # Families | % Families |
| Less than $10,000 | 9 | 1.3% |
| $10,000 to $14,999 | 0 | 0.0% |
| $15,000 to $24,999 | 13 | 1.8% |
| $25,000 to $34,999 | 27 | 3.8% |
| $35,000 to $49,999 | 39 | 5.5% |
| $50,000 to $74,999 | 122 | 17.2% |
| $75,000 to $99,999 | 154 | 21.7% |
| $100,000 to $149,999 | 150 | 21.1% |
| $150,000 to $199,999 | 135 | 19.0% |
| $200,000+ | 62 | 8.7% |
Family Income by Famaliy Size in Combine
5-person families (44 | 6.2%) account for the highest median family income in Combine with $198,594 per family, while 2-person families (260 | 36.6%) have the highest median income of $45,938 per family member.
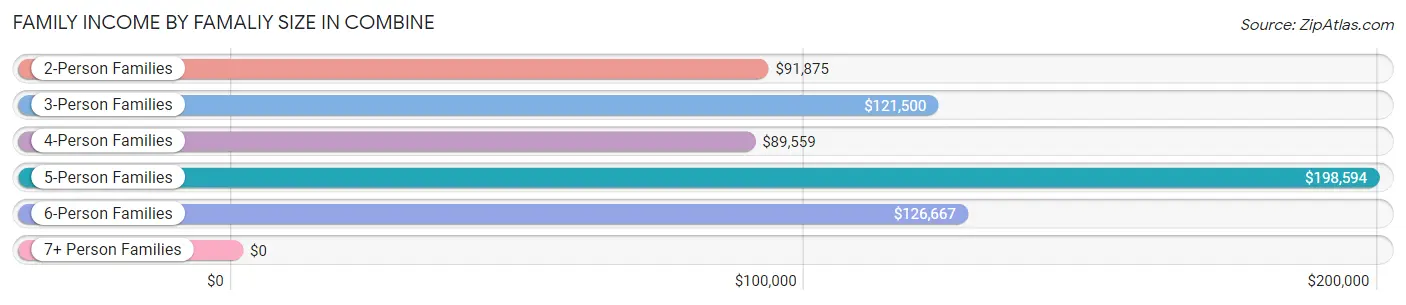
| Income Bracket | # Families | Median Income |
| 2-Person Families | 260 (36.6%) | $91,875 |
| 3-Person Families | 134 (18.9%) | $121,500 |
| 4-Person Families | 228 (32.1%) | $89,559 |
| 5-Person Families | 44 (6.2%) | $198,594 |
| 6-Person Families | 30 (4.2%) | $126,667 |
| 7+ Person Families | 15 (2.1%) | $0 |
| Total | 711 (100.0%) | $96,382 |
Family Income by Number of Earners in Combine
The median family income in Combine is $96,382, with families comprising 3+ earners (114) having the highest median family income of $187,778, while families with 1 earner (164) have the lowest median family income of $74,833, accounting for 16.0% and 23.1% of families, respectively.
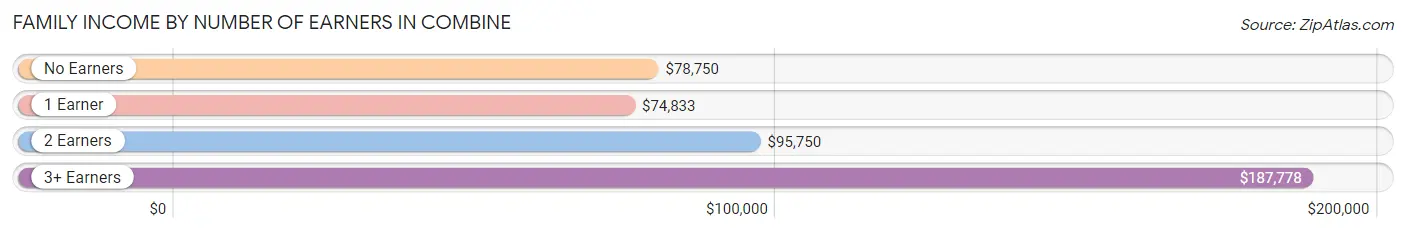
| Number of Earners | # Families | Median Income |
| No Earners | 91 (12.8%) | $78,750 |
| 1 Earner | 164 (23.1%) | $74,833 |
| 2 Earners | 342 (48.1%) | $95,750 |
| 3+ Earners | 114 (16.0%) | $187,778 |
| Total | 711 (100.0%) | $96,382 |
Household Income in Combine
Household Income Brackets in Combine
With 165 households falling in the category, the $75,000 to $99,999 income range is the most frequent in Combine, accounting for 20.0% of all households. In contrast, only 3 households (0.4%) fall into the $10,000 to $14,999 income bracket, making it the least populous group.
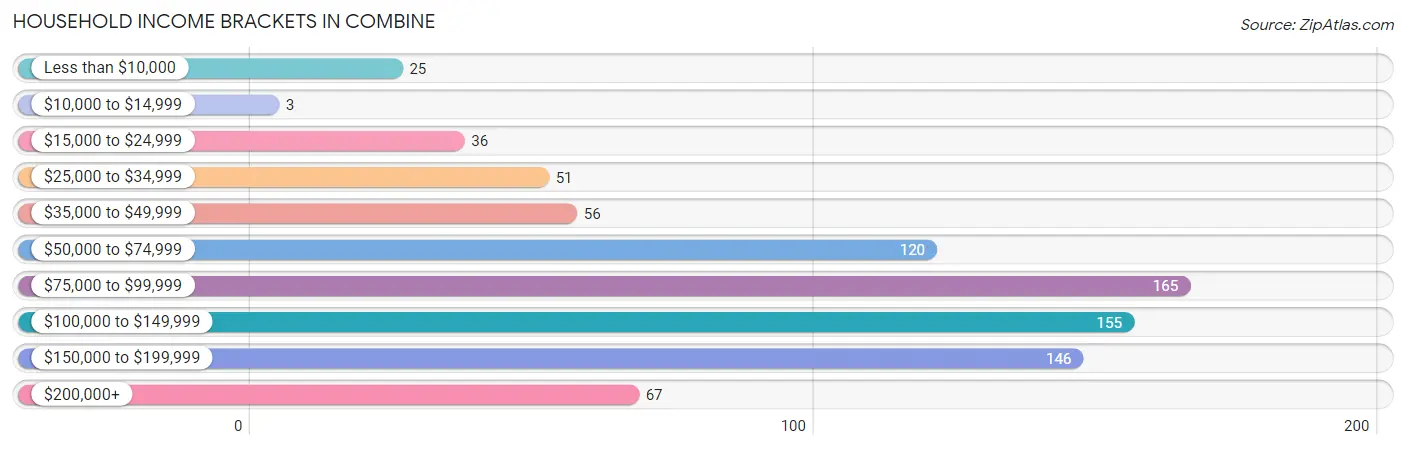
| Income Bracket | # Households | % Households |
| Less than $10,000 | 25 | 3.0% |
| $10,000 to $14,999 | 3 | 0.4% |
| $15,000 to $24,999 | 36 | 4.4% |
| $25,000 to $34,999 | 51 | 6.2% |
| $35,000 to $49,999 | 56 | 6.8% |
| $50,000 to $74,999 | 120 | 14.6% |
| $75,000 to $99,999 | 165 | 20.0% |
| $100,000 to $149,999 | 155 | 18.8% |
| $150,000 to $199,999 | 146 | 17.7% |
| $200,000+ | 67 | 8.1% |
Household Income by Householder Age in Combine
The median household income in Combine is $90,313, with the highest median household income of $112,344 found in the 45 to 64 years age bracket for the primary householder. A total of 283 households (34.3%) fall into this category.
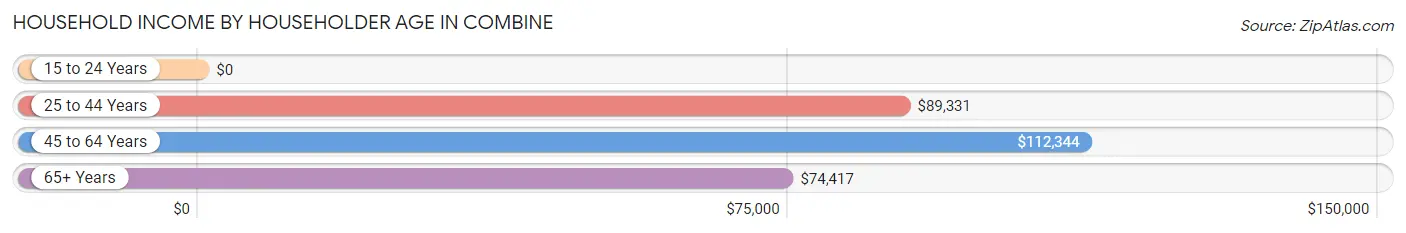
| Income Bracket | # Households | Median Income |
| 15 to 24 Years | 0 (0.0%) | $0 |
| 25 to 44 Years | 334 (40.5%) | $89,331 |
| 45 to 64 Years | 283 (34.3%) | $112,344 |
| 65+ Years | 207 (25.1%) | $74,417 |
| Total | 824 (100.0%) | $90,313 |
Poverty in Combine
Income Below Poverty by Sex and Age in Combine
With 6.3% poverty level for males and 6.9% for females among the residents of Combine, 25 to 34 year old males and 15 year old females are the most vulnerable to poverty, with 18 males (22.0%) and 11 females (27.5%) in their respective age groups living below the poverty level.
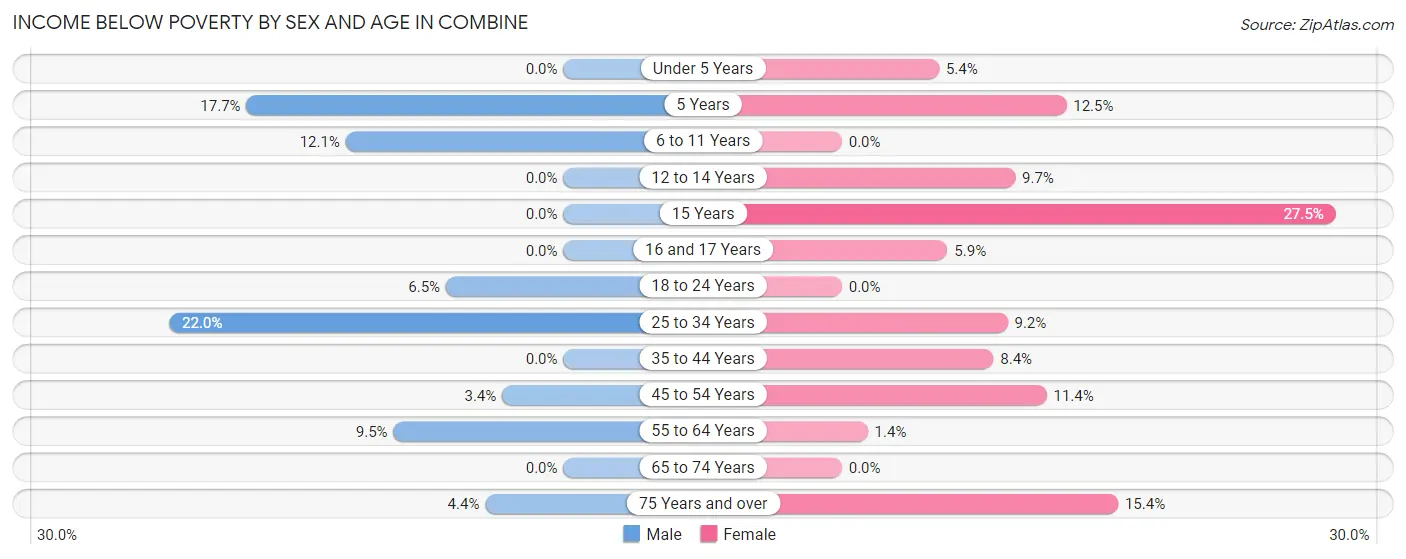
| Age Bracket | Male | Female |
| Under 5 Years | 0 (0.0%) | 2 (5.4%) |
| 5 Years | 12 (17.6%) | 2 (12.5%) |
| 6 to 11 Years | 20 (12.1%) | 0 (0.0%) |
| 12 to 14 Years | 0 (0.0%) | 11 (9.7%) |
| 15 Years | 0 (0.0%) | 11 (27.5%) |
| 16 and 17 Years | 0 (0.0%) | 3 (5.9%) |
| 18 to 24 Years | 7 (6.5%) | 0 (0.0%) |
| 25 to 34 Years | 18 (22.0%) | 6 (9.2%) |
| 35 to 44 Years | 0 (0.0%) | 20 (8.4%) |
| 45 to 54 Years | 7 (3.4%) | 26 (11.4%) |
| 55 to 64 Years | 14 (9.5%) | 2 (1.4%) |
| 65 to 74 Years | 0 (0.0%) | 0 (0.0%) |
| 75 Years and over | 3 (4.3%) | 8 (15.4%) |
| Total | 81 (6.3%) | 91 (6.9%) |
Income Above Poverty by Sex and Age in Combine
According to the poverty statistics in Combine, males aged under 5 years and females aged 6 to 11 years are the age groups that are most secure financially, with 100.0% of males and 100.0% of females in these age groups living above the poverty line.
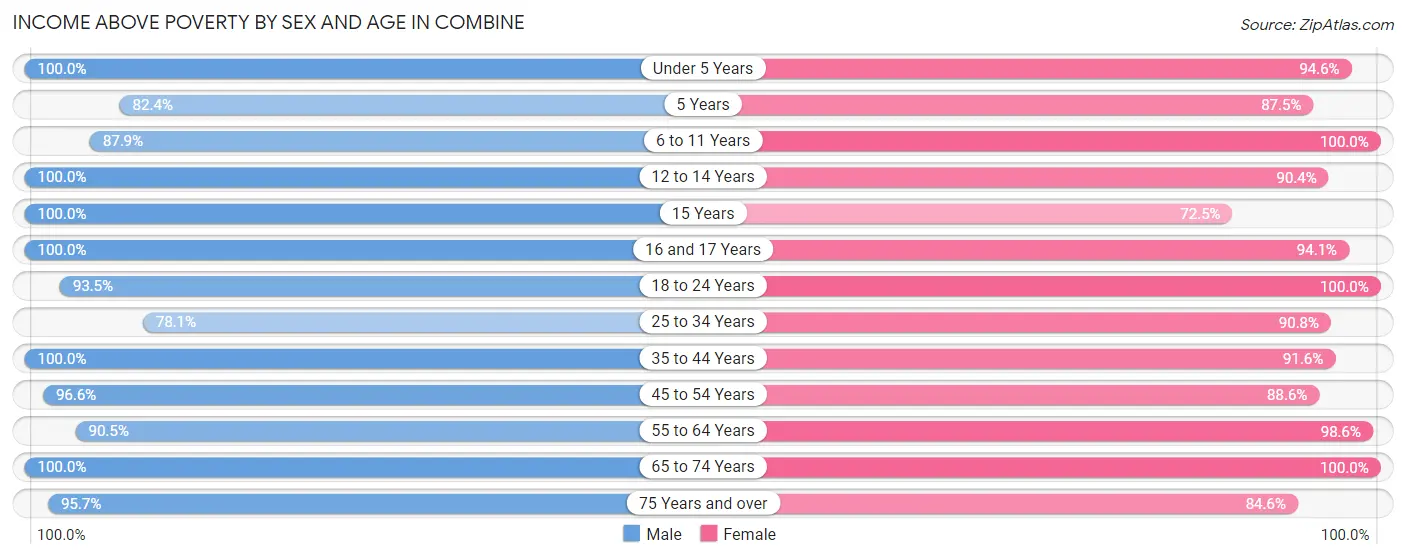
| Age Bracket | Male | Female |
| Under 5 Years | 24 (100.0%) | 35 (94.6%) |
| 5 Years | 56 (82.4%) | 14 (87.5%) |
| 6 to 11 Years | 145 (87.9%) | 65 (100.0%) |
| 12 to 14 Years | 13 (100.0%) | 103 (90.3%) |
| 15 Years | 5 (100.0%) | 29 (72.5%) |
| 16 and 17 Years | 13 (100.0%) | 48 (94.1%) |
| 18 to 24 Years | 100 (93.5%) | 126 (100.0%) |
| 25 to 34 Years | 64 (78.0%) | 59 (90.8%) |
| 35 to 44 Years | 252 (100.0%) | 217 (91.6%) |
| 45 to 54 Years | 198 (96.6%) | 202 (88.6%) |
| 55 to 64 Years | 134 (90.5%) | 137 (98.6%) |
| 65 to 74 Years | 133 (100.0%) | 152 (100.0%) |
| 75 Years and over | 66 (95.7%) | 44 (84.6%) |
| Total | 1,203 (93.7%) | 1,231 (93.1%) |
Income Below Poverty Among Married-Couple Families in Combine
The poverty statistics for married-couple families in Combine show that 1.7% or 10 of the total 599 families live below the poverty line. Families with 3 or 4 children have the highest poverty rate of 26.3%, comprising of 5 families. On the other hand, families with 1 or 2 children have the lowest poverty rate of 0.7%, which includes 2 families.
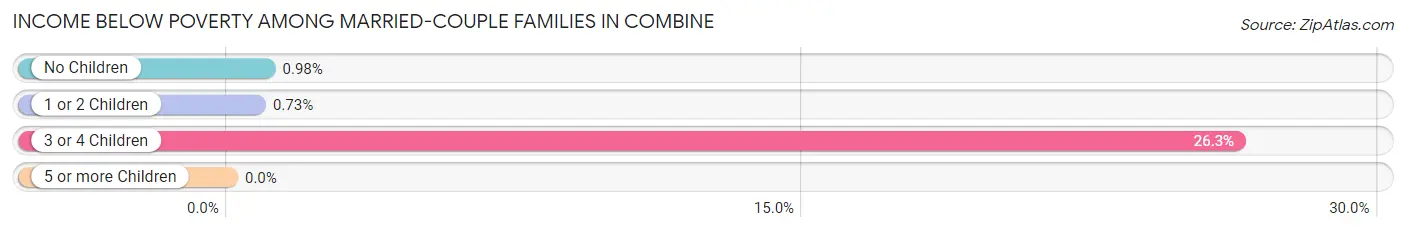
| Children | Above Poverty | Below Poverty |
| No Children | 303 (99.0%) | 3 (1.0%) |
| 1 or 2 Children | 272 (99.3%) | 2 (0.7%) |
| 3 or 4 Children | 14 (73.7%) | 5 (26.3%) |
| 5 or more Children | 0 (0.0%) | 0 (0.0%) |
| Total | 589 (98.3%) | 10 (1.7%) |
Income Below Poverty Among Single-Parent Households in Combine
According to the poverty data in Combine, 22.0% or 13 single-father households and 17.0% or 9 single-mother households are living below the poverty line. Among single-father households, those with 3 or 4 children have the highest poverty rate, with 10 households (100.0%) experiencing poverty. Likewise, among single-mother households, those with 1 or 2 children have the highest poverty rate, with 9 households (28.1%) falling below the poverty line.
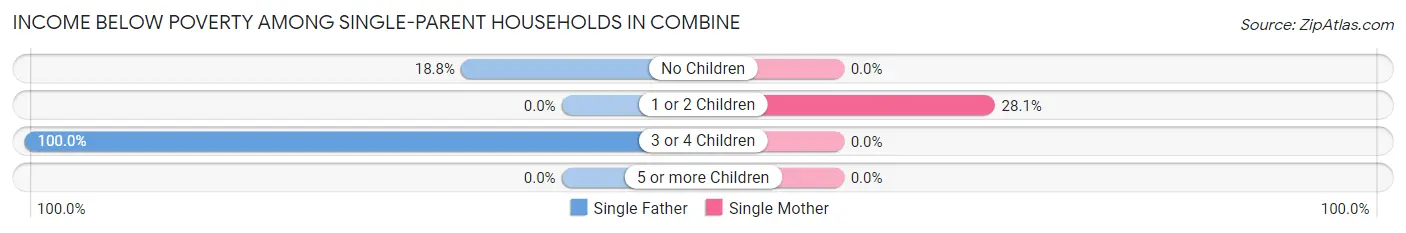
| Children | Single Father | Single Mother |
| No Children | 3 (18.8%) | 0 (0.0%) |
| 1 or 2 Children | 0 (0.0%) | 9 (28.1%) |
| 3 or 4 Children | 10 (100.0%) | 0 (0.0%) |
| 5 or more Children | 0 (0.0%) | 0 (0.0%) |
| Total | 13 (22.0%) | 9 (17.0%) |
Income Below Poverty Among Married-Couple vs Single-Parent Households in Combine
The poverty data for Combine shows that 10 of the married-couple family households (1.7%) and 22 of the single-parent households (19.6%) are living below the poverty level. Within the married-couple family households, those with 3 or 4 children have the highest poverty rate, with 5 households (26.3%) falling below the poverty line. Among the single-parent households, those with 3 or 4 children have the highest poverty rate, with 10 household (50.0%) living below poverty.
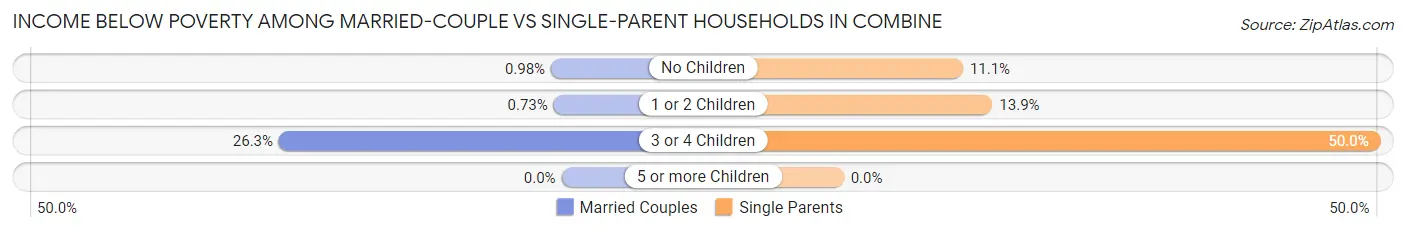
| Children | Married-Couple Families | Single-Parent Households |
| No Children | 3 (1.0%) | 3 (11.1%) |
| 1 or 2 Children | 2 (0.7%) | 9 (13.9%) |
| 3 or 4 Children | 5 (26.3%) | 10 (50.0%) |
| 5 or more Children | 0 (0.0%) | 0 (0.0%) |
| Total | 10 (1.7%) | 22 (19.6%) |
Race in Combine
The most populous races in Combine are White / Caucasian (1,997 | 76.5%), Hispanic or Latino (687 | 26.3%), and Two or more Races (304 | 11.7%).
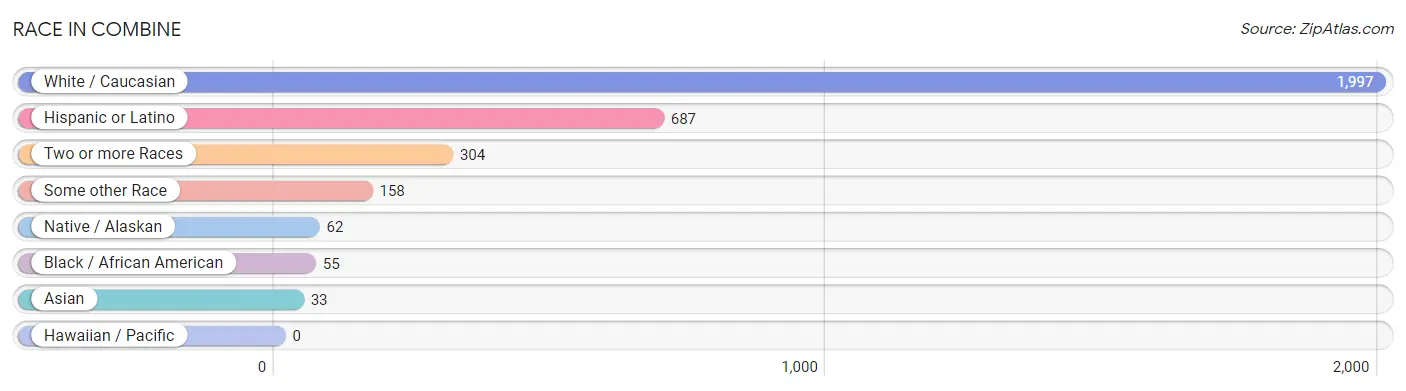
| Race | # Population | % Population |
| Asian | 33 | 1.3% |
| Black / African American | 55 | 2.1% |
| Hawaiian / Pacific | 0 | 0.0% |
| Hispanic or Latino | 687 | 26.3% |
| Native / Alaskan | 62 | 2.4% |
| White / Caucasian | 1,997 | 76.5% |
| Two or more Races | 304 | 11.7% |
| Some other Race | 158 | 6.1% |
| Total | 2,609 | 100.0% |
Ancestry in Combine
The most populous ancestries reported in Combine are Mexican (519 | 19.9%), English (369 | 14.1%), American (306 | 11.7%), German (144 | 5.5%), and Irish (142 | 5.4%), together accounting for 56.7% of all Combine residents.
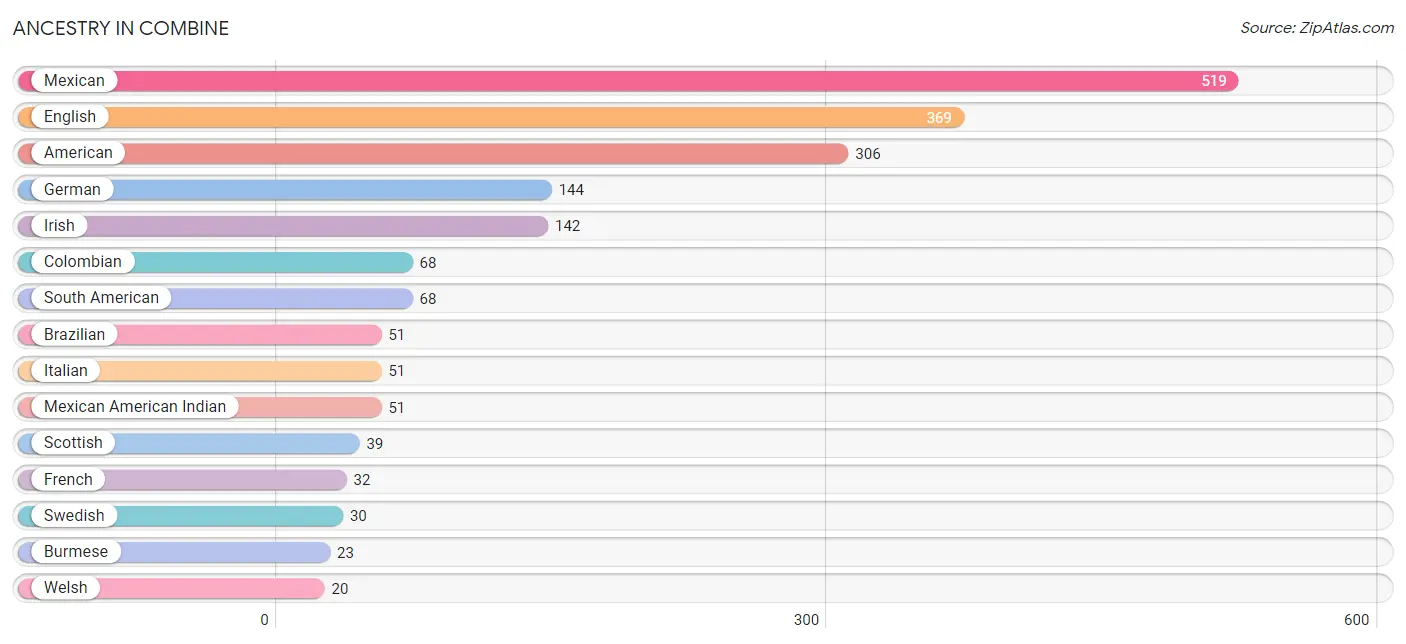
| Ancestry | # Population | % Population |
| American | 306 | 11.7% |
| Brazilian | 51 | 1.9% |
| Burmese | 23 | 0.9% |
| Cherokee | 4 | 0.2% |
| Colombian | 68 | 2.6% |
| Cuban | 4 | 0.2% |
| Czech | 7 | 0.3% |
| Dutch | 17 | 0.6% |
| English | 369 | 14.1% |
| European | 9 | 0.3% |
| French | 32 | 1.2% |
| German | 144 | 5.5% |
| Irish | 142 | 5.4% |
| Italian | 51 | 1.9% |
| Malaysian | 10 | 0.4% |
| Mexican | 519 | 19.9% |
| Mexican American Indian | 51 | 1.9% |
| Norwegian | 2 | 0.1% |
| Polish | 18 | 0.7% |
| Potawatomi | 11 | 0.4% |
| Russian | 12 | 0.5% |
| Scotch-Irish | 6 | 0.2% |
| Scottish | 39 | 1.5% |
| South American | 68 | 2.6% |
| Spaniard | 16 | 0.6% |
| Swedish | 30 | 1.1% |
| Welsh | 20 | 0.8% | View All 27 Rows |
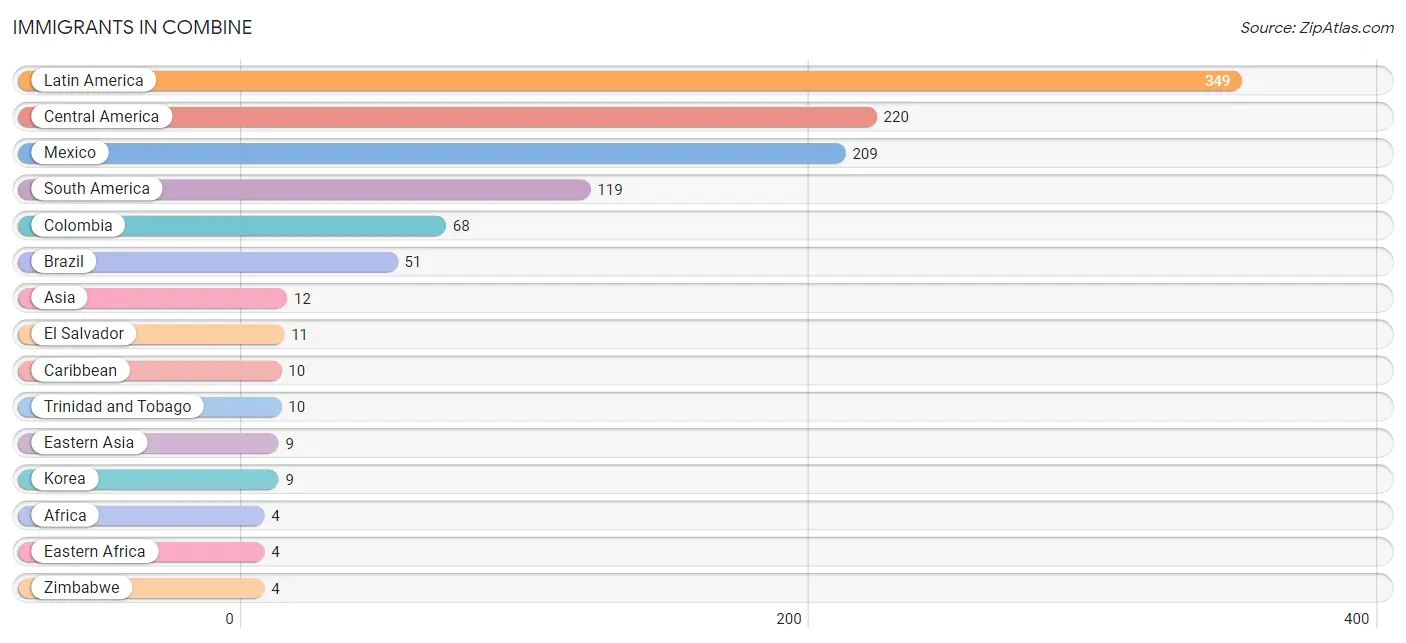
Immigrants in Combine
The most numerous immigrant groups reported in Combine came from Latin America (349 | 13.4%), Central America (220 | 8.4%), Mexico (209 | 8.0%), South America (119 | 4.6%), and Colombia (68 | 2.6%), together accounting for 37.0% of all Combine residents.
| Immigration Origin | # Population | % Population |
| Africa | 4 | 0.2% |
| Asia | 12 | 0.5% |
| Brazil | 51 | 1.9% |
| Caribbean | 10 | 0.4% |
| Central America | 220 | 8.4% |
| Colombia | 68 | 2.6% |
| Eastern Africa | 4 | 0.2% |
| Eastern Asia | 9 | 0.3% |
| El Salvador | 11 | 0.4% |
| England | 3 | 0.1% |
| Europe | 3 | 0.1% |
| India | 3 | 0.1% |
| Korea | 9 | 0.3% |
| Latin America | 349 | 13.4% |
| Mexico | 209 | 8.0% |
| Northern Europe | 3 | 0.1% |
| South America | 119 | 4.6% |
| South Central Asia | 3 | 0.1% |
| Trinidad and Tobago | 10 | 0.4% |
| Zimbabwe | 4 | 0.2% | View All 20 Rows |
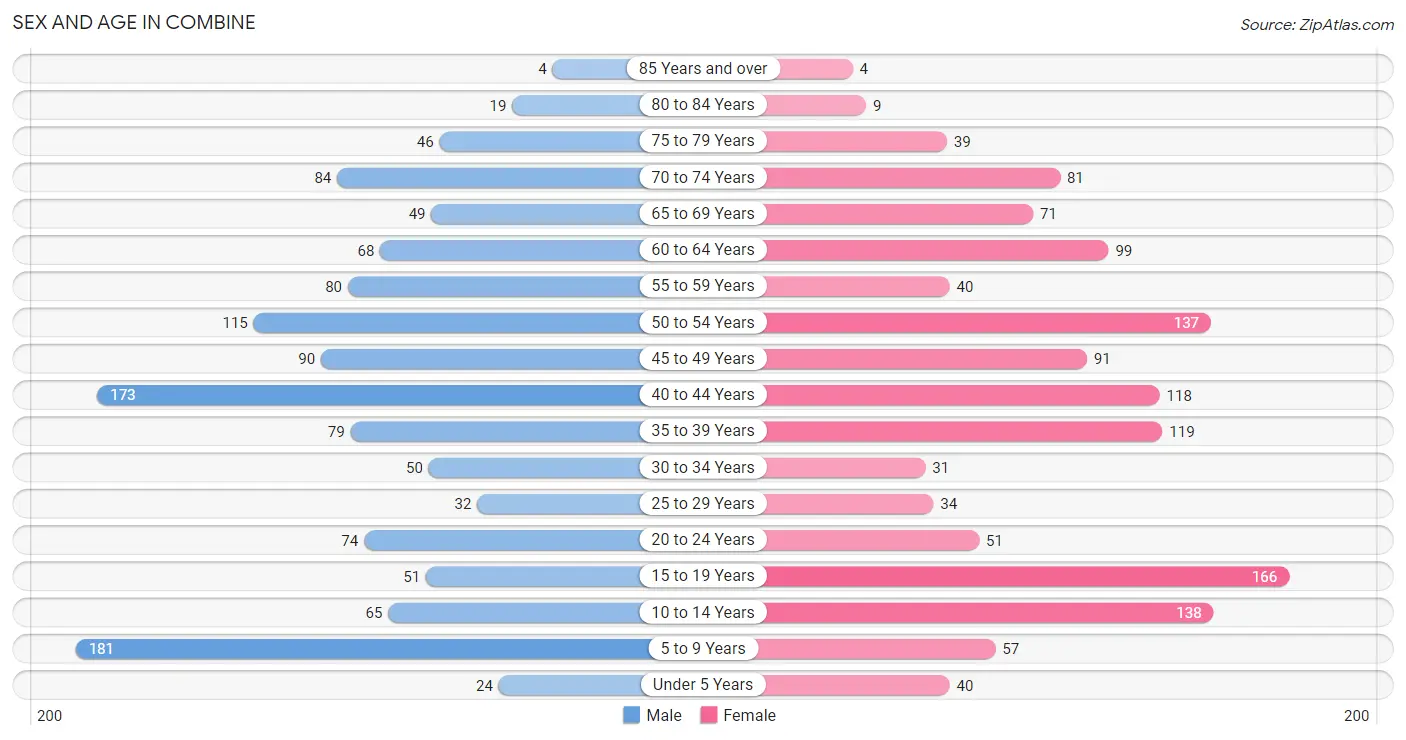
Sex and Age in Combine
Sex and Age in Combine
The most populous age groups in Combine are 5 to 9 Years (181 | 14.1%) for men and 15 to 19 Years (166 | 12.5%) for women.
| Age Bracket | Male | Female |
| Under 5 Years | 24 (1.9%) | 40 (3.0%) |
| 5 to 9 Years | 181 (14.1%) | 57 (4.3%) |
| 10 to 14 Years | 65 (5.1%) | 138 (10.4%) |
| 15 to 19 Years | 51 (4.0%) | 166 (12.5%) |
| 20 to 24 Years | 74 (5.8%) | 51 (3.8%) |
| 25 to 29 Years | 32 (2.5%) | 34 (2.6%) |
| 30 to 34 Years | 50 (3.9%) | 31 (2.3%) |
| 35 to 39 Years | 79 (6.1%) | 119 (9.0%) |
| 40 to 44 Years | 173 (13.5%) | 118 (8.9%) |
| 45 to 49 Years | 90 (7.0%) | 91 (6.9%) |
| 50 to 54 Years | 115 (9.0%) | 137 (10.3%) |
| 55 to 59 Years | 80 (6.2%) | 40 (3.0%) |
| 60 to 64 Years | 68 (5.3%) | 99 (7.5%) |
| 65 to 69 Years | 49 (3.8%) | 71 (5.4%) |
| 70 to 74 Years | 84 (6.5%) | 81 (6.1%) |
| 75 to 79 Years | 46 (3.6%) | 39 (2.9%) |
| 80 to 84 Years | 19 (1.5%) | 9 (0.7%) |
| 85 Years and over | 4 (0.3%) | 4 (0.3%) |
| Total | 1,284 (100.0%) | 1,325 (100.0%) |
Families and Households in Combine
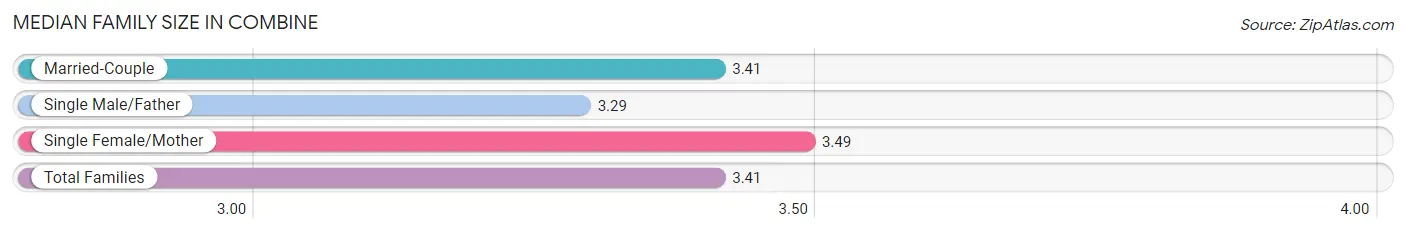
Median Family Size in Combine
The median family size in Combine is 3.41 persons per family, with single female/mother families (53 | 7.4%) accounting for the largest median family size of 3.49 persons per family. On the other hand, single male/father families (59 | 8.3%) represent the smallest median family size with 3.29 persons per family.
| Family Type | # Families | Family Size |
| Married-Couple | 599 (84.3%) | 3.41 |
| Single Male/Father | 59 (8.3%) | 3.29 |
| Single Female/Mother | 53 (7.4%) | 3.49 |
| Total Families | 711 (100.0%) | 3.41 |
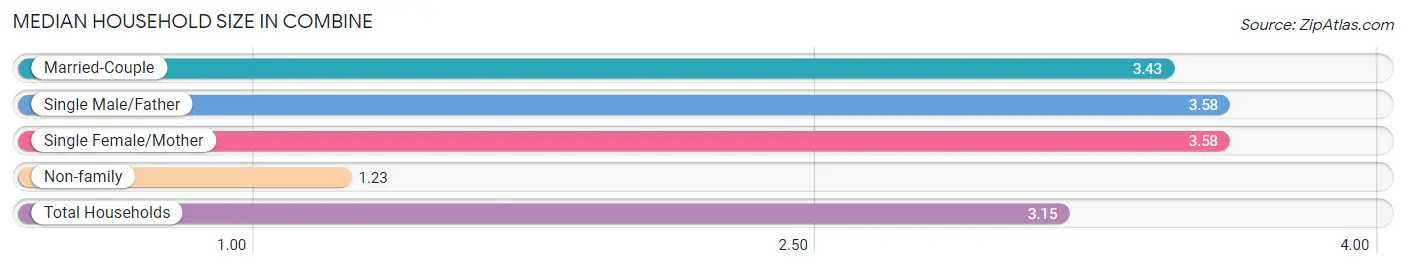
Median Household Size in Combine
The median household size in Combine is 3.15 persons per household, with single male/father households (59 | 7.2%) accounting for the largest median household size of 3.58 persons per household. non-family households (113 | 13.7%) represent the smallest median household size with 1.23 persons per household.
| Household Type | # Households | Household Size |
| Married-Couple | 599 (72.7%) | 3.43 |
| Single Male/Father | 59 (7.2%) | 3.58 |
| Single Female/Mother | 53 (6.4%) | 3.58 |
| Non-family | 113 (13.7%) | 1.23 |
| Total Households | 824 (100.0%) | 3.15 |
Household Size by Marriage Status in Combine
Out of a total of 824 households in Combine, 711 (86.3%) are family households, while 113 (13.7%) are nonfamily households. The most numerous type of family households are 2-person households, comprising 254, and the most common type of nonfamily households are 1-person households, comprising 93.
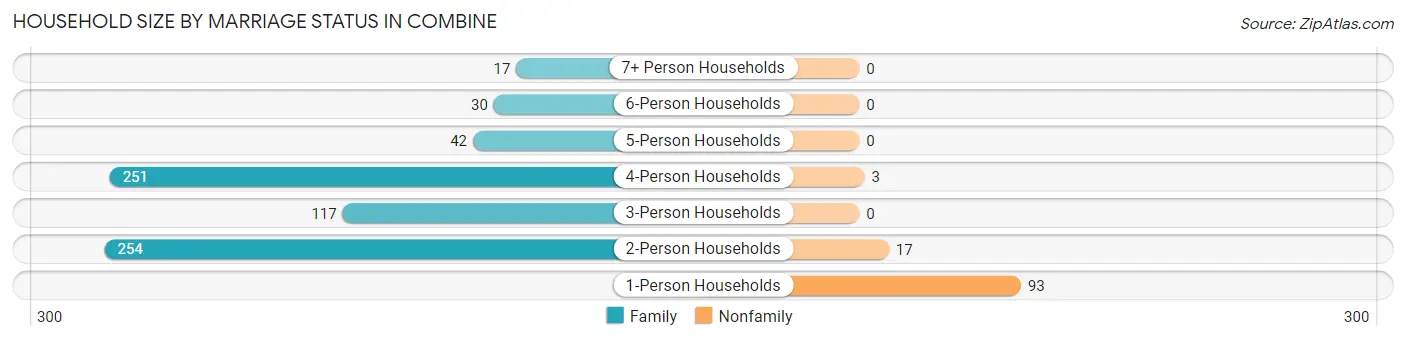
| Household Size | Family Households | Nonfamily Households |
| 1-Person Households | - | 93 (11.3%) |
| 2-Person Households | 254 (30.8%) | 17 (2.1%) |
| 3-Person Households | 117 (14.2%) | 0 (0.0%) |
| 4-Person Households | 251 (30.5%) | 3 (0.4%) |
| 5-Person Households | 42 (5.1%) | 0 (0.0%) |
| 6-Person Households | 30 (3.6%) | 0 (0.0%) |
| 7+ Person Households | 17 (2.1%) | 0 (0.0%) |
| Total | 711 (86.3%) | 113 (13.7%) |
Female Fertility in Combine
Fertility by Age in Combine
Average fertility rate in Combine is 26.0 births per 1,000 women. Women in the age bracket of 35 to 50 years have the highest fertility rate with 48.0 births per 1,000 women. Women in the age bracket of 35 to 50 years acount for 100.0% of all women with births.
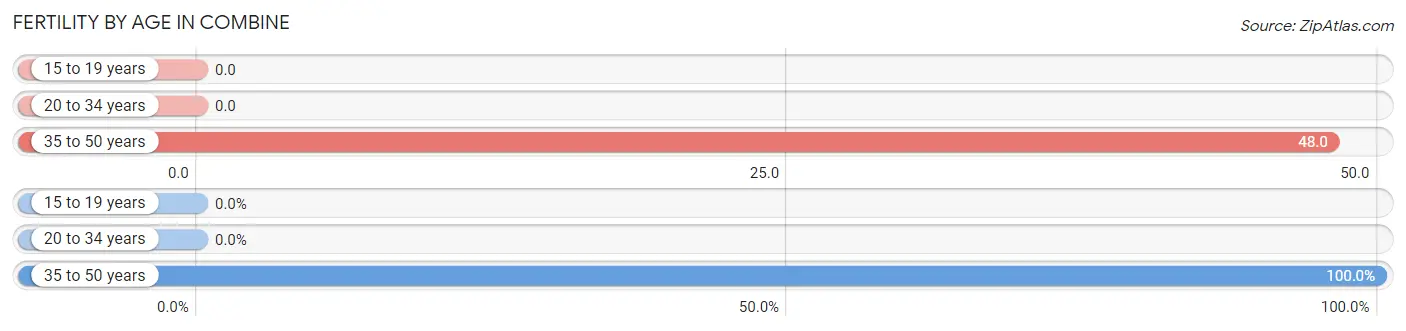
| Age Bracket | Women with Births | Births / 1,000 Women |
| 15 to 19 years | 0 (0.0%) | 0.0 |
| 20 to 34 years | 0 (0.0%) | 0.0 |
| 35 to 50 years | 16 (100.0%) | 48.0 |
| Total | 16 (100.0%) | 26.0 |
Fertility by Age by Marriage Status in Combine
56.2% of women with births (16) in Combine are married. The highest percentage of unmarried women with births falls into 35 to 50 years age bracket with 43.8% of them unmarried at the time of birth, while the lowest percentage of unmarried women with births belong to 35 to 50 years age bracket with 43.8% of them unmarried.
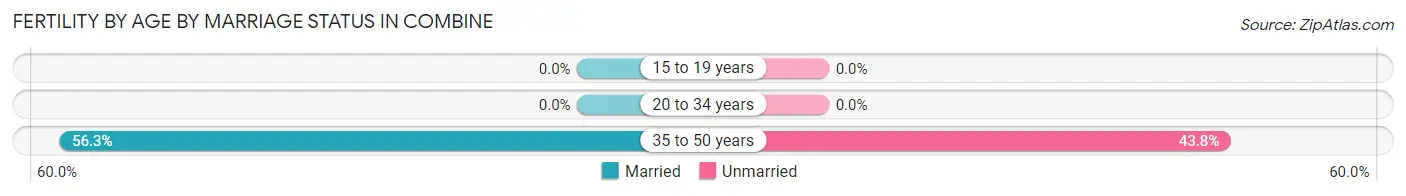
| Age Bracket | Married | Unmarried |
| 15 to 19 years | 0 (0.0%) | 0 (0.0%) |
| 20 to 34 years | 0 (0.0%) | 0 (0.0%) |
| 35 to 50 years | 9 (56.2%) | 7 (43.8%) |
| Total | 9 (56.2%) | 7 (43.8%) |
Fertility by Education in Combine
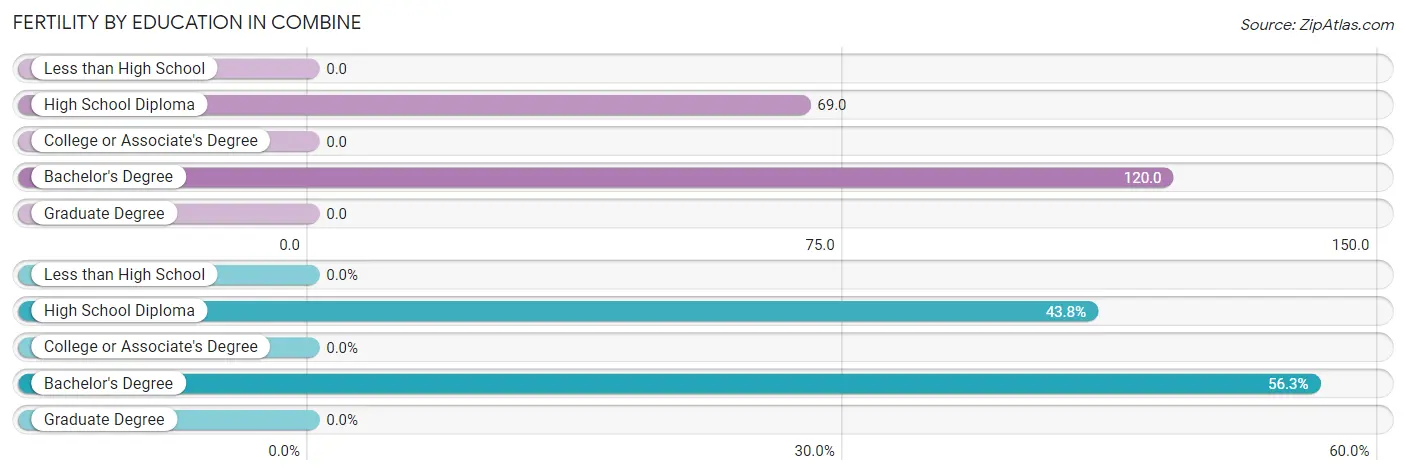
| Educational Attainment | Women with Births | Births / 1,000 Women |
| Less than High School | 0 (0.0%) | 0.0 |
| High School Diploma | 7 (43.8%) | 69.0 |
| College or Associate's Degree | 0 (0.0%) | 0.0 |
| Bachelor's Degree | 9 (56.2%) | 120.0 |
| Graduate Degree | 0 (0.0%) | 0.0 |
| Total | 16 (100.0%) | 26.0 |
Fertility by Education by Marriage Status in Combine
43.8% of women with births in Combine are unmarried. Women with the educational attainment of bachelor's degree are most likely to be married with 100.0% of them married at childbirth, while women with the educational attainment of high school diploma are least likely to be married with 100.0% of them unmarried at childbirth.
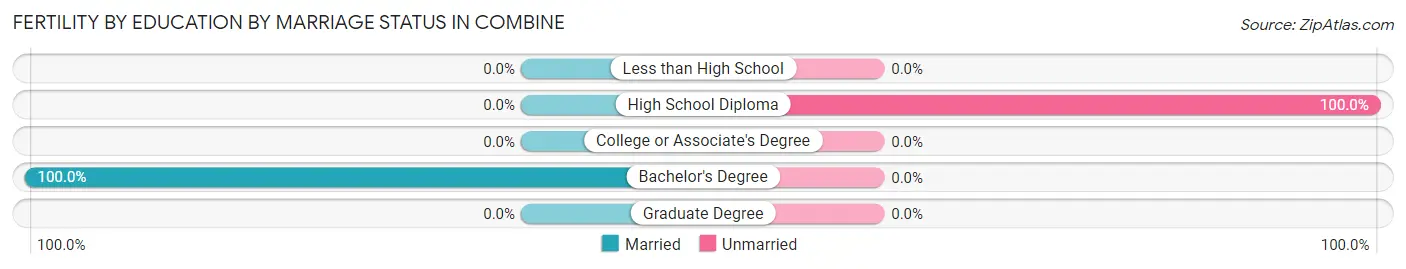
| Educational Attainment | Married | Unmarried |
| Less than High School | 0 (0.0%) | 0 (0.0%) |
| High School Diploma | 0 (0.0%) | 7 (100.0%) |
| College or Associate's Degree | 0 (0.0%) | 0 (0.0%) |
| Bachelor's Degree | 9 (100.0%) | 0 (0.0%) |
| Graduate Degree | 0 (0.0%) | 0 (0.0%) |
| Total | 9 (56.2%) | 7 (43.8%) |
Employment Characteristics in Combine
Employment by Class of Employer in Combine
Among the 1,234 employed individuals in Combine, private company employees (783 | 63.4%), self-employed (not incorporated) (189 | 15.3%), and local government employees (100 | 8.1%) make up the most common classes of employment.
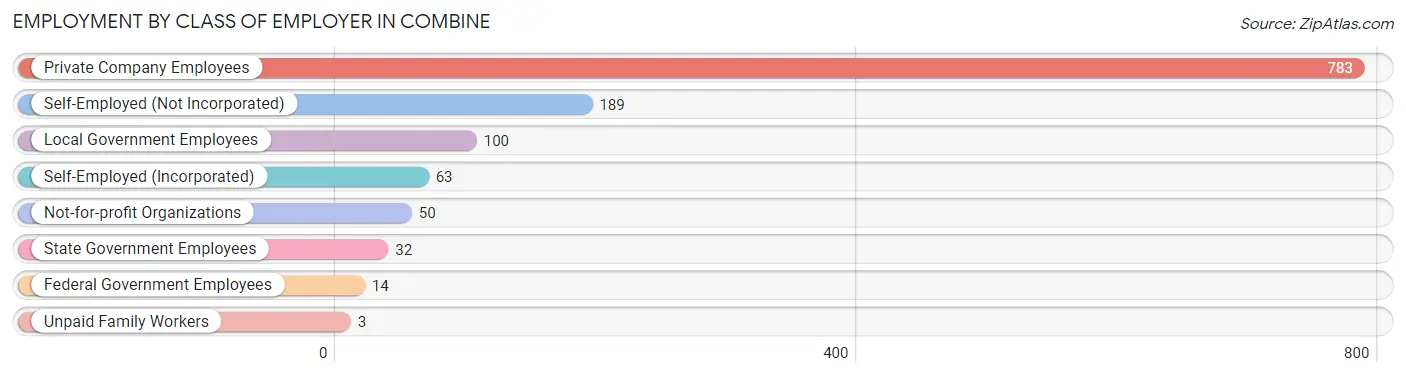
| Employer Class | # Employees | % Employees |
| Private Company Employees | 783 | 63.4% |
| Self-Employed (Incorporated) | 63 | 5.1% |
| Self-Employed (Not Incorporated) | 189 | 15.3% |
| Not-for-profit Organizations | 50 | 4.1% |
| Local Government Employees | 100 | 8.1% |
| State Government Employees | 32 | 2.6% |
| Federal Government Employees | 14 | 1.1% |
| Unpaid Family Workers | 3 | 0.2% |
| Total | 1,234 | 100.0% |
Employment Status by Age in Combine
According to the labor force statistics for Combine, out of the total population over 16 years of age (2,059), 65.5% or 1,349 individuals are in the labor force, with 6.3% or 85 of them unemployed. The age group with the highest labor force participation rate is 25 to 29 years, with 97.0% or 64 individuals in the labor force. Within the labor force, the 60 to 64 years age range has the highest percentage of unemployed individuals, with 23.2% or 19 of them being unemployed.
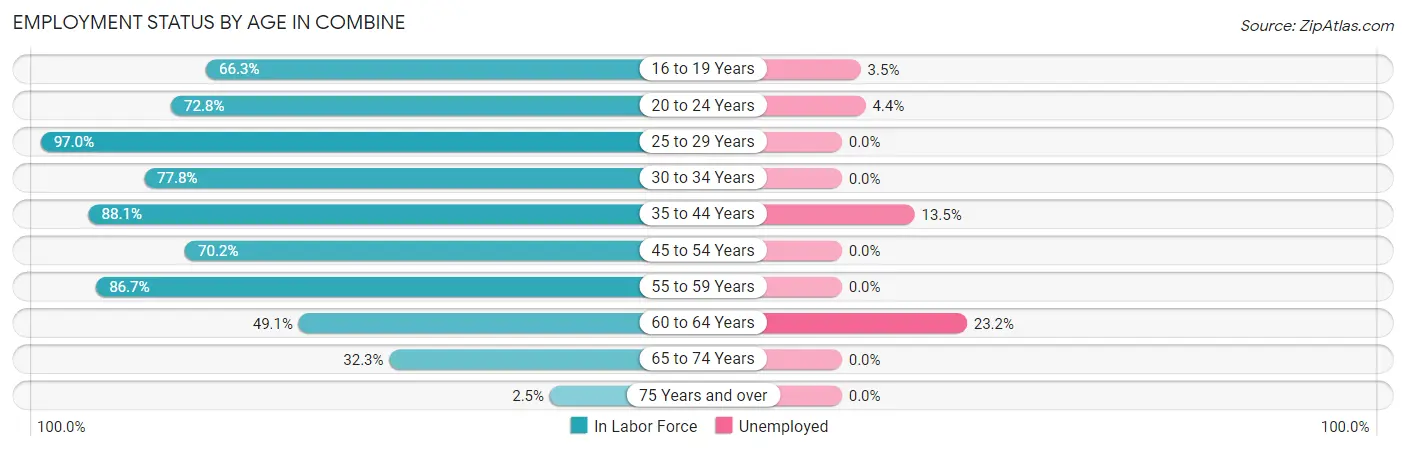
| Age Bracket | In Labor Force | Unemployed |
| 16 to 19 Years | 114 (66.3%) | 4 (3.5%) |
| 20 to 24 Years | 91 (72.8%) | 4 (4.4%) |
| 25 to 29 Years | 64 (97.0%) | 0 (0.0%) |
| 30 to 34 Years | 63 (77.8%) | 0 (0.0%) |
| 35 to 44 Years | 431 (88.1%) | 58 (13.5%) |
| 45 to 54 Years | 304 (70.2%) | 0 (0.0%) |
| 55 to 59 Years | 104 (86.7%) | 0 (0.0%) |
| 60 to 64 Years | 82 (49.1%) | 19 (23.2%) |
| 65 to 74 Years | 92 (32.3%) | 0 (0.0%) |
| 75 Years and over | 3 (2.5%) | 0 (0.0%) |
| Total | 1,349 (65.5%) | 85 (6.3%) |
Employment Status by Educational Attainment in Combine
According to labor force statistics for Combine, 77.3% of individuals (1,048) out of the total population between 25 and 64 years of age (1,356) are in the labor force, with 7.3% or 77 of them being unemployed. The group with the highest labor force participation rate are those with the educational attainment of high school diploma, with 79.3% or 284 individuals in the labor force. Within the labor force, individuals with less than high school education have the highest percentage of unemployment, with 20.8% or 51 of them being unemployed.
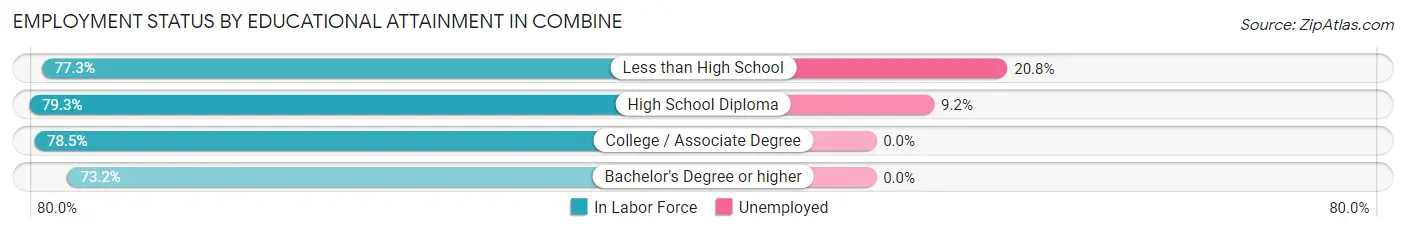
| Educational Attainment | In Labor Force | Unemployed |
| Less than High School | 245 (77.3%) | 66 (20.8%) |
| High School Diploma | 284 (79.3%) | 33 (9.2%) |
| College / Associate Degree | 303 (78.5%) | 0 (0.0%) |
| Bachelor's Degree or higher | 216 (73.2%) | 0 (0.0%) |
| Total | 1,048 (77.3%) | 99 (7.3%) |
Employment Occupations by Sex in Combine
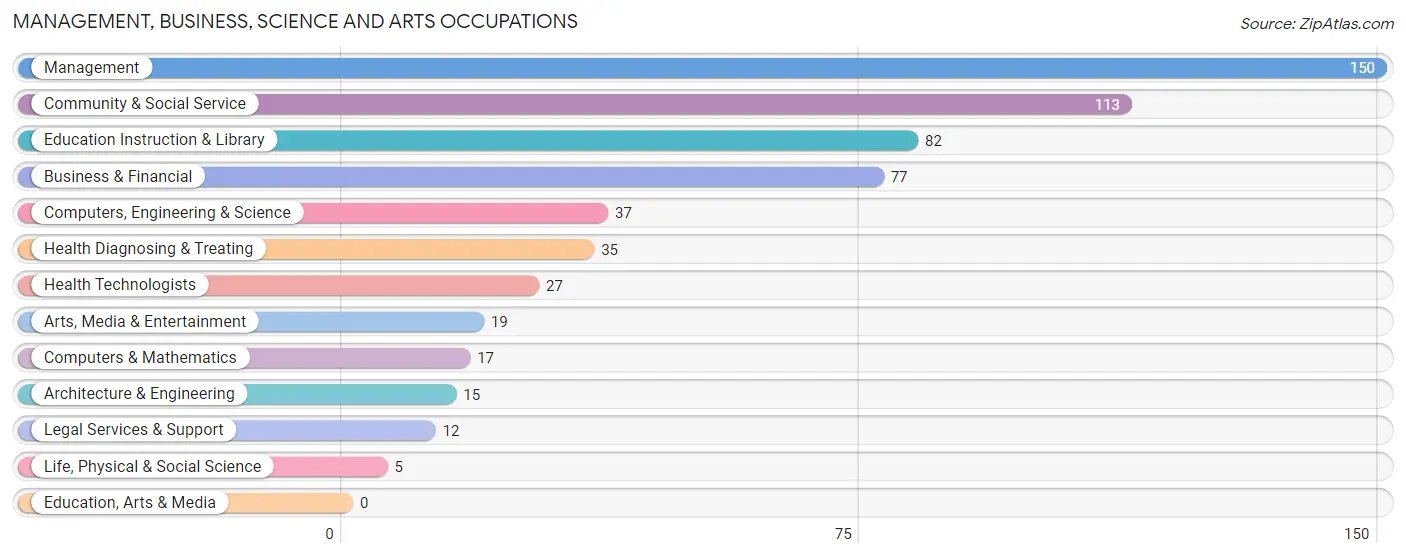
Management, Business, Science and Arts Occupations
The most common Management, Business, Science and Arts occupations in Combine are Management (150 | 11.9%), Community & Social Service (113 | 8.9%), Education Instruction & Library (82 | 6.5%), Business & Financial (77 | 6.1%), and Computers, Engineering & Science (37 | 2.9%).
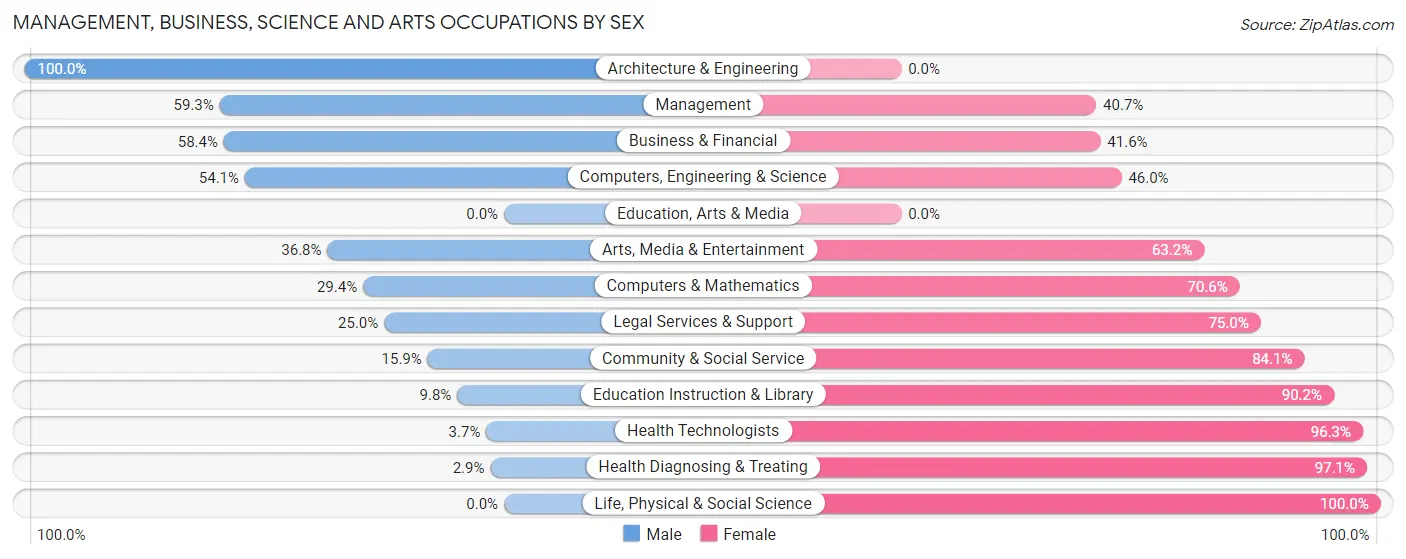
Management, Business, Science and Arts Occupations by Sex
Within the Management, Business, Science and Arts occupations in Combine, the most male-oriented occupations are Architecture & Engineering (100.0%), Management (59.3%), and Business & Financial (58.4%), while the most female-oriented occupations are Life, Physical & Social Science (100.0%), Health Diagnosing & Treating (97.1%), and Health Technologists (96.3%).
| Occupation | Male | Female |
| Management | 89 (59.3%) | 61 (40.7%) |
| Business & Financial | 45 (58.4%) | 32 (41.6%) |
| Computers, Engineering & Science | 20 (54.0%) | 17 (46.0%) |
| Computers & Mathematics | 5 (29.4%) | 12 (70.6%) |
| Architecture & Engineering | 15 (100.0%) | 0 (0.0%) |
| Life, Physical & Social Science | 0 (0.0%) | 5 (100.0%) |
| Community & Social Service | 18 (15.9%) | 95 (84.1%) |
| Education, Arts & Media | 0 (0.0%) | 0 (0.0%) |
| Legal Services & Support | 3 (25.0%) | 9 (75.0%) |
| Education Instruction & Library | 8 (9.8%) | 74 (90.2%) |
| Arts, Media & Entertainment | 7 (36.8%) | 12 (63.2%) |
| Health Diagnosing & Treating | 1 (2.9%) | 34 (97.1%) |
| Health Technologists | 1 (3.7%) | 26 (96.3%) |
| Total (Category) | 173 (42.0%) | 239 (58.0%) |
| Total (Overall) | 727 (57.6%) | 536 (42.4%) |
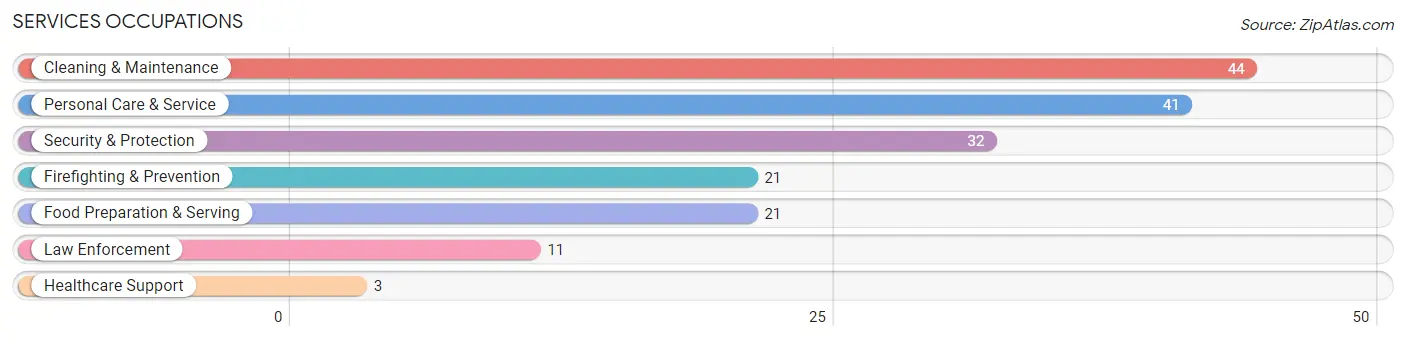
Services Occupations
The most common Services occupations in Combine are Cleaning & Maintenance (44 | 3.5%), Personal Care & Service (41 | 3.3%), Security & Protection (32 | 2.5%), Firefighting & Prevention (21 | 1.7%), and Food Preparation & Serving (21 | 1.7%).
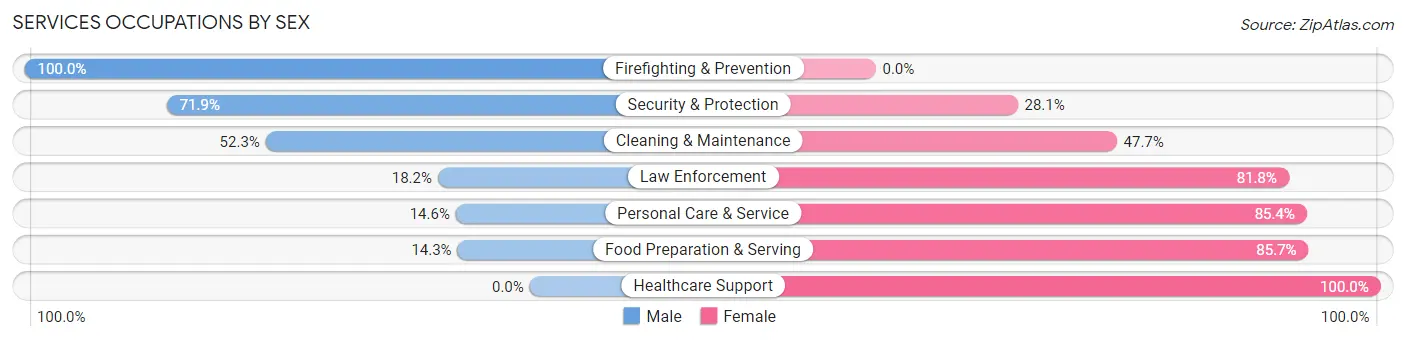
Services Occupations by Sex
Within the Services occupations in Combine, the most male-oriented occupations are Firefighting & Prevention (100.0%), Security & Protection (71.9%), and Cleaning & Maintenance (52.3%), while the most female-oriented occupations are Healthcare Support (100.0%), Food Preparation & Serving (85.7%), and Personal Care & Service (85.4%).
| Occupation | Male | Female |
| Healthcare Support | 0 (0.0%) | 3 (100.0%) |
| Security & Protection | 23 (71.9%) | 9 (28.1%) |
| Firefighting & Prevention | 21 (100.0%) | 0 (0.0%) |
| Law Enforcement | 2 (18.2%) | 9 (81.8%) |
| Food Preparation & Serving | 3 (14.3%) | 18 (85.7%) |
| Cleaning & Maintenance | 23 (52.3%) | 21 (47.7%) |
| Personal Care & Service | 6 (14.6%) | 35 (85.4%) |
| Total (Category) | 55 (39.0%) | 86 (61.0%) |
| Total (Overall) | 727 (57.6%) | 536 (42.4%) |
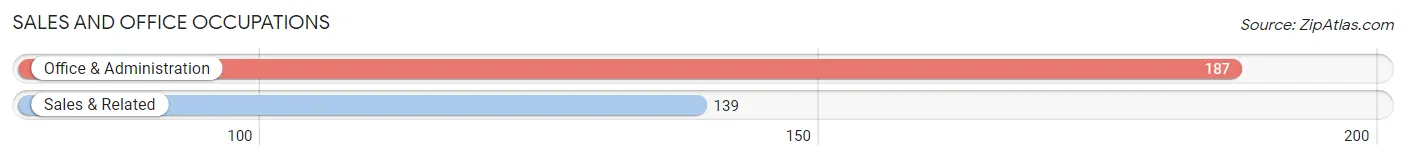
Sales and Office Occupations
The most common Sales and Office occupations in Combine are Office & Administration (187 | 14.8%), and Sales & Related (139 | 11.0%).
Sales and Office Occupations by Sex
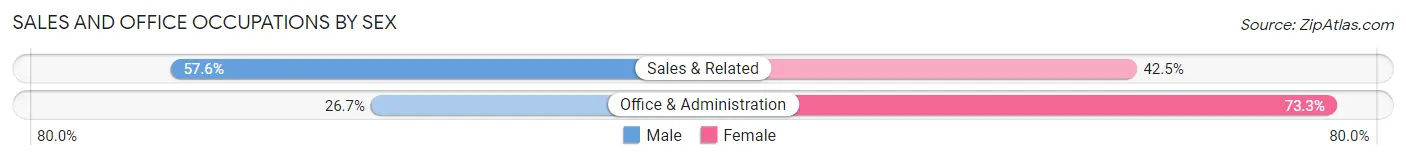
| Occupation | Male | Female |
| Sales & Related | 80 (57.6%) | 59 (42.4%) |
| Office & Administration | 50 (26.7%) | 137 (73.3%) |
| Total (Category) | 130 (39.9%) | 196 (60.1%) |
| Total (Overall) | 727 (57.6%) | 536 (42.4%) |
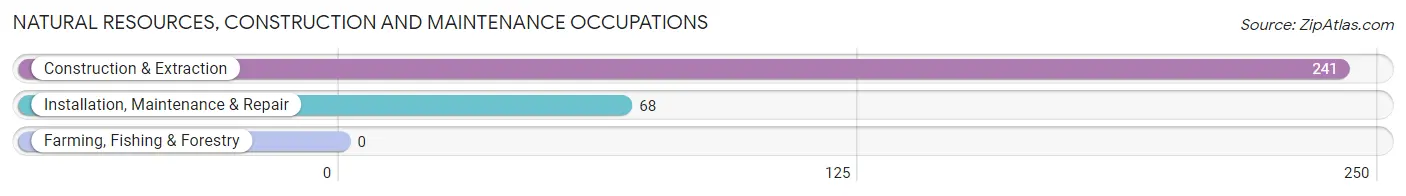
Natural Resources, Construction and Maintenance Occupations
The most common Natural Resources, Construction and Maintenance occupations in Combine are Construction & Extraction (241 | 19.1%), and Installation, Maintenance & Repair (68 | 5.4%).
Natural Resources, Construction and Maintenance Occupations by Sex
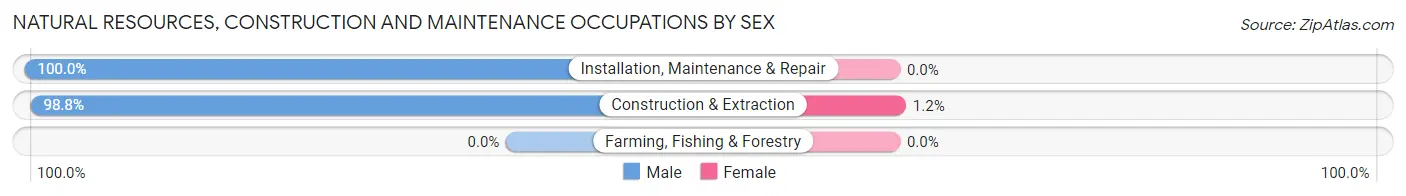
| Occupation | Male | Female |
| Farming, Fishing & Forestry | 0 (0.0%) | 0 (0.0%) |
| Construction & Extraction | 238 (98.8%) | 3 (1.2%) |
| Installation, Maintenance & Repair | 68 (100.0%) | 0 (0.0%) |
| Total (Category) | 306 (99.0%) | 3 (1.0%) |
| Total (Overall) | 727 (57.6%) | 536 (42.4%) |
Production, Transportation and Moving Occupations
The most common Production, Transportation and Moving occupations in Combine are Transportation (34 | 2.7%), Material Moving (23 | 1.8%), and Production (18 | 1.4%).
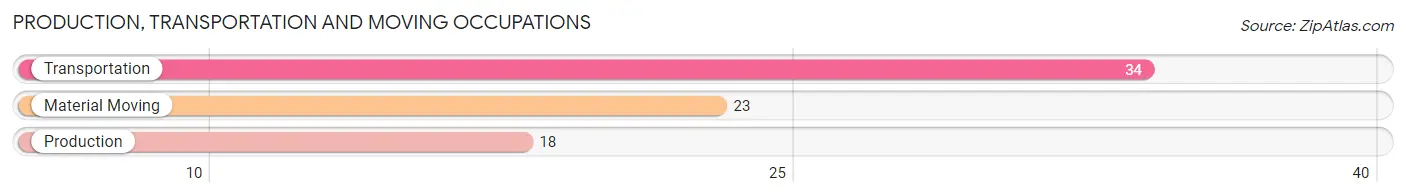
Production, Transportation and Moving Occupations by Sex
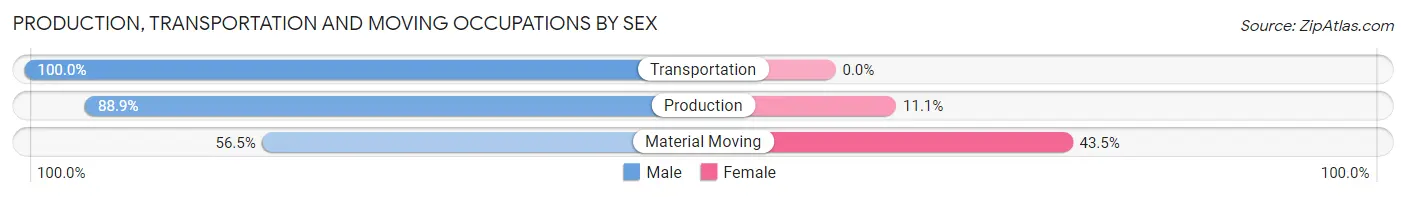
| Occupation | Male | Female |
| Production | 16 (88.9%) | 2 (11.1%) |
| Transportation | 34 (100.0%) | 0 (0.0%) |
| Material Moving | 13 (56.5%) | 10 (43.5%) |
| Total (Category) | 63 (84.0%) | 12 (16.0%) |
| Total (Overall) | 727 (57.6%) | 536 (42.4%) |
Employment Industries by Sex in Combine
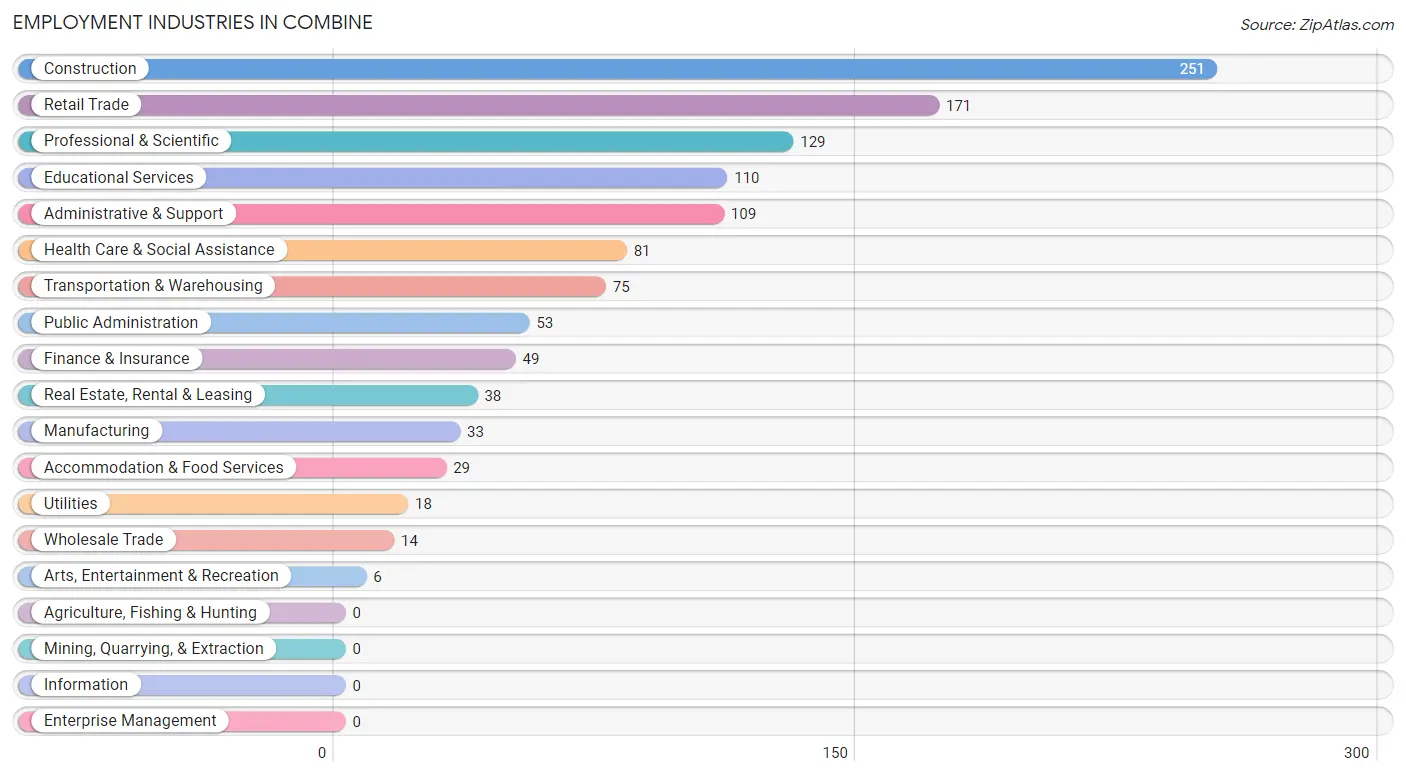
Employment Industries in Combine
The major employment industries in Combine include Construction (251 | 19.9%), Retail Trade (171 | 13.5%), Professional & Scientific (129 | 10.2%), Educational Services (110 | 8.7%), and Administrative & Support (109 | 8.6%).
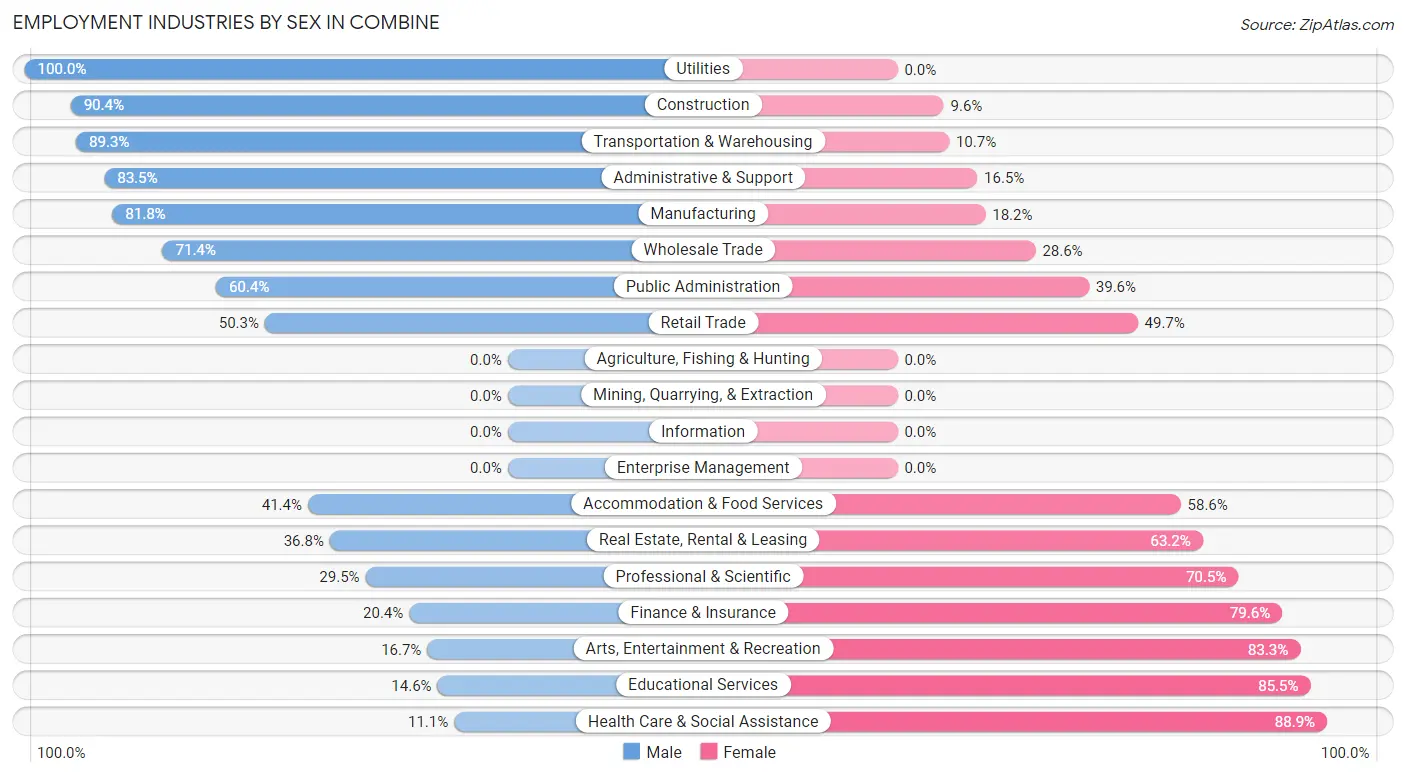
Employment Industries by Sex in Combine
The Combine industries that see more men than women are Utilities (100.0%), Construction (90.4%), and Transportation & Warehousing (89.3%), whereas the industries that tend to have a higher number of women are Health Care & Social Assistance (88.9%), Educational Services (85.5%), and Arts, Entertainment & Recreation (83.3%).
| Industry | Male | Female |
| Agriculture, Fishing & Hunting | 0 (0.0%) | 0 (0.0%) |
| Mining, Quarrying, & Extraction | 0 (0.0%) | 0 (0.0%) |
| Construction | 227 (90.4%) | 24 (9.6%) |
| Manufacturing | 27 (81.8%) | 6 (18.2%) |
| Wholesale Trade | 10 (71.4%) | 4 (28.6%) |
| Retail Trade | 86 (50.3%) | 85 (49.7%) |
| Transportation & Warehousing | 67 (89.3%) | 8 (10.7%) |
| Utilities | 18 (100.0%) | 0 (0.0%) |
| Information | 0 (0.0%) | 0 (0.0%) |
| Finance & Insurance | 10 (20.4%) | 39 (79.6%) |
| Real Estate, Rental & Leasing | 14 (36.8%) | 24 (63.2%) |
| Professional & Scientific | 38 (29.5%) | 91 (70.5%) |
| Enterprise Management | 0 (0.0%) | 0 (0.0%) |
| Administrative & Support | 91 (83.5%) | 18 (16.5%) |
| Educational Services | 16 (14.5%) | 94 (85.5%) |
| Health Care & Social Assistance | 9 (11.1%) | 72 (88.9%) |
| Arts, Entertainment & Recreation | 1 (16.7%) | 5 (83.3%) |
| Accommodation & Food Services | 12 (41.4%) | 17 (58.6%) |
| Public Administration | 32 (60.4%) | 21 (39.6%) |
| Total | 727 (57.6%) | 536 (42.4%) |
Education in Combine
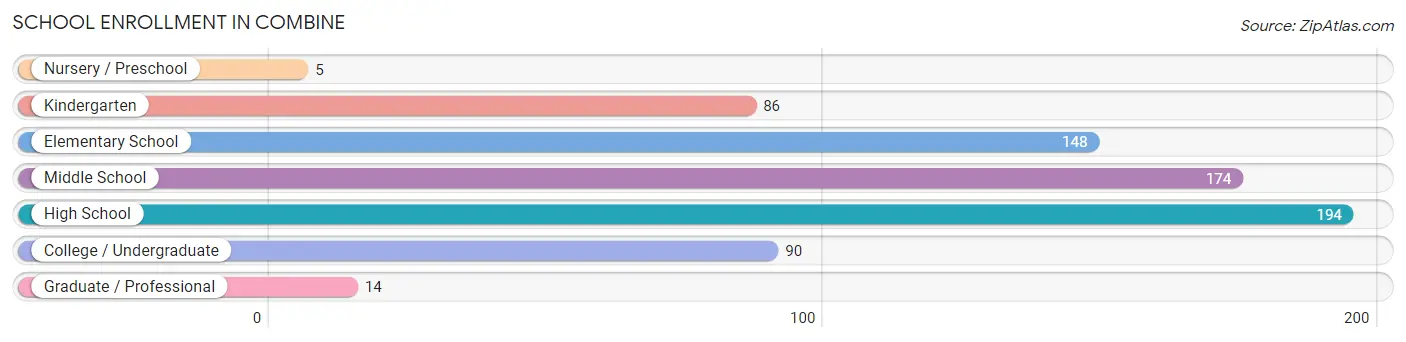
School Enrollment in Combine
The most common levels of schooling among the 711 students in Combine are high school (194 | 27.3%), middle school (174 | 24.5%), and elementary school (148 | 20.8%).
| School Level | # Students | % Students |
| Nursery / Preschool | 5 | 0.7% |
| Kindergarten | 86 | 12.1% |
| Elementary School | 148 | 20.8% |
| Middle School | 174 | 24.5% |
| High School | 194 | 27.3% |
| College / Undergraduate | 90 | 12.7% |
| Graduate / Professional | 14 | 2.0% |
| Total | 711 | 100.0% |
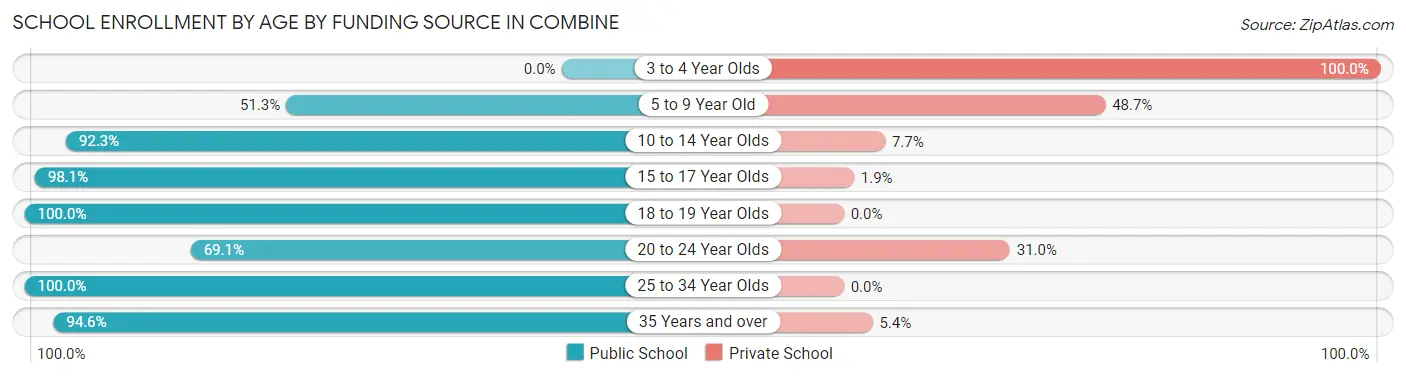
School Enrollment by Age by Funding Source in Combine
Out of a total of 711 students who are enrolled in schools in Combine, 149 (21.0%) attend a private institution, while the remaining 562 (79.0%) are enrolled in public schools. The age group of 3 to 4 year olds has the highest likelihood of being enrolled in private schools, with 3 (100.0% in the age bracket) enrolled. Conversely, the age group of 18 to 19 year olds has the lowest likelihood of being enrolled in a private school, with 72 (100.0% in the age bracket) attending a public institution.
| Age Bracket | Public School | Private School |
| 3 to 4 Year Olds | 0 (0.0%) | 3 (100.0%) |
| 5 to 9 Year Old | 119 (51.3%) | 113 (48.7%) |
| 10 to 14 Year Olds | 180 (92.3%) | 15 (7.7%) |
| 15 to 17 Year Olds | 103 (98.1%) | 2 (1.9%) |
| 18 to 19 Year Olds | 72 (100.0%) | 0 (0.0%) |
| 20 to 24 Year Olds | 29 (69.1%) | 13 (30.9%) |
| 25 to 34 Year Olds | 6 (100.0%) | 0 (0.0%) |
| 35 Years and over | 53 (94.6%) | 3 (5.4%) |
| Total | 562 (79.0%) | 149 (21.0%) |
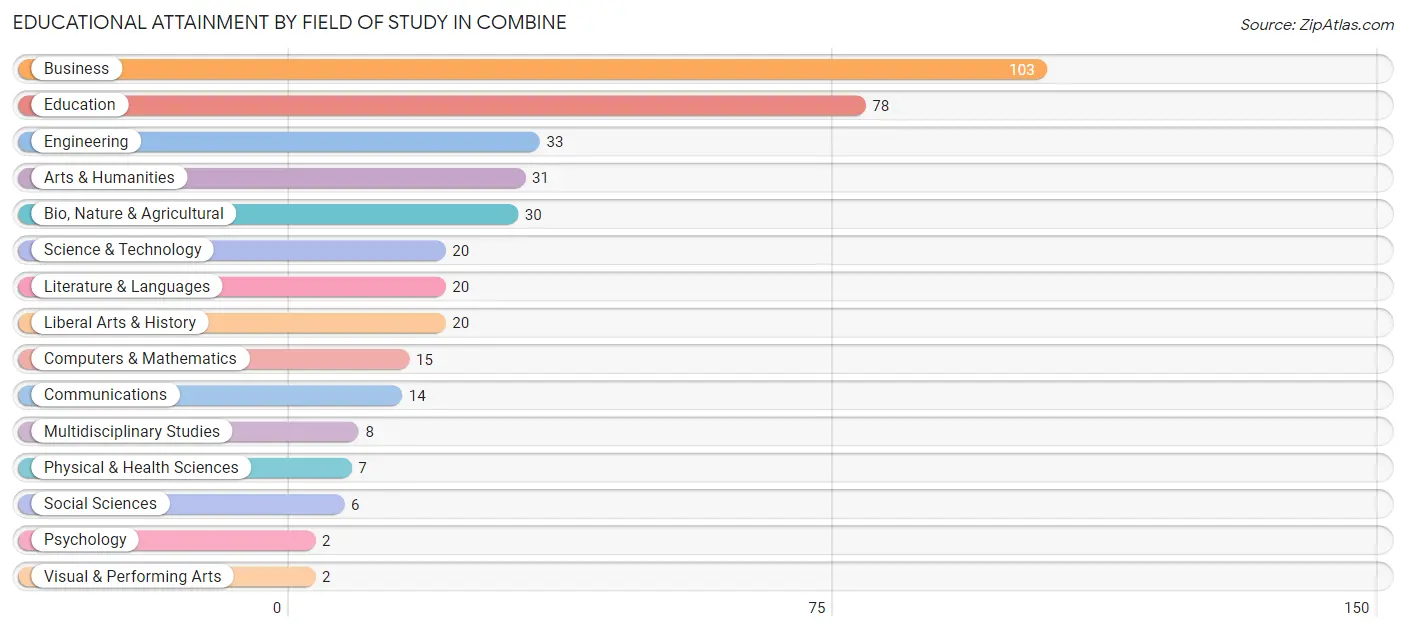
Educational Attainment by Field of Study in Combine
Business (103 | 26.5%), education (78 | 20.1%), engineering (33 | 8.5%), arts & humanities (31 | 8.0%), and bio, nature & agricultural (30 | 7.7%) are the most common fields of study among 389 individuals in Combine who have obtained a bachelor's degree or higher.
| Field of Study | # Graduates | % Graduates |
| Computers & Mathematics | 15 | 3.9% |
| Bio, Nature & Agricultural | 30 | 7.7% |
| Physical & Health Sciences | 7 | 1.8% |
| Psychology | 2 | 0.5% |
| Social Sciences | 6 | 1.5% |
| Engineering | 33 | 8.5% |
| Multidisciplinary Studies | 8 | 2.1% |
| Science & Technology | 20 | 5.1% |
| Business | 103 | 26.5% |
| Education | 78 | 20.1% |
| Literature & Languages | 20 | 5.1% |
| Liberal Arts & History | 20 | 5.1% |
| Visual & Performing Arts | 2 | 0.5% |
| Communications | 14 | 3.6% |
| Arts & Humanities | 31 | 8.0% |
| Total | 389 | 100.0% |
Transportation & Commute in Combine
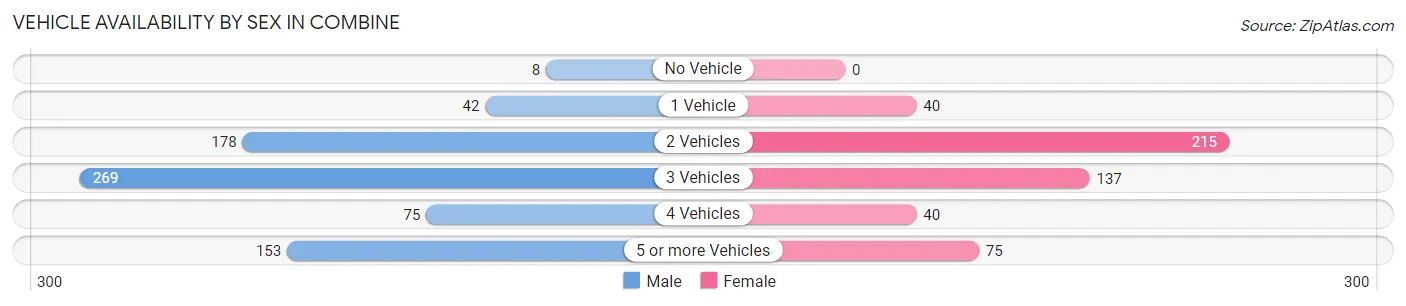
Vehicle Availability by Sex in Combine
The most prevalent vehicle ownership categories in Combine are males with 3 vehicles (269, accounting for 37.1%) and females with 3 vehicles (137, making up 53.1%).
| Vehicles Available | Male | Female |
| No Vehicle | 8 (1.1%) | 0 (0.0%) |
| 1 Vehicle | 42 (5.8%) | 40 (7.9%) |
| 2 Vehicles | 178 (24.5%) | 215 (42.4%) |
| 3 Vehicles | 269 (37.1%) | 137 (27.0%) |
| 4 Vehicles | 75 (10.3%) | 40 (7.9%) |
| 5 or more Vehicles | 153 (21.1%) | 75 (14.8%) |
| Total | 725 (100.0%) | 507 (100.0%) |
Commute Time in Combine
The most frequently occuring commute durations in Combine are 45 to 59 minutes (226 commuters, 20.3%), 60 to 89 minutes (170 commuters, 15.2%), and 30 to 34 minutes (130 commuters, 11.7%).
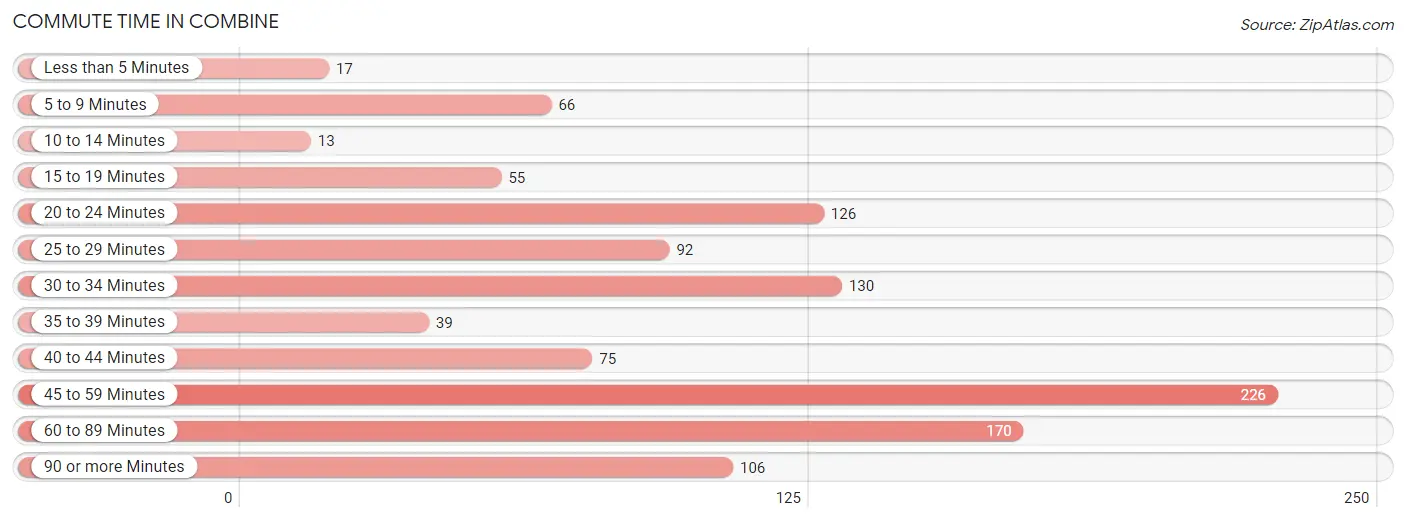
| Commute Time | # Commuters | % Commuters |
| Less than 5 Minutes | 17 | 1.5% |
| 5 to 9 Minutes | 66 | 5.9% |
| 10 to 14 Minutes | 13 | 1.2% |
| 15 to 19 Minutes | 55 | 4.9% |
| 20 to 24 Minutes | 126 | 11.3% |
| 25 to 29 Minutes | 92 | 8.3% |
| 30 to 34 Minutes | 130 | 11.7% |
| 35 to 39 Minutes | 39 | 3.5% |
| 40 to 44 Minutes | 75 | 6.7% |
| 45 to 59 Minutes | 226 | 20.3% |
| 60 to 89 Minutes | 170 | 15.2% |
| 90 or more Minutes | 106 | 9.5% |
Commute Time by Sex in Combine
The most common commute times in Combine are 45 to 59 minutes (181 commuters, 27.1%) for males and 20 to 24 minutes (101 commuters, 22.6%) for females.
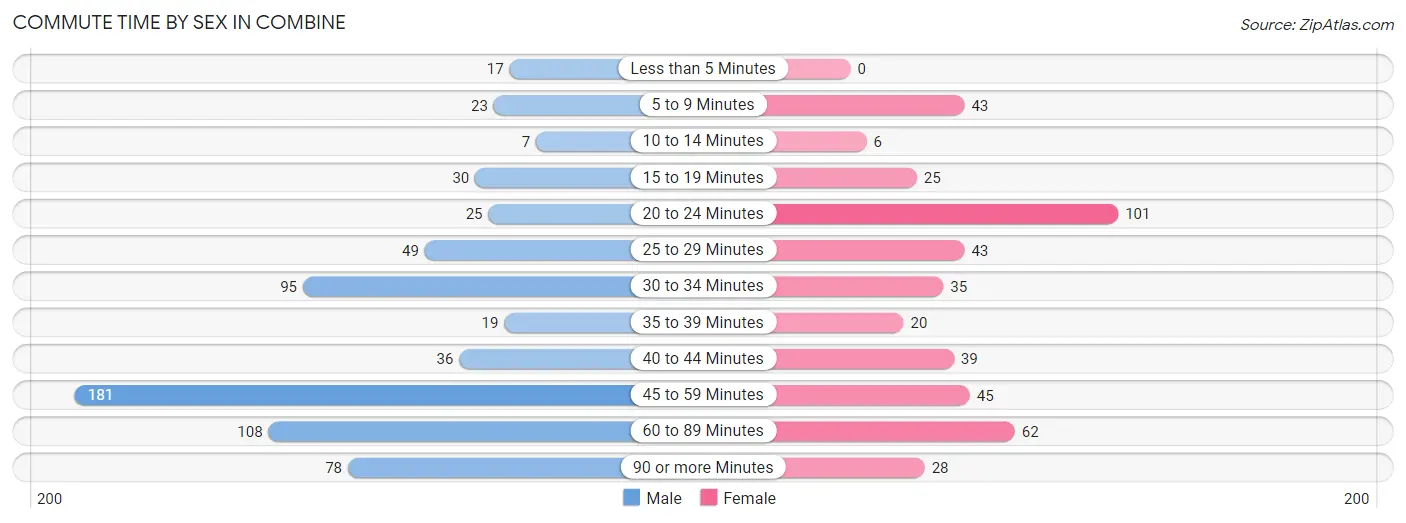
| Commute Time | Male | Female |
| Less than 5 Minutes | 17 (2.5%) | 0 (0.0%) |
| 5 to 9 Minutes | 23 (3.4%) | 43 (9.6%) |
| 10 to 14 Minutes | 7 (1.1%) | 6 (1.3%) |
| 15 to 19 Minutes | 30 (4.5%) | 25 (5.6%) |
| 20 to 24 Minutes | 25 (3.7%) | 101 (22.6%) |
| 25 to 29 Minutes | 49 (7.3%) | 43 (9.6%) |
| 30 to 34 Minutes | 95 (14.2%) | 35 (7.8%) |
| 35 to 39 Minutes | 19 (2.8%) | 20 (4.5%) |
| 40 to 44 Minutes | 36 (5.4%) | 39 (8.7%) |
| 45 to 59 Minutes | 181 (27.1%) | 45 (10.1%) |
| 60 to 89 Minutes | 108 (16.2%) | 62 (13.9%) |
| 90 or more Minutes | 78 (11.7%) | 28 (6.3%) |
Time of Departure to Work by Sex in Combine
The most frequent times of departure to work in Combine are 12:00 AM to 4:59 AM (123, 18.4%) for males and 7:00 AM to 7:29 AM (86, 19.2%) for females.
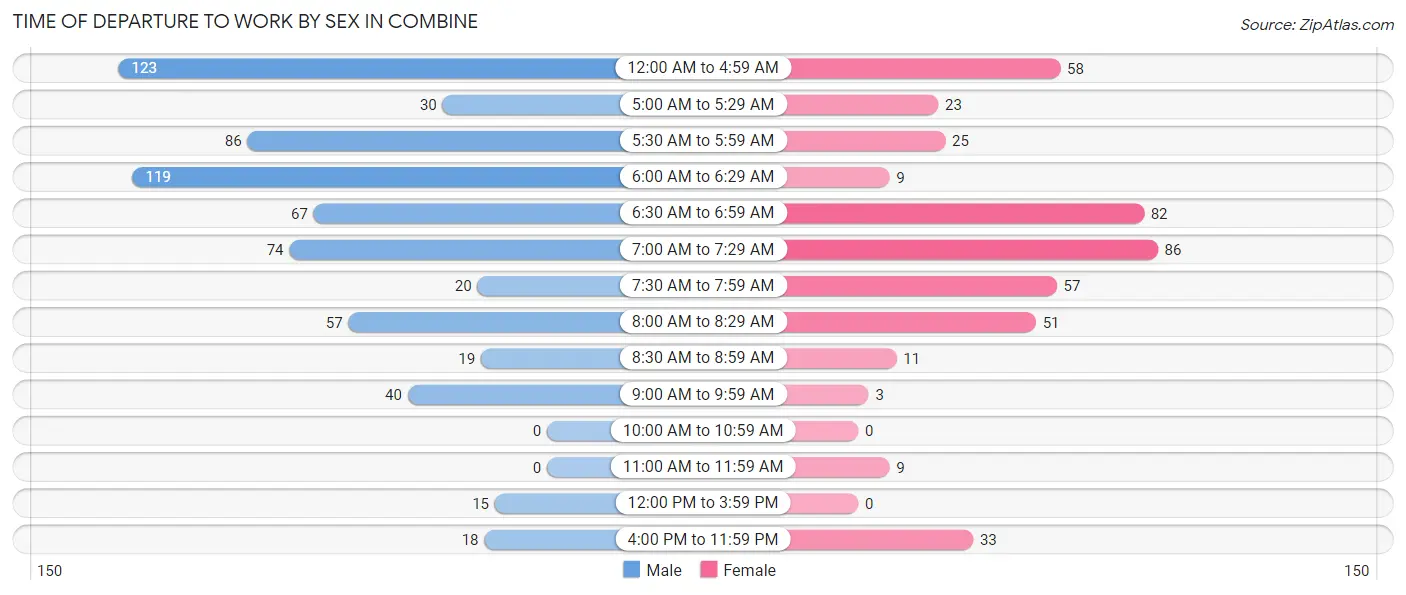
| Time of Departure | Male | Female |
| 12:00 AM to 4:59 AM | 123 (18.4%) | 58 (13.0%) |
| 5:00 AM to 5:29 AM | 30 (4.5%) | 23 (5.1%) |
| 5:30 AM to 5:59 AM | 86 (12.9%) | 25 (5.6%) |
| 6:00 AM to 6:29 AM | 119 (17.8%) | 9 (2.0%) |
| 6:30 AM to 6:59 AM | 67 (10.0%) | 82 (18.3%) |
| 7:00 AM to 7:29 AM | 74 (11.1%) | 86 (19.2%) |
| 7:30 AM to 7:59 AM | 20 (3.0%) | 57 (12.8%) |
| 8:00 AM to 8:29 AM | 57 (8.5%) | 51 (11.4%) |
| 8:30 AM to 8:59 AM | 19 (2.8%) | 11 (2.5%) |
| 9:00 AM to 9:59 AM | 40 (6.0%) | 3 (0.7%) |
| 10:00 AM to 10:59 AM | 0 (0.0%) | 0 (0.0%) |
| 11:00 AM to 11:59 AM | 0 (0.0%) | 9 (2.0%) |
| 12:00 PM to 3:59 PM | 15 (2.2%) | 0 (0.0%) |
| 4:00 PM to 11:59 PM | 18 (2.7%) | 33 (7.4%) |
| Total | 668 (100.0%) | 447 (100.0%) |
Housing Occupancy in Combine
Occupancy by Ownership in Combine
Of the total 824 dwellings in Combine, owner-occupied units account for 749 (90.9%), while renter-occupied units make up 75 (9.1%).
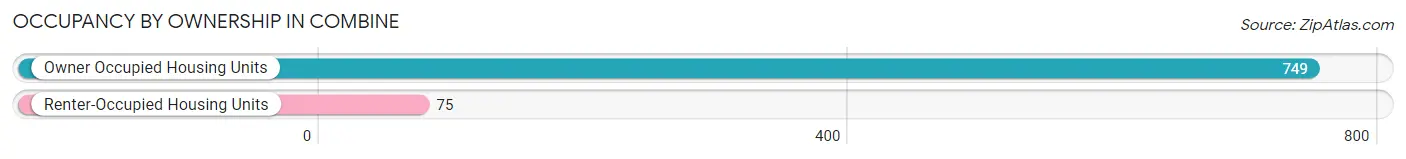
| Occupancy | # Housing Units | % Housing Units |
| Owner Occupied Housing Units | 749 | 90.9% |
| Renter-Occupied Housing Units | 75 | 9.1% |
| Total Occupied Housing Units | 824 | 100.0% |
Occupancy by Household Size in Combine
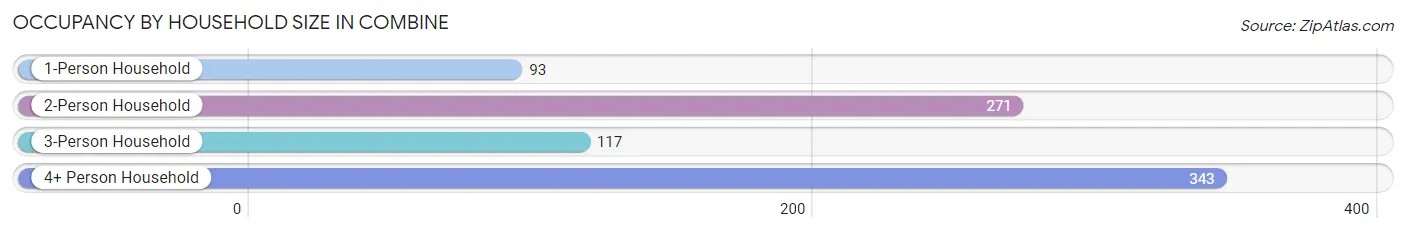
| Household Size | # Housing Units | % Housing Units |
| 1-Person Household | 93 | 11.3% |
| 2-Person Household | 271 | 32.9% |
| 3-Person Household | 117 | 14.2% |
| 4+ Person Household | 343 | 41.6% |
| Total Housing Units | 824 | 100.0% |
Occupancy by Ownership by Household Size in Combine
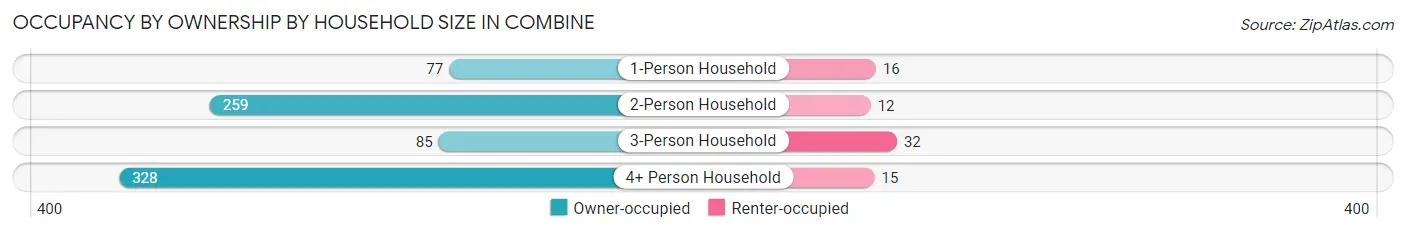
| Household Size | Owner-occupied | Renter-occupied |
| 1-Person Household | 77 (82.8%) | 16 (17.2%) |
| 2-Person Household | 259 (95.6%) | 12 (4.4%) |
| 3-Person Household | 85 (72.7%) | 32 (27.4%) |
| 4+ Person Household | 328 (95.6%) | 15 (4.4%) |
| Total Housing Units | 749 (90.9%) | 75 (9.1%) |
Occupancy by Educational Attainment in Combine
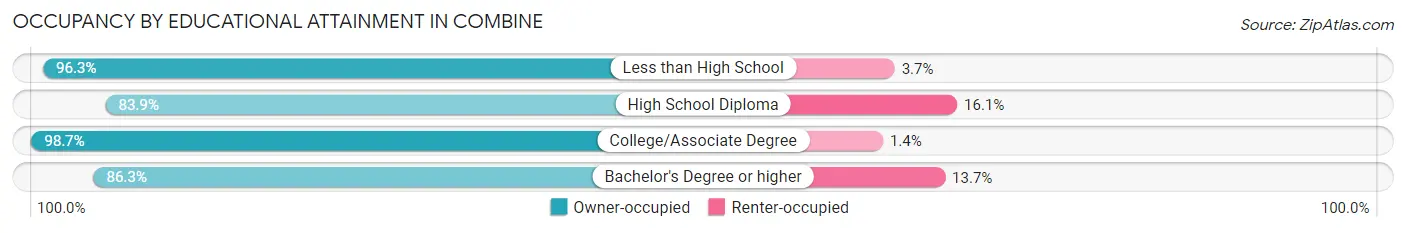
| Household Size | Owner-occupied | Renter-occupied |
| Less than High School | 157 (96.3%) | 6 (3.7%) |
| High School Diploma | 209 (83.9%) | 40 (16.1%) |
| College/Associate Degree | 219 (98.7%) | 3 (1.3%) |
| Bachelor's Degree or higher | 164 (86.3%) | 26 (13.7%) |
Occupancy by Age of Householder in Combine
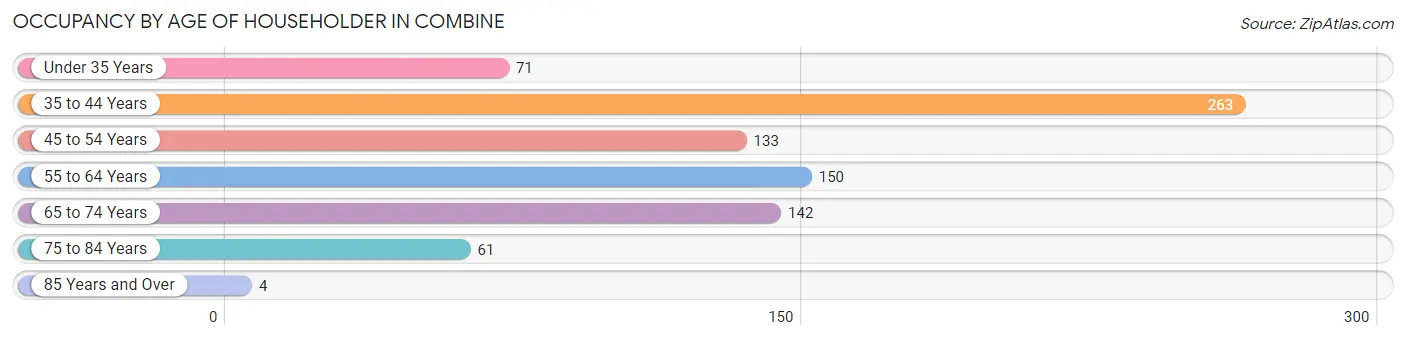
| Age Bracket | # Households | % Households |
| Under 35 Years | 71 | 8.6% |
| 35 to 44 Years | 263 | 31.9% |
| 45 to 54 Years | 133 | 16.1% |
| 55 to 64 Years | 150 | 18.2% |
| 65 to 74 Years | 142 | 17.2% |
| 75 to 84 Years | 61 | 7.4% |
| 85 Years and Over | 4 | 0.5% |
| Total | 824 | 100.0% |
Housing Finances in Combine
Median Income by Occupancy in Combine
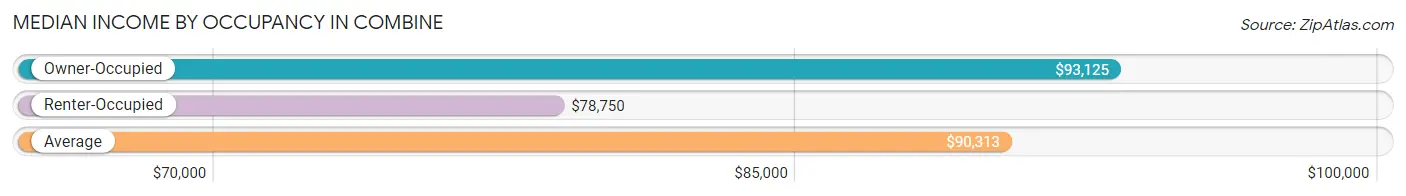
| Occupancy Type | # Households | Median Income |
| Owner-Occupied | 749 (90.9%) | $93,125 |
| Renter-Occupied | 75 (9.1%) | $78,750 |
| Average | 824 (100.0%) | $90,313 |
Occupancy by Householder Income Bracket in Combine
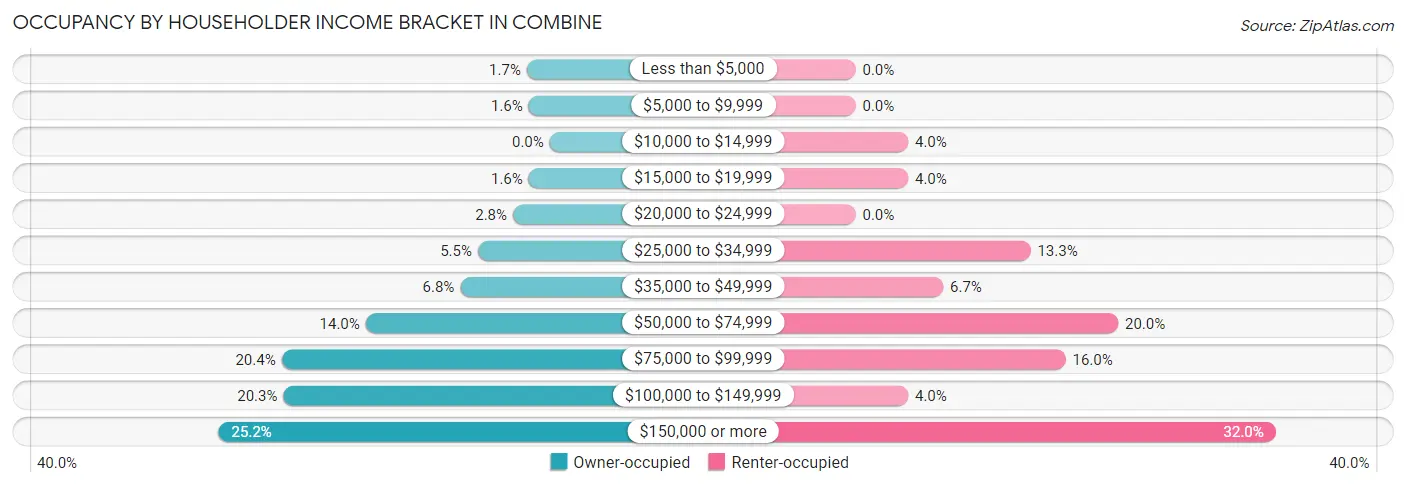
| Income Bracket | Owner-occupied | Renter-occupied |
| Less than $5,000 | 13 (1.7%) | 0 (0.0%) |
| $5,000 to $9,999 | 12 (1.6%) | 0 (0.0%) |
| $10,000 to $14,999 | 0 (0.0%) | 3 (4.0%) |
| $15,000 to $19,999 | 12 (1.6%) | 3 (4.0%) |
| $20,000 to $24,999 | 21 (2.8%) | 0 (0.0%) |
| $25,000 to $34,999 | 41 (5.5%) | 10 (13.3%) |
| $35,000 to $49,999 | 51 (6.8%) | 5 (6.7%) |
| $50,000 to $74,999 | 105 (14.0%) | 15 (20.0%) |
| $75,000 to $99,999 | 153 (20.4%) | 12 (16.0%) |
| $100,000 to $149,999 | 152 (20.3%) | 3 (4.0%) |
| $150,000 or more | 189 (25.2%) | 24 (32.0%) |
| Total | 749 (100.0%) | 75 (100.0%) |
Monthly Housing Cost Tiers in Combine
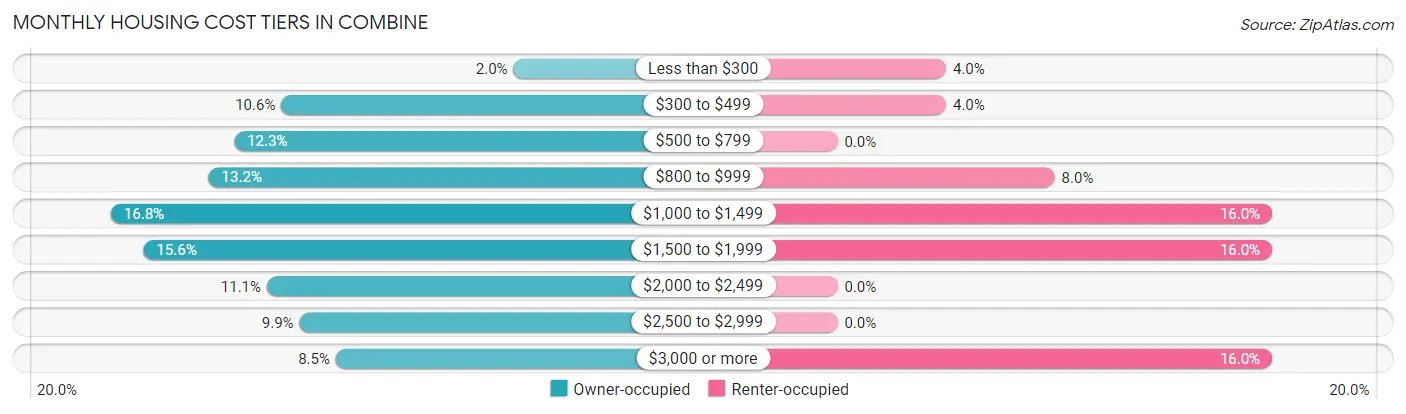
| Monthly Cost | Owner-occupied | Renter-occupied |
| Less than $300 | 15 (2.0%) | 3 (4.0%) |
| $300 to $499 | 79 (10.5%) | 3 (4.0%) |
| $500 to $799 | 92 (12.3%) | 0 (0.0%) |
| $800 to $999 | 99 (13.2%) | 6 (8.0%) |
| $1,000 to $1,499 | 126 (16.8%) | 12 (16.0%) |
| $1,500 to $1,999 | 117 (15.6%) | 12 (16.0%) |
| $2,000 to $2,499 | 83 (11.1%) | 0 (0.0%) |
| $2,500 to $2,999 | 74 (9.9%) | 0 (0.0%) |
| $3,000 or more | 64 (8.5%) | 12 (16.0%) |
| Total | 749 (100.0%) | 75 (100.0%) |
Physical Housing Characteristics in Combine
Housing Structures in Combine
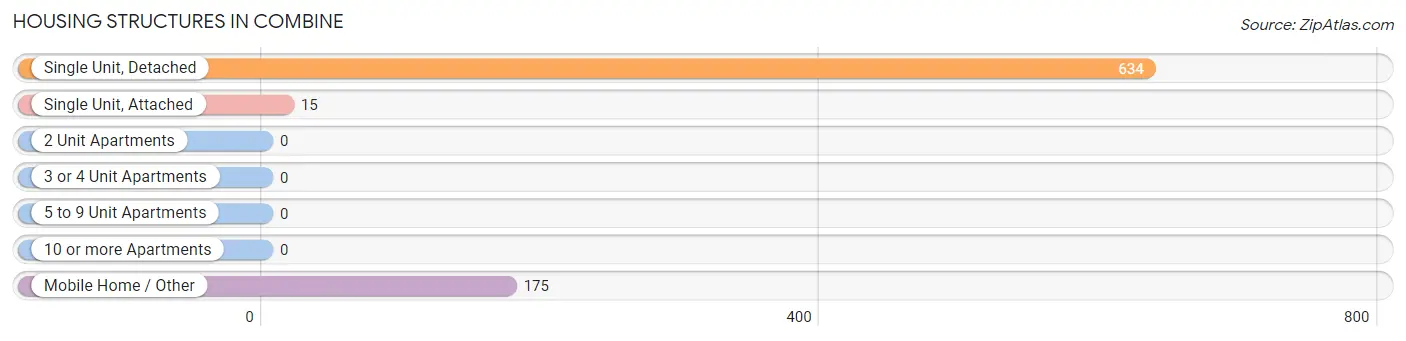
| Structure Type | # Housing Units | % Housing Units |
| Single Unit, Detached | 634 | 76.9% |
| Single Unit, Attached | 15 | 1.8% |
| 2 Unit Apartments | 0 | 0.0% |
| 3 or 4 Unit Apartments | 0 | 0.0% |
| 5 to 9 Unit Apartments | 0 | 0.0% |
| 10 or more Apartments | 0 | 0.0% |
| Mobile Home / Other | 175 | 21.2% |
| Total | 824 | 100.0% |
Housing Structures by Occupancy in Combine
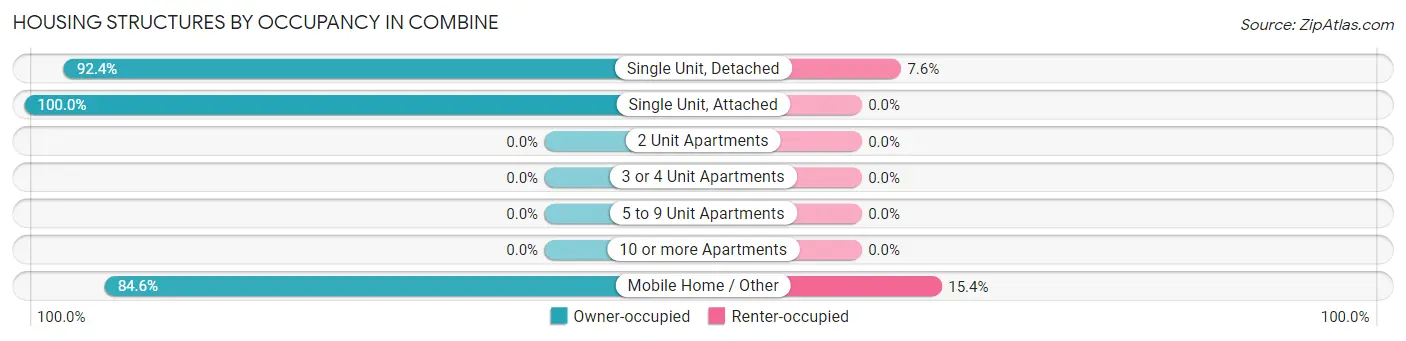
| Structure Type | Owner-occupied | Renter-occupied |
| Single Unit, Detached | 586 (92.4%) | 48 (7.6%) |
| Single Unit, Attached | 15 (100.0%) | 0 (0.0%) |
| 2 Unit Apartments | 0 (0.0%) | 0 (0.0%) |
| 3 or 4 Unit Apartments | 0 (0.0%) | 0 (0.0%) |
| 5 to 9 Unit Apartments | 0 (0.0%) | 0 (0.0%) |
| 10 or more Apartments | 0 (0.0%) | 0 (0.0%) |
| Mobile Home / Other | 148 (84.6%) | 27 (15.4%) |
| Total | 749 (90.9%) | 75 (9.1%) |
Housing Structures by Number of Rooms in Combine
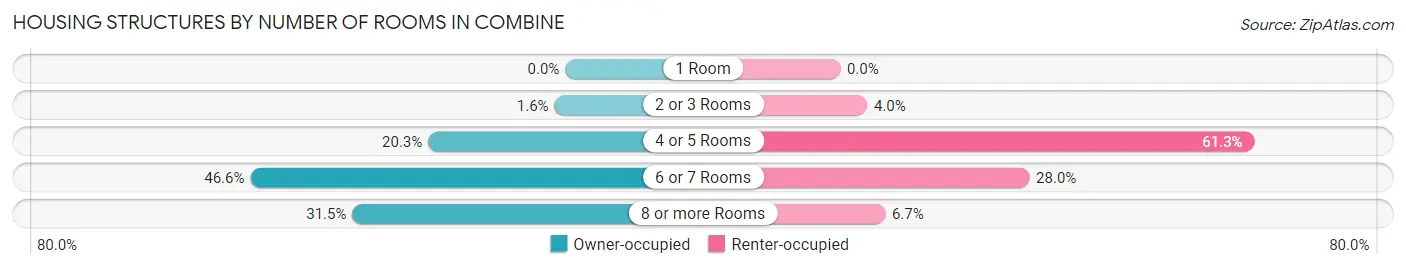
| Number of Rooms | Owner-occupied | Renter-occupied |
| 1 Room | 0 (0.0%) | 0 (0.0%) |
| 2 or 3 Rooms | 12 (1.6%) | 3 (4.0%) |
| 4 or 5 Rooms | 152 (20.3%) | 46 (61.3%) |
| 6 or 7 Rooms | 349 (46.6%) | 21 (28.0%) |
| 8 or more Rooms | 236 (31.5%) | 5 (6.7%) |
| Total | 749 (100.0%) | 75 (100.0%) |
Housing Structure by Heating Type in Combine
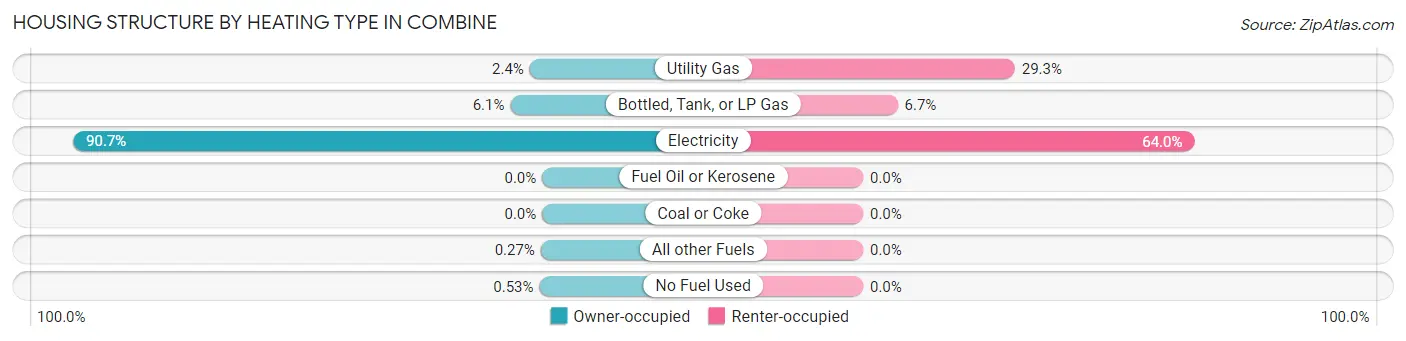
| Heating Type | Owner-occupied | Renter-occupied |
| Utility Gas | 18 (2.4%) | 22 (29.3%) |
| Bottled, Tank, or LP Gas | 46 (6.1%) | 5 (6.7%) |
| Electricity | 679 (90.6%) | 48 (64.0%) |
| Fuel Oil or Kerosene | 0 (0.0%) | 0 (0.0%) |
| Coal or Coke | 0 (0.0%) | 0 (0.0%) |
| All other Fuels | 2 (0.3%) | 0 (0.0%) |
| No Fuel Used | 4 (0.5%) | 0 (0.0%) |
| Total | 749 (100.0%) | 75 (100.0%) |
Household Vehicle Usage in Combine
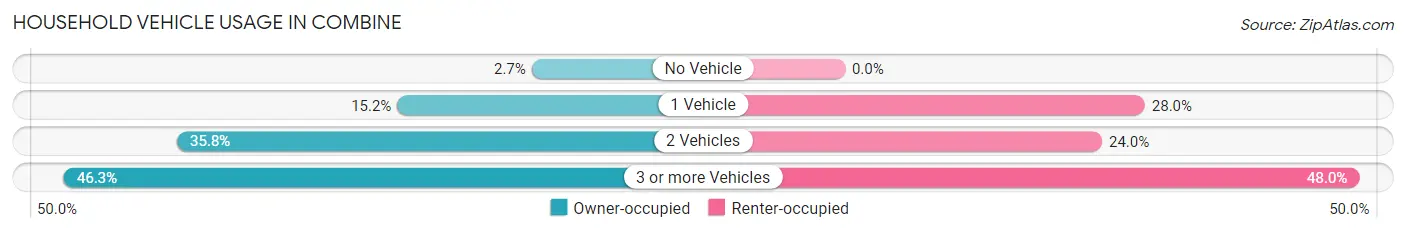
| Vehicles per Household | Owner-occupied | Renter-occupied |
| No Vehicle | 20 (2.7%) | 0 (0.0%) |
| 1 Vehicle | 114 (15.2%) | 21 (28.0%) |
| 2 Vehicles | 268 (35.8%) | 18 (24.0%) |
| 3 or more Vehicles | 347 (46.3%) | 36 (48.0%) |
| Total | 749 (100.0%) | 75 (100.0%) |
Real Estate & Mortgages in Combine
Real Estate and Mortgage Overview in Combine
| Characteristic | Without Mortgage | With Mortgage |
| Housing Units | 366 | 383 |
| Median Property Value | $229,500 | $326,700 |
| Median Household Income | $77,222 | $107 |
| Monthly Housing Costs | $813 | $64 |
| Real Estate Taxes | $3,590 | $13 |
Property Value by Mortgage Status in Combine
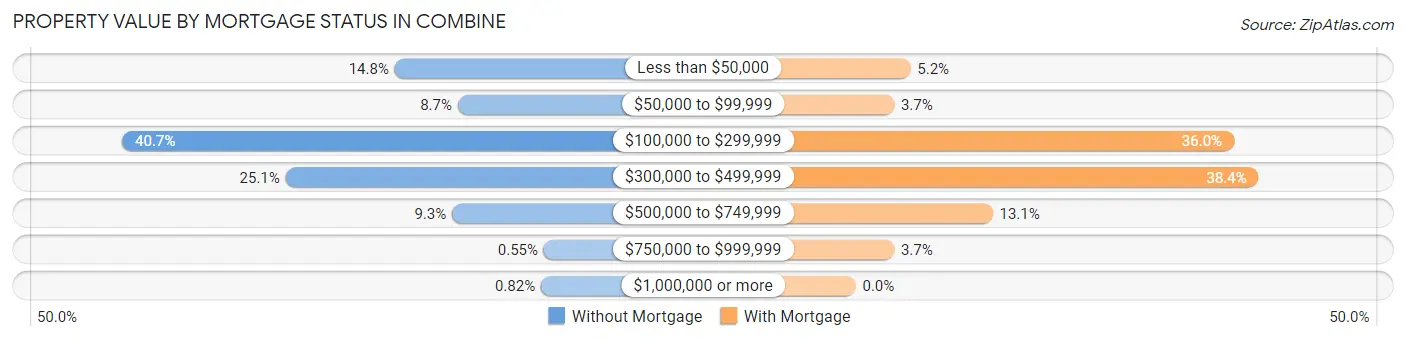
| Property Value | Without Mortgage | With Mortgage |
| Less than $50,000 | 54 (14.7%) | 20 (5.2%) |
| $50,000 to $99,999 | 32 (8.7%) | 14 (3.7%) |
| $100,000 to $299,999 | 149 (40.7%) | 138 (36.0%) |
| $300,000 to $499,999 | 92 (25.1%) | 147 (38.4%) |
| $500,000 to $749,999 | 34 (9.3%) | 50 (13.1%) |
| $750,000 to $999,999 | 2 (0.5%) | 14 (3.7%) |
| $1,000,000 or more | 3 (0.8%) | 0 (0.0%) |
| Total | 366 (100.0%) | 383 (100.0%) |
Household Income by Mortgage Status in Combine
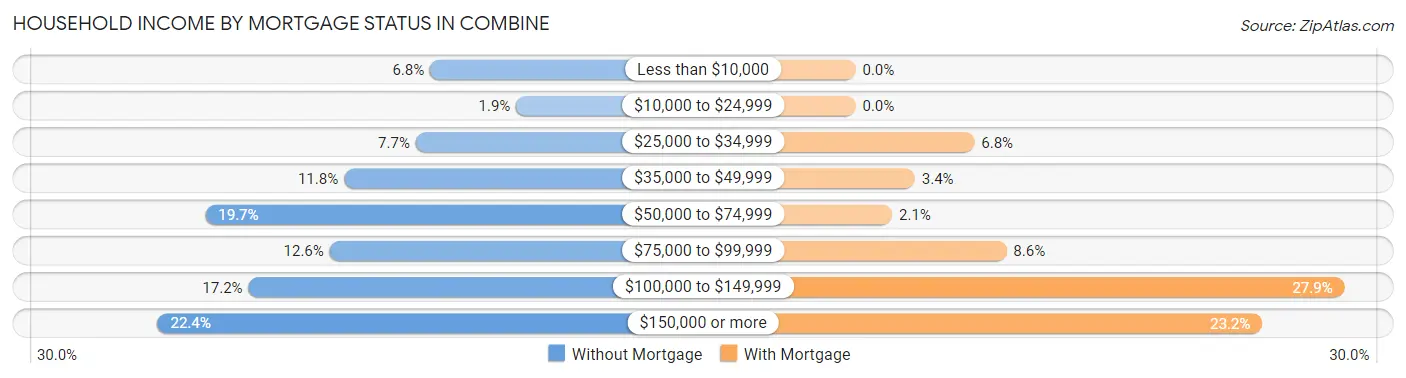
| Household Income | Without Mortgage | With Mortgage |
| Less than $10,000 | 25 (6.8%) | 0 (0.0%) |
| $10,000 to $24,999 | 7 (1.9%) | 0 (0.0%) |
| $25,000 to $34,999 | 28 (7.6%) | 26 (6.8%) |
| $35,000 to $49,999 | 43 (11.7%) | 13 (3.4%) |
| $50,000 to $74,999 | 72 (19.7%) | 8 (2.1%) |
| $75,000 to $99,999 | 46 (12.6%) | 33 (8.6%) |
| $100,000 to $149,999 | 63 (17.2%) | 107 (27.9%) |
| $150,000 or more | 82 (22.4%) | 89 (23.2%) |
| Total | 366 (100.0%) | 383 (100.0%) |
Property Value to Household Income Ratio in Combine
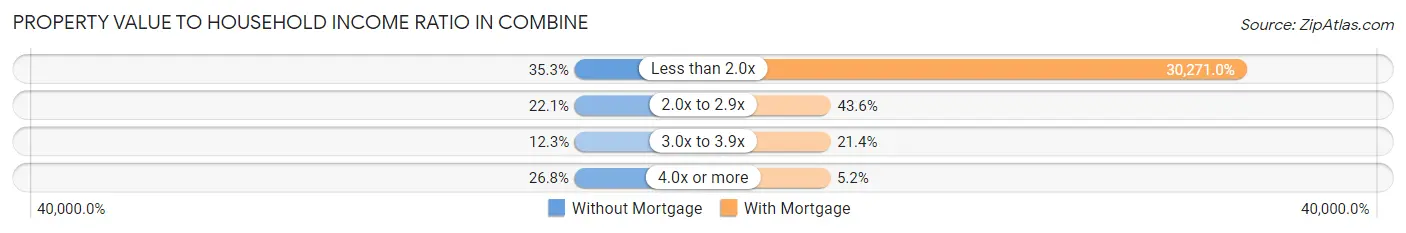
| Value-to-Income Ratio | Without Mortgage | With Mortgage |
| Less than 2.0x | 129 (35.2%) | 115,938 (30,271.0%) |
| 2.0x to 2.9x | 81 (22.1%) | 167 (43.6%) |
| 3.0x to 3.9x | 45 (12.3%) | 82 (21.4%) |
| 4.0x or more | 98 (26.8%) | 20 (5.2%) |
| Total | 366 (100.0%) | 383 (100.0%) |
Real Estate Taxes by Mortgage Status in Combine
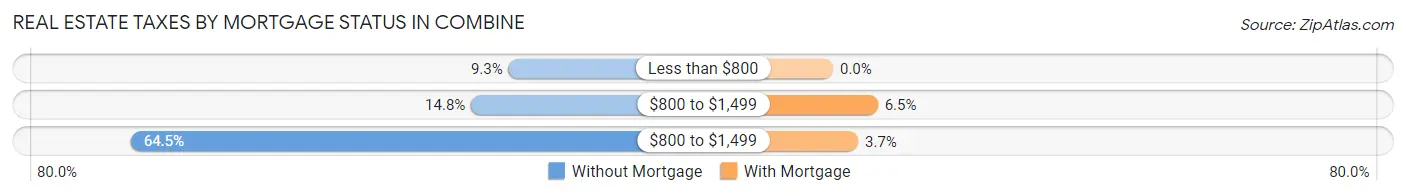
| Property Taxes | Without Mortgage | With Mortgage |
| Less than $800 | 34 (9.3%) | 0 (0.0%) |
| $800 to $1,499 | 54 (14.7%) | 25 (6.5%) |
| $800 to $1,499 | 236 (64.5%) | 14 (3.7%) |
| Total | 366 (100.0%) | 383 (100.0%) |
Health & Disability in Combine
Health Insurance Coverage by Age in Combine
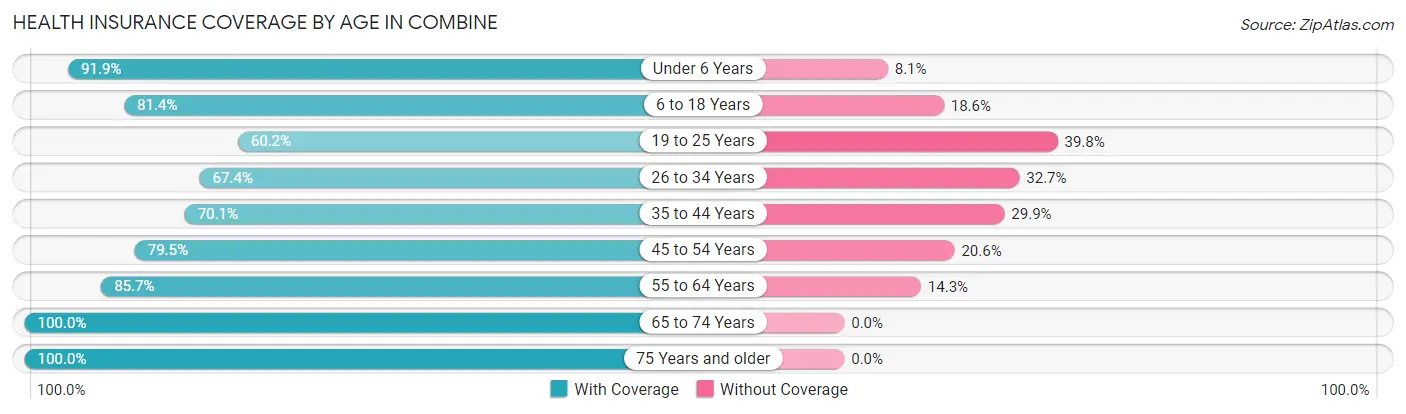
| Age Bracket | With Coverage | Without Coverage |
| Under 6 Years | 136 (91.9%) | 12 (8.1%) |
| 6 to 18 Years | 430 (81.4%) | 98 (18.6%) |
| 19 to 25 Years | 103 (60.2%) | 68 (39.8%) |
| 26 to 34 Years | 99 (67.3%) | 48 (32.7%) |
| 35 to 44 Years | 343 (70.1%) | 146 (29.9%) |
| 45 to 54 Years | 344 (79.4%) | 89 (20.5%) |
| 55 to 64 Years | 246 (85.7%) | 41 (14.3%) |
| 65 to 74 Years | 285 (100.0%) | 0 (0.0%) |
| 75 Years and older | 121 (100.0%) | 0 (0.0%) |
| Total | 2,107 (80.8%) | 502 (19.2%) |
Health Insurance Coverage by Citizenship Status in Combine
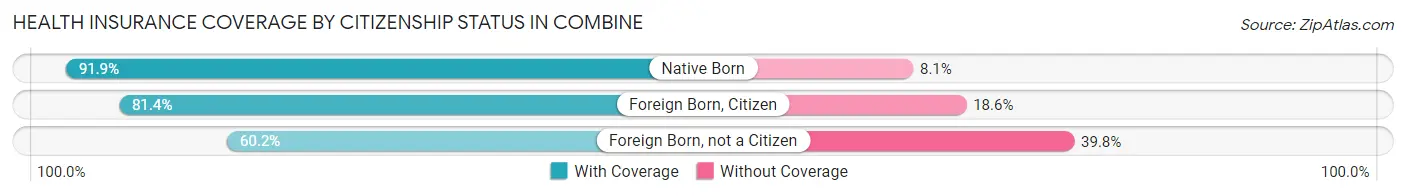
| Citizenship Status | With Coverage | Without Coverage |
| Native Born | 136 (91.9%) | 12 (8.1%) |
| Foreign Born, Citizen | 430 (81.4%) | 98 (18.6%) |
| Foreign Born, not a Citizen | 103 (60.2%) | 68 (39.8%) |
Health Insurance Coverage by Household Income in Combine
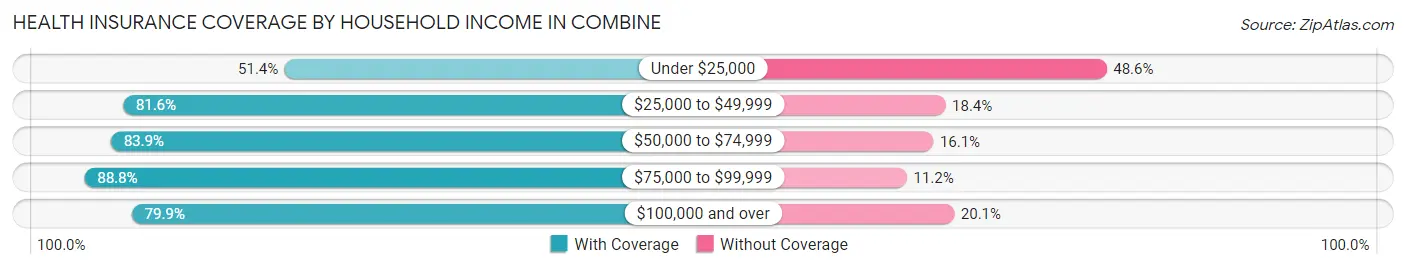
| Household Income | With Coverage | Without Coverage |
| Under $25,000 | 56 (51.4%) | 53 (48.6%) |
| $25,000 to $49,999 | 217 (81.6%) | 49 (18.4%) |
| $50,000 to $74,999 | 317 (83.9%) | 61 (16.1%) |
| $75,000 to $99,999 | 373 (88.8%) | 47 (11.2%) |
| $100,000 and over | 1,136 (79.9%) | 285 (20.1%) |
Public vs Private Health Insurance Coverage by Age in Combine
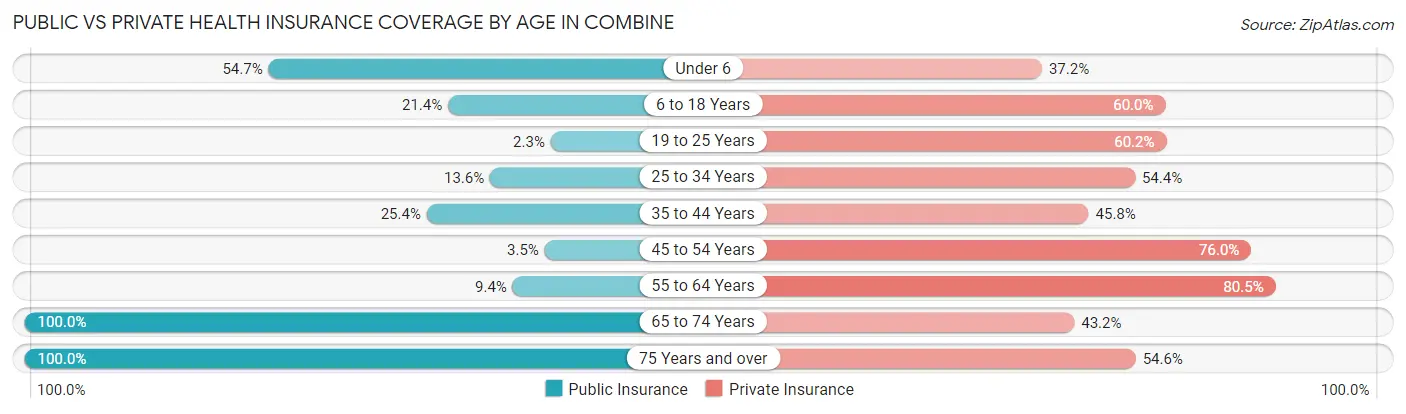
| Age Bracket | Public Insurance | Private Insurance |
| Under 6 | 81 (54.7%) | 55 (37.2%) |
| 6 to 18 Years | 113 (21.4%) | 317 (60.0%) |
| 19 to 25 Years | 4 (2.3%) | 103 (60.2%) |
| 25 to 34 Years | 20 (13.6%) | 80 (54.4%) |
| 35 to 44 Years | 124 (25.4%) | 224 (45.8%) |
| 45 to 54 Years | 15 (3.5%) | 329 (76.0%) |
| 55 to 64 Years | 27 (9.4%) | 231 (80.5%) |
| 65 to 74 Years | 285 (100.0%) | 123 (43.2%) |
| 75 Years and over | 121 (100.0%) | 66 (54.5%) |
| Total | 790 (30.3%) | 1,528 (58.6%) |
Disability Status by Sex by Age in Combine
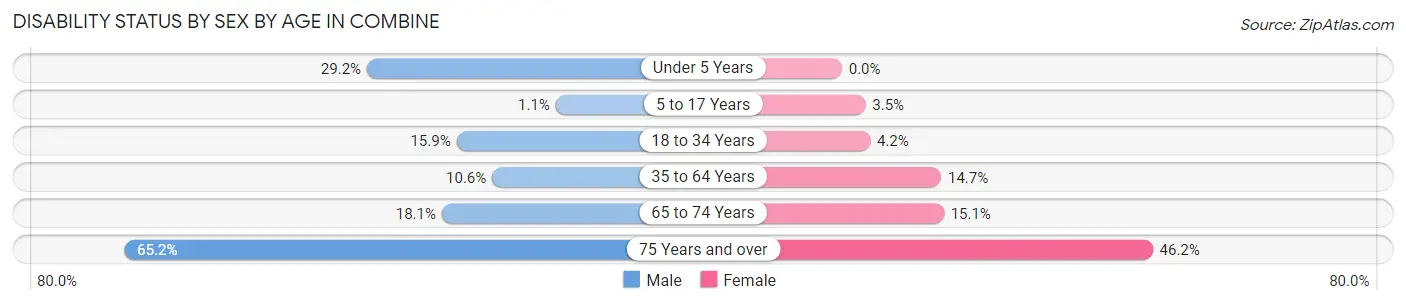
| Age Bracket | Male | Female |
| Under 5 Years | 7 (29.2%) | 0 (0.0%) |
| 5 to 17 Years | 3 (1.1%) | 10 (3.5%) |
| 18 to 34 Years | 30 (15.9%) | 8 (4.2%) |
| 35 to 64 Years | 64 (10.6%) | 89 (14.7%) |
| 65 to 74 Years | 24 (18.0%) | 23 (15.1%) |
| 75 Years and over | 45 (65.2%) | 24 (46.2%) |
Disability Class by Sex by Age in Combine
Disability Class: Hearing Difficulty
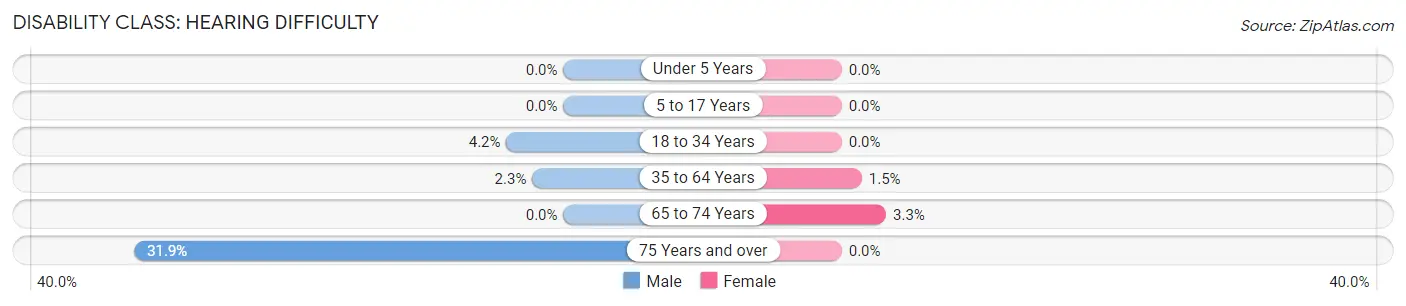
| Age Bracket | Male | Female |
| Under 5 Years | 0 (0.0%) | 0 (0.0%) |
| 5 to 17 Years | 0 (0.0%) | 0 (0.0%) |
| 18 to 34 Years | 8 (4.2%) | 0 (0.0%) |
| 35 to 64 Years | 14 (2.3%) | 9 (1.5%) |
| 65 to 74 Years | 0 (0.0%) | 5 (3.3%) |
| 75 Years and over | 22 (31.9%) | 0 (0.0%) |
Disability Class: Vision Difficulty
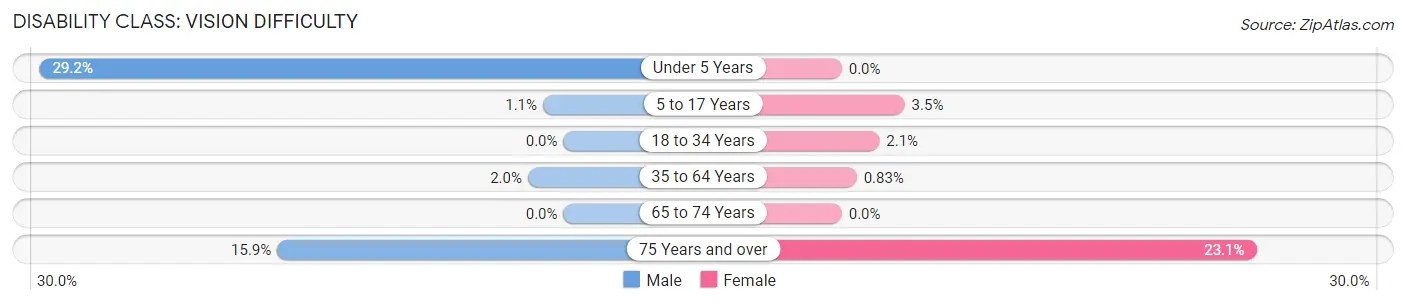
| Age Bracket | Male | Female |
| Under 5 Years | 7 (29.2%) | 0 (0.0%) |
| 5 to 17 Years | 3 (1.1%) | 10 (3.5%) |
| 18 to 34 Years | 0 (0.0%) | 4 (2.1%) |
| 35 to 64 Years | 12 (2.0%) | 5 (0.8%) |
| 65 to 74 Years | 0 (0.0%) | 0 (0.0%) |
| 75 Years and over | 11 (15.9%) | 12 (23.1%) |
Disability Class: Cognitive Difficulty
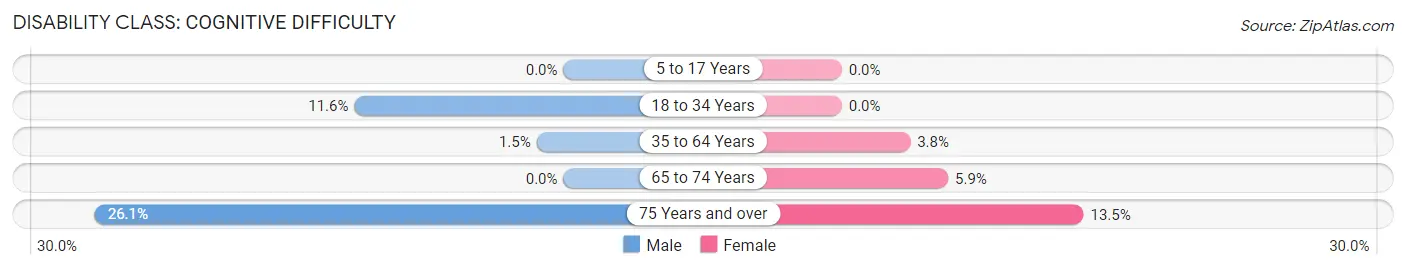
| Age Bracket | Male | Female |
| 5 to 17 Years | 0 (0.0%) | 0 (0.0%) |
| 18 to 34 Years | 22 (11.6%) | 0 (0.0%) |
| 35 to 64 Years | 9 (1.5%) | 23 (3.8%) |
| 65 to 74 Years | 0 (0.0%) | 9 (5.9%) |
| 75 Years and over | 18 (26.1%) | 7 (13.5%) |
Disability Class: Ambulatory Difficulty
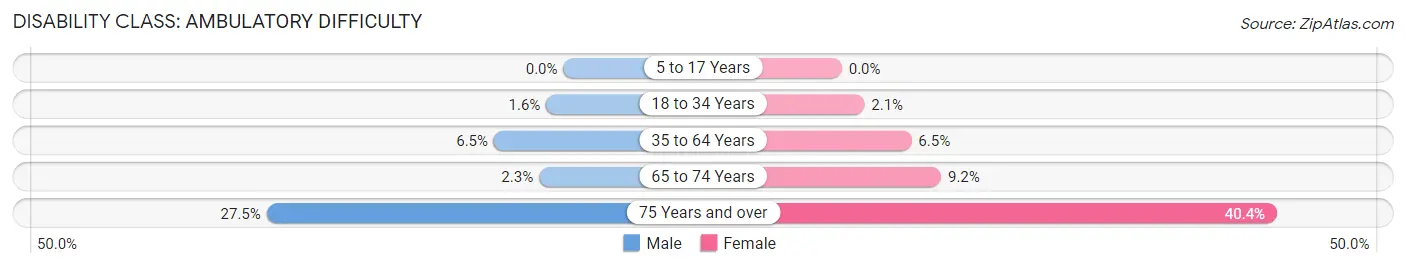
| Age Bracket | Male | Female |
| 5 to 17 Years | 0 (0.0%) | 0 (0.0%) |
| 18 to 34 Years | 3 (1.6%) | 4 (2.1%) |
| 35 to 64 Years | 39 (6.5%) | 39 (6.5%) |
| 65 to 74 Years | 3 (2.3%) | 14 (9.2%) |
| 75 Years and over | 19 (27.5%) | 21 (40.4%) |
Disability Class: Self-Care Difficulty
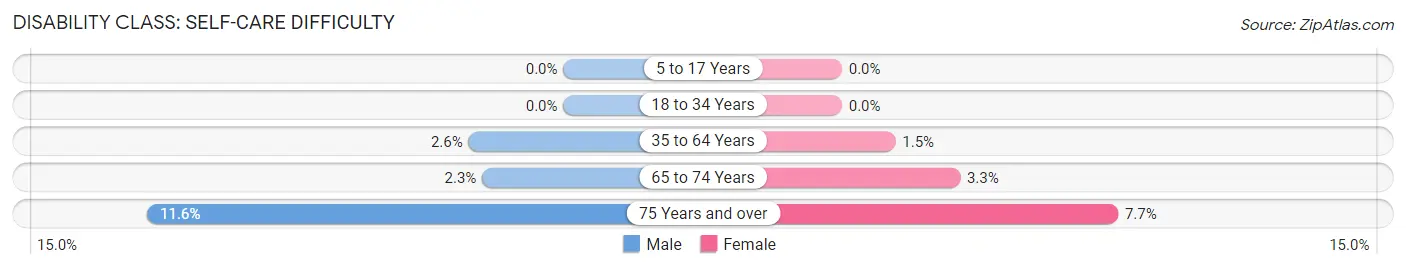
| Age Bracket | Male | Female |
| 5 to 17 Years | 0 (0.0%) | 0 (0.0%) |
| 18 to 34 Years | 0 (0.0%) | 0 (0.0%) |
| 35 to 64 Years | 16 (2.6%) | 9 (1.5%) |
| 65 to 74 Years | 3 (2.3%) | 5 (3.3%) |
| 75 Years and over | 8 (11.6%) | 4 (7.7%) |
Technology Access in Combine
Computing Device Access in Combine
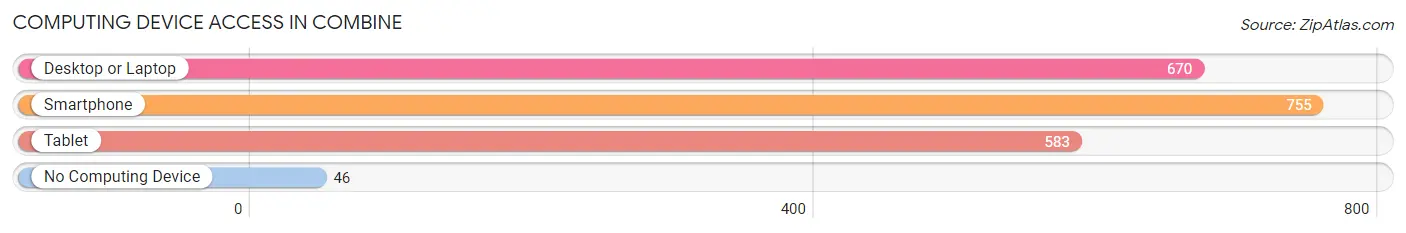
| Device Type | # Households | % Households |
| Desktop or Laptop | 670 | 81.3% |
| Smartphone | 755 | 91.6% |
| Tablet | 583 | 70.8% |
| No Computing Device | 46 | 5.6% |
| Total | 824 | 100.0% |
Internet Access in Combine
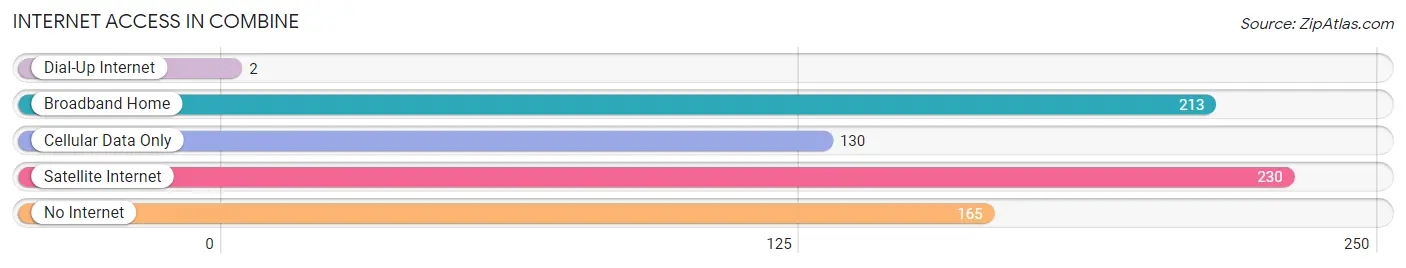
| Internet Type | # Households | % Households |
| Dial-Up Internet | 2 | 0.2% |
| Broadband Home | 213 | 25.9% |
| Cellular Data Only | 130 | 15.8% |
| Satellite Internet | 230 | 27.9% |
| No Internet | 165 | 20.0% |
| Total | 824 | 100.0% |
Combine Summary
Texas is a state located in the south-central region of the United States. It is the second largest state in the country, both in terms of population and land area. Texas has a rich history, diverse geography, and a vibrant economy. Its demographics are also unique, with a large population of Hispanic and African American residents.
History
Texas has a long and varied history, beginning with its first inhabitants, the Native American tribes of the Caddo, Comanche, and Apache. These tribes were later joined by Spanish explorers in the 16th century, who established missions and settlements in the area. In 1821, Texas became part of Mexico, and in 1836, it declared its independence and became the Republic of Texas. After a brief period of independence, Texas was annexed by the United States in 1845. During the Civil War, Texas was a Confederate state, and after the war, it became part of the Reconstruction era. In the late 19th century, Texas experienced a period of rapid growth and development, becoming an important center of industry and agriculture.
Geography
Texas is a large and diverse state, with a variety of geographical features. It is bordered by the states of Oklahoma, Arkansas, Louisiana, and New Mexico, as well as the Gulf of Mexico. The state is divided into four distinct regions: the Gulf Coast, the Great Plains, the Hill Country, and the Panhandle. The Gulf Coast is a low-lying coastal plain, while the Great Plains are a vast expanse of flat grasslands. The Hill Country is a region of rolling hills and valleys, and the Panhandle is a region of flat plains and desert.
Economy
Texas has a strong and diverse economy, with a variety of industries. The state is a major producer of oil and natural gas, and it is also a leader in the technology and aerospace industries. Agriculture is also an important part of the economy, with the state producing a variety of crops, including cotton, corn, and wheat. Additionally, Texas is home to a number of major cities, including Houston, Dallas, and San Antonio, which are important centers of commerce and industry.
Demographics
Texas has a population of over 28 million people, making it the second most populous state in the country. The state is also one of the most diverse, with a large population of Hispanic and African American residents. Additionally, Texas has a large population of immigrants, with over 4 million foreign-born residents. The state also has a large population of Native Americans, with over 1 million residents.
Common Questions
What is Per Capita Income in Combine?
Per Capita income in Combine is $36,374.
What is the Median Family Income in Combine?
Median Family Income in Combine is $96,382.
What is the Median Household income in Combine?
Median Household Income in Combine is $90,313.
What is Income or Wage Gap in Combine?
Income or Wage Gap in Combine is 42.2%.
Women in Combine earn 57.8 cents for every dollar earned by a man.
What is Inequality or Gini Index in Combine?
Inequality or Gini Index in Combine is 0.36.
What is the Total Population of Combine?
Total Population of Combine is 2,609.
What is the Total Male Population of Combine?
Total Male Population of Combine is 1,284.
What is the Total Female Population of Combine?
Total Female Population of Combine is 1,325.
What is the Ratio of Males per 100 Females in Combine?
There are 96.91 Males per 100 Females in Combine.
What is the Ratio of Females per 100 Males in Combine?
There are 103.19 Females per 100 Males in Combine.
What is the Median Population Age in Combine?
Median Population Age in Combine is 42.2 Years.
What is the Average Family Size in Combine
Average Family Size in Combine is 3.4 People.
What is the Average Household Size in Combine
Average Household Size in Combine is 3.1 People.
How Large is the Labor Force in Combine?
There are 1,349 People in the Labor Forcein in Combine.
What is the Percentage of People in the Labor Force in Combine?
65.5% of People are in the Labor Force in Combine.
What is the Unemployment Rate in Combine?
Unemployment Rate in Combine is 6.3%.