Colorado City, TX Map & Demographics
Colorado City Map
Colorado City Overview
$22,954
PER CAPITA INCOME
$51,985
AVG FAMILY INCOME
$46,961
AVG HOUSEHOLD INCOME
44.1%
WAGE / INCOME GAP [ % ]
55.9¢/ $1
WAGE / INCOME GAP [ $ ]
$5,117
FAMILY INCOME DEFICIT
0.42
INEQUALITY / GINI INDEX
3,952
TOTAL POPULATION
1,823
MALE POPULATION
2,129
FEMALE POPULATION
85.63
MALES / 100 FEMALES
116.79
FEMALES / 100 MALES
31.4
MEDIAN AGE
4.9
AVG FAMILY SIZE
3.0
AVG HOUSEHOLD SIZE
1,803
LABOR FORCE [ PEOPLE ]
55.3%
PERCENT IN LABOR FORCE
1.6%
UNEMPLOYMENT RATE
Colorado City Zip Codes
Colorado City Area Codes
Income in Colorado City
Income Overview in Colorado City
Per Capita Income in Colorado City is $22,954, while median incomes of families and households are $51,985 and $46,961 respectively.
| Characteristic | Number | Measure |
| Per Capita Income | 3,952 | $22,954 |
| Median Family Income | 635 | $51,985 |
| Mean Family Income | 635 | $79,126 |
| Median Household Income | 1,261 | $46,961 |
| Mean Household Income | 1,261 | $59,133 |
| Income Deficit | 635 | $5,117 |
| Wage / Income Gap (%) | 3,952 | 44.05% |
| Wage / Income Gap ($) | 3,952 | 55.95¢ per $1 |
| Gini / Inequality Index | 3,952 | 0.42 |
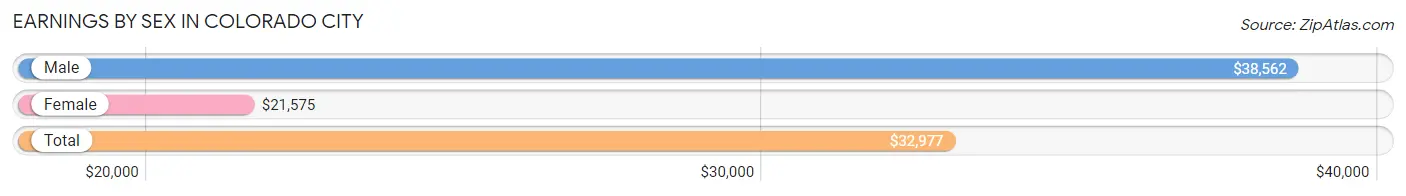
Earnings by Sex in Colorado City
Average Earnings in Colorado City are $32,977, $38,562 for men and $21,575 for women, a difference of 44.1%.
| Sex | Number | Average Earnings |
| Male | 942 (50.5%) | $38,562 |
| Female | 923 (49.5%) | $21,575 |
| Total | 1,865 (100.0%) | $32,977 |
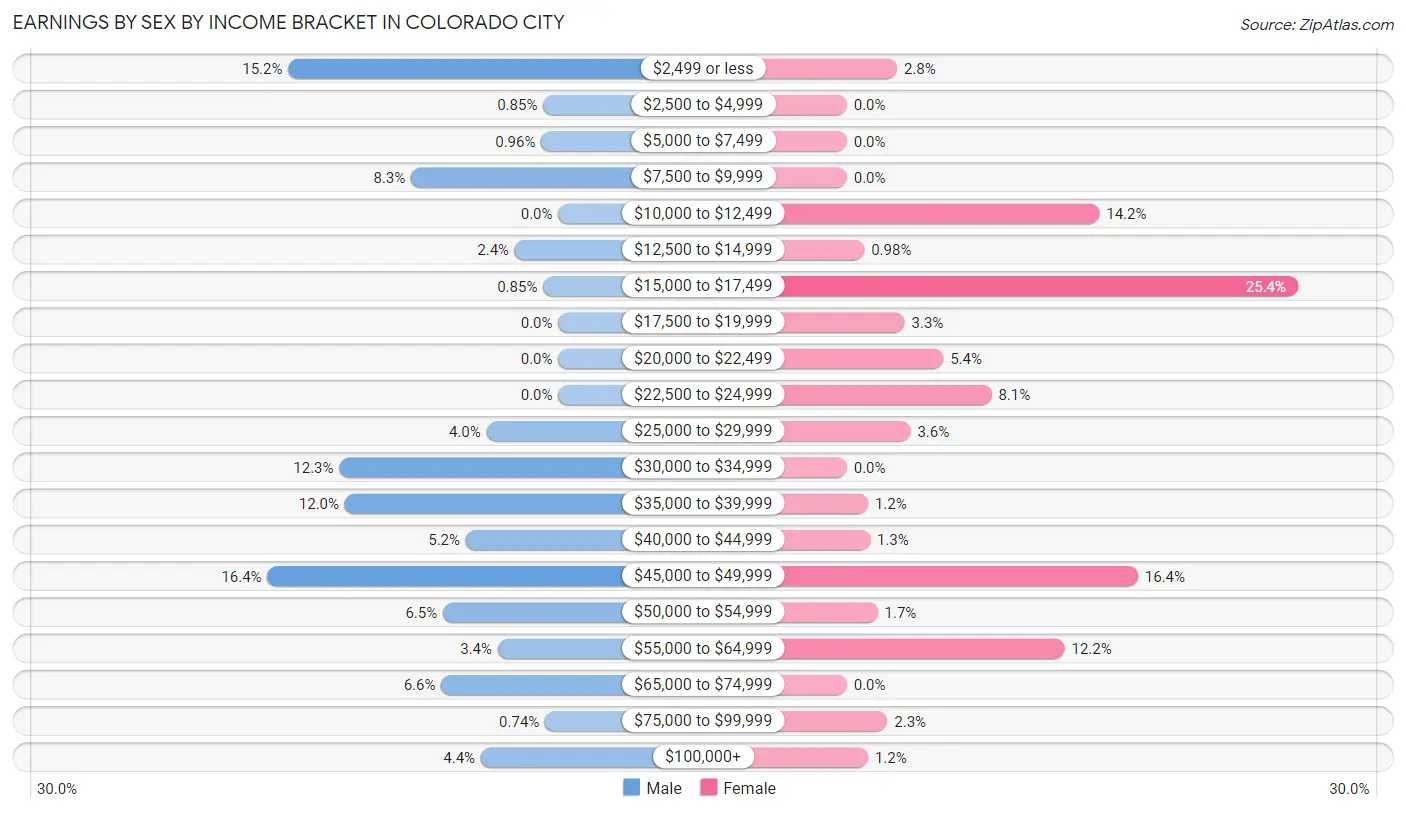
Earnings by Sex by Income Bracket in Colorado City
The most common earnings brackets in Colorado City are $45,000 to $49,999 for men (154 | 16.4%) and $15,000 to $17,499 for women (234 | 25.4%).
| Income | Male | Female |
| $2,499 or less | 143 (15.2%) | 26 (2.8%) |
| $2,500 to $4,999 | 8 (0.9%) | 0 (0.0%) |
| $5,000 to $7,499 | 9 (1.0%) | 0 (0.0%) |
| $7,500 to $9,999 | 78 (8.3%) | 0 (0.0%) |
| $10,000 to $12,499 | 0 (0.0%) | 131 (14.2%) |
| $12,500 to $14,999 | 23 (2.4%) | 9 (1.0%) |
| $15,000 to $17,499 | 8 (0.9%) | 234 (25.4%) |
| $17,500 to $19,999 | 0 (0.0%) | 30 (3.3%) |
| $20,000 to $22,499 | 0 (0.0%) | 50 (5.4%) |
| $22,500 to $24,999 | 0 (0.0%) | 75 (8.1%) |
| $25,000 to $29,999 | 38 (4.0%) | 33 (3.6%) |
| $30,000 to $34,999 | 116 (12.3%) | 0 (0.0%) |
| $35,000 to $39,999 | 113 (12.0%) | 11 (1.2%) |
| $40,000 to $44,999 | 49 (5.2%) | 12 (1.3%) |
| $45,000 to $49,999 | 154 (16.4%) | 151 (16.4%) |
| $50,000 to $54,999 | 61 (6.5%) | 16 (1.7%) |
| $55,000 to $64,999 | 32 (3.4%) | 113 (12.2%) |
| $65,000 to $74,999 | 62 (6.6%) | 0 (0.0%) |
| $75,000 to $99,999 | 7 (0.7%) | 21 (2.3%) |
| $100,000+ | 41 (4.3%) | 11 (1.2%) |
| Total | 942 (100.0%) | 923 (100.0%) |
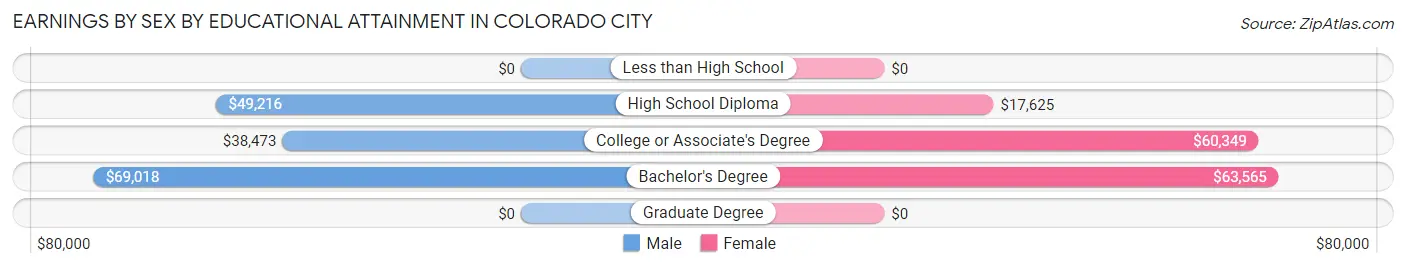
Earnings by Sex by Educational Attainment in Colorado City
Average earnings in Colorado City are $48,076 for men and $23,667 for women, a difference of 50.8%. Men with an educational attainment of bachelor's degree enjoy the highest average annual earnings of $69,018, while those with college or associate's degree education earn the least with $38,473. Women with an educational attainment of bachelor's degree earn the most with the average annual earnings of $63,565, while those with high school diploma education have the smallest earnings of $17,625.
| Educational Attainment | Male Income | Female Income |
| Less than High School | - | - |
| High School Diploma | $49,216 | $17,625 |
| College or Associate's Degree | $38,473 | $60,349 |
| Bachelor's Degree | $69,018 | $63,565 |
| Graduate Degree | - | - |
| Total | $48,076 | $23,667 |
Family Income in Colorado City
Family Income Brackets in Colorado City
According to the Colorado City family income data, there are 106 families falling into the $15,000 to $24,999 income range, which is the most common income bracket and makes up 16.7% of all families.
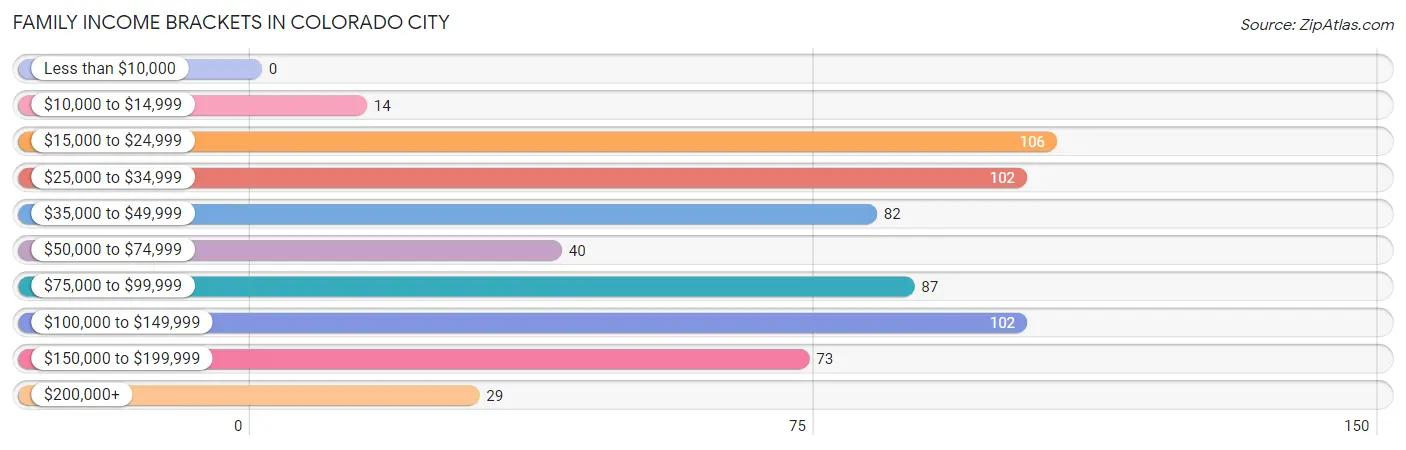
| Income Bracket | # Families | % Families |
| Less than $10,000 | 0 | 0.0% |
| $10,000 to $14,999 | 14 | 2.2% |
| $15,000 to $24,999 | 106 | 16.7% |
| $25,000 to $34,999 | 102 | 16.1% |
| $35,000 to $49,999 | 82 | 12.9% |
| $50,000 to $74,999 | 40 | 6.3% |
| $75,000 to $99,999 | 87 | 13.7% |
| $100,000 to $149,999 | 102 | 16.1% |
| $150,000 to $199,999 | 73 | 11.5% |
| $200,000+ | 29 | 4.6% |
Family Income by Famaliy Size in Colorado City
5-person families (100 | 15.8%) account for the highest median family income in Colorado City with $103,534 per family, while 2-person families (344 | 54.2%) have the highest median income of $37,678 per family member.
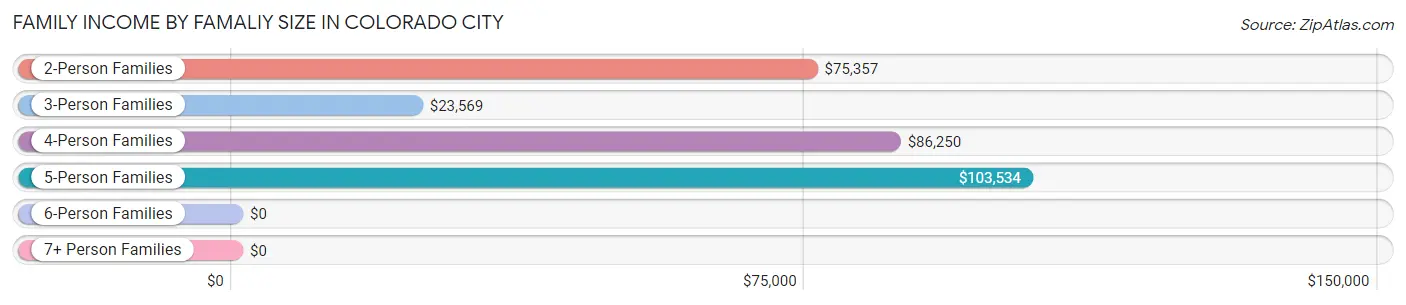
| Income Bracket | # Families | Median Income |
| 2-Person Families | 344 (54.2%) | $75,357 |
| 3-Person Families | 125 (19.7%) | $23,569 |
| 4-Person Families | 66 (10.4%) | $86,250 |
| 5-Person Families | 100 (15.8%) | $103,534 |
| 6-Person Families | 0 (0.0%) | $0 |
| 7+ Person Families | 0 (0.0%) | $0 |
| Total | 635 (100.0%) | $51,985 |
Family Income by Number of Earners in Colorado City
The median family income in Colorado City is $51,985, with families comprising 3+ earners (72) having the highest median family income of $105,303, while families with no earners (156) have the lowest median family income of $26,680, accounting for 11.3% and 24.6% of families, respectively.
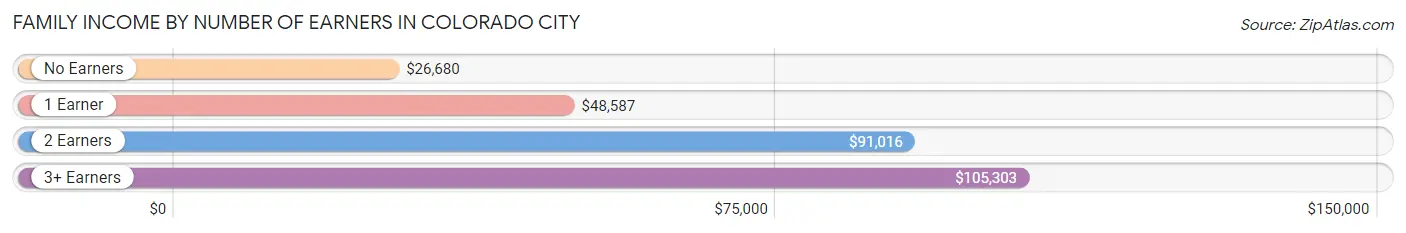
| Number of Earners | # Families | Median Income |
| No Earners | 156 (24.6%) | $26,680 |
| 1 Earner | 240 (37.8%) | $48,587 |
| 2 Earners | 167 (26.3%) | $91,016 |
| 3+ Earners | 72 (11.3%) | $105,303 |
| Total | 635 (100.0%) | $51,985 |
Household Income in Colorado City
Household Income Brackets in Colorado City
With 369 households falling in the category, the $35,000 to $49,999 income range is the most frequent in Colorado City, accounting for 29.3% of all households. In contrast, only 16 households (1.3%) fall into the less than $10,000 income bracket, making it the least populous group.
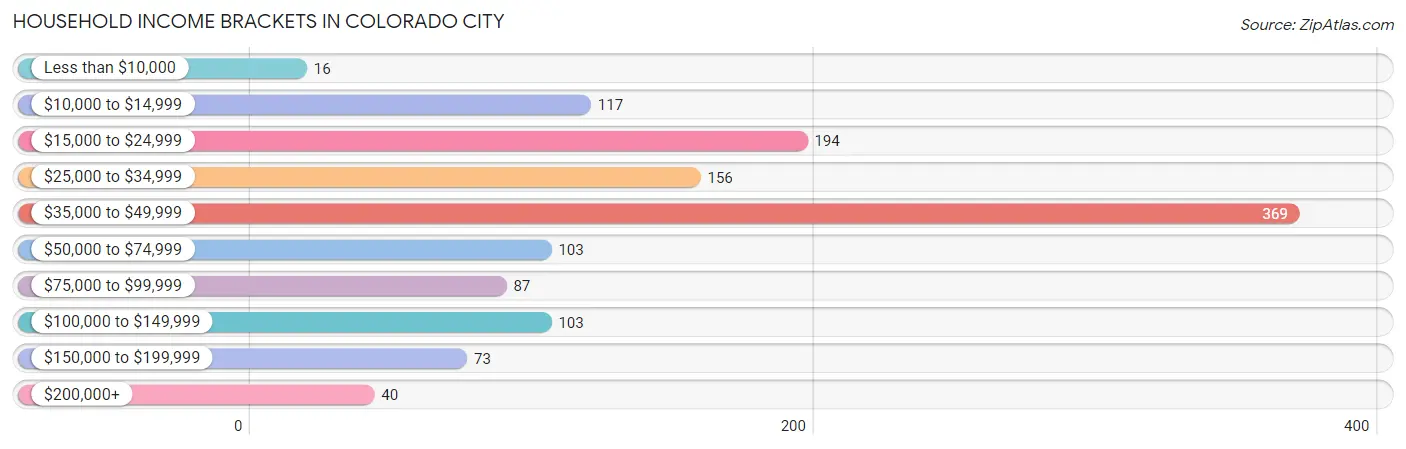
| Income Bracket | # Households | % Households |
| Less than $10,000 | 16 | 1.3% |
| $10,000 to $14,999 | 117 | 9.3% |
| $15,000 to $24,999 | 194 | 15.4% |
| $25,000 to $34,999 | 156 | 12.4% |
| $35,000 to $49,999 | 369 | 29.3% |
| $50,000 to $74,999 | 103 | 8.2% |
| $75,000 to $99,999 | 87 | 6.9% |
| $100,000 to $149,999 | 103 | 8.2% |
| $150,000 to $199,999 | 73 | 5.8% |
| $200,000+ | 40 | 3.2% |
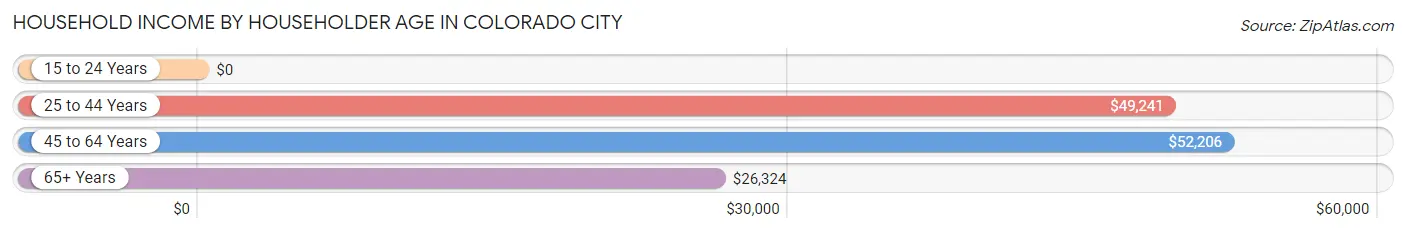
Household Income by Householder Age in Colorado City
The median household income in Colorado City is $46,961, with the highest median household income of $52,206 found in the 45 to 64 years age bracket for the primary householder. A total of 320 households (25.4%) fall into this category. Meanwhile, the 15 to 24 years age bracket for the primary householder has the lowest median household income of $0, with 155 households (12.3%) in this group.
| Income Bracket | # Households | Median Income |
| 15 to 24 Years | 155 (12.3%) | $0 |
| 25 to 44 Years | 352 (27.9%) | $49,241 |
| 45 to 64 Years | 320 (25.4%) | $52,206 |
| 65+ Years | 434 (34.4%) | $26,324 |
| Total | 1,261 (100.0%) | $46,961 |
Poverty in Colorado City
Income Below Poverty by Sex and Age in Colorado City
With 5.6% poverty level for males and 15.6% for females among the residents of Colorado City, 5 year old males and 75 year old and over females are the most vulnerable to poverty, with 24 males (42.9%) and 73 females (35.8%) in their respective age groups living below the poverty level.
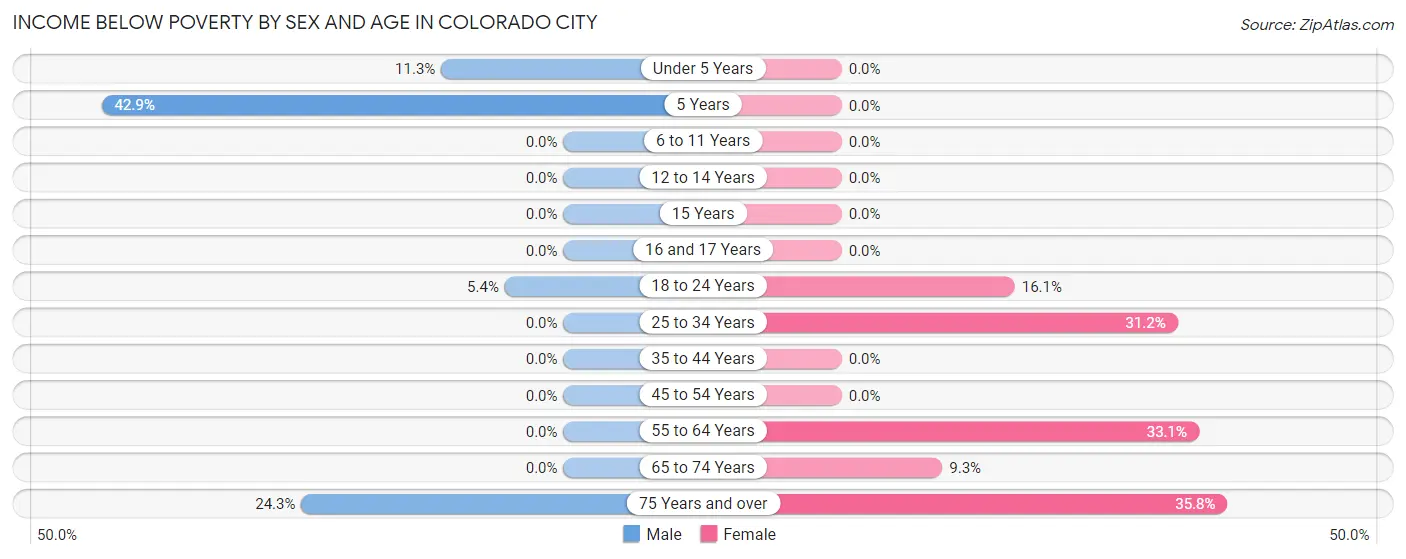
| Age Bracket | Male | Female |
| Under 5 Years | 28 (11.3%) | 0 (0.0%) |
| 5 Years | 24 (42.9%) | 0 (0.0%) |
| 6 to 11 Years | 0 (0.0%) | 0 (0.0%) |
| 12 to 14 Years | 0 (0.0%) | 0 (0.0%) |
| 15 Years | 0 (0.0%) | 0 (0.0%) |
| 16 and 17 Years | 0 (0.0%) | 0 (0.0%) |
| 18 to 24 Years | 19 (5.4%) | 88 (16.1%) |
| 25 to 34 Years | 0 (0.0%) | 86 (31.2%) |
| 35 to 44 Years | 0 (0.0%) | 0 (0.0%) |
| 45 to 54 Years | 0 (0.0%) | 0 (0.0%) |
| 55 to 64 Years | 0 (0.0%) | 55 (33.1%) |
| 65 to 74 Years | 0 (0.0%) | 18 (9.3%) |
| 75 Years and over | 27 (24.3%) | 73 (35.8%) |
| Total | 98 (5.6%) | 320 (15.6%) |
Income Above Poverty by Sex and Age in Colorado City
According to the poverty statistics in Colorado City, males aged 6 to 11 years and females aged under 5 years are the age groups that are most secure financially, with 100.0% of males and 100.0% of females in these age groups living above the poverty line.
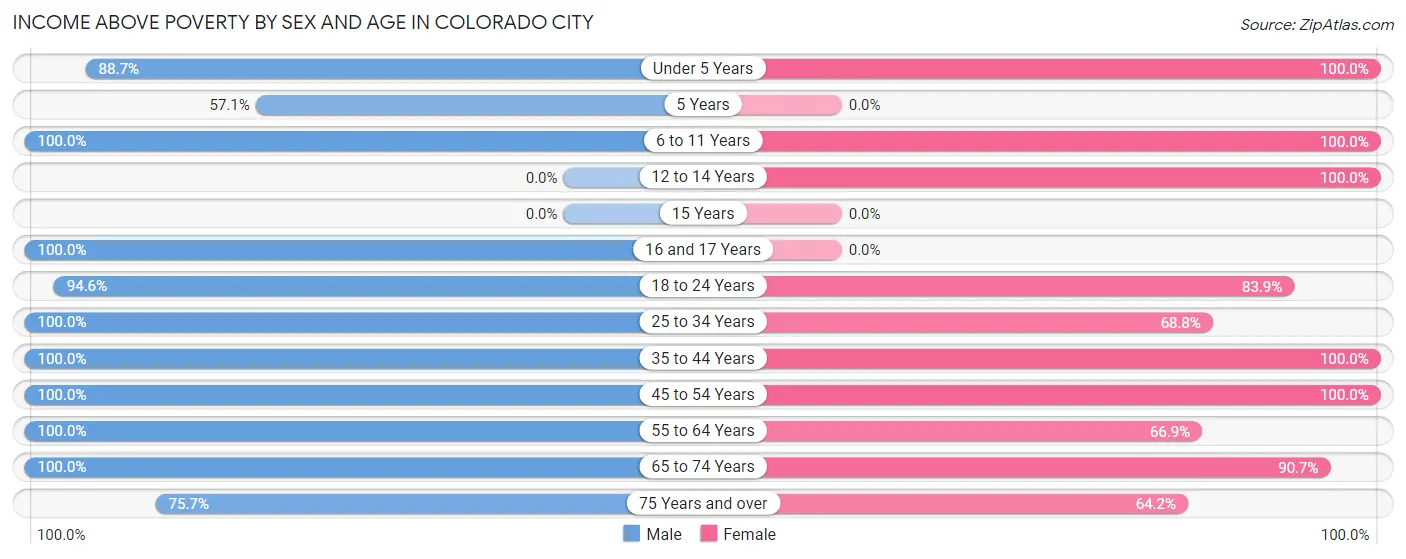
| Age Bracket | Male | Female |
| Under 5 Years | 219 (88.7%) | 106 (100.0%) |
| 5 Years | 32 (57.1%) | 0 (0.0%) |
| 6 to 11 Years | 27 (100.0%) | 223 (100.0%) |
| 12 to 14 Years | 0 (0.0%) | 33 (100.0%) |
| 15 Years | 0 (0.0%) | 0 (0.0%) |
| 16 and 17 Years | 118 (100.0%) | 0 (0.0%) |
| 18 to 24 Years | 330 (94.6%) | 460 (83.9%) |
| 25 to 34 Years | 299 (100.0%) | 190 (68.8%) |
| 35 to 44 Years | 50 (100.0%) | 78 (100.0%) |
| 45 to 54 Years | 95 (100.0%) | 221 (100.0%) |
| 55 to 64 Years | 228 (100.0%) | 111 (66.9%) |
| 65 to 74 Years | 178 (100.0%) | 175 (90.7%) |
| 75 Years and over | 84 (75.7%) | 131 (64.2%) |
| Total | 1,660 (94.4%) | 1,728 (84.4%) |
Income Below Poverty Among Married-Couple Families in Colorado City
The poverty statistics for married-couple families in Colorado City show that 12.2% or 53 of the total 435 families live below the poverty line. Families with 3 or 4 children have the highest poverty rate of 68.4%, comprising of 26 families. On the other hand, families with 1 or 2 children have the lowest poverty rate of 0.0%, which includes 0 families.
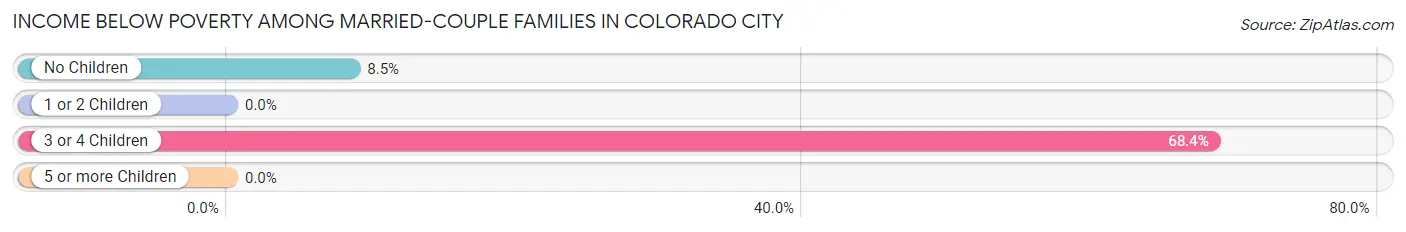
| Children | Above Poverty | Below Poverty |
| No Children | 290 (91.5%) | 27 (8.5%) |
| 1 or 2 Children | 80 (100.0%) | 0 (0.0%) |
| 3 or 4 Children | 12 (31.6%) | 26 (68.4%) |
| 5 or more Children | 0 (0.0%) | 0 (0.0%) |
| Total | 382 (87.8%) | 53 (12.2%) |
Income Below Poverty Among Single-Parent Households in Colorado City
| Children | Single Father | Single Mother |
| No Children | 0 (0.0%) | 0 (0.0%) |
| 1 or 2 Children | 0 (0.0%) | 0 (0.0%) |
| 3 or 4 Children | 0 (0.0%) | 0 (0.0%) |
| 5 or more Children | 0 (0.0%) | 0 (0.0%) |
| Total | 0 (0.0%) | 0 (0.0%) |
Income Below Poverty Among Married-Couple vs Single-Parent Households in Colorado City
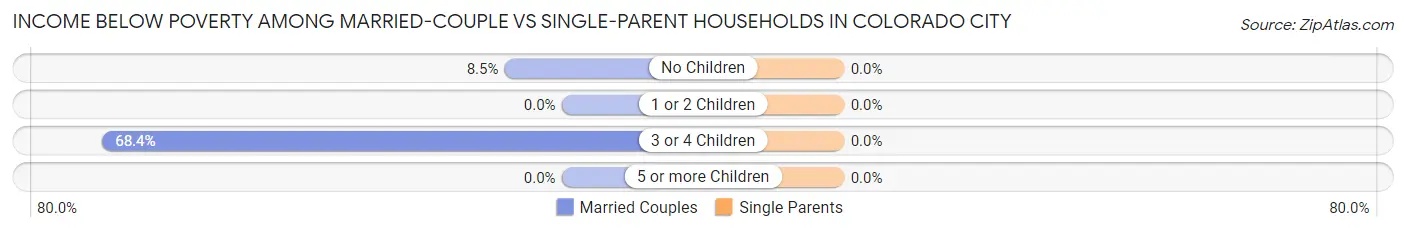
| Children | Married-Couple Families | Single-Parent Households |
| No Children | 27 (8.5%) | 0 (0.0%) |
| 1 or 2 Children | 0 (0.0%) | 0 (0.0%) |
| 3 or 4 Children | 26 (68.4%) | 0 (0.0%) |
| 5 or more Children | 0 (0.0%) | 0 (0.0%) |
| Total | 53 (12.2%) | 0 (0.0%) |
Race in Colorado City
The most populous races in Colorado City are White / Caucasian (3,041 | 76.9%), Hispanic or Latino (1,969 | 49.8%), and Two or more Races (514 | 13.0%).
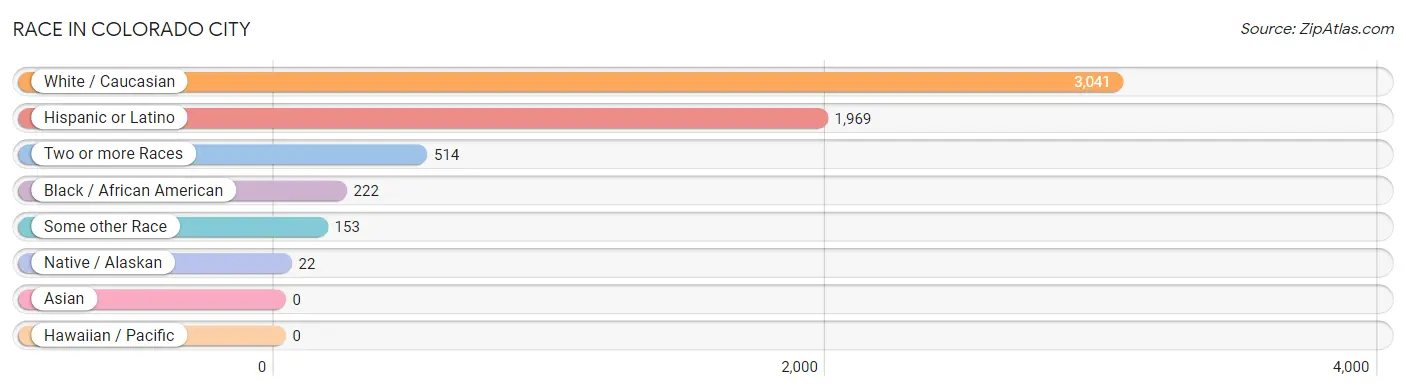
| Race | # Population | % Population |
| Asian | 0 | 0.0% |
| Black / African American | 222 | 5.6% |
| Hawaiian / Pacific | 0 | 0.0% |
| Hispanic or Latino | 1,969 | 49.8% |
| Native / Alaskan | 22 | 0.6% |
| White / Caucasian | 3,041 | 76.9% |
| Two or more Races | 514 | 13.0% |
| Some other Race | 153 | 3.9% |
| Total | 3,952 | 100.0% |
Ancestry in Colorado City
The most populous ancestries reported in Colorado City are Mexican (1,944 | 49.2%), German (405 | 10.2%), English (195 | 4.9%), American (182 | 4.6%), and Irish (93 | 2.4%), together accounting for 71.3% of all Colorado City residents.
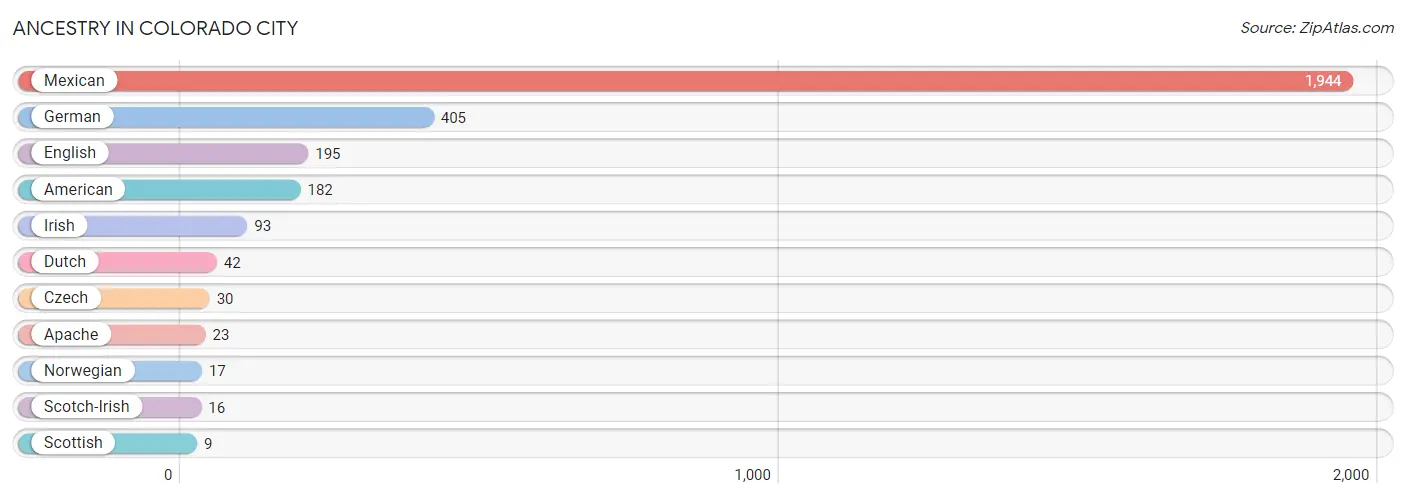
| Ancestry | # Population | % Population |
| American | 182 | 4.6% |
| Apache | 23 | 0.6% |
| Czech | 30 | 0.8% |
| Dutch | 42 | 1.1% |
| English | 195 | 4.9% |
| German | 405 | 10.2% |
| Irish | 93 | 2.4% |
| Mexican | 1,944 | 49.2% |
| Norwegian | 17 | 0.4% |
| Scotch-Irish | 16 | 0.4% |
| Scottish | 9 | 0.2% | View All 11 Rows |
Immigrants in Colorado City
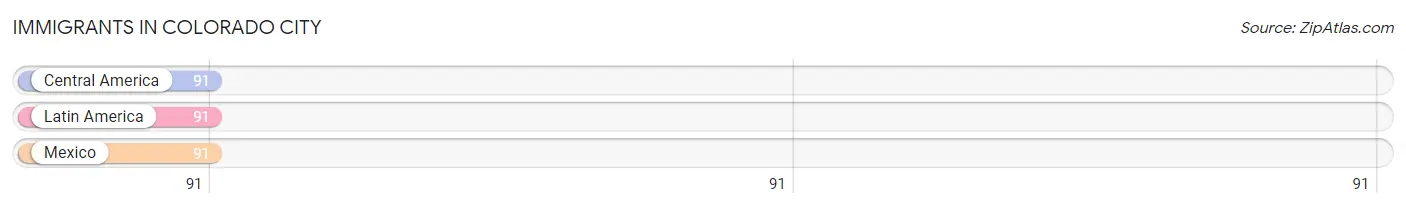
The most numerous immigrant groups reported in Colorado City came from Central America (91 | 2.3%), Latin America (91 | 2.3%), and Mexico (91 | 2.3%), together accounting for 6.9% of all Colorado City residents.
| Immigration Origin | # Population | % Population |
| Central America | 91 | 2.3% |
| Latin America | 91 | 2.3% |
| Mexico | 91 | 2.3% | View All 3 Rows |
Sex and Age in Colorado City
Sex and Age in Colorado City
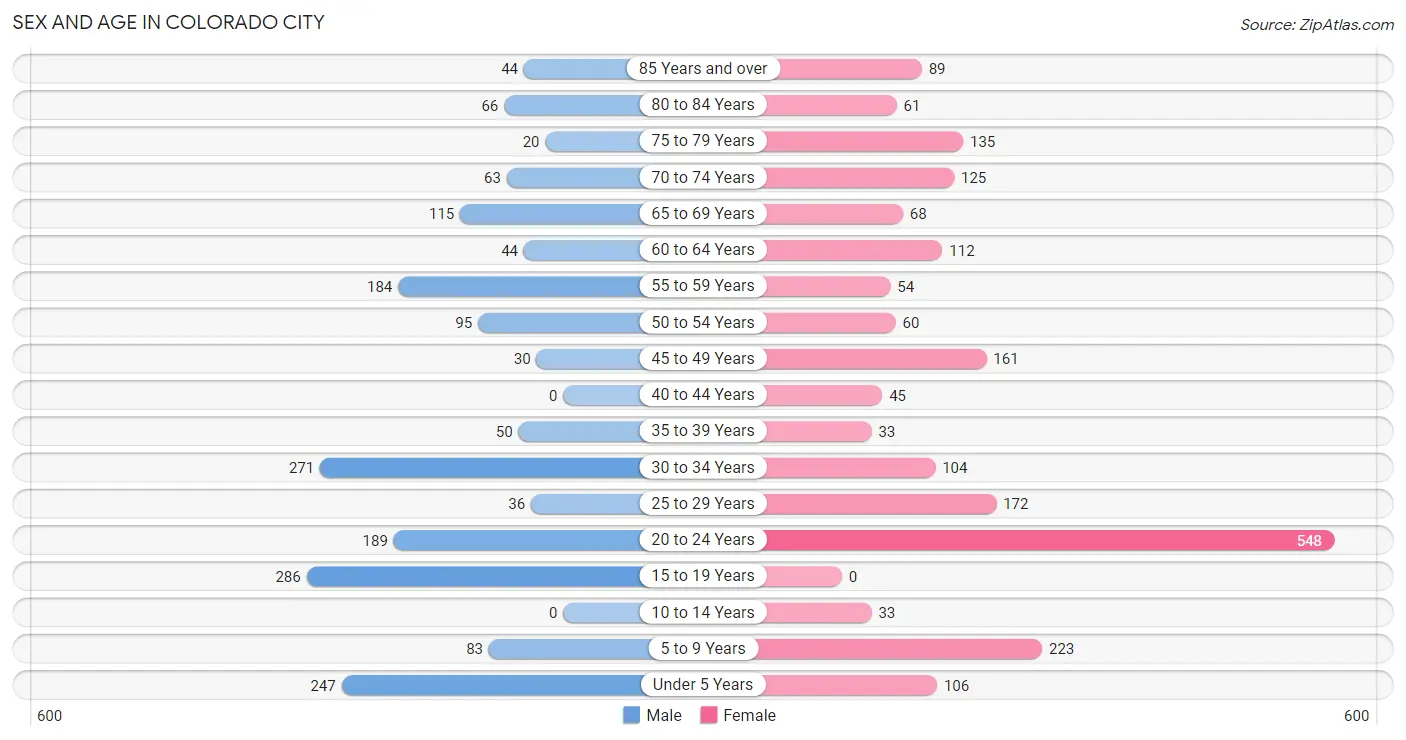
The most populous age groups in Colorado City are 15 to 19 Years (286 | 15.7%) for men and 20 to 24 Years (548 | 25.7%) for women.
| Age Bracket | Male | Female |
| Under 5 Years | 247 (13.6%) | 106 (5.0%) |
| 5 to 9 Years | 83 (4.5%) | 223 (10.5%) |
| 10 to 14 Years | 0 (0.0%) | 33 (1.5%) |
| 15 to 19 Years | 286 (15.7%) | 0 (0.0%) |
| 20 to 24 Years | 189 (10.4%) | 548 (25.7%) |
| 25 to 29 Years | 36 (2.0%) | 172 (8.1%) |
| 30 to 34 Years | 271 (14.9%) | 104 (4.9%) |
| 35 to 39 Years | 50 (2.7%) | 33 (1.5%) |
| 40 to 44 Years | 0 (0.0%) | 45 (2.1%) |
| 45 to 49 Years | 30 (1.7%) | 161 (7.6%) |
| 50 to 54 Years | 95 (5.2%) | 60 (2.8%) |
| 55 to 59 Years | 184 (10.1%) | 54 (2.5%) |
| 60 to 64 Years | 44 (2.4%) | 112 (5.3%) |
| 65 to 69 Years | 115 (6.3%) | 68 (3.2%) |
| 70 to 74 Years | 63 (3.5%) | 125 (5.9%) |
| 75 to 79 Years | 20 (1.1%) | 135 (6.3%) |
| 80 to 84 Years | 66 (3.6%) | 61 (2.9%) |
| 85 Years and over | 44 (2.4%) | 89 (4.2%) |
| Total | 1,823 (100.0%) | 2,129 (100.0%) |
Families and Households in Colorado City
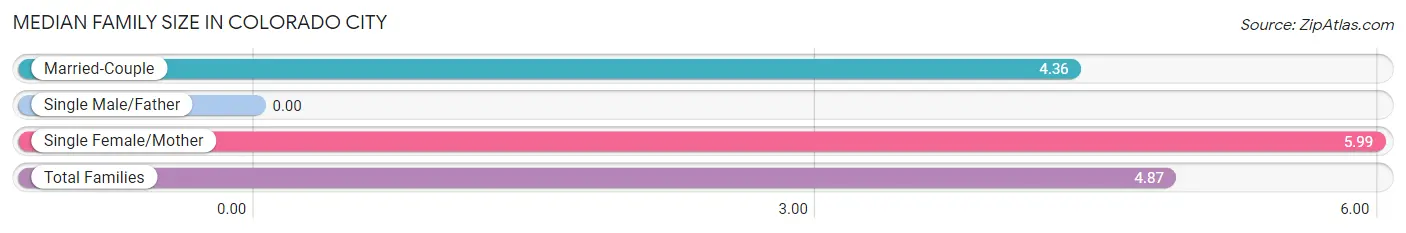
Median Family Size in Colorado City
| Family Type | # Families | Family Size |
| Married-Couple | 435 (68.5%) | 4.36 |
| Single Male/Father | 0 (0.0%) | - |
| Single Female/Mother | 200 (31.5%) | 5.99 |
| Total Families | 635 (100.0%) | 4.87 |
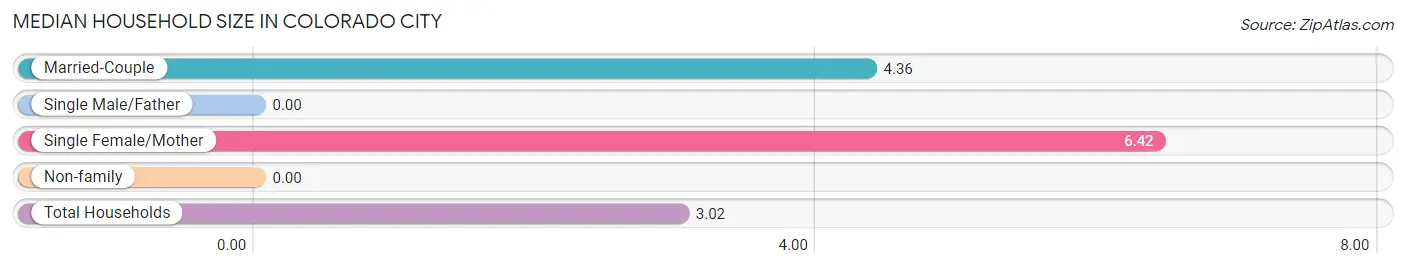
Median Household Size in Colorado City
| Household Type | # Households | Household Size |
| Married-Couple | 435 (34.5%) | 4.36 |
| Single Male/Father | 0 (0.0%) | - |
| Single Female/Mother | 200 (15.9%) | 6.42 |
| Non-family | 626 (49.6%) | - |
| Total Households | 1,261 (100.0%) | 3.02 |
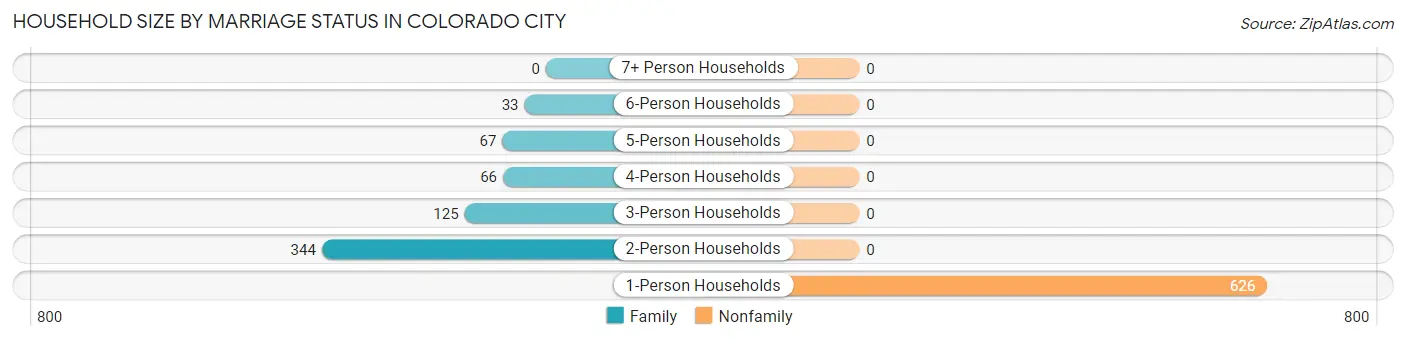
Household Size by Marriage Status in Colorado City
Out of a total of 1,261 households in Colorado City, 635 (50.4%) are family households, while 626 (49.6%) are nonfamily households. The most numerous type of family households are 2-person households, comprising 344, and the most common type of nonfamily households are 1-person households, comprising 626.
| Household Size | Family Households | Nonfamily Households |
| 1-Person Households | - | 626 (49.6%) |
| 2-Person Households | 344 (27.3%) | 0 (0.0%) |
| 3-Person Households | 125 (9.9%) | 0 (0.0%) |
| 4-Person Households | 66 (5.2%) | 0 (0.0%) |
| 5-Person Households | 67 (5.3%) | 0 (0.0%) |
| 6-Person Households | 33 (2.6%) | 0 (0.0%) |
| 7+ Person Households | 0 (0.0%) | 0 (0.0%) |
| Total | 635 (50.4%) | 626 (49.6%) |
Female Fertility in Colorado City
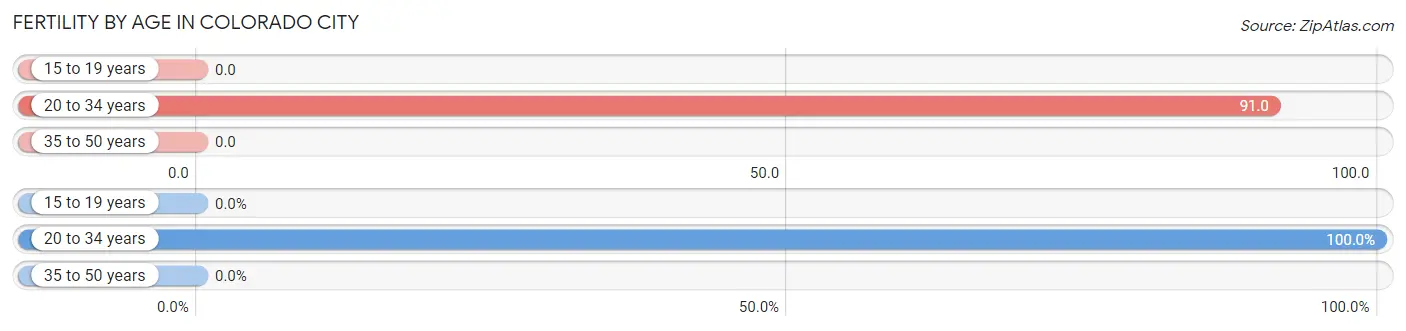
Fertility by Age in Colorado City
Average fertility rate in Colorado City is 70.0 births per 1,000 women. Women in the age bracket of 20 to 34 years have the highest fertility rate with 91.0 births per 1,000 women. Women in the age bracket of 20 to 34 years acount for 100.0% of all women with births.
| Age Bracket | Women with Births | Births / 1,000 Women |
| 15 to 19 years | 0 (0.0%) | 0.0 |
| 20 to 34 years | 75 (100.0%) | 91.0 |
| 35 to 50 years | 0 (0.0%) | 0.0 |
| Total | 75 (100.0%) | 70.0 |
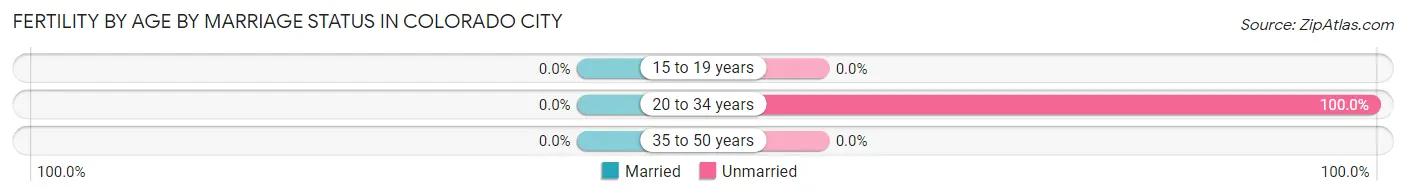
Fertility by Age by Marriage Status in Colorado City
| Age Bracket | Married | Unmarried |
| 15 to 19 years | 0 (0.0%) | 0 (0.0%) |
| 20 to 34 years | 0 (0.0%) | 75 (100.0%) |
| 35 to 50 years | 0 (0.0%) | 0 (0.0%) |
| Total | 0 (0.0%) | 75 (100.0%) |
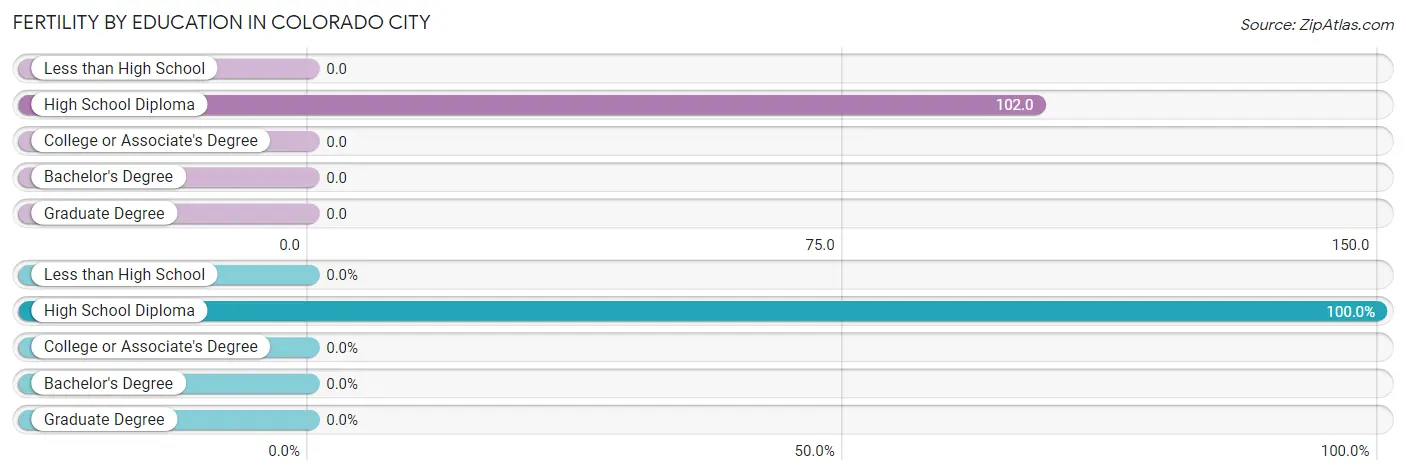
Fertility by Education in Colorado City
| Educational Attainment | Women with Births | Births / 1,000 Women |
| Less than High School | 0 (0.0%) | 0.0 |
| High School Diploma | 75 (100.0%) | 102.0 |
| College or Associate's Degree | 0 (0.0%) | 0.0 |
| Bachelor's Degree | 0 (0.0%) | 0.0 |
| Graduate Degree | 0 (0.0%) | 0.0 |
| Total | 75 (100.0%) | 70.0 |
Fertility by Education by Marriage Status in Colorado City
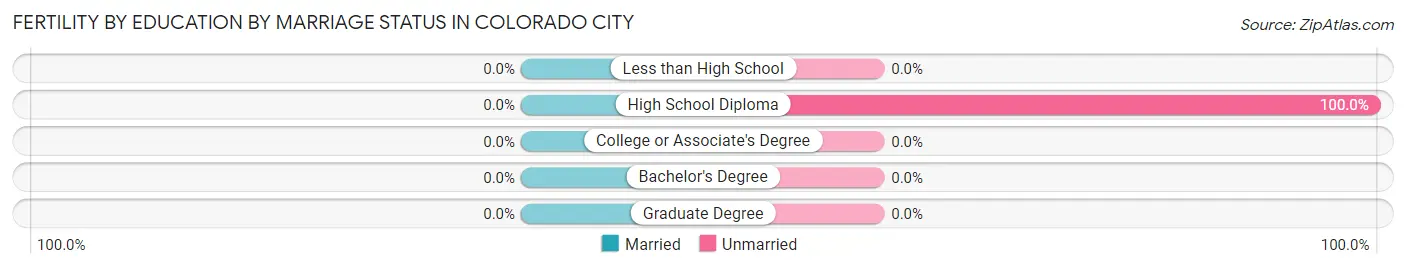
| Educational Attainment | Married | Unmarried |
| Less than High School | 0 (0.0%) | 0 (0.0%) |
| High School Diploma | 0 (0.0%) | 75 (100.0%) |
| College or Associate's Degree | 0 (0.0%) | 0 (0.0%) |
| Bachelor's Degree | 0 (0.0%) | 0 (0.0%) |
| Graduate Degree | 0 (0.0%) | 0 (0.0%) |
| Total | 0 (0.0%) | 75 (100.0%) |
Employment Characteristics in Colorado City
Employment by Class of Employer in Colorado City
Among the 1,734 employed individuals in Colorado City, private company employees (1,102 | 63.5%), local government employees (335 | 19.3%), and self-employed (not incorporated) (143 | 8.3%) make up the most common classes of employment.
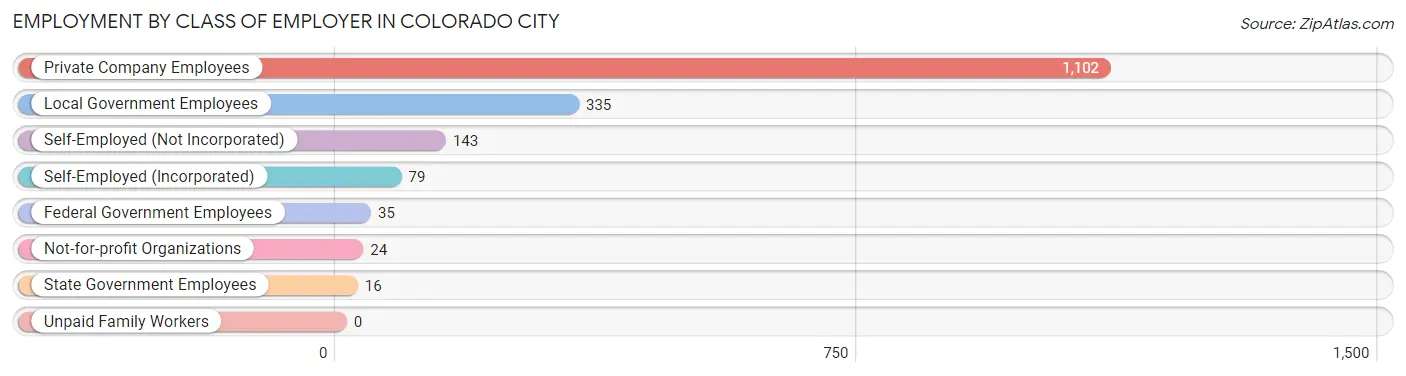
| Employer Class | # Employees | % Employees |
| Private Company Employees | 1,102 | 63.5% |
| Self-Employed (Incorporated) | 79 | 4.6% |
| Self-Employed (Not Incorporated) | 143 | 8.3% |
| Not-for-profit Organizations | 24 | 1.4% |
| Local Government Employees | 335 | 19.3% |
| State Government Employees | 16 | 0.9% |
| Federal Government Employees | 35 | 2.0% |
| Unpaid Family Workers | 0 | 0.0% |
| Total | 1,734 | 100.0% |
Employment Status by Age in Colorado City
According to the labor force statistics for Colorado City, out of the total population over 16 years of age (3,260), 55.3% or 1,803 individuals are in the labor force, with 1.6% or 29 of them unemployed. The age group with the highest labor force participation rate is 35 to 44 years, with 100.0% or 128 individuals in the labor force. Within the labor force, the 55 to 59 years age range has the highest percentage of unemployed individuals, with 9.6% or 15 of them being unemployed.
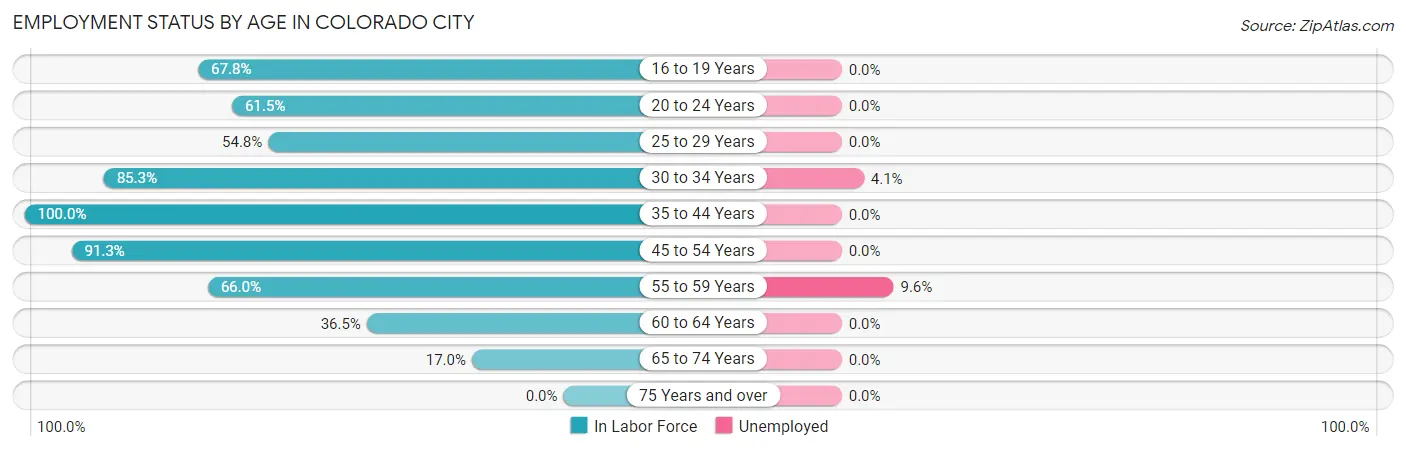
| Age Bracket | In Labor Force | Unemployed |
| 16 to 19 Years | 194 (67.8%) | 0 (0.0%) |
| 20 to 24 Years | 453 (61.5%) | 0 (0.0%) |
| 25 to 29 Years | 114 (54.8%) | 0 (0.0%) |
| 30 to 34 Years | 320 (85.3%) | 13 (4.1%) |
| 35 to 44 Years | 128 (100.0%) | 0 (0.0%) |
| 45 to 54 Years | 316 (91.3%) | 0 (0.0%) |
| 55 to 59 Years | 157 (66.0%) | 15 (9.6%) |
| 60 to 64 Years | 57 (36.5%) | 0 (0.0%) |
| 65 to 74 Years | 63 (17.0%) | 0 (0.0%) |
| 75 Years and over | 0 (0.0%) | 0 (0.0%) |
| Total | 1,803 (55.3%) | 29 (1.6%) |
Employment Status by Educational Attainment in Colorado City
According to labor force statistics for Colorado City, 75.3% of individuals (1,093) out of the total population between 25 and 64 years of age (1,451) are in the labor force, with 2.6% or 28 of them being unemployed. The group with the highest labor force participation rate are those with the educational attainment of bachelor's degree or higher, with 100.0% or 213 individuals in the labor force. Within the labor force, individuals with bachelor's degree or higher education have the highest percentage of unemployment, with 6.1% or 13 of them being unemployed.
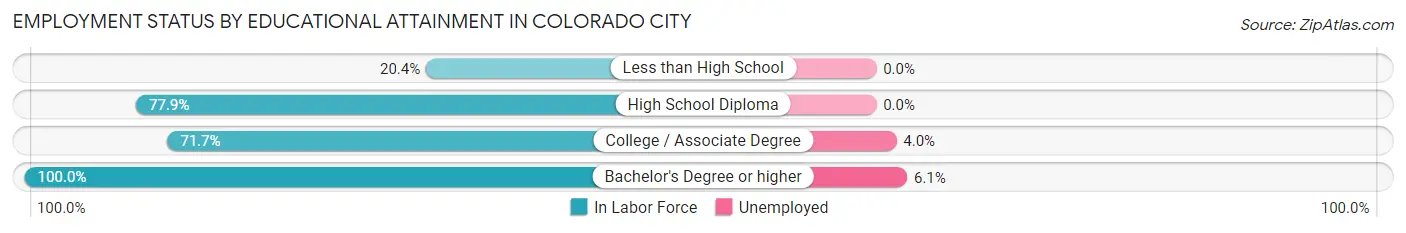
| Educational Attainment | In Labor Force | Unemployed |
| Less than High School | 19 (20.4%) | 0 (0.0%) |
| High School Diploma | 487 (77.9%) | 0 (0.0%) |
| College / Associate Degree | 373 (71.7%) | 21 (4.0%) |
| Bachelor's Degree or higher | 213 (100.0%) | 13 (6.1%) |
| Total | 1,093 (75.3%) | 38 (2.6%) |
Employment Occupations by Sex in Colorado City
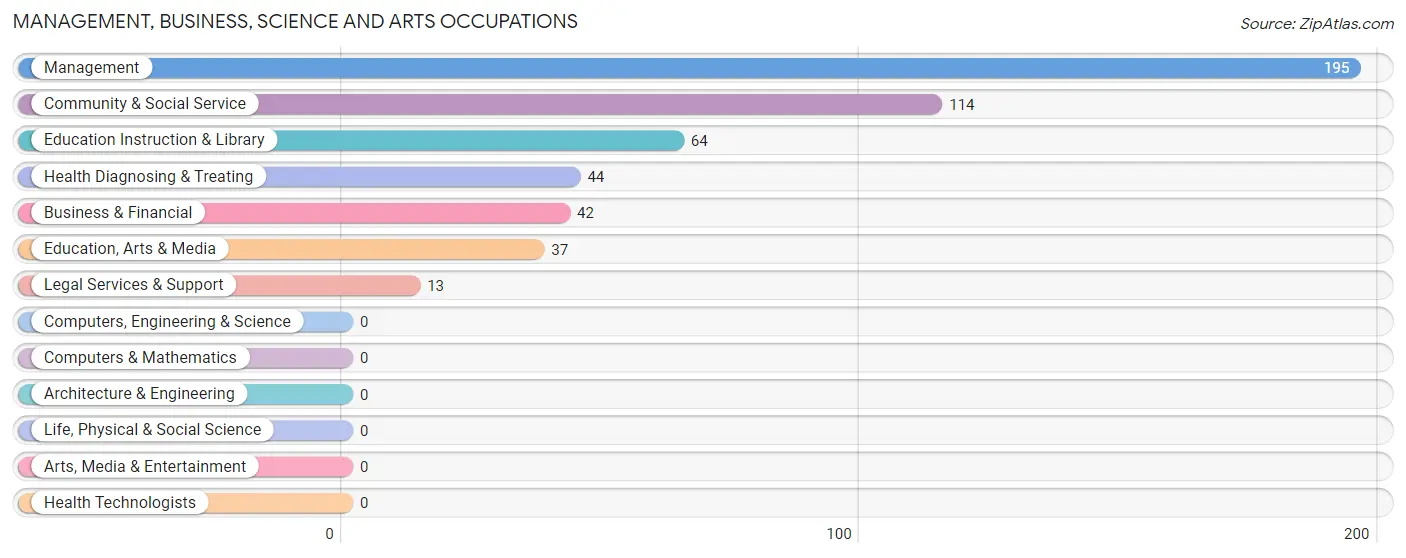
Management, Business, Science and Arts Occupations
The most common Management, Business, Science and Arts occupations in Colorado City are Management (195 | 11.0%), Community & Social Service (114 | 6.4%), Education Instruction & Library (64 | 3.6%), Health Diagnosing & Treating (44 | 2.5%), and Business & Financial (42 | 2.4%).
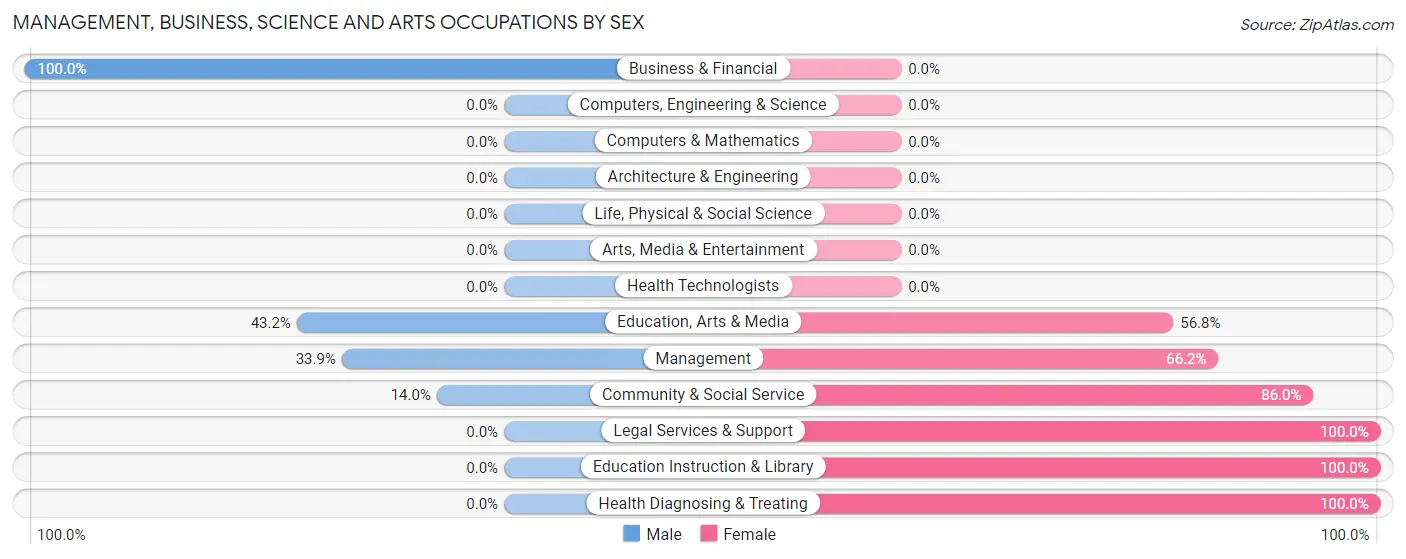
Management, Business, Science and Arts Occupations by Sex
Within the Management, Business, Science and Arts occupations in Colorado City, the most male-oriented occupations are Business & Financial (100.0%), Education, Arts & Media (43.2%), and Management (33.9%), while the most female-oriented occupations are Legal Services & Support (100.0%), Education Instruction & Library (100.0%), and Health Diagnosing & Treating (100.0%).
| Occupation | Male | Female |
| Management | 66 (33.9%) | 129 (66.1%) |
| Business & Financial | 42 (100.0%) | 0 (0.0%) |
| Computers, Engineering & Science | 0 (0.0%) | 0 (0.0%) |
| Computers & Mathematics | 0 (0.0%) | 0 (0.0%) |
| Architecture & Engineering | 0 (0.0%) | 0 (0.0%) |
| Life, Physical & Social Science | 0 (0.0%) | 0 (0.0%) |
| Community & Social Service | 16 (14.0%) | 98 (86.0%) |
| Education, Arts & Media | 16 (43.2%) | 21 (56.8%) |
| Legal Services & Support | 0 (0.0%) | 13 (100.0%) |
| Education Instruction & Library | 0 (0.0%) | 64 (100.0%) |
| Arts, Media & Entertainment | 0 (0.0%) | 0 (0.0%) |
| Health Diagnosing & Treating | 0 (0.0%) | 44 (100.0%) |
| Health Technologists | 0 (0.0%) | 0 (0.0%) |
| Total (Category) | 124 (31.4%) | 271 (68.6%) |
| Total (Overall) | 864 (48.7%) | 910 (51.3%) |
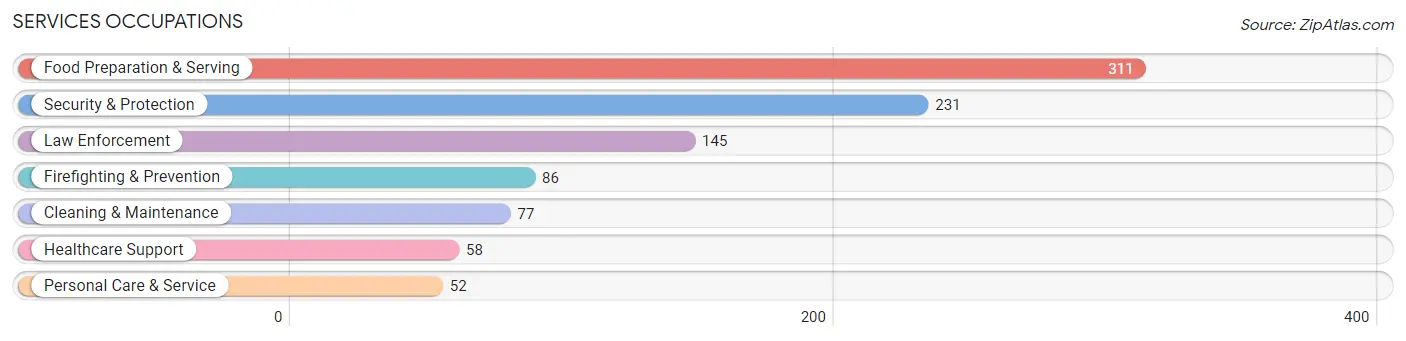
Services Occupations
The most common Services occupations in Colorado City are Food Preparation & Serving (311 | 17.5%), Security & Protection (231 | 13.0%), Law Enforcement (145 | 8.2%), Firefighting & Prevention (86 | 4.9%), and Cleaning & Maintenance (77 | 4.3%).
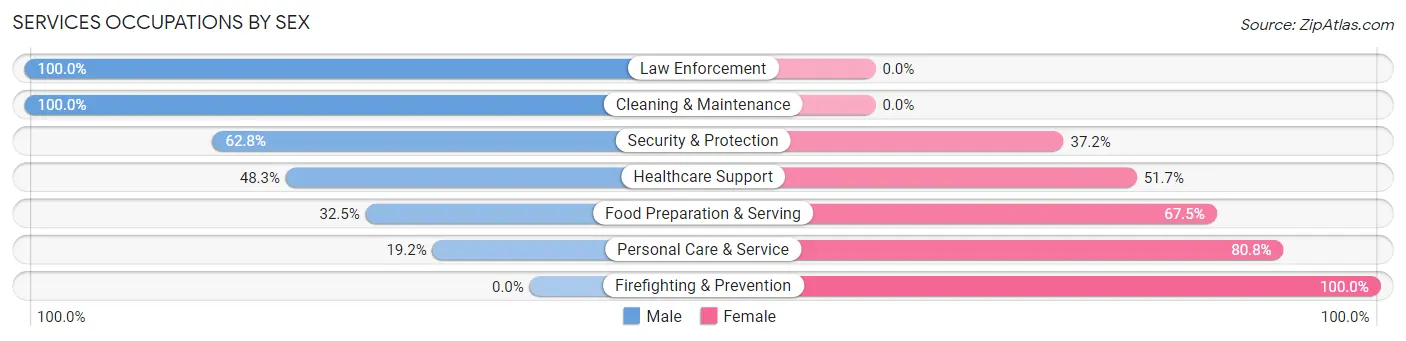
Services Occupations by Sex
Within the Services occupations in Colorado City, the most male-oriented occupations are Law Enforcement (100.0%), Cleaning & Maintenance (100.0%), and Security & Protection (62.8%), while the most female-oriented occupations are Firefighting & Prevention (100.0%), Personal Care & Service (80.8%), and Food Preparation & Serving (67.5%).
| Occupation | Male | Female |
| Healthcare Support | 28 (48.3%) | 30 (51.7%) |
| Security & Protection | 145 (62.8%) | 86 (37.2%) |
| Firefighting & Prevention | 0 (0.0%) | 86 (100.0%) |
| Law Enforcement | 145 (100.0%) | 0 (0.0%) |
| Food Preparation & Serving | 101 (32.5%) | 210 (67.5%) |
| Cleaning & Maintenance | 77 (100.0%) | 0 (0.0%) |
| Personal Care & Service | 10 (19.2%) | 42 (80.8%) |
| Total (Category) | 361 (49.5%) | 368 (50.5%) |
| Total (Overall) | 864 (48.7%) | 910 (51.3%) |
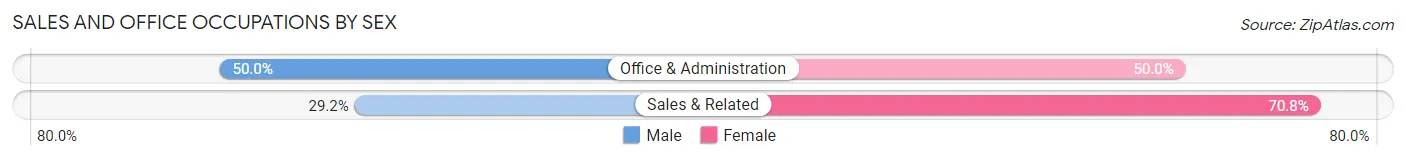
Sales and Office Occupations
The most common Sales and Office occupations in Colorado City are Sales & Related (301 | 17.0%), and Office & Administration (50 | 2.8%).

Sales and Office Occupations by Sex
| Occupation | Male | Female |
| Sales & Related | 88 (29.2%) | 213 (70.8%) |
| Office & Administration | 25 (50.0%) | 25 (50.0%) |
| Total (Category) | 113 (32.2%) | 238 (67.8%) |
| Total (Overall) | 864 (48.7%) | 910 (51.3%) |
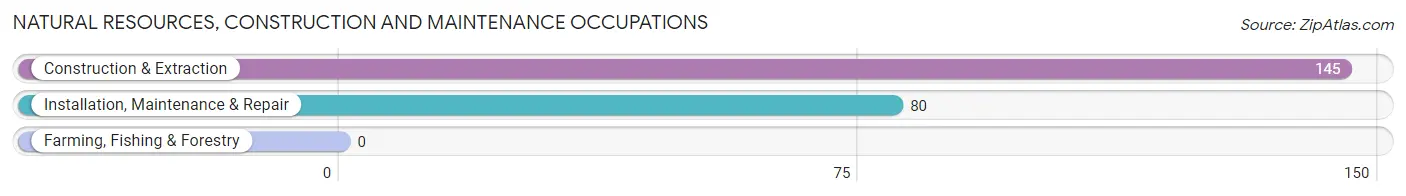
Natural Resources, Construction and Maintenance Occupations
The most common Natural Resources, Construction and Maintenance occupations in Colorado City are Construction & Extraction (145 | 8.2%), and Installation, Maintenance & Repair (80 | 4.5%).
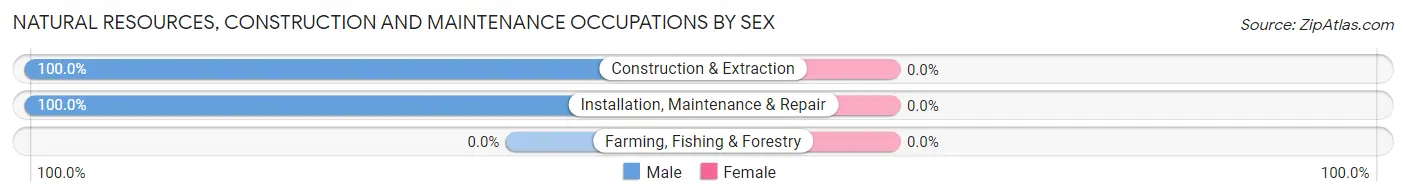
Natural Resources, Construction and Maintenance Occupations by Sex
| Occupation | Male | Female |
| Farming, Fishing & Forestry | 0 (0.0%) | 0 (0.0%) |
| Construction & Extraction | 145 (100.0%) | 0 (0.0%) |
| Installation, Maintenance & Repair | 80 (100.0%) | 0 (0.0%) |
| Total (Category) | 225 (100.0%) | 0 (0.0%) |
| Total (Overall) | 864 (48.7%) | 910 (51.3%) |
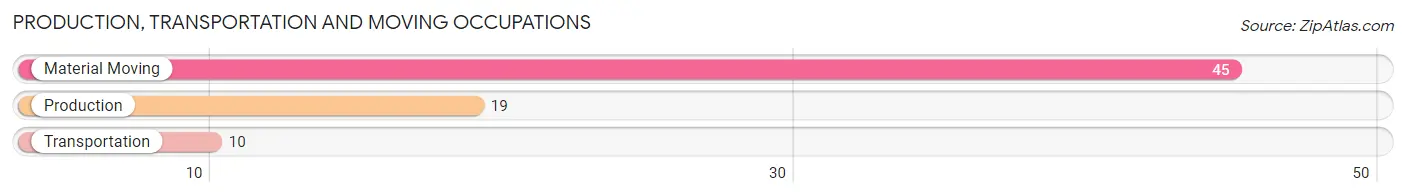
Production, Transportation and Moving Occupations
The most common Production, Transportation and Moving occupations in Colorado City are Material Moving (45 | 2.5%), Production (19 | 1.1%), and Transportation (10 | 0.6%).
Production, Transportation and Moving Occupations by Sex

| Occupation | Male | Female |
| Production | 19 (100.0%) | 0 (0.0%) |
| Transportation | 10 (100.0%) | 0 (0.0%) |
| Material Moving | 12 (26.7%) | 33 (73.3%) |
| Total (Category) | 41 (55.4%) | 33 (44.6%) |
| Total (Overall) | 864 (48.7%) | 910 (51.3%) |
Employment Industries by Sex in Colorado City
Employment Industries in Colorado City
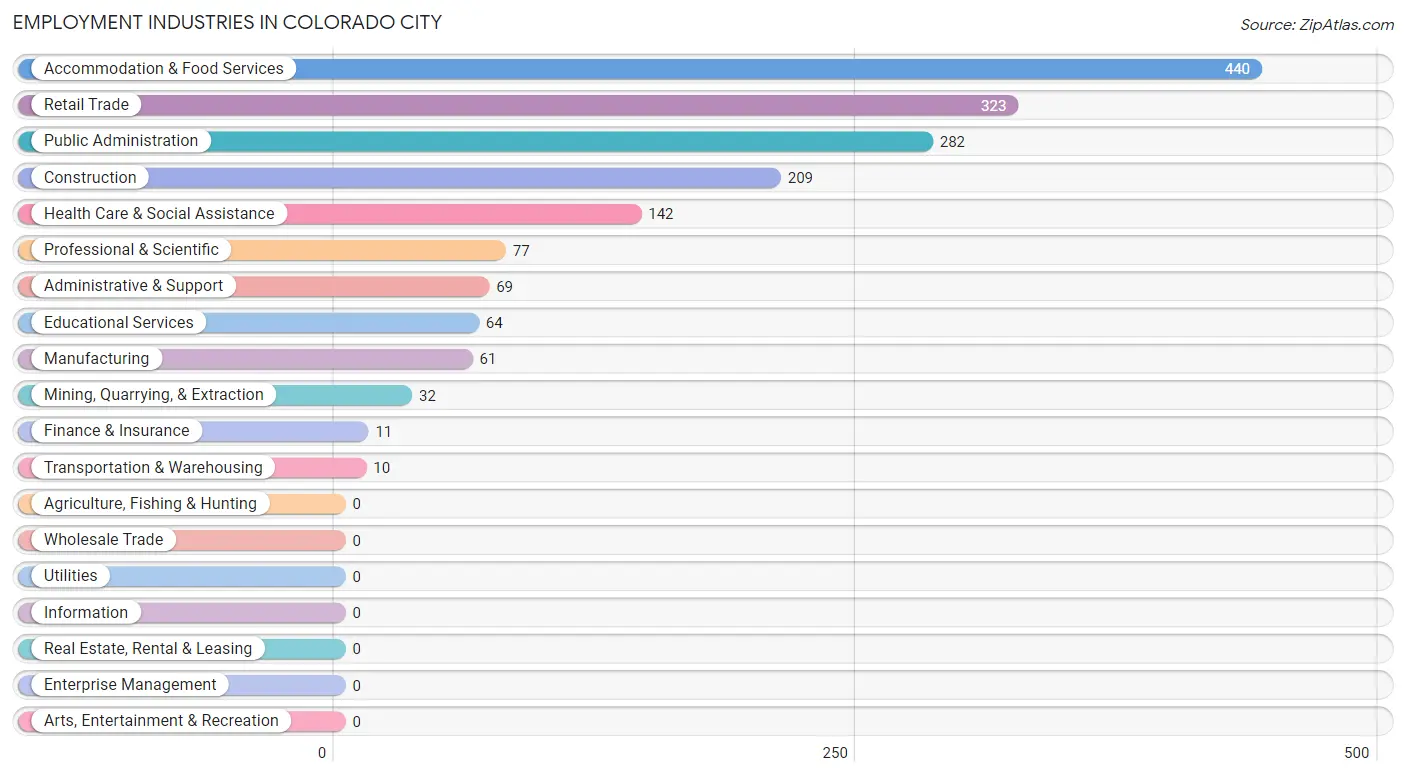
The major employment industries in Colorado City include Accommodation & Food Services (440 | 24.8%), Retail Trade (323 | 18.2%), Public Administration (282 | 15.9%), Construction (209 | 11.8%), and Health Care & Social Assistance (142 | 8.0%).
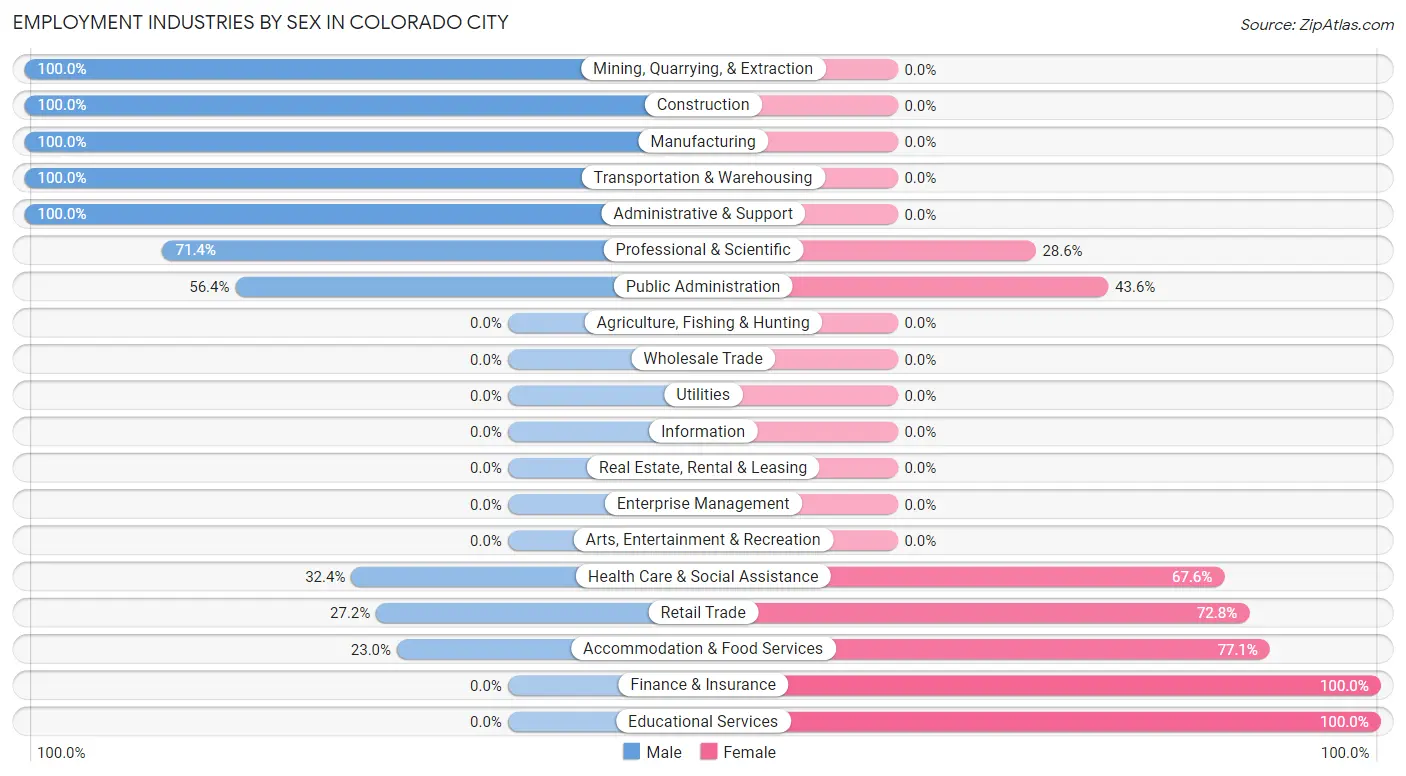
Employment Industries by Sex in Colorado City
The Colorado City industries that see more men than women are Mining, Quarrying, & Extraction (100.0%), Construction (100.0%), and Manufacturing (100.0%), whereas the industries that tend to have a higher number of women are Finance & Insurance (100.0%), Educational Services (100.0%), and Accommodation & Food Services (77.0%).
| Industry | Male | Female |
| Agriculture, Fishing & Hunting | 0 (0.0%) | 0 (0.0%) |
| Mining, Quarrying, & Extraction | 32 (100.0%) | 0 (0.0%) |
| Construction | 209 (100.0%) | 0 (0.0%) |
| Manufacturing | 61 (100.0%) | 0 (0.0%) |
| Wholesale Trade | 0 (0.0%) | 0 (0.0%) |
| Retail Trade | 88 (27.2%) | 235 (72.8%) |
| Transportation & Warehousing | 10 (100.0%) | 0 (0.0%) |
| Utilities | 0 (0.0%) | 0 (0.0%) |
| Information | 0 (0.0%) | 0 (0.0%) |
| Finance & Insurance | 0 (0.0%) | 11 (100.0%) |
| Real Estate, Rental & Leasing | 0 (0.0%) | 0 (0.0%) |
| Professional & Scientific | 55 (71.4%) | 22 (28.6%) |
| Enterprise Management | 0 (0.0%) | 0 (0.0%) |
| Administrative & Support | 69 (100.0%) | 0 (0.0%) |
| Educational Services | 0 (0.0%) | 64 (100.0%) |
| Health Care & Social Assistance | 46 (32.4%) | 96 (67.6%) |
| Arts, Entertainment & Recreation | 0 (0.0%) | 0 (0.0%) |
| Accommodation & Food Services | 101 (23.0%) | 339 (77.0%) |
| Public Administration | 159 (56.4%) | 123 (43.6%) |
| Total | 864 (48.7%) | 910 (51.3%) |
Education in Colorado City
School Enrollment in Colorado City
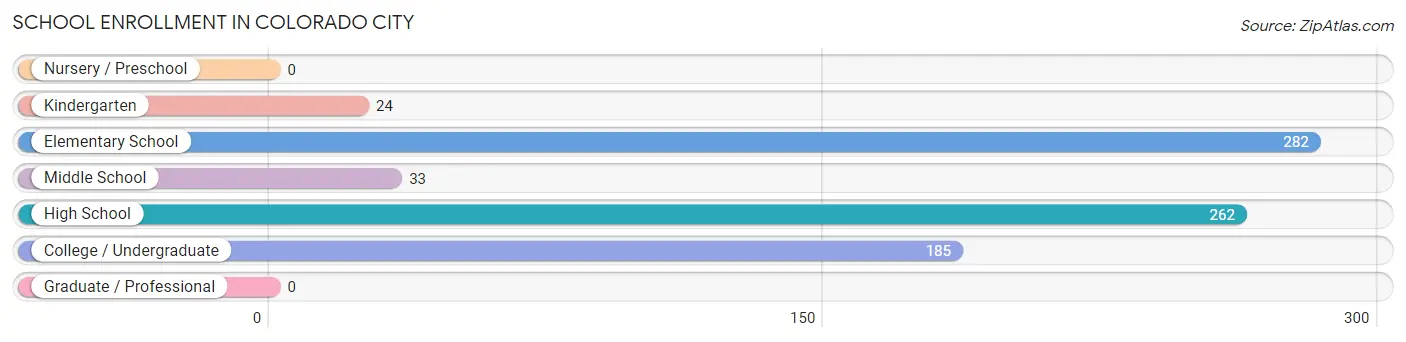
The most common levels of schooling among the 786 students in Colorado City are elementary school (282 | 35.9%), high school (262 | 33.3%), and college / undergraduate (185 | 23.5%).
| School Level | # Students | % Students |
| Nursery / Preschool | 0 | 0.0% |
| Kindergarten | 24 | 3.0% |
| Elementary School | 282 | 35.9% |
| Middle School | 33 | 4.2% |
| High School | 262 | 33.3% |
| College / Undergraduate | 185 | 23.5% |
| Graduate / Professional | 0 | 0.0% |
| Total | 786 | 100.0% |
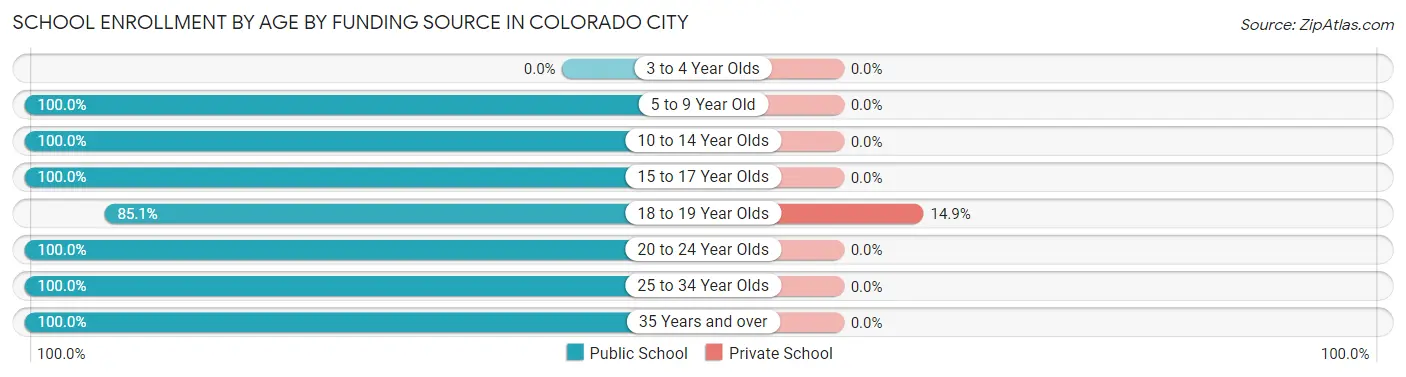
School Enrollment by Age by Funding Source in Colorado City
Out of a total of 786 students who are enrolled in schools in Colorado City, 25 (3.2%) attend a private institution, while the remaining 761 (96.8%) are enrolled in public schools. The age group of 18 to 19 year olds has the highest likelihood of being enrolled in private schools, with 25 (14.9% in the age bracket) enrolled. Conversely, the age group of 5 to 9 year old has the lowest likelihood of being enrolled in a private school, with 306 (100.0% in the age bracket) attending a public institution.
| Age Bracket | Public School | Private School |
| 3 to 4 Year Olds | 0 (0.0%) | 0 (0.0%) |
| 5 to 9 Year Old | 306 (100.0%) | 0 (0.0%) |
| 10 to 14 Year Olds | 33 (100.0%) | 0 (0.0%) |
| 15 to 17 Year Olds | 118 (100.0%) | 0 (0.0%) |
| 18 to 19 Year Olds | 143 (85.1%) | 25 (14.9%) |
| 20 to 24 Year Olds | 116 (100.0%) | 0 (0.0%) |
| 25 to 34 Year Olds | 32 (100.0%) | 0 (0.0%) |
| 35 Years and over | 13 (100.0%) | 0 (0.0%) |
| Total | 761 (96.8%) | 25 (3.2%) |
Educational Attainment by Field of Study in Colorado City
Education (135 | 54.7%), social sciences (39 | 15.8%), arts & humanities (21 | 8.5%), physical & health sciences (18 | 7.3%), and business (18 | 7.3%) are the most common fields of study among 247 individuals in Colorado City who have obtained a bachelor's degree or higher.
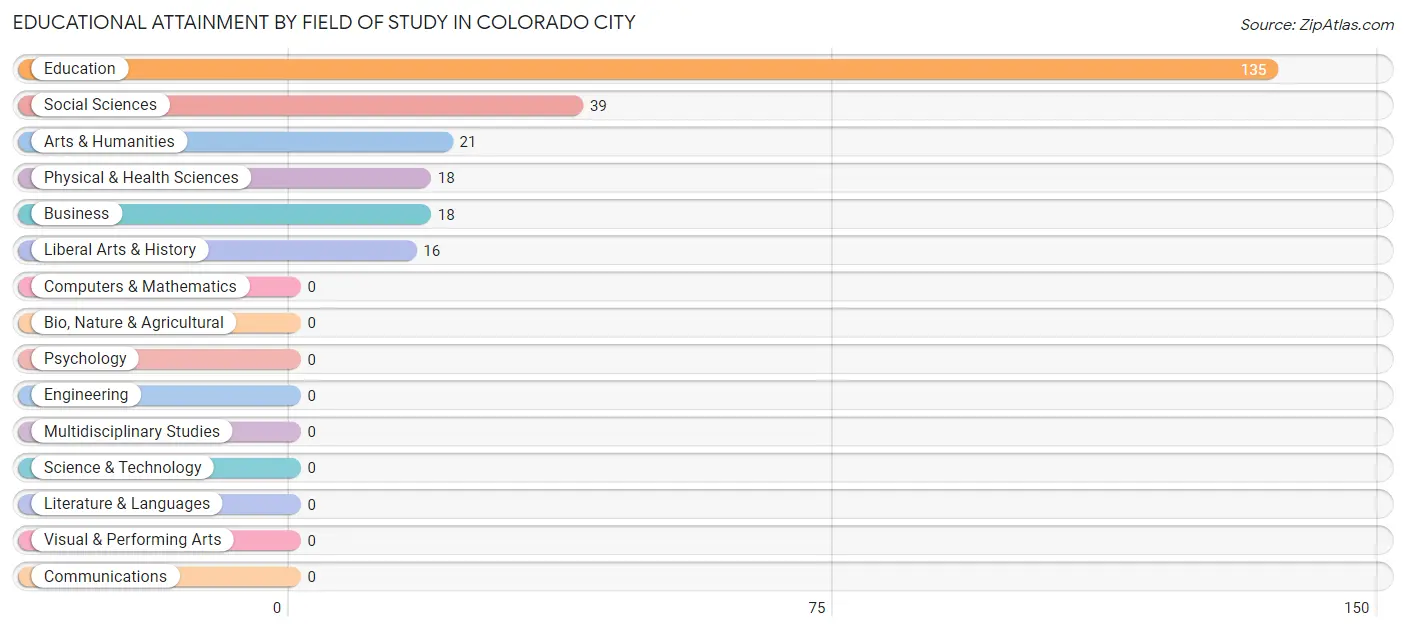
| Field of Study | # Graduates | % Graduates |
| Computers & Mathematics | 0 | 0.0% |
| Bio, Nature & Agricultural | 0 | 0.0% |
| Physical & Health Sciences | 18 | 7.3% |
| Psychology | 0 | 0.0% |
| Social Sciences | 39 | 15.8% |
| Engineering | 0 | 0.0% |
| Multidisciplinary Studies | 0 | 0.0% |
| Science & Technology | 0 | 0.0% |
| Business | 18 | 7.3% |
| Education | 135 | 54.7% |
| Literature & Languages | 0 | 0.0% |
| Liberal Arts & History | 16 | 6.5% |
| Visual & Performing Arts | 0 | 0.0% |
| Communications | 0 | 0.0% |
| Arts & Humanities | 21 | 8.5% |
| Total | 247 | 100.0% |
Transportation & Commute in Colorado City
Vehicle Availability by Sex in Colorado City
The most prevalent vehicle ownership categories in Colorado City are males with 3 vehicles (432, accounting for 50.0%) and females with 3 vehicles (198, making up 49.7%).
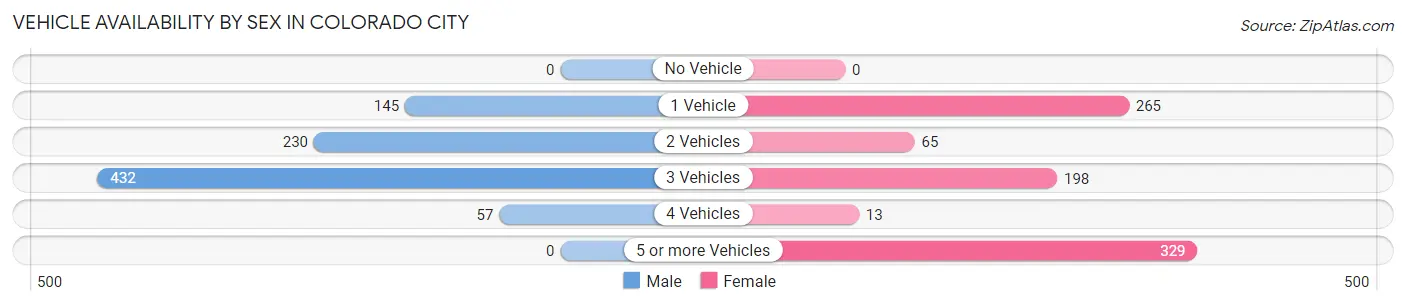
| Vehicles Available | Male | Female |
| No Vehicle | 0 (0.0%) | 0 (0.0%) |
| 1 Vehicle | 145 (16.8%) | 265 (30.5%) |
| 2 Vehicles | 230 (26.6%) | 65 (7.5%) |
| 3 Vehicles | 432 (50.0%) | 198 (22.8%) |
| 4 Vehicles | 57 (6.6%) | 13 (1.5%) |
| 5 or more Vehicles | 0 (0.0%) | 329 (37.8%) |
| Total | 864 (100.0%) | 870 (100.0%) |
Commute Time in Colorado City
The most frequently occuring commute durations in Colorado City are 5 to 9 minutes (699 commuters, 40.7%), 45 to 59 minutes (375 commuters, 21.8%), and 30 to 34 minutes (200 commuters, 11.6%).
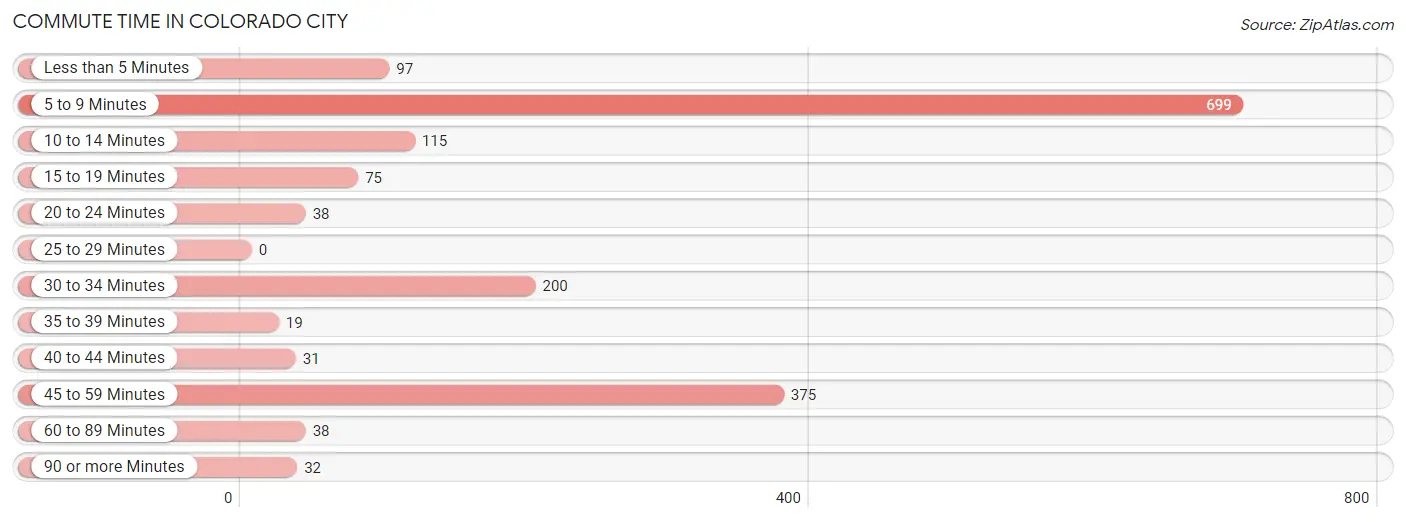
| Commute Time | # Commuters | % Commuters |
| Less than 5 Minutes | 97 | 5.6% |
| 5 to 9 Minutes | 699 | 40.7% |
| 10 to 14 Minutes | 115 | 6.7% |
| 15 to 19 Minutes | 75 | 4.4% |
| 20 to 24 Minutes | 38 | 2.2% |
| 25 to 29 Minutes | 0 | 0.0% |
| 30 to 34 Minutes | 200 | 11.6% |
| 35 to 39 Minutes | 19 | 1.1% |
| 40 to 44 Minutes | 31 | 1.8% |
| 45 to 59 Minutes | 375 | 21.8% |
| 60 to 89 Minutes | 38 | 2.2% |
| 90 or more Minutes | 32 | 1.9% |
Commute Time by Sex in Colorado City
The most common commute times in Colorado City are 5 to 9 minutes (394 commuters, 45.6%) for males and 5 to 9 minutes (305 commuters, 35.7%) for females.
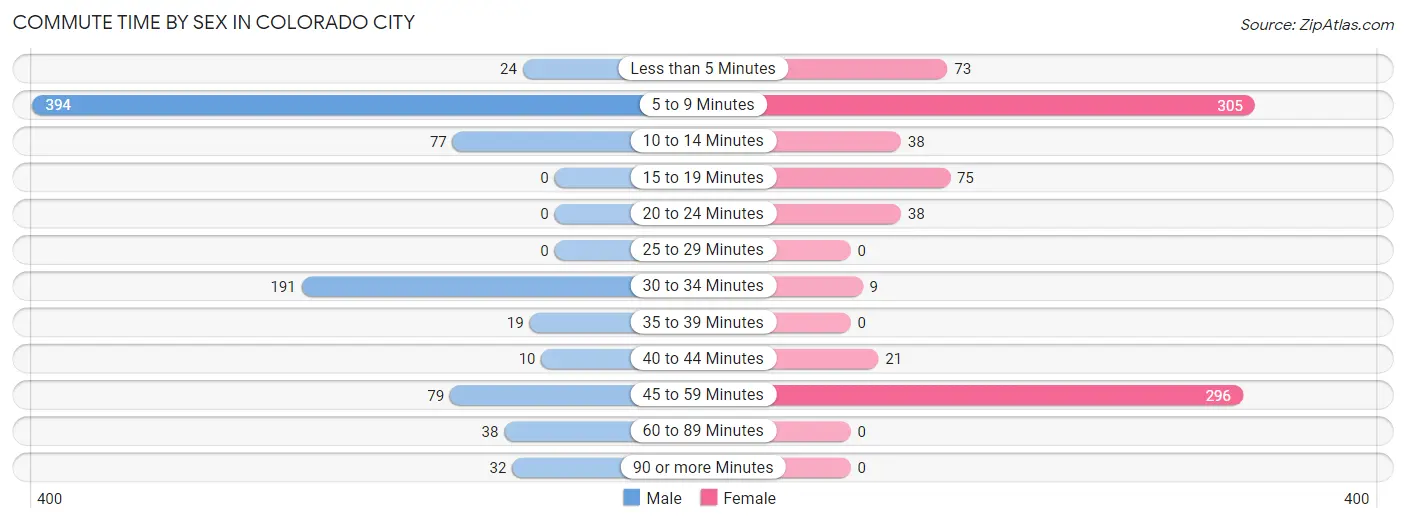
| Commute Time | Male | Female |
| Less than 5 Minutes | 24 (2.8%) | 73 (8.5%) |
| 5 to 9 Minutes | 394 (45.6%) | 305 (35.7%) |
| 10 to 14 Minutes | 77 (8.9%) | 38 (4.4%) |
| 15 to 19 Minutes | 0 (0.0%) | 75 (8.8%) |
| 20 to 24 Minutes | 0 (0.0%) | 38 (4.4%) |
| 25 to 29 Minutes | 0 (0.0%) | 0 (0.0%) |
| 30 to 34 Minutes | 191 (22.1%) | 9 (1.1%) |
| 35 to 39 Minutes | 19 (2.2%) | 0 (0.0%) |
| 40 to 44 Minutes | 10 (1.2%) | 21 (2.5%) |
| 45 to 59 Minutes | 79 (9.1%) | 296 (34.6%) |
| 60 to 89 Minutes | 38 (4.4%) | 0 (0.0%) |
| 90 or more Minutes | 32 (3.7%) | 0 (0.0%) |
Time of Departure to Work by Sex in Colorado City
The most frequent times of departure to work in Colorado City are 7:00 AM to 7:29 AM (192, 22.2%) for males and 9:00 AM to 9:59 AM (350, 40.9%) for females.
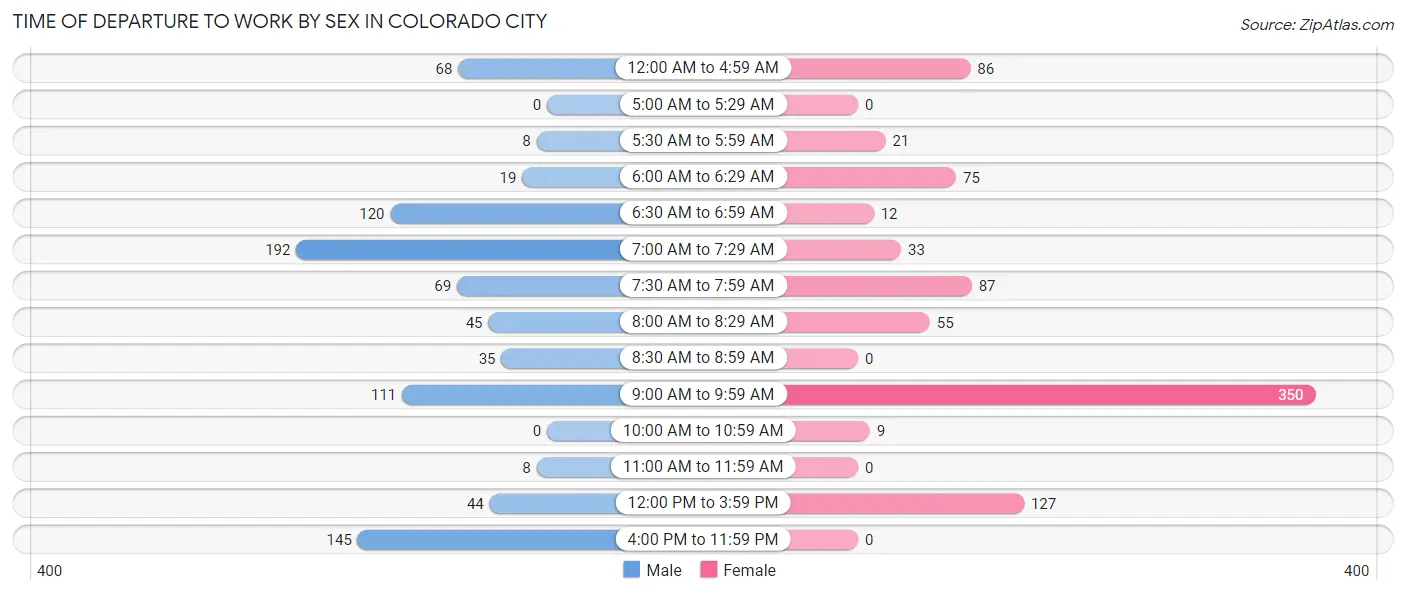
| Time of Departure | Male | Female |
| 12:00 AM to 4:59 AM | 68 (7.9%) | 86 (10.1%) |
| 5:00 AM to 5:29 AM | 0 (0.0%) | 0 (0.0%) |
| 5:30 AM to 5:59 AM | 8 (0.9%) | 21 (2.5%) |
| 6:00 AM to 6:29 AM | 19 (2.2%) | 75 (8.8%) |
| 6:30 AM to 6:59 AM | 120 (13.9%) | 12 (1.4%) |
| 7:00 AM to 7:29 AM | 192 (22.2%) | 33 (3.9%) |
| 7:30 AM to 7:59 AM | 69 (8.0%) | 87 (10.2%) |
| 8:00 AM to 8:29 AM | 45 (5.2%) | 55 (6.4%) |
| 8:30 AM to 8:59 AM | 35 (4.1%) | 0 (0.0%) |
| 9:00 AM to 9:59 AM | 111 (12.9%) | 350 (40.9%) |
| 10:00 AM to 10:59 AM | 0 (0.0%) | 9 (1.1%) |
| 11:00 AM to 11:59 AM | 8 (0.9%) | 0 (0.0%) |
| 12:00 PM to 3:59 PM | 44 (5.1%) | 127 (14.8%) |
| 4:00 PM to 11:59 PM | 145 (16.8%) | 0 (0.0%) |
| Total | 864 (100.0%) | 855 (100.0%) |
Housing Occupancy in Colorado City
Occupancy by Ownership in Colorado City
Of the total 1,261 dwellings in Colorado City, owner-occupied units account for 738 (58.5%), while renter-occupied units make up 523 (41.5%).
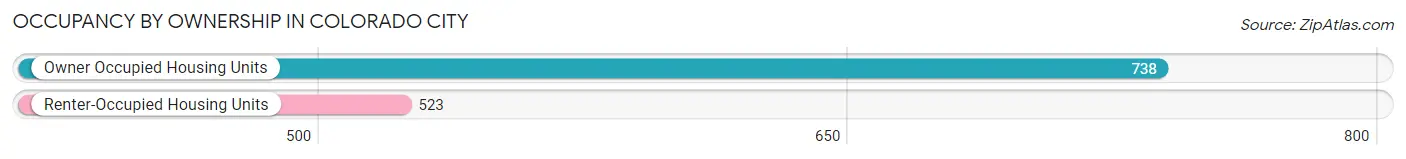
| Occupancy | # Housing Units | % Housing Units |
| Owner Occupied Housing Units | 738 | 58.5% |
| Renter-Occupied Housing Units | 523 | 41.5% |
| Total Occupied Housing Units | 1,261 | 100.0% |
Occupancy by Household Size in Colorado City
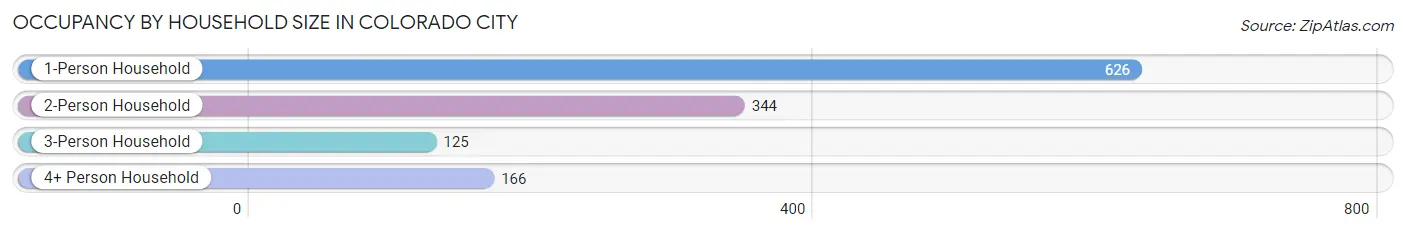
| Household Size | # Housing Units | % Housing Units |
| 1-Person Household | 626 | 49.6% |
| 2-Person Household | 344 | 27.3% |
| 3-Person Household | 125 | 9.9% |
| 4+ Person Household | 166 | 13.2% |
| Total Housing Units | 1,261 | 100.0% |
Occupancy by Ownership by Household Size in Colorado City
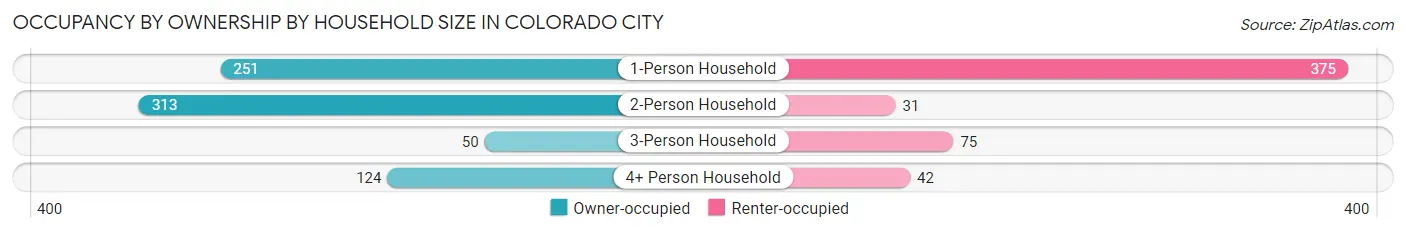
| Household Size | Owner-occupied | Renter-occupied |
| 1-Person Household | 251 (40.1%) | 375 (59.9%) |
| 2-Person Household | 313 (91.0%) | 31 (9.0%) |
| 3-Person Household | 50 (40.0%) | 75 (60.0%) |
| 4+ Person Household | 124 (74.7%) | 42 (25.3%) |
| Total Housing Units | 738 (58.5%) | 523 (41.5%) |
Occupancy by Educational Attainment in Colorado City
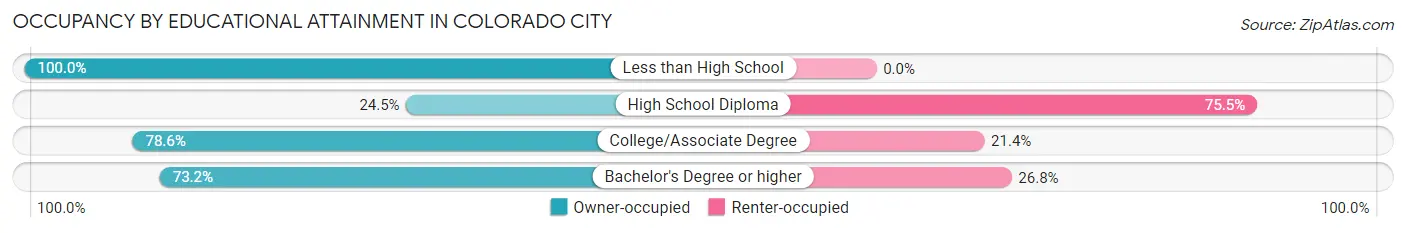
| Household Size | Owner-occupied | Renter-occupied |
| Less than High School | 205 (100.0%) | 0 (0.0%) |
| High School Diploma | 131 (24.5%) | 404 (75.5%) |
| College/Associate Degree | 301 (78.6%) | 82 (21.4%) |
| Bachelor's Degree or higher | 101 (73.2%) | 37 (26.8%) |
Occupancy by Age of Householder in Colorado City
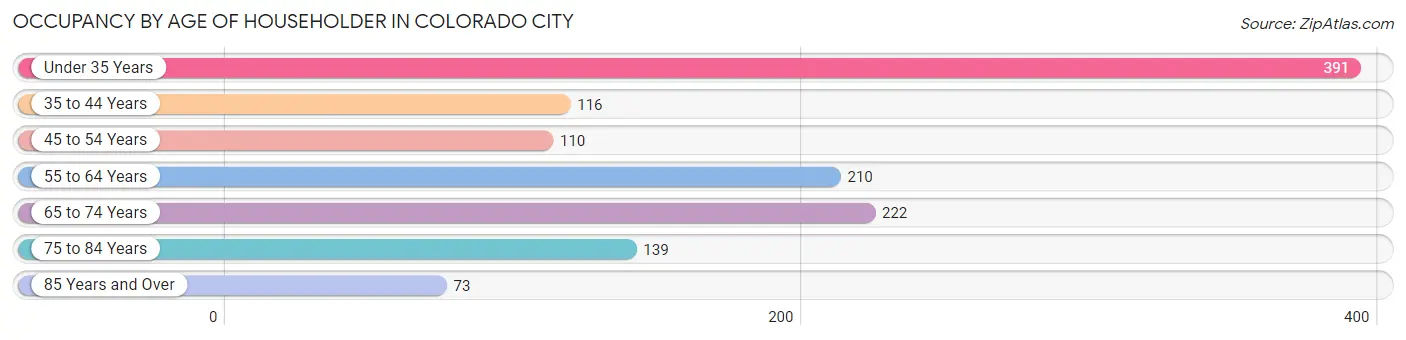
| Age Bracket | # Households | % Households |
| Under 35 Years | 391 | 31.0% |
| 35 to 44 Years | 116 | 9.2% |
| 45 to 54 Years | 110 | 8.7% |
| 55 to 64 Years | 210 | 16.7% |
| 65 to 74 Years | 222 | 17.6% |
| 75 to 84 Years | 139 | 11.0% |
| 85 Years and Over | 73 | 5.8% |
| Total | 1,261 | 100.0% |
Housing Finances in Colorado City
Median Income by Occupancy in Colorado City
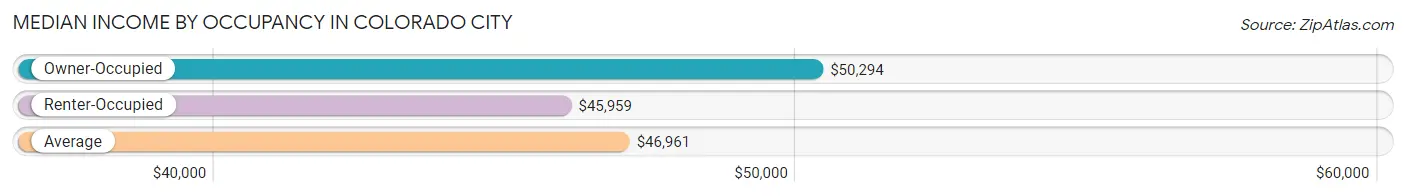
| Occupancy Type | # Households | Median Income |
| Owner-Occupied | 738 (58.5%) | $50,294 |
| Renter-Occupied | 523 (41.5%) | $45,959 |
| Average | 1,261 (100.0%) | $46,961 |
Occupancy by Householder Income Bracket in Colorado City
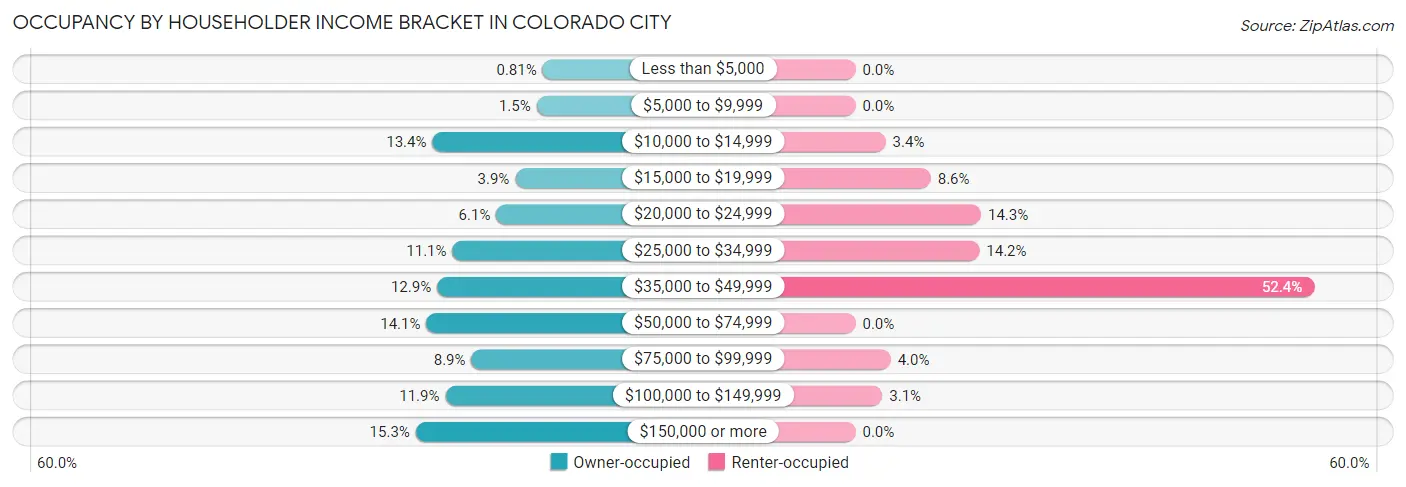
| Income Bracket | Owner-occupied | Renter-occupied |
| Less than $5,000 | 6 (0.8%) | 0 (0.0%) |
| $5,000 to $9,999 | 11 (1.5%) | 0 (0.0%) |
| $10,000 to $14,999 | 99 (13.4%) | 18 (3.4%) |
| $15,000 to $19,999 | 29 (3.9%) | 45 (8.6%) |
| $20,000 to $24,999 | 45 (6.1%) | 75 (14.3%) |
| $25,000 to $34,999 | 82 (11.1%) | 74 (14.1%) |
| $35,000 to $49,999 | 95 (12.9%) | 274 (52.4%) |
| $50,000 to $74,999 | 104 (14.1%) | 0 (0.0%) |
| $75,000 to $99,999 | 66 (8.9%) | 21 (4.0%) |
| $100,000 to $149,999 | 88 (11.9%) | 16 (3.1%) |
| $150,000 or more | 113 (15.3%) | 0 (0.0%) |
| Total | 738 (100.0%) | 523 (100.0%) |
Monthly Housing Cost Tiers in Colorado City
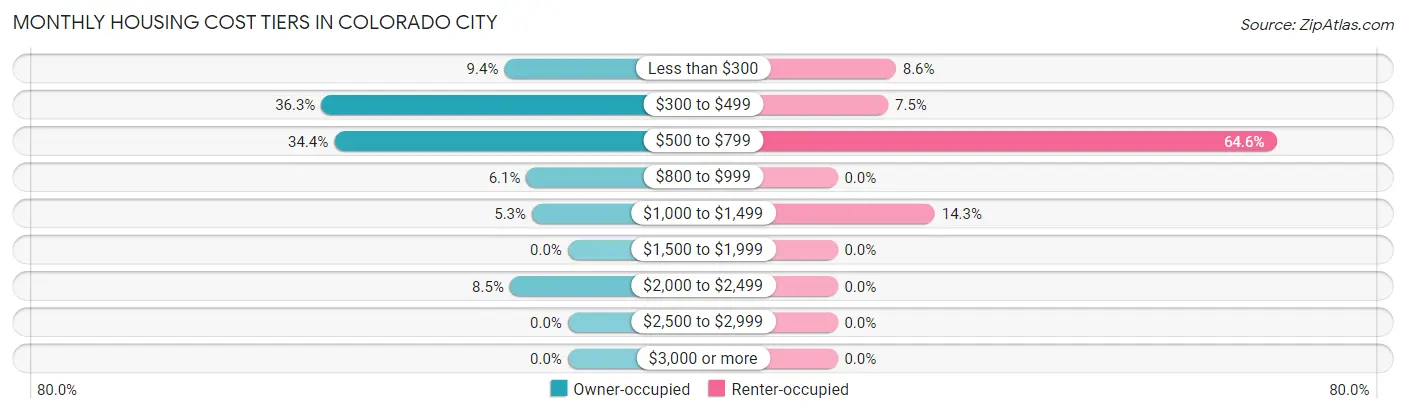
| Monthly Cost | Owner-occupied | Renter-occupied |
| Less than $300 | 69 (9.3%) | 45 (8.6%) |
| $300 to $499 | 268 (36.3%) | 39 (7.5%) |
| $500 to $799 | 254 (34.4%) | 338 (64.6%) |
| $800 to $999 | 45 (6.1%) | 0 (0.0%) |
| $1,000 to $1,499 | 39 (5.3%) | 75 (14.3%) |
| $1,500 to $1,999 | 0 (0.0%) | 0 (0.0%) |
| $2,000 to $2,499 | 63 (8.5%) | 0 (0.0%) |
| $2,500 to $2,999 | 0 (0.0%) | 0 (0.0%) |
| $3,000 or more | 0 (0.0%) | 0 (0.0%) |
| Total | 738 (100.0%) | 523 (100.0%) |
Physical Housing Characteristics in Colorado City
Housing Structures in Colorado City
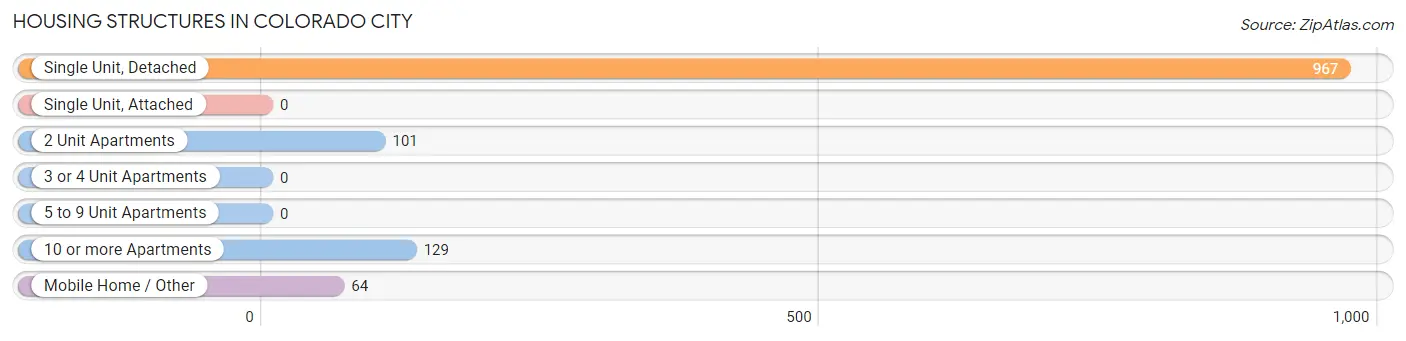
| Structure Type | # Housing Units | % Housing Units |
| Single Unit, Detached | 967 | 76.7% |
| Single Unit, Attached | 0 | 0.0% |
| 2 Unit Apartments | 101 | 8.0% |
| 3 or 4 Unit Apartments | 0 | 0.0% |
| 5 to 9 Unit Apartments | 0 | 0.0% |
| 10 or more Apartments | 129 | 10.2% |
| Mobile Home / Other | 64 | 5.1% |
| Total | 1,261 | 100.0% |
Housing Structures by Occupancy in Colorado City
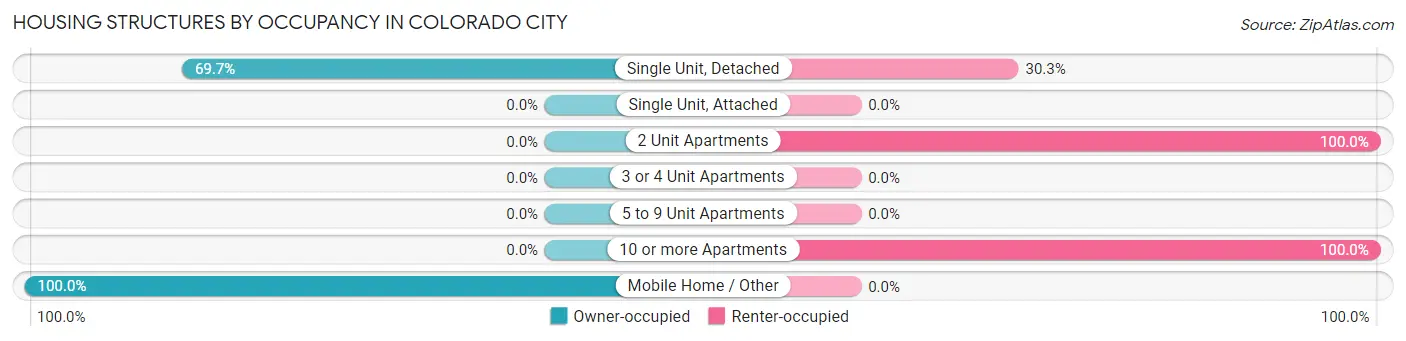
| Structure Type | Owner-occupied | Renter-occupied |
| Single Unit, Detached | 674 (69.7%) | 293 (30.3%) |
| Single Unit, Attached | 0 (0.0%) | 0 (0.0%) |
| 2 Unit Apartments | 0 (0.0%) | 101 (100.0%) |
| 3 or 4 Unit Apartments | 0 (0.0%) | 0 (0.0%) |
| 5 to 9 Unit Apartments | 0 (0.0%) | 0 (0.0%) |
| 10 or more Apartments | 0 (0.0%) | 129 (100.0%) |
| Mobile Home / Other | 64 (100.0%) | 0 (0.0%) |
| Total | 738 (58.5%) | 523 (41.5%) |
Housing Structures by Number of Rooms in Colorado City
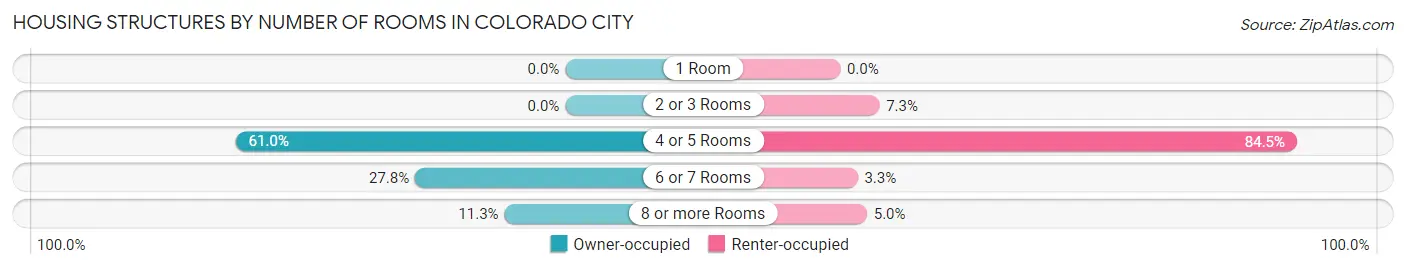
| Number of Rooms | Owner-occupied | Renter-occupied |
| 1 Room | 0 (0.0%) | 0 (0.0%) |
| 2 or 3 Rooms | 0 (0.0%) | 38 (7.3%) |
| 4 or 5 Rooms | 450 (61.0%) | 442 (84.5%) |
| 6 or 7 Rooms | 205 (27.8%) | 17 (3.3%) |
| 8 or more Rooms | 83 (11.3%) | 26 (5.0%) |
| Total | 738 (100.0%) | 523 (100.0%) |
Housing Structure by Heating Type in Colorado City
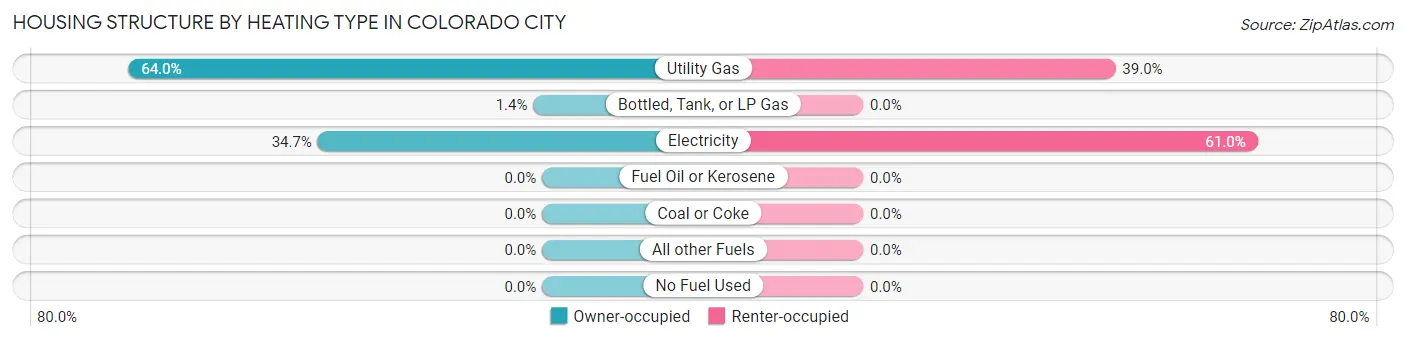
| Heating Type | Owner-occupied | Renter-occupied |
| Utility Gas | 472 (64.0%) | 204 (39.0%) |
| Bottled, Tank, or LP Gas | 10 (1.4%) | 0 (0.0%) |
| Electricity | 256 (34.7%) | 319 (61.0%) |
| Fuel Oil or Kerosene | 0 (0.0%) | 0 (0.0%) |
| Coal or Coke | 0 (0.0%) | 0 (0.0%) |
| All other Fuels | 0 (0.0%) | 0 (0.0%) |
| No Fuel Used | 0 (0.0%) | 0 (0.0%) |
| Total | 738 (100.0%) | 523 (100.0%) |
Household Vehicle Usage in Colorado City
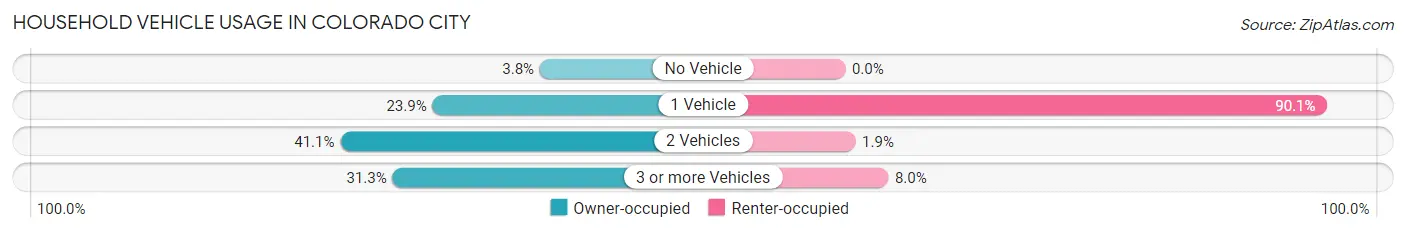
| Vehicles per Household | Owner-occupied | Renter-occupied |
| No Vehicle | 28 (3.8%) | 0 (0.0%) |
| 1 Vehicle | 176 (23.8%) | 471 (90.1%) |
| 2 Vehicles | 303 (41.1%) | 10 (1.9%) |
| 3 or more Vehicles | 231 (31.3%) | 42 (8.0%) |
| Total | 738 (100.0%) | 523 (100.0%) |
Real Estate & Mortgages in Colorado City
Real Estate and Mortgage Overview in Colorado City
| Characteristic | Without Mortgage | With Mortgage |
| Housing Units | 629 | 109 |
| Median Property Value | $55,900 | $0 |
| Median Household Income | $48,451 | $42 |
| Monthly Housing Costs | $474 | $0 |
| Real Estate Taxes | $916 | $0 |
Property Value by Mortgage Status in Colorado City
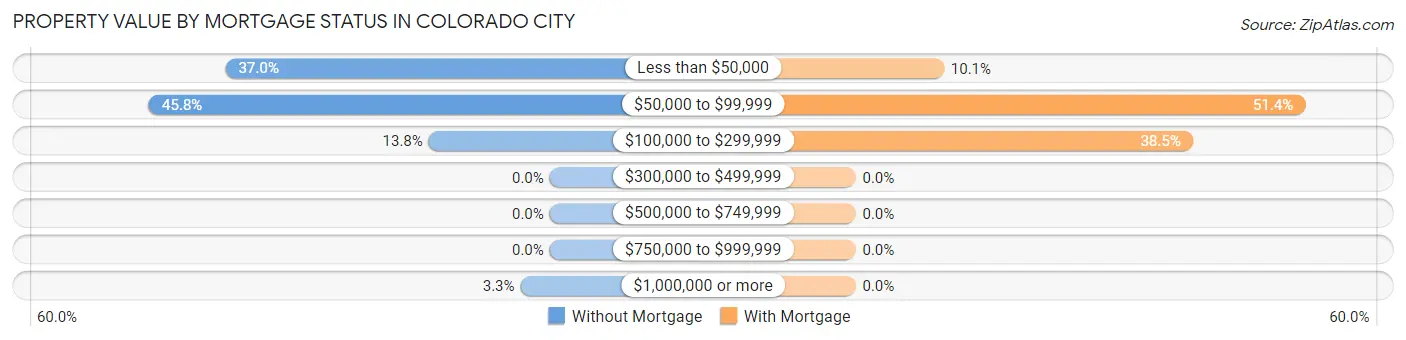
| Property Value | Without Mortgage | With Mortgage |
| Less than $50,000 | 233 (37.0%) | 11 (10.1%) |
| $50,000 to $99,999 | 288 (45.8%) | 56 (51.4%) |
| $100,000 to $299,999 | 87 (13.8%) | 42 (38.5%) |
| $300,000 to $499,999 | 0 (0.0%) | 0 (0.0%) |
| $500,000 to $749,999 | 0 (0.0%) | 0 (0.0%) |
| $750,000 to $999,999 | 0 (0.0%) | 0 (0.0%) |
| $1,000,000 or more | 21 (3.3%) | 0 (0.0%) |
| Total | 629 (100.0%) | 109 (100.0%) |
Household Income by Mortgage Status in Colorado City
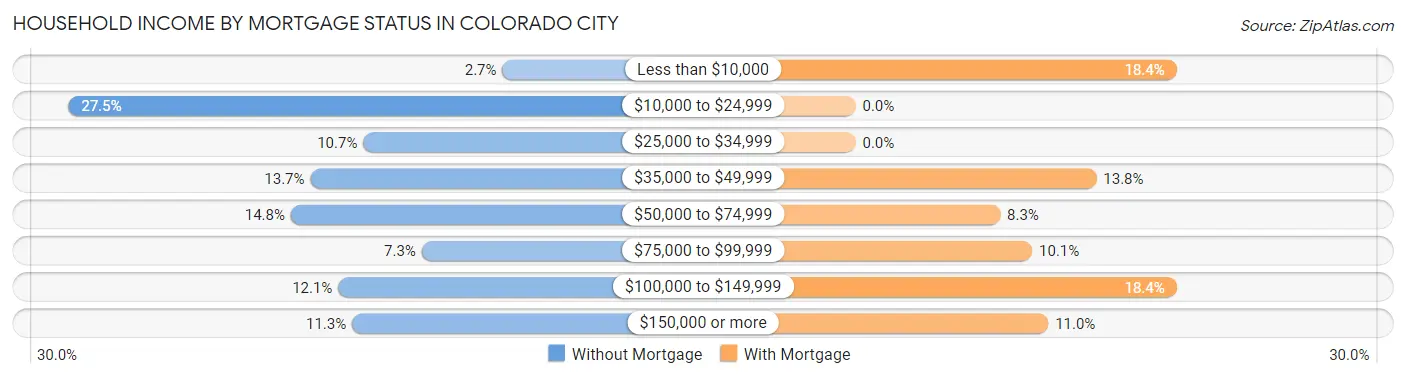
| Household Income | Without Mortgage | With Mortgage |
| Less than $10,000 | 17 (2.7%) | 20 (18.3%) |
| $10,000 to $24,999 | 173 (27.5%) | 0 (0.0%) |
| $25,000 to $34,999 | 67 (10.6%) | 0 (0.0%) |
| $35,000 to $49,999 | 86 (13.7%) | 15 (13.8%) |
| $50,000 to $74,999 | 93 (14.8%) | 9 (8.3%) |
| $75,000 to $99,999 | 46 (7.3%) | 11 (10.1%) |
| $100,000 to $149,999 | 76 (12.1%) | 20 (18.3%) |
| $150,000 or more | 71 (11.3%) | 12 (11.0%) |
| Total | 629 (100.0%) | 109 (100.0%) |
Property Value to Household Income Ratio in Colorado City
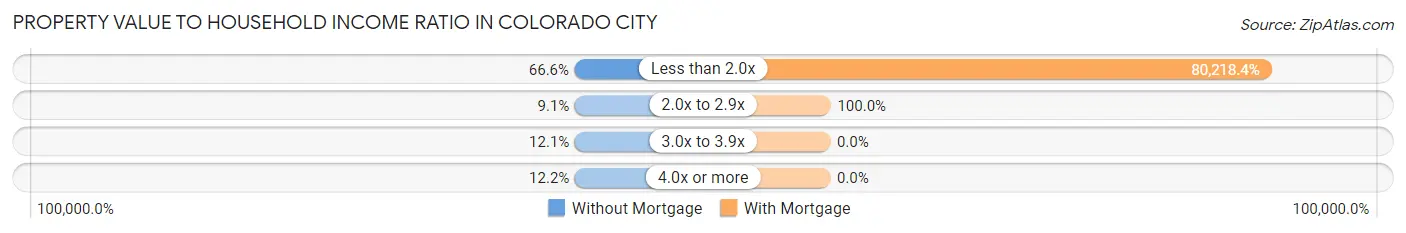
| Value-to-Income Ratio | Without Mortgage | With Mortgage |
| Less than 2.0x | 419 (66.6%) | 87,438 (80,218.3%) |
| 2.0x to 2.9x | 57 (9.1%) | 109 (100.0%) |
| 3.0x to 3.9x | 76 (12.1%) | 0 (0.0%) |
| 4.0x or more | 77 (12.2%) | 0 (0.0%) |
| Total | 629 (100.0%) | 109 (100.0%) |
Real Estate Taxes by Mortgage Status in Colorado City
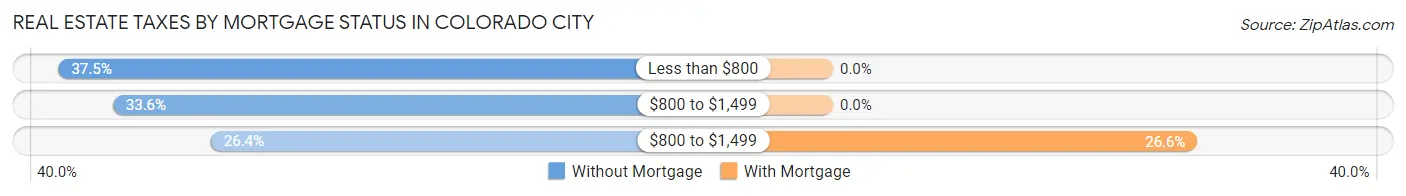
| Property Taxes | Without Mortgage | With Mortgage |
| Less than $800 | 236 (37.5%) | 0 (0.0%) |
| $800 to $1,499 | 211 (33.6%) | 0 (0.0%) |
| $800 to $1,499 | 166 (26.4%) | 29 (26.6%) |
| Total | 629 (100.0%) | 109 (100.0%) |
Health & Disability in Colorado City
Health Insurance Coverage by Age in Colorado City
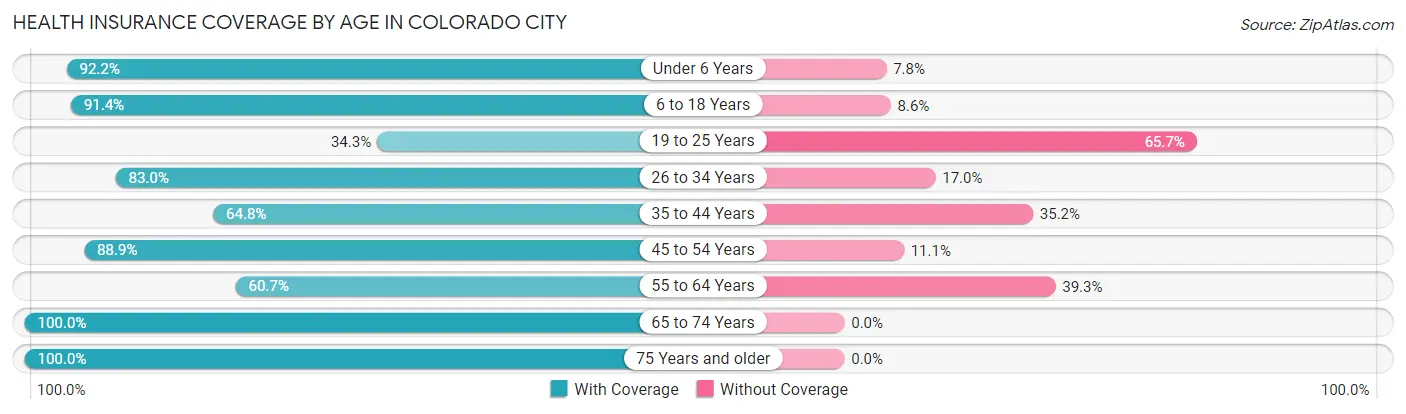
| Age Bracket | With Coverage | Without Coverage |
| Under 6 Years | 377 (92.2%) | 32 (7.8%) |
| 6 to 18 Years | 497 (91.4%) | 47 (8.6%) |
| 19 to 25 Years | 288 (34.3%) | 552 (65.7%) |
| 26 to 34 Years | 406 (83.0%) | 83 (17.0%) |
| 35 to 44 Years | 83 (64.8%) | 45 (35.2%) |
| 45 to 54 Years | 281 (88.9%) | 35 (11.1%) |
| 55 to 64 Years | 239 (60.7%) | 155 (39.3%) |
| 65 to 74 Years | 371 (100.0%) | 0 (0.0%) |
| 75 Years and older | 315 (100.0%) | 0 (0.0%) |
| Total | 2,857 (75.1%) | 949 (24.9%) |
Health Insurance Coverage by Citizenship Status in Colorado City

| Citizenship Status | With Coverage | Without Coverage |
| Native Born | 377 (92.2%) | 32 (7.8%) |
| Foreign Born, Citizen | 497 (91.4%) | 47 (8.6%) |
| Foreign Born, not a Citizen | 288 (34.3%) | 552 (65.7%) |
Health Insurance Coverage by Household Income in Colorado City
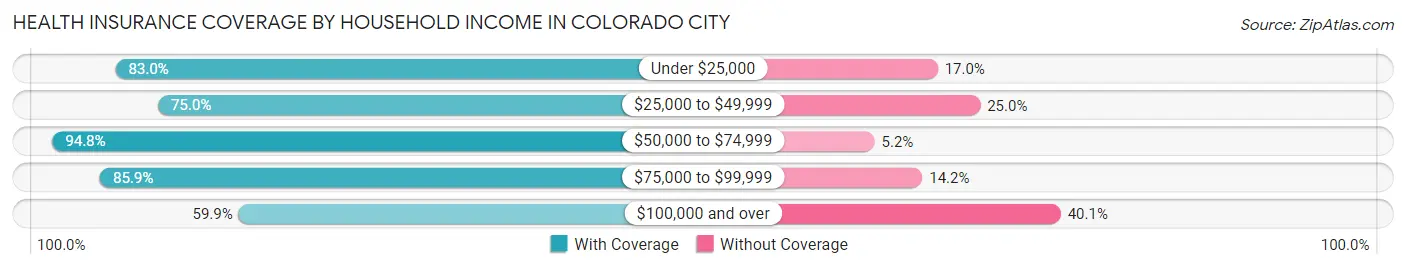
| Household Income | With Coverage | Without Coverage |
| Under $25,000 | 570 (83.0%) | 117 (17.0%) |
| $25,000 to $49,999 | 804 (75.0%) | 268 (25.0%) |
| $50,000 to $74,999 | 473 (94.8%) | 26 (5.2%) |
| $75,000 to $99,999 | 273 (85.9%) | 45 (14.1%) |
| $100,000 and over | 737 (59.9%) | 493 (40.1%) |
Public vs Private Health Insurance Coverage by Age in Colorado City
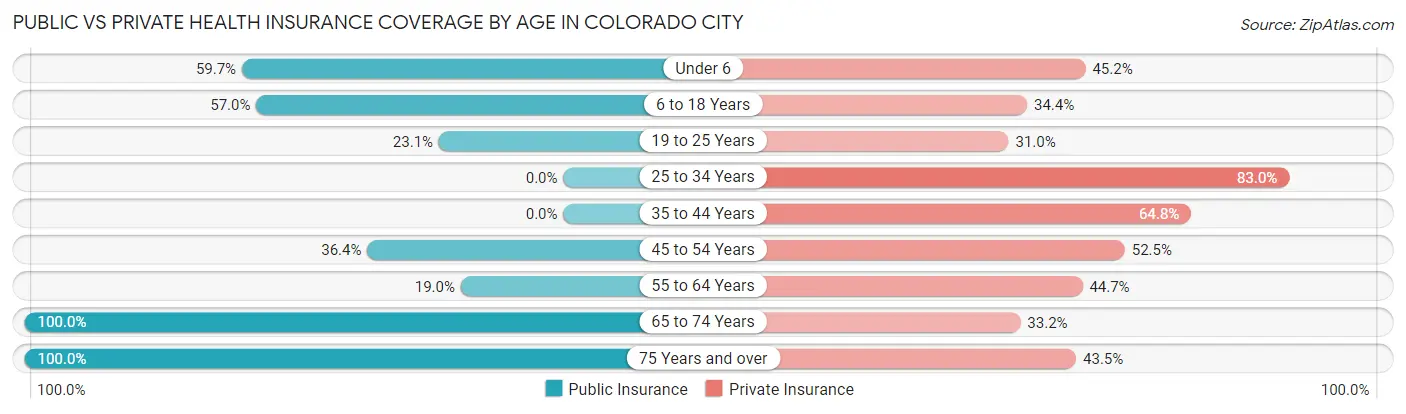
| Age Bracket | Public Insurance | Private Insurance |
| Under 6 | 244 (59.7%) | 185 (45.2%) |
| 6 to 18 Years | 310 (57.0%) | 187 (34.4%) |
| 19 to 25 Years | 194 (23.1%) | 260 (30.9%) |
| 25 to 34 Years | 0 (0.0%) | 406 (83.0%) |
| 35 to 44 Years | 0 (0.0%) | 83 (64.8%) |
| 45 to 54 Years | 115 (36.4%) | 166 (52.5%) |
| 55 to 64 Years | 75 (19.0%) | 176 (44.7%) |
| 65 to 74 Years | 371 (100.0%) | 123 (33.2%) |
| 75 Years and over | 315 (100.0%) | 137 (43.5%) |
| Total | 1,624 (42.7%) | 1,723 (45.3%) |
Disability Status by Sex by Age in Colorado City
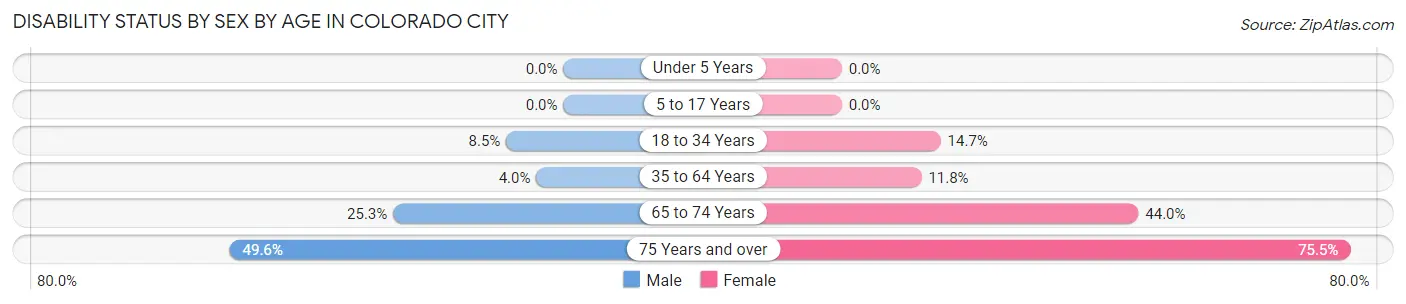
| Age Bracket | Male | Female |
| Under 5 Years | 0 (0.0%) | 0 (0.0%) |
| 5 to 17 Years | 0 (0.0%) | 0 (0.0%) |
| 18 to 34 Years | 55 (8.5%) | 121 (14.7%) |
| 35 to 64 Years | 15 (4.0%) | 55 (11.8%) |
| 65 to 74 Years | 45 (25.3%) | 85 (44.0%) |
| 75 Years and over | 55 (49.5%) | 154 (75.5%) |
Disability Class by Sex by Age in Colorado City
Disability Class: Hearing Difficulty
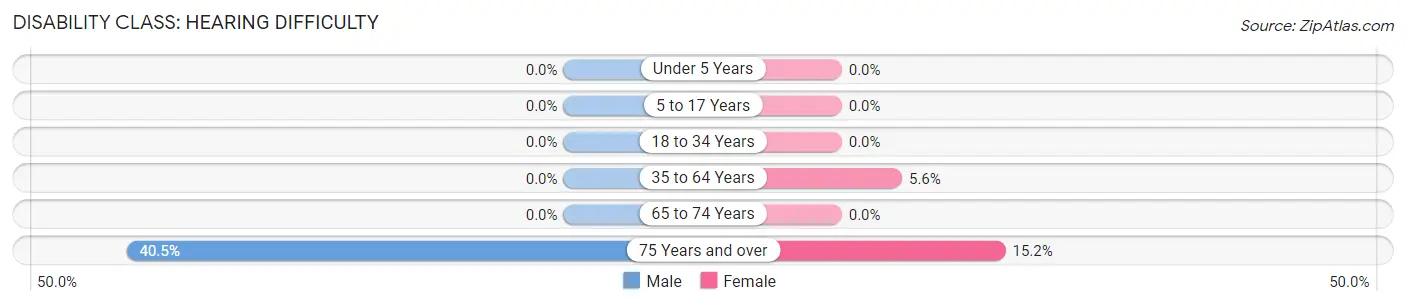
| Age Bracket | Male | Female |
| Under 5 Years | 0 (0.0%) | 0 (0.0%) |
| 5 to 17 Years | 0 (0.0%) | 0 (0.0%) |
| 18 to 34 Years | 0 (0.0%) | 0 (0.0%) |
| 35 to 64 Years | 0 (0.0%) | 26 (5.6%) |
| 65 to 74 Years | 0 (0.0%) | 0 (0.0%) |
| 75 Years and over | 45 (40.5%) | 31 (15.2%) |
Disability Class: Vision Difficulty
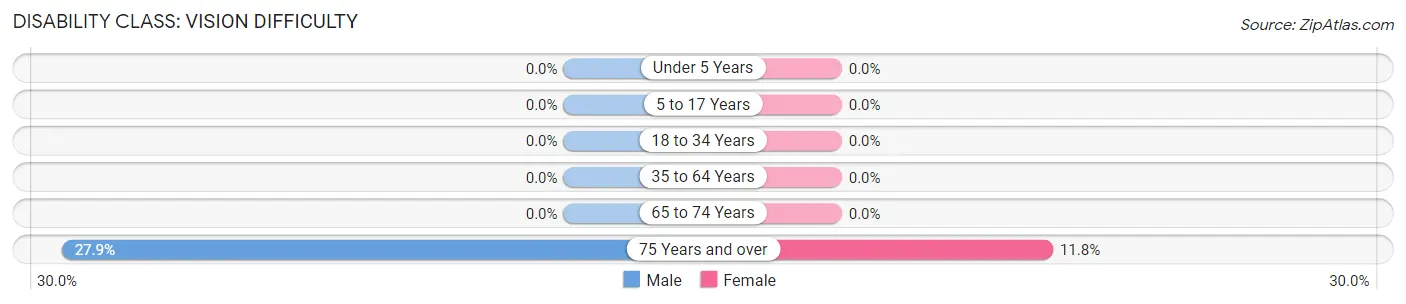
| Age Bracket | Male | Female |
| Under 5 Years | 0 (0.0%) | 0 (0.0%) |
| 5 to 17 Years | 0 (0.0%) | 0 (0.0%) |
| 18 to 34 Years | 0 (0.0%) | 0 (0.0%) |
| 35 to 64 Years | 0 (0.0%) | 0 (0.0%) |
| 65 to 74 Years | 0 (0.0%) | 0 (0.0%) |
| 75 Years and over | 31 (27.9%) | 24 (11.8%) |
Disability Class: Cognitive Difficulty
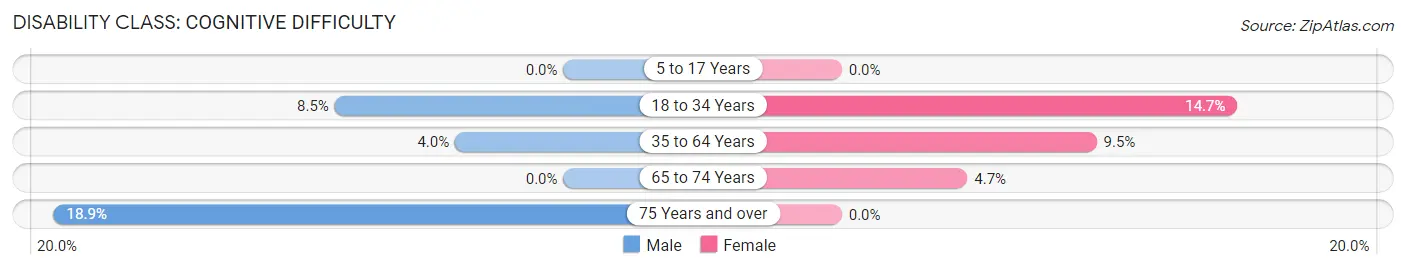
| Age Bracket | Male | Female |
| 5 to 17 Years | 0 (0.0%) | 0 (0.0%) |
| 18 to 34 Years | 55 (8.5%) | 121 (14.7%) |
| 35 to 64 Years | 15 (4.0%) | 44 (9.5%) |
| 65 to 74 Years | 0 (0.0%) | 9 (4.7%) |
| 75 Years and over | 21 (18.9%) | 0 (0.0%) |
Disability Class: Ambulatory Difficulty
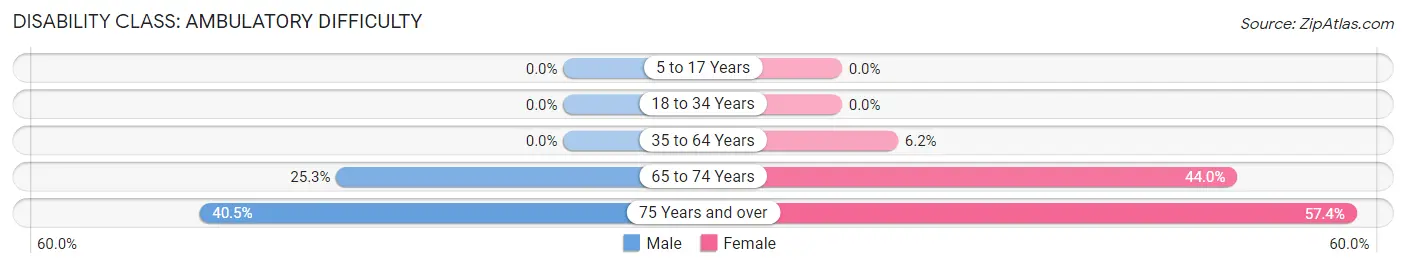
| Age Bracket | Male | Female |
| 5 to 17 Years | 0 (0.0%) | 0 (0.0%) |
| 18 to 34 Years | 0 (0.0%) | 0 (0.0%) |
| 35 to 64 Years | 0 (0.0%) | 29 (6.2%) |
| 65 to 74 Years | 45 (25.3%) | 85 (44.0%) |
| 75 Years and over | 45 (40.5%) | 117 (57.4%) |
Disability Class: Self-Care Difficulty
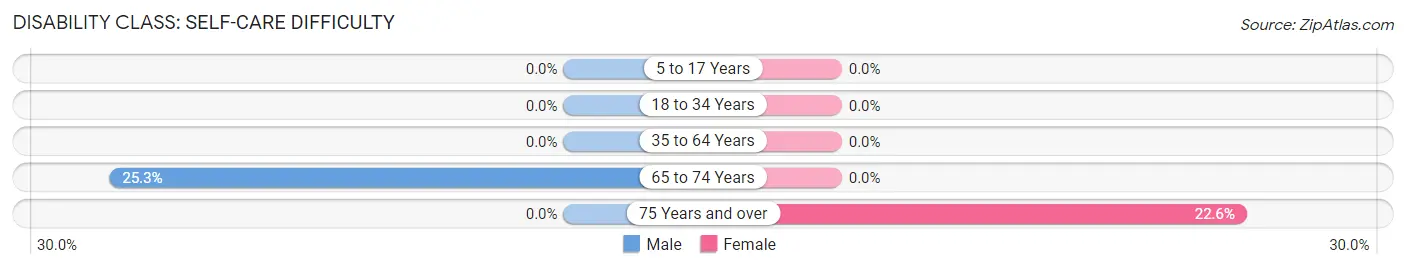
| Age Bracket | Male | Female |
| 5 to 17 Years | 0 (0.0%) | 0 (0.0%) |
| 18 to 34 Years | 0 (0.0%) | 0 (0.0%) |
| 35 to 64 Years | 0 (0.0%) | 0 (0.0%) |
| 65 to 74 Years | 45 (25.3%) | 0 (0.0%) |
| 75 Years and over | 0 (0.0%) | 46 (22.6%) |
Technology Access in Colorado City
Computing Device Access in Colorado City
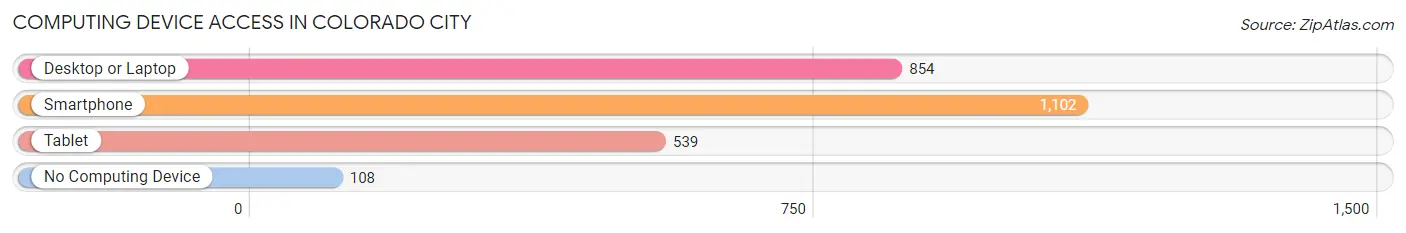
| Device Type | # Households | % Households |
| Desktop or Laptop | 854 | 67.7% |
| Smartphone | 1,102 | 87.4% |
| Tablet | 539 | 42.7% |
| No Computing Device | 108 | 8.6% |
| Total | 1,261 | 100.0% |
Internet Access in Colorado City
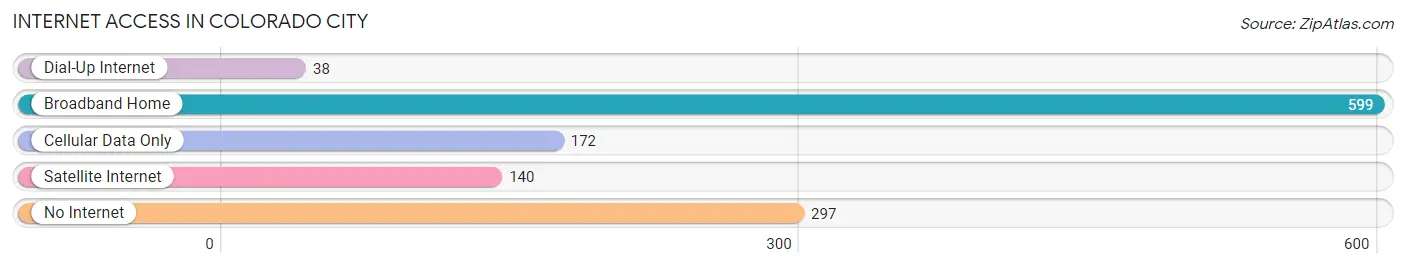
| Internet Type | # Households | % Households |
| Dial-Up Internet | 38 | 3.0% |
| Broadband Home | 599 | 47.5% |
| Cellular Data Only | 172 | 13.6% |
| Satellite Internet | 140 | 11.1% |
| No Internet | 297 | 23.5% |
| Total | 1,261 | 100.0% |
Colorado City Summary
City of Colorado City Texas
Colorado City is a city located in Mitchell County, Texas, United States. The population was 4,146 at the 2010 census. It is the county seat of Mitchell County.
History
The area around Colorado City was first settled in the late 1800s. The town was founded in 1882 and named after the nearby Colorado River. The town was incorporated in 1883 and the first post office was established in 1884.
The town grew rapidly in the early 1900s, and by 1910 the population had reached 1,000. The town was a center of commerce for the surrounding area, and it was home to several businesses, including a bank, a hotel, and a newspaper.
In the 1920s, the town was hit hard by the Great Depression, and the population declined. The town was able to recover in the 1930s, and by 1940 the population had grown to 1,500.
The town continued to grow in the 1950s and 1960s, and by 1970 the population had reached 2,500. The town has continued to grow since then, and the population was 4,146 at the 2010 census.
Geography
Colorado City is located at 32°22′17″N 100°45′17″W (32.371400, -100.754700). According to the United States Census Bureau, the city has a total area of 4.2 square miles (10.9 km2), all of it land.
Economy
The economy of Colorado City is largely based on agriculture and oil and gas production. The town is home to several businesses, including a bank, a hotel, and a newspaper.
The town is also home to several manufacturing companies, including a furniture factory, a plastics factory, and a metal fabrication plant.
Demographics
As of the census of 2010, there were 4,146 people, 1,541 households, and 1,072 families residing in the city. The population density was 986.2 people per square mile (381.2/km2). There were 1,717 housing units at an average density of 409.7 per square mile (158.2/km2). The racial makeup of the city was 79.2% White, 0.7% African American, 0.7% Native American, 0.3% Asian, 0.1% Pacific Islander, 16.7% from other races, and 2.3% from two or more races. Hispanic or Latino of any race were 33.2% of the population.
There were 1,541 households, out of which 33.2% had children under the age of 18 living with them, 51.2% were married couples living together, 13.2% had a female householder with no husband present, and 30.2% were non-families. 26.2% of all households were made up of individuals, and 13.2% had someone living alone who was 65 years of age or older. The average household size was 2.63 and the average family size was 3.17.
In the city, the population was spread out, with 28.2% under the age of 18, 8.2% from 18 to 24, 24.2% from 25 to 44, 22.2% from 45 to 64, and 17.2% who were 65 years of age or older. The median age was 36 years. For every 100 females, there were 91.2 males. For every 100 females age 18 and over, there were 87.2 males.
The median income for a household in the city was $27,917, and the median income for a family was $32,917. Males had a median income of $27,917 versus $20,000 for females. The per capita income for the city was $14,917. About 16.2% of families and 19.2% of the population were below the poverty line, including 25.2% of those under age 18 and 16.2% of those age 65 or over.
Common Questions
What is Per Capita Income in Colorado City?
Per Capita income in Colorado City is $22,954.
What is the Median Family Income in Colorado City?
Median Family Income in Colorado City is $51,985.
What is the Median Household income in Colorado City?
Median Household Income in Colorado City is $46,961.
What is Income or Wage Gap in Colorado City?
Income or Wage Gap in Colorado City is 44.1%.
Women in Colorado City earn 55.9 cents for every dollar earned by a man.
What is Family Income Deficit in Colorado City?
Family Income Deficit in Colorado City is $5,117.
Families that are below poverty line in Colorado City earn $5,117 less on average than the poverty threshold level.
What is Inequality or Gini Index in Colorado City?
Inequality or Gini Index in Colorado City is 0.42.
What is the Total Population of Colorado City?
Total Population of Colorado City is 3,952.
What is the Total Male Population of Colorado City?
Total Male Population of Colorado City is 1,823.
What is the Total Female Population of Colorado City?
Total Female Population of Colorado City is 2,129.
What is the Ratio of Males per 100 Females in Colorado City?
There are 85.63 Males per 100 Females in Colorado City.
What is the Ratio of Females per 100 Males in Colorado City?
There are 116.79 Females per 100 Males in Colorado City.
What is the Median Population Age in Colorado City?
Median Population Age in Colorado City is 31.4 Years.
What is the Average Family Size in Colorado City
Average Family Size in Colorado City is 4.9 People.
What is the Average Household Size in Colorado City
Average Household Size in Colorado City is 3.0 People.
How Large is the Labor Force in Colorado City?
There are 1,803 People in the Labor Forcein in Colorado City.
What is the Percentage of People in the Labor Force in Colorado City?
55.3% of People are in the Labor Force in Colorado City.
What is the Unemployment Rate in Colorado City?
Unemployment Rate in Colorado City is 1.6%.