Collinsville, TX Map & Demographics
Collinsville Map
Collinsville Overview
$32,890
PER CAPITA INCOME
$61,389
AVG FAMILY INCOME
$59,525
AVG HOUSEHOLD INCOME
47.1%
WAGE / INCOME GAP [ % ]
52.9¢/ $1
WAGE / INCOME GAP [ $ ]
0.42
INEQUALITY / GINI INDEX
1,762
TOTAL POPULATION
911
MALE POPULATION
851
FEMALE POPULATION
107.05
MALES / 100 FEMALES
93.41
FEMALES / 100 MALES
36.1
MEDIAN AGE
2.8
AVG FAMILY SIZE
2.6
AVG HOUSEHOLD SIZE
883
LABOR FORCE [ PEOPLE ]
63.5%
PERCENT IN LABOR FORCE
1.5%
UNEMPLOYMENT RATE
Collinsville Zip Codes
Collinsville Area Codes
Income in Collinsville
Income Overview in Collinsville
Per Capita Income in Collinsville is $32,890, while median incomes of families and households are $61,389 and $59,525 respectively.
| Characteristic | Number | Measure |
| Per Capita Income | 1,762 | $32,890 |
| Median Family Income | 504 | $61,389 |
| Mean Family Income | 504 | $96,510 |
| Median Household Income | 661 | $59,525 |
| Mean Household Income | 661 | $87,921 |
| Income Deficit | 504 | $0 |
| Wage / Income Gap (%) | 1,762 | 47.12% |
| Wage / Income Gap ($) | 1,762 | 52.88¢ per $1 |
| Gini / Inequality Index | 1,762 | 0.42 |
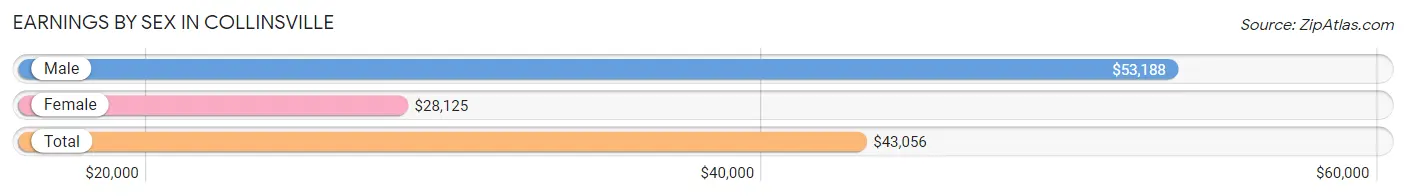
Earnings by Sex in Collinsville
Average Earnings in Collinsville are $43,056, $53,188 for men and $28,125 for women, a difference of 47.1%.
| Sex | Number | Average Earnings |
| Male | 523 (56.6%) | $53,188 |
| Female | 401 (43.4%) | $28,125 |
| Total | 924 (100.0%) | $43,056 |
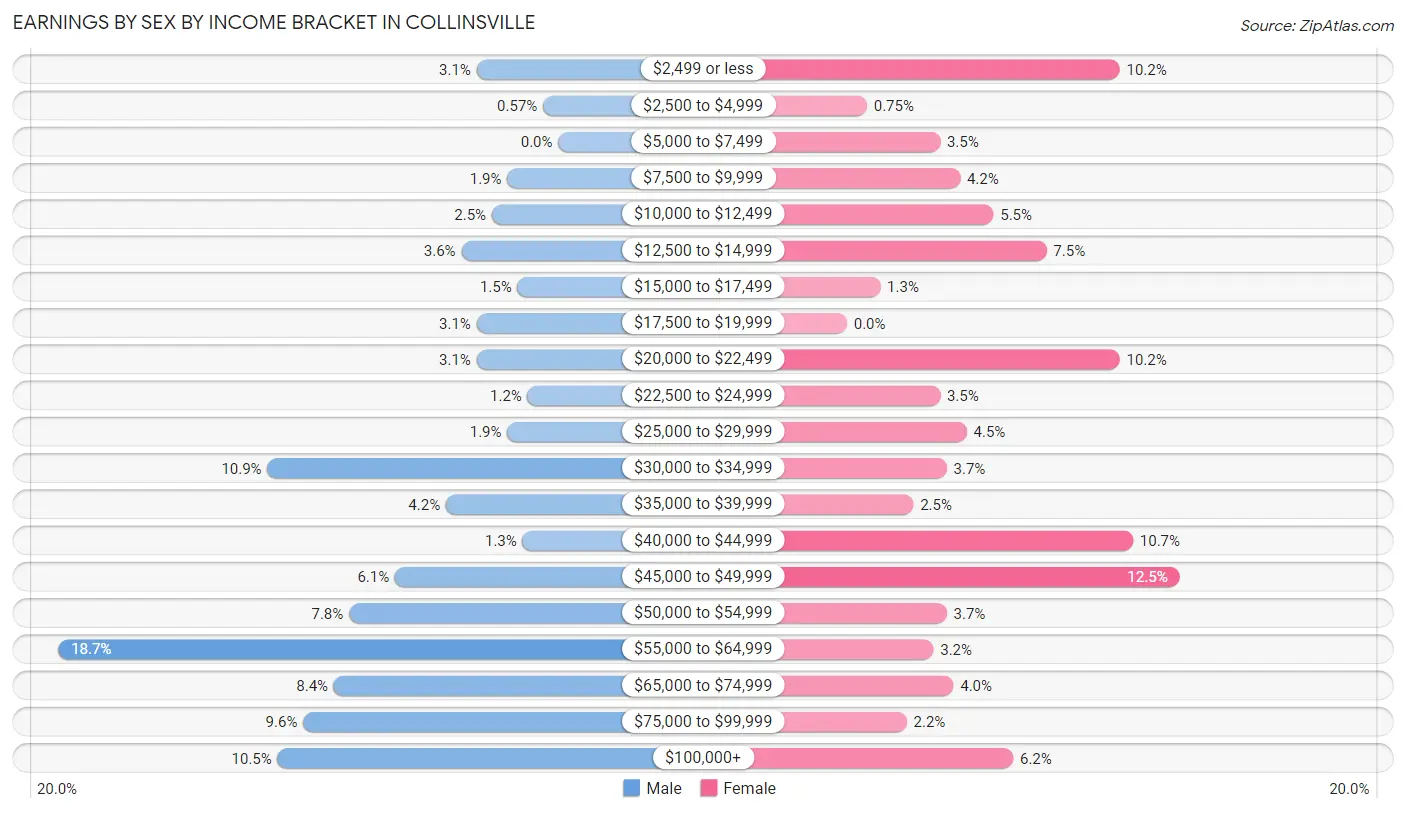
Earnings by Sex by Income Bracket in Collinsville
The most common earnings brackets in Collinsville are $55,000 to $64,999 for men (98 | 18.7%) and $45,000 to $49,999 for women (50 | 12.5%).
| Income | Male | Female |
| $2,499 or less | 16 (3.1%) | 41 (10.2%) |
| $2,500 to $4,999 | 3 (0.6%) | 3 (0.7%) |
| $5,000 to $7,499 | 0 (0.0%) | 14 (3.5%) |
| $7,500 to $9,999 | 10 (1.9%) | 17 (4.2%) |
| $10,000 to $12,499 | 13 (2.5%) | 22 (5.5%) |
| $12,500 to $14,999 | 19 (3.6%) | 30 (7.5%) |
| $15,000 to $17,499 | 8 (1.5%) | 5 (1.3%) |
| $17,500 to $19,999 | 16 (3.1%) | 0 (0.0%) |
| $20,000 to $22,499 | 16 (3.1%) | 41 (10.2%) |
| $22,500 to $24,999 | 6 (1.1%) | 14 (3.5%) |
| $25,000 to $29,999 | 10 (1.9%) | 18 (4.5%) |
| $30,000 to $34,999 | 57 (10.9%) | 15 (3.7%) |
| $35,000 to $39,999 | 22 (4.2%) | 10 (2.5%) |
| $40,000 to $44,999 | 7 (1.3%) | 43 (10.7%) |
| $45,000 to $49,999 | 32 (6.1%) | 50 (12.5%) |
| $50,000 to $54,999 | 41 (7.8%) | 15 (3.7%) |
| $55,000 to $64,999 | 98 (18.7%) | 13 (3.2%) |
| $65,000 to $74,999 | 44 (8.4%) | 16 (4.0%) |
| $75,000 to $99,999 | 50 (9.6%) | 9 (2.2%) |
| $100,000+ | 55 (10.5%) | 25 (6.2%) |
| Total | 523 (100.0%) | 401 (100.0%) |
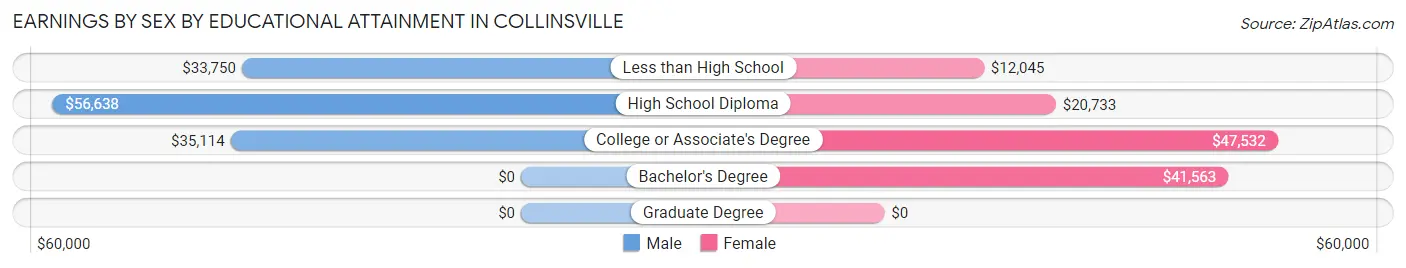
Earnings by Sex by Educational Attainment in Collinsville
Average earnings in Collinsville are $55,161 for men and $34,792 for women, a difference of 36.9%. Men with an educational attainment of high school diploma enjoy the highest average annual earnings of $56,638, while those with less than high school education earn the least with $33,750. Women with an educational attainment of college or associate's degree earn the most with the average annual earnings of $47,532, while those with less than high school education have the smallest earnings of $12,045.
| Educational Attainment | Male Income | Female Income |
| Less than High School | $33,750 | $12,045 |
| High School Diploma | $56,638 | $20,733 |
| College or Associate's Degree | $35,114 | $47,532 |
| Bachelor's Degree | - | - |
| Graduate Degree | - | - |
| Total | $55,161 | $34,792 |
Family Income in Collinsville
Family Income Brackets in Collinsville
According to the Collinsville family income data, there are 164 families falling into the $50,000 to $74,999 income range, which is the most common income bracket and makes up 32.5% of all families. Conversely, the less than $10,000 income bracket is the least frequent group with only 3 families (0.6%) belonging to this category.
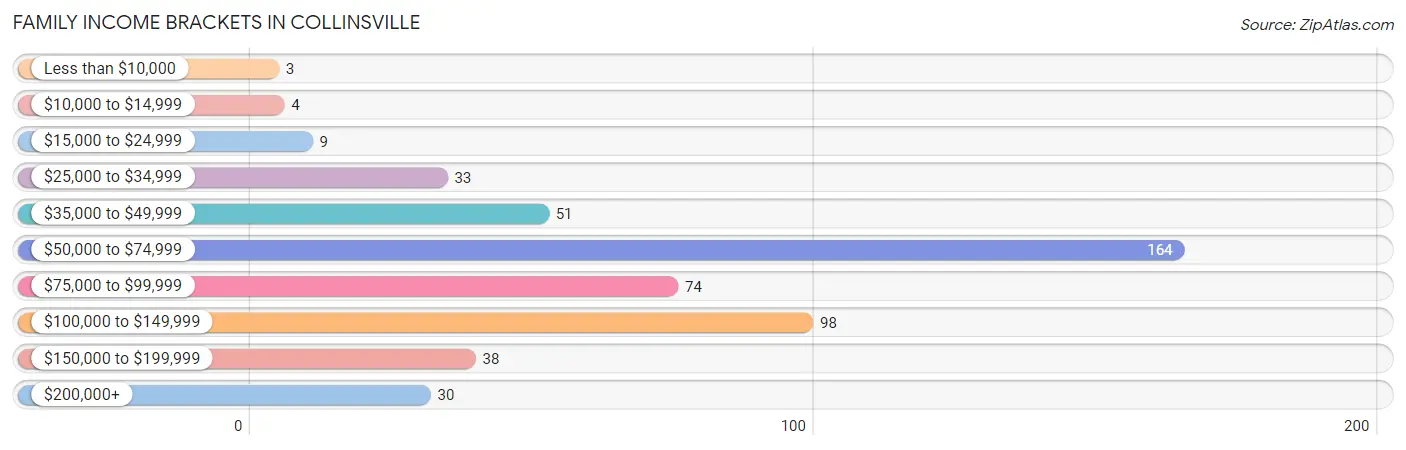
| Income Bracket | # Families | % Families |
| Less than $10,000 | 3 | 0.6% |
| $10,000 to $14,999 | 4 | 0.8% |
| $15,000 to $24,999 | 9 | 1.8% |
| $25,000 to $34,999 | 33 | 6.5% |
| $35,000 to $49,999 | 51 | 10.1% |
| $50,000 to $74,999 | 164 | 32.5% |
| $75,000 to $99,999 | 74 | 14.7% |
| $100,000 to $149,999 | 98 | 19.4% |
| $150,000 to $199,999 | 38 | 7.5% |
| $200,000+ | 30 | 6.0% |
Family Income by Famaliy Size in Collinsville
5-person families (32 | 6.4%) account for the highest median family income in Collinsville with $123,500 per family, while 3-person families (123 | 24.4%) have the highest median income of $33,701 per family member.
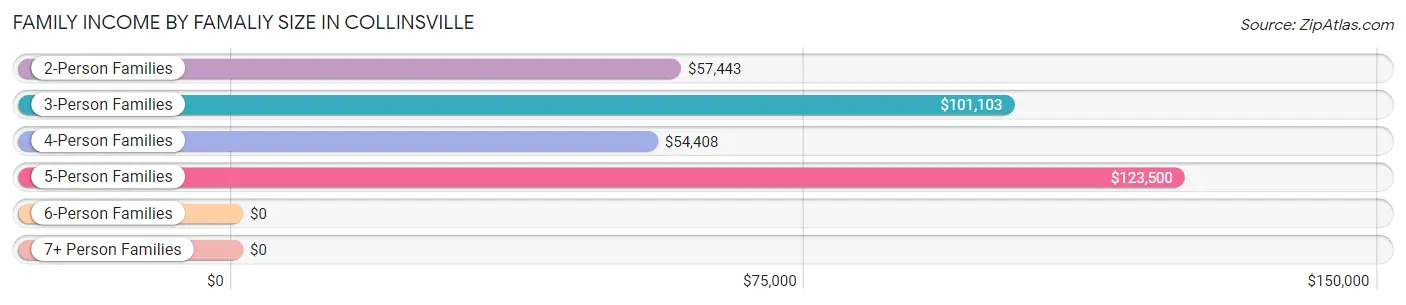
| Income Bracket | # Families | Median Income |
| 2-Person Families | 234 (46.4%) | $57,443 |
| 3-Person Families | 123 (24.4%) | $101,103 |
| 4-Person Families | 108 (21.4%) | $54,408 |
| 5-Person Families | 32 (6.4%) | $123,500 |
| 6-Person Families | 3 (0.6%) | $0 |
| 7+ Person Families | 4 (0.8%) | $0 |
| Total | 504 (100.0%) | $61,389 |
Family Income by Number of Earners in Collinsville
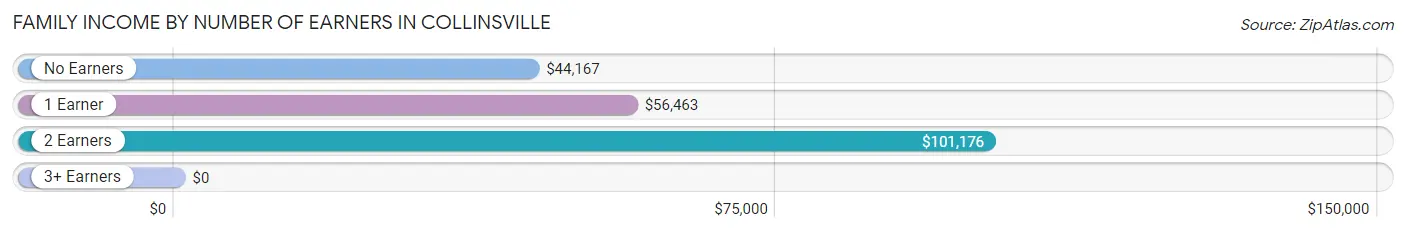
| Number of Earners | # Families | Median Income |
| No Earners | 30 (5.9%) | $44,167 |
| 1 Earner | 207 (41.1%) | $56,463 |
| 2 Earners | 200 (39.7%) | $101,176 |
| 3+ Earners | 67 (13.3%) | $0 |
| Total | 504 (100.0%) | $61,389 |
Household Income in Collinsville
Household Income Brackets in Collinsville
With 191 households falling in the category, the $50,000 to $74,999 income range is the most frequent in Collinsville, accounting for 28.9% of all households. In contrast, only 6 households (0.9%) fall into the $10,000 to $14,999 income bracket, making it the least populous group.
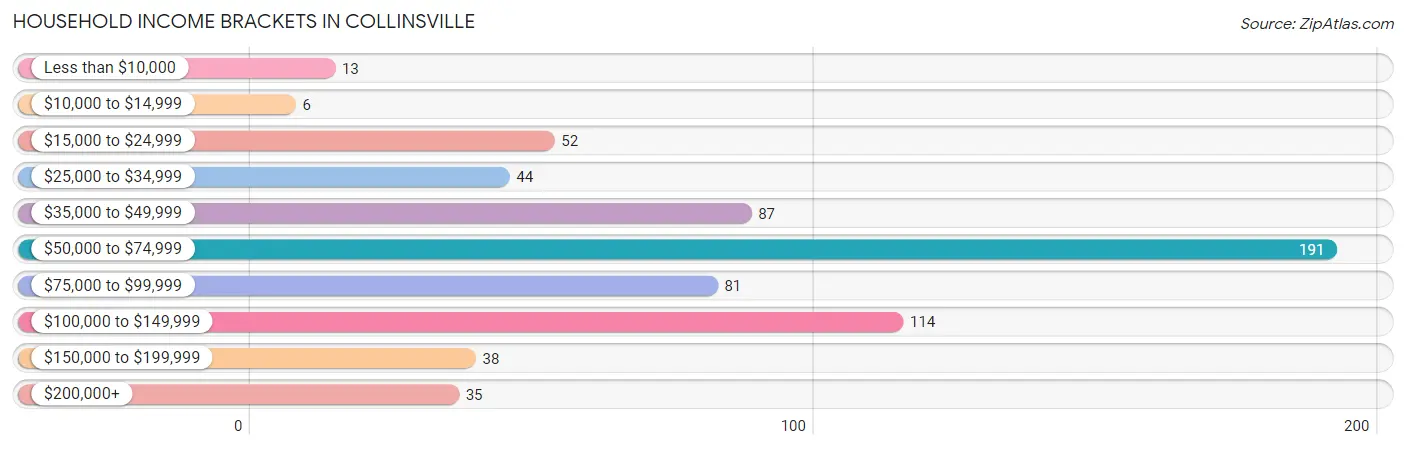
| Income Bracket | # Households | % Households |
| Less than $10,000 | 13 | 2.0% |
| $10,000 to $14,999 | 6 | 0.9% |
| $15,000 to $24,999 | 52 | 7.9% |
| $25,000 to $34,999 | 44 | 6.7% |
| $35,000 to $49,999 | 87 | 13.2% |
| $50,000 to $74,999 | 191 | 28.9% |
| $75,000 to $99,999 | 81 | 12.3% |
| $100,000 to $149,999 | 114 | 17.2% |
| $150,000 to $199,999 | 38 | 5.7% |
| $200,000+ | 35 | 5.3% |
Household Income by Householder Age in Collinsville
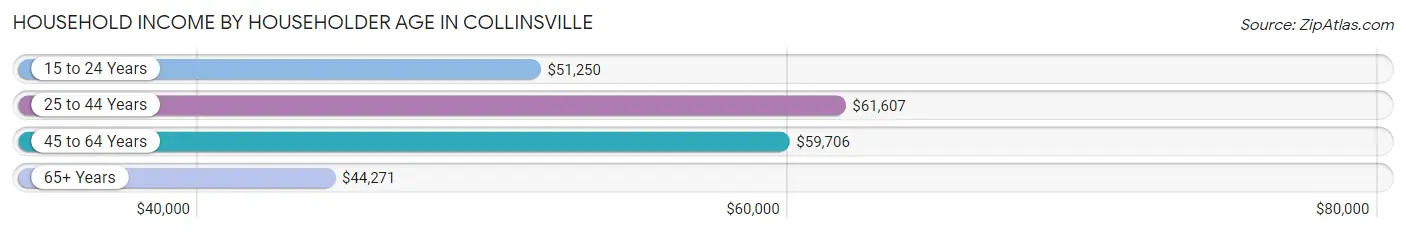
The median household income in Collinsville is $59,525, with the highest median household income of $61,607 found in the 25 to 44 years age bracket for the primary householder. A total of 300 households (45.4%) fall into this category. Meanwhile, the 65+ years age bracket for the primary householder has the lowest median household income of $44,271, with 105 households (15.9%) in this group.
| Income Bracket | # Households | Median Income |
| 15 to 24 Years | 32 (4.8%) | $51,250 |
| 25 to 44 Years | 300 (45.4%) | $61,607 |
| 45 to 64 Years | 224 (33.9%) | $59,706 |
| 65+ Years | 105 (15.9%) | $44,271 |
| Total | 661 (100.0%) | $59,525 |
Poverty in Collinsville
Income Below Poverty by Sex and Age in Collinsville
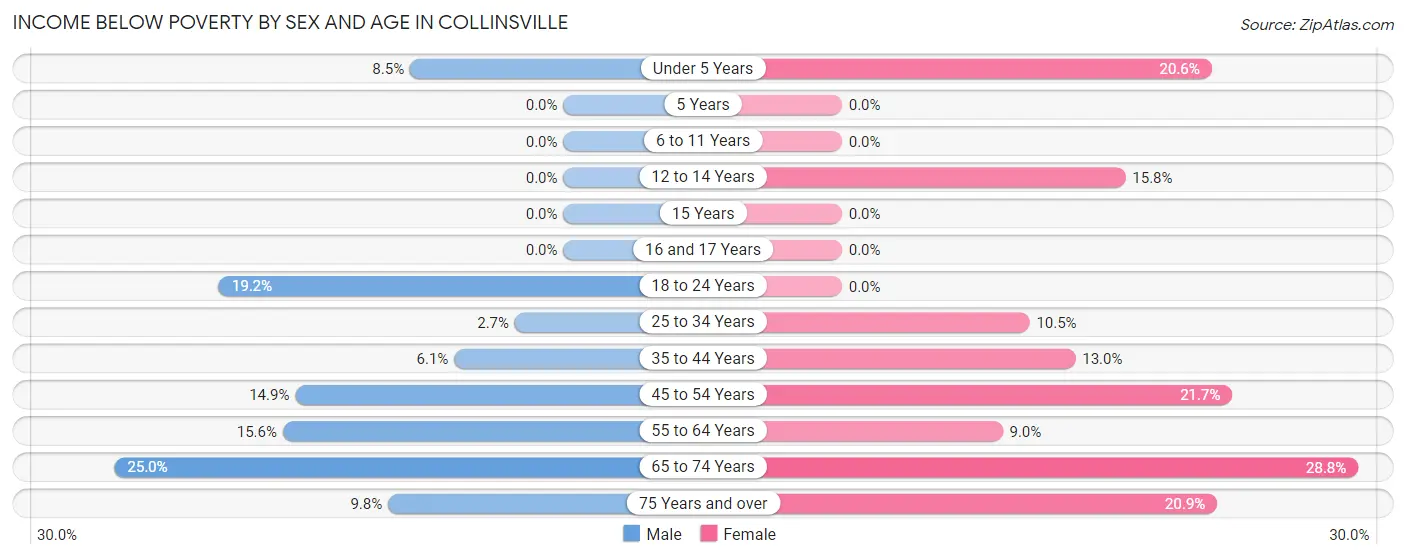
With 9.1% poverty level for males and 13.0% for females among the residents of Collinsville, 65 to 74 year old males and 65 to 74 year old females are the most vulnerable to poverty, with 15 males (25.0%) and 23 females (28.7%) in their respective age groups living below the poverty level.
| Age Bracket | Male | Female |
| Under 5 Years | 7 (8.5%) | 14 (20.6%) |
| 5 Years | 0 (0.0%) | 0 (0.0%) |
| 6 to 11 Years | 0 (0.0%) | 0 (0.0%) |
| 12 to 14 Years | 0 (0.0%) | 3 (15.8%) |
| 15 Years | 0 (0.0%) | 0 (0.0%) |
| 16 and 17 Years | 0 (0.0%) | 0 (0.0%) |
| 18 to 24 Years | 14 (19.2%) | 0 (0.0%) |
| 25 to 34 Years | 4 (2.7%) | 14 (10.4%) |
| 35 to 44 Years | 9 (6.1%) | 13 (13.0%) |
| 45 to 54 Years | 10 (14.9%) | 10 (21.7%) |
| 55 to 64 Years | 20 (15.6%) | 17 (8.9%) |
| 65 to 74 Years | 15 (25.0%) | 23 (28.7%) |
| 75 Years and over | 4 (9.8%) | 14 (20.9%) |
| Total | 83 (9.1%) | 108 (13.0%) |
Income Above Poverty by Sex and Age in Collinsville
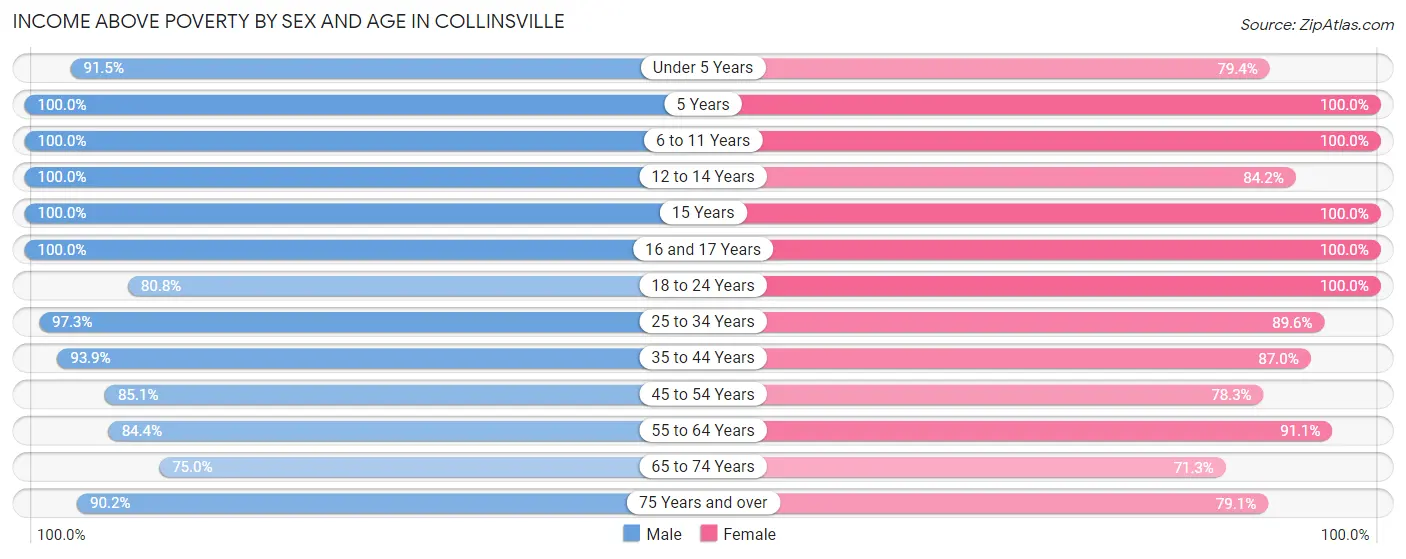
According to the poverty statistics in Collinsville, males aged 5 years and females aged 5 years are the age groups that are most secure financially, with 100.0% of males and 100.0% of females in these age groups living above the poverty line.
| Age Bracket | Male | Female |
| Under 5 Years | 75 (91.5%) | 54 (79.4%) |
| 5 Years | 3 (100.0%) | 3 (100.0%) |
| 6 to 11 Years | 67 (100.0%) | 37 (100.0%) |
| 12 to 14 Years | 69 (100.0%) | 16 (84.2%) |
| 15 Years | 14 (100.0%) | 10 (100.0%) |
| 16 and 17 Years | 11 (100.0%) | 12 (100.0%) |
| 18 to 24 Years | 59 (80.8%) | 63 (100.0%) |
| 25 to 34 Years | 144 (97.3%) | 120 (89.5%) |
| 35 to 44 Years | 139 (93.9%) | 87 (87.0%) |
| 45 to 54 Years | 57 (85.1%) | 36 (78.3%) |
| 55 to 64 Years | 108 (84.4%) | 173 (91.0%) |
| 65 to 74 Years | 45 (75.0%) | 57 (71.3%) |
| 75 Years and over | 37 (90.2%) | 53 (79.1%) |
| Total | 828 (90.9%) | 721 (87.0%) |
Income Below Poverty Among Married-Couple Families in Collinsville
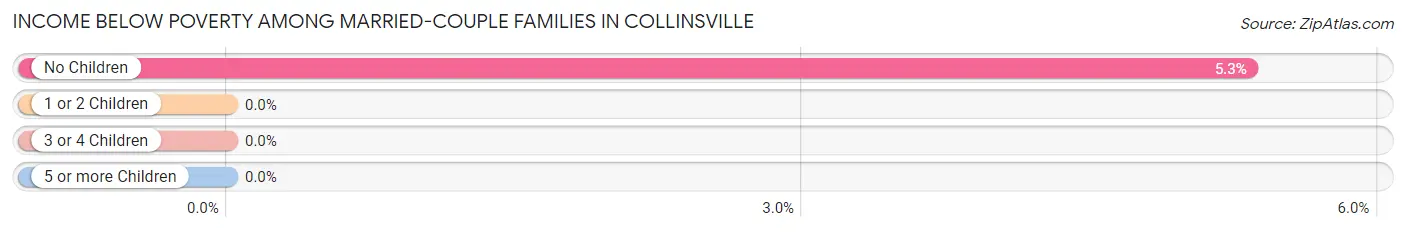
The poverty statistics for married-couple families in Collinsville show that 2.4% or 9 of the total 369 families live below the poverty line. Families with no children have the highest poverty rate of 5.3%, comprising of 9 families. On the other hand, families with 1 or 2 children have the lowest poverty rate of 0.0%, which includes 0 families.
| Children | Above Poverty | Below Poverty |
| No Children | 160 (94.7%) | 9 (5.3%) |
| 1 or 2 Children | 183 (100.0%) | 0 (0.0%) |
| 3 or 4 Children | 13 (100.0%) | 0 (0.0%) |
| 5 or more Children | 4 (100.0%) | 0 (0.0%) |
| Total | 360 (97.6%) | 9 (2.4%) |
Income Below Poverty Among Single-Parent Households in Collinsville
According to the poverty data in Collinsville, 4.6% or 4 single-father households and 33.3% or 16 single-mother households are living below the poverty line. Among single-father households, those with 1 or 2 children have the highest poverty rate, with 4 households (8.7%) experiencing poverty. Likewise, among single-mother households, those with 1 or 2 children have the highest poverty rate, with 16 households (57.1%) falling below the poverty line.
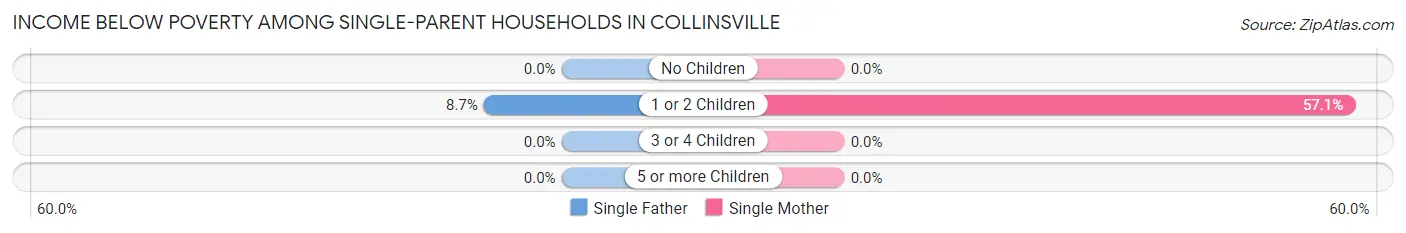
| Children | Single Father | Single Mother |
| No Children | 0 (0.0%) | 0 (0.0%) |
| 1 or 2 Children | 4 (8.7%) | 16 (57.1%) |
| 3 or 4 Children | 0 (0.0%) | 0 (0.0%) |
| 5 or more Children | 0 (0.0%) | 0 (0.0%) |
| Total | 4 (4.6%) | 16 (33.3%) |
Income Below Poverty Among Married-Couple vs Single-Parent Households in Collinsville
The poverty data for Collinsville shows that 9 of the married-couple family households (2.4%) and 20 of the single-parent households (14.8%) are living below the poverty level. Within the married-couple family households, those with no children have the highest poverty rate, with 9 households (5.3%) falling below the poverty line. Among the single-parent households, those with 1 or 2 children have the highest poverty rate, with 20 household (27.0%) living below poverty.
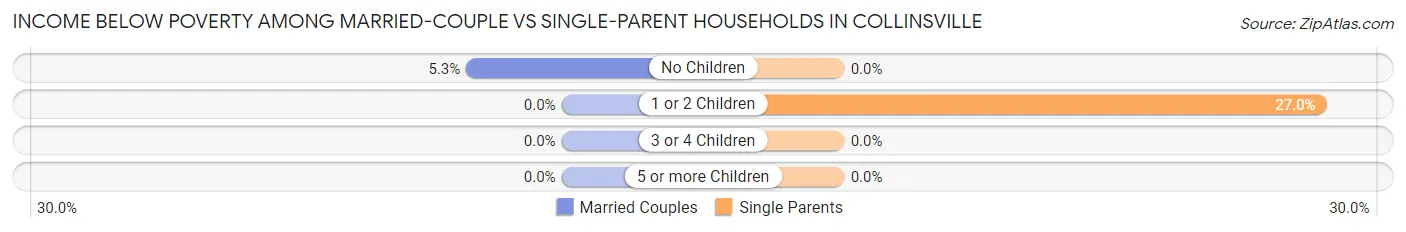
| Children | Married-Couple Families | Single-Parent Households |
| No Children | 9 (5.3%) | 0 (0.0%) |
| 1 or 2 Children | 0 (0.0%) | 20 (27.0%) |
| 3 or 4 Children | 0 (0.0%) | 0 (0.0%) |
| 5 or more Children | 0 (0.0%) | 0 (0.0%) |
| Total | 9 (2.4%) | 20 (14.8%) |
Race in Collinsville
The most populous races in Collinsville are White / Caucasian (1,496 | 84.9%), Hispanic or Latino (361 | 20.5%), and Two or more Races (215 | 12.2%).
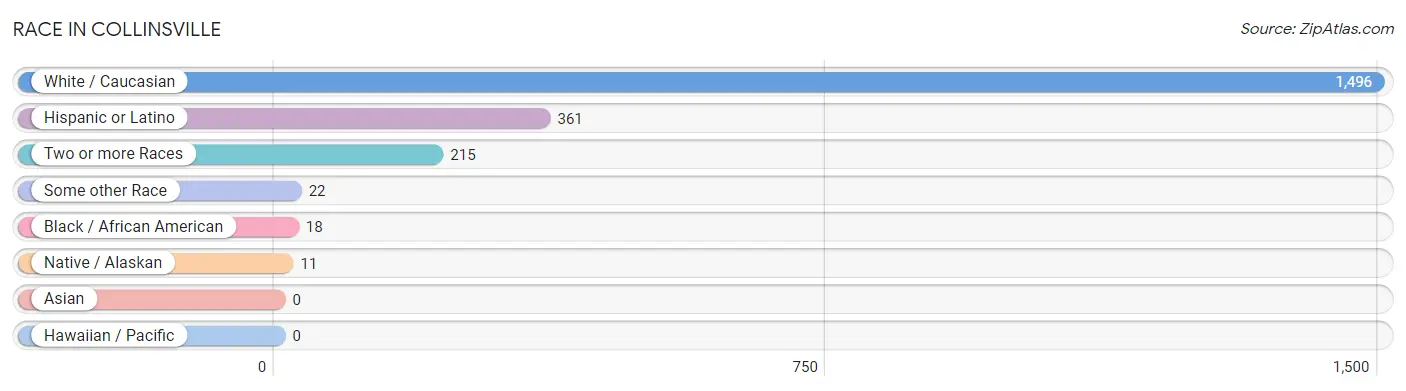
| Race | # Population | % Population |
| Asian | 0 | 0.0% |
| Black / African American | 18 | 1.0% |
| Hawaiian / Pacific | 0 | 0.0% |
| Hispanic or Latino | 361 | 20.5% |
| Native / Alaskan | 11 | 0.6% |
| White / Caucasian | 1,496 | 84.9% |
| Two or more Races | 215 | 12.2% |
| Some other Race | 22 | 1.3% |
| Total | 1,762 | 100.0% |
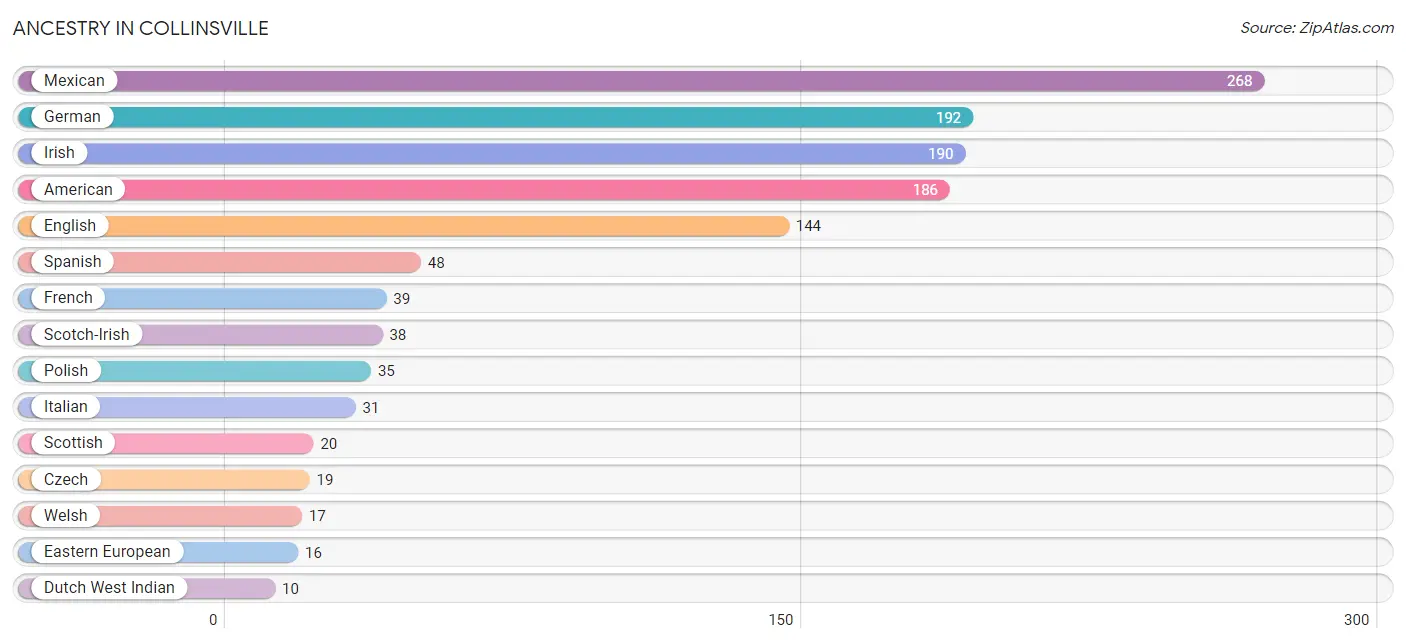
Ancestry in Collinsville
The most populous ancestries reported in Collinsville are Mexican (268 | 15.2%), German (192 | 10.9%), Irish (190 | 10.8%), American (186 | 10.6%), and English (144 | 8.2%), together accounting for 55.6% of all Collinsville residents.
| Ancestry | # Population | % Population |
| American | 186 | 10.6% |
| Bhutanese | 3 | 0.2% |
| Cherokee | 9 | 0.5% |
| Choctaw | 4 | 0.2% |
| Cuban | 5 | 0.3% |
| Czech | 19 | 1.1% |
| Dutch | 3 | 0.2% |
| Dutch West Indian | 10 | 0.6% |
| Eastern European | 16 | 0.9% |
| English | 144 | 8.2% |
| European | 10 | 0.6% |
| French | 39 | 2.2% |
| German | 192 | 10.9% |
| Greek | 4 | 0.2% |
| Irish | 190 | 10.8% |
| Israeli | 9 | 0.5% |
| Italian | 31 | 1.8% |
| Mexican | 268 | 15.2% |
| Norwegian | 8 | 0.4% |
| Polish | 35 | 2.0% |
| Potawatomi | 1 | 0.1% |
| Puerto Rican | 2 | 0.1% |
| Romanian | 5 | 0.3% |
| Russian | 3 | 0.2% |
| Scandinavian | 3 | 0.2% |
| Scotch-Irish | 38 | 2.2% |
| Scottish | 20 | 1.1% |
| Slovak | 3 | 0.2% |
| Spanish | 48 | 2.7% |
| Sri Lankan | 3 | 0.2% |
| Swedish | 3 | 0.2% |
| Welsh | 17 | 1.0% | View All 32 Rows |
Immigrants in Collinsville
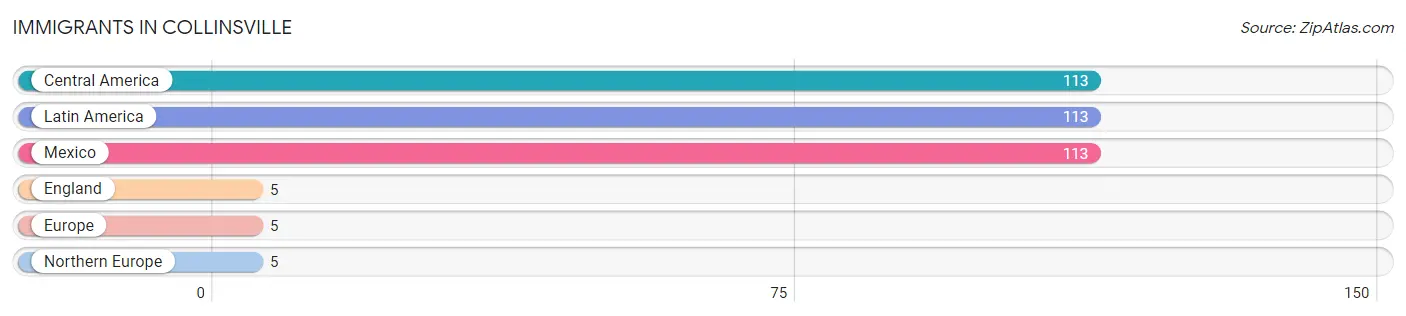
The most numerous immigrant groups reported in Collinsville came from Central America (113 | 6.4%), Latin America (113 | 6.4%), Mexico (113 | 6.4%), England (5 | 0.3%), and Europe (5 | 0.3%), together accounting for 19.8% of all Collinsville residents.
| Immigration Origin | # Population | % Population |
| Central America | 113 | 6.4% |
| England | 5 | 0.3% |
| Europe | 5 | 0.3% |
| Latin America | 113 | 6.4% |
| Mexico | 113 | 6.4% |
| Northern Europe | 5 | 0.3% | View All 6 Rows |
Sex and Age in Collinsville
Sex and Age in Collinsville
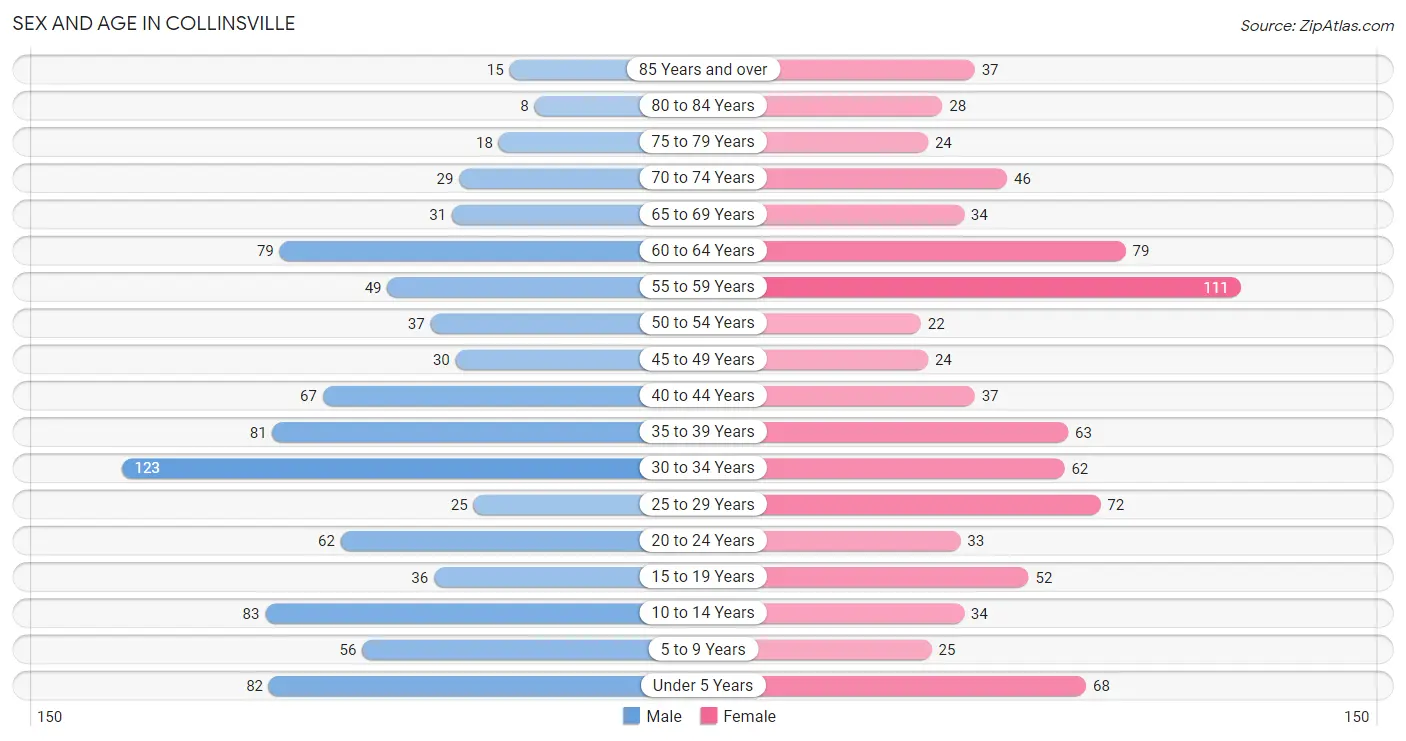
The most populous age groups in Collinsville are 30 to 34 Years (123 | 13.5%) for men and 55 to 59 Years (111 | 13.0%) for women.
| Age Bracket | Male | Female |
| Under 5 Years | 82 (9.0%) | 68 (8.0%) |
| 5 to 9 Years | 56 (6.1%) | 25 (2.9%) |
| 10 to 14 Years | 83 (9.1%) | 34 (4.0%) |
| 15 to 19 Years | 36 (4.0%) | 52 (6.1%) |
| 20 to 24 Years | 62 (6.8%) | 33 (3.9%) |
| 25 to 29 Years | 25 (2.7%) | 72 (8.5%) |
| 30 to 34 Years | 123 (13.5%) | 62 (7.3%) |
| 35 to 39 Years | 81 (8.9%) | 63 (7.4%) |
| 40 to 44 Years | 67 (7.3%) | 37 (4.3%) |
| 45 to 49 Years | 30 (3.3%) | 24 (2.8%) |
| 50 to 54 Years | 37 (4.1%) | 22 (2.6%) |
| 55 to 59 Years | 49 (5.4%) | 111 (13.0%) |
| 60 to 64 Years | 79 (8.7%) | 79 (9.3%) |
| 65 to 69 Years | 31 (3.4%) | 34 (4.0%) |
| 70 to 74 Years | 29 (3.2%) | 46 (5.4%) |
| 75 to 79 Years | 18 (2.0%) | 24 (2.8%) |
| 80 to 84 Years | 8 (0.9%) | 28 (3.3%) |
| 85 Years and over | 15 (1.7%) | 37 (4.3%) |
| Total | 911 (100.0%) | 851 (100.0%) |
Families and Households in Collinsville
Median Family Size in Collinsville
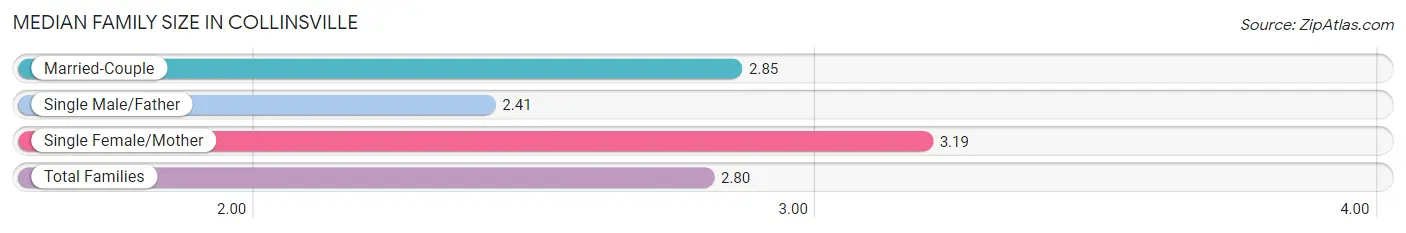
The median family size in Collinsville is 2.80 persons per family, with single female/mother families (48 | 9.5%) accounting for the largest median family size of 3.19 persons per family. On the other hand, single male/father families (87 | 17.3%) represent the smallest median family size with 2.41 persons per family.
| Family Type | # Families | Family Size |
| Married-Couple | 369 (73.2%) | 2.85 |
| Single Male/Father | 87 (17.3%) | 2.41 |
| Single Female/Mother | 48 (9.5%) | 3.19 |
| Total Families | 504 (100.0%) | 2.80 |
Median Household Size in Collinsville
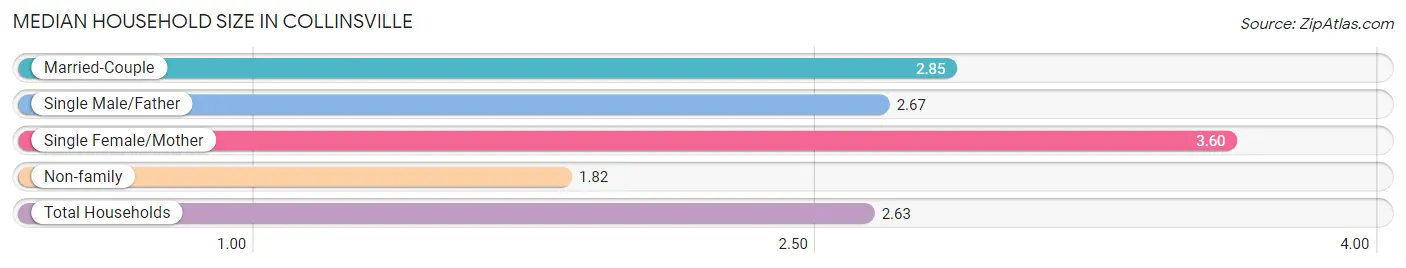
The median household size in Collinsville is 2.63 persons per household, with single female/mother households (48 | 7.3%) accounting for the largest median household size of 3.6 persons per household. non-family households (157 | 23.7%) represent the smallest median household size with 1.82 persons per household.
| Household Type | # Households | Household Size |
| Married-Couple | 369 (55.8%) | 2.85 |
| Single Male/Father | 87 (13.2%) | 2.67 |
| Single Female/Mother | 48 (7.3%) | 3.60 |
| Non-family | 157 (23.7%) | 1.82 |
| Total Households | 661 (100.0%) | 2.63 |
Household Size by Marriage Status in Collinsville
Out of a total of 661 households in Collinsville, 504 (76.2%) are family households, while 157 (23.7%) are nonfamily households. The most numerous type of family households are 2-person households, comprising 190, and the most common type of nonfamily households are 1-person households, comprising 133.
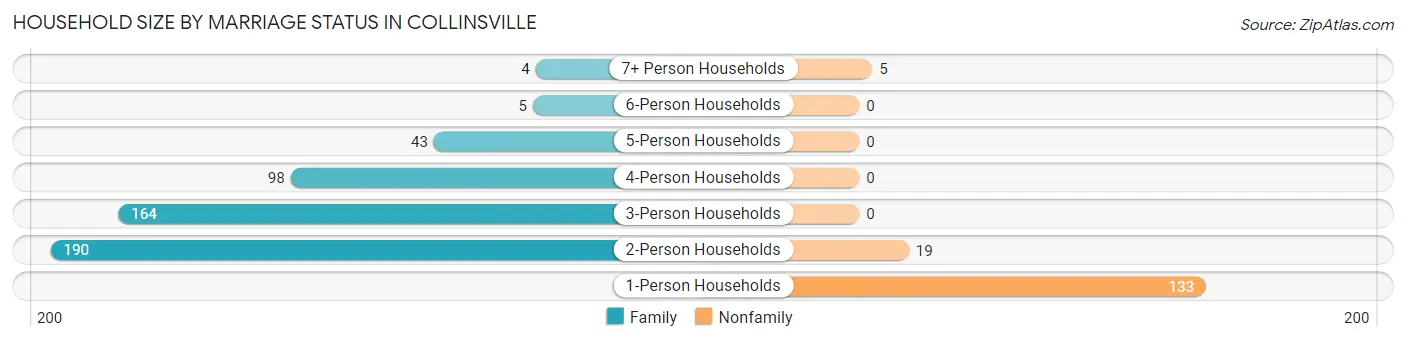
| Household Size | Family Households | Nonfamily Households |
| 1-Person Households | - | 133 (20.1%) |
| 2-Person Households | 190 (28.7%) | 19 (2.9%) |
| 3-Person Households | 164 (24.8%) | 0 (0.0%) |
| 4-Person Households | 98 (14.8%) | 0 (0.0%) |
| 5-Person Households | 43 (6.5%) | 0 (0.0%) |
| 6-Person Households | 5 (0.8%) | 0 (0.0%) |
| 7+ Person Households | 4 (0.6%) | 5 (0.8%) |
| Total | 504 (76.2%) | 157 (23.7%) |
Female Fertility in Collinsville
Fertility by Age in Collinsville
Average fertility rate in Collinsville is 114.0 births per 1,000 women. Women in the age bracket of 20 to 34 years have the highest fertility rate with 246.0 births per 1,000 women. Women in the age bracket of 20 to 34 years acount for 100.0% of all women with births.
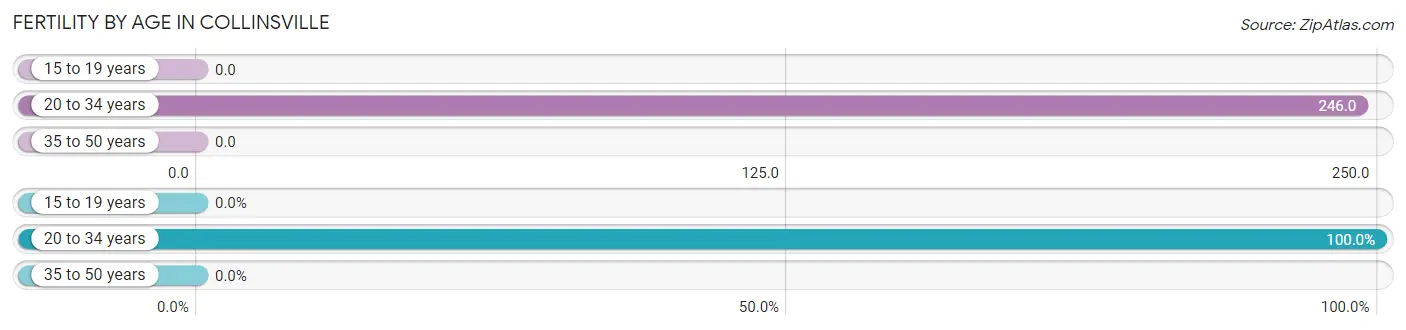
| Age Bracket | Women with Births | Births / 1,000 Women |
| 15 to 19 years | 0 (0.0%) | 0.0 |
| 20 to 34 years | 41 (100.0%) | 246.0 |
| 35 to 50 years | 0 (0.0%) | 0.0 |
| Total | 41 (100.0%) | 114.0 |
Fertility by Age by Marriage Status in Collinsville
92.7% of women with births (41) in Collinsville are married. The highest percentage of unmarried women with births falls into 20 to 34 years age bracket with 7.3% of them unmarried at the time of birth, while the lowest percentage of unmarried women with births belong to 20 to 34 years age bracket with 7.3% of them unmarried.
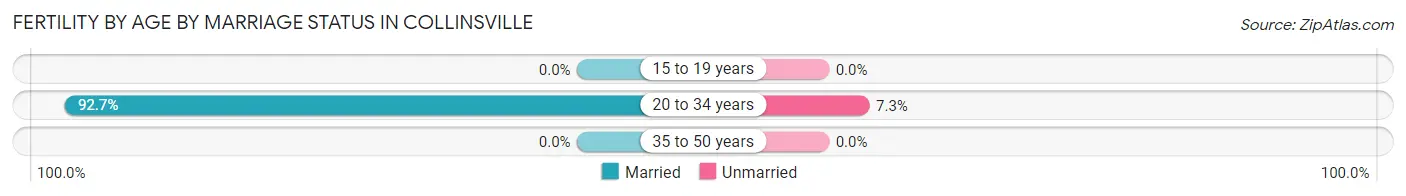
| Age Bracket | Married | Unmarried |
| 15 to 19 years | 0 (0.0%) | 0 (0.0%) |
| 20 to 34 years | 38 (92.7%) | 3 (7.3%) |
| 35 to 50 years | 0 (0.0%) | 0 (0.0%) |
| Total | 38 (92.7%) | 3 (7.3%) |
Fertility by Education in Collinsville
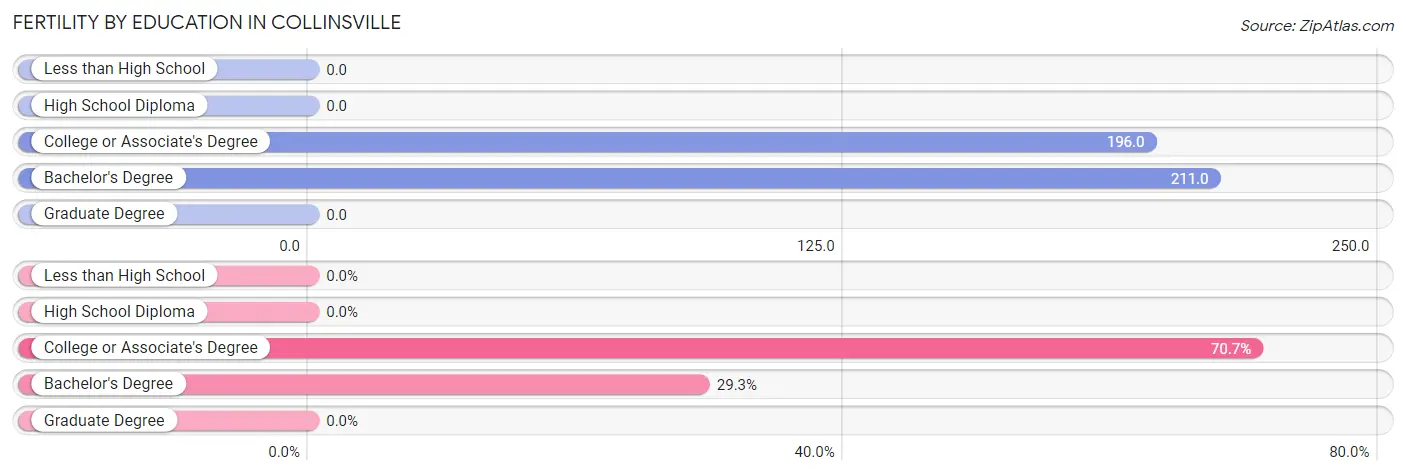
| Educational Attainment | Women with Births | Births / 1,000 Women |
| Less than High School | 0 (0.0%) | 0.0 |
| High School Diploma | 0 (0.0%) | 0.0 |
| College or Associate's Degree | 29 (70.7%) | 196.0 |
| Bachelor's Degree | 12 (29.3%) | 211.0 |
| Graduate Degree | 0 (0.0%) | 0.0 |
| Total | 41 (100.0%) | 114.0 |
Fertility by Education by Marriage Status in Collinsville
7.3% of women with births in Collinsville are unmarried. Women with the educational attainment of bachelor's degree are most likely to be married with 100.0% of them married at childbirth, while women with the educational attainment of college or associate's degree are least likely to be married with 10.3% of them unmarried at childbirth.
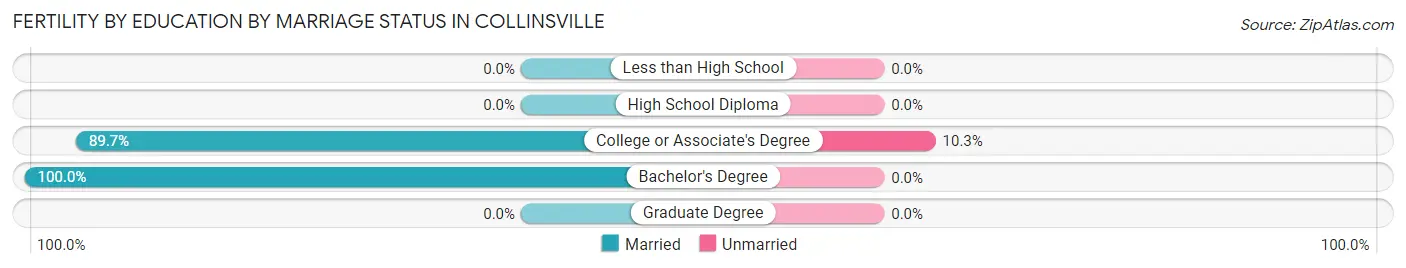
| Educational Attainment | Married | Unmarried |
| Less than High School | 0 (0.0%) | 0 (0.0%) |
| High School Diploma | 0 (0.0%) | 0 (0.0%) |
| College or Associate's Degree | 26 (89.7%) | 3 (10.3%) |
| Bachelor's Degree | 12 (100.0%) | 0 (0.0%) |
| Graduate Degree | 0 (0.0%) | 0 (0.0%) |
| Total | 38 (92.7%) | 3 (7.3%) |
Employment Characteristics in Collinsville
Employment by Class of Employer in Collinsville
Among the 844 employed individuals in Collinsville, private company employees (619 | 73.3%), local government employees (90 | 10.7%), and self-employed (not incorporated) (54 | 6.4%) make up the most common classes of employment.
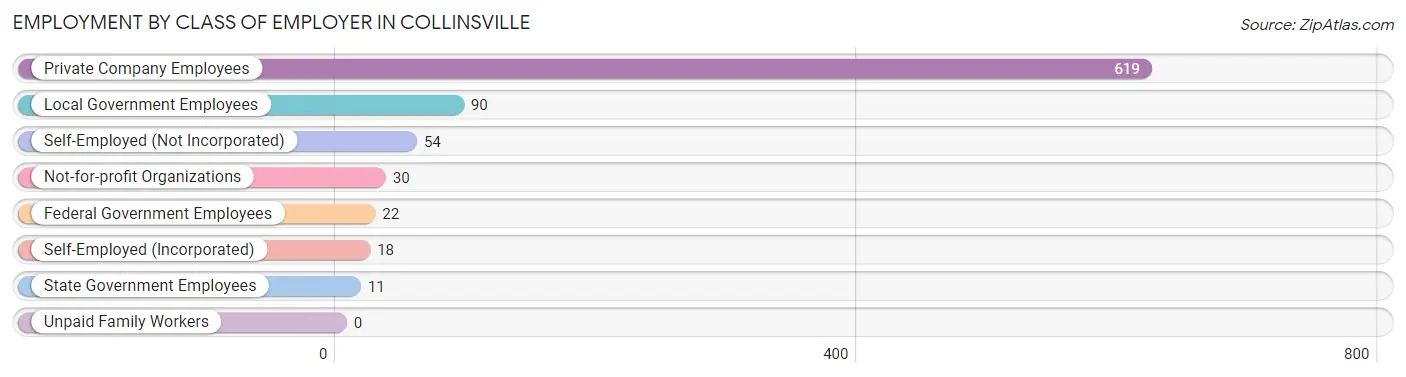
| Employer Class | # Employees | % Employees |
| Private Company Employees | 619 | 73.3% |
| Self-Employed (Incorporated) | 18 | 2.1% |
| Self-Employed (Not Incorporated) | 54 | 6.4% |
| Not-for-profit Organizations | 30 | 3.5% |
| Local Government Employees | 90 | 10.7% |
| State Government Employees | 11 | 1.3% |
| Federal Government Employees | 22 | 2.6% |
| Unpaid Family Workers | 0 | 0.0% |
| Total | 844 | 100.0% |
Employment Status by Age in Collinsville
According to the labor force statistics for Collinsville, out of the total population over 16 years of age (1,390), 63.5% or 883 individuals are in the labor force, with 1.5% or 13 of them unemployed. The age group with the highest labor force participation rate is 30 to 34 years, with 97.3% or 180 individuals in the labor force. Within the labor force, the 16 to 19 years age range has the highest percentage of unemployed individuals, with 54.5% or 6 of them being unemployed.
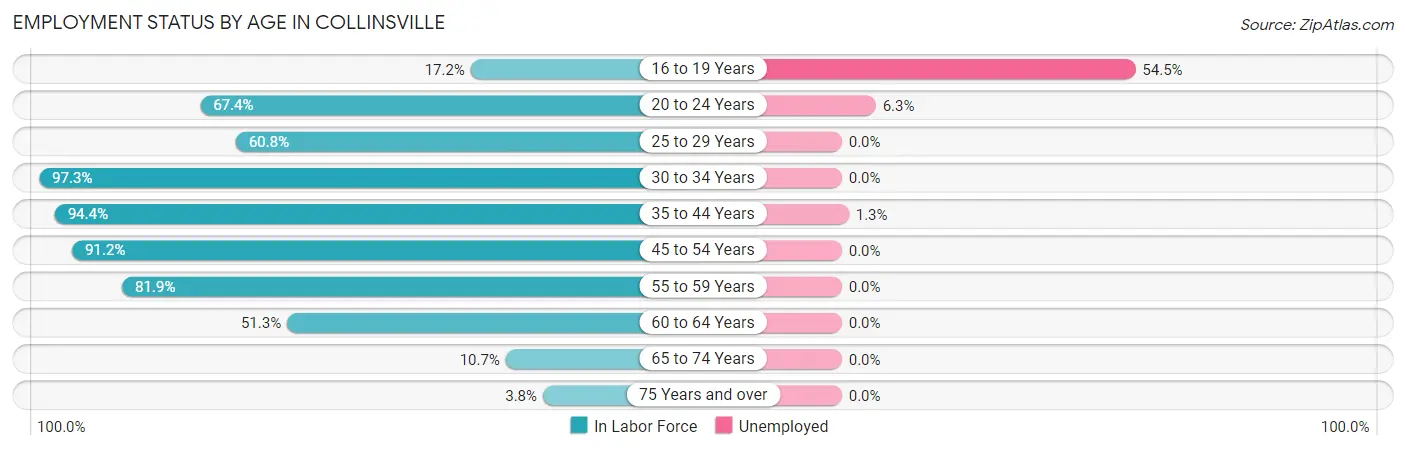
| Age Bracket | In Labor Force | Unemployed |
| 16 to 19 Years | 11 (17.2%) | 6 (54.5%) |
| 20 to 24 Years | 64 (67.4%) | 4 (6.3%) |
| 25 to 29 Years | 59 (60.8%) | 0 (0.0%) |
| 30 to 34 Years | 180 (97.3%) | 0 (0.0%) |
| 35 to 44 Years | 234 (94.4%) | 3 (1.3%) |
| 45 to 54 Years | 103 (91.2%) | 0 (0.0%) |
| 55 to 59 Years | 131 (81.9%) | 0 (0.0%) |
| 60 to 64 Years | 81 (51.3%) | 0 (0.0%) |
| 65 to 74 Years | 15 (10.7%) | 0 (0.0%) |
| 75 Years and over | 5 (3.8%) | 0 (0.0%) |
| Total | 883 (63.5%) | 13 (1.5%) |
Employment Status by Educational Attainment in Collinsville
According to labor force statistics for Collinsville, 82.0% of individuals (788) out of the total population between 25 and 64 years of age (961) are in the labor force, with 0.4% or 3 of them being unemployed. The group with the highest labor force participation rate are those with the educational attainment of less than high school, with 94.7% or 108 individuals in the labor force. Within the labor force, individuals with less than high school education have the highest percentage of unemployment, with 2.8% or 3 of them being unemployed.

| Educational Attainment | In Labor Force | Unemployed |
| Less than High School | 108 (94.7%) | 3 (2.8%) |
| High School Diploma | 285 (79.6%) | 0 (0.0%) |
| College / Associate Degree | 292 (82.7%) | 0 (0.0%) |
| Bachelor's Degree or higher | 103 (75.7%) | 0 (0.0%) |
| Total | 788 (82.0%) | 4 (0.4%) |
Employment Occupations by Sex in Collinsville
Management, Business, Science and Arts Occupations
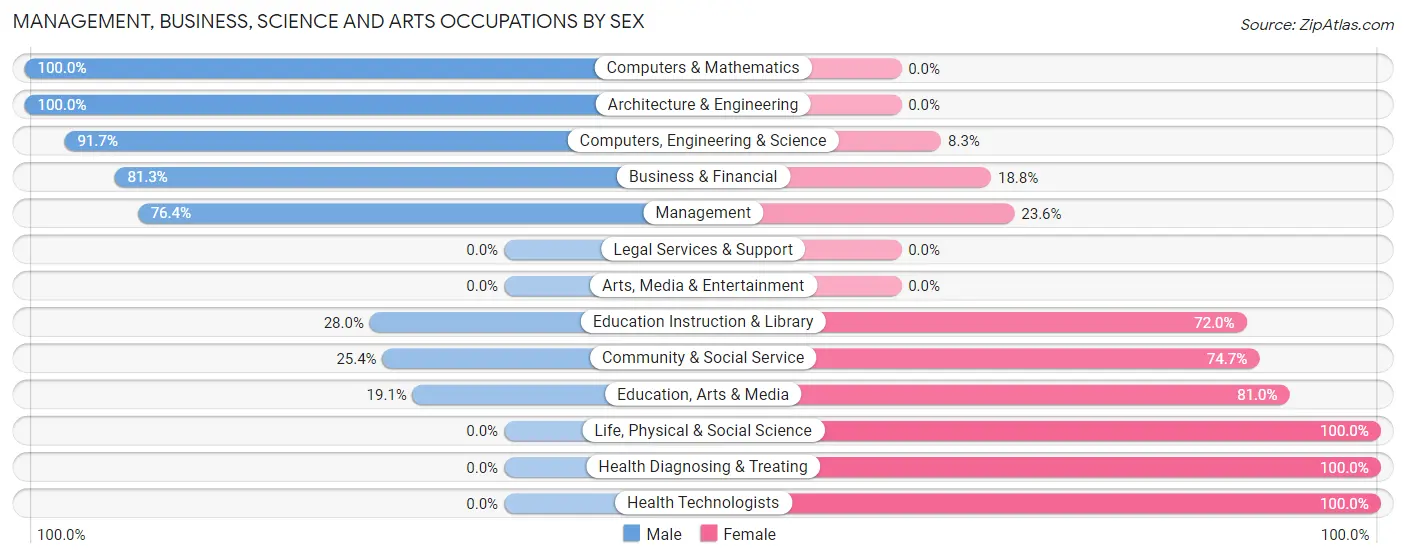
The most common Management, Business, Science and Arts occupations in Collinsville are Management (72 | 8.3%), Community & Social Service (71 | 8.2%), Health Diagnosing & Treating (53 | 6.1%), Education Instruction & Library (50 | 5.8%), and Computers, Engineering & Science (24 | 2.8%).
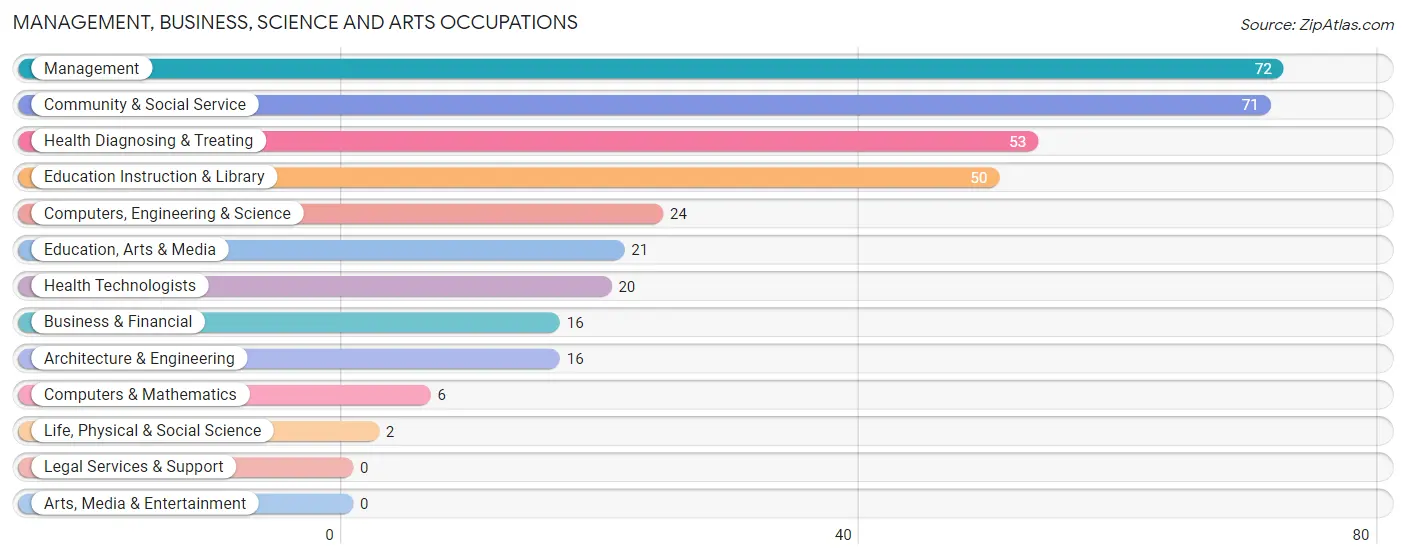
Management, Business, Science and Arts Occupations by Sex
Within the Management, Business, Science and Arts occupations in Collinsville, the most male-oriented occupations are Computers & Mathematics (100.0%), Architecture & Engineering (100.0%), and Computers, Engineering & Science (91.7%), while the most female-oriented occupations are Life, Physical & Social Science (100.0%), Health Diagnosing & Treating (100.0%), and Health Technologists (100.0%).
| Occupation | Male | Female |
| Management | 55 (76.4%) | 17 (23.6%) |
| Business & Financial | 13 (81.2%) | 3 (18.8%) |
| Computers, Engineering & Science | 22 (91.7%) | 2 (8.3%) |
| Computers & Mathematics | 6 (100.0%) | 0 (0.0%) |
| Architecture & Engineering | 16 (100.0%) | 0 (0.0%) |
| Life, Physical & Social Science | 0 (0.0%) | 2 (100.0%) |
| Community & Social Service | 18 (25.4%) | 53 (74.7%) |
| Education, Arts & Media | 4 (19.1%) | 17 (80.9%) |
| Legal Services & Support | 0 (0.0%) | 0 (0.0%) |
| Education Instruction & Library | 14 (28.0%) | 36 (72.0%) |
| Arts, Media & Entertainment | 0 (0.0%) | 0 (0.0%) |
| Health Diagnosing & Treating | 0 (0.0%) | 53 (100.0%) |
| Health Technologists | 0 (0.0%) | 20 (100.0%) |
| Total (Category) | 108 (45.8%) | 128 (54.2%) |
| Total (Overall) | 507 (58.3%) | 363 (41.7%) |
Services Occupations
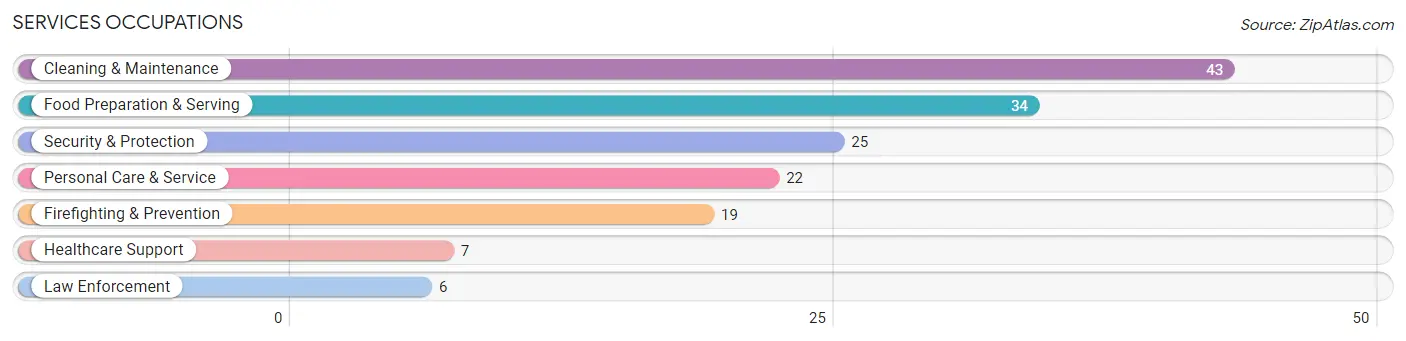
The most common Services occupations in Collinsville are Cleaning & Maintenance (43 | 4.9%), Food Preparation & Serving (34 | 3.9%), Security & Protection (25 | 2.9%), Personal Care & Service (22 | 2.5%), and Firefighting & Prevention (19 | 2.2%).
Services Occupations by Sex
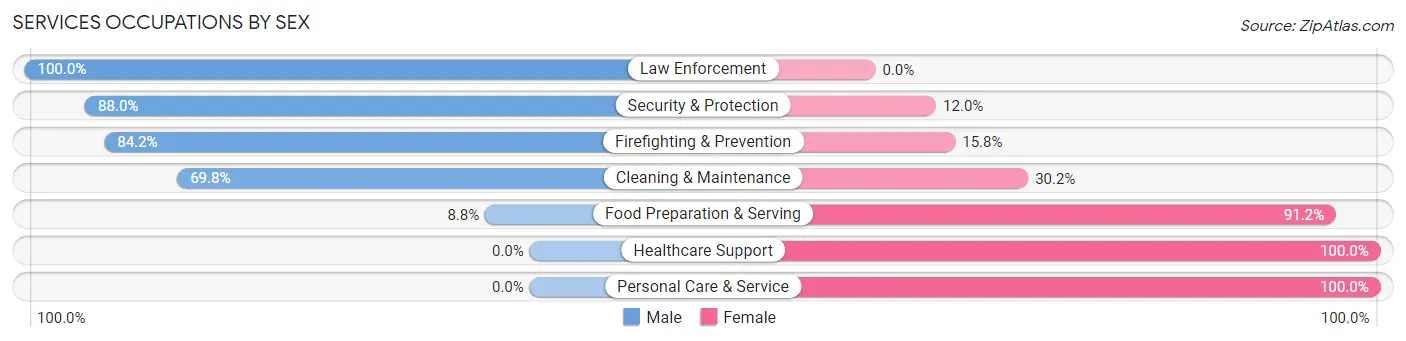
Within the Services occupations in Collinsville, the most male-oriented occupations are Law Enforcement (100.0%), Security & Protection (88.0%), and Firefighting & Prevention (84.2%), while the most female-oriented occupations are Healthcare Support (100.0%), Personal Care & Service (100.0%), and Food Preparation & Serving (91.2%).
| Occupation | Male | Female |
| Healthcare Support | 0 (0.0%) | 7 (100.0%) |
| Security & Protection | 22 (88.0%) | 3 (12.0%) |
| Firefighting & Prevention | 16 (84.2%) | 3 (15.8%) |
| Law Enforcement | 6 (100.0%) | 0 (0.0%) |
| Food Preparation & Serving | 3 (8.8%) | 31 (91.2%) |
| Cleaning & Maintenance | 30 (69.8%) | 13 (30.2%) |
| Personal Care & Service | 0 (0.0%) | 22 (100.0%) |
| Total (Category) | 55 (42.0%) | 76 (58.0%) |
| Total (Overall) | 507 (58.3%) | 363 (41.7%) |
Sales and Office Occupations
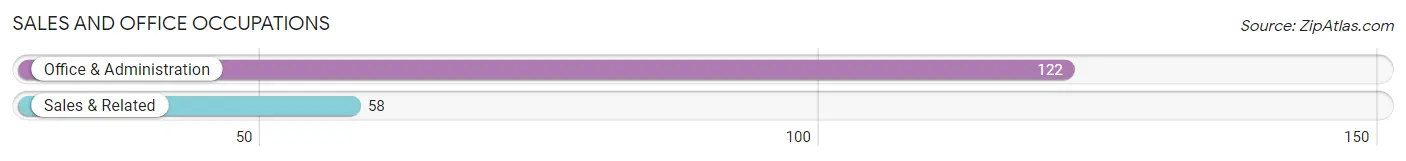
The most common Sales and Office occupations in Collinsville are Office & Administration (122 | 14.0%), and Sales & Related (58 | 6.7%).
Sales and Office Occupations by Sex
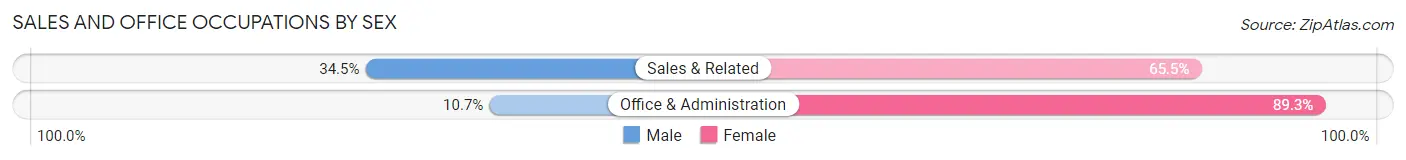
| Occupation | Male | Female |
| Sales & Related | 20 (34.5%) | 38 (65.5%) |
| Office & Administration | 13 (10.7%) | 109 (89.3%) |
| Total (Category) | 33 (18.3%) | 147 (81.7%) |
| Total (Overall) | 507 (58.3%) | 363 (41.7%) |
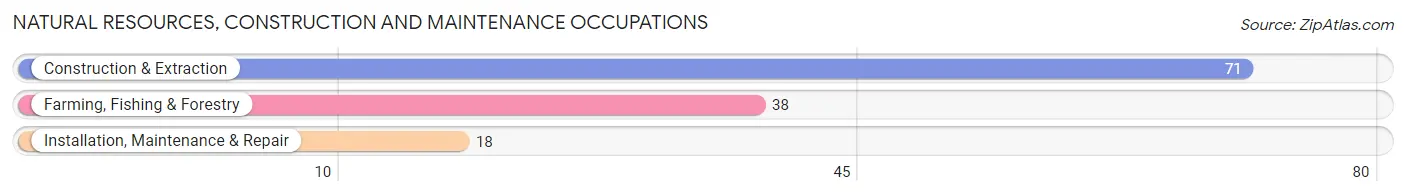
Natural Resources, Construction and Maintenance Occupations
The most common Natural Resources, Construction and Maintenance occupations in Collinsville are Construction & Extraction (71 | 8.2%), Farming, Fishing & Forestry (38 | 4.4%), and Installation, Maintenance & Repair (18 | 2.1%).
Natural Resources, Construction and Maintenance Occupations by Sex
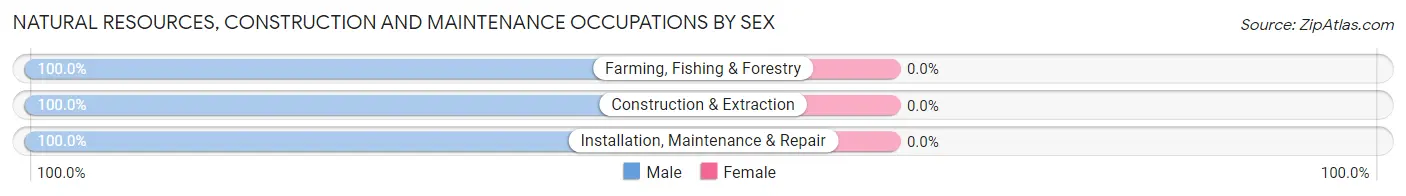
| Occupation | Male | Female |
| Farming, Fishing & Forestry | 38 (100.0%) | 0 (0.0%) |
| Construction & Extraction | 71 (100.0%) | 0 (0.0%) |
| Installation, Maintenance & Repair | 18 (100.0%) | 0 (0.0%) |
| Total (Category) | 127 (100.0%) | 0 (0.0%) |
| Total (Overall) | 507 (58.3%) | 363 (41.7%) |
Production, Transportation and Moving Occupations
The most common Production, Transportation and Moving occupations in Collinsville are Production (90 | 10.3%), Transportation (58 | 6.7%), and Material Moving (48 | 5.5%).
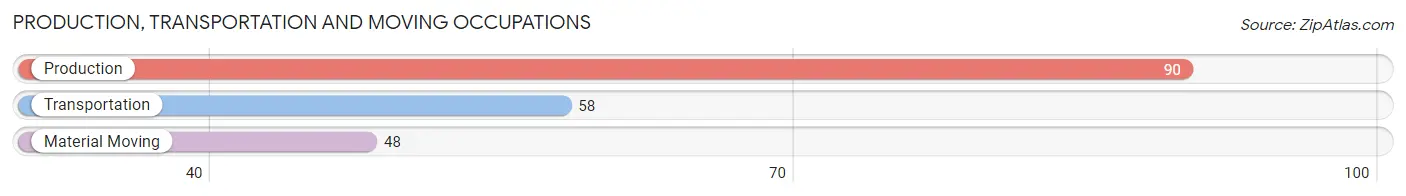
Production, Transportation and Moving Occupations by Sex
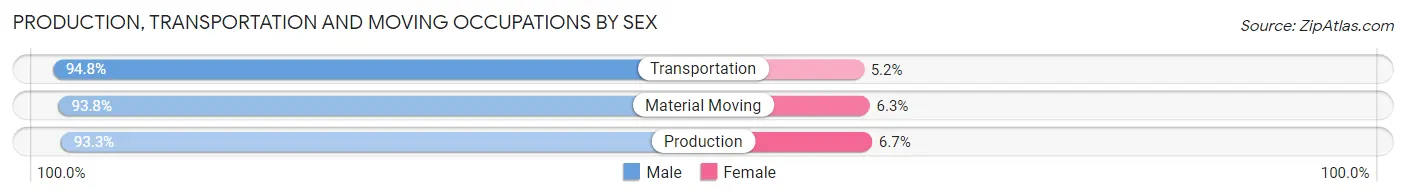
| Occupation | Male | Female |
| Production | 84 (93.3%) | 6 (6.7%) |
| Transportation | 55 (94.8%) | 3 (5.2%) |
| Material Moving | 45 (93.8%) | 3 (6.2%) |
| Total (Category) | 184 (93.9%) | 12 (6.1%) |
| Total (Overall) | 507 (58.3%) | 363 (41.7%) |
Employment Industries by Sex in Collinsville
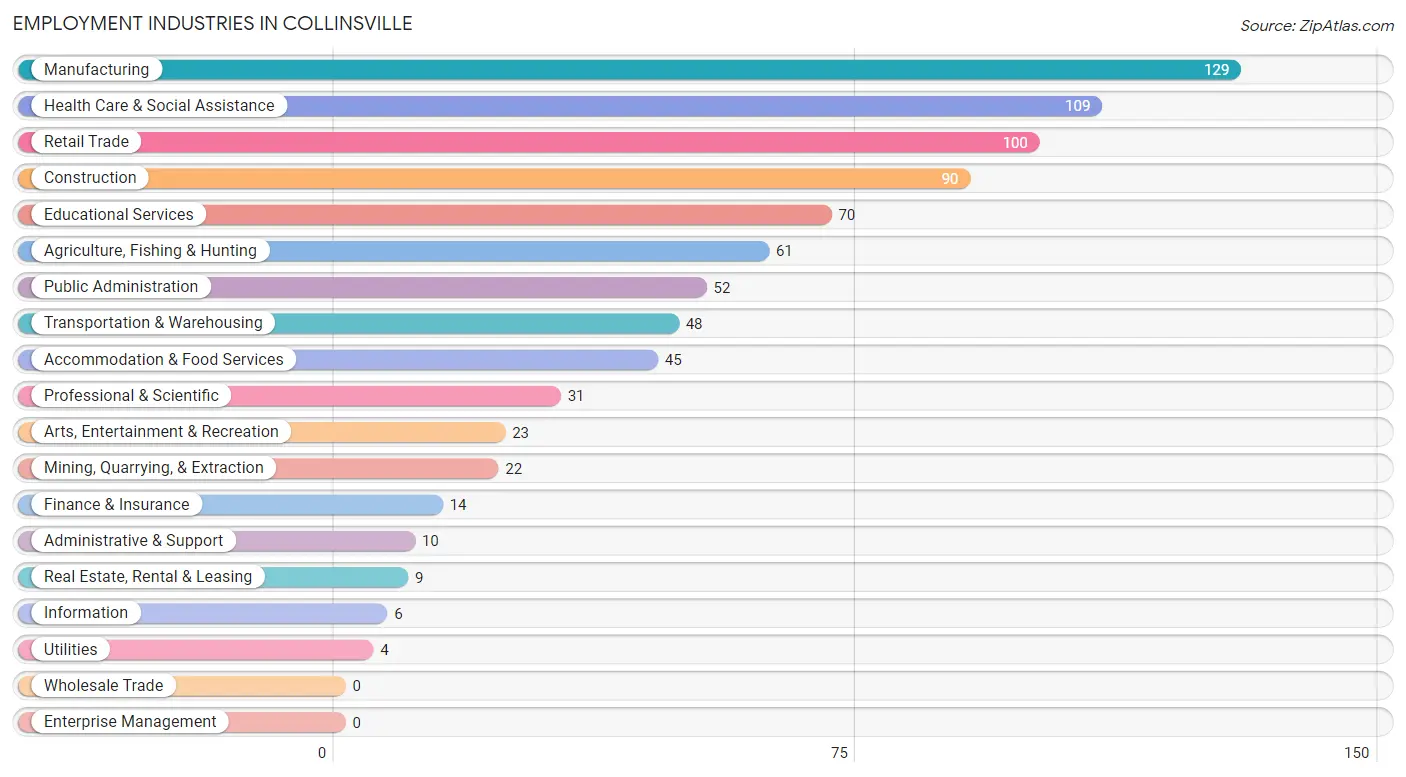
Employment Industries in Collinsville
The major employment industries in Collinsville include Manufacturing (129 | 14.8%), Health Care & Social Assistance (109 | 12.5%), Retail Trade (100 | 11.5%), Construction (90 | 10.3%), and Educational Services (70 | 8.1%).
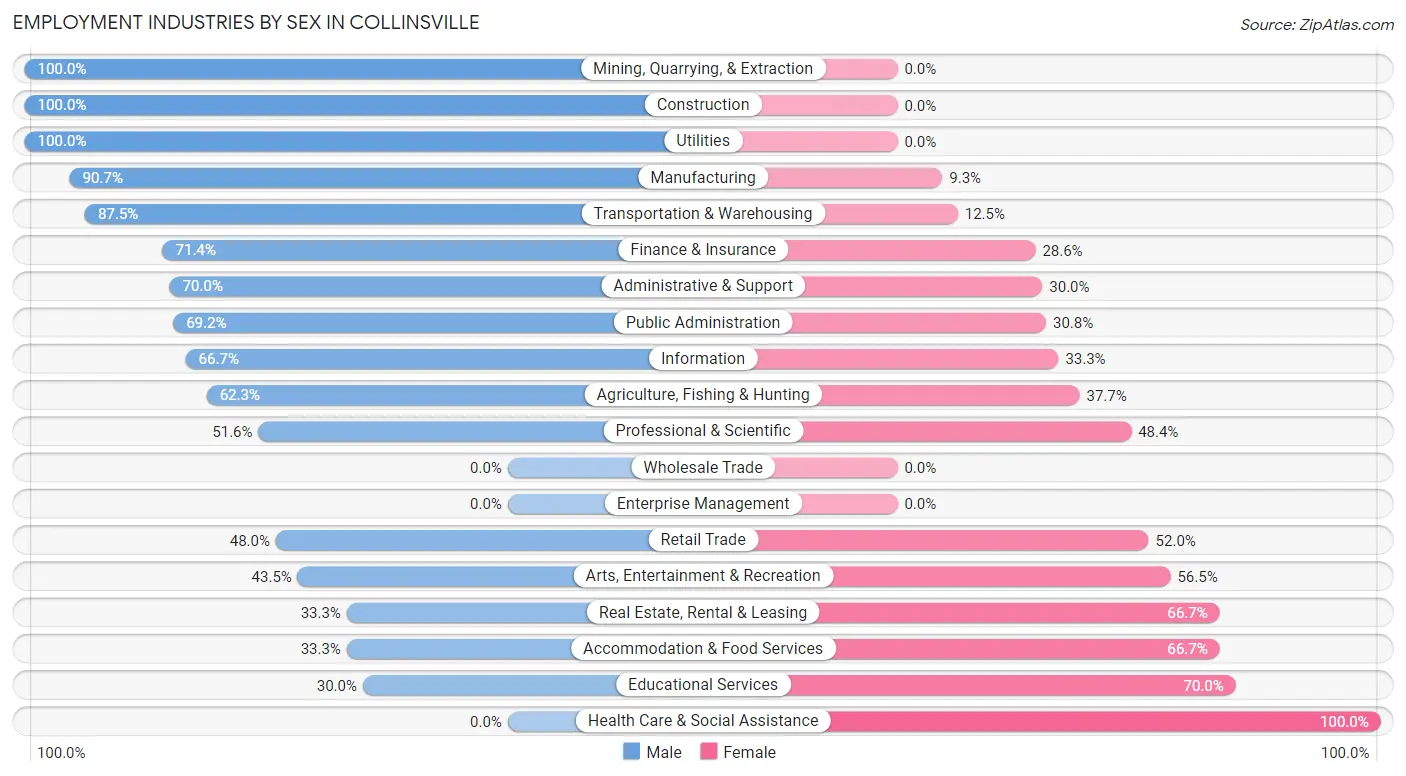
Employment Industries by Sex in Collinsville
The Collinsville industries that see more men than women are Mining, Quarrying, & Extraction (100.0%), Construction (100.0%), and Utilities (100.0%), whereas the industries that tend to have a higher number of women are Health Care & Social Assistance (100.0%), Educational Services (70.0%), and Real Estate, Rental & Leasing (66.7%).
| Industry | Male | Female |
| Agriculture, Fishing & Hunting | 38 (62.3%) | 23 (37.7%) |
| Mining, Quarrying, & Extraction | 22 (100.0%) | 0 (0.0%) |
| Construction | 90 (100.0%) | 0 (0.0%) |
| Manufacturing | 117 (90.7%) | 12 (9.3%) |
| Wholesale Trade | 0 (0.0%) | 0 (0.0%) |
| Retail Trade | 48 (48.0%) | 52 (52.0%) |
| Transportation & Warehousing | 42 (87.5%) | 6 (12.5%) |
| Utilities | 4 (100.0%) | 0 (0.0%) |
| Information | 4 (66.7%) | 2 (33.3%) |
| Finance & Insurance | 10 (71.4%) | 4 (28.6%) |
| Real Estate, Rental & Leasing | 3 (33.3%) | 6 (66.7%) |
| Professional & Scientific | 16 (51.6%) | 15 (48.4%) |
| Enterprise Management | 0 (0.0%) | 0 (0.0%) |
| Administrative & Support | 7 (70.0%) | 3 (30.0%) |
| Educational Services | 21 (30.0%) | 49 (70.0%) |
| Health Care & Social Assistance | 0 (0.0%) | 109 (100.0%) |
| Arts, Entertainment & Recreation | 10 (43.5%) | 13 (56.5%) |
| Accommodation & Food Services | 15 (33.3%) | 30 (66.7%) |
| Public Administration | 36 (69.2%) | 16 (30.8%) |
| Total | 507 (58.3%) | 363 (41.7%) |
Education in Collinsville
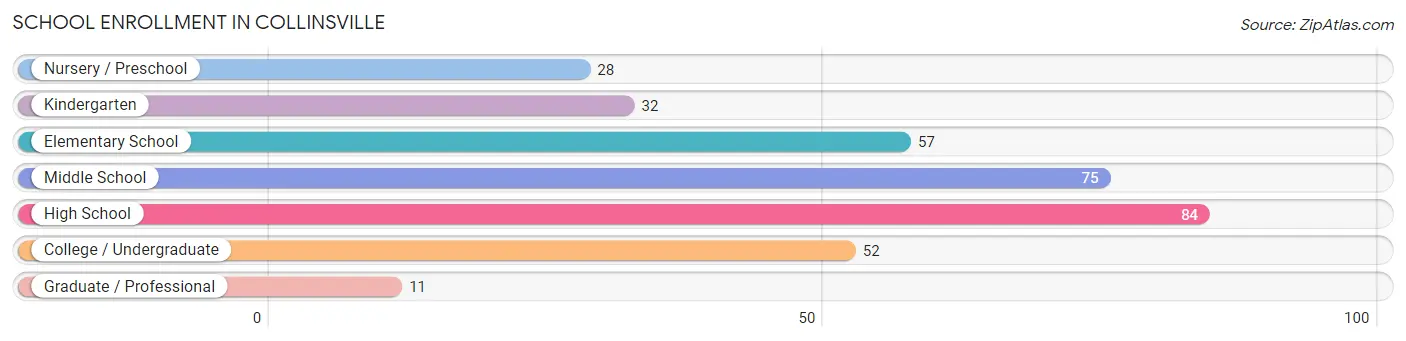
School Enrollment in Collinsville
The most common levels of schooling among the 339 students in Collinsville are high school (84 | 24.8%), middle school (75 | 22.1%), and elementary school (57 | 16.8%).
| School Level | # Students | % Students |
| Nursery / Preschool | 28 | 8.3% |
| Kindergarten | 32 | 9.4% |
| Elementary School | 57 | 16.8% |
| Middle School | 75 | 22.1% |
| High School | 84 | 24.8% |
| College / Undergraduate | 52 | 15.3% |
| Graduate / Professional | 11 | 3.2% |
| Total | 339 | 100.0% |
School Enrollment by Age by Funding Source in Collinsville
Out of a total of 339 students who are enrolled in schools in Collinsville, 45 (13.3%) attend a private institution, while the remaining 294 (86.7%) are enrolled in public schools. The age group of 3 to 4 year olds has the highest likelihood of being enrolled in private schools, with 26 (72.2% in the age bracket) enrolled. Conversely, the age group of 5 to 9 year old has the lowest likelihood of being enrolled in a private school, with 81 (100.0% in the age bracket) attending a public institution.
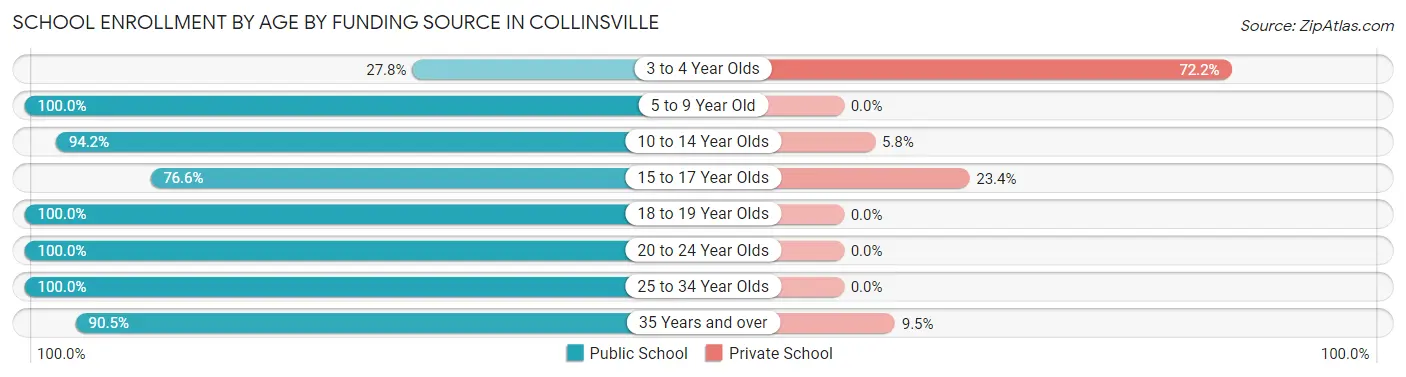
| Age Bracket | Public School | Private School |
| 3 to 4 Year Olds | 10 (27.8%) | 26 (72.2%) |
| 5 to 9 Year Old | 81 (100.0%) | 0 (0.0%) |
| 10 to 14 Year Olds | 97 (94.2%) | 6 (5.8%) |
| 15 to 17 Year Olds | 36 (76.6%) | 11 (23.4%) |
| 18 to 19 Year Olds | 22 (100.0%) | 0 (0.0%) |
| 20 to 24 Year Olds | 13 (100.0%) | 0 (0.0%) |
| 25 to 34 Year Olds | 16 (100.0%) | 0 (0.0%) |
| 35 Years and over | 19 (90.5%) | 2 (9.5%) |
| Total | 294 (86.7%) | 45 (13.3%) |
Educational Attainment by Field of Study in Collinsville
Science & technology (44 | 22.3%), education (38 | 19.3%), arts & humanities (37 | 18.8%), business (36 | 18.3%), and literature & languages (19 | 9.6%) are the most common fields of study among 197 individuals in Collinsville who have obtained a bachelor's degree or higher.
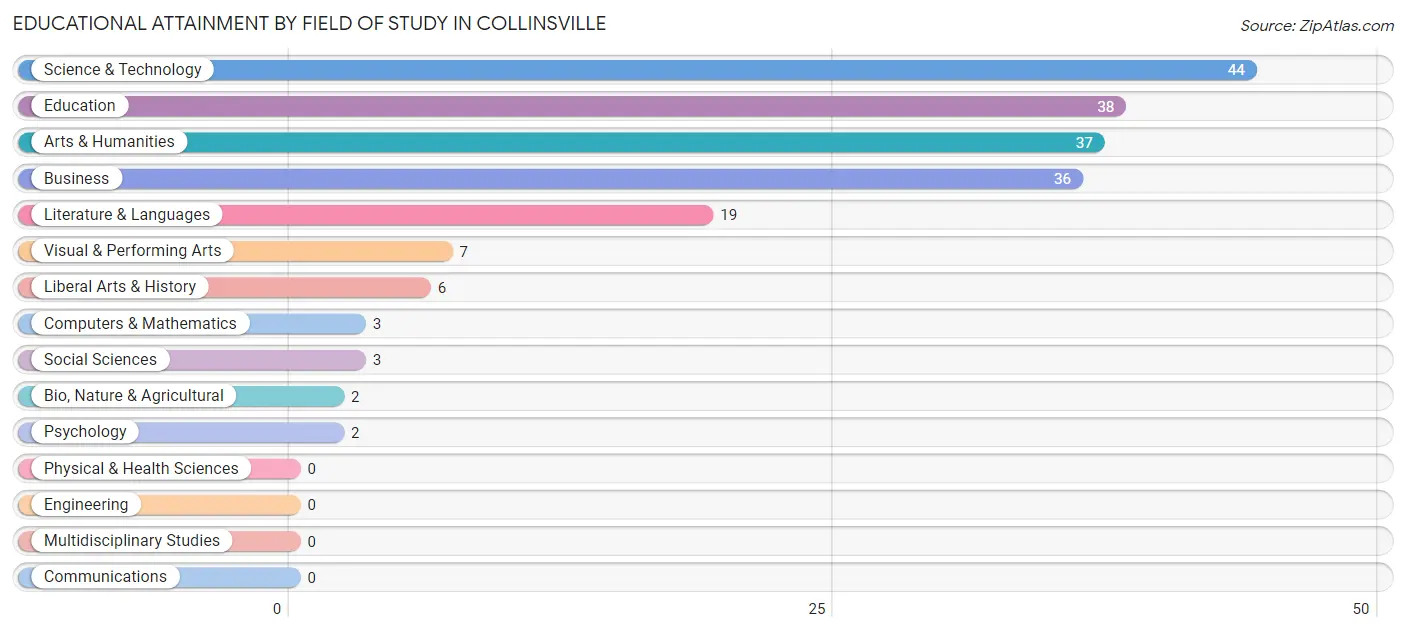
| Field of Study | # Graduates | % Graduates |
| Computers & Mathematics | 3 | 1.5% |
| Bio, Nature & Agricultural | 2 | 1.0% |
| Physical & Health Sciences | 0 | 0.0% |
| Psychology | 2 | 1.0% |
| Social Sciences | 3 | 1.5% |
| Engineering | 0 | 0.0% |
| Multidisciplinary Studies | 0 | 0.0% |
| Science & Technology | 44 | 22.3% |
| Business | 36 | 18.3% |
| Education | 38 | 19.3% |
| Literature & Languages | 19 | 9.6% |
| Liberal Arts & History | 6 | 3.0% |
| Visual & Performing Arts | 7 | 3.5% |
| Communications | 0 | 0.0% |
| Arts & Humanities | 37 | 18.8% |
| Total | 197 | 100.0% |
Transportation & Commute in Collinsville
Vehicle Availability by Sex in Collinsville
The most prevalent vehicle ownership categories in Collinsville are males with 2 vehicles (337, accounting for 66.5%) and females with 2 vehicles (173, making up 100.0%).
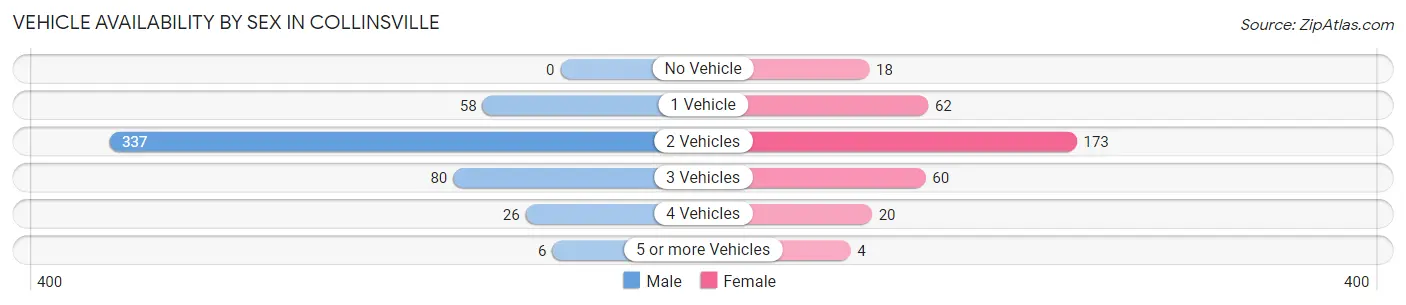
| Vehicles Available | Male | Female |
| No Vehicle | 0 (0.0%) | 18 (5.3%) |
| 1 Vehicle | 58 (11.4%) | 62 (18.4%) |
| 2 Vehicles | 337 (66.5%) | 173 (51.3%) |
| 3 Vehicles | 80 (15.8%) | 60 (17.8%) |
| 4 Vehicles | 26 (5.1%) | 20 (5.9%) |
| 5 or more Vehicles | 6 (1.2%) | 4 (1.2%) |
| Total | 507 (100.0%) | 337 (100.0%) |
Commute Time in Collinsville
The most frequently occuring commute durations in Collinsville are 30 to 34 minutes (122 commuters, 14.9%), 45 to 59 minutes (92 commuters, 11.3%), and 60 to 89 minutes (91 commuters, 11.1%).
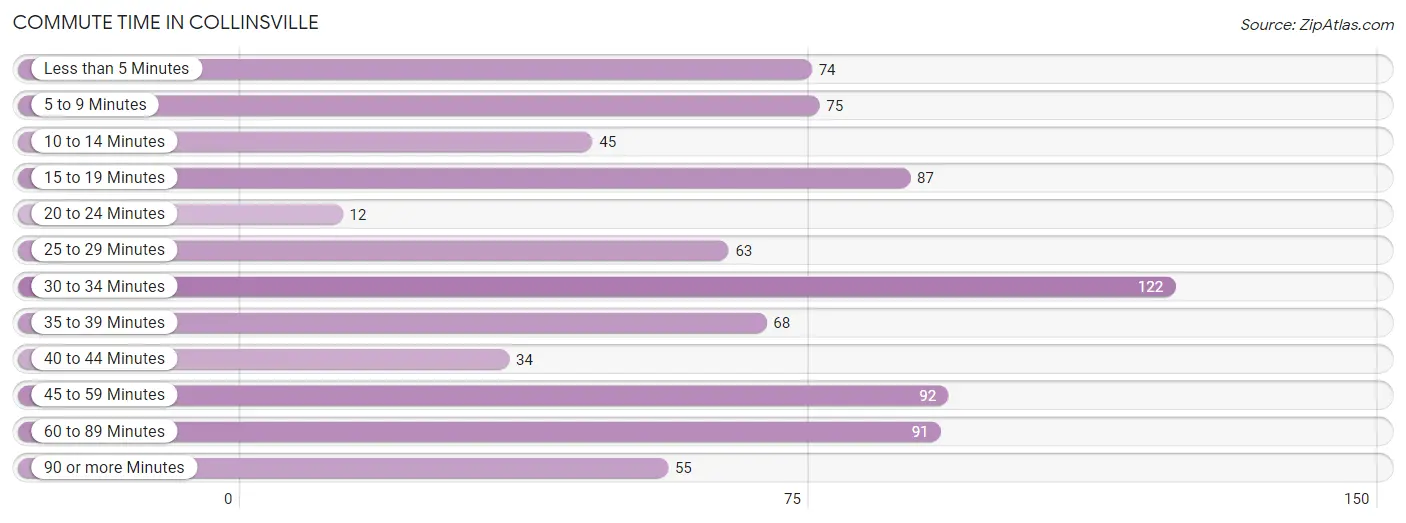
| Commute Time | # Commuters | % Commuters |
| Less than 5 Minutes | 74 | 9.0% |
| 5 to 9 Minutes | 75 | 9.2% |
| 10 to 14 Minutes | 45 | 5.5% |
| 15 to 19 Minutes | 87 | 10.6% |
| 20 to 24 Minutes | 12 | 1.5% |
| 25 to 29 Minutes | 63 | 7.7% |
| 30 to 34 Minutes | 122 | 14.9% |
| 35 to 39 Minutes | 68 | 8.3% |
| 40 to 44 Minutes | 34 | 4.2% |
| 45 to 59 Minutes | 92 | 11.3% |
| 60 to 89 Minutes | 91 | 11.1% |
| 90 or more Minutes | 55 | 6.7% |
Commute Time by Sex in Collinsville
The most common commute times in Collinsville are 60 to 89 minutes (76 commuters, 15.4%) for males and less than 5 minutes (74 commuters, 22.8%) for females.
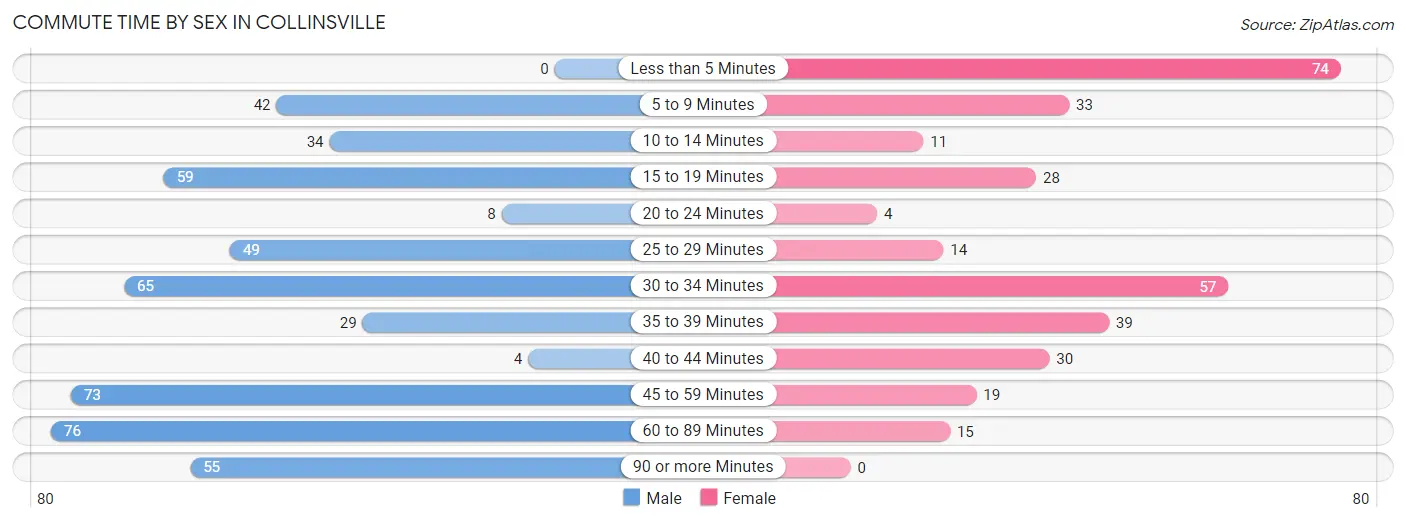
| Commute Time | Male | Female |
| Less than 5 Minutes | 0 (0.0%) | 74 (22.8%) |
| 5 to 9 Minutes | 42 (8.5%) | 33 (10.2%) |
| 10 to 14 Minutes | 34 (6.9%) | 11 (3.4%) |
| 15 to 19 Minutes | 59 (11.9%) | 28 (8.6%) |
| 20 to 24 Minutes | 8 (1.6%) | 4 (1.2%) |
| 25 to 29 Minutes | 49 (9.9%) | 14 (4.3%) |
| 30 to 34 Minutes | 65 (13.2%) | 57 (17.6%) |
| 35 to 39 Minutes | 29 (5.9%) | 39 (12.0%) |
| 40 to 44 Minutes | 4 (0.8%) | 30 (9.3%) |
| 45 to 59 Minutes | 73 (14.8%) | 19 (5.9%) |
| 60 to 89 Minutes | 76 (15.4%) | 15 (4.6%) |
| 90 or more Minutes | 55 (11.1%) | 0 (0.0%) |
Time of Departure to Work by Sex in Collinsville
The most frequent times of departure to work in Collinsville are 5:00 AM to 5:29 AM (80, 16.2%) for males and 8:30 AM to 8:59 AM (46, 14.2%) for females.
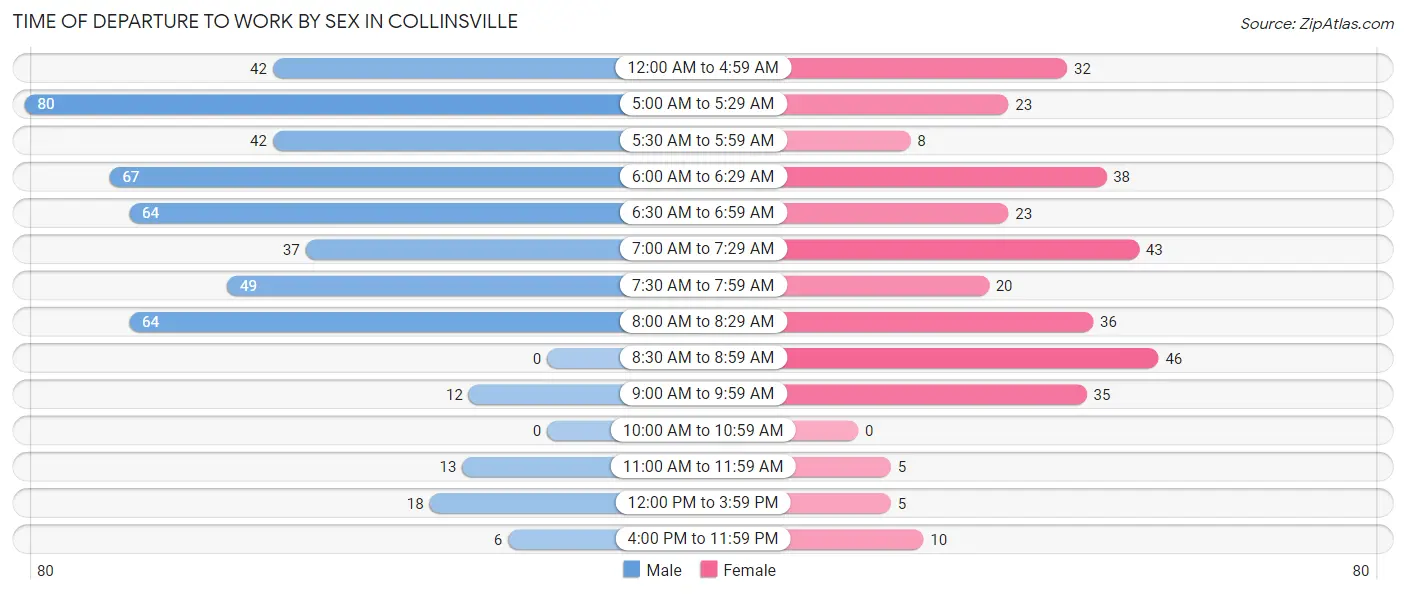
| Time of Departure | Male | Female |
| 12:00 AM to 4:59 AM | 42 (8.5%) | 32 (9.9%) |
| 5:00 AM to 5:29 AM | 80 (16.2%) | 23 (7.1%) |
| 5:30 AM to 5:59 AM | 42 (8.5%) | 8 (2.5%) |
| 6:00 AM to 6:29 AM | 67 (13.6%) | 38 (11.7%) |
| 6:30 AM to 6:59 AM | 64 (13.0%) | 23 (7.1%) |
| 7:00 AM to 7:29 AM | 37 (7.5%) | 43 (13.3%) |
| 7:30 AM to 7:59 AM | 49 (9.9%) | 20 (6.2%) |
| 8:00 AM to 8:29 AM | 64 (13.0%) | 36 (11.1%) |
| 8:30 AM to 8:59 AM | 0 (0.0%) | 46 (14.2%) |
| 9:00 AM to 9:59 AM | 12 (2.4%) | 35 (10.8%) |
| 10:00 AM to 10:59 AM | 0 (0.0%) | 0 (0.0%) |
| 11:00 AM to 11:59 AM | 13 (2.6%) | 5 (1.5%) |
| 12:00 PM to 3:59 PM | 18 (3.6%) | 5 (1.5%) |
| 4:00 PM to 11:59 PM | 6 (1.2%) | 10 (3.1%) |
| Total | 494 (100.0%) | 324 (100.0%) |
Housing Occupancy in Collinsville
Occupancy by Ownership in Collinsville
Of the total 661 dwellings in Collinsville, owner-occupied units account for 394 (59.6%), while renter-occupied units make up 267 (40.4%).
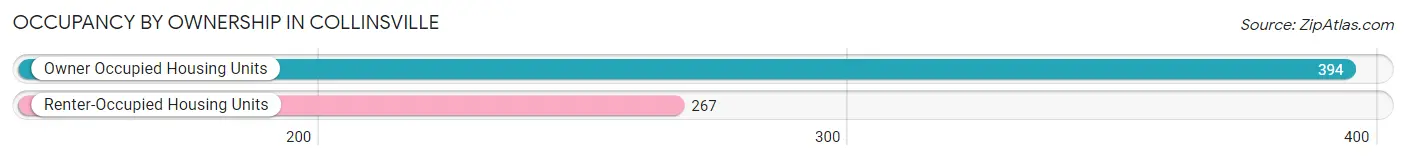
| Occupancy | # Housing Units | % Housing Units |
| Owner Occupied Housing Units | 394 | 59.6% |
| Renter-Occupied Housing Units | 267 | 40.4% |
| Total Occupied Housing Units | 661 | 100.0% |
Occupancy by Household Size in Collinsville
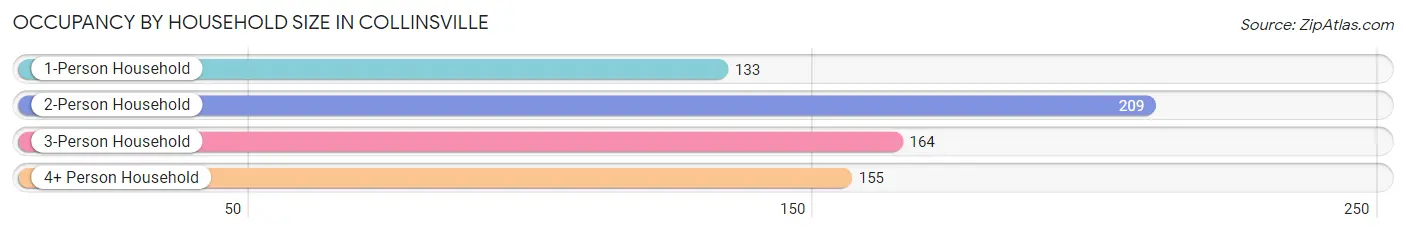
| Household Size | # Housing Units | % Housing Units |
| 1-Person Household | 133 | 20.1% |
| 2-Person Household | 209 | 31.6% |
| 3-Person Household | 164 | 24.8% |
| 4+ Person Household | 155 | 23.4% |
| Total Housing Units | 661 | 100.0% |
Occupancy by Ownership by Household Size in Collinsville
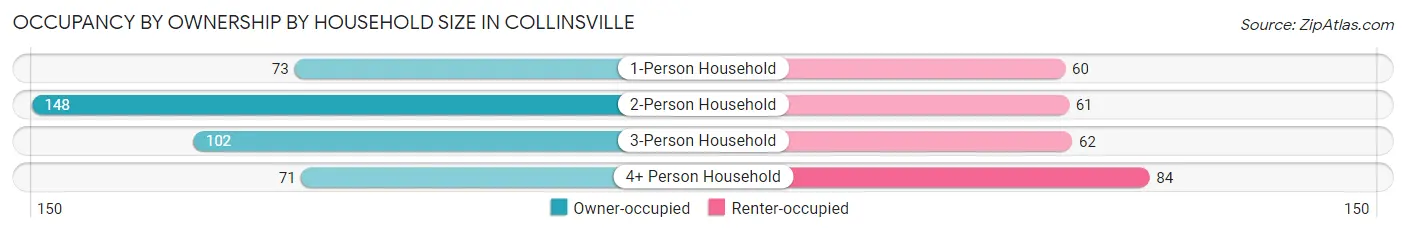
| Household Size | Owner-occupied | Renter-occupied |
| 1-Person Household | 73 (54.9%) | 60 (45.1%) |
| 2-Person Household | 148 (70.8%) | 61 (29.2%) |
| 3-Person Household | 102 (62.2%) | 62 (37.8%) |
| 4+ Person Household | 71 (45.8%) | 84 (54.2%) |
| Total Housing Units | 394 (59.6%) | 267 (40.4%) |
Occupancy by Educational Attainment in Collinsville
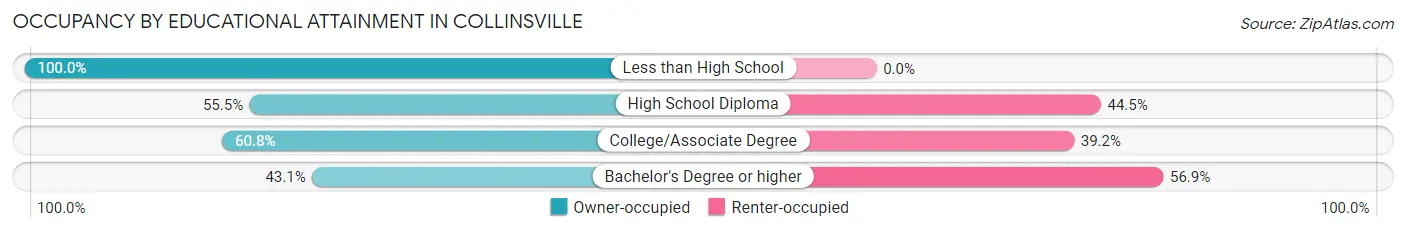
| Household Size | Owner-occupied | Renter-occupied |
| Less than High School | 62 (100.0%) | 0 (0.0%) |
| High School Diploma | 136 (55.5%) | 109 (44.5%) |
| College/Associate Degree | 149 (60.8%) | 96 (39.2%) |
| Bachelor's Degree or higher | 47 (43.1%) | 62 (56.9%) |
Occupancy by Age of Householder in Collinsville
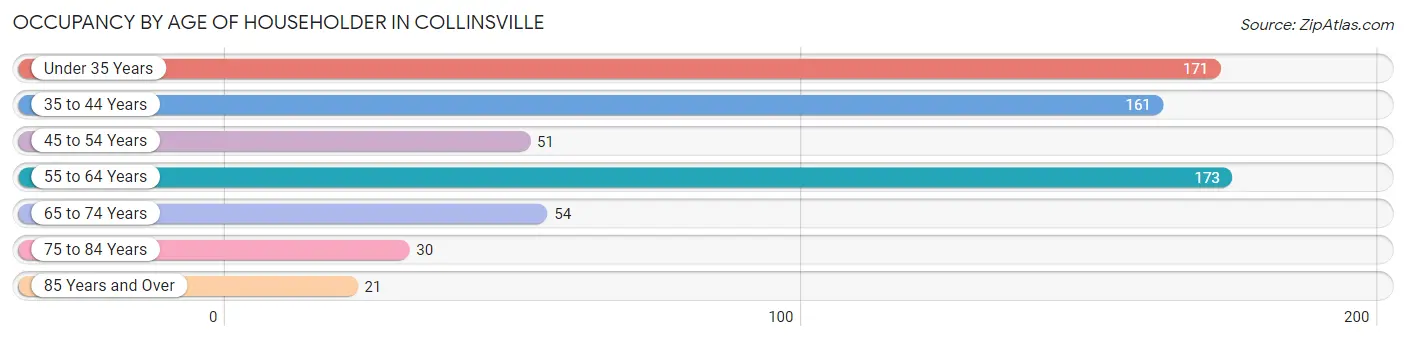
| Age Bracket | # Households | % Households |
| Under 35 Years | 171 | 25.9% |
| 35 to 44 Years | 161 | 24.4% |
| 45 to 54 Years | 51 | 7.7% |
| 55 to 64 Years | 173 | 26.2% |
| 65 to 74 Years | 54 | 8.2% |
| 75 to 84 Years | 30 | 4.5% |
| 85 Years and Over | 21 | 3.2% |
| Total | 661 | 100.0% |
Housing Finances in Collinsville
Median Income by Occupancy in Collinsville
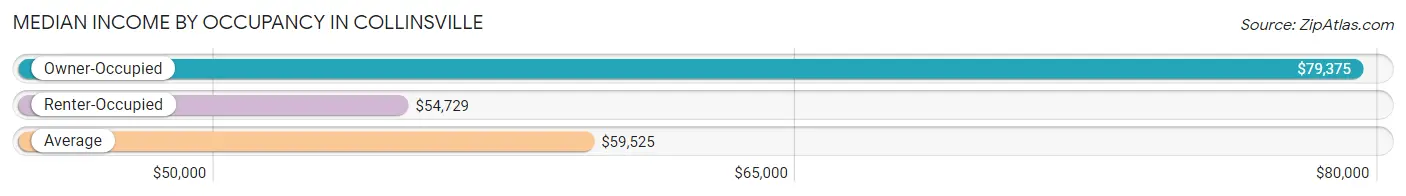
| Occupancy Type | # Households | Median Income |
| Owner-Occupied | 394 (59.6%) | $79,375 |
| Renter-Occupied | 267 (40.4%) | $54,729 |
| Average | 661 (100.0%) | $59,525 |
Occupancy by Householder Income Bracket in Collinsville
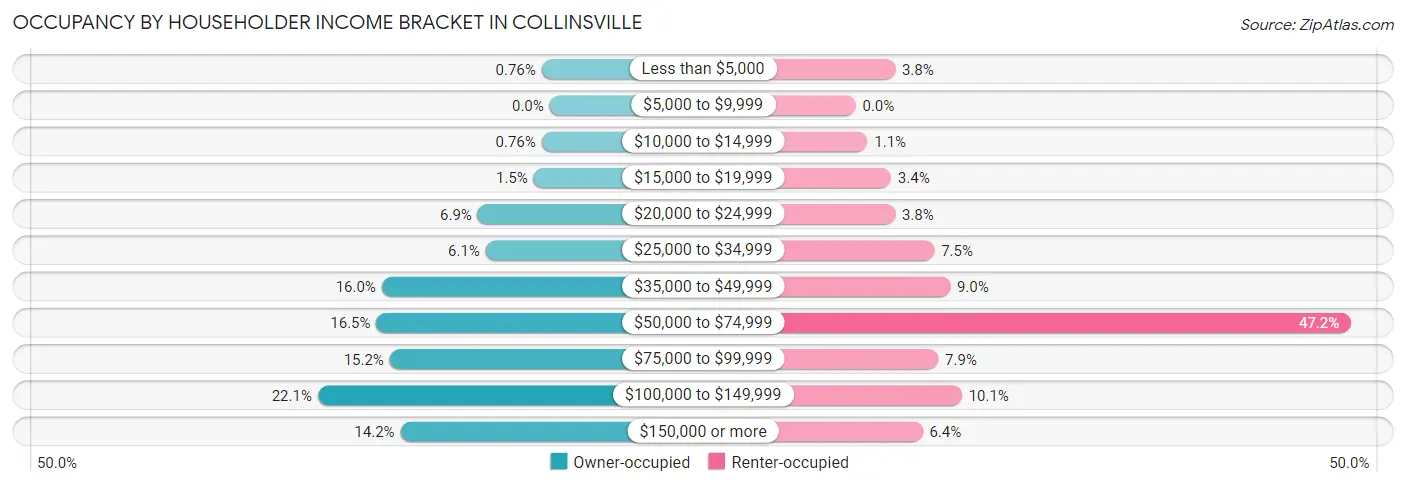
| Income Bracket | Owner-occupied | Renter-occupied |
| Less than $5,000 | 3 (0.8%) | 10 (3.7%) |
| $5,000 to $9,999 | 0 (0.0%) | 0 (0.0%) |
| $10,000 to $14,999 | 3 (0.8%) | 3 (1.1%) |
| $15,000 to $19,999 | 6 (1.5%) | 9 (3.4%) |
| $20,000 to $24,999 | 27 (6.9%) | 10 (3.7%) |
| $25,000 to $34,999 | 24 (6.1%) | 20 (7.5%) |
| $35,000 to $49,999 | 63 (16.0%) | 24 (9.0%) |
| $50,000 to $74,999 | 65 (16.5%) | 126 (47.2%) |
| $75,000 to $99,999 | 60 (15.2%) | 21 (7.9%) |
| $100,000 to $149,999 | 87 (22.1%) | 27 (10.1%) |
| $150,000 or more | 56 (14.2%) | 17 (6.4%) |
| Total | 394 (100.0%) | 267 (100.0%) |
Monthly Housing Cost Tiers in Collinsville

| Monthly Cost | Owner-occupied | Renter-occupied |
| Less than $300 | 0 (0.0%) | 0 (0.0%) |
| $300 to $499 | 33 (8.4%) | 3 (1.1%) |
| $500 to $799 | 84 (21.3%) | 47 (17.6%) |
| $800 to $999 | 49 (12.4%) | 38 (14.2%) |
| $1,000 to $1,499 | 120 (30.5%) | 129 (48.3%) |
| $1,500 to $1,999 | 65 (16.5%) | 35 (13.1%) |
| $2,000 to $2,499 | 23 (5.8%) | 0 (0.0%) |
| $2,500 to $2,999 | 13 (3.3%) | 0 (0.0%) |
| $3,000 or more | 7 (1.8%) | 5 (1.9%) |
| Total | 394 (100.0%) | 267 (100.0%) |
Physical Housing Characteristics in Collinsville
Housing Structures in Collinsville
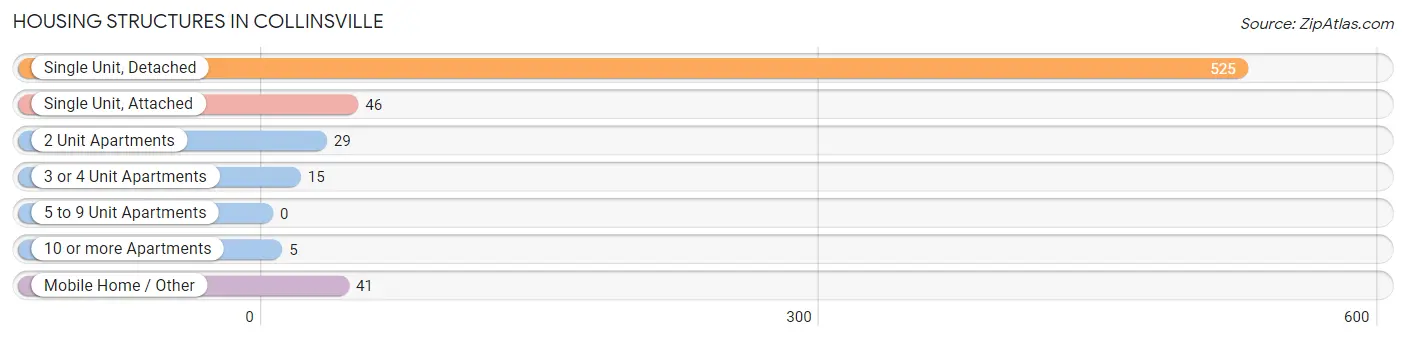
| Structure Type | # Housing Units | % Housing Units |
| Single Unit, Detached | 525 | 79.4% |
| Single Unit, Attached | 46 | 7.0% |
| 2 Unit Apartments | 29 | 4.4% |
| 3 or 4 Unit Apartments | 15 | 2.3% |
| 5 to 9 Unit Apartments | 0 | 0.0% |
| 10 or more Apartments | 5 | 0.8% |
| Mobile Home / Other | 41 | 6.2% |
| Total | 661 | 100.0% |
Housing Structures by Occupancy in Collinsville
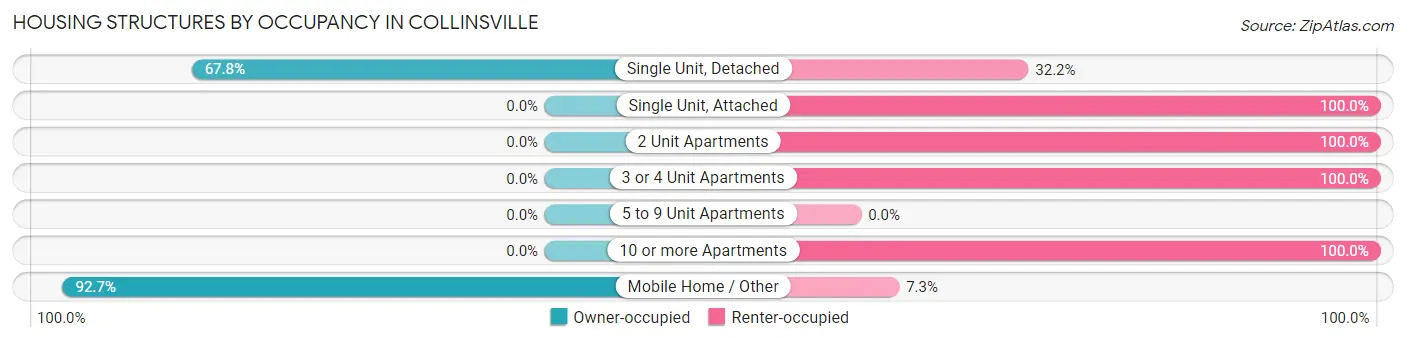
| Structure Type | Owner-occupied | Renter-occupied |
| Single Unit, Detached | 356 (67.8%) | 169 (32.2%) |
| Single Unit, Attached | 0 (0.0%) | 46 (100.0%) |
| 2 Unit Apartments | 0 (0.0%) | 29 (100.0%) |
| 3 or 4 Unit Apartments | 0 (0.0%) | 15 (100.0%) |
| 5 to 9 Unit Apartments | 0 (0.0%) | 0 (0.0%) |
| 10 or more Apartments | 0 (0.0%) | 5 (100.0%) |
| Mobile Home / Other | 38 (92.7%) | 3 (7.3%) |
| Total | 394 (59.6%) | 267 (40.4%) |
Housing Structures by Number of Rooms in Collinsville
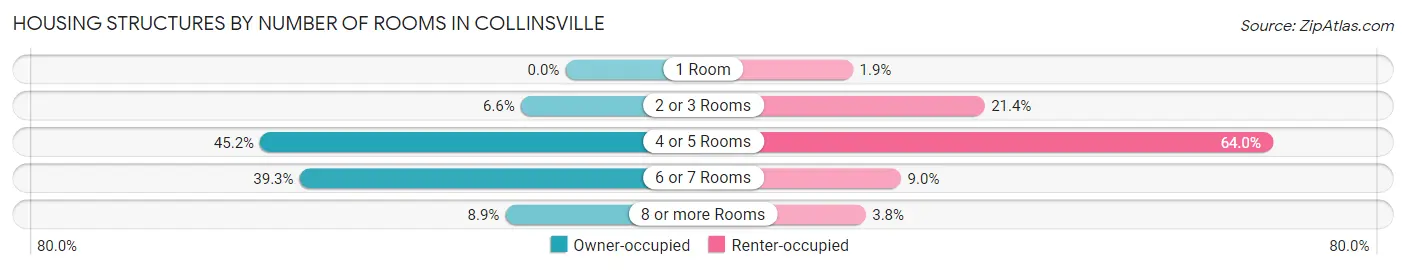
| Number of Rooms | Owner-occupied | Renter-occupied |
| 1 Room | 0 (0.0%) | 5 (1.9%) |
| 2 or 3 Rooms | 26 (6.6%) | 57 (21.3%) |
| 4 or 5 Rooms | 178 (45.2%) | 171 (64.0%) |
| 6 or 7 Rooms | 155 (39.3%) | 24 (9.0%) |
| 8 or more Rooms | 35 (8.9%) | 10 (3.7%) |
| Total | 394 (100.0%) | 267 (100.0%) |
Housing Structure by Heating Type in Collinsville
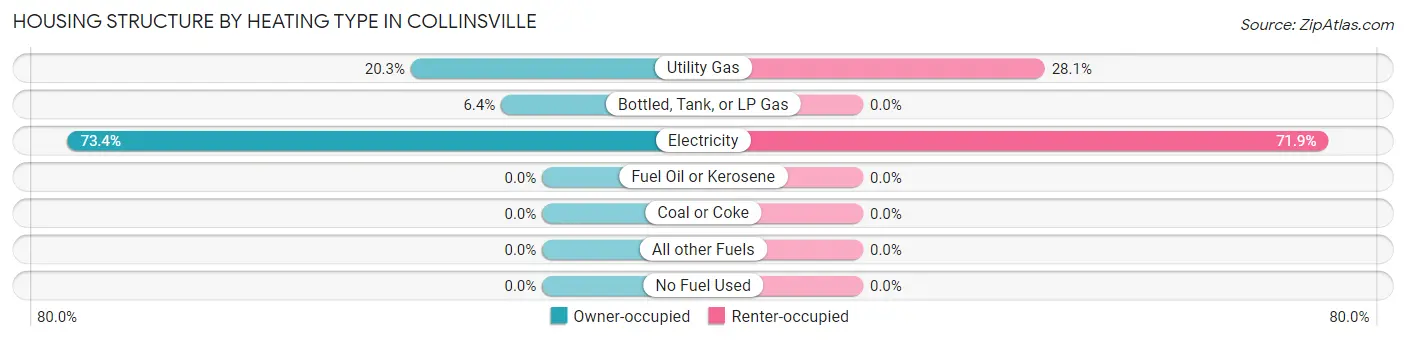
| Heating Type | Owner-occupied | Renter-occupied |
| Utility Gas | 80 (20.3%) | 75 (28.1%) |
| Bottled, Tank, or LP Gas | 25 (6.4%) | 0 (0.0%) |
| Electricity | 289 (73.4%) | 192 (71.9%) |
| Fuel Oil or Kerosene | 0 (0.0%) | 0 (0.0%) |
| Coal or Coke | 0 (0.0%) | 0 (0.0%) |
| All other Fuels | 0 (0.0%) | 0 (0.0%) |
| No Fuel Used | 0 (0.0%) | 0 (0.0%) |
| Total | 394 (100.0%) | 267 (100.0%) |
Household Vehicle Usage in Collinsville
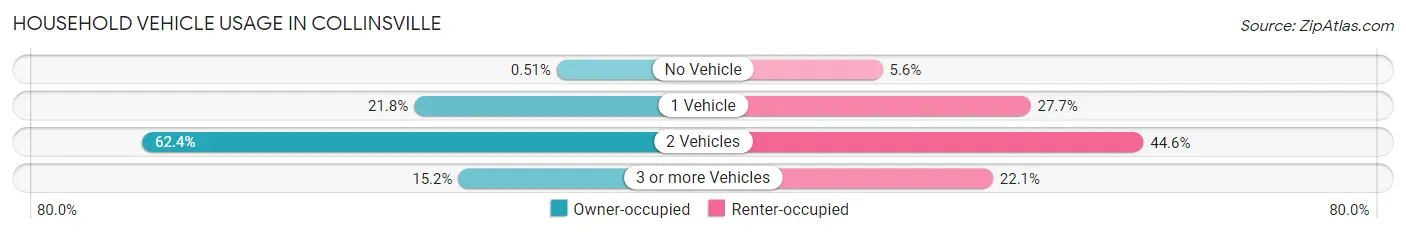
| Vehicles per Household | Owner-occupied | Renter-occupied |
| No Vehicle | 2 (0.5%) | 15 (5.6%) |
| 1 Vehicle | 86 (21.8%) | 74 (27.7%) |
| 2 Vehicles | 246 (62.4%) | 119 (44.6%) |
| 3 or more Vehicles | 60 (15.2%) | 59 (22.1%) |
| Total | 394 (100.0%) | 267 (100.0%) |
Real Estate & Mortgages in Collinsville
Real Estate and Mortgage Overview in Collinsville
| Characteristic | Without Mortgage | With Mortgage |
| Housing Units | 152 | 242 |
| Median Property Value | $162,500 | $199,300 |
| Median Household Income | $53,750 | $39 |
| Monthly Housing Costs | $600 | $7 |
| Real Estate Taxes | $2,475 | $0 |
Property Value by Mortgage Status in Collinsville
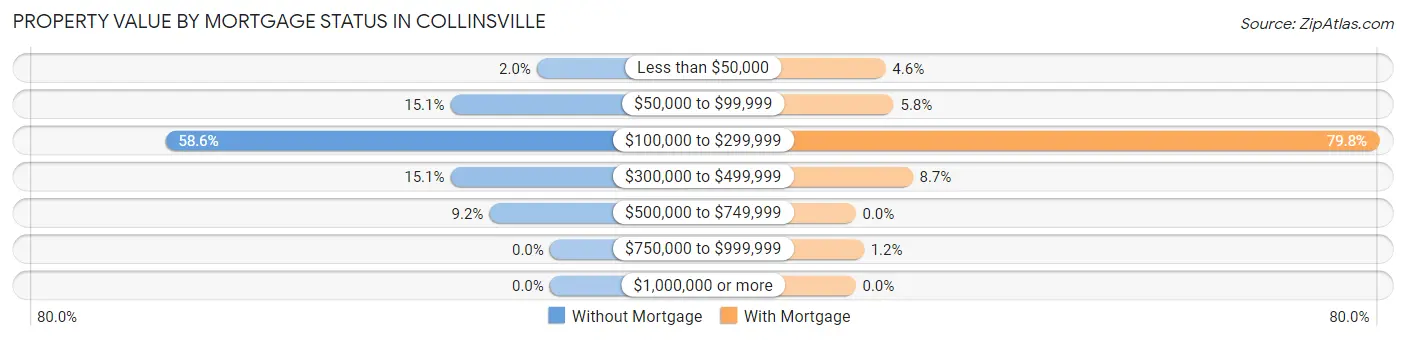
| Property Value | Without Mortgage | With Mortgage |
| Less than $50,000 | 3 (2.0%) | 11 (4.5%) |
| $50,000 to $99,999 | 23 (15.1%) | 14 (5.8%) |
| $100,000 to $299,999 | 89 (58.6%) | 193 (79.7%) |
| $300,000 to $499,999 | 23 (15.1%) | 21 (8.7%) |
| $500,000 to $749,999 | 14 (9.2%) | 0 (0.0%) |
| $750,000 to $999,999 | 0 (0.0%) | 3 (1.2%) |
| $1,000,000 or more | 0 (0.0%) | 0 (0.0%) |
| Total | 152 (100.0%) | 242 (100.0%) |
Household Income by Mortgage Status in Collinsville
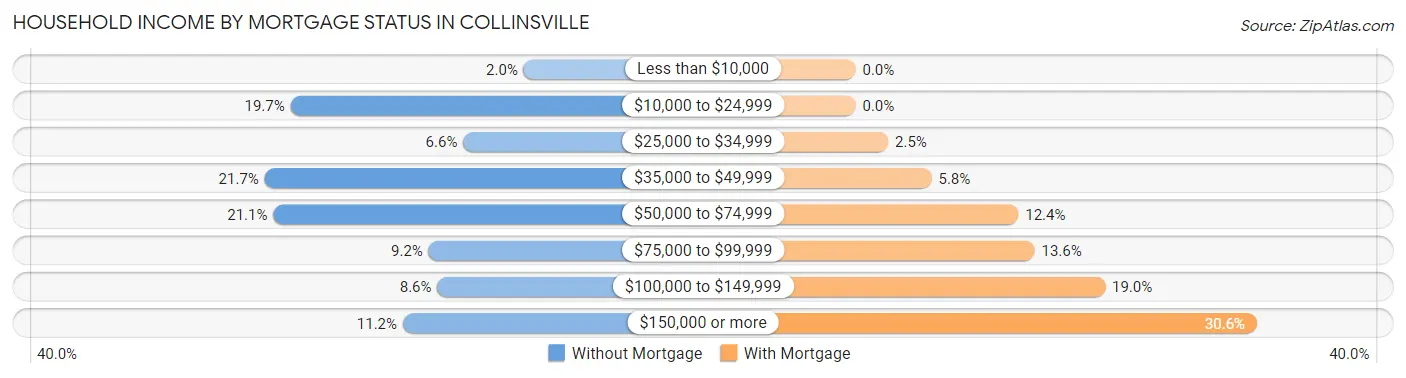
| Household Income | Without Mortgage | With Mortgage |
| Less than $10,000 | 3 (2.0%) | 0 (0.0%) |
| $10,000 to $24,999 | 30 (19.7%) | 0 (0.0%) |
| $25,000 to $34,999 | 10 (6.6%) | 6 (2.5%) |
| $35,000 to $49,999 | 33 (21.7%) | 14 (5.8%) |
| $50,000 to $74,999 | 32 (21.0%) | 30 (12.4%) |
| $75,000 to $99,999 | 14 (9.2%) | 33 (13.6%) |
| $100,000 to $149,999 | 13 (8.6%) | 46 (19.0%) |
| $150,000 or more | 17 (11.2%) | 74 (30.6%) |
| Total | 152 (100.0%) | 242 (100.0%) |
Property Value to Household Income Ratio in Collinsville
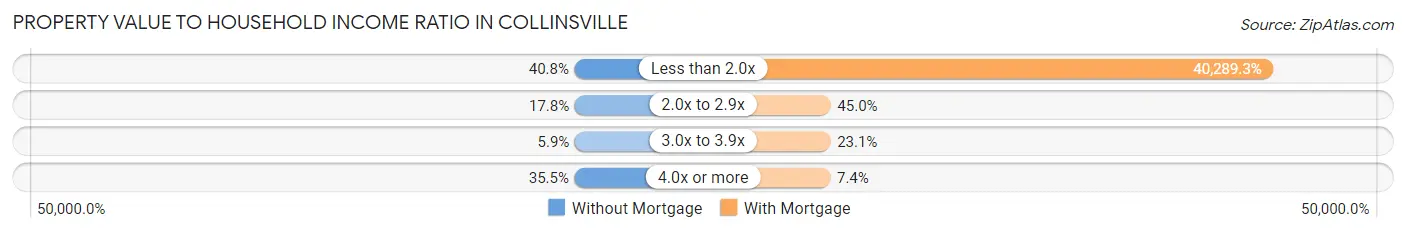
| Value-to-Income Ratio | Without Mortgage | With Mortgage |
| Less than 2.0x | 62 (40.8%) | 97,500 (40,289.3%) |
| 2.0x to 2.9x | 27 (17.8%) | 109 (45.0%) |
| 3.0x to 3.9x | 9 (5.9%) | 56 (23.1%) |
| 4.0x or more | 54 (35.5%) | 18 (7.4%) |
| Total | 152 (100.0%) | 242 (100.0%) |
Real Estate Taxes by Mortgage Status in Collinsville
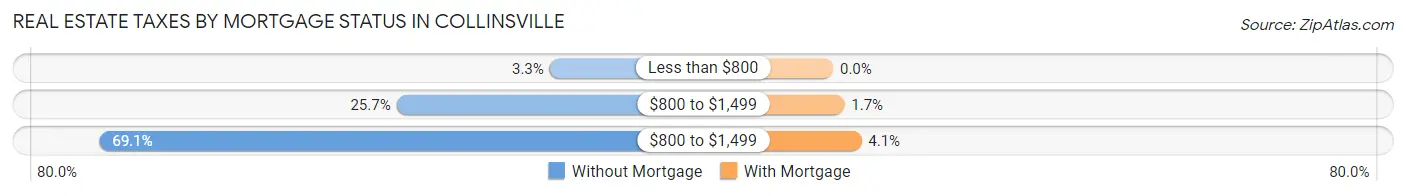
| Property Taxes | Without Mortgage | With Mortgage |
| Less than $800 | 5 (3.3%) | 0 (0.0%) |
| $800 to $1,499 | 39 (25.7%) | 4 (1.7%) |
| $800 to $1,499 | 105 (69.1%) | 10 (4.1%) |
| Total | 152 (100.0%) | 242 (100.0%) |
Health & Disability in Collinsville
Health Insurance Coverage by Age in Collinsville
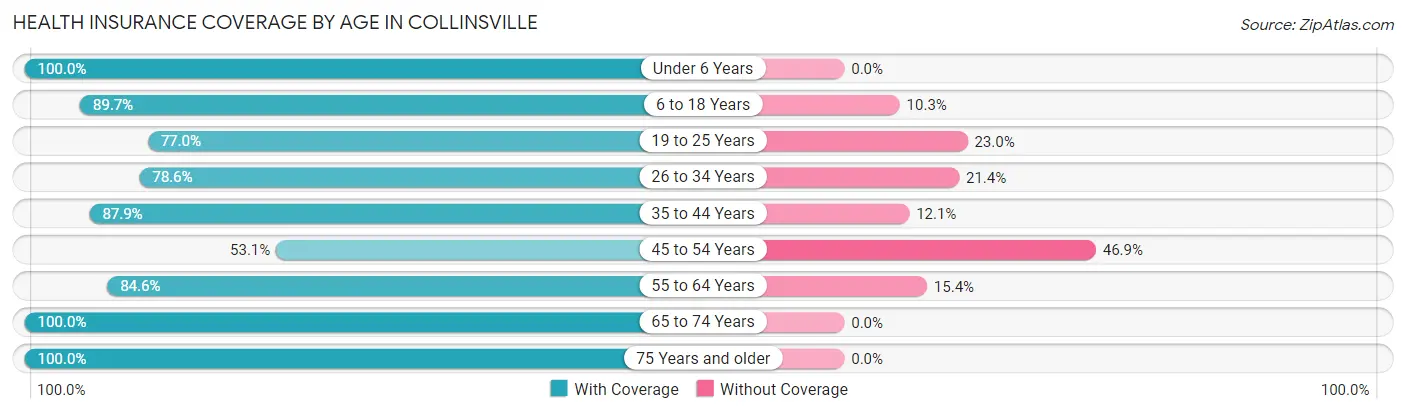
| Age Bracket | With Coverage | Without Coverage |
| Under 6 Years | 156 (100.0%) | 0 (0.0%) |
| 6 to 18 Years | 226 (89.7%) | 26 (10.3%) |
| 19 to 25 Years | 114 (77.0%) | 34 (23.0%) |
| 26 to 34 Years | 202 (78.6%) | 55 (21.4%) |
| 35 to 44 Years | 218 (87.9%) | 30 (12.1%) |
| 45 to 54 Years | 60 (53.1%) | 53 (46.9%) |
| 55 to 64 Years | 269 (84.6%) | 49 (15.4%) |
| 65 to 74 Years | 140 (100.0%) | 0 (0.0%) |
| 75 Years and older | 108 (100.0%) | 0 (0.0%) |
| Total | 1,493 (85.8%) | 247 (14.2%) |
Health Insurance Coverage by Citizenship Status in Collinsville
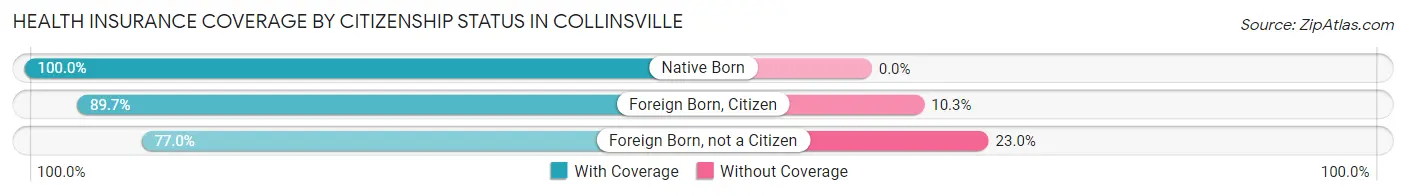
| Citizenship Status | With Coverage | Without Coverage |
| Native Born | 156 (100.0%) | 0 (0.0%) |
| Foreign Born, Citizen | 226 (89.7%) | 26 (10.3%) |
| Foreign Born, not a Citizen | 114 (77.0%) | 34 (23.0%) |
Health Insurance Coverage by Household Income in Collinsville
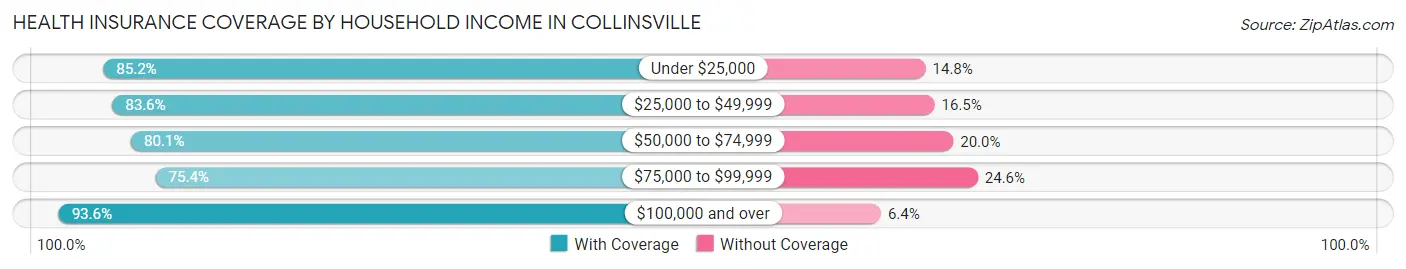
| Household Income | With Coverage | Without Coverage |
| Under $25,000 | 75 (85.2%) | 13 (14.8%) |
| $25,000 to $49,999 | 259 (83.6%) | 51 (16.5%) |
| $50,000 to $74,999 | 329 (80.0%) | 82 (20.0%) |
| $75,000 to $99,999 | 172 (75.4%) | 56 (24.6%) |
| $100,000 and over | 658 (93.6%) | 45 (6.4%) |
Public vs Private Health Insurance Coverage by Age in Collinsville
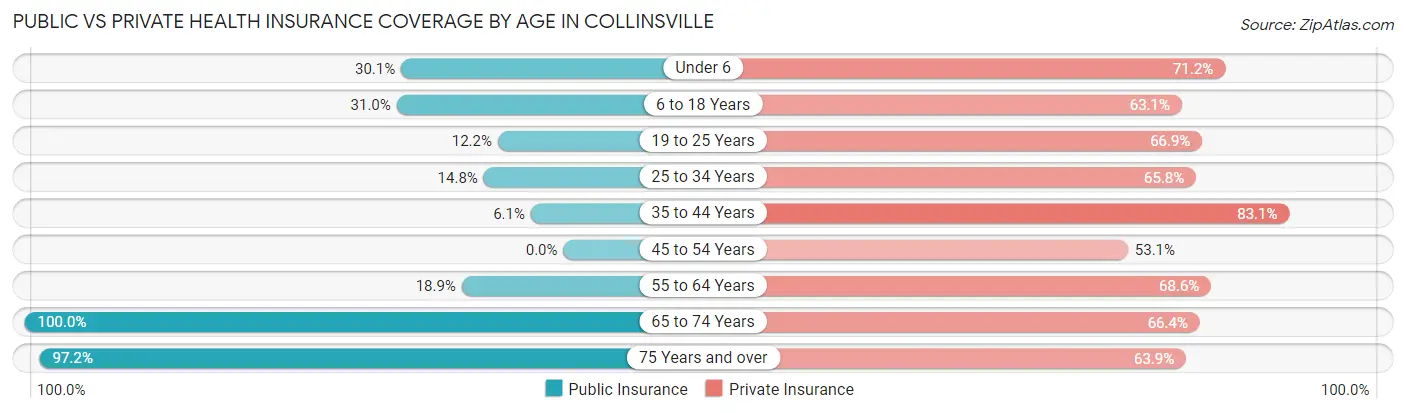
| Age Bracket | Public Insurance | Private Insurance |
| Under 6 | 47 (30.1%) | 111 (71.2%) |
| 6 to 18 Years | 78 (30.9%) | 159 (63.1%) |
| 19 to 25 Years | 18 (12.2%) | 99 (66.9%) |
| 25 to 34 Years | 38 (14.8%) | 169 (65.8%) |
| 35 to 44 Years | 15 (6.0%) | 206 (83.1%) |
| 45 to 54 Years | 0 (0.0%) | 60 (53.1%) |
| 55 to 64 Years | 60 (18.9%) | 218 (68.5%) |
| 65 to 74 Years | 140 (100.0%) | 93 (66.4%) |
| 75 Years and over | 105 (97.2%) | 69 (63.9%) |
| Total | 501 (28.8%) | 1,184 (68.0%) |
Disability Status by Sex by Age in Collinsville
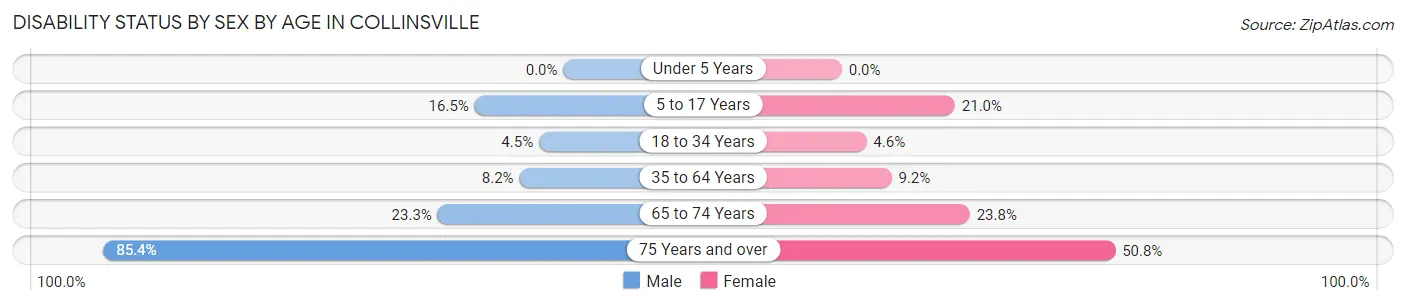
| Age Bracket | Male | Female |
| Under 5 Years | 0 (0.0%) | 0 (0.0%) |
| 5 to 17 Years | 27 (16.5%) | 17 (21.0%) |
| 18 to 34 Years | 10 (4.5%) | 9 (4.6%) |
| 35 to 64 Years | 28 (8.2%) | 31 (9.2%) |
| 65 to 74 Years | 14 (23.3%) | 19 (23.7%) |
| 75 Years and over | 35 (85.4%) | 34 (50.7%) |
Disability Class by Sex by Age in Collinsville
Disability Class: Hearing Difficulty
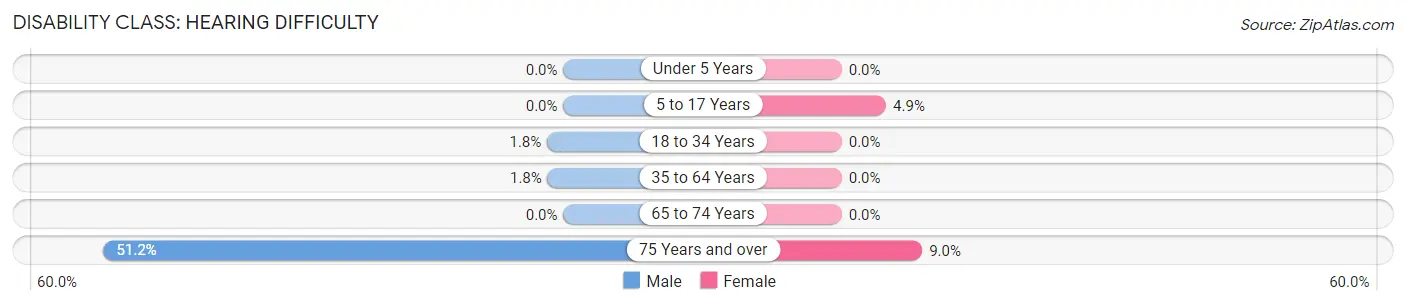
| Age Bracket | Male | Female |
| Under 5 Years | 0 (0.0%) | 0 (0.0%) |
| 5 to 17 Years | 0 (0.0%) | 4 (4.9%) |
| 18 to 34 Years | 4 (1.8%) | 0 (0.0%) |
| 35 to 64 Years | 6 (1.8%) | 0 (0.0%) |
| 65 to 74 Years | 0 (0.0%) | 0 (0.0%) |
| 75 Years and over | 21 (51.2%) | 6 (9.0%) |
Disability Class: Vision Difficulty
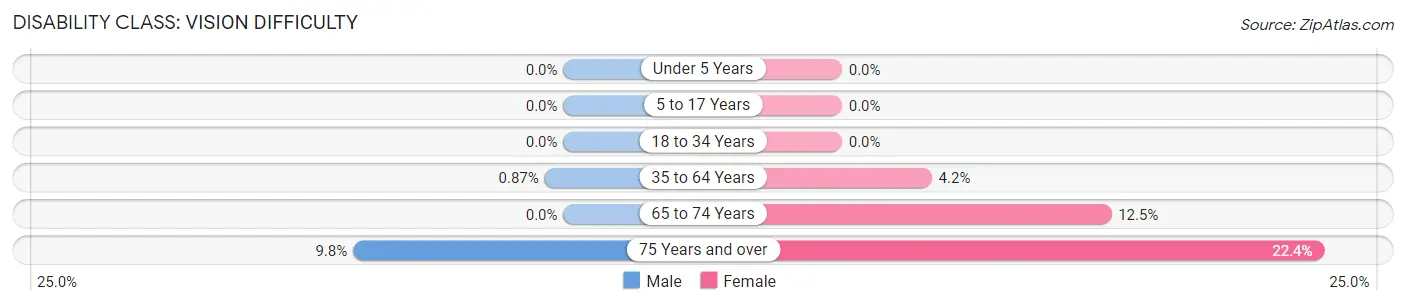
| Age Bracket | Male | Female |
| Under 5 Years | 0 (0.0%) | 0 (0.0%) |
| 5 to 17 Years | 0 (0.0%) | 0 (0.0%) |
| 18 to 34 Years | 0 (0.0%) | 0 (0.0%) |
| 35 to 64 Years | 3 (0.9%) | 14 (4.2%) |
| 65 to 74 Years | 0 (0.0%) | 10 (12.5%) |
| 75 Years and over | 4 (9.8%) | 15 (22.4%) |
Disability Class: Cognitive Difficulty
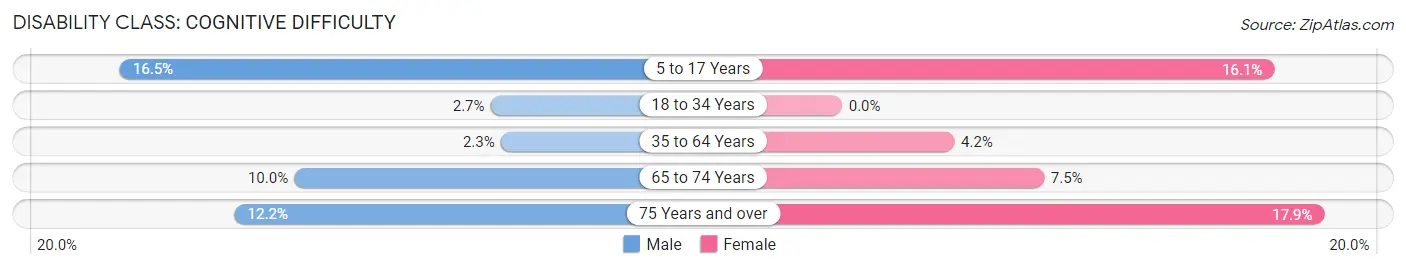
| Age Bracket | Male | Female |
| 5 to 17 Years | 27 (16.5%) | 13 (16.1%) |
| 18 to 34 Years | 6 (2.7%) | 0 (0.0%) |
| 35 to 64 Years | 8 (2.3%) | 14 (4.2%) |
| 65 to 74 Years | 6 (10.0%) | 6 (7.5%) |
| 75 Years and over | 5 (12.2%) | 12 (17.9%) |
Disability Class: Ambulatory Difficulty
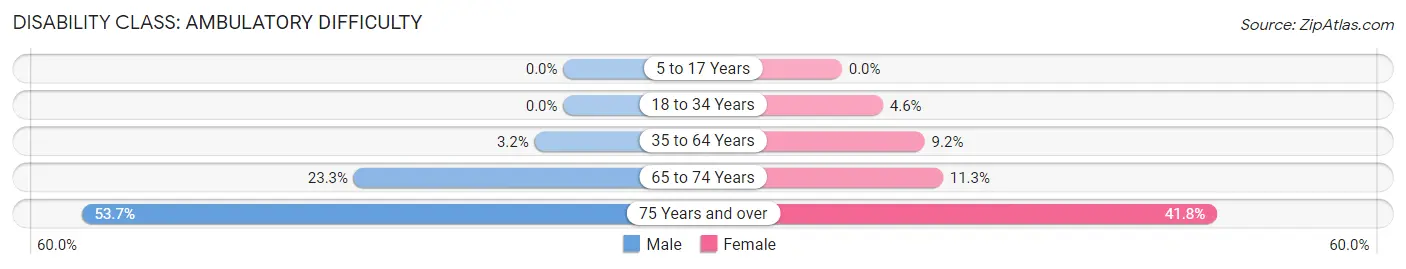
| Age Bracket | Male | Female |
| 5 to 17 Years | 0 (0.0%) | 0 (0.0%) |
| 18 to 34 Years | 0 (0.0%) | 9 (4.6%) |
| 35 to 64 Years | 11 (3.2%) | 31 (9.2%) |
| 65 to 74 Years | 14 (23.3%) | 9 (11.3%) |
| 75 Years and over | 22 (53.7%) | 28 (41.8%) |
Disability Class: Self-Care Difficulty
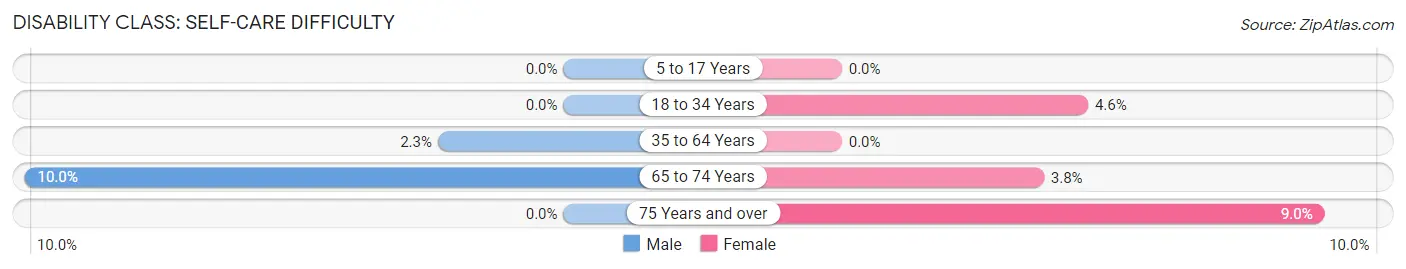
| Age Bracket | Male | Female |
| 5 to 17 Years | 0 (0.0%) | 0 (0.0%) |
| 18 to 34 Years | 0 (0.0%) | 9 (4.6%) |
| 35 to 64 Years | 8 (2.3%) | 0 (0.0%) |
| 65 to 74 Years | 6 (10.0%) | 3 (3.7%) |
| 75 Years and over | 0 (0.0%) | 6 (9.0%) |
Technology Access in Collinsville
Computing Device Access in Collinsville
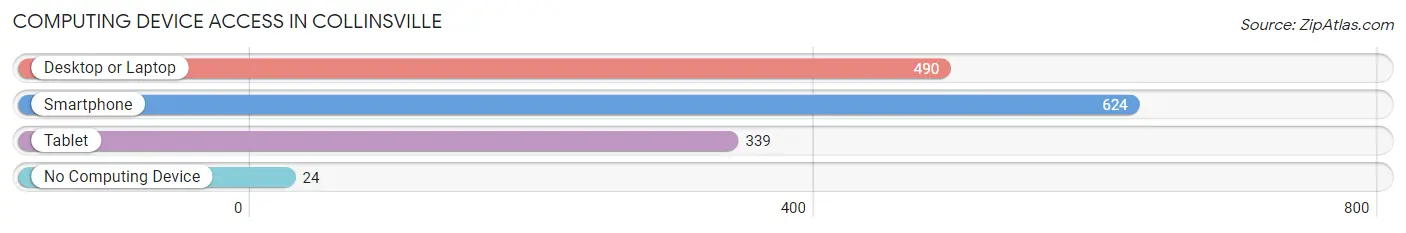
| Device Type | # Households | % Households |
| Desktop or Laptop | 490 | 74.1% |
| Smartphone | 624 | 94.4% |
| Tablet | 339 | 51.3% |
| No Computing Device | 24 | 3.6% |
| Total | 661 | 100.0% |
Internet Access in Collinsville
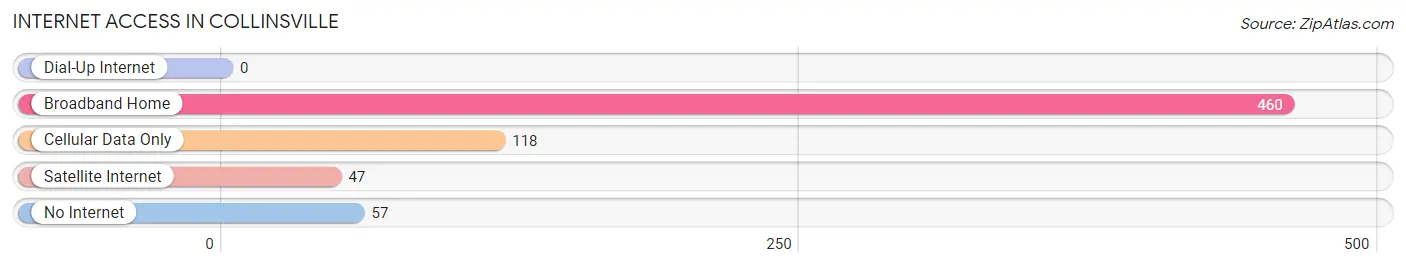
| Internet Type | # Households | % Households |
| Dial-Up Internet | 0 | 0.0% |
| Broadband Home | 460 | 69.6% |
| Cellular Data Only | 118 | 17.8% |
| Satellite Internet | 47 | 7.1% |
| No Internet | 57 | 8.6% |
| Total | 661 | 100.0% |
Collinsville Summary
History
The town of Collinsville, Texas is located in the northeast corner of Denton County, about 40 miles north of Dallas. It was founded in 1848 by William and Mary Collins, who moved to the area from Tennessee. The town was originally called Collins Settlement, but was later changed to Collinsville. The town was officially incorporated in 1873.
The town was a farming community for many years, with cotton and corn being the main crops. In the early 1900s, the town began to grow as the railroad came through and the population increased. The town was also home to several businesses, including a cotton gin, a blacksmith shop, a general store, and a hotel.
In the 1950s, the town began to experience a population boom as people moved to the area from other parts of the country. This growth was due in part to the development of nearby Lake Ray Roberts, which provided recreational opportunities for the residents.
Geography
Collinsville is located in the northeast corner of Denton County, about 40 miles north of Dallas. It is situated on the banks of the Elm Fork of the Trinity River. The town is surrounded by rolling hills and is home to several creeks and streams. The climate is generally mild, with temperatures ranging from the mid-50s in the winter to the mid-90s in the summer.
Economy
The economy of Collinsville is largely based on agriculture and tourism. The town is home to several farms, which produce a variety of crops, including cotton, corn, wheat, and hay. The town is also home to several businesses, including a grocery store, a hardware store, a restaurant, and a gas station.
The town is also a popular tourist destination, with visitors coming to enjoy the nearby Lake Ray Roberts and the surrounding countryside. The town is home to several parks, including Collinsville Park, which features a playground, picnic areas, and a fishing pond.
Demographics
As of the 2010 census, the population of Collinsville was 1,845. The racial makeup of the town was 94.3% White, 0.7% African American, 0.3% Native American, 0.2% Asian, 0.1% Pacific Islander, 2.7% from other races, and 1.7% from two or more races. Hispanic or Latino of any race were 5.3% of the population.
The median household income in Collinsville was $45,938, and the median family income was $50,938. The per capita income was $20,938. About 11.3% of families and 13.3% of the population were below the poverty line, including 17.3% of those under age 18 and 8.3% of those age 65 or over.
Collinsville is served by the Denton Independent School District. The town is home to Collinsville High School, which serves students in grades 9-12. The town is also home to several churches, including the First United Methodist Church, the First Baptist Church, and the Church of Christ.
Common Questions
What is Per Capita Income in Collinsville?
Per Capita income in Collinsville is $32,890.
What is the Median Family Income in Collinsville?
Median Family Income in Collinsville is $61,389.
What is the Median Household income in Collinsville?
Median Household Income in Collinsville is $59,525.
What is Income or Wage Gap in Collinsville?
Income or Wage Gap in Collinsville is 47.1%.
Women in Collinsville earn 52.9 cents for every dollar earned by a man.
What is Inequality or Gini Index in Collinsville?
Inequality or Gini Index in Collinsville is 0.42.
What is the Total Population of Collinsville?
Total Population of Collinsville is 1,762.
What is the Total Male Population of Collinsville?
Total Male Population of Collinsville is 911.
What is the Total Female Population of Collinsville?
Total Female Population of Collinsville is 851.
What is the Ratio of Males per 100 Females in Collinsville?
There are 107.05 Males per 100 Females in Collinsville.
What is the Ratio of Females per 100 Males in Collinsville?
There are 93.41 Females per 100 Males in Collinsville.
What is the Median Population Age in Collinsville?
Median Population Age in Collinsville is 36.1 Years.
What is the Average Family Size in Collinsville
Average Family Size in Collinsville is 2.8 People.
What is the Average Household Size in Collinsville
Average Household Size in Collinsville is 2.6 People.
How Large is the Labor Force in Collinsville?
There are 883 People in the Labor Forcein in Collinsville.
What is the Percentage of People in the Labor Force in Collinsville?
63.5% of People are in the Labor Force in Collinsville.
What is the Unemployment Rate in Collinsville?
Unemployment Rate in Collinsville is 1.5%.