Coleman, TX Map & Demographics
Coleman Map
Coleman Overview
$27,195
PER CAPITA INCOME
$58,587
AVG FAMILY INCOME
$49,588
AVG HOUSEHOLD INCOME
20.9%
WAGE / INCOME GAP [ % ]
79.1¢/ $1
WAGE / INCOME GAP [ $ ]
0.46
INEQUALITY / GINI INDEX
3,973
TOTAL POPULATION
2,013
MALE POPULATION
1,960
FEMALE POPULATION
102.70
MALES / 100 FEMALES
97.37
FEMALES / 100 MALES
43.5
MEDIAN AGE
3.5
AVG FAMILY SIZE
2.5
AVG HOUSEHOLD SIZE
1,849
LABOR FORCE [ PEOPLE ]
60.4%
PERCENT IN LABOR FORCE
9.5%
UNEMPLOYMENT RATE
Coleman Zip Codes
Coleman Area Codes
Income in Coleman
Income Overview in Coleman
Per Capita Income in Coleman is $27,195, while median incomes of families and households are $58,587 and $49,588 respectively.
| Characteristic | Number | Measure |
| Per Capita Income | 3,973 | $27,195 |
| Median Family Income | 884 | $58,587 |
| Mean Family Income | 884 | $77,972 |
| Median Household Income | 1,587 | $49,588 |
| Mean Household Income | 1,587 | $66,721 |
| Income Deficit | 884 | $0 |
| Wage / Income Gap (%) | 3,973 | 20.92% |
| Wage / Income Gap ($) | 3,973 | 79.08¢ per $1 |
| Gini / Inequality Index | 3,973 | 0.46 |
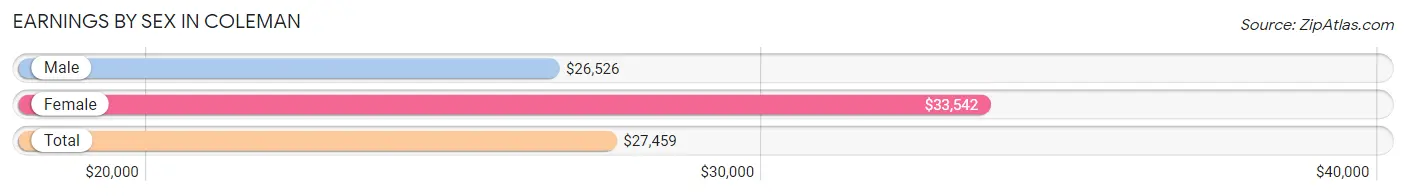
Earnings by Sex in Coleman
Average Earnings in Coleman are $27,459, $26,526 for men and $33,542 for women, a difference of 20.9%.
| Sex | Number | Average Earnings |
| Male | 1,068 (57.0%) | $26,526 |
| Female | 807 (43.0%) | $33,542 |
| Total | 1,875 (100.0%) | $27,459 |
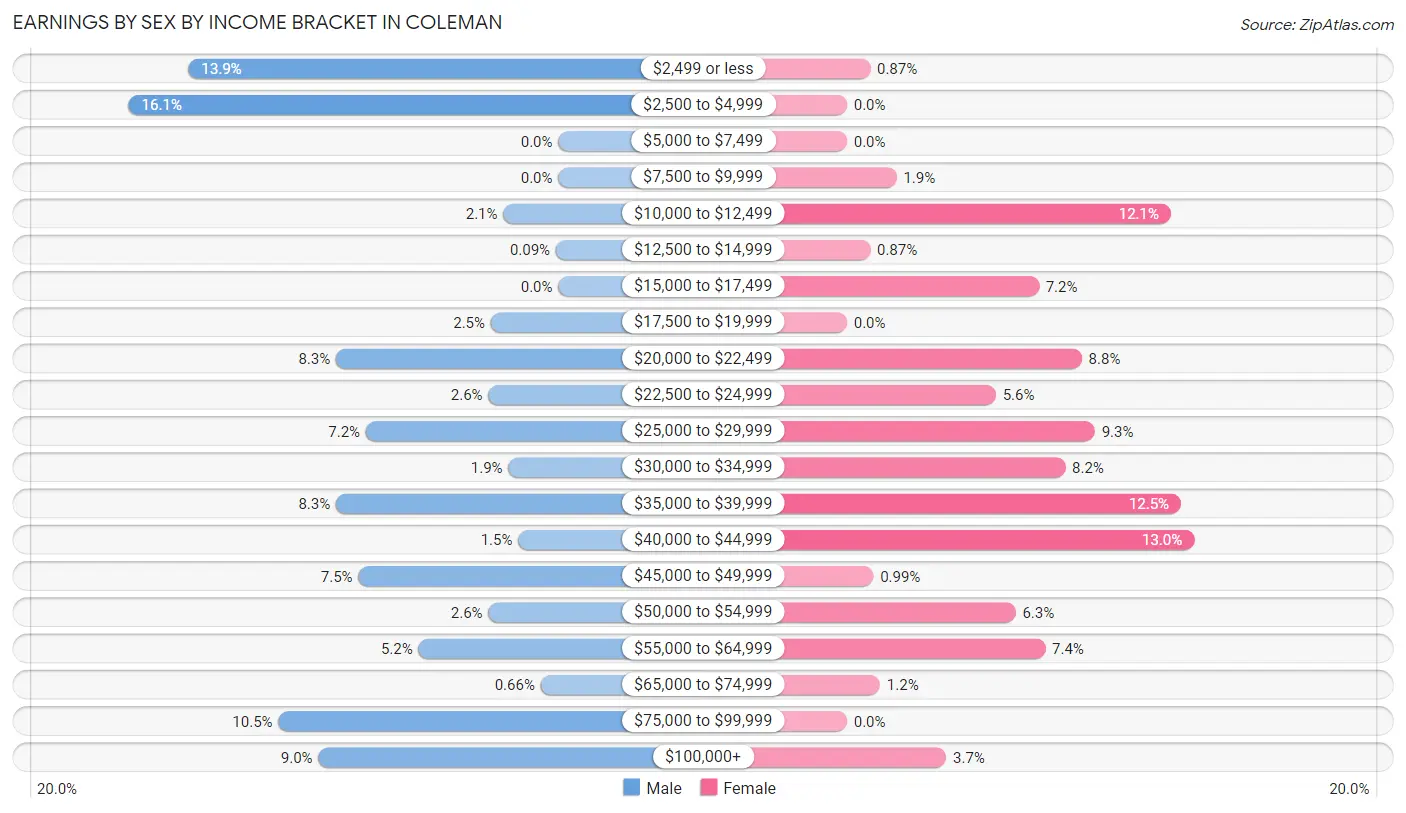
Earnings by Sex by Income Bracket in Coleman
The most common earnings brackets in Coleman are $2,500 to $4,999 for men (172 | 16.1%) and $40,000 to $44,999 for women (105 | 13.0%).
| Income | Male | Female |
| $2,499 or less | 148 (13.9%) | 7 (0.9%) |
| $2,500 to $4,999 | 172 (16.1%) | 0 (0.0%) |
| $5,000 to $7,499 | 0 (0.0%) | 0 (0.0%) |
| $7,500 to $9,999 | 0 (0.0%) | 15 (1.9%) |
| $10,000 to $12,499 | 22 (2.1%) | 98 (12.1%) |
| $12,500 to $14,999 | 1 (0.1%) | 7 (0.9%) |
| $15,000 to $17,499 | 0 (0.0%) | 58 (7.2%) |
| $17,500 to $19,999 | 27 (2.5%) | 0 (0.0%) |
| $20,000 to $22,499 | 89 (8.3%) | 71 (8.8%) |
| $22,500 to $24,999 | 28 (2.6%) | 45 (5.6%) |
| $25,000 to $29,999 | 77 (7.2%) | 75 (9.3%) |
| $30,000 to $34,999 | 20 (1.9%) | 66 (8.2%) |
| $35,000 to $39,999 | 89 (8.3%) | 101 (12.5%) |
| $40,000 to $44,999 | 16 (1.5%) | 105 (13.0%) |
| $45,000 to $49,999 | 80 (7.5%) | 8 (1.0%) |
| $50,000 to $54,999 | 28 (2.6%) | 51 (6.3%) |
| $55,000 to $64,999 | 56 (5.2%) | 60 (7.4%) |
| $65,000 to $74,999 | 7 (0.7%) | 10 (1.2%) |
| $75,000 to $99,999 | 112 (10.5%) | 0 (0.0%) |
| $100,000+ | 96 (9.0%) | 30 (3.7%) |
| Total | 1,068 (100.0%) | 807 (100.0%) |
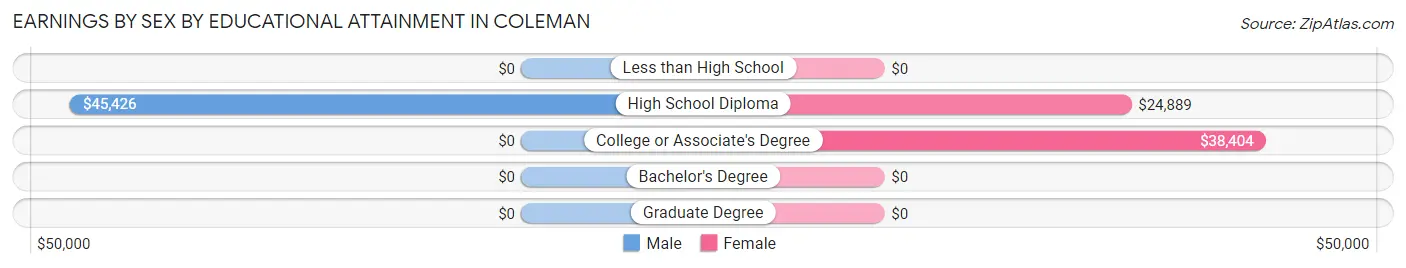
Earnings by Sex by Educational Attainment in Coleman
Average earnings in Coleman are $35,744 for men and $36,852 for women, a difference of 3.0%. Men with an educational attainment of high school diploma enjoy the highest average annual earnings of $45,426, while those with high school diploma education earn the least with $45,426. Women with an educational attainment of college or associate's degree earn the most with the average annual earnings of $38,404, while those with high school diploma education have the smallest earnings of $24,889.
| Educational Attainment | Male Income | Female Income |
| Less than High School | - | - |
| High School Diploma | $45,426 | $24,889 |
| College or Associate's Degree | - | - |
| Bachelor's Degree | - | - |
| Graduate Degree | - | - |
| Total | $35,744 | $36,852 |
Family Income in Coleman
Family Income Brackets in Coleman
According to the Coleman family income data, there are 241 families falling into the $50,000 to $74,999 income range, which is the most common income bracket and makes up 27.3% of all families. Conversely, the less than $10,000 income bracket is the least frequent group with only 6 families (0.7%) belonging to this category.
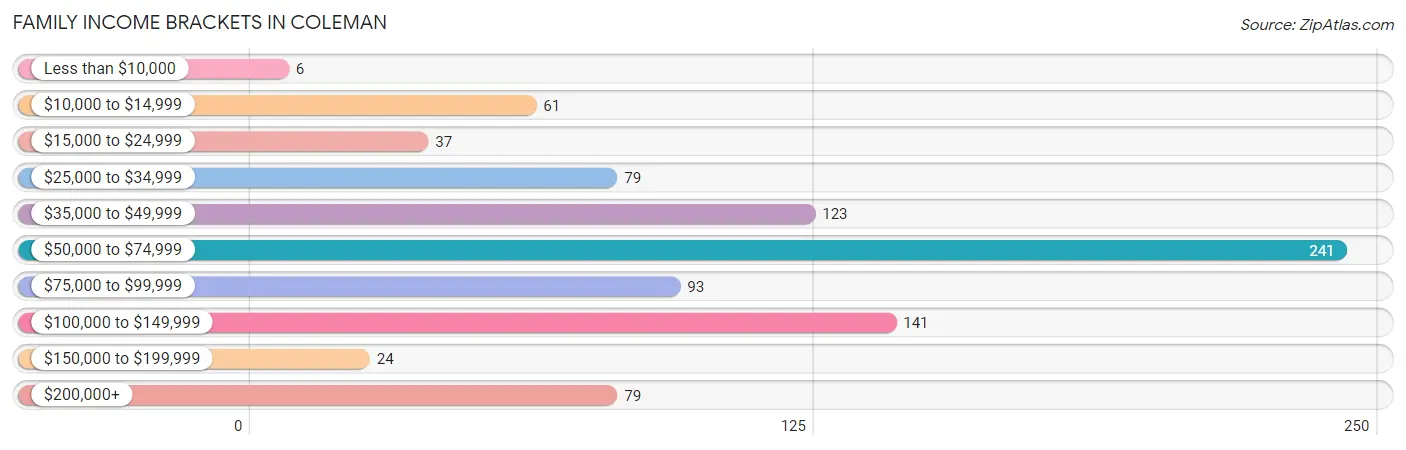
| Income Bracket | # Families | % Families |
| Less than $10,000 | 6 | 0.7% |
| $10,000 to $14,999 | 61 | 6.9% |
| $15,000 to $24,999 | 37 | 4.2% |
| $25,000 to $34,999 | 79 | 8.9% |
| $35,000 to $49,999 | 123 | 13.9% |
| $50,000 to $74,999 | 241 | 27.3% |
| $75,000 to $99,999 | 93 | 10.5% |
| $100,000 to $149,999 | 141 | 16.0% |
| $150,000 to $199,999 | 24 | 2.7% |
| $200,000+ | 79 | 8.9% |
Family Income by Famaliy Size in Coleman
3-person families (56 | 6.3%) account for the highest median family income in Coleman with $85,167 per family, while 3-person families (56 | 6.3%) have the highest median income of $28,389 per family member.
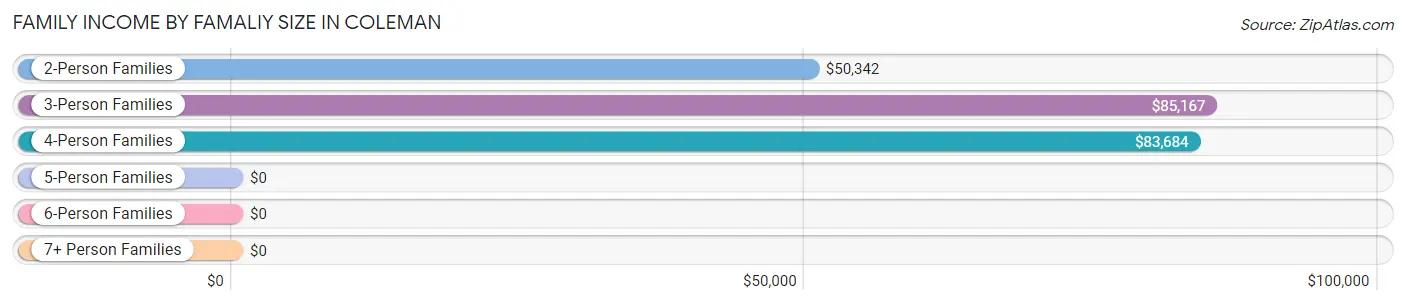
| Income Bracket | # Families | Median Income |
| 2-Person Families | 477 (54.0%) | $50,342 |
| 3-Person Families | 56 (6.3%) | $85,167 |
| 4-Person Families | 228 (25.8%) | $83,684 |
| 5-Person Families | 55 (6.2%) | $0 |
| 6-Person Families | 68 (7.7%) | $0 |
| 7+ Person Families | 0 (0.0%) | $0 |
| Total | 884 (100.0%) | $58,587 |
Family Income by Number of Earners in Coleman
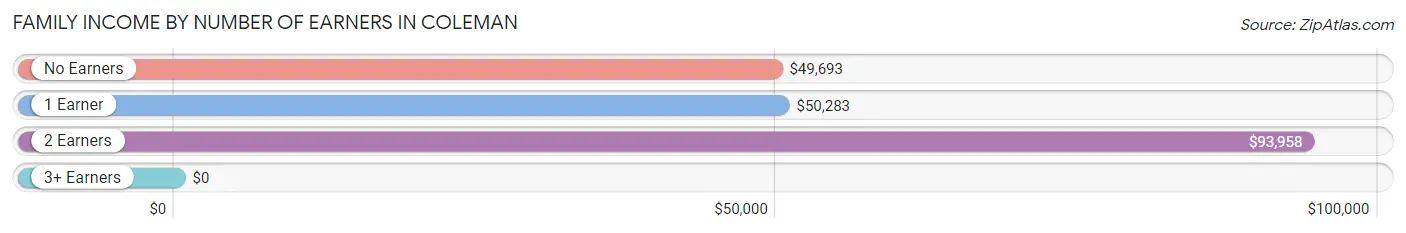
| Number of Earners | # Families | Median Income |
| No Earners | 193 (21.8%) | $49,693 |
| 1 Earner | 226 (25.6%) | $50,283 |
| 2 Earners | 403 (45.6%) | $93,958 |
| 3+ Earners | 62 (7.0%) | $0 |
| Total | 884 (100.0%) | $58,587 |
Household Income in Coleman
Household Income Brackets in Coleman
With 421 households falling in the category, the $50,000 to $74,999 income range is the most frequent in Coleman, accounting for 26.5% of all households. In contrast, only 14 households (0.9%) fall into the less than $10,000 income bracket, making it the least populous group.
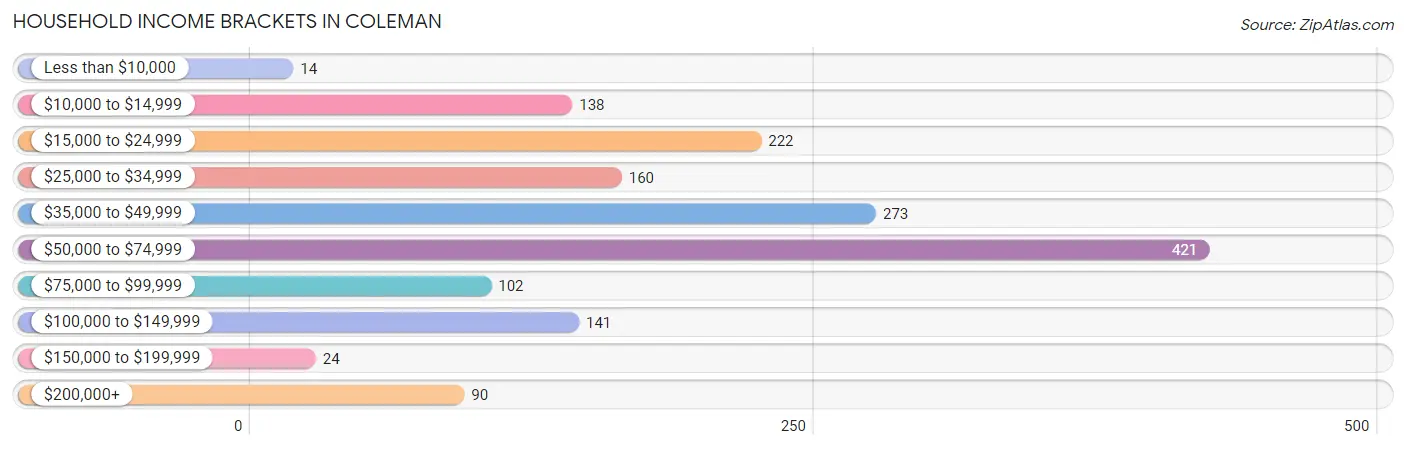
| Income Bracket | # Households | % Households |
| Less than $10,000 | 14 | 0.9% |
| $10,000 to $14,999 | 138 | 8.7% |
| $15,000 to $24,999 | 222 | 14.0% |
| $25,000 to $34,999 | 160 | 10.1% |
| $35,000 to $49,999 | 273 | 17.2% |
| $50,000 to $74,999 | 421 | 26.5% |
| $75,000 to $99,999 | 102 | 6.4% |
| $100,000 to $149,999 | 141 | 8.9% |
| $150,000 to $199,999 | 24 | 1.5% |
| $200,000+ | 90 | 5.7% |
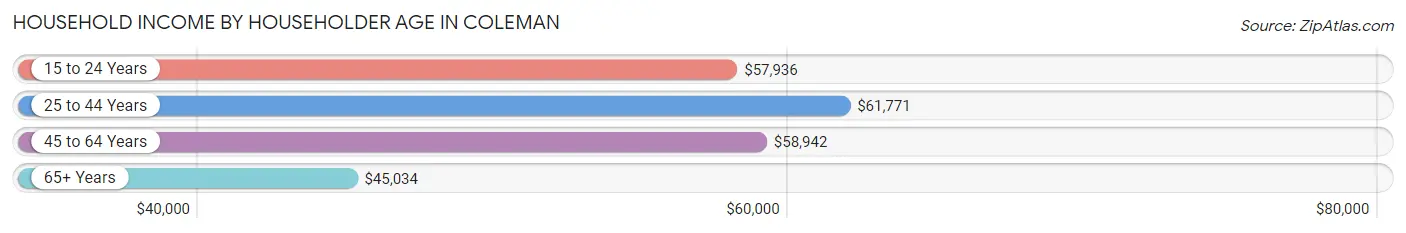
Household Income by Householder Age in Coleman
The median household income in Coleman is $49,588, with the highest median household income of $61,771 found in the 25 to 44 years age bracket for the primary householder. A total of 269 households (17.0%) fall into this category. Meanwhile, the 65+ years age bracket for the primary householder has the lowest median household income of $45,034, with 725 households (45.7%) in this group.
| Income Bracket | # Households | Median Income |
| 15 to 24 Years | 109 (6.9%) | $57,936 |
| 25 to 44 Years | 269 (17.0%) | $61,771 |
| 45 to 64 Years | 484 (30.5%) | $58,942 |
| 65+ Years | 725 (45.7%) | $45,034 |
| Total | 1,587 (100.0%) | $49,588 |
Poverty in Coleman
Income Below Poverty by Sex and Age in Coleman
With 22.0% poverty level for males and 19.8% for females among the residents of Coleman, under 5 year old males and 5 year old females are the most vulnerable to poverty, with 90 males (66.7%) and 50 females (100.0%) in their respective age groups living below the poverty level.
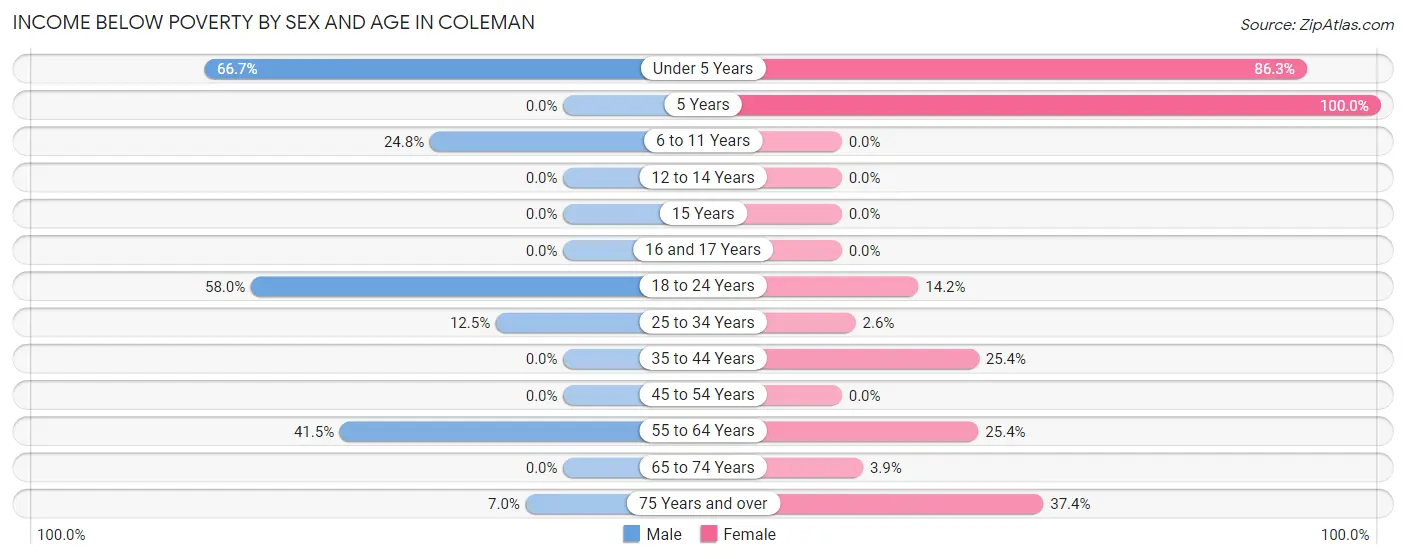
| Age Bracket | Male | Female |
| Under 5 Years | 90 (66.7%) | 88 (86.3%) |
| 5 Years | 0 (0.0%) | 50 (100.0%) |
| 6 to 11 Years | 49 (24.7%) | 0 (0.0%) |
| 12 to 14 Years | 0 (0.0%) | 0 (0.0%) |
| 15 Years | 0 (0.0%) | 0 (0.0%) |
| 16 and 17 Years | 0 (0.0%) | 0 (0.0%) |
| 18 to 24 Years | 120 (58.0%) | 26 (14.2%) |
| 25 to 34 Years | 22 (12.5%) | 3 (2.6%) |
| 35 to 44 Years | 0 (0.0%) | 58 (25.4%) |
| 45 to 54 Years | 0 (0.0%) | 0 (0.0%) |
| 55 to 64 Years | 136 (41.5%) | 53 (25.4%) |
| 65 to 74 Years | 0 (0.0%) | 14 (3.9%) |
| 75 Years and over | 13 (7.0%) | 92 (37.4%) |
| Total | 430 (22.0%) | 384 (19.8%) |
Income Above Poverty by Sex and Age in Coleman
According to the poverty statistics in Coleman, males aged 12 to 14 years and females aged 6 to 11 years are the age groups that are most secure financially, with 100.0% of males and 100.0% of females in these age groups living above the poverty line.
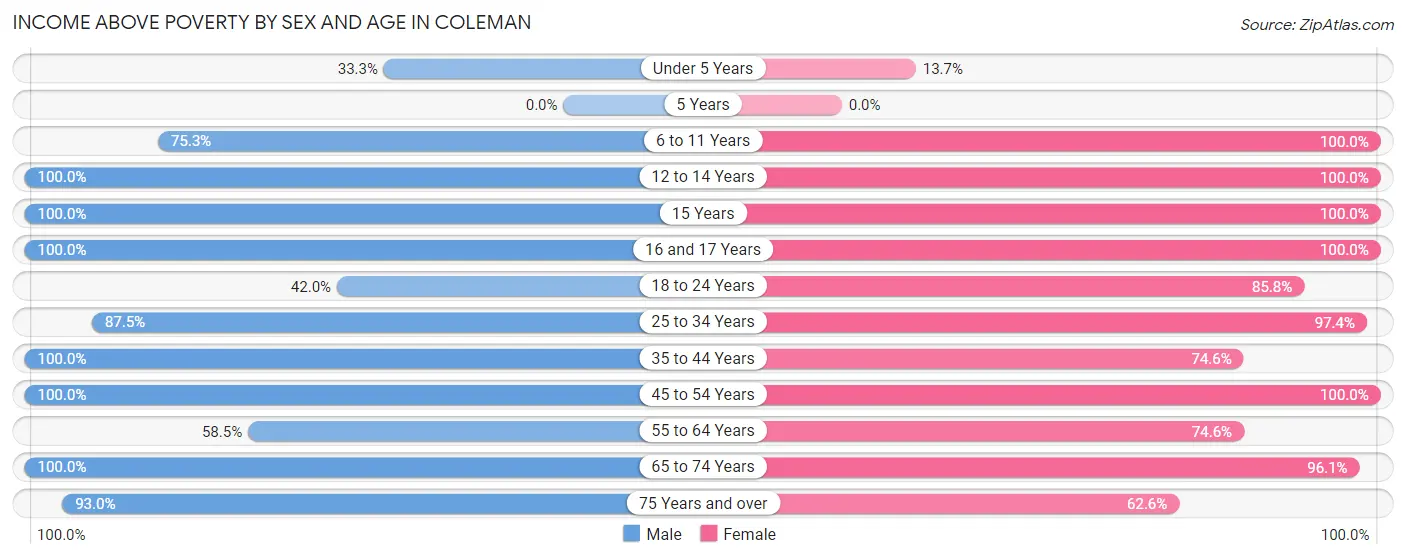
| Age Bracket | Male | Female |
| Under 5 Years | 45 (33.3%) | 14 (13.7%) |
| 5 Years | 0 (0.0%) | 0 (0.0%) |
| 6 to 11 Years | 149 (75.2%) | 66 (100.0%) |
| 12 to 14 Years | 68 (100.0%) | 85 (100.0%) |
| 15 Years | 74 (100.0%) | 94 (100.0%) |
| 16 and 17 Years | 16 (100.0%) | 32 (100.0%) |
| 18 to 24 Years | 87 (42.0%) | 157 (85.8%) |
| 25 to 34 Years | 154 (87.5%) | 114 (97.4%) |
| 35 to 44 Years | 142 (100.0%) | 170 (74.6%) |
| 45 to 54 Years | 229 (100.0%) | 169 (100.0%) |
| 55 to 64 Years | 192 (58.5%) | 156 (74.6%) |
| 65 to 74 Years | 200 (100.0%) | 342 (96.1%) |
| 75 Years and over | 173 (93.0%) | 154 (62.6%) |
| Total | 1,529 (78.0%) | 1,553 (80.2%) |
Income Below Poverty Among Married-Couple Families in Coleman
The poverty statistics for married-couple families in Coleman show that 4.8% or 34 of the total 704 families live below the poverty line. Families with 1 or 2 children have the highest poverty rate of 9.7%, comprising of 21 families. On the other hand, families with 3 or 4 children have the lowest poverty rate of 0.0%, which includes 0 families.
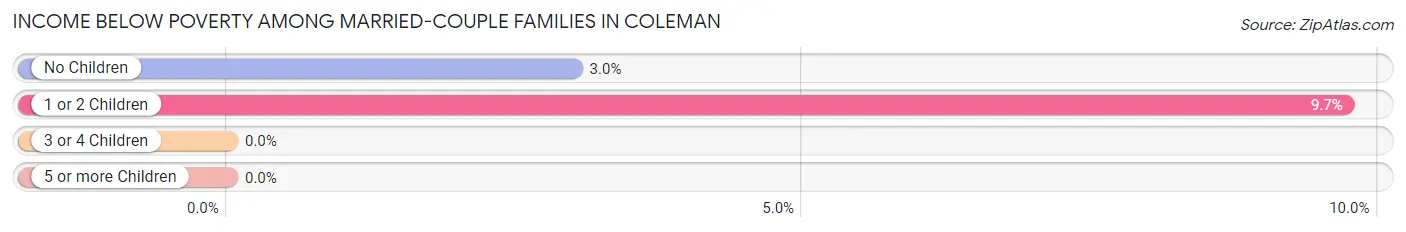
| Children | Above Poverty | Below Poverty |
| No Children | 420 (97.0%) | 13 (3.0%) |
| 1 or 2 Children | 195 (90.3%) | 21 (9.7%) |
| 3 or 4 Children | 55 (100.0%) | 0 (0.0%) |
| 5 or more Children | 0 (0.0%) | 0 (0.0%) |
| Total | 670 (95.2%) | 34 (4.8%) |
Income Below Poverty Among Single-Parent Households in Coleman
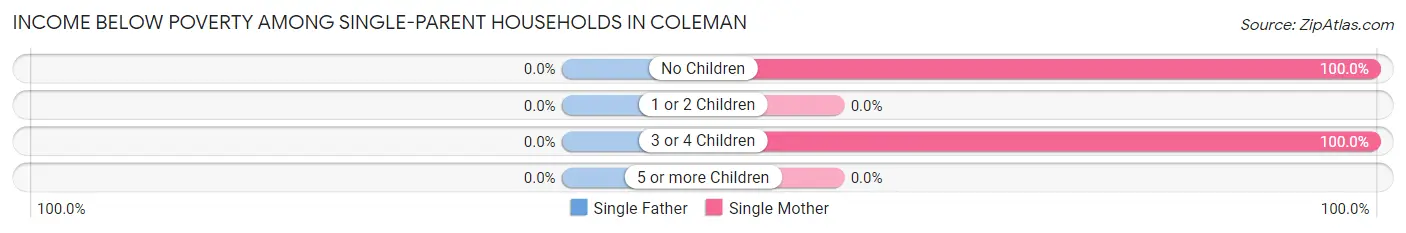
| Children | Single Father | Single Mother |
| No Children | 0 (0.0%) | 54 (100.0%) |
| 1 or 2 Children | 0 (0.0%) | 0 (0.0%) |
| 3 or 4 Children | 0 (0.0%) | 58 (100.0%) |
| 5 or more Children | 0 (0.0%) | 0 (0.0%) |
| Total | 0 (0.0%) | 112 (94.1%) |
Income Below Poverty Among Married-Couple vs Single-Parent Households in Coleman
The poverty data for Coleman shows that 34 of the married-couple family households (4.8%) and 112 of the single-parent households (62.2%) are living below the poverty level. Within the married-couple family households, those with 1 or 2 children have the highest poverty rate, with 21 households (9.7%) falling below the poverty line. Among the single-parent households, those with 3 or 4 children have the highest poverty rate, with 58 household (100.0%) living below poverty.
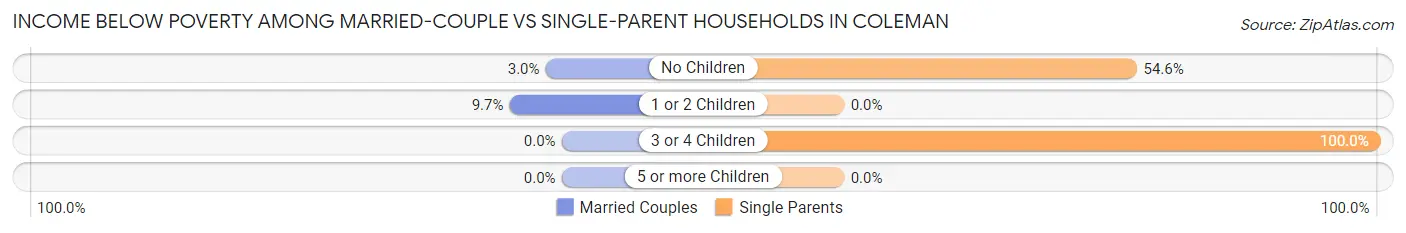
| Children | Married-Couple Families | Single-Parent Households |
| No Children | 13 (3.0%) | 54 (54.5%) |
| 1 or 2 Children | 21 (9.7%) | 0 (0.0%) |
| 3 or 4 Children | 0 (0.0%) | 58 (100.0%) |
| 5 or more Children | 0 (0.0%) | 0 (0.0%) |
| Total | 34 (4.8%) | 112 (62.2%) |
Race in Coleman
The most populous races in Coleman are White / Caucasian (3,020 | 76.0%), Hispanic or Latino (1,144 | 28.8%), and Two or more Races (562 | 14.1%).
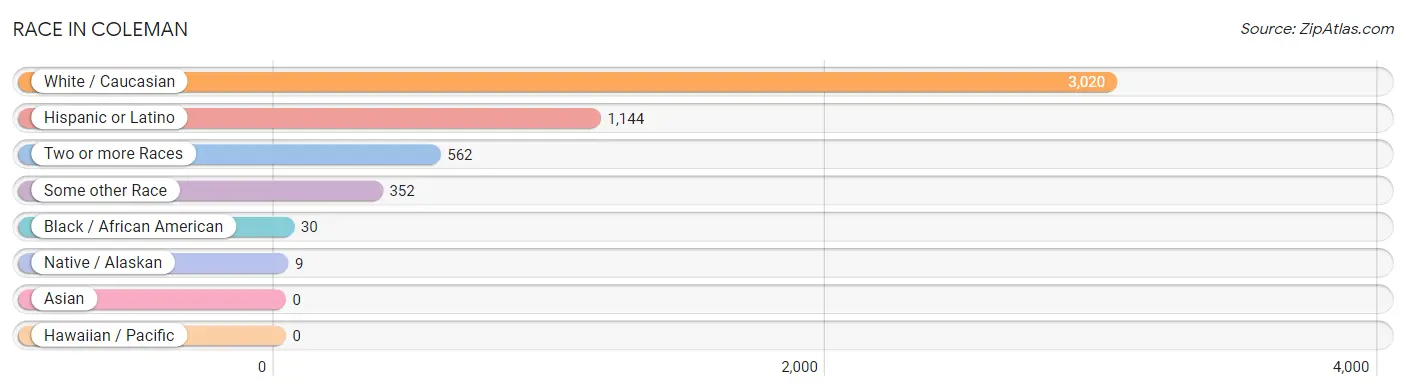
| Race | # Population | % Population |
| Asian | 0 | 0.0% |
| Black / African American | 30 | 0.8% |
| Hawaiian / Pacific | 0 | 0.0% |
| Hispanic or Latino | 1,144 | 28.8% |
| Native / Alaskan | 9 | 0.2% |
| White / Caucasian | 3,020 | 76.0% |
| Two or more Races | 562 | 14.1% |
| Some other Race | 352 | 8.9% |
| Total | 3,973 | 100.0% |
Ancestry in Coleman
The most populous ancestries reported in Coleman are Mexican (1,017 | 25.6%), European (774 | 19.5%), English (492 | 12.4%), Scottish (395 | 9.9%), and German (362 | 9.1%), together accounting for 76.5% of all Coleman residents.
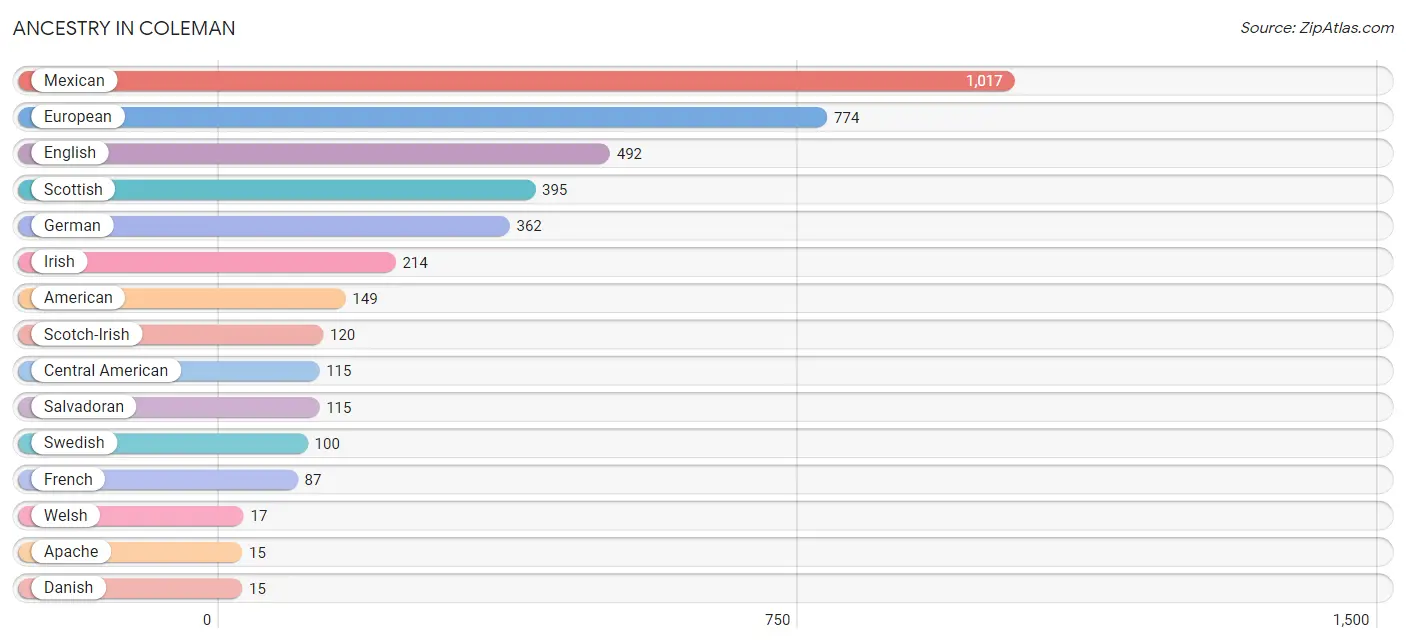
| Ancestry | # Population | % Population |
| American | 149 | 3.7% |
| Apache | 15 | 0.4% |
| Belgian | 9 | 0.2% |
| Central American | 115 | 2.9% |
| Cherokee | 2 | 0.1% |
| Chickasaw | 7 | 0.2% |
| Comanche | 6 | 0.2% |
| Danish | 15 | 0.4% |
| English | 492 | 12.4% |
| European | 774 | 19.5% |
| French | 87 | 2.2% |
| German | 362 | 9.1% |
| Irish | 214 | 5.4% |
| Mexican | 1,017 | 25.6% |
| Russian | 7 | 0.2% |
| Salvadoran | 115 | 2.9% |
| Scotch-Irish | 120 | 3.0% |
| Scottish | 395 | 9.9% |
| Spaniard | 3 | 0.1% |
| Swedish | 100 | 2.5% |
| Welsh | 17 | 0.4% | View All 21 Rows |
Immigrants in Coleman
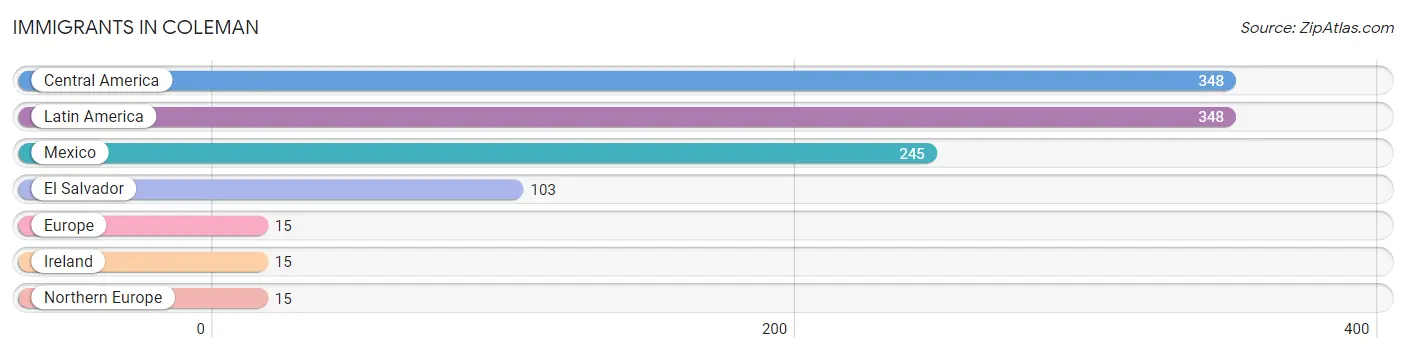
The most numerous immigrant groups reported in Coleman came from Central America (348 | 8.8%), Latin America (348 | 8.8%), Mexico (245 | 6.2%), El Salvador (103 | 2.6%), and Europe (15 | 0.4%), together accounting for 26.7% of all Coleman residents.
| Immigration Origin | # Population | % Population |
| Central America | 348 | 8.8% |
| El Salvador | 103 | 2.6% |
| Europe | 15 | 0.4% |
| Ireland | 15 | 0.4% |
| Latin America | 348 | 8.8% |
| Mexico | 245 | 6.2% |
| Northern Europe | 15 | 0.4% | View All 7 Rows |
Sex and Age in Coleman
Sex and Age in Coleman
The most populous age groups in Coleman are 15 to 19 Years (259 | 12.9%) for men and 70 to 74 Years (248 | 12.7%) for women.
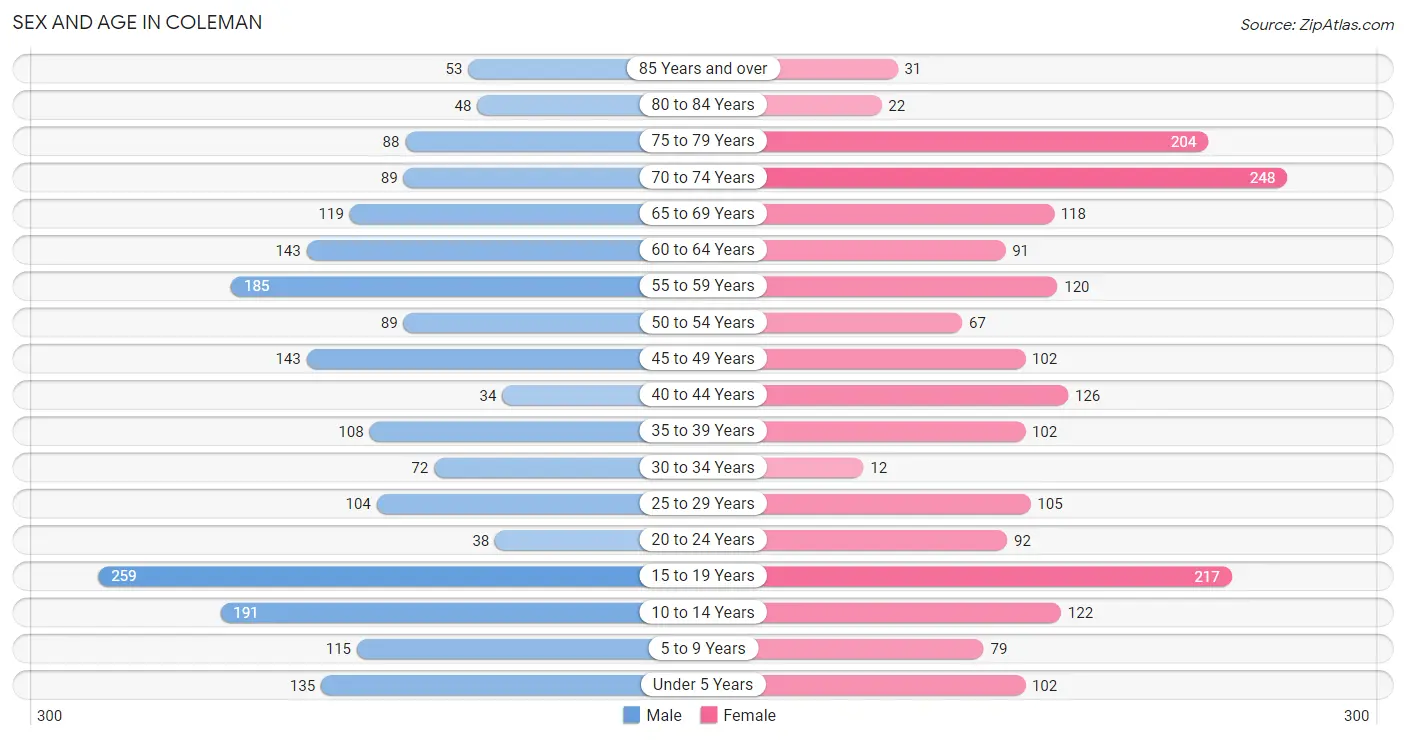
| Age Bracket | Male | Female |
| Under 5 Years | 135 (6.7%) | 102 (5.2%) |
| 5 to 9 Years | 115 (5.7%) | 79 (4.0%) |
| 10 to 14 Years | 191 (9.5%) | 122 (6.2%) |
| 15 to 19 Years | 259 (12.9%) | 217 (11.1%) |
| 20 to 24 Years | 38 (1.9%) | 92 (4.7%) |
| 25 to 29 Years | 104 (5.2%) | 105 (5.4%) |
| 30 to 34 Years | 72 (3.6%) | 12 (0.6%) |
| 35 to 39 Years | 108 (5.4%) | 102 (5.2%) |
| 40 to 44 Years | 34 (1.7%) | 126 (6.4%) |
| 45 to 49 Years | 143 (7.1%) | 102 (5.2%) |
| 50 to 54 Years | 89 (4.4%) | 67 (3.4%) |
| 55 to 59 Years | 185 (9.2%) | 120 (6.1%) |
| 60 to 64 Years | 143 (7.1%) | 91 (4.6%) |
| 65 to 69 Years | 119 (5.9%) | 118 (6.0%) |
| 70 to 74 Years | 89 (4.4%) | 248 (12.7%) |
| 75 to 79 Years | 88 (4.4%) | 204 (10.4%) |
| 80 to 84 Years | 48 (2.4%) | 22 (1.1%) |
| 85 Years and over | 53 (2.6%) | 31 (1.6%) |
| Total | 2,013 (100.0%) | 1,960 (100.0%) |
Families and Households in Coleman
Median Family Size in Coleman
The median family size in Coleman is 3.48 persons per family, with single female/mother families (119 | 13.5%) accounting for the largest median family size of 5 persons per family. On the other hand, married-couple families (704 | 79.6%) represent the smallest median family size with 3.23 persons per family.
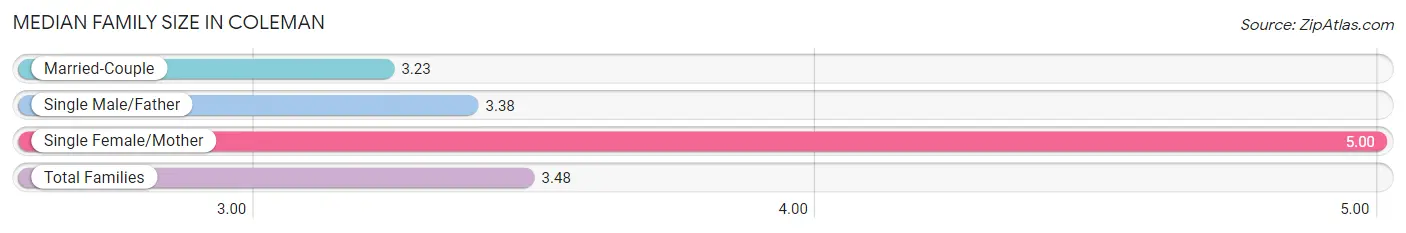
| Family Type | # Families | Family Size |
| Married-Couple | 704 (79.6%) | 3.23 |
| Single Male/Father | 61 (6.9%) | 3.38 |
| Single Female/Mother | 119 (13.5%) | 5.00 |
| Total Families | 884 (100.0%) | 3.48 |
Median Household Size in Coleman
The median household size in Coleman is 2.48 persons per household, with single female/mother households (119 | 7.5%) accounting for the largest median household size of 5 persons per household. non-family households (703 | 44.3%) represent the smallest median household size with 1.20 persons per household.
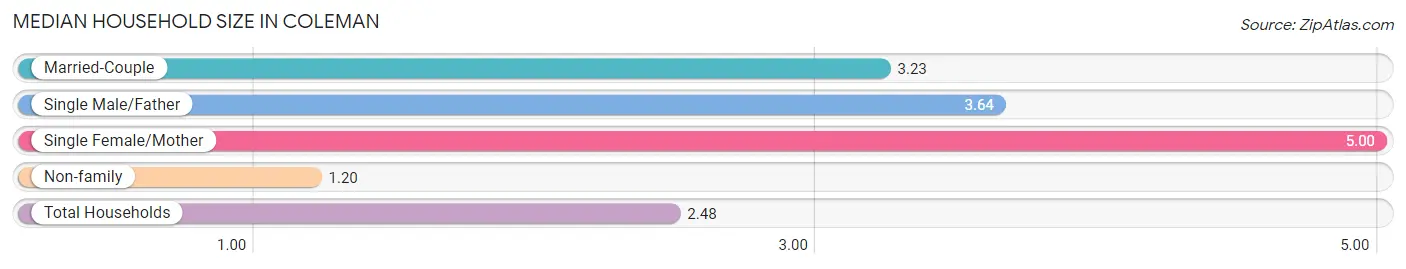
| Household Type | # Households | Household Size |
| Married-Couple | 704 (44.4%) | 3.23 |
| Single Male/Father | 61 (3.8%) | 3.64 |
| Single Female/Mother | 119 (7.5%) | 5.00 |
| Non-family | 703 (44.3%) | 1.20 |
| Total Households | 1,587 (100.0%) | 2.48 |
Household Size by Marriage Status in Coleman
Out of a total of 1,587 households in Coleman, 884 (55.7%) are family households, while 703 (44.3%) are nonfamily households. The most numerous type of family households are 2-person households, comprising 461, and the most common type of nonfamily households are 1-person households, comprising 601.
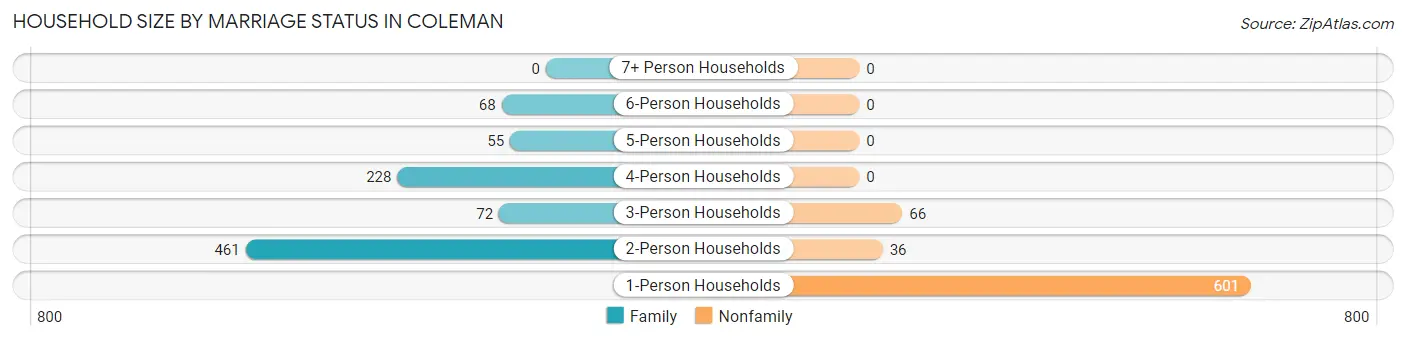
| Household Size | Family Households | Nonfamily Households |
| 1-Person Households | - | 601 (37.9%) |
| 2-Person Households | 461 (29.0%) | 36 (2.3%) |
| 3-Person Households | 72 (4.5%) | 66 (4.2%) |
| 4-Person Households | 228 (14.4%) | 0 (0.0%) |
| 5-Person Households | 55 (3.5%) | 0 (0.0%) |
| 6-Person Households | 68 (4.3%) | 0 (0.0%) |
| 7+ Person Households | 0 (0.0%) | 0 (0.0%) |
| Total | 884 (55.7%) | 703 (44.3%) |
Female Fertility in Coleman
Fertility by Age in Coleman
Average fertility rate in Coleman is 99.0 births per 1,000 women. Women in the age bracket of 35 to 50 years have the highest fertility rate with 161.0 births per 1,000 women. Women in the age bracket of 35 to 50 years acount for 74.4% of all women with births.
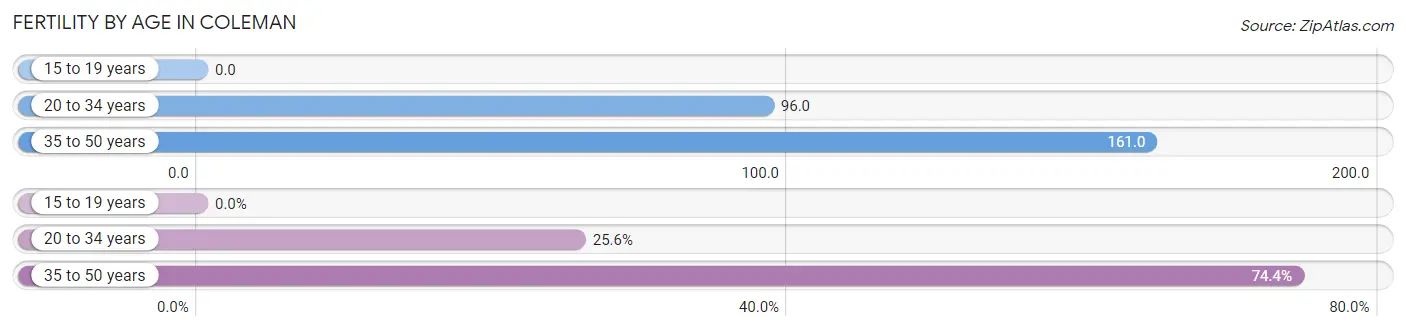
| Age Bracket | Women with Births | Births / 1,000 Women |
| 15 to 19 years | 0 (0.0%) | 0.0 |
| 20 to 34 years | 20 (25.6%) | 96.0 |
| 35 to 50 years | 58 (74.4%) | 161.0 |
| Total | 78 (100.0%) | 99.0 |
Fertility by Age by Marriage Status in Coleman
25.6% of women with births (78) in Coleman are married. The highest percentage of unmarried women with births falls into 35 to 50 years age bracket with 100.0% of them unmarried at the time of birth, while the lowest percentage of unmarried women with births belong to 20 to 34 years age bracket with 0.0% of them unmarried.
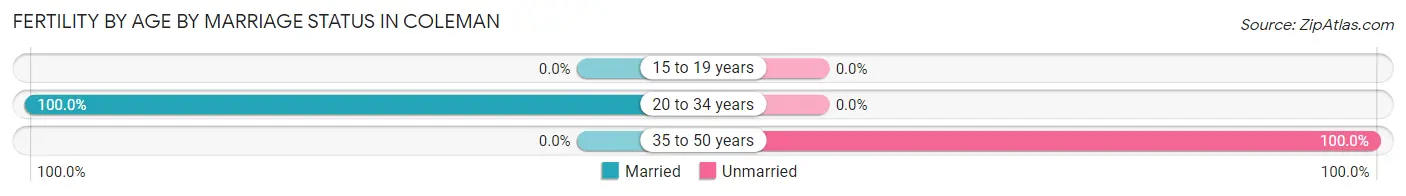
| Age Bracket | Married | Unmarried |
| 15 to 19 years | 0 (0.0%) | 0 (0.0%) |
| 20 to 34 years | 20 (100.0%) | 0 (0.0%) |
| 35 to 50 years | 0 (0.0%) | 58 (100.0%) |
| Total | 20 (25.6%) | 58 (74.4%) |
Fertility by Education in Coleman
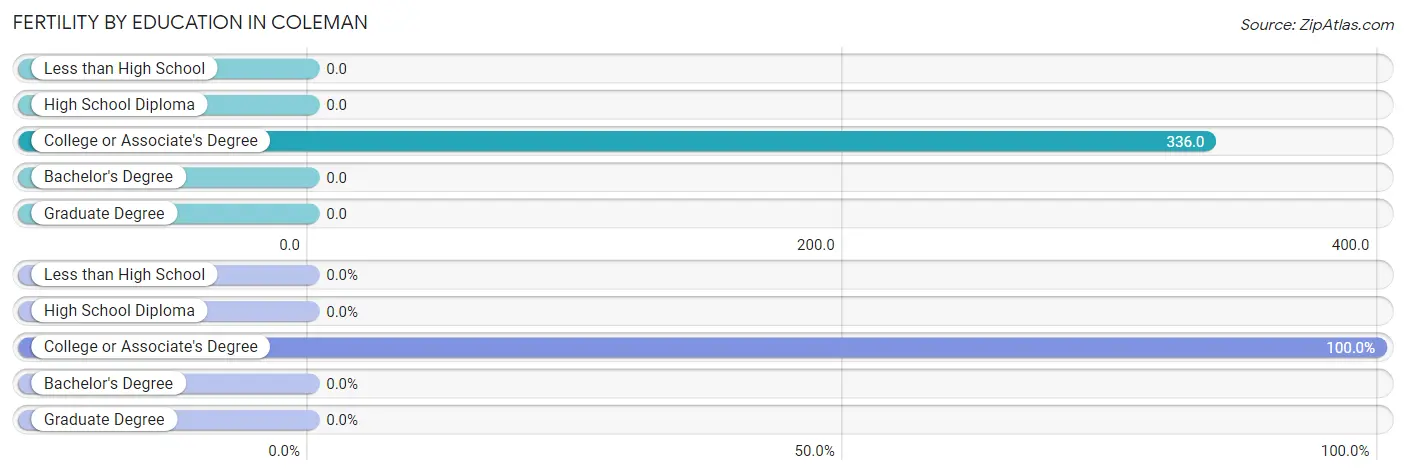
| Educational Attainment | Women with Births | Births / 1,000 Women |
| Less than High School | 0 (0.0%) | 0.0 |
| High School Diploma | 0 (0.0%) | 0.0 |
| College or Associate's Degree | 78 (100.0%) | 336.0 |
| Bachelor's Degree | 0 (0.0%) | 0.0 |
| Graduate Degree | 0 (0.0%) | 0.0 |
| Total | 78 (100.0%) | 99.0 |
Fertility by Education by Marriage Status in Coleman
74.4% of women with births in Coleman are unmarried. Women with the educational attainment of college or associate's degree are most likely to be married with 25.6% of them married at childbirth, while women with the educational attainment of college or associate's degree are least likely to be married with 74.4% of them unmarried at childbirth.
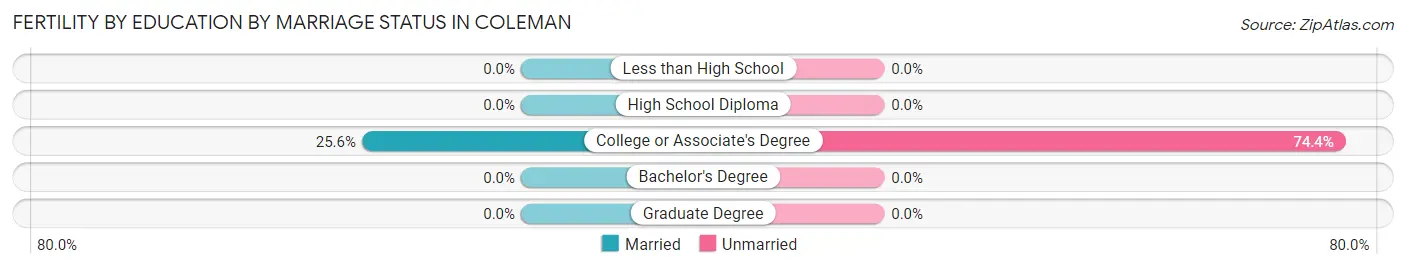
| Educational Attainment | Married | Unmarried |
| Less than High School | 0 (0.0%) | 0 (0.0%) |
| High School Diploma | 0 (0.0%) | 0 (0.0%) |
| College or Associate's Degree | 20 (25.6%) | 58 (74.4%) |
| Bachelor's Degree | 0 (0.0%) | 0 (0.0%) |
| Graduate Degree | 0 (0.0%) | 0 (0.0%) |
| Total | 20 (25.6%) | 58 (74.4%) |
Employment Characteristics in Coleman
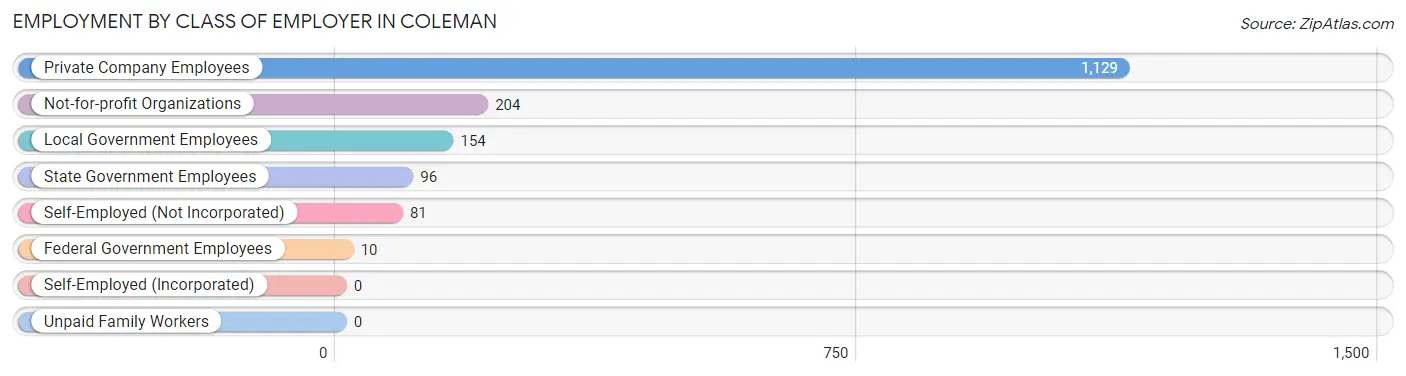
Employment by Class of Employer in Coleman
Among the 1,674 employed individuals in Coleman, private company employees (1,129 | 67.4%), not-for-profit organizations (204 | 12.2%), and local government employees (154 | 9.2%) make up the most common classes of employment.
| Employer Class | # Employees | % Employees |
| Private Company Employees | 1,129 | 67.4% |
| Self-Employed (Incorporated) | 0 | 0.0% |
| Self-Employed (Not Incorporated) | 81 | 4.8% |
| Not-for-profit Organizations | 204 | 12.2% |
| Local Government Employees | 154 | 9.2% |
| State Government Employees | 96 | 5.7% |
| Federal Government Employees | 10 | 0.6% |
| Unpaid Family Workers | 0 | 0.0% |
| Total | 1,674 | 100.0% |
Employment Status by Age in Coleman
According to the labor force statistics for Coleman, out of the total population over 16 years of age (3,061), 60.4% or 1,849 individuals are in the labor force, with 9.5% or 176 of them unemployed. The age group with the highest labor force participation rate is 55 to 59 years, with 100.0% or 305 individuals in the labor force. Within the labor force, the 55 to 59 years age range has the highest percentage of unemployed individuals, with 39.3% or 120 of them being unemployed.
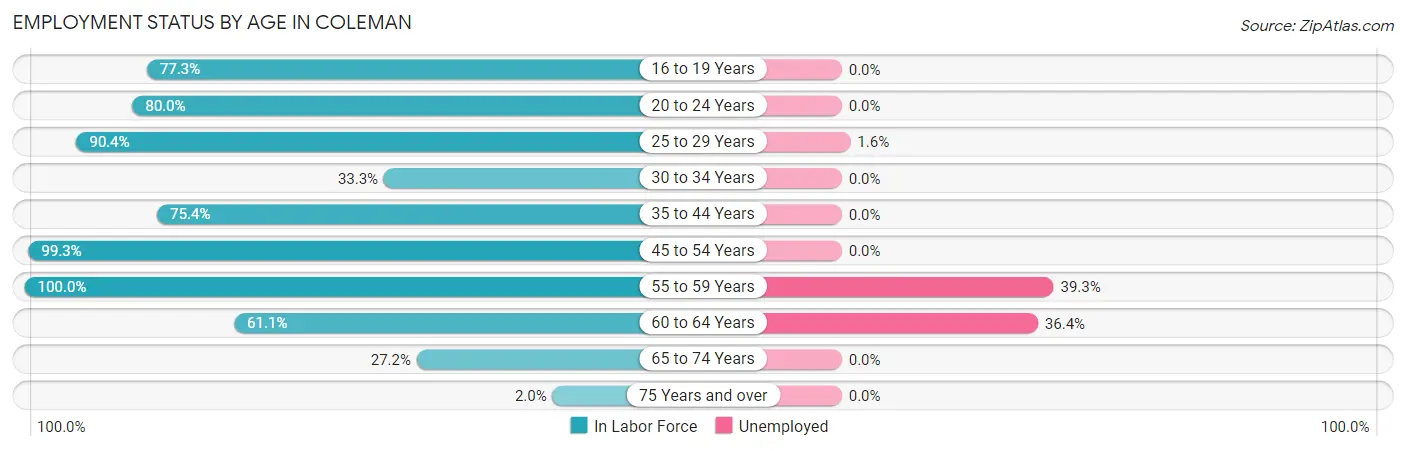
| Age Bracket | In Labor Force | Unemployed |
| 16 to 19 Years | 238 (77.3%) | 0 (0.0%) |
| 20 to 24 Years | 104 (80.0%) | 0 (0.0%) |
| 25 to 29 Years | 189 (90.4%) | 3 (1.6%) |
| 30 to 34 Years | 28 (33.3%) | 0 (0.0%) |
| 35 to 44 Years | 279 (75.4%) | 0 (0.0%) |
| 45 to 54 Years | 398 (99.3%) | 0 (0.0%) |
| 55 to 59 Years | 305 (100.0%) | 120 (39.3%) |
| 60 to 64 Years | 143 (61.1%) | 52 (36.4%) |
| 65 to 74 Years | 156 (27.2%) | 0 (0.0%) |
| 75 Years and over | 9 (2.0%) | 0 (0.0%) |
| Total | 1,849 (60.4%) | 176 (9.5%) |
Employment Status by Educational Attainment in Coleman
According to labor force statistics for Coleman, 83.7% of individuals (1,342) out of the total population between 25 and 64 years of age (1,603) are in the labor force, with 13.0% or 174 of them being unemployed. The group with the highest labor force participation rate are those with the educational attainment of less than high school, with 99.3% or 274 individuals in the labor force. Within the labor force, individuals with college / associate degree education have the highest percentage of unemployment, with 23.1% or 123 of them being unemployed.
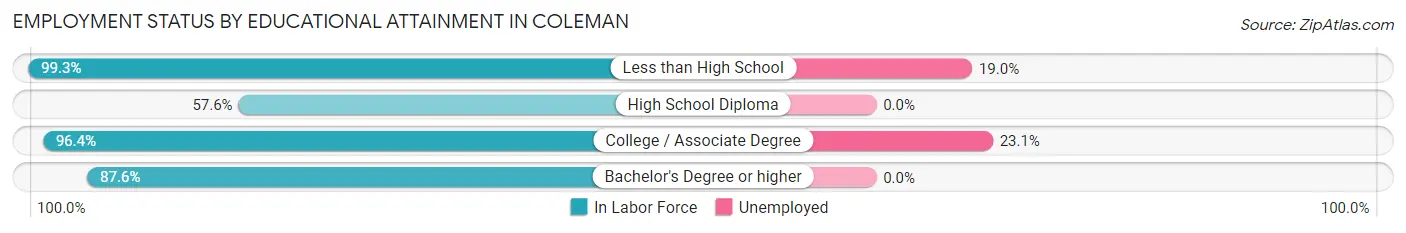
| Educational Attainment | In Labor Force | Unemployed |
| Less than High School | 274 (99.3%) | 52 (19.0%) |
| High School Diploma | 274 (57.6%) | 0 (0.0%) |
| College / Associate Degree | 532 (96.4%) | 128 (23.1%) |
| Bachelor's Degree or higher | 262 (87.6%) | 0 (0.0%) |
| Total | 1,342 (83.7%) | 208 (13.0%) |
Employment Occupations by Sex in Coleman
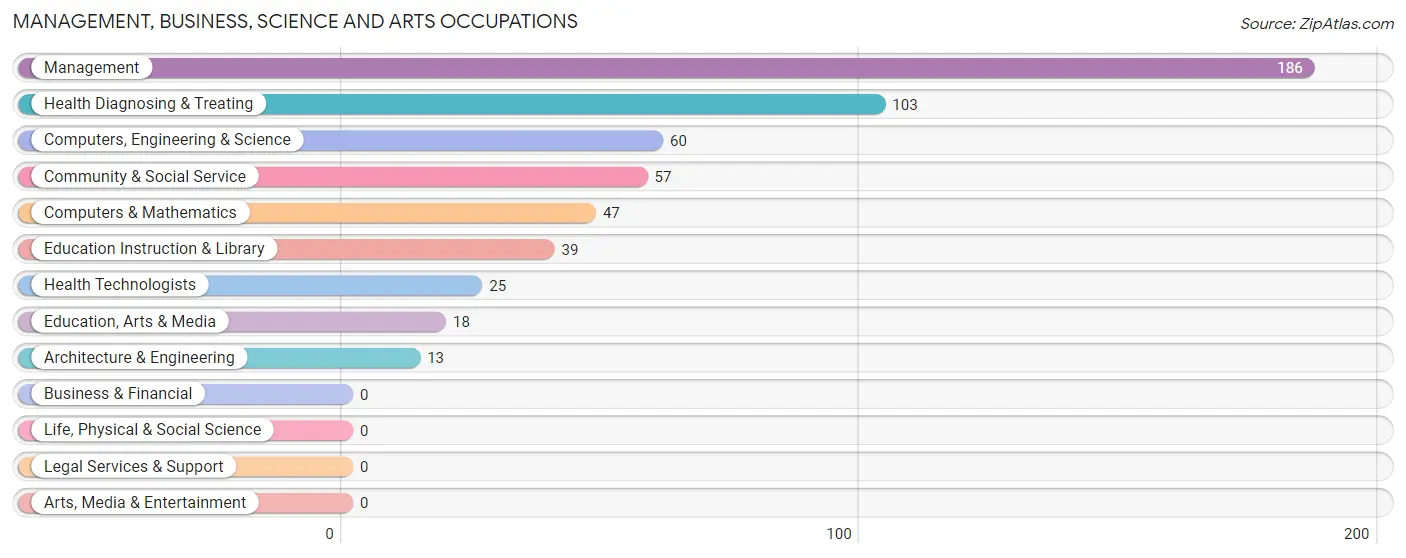
Management, Business, Science and Arts Occupations
The most common Management, Business, Science and Arts occupations in Coleman are Management (186 | 11.1%), Health Diagnosing & Treating (103 | 6.1%), Computers, Engineering & Science (60 | 3.6%), Community & Social Service (57 | 3.4%), and Computers & Mathematics (47 | 2.8%).
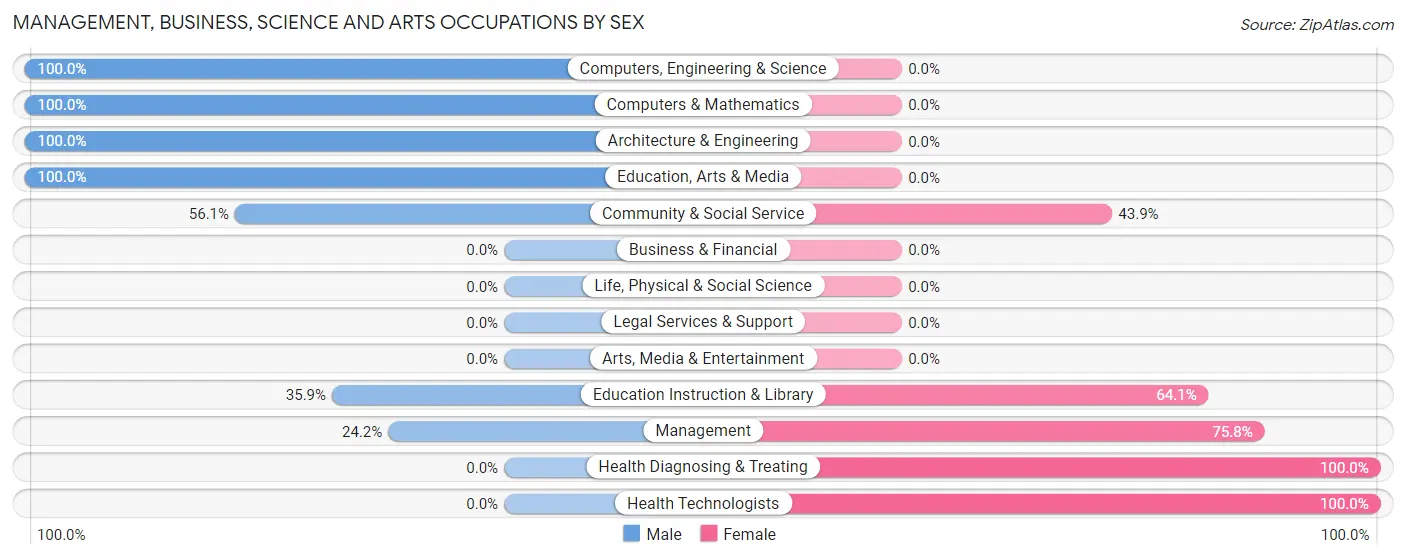
Management, Business, Science and Arts Occupations by Sex
Within the Management, Business, Science and Arts occupations in Coleman, the most male-oriented occupations are Computers, Engineering & Science (100.0%), Computers & Mathematics (100.0%), and Architecture & Engineering (100.0%), while the most female-oriented occupations are Health Diagnosing & Treating (100.0%), Health Technologists (100.0%), and Management (75.8%).
| Occupation | Male | Female |
| Management | 45 (24.2%) | 141 (75.8%) |
| Business & Financial | 0 (0.0%) | 0 (0.0%) |
| Computers, Engineering & Science | 60 (100.0%) | 0 (0.0%) |
| Computers & Mathematics | 47 (100.0%) | 0 (0.0%) |
| Architecture & Engineering | 13 (100.0%) | 0 (0.0%) |
| Life, Physical & Social Science | 0 (0.0%) | 0 (0.0%) |
| Community & Social Service | 32 (56.1%) | 25 (43.9%) |
| Education, Arts & Media | 18 (100.0%) | 0 (0.0%) |
| Legal Services & Support | 0 (0.0%) | 0 (0.0%) |
| Education Instruction & Library | 14 (35.9%) | 25 (64.1%) |
| Arts, Media & Entertainment | 0 (0.0%) | 0 (0.0%) |
| Health Diagnosing & Treating | 0 (0.0%) | 103 (100.0%) |
| Health Technologists | 0 (0.0%) | 25 (100.0%) |
| Total (Category) | 137 (33.7%) | 269 (66.3%) |
| Total (Overall) | 867 (51.8%) | 807 (48.2%) |
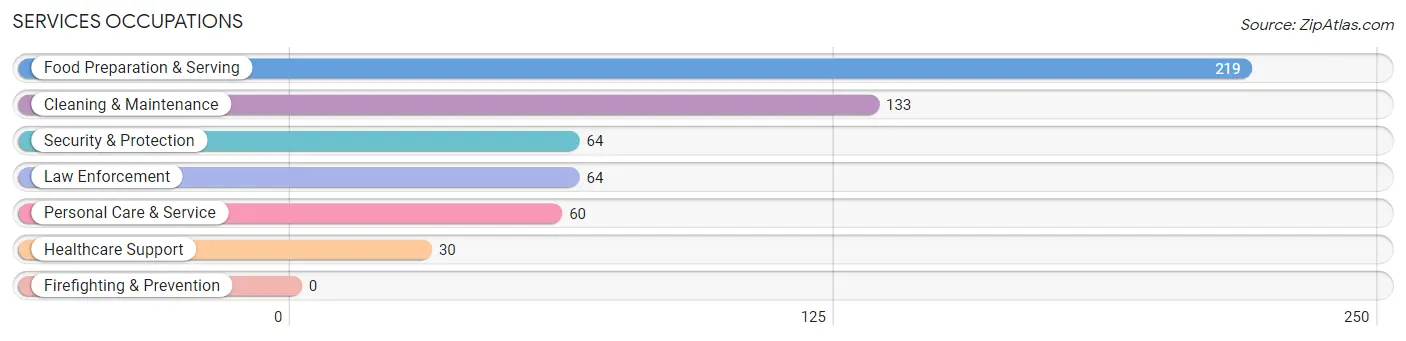
Services Occupations
The most common Services occupations in Coleman are Food Preparation & Serving (219 | 13.1%), Cleaning & Maintenance (133 | 8.0%), Security & Protection (64 | 3.8%), Law Enforcement (64 | 3.8%), and Personal Care & Service (60 | 3.6%).
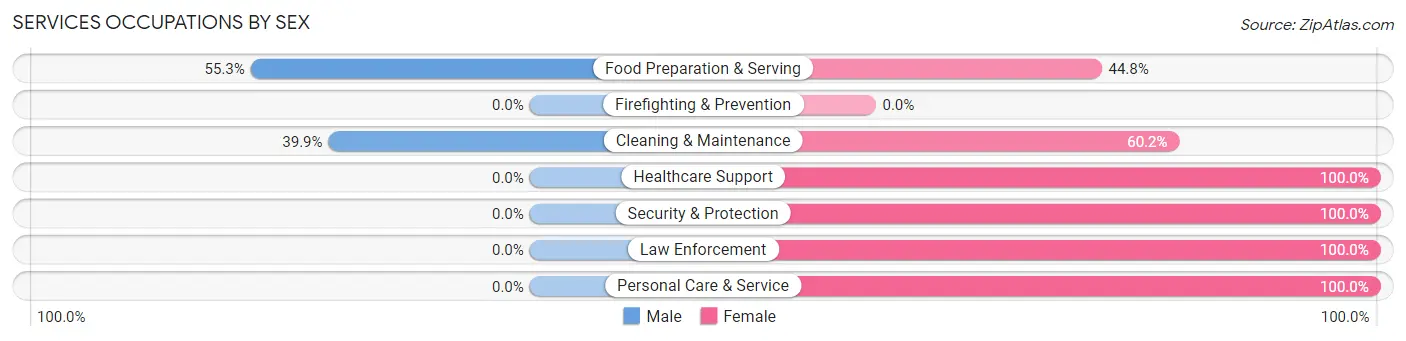
Services Occupations by Sex
Within the Services occupations in Coleman, the most male-oriented occupations are Food Preparation & Serving (55.2%), and Cleaning & Maintenance (39.9%), while the most female-oriented occupations are Healthcare Support (100.0%), Security & Protection (100.0%), and Law Enforcement (100.0%).
| Occupation | Male | Female |
| Healthcare Support | 0 (0.0%) | 30 (100.0%) |
| Security & Protection | 0 (0.0%) | 64 (100.0%) |
| Firefighting & Prevention | 0 (0.0%) | 0 (0.0%) |
| Law Enforcement | 0 (0.0%) | 64 (100.0%) |
| Food Preparation & Serving | 121 (55.2%) | 98 (44.8%) |
| Cleaning & Maintenance | 53 (39.9%) | 80 (60.2%) |
| Personal Care & Service | 0 (0.0%) | 60 (100.0%) |
| Total (Category) | 174 (34.4%) | 332 (65.6%) |
| Total (Overall) | 867 (51.8%) | 807 (48.2%) |
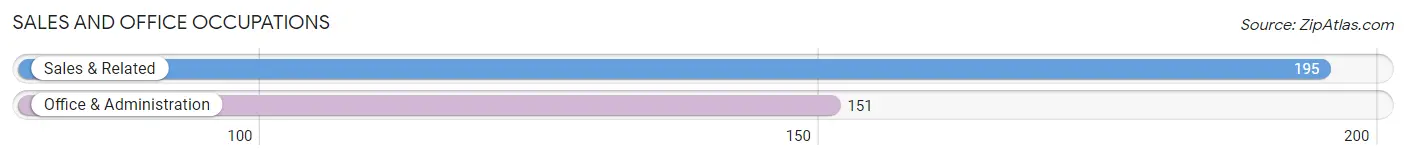
Sales and Office Occupations
The most common Sales and Office occupations in Coleman are Sales & Related (195 | 11.7%), and Office & Administration (151 | 9.0%).
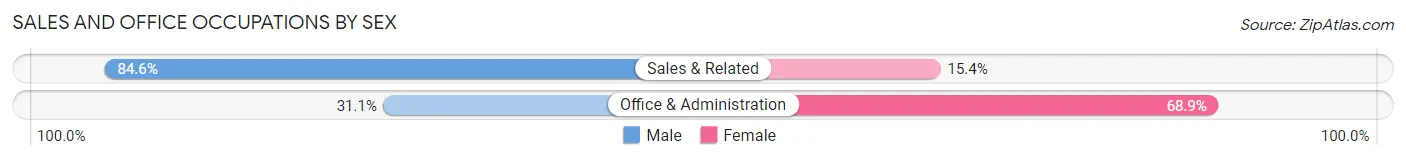
Sales and Office Occupations by Sex
| Occupation | Male | Female |
| Sales & Related | 165 (84.6%) | 30 (15.4%) |
| Office & Administration | 47 (31.1%) | 104 (68.9%) |
| Total (Category) | 212 (61.3%) | 134 (38.7%) |
| Total (Overall) | 867 (51.8%) | 807 (48.2%) |
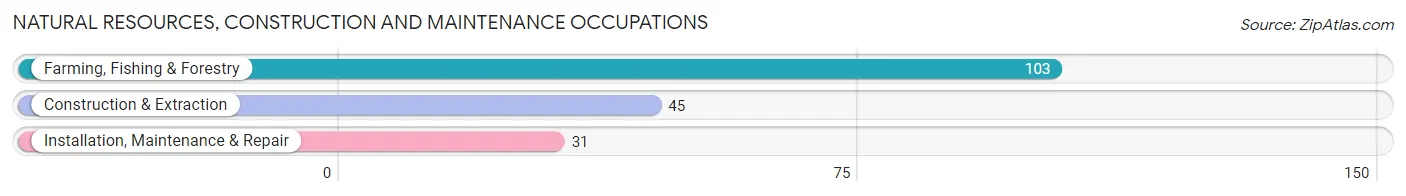
Natural Resources, Construction and Maintenance Occupations
The most common Natural Resources, Construction and Maintenance occupations in Coleman are Farming, Fishing & Forestry (103 | 6.1%), Construction & Extraction (45 | 2.7%), and Installation, Maintenance & Repair (31 | 1.8%).
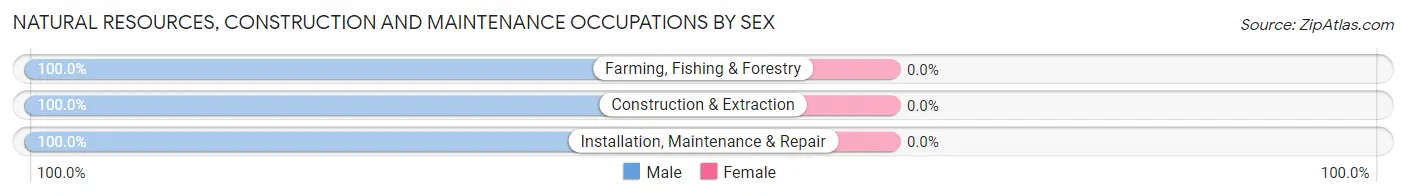
Natural Resources, Construction and Maintenance Occupations by Sex
| Occupation | Male | Female |
| Farming, Fishing & Forestry | 103 (100.0%) | 0 (0.0%) |
| Construction & Extraction | 45 (100.0%) | 0 (0.0%) |
| Installation, Maintenance & Repair | 31 (100.0%) | 0 (0.0%) |
| Total (Category) | 179 (100.0%) | 0 (0.0%) |
| Total (Overall) | 867 (51.8%) | 807 (48.2%) |
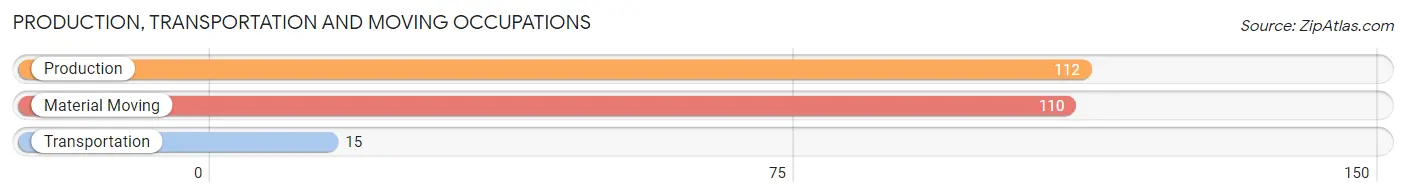
Production, Transportation and Moving Occupations
The most common Production, Transportation and Moving occupations in Coleman are Production (112 | 6.7%), Material Moving (110 | 6.6%), and Transportation (15 | 0.9%).
Production, Transportation and Moving Occupations by Sex
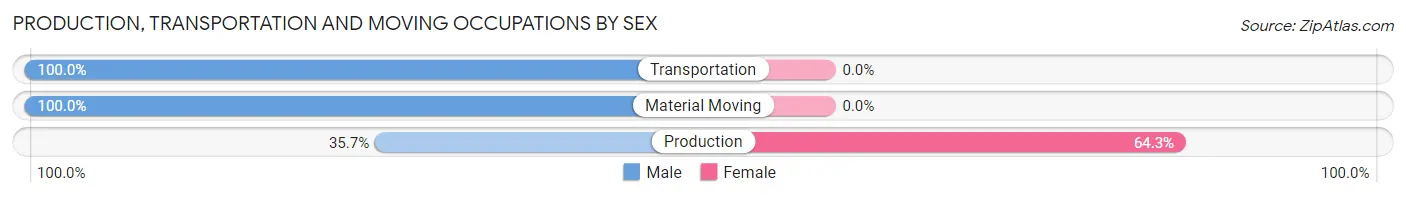
| Occupation | Male | Female |
| Production | 40 (35.7%) | 72 (64.3%) |
| Transportation | 15 (100.0%) | 0 (0.0%) |
| Material Moving | 110 (100.0%) | 0 (0.0%) |
| Total (Category) | 165 (69.6%) | 72 (30.4%) |
| Total (Overall) | 867 (51.8%) | 807 (48.2%) |
Employment Industries by Sex in Coleman
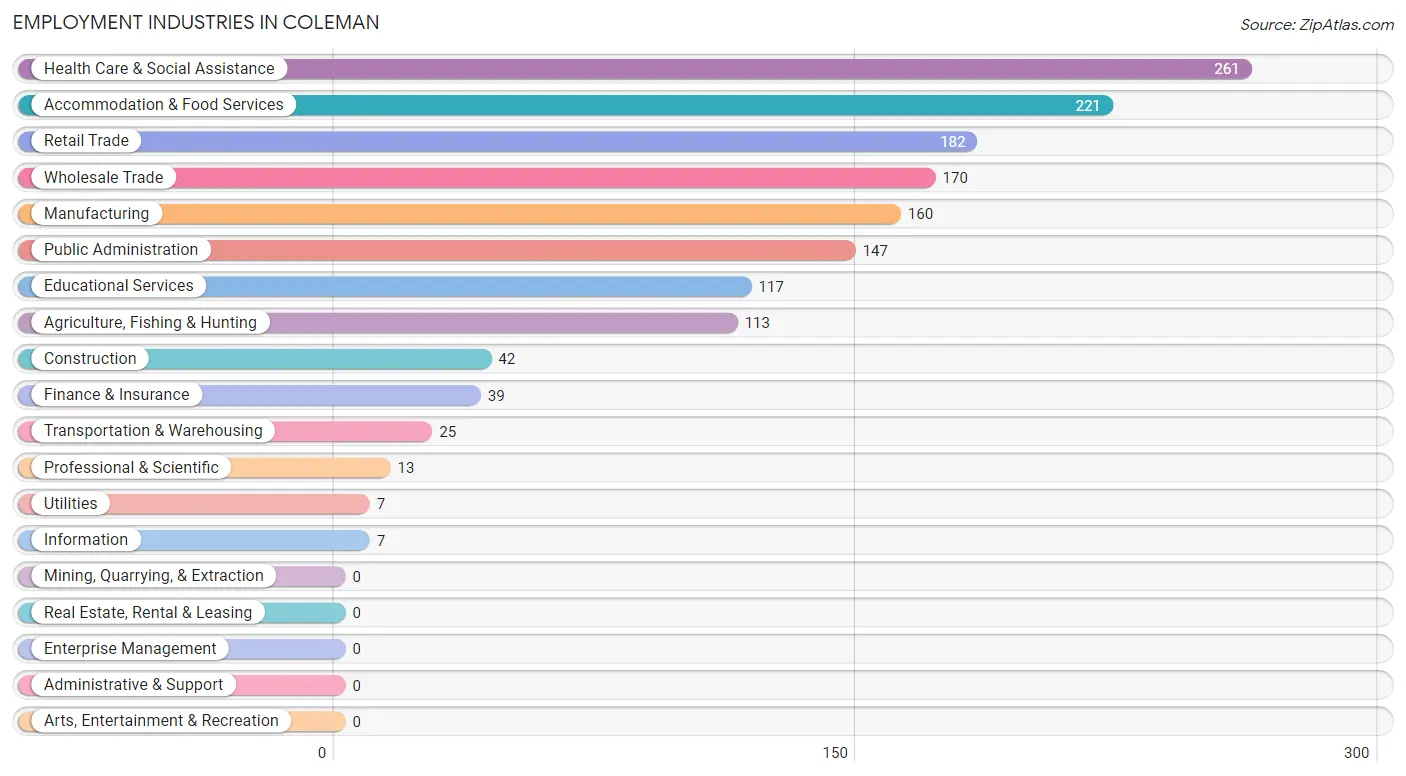
Employment Industries in Coleman
The major employment industries in Coleman include Health Care & Social Assistance (261 | 15.6%), Accommodation & Food Services (221 | 13.2%), Retail Trade (182 | 10.9%), Wholesale Trade (170 | 10.2%), and Manufacturing (160 | 9.6%).
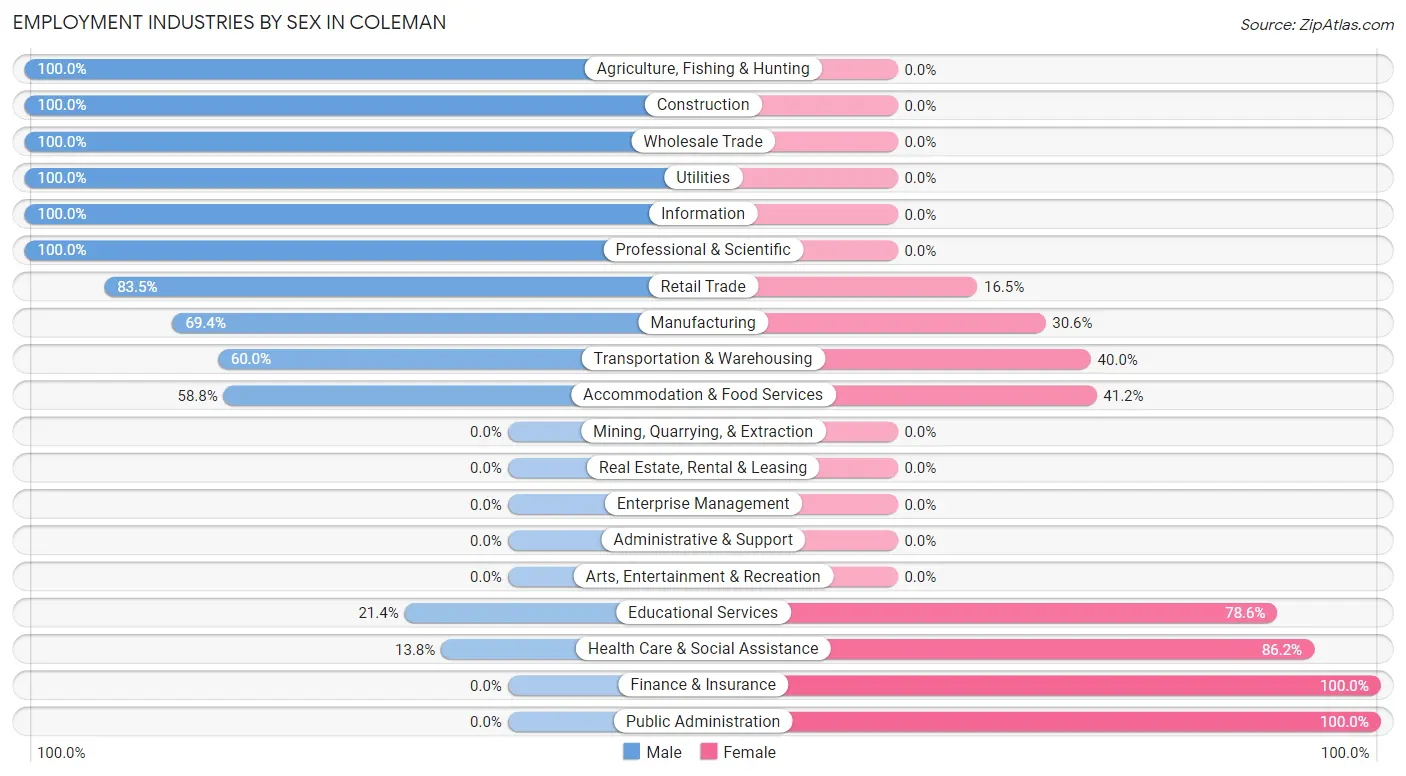
Employment Industries by Sex in Coleman
The Coleman industries that see more men than women are Agriculture, Fishing & Hunting (100.0%), Construction (100.0%), and Wholesale Trade (100.0%), whereas the industries that tend to have a higher number of women are Finance & Insurance (100.0%), Public Administration (100.0%), and Health Care & Social Assistance (86.2%).
| Industry | Male | Female |
| Agriculture, Fishing & Hunting | 113 (100.0%) | 0 (0.0%) |
| Mining, Quarrying, & Extraction | 0 (0.0%) | 0 (0.0%) |
| Construction | 42 (100.0%) | 0 (0.0%) |
| Manufacturing | 111 (69.4%) | 49 (30.6%) |
| Wholesale Trade | 170 (100.0%) | 0 (0.0%) |
| Retail Trade | 152 (83.5%) | 30 (16.5%) |
| Transportation & Warehousing | 15 (60.0%) | 10 (40.0%) |
| Utilities | 7 (100.0%) | 0 (0.0%) |
| Information | 7 (100.0%) | 0 (0.0%) |
| Finance & Insurance | 0 (0.0%) | 39 (100.0%) |
| Real Estate, Rental & Leasing | 0 (0.0%) | 0 (0.0%) |
| Professional & Scientific | 13 (100.0%) | 0 (0.0%) |
| Enterprise Management | 0 (0.0%) | 0 (0.0%) |
| Administrative & Support | 0 (0.0%) | 0 (0.0%) |
| Educational Services | 25 (21.4%) | 92 (78.6%) |
| Health Care & Social Assistance | 36 (13.8%) | 225 (86.2%) |
| Arts, Entertainment & Recreation | 0 (0.0%) | 0 (0.0%) |
| Accommodation & Food Services | 130 (58.8%) | 91 (41.2%) |
| Public Administration | 0 (0.0%) | 147 (100.0%) |
| Total | 867 (51.8%) | 807 (48.2%) |
Education in Coleman
School Enrollment in Coleman
The most common levels of schooling among the 818 students in Coleman are high school (276 | 33.7%), middle school (185 | 22.6%), and nursery / preschool (179 | 21.9%).
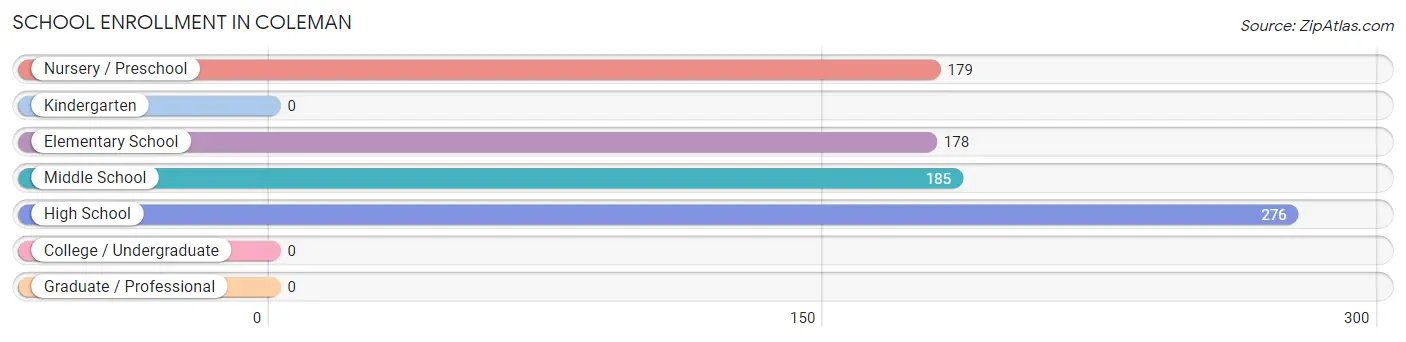
| School Level | # Students | % Students |
| Nursery / Preschool | 179 | 21.9% |
| Kindergarten | 0 | 0.0% |
| Elementary School | 178 | 21.8% |
| Middle School | 185 | 22.6% |
| High School | 276 | 33.7% |
| College / Undergraduate | 0 | 0.0% |
| Graduate / Professional | 0 | 0.0% |
| Total | 818 | 100.0% |
School Enrollment by Age by Funding Source in Coleman
Out of a total of 818 students who are enrolled in schools in Coleman, 28 (3.4%) attend a private institution, while the remaining 790 (96.6%) are enrolled in public schools. The age group of 3 to 4 year olds has the highest likelihood of being enrolled in private schools, with 28 (31.5% in the age bracket) enrolled. Conversely, the age group of 5 to 9 year old has the lowest likelihood of being enrolled in a private school, with 194 (100.0% in the age bracket) attending a public institution.
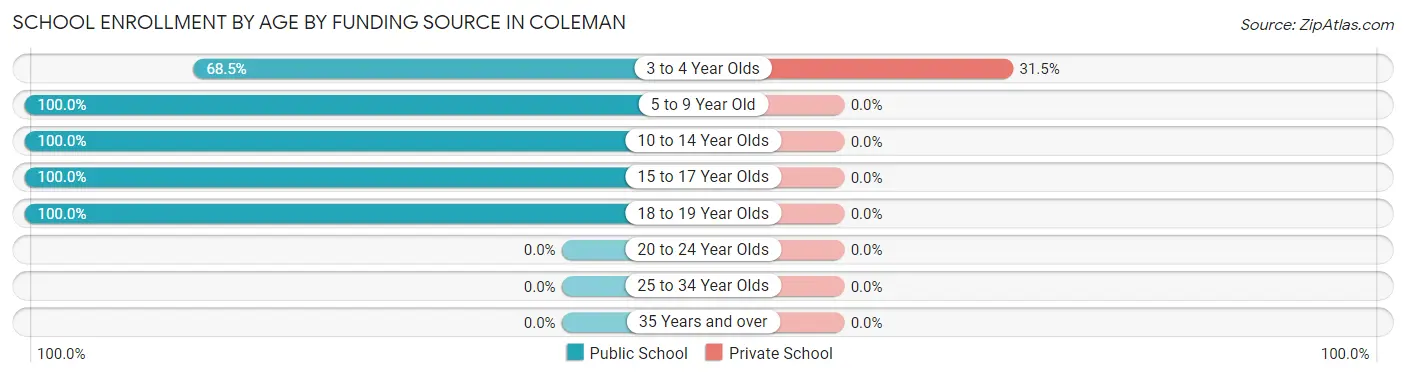
| Age Bracket | Public School | Private School |
| 3 to 4 Year Olds | 61 (68.5%) | 28 (31.5%) |
| 5 to 9 Year Old | 194 (100.0%) | 0 (0.0%) |
| 10 to 14 Year Olds | 313 (100.0%) | 0 (0.0%) |
| 15 to 17 Year Olds | 200 (100.0%) | 0 (0.0%) |
| 18 to 19 Year Olds | 22 (100.0%) | 0 (0.0%) |
| 20 to 24 Year Olds | 0 (0.0%) | 0 (0.0%) |
| 25 to 34 Year Olds | 0 (0.0%) | 0 (0.0%) |
| 35 Years and over | 0 (0.0%) | 0 (0.0%) |
| Total | 790 (96.6%) | 28 (3.4%) |
Educational Attainment by Field of Study in Coleman
Physical & health sciences (70 | 16.1%), bio, nature & agricultural (69 | 15.9%), communications (52 | 11.9%), arts & humanities (51 | 11.7%), and social sciences (48 | 11.0%) are the most common fields of study among 435 individuals in Coleman who have obtained a bachelor's degree or higher.
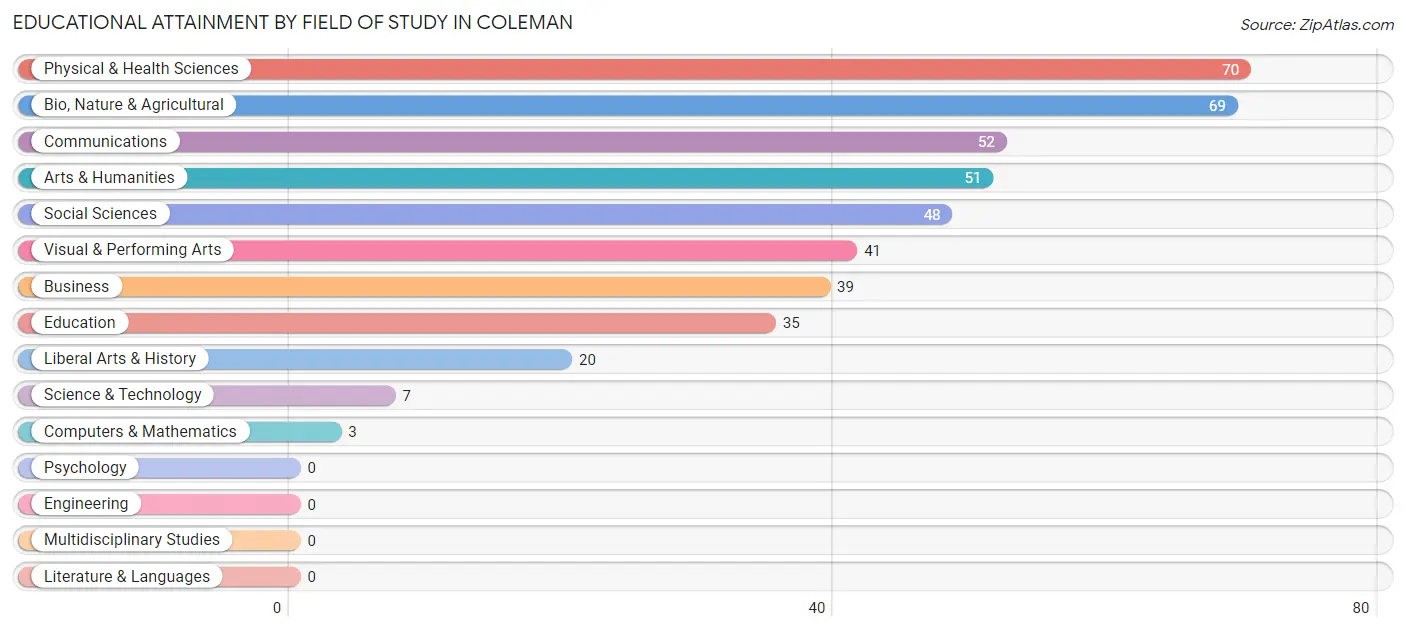
| Field of Study | # Graduates | % Graduates |
| Computers & Mathematics | 3 | 0.7% |
| Bio, Nature & Agricultural | 69 | 15.9% |
| Physical & Health Sciences | 70 | 16.1% |
| Psychology | 0 | 0.0% |
| Social Sciences | 48 | 11.0% |
| Engineering | 0 | 0.0% |
| Multidisciplinary Studies | 0 | 0.0% |
| Science & Technology | 7 | 1.6% |
| Business | 39 | 9.0% |
| Education | 35 | 8.1% |
| Literature & Languages | 0 | 0.0% |
| Liberal Arts & History | 20 | 4.6% |
| Visual & Performing Arts | 41 | 9.4% |
| Communications | 52 | 11.9% |
| Arts & Humanities | 51 | 11.7% |
| Total | 435 | 100.0% |
Transportation & Commute in Coleman
Vehicle Availability by Sex in Coleman
The most prevalent vehicle ownership categories in Coleman are males with 2 vehicles (455, accounting for 52.5%) and females with 2 vehicles (394, making up 56.4%).
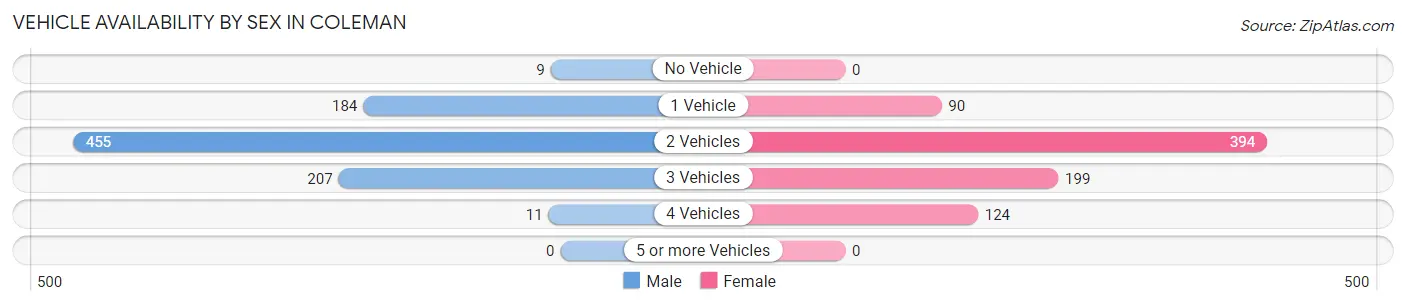
| Vehicles Available | Male | Female |
| No Vehicle | 9 (1.0%) | 0 (0.0%) |
| 1 Vehicle | 184 (21.2%) | 90 (11.2%) |
| 2 Vehicles | 455 (52.5%) | 394 (48.8%) |
| 3 Vehicles | 207 (23.9%) | 199 (24.7%) |
| 4 Vehicles | 11 (1.3%) | 124 (15.4%) |
| 5 or more Vehicles | 0 (0.0%) | 0 (0.0%) |
| Total | 866 (100.0%) | 807 (100.0%) |
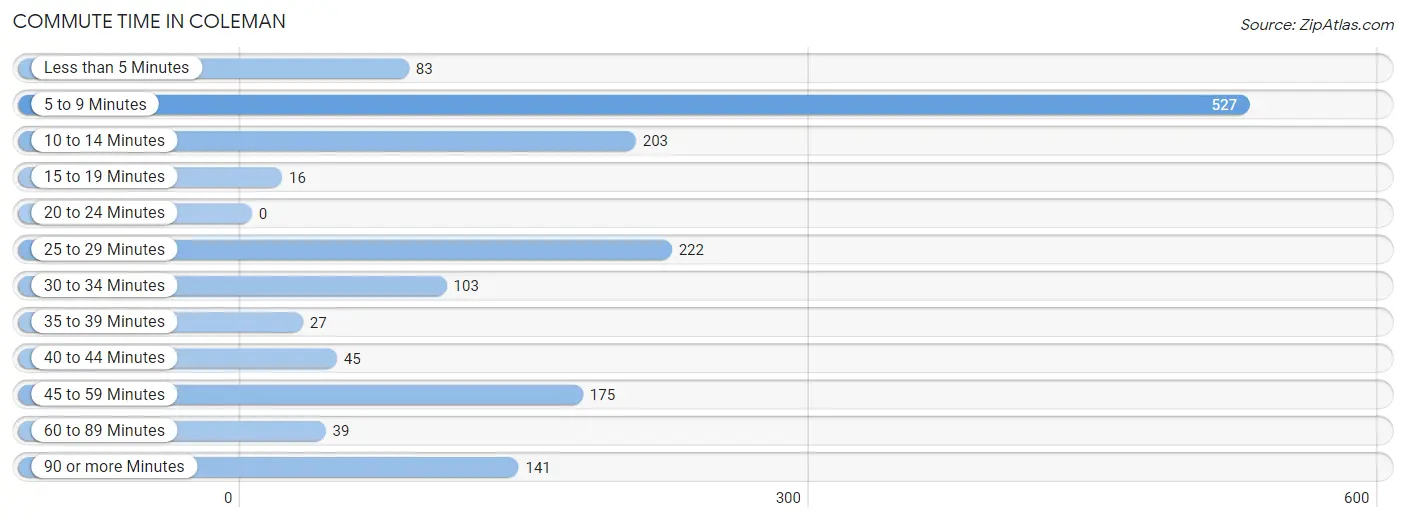
Commute Time in Coleman
The most frequently occuring commute durations in Coleman are 5 to 9 minutes (527 commuters, 33.3%), 25 to 29 minutes (222 commuters, 14.0%), and 10 to 14 minutes (203 commuters, 12.8%).
| Commute Time | # Commuters | % Commuters |
| Less than 5 Minutes | 83 | 5.2% |
| 5 to 9 Minutes | 527 | 33.3% |
| 10 to 14 Minutes | 203 | 12.8% |
| 15 to 19 Minutes | 16 | 1.0% |
| 20 to 24 Minutes | 0 | 0.0% |
| 25 to 29 Minutes | 222 | 14.0% |
| 30 to 34 Minutes | 103 | 6.5% |
| 35 to 39 Minutes | 27 | 1.7% |
| 40 to 44 Minutes | 45 | 2.9% |
| 45 to 59 Minutes | 175 | 11.1% |
| 60 to 89 Minutes | 39 | 2.5% |
| 90 or more Minutes | 141 | 8.9% |
Commute Time by Sex in Coleman
The most common commute times in Coleman are 5 to 9 minutes (238 commuters, 29.9%) for males and 5 to 9 minutes (289 commuters, 36.9%) for females.
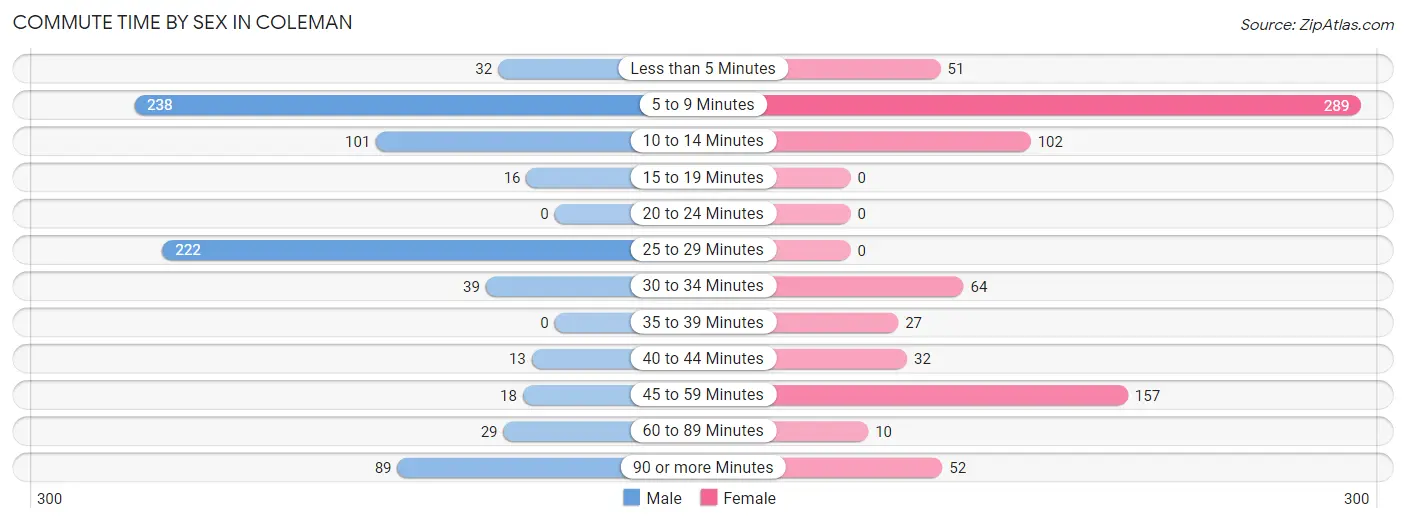
| Commute Time | Male | Female |
| Less than 5 Minutes | 32 (4.0%) | 51 (6.5%) |
| 5 to 9 Minutes | 238 (29.9%) | 289 (36.9%) |
| 10 to 14 Minutes | 101 (12.7%) | 102 (13.0%) |
| 15 to 19 Minutes | 16 (2.0%) | 0 (0.0%) |
| 20 to 24 Minutes | 0 (0.0%) | 0 (0.0%) |
| 25 to 29 Minutes | 222 (27.9%) | 0 (0.0%) |
| 30 to 34 Minutes | 39 (4.9%) | 64 (8.2%) |
| 35 to 39 Minutes | 0 (0.0%) | 27 (3.4%) |
| 40 to 44 Minutes | 13 (1.6%) | 32 (4.1%) |
| 45 to 59 Minutes | 18 (2.3%) | 157 (20.0%) |
| 60 to 89 Minutes | 29 (3.6%) | 10 (1.3%) |
| 90 or more Minutes | 89 (11.2%) | 52 (6.6%) |
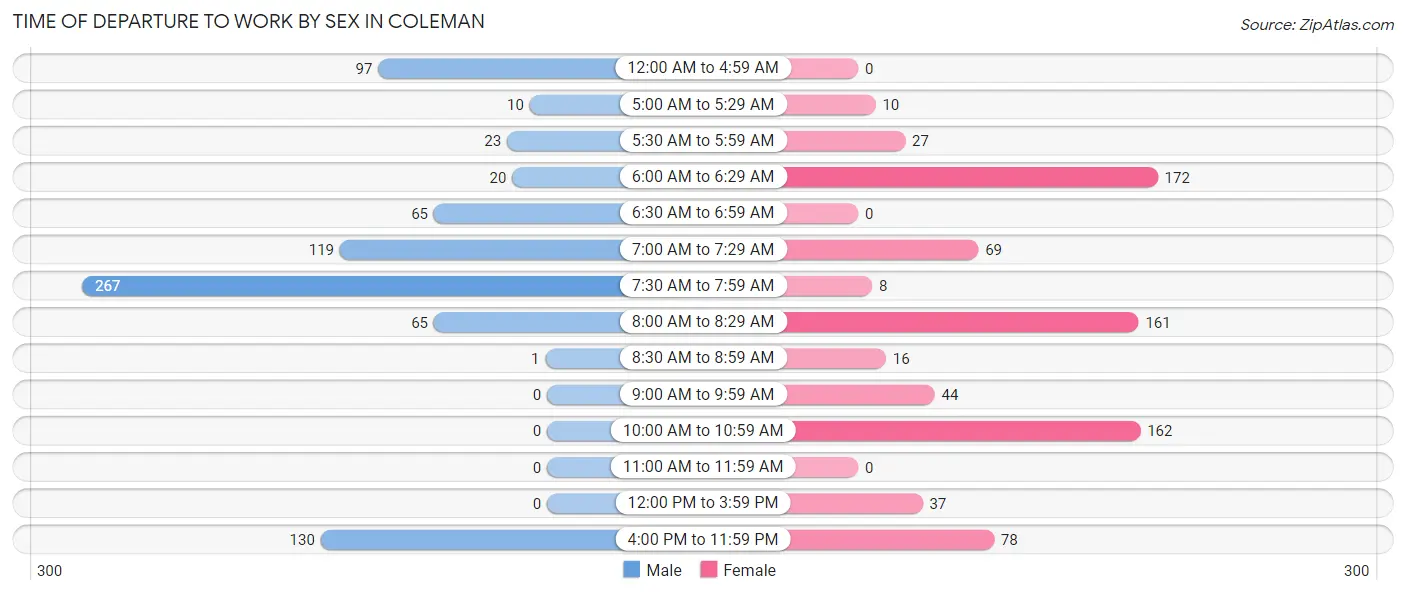
Time of Departure to Work by Sex in Coleman
The most frequent times of departure to work in Coleman are 7:30 AM to 7:59 AM (267, 33.5%) for males and 6:00 AM to 6:29 AM (172, 21.9%) for females.
| Time of Departure | Male | Female |
| 12:00 AM to 4:59 AM | 97 (12.2%) | 0 (0.0%) |
| 5:00 AM to 5:29 AM | 10 (1.3%) | 10 (1.3%) |
| 5:30 AM to 5:59 AM | 23 (2.9%) | 27 (3.4%) |
| 6:00 AM to 6:29 AM | 20 (2.5%) | 172 (21.9%) |
| 6:30 AM to 6:59 AM | 65 (8.2%) | 0 (0.0%) |
| 7:00 AM to 7:29 AM | 119 (14.9%) | 69 (8.8%) |
| 7:30 AM to 7:59 AM | 267 (33.5%) | 8 (1.0%) |
| 8:00 AM to 8:29 AM | 65 (8.2%) | 161 (20.5%) |
| 8:30 AM to 8:59 AM | 1 (0.1%) | 16 (2.0%) |
| 9:00 AM to 9:59 AM | 0 (0.0%) | 44 (5.6%) |
| 10:00 AM to 10:59 AM | 0 (0.0%) | 162 (20.7%) |
| 11:00 AM to 11:59 AM | 0 (0.0%) | 0 (0.0%) |
| 12:00 PM to 3:59 PM | 0 (0.0%) | 37 (4.7%) |
| 4:00 PM to 11:59 PM | 130 (16.3%) | 78 (10.0%) |
| Total | 797 (100.0%) | 784 (100.0%) |
Housing Occupancy in Coleman
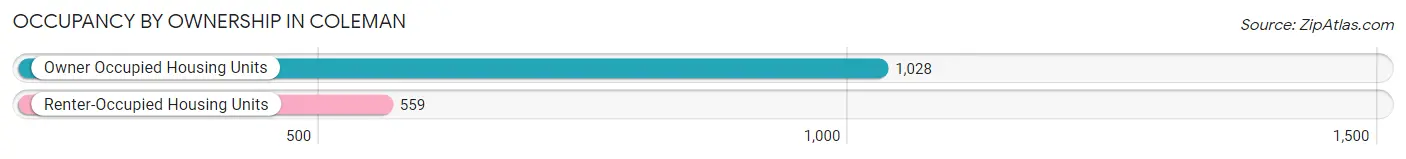
Occupancy by Ownership in Coleman
Of the total 1,587 dwellings in Coleman, owner-occupied units account for 1,028 (64.8%), while renter-occupied units make up 559 (35.2%).
| Occupancy | # Housing Units | % Housing Units |
| Owner Occupied Housing Units | 1,028 | 64.8% |
| Renter-Occupied Housing Units | 559 | 35.2% |
| Total Occupied Housing Units | 1,587 | 100.0% |
Occupancy by Household Size in Coleman
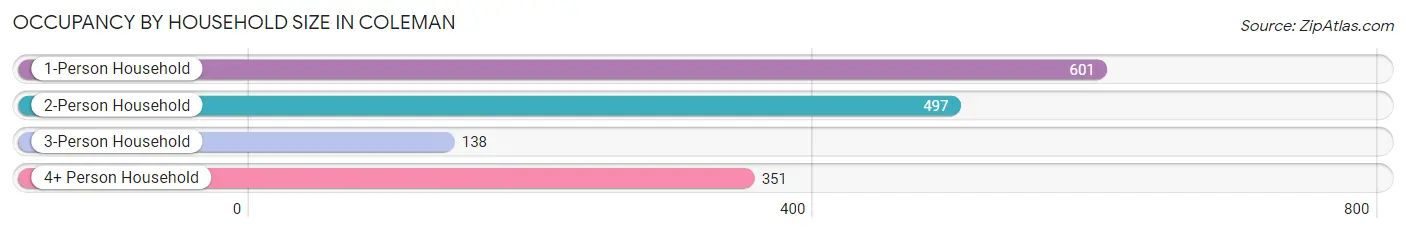
| Household Size | # Housing Units | % Housing Units |
| 1-Person Household | 601 | 37.9% |
| 2-Person Household | 497 | 31.3% |
| 3-Person Household | 138 | 8.7% |
| 4+ Person Household | 351 | 22.1% |
| Total Housing Units | 1,587 | 100.0% |
Occupancy by Ownership by Household Size in Coleman
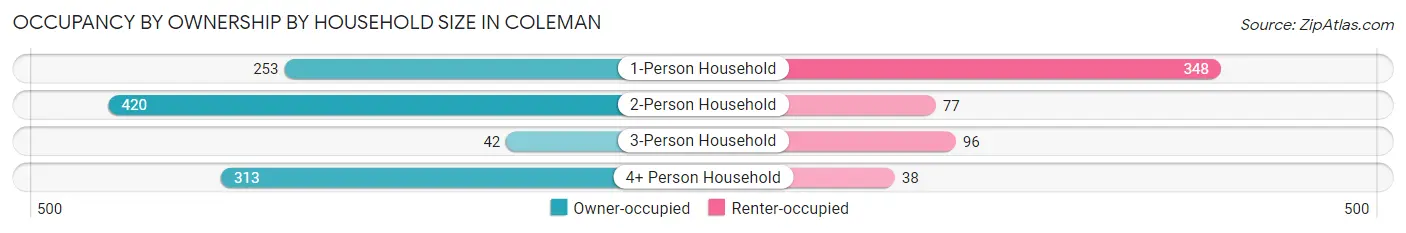
| Household Size | Owner-occupied | Renter-occupied |
| 1-Person Household | 253 (42.1%) | 348 (57.9%) |
| 2-Person Household | 420 (84.5%) | 77 (15.5%) |
| 3-Person Household | 42 (30.4%) | 96 (69.6%) |
| 4+ Person Household | 313 (89.2%) | 38 (10.8%) |
| Total Housing Units | 1,028 (64.8%) | 559 (35.2%) |
Occupancy by Educational Attainment in Coleman
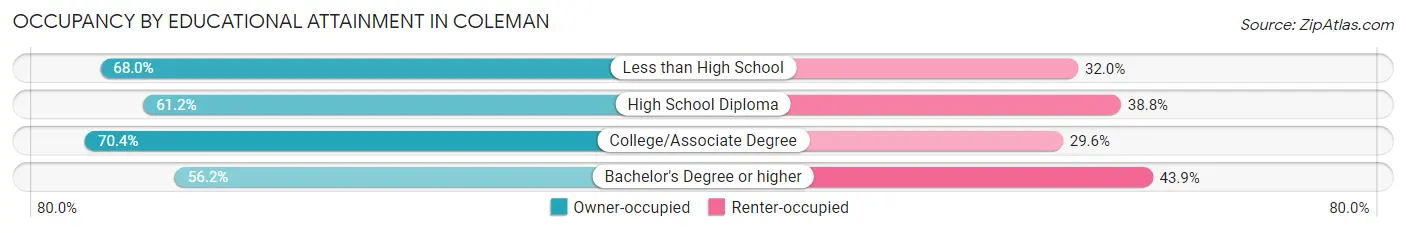
| Household Size | Owner-occupied | Renter-occupied |
| Less than High School | 138 (68.0%) | 65 (32.0%) |
| High School Diploma | 260 (61.2%) | 165 (38.8%) |
| College/Associate Degree | 452 (70.4%) | 190 (29.6%) |
| Bachelor's Degree or higher | 178 (56.1%) | 139 (43.9%) |
Occupancy by Age of Householder in Coleman
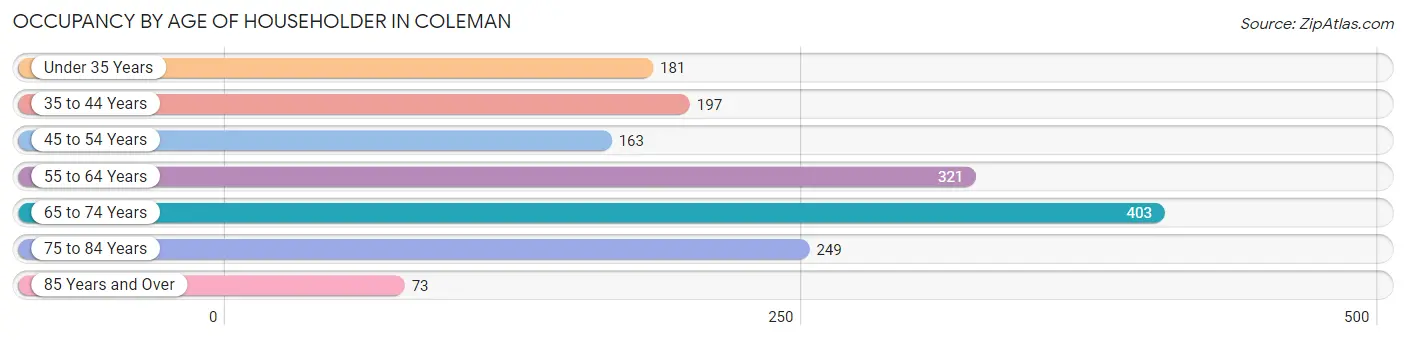
| Age Bracket | # Households | % Households |
| Under 35 Years | 181 | 11.4% |
| 35 to 44 Years | 197 | 12.4% |
| 45 to 54 Years | 163 | 10.3% |
| 55 to 64 Years | 321 | 20.2% |
| 65 to 74 Years | 403 | 25.4% |
| 75 to 84 Years | 249 | 15.7% |
| 85 Years and Over | 73 | 4.6% |
| Total | 1,587 | 100.0% |
Housing Finances in Coleman
Median Income by Occupancy in Coleman
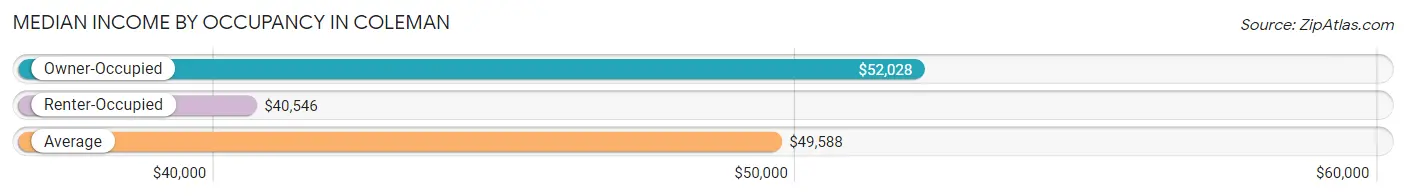
| Occupancy Type | # Households | Median Income |
| Owner-Occupied | 1,028 (64.8%) | $52,028 |
| Renter-Occupied | 559 (35.2%) | $40,546 |
| Average | 1,587 (100.0%) | $49,588 |
Occupancy by Householder Income Bracket in Coleman
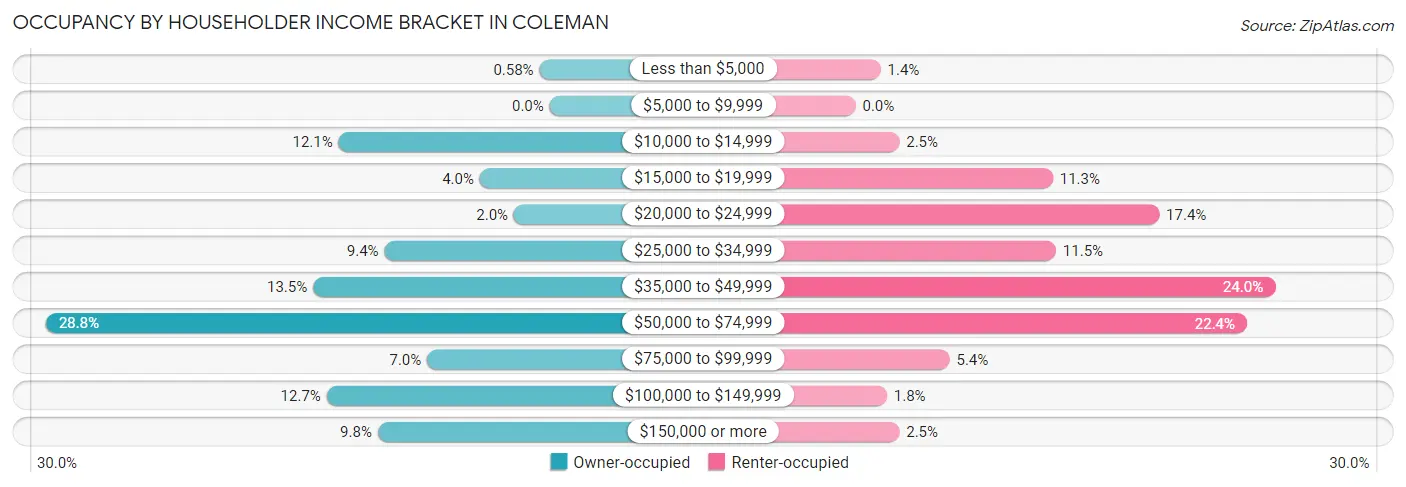
| Income Bracket | Owner-occupied | Renter-occupied |
| Less than $5,000 | 6 (0.6%) | 8 (1.4%) |
| $5,000 to $9,999 | 0 (0.0%) | 0 (0.0%) |
| $10,000 to $14,999 | 124 (12.1%) | 14 (2.5%) |
| $15,000 to $19,999 | 41 (4.0%) | 63 (11.3%) |
| $20,000 to $24,999 | 21 (2.0%) | 97 (17.3%) |
| $25,000 to $34,999 | 97 (9.4%) | 64 (11.5%) |
| $35,000 to $49,999 | 139 (13.5%) | 134 (24.0%) |
| $50,000 to $74,999 | 296 (28.8%) | 125 (22.4%) |
| $75,000 to $99,999 | 72 (7.0%) | 30 (5.4%) |
| $100,000 to $149,999 | 131 (12.7%) | 10 (1.8%) |
| $150,000 or more | 101 (9.8%) | 14 (2.5%) |
| Total | 1,028 (100.0%) | 559 (100.0%) |
Monthly Housing Cost Tiers in Coleman
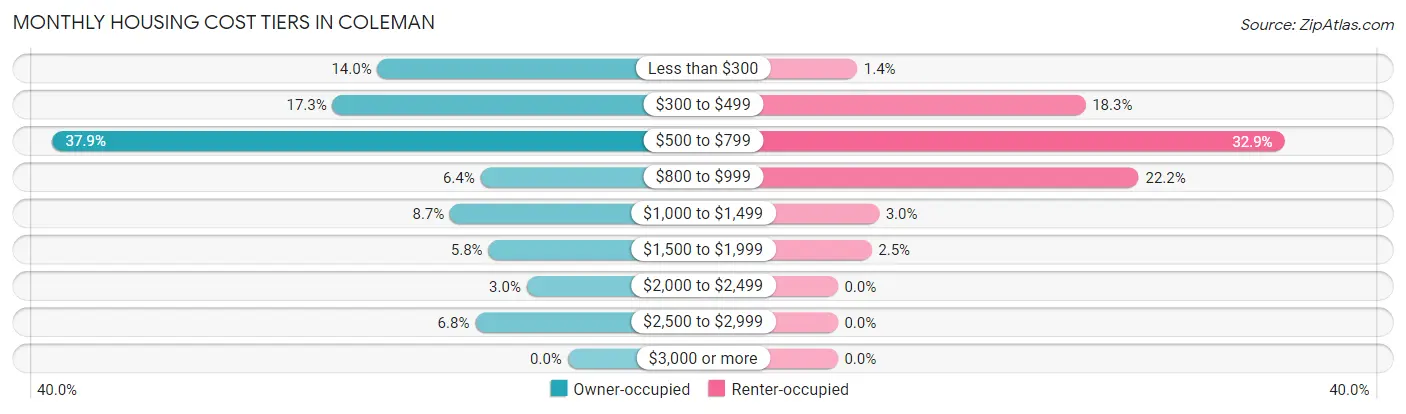
| Monthly Cost | Owner-occupied | Renter-occupied |
| Less than $300 | 144 (14.0%) | 8 (1.4%) |
| $300 to $499 | 178 (17.3%) | 102 (18.2%) |
| $500 to $799 | 390 (37.9%) | 184 (32.9%) |
| $800 to $999 | 66 (6.4%) | 124 (22.2%) |
| $1,000 to $1,499 | 89 (8.7%) | 17 (3.0%) |
| $1,500 to $1,999 | 60 (5.8%) | 14 (2.5%) |
| $2,000 to $2,499 | 31 (3.0%) | 0 (0.0%) |
| $2,500 to $2,999 | 70 (6.8%) | 0 (0.0%) |
| $3,000 or more | 0 (0.0%) | 0 (0.0%) |
| Total | 1,028 (100.0%) | 559 (100.0%) |
Physical Housing Characteristics in Coleman
Housing Structures in Coleman
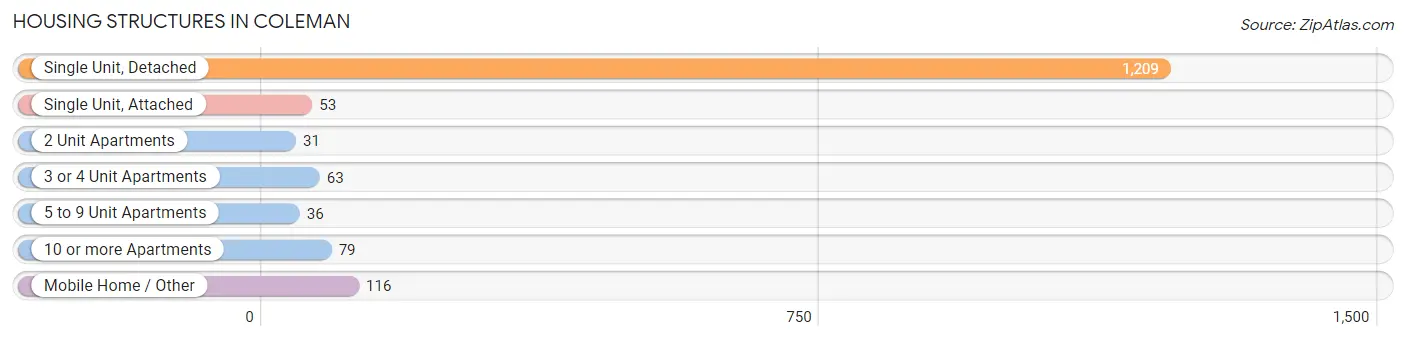
| Structure Type | # Housing Units | % Housing Units |
| Single Unit, Detached | 1,209 | 76.2% |
| Single Unit, Attached | 53 | 3.3% |
| 2 Unit Apartments | 31 | 1.9% |
| 3 or 4 Unit Apartments | 63 | 4.0% |
| 5 to 9 Unit Apartments | 36 | 2.3% |
| 10 or more Apartments | 79 | 5.0% |
| Mobile Home / Other | 116 | 7.3% |
| Total | 1,587 | 100.0% |
Housing Structures by Occupancy in Coleman
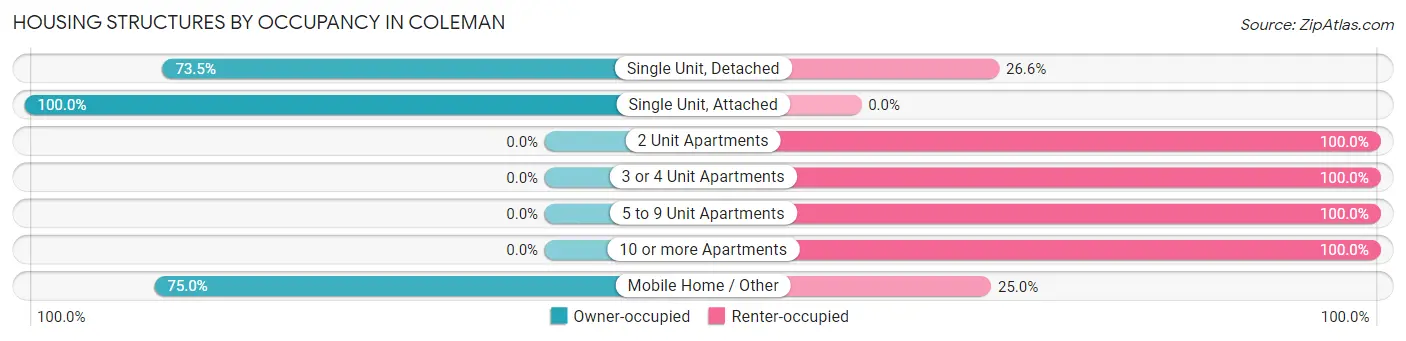
| Structure Type | Owner-occupied | Renter-occupied |
| Single Unit, Detached | 888 (73.5%) | 321 (26.6%) |
| Single Unit, Attached | 53 (100.0%) | 0 (0.0%) |
| 2 Unit Apartments | 0 (0.0%) | 31 (100.0%) |
| 3 or 4 Unit Apartments | 0 (0.0%) | 63 (100.0%) |
| 5 to 9 Unit Apartments | 0 (0.0%) | 36 (100.0%) |
| 10 or more Apartments | 0 (0.0%) | 79 (100.0%) |
| Mobile Home / Other | 87 (75.0%) | 29 (25.0%) |
| Total | 1,028 (64.8%) | 559 (35.2%) |
Housing Structures by Number of Rooms in Coleman
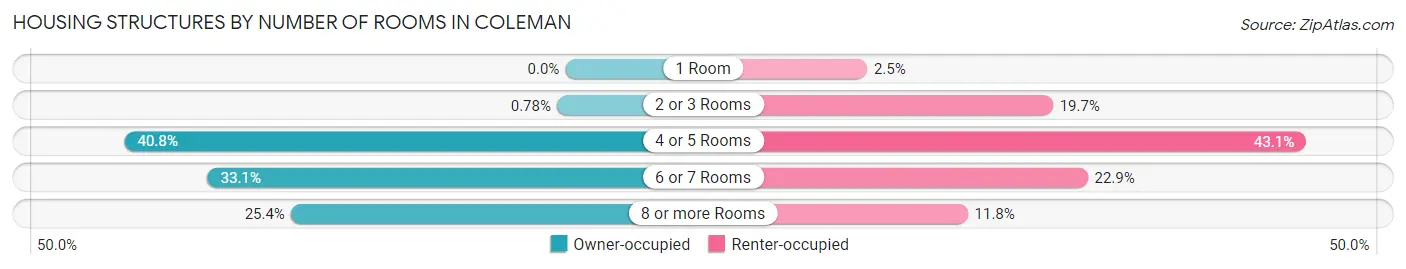
| Number of Rooms | Owner-occupied | Renter-occupied |
| 1 Room | 0 (0.0%) | 14 (2.5%) |
| 2 or 3 Rooms | 8 (0.8%) | 110 (19.7%) |
| 4 or 5 Rooms | 419 (40.8%) | 241 (43.1%) |
| 6 or 7 Rooms | 340 (33.1%) | 128 (22.9%) |
| 8 or more Rooms | 261 (25.4%) | 66 (11.8%) |
| Total | 1,028 (100.0%) | 559 (100.0%) |
Housing Structure by Heating Type in Coleman
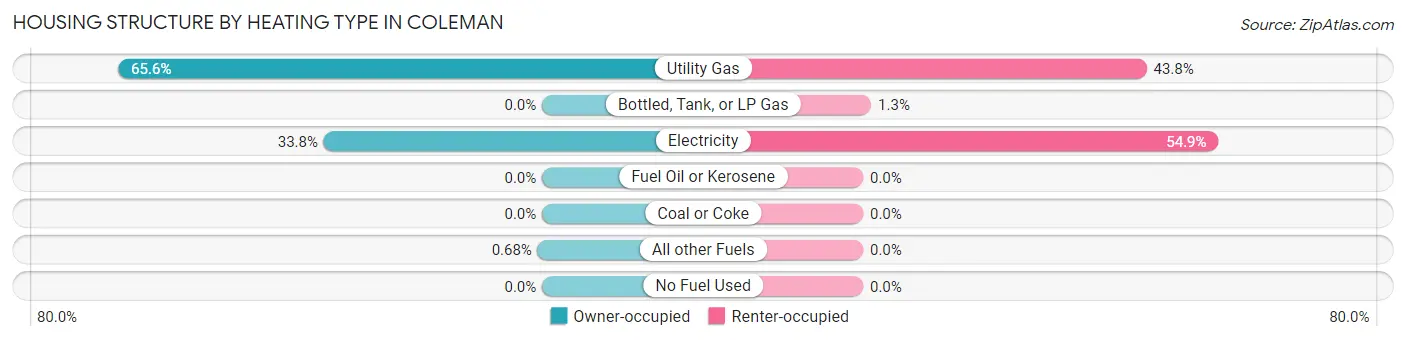
| Heating Type | Owner-occupied | Renter-occupied |
| Utility Gas | 674 (65.6%) | 245 (43.8%) |
| Bottled, Tank, or LP Gas | 0 (0.0%) | 7 (1.3%) |
| Electricity | 347 (33.8%) | 307 (54.9%) |
| Fuel Oil or Kerosene | 0 (0.0%) | 0 (0.0%) |
| Coal or Coke | 0 (0.0%) | 0 (0.0%) |
| All other Fuels | 7 (0.7%) | 0 (0.0%) |
| No Fuel Used | 0 (0.0%) | 0 (0.0%) |
| Total | 1,028 (100.0%) | 559 (100.0%) |
Household Vehicle Usage in Coleman
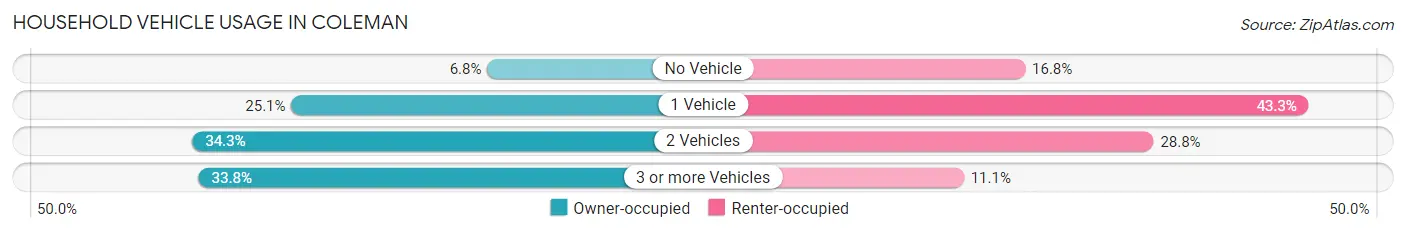
| Vehicles per Household | Owner-occupied | Renter-occupied |
| No Vehicle | 70 (6.8%) | 94 (16.8%) |
| 1 Vehicle | 258 (25.1%) | 242 (43.3%) |
| 2 Vehicles | 353 (34.3%) | 161 (28.8%) |
| 3 or more Vehicles | 347 (33.8%) | 62 (11.1%) |
| Total | 1,028 (100.0%) | 559 (100.0%) |
Real Estate & Mortgages in Coleman
Real Estate and Mortgage Overview in Coleman
| Characteristic | Without Mortgage | With Mortgage |
| Housing Units | 621 | 407 |
| Median Property Value | $71,600 | $95,200 |
| Median Household Income | $50,283 | $79 |
| Monthly Housing Costs | $503 | $0 |
| Real Estate Taxes | $874 | $26 |
Property Value by Mortgage Status in Coleman
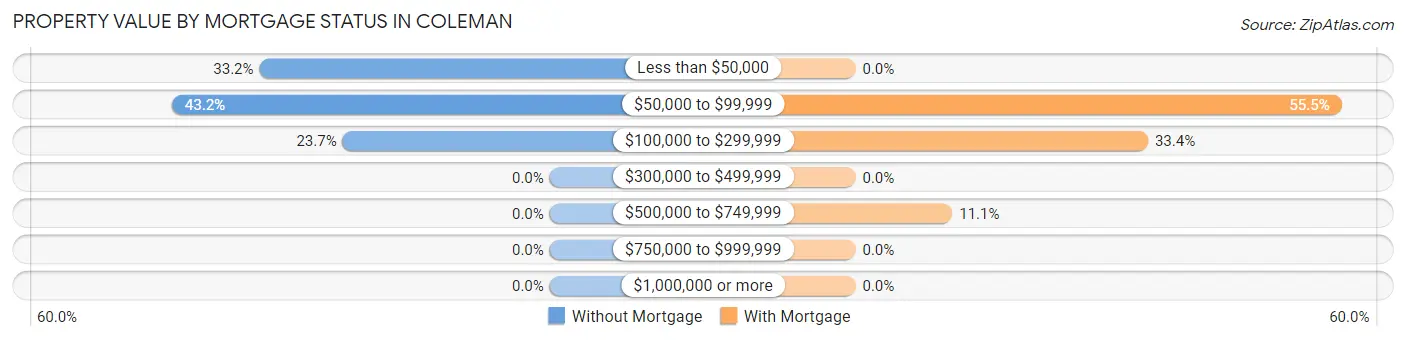
| Property Value | Without Mortgage | With Mortgage |
| Less than $50,000 | 206 (33.2%) | 0 (0.0%) |
| $50,000 to $99,999 | 268 (43.2%) | 226 (55.5%) |
| $100,000 to $299,999 | 147 (23.7%) | 136 (33.4%) |
| $300,000 to $499,999 | 0 (0.0%) | 0 (0.0%) |
| $500,000 to $749,999 | 0 (0.0%) | 45 (11.1%) |
| $750,000 to $999,999 | 0 (0.0%) | 0 (0.0%) |
| $1,000,000 or more | 0 (0.0%) | 0 (0.0%) |
| Total | 621 (100.0%) | 407 (100.0%) |
Household Income by Mortgage Status in Coleman
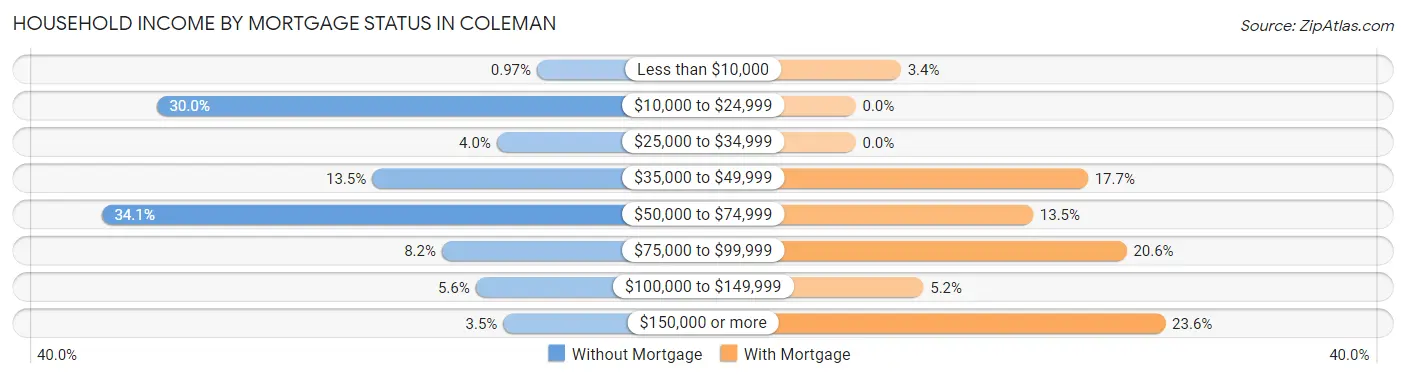
| Household Income | Without Mortgage | With Mortgage |
| Less than $10,000 | 6 (1.0%) | 14 (3.4%) |
| $10,000 to $24,999 | 186 (29.9%) | 0 (0.0%) |
| $25,000 to $34,999 | 25 (4.0%) | 0 (0.0%) |
| $35,000 to $49,999 | 84 (13.5%) | 72 (17.7%) |
| $50,000 to $74,999 | 212 (34.1%) | 55 (13.5%) |
| $75,000 to $99,999 | 51 (8.2%) | 84 (20.6%) |
| $100,000 to $149,999 | 35 (5.6%) | 21 (5.2%) |
| $150,000 or more | 22 (3.5%) | 96 (23.6%) |
| Total | 621 (100.0%) | 407 (100.0%) |
Property Value to Household Income Ratio in Coleman
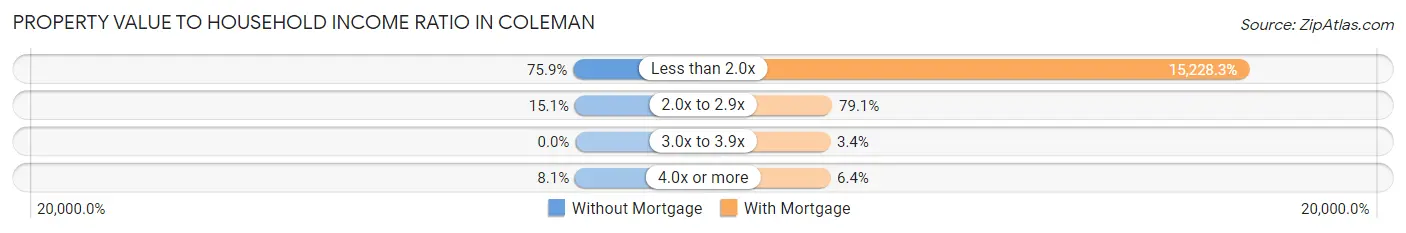
| Value-to-Income Ratio | Without Mortgage | With Mortgage |
| Less than 2.0x | 471 (75.8%) | 61,979 (15,228.3%) |
| 2.0x to 2.9x | 94 (15.1%) | 322 (79.1%) |
| 3.0x to 3.9x | 0 (0.0%) | 14 (3.4%) |
| 4.0x or more | 50 (8.1%) | 26 (6.4%) |
| Total | 621 (100.0%) | 407 (100.0%) |
Real Estate Taxes by Mortgage Status in Coleman
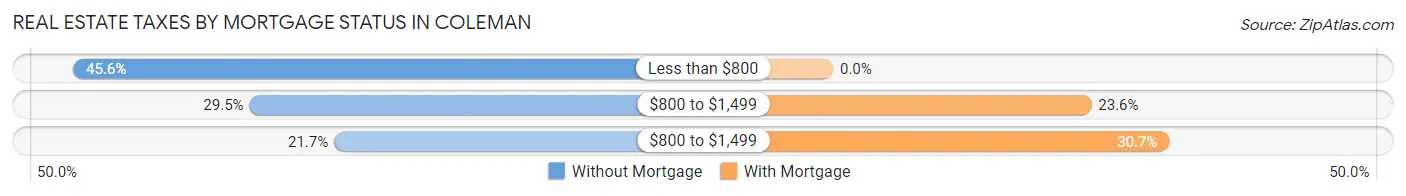
| Property Taxes | Without Mortgage | With Mortgage |
| Less than $800 | 283 (45.6%) | 0 (0.0%) |
| $800 to $1,499 | 183 (29.5%) | 96 (23.6%) |
| $800 to $1,499 | 135 (21.7%) | 125 (30.7%) |
| Total | 621 (100.0%) | 407 (100.0%) |
Health & Disability in Coleman
Health Insurance Coverage by Age in Coleman
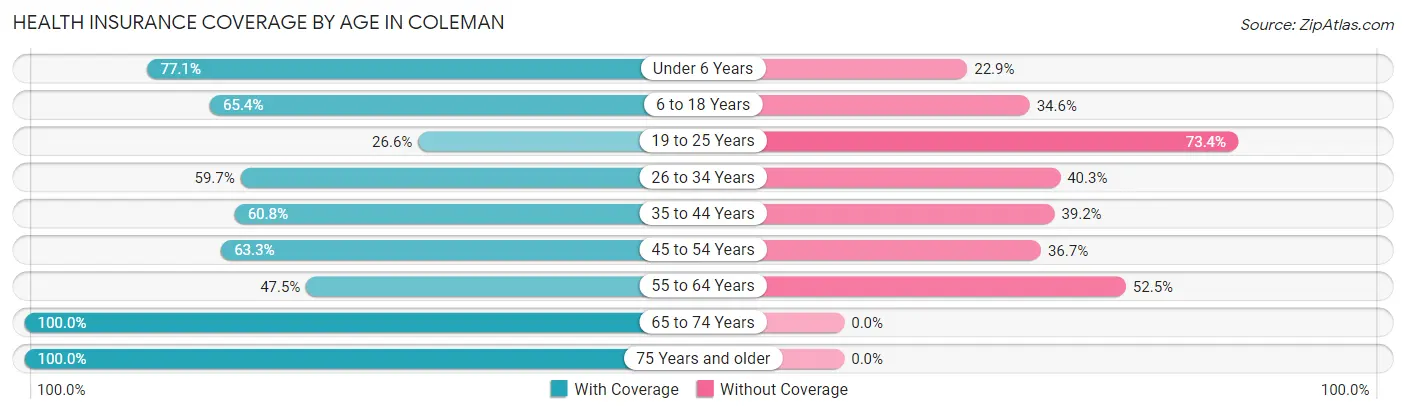
| Age Bracket | With Coverage | Without Coverage |
| Under 6 Years | 252 (77.1%) | 75 (22.9%) |
| 6 to 18 Years | 507 (65.4%) | 268 (34.6%) |
| 19 to 25 Years | 66 (26.6%) | 182 (73.4%) |
| 26 to 34 Years | 175 (59.7%) | 118 (40.3%) |
| 35 to 44 Years | 225 (60.8%) | 145 (39.2%) |
| 45 to 54 Years | 252 (63.3%) | 146 (36.7%) |
| 55 to 64 Years | 255 (47.5%) | 282 (52.5%) |
| 65 to 74 Years | 556 (100.0%) | 0 (0.0%) |
| 75 Years and older | 432 (100.0%) | 0 (0.0%) |
| Total | 2,720 (69.1%) | 1,216 (30.9%) |
Health Insurance Coverage by Citizenship Status in Coleman
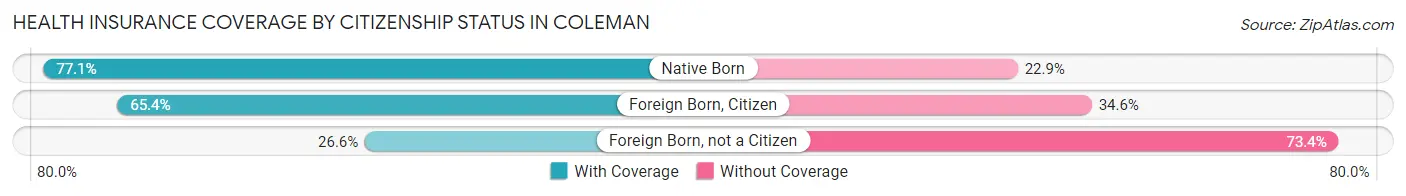
| Citizenship Status | With Coverage | Without Coverage |
| Native Born | 252 (77.1%) | 75 (22.9%) |
| Foreign Born, Citizen | 507 (65.4%) | 268 (34.6%) |
| Foreign Born, not a Citizen | 66 (26.6%) | 182 (73.4%) |
Health Insurance Coverage by Household Income in Coleman
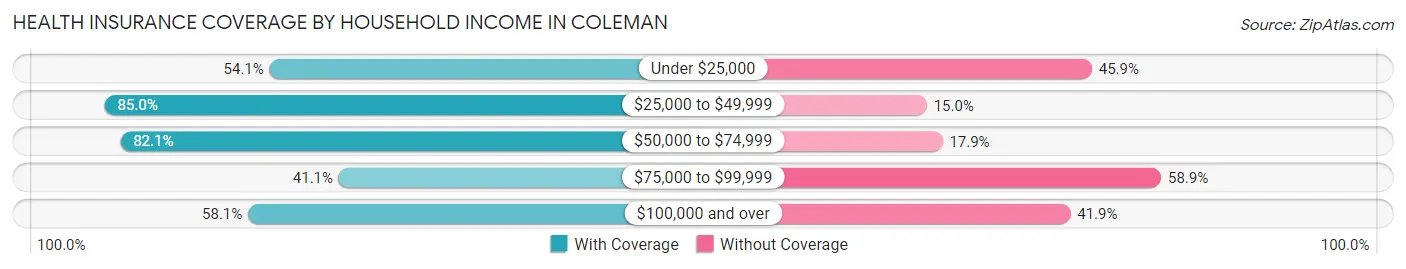
| Household Income | With Coverage | Without Coverage |
| Under $25,000 | 323 (54.1%) | 274 (45.9%) |
| $25,000 to $49,999 | 858 (85.0%) | 151 (15.0%) |
| $50,000 to $74,999 | 838 (82.1%) | 183 (17.9%) |
| $75,000 to $99,999 | 139 (41.1%) | 199 (58.9%) |
| $100,000 and over | 562 (58.1%) | 405 (41.9%) |
Public vs Private Health Insurance Coverage by Age in Coleman
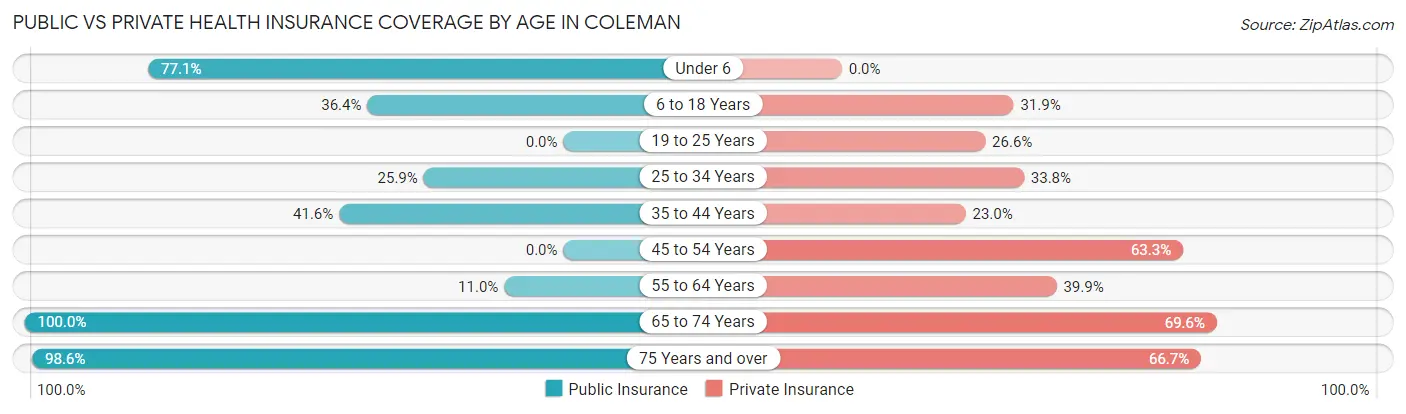
| Age Bracket | Public Insurance | Private Insurance |
| Under 6 | 252 (77.1%) | 0 (0.0%) |
| 6 to 18 Years | 282 (36.4%) | 247 (31.9%) |
| 19 to 25 Years | 0 (0.0%) | 66 (26.6%) |
| 25 to 34 Years | 76 (25.9%) | 99 (33.8%) |
| 35 to 44 Years | 154 (41.6%) | 85 (23.0%) |
| 45 to 54 Years | 0 (0.0%) | 252 (63.3%) |
| 55 to 64 Years | 59 (11.0%) | 214 (39.9%) |
| 65 to 74 Years | 556 (100.0%) | 387 (69.6%) |
| 75 Years and over | 426 (98.6%) | 288 (66.7%) |
| Total | 1,805 (45.9%) | 1,638 (41.6%) |
Disability Status by Sex by Age in Coleman
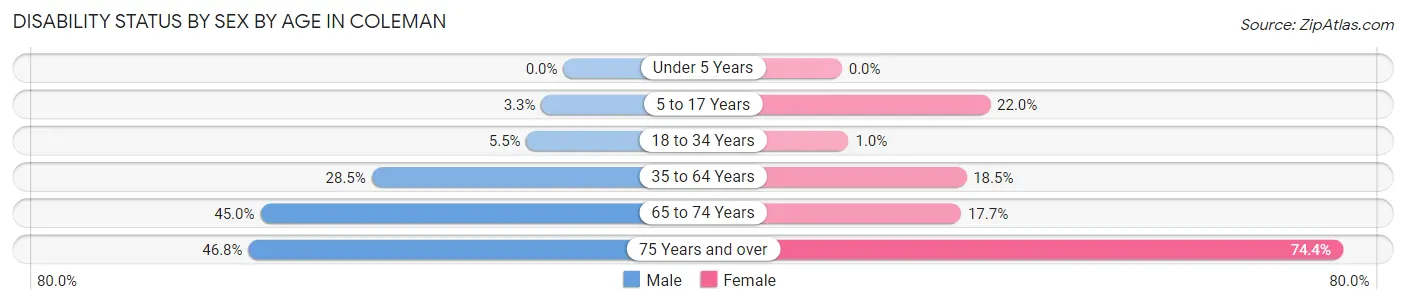
| Age Bracket | Male | Female |
| Under 5 Years | 0 (0.0%) | 0 (0.0%) |
| 5 to 17 Years | 13 (3.3%) | 72 (22.0%) |
| 18 to 34 Years | 21 (5.5%) | 3 (1.0%) |
| 35 to 64 Years | 199 (28.5%) | 112 (18.5%) |
| 65 to 74 Years | 90 (45.0%) | 63 (17.7%) |
| 75 Years and over | 87 (46.8%) | 183 (74.4%) |
Disability Class by Sex by Age in Coleman
Disability Class: Hearing Difficulty
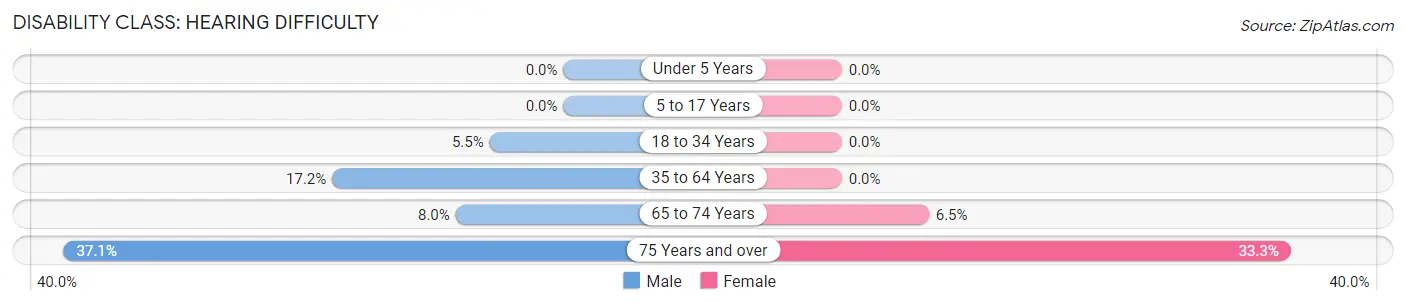
| Age Bracket | Male | Female |
| Under 5 Years | 0 (0.0%) | 0 (0.0%) |
| 5 to 17 Years | 0 (0.0%) | 0 (0.0%) |
| 18 to 34 Years | 21 (5.5%) | 0 (0.0%) |
| 35 to 64 Years | 120 (17.2%) | 0 (0.0%) |
| 65 to 74 Years | 16 (8.0%) | 23 (6.5%) |
| 75 Years and over | 69 (37.1%) | 82 (33.3%) |
Disability Class: Vision Difficulty
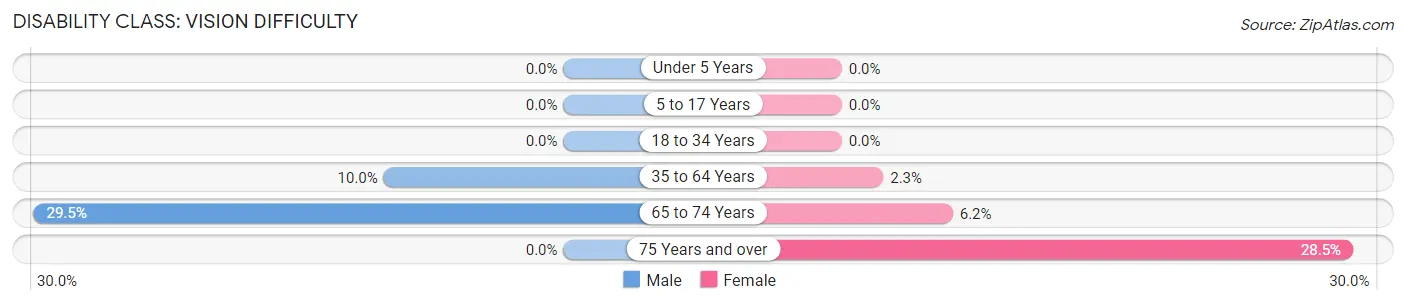
| Age Bracket | Male | Female |
| Under 5 Years | 0 (0.0%) | 0 (0.0%) |
| 5 to 17 Years | 0 (0.0%) | 0 (0.0%) |
| 18 to 34 Years | 0 (0.0%) | 0 (0.0%) |
| 35 to 64 Years | 70 (10.0%) | 14 (2.3%) |
| 65 to 74 Years | 59 (29.5%) | 22 (6.2%) |
| 75 Years and over | 0 (0.0%) | 70 (28.5%) |
Disability Class: Cognitive Difficulty
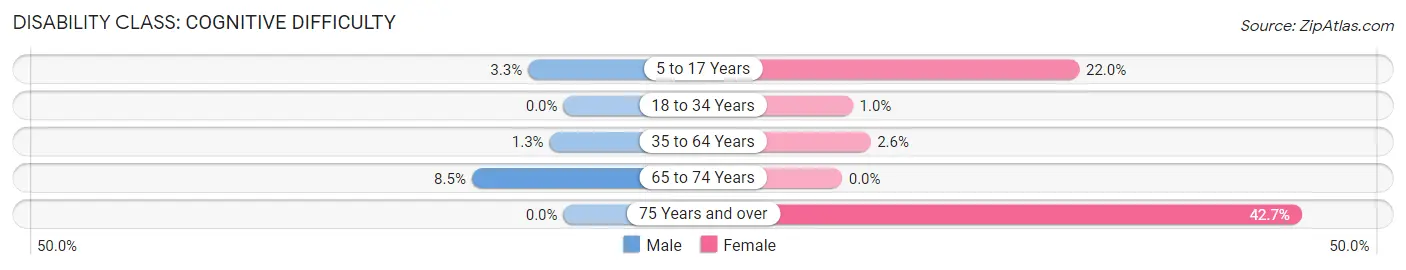
| Age Bracket | Male | Female |
| 5 to 17 Years | 13 (3.3%) | 72 (22.0%) |
| 18 to 34 Years | 0 (0.0%) | 3 (1.0%) |
| 35 to 64 Years | 9 (1.3%) | 16 (2.6%) |
| 65 to 74 Years | 17 (8.5%) | 0 (0.0%) |
| 75 Years and over | 0 (0.0%) | 105 (42.7%) |
Disability Class: Ambulatory Difficulty
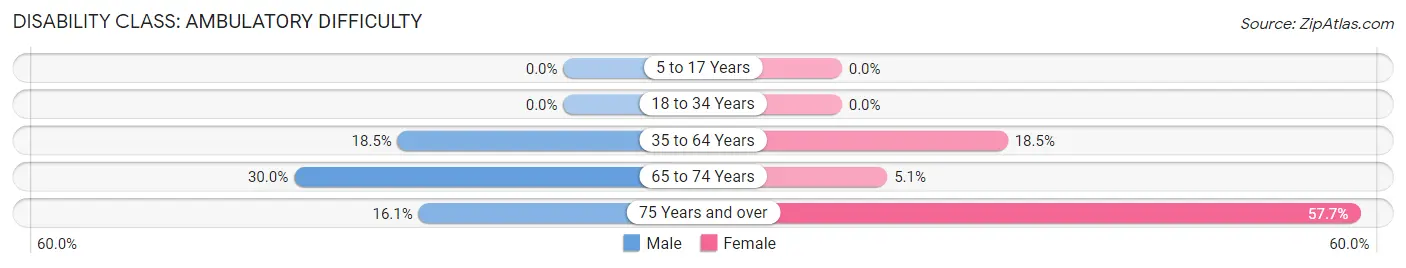
| Age Bracket | Male | Female |
| 5 to 17 Years | 0 (0.0%) | 0 (0.0%) |
| 18 to 34 Years | 0 (0.0%) | 0 (0.0%) |
| 35 to 64 Years | 129 (18.4%) | 112 (18.5%) |
| 65 to 74 Years | 60 (30.0%) | 18 (5.1%) |
| 75 Years and over | 30 (16.1%) | 142 (57.7%) |
Disability Class: Self-Care Difficulty
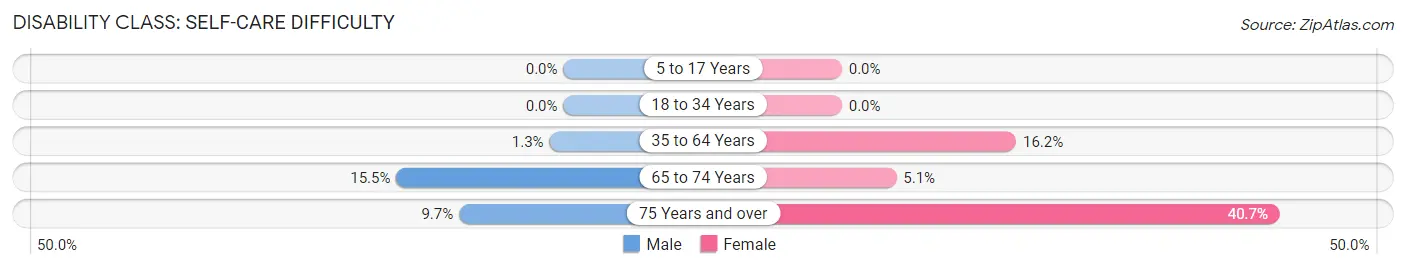
| Age Bracket | Male | Female |
| 5 to 17 Years | 0 (0.0%) | 0 (0.0%) |
| 18 to 34 Years | 0 (0.0%) | 0 (0.0%) |
| 35 to 64 Years | 9 (1.3%) | 98 (16.2%) |
| 65 to 74 Years | 31 (15.5%) | 18 (5.1%) |
| 75 Years and over | 18 (9.7%) | 100 (40.6%) |
Technology Access in Coleman
Computing Device Access in Coleman
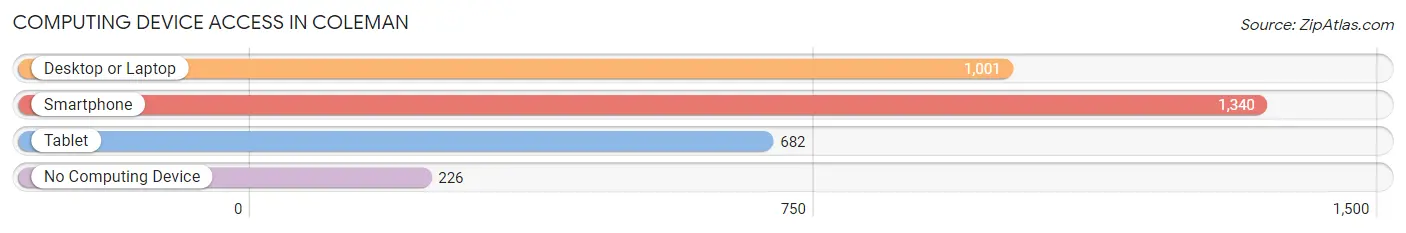
| Device Type | # Households | % Households |
| Desktop or Laptop | 1,001 | 63.1% |
| Smartphone | 1,340 | 84.4% |
| Tablet | 682 | 43.0% |
| No Computing Device | 226 | 14.2% |
| Total | 1,587 | 100.0% |
Internet Access in Coleman
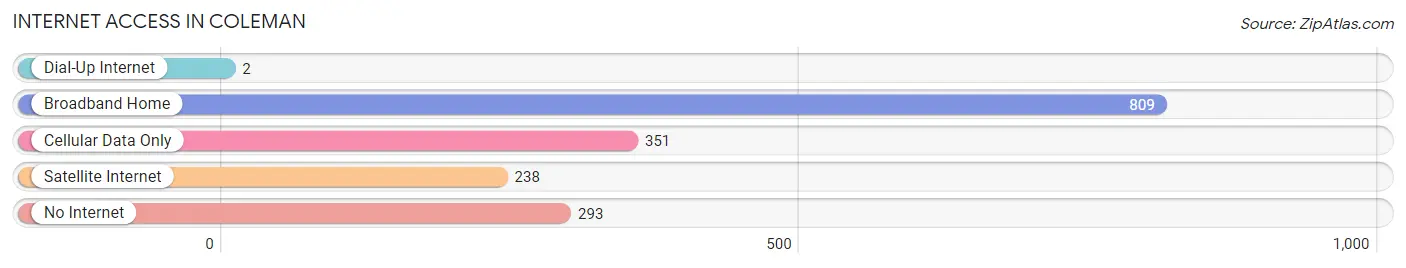
| Internet Type | # Households | % Households |
| Dial-Up Internet | 2 | 0.1% |
| Broadband Home | 809 | 51.0% |
| Cellular Data Only | 351 | 22.1% |
| Satellite Internet | 238 | 15.0% |
| No Internet | 293 | 18.5% |
| Total | 1,587 | 100.0% |
Coleman Summary
Coleman, Texas is a small city located in the heart of Texas, in Coleman County. It is situated in the rolling hills of the Edwards Plateau, and is surrounded by the cities of Santa Anna, Goldthwaite, and Brownwood. Coleman is known for its rich history, its unique geography, and its vibrant economy.
History
Coleman was founded in 1876 by a group of settlers from Coleman County, Tennessee. The town was named after Robert M. Coleman, a prominent local rancher and businessman. The town quickly grew, and by the early 1900s, it had become a bustling center of commerce and industry. The town was home to several businesses, including a cotton gin, a flour mill, and a blacksmith shop.
In the early 1900s, Coleman was also home to a thriving oil industry. The town was the site of the first oil well in Coleman County, and it quickly became a major oil-producing region. The oil industry brought wealth and prosperity to the town, and it was soon home to several large oil companies.
Geography
Coleman is located in the rolling hills of the Edwards Plateau, in the heart of Texas. The town is situated at the intersection of US Highway 84 and State Highway 206. The town is surrounded by several small towns, including Santa Anna, Goldthwaite, and Brownwood.
The town is located in a semi-arid climate, with hot summers and mild winters. The average annual temperature is around 70 degrees Fahrenheit, and the average annual precipitation is around 25 inches.
Economy
Coleman’s economy is largely based on agriculture and oil production. The town is home to several large oil companies, and it is also home to several large agricultural operations. The town is also home to several small businesses, including restaurants, retail stores, and service providers.
The town is also home to several manufacturing companies, including a furniture factory and a metal fabrication plant. The town is also home to several educational institutions, including a community college and a technical school.
Demographics
As of the 2010 census, Coleman had a population of 4,726. The population is largely white (83.3%), with a small Hispanic population (14.2%). The median household income is $37,945, and the median home value is $90,000.
Coleman is a small town with a rich history, unique geography, and vibrant economy. The town is home to several large oil companies, agricultural operations, and manufacturing companies. The town is also home to several educational institutions, and it is a popular destination for tourists and outdoor enthusiasts.
Common Questions
What is Per Capita Income in Coleman?
Per Capita income in Coleman is $27,195.
What is the Median Family Income in Coleman?
Median Family Income in Coleman is $58,587.
What is the Median Household income in Coleman?
Median Household Income in Coleman is $49,588.
What is Income or Wage Gap in Coleman?
Income or Wage Gap in Coleman is 20.9%.
Women in Coleman earn 79.1 cents for every dollar earned by a man.
What is Inequality or Gini Index in Coleman?
Inequality or Gini Index in Coleman is 0.46.
What is the Total Population of Coleman?
Total Population of Coleman is 3,973.
What is the Total Male Population of Coleman?
Total Male Population of Coleman is 2,013.
What is the Total Female Population of Coleman?
Total Female Population of Coleman is 1,960.
What is the Ratio of Males per 100 Females in Coleman?
There are 102.70 Males per 100 Females in Coleman.
What is the Ratio of Females per 100 Males in Coleman?
There are 97.37 Females per 100 Males in Coleman.
What is the Median Population Age in Coleman?
Median Population Age in Coleman is 43.5 Years.
What is the Average Family Size in Coleman
Average Family Size in Coleman is 3.5 People.
What is the Average Household Size in Coleman
Average Household Size in Coleman is 2.5 People.
How Large is the Labor Force in Coleman?
There are 1,849 People in the Labor Forcein in Coleman.
What is the Percentage of People in the Labor Force in Coleman?
60.4% of People are in the Labor Force in Coleman.
What is the Unemployment Rate in Coleman?
Unemployment Rate in Coleman is 9.5%.