Clyde, TX Map & Demographics
Clyde Map
Clyde Overview
$25,140
PER CAPITA INCOME
$66,218
AVG FAMILY INCOME
$60,799
AVG HOUSEHOLD INCOME
25.1%
WAGE / INCOME GAP [ % ]
74.9¢/ $1
WAGE / INCOME GAP [ $ ]
0.36
INEQUALITY / GINI INDEX
3,850
TOTAL POPULATION
1,999
MALE POPULATION
1,851
FEMALE POPULATION
108.00
MALES / 100 FEMALES
92.60
FEMALES / 100 MALES
35.0
MEDIAN AGE
3.7
AVG FAMILY SIZE
3.0
AVG HOUSEHOLD SIZE
1,750
LABOR FORCE [ PEOPLE ]
59.4%
PERCENT IN LABOR FORCE
5.9%
UNEMPLOYMENT RATE
Clyde Zip Codes
Clyde Area Codes
Income in Clyde
Income Overview in Clyde
Per Capita Income in Clyde is $25,140, while median incomes of families and households are $66,218 and $60,799 respectively.
| Characteristic | Number | Measure |
| Per Capita Income | 3,850 | $25,140 |
| Median Family Income | 858 | $66,218 |
| Mean Family Income | 858 | $79,689 |
| Median Household Income | 1,247 | $60,799 |
| Mean Household Income | 1,247 | $68,473 |
| Income Deficit | 858 | $0 |
| Wage / Income Gap (%) | 3,850 | 25.11% |
| Wage / Income Gap ($) | 3,850 | 74.89¢ per $1 |
| Gini / Inequality Index | 3,850 | 0.36 |
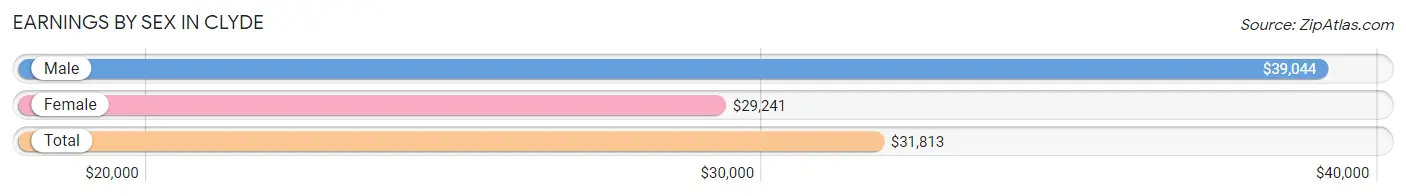
Earnings by Sex in Clyde
Average Earnings in Clyde are $31,813, $39,044 for men and $29,241 for women, a difference of 25.1%.
| Sex | Number | Average Earnings |
| Male | 1,025 (55.6%) | $39,044 |
| Female | 817 (44.4%) | $29,241 |
| Total | 1,842 (100.0%) | $31,813 |
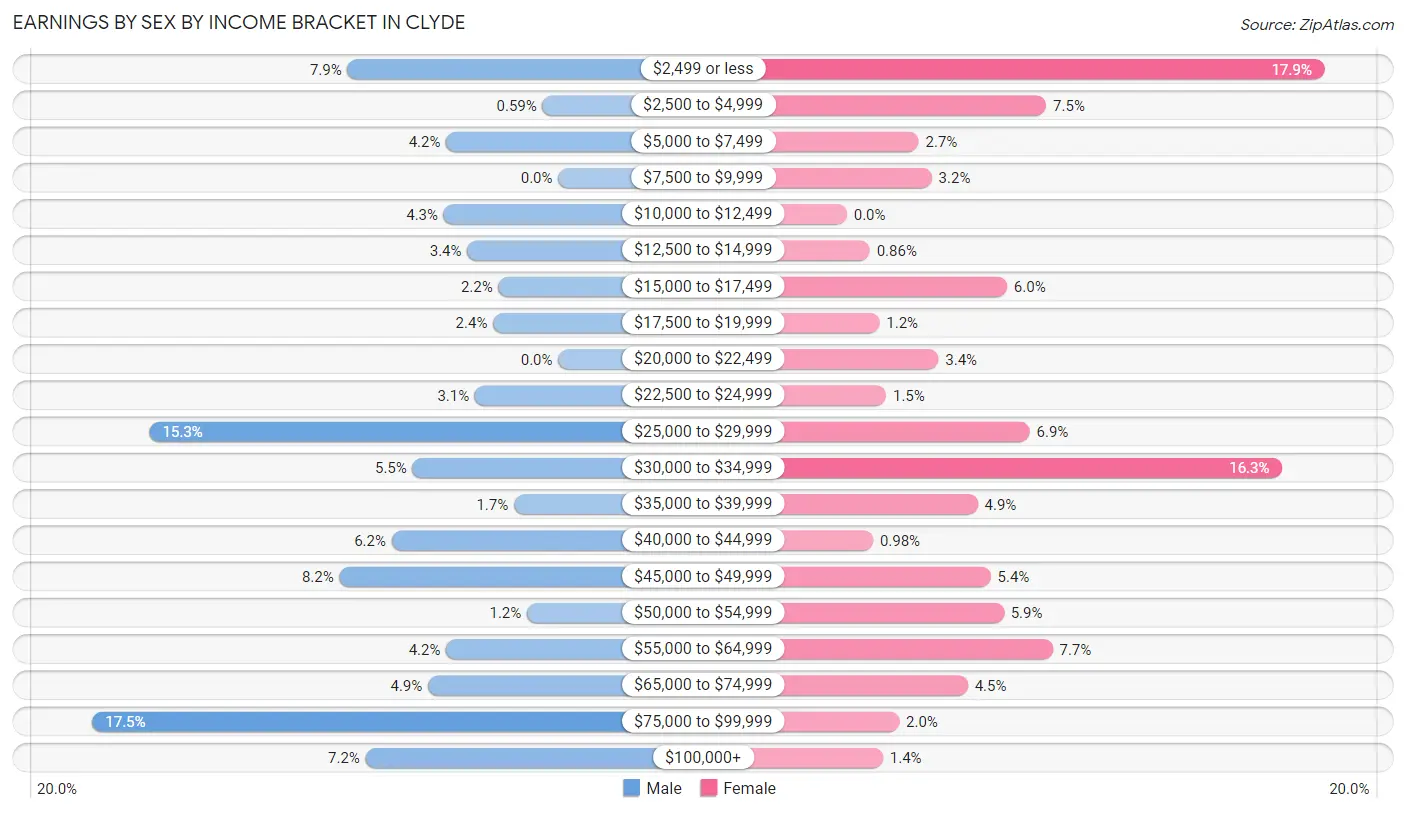
Earnings by Sex by Income Bracket in Clyde
The most common earnings brackets in Clyde are $75,000 to $99,999 for men (179 | 17.5%) and $2,499 or less for women (146 | 17.9%).
| Income | Male | Female |
| $2,499 or less | 81 (7.9%) | 146 (17.9%) |
| $2,500 to $4,999 | 6 (0.6%) | 61 (7.5%) |
| $5,000 to $7,499 | 43 (4.2%) | 22 (2.7%) |
| $7,500 to $9,999 | 0 (0.0%) | 26 (3.2%) |
| $10,000 to $12,499 | 44 (4.3%) | 0 (0.0%) |
| $12,500 to $14,999 | 35 (3.4%) | 7 (0.9%) |
| $15,000 to $17,499 | 23 (2.2%) | 49 (6.0%) |
| $17,500 to $19,999 | 25 (2.4%) | 10 (1.2%) |
| $20,000 to $22,499 | 0 (0.0%) | 28 (3.4%) |
| $22,500 to $24,999 | 32 (3.1%) | 12 (1.5%) |
| $25,000 to $29,999 | 157 (15.3%) | 56 (6.9%) |
| $30,000 to $34,999 | 56 (5.5%) | 133 (16.3%) |
| $35,000 to $39,999 | 17 (1.7%) | 40 (4.9%) |
| $40,000 to $44,999 | 64 (6.2%) | 8 (1.0%) |
| $45,000 to $49,999 | 84 (8.2%) | 44 (5.4%) |
| $50,000 to $54,999 | 12 (1.2%) | 48 (5.9%) |
| $55,000 to $64,999 | 43 (4.2%) | 63 (7.7%) |
| $65,000 to $74,999 | 50 (4.9%) | 37 (4.5%) |
| $75,000 to $99,999 | 179 (17.5%) | 16 (2.0%) |
| $100,000+ | 74 (7.2%) | 11 (1.3%) |
| Total | 1,025 (100.0%) | 817 (100.0%) |
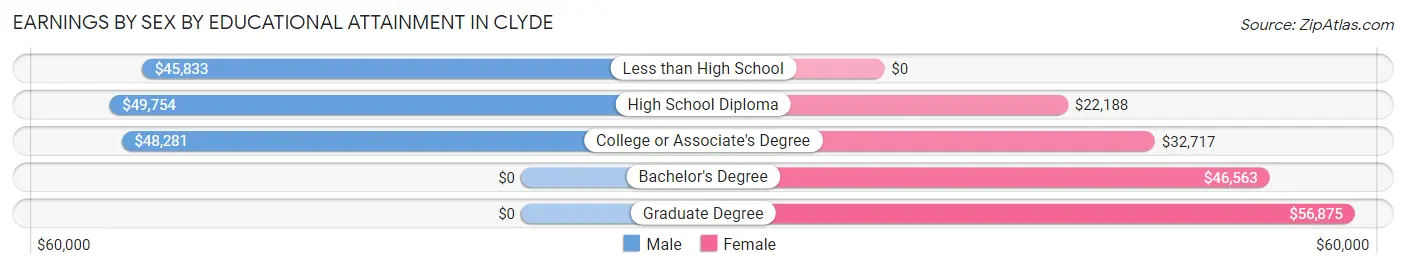
Earnings by Sex by Educational Attainment in Clyde
Average earnings in Clyde are $54,063 for men and $32,461 for women, a difference of 40.0%. Men with an educational attainment of high school diploma enjoy the highest average annual earnings of $49,754, while those with less than high school education earn the least with $45,833. Women with an educational attainment of graduate degree earn the most with the average annual earnings of $56,875, while those with high school diploma education have the smallest earnings of $22,188.
| Educational Attainment | Male Income | Female Income |
| Less than High School | $45,833 | $0 |
| High School Diploma | $49,754 | $22,188 |
| College or Associate's Degree | $48,281 | $32,717 |
| Bachelor's Degree | - | - |
| Graduate Degree | - | - |
| Total | $54,063 | $32,461 |
Family Income in Clyde
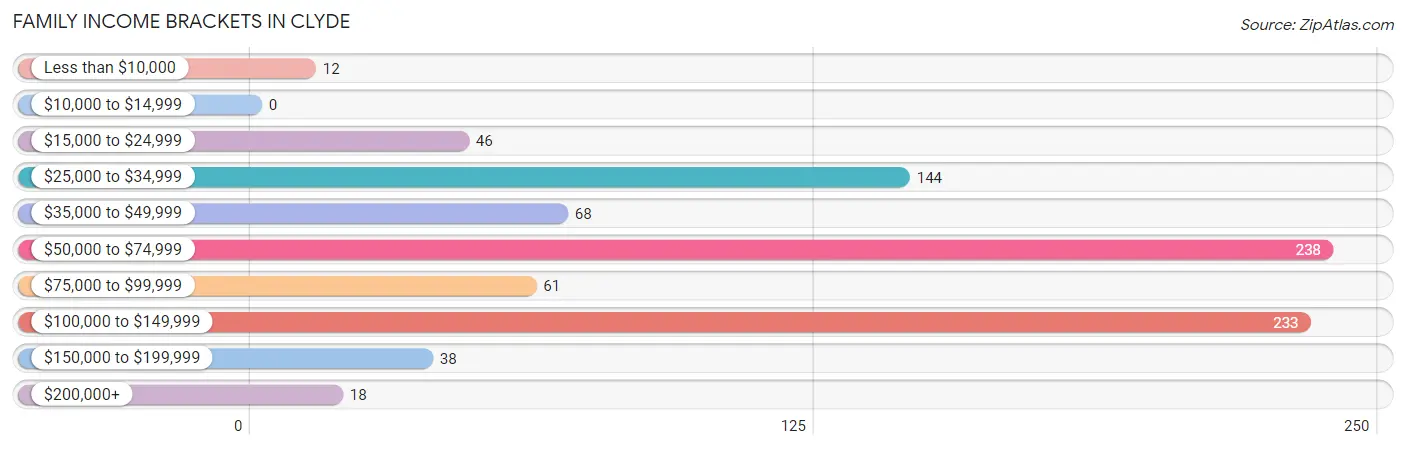
Family Income Brackets in Clyde
According to the Clyde family income data, there are 238 families falling into the $50,000 to $74,999 income range, which is the most common income bracket and makes up 27.7% of all families.
| Income Bracket | # Families | % Families |
| Less than $10,000 | 12 | 1.4% |
| $10,000 to $14,999 | 0 | 0.0% |
| $15,000 to $24,999 | 46 | 5.4% |
| $25,000 to $34,999 | 144 | 16.8% |
| $35,000 to $49,999 | 68 | 7.9% |
| $50,000 to $74,999 | 238 | 27.7% |
| $75,000 to $99,999 | 61 | 7.1% |
| $100,000 to $149,999 | 233 | 27.2% |
| $150,000 to $199,999 | 38 | 4.4% |
| $200,000+ | 18 | 2.1% |
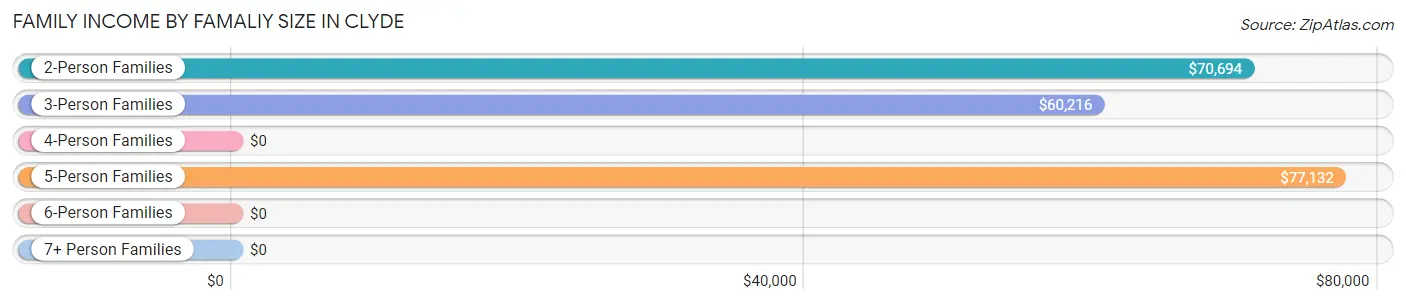
Family Income by Famaliy Size in Clyde
5-person families (133 | 15.5%) account for the highest median family income in Clyde with $77,132 per family, while 2-person families (279 | 32.5%) have the highest median income of $35,347 per family member.
| Income Bracket | # Families | Median Income |
| 2-Person Families | 279 (32.5%) | $70,694 |
| 3-Person Families | 283 (33.0%) | $60,216 |
| 4-Person Families | 146 (17.0%) | $0 |
| 5-Person Families | 133 (15.5%) | $77,132 |
| 6-Person Families | 10 (1.2%) | $0 |
| 7+ Person Families | 7 (0.8%) | $0 |
| Total | 858 (100.0%) | $66,218 |
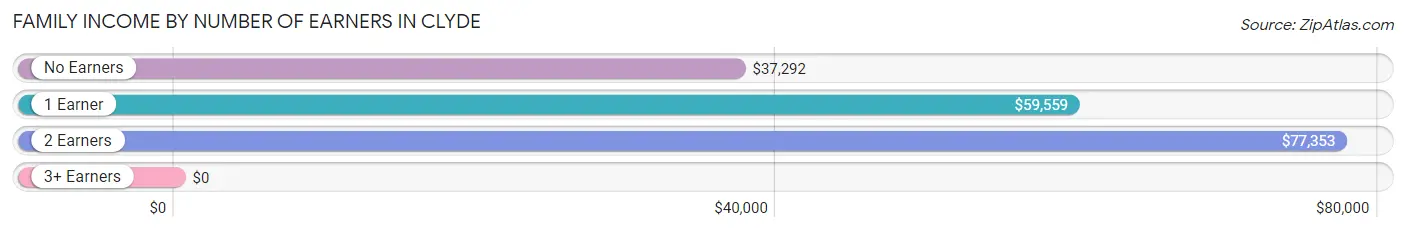
Family Income by Number of Earners in Clyde
| Number of Earners | # Families | Median Income |
| No Earners | 91 (10.6%) | $37,292 |
| 1 Earner | 276 (32.2%) | $59,559 |
| 2 Earners | 416 (48.5%) | $77,353 |
| 3+ Earners | 75 (8.7%) | $0 |
| Total | 858 (100.0%) | $66,218 |
Household Income in Clyde
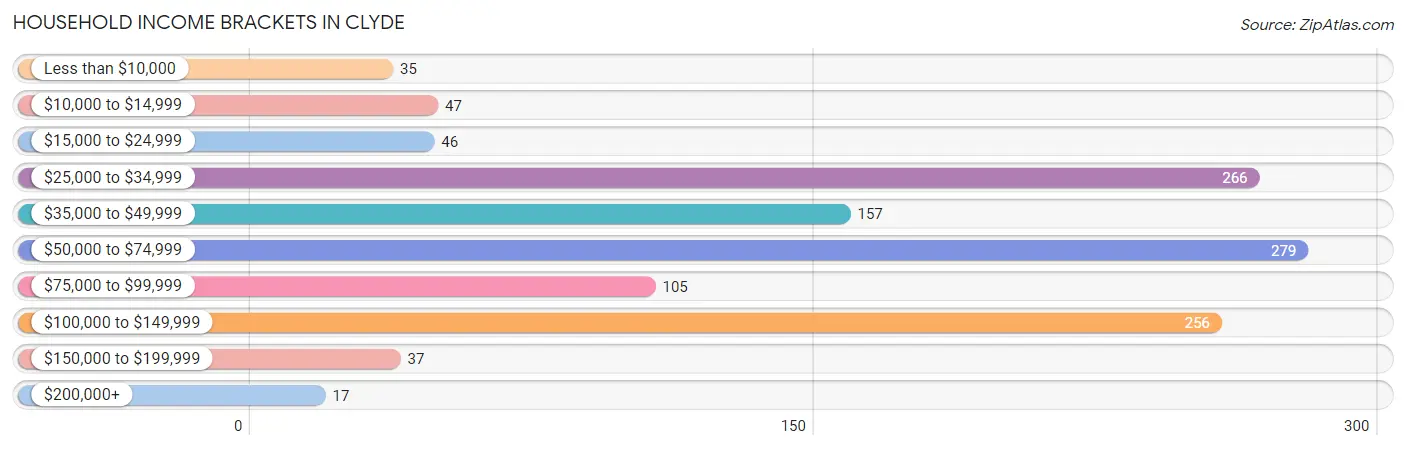
Household Income Brackets in Clyde
With 279 households falling in the category, the $50,000 to $74,999 income range is the most frequent in Clyde, accounting for 22.4% of all households. In contrast, only 17 households (1.4%) fall into the $200,000+ income bracket, making it the least populous group.
| Income Bracket | # Households | % Households |
| Less than $10,000 | 35 | 2.8% |
| $10,000 to $14,999 | 47 | 3.8% |
| $15,000 to $24,999 | 46 | 3.7% |
| $25,000 to $34,999 | 266 | 21.3% |
| $35,000 to $49,999 | 157 | 12.6% |
| $50,000 to $74,999 | 279 | 22.4% |
| $75,000 to $99,999 | 105 | 8.4% |
| $100,000 to $149,999 | 256 | 20.5% |
| $150,000 to $199,999 | 37 | 3.0% |
| $200,000+ | 17 | 1.4% |
Household Income by Householder Age in Clyde
The median household income in Clyde is $60,799, with the highest median household income of $95,946 found in the 25 to 44 years age bracket for the primary householder. A total of 368 households (29.5%) fall into this category. Meanwhile, the 15 to 24 years age bracket for the primary householder has the lowest median household income of $0, with 28 households (2.2%) in this group.
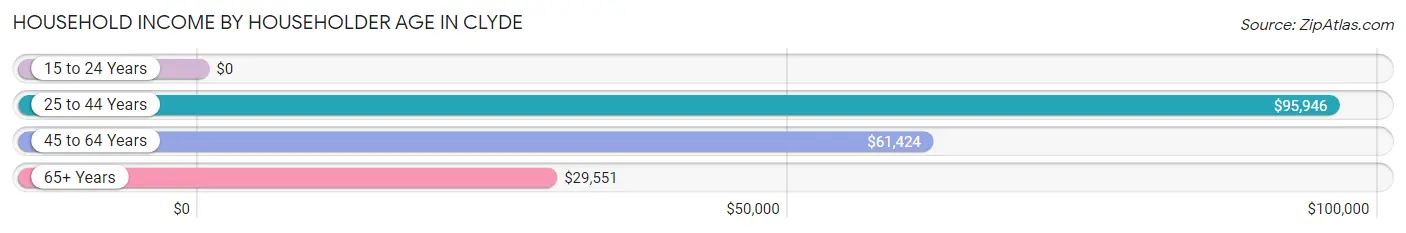
| Income Bracket | # Households | Median Income |
| 15 to 24 Years | 28 (2.2%) | $0 |
| 25 to 44 Years | 368 (29.5%) | $95,946 |
| 45 to 64 Years | 561 (45.0%) | $61,424 |
| 65+ Years | 290 (23.3%) | $29,551 |
| Total | 1,247 (100.0%) | $60,799 |
Poverty in Clyde
Income Below Poverty by Sex and Age in Clyde
With 10.9% poverty level for males and 13.0% for females among the residents of Clyde, under 5 year old males and 16 and 17 year old females are the most vulnerable to poverty, with 52 males (59.1%) and 30 females (100.0%) in their respective age groups living below the poverty level.
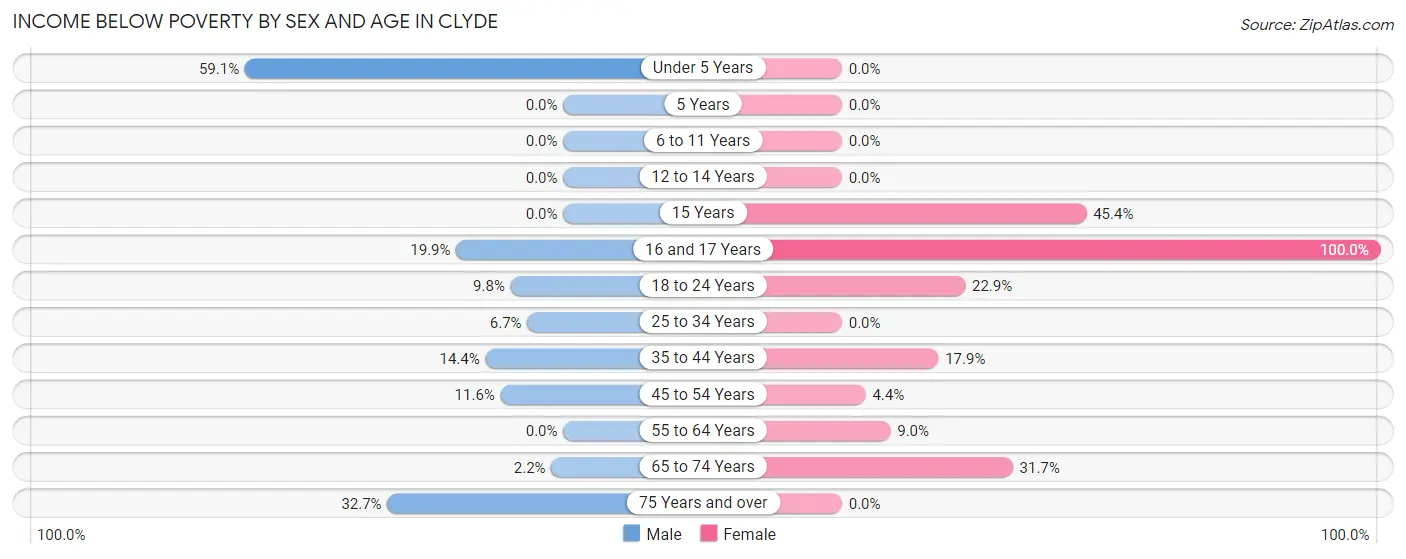
| Age Bracket | Male | Female |
| Under 5 Years | 52 (59.1%) | 0 (0.0%) |
| 5 Years | 0 (0.0%) | 0 (0.0%) |
| 6 to 11 Years | 0 (0.0%) | 0 (0.0%) |
| 12 to 14 Years | 0 (0.0%) | 0 (0.0%) |
| 15 Years | 0 (0.0%) | 49 (45.4%) |
| 16 and 17 Years | 28 (19.9%) | 30 (100.0%) |
| 18 to 24 Years | 34 (9.8%) | 54 (22.9%) |
| 25 to 34 Years | 5 (6.7%) | 0 (0.0%) |
| 35 to 44 Years | 41 (14.4%) | 41 (17.9%) |
| 45 to 54 Years | 32 (11.6%) | 8 (4.4%) |
| 55 to 64 Years | 0 (0.0%) | 28 (9.0%) |
| 65 to 74 Years | 3 (2.2%) | 26 (31.7%) |
| 75 Years and over | 16 (32.7%) | 0 (0.0%) |
| Total | 211 (10.9%) | 236 (13.0%) |
Income Above Poverty by Sex and Age in Clyde
According to the poverty statistics in Clyde, males aged 6 to 11 years and females aged under 5 years are the age groups that are most secure financially, with 100.0% of males and 100.0% of females in these age groups living above the poverty line.
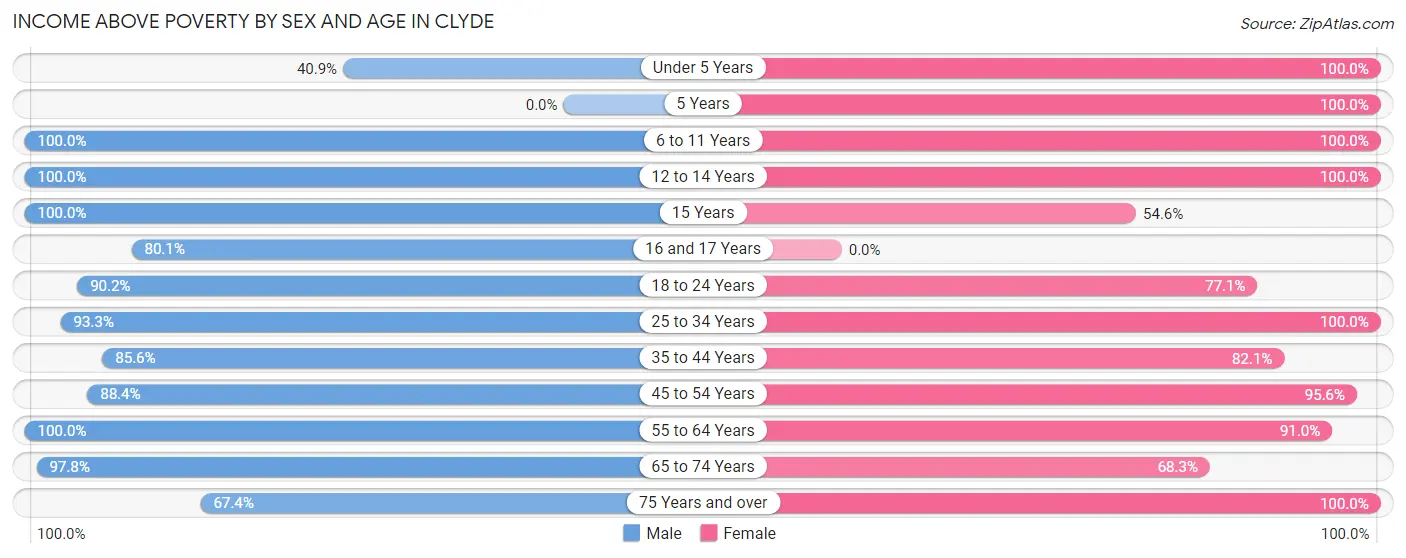
| Age Bracket | Male | Female |
| Under 5 Years | 36 (40.9%) | 73 (100.0%) |
| 5 Years | 0 (0.0%) | 40 (100.0%) |
| 6 to 11 Years | 218 (100.0%) | 216 (100.0%) |
| 12 to 14 Years | 90 (100.0%) | 23 (100.0%) |
| 15 Years | 8 (100.0%) | 59 (54.6%) |
| 16 and 17 Years | 113 (80.1%) | 0 (0.0%) |
| 18 to 24 Years | 314 (90.2%) | 182 (77.1%) |
| 25 to 34 Years | 70 (93.3%) | 192 (100.0%) |
| 35 to 44 Years | 243 (85.6%) | 188 (82.1%) |
| 45 to 54 Years | 243 (88.4%) | 174 (95.6%) |
| 55 to 64 Years | 230 (100.0%) | 283 (91.0%) |
| 65 to 74 Years | 133 (97.8%) | 56 (68.3%) |
| 75 Years and over | 33 (67.3%) | 101 (100.0%) |
| Total | 1,731 (89.1%) | 1,587 (87.1%) |
Income Below Poverty Among Married-Couple Families in Clyde
The poverty statistics for married-couple families in Clyde show that 1.7% or 11 of the total 632 families live below the poverty line. Families with no children have the highest poverty rate of 3.6%, comprising of 11 families. On the other hand, families with 1 or 2 children have the lowest poverty rate of 0.0%, which includes 0 families.
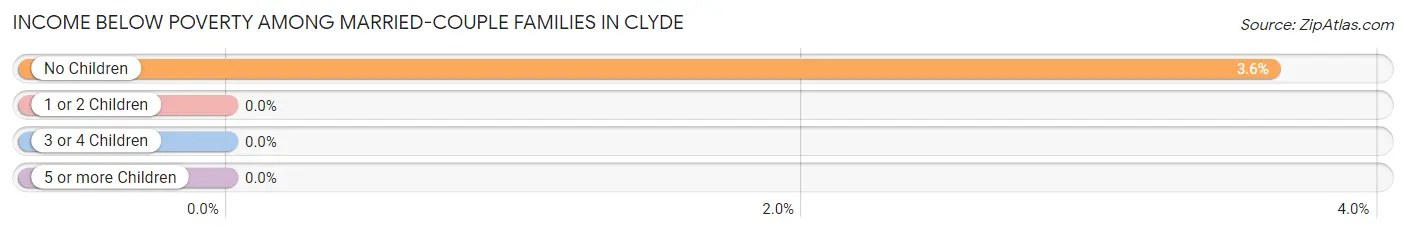
| Children | Above Poverty | Below Poverty |
| No Children | 292 (96.4%) | 11 (3.6%) |
| 1 or 2 Children | 231 (100.0%) | 0 (0.0%) |
| 3 or 4 Children | 98 (100.0%) | 0 (0.0%) |
| 5 or more Children | 0 (0.0%) | 0 (0.0%) |
| Total | 621 (98.3%) | 11 (1.7%) |
Income Below Poverty Among Single-Parent Households in Clyde
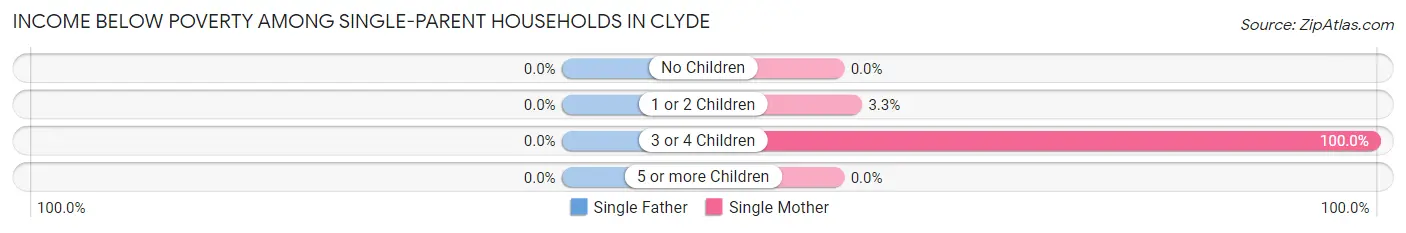
| Children | Single Father | Single Mother |
| No Children | 0 (0.0%) | 0 (0.0%) |
| 1 or 2 Children | 0 (0.0%) | 4 (3.3%) |
| 3 or 4 Children | 0 (0.0%) | 32 (100.0%) |
| 5 or more Children | 0 (0.0%) | 0 (0.0%) |
| Total | 0 (0.0%) | 36 (20.0%) |
Income Below Poverty Among Married-Couple vs Single-Parent Households in Clyde
The poverty data for Clyde shows that 11 of the married-couple family households (1.7%) and 36 of the single-parent households (15.9%) are living below the poverty level. Within the married-couple family households, those with no children have the highest poverty rate, with 11 households (3.6%) falling below the poverty line. Among the single-parent households, those with 3 or 4 children have the highest poverty rate, with 32 household (100.0%) living below poverty.
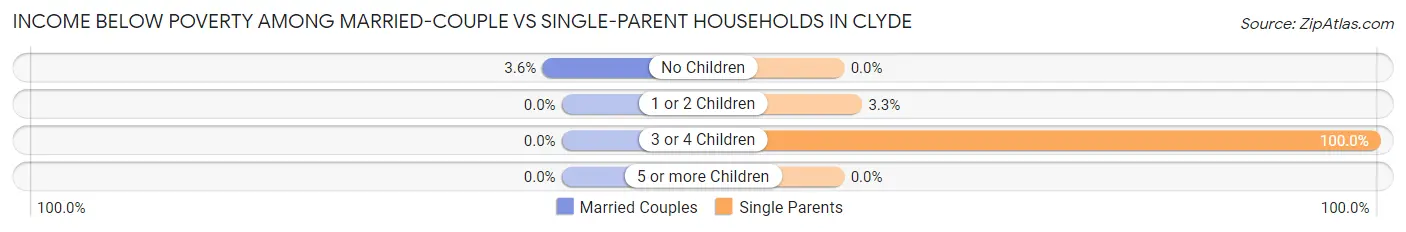
| Children | Married-Couple Families | Single-Parent Households |
| No Children | 11 (3.6%) | 0 (0.0%) |
| 1 or 2 Children | 0 (0.0%) | 4 (3.3%) |
| 3 or 4 Children | 0 (0.0%) | 32 (100.0%) |
| 5 or more Children | 0 (0.0%) | 0 (0.0%) |
| Total | 11 (1.7%) | 36 (15.9%) |
Race in Clyde
The most populous races in Clyde are White / Caucasian (3,111 | 80.8%), Hispanic or Latino (814 | 21.1%), and Two or more Races (587 | 15.2%).
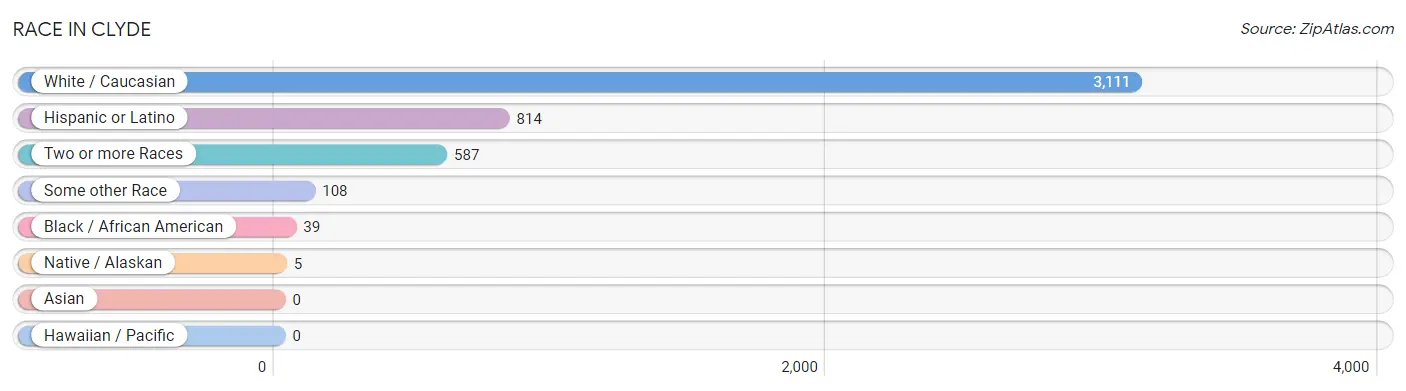
| Race | # Population | % Population |
| Asian | 0 | 0.0% |
| Black / African American | 39 | 1.0% |
| Hawaiian / Pacific | 0 | 0.0% |
| Hispanic or Latino | 814 | 21.1% |
| Native / Alaskan | 5 | 0.1% |
| White / Caucasian | 3,111 | 80.8% |
| Two or more Races | 587 | 15.2% |
| Some other Race | 108 | 2.8% |
| Total | 3,850 | 100.0% |
Ancestry in Clyde
The most populous ancestries reported in Clyde are Mexican (795 | 20.6%), German (470 | 12.2%), Irish (392 | 10.2%), English (319 | 8.3%), and European (181 | 4.7%), together accounting for 56.0% of all Clyde residents.
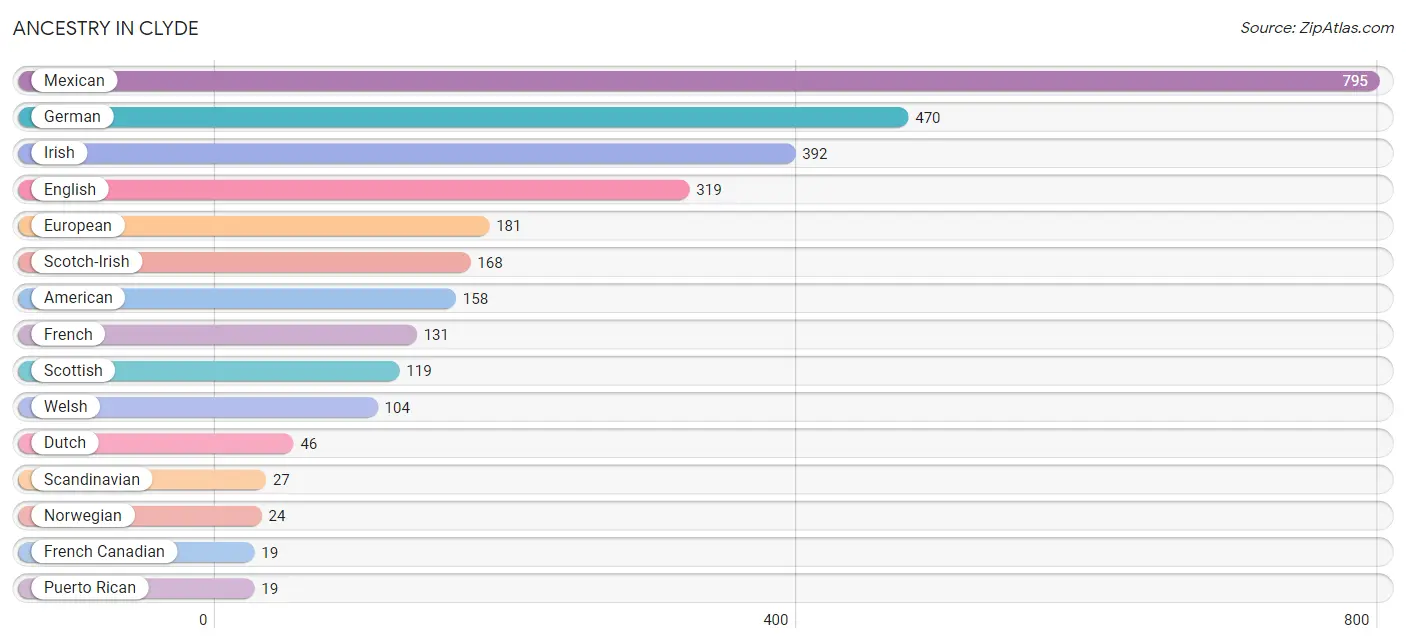
| Ancestry | # Population | % Population |
| American | 158 | 4.1% |
| British | 6 | 0.2% |
| Dutch | 46 | 1.2% |
| English | 319 | 8.3% |
| European | 181 | 4.7% |
| French | 131 | 3.4% |
| French Canadian | 19 | 0.5% |
| German | 470 | 12.2% |
| Irish | 392 | 10.2% |
| Mexican | 795 | 20.6% |
| Norwegian | 24 | 0.6% |
| Puerto Rican | 19 | 0.5% |
| Scandinavian | 27 | 0.7% |
| Scotch-Irish | 168 | 4.4% |
| Scottish | 119 | 3.1% |
| Welsh | 104 | 2.7% | View All 16 Rows |
Immigrants in Clyde

| Immigration Origin | # Population | % Population | View All 0 Rows |
Sex and Age in Clyde
Sex and Age in Clyde
The most populous age groups in Clyde are 15 to 19 Years (297 | 14.9%) for men and 15 to 19 Years (271 | 14.6%) for women.
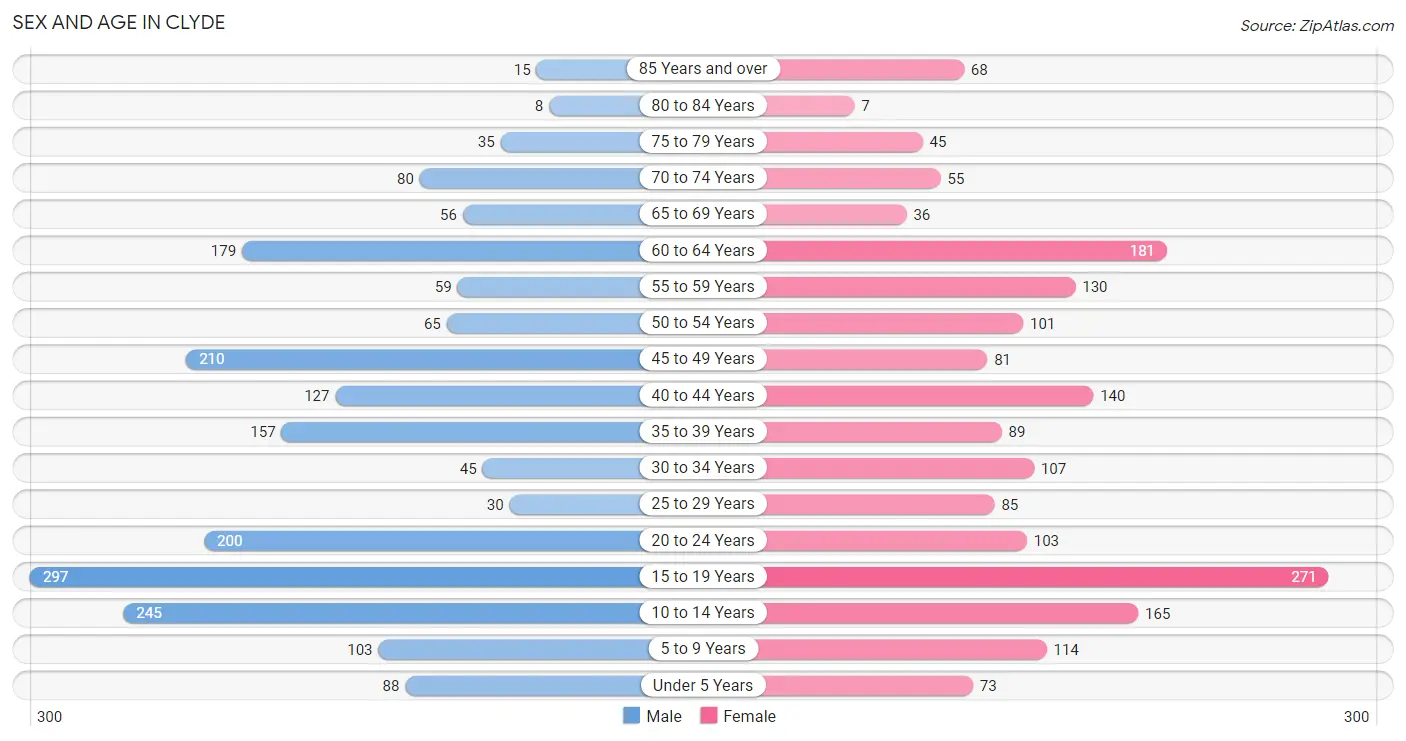
| Age Bracket | Male | Female |
| Under 5 Years | 88 (4.4%) | 73 (3.9%) |
| 5 to 9 Years | 103 (5.1%) | 114 (6.2%) |
| 10 to 14 Years | 245 (12.3%) | 165 (8.9%) |
| 15 to 19 Years | 297 (14.9%) | 271 (14.6%) |
| 20 to 24 Years | 200 (10.0%) | 103 (5.6%) |
| 25 to 29 Years | 30 (1.5%) | 85 (4.6%) |
| 30 to 34 Years | 45 (2.2%) | 107 (5.8%) |
| 35 to 39 Years | 157 (7.9%) | 89 (4.8%) |
| 40 to 44 Years | 127 (6.4%) | 140 (7.6%) |
| 45 to 49 Years | 210 (10.5%) | 81 (4.4%) |
| 50 to 54 Years | 65 (3.3%) | 101 (5.5%) |
| 55 to 59 Years | 59 (2.9%) | 130 (7.0%) |
| 60 to 64 Years | 179 (8.9%) | 181 (9.8%) |
| 65 to 69 Years | 56 (2.8%) | 36 (1.9%) |
| 70 to 74 Years | 80 (4.0%) | 55 (3.0%) |
| 75 to 79 Years | 35 (1.8%) | 45 (2.4%) |
| 80 to 84 Years | 8 (0.4%) | 7 (0.4%) |
| 85 Years and over | 15 (0.7%) | 68 (3.7%) |
| Total | 1,999 (100.0%) | 1,851 (100.0%) |
Families and Households in Clyde
Median Family Size in Clyde
The median family size in Clyde is 3.74 persons per family, with single female/mother families (180 | 21.0%) accounting for the largest median family size of 4.13 persons per family. On the other hand, single male/father families (46 | 5.4%) represent the smallest median family size with 2.57 persons per family.
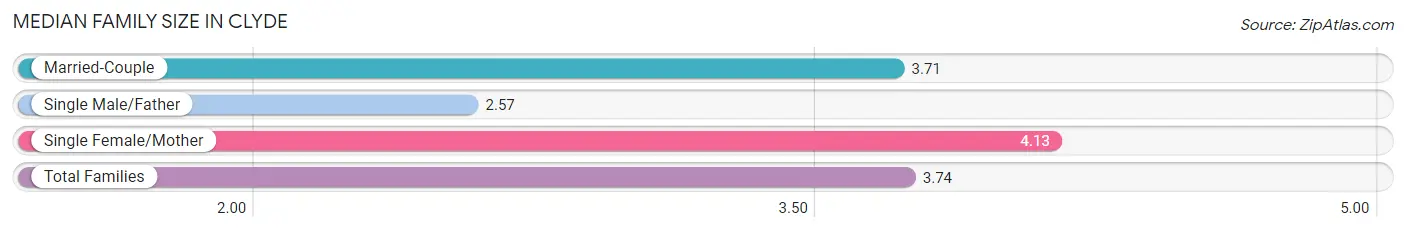
| Family Type | # Families | Family Size |
| Married-Couple | 632 (73.7%) | 3.71 |
| Single Male/Father | 46 (5.4%) | 2.57 |
| Single Female/Mother | 180 (21.0%) | 4.13 |
| Total Families | 858 (100.0%) | 3.74 |
Median Household Size in Clyde
The median household size in Clyde is 3.05 persons per household, with single female/mother households (180 | 14.4%) accounting for the largest median household size of 4.99 persons per household. non-family households (389 | 31.2%) represent the smallest median household size with 1.09 persons per household.
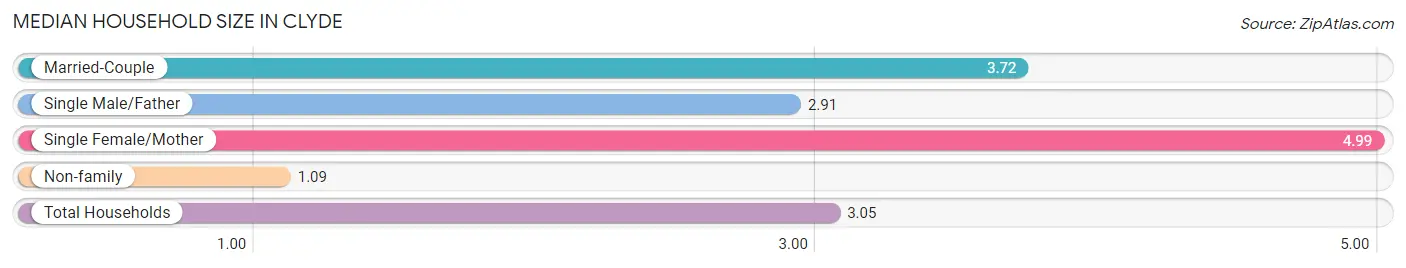
| Household Type | # Households | Household Size |
| Married-Couple | 632 (50.7%) | 3.72 |
| Single Male/Father | 46 (3.7%) | 2.91 |
| Single Female/Mother | 180 (14.4%) | 4.99 |
| Non-family | 389 (31.2%) | 1.09 |
| Total Households | 1,247 (100.0%) | 3.05 |
Household Size by Marriage Status in Clyde
Out of a total of 1,247 households in Clyde, 858 (68.8%) are family households, while 389 (31.2%) are nonfamily households. The most numerous type of family households are 3-person households, comprising 271, and the most common type of nonfamily households are 1-person households, comprising 373.
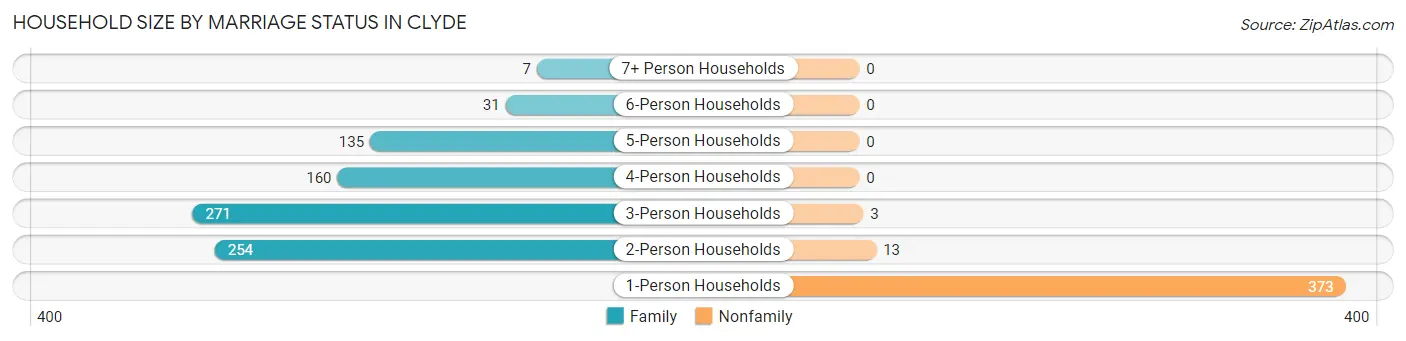
| Household Size | Family Households | Nonfamily Households |
| 1-Person Households | - | 373 (29.9%) |
| 2-Person Households | 254 (20.4%) | 13 (1.0%) |
| 3-Person Households | 271 (21.7%) | 3 (0.2%) |
| 4-Person Households | 160 (12.8%) | 0 (0.0%) |
| 5-Person Households | 135 (10.8%) | 0 (0.0%) |
| 6-Person Households | 31 (2.5%) | 0 (0.0%) |
| 7+ Person Households | 7 (0.6%) | 0 (0.0%) |
| Total | 858 (68.8%) | 389 (31.2%) |
Female Fertility in Clyde
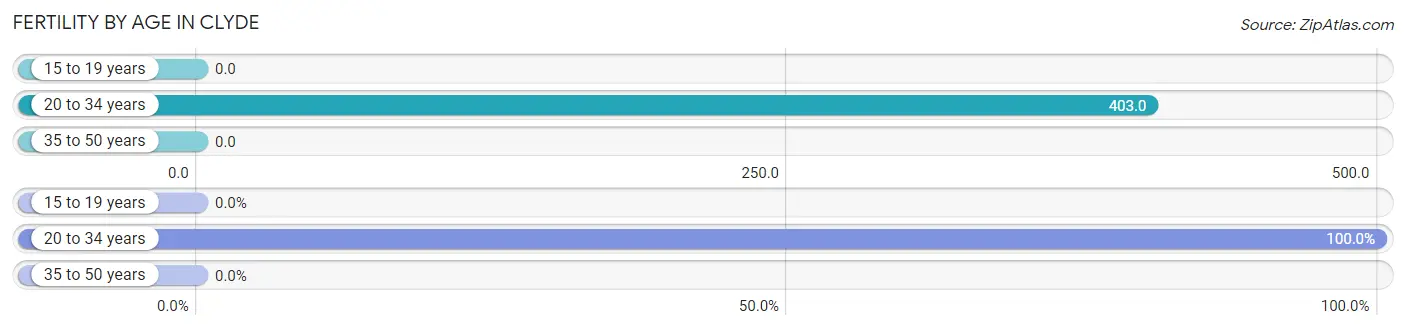
Fertility by Age in Clyde
Average fertility rate in Clyde is 135.0 births per 1,000 women. Women in the age bracket of 20 to 34 years have the highest fertility rate with 403.0 births per 1,000 women. Women in the age bracket of 20 to 34 years acount for 100.0% of all women with births.
| Age Bracket | Women with Births | Births / 1,000 Women |
| 15 to 19 years | 0 (0.0%) | 0.0 |
| 20 to 34 years | 119 (100.0%) | 403.0 |
| 35 to 50 years | 0 (0.0%) | 0.0 |
| Total | 119 (100.0%) | 135.0 |
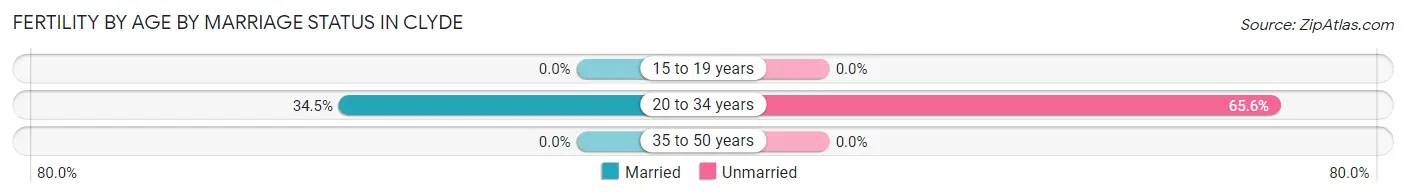
Fertility by Age by Marriage Status in Clyde
34.5% of women with births (119) in Clyde are married. The highest percentage of unmarried women with births falls into 20 to 34 years age bracket with 65.5% of them unmarried at the time of birth, while the lowest percentage of unmarried women with births belong to 20 to 34 years age bracket with 65.5% of them unmarried.
| Age Bracket | Married | Unmarried |
| 15 to 19 years | 0 (0.0%) | 0 (0.0%) |
| 20 to 34 years | 41 (34.4%) | 78 (65.5%) |
| 35 to 50 years | 0 (0.0%) | 0 (0.0%) |
| Total | 41 (34.4%) | 78 (65.5%) |
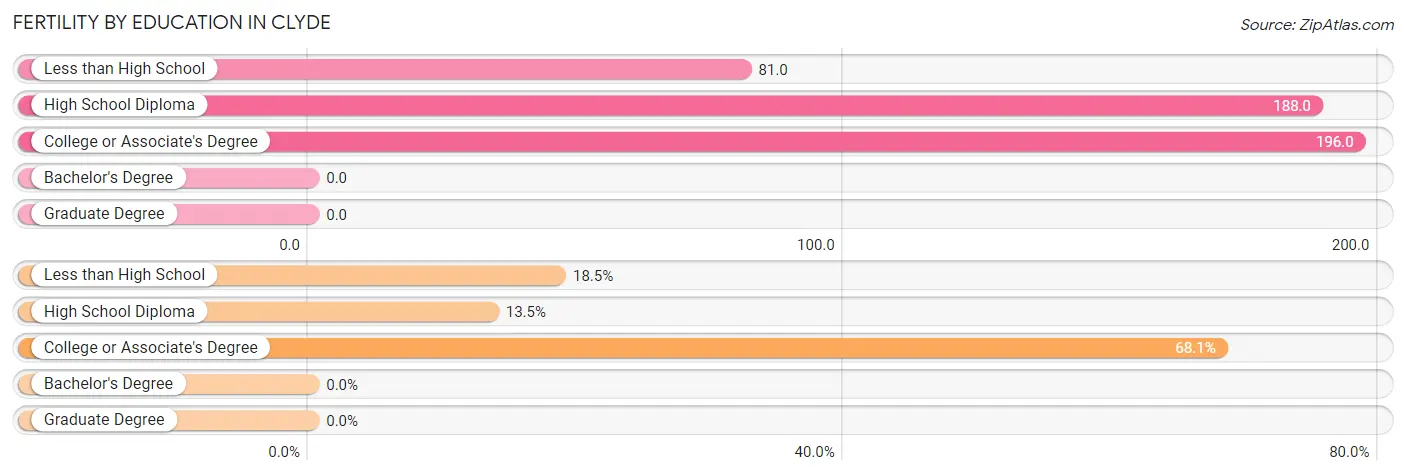
Fertility by Education in Clyde
| Educational Attainment | Women with Births | Births / 1,000 Women |
| Less than High School | 22 (18.5%) | 81.0 |
| High School Diploma | 16 (13.5%) | 188.0 |
| College or Associate's Degree | 81 (68.1%) | 196.0 |
| Bachelor's Degree | 0 (0.0%) | 0.0 |
| Graduate Degree | 0 (0.0%) | 0.0 |
| Total | 119 (100.0%) | 135.0 |
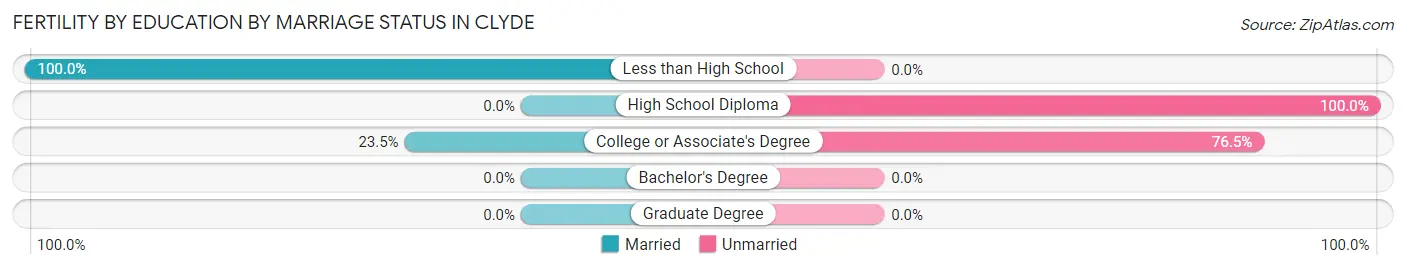
Fertility by Education by Marriage Status in Clyde
65.5% of women with births in Clyde are unmarried. Women with the educational attainment of less than high school are most likely to be married with 100.0% of them married at childbirth, while women with the educational attainment of high school diploma are least likely to be married with 100.0% of them unmarried at childbirth.
| Educational Attainment | Married | Unmarried |
| Less than High School | 22 (100.0%) | 0 (0.0%) |
| High School Diploma | 0 (0.0%) | 16 (100.0%) |
| College or Associate's Degree | 19 (23.5%) | 62 (76.5%) |
| Bachelor's Degree | 0 (0.0%) | 0 (0.0%) |
| Graduate Degree | 0 (0.0%) | 0 (0.0%) |
| Total | 41 (34.4%) | 78 (65.5%) |
Employment Characteristics in Clyde
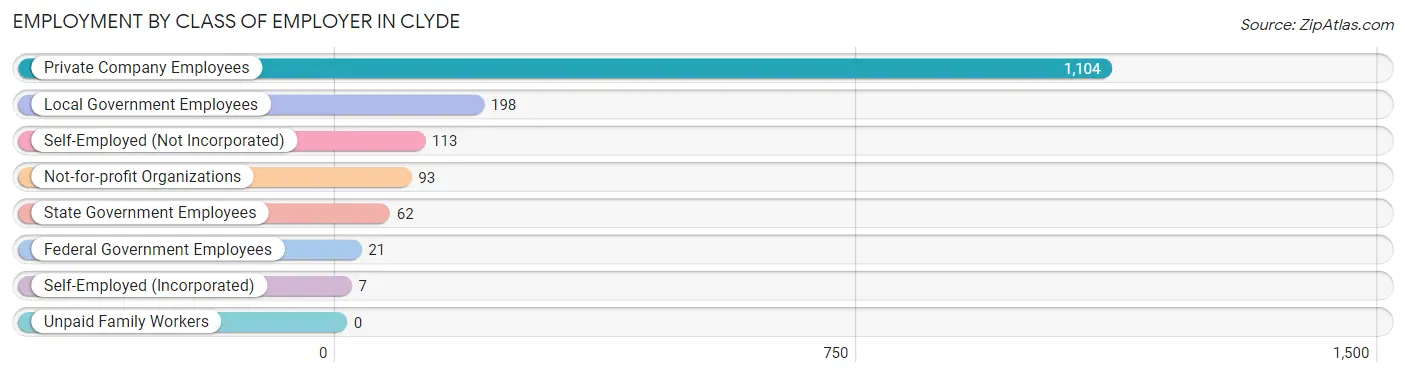
Employment by Class of Employer in Clyde
Among the 1,598 employed individuals in Clyde, private company employees (1,104 | 69.1%), local government employees (198 | 12.4%), and self-employed (not incorporated) (113 | 7.1%) make up the most common classes of employment.
| Employer Class | # Employees | % Employees |
| Private Company Employees | 1,104 | 69.1% |
| Self-Employed (Incorporated) | 7 | 0.4% |
| Self-Employed (Not Incorporated) | 113 | 7.1% |
| Not-for-profit Organizations | 93 | 5.8% |
| Local Government Employees | 198 | 12.4% |
| State Government Employees | 62 | 3.9% |
| Federal Government Employees | 21 | 1.3% |
| Unpaid Family Workers | 0 | 0.0% |
| Total | 1,598 | 100.0% |
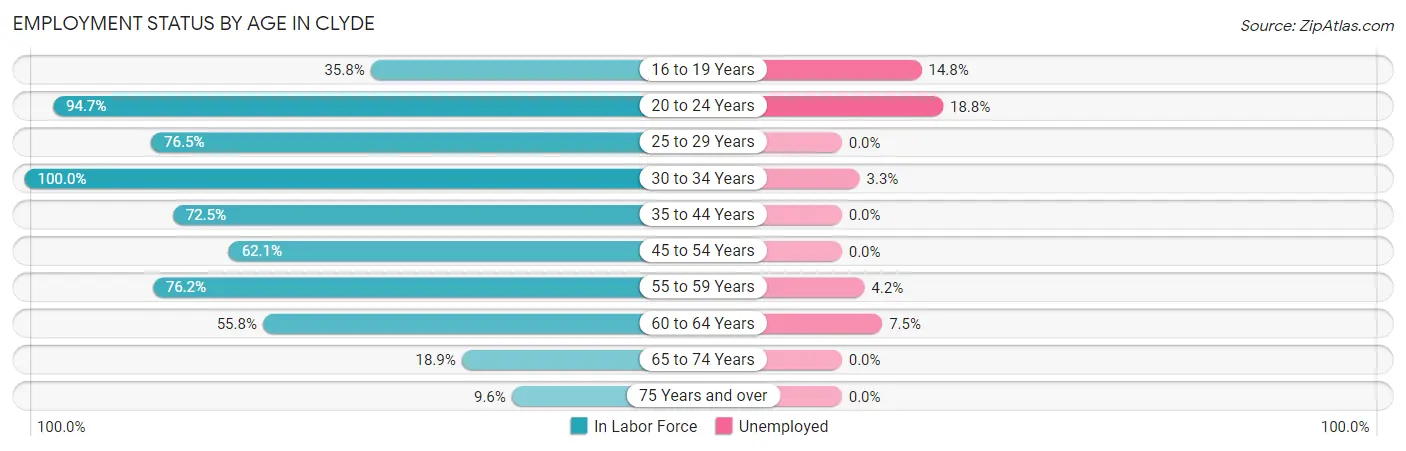
Employment Status by Age in Clyde
According to the labor force statistics for Clyde, out of the total population over 16 years of age (2,946), 59.4% or 1,750 individuals are in the labor force, with 5.9% or 103 of them unemployed. The age group with the highest labor force participation rate is 30 to 34 years, with 100.0% or 152 individuals in the labor force. Within the labor force, the 20 to 24 years age range has the highest percentage of unemployed individuals, with 18.8% or 54 of them being unemployed.
| Age Bracket | In Labor Force | Unemployed |
| 16 to 19 Years | 162 (35.8%) | 24 (14.8%) |
| 20 to 24 Years | 287 (94.7%) | 54 (18.8%) |
| 25 to 29 Years | 88 (76.5%) | 0 (0.0%) |
| 30 to 34 Years | 152 (100.0%) | 5 (3.3%) |
| 35 to 44 Years | 372 (72.5%) | 0 (0.0%) |
| 45 to 54 Years | 284 (62.1%) | 0 (0.0%) |
| 55 to 59 Years | 144 (76.2%) | 6 (4.2%) |
| 60 to 64 Years | 201 (55.8%) | 15 (7.5%) |
| 65 to 74 Years | 43 (18.9%) | 0 (0.0%) |
| 75 Years and over | 17 (9.6%) | 0 (0.0%) |
| Total | 1,750 (59.4%) | 103 (5.9%) |
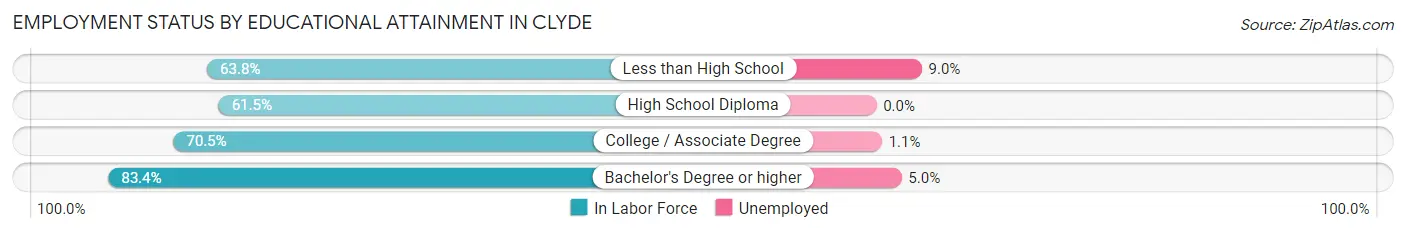
Employment Status by Educational Attainment in Clyde
According to labor force statistics for Clyde, 69.5% of individuals (1,241) out of the total population between 25 and 64 years of age (1,786) are in the labor force, with 2.1% or 26 of them being unemployed. The group with the highest labor force participation rate are those with the educational attainment of bachelor's degree or higher, with 83.4% or 302 individuals in the labor force. Within the labor force, individuals with less than high school education have the highest percentage of unemployment, with 9.0% or 6 of them being unemployed.
| Educational Attainment | In Labor Force | Unemployed |
| Less than High School | 67 (63.8%) | 9 (9.0%) |
| High School Diploma | 398 (61.5%) | 0 (0.0%) |
| College / Associate Degree | 474 (70.5%) | 7 (1.1%) |
| Bachelor's Degree or higher | 302 (83.4%) | 18 (5.0%) |
| Total | 1,241 (69.5%) | 38 (2.1%) |
Employment Occupations by Sex in Clyde
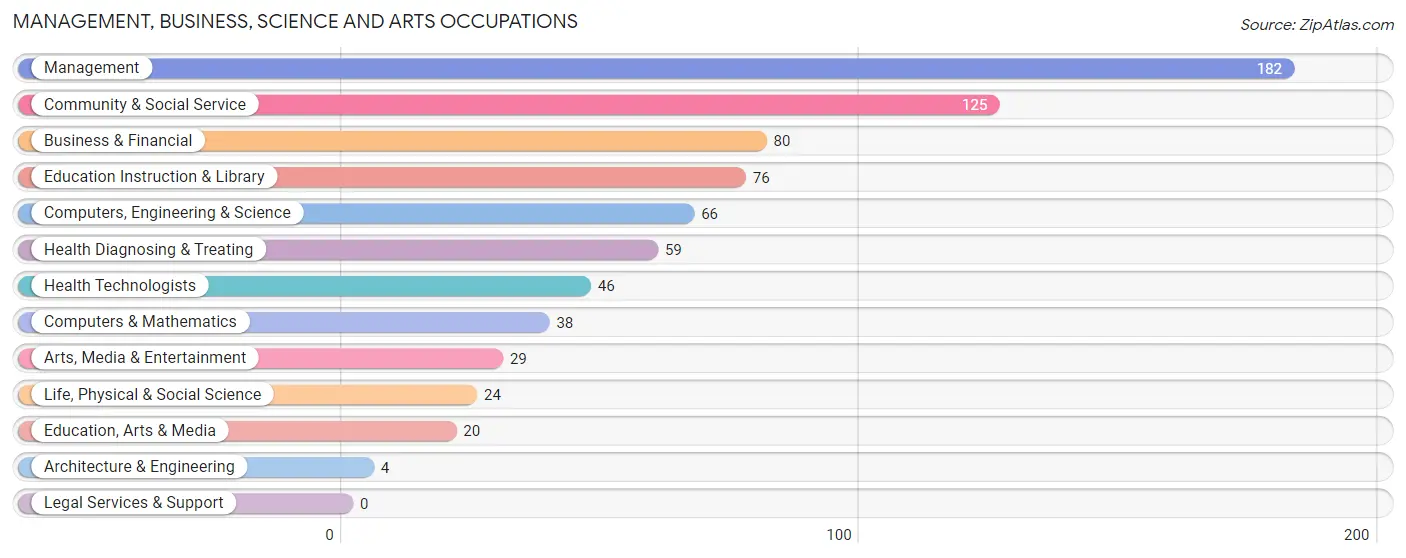
Management, Business, Science and Arts Occupations
The most common Management, Business, Science and Arts occupations in Clyde are Management (182 | 11.1%), Community & Social Service (125 | 7.6%), Business & Financial (80 | 4.9%), Education Instruction & Library (76 | 4.6%), and Computers, Engineering & Science (66 | 4.0%).
Management, Business, Science and Arts Occupations by Sex
Within the Management, Business, Science and Arts occupations in Clyde, the most male-oriented occupations are Architecture & Engineering (100.0%), Life, Physical & Social Science (100.0%), and Health Technologists (65.2%), while the most female-oriented occupations are Education, Arts & Media (100.0%), Education Instruction & Library (84.2%), and Business & Financial (83.8%).
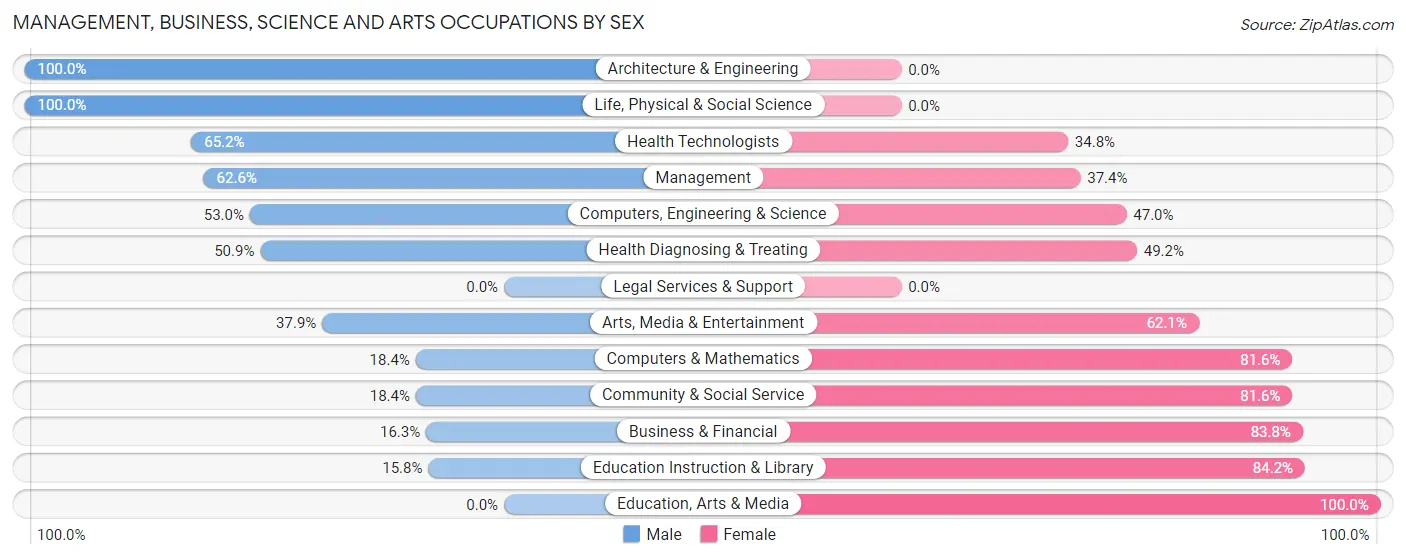
| Occupation | Male | Female |
| Management | 114 (62.6%) | 68 (37.4%) |
| Business & Financial | 13 (16.3%) | 67 (83.8%) |
| Computers, Engineering & Science | 35 (53.0%) | 31 (47.0%) |
| Computers & Mathematics | 7 (18.4%) | 31 (81.6%) |
| Architecture & Engineering | 4 (100.0%) | 0 (0.0%) |
| Life, Physical & Social Science | 24 (100.0%) | 0 (0.0%) |
| Community & Social Service | 23 (18.4%) | 102 (81.6%) |
| Education, Arts & Media | 0 (0.0%) | 20 (100.0%) |
| Legal Services & Support | 0 (0.0%) | 0 (0.0%) |
| Education Instruction & Library | 12 (15.8%) | 64 (84.2%) |
| Arts, Media & Entertainment | 11 (37.9%) | 18 (62.1%) |
| Health Diagnosing & Treating | 30 (50.8%) | 29 (49.1%) |
| Health Technologists | 30 (65.2%) | 16 (34.8%) |
| Total (Category) | 215 (42.0%) | 297 (58.0%) |
| Total (Overall) | 907 (55.1%) | 739 (44.9%) |
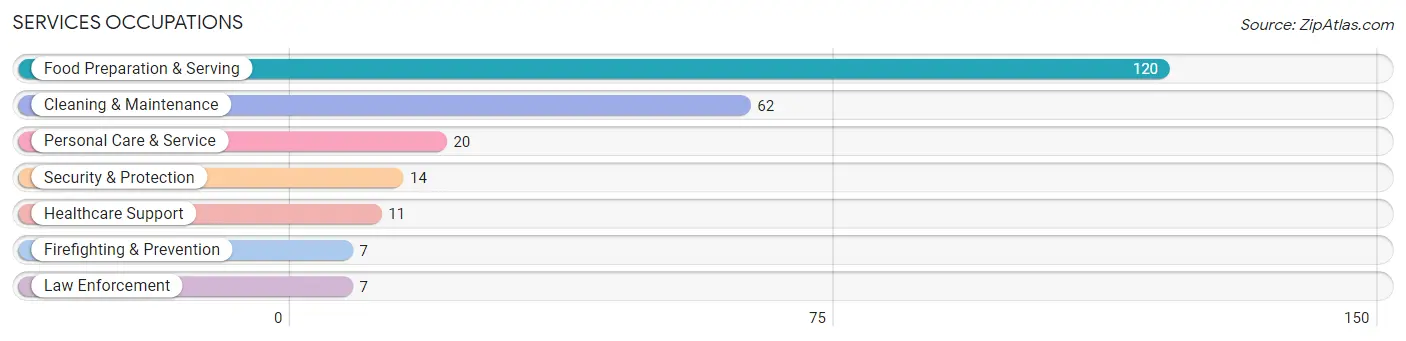
Services Occupations
The most common Services occupations in Clyde are Food Preparation & Serving (120 | 7.3%), Cleaning & Maintenance (62 | 3.8%), Personal Care & Service (20 | 1.2%), Security & Protection (14 | 0.9%), and Healthcare Support (11 | 0.7%).
Services Occupations by Sex
Within the Services occupations in Clyde, the most male-oriented occupations are Law Enforcement (100.0%), Security & Protection (50.0%), and Food Preparation & Serving (38.3%), while the most female-oriented occupations are Healthcare Support (100.0%), Firefighting & Prevention (100.0%), and Personal Care & Service (100.0%).
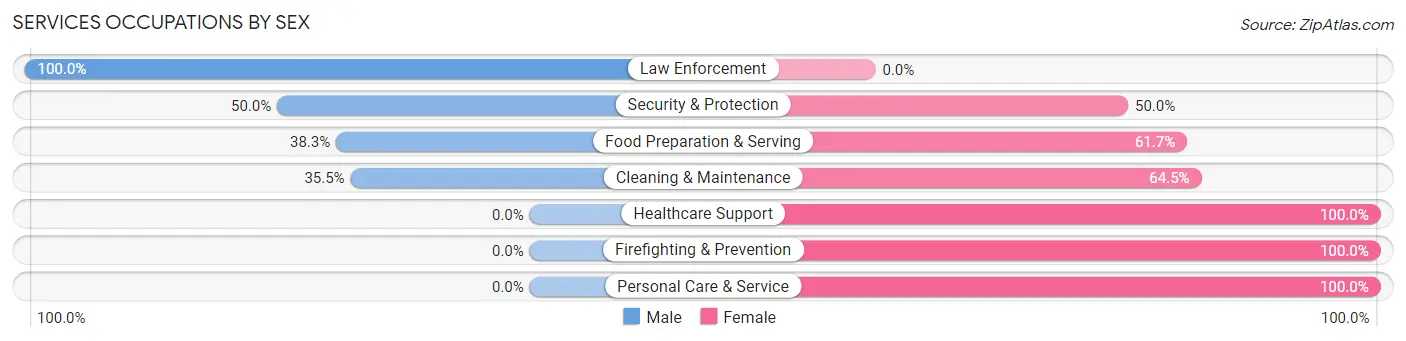
| Occupation | Male | Female |
| Healthcare Support | 0 (0.0%) | 11 (100.0%) |
| Security & Protection | 7 (50.0%) | 7 (50.0%) |
| Firefighting & Prevention | 0 (0.0%) | 7 (100.0%) |
| Law Enforcement | 7 (100.0%) | 0 (0.0%) |
| Food Preparation & Serving | 46 (38.3%) | 74 (61.7%) |
| Cleaning & Maintenance | 22 (35.5%) | 40 (64.5%) |
| Personal Care & Service | 0 (0.0%) | 20 (100.0%) |
| Total (Category) | 75 (33.0%) | 152 (67.0%) |
| Total (Overall) | 907 (55.1%) | 739 (44.9%) |
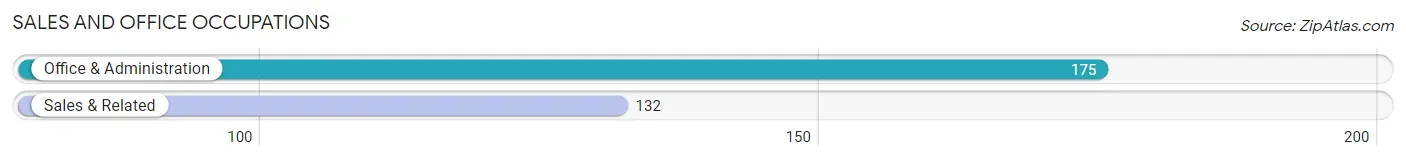
Sales and Office Occupations
The most common Sales and Office occupations in Clyde are Office & Administration (175 | 10.6%), and Sales & Related (132 | 8.0%).
Sales and Office Occupations by Sex
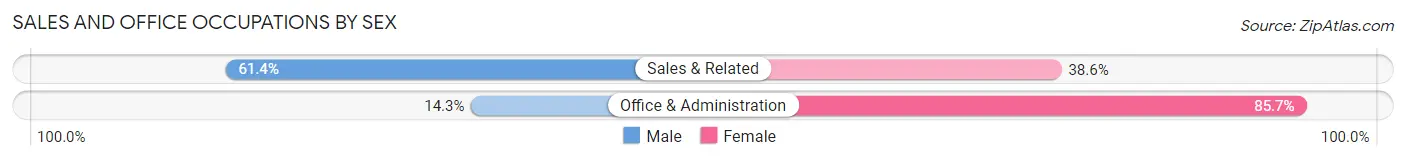
| Occupation | Male | Female |
| Sales & Related | 81 (61.4%) | 51 (38.6%) |
| Office & Administration | 25 (14.3%) | 150 (85.7%) |
| Total (Category) | 106 (34.5%) | 201 (65.5%) |
| Total (Overall) | 907 (55.1%) | 739 (44.9%) |
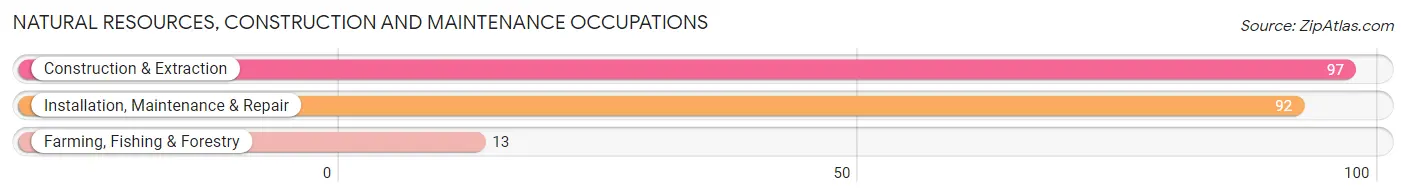
Natural Resources, Construction and Maintenance Occupations
The most common Natural Resources, Construction and Maintenance occupations in Clyde are Construction & Extraction (97 | 5.9%), Installation, Maintenance & Repair (92 | 5.6%), and Farming, Fishing & Forestry (13 | 0.8%).
Natural Resources, Construction and Maintenance Occupations by Sex
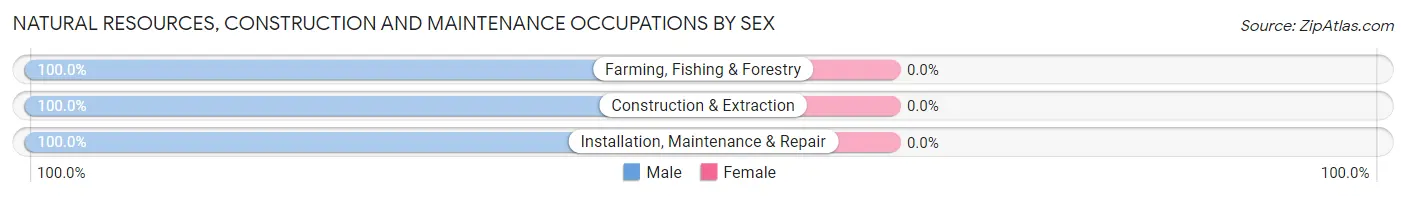
| Occupation | Male | Female |
| Farming, Fishing & Forestry | 13 (100.0%) | 0 (0.0%) |
| Construction & Extraction | 97 (100.0%) | 0 (0.0%) |
| Installation, Maintenance & Repair | 92 (100.0%) | 0 (0.0%) |
| Total (Category) | 202 (100.0%) | 0 (0.0%) |
| Total (Overall) | 907 (55.1%) | 739 (44.9%) |
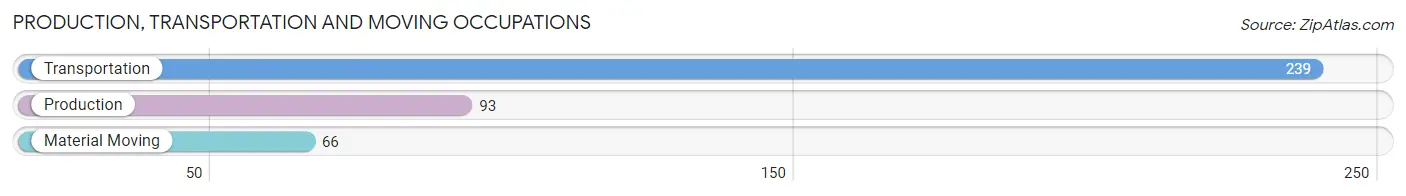
Production, Transportation and Moving Occupations
The most common Production, Transportation and Moving occupations in Clyde are Transportation (239 | 14.5%), Production (93 | 5.7%), and Material Moving (66 | 4.0%).
Production, Transportation and Moving Occupations by Sex
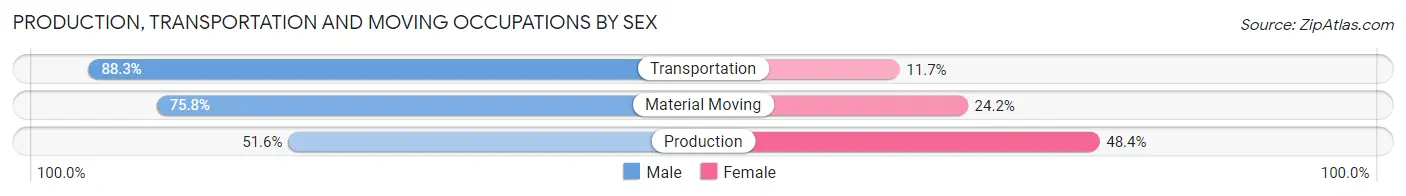
| Occupation | Male | Female |
| Production | 48 (51.6%) | 45 (48.4%) |
| Transportation | 211 (88.3%) | 28 (11.7%) |
| Material Moving | 50 (75.8%) | 16 (24.2%) |
| Total (Category) | 309 (77.6%) | 89 (22.4%) |
| Total (Overall) | 907 (55.1%) | 739 (44.9%) |
Employment Industries by Sex in Clyde
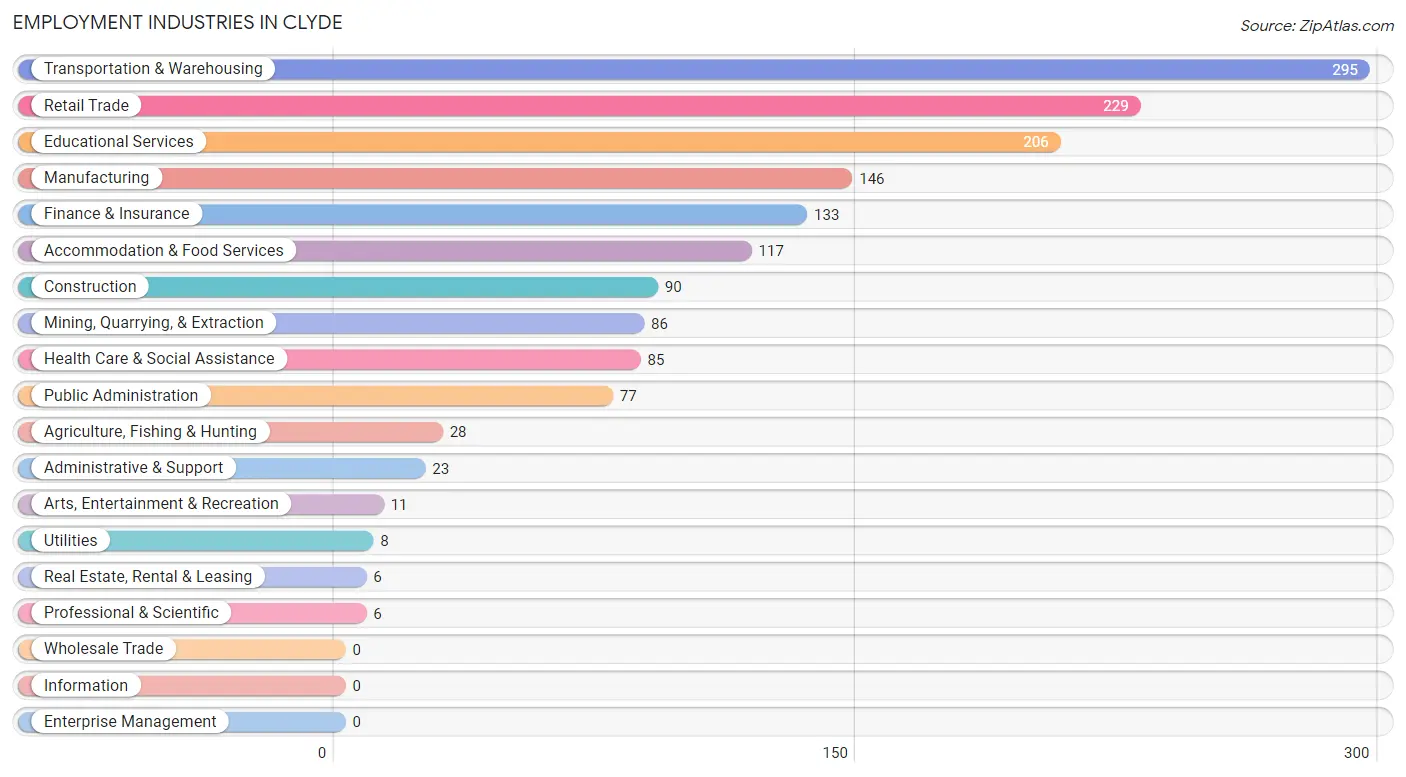
Employment Industries in Clyde
The major employment industries in Clyde include Transportation & Warehousing (295 | 17.9%), Retail Trade (229 | 13.9%), Educational Services (206 | 12.5%), Manufacturing (146 | 8.9%), and Finance & Insurance (133 | 8.1%).
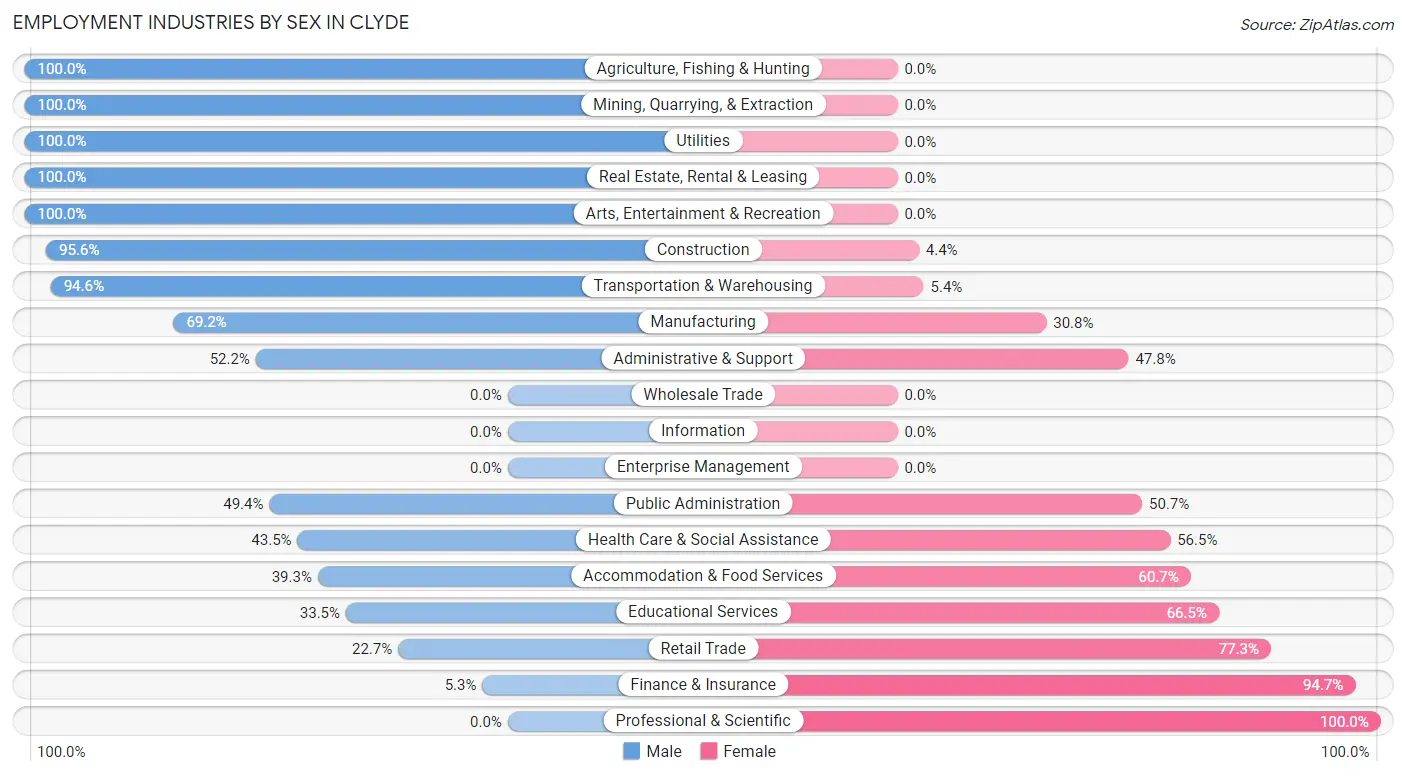
Employment Industries by Sex in Clyde
The Clyde industries that see more men than women are Agriculture, Fishing & Hunting (100.0%), Mining, Quarrying, & Extraction (100.0%), and Utilities (100.0%), whereas the industries that tend to have a higher number of women are Professional & Scientific (100.0%), Finance & Insurance (94.7%), and Retail Trade (77.3%).
| Industry | Male | Female |
| Agriculture, Fishing & Hunting | 28 (100.0%) | 0 (0.0%) |
| Mining, Quarrying, & Extraction | 86 (100.0%) | 0 (0.0%) |
| Construction | 86 (95.6%) | 4 (4.4%) |
| Manufacturing | 101 (69.2%) | 45 (30.8%) |
| Wholesale Trade | 0 (0.0%) | 0 (0.0%) |
| Retail Trade | 52 (22.7%) | 177 (77.3%) |
| Transportation & Warehousing | 279 (94.6%) | 16 (5.4%) |
| Utilities | 8 (100.0%) | 0 (0.0%) |
| Information | 0 (0.0%) | 0 (0.0%) |
| Finance & Insurance | 7 (5.3%) | 126 (94.7%) |
| Real Estate, Rental & Leasing | 6 (100.0%) | 0 (0.0%) |
| Professional & Scientific | 0 (0.0%) | 6 (100.0%) |
| Enterprise Management | 0 (0.0%) | 0 (0.0%) |
| Administrative & Support | 12 (52.2%) | 11 (47.8%) |
| Educational Services | 69 (33.5%) | 137 (66.5%) |
| Health Care & Social Assistance | 37 (43.5%) | 48 (56.5%) |
| Arts, Entertainment & Recreation | 11 (100.0%) | 0 (0.0%) |
| Accommodation & Food Services | 46 (39.3%) | 71 (60.7%) |
| Public Administration | 38 (49.3%) | 39 (50.6%) |
| Total | 907 (55.1%) | 739 (44.9%) |
Education in Clyde
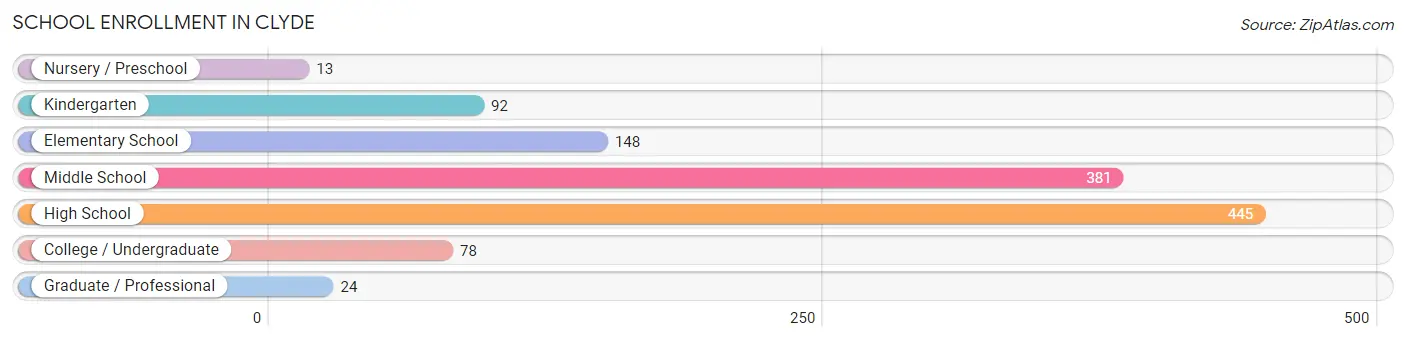
School Enrollment in Clyde
The most common levels of schooling among the 1,181 students in Clyde are high school (445 | 37.7%), middle school (381 | 32.3%), and elementary school (148 | 12.5%).
| School Level | # Students | % Students |
| Nursery / Preschool | 13 | 1.1% |
| Kindergarten | 92 | 7.8% |
| Elementary School | 148 | 12.5% |
| Middle School | 381 | 32.3% |
| High School | 445 | 37.7% |
| College / Undergraduate | 78 | 6.6% |
| Graduate / Professional | 24 | 2.0% |
| Total | 1,181 | 100.0% |
School Enrollment by Age by Funding Source in Clyde
Out of a total of 1,181 students who are enrolled in schools in Clyde, 67 (5.7%) attend a private institution, while the remaining 1,114 (94.3%) are enrolled in public schools. The age group of 3 to 4 year olds has the highest likelihood of being enrolled in private schools, with 13 (68.4% in the age bracket) enrolled. Conversely, the age group of 5 to 9 year old has the lowest likelihood of being enrolled in a private school, with 217 (100.0% in the age bracket) attending a public institution.
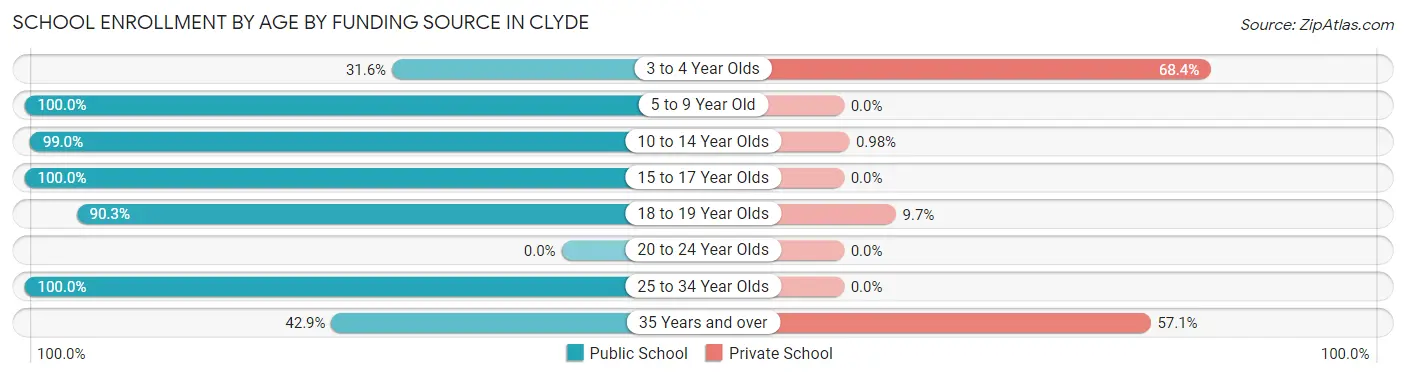
| Age Bracket | Public School | Private School |
| 3 to 4 Year Olds | 6 (31.6%) | 13 (68.4%) |
| 5 to 9 Year Old | 217 (100.0%) | 0 (0.0%) |
| 10 to 14 Year Olds | 406 (99.0%) | 4 (1.0%) |
| 15 to 17 Year Olds | 287 (100.0%) | 0 (0.0%) |
| 18 to 19 Year Olds | 168 (90.3%) | 18 (9.7%) |
| 20 to 24 Year Olds | 0 (0.0%) | 0 (0.0%) |
| 25 to 34 Year Olds | 6 (100.0%) | 0 (0.0%) |
| 35 Years and over | 24 (42.9%) | 32 (57.1%) |
| Total | 1,114 (94.3%) | 67 (5.7%) |
Educational Attainment by Field of Study in Clyde
Education (120 | 25.4%), business (83 | 17.5%), multidisciplinary studies (55 | 11.6%), communications (40 | 8.5%), and visual & performing arts (39 | 8.3%) are the most common fields of study among 473 individuals in Clyde who have obtained a bachelor's degree or higher.
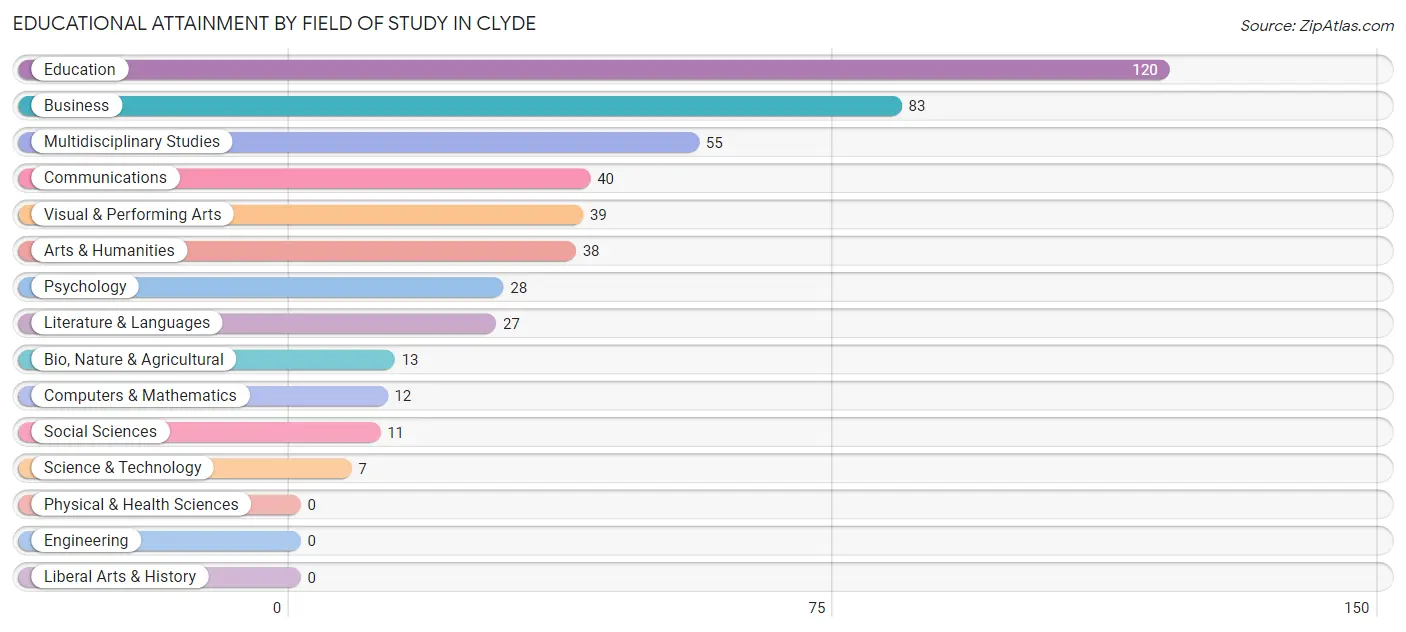
| Field of Study | # Graduates | % Graduates |
| Computers & Mathematics | 12 | 2.5% |
| Bio, Nature & Agricultural | 13 | 2.8% |
| Physical & Health Sciences | 0 | 0.0% |
| Psychology | 28 | 5.9% |
| Social Sciences | 11 | 2.3% |
| Engineering | 0 | 0.0% |
| Multidisciplinary Studies | 55 | 11.6% |
| Science & Technology | 7 | 1.5% |
| Business | 83 | 17.5% |
| Education | 120 | 25.4% |
| Literature & Languages | 27 | 5.7% |
| Liberal Arts & History | 0 | 0.0% |
| Visual & Performing Arts | 39 | 8.3% |
| Communications | 40 | 8.5% |
| Arts & Humanities | 38 | 8.0% |
| Total | 473 | 100.0% |
Transportation & Commute in Clyde
Vehicle Availability by Sex in Clyde
The most prevalent vehicle ownership categories in Clyde are males with 3 vehicles (343, accounting for 37.8%) and females with 3 vehicles (97, making up 49.6%).
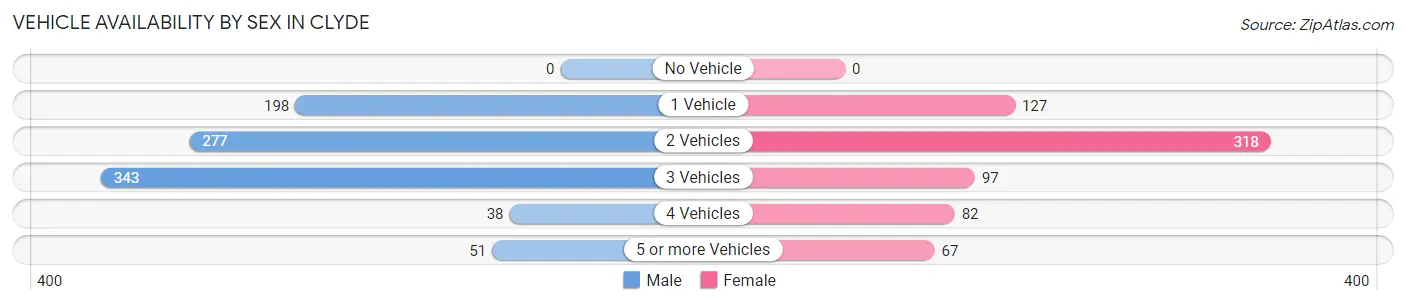
| Vehicles Available | Male | Female |
| No Vehicle | 0 (0.0%) | 0 (0.0%) |
| 1 Vehicle | 198 (21.8%) | 127 (18.4%) |
| 2 Vehicles | 277 (30.5%) | 318 (46.0%) |
| 3 Vehicles | 343 (37.8%) | 97 (14.0%) |
| 4 Vehicles | 38 (4.2%) | 82 (11.9%) |
| 5 or more Vehicles | 51 (5.6%) | 67 (9.7%) |
| Total | 907 (100.0%) | 691 (100.0%) |
Commute Time in Clyde
The most frequently occuring commute durations in Clyde are 20 to 24 minutes (424 commuters, 28.2%), 15 to 19 minutes (204 commuters, 13.6%), and 5 to 9 minutes (191 commuters, 12.7%).
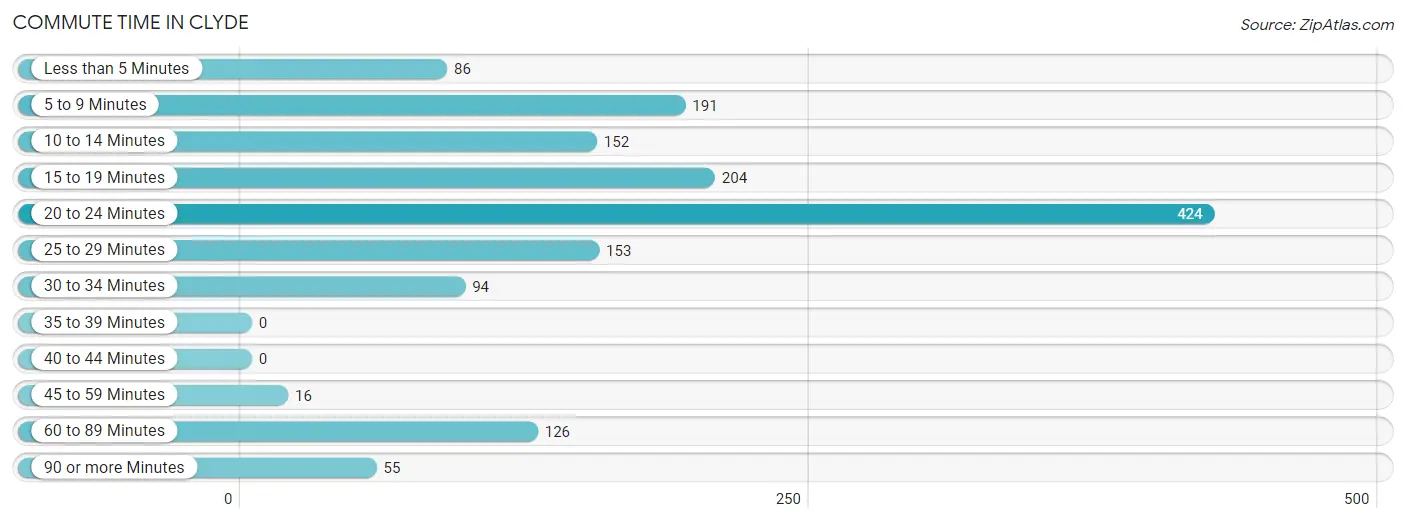
| Commute Time | # Commuters | % Commuters |
| Less than 5 Minutes | 86 | 5.7% |
| 5 to 9 Minutes | 191 | 12.7% |
| 10 to 14 Minutes | 152 | 10.1% |
| 15 to 19 Minutes | 204 | 13.6% |
| 20 to 24 Minutes | 424 | 28.2% |
| 25 to 29 Minutes | 153 | 10.2% |
| 30 to 34 Minutes | 94 | 6.3% |
| 35 to 39 Minutes | 0 | 0.0% |
| 40 to 44 Minutes | 0 | 0.0% |
| 45 to 59 Minutes | 16 | 1.1% |
| 60 to 89 Minutes | 126 | 8.4% |
| 90 or more Minutes | 55 | 3.7% |
Commute Time by Sex in Clyde
The most common commute times in Clyde are 20 to 24 minutes (349 commuters, 39.7%) for males and 5 to 9 minutes (131 commuters, 21.1%) for females.
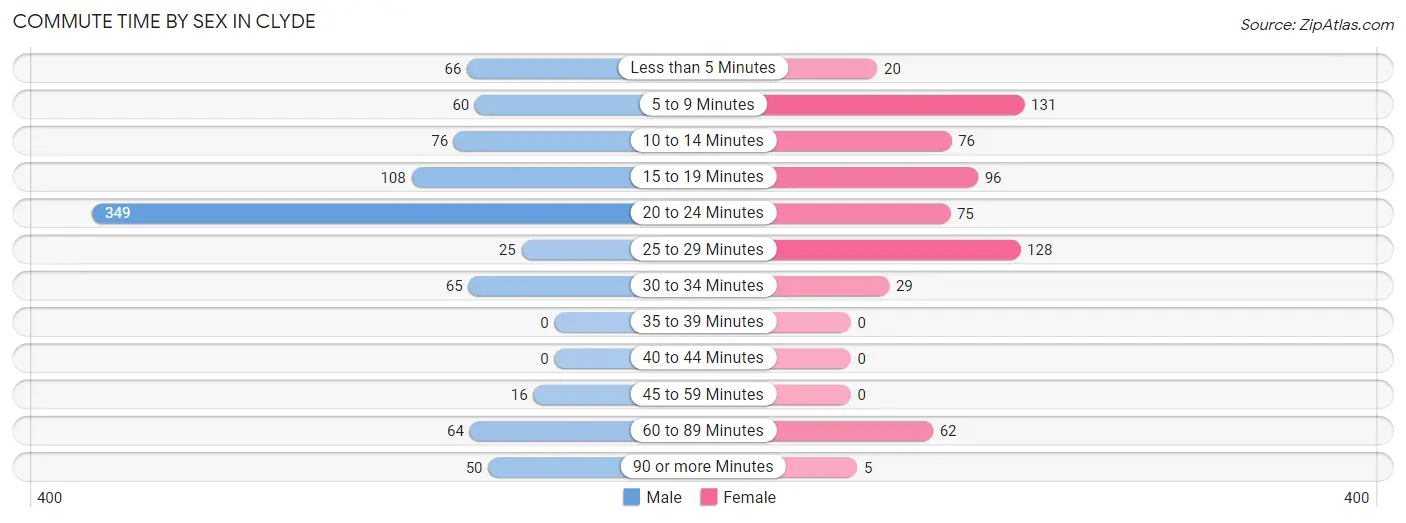
| Commute Time | Male | Female |
| Less than 5 Minutes | 66 (7.5%) | 20 (3.2%) |
| 5 to 9 Minutes | 60 (6.8%) | 131 (21.1%) |
| 10 to 14 Minutes | 76 (8.6%) | 76 (12.2%) |
| 15 to 19 Minutes | 108 (12.3%) | 96 (15.4%) |
| 20 to 24 Minutes | 349 (39.7%) | 75 (12.1%) |
| 25 to 29 Minutes | 25 (2.8%) | 128 (20.6%) |
| 30 to 34 Minutes | 65 (7.4%) | 29 (4.7%) |
| 35 to 39 Minutes | 0 (0.0%) | 0 (0.0%) |
| 40 to 44 Minutes | 0 (0.0%) | 0 (0.0%) |
| 45 to 59 Minutes | 16 (1.8%) | 0 (0.0%) |
| 60 to 89 Minutes | 64 (7.3%) | 62 (10.0%) |
| 90 or more Minutes | 50 (5.7%) | 5 (0.8%) |
Time of Departure to Work by Sex in Clyde
The most frequent times of departure to work in Clyde are 7:00 AM to 7:29 AM (196, 22.3%) for males and 7:00 AM to 7:29 AM (102, 16.4%) for females.
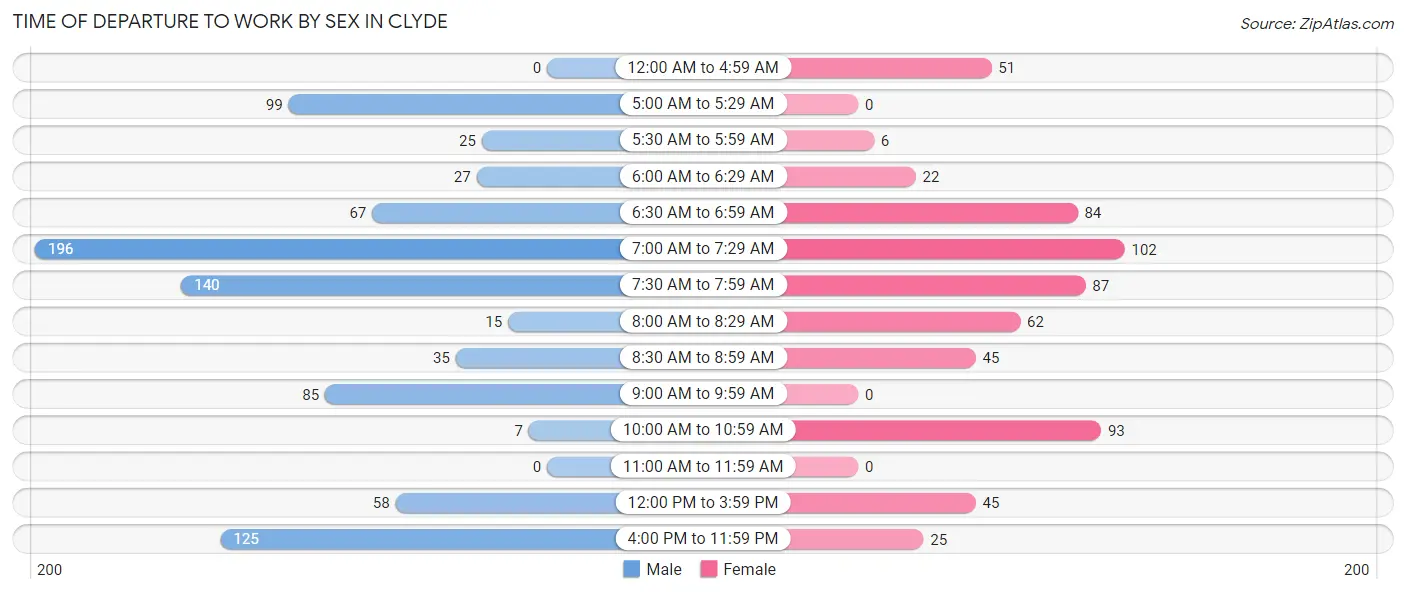
| Time of Departure | Male | Female |
| 12:00 AM to 4:59 AM | 0 (0.0%) | 51 (8.2%) |
| 5:00 AM to 5:29 AM | 99 (11.3%) | 0 (0.0%) |
| 5:30 AM to 5:59 AM | 25 (2.8%) | 6 (1.0%) |
| 6:00 AM to 6:29 AM | 27 (3.1%) | 22 (3.5%) |
| 6:30 AM to 6:59 AM | 67 (7.6%) | 84 (13.5%) |
| 7:00 AM to 7:29 AM | 196 (22.3%) | 102 (16.4%) |
| 7:30 AM to 7:59 AM | 140 (15.9%) | 87 (14.0%) |
| 8:00 AM to 8:29 AM | 15 (1.7%) | 62 (10.0%) |
| 8:30 AM to 8:59 AM | 35 (4.0%) | 45 (7.2%) |
| 9:00 AM to 9:59 AM | 85 (9.7%) | 0 (0.0%) |
| 10:00 AM to 10:59 AM | 7 (0.8%) | 93 (14.9%) |
| 11:00 AM to 11:59 AM | 0 (0.0%) | 0 (0.0%) |
| 12:00 PM to 3:59 PM | 58 (6.6%) | 45 (7.2%) |
| 4:00 PM to 11:59 PM | 125 (14.2%) | 25 (4.0%) |
| Total | 879 (100.0%) | 622 (100.0%) |
Housing Occupancy in Clyde
Occupancy by Ownership in Clyde
Of the total 1,247 dwellings in Clyde, owner-occupied units account for 933 (74.8%), while renter-occupied units make up 314 (25.2%).
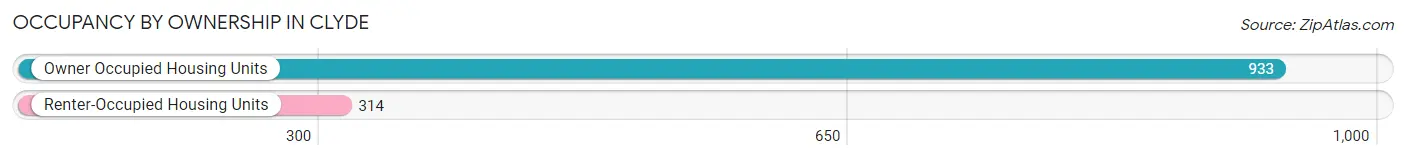
| Occupancy | # Housing Units | % Housing Units |
| Owner Occupied Housing Units | 933 | 74.8% |
| Renter-Occupied Housing Units | 314 | 25.2% |
| Total Occupied Housing Units | 1,247 | 100.0% |
Occupancy by Household Size in Clyde
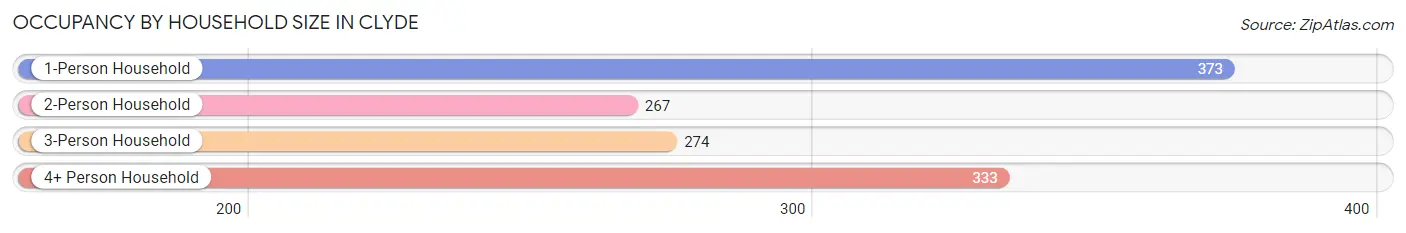
| Household Size | # Housing Units | % Housing Units |
| 1-Person Household | 373 | 29.9% |
| 2-Person Household | 267 | 21.4% |
| 3-Person Household | 274 | 22.0% |
| 4+ Person Household | 333 | 26.7% |
| Total Housing Units | 1,247 | 100.0% |
Occupancy by Ownership by Household Size in Clyde
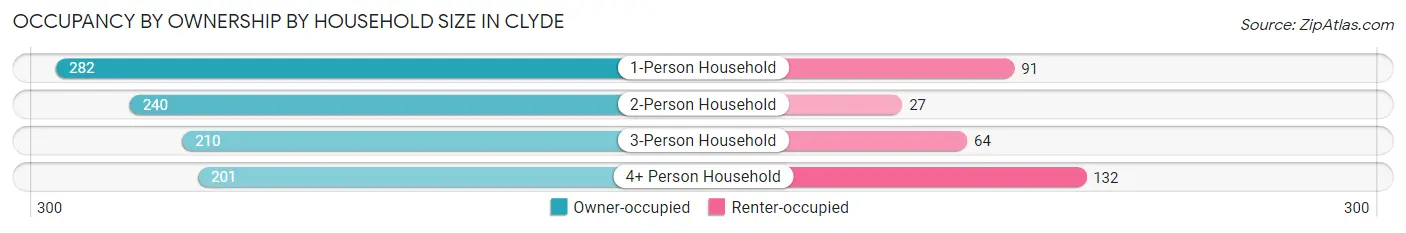
| Household Size | Owner-occupied | Renter-occupied |
| 1-Person Household | 282 (75.6%) | 91 (24.4%) |
| 2-Person Household | 240 (89.9%) | 27 (10.1%) |
| 3-Person Household | 210 (76.6%) | 64 (23.4%) |
| 4+ Person Household | 201 (60.4%) | 132 (39.6%) |
| Total Housing Units | 933 (74.8%) | 314 (25.2%) |
Occupancy by Educational Attainment in Clyde
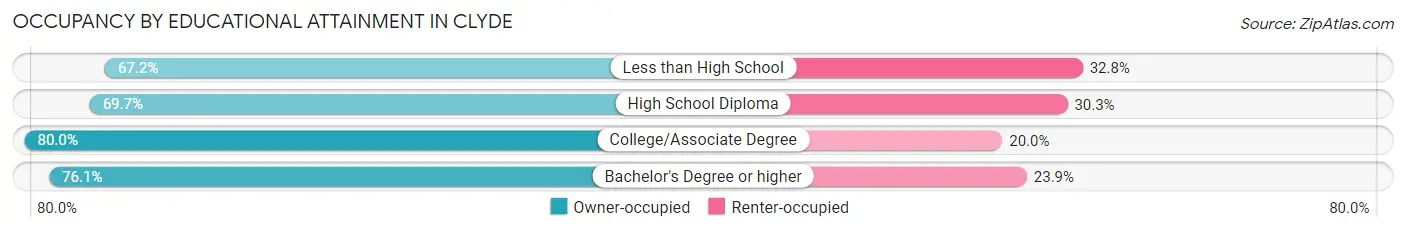
| Household Size | Owner-occupied | Renter-occupied |
| Less than High School | 78 (67.2%) | 38 (32.8%) |
| High School Diploma | 264 (69.7%) | 115 (30.3%) |
| College/Associate Degree | 384 (80.0%) | 96 (20.0%) |
| Bachelor's Degree or higher | 207 (76.1%) | 65 (23.9%) |
Occupancy by Age of Householder in Clyde
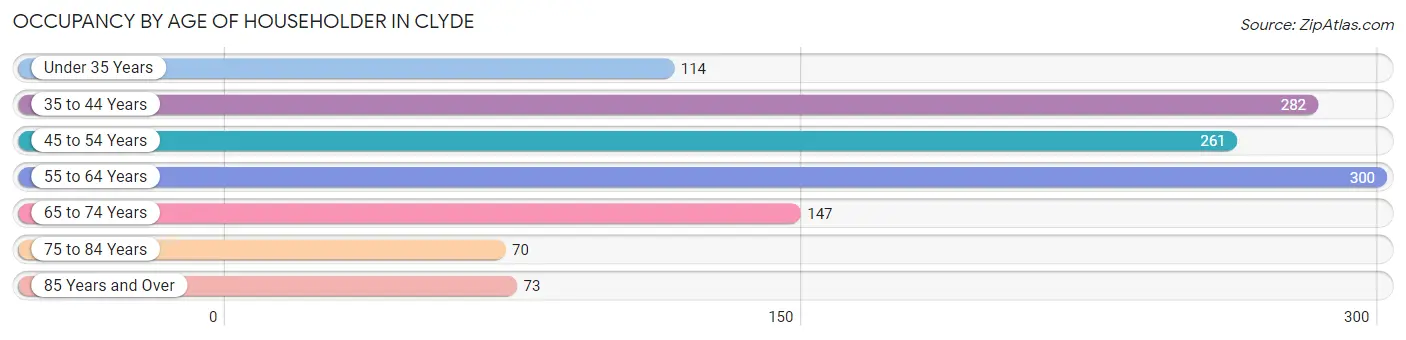
| Age Bracket | # Households | % Households |
| Under 35 Years | 114 | 9.1% |
| 35 to 44 Years | 282 | 22.6% |
| 45 to 54 Years | 261 | 20.9% |
| 55 to 64 Years | 300 | 24.1% |
| 65 to 74 Years | 147 | 11.8% |
| 75 to 84 Years | 70 | 5.6% |
| 85 Years and Over | 73 | 5.9% |
| Total | 1,247 | 100.0% |
Housing Finances in Clyde
Median Income by Occupancy in Clyde
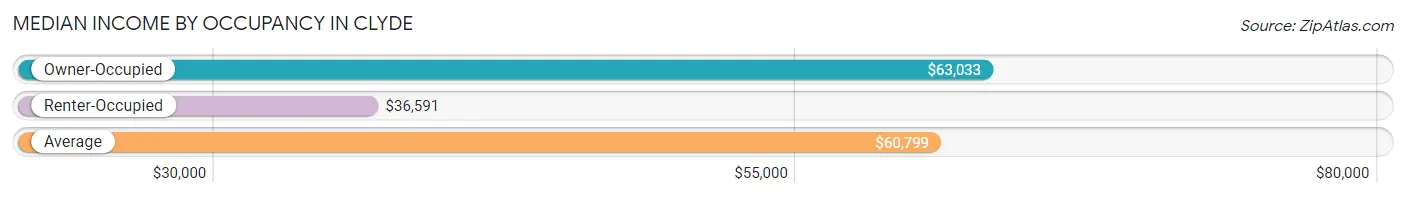
| Occupancy Type | # Households | Median Income |
| Owner-Occupied | 933 (74.8%) | $63,033 |
| Renter-Occupied | 314 (25.2%) | $36,591 |
| Average | 1,247 (100.0%) | $60,799 |
Occupancy by Householder Income Bracket in Clyde
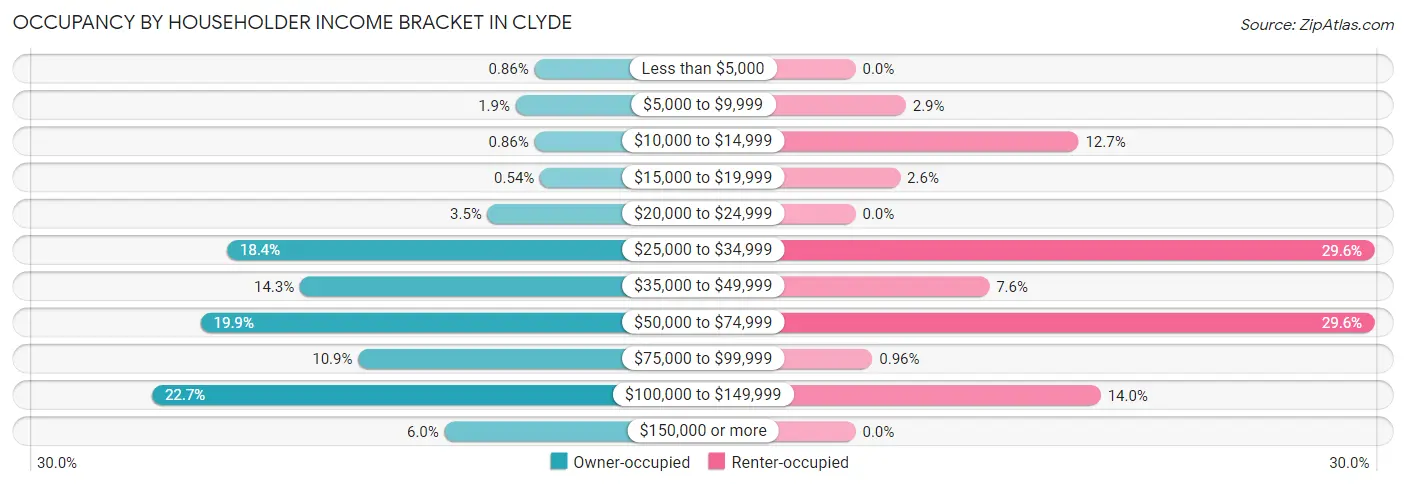
| Income Bracket | Owner-occupied | Renter-occupied |
| Less than $5,000 | 8 (0.9%) | 0 (0.0%) |
| $5,000 to $9,999 | 18 (1.9%) | 9 (2.9%) |
| $10,000 to $14,999 | 8 (0.9%) | 40 (12.7%) |
| $15,000 to $19,999 | 5 (0.5%) | 8 (2.5%) |
| $20,000 to $24,999 | 33 (3.5%) | 0 (0.0%) |
| $25,000 to $34,999 | 172 (18.4%) | 93 (29.6%) |
| $35,000 to $49,999 | 133 (14.3%) | 24 (7.6%) |
| $50,000 to $74,999 | 186 (19.9%) | 93 (29.6%) |
| $75,000 to $99,999 | 102 (10.9%) | 3 (1.0%) |
| $100,000 to $149,999 | 212 (22.7%) | 44 (14.0%) |
| $150,000 or more | 56 (6.0%) | 0 (0.0%) |
| Total | 933 (100.0%) | 314 (100.0%) |
Monthly Housing Cost Tiers in Clyde
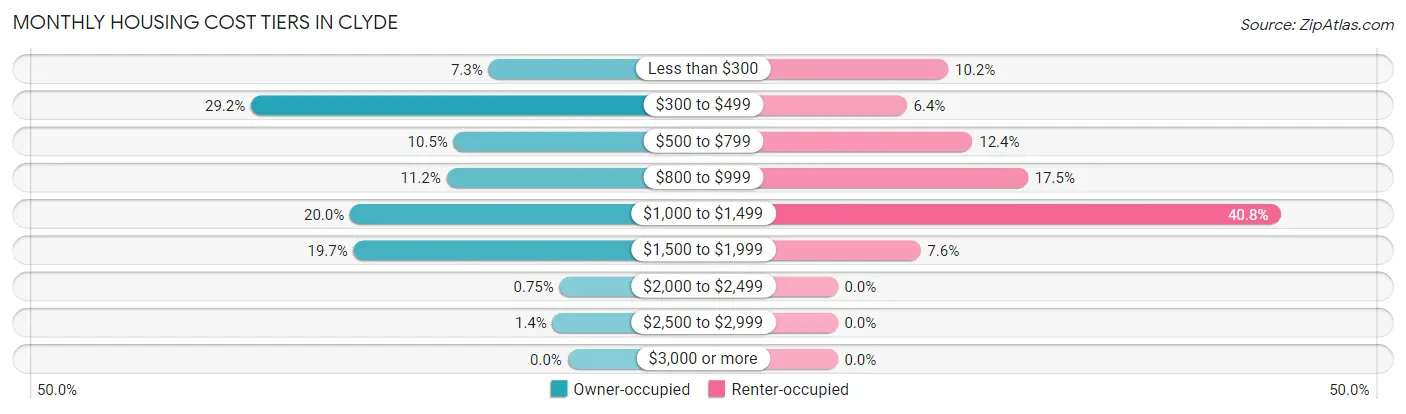
| Monthly Cost | Owner-occupied | Renter-occupied |
| Less than $300 | 68 (7.3%) | 32 (10.2%) |
| $300 to $499 | 272 (29.1%) | 20 (6.4%) |
| $500 to $799 | 98 (10.5%) | 39 (12.4%) |
| $800 to $999 | 104 (11.2%) | 55 (17.5%) |
| $1,000 to $1,499 | 187 (20.0%) | 128 (40.8%) |
| $1,500 to $1,999 | 184 (19.7%) | 24 (7.6%) |
| $2,000 to $2,499 | 7 (0.7%) | 0 (0.0%) |
| $2,500 to $2,999 | 13 (1.4%) | 0 (0.0%) |
| $3,000 or more | 0 (0.0%) | 0 (0.0%) |
| Total | 933 (100.0%) | 314 (100.0%) |
Physical Housing Characteristics in Clyde
Housing Structures in Clyde
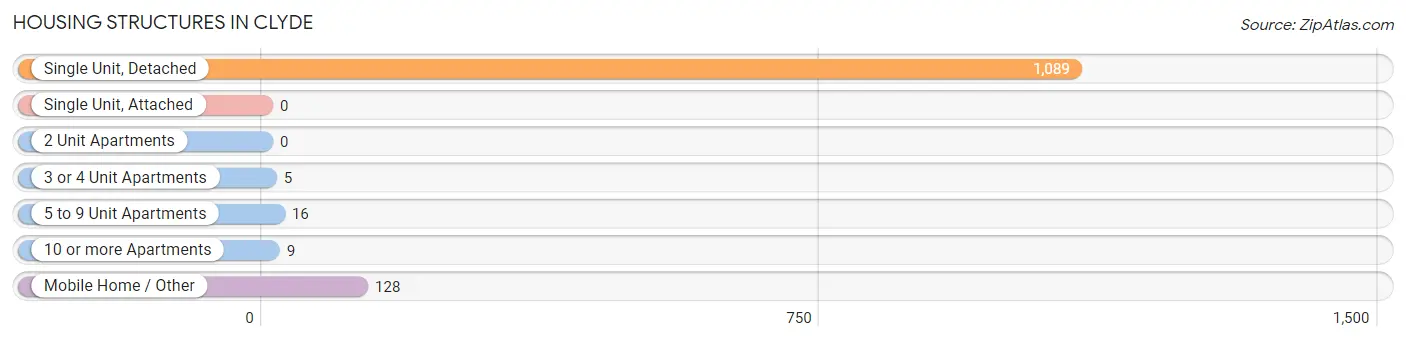
| Structure Type | # Housing Units | % Housing Units |
| Single Unit, Detached | 1,089 | 87.3% |
| Single Unit, Attached | 0 | 0.0% |
| 2 Unit Apartments | 0 | 0.0% |
| 3 or 4 Unit Apartments | 5 | 0.4% |
| 5 to 9 Unit Apartments | 16 | 1.3% |
| 10 or more Apartments | 9 | 0.7% |
| Mobile Home / Other | 128 | 10.3% |
| Total | 1,247 | 100.0% |
Housing Structures by Occupancy in Clyde
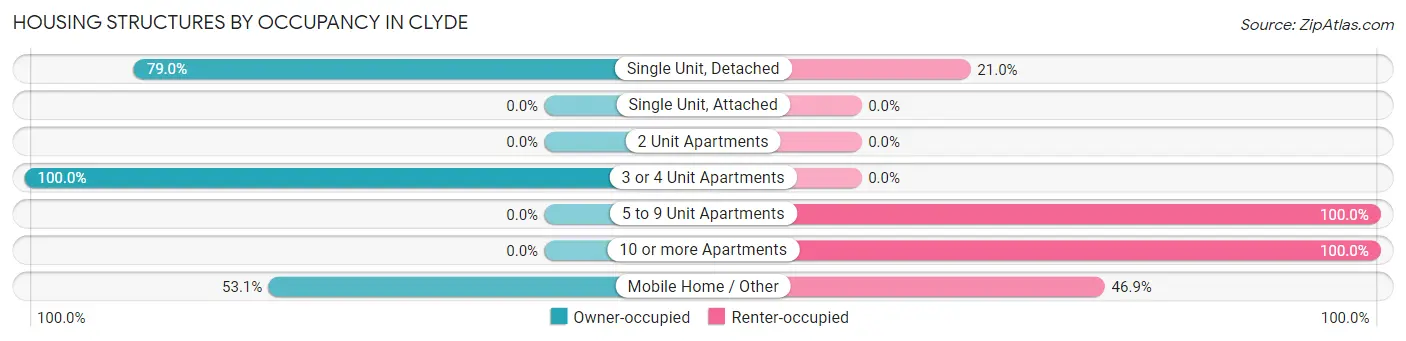
| Structure Type | Owner-occupied | Renter-occupied |
| Single Unit, Detached | 860 (79.0%) | 229 (21.0%) |
| Single Unit, Attached | 0 (0.0%) | 0 (0.0%) |
| 2 Unit Apartments | 0 (0.0%) | 0 (0.0%) |
| 3 or 4 Unit Apartments | 5 (100.0%) | 0 (0.0%) |
| 5 to 9 Unit Apartments | 0 (0.0%) | 16 (100.0%) |
| 10 or more Apartments | 0 (0.0%) | 9 (100.0%) |
| Mobile Home / Other | 68 (53.1%) | 60 (46.9%) |
| Total | 933 (74.8%) | 314 (25.2%) |
Housing Structures by Number of Rooms in Clyde
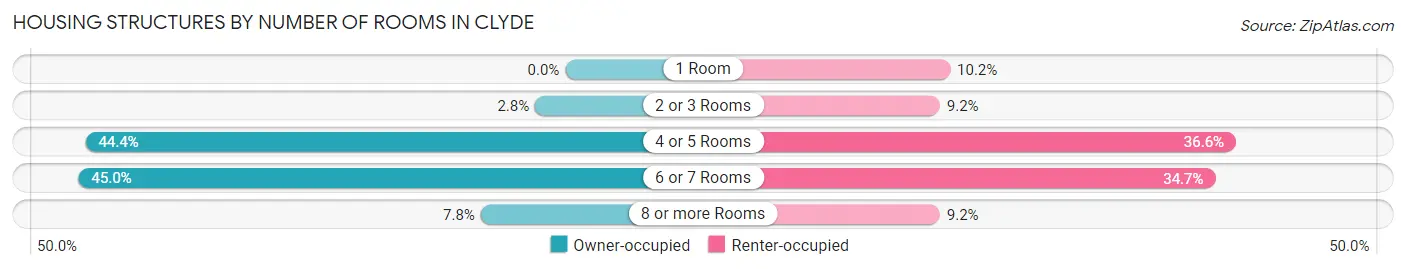
| Number of Rooms | Owner-occupied | Renter-occupied |
| 1 Room | 0 (0.0%) | 32 (10.2%) |
| 2 or 3 Rooms | 26 (2.8%) | 29 (9.2%) |
| 4 or 5 Rooms | 414 (44.4%) | 115 (36.6%) |
| 6 or 7 Rooms | 420 (45.0%) | 109 (34.7%) |
| 8 or more Rooms | 73 (7.8%) | 29 (9.2%) |
| Total | 933 (100.0%) | 314 (100.0%) |
Housing Structure by Heating Type in Clyde
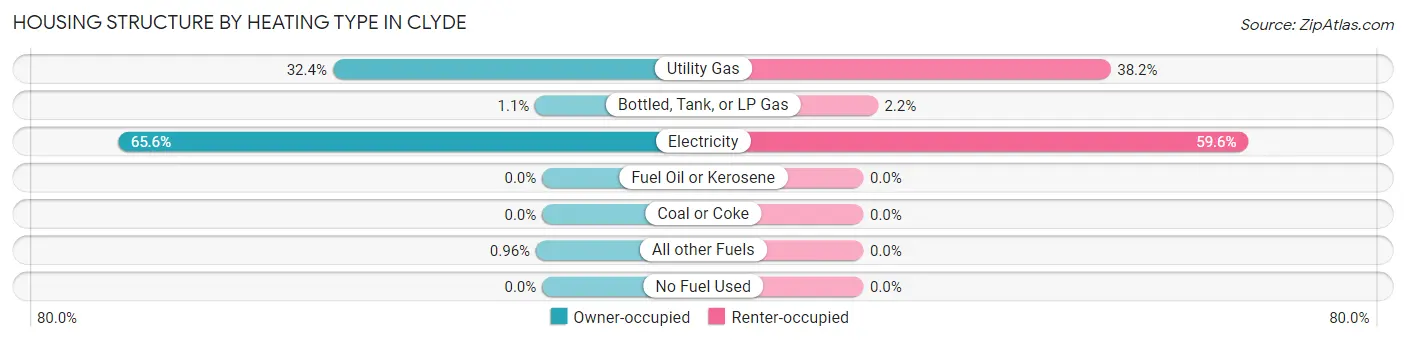
| Heating Type | Owner-occupied | Renter-occupied |
| Utility Gas | 302 (32.4%) | 120 (38.2%) |
| Bottled, Tank, or LP Gas | 10 (1.1%) | 7 (2.2%) |
| Electricity | 612 (65.6%) | 187 (59.6%) |
| Fuel Oil or Kerosene | 0 (0.0%) | 0 (0.0%) |
| Coal or Coke | 0 (0.0%) | 0 (0.0%) |
| All other Fuels | 9 (1.0%) | 0 (0.0%) |
| No Fuel Used | 0 (0.0%) | 0 (0.0%) |
| Total | 933 (100.0%) | 314 (100.0%) |
Household Vehicle Usage in Clyde
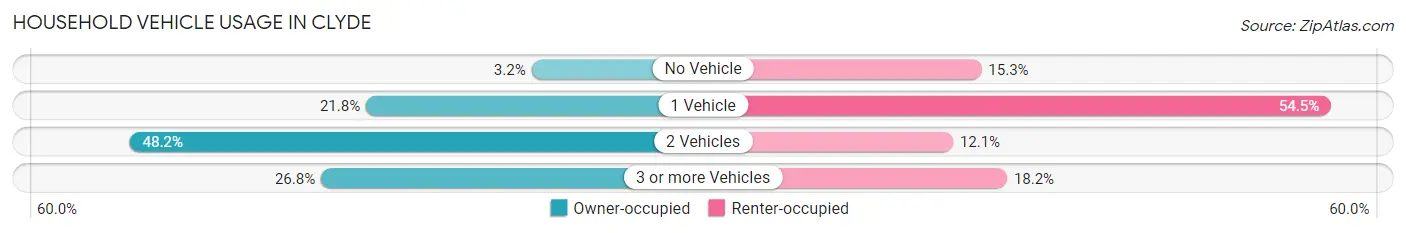
| Vehicles per Household | Owner-occupied | Renter-occupied |
| No Vehicle | 30 (3.2%) | 48 (15.3%) |
| 1 Vehicle | 203 (21.8%) | 171 (54.5%) |
| 2 Vehicles | 450 (48.2%) | 38 (12.1%) |
| 3 or more Vehicles | 250 (26.8%) | 57 (18.1%) |
| Total | 933 (100.0%) | 314 (100.0%) |
Real Estate & Mortgages in Clyde
Real Estate and Mortgage Overview in Clyde
| Characteristic | Without Mortgage | With Mortgage |
| Housing Units | 473 | 460 |
| Median Property Value | $115,600 | $146,400 |
| Median Household Income | $42,634 | $44 |
| Monthly Housing Costs | $455 | $0 |
| Real Estate Taxes | $1,124 | $27 |
Property Value by Mortgage Status in Clyde
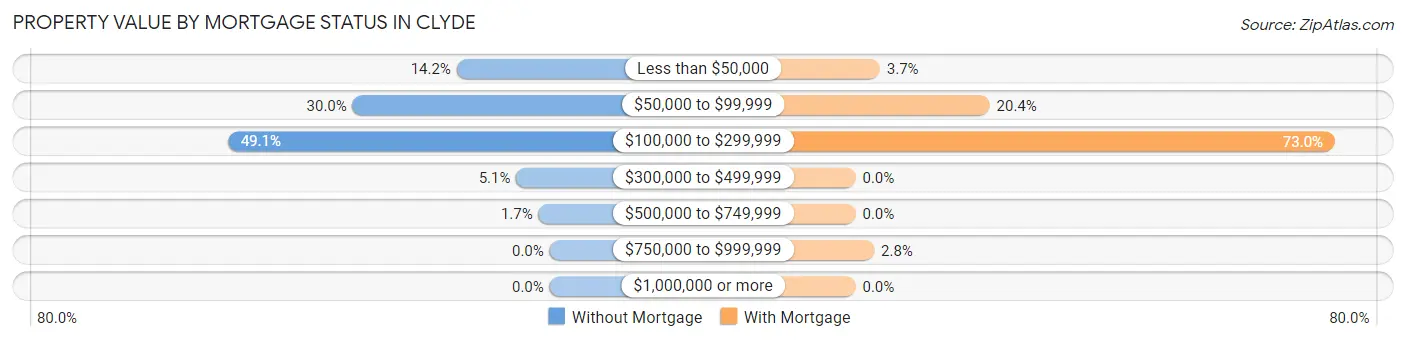
| Property Value | Without Mortgage | With Mortgage |
| Less than $50,000 | 67 (14.2%) | 17 (3.7%) |
| $50,000 to $99,999 | 142 (30.0%) | 94 (20.4%) |
| $100,000 to $299,999 | 232 (49.0%) | 336 (73.0%) |
| $300,000 to $499,999 | 24 (5.1%) | 0 (0.0%) |
| $500,000 to $749,999 | 8 (1.7%) | 0 (0.0%) |
| $750,000 to $999,999 | 0 (0.0%) | 13 (2.8%) |
| $1,000,000 or more | 0 (0.0%) | 0 (0.0%) |
| Total | 473 (100.0%) | 460 (100.0%) |
Household Income by Mortgage Status in Clyde
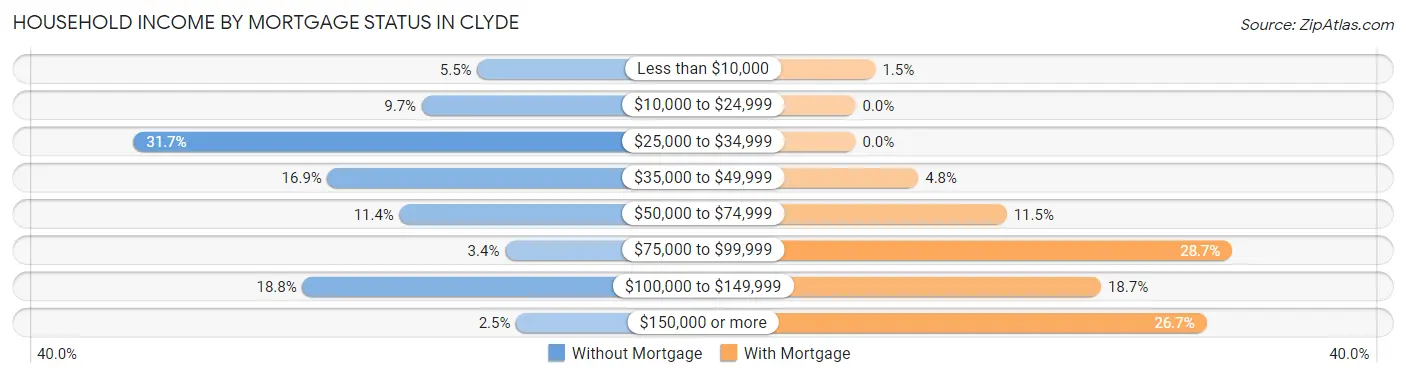
| Household Income | Without Mortgage | With Mortgage |
| Less than $10,000 | 26 (5.5%) | 7 (1.5%) |
| $10,000 to $24,999 | 46 (9.7%) | 0 (0.0%) |
| $25,000 to $34,999 | 150 (31.7%) | 0 (0.0%) |
| $35,000 to $49,999 | 80 (16.9%) | 22 (4.8%) |
| $50,000 to $74,999 | 54 (11.4%) | 53 (11.5%) |
| $75,000 to $99,999 | 16 (3.4%) | 132 (28.7%) |
| $100,000 to $149,999 | 89 (18.8%) | 86 (18.7%) |
| $150,000 or more | 12 (2.5%) | 123 (26.7%) |
| Total | 473 (100.0%) | 460 (100.0%) |
Property Value to Household Income Ratio in Clyde
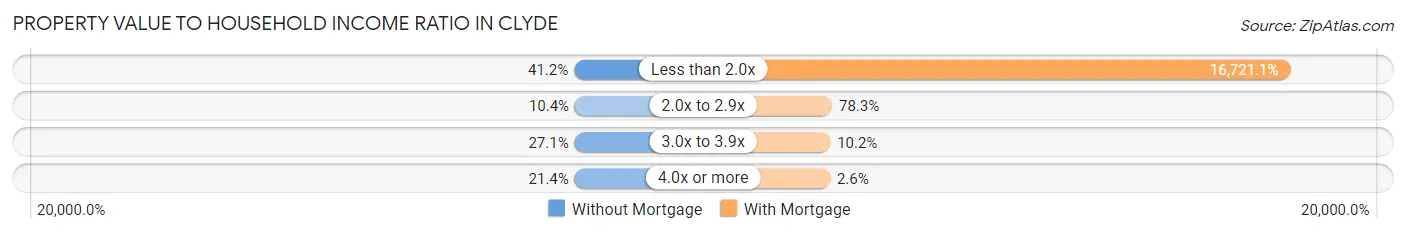
| Value-to-Income Ratio | Without Mortgage | With Mortgage |
| Less than 2.0x | 195 (41.2%) | 76,917 (16,721.1%) |
| 2.0x to 2.9x | 49 (10.4%) | 360 (78.3%) |
| 3.0x to 3.9x | 128 (27.1%) | 47 (10.2%) |
| 4.0x or more | 101 (21.3%) | 12 (2.6%) |
| Total | 473 (100.0%) | 460 (100.0%) |
Real Estate Taxes by Mortgage Status in Clyde
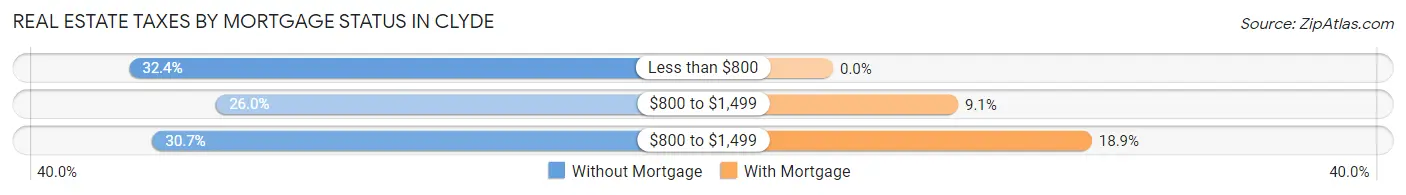
| Property Taxes | Without Mortgage | With Mortgage |
| Less than $800 | 153 (32.4%) | 0 (0.0%) |
| $800 to $1,499 | 123 (26.0%) | 42 (9.1%) |
| $800 to $1,499 | 145 (30.7%) | 87 (18.9%) |
| Total | 473 (100.0%) | 460 (100.0%) |
Health & Disability in Clyde
Health Insurance Coverage by Age in Clyde
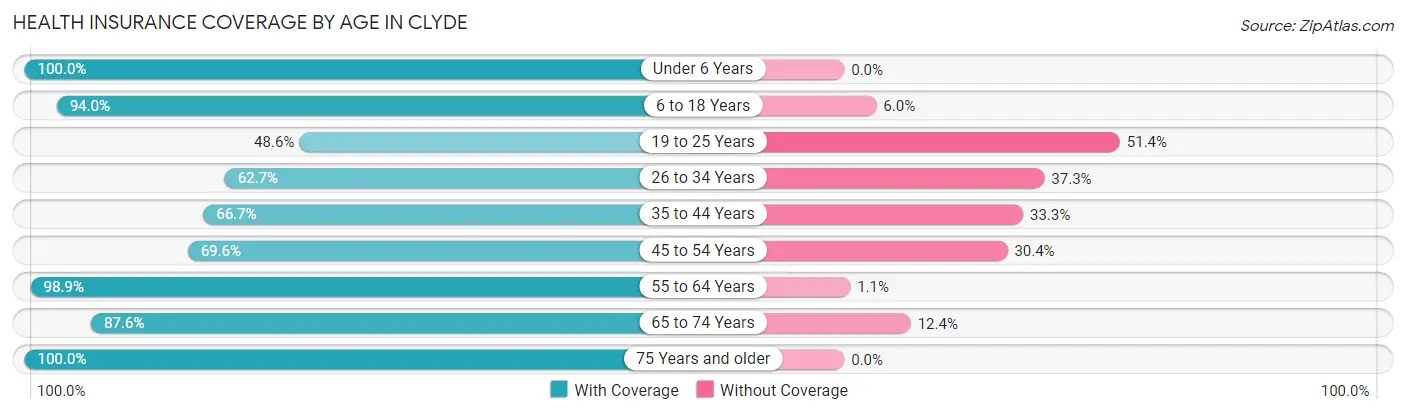
| Age Bracket | With Coverage | Without Coverage |
| Under 6 Years | 201 (100.0%) | 0 (0.0%) |
| 6 to 18 Years | 1,052 (94.0%) | 67 (6.0%) |
| 19 to 25 Years | 193 (48.6%) | 204 (51.4%) |
| 26 to 34 Years | 131 (62.7%) | 78 (37.3%) |
| 35 to 44 Years | 342 (66.7%) | 171 (33.3%) |
| 45 to 54 Years | 318 (69.6%) | 139 (30.4%) |
| 55 to 64 Years | 535 (98.9%) | 6 (1.1%) |
| 65 to 74 Years | 191 (87.6%) | 27 (12.4%) |
| 75 Years and older | 150 (100.0%) | 0 (0.0%) |
| Total | 3,113 (81.8%) | 692 (18.2%) |
Health Insurance Coverage by Citizenship Status in Clyde
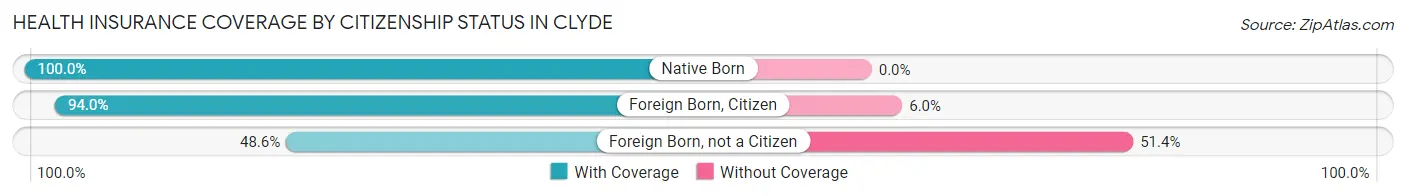
| Citizenship Status | With Coverage | Without Coverage |
| Native Born | 201 (100.0%) | 0 (0.0%) |
| Foreign Born, Citizen | 1,052 (94.0%) | 67 (6.0%) |
| Foreign Born, not a Citizen | 193 (48.6%) | 204 (51.4%) |
Health Insurance Coverage by Household Income in Clyde
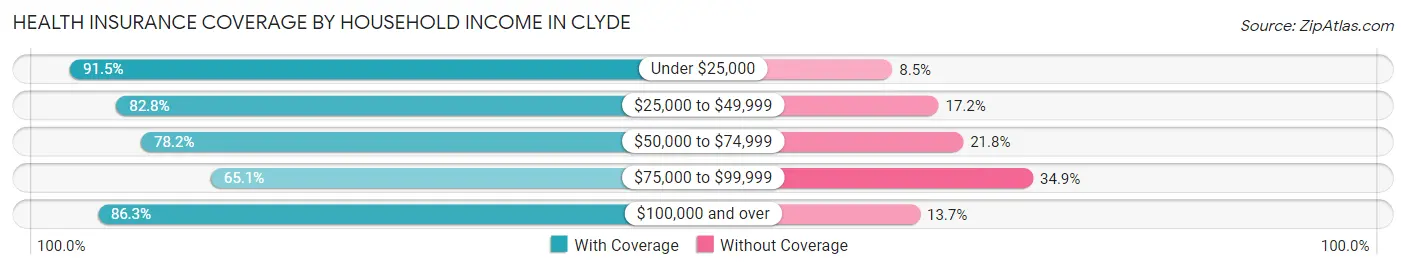
| Household Income | With Coverage | Without Coverage |
| Under $25,000 | 150 (91.5%) | 14 (8.5%) |
| $25,000 to $49,999 | 915 (82.8%) | 190 (17.2%) |
| $50,000 to $74,999 | 878 (78.2%) | 245 (21.8%) |
| $75,000 to $99,999 | 151 (65.1%) | 81 (34.9%) |
| $100,000 and over | 1,019 (86.3%) | 162 (13.7%) |
Public vs Private Health Insurance Coverage by Age in Clyde
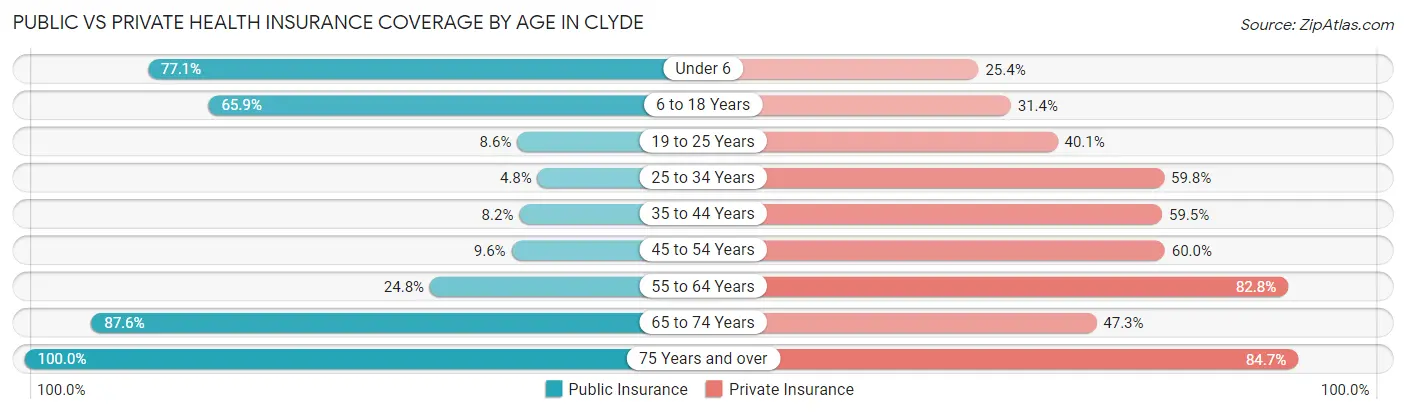
| Age Bracket | Public Insurance | Private Insurance |
| Under 6 | 155 (77.1%) | 51 (25.4%) |
| 6 to 18 Years | 737 (65.9%) | 351 (31.4%) |
| 19 to 25 Years | 34 (8.6%) | 159 (40.1%) |
| 25 to 34 Years | 10 (4.8%) | 125 (59.8%) |
| 35 to 44 Years | 42 (8.2%) | 305 (59.5%) |
| 45 to 54 Years | 44 (9.6%) | 274 (60.0%) |
| 55 to 64 Years | 134 (24.8%) | 448 (82.8%) |
| 65 to 74 Years | 191 (87.6%) | 103 (47.2%) |
| 75 Years and over | 150 (100.0%) | 127 (84.7%) |
| Total | 1,497 (39.3%) | 1,943 (51.1%) |
Disability Status by Sex by Age in Clyde
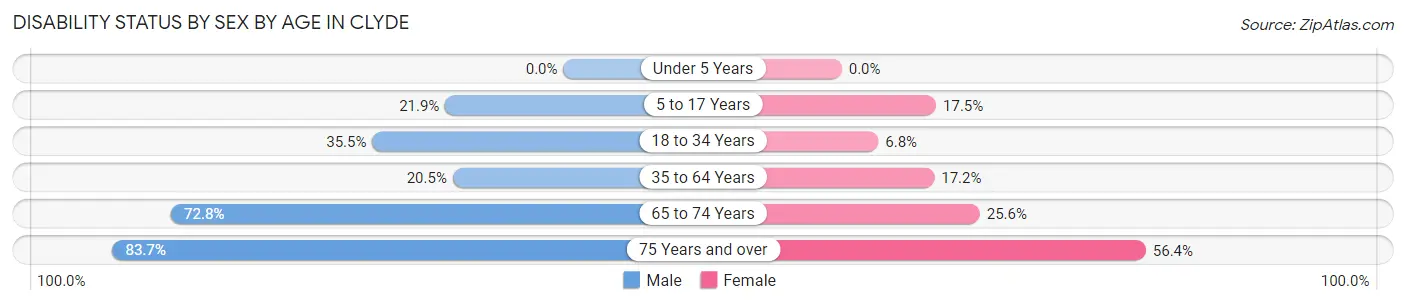
| Age Bracket | Male | Female |
| Under 5 Years | 0 (0.0%) | 0 (0.0%) |
| 5 to 17 Years | 109 (21.9%) | 73 (17.5%) |
| 18 to 34 Years | 150 (35.5%) | 29 (6.8%) |
| 35 to 64 Years | 162 (20.5%) | 124 (17.2%) |
| 65 to 74 Years | 99 (72.8%) | 21 (25.6%) |
| 75 Years and over | 41 (83.7%) | 57 (56.4%) |
Disability Class by Sex by Age in Clyde
Disability Class: Hearing Difficulty
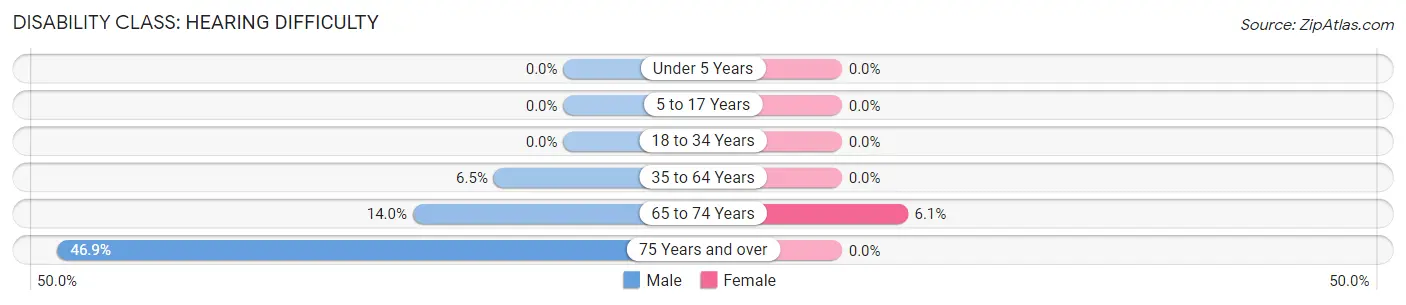
| Age Bracket | Male | Female |
| Under 5 Years | 0 (0.0%) | 0 (0.0%) |
| 5 to 17 Years | 0 (0.0%) | 0 (0.0%) |
| 18 to 34 Years | 0 (0.0%) | 0 (0.0%) |
| 35 to 64 Years | 51 (6.5%) | 0 (0.0%) |
| 65 to 74 Years | 19 (14.0%) | 5 (6.1%) |
| 75 Years and over | 23 (46.9%) | 0 (0.0%) |
Disability Class: Vision Difficulty
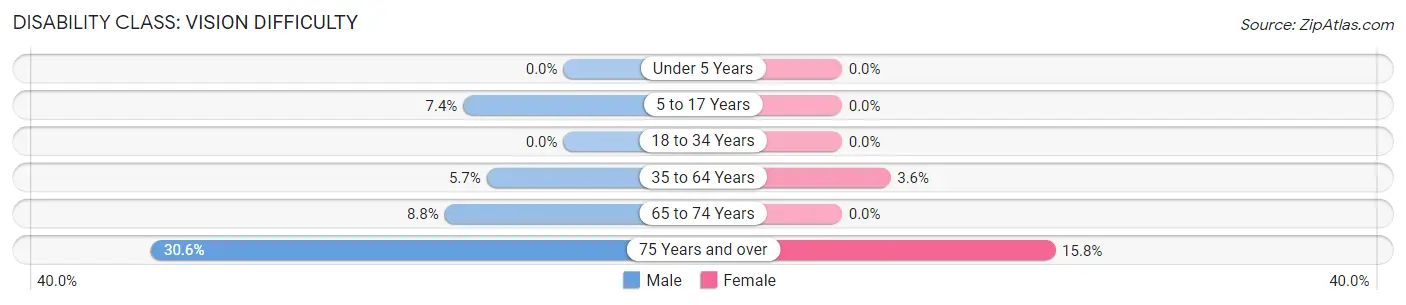
| Age Bracket | Male | Female |
| Under 5 Years | 0 (0.0%) | 0 (0.0%) |
| 5 to 17 Years | 37 (7.4%) | 0 (0.0%) |
| 18 to 34 Years | 0 (0.0%) | 0 (0.0%) |
| 35 to 64 Years | 45 (5.7%) | 26 (3.6%) |
| 65 to 74 Years | 12 (8.8%) | 0 (0.0%) |
| 75 Years and over | 15 (30.6%) | 16 (15.8%) |
Disability Class: Cognitive Difficulty
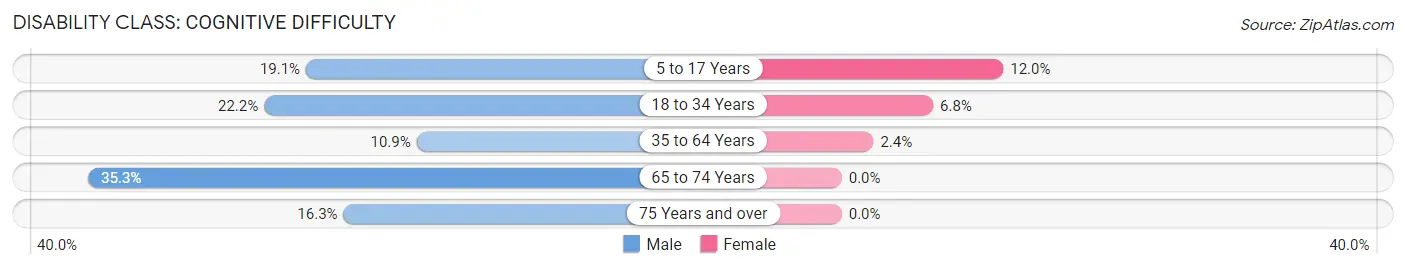
| Age Bracket | Male | Female |
| 5 to 17 Years | 95 (19.1%) | 50 (12.0%) |
| 18 to 34 Years | 94 (22.2%) | 29 (6.8%) |
| 35 to 64 Years | 86 (10.9%) | 17 (2.4%) |
| 65 to 74 Years | 48 (35.3%) | 0 (0.0%) |
| 75 Years and over | 8 (16.3%) | 0 (0.0%) |
Disability Class: Ambulatory Difficulty
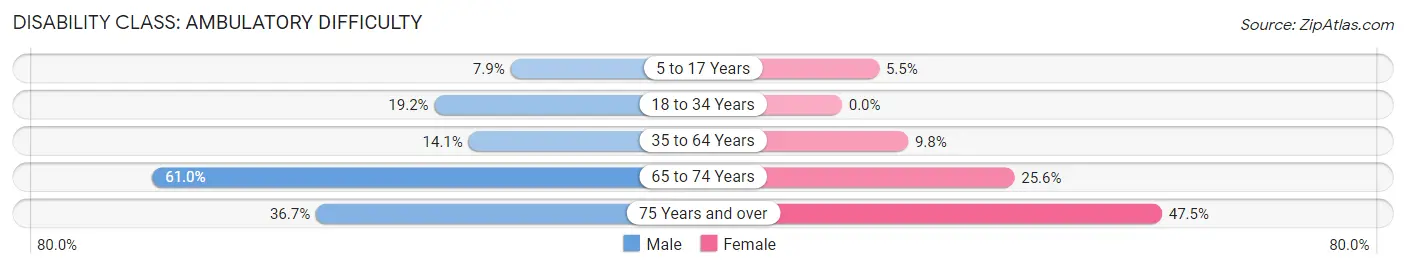
| Age Bracket | Male | Female |
| 5 to 17 Years | 39 (7.9%) | 23 (5.5%) |
| 18 to 34 Years | 81 (19.2%) | 0 (0.0%) |
| 35 to 64 Years | 111 (14.1%) | 71 (9.8%) |
| 65 to 74 Years | 83 (61.0%) | 21 (25.6%) |
| 75 Years and over | 18 (36.7%) | 48 (47.5%) |
Disability Class: Self-Care Difficulty
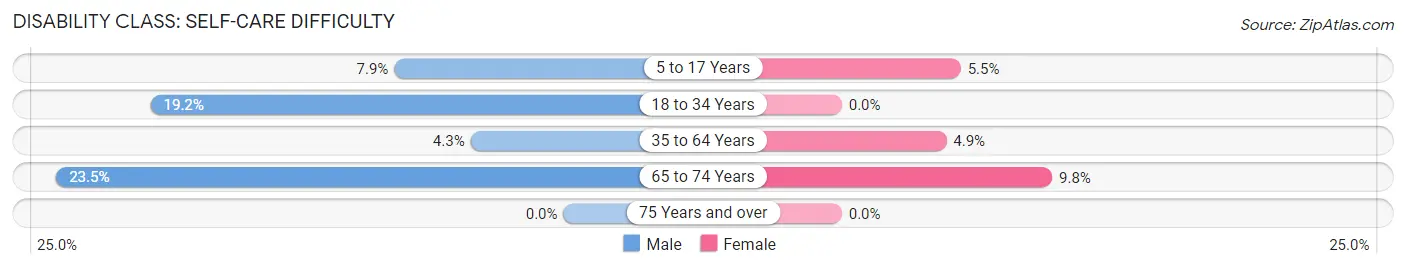
| Age Bracket | Male | Female |
| 5 to 17 Years | 39 (7.9%) | 23 (5.5%) |
| 18 to 34 Years | 81 (19.2%) | 0 (0.0%) |
| 35 to 64 Years | 34 (4.3%) | 35 (4.9%) |
| 65 to 74 Years | 32 (23.5%) | 8 (9.8%) |
| 75 Years and over | 0 (0.0%) | 0 (0.0%) |
Technology Access in Clyde
Computing Device Access in Clyde
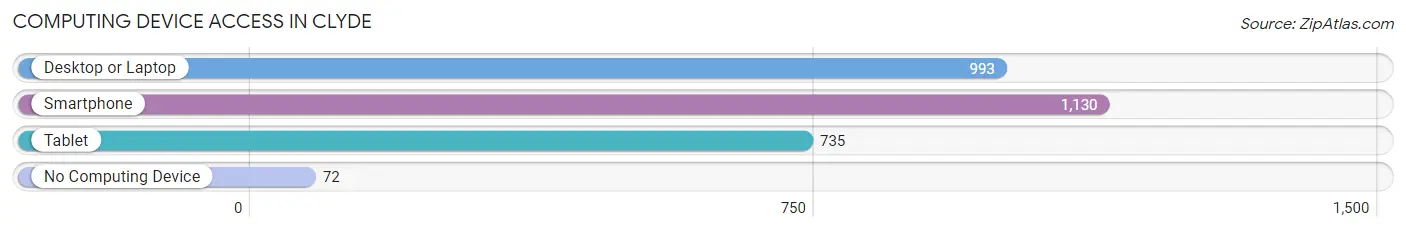
| Device Type | # Households | % Households |
| Desktop or Laptop | 993 | 79.6% |
| Smartphone | 1,130 | 90.6% |
| Tablet | 735 | 58.9% |
| No Computing Device | 72 | 5.8% |
| Total | 1,247 | 100.0% |
Internet Access in Clyde
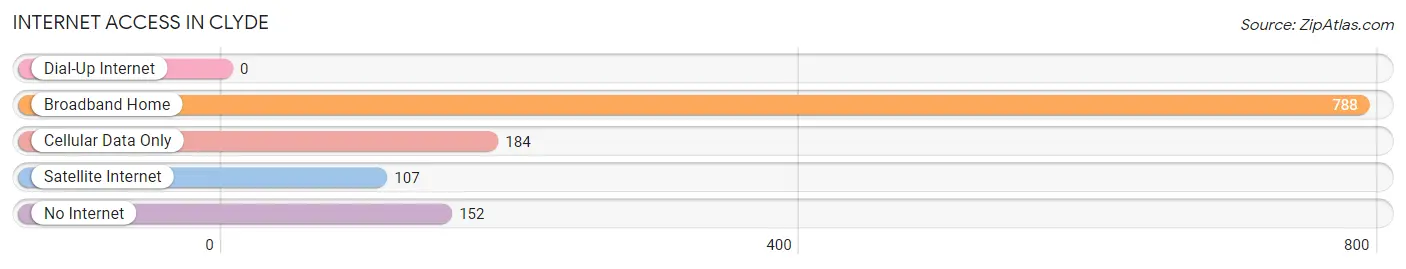
| Internet Type | # Households | % Households |
| Dial-Up Internet | 0 | 0.0% |
| Broadband Home | 788 | 63.2% |
| Cellular Data Only | 184 | 14.8% |
| Satellite Internet | 107 | 8.6% |
| No Internet | 152 | 12.2% |
| Total | 1,247 | 100.0% |
Clyde Summary
Clyde is a small town located in Callahan County, Texas, United States. It is situated about 25 miles east of Abilene and is part of the Abilene Metropolitan Statistical Area. The population of Clyde was 2,845 at the 2010 census.
History
Clyde was founded in 1881 by a group of settlers from Kentucky. The town was named after a local rancher, Clyde Johnson. The first post office was established in 1882 and the town was incorporated in 1885.
In the early 1900s, Clyde was a thriving agricultural community. Cotton was the main crop, but other crops such as corn, wheat, and oats were also grown. The town also had a number of businesses, including a bank, a hotel, a general store, and a blacksmith shop.
In the 1920s, Clyde began to experience a decline in population as many of its residents moved away to larger cities in search of better economic opportunities. The Great Depression of the 1930s further exacerbated the situation, and by 1940 the population had dropped to just over 1,000.
Geography
Clyde is located at the intersection of U.S. Route 83 and State Highway 36 in Callahan County. It is situated about 25 miles east of Abilene and is part of the Abilene Metropolitan Statistical Area. The town is located in a semi-arid region of Texas, with an average annual precipitation of about 22 inches.
The terrain around Clyde is mostly flat, with some rolling hills in the surrounding area. The town is situated on the edge of the Edwards Plateau, which is characterized by limestone outcroppings and canyons.
Economy
The economy of Clyde is largely based on agriculture and ranching. Cotton is the main crop, but other crops such as corn, wheat, and oats are also grown. The town also has a number of businesses, including a bank, a hotel, a general store, and a blacksmith shop.
The town is also home to a number of manufacturing companies, including a plastics plant, a metal fabrication plant, and a food processing plant. The town is also home to a number of oil and gas companies, as well as a number of wind farms.
Demographics
As of the 2010 census, the population of Clyde was 2,845. The racial makeup of the town was 87.3% White, 8.2% Hispanic or Latino, 1.7% African American, 0.7% Native American, 0.3% Asian, and 1.9% from other races.
The median household income in Clyde was $37,917, and the median family income was $45,917. The per capita income was $19,917. About 11.3% of the population was below the poverty line.
The town is served by the Clyde Consolidated Independent School District, which includes two elementary schools, one middle school, and one high school. The town is also home to a branch of the Abilene Christian University.
Common Questions
What is Per Capita Income in Clyde?
Per Capita income in Clyde is $25,140.
What is the Median Family Income in Clyde?
Median Family Income in Clyde is $66,218.
What is the Median Household income in Clyde?
Median Household Income in Clyde is $60,799.
What is Income or Wage Gap in Clyde?
Income or Wage Gap in Clyde is 25.1%.
Women in Clyde earn 74.9 cents for every dollar earned by a man.
What is Inequality or Gini Index in Clyde?
Inequality or Gini Index in Clyde is 0.36.
What is the Total Population of Clyde?
Total Population of Clyde is 3,850.
What is the Total Male Population of Clyde?
Total Male Population of Clyde is 1,999.
What is the Total Female Population of Clyde?
Total Female Population of Clyde is 1,851.
What is the Ratio of Males per 100 Females in Clyde?
There are 108.00 Males per 100 Females in Clyde.
What is the Ratio of Females per 100 Males in Clyde?
There are 92.60 Females per 100 Males in Clyde.
What is the Median Population Age in Clyde?
Median Population Age in Clyde is 35.0 Years.
What is the Average Family Size in Clyde
Average Family Size in Clyde is 3.7 People.
What is the Average Household Size in Clyde
Average Household Size in Clyde is 3.0 People.
How Large is the Labor Force in Clyde?
There are 1,750 People in the Labor Forcein in Clyde.
What is the Percentage of People in the Labor Force in Clyde?
59.4% of People are in the Labor Force in Clyde.
What is the Unemployment Rate in Clyde?
Unemployment Rate in Clyde is 5.9%.