Clute, TX Map & Demographics
Clute Map
Clute Overview
$35,554
PER CAPITA INCOME
$69,896
AVG FAMILY INCOME
$68,306
AVG HOUSEHOLD INCOME
50.4%
WAGE / INCOME GAP [ % ]
49.6¢/ $1
WAGE / INCOME GAP [ $ ]
0.43
INEQUALITY / GINI INDEX
10,670
TOTAL POPULATION
5,448
MALE POPULATION
5,222
FEMALE POPULATION
104.33
MALES / 100 FEMALES
95.85
FEMALES / 100 MALES
30.2
MEDIAN AGE
3.1
AVG FAMILY SIZE
2.4
AVG HOUSEHOLD SIZE
5,982
LABOR FORCE [ PEOPLE ]
70.1%
PERCENT IN LABOR FORCE
8.6%
UNEMPLOYMENT RATE
Clute Zip Codes
Clute Area Codes
Income in Clute
Income Overview in Clute
Per Capita Income in Clute is $35,554, while median incomes of families and households are $69,896 and $68,306 respectively.
| Characteristic | Number | Measure |
| Per Capita Income | 10,670 | $35,554 |
| Median Family Income | 2,703 | $69,896 |
| Mean Family Income | 2,703 | $90,931 |
| Median Household Income | 4,314 | $68,306 |
| Mean Household Income | 4,314 | $91,118 |
| Income Deficit | 2,703 | $0 |
| Wage / Income Gap (%) | 10,670 | 50.35% |
| Wage / Income Gap ($) | 10,670 | 49.65¢ per $1 |
| Gini / Inequality Index | 10,670 | 0.43 |
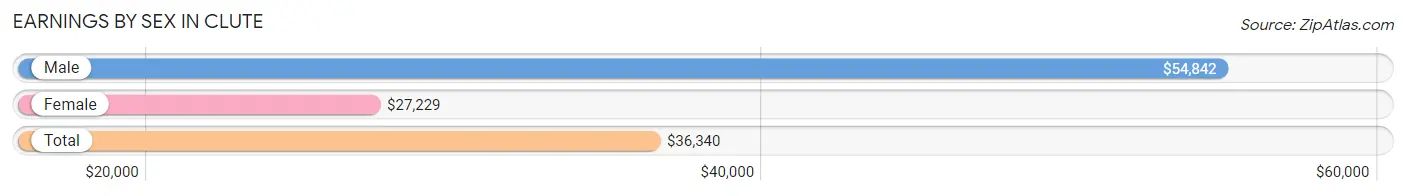
Earnings by Sex in Clute
Average Earnings in Clute are $36,340, $54,842 for men and $27,229 for women, a difference of 50.3%.
| Sex | Number | Average Earnings |
| Male | 3,454 (58.1%) | $54,842 |
| Female | 2,489 (41.9%) | $27,229 |
| Total | 5,943 (100.0%) | $36,340 |
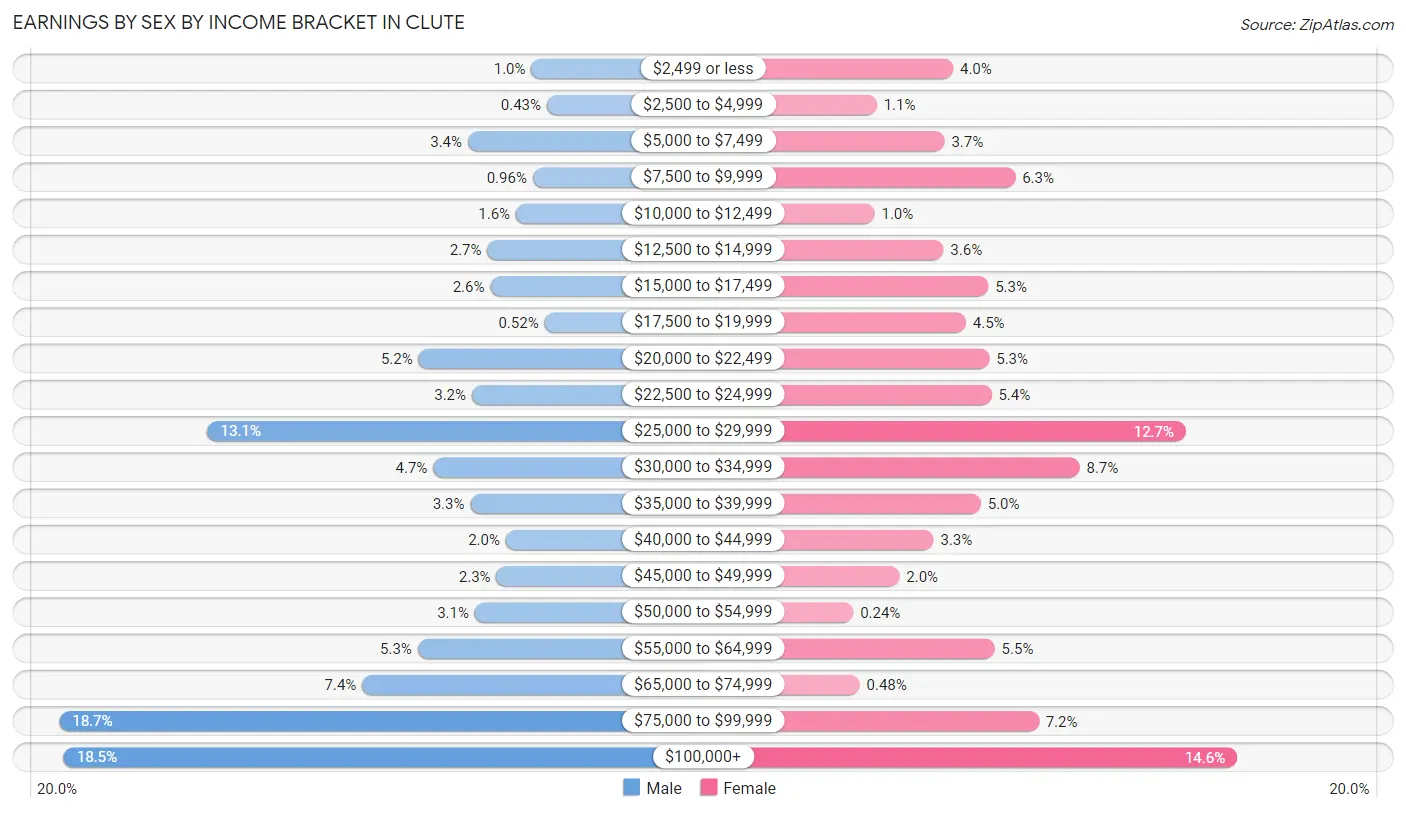
Earnings by Sex by Income Bracket in Clute
The most common earnings brackets in Clute are $75,000 to $99,999 for men (646 | 18.7%) and $100,000+ for women (364 | 14.6%).
| Income | Male | Female |
| $2,499 or less | 35 (1.0%) | 99 (4.0%) |
| $2,500 to $4,999 | 15 (0.4%) | 28 (1.1%) |
| $5,000 to $7,499 | 117 (3.4%) | 91 (3.7%) |
| $7,500 to $9,999 | 33 (1.0%) | 157 (6.3%) |
| $10,000 to $12,499 | 55 (1.6%) | 26 (1.0%) |
| $12,500 to $14,999 | 92 (2.7%) | 90 (3.6%) |
| $15,000 to $17,499 | 88 (2.5%) | 132 (5.3%) |
| $17,500 to $19,999 | 18 (0.5%) | 111 (4.5%) |
| $20,000 to $22,499 | 181 (5.2%) | 133 (5.3%) |
| $22,500 to $24,999 | 112 (3.2%) | 135 (5.4%) |
| $25,000 to $29,999 | 454 (13.1%) | 316 (12.7%) |
| $30,000 to $34,999 | 162 (4.7%) | 217 (8.7%) |
| $35,000 to $39,999 | 114 (3.3%) | 125 (5.0%) |
| $40,000 to $44,999 | 68 (2.0%) | 81 (3.3%) |
| $45,000 to $49,999 | 80 (2.3%) | 49 (2.0%) |
| $50,000 to $54,999 | 108 (3.1%) | 6 (0.2%) |
| $55,000 to $64,999 | 182 (5.3%) | 138 (5.5%) |
| $65,000 to $74,999 | 254 (7.3%) | 12 (0.5%) |
| $75,000 to $99,999 | 646 (18.7%) | 179 (7.2%) |
| $100,000+ | 640 (18.5%) | 364 (14.6%) |
| Total | 3,454 (100.0%) | 2,489 (100.0%) |
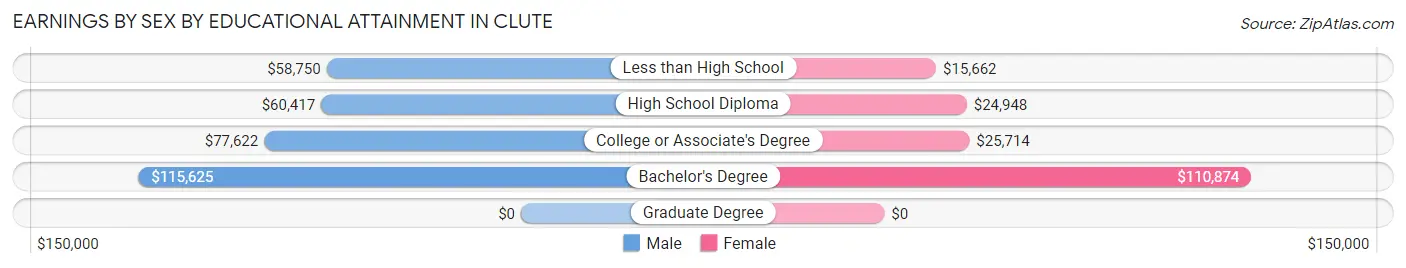
Earnings by Sex by Educational Attainment in Clute
Average earnings in Clute are $68,470 for men and $32,839 for women, a difference of 52.0%. Men with an educational attainment of bachelor's degree enjoy the highest average annual earnings of $115,625, while those with less than high school education earn the least with $58,750. Women with an educational attainment of bachelor's degree earn the most with the average annual earnings of $110,874, while those with less than high school education have the smallest earnings of $15,662.
| Educational Attainment | Male Income | Female Income |
| Less than High School | $58,750 | $15,662 |
| High School Diploma | $60,417 | $24,948 |
| College or Associate's Degree | $77,622 | $25,714 |
| Bachelor's Degree | $115,625 | $110,874 |
| Graduate Degree | - | - |
| Total | $68,470 | $32,839 |
Family Income in Clute
Family Income Brackets in Clute
According to the Clute family income data, there are 503 families falling into the $100,000 to $149,999 income range, which is the most common income bracket and makes up 18.6% of all families. Conversely, the less than $10,000 income bracket is the least frequent group with only 49 families (1.8%) belonging to this category.
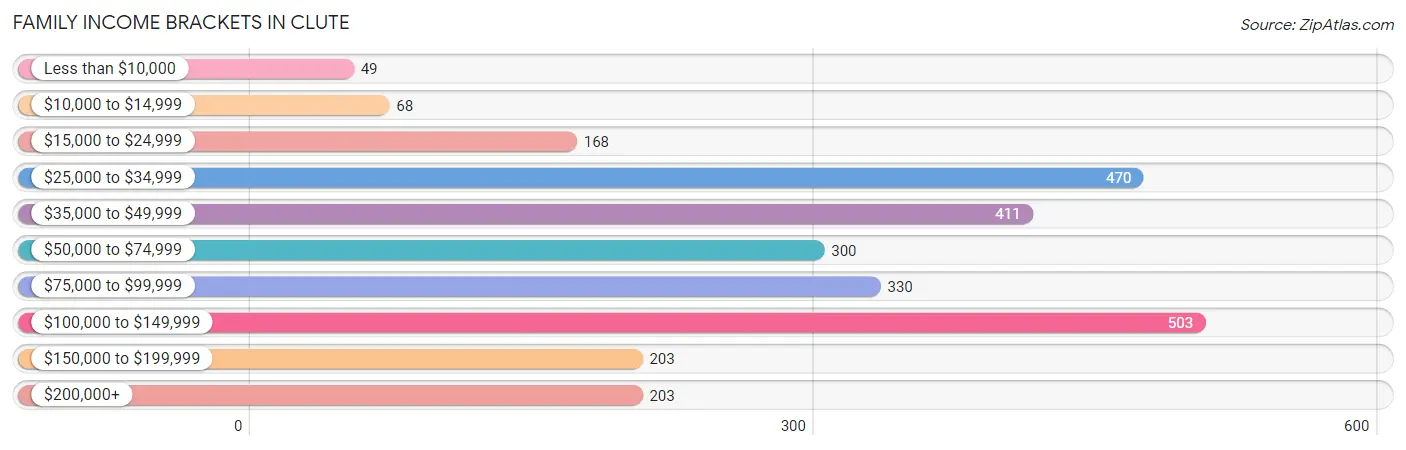
| Income Bracket | # Families | % Families |
| Less than $10,000 | 49 | 1.8% |
| $10,000 to $14,999 | 68 | 2.5% |
| $15,000 to $24,999 | 168 | 6.2% |
| $25,000 to $34,999 | 470 | 17.4% |
| $35,000 to $49,999 | 411 | 15.2% |
| $50,000 to $74,999 | 300 | 11.1% |
| $75,000 to $99,999 | 330 | 12.2% |
| $100,000 to $149,999 | 503 | 18.6% |
| $150,000 to $199,999 | 203 | 7.5% |
| $200,000+ | 203 | 7.5% |
Family Income by Famaliy Size in Clute
5-person families (179 | 6.6%) account for the highest median family income in Clute with $119,850 per family, while 5-person families (179 | 6.6%) have the highest median income of $23,970 per family member.
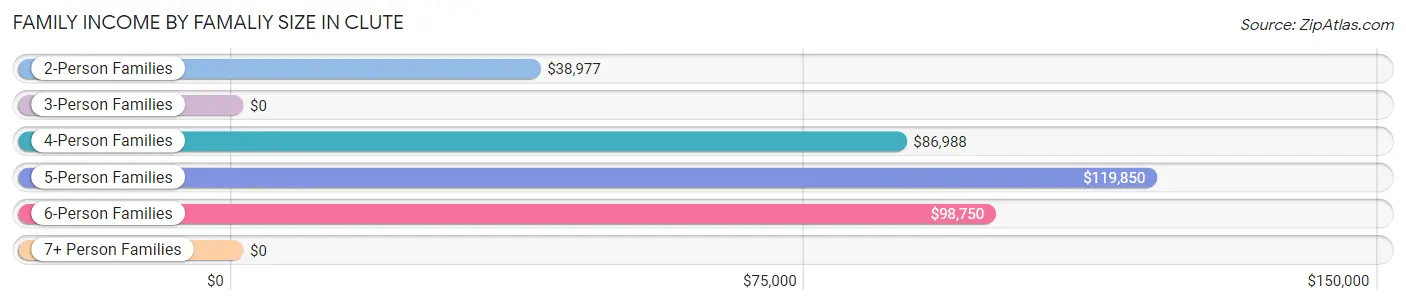
| Income Bracket | # Families | Median Income |
| 2-Person Families | 1,214 (44.9%) | $38,977 |
| 3-Person Families | 687 (25.4%) | $0 |
| 4-Person Families | 557 (20.6%) | $86,988 |
| 5-Person Families | 179 (6.6%) | $119,850 |
| 6-Person Families | 66 (2.4%) | $98,750 |
| 7+ Person Families | 0 (0.0%) | $0 |
| Total | 2,703 (100.0%) | $69,896 |
Family Income by Number of Earners in Clute
The median family income in Clute is $69,896, with families comprising 3+ earners (148) having the highest median family income of $170,556, while families with no earners (182) have the lowest median family income of $27,976, accounting for 5.5% and 6.7% of families, respectively.
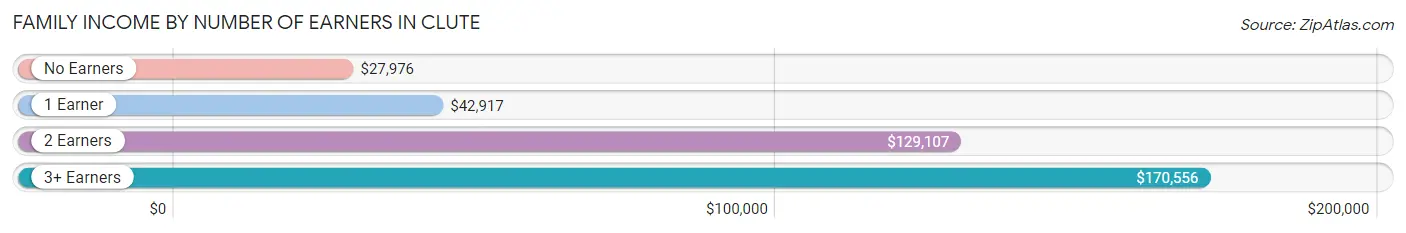
| Number of Earners | # Families | Median Income |
| No Earners | 182 (6.7%) | $27,976 |
| 1 Earner | 1,325 (49.0%) | $42,917 |
| 2 Earners | 1,048 (38.8%) | $129,107 |
| 3+ Earners | 148 (5.5%) | $170,556 |
| Total | 2,703 (100.0%) | $69,896 |
Household Income in Clute
Household Income Brackets in Clute
With 807 households falling in the category, the $50,000 to $74,999 income range is the most frequent in Clute, accounting for 18.7% of all households. In contrast, only 78 households (1.8%) fall into the $10,000 to $14,999 income bracket, making it the least populous group.
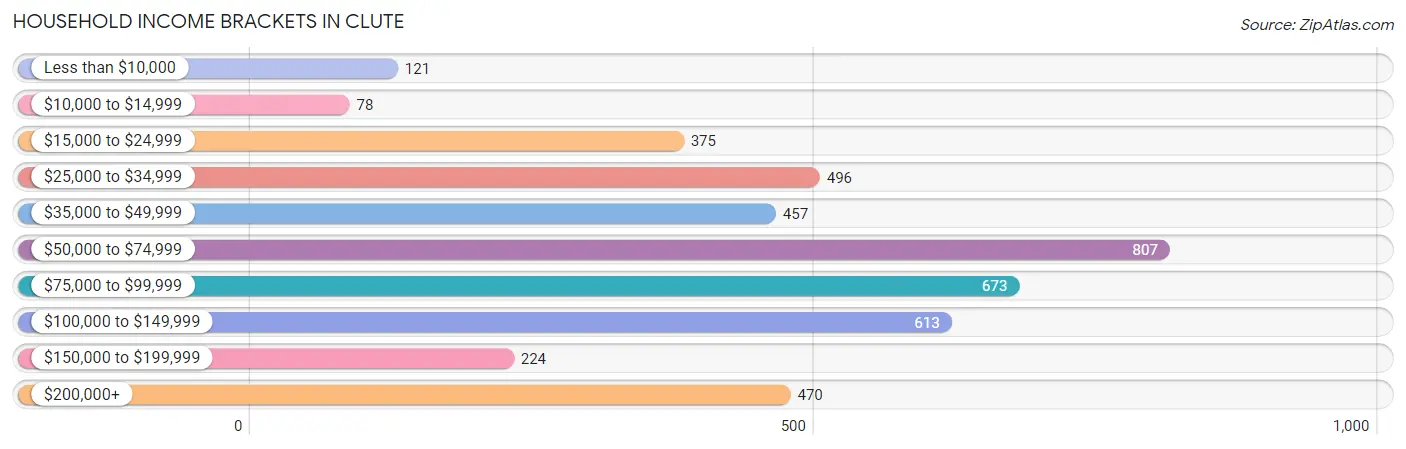
| Income Bracket | # Households | % Households |
| Less than $10,000 | 121 | 2.8% |
| $10,000 to $14,999 | 78 | 1.8% |
| $15,000 to $24,999 | 375 | 8.7% |
| $25,000 to $34,999 | 496 | 11.5% |
| $35,000 to $49,999 | 457 | 10.6% |
| $50,000 to $74,999 | 807 | 18.7% |
| $75,000 to $99,999 | 673 | 15.6% |
| $100,000 to $149,999 | 613 | 14.2% |
| $150,000 to $199,999 | 224 | 5.2% |
| $200,000+ | 470 | 10.9% |
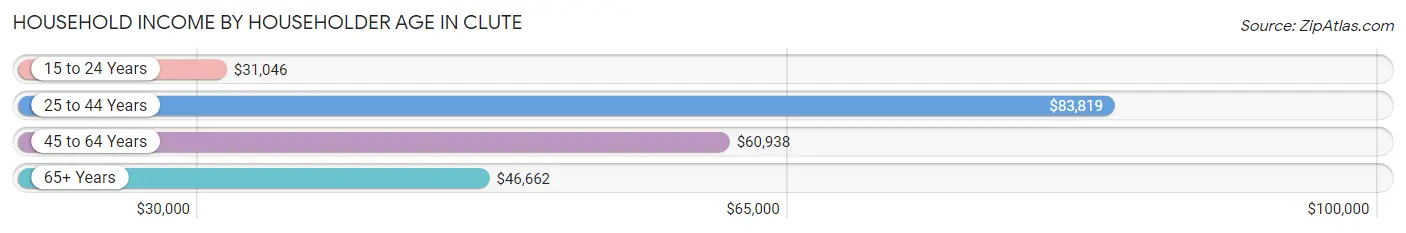
Household Income by Householder Age in Clute
The median household income in Clute is $68,306, with the highest median household income of $83,819 found in the 25 to 44 years age bracket for the primary householder. A total of 2,447 households (56.7%) fall into this category. Meanwhile, the 15 to 24 years age bracket for the primary householder has the lowest median household income of $31,046, with 147 households (3.4%) in this group.
| Income Bracket | # Households | Median Income |
| 15 to 24 Years | 147 (3.4%) | $31,046 |
| 25 to 44 Years | 2,447 (56.7%) | $83,819 |
| 45 to 64 Years | 1,021 (23.7%) | $60,938 |
| 65+ Years | 699 (16.2%) | $46,662 |
| Total | 4,314 (100.0%) | $68,306 |
Poverty in Clute
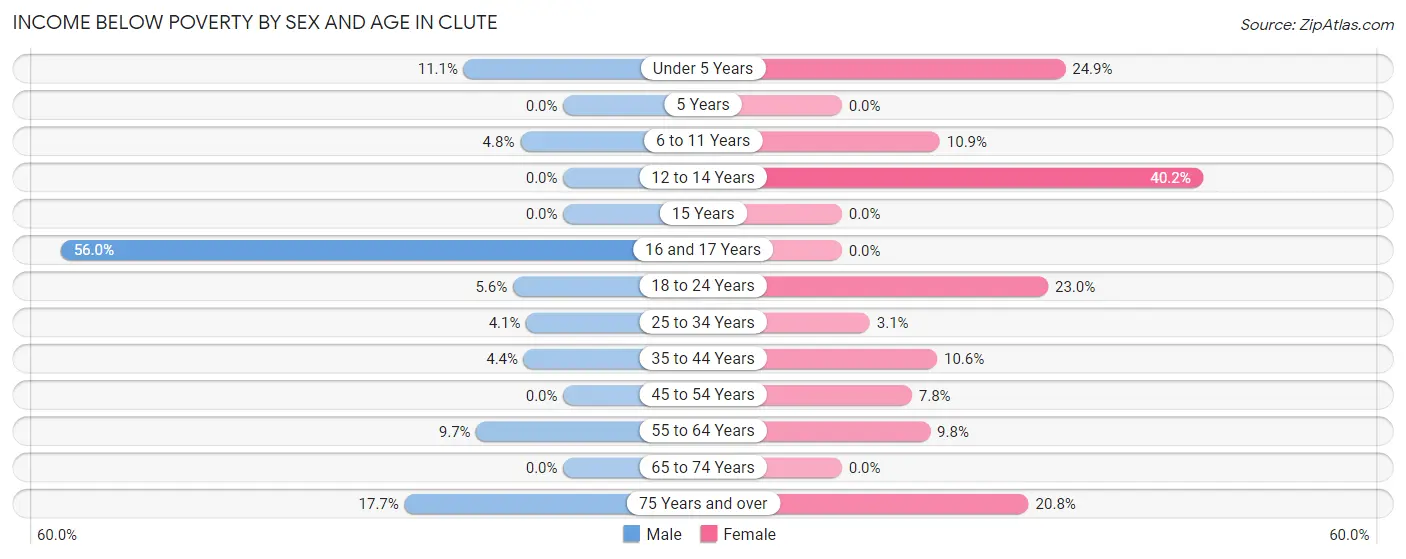
Income Below Poverty by Sex and Age in Clute
With 6.5% poverty level for males and 12.4% for females among the residents of Clute, 16 and 17 year old males and 12 to 14 year old females are the most vulnerable to poverty, with 75 males (56.0%) and 94 females (40.2%) in their respective age groups living below the poverty level.
| Age Bracket | Male | Female |
| Under 5 Years | 51 (11.1%) | 55 (24.9%) |
| 5 Years | 0 (0.0%) | 0 (0.0%) |
| 6 to 11 Years | 20 (4.8%) | 45 (10.9%) |
| 12 to 14 Years | 0 (0.0%) | 94 (40.2%) |
| 15 Years | 0 (0.0%) | 0 (0.0%) |
| 16 and 17 Years | 75 (56.0%) | 0 (0.0%) |
| 18 to 24 Years | 34 (5.6%) | 204 (23.0%) |
| 25 to 34 Years | 57 (4.1%) | 26 (3.1%) |
| 35 to 44 Years | 41 (4.4%) | 75 (10.6%) |
| 45 to 54 Years | 0 (0.0%) | 32 (7.8%) |
| 55 to 64 Years | 43 (9.7%) | 61 (9.8%) |
| 65 to 74 Years | 0 (0.0%) | 0 (0.0%) |
| 75 Years and over | 32 (17.7%) | 46 (20.8%) |
| Total | 353 (6.5%) | 638 (12.4%) |
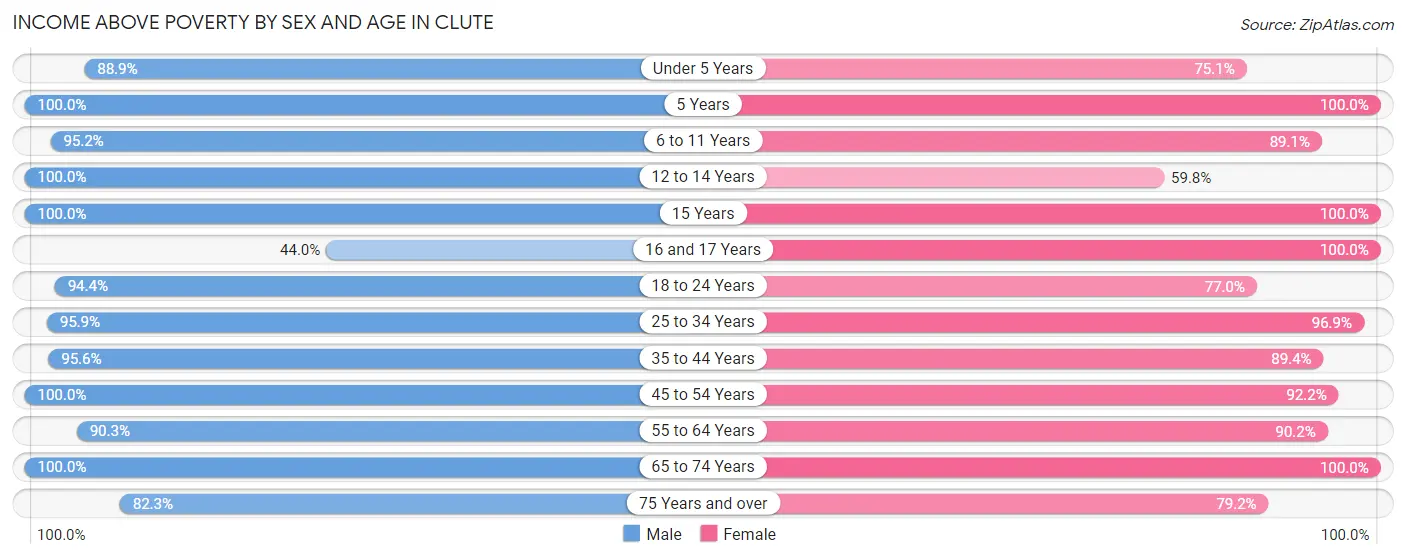
Income Above Poverty by Sex and Age in Clute
According to the poverty statistics in Clute, males aged 5 years and females aged 5 years are the age groups that are most secure financially, with 100.0% of males and 100.0% of females in these age groups living above the poverty line.
| Age Bracket | Male | Female |
| Under 5 Years | 409 (88.9%) | 166 (75.1%) |
| 5 Years | 16 (100.0%) | 47 (100.0%) |
| 6 to 11 Years | 397 (95.2%) | 367 (89.1%) |
| 12 to 14 Years | 124 (100.0%) | 140 (59.8%) |
| 15 Years | 153 (100.0%) | 52 (100.0%) |
| 16 and 17 Years | 59 (44.0%) | 29 (100.0%) |
| 18 to 24 Years | 573 (94.4%) | 684 (77.0%) |
| 25 to 34 Years | 1,322 (95.9%) | 806 (96.9%) |
| 35 to 44 Years | 891 (95.6%) | 632 (89.4%) |
| 45 to 54 Years | 319 (100.0%) | 378 (92.2%) |
| 55 to 64 Years | 401 (90.3%) | 559 (90.2%) |
| 65 to 74 Years | 229 (100.0%) | 458 (100.0%) |
| 75 Years and over | 149 (82.3%) | 175 (79.2%) |
| Total | 5,042 (93.5%) | 4,493 (87.6%) |
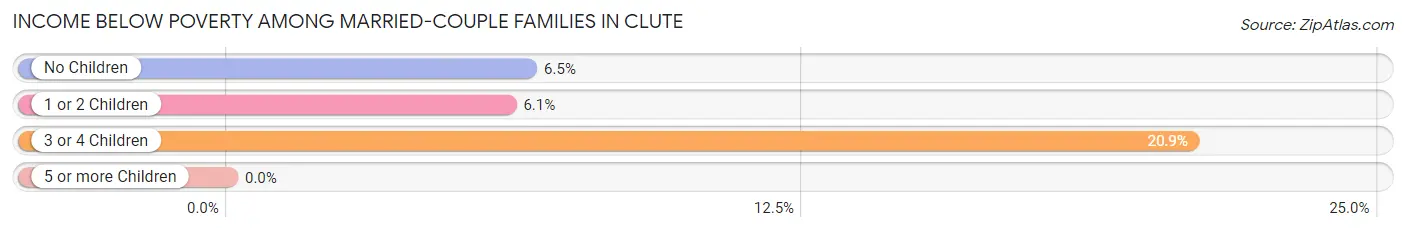
Income Below Poverty Among Married-Couple Families in Clute
The poverty statistics for married-couple families in Clute show that 7.6% or 114 of the total 1,507 families live below the poverty line. Families with 3 or 4 children have the highest poverty rate of 20.9%, comprising of 27 families. On the other hand, families with 1 or 2 children have the lowest poverty rate of 6.1%, which includes 36 families.
| Children | Above Poverty | Below Poverty |
| No Children | 733 (93.5%) | 51 (6.5%) |
| 1 or 2 Children | 558 (93.9%) | 36 (6.1%) |
| 3 or 4 Children | 102 (79.1%) | 27 (20.9%) |
| 5 or more Children | 0 (0.0%) | 0 (0.0%) |
| Total | 1,393 (92.4%) | 114 (7.6%) |
Income Below Poverty Among Single-Parent Households in Clute
According to the poverty data in Clute, 4.2% or 18 single-father households and 10.1% or 77 single-mother households are living below the poverty line. Among single-father households, those with 3 or 4 children have the highest poverty rate, with 18 households (69.2%) experiencing poverty. Likewise, among single-mother households, those with 1 or 2 children have the highest poverty rate, with 62 households (14.5%) falling below the poverty line.
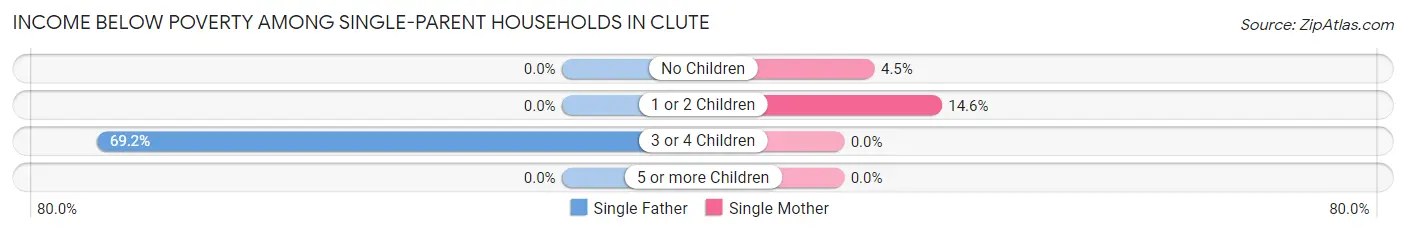
| Children | Single Father | Single Mother |
| No Children | 0 (0.0%) | 15 (4.5%) |
| 1 or 2 Children | 0 (0.0%) | 62 (14.5%) |
| 3 or 4 Children | 18 (69.2%) | 0 (0.0%) |
| 5 or more Children | 0 (0.0%) | 0 (0.0%) |
| Total | 18 (4.2%) | 77 (10.1%) |
Income Below Poverty Among Married-Couple vs Single-Parent Households in Clute
The poverty data for Clute shows that 114 of the married-couple family households (7.6%) and 95 of the single-parent households (7.9%) are living below the poverty level. Within the married-couple family households, those with 3 or 4 children have the highest poverty rate, with 27 households (20.9%) falling below the poverty line. Among the single-parent households, those with 3 or 4 children have the highest poverty rate, with 18 household (52.9%) living below poverty.
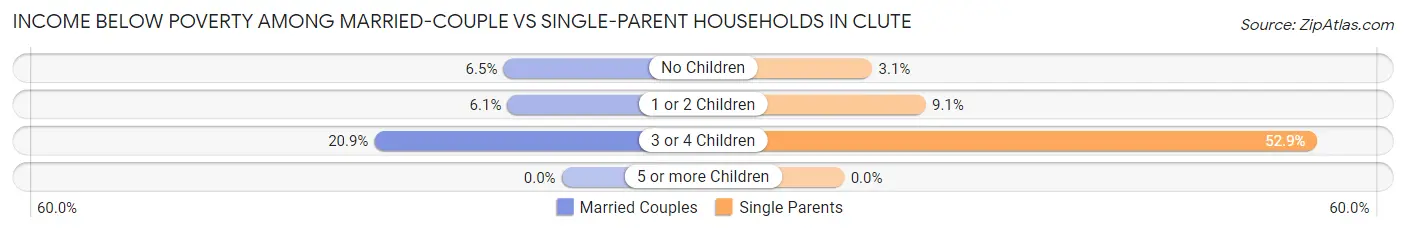
| Children | Married-Couple Families | Single-Parent Households |
| No Children | 51 (6.5%) | 15 (3.1%) |
| 1 or 2 Children | 36 (6.1%) | 62 (9.1%) |
| 3 or 4 Children | 27 (20.9%) | 18 (52.9%) |
| 5 or more Children | 0 (0.0%) | 0 (0.0%) |
| Total | 114 (7.6%) | 95 (7.9%) |
Race in Clute
The most populous races in Clute are Hispanic or Latino (6,069 | 56.9%), White / Caucasian (5,772 | 54.1%), and Two or more Races (2,263 | 21.2%).
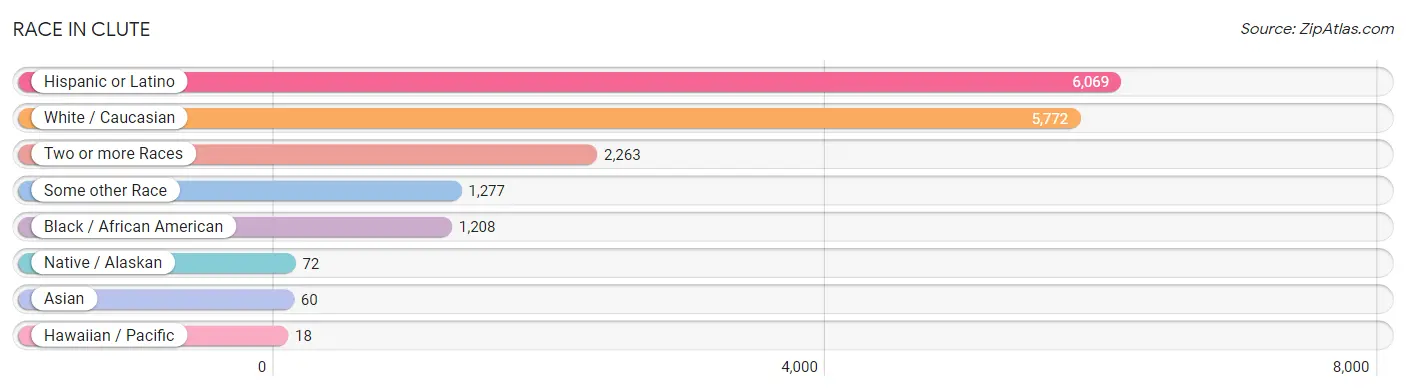
| Race | # Population | % Population |
| Asian | 60 | 0.6% |
| Black / African American | 1,208 | 11.3% |
| Hawaiian / Pacific | 18 | 0.2% |
| Hispanic or Latino | 6,069 | 56.9% |
| Native / Alaskan | 72 | 0.7% |
| White / Caucasian | 5,772 | 54.1% |
| Two or more Races | 2,263 | 21.2% |
| Some other Race | 1,277 | 12.0% |
| Total | 10,670 | 100.0% |
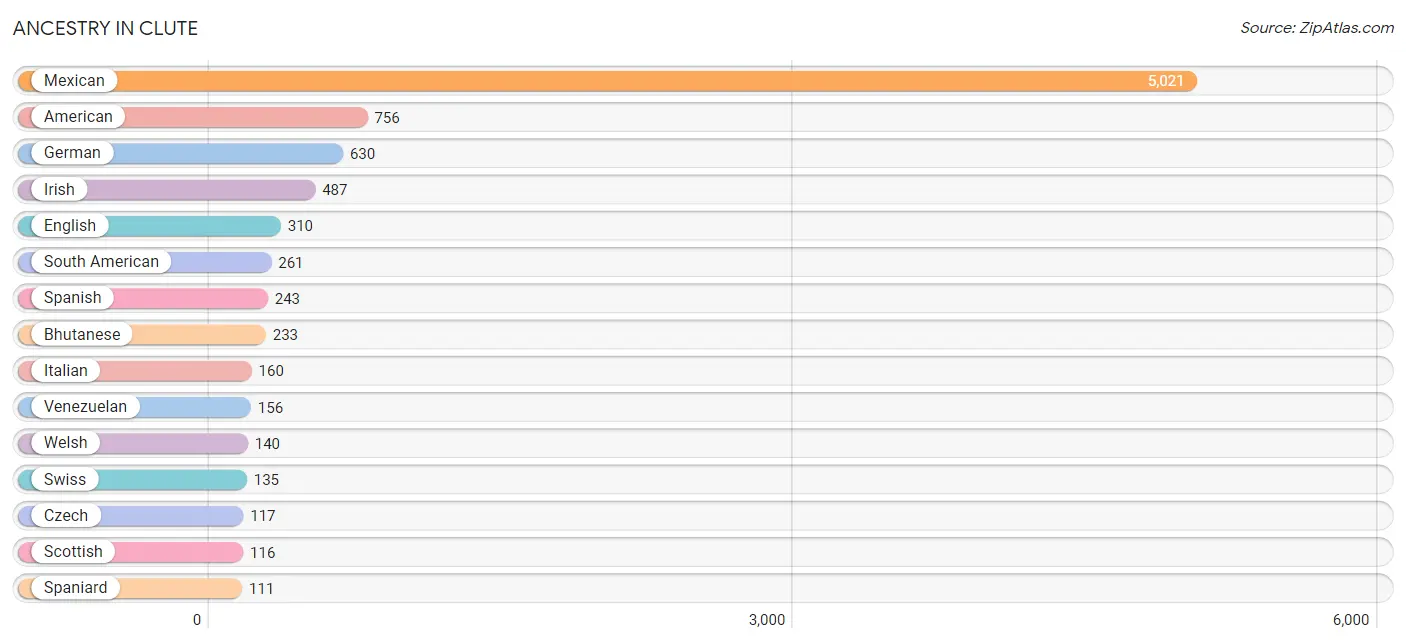
Ancestry in Clute
The most populous ancestries reported in Clute are Mexican (5,021 | 47.1%), American (756 | 7.1%), German (630 | 5.9%), Irish (487 | 4.6%), and English (310 | 2.9%), together accounting for 67.5% of all Clute residents.
| Ancestry | # Population | % Population |
| American | 756 | 7.1% |
| Argentinean | 26 | 0.2% |
| Bhutanese | 233 | 2.2% |
| Blackfeet | 13 | 0.1% |
| British | 4 | 0.0% |
| Central American | 38 | 0.4% |
| Central American Indian | 42 | 0.4% |
| Cherokee | 44 | 0.4% |
| Chickasaw | 44 | 0.4% |
| Colombian | 79 | 0.7% |
| Comanche | 12 | 0.1% |
| Cuban | 47 | 0.4% |
| Czech | 117 | 1.1% |
| Danish | 58 | 0.5% |
| Dutch | 5 | 0.1% |
| English | 310 | 2.9% |
| European | 103 | 1.0% |
| French | 59 | 0.5% |
| French Canadian | 38 | 0.4% |
| German | 630 | 5.9% |
| Guatemalan | 38 | 0.4% |
| Hungarian | 14 | 0.1% |
| Indian (Asian) | 15 | 0.1% |
| Irish | 487 | 4.6% |
| Italian | 160 | 1.5% |
| Korean | 6 | 0.1% |
| Mexican | 5,021 | 47.1% |
| Mexican American Indian | 8 | 0.1% |
| Native Hawaiian | 10 | 0.1% |
| Polish | 35 | 0.3% |
| Puerto Rican | 100 | 0.9% |
| Samoan | 8 | 0.1% |
| Scotch-Irish | 17 | 0.2% |
| Scottish | 116 | 1.1% |
| Slovene | 4 | 0.0% |
| South American | 261 | 2.5% |
| Spaniard | 111 | 1.0% |
| Spanish | 243 | 2.3% |
| Swedish | 50 | 0.5% |
| Swiss | 135 | 1.3% |
| Thai | 45 | 0.4% |
| Venezuelan | 156 | 1.5% |
| Welsh | 140 | 1.3% | View All 43 Rows |
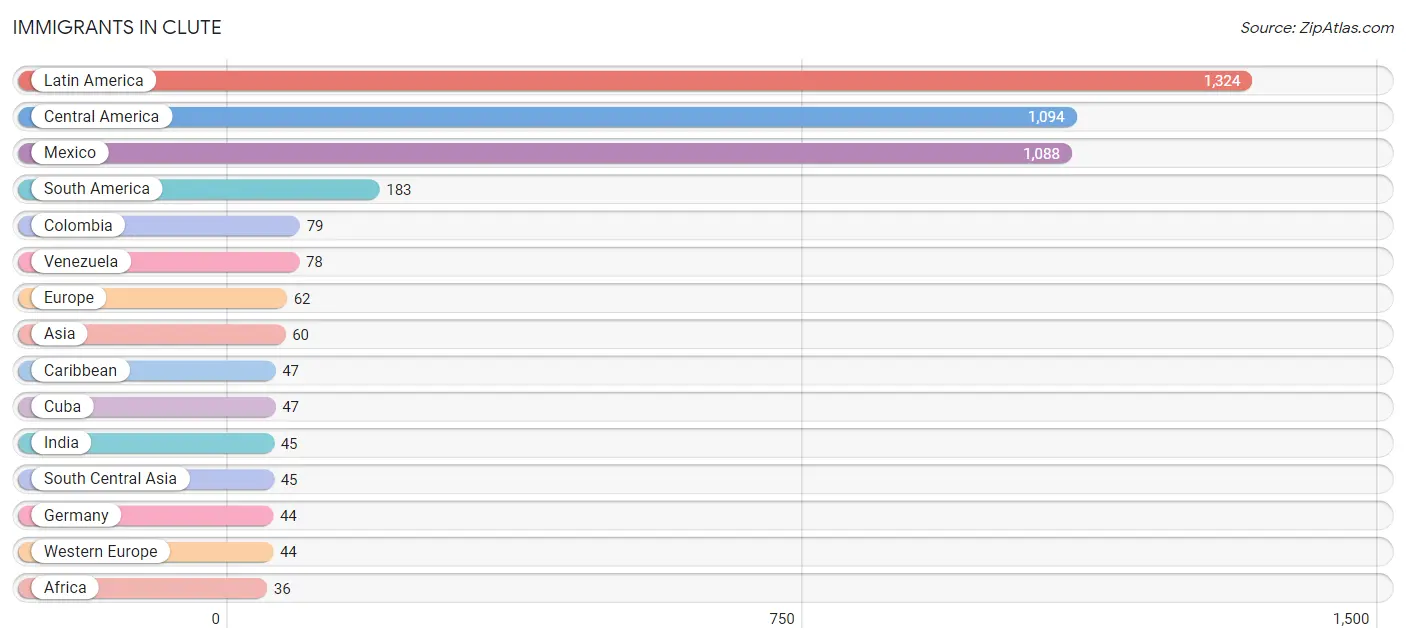
Immigrants in Clute
The most numerous immigrant groups reported in Clute came from Latin America (1,324 | 12.4%), Central America (1,094 | 10.2%), Mexico (1,088 | 10.2%), South America (183 | 1.7%), and Colombia (79 | 0.7%), together accounting for 35.3% of all Clute residents.
| Immigration Origin | # Population | % Population |
| Africa | 36 | 0.3% |
| Argentina | 26 | 0.2% |
| Asia | 60 | 0.6% |
| Canada | 21 | 0.2% |
| Caribbean | 47 | 0.4% |
| Central America | 1,094 | 10.2% |
| China | 15 | 0.1% |
| Colombia | 79 | 0.7% |
| Cuba | 47 | 0.4% |
| Eastern Asia | 15 | 0.1% |
| England | 18 | 0.2% |
| Europe | 62 | 0.6% |
| Germany | 44 | 0.4% |
| Guatemala | 6 | 0.1% |
| India | 45 | 0.4% |
| Latin America | 1,324 | 12.4% |
| Mexico | 1,088 | 10.2% |
| Northern Europe | 18 | 0.2% |
| Oceania | 8 | 0.1% |
| South Africa | 36 | 0.3% |
| South America | 183 | 1.7% |
| South Central Asia | 45 | 0.4% |
| Venezuela | 78 | 0.7% |
| Western Europe | 44 | 0.4% | View All 24 Rows |
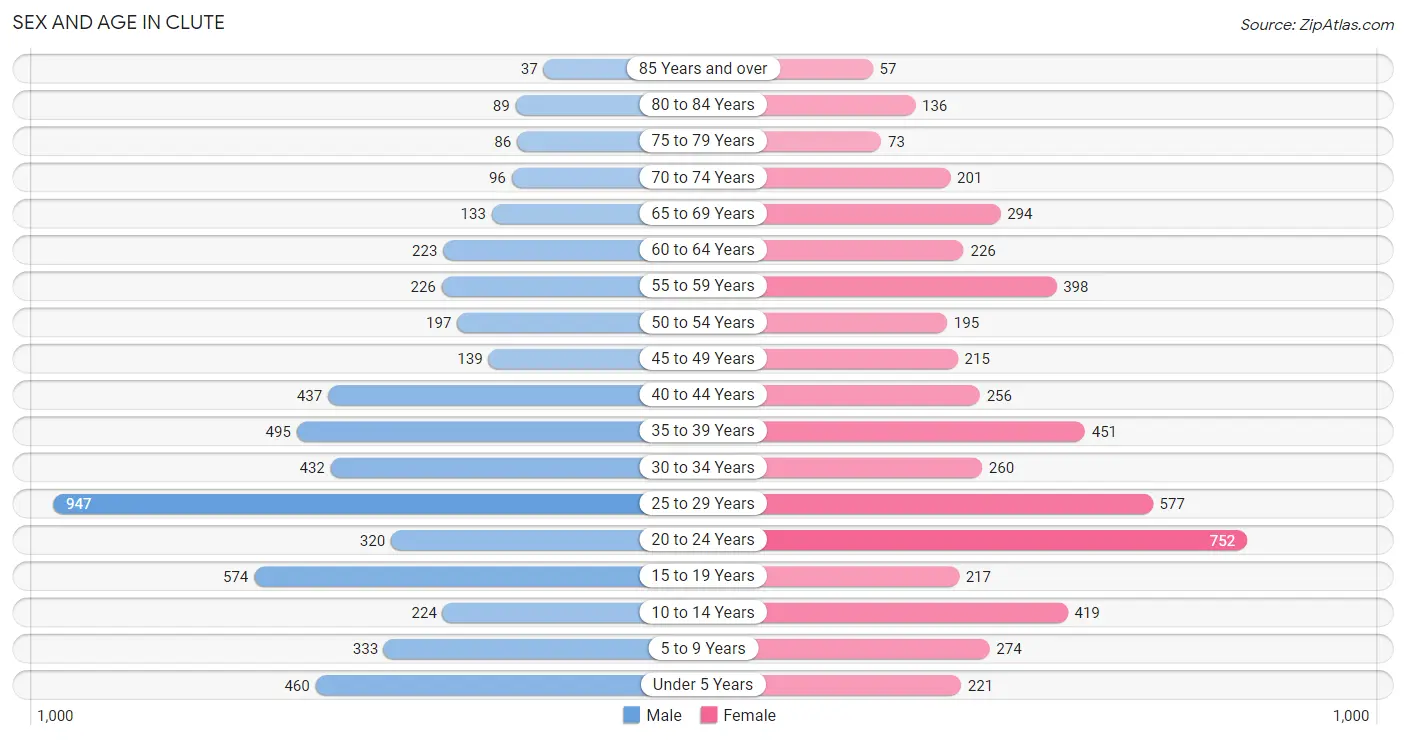
Sex and Age in Clute
Sex and Age in Clute
The most populous age groups in Clute are 25 to 29 Years (947 | 17.4%) for men and 20 to 24 Years (752 | 14.4%) for women.
| Age Bracket | Male | Female |
| Under 5 Years | 460 (8.4%) | 221 (4.2%) |
| 5 to 9 Years | 333 (6.1%) | 274 (5.2%) |
| 10 to 14 Years | 224 (4.1%) | 419 (8.0%) |
| 15 to 19 Years | 574 (10.5%) | 217 (4.2%) |
| 20 to 24 Years | 320 (5.9%) | 752 (14.4%) |
| 25 to 29 Years | 947 (17.4%) | 577 (11.1%) |
| 30 to 34 Years | 432 (7.9%) | 260 (5.0%) |
| 35 to 39 Years | 495 (9.1%) | 451 (8.6%) |
| 40 to 44 Years | 437 (8.0%) | 256 (4.9%) |
| 45 to 49 Years | 139 (2.5%) | 215 (4.1%) |
| 50 to 54 Years | 197 (3.6%) | 195 (3.7%) |
| 55 to 59 Years | 226 (4.2%) | 398 (7.6%) |
| 60 to 64 Years | 223 (4.1%) | 226 (4.3%) |
| 65 to 69 Years | 133 (2.4%) | 294 (5.6%) |
| 70 to 74 Years | 96 (1.8%) | 201 (3.8%) |
| 75 to 79 Years | 86 (1.6%) | 73 (1.4%) |
| 80 to 84 Years | 89 (1.6%) | 136 (2.6%) |
| 85 Years and over | 37 (0.7%) | 57 (1.1%) |
| Total | 5,448 (100.0%) | 5,222 (100.0%) |
Families and Households in Clute
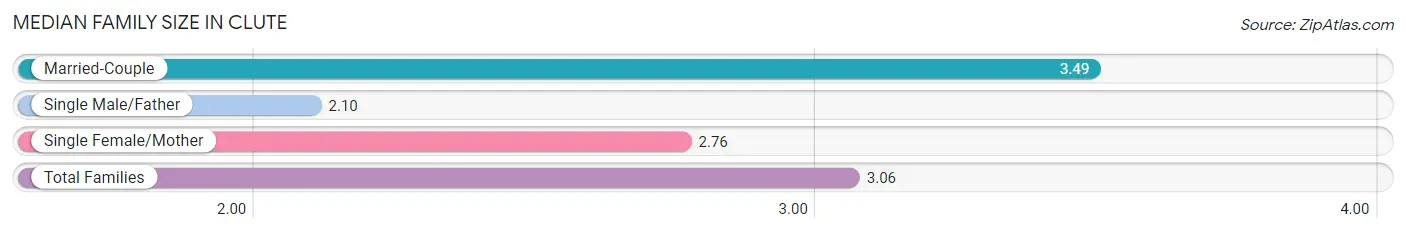
Median Family Size in Clute
The median family size in Clute is 3.06 persons per family, with married-couple families (1,507 | 55.7%) accounting for the largest median family size of 3.49 persons per family. On the other hand, single male/father families (430 | 15.9%) represent the smallest median family size with 2.10 persons per family.
| Family Type | # Families | Family Size |
| Married-Couple | 1,507 (55.7%) | 3.49 |
| Single Male/Father | 430 (15.9%) | 2.10 |
| Single Female/Mother | 766 (28.3%) | 2.76 |
| Total Families | 2,703 (100.0%) | 3.06 |
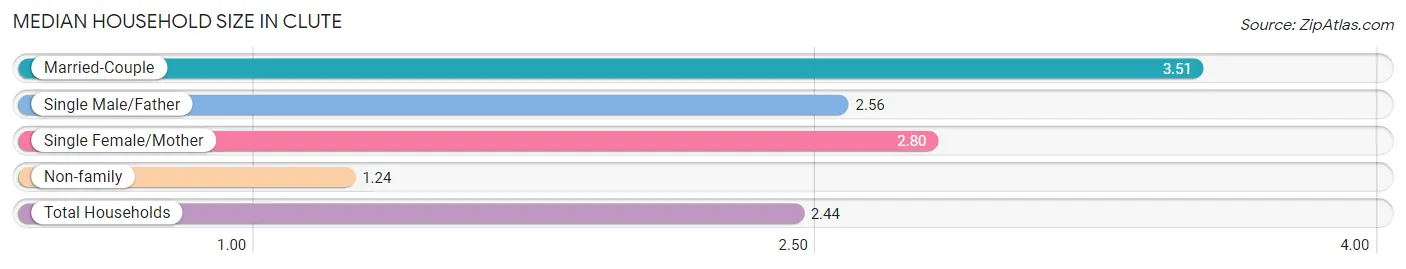
Median Household Size in Clute
The median household size in Clute is 2.44 persons per household, with married-couple households (1,507 | 34.9%) accounting for the largest median household size of 3.51 persons per household. non-family households (1,611 | 37.3%) represent the smallest median household size with 1.24 persons per household.
| Household Type | # Households | Household Size |
| Married-Couple | 1,507 (34.9%) | 3.51 |
| Single Male/Father | 430 (10.0%) | 2.56 |
| Single Female/Mother | 766 (17.8%) | 2.80 |
| Non-family | 1,611 (37.3%) | 1.24 |
| Total Households | 4,314 (100.0%) | 2.44 |
Household Size by Marriage Status in Clute
Out of a total of 4,314 households in Clute, 2,703 (62.7%) are family households, while 1,611 (37.3%) are nonfamily households. The most numerous type of family households are 2-person households, comprising 951, and the most common type of nonfamily households are 1-person households, comprising 1,127.
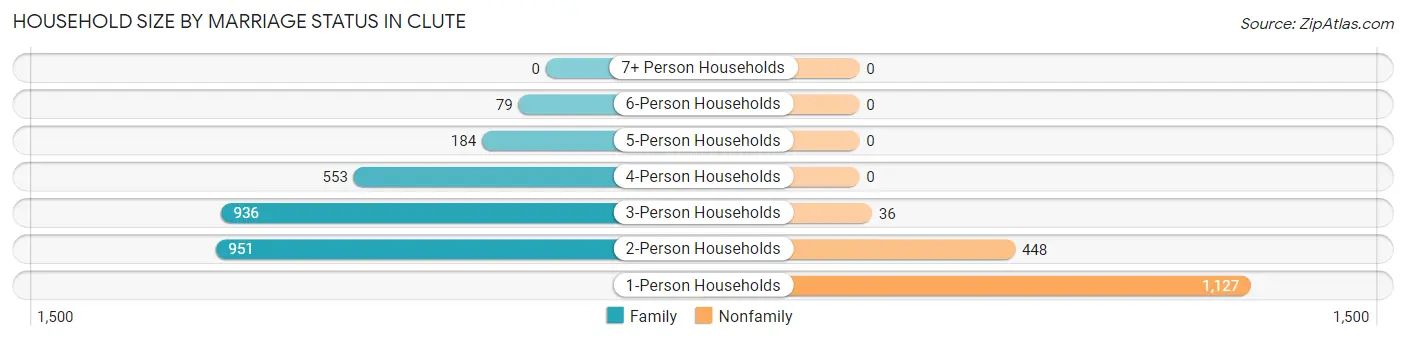
| Household Size | Family Households | Nonfamily Households |
| 1-Person Households | - | 1,127 (26.1%) |
| 2-Person Households | 951 (22.0%) | 448 (10.4%) |
| 3-Person Households | 936 (21.7%) | 36 (0.8%) |
| 4-Person Households | 553 (12.8%) | 0 (0.0%) |
| 5-Person Households | 184 (4.3%) | 0 (0.0%) |
| 6-Person Households | 79 (1.8%) | 0 (0.0%) |
| 7+ Person Households | 0 (0.0%) | 0 (0.0%) |
| Total | 2,703 (62.7%) | 1,611 (37.3%) |
Female Fertility in Clute
Fertility by Age in Clute
Average fertility rate in Clute is 122.0 births per 1,000 women. Women in the age bracket of 20 to 34 years have the highest fertility rate with 169.0 births per 1,000 women. Women in the age bracket of 20 to 34 years acount for 78.1% of all women with births.
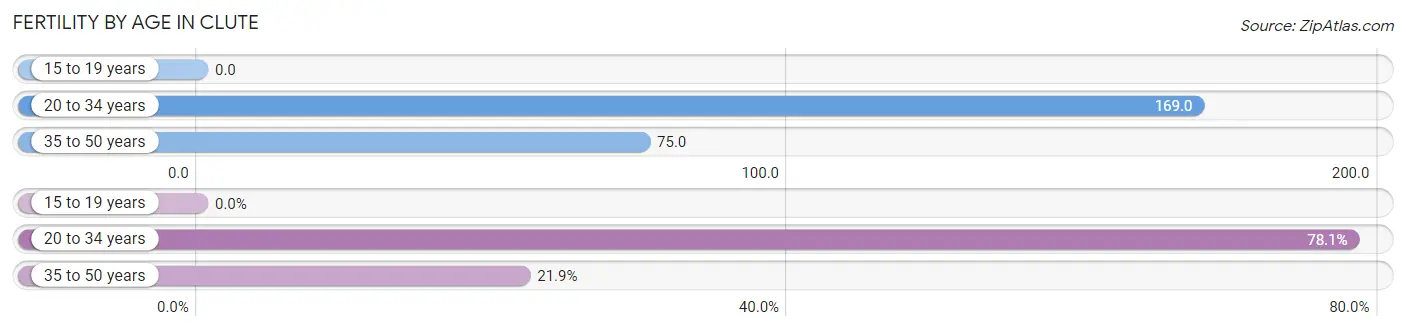
| Age Bracket | Women with Births | Births / 1,000 Women |
| 15 to 19 years | 0 (0.0%) | 0.0 |
| 20 to 34 years | 268 (78.1%) | 169.0 |
| 35 to 50 years | 75 (21.9%) | 75.0 |
| Total | 343 (100.0%) | 122.0 |
Fertility by Age by Marriage Status in Clute
27.4% of women with births (343) in Clute are married. The highest percentage of unmarried women with births falls into 20 to 34 years age bracket with 78.7% of them unmarried at the time of birth, while the lowest percentage of unmarried women with births belong to 35 to 50 years age bracket with 50.7% of them unmarried.
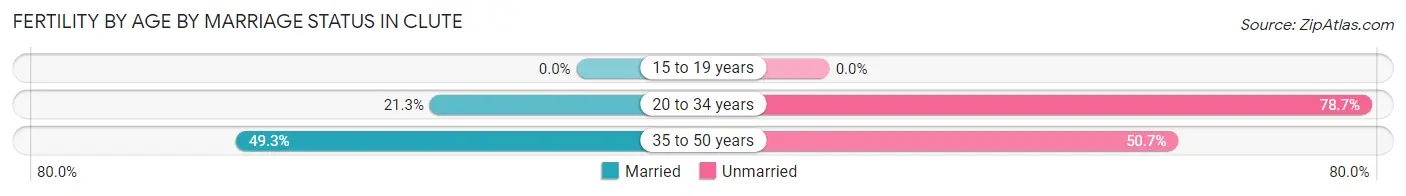
| Age Bracket | Married | Unmarried |
| 15 to 19 years | 0 (0.0%) | 0 (0.0%) |
| 20 to 34 years | 57 (21.3%) | 211 (78.7%) |
| 35 to 50 years | 37 (49.3%) | 38 (50.7%) |
| Total | 94 (27.4%) | 249 (72.6%) |
Fertility by Education in Clute
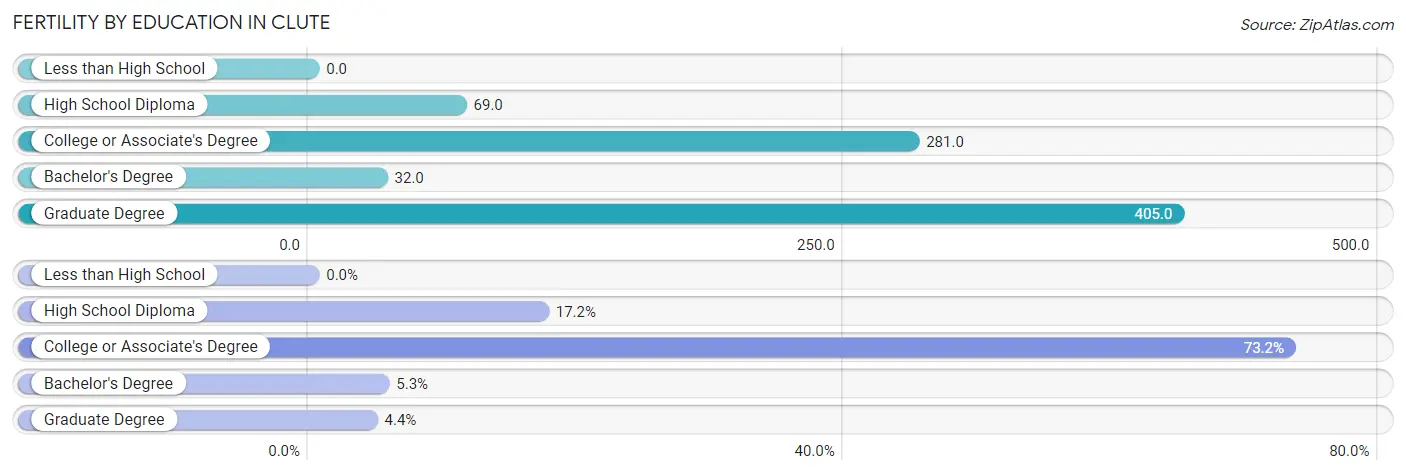
| Educational Attainment | Women with Births | Births / 1,000 Women |
| Less than High School | 0 (0.0%) | 0.0 |
| High School Diploma | 59 (17.2%) | 69.0 |
| College or Associate's Degree | 251 (73.2%) | 281.0 |
| Bachelor's Degree | 18 (5.2%) | 32.0 |
| Graduate Degree | 15 (4.4%) | 405.0 |
| Total | 343 (100.0%) | 122.0 |
Fertility by Education by Marriage Status in Clute
72.6% of women with births in Clute are unmarried. Women with the educational attainment of bachelor's degree are most likely to be married with 100.0% of them married at childbirth, while women with the educational attainment of high school diploma are least likely to be married with 100.0% of them unmarried at childbirth.
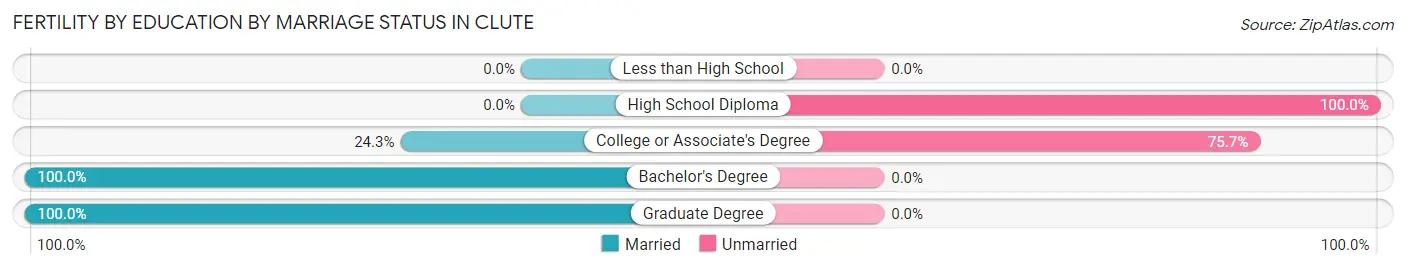
| Educational Attainment | Married | Unmarried |
| Less than High School | 0 (0.0%) | 0 (0.0%) |
| High School Diploma | 0 (0.0%) | 59 (100.0%) |
| College or Associate's Degree | 61 (24.3%) | 190 (75.7%) |
| Bachelor's Degree | 18 (100.0%) | 0 (0.0%) |
| Graduate Degree | 15 (100.0%) | 0 (0.0%) |
| Total | 94 (27.4%) | 249 (72.6%) |
Employment Characteristics in Clute
Employment by Class of Employer in Clute
Among the 5,275 employed individuals in Clute, private company employees (4,468 | 84.7%), not-for-profit organizations (206 | 3.9%), and local government employees (201 | 3.8%) make up the most common classes of employment.
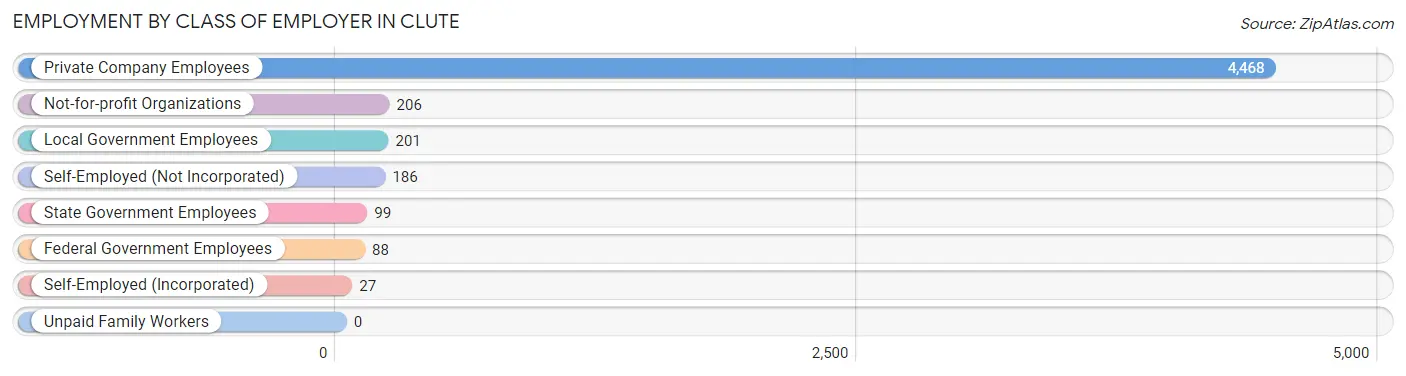
| Employer Class | # Employees | % Employees |
| Private Company Employees | 4,468 | 84.7% |
| Self-Employed (Incorporated) | 27 | 0.5% |
| Self-Employed (Not Incorporated) | 186 | 3.5% |
| Not-for-profit Organizations | 206 | 3.9% |
| Local Government Employees | 201 | 3.8% |
| State Government Employees | 99 | 1.9% |
| Federal Government Employees | 88 | 1.7% |
| Unpaid Family Workers | 0 | 0.0% |
| Total | 5,275 | 100.0% |
Employment Status by Age in Clute
According to the labor force statistics for Clute, out of the total population over 16 years of age (8,534), 70.1% or 5,982 individuals are in the labor force, with 8.6% or 514 of them unemployed. The age group with the highest labor force participation rate is 25 to 29 years, with 89.5% or 1,364 individuals in the labor force. Within the labor force, the 45 to 54 years age range has the highest percentage of unemployed individuals, with 19.3% or 118 of them being unemployed.
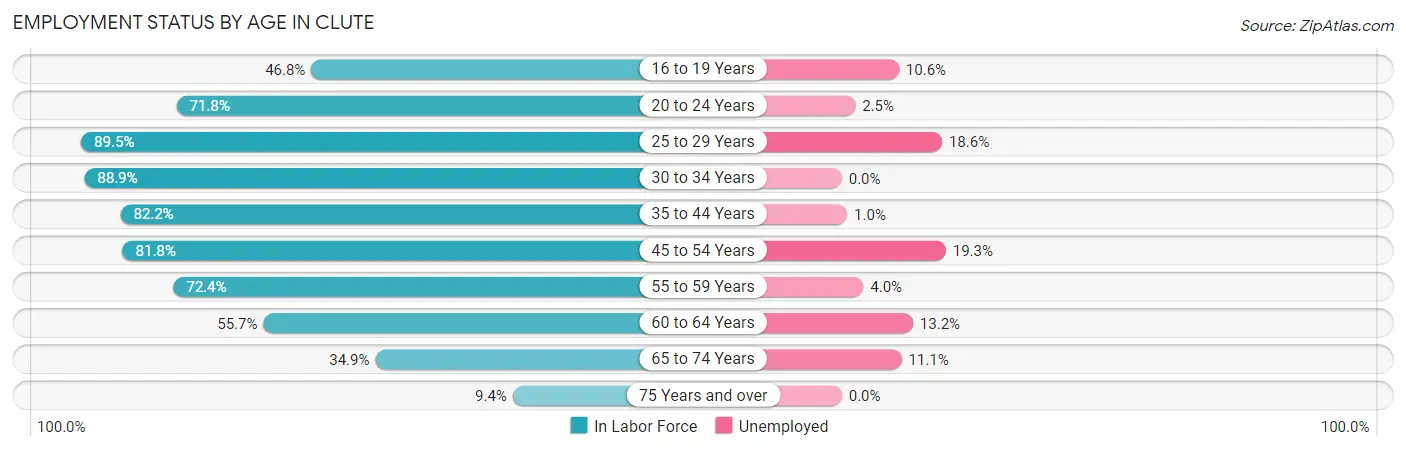
| Age Bracket | In Labor Force | Unemployed |
| 16 to 19 Years | 274 (46.8%) | 29 (10.6%) |
| 20 to 24 Years | 770 (71.8%) | 19 (2.5%) |
| 25 to 29 Years | 1,364 (89.5%) | 254 (18.6%) |
| 30 to 34 Years | 615 (88.9%) | 0 (0.0%) |
| 35 to 44 Years | 1,347 (82.2%) | 13 (1.0%) |
| 45 to 54 Years | 610 (81.8%) | 118 (19.3%) |
| 55 to 59 Years | 452 (72.4%) | 18 (4.0%) |
| 60 to 64 Years | 250 (55.7%) | 33 (13.2%) |
| 65 to 74 Years | 253 (34.9%) | 28 (11.1%) |
| 75 Years and over | 45 (9.4%) | 0 (0.0%) |
| Total | 5,982 (70.1%) | 514 (8.6%) |
Employment Status by Educational Attainment in Clute
According to labor force statistics for Clute, 81.7% of individuals (4,636) out of the total population between 25 and 64 years of age (5,674) are in the labor force, with 9.4% or 436 of them being unemployed. The group with the highest labor force participation rate are those with the educational attainment of bachelor's degree or higher, with 86.5% or 991 individuals in the labor force. Within the labor force, individuals with college / associate degree education have the highest percentage of unemployment, with 16.5% or 259 of them being unemployed.
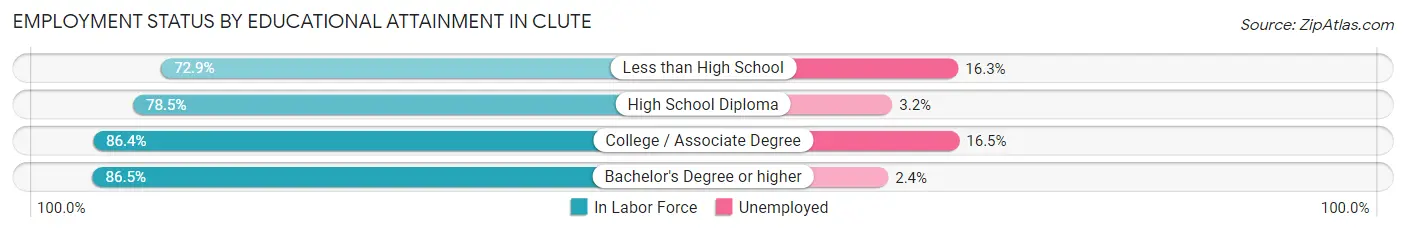
| Educational Attainment | In Labor Force | Unemployed |
| Less than High School | 658 (72.9%) | 147 (16.3%) |
| High School Diploma | 1,418 (78.5%) | 58 (3.2%) |
| College / Associate Degree | 1,572 (86.4%) | 300 (16.5%) |
| Bachelor's Degree or higher | 991 (86.5%) | 28 (2.4%) |
| Total | 4,636 (81.7%) | 533 (9.4%) |
Employment Occupations by Sex in Clute
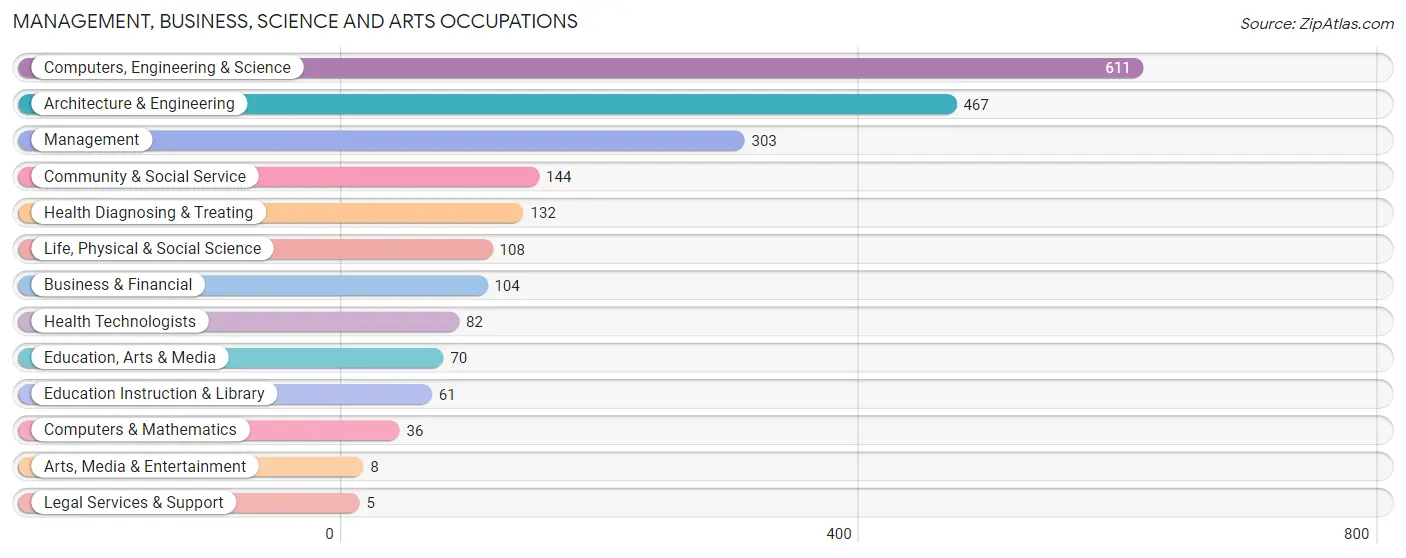
Management, Business, Science and Arts Occupations
The most common Management, Business, Science and Arts occupations in Clute are Computers, Engineering & Science (611 | 11.2%), Architecture & Engineering (467 | 8.5%), Management (303 | 5.5%), Community & Social Service (144 | 2.6%), and Health Diagnosing & Treating (132 | 2.4%).
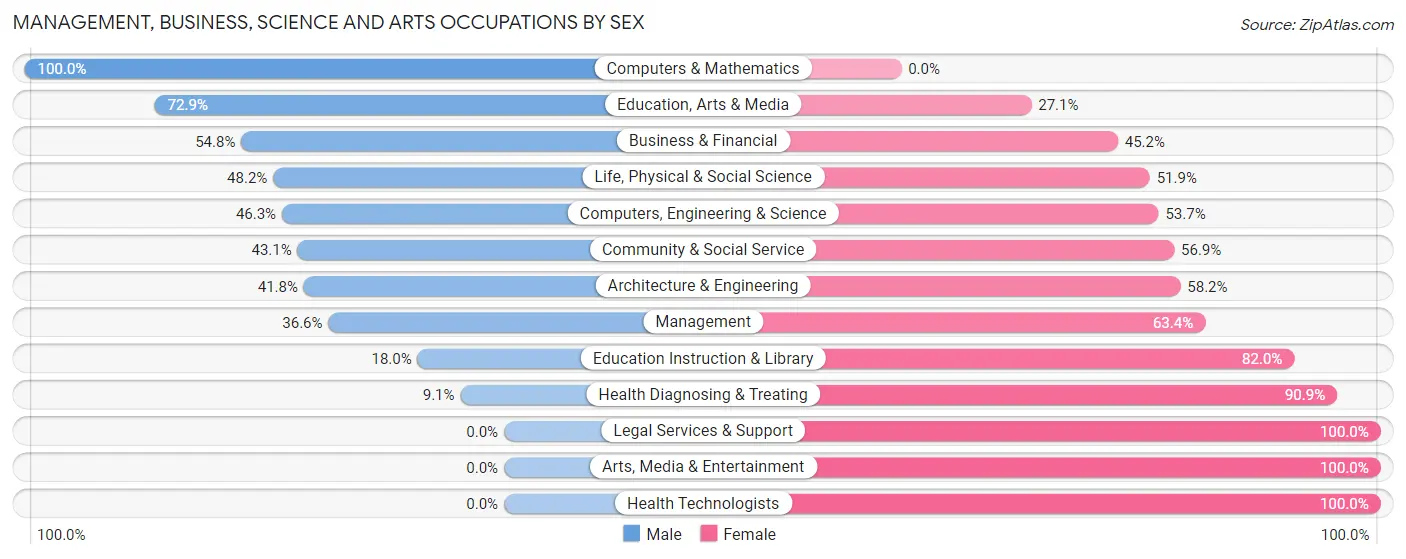
Management, Business, Science and Arts Occupations by Sex
Within the Management, Business, Science and Arts occupations in Clute, the most male-oriented occupations are Computers & Mathematics (100.0%), Education, Arts & Media (72.9%), and Business & Financial (54.8%), while the most female-oriented occupations are Legal Services & Support (100.0%), Arts, Media & Entertainment (100.0%), and Health Technologists (100.0%).
| Occupation | Male | Female |
| Management | 111 (36.6%) | 192 (63.4%) |
| Business & Financial | 57 (54.8%) | 47 (45.2%) |
| Computers, Engineering & Science | 283 (46.3%) | 328 (53.7%) |
| Computers & Mathematics | 36 (100.0%) | 0 (0.0%) |
| Architecture & Engineering | 195 (41.8%) | 272 (58.2%) |
| Life, Physical & Social Science | 52 (48.1%) | 56 (51.8%) |
| Community & Social Service | 62 (43.1%) | 82 (56.9%) |
| Education, Arts & Media | 51 (72.9%) | 19 (27.1%) |
| Legal Services & Support | 0 (0.0%) | 5 (100.0%) |
| Education Instruction & Library | 11 (18.0%) | 50 (82.0%) |
| Arts, Media & Entertainment | 0 (0.0%) | 8 (100.0%) |
| Health Diagnosing & Treating | 12 (9.1%) | 120 (90.9%) |
| Health Technologists | 0 (0.0%) | 82 (100.0%) |
| Total (Category) | 525 (40.6%) | 769 (59.4%) |
| Total (Overall) | 3,058 (55.9%) | 2,410 (44.1%) |
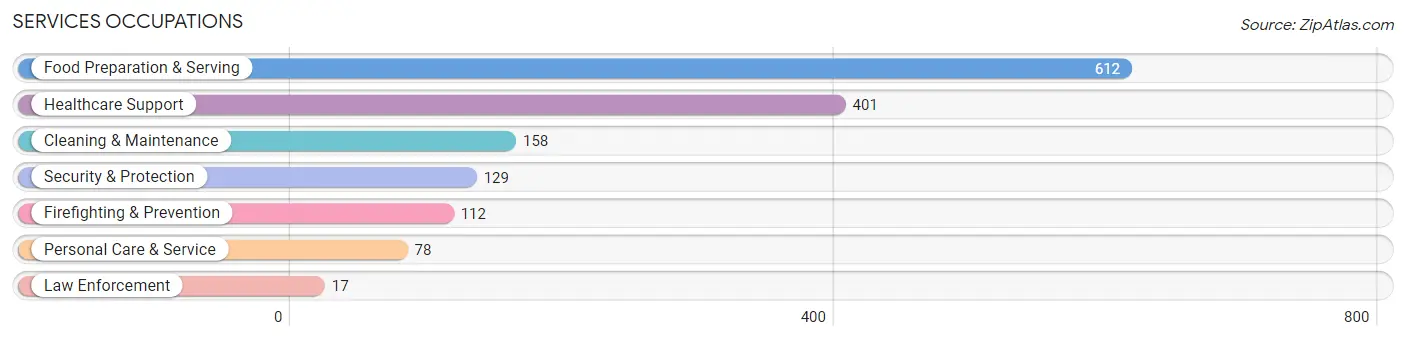
Services Occupations
The most common Services occupations in Clute are Food Preparation & Serving (612 | 11.2%), Healthcare Support (401 | 7.3%), Cleaning & Maintenance (158 | 2.9%), Security & Protection (129 | 2.4%), and Firefighting & Prevention (112 | 2.1%).
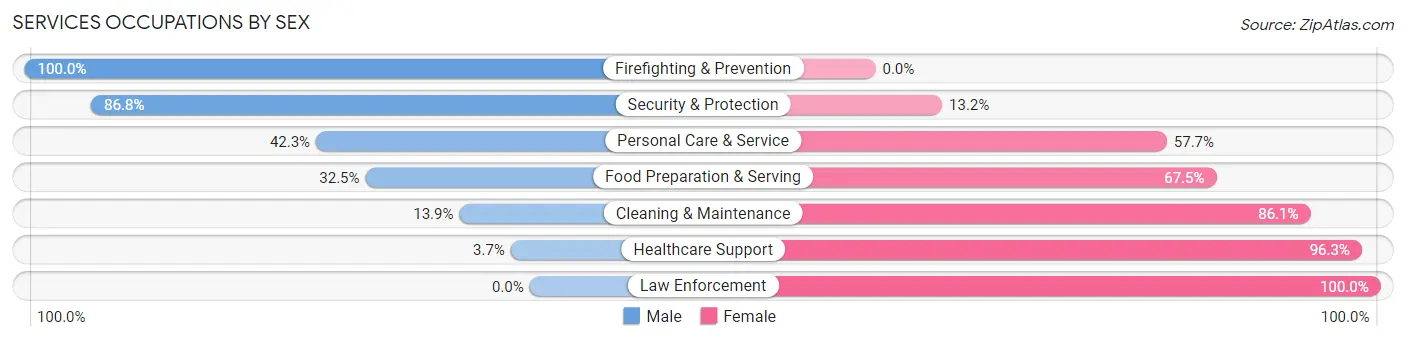
Services Occupations by Sex
Within the Services occupations in Clute, the most male-oriented occupations are Firefighting & Prevention (100.0%), Security & Protection (86.8%), and Personal Care & Service (42.3%), while the most female-oriented occupations are Law Enforcement (100.0%), Healthcare Support (96.3%), and Cleaning & Maintenance (86.1%).
| Occupation | Male | Female |
| Healthcare Support | 15 (3.7%) | 386 (96.3%) |
| Security & Protection | 112 (86.8%) | 17 (13.2%) |
| Firefighting & Prevention | 112 (100.0%) | 0 (0.0%) |
| Law Enforcement | 0 (0.0%) | 17 (100.0%) |
| Food Preparation & Serving | 199 (32.5%) | 413 (67.5%) |
| Cleaning & Maintenance | 22 (13.9%) | 136 (86.1%) |
| Personal Care & Service | 33 (42.3%) | 45 (57.7%) |
| Total (Category) | 381 (27.7%) | 997 (72.4%) |
| Total (Overall) | 3,058 (55.9%) | 2,410 (44.1%) |
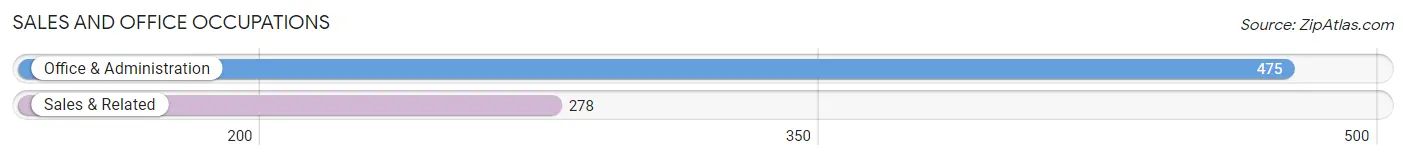
Sales and Office Occupations
The most common Sales and Office occupations in Clute are Office & Administration (475 | 8.7%), and Sales & Related (278 | 5.1%).
Sales and Office Occupations by Sex
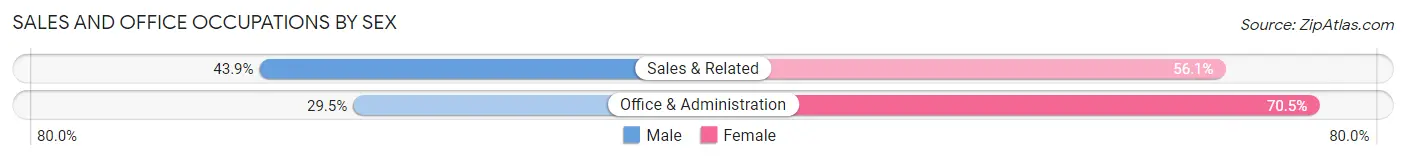
| Occupation | Male | Female |
| Sales & Related | 122 (43.9%) | 156 (56.1%) |
| Office & Administration | 140 (29.5%) | 335 (70.5%) |
| Total (Category) | 262 (34.8%) | 491 (65.2%) |
| Total (Overall) | 3,058 (55.9%) | 2,410 (44.1%) |
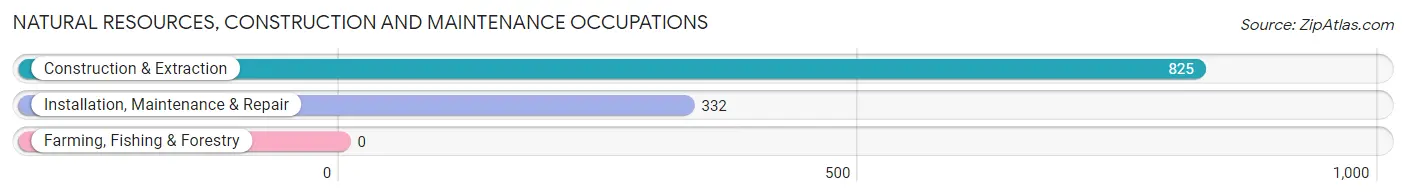
Natural Resources, Construction and Maintenance Occupations
The most common Natural Resources, Construction and Maintenance occupations in Clute are Construction & Extraction (825 | 15.1%), and Installation, Maintenance & Repair (332 | 6.1%).
Natural Resources, Construction and Maintenance Occupations by Sex
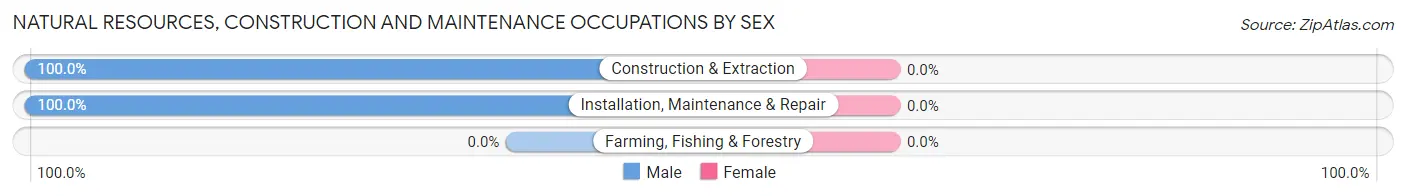
| Occupation | Male | Female |
| Farming, Fishing & Forestry | 0 (0.0%) | 0 (0.0%) |
| Construction & Extraction | 825 (100.0%) | 0 (0.0%) |
| Installation, Maintenance & Repair | 332 (100.0%) | 0 (0.0%) |
| Total (Category) | 1,157 (100.0%) | 0 (0.0%) |
| Total (Overall) | 3,058 (55.9%) | 2,410 (44.1%) |
Production, Transportation and Moving Occupations
The most common Production, Transportation and Moving occupations in Clute are Production (387 | 7.1%), Transportation (266 | 4.9%), and Material Moving (233 | 4.3%).
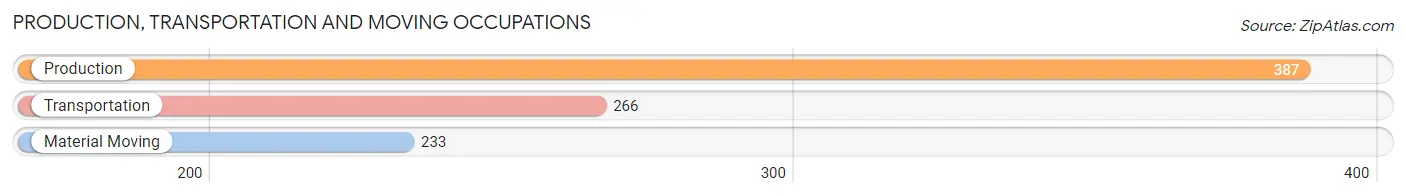
Production, Transportation and Moving Occupations by Sex
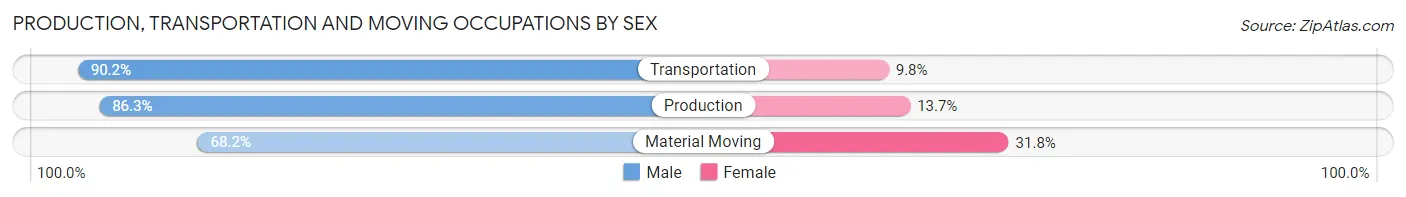
| Occupation | Male | Female |
| Production | 334 (86.3%) | 53 (13.7%) |
| Transportation | 240 (90.2%) | 26 (9.8%) |
| Material Moving | 159 (68.2%) | 74 (31.8%) |
| Total (Category) | 733 (82.7%) | 153 (17.3%) |
| Total (Overall) | 3,058 (55.9%) | 2,410 (44.1%) |
Employment Industries by Sex in Clute
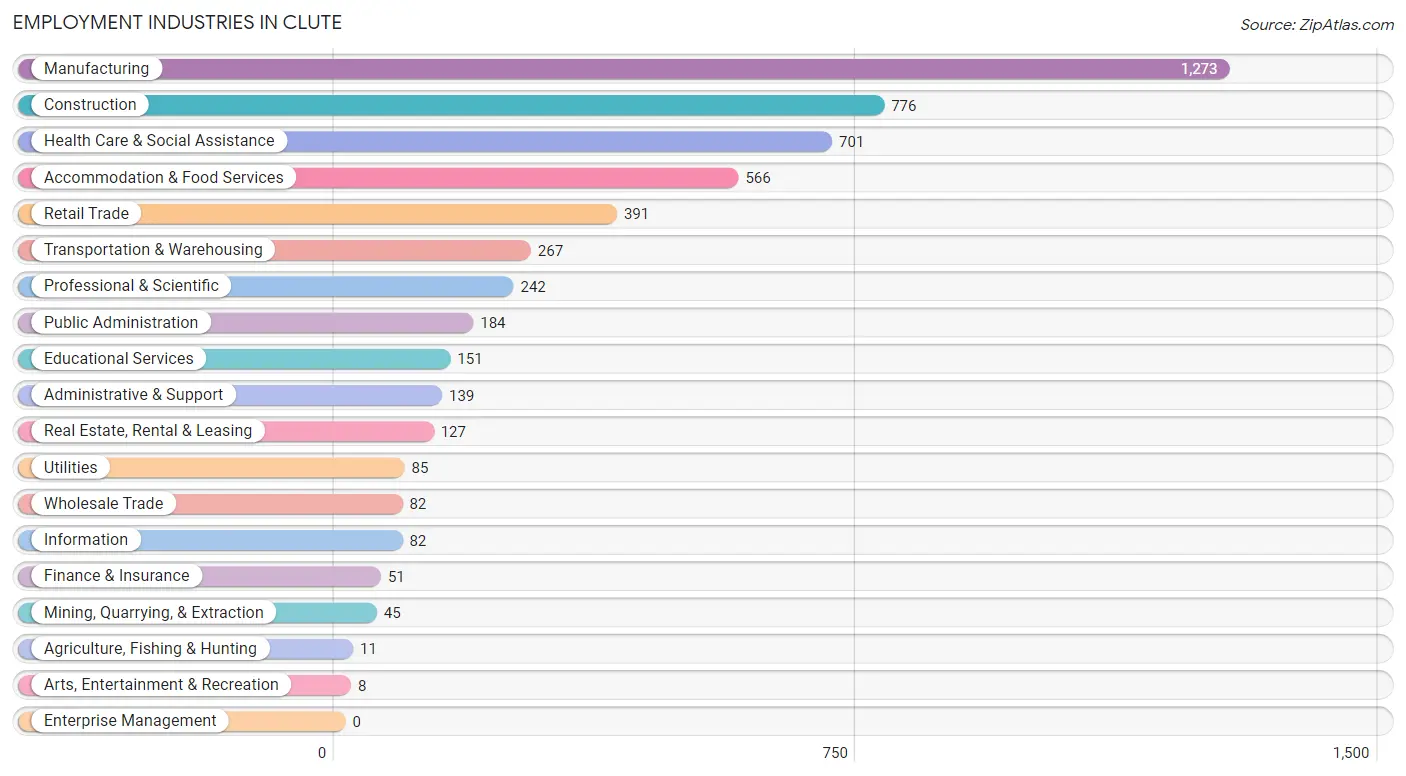
Employment Industries in Clute
The major employment industries in Clute include Manufacturing (1,273 | 23.3%), Construction (776 | 14.2%), Health Care & Social Assistance (701 | 12.8%), Accommodation & Food Services (566 | 10.3%), and Retail Trade (391 | 7.1%).
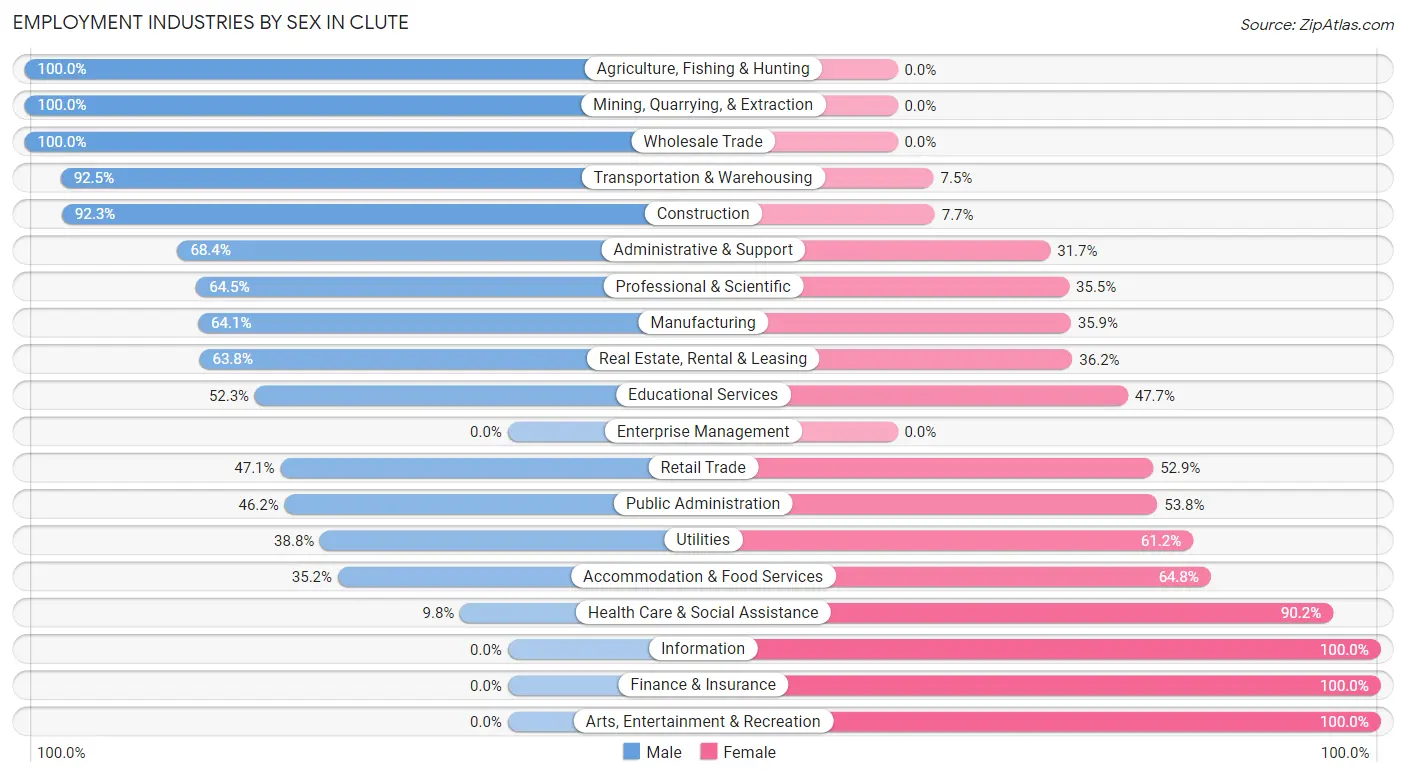
Employment Industries by Sex in Clute
The Clute industries that see more men than women are Agriculture, Fishing & Hunting (100.0%), Mining, Quarrying, & Extraction (100.0%), and Wholesale Trade (100.0%), whereas the industries that tend to have a higher number of women are Information (100.0%), Finance & Insurance (100.0%), and Arts, Entertainment & Recreation (100.0%).
| Industry | Male | Female |
| Agriculture, Fishing & Hunting | 11 (100.0%) | 0 (0.0%) |
| Mining, Quarrying, & Extraction | 45 (100.0%) | 0 (0.0%) |
| Construction | 716 (92.3%) | 60 (7.7%) |
| Manufacturing | 816 (64.1%) | 457 (35.9%) |
| Wholesale Trade | 82 (100.0%) | 0 (0.0%) |
| Retail Trade | 184 (47.1%) | 207 (52.9%) |
| Transportation & Warehousing | 247 (92.5%) | 20 (7.5%) |
| Utilities | 33 (38.8%) | 52 (61.2%) |
| Information | 0 (0.0%) | 82 (100.0%) |
| Finance & Insurance | 0 (0.0%) | 51 (100.0%) |
| Real Estate, Rental & Leasing | 81 (63.8%) | 46 (36.2%) |
| Professional & Scientific | 156 (64.5%) | 86 (35.5%) |
| Enterprise Management | 0 (0.0%) | 0 (0.0%) |
| Administrative & Support | 95 (68.3%) | 44 (31.7%) |
| Educational Services | 79 (52.3%) | 72 (47.7%) |
| Health Care & Social Assistance | 69 (9.8%) | 632 (90.2%) |
| Arts, Entertainment & Recreation | 0 (0.0%) | 8 (100.0%) |
| Accommodation & Food Services | 199 (35.2%) | 367 (64.8%) |
| Public Administration | 85 (46.2%) | 99 (53.8%) |
| Total | 3,058 (55.9%) | 2,410 (44.1%) |
Education in Clute
School Enrollment in Clute
The most common levels of schooling among the 2,549 students in Clute are high school (585 | 23.0%), middle school (544 | 21.3%), and elementary school (541 | 21.2%).
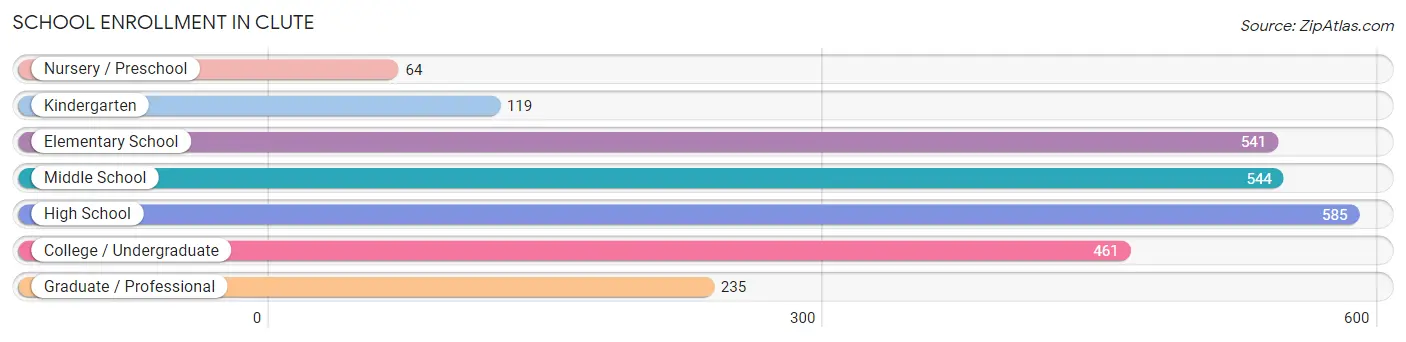
| School Level | # Students | % Students |
| Nursery / Preschool | 64 | 2.5% |
| Kindergarten | 119 | 4.7% |
| Elementary School | 541 | 21.2% |
| Middle School | 544 | 21.3% |
| High School | 585 | 23.0% |
| College / Undergraduate | 461 | 18.1% |
| Graduate / Professional | 235 | 9.2% |
| Total | 2,549 | 100.0% |
School Enrollment by Age by Funding Source in Clute
Out of a total of 2,549 students who are enrolled in schools in Clute, 255 (10.0%) attend a private institution, while the remaining 2,294 (90.0%) are enrolled in public schools. The age group of 3 to 4 year olds has the highest likelihood of being enrolled in private schools, with 37 (57.8% in the age bracket) enrolled. Conversely, the age group of 5 to 9 year old has the lowest likelihood of being enrolled in a private school, with 607 (100.0% in the age bracket) attending a public institution.
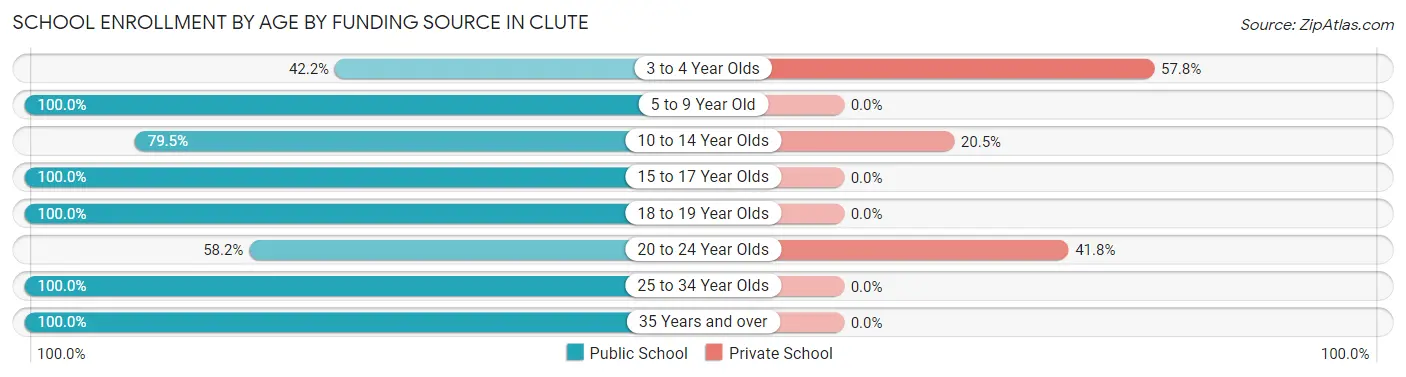
| Age Bracket | Public School | Private School |
| 3 to 4 Year Olds | 27 (42.2%) | 37 (57.8%) |
| 5 to 9 Year Old | 607 (100.0%) | 0 (0.0%) |
| 10 to 14 Year Olds | 511 (79.5%) | 132 (20.5%) |
| 15 to 17 Year Olds | 368 (100.0%) | 0 (0.0%) |
| 18 to 19 Year Olds | 301 (100.0%) | 0 (0.0%) |
| 20 to 24 Year Olds | 121 (58.2%) | 87 (41.8%) |
| 25 to 34 Year Olds | 233 (100.0%) | 0 (0.0%) |
| 35 Years and over | 125 (100.0%) | 0 (0.0%) |
| Total | 2,294 (90.0%) | 255 (10.0%) |
Educational Attainment by Field of Study in Clute
Engineering (480 | 33.1%), business (290 | 20.0%), education (162 | 11.2%), arts & humanities (132 | 9.1%), and science & technology (123 | 8.5%) are the most common fields of study among 1,451 individuals in Clute who have obtained a bachelor's degree or higher.
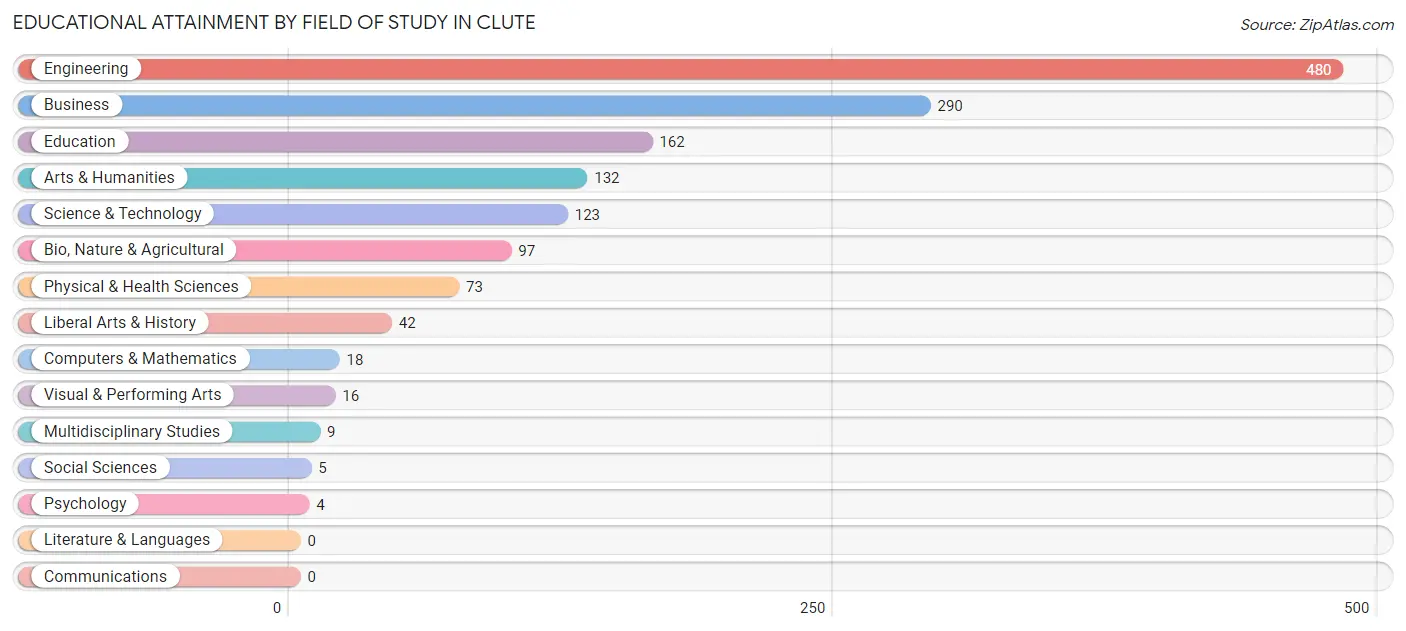
| Field of Study | # Graduates | % Graduates |
| Computers & Mathematics | 18 | 1.2% |
| Bio, Nature & Agricultural | 97 | 6.7% |
| Physical & Health Sciences | 73 | 5.0% |
| Psychology | 4 | 0.3% |
| Social Sciences | 5 | 0.3% |
| Engineering | 480 | 33.1% |
| Multidisciplinary Studies | 9 | 0.6% |
| Science & Technology | 123 | 8.5% |
| Business | 290 | 20.0% |
| Education | 162 | 11.2% |
| Literature & Languages | 0 | 0.0% |
| Liberal Arts & History | 42 | 2.9% |
| Visual & Performing Arts | 16 | 1.1% |
| Communications | 0 | 0.0% |
| Arts & Humanities | 132 | 9.1% |
| Total | 1,451 | 100.0% |
Transportation & Commute in Clute
Vehicle Availability by Sex in Clute
The most prevalent vehicle ownership categories in Clute are males with 2 vehicles (1,242, accounting for 41.3%) and females with 2 vehicles (1,097, making up 54.8%).
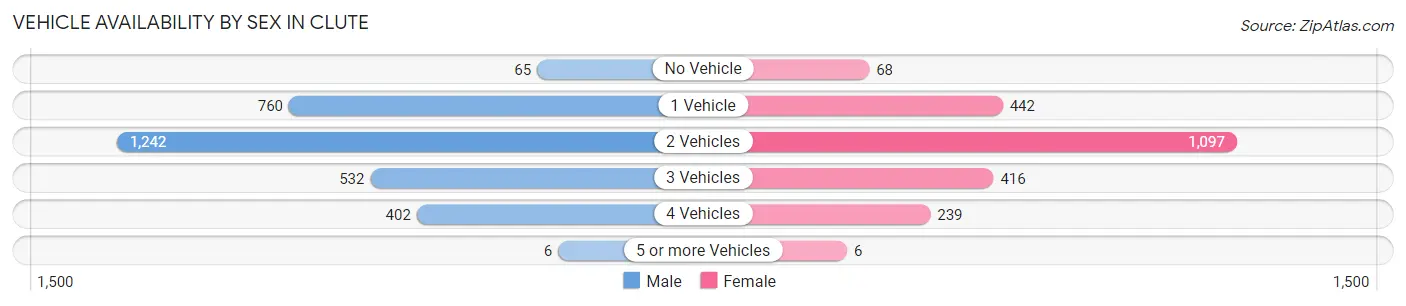
| Vehicles Available | Male | Female |
| No Vehicle | 65 (2.2%) | 68 (3.0%) |
| 1 Vehicle | 760 (25.3%) | 442 (19.5%) |
| 2 Vehicles | 1,242 (41.3%) | 1,097 (48.4%) |
| 3 Vehicles | 532 (17.7%) | 416 (18.3%) |
| 4 Vehicles | 402 (13.4%) | 239 (10.5%) |
| 5 or more Vehicles | 6 (0.2%) | 6 (0.3%) |
| Total | 3,007 (100.0%) | 2,268 (100.0%) |
Commute Time in Clute
The most frequently occuring commute durations in Clute are 10 to 14 minutes (1,780 commuters, 34.4%), 15 to 19 minutes (1,002 commuters, 19.4%), and 20 to 24 minutes (934 commuters, 18.1%).
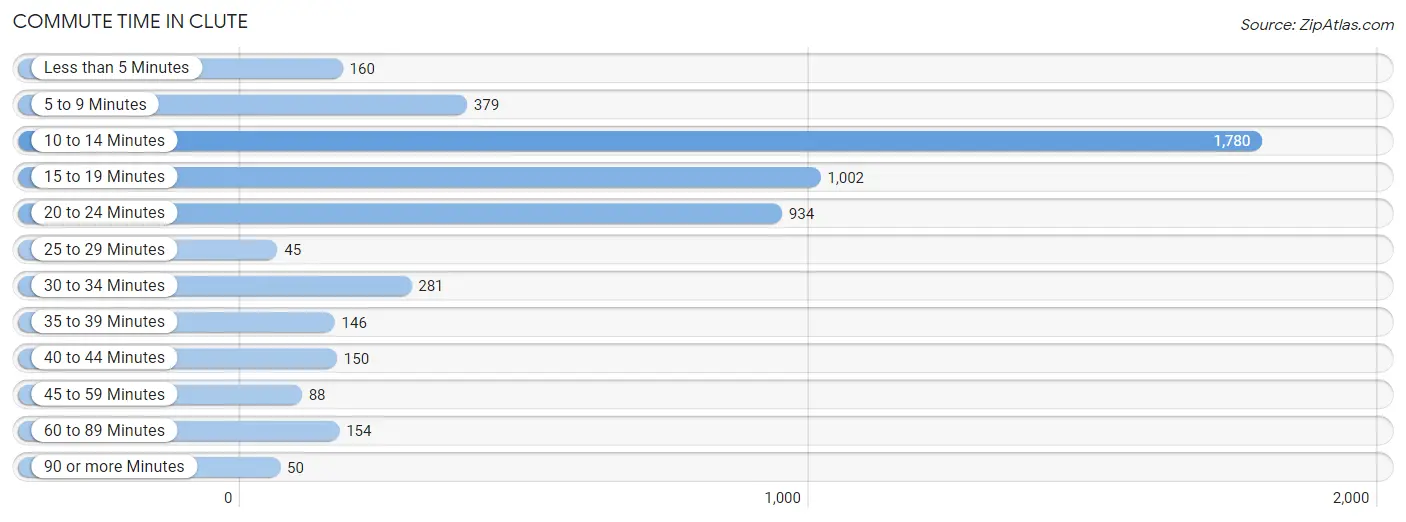
| Commute Time | # Commuters | % Commuters |
| Less than 5 Minutes | 160 | 3.1% |
| 5 to 9 Minutes | 379 | 7.3% |
| 10 to 14 Minutes | 1,780 | 34.4% |
| 15 to 19 Minutes | 1,002 | 19.4% |
| 20 to 24 Minutes | 934 | 18.1% |
| 25 to 29 Minutes | 45 | 0.9% |
| 30 to 34 Minutes | 281 | 5.4% |
| 35 to 39 Minutes | 146 | 2.8% |
| 40 to 44 Minutes | 150 | 2.9% |
| 45 to 59 Minutes | 88 | 1.7% |
| 60 to 89 Minutes | 154 | 3.0% |
| 90 or more Minutes | 50 | 1.0% |
Commute Time by Sex in Clute
The most common commute times in Clute are 10 to 14 minutes (1,049 commuters, 35.5%) for males and 10 to 14 minutes (731 commuters, 33.0%) for females.
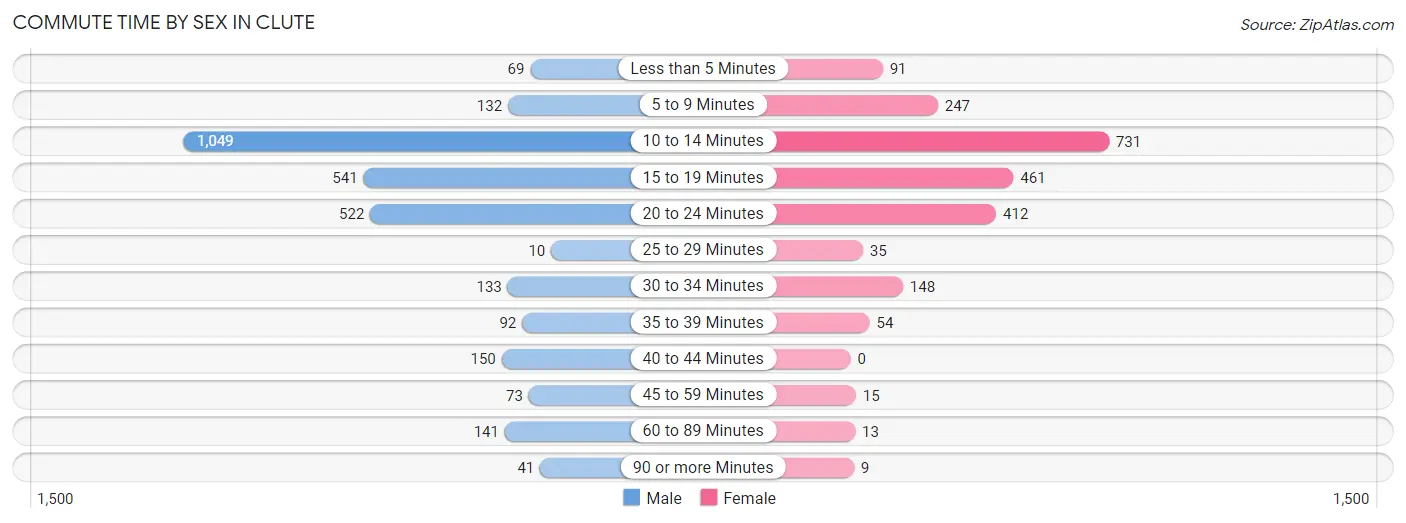
| Commute Time | Male | Female |
| Less than 5 Minutes | 69 (2.3%) | 91 (4.1%) |
| 5 to 9 Minutes | 132 (4.5%) | 247 (11.2%) |
| 10 to 14 Minutes | 1,049 (35.5%) | 731 (33.0%) |
| 15 to 19 Minutes | 541 (18.3%) | 461 (20.8%) |
| 20 to 24 Minutes | 522 (17.7%) | 412 (18.6%) |
| 25 to 29 Minutes | 10 (0.3%) | 35 (1.6%) |
| 30 to 34 Minutes | 133 (4.5%) | 148 (6.7%) |
| 35 to 39 Minutes | 92 (3.1%) | 54 (2.4%) |
| 40 to 44 Minutes | 150 (5.1%) | 0 (0.0%) |
| 45 to 59 Minutes | 73 (2.5%) | 15 (0.7%) |
| 60 to 89 Minutes | 141 (4.8%) | 13 (0.6%) |
| 90 or more Minutes | 41 (1.4%) | 9 (0.4%) |
Time of Departure to Work by Sex in Clute
The most frequent times of departure to work in Clute are 6:00 AM to 6:29 AM (514, 17.4%) for males and 7:30 AM to 7:59 AM (400, 18.0%) for females.
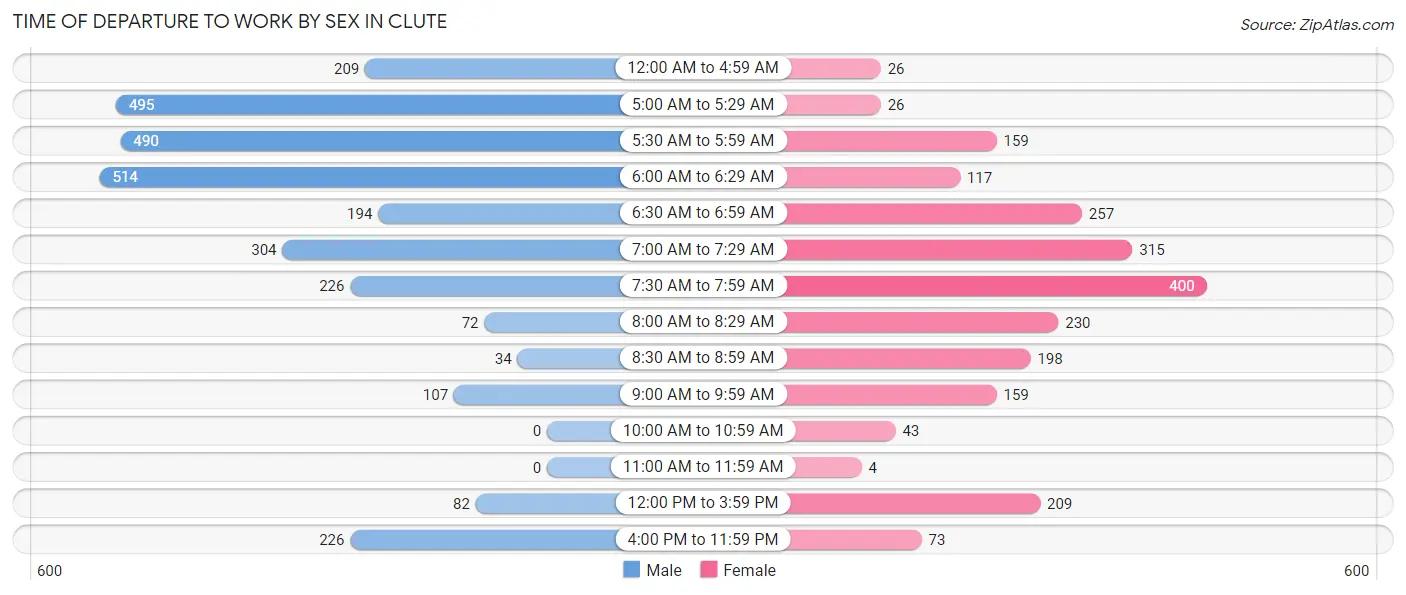
| Time of Departure | Male | Female |
| 12:00 AM to 4:59 AM | 209 (7.1%) | 26 (1.2%) |
| 5:00 AM to 5:29 AM | 495 (16.8%) | 26 (1.2%) |
| 5:30 AM to 5:59 AM | 490 (16.6%) | 159 (7.2%) |
| 6:00 AM to 6:29 AM | 514 (17.4%) | 117 (5.3%) |
| 6:30 AM to 6:59 AM | 194 (6.6%) | 257 (11.6%) |
| 7:00 AM to 7:29 AM | 304 (10.3%) | 315 (14.2%) |
| 7:30 AM to 7:59 AM | 226 (7.6%) | 400 (18.0%) |
| 8:00 AM to 8:29 AM | 72 (2.4%) | 230 (10.4%) |
| 8:30 AM to 8:59 AM | 34 (1.1%) | 198 (8.9%) |
| 9:00 AM to 9:59 AM | 107 (3.6%) | 159 (7.2%) |
| 10:00 AM to 10:59 AM | 0 (0.0%) | 43 (1.9%) |
| 11:00 AM to 11:59 AM | 0 (0.0%) | 4 (0.2%) |
| 12:00 PM to 3:59 PM | 82 (2.8%) | 209 (9.4%) |
| 4:00 PM to 11:59 PM | 226 (7.6%) | 73 (3.3%) |
| Total | 2,953 (100.0%) | 2,216 (100.0%) |
Housing Occupancy in Clute
Occupancy by Ownership in Clute
Of the total 4,314 dwellings in Clute, owner-occupied units account for 2,186 (50.7%), while renter-occupied units make up 2,128 (49.3%).
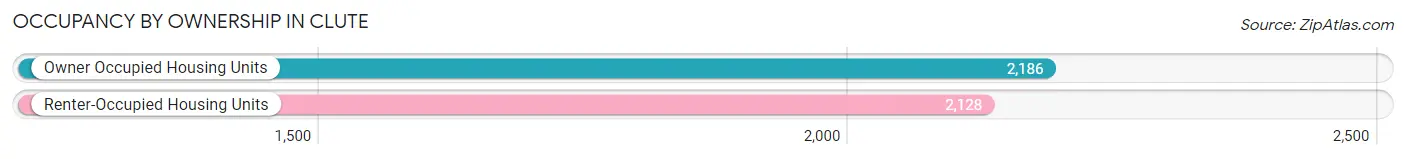
| Occupancy | # Housing Units | % Housing Units |
| Owner Occupied Housing Units | 2,186 | 50.7% |
| Renter-Occupied Housing Units | 2,128 | 49.3% |
| Total Occupied Housing Units | 4,314 | 100.0% |
Occupancy by Household Size in Clute
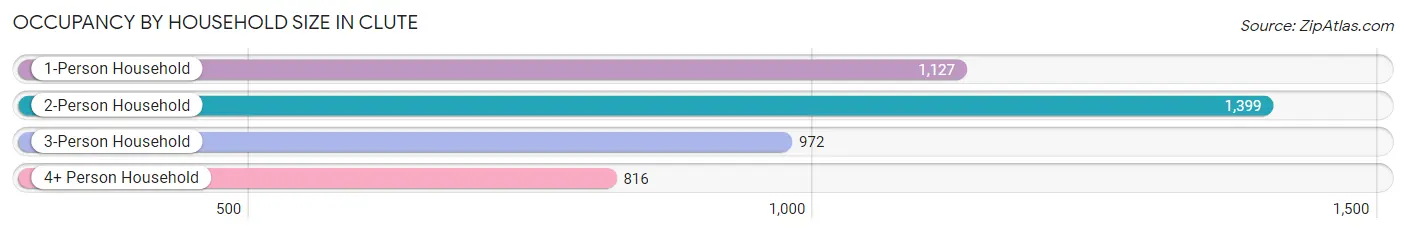
| Household Size | # Housing Units | % Housing Units |
| 1-Person Household | 1,127 | 26.1% |
| 2-Person Household | 1,399 | 32.4% |
| 3-Person Household | 972 | 22.5% |
| 4+ Person Household | 816 | 18.9% |
| Total Housing Units | 4,314 | 100.0% |
Occupancy by Ownership by Household Size in Clute
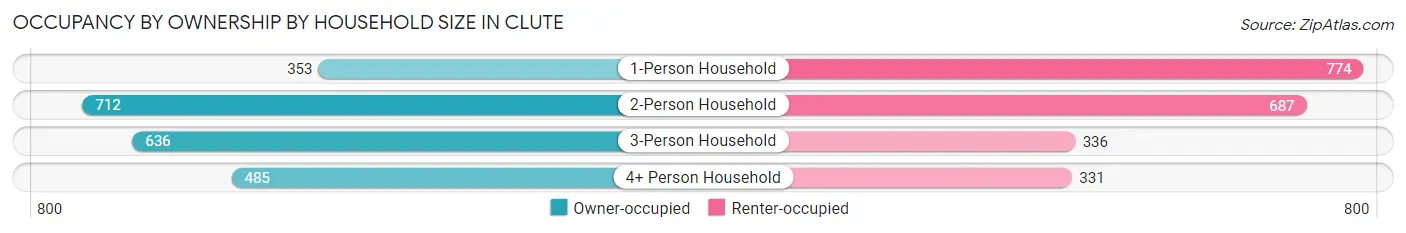
| Household Size | Owner-occupied | Renter-occupied |
| 1-Person Household | 353 (31.3%) | 774 (68.7%) |
| 2-Person Household | 712 (50.9%) | 687 (49.1%) |
| 3-Person Household | 636 (65.4%) | 336 (34.6%) |
| 4+ Person Household | 485 (59.4%) | 331 (40.6%) |
| Total Housing Units | 2,186 (50.7%) | 2,128 (49.3%) |
Occupancy by Educational Attainment in Clute
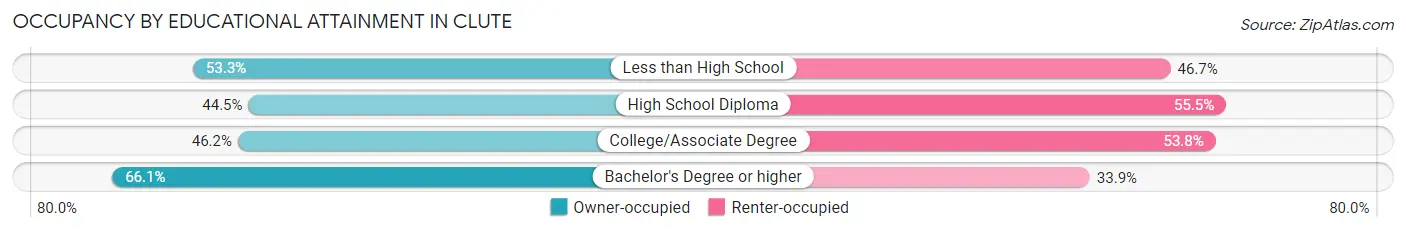
| Household Size | Owner-occupied | Renter-occupied |
| Less than High School | 323 (53.3%) | 283 (46.7%) |
| High School Diploma | 637 (44.5%) | 794 (55.5%) |
| College/Associate Degree | 647 (46.2%) | 754 (53.8%) |
| Bachelor's Degree or higher | 579 (66.1%) | 297 (33.9%) |
Occupancy by Age of Householder in Clute
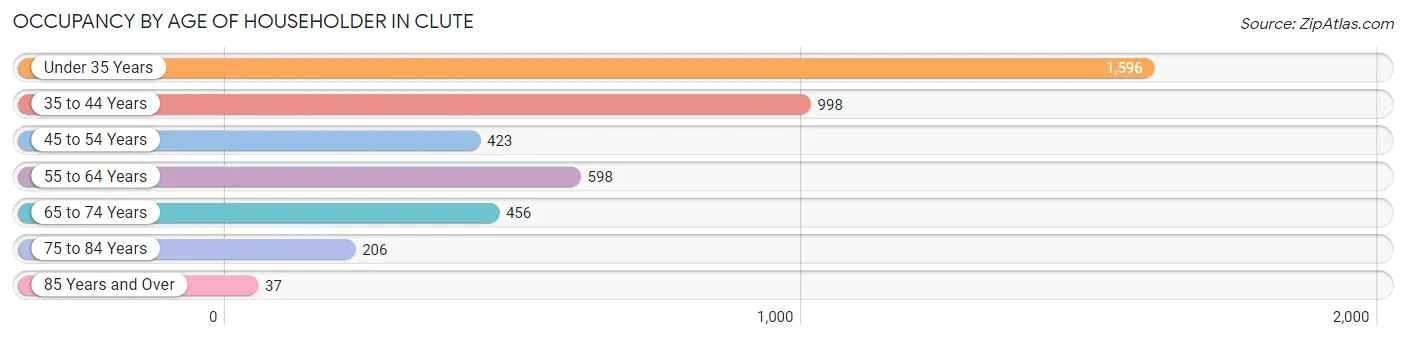
| Age Bracket | # Households | % Households |
| Under 35 Years | 1,596 | 37.0% |
| 35 to 44 Years | 998 | 23.1% |
| 45 to 54 Years | 423 | 9.8% |
| 55 to 64 Years | 598 | 13.9% |
| 65 to 74 Years | 456 | 10.6% |
| 75 to 84 Years | 206 | 4.8% |
| 85 Years and Over | 37 | 0.9% |
| Total | 4,314 | 100.0% |
Housing Finances in Clute
Median Income by Occupancy in Clute
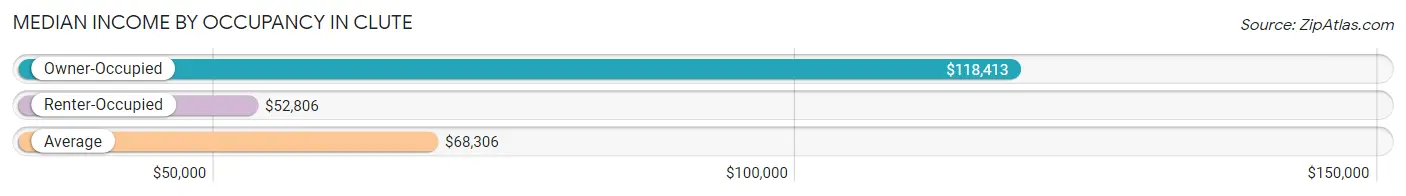
| Occupancy Type | # Households | Median Income |
| Owner-Occupied | 2,186 (50.7%) | $118,413 |
| Renter-Occupied | 2,128 (49.3%) | $52,806 |
| Average | 4,314 (100.0%) | $68,306 |
Occupancy by Householder Income Bracket in Clute
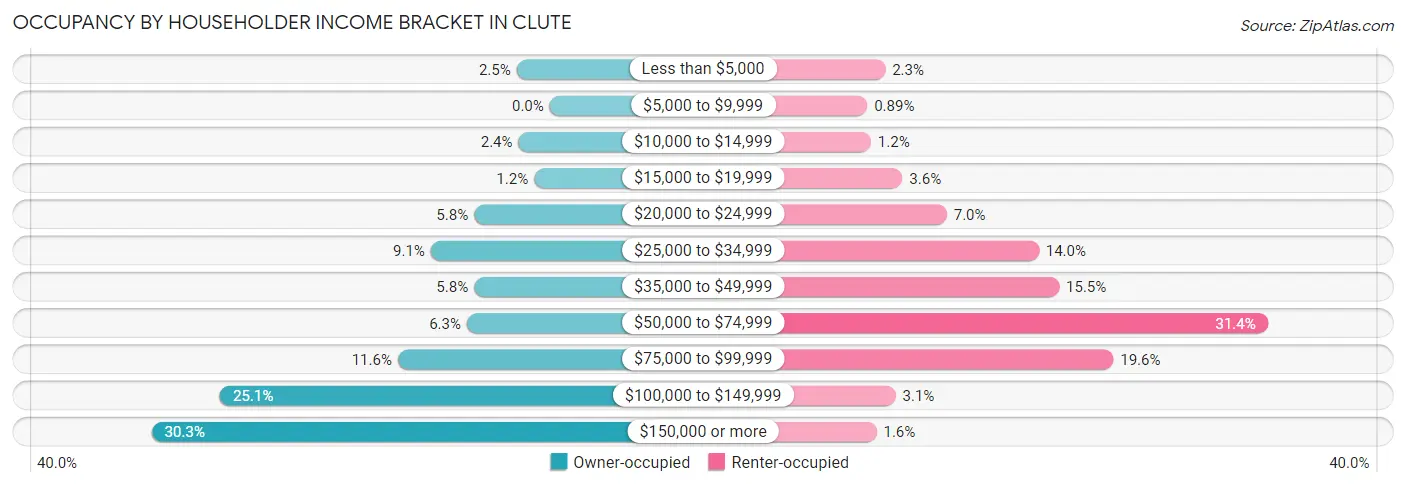
| Income Bracket | Owner-occupied | Renter-occupied |
| Less than $5,000 | 55 (2.5%) | 48 (2.3%) |
| $5,000 to $9,999 | 0 (0.0%) | 19 (0.9%) |
| $10,000 to $14,999 | 52 (2.4%) | 25 (1.2%) |
| $15,000 to $19,999 | 26 (1.2%) | 76 (3.6%) |
| $20,000 to $24,999 | 126 (5.8%) | 148 (7.0%) |
| $25,000 to $34,999 | 198 (9.1%) | 297 (14.0%) |
| $35,000 to $49,999 | 126 (5.8%) | 330 (15.5%) |
| $50,000 to $74,999 | 138 (6.3%) | 668 (31.4%) |
| $75,000 to $99,999 | 253 (11.6%) | 418 (19.6%) |
| $100,000 to $149,999 | 549 (25.1%) | 65 (3.0%) |
| $150,000 or more | 663 (30.3%) | 34 (1.6%) |
| Total | 2,186 (100.0%) | 2,128 (100.0%) |
Monthly Housing Cost Tiers in Clute
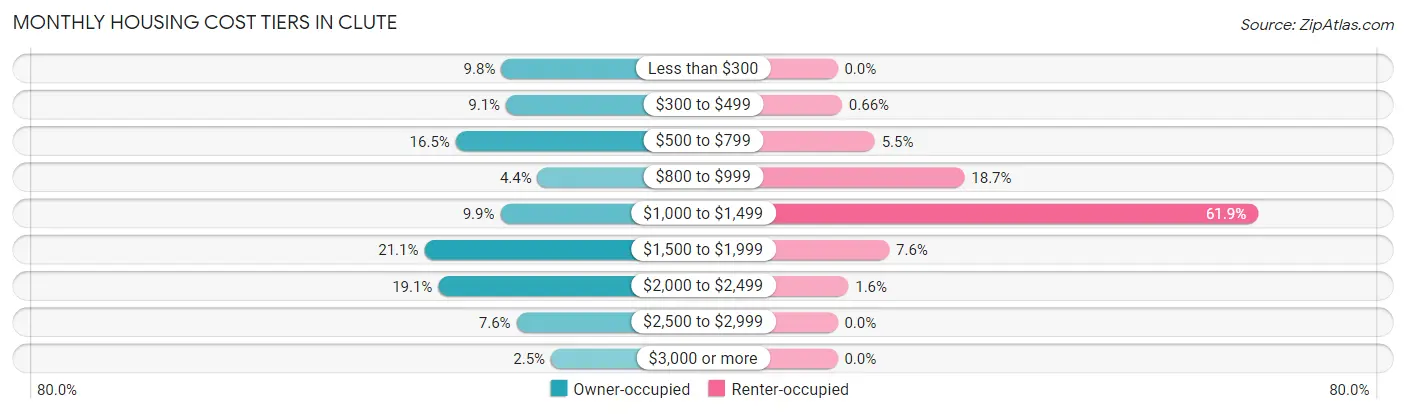
| Monthly Cost | Owner-occupied | Renter-occupied |
| Less than $300 | 214 (9.8%) | 0 (0.0%) |
| $300 to $499 | 199 (9.1%) | 14 (0.7%) |
| $500 to $799 | 361 (16.5%) | 117 (5.5%) |
| $800 to $999 | 97 (4.4%) | 398 (18.7%) |
| $1,000 to $1,499 | 217 (9.9%) | 1,318 (61.9%) |
| $1,500 to $1,999 | 462 (21.1%) | 162 (7.6%) |
| $2,000 to $2,499 | 417 (19.1%) | 34 (1.6%) |
| $2,500 to $2,999 | 165 (7.5%) | 0 (0.0%) |
| $3,000 or more | 54 (2.5%) | 0 (0.0%) |
| Total | 2,186 (100.0%) | 2,128 (100.0%) |
Physical Housing Characteristics in Clute
Housing Structures in Clute
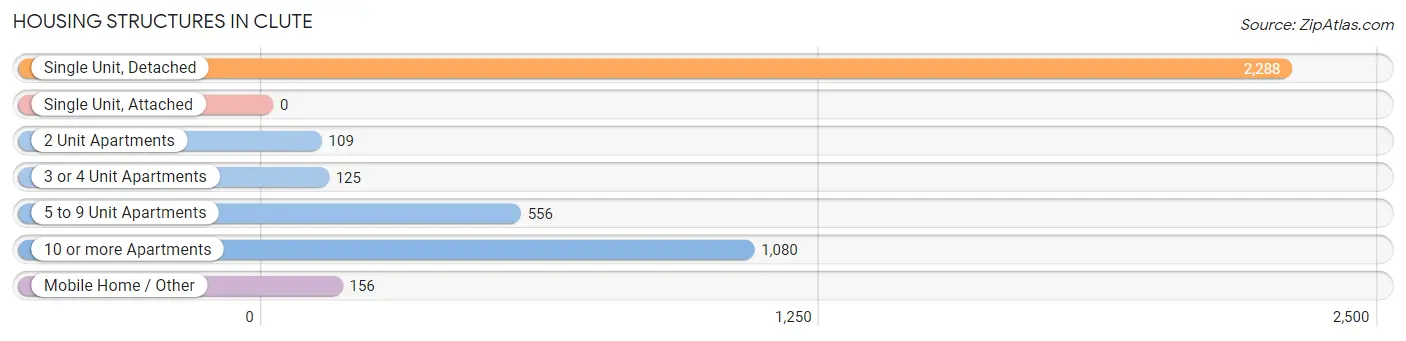
| Structure Type | # Housing Units | % Housing Units |
| Single Unit, Detached | 2,288 | 53.0% |
| Single Unit, Attached | 0 | 0.0% |
| 2 Unit Apartments | 109 | 2.5% |
| 3 or 4 Unit Apartments | 125 | 2.9% |
| 5 to 9 Unit Apartments | 556 | 12.9% |
| 10 or more Apartments | 1,080 | 25.0% |
| Mobile Home / Other | 156 | 3.6% |
| Total | 4,314 | 100.0% |
Housing Structures by Occupancy in Clute
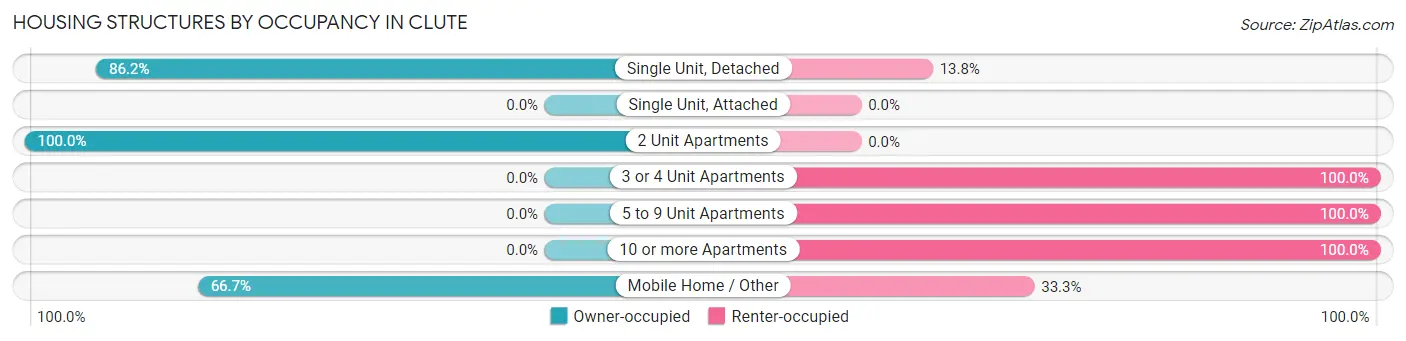
| Structure Type | Owner-occupied | Renter-occupied |
| Single Unit, Detached | 1,973 (86.2%) | 315 (13.8%) |
| Single Unit, Attached | 0 (0.0%) | 0 (0.0%) |
| 2 Unit Apartments | 109 (100.0%) | 0 (0.0%) |
| 3 or 4 Unit Apartments | 0 (0.0%) | 125 (100.0%) |
| 5 to 9 Unit Apartments | 0 (0.0%) | 556 (100.0%) |
| 10 or more Apartments | 0 (0.0%) | 1,080 (100.0%) |
| Mobile Home / Other | 104 (66.7%) | 52 (33.3%) |
| Total | 2,186 (50.7%) | 2,128 (49.3%) |
Housing Structures by Number of Rooms in Clute
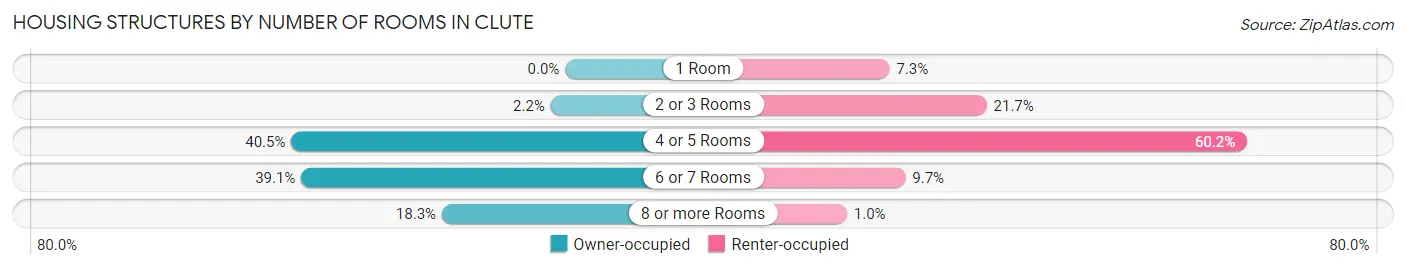
| Number of Rooms | Owner-occupied | Renter-occupied |
| 1 Room | 0 (0.0%) | 156 (7.3%) |
| 2 or 3 Rooms | 47 (2.1%) | 462 (21.7%) |
| 4 or 5 Rooms | 886 (40.5%) | 1,282 (60.2%) |
| 6 or 7 Rooms | 854 (39.1%) | 206 (9.7%) |
| 8 or more Rooms | 399 (18.2%) | 22 (1.0%) |
| Total | 2,186 (100.0%) | 2,128 (100.0%) |
Housing Structure by Heating Type in Clute
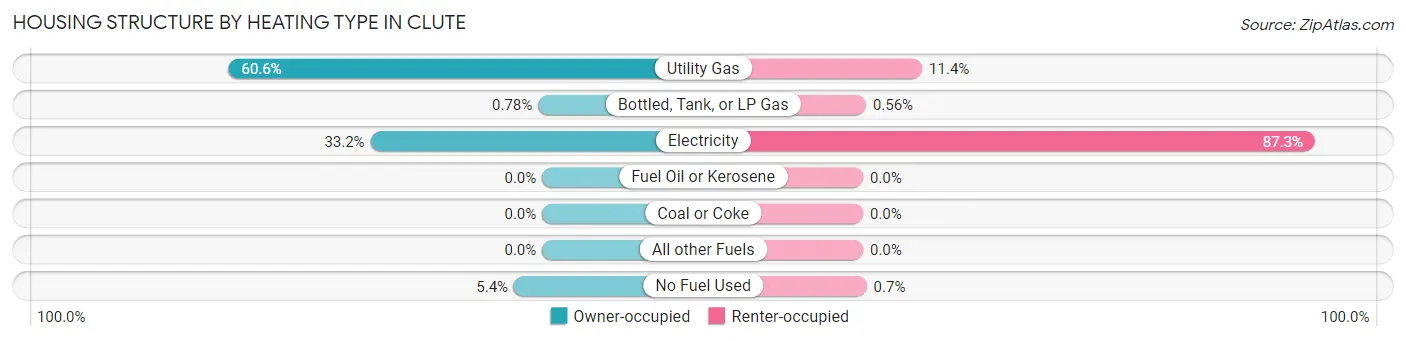
| Heating Type | Owner-occupied | Renter-occupied |
| Utility Gas | 1,325 (60.6%) | 243 (11.4%) |
| Bottled, Tank, or LP Gas | 17 (0.8%) | 12 (0.6%) |
| Electricity | 725 (33.2%) | 1,858 (87.3%) |
| Fuel Oil or Kerosene | 0 (0.0%) | 0 (0.0%) |
| Coal or Coke | 0 (0.0%) | 0 (0.0%) |
| All other Fuels | 0 (0.0%) | 0 (0.0%) |
| No Fuel Used | 119 (5.4%) | 15 (0.7%) |
| Total | 2,186 (100.0%) | 2,128 (100.0%) |
Household Vehicle Usage in Clute
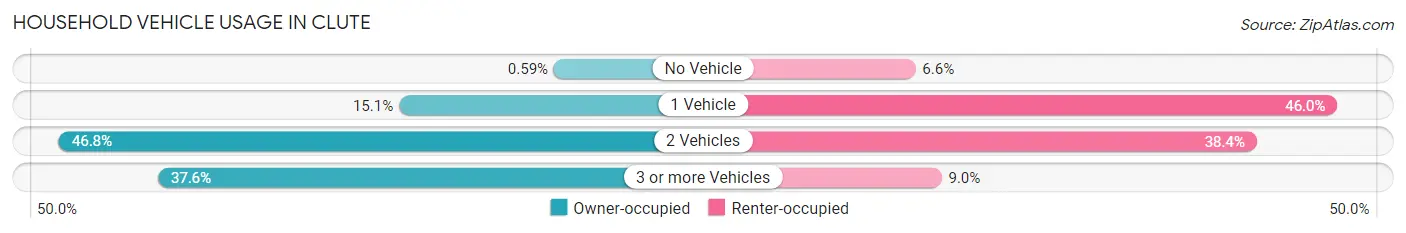
| Vehicles per Household | Owner-occupied | Renter-occupied |
| No Vehicle | 13 (0.6%) | 140 (6.6%) |
| 1 Vehicle | 329 (15.0%) | 978 (46.0%) |
| 2 Vehicles | 1,023 (46.8%) | 818 (38.4%) |
| 3 or more Vehicles | 821 (37.6%) | 192 (9.0%) |
| Total | 2,186 (100.0%) | 2,128 (100.0%) |
Real Estate & Mortgages in Clute
Real Estate and Mortgage Overview in Clute
| Characteristic | Without Mortgage | With Mortgage |
| Housing Units | 931 | 1,255 |
| Median Property Value | $119,900 | $280,000 |
| Median Household Income | $47,287 | $566 |
| Monthly Housing Costs | $527 | $39 |
| Real Estate Taxes | $1,840 | $53 |
Property Value by Mortgage Status in Clute
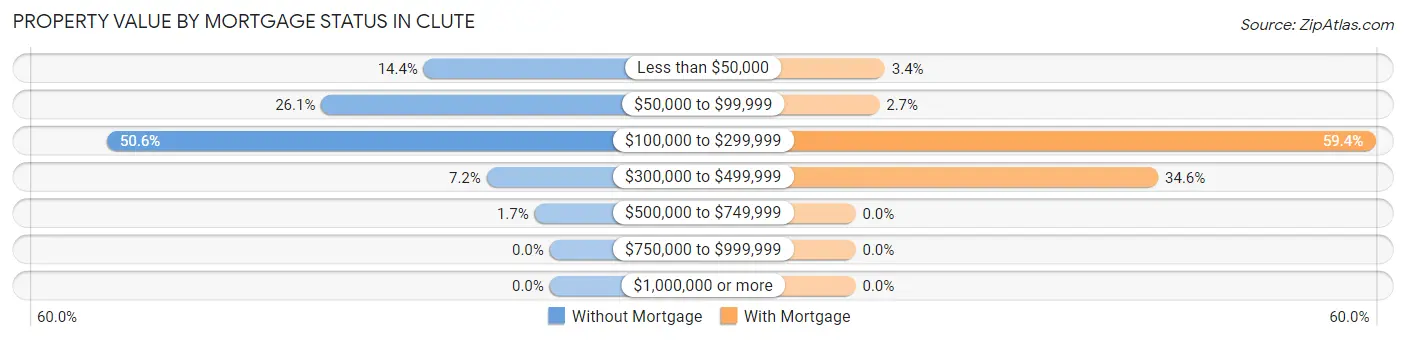
| Property Value | Without Mortgage | With Mortgage |
| Less than $50,000 | 134 (14.4%) | 42 (3.4%) |
| $50,000 to $99,999 | 243 (26.1%) | 34 (2.7%) |
| $100,000 to $299,999 | 471 (50.6%) | 745 (59.4%) |
| $300,000 to $499,999 | 67 (7.2%) | 434 (34.6%) |
| $500,000 to $749,999 | 16 (1.7%) | 0 (0.0%) |
| $750,000 to $999,999 | 0 (0.0%) | 0 (0.0%) |
| $1,000,000 or more | 0 (0.0%) | 0 (0.0%) |
| Total | 931 (100.0%) | 1,255 (100.0%) |
Household Income by Mortgage Status in Clute
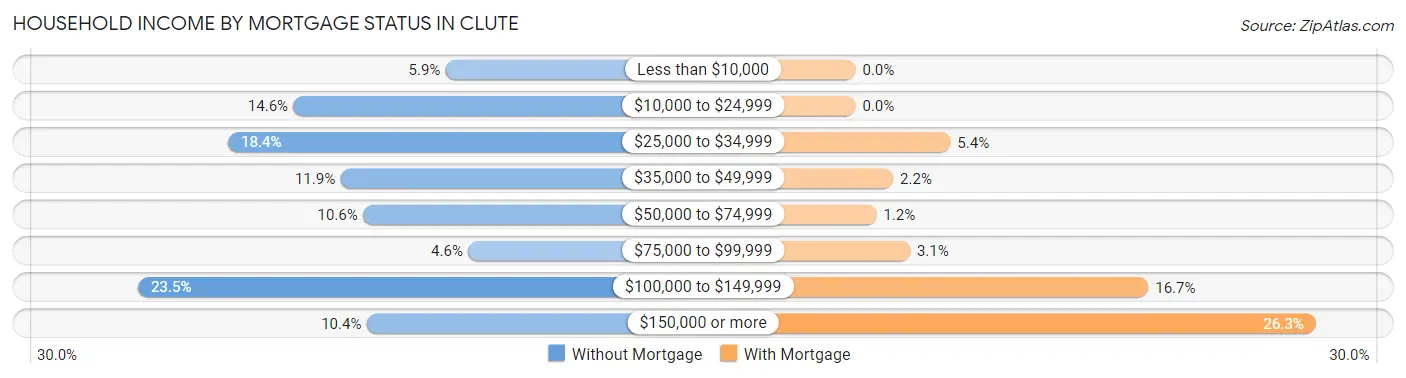
| Household Income | Without Mortgage | With Mortgage |
| Less than $10,000 | 55 (5.9%) | 0 (0.0%) |
| $10,000 to $24,999 | 136 (14.6%) | 0 (0.0%) |
| $25,000 to $34,999 | 171 (18.4%) | 68 (5.4%) |
| $35,000 to $49,999 | 111 (11.9%) | 27 (2.1%) |
| $50,000 to $74,999 | 99 (10.6%) | 15 (1.2%) |
| $75,000 to $99,999 | 43 (4.6%) | 39 (3.1%) |
| $100,000 to $149,999 | 219 (23.5%) | 210 (16.7%) |
| $150,000 or more | 97 (10.4%) | 330 (26.3%) |
| Total | 931 (100.0%) | 1,255 (100.0%) |
Property Value to Household Income Ratio in Clute
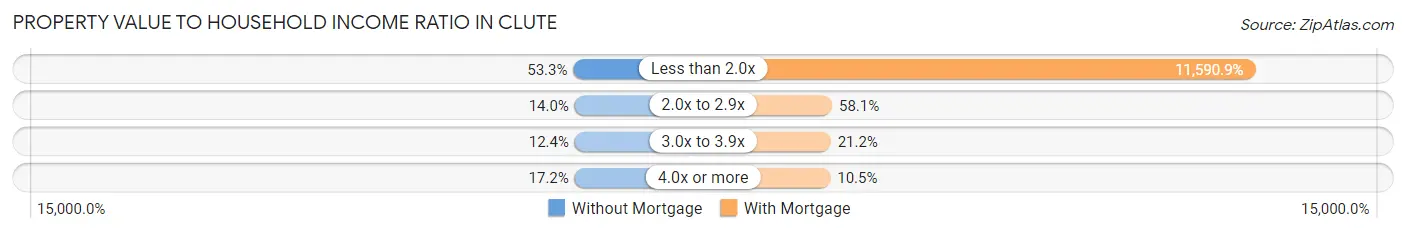
| Value-to-Income Ratio | Without Mortgage | With Mortgage |
| Less than 2.0x | 496 (53.3%) | 145,466 (11,590.9%) |
| 2.0x to 2.9x | 130 (14.0%) | 729 (58.1%) |
| 3.0x to 3.9x | 115 (12.3%) | 266 (21.2%) |
| 4.0x or more | 160 (17.2%) | 132 (10.5%) |
| Total | 931 (100.0%) | 1,255 (100.0%) |
Real Estate Taxes by Mortgage Status in Clute
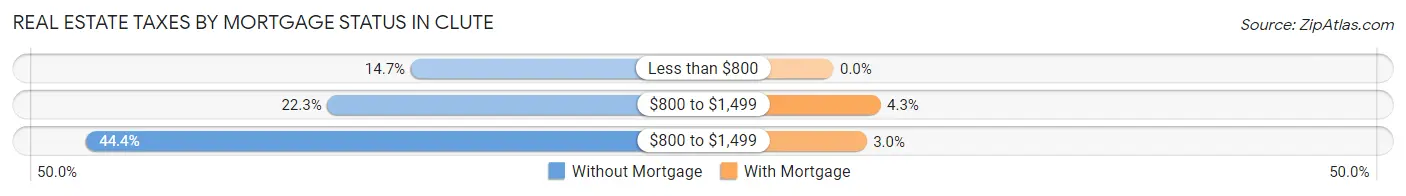
| Property Taxes | Without Mortgage | With Mortgage |
| Less than $800 | 137 (14.7%) | 0 (0.0%) |
| $800 to $1,499 | 208 (22.3%) | 54 (4.3%) |
| $800 to $1,499 | 413 (44.4%) | 38 (3.0%) |
| Total | 931 (100.0%) | 1,255 (100.0%) |
Health & Disability in Clute
Health Insurance Coverage by Age in Clute
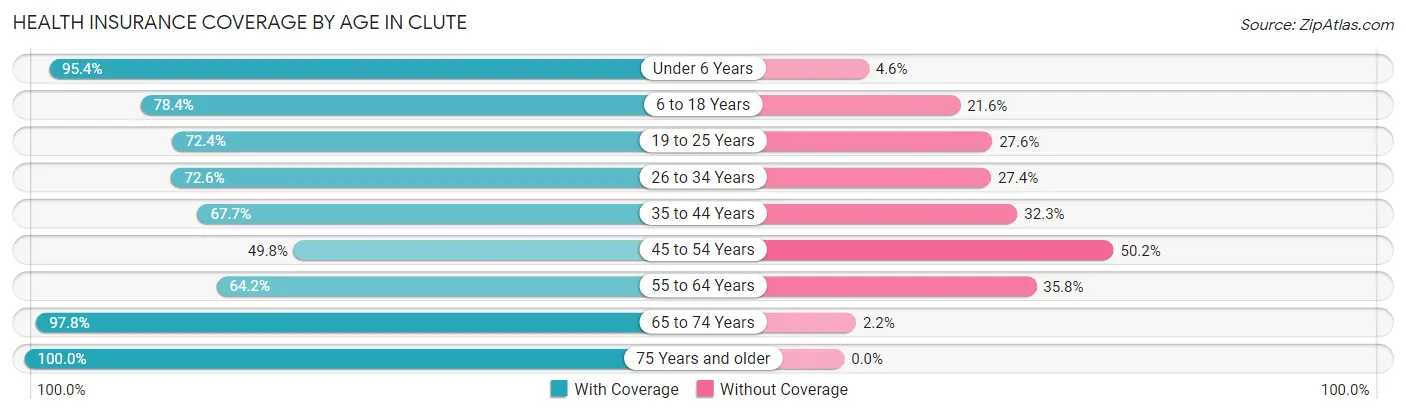
| Age Bracket | With Coverage | Without Coverage |
| Under 6 Years | 710 (95.4%) | 34 (4.6%) |
| 6 to 18 Years | 1,335 (78.4%) | 368 (21.6%) |
| 19 to 25 Years | 1,145 (72.4%) | 436 (27.6%) |
| 26 to 34 Years | 1,436 (72.6%) | 541 (27.4%) |
| 35 to 44 Years | 1,110 (67.7%) | 529 (32.3%) |
| 45 to 54 Years | 363 (49.8%) | 366 (50.2%) |
| 55 to 64 Years | 683 (64.2%) | 381 (35.8%) |
| 65 to 74 Years | 672 (97.8%) | 15 (2.2%) |
| 75 Years and older | 402 (100.0%) | 0 (0.0%) |
| Total | 7,856 (74.6%) | 2,670 (25.4%) |
Health Insurance Coverage by Citizenship Status in Clute
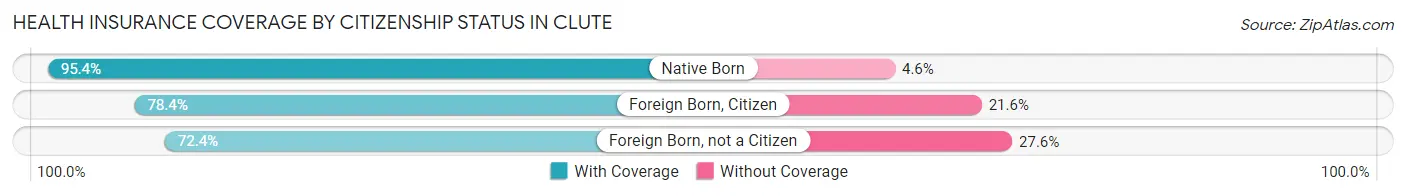
| Citizenship Status | With Coverage | Without Coverage |
| Native Born | 710 (95.4%) | 34 (4.6%) |
| Foreign Born, Citizen | 1,335 (78.4%) | 368 (21.6%) |
| Foreign Born, not a Citizen | 1,145 (72.4%) | 436 (27.6%) |
Health Insurance Coverage by Household Income in Clute
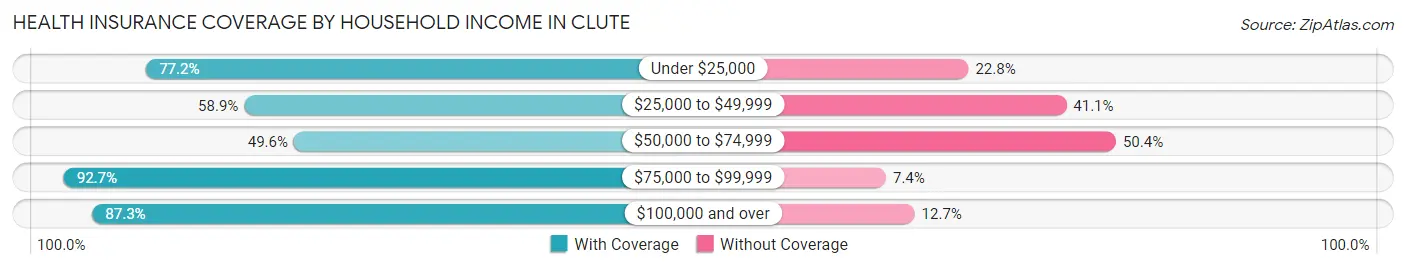
| Household Income | With Coverage | Without Coverage |
| Under $25,000 | 799 (77.2%) | 236 (22.8%) |
| $25,000 to $49,999 | 1,357 (58.9%) | 948 (41.1%) |
| $50,000 to $74,999 | 866 (49.6%) | 881 (50.4%) |
| $75,000 to $99,999 | 1,488 (92.6%) | 118 (7.3%) |
| $100,000 and over | 3,345 (87.3%) | 487 (12.7%) |
Public vs Private Health Insurance Coverage by Age in Clute
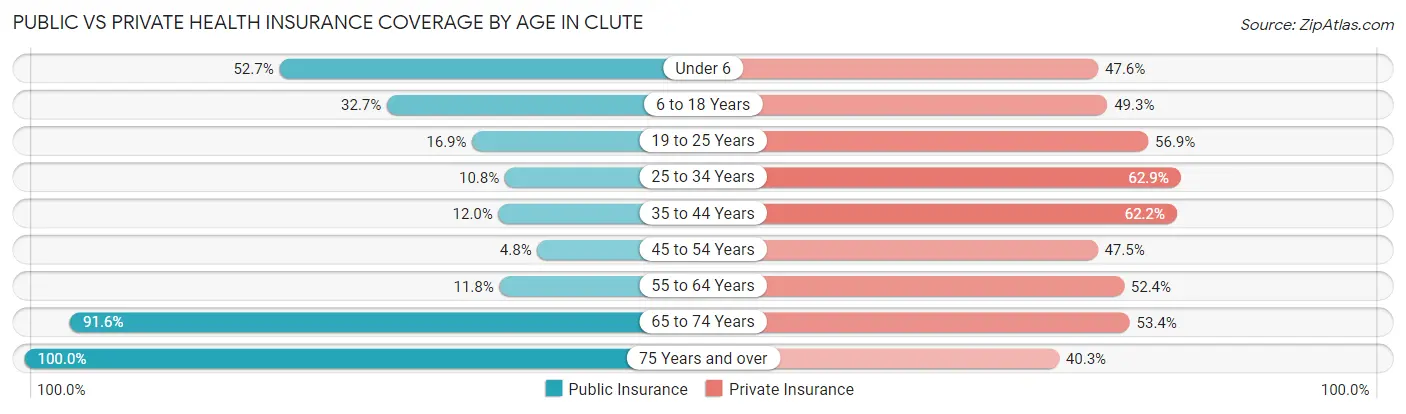
| Age Bracket | Public Insurance | Private Insurance |
| Under 6 | 392 (52.7%) | 354 (47.6%) |
| 6 to 18 Years | 557 (32.7%) | 839 (49.3%) |
| 19 to 25 Years | 267 (16.9%) | 899 (56.9%) |
| 25 to 34 Years | 214 (10.8%) | 1,243 (62.9%) |
| 35 to 44 Years | 197 (12.0%) | 1,019 (62.2%) |
| 45 to 54 Years | 35 (4.8%) | 346 (47.5%) |
| 55 to 64 Years | 126 (11.8%) | 557 (52.3%) |
| 65 to 74 Years | 629 (91.6%) | 367 (53.4%) |
| 75 Years and over | 402 (100.0%) | 162 (40.3%) |
| Total | 2,819 (26.8%) | 5,786 (55.0%) |
Disability Status by Sex by Age in Clute
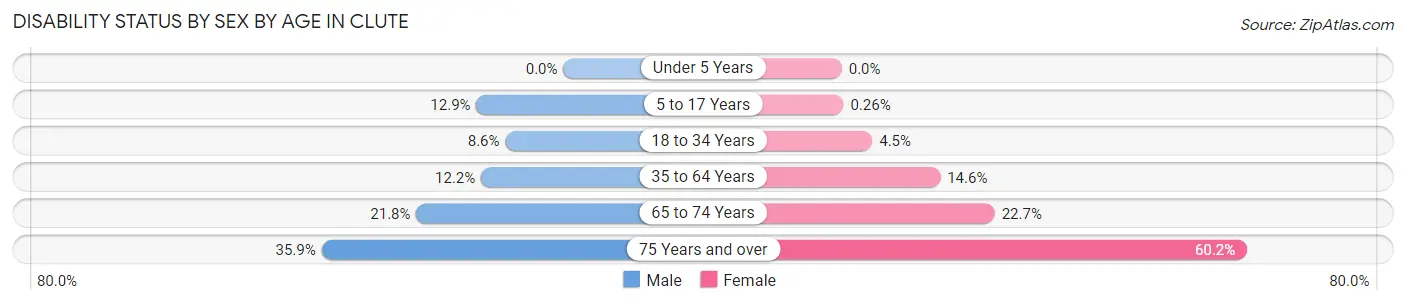
| Age Bracket | Male | Female |
| Under 5 Years | 0 (0.0%) | 0 (0.0%) |
| 5 to 17 Years | 109 (12.9%) | 2 (0.3%) |
| 18 to 34 Years | 171 (8.6%) | 78 (4.5%) |
| 35 to 64 Years | 207 (12.2%) | 254 (14.6%) |
| 65 to 74 Years | 50 (21.8%) | 104 (22.7%) |
| 75 Years and over | 65 (35.9%) | 133 (60.2%) |
Disability Class by Sex by Age in Clute
Disability Class: Hearing Difficulty
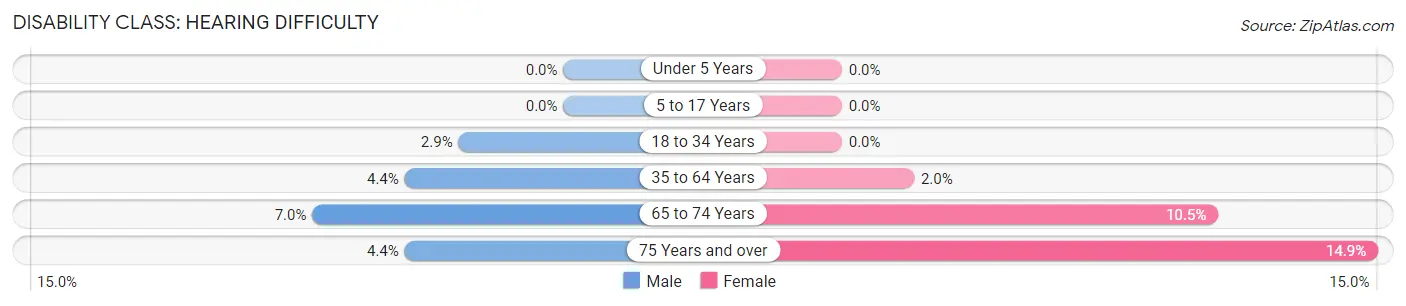
| Age Bracket | Male | Female |
| Under 5 Years | 0 (0.0%) | 0 (0.0%) |
| 5 to 17 Years | 0 (0.0%) | 0 (0.0%) |
| 18 to 34 Years | 58 (2.9%) | 0 (0.0%) |
| 35 to 64 Years | 75 (4.4%) | 35 (2.0%) |
| 65 to 74 Years | 16 (7.0%) | 48 (10.5%) |
| 75 Years and over | 8 (4.4%) | 33 (14.9%) |
Disability Class: Vision Difficulty
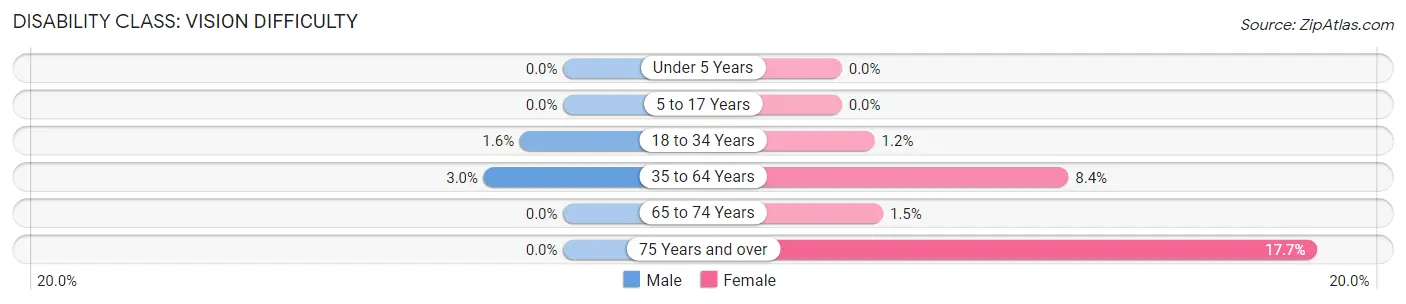
| Age Bracket | Male | Female |
| Under 5 Years | 0 (0.0%) | 0 (0.0%) |
| 5 to 17 Years | 0 (0.0%) | 0 (0.0%) |
| 18 to 34 Years | 32 (1.6%) | 21 (1.2%) |
| 35 to 64 Years | 50 (2.9%) | 146 (8.4%) |
| 65 to 74 Years | 0 (0.0%) | 7 (1.5%) |
| 75 Years and over | 0 (0.0%) | 39 (17.6%) |
Disability Class: Cognitive Difficulty
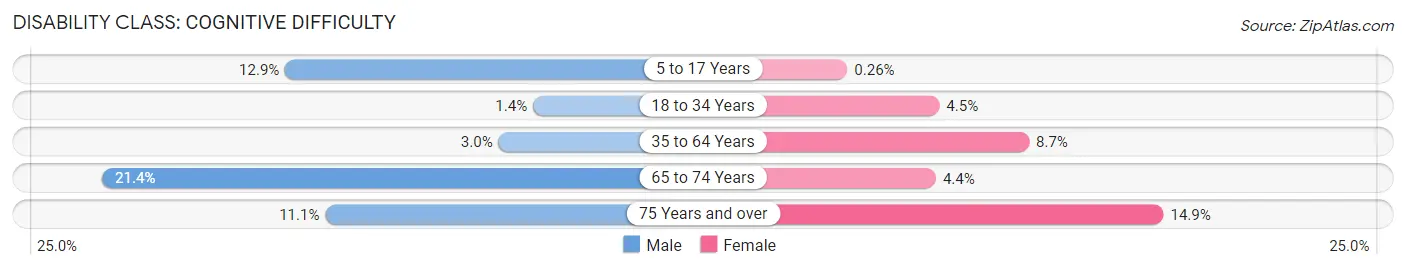
| Age Bracket | Male | Female |
| 5 to 17 Years | 109 (12.9%) | 2 (0.3%) |
| 18 to 34 Years | 28 (1.4%) | 78 (4.5%) |
| 35 to 64 Years | 51 (3.0%) | 151 (8.7%) |
| 65 to 74 Years | 49 (21.4%) | 20 (4.4%) |
| 75 Years and over | 20 (11.1%) | 33 (14.9%) |
Disability Class: Ambulatory Difficulty
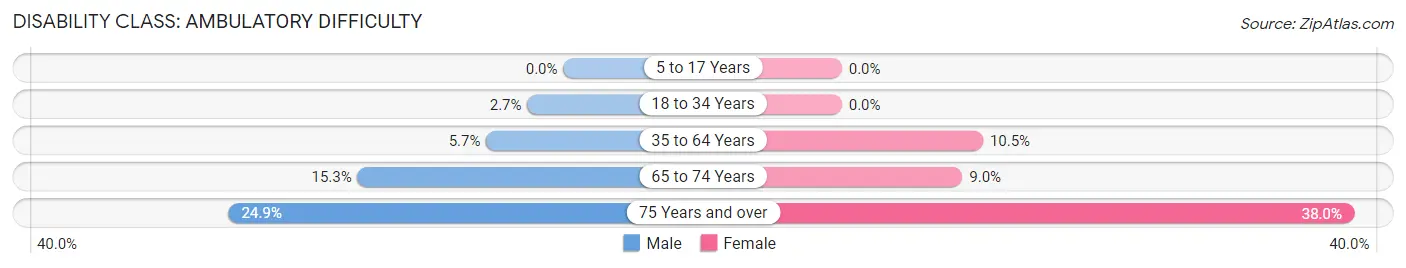
| Age Bracket | Male | Female |
| 5 to 17 Years | 0 (0.0%) | 0 (0.0%) |
| 18 to 34 Years | 53 (2.7%) | 0 (0.0%) |
| 35 to 64 Years | 97 (5.7%) | 182 (10.5%) |
| 65 to 74 Years | 35 (15.3%) | 41 (8.9%) |
| 75 Years and over | 45 (24.9%) | 84 (38.0%) |
Disability Class: Self-Care Difficulty
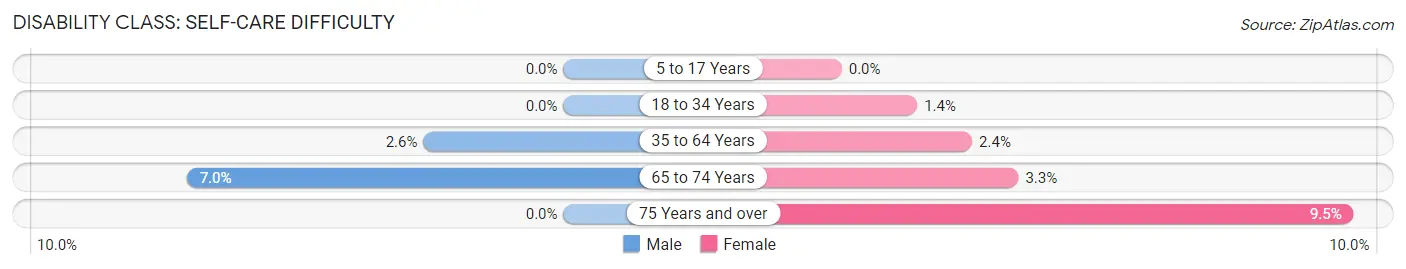
| Age Bracket | Male | Female |
| 5 to 17 Years | 0 (0.0%) | 0 (0.0%) |
| 18 to 34 Years | 0 (0.0%) | 24 (1.4%) |
| 35 to 64 Years | 44 (2.6%) | 42 (2.4%) |
| 65 to 74 Years | 16 (7.0%) | 15 (3.3%) |
| 75 Years and over | 0 (0.0%) | 21 (9.5%) |
Technology Access in Clute
Computing Device Access in Clute
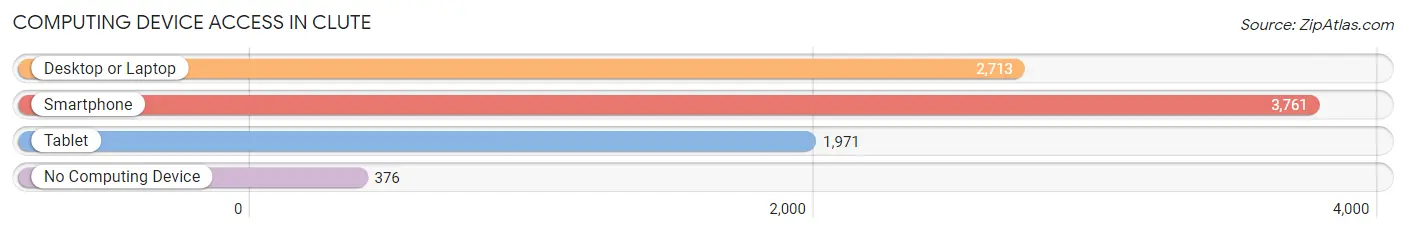
| Device Type | # Households | % Households |
| Desktop or Laptop | 2,713 | 62.9% |
| Smartphone | 3,761 | 87.2% |
| Tablet | 1,971 | 45.7% |
| No Computing Device | 376 | 8.7% |
| Total | 4,314 | 100.0% |
Internet Access in Clute
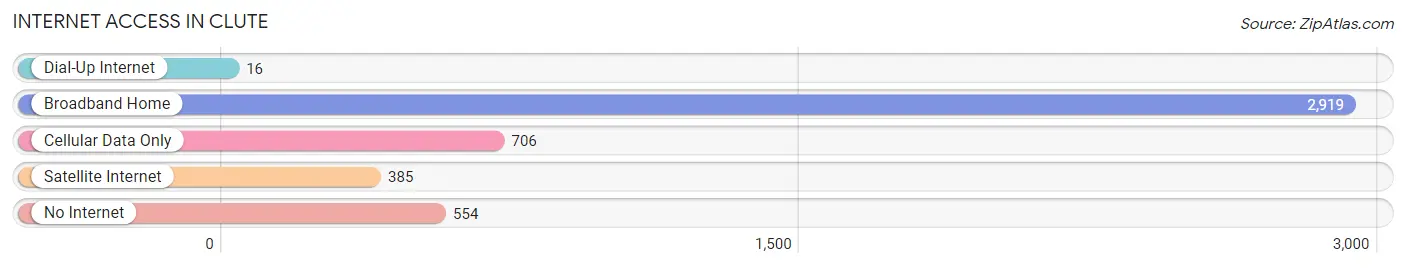
| Internet Type | # Households | % Households |
| Dial-Up Internet | 16 | 0.4% |
| Broadband Home | 2,919 | 67.7% |
| Cellular Data Only | 706 | 16.4% |
| Satellite Internet | 385 | 8.9% |
| No Internet | 554 | 12.8% |
| Total | 4,314 | 100.0% |
Clute Summary
Clute, Texas is a small city located in Brazoria County, Texas, United States. It is situated on the Gulf Coast, approximately 50 miles south of Houston. The city has a population of 11,211 as of the 2010 census.
History
Clute was founded in 1891 by William Clute, a German immigrant who had moved to the area from New York. He purchased land from the local Karankawa Indians and began to develop the area. Clute named the town after himself and began to build a small community.
In the early 1900s, Clute began to grow rapidly as the railroad was extended to the area. This allowed for the transportation of goods and services to and from the city. The railroad also brought in new settlers and businesses, which helped to further develop the city.
In the 1920s, Clute experienced a period of growth and prosperity. The city was home to several businesses, including a cotton gin, a lumber mill, and a brick factory. The city also had a number of churches, schools, and other amenities.
In the 1950s, Clute began to experience a decline in population and businesses. This was due to the decline of the railroad industry and the rise of the automobile industry. The city was also affected by the Great Depression and World War II.
In the 1970s, Clute began to experience a resurgence in population and businesses. This was due to the growth of the oil and gas industry in the area. The city also experienced a period of growth due to the influx of new residents from other parts of the country.
Geography
Clute is located in Brazoria County, Texas, United States. It is situated on the Gulf Coast, approximately 50 miles south of Houston. The city has a total area of 4.3 square miles, all of which is land.
The city is located on the Gulf Coast, which provides a humid subtropical climate. The average temperature in the summer is around 90 degrees Fahrenheit, while the average temperature in the winter is around 60 degrees Fahrenheit.
Economy
The economy of Clute is largely based on the oil and gas industry. The city is home to several oil and gas companies, including Chevron, Shell, and ExxonMobil. The city also has a number of other businesses, including manufacturing, retail, and healthcare.
The city is also home to a number of educational institutions, including Brazosport College and the University of Houston-Clear Lake.
Demographics
As of the 2010 census, the population of Clute was 11,211. The racial makeup of the city was 75.3% White, 11.2% African American, 0.7% Native American, 0.7% Asian, 0.1% Pacific Islander, 9.7% from other races, and 2.2% from two or more races. Hispanic or Latino of any race were 22.3% of the population.
The median income for a household in Clute was $41,945, and the median income for a family was $50,945. The per capita income for the city was $20,945. About 15.3% of families and 18.2% of the population were below the poverty line, including 25.3% of those under age 18 and 11.2% of those age 65 or over.
Conclusion
Clute, Texas is a small city located in Brazoria County, Texas, United States. It is situated on the Gulf Coast, approximately 50 miles south of Houston. The city has a population of 11,211 as of the 2010 census. The economy of Clute is largely based on the oil and gas industry, and the city is home to several educational institutions. The racial makeup of the city is 75.3% White, 11.2% African American, 0.7% Native American, 0.7% Asian, 0.1% Pacific Islander, 9.7% from other races, and 2.2% from two or more races. The median income for a household in Clute was $41,945, and the median income for a family was $50,945.
Common Questions
What is Per Capita Income in Clute?
Per Capita income in Clute is $35,554.
What is the Median Family Income in Clute?
Median Family Income in Clute is $69,896.
What is the Median Household income in Clute?
Median Household Income in Clute is $68,306.
What is Income or Wage Gap in Clute?
Income or Wage Gap in Clute is 50.4%.
Women in Clute earn 49.6 cents for every dollar earned by a man.
What is Inequality or Gini Index in Clute?
Inequality or Gini Index in Clute is 0.43.
What is the Total Population of Clute?
Total Population of Clute is 10,670.
What is the Total Male Population of Clute?
Total Male Population of Clute is 5,448.
What is the Total Female Population of Clute?
Total Female Population of Clute is 5,222.
What is the Ratio of Males per 100 Females in Clute?
There are 104.33 Males per 100 Females in Clute.
What is the Ratio of Females per 100 Males in Clute?
There are 95.85 Females per 100 Males in Clute.
What is the Median Population Age in Clute?
Median Population Age in Clute is 30.2 Years.
What is the Average Family Size in Clute
Average Family Size in Clute is 3.1 People.
What is the Average Household Size in Clute
Average Household Size in Clute is 2.4 People.
How Large is the Labor Force in Clute?
There are 5,982 People in the Labor Forcein in Clute.
What is the Percentage of People in the Labor Force in Clute?
70.1% of People are in the Labor Force in Clute.
What is the Unemployment Rate in Clute?
Unemployment Rate in Clute is 8.6%.