Clifton, TX Map & Demographics
Clifton Map
Clifton Overview
$27,885
PER CAPITA INCOME
$66,760
AVG FAMILY INCOME
$56,500
AVG HOUSEHOLD INCOME
20.3%
WAGE / INCOME GAP [ % ]
79.7¢/ $1
WAGE / INCOME GAP [ $ ]
0.42
INEQUALITY / GINI INDEX
3,487
TOTAL POPULATION
1,664
MALE POPULATION
1,823
FEMALE POPULATION
91.28
MALES / 100 FEMALES
109.56
FEMALES / 100 MALES
48.9
MEDIAN AGE
3.0
AVG FAMILY SIZE
2.4
AVG HOUSEHOLD SIZE
1,583
LABOR FORCE [ PEOPLE ]
55.2%
PERCENT IN LABOR FORCE
5.2%
UNEMPLOYMENT RATE
Clifton Zip Codes
Clifton Area Codes
Income in Clifton
Income Overview in Clifton
Per Capita Income in Clifton is $27,885, while median incomes of families and households are $66,760 and $56,500 respectively.
| Characteristic | Number | Measure |
| Per Capita Income | 3,487 | $27,885 |
| Median Family Income | 877 | $66,760 |
| Mean Family Income | 877 | $80,152 |
| Median Household Income | 1,346 | $56,500 |
| Mean Household Income | 1,346 | $68,738 |
| Income Deficit | 877 | $0 |
| Wage / Income Gap (%) | 3,487 | 20.27% |
| Wage / Income Gap ($) | 3,487 | 79.73¢ per $1 |
| Gini / Inequality Index | 3,487 | 0.42 |
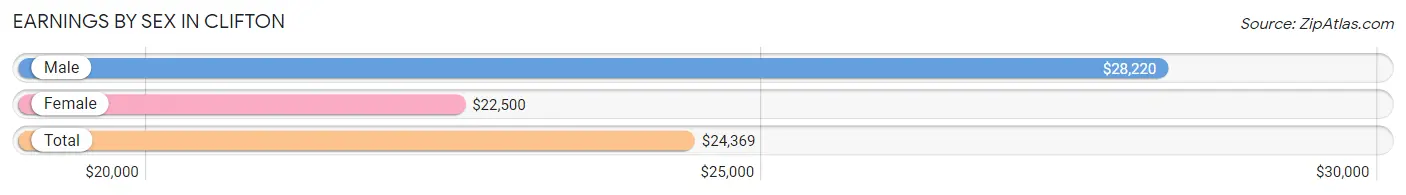
Earnings by Sex in Clifton
Average Earnings in Clifton are $24,369, $28,220 for men and $22,500 for women, a difference of 20.3%.
| Sex | Number | Average Earnings |
| Male | 843 (49.7%) | $28,220 |
| Female | 852 (50.3%) | $22,500 |
| Total | 1,695 (100.0%) | $24,369 |
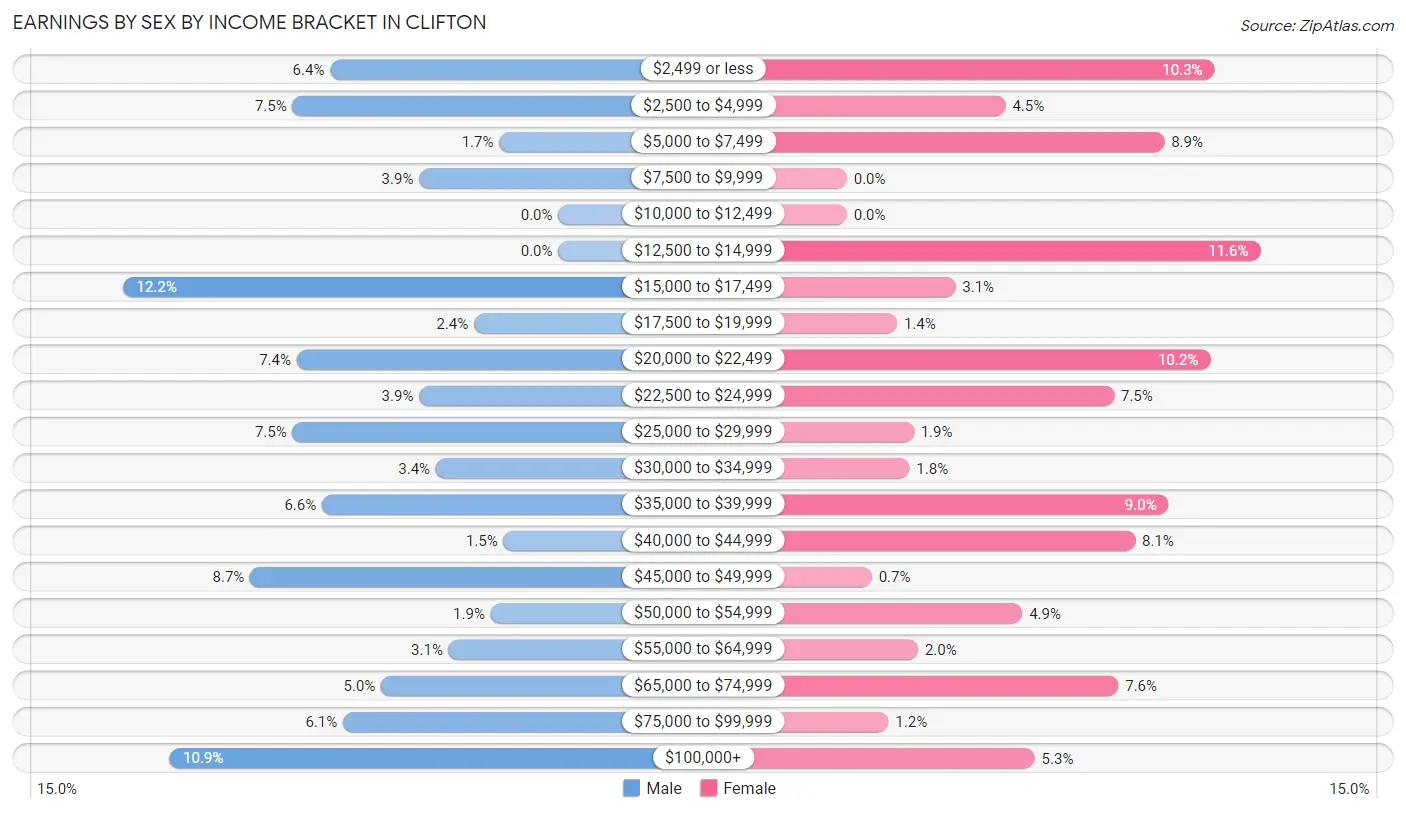
Earnings by Sex by Income Bracket in Clifton
The most common earnings brackets in Clifton are $15,000 to $17,499 for men (103 | 12.2%) and $12,500 to $14,999 for women (99 | 11.6%).
| Income | Male | Female |
| $2,499 or less | 54 (6.4%) | 88 (10.3%) |
| $2,500 to $4,999 | 63 (7.5%) | 38 (4.5%) |
| $5,000 to $7,499 | 14 (1.7%) | 76 (8.9%) |
| $7,500 to $9,999 | 33 (3.9%) | 0 (0.0%) |
| $10,000 to $12,499 | 0 (0.0%) | 0 (0.0%) |
| $12,500 to $14,999 | 0 (0.0%) | 99 (11.6%) |
| $15,000 to $17,499 | 103 (12.2%) | 26 (3.0%) |
| $17,500 to $19,999 | 20 (2.4%) | 12 (1.4%) |
| $20,000 to $22,499 | 62 (7.3%) | 87 (10.2%) |
| $22,500 to $24,999 | 33 (3.9%) | 64 (7.5%) |
| $25,000 to $29,999 | 63 (7.5%) | 16 (1.9%) |
| $30,000 to $34,999 | 29 (3.4%) | 15 (1.8%) |
| $35,000 to $39,999 | 56 (6.6%) | 77 (9.0%) |
| $40,000 to $44,999 | 13 (1.5%) | 69 (8.1%) |
| $45,000 to $49,999 | 73 (8.7%) | 6 (0.7%) |
| $50,000 to $54,999 | 16 (1.9%) | 42 (4.9%) |
| $55,000 to $64,999 | 26 (3.1%) | 17 (2.0%) |
| $65,000 to $74,999 | 42 (5.0%) | 65 (7.6%) |
| $75,000 to $99,999 | 51 (6.0%) | 10 (1.2%) |
| $100,000+ | 92 (10.9%) | 45 (5.3%) |
| Total | 843 (100.0%) | 852 (100.0%) |
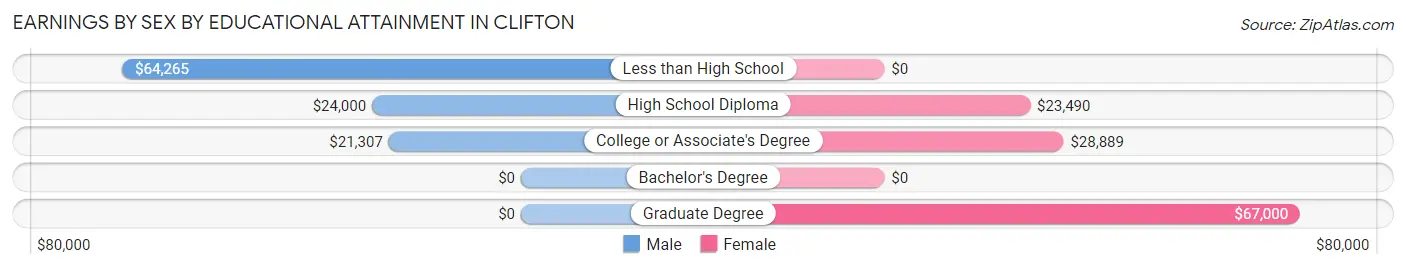
Earnings by Sex by Educational Attainment in Clifton
Average earnings in Clifton are $34,741 for men and $24,141 for women, a difference of 30.5%. Men with an educational attainment of less than high school enjoy the highest average annual earnings of $64,265, while those with college or associate's degree education earn the least with $21,307. Women with an educational attainment of graduate degree earn the most with the average annual earnings of $67,000, while those with high school diploma education have the smallest earnings of $23,490.
| Educational Attainment | Male Income | Female Income |
| Less than High School | $64,265 | $0 |
| High School Diploma | $24,000 | $23,490 |
| College or Associate's Degree | $21,307 | $28,889 |
| Bachelor's Degree | - | - |
| Graduate Degree | - | - |
| Total | $34,741 | $24,141 |
Family Income in Clifton
Family Income Brackets in Clifton
According to the Clifton family income data, there are 197 families falling into the $50,000 to $74,999 income range, which is the most common income bracket and makes up 22.5% of all families.
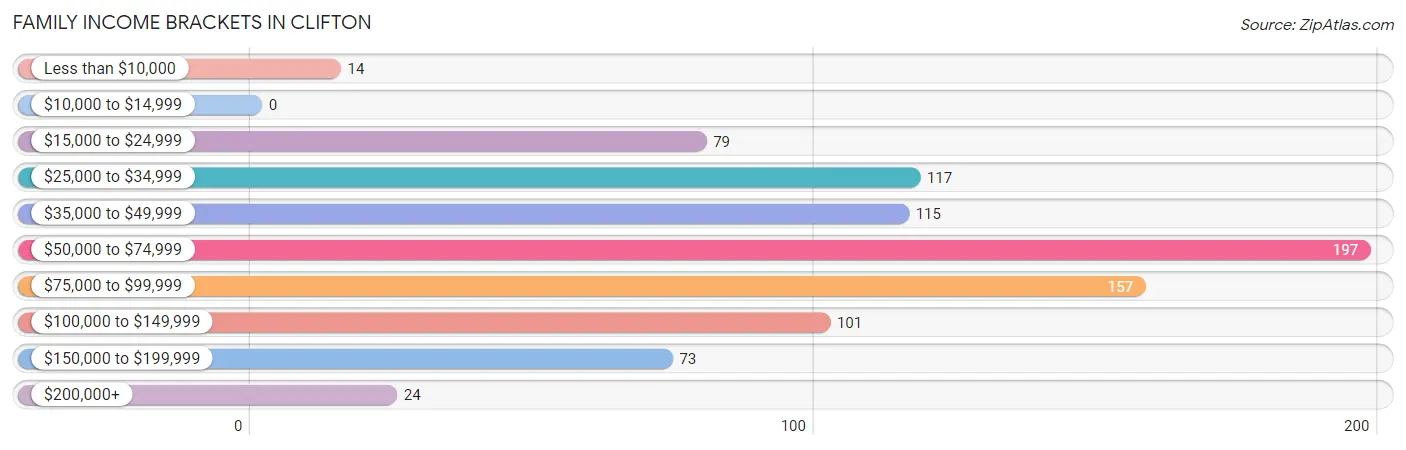
| Income Bracket | # Families | % Families |
| Less than $10,000 | 14 | 1.6% |
| $10,000 to $14,999 | 0 | 0.0% |
| $15,000 to $24,999 | 79 | 9.0% |
| $25,000 to $34,999 | 117 | 13.3% |
| $35,000 to $49,999 | 115 | 13.1% |
| $50,000 to $74,999 | 197 | 22.5% |
| $75,000 to $99,999 | 157 | 17.9% |
| $100,000 to $149,999 | 101 | 11.5% |
| $150,000 to $199,999 | 73 | 8.3% |
| $200,000+ | 24 | 2.7% |
Family Income by Famaliy Size in Clifton
3-person families (137 | 15.6%) account for the highest median family income in Clifton with $96,319 per family, while 2-person families (426 | 48.6%) have the highest median income of $42,728 per family member.
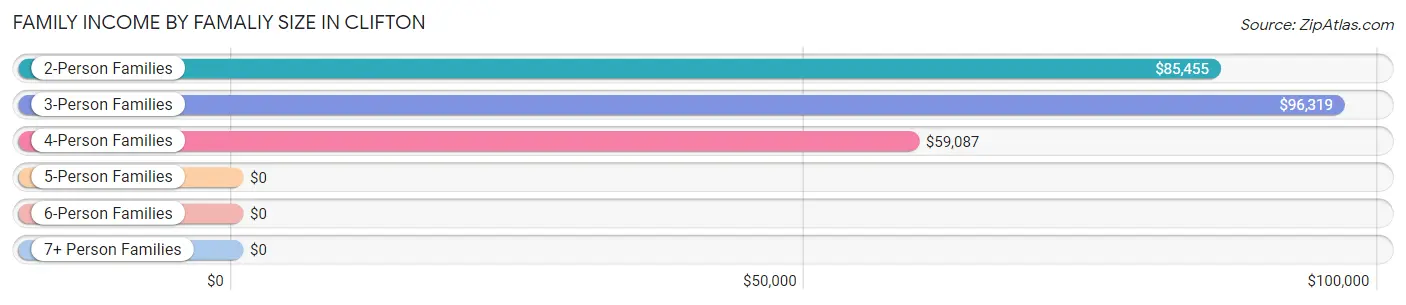
| Income Bracket | # Families | Median Income |
| 2-Person Families | 426 (48.6%) | $85,455 |
| 3-Person Families | 137 (15.6%) | $96,319 |
| 4-Person Families | 215 (24.5%) | $59,087 |
| 5-Person Families | 88 (10.0%) | $0 |
| 6-Person Families | 0 (0.0%) | $0 |
| 7+ Person Families | 11 (1.3%) | $0 |
| Total | 877 (100.0%) | $66,760 |
Family Income by Number of Earners in Clifton
The median family income in Clifton is $66,760, with families comprising 2 earners (434) having the highest median family income of $72,446, while families with 1 earner (143) have the lowest median family income of $47,375, accounting for 49.5% and 16.3% of families, respectively.
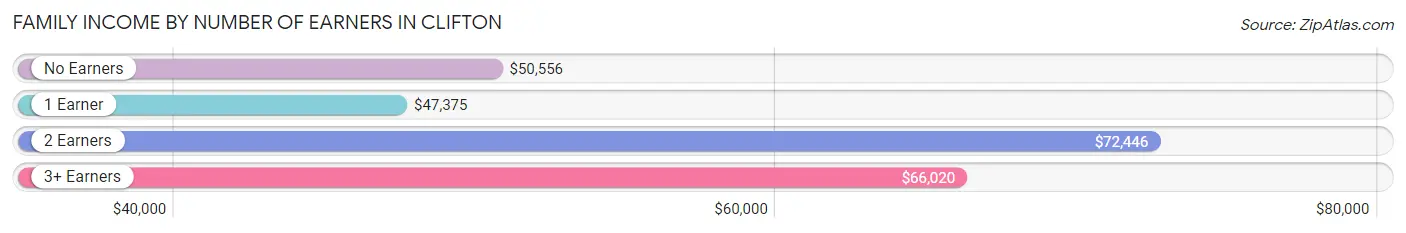
| Number of Earners | # Families | Median Income |
| No Earners | 186 (21.2%) | $50,556 |
| 1 Earner | 143 (16.3%) | $47,375 |
| 2 Earners | 434 (49.5%) | $72,446 |
| 3+ Earners | 114 (13.0%) | $66,020 |
| Total | 877 (100.0%) | $66,760 |
Household Income in Clifton
Household Income Brackets in Clifton
With 256 households falling in the category, the $50,000 to $74,999 income range is the most frequent in Clifton, accounting for 19.0% of all households. In contrast, only 35 households (2.6%) fall into the $10,000 to $14,999 income bracket, making it the least populous group.
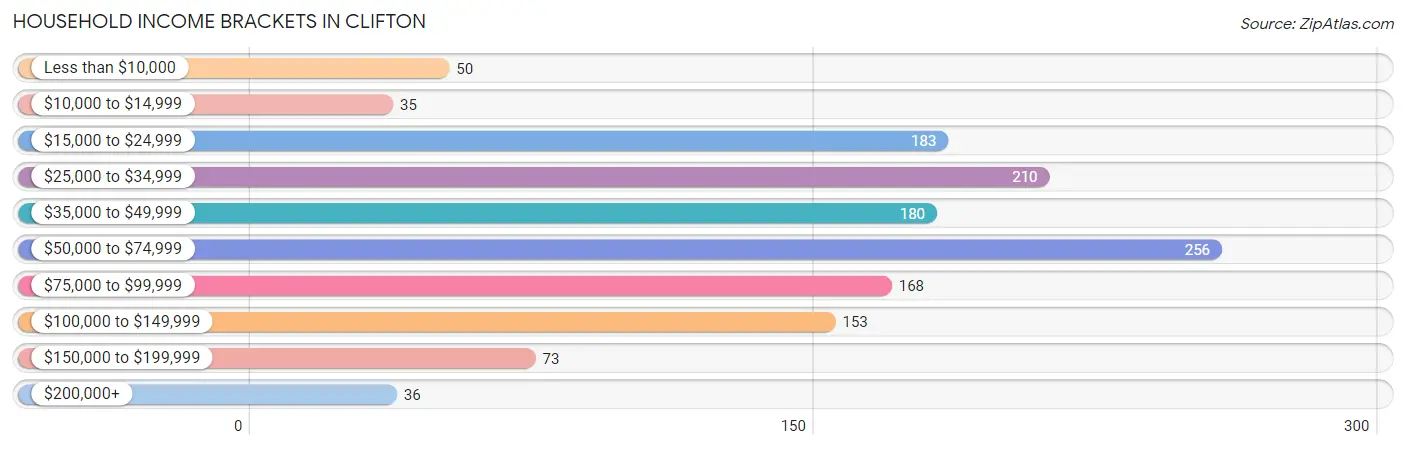
| Income Bracket | # Households | % Households |
| Less than $10,000 | 50 | 3.7% |
| $10,000 to $14,999 | 35 | 2.6% |
| $15,000 to $24,999 | 183 | 13.6% |
| $25,000 to $34,999 | 210 | 15.6% |
| $35,000 to $49,999 | 180 | 13.4% |
| $50,000 to $74,999 | 256 | 19.0% |
| $75,000 to $99,999 | 168 | 12.5% |
| $100,000 to $149,999 | 153 | 11.4% |
| $150,000 to $199,999 | 73 | 5.4% |
| $200,000+ | 36 | 2.7% |
Household Income by Householder Age in Clifton
The median household income in Clifton is $56,500, with the highest median household income of $67,245 found in the 45 to 64 years age bracket for the primary householder. A total of 440 households (32.7%) fall into this category. Meanwhile, the 15 to 24 years age bracket for the primary householder has the lowest median household income of $0, with 13 households (1.0%) in this group.
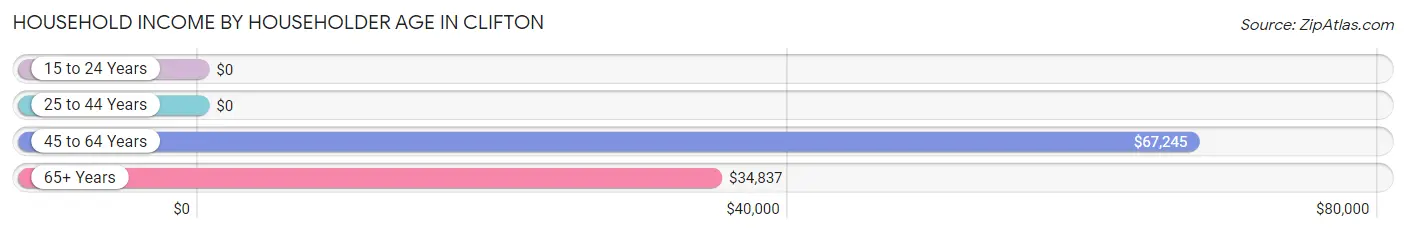
| Income Bracket | # Households | Median Income |
| 15 to 24 Years | 13 (1.0%) | $0 |
| 25 to 44 Years | 337 (25.0%) | $0 |
| 45 to 64 Years | 440 (32.7%) | $67,245 |
| 65+ Years | 556 (41.3%) | $34,837 |
| Total | 1,346 (100.0%) | $56,500 |
Poverty in Clifton
Income Below Poverty by Sex and Age in Clifton
With 19.6% poverty level for males and 24.1% for females among the residents of Clifton, 35 to 44 year old males and 15 year old females are the most vulnerable to poverty, with 77 males (51.3%) and 57 females (100.0%) in their respective age groups living below the poverty level.
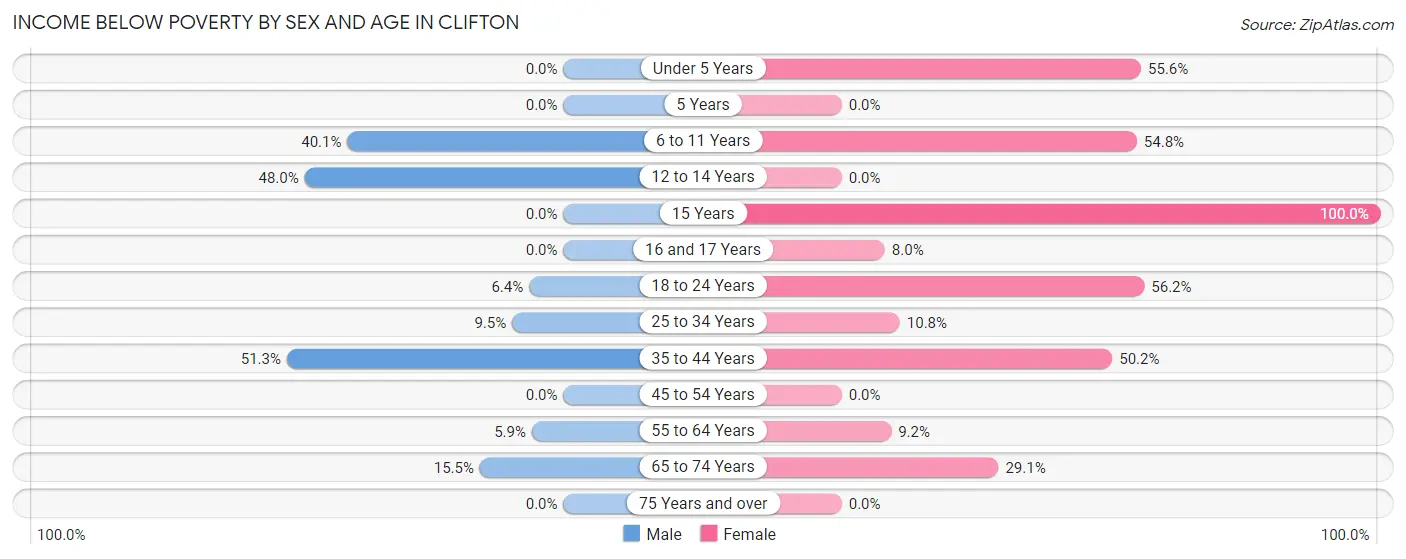
| Age Bracket | Male | Female |
| Under 5 Years | 0 (0.0%) | 20 (55.6%) |
| 5 Years | 0 (0.0%) | 0 (0.0%) |
| 6 to 11 Years | 77 (40.1%) | 63 (54.8%) |
| 12 to 14 Years | 86 (48.0%) | 0 (0.0%) |
| 15 Years | 0 (0.0%) | 57 (100.0%) |
| 16 and 17 Years | 0 (0.0%) | 2 (8.0%) |
| 18 to 24 Years | 7 (6.4%) | 41 (56.2%) |
| 25 to 34 Years | 20 (9.5%) | 18 (10.8%) |
| 35 to 44 Years | 77 (51.3%) | 120 (50.2%) |
| 45 to 54 Years | 0 (0.0%) | 0 (0.0%) |
| 55 to 64 Years | 15 (5.9%) | 20 (9.2%) |
| 65 to 74 Years | 29 (15.5%) | 57 (29.1%) |
| 75 Years and over | 0 (0.0%) | 0 (0.0%) |
| Total | 311 (19.6%) | 398 (24.1%) |
Income Above Poverty by Sex and Age in Clifton
According to the poverty statistics in Clifton, males aged under 5 years and females aged 12 to 14 years are the age groups that are most secure financially, with 100.0% of males and 100.0% of females in these age groups living above the poverty line.
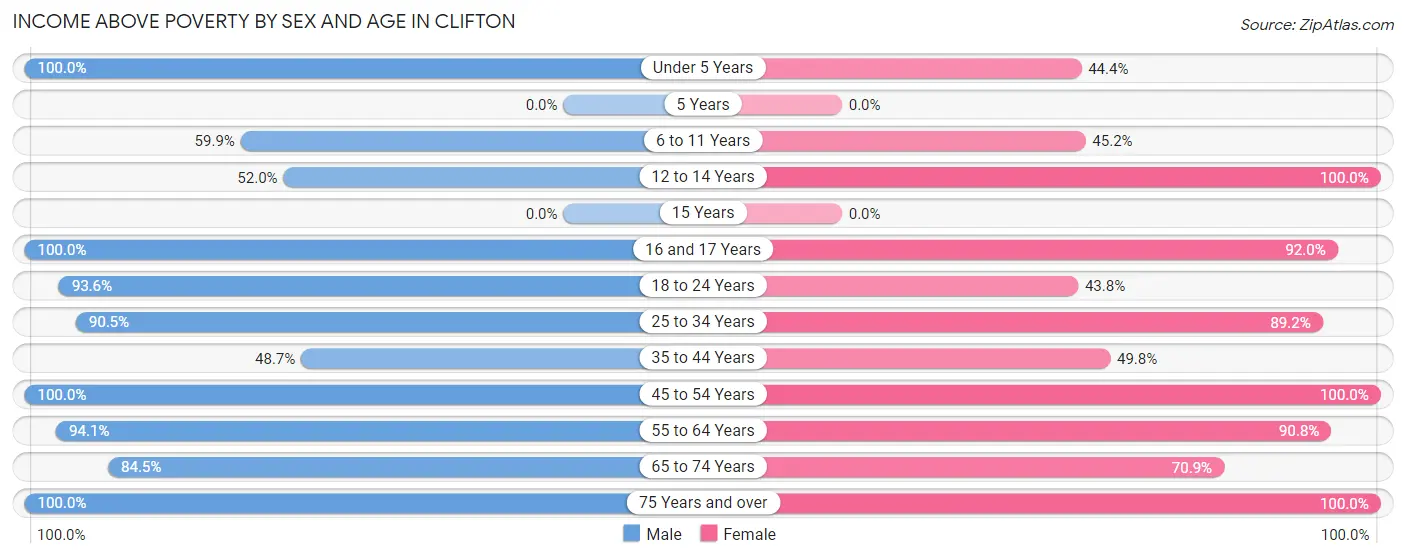
| Age Bracket | Male | Female |
| Under 5 Years | 5 (100.0%) | 16 (44.4%) |
| 5 Years | 0 (0.0%) | 0 (0.0%) |
| 6 to 11 Years | 115 (59.9%) | 52 (45.2%) |
| 12 to 14 Years | 93 (52.0%) | 35 (100.0%) |
| 15 Years | 0 (0.0%) | 0 (0.0%) |
| 16 and 17 Years | 23 (100.0%) | 23 (92.0%) |
| 18 to 24 Years | 103 (93.6%) | 32 (43.8%) |
| 25 to 34 Years | 190 (90.5%) | 149 (89.2%) |
| 35 to 44 Years | 73 (48.7%) | 119 (49.8%) |
| 45 to 54 Years | 159 (100.0%) | 211 (100.0%) |
| 55 to 64 Years | 241 (94.1%) | 198 (90.8%) |
| 65 to 74 Years | 158 (84.5%) | 139 (70.9%) |
| 75 Years and over | 116 (100.0%) | 280 (100.0%) |
| Total | 1,276 (80.4%) | 1,254 (75.9%) |
Income Below Poverty Among Married-Couple Families in Clifton
The poverty statistics for married-couple families in Clifton show that 15.2% or 110 of the total 725 families live below the poverty line. Families with 3 or 4 children have the highest poverty rate of 100.0%, comprising of 75 families. On the other hand, families with no children have the lowest poverty rate of 3.0%, which includes 15 families.
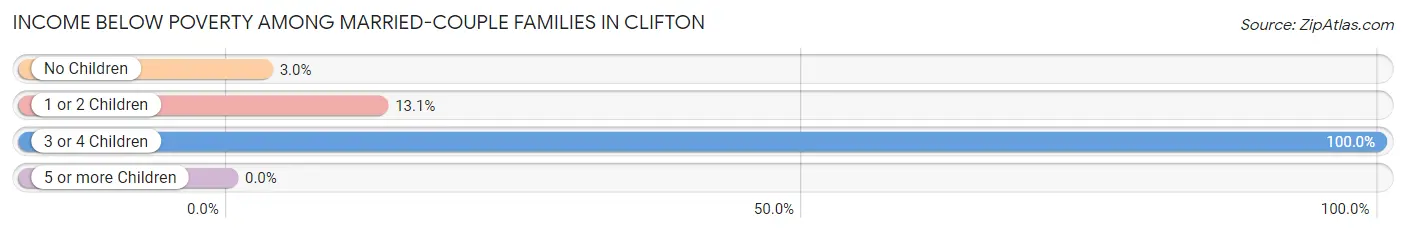
| Children | Above Poverty | Below Poverty |
| No Children | 482 (97.0%) | 15 (3.0%) |
| 1 or 2 Children | 133 (86.9%) | 20 (13.1%) |
| 3 or 4 Children | 0 (0.0%) | 75 (100.0%) |
| 5 or more Children | 0 (0.0%) | 0 (0.0%) |
| Total | 615 (84.8%) | 110 (15.2%) |
Income Below Poverty Among Single-Parent Households in Clifton
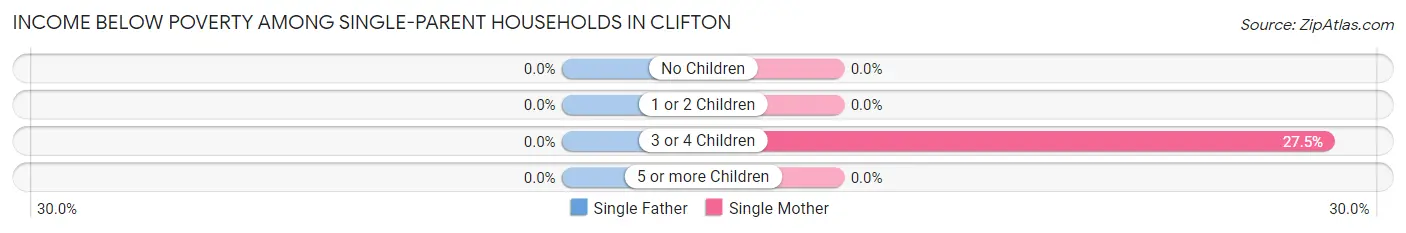
| Children | Single Father | Single Mother |
| No Children | 0 (0.0%) | 0 (0.0%) |
| 1 or 2 Children | 0 (0.0%) | 0 (0.0%) |
| 3 or 4 Children | 0 (0.0%) | 14 (27.5%) |
| 5 or more Children | 0 (0.0%) | 0 (0.0%) |
| Total | 0 (0.0%) | 14 (9.6%) |
Income Below Poverty Among Married-Couple vs Single-Parent Households in Clifton
The poverty data for Clifton shows that 110 of the married-couple family households (15.2%) and 14 of the single-parent households (9.2%) are living below the poverty level. Within the married-couple family households, those with 3 or 4 children have the highest poverty rate, with 75 households (100.0%) falling below the poverty line. Among the single-parent households, those with 3 or 4 children have the highest poverty rate, with 14 household (27.5%) living below poverty.
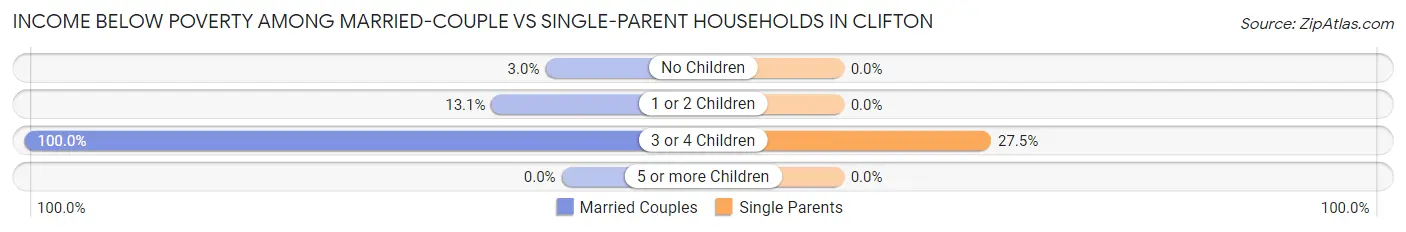
| Children | Married-Couple Families | Single-Parent Households |
| No Children | 15 (3.0%) | 0 (0.0%) |
| 1 or 2 Children | 20 (13.1%) | 0 (0.0%) |
| 3 or 4 Children | 75 (100.0%) | 14 (27.5%) |
| 5 or more Children | 0 (0.0%) | 0 (0.0%) |
| Total | 110 (15.2%) | 14 (9.2%) |
Race in Clifton
The most populous races in Clifton are White / Caucasian (2,541 | 72.9%), Hispanic or Latino (1,234 | 35.4%), and Some other Race (462 | 13.3%).
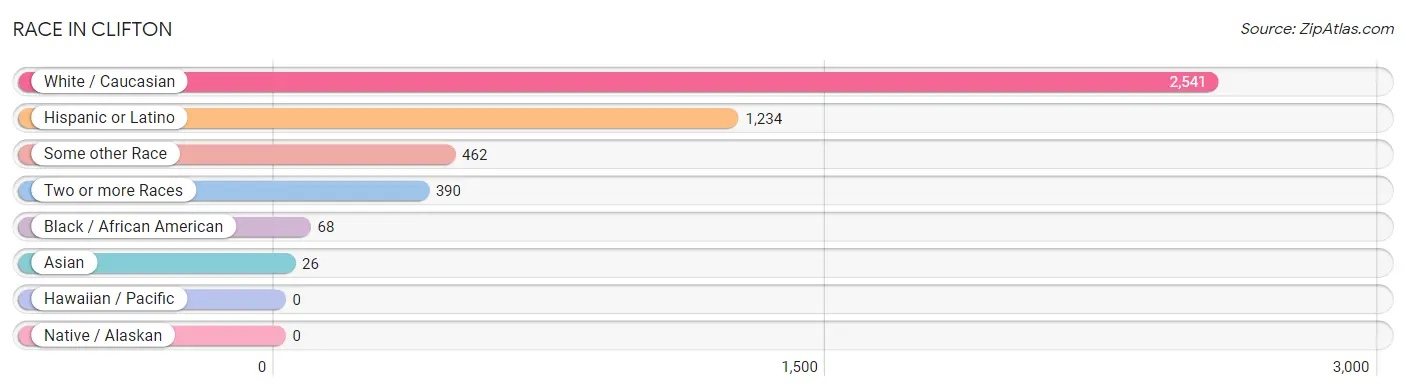
| Race | # Population | % Population |
| Asian | 26 | 0.7% |
| Black / African American | 68 | 1.9% |
| Hawaiian / Pacific | 0 | 0.0% |
| Hispanic or Latino | 1,234 | 35.4% |
| Native / Alaskan | 0 | 0.0% |
| White / Caucasian | 2,541 | 72.9% |
| Two or more Races | 390 | 11.2% |
| Some other Race | 462 | 13.3% |
| Total | 3,487 | 100.0% |
Ancestry in Clifton
The most populous ancestries reported in Clifton are Mexican (1,177 | 33.8%), German (622 | 17.8%), Irish (374 | 10.7%), English (218 | 6.2%), and American (158 | 4.5%), together accounting for 73.1% of all Clifton residents.
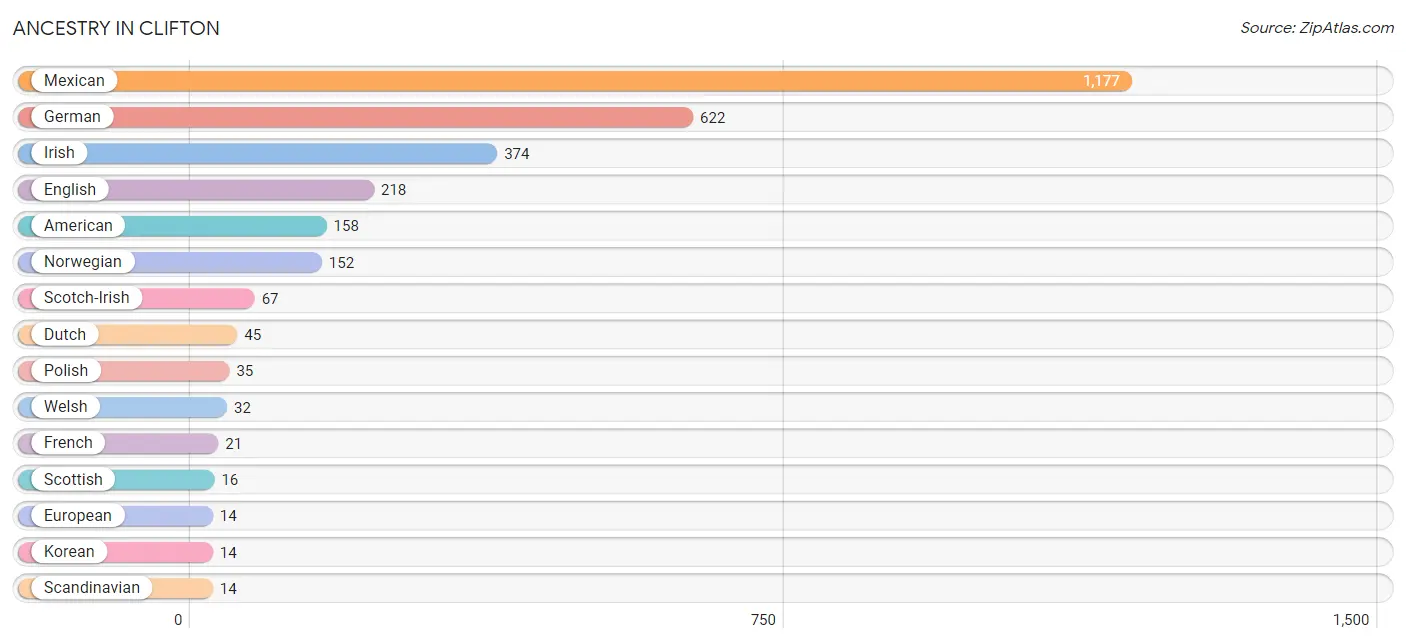
| Ancestry | # Population | % Population |
| American | 158 | 4.5% |
| Croatian | 13 | 0.4% |
| Czech | 10 | 0.3% |
| Czechoslovakian | 2 | 0.1% |
| Dutch | 45 | 1.3% |
| English | 218 | 6.2% |
| European | 14 | 0.4% |
| French | 21 | 0.6% |
| German | 622 | 17.8% |
| German Russian | 10 | 0.3% |
| Irish | 374 | 10.7% |
| Korean | 14 | 0.4% |
| Mexican | 1,177 | 33.8% |
| Norwegian | 152 | 4.4% |
| Polish | 35 | 1.0% |
| Scandinavian | 14 | 0.4% |
| Scotch-Irish | 67 | 1.9% |
| Scottish | 16 | 0.5% |
| Thai | 12 | 0.3% |
| Welsh | 32 | 0.9% | View All 20 Rows |
Immigrants in Clifton
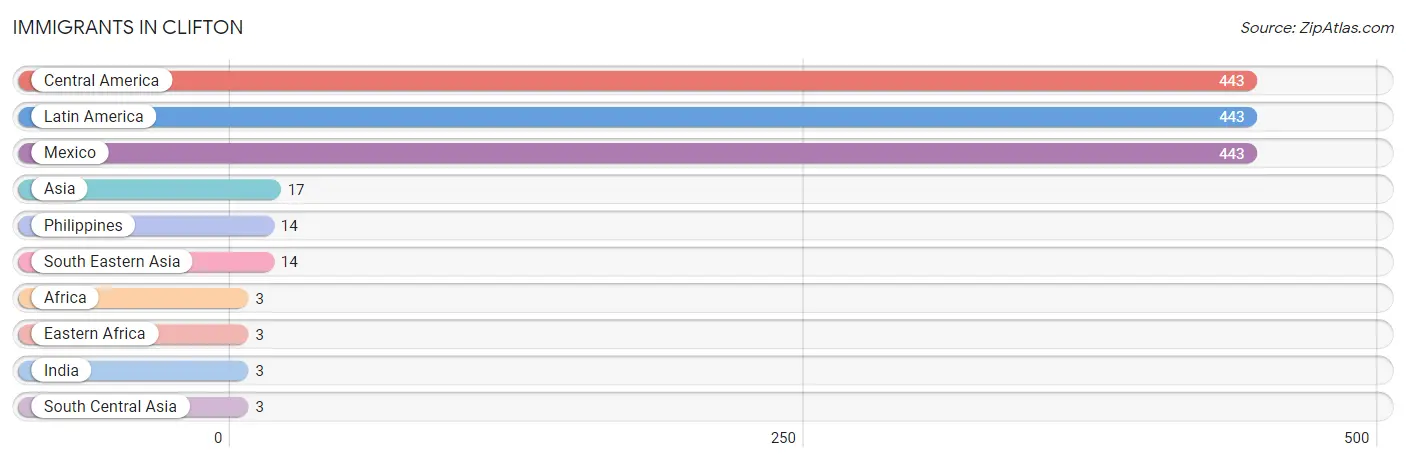
The most numerous immigrant groups reported in Clifton came from Central America (443 | 12.7%), Latin America (443 | 12.7%), Mexico (443 | 12.7%), Asia (17 | 0.5%), and Philippines (14 | 0.4%), together accounting for 39.0% of all Clifton residents.
| Immigration Origin | # Population | % Population |
| Africa | 3 | 0.1% |
| Asia | 17 | 0.5% |
| Central America | 443 | 12.7% |
| Eastern Africa | 3 | 0.1% |
| India | 3 | 0.1% |
| Latin America | 443 | 12.7% |
| Mexico | 443 | 12.7% |
| Philippines | 14 | 0.4% |
| South Central Asia | 3 | 0.1% |
| South Eastern Asia | 14 | 0.4% | View All 10 Rows |
Sex and Age in Clifton
Sex and Age in Clifton
The most populous age groups in Clifton are 10 to 14 Years (300 | 18.0%) for men and 85 Years and over (188 | 10.3%) for women.
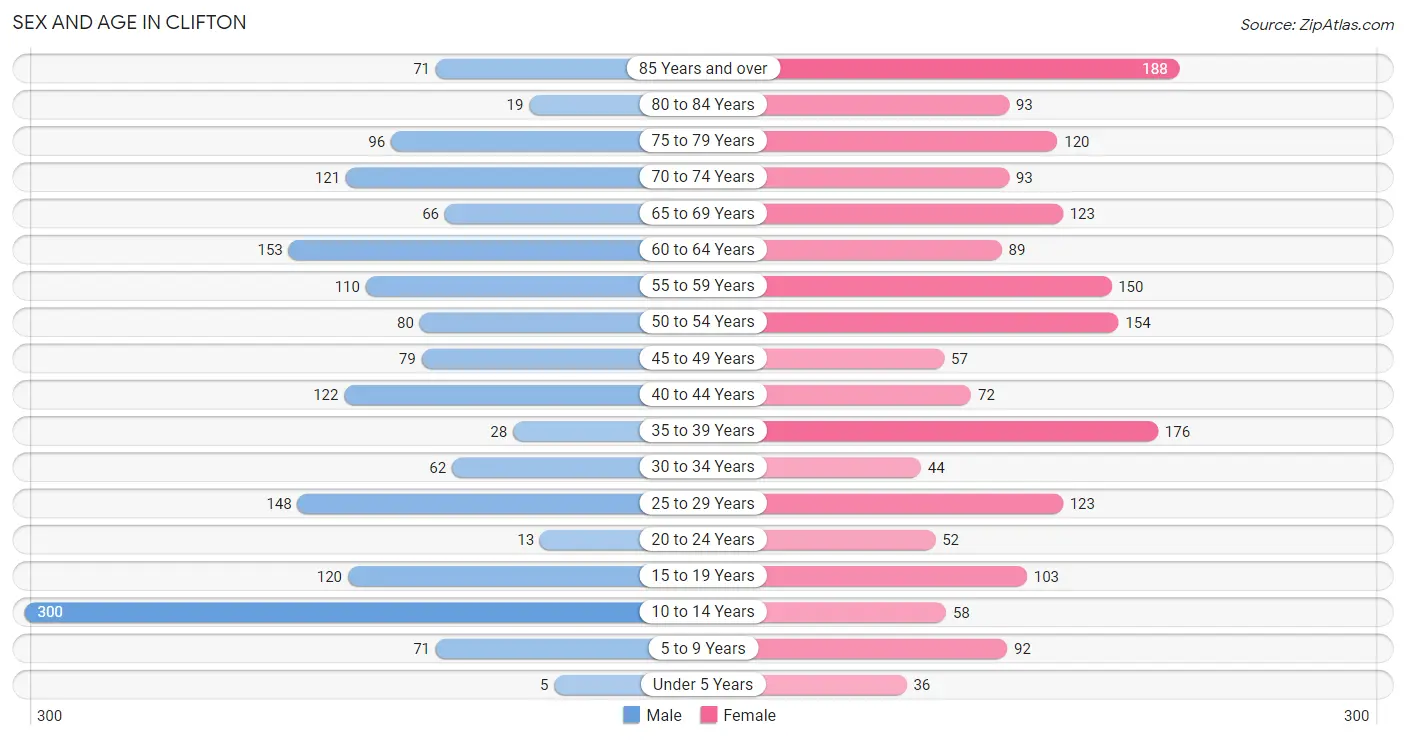
| Age Bracket | Male | Female |
| Under 5 Years | 5 (0.3%) | 36 (2.0%) |
| 5 to 9 Years | 71 (4.3%) | 92 (5.1%) |
| 10 to 14 Years | 300 (18.0%) | 58 (3.2%) |
| 15 to 19 Years | 120 (7.2%) | 103 (5.7%) |
| 20 to 24 Years | 13 (0.8%) | 52 (2.9%) |
| 25 to 29 Years | 148 (8.9%) | 123 (6.8%) |
| 30 to 34 Years | 62 (3.7%) | 44 (2.4%) |
| 35 to 39 Years | 28 (1.7%) | 176 (9.7%) |
| 40 to 44 Years | 122 (7.3%) | 72 (4.0%) |
| 45 to 49 Years | 79 (4.8%) | 57 (3.1%) |
| 50 to 54 Years | 80 (4.8%) | 154 (8.5%) |
| 55 to 59 Years | 110 (6.6%) | 150 (8.2%) |
| 60 to 64 Years | 153 (9.2%) | 89 (4.9%) |
| 65 to 69 Years | 66 (4.0%) | 123 (6.8%) |
| 70 to 74 Years | 121 (7.3%) | 93 (5.1%) |
| 75 to 79 Years | 96 (5.8%) | 120 (6.6%) |
| 80 to 84 Years | 19 (1.1%) | 93 (5.1%) |
| 85 Years and over | 71 (4.3%) | 188 (10.3%) |
| Total | 1,664 (100.0%) | 1,823 (100.0%) |
Families and Households in Clifton
Median Family Size in Clifton
The median family size in Clifton is 3.04 persons per family, with single female/mother families (146 | 16.7%) accounting for the largest median family size of 3.28 persons per family. On the other hand, single male/father families (6 | 0.7%) represent the smallest median family size with 1.67 persons per family.
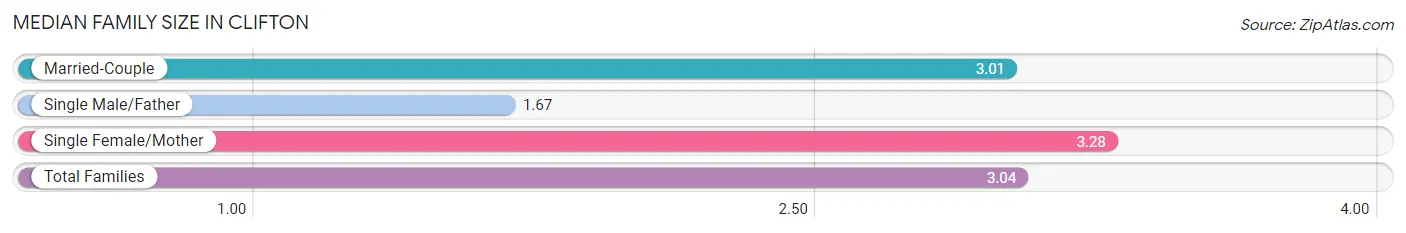
| Family Type | # Families | Family Size |
| Married-Couple | 725 (82.7%) | 3.01 |
| Single Male/Father | 6 (0.7%) | 1.67 |
| Single Female/Mother | 146 (16.7%) | 3.28 |
| Total Families | 877 (100.0%) | 3.04 |
Median Household Size in Clifton
The median household size in Clifton is 2.40 persons per household, with single female/mother households (146 | 10.8%) accounting for the largest median household size of 3.34 persons per household. non-family households (469 | 34.8%) represent the smallest median household size with 1.06 persons per household.
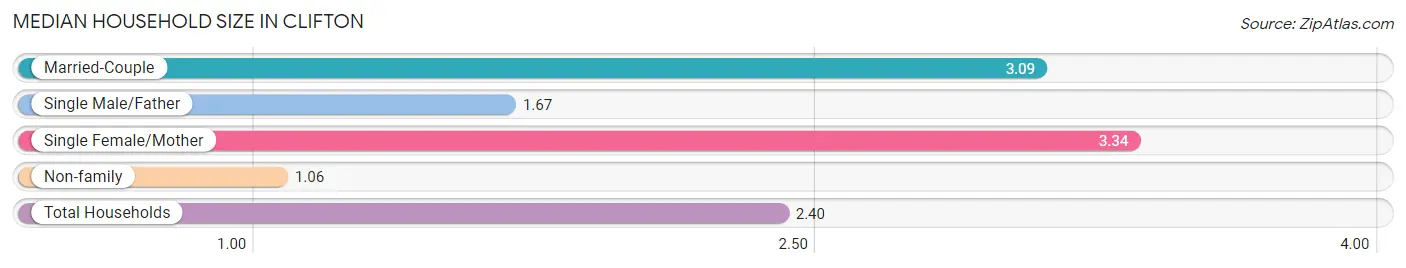
| Household Type | # Households | Household Size |
| Married-Couple | 725 (53.9%) | 3.09 |
| Single Male/Father | 6 (0.4%) | 1.67 |
| Single Female/Mother | 146 (10.8%) | 3.34 |
| Non-family | 469 (34.8%) | 1.06 |
| Total Households | 1,346 (100.0%) | 2.40 |
Household Size by Marriage Status in Clifton
Out of a total of 1,346 households in Clifton, 877 (65.2%) are family households, while 469 (34.8%) are nonfamily households. The most numerous type of family households are 2-person households, comprising 423, and the most common type of nonfamily households are 1-person households, comprising 434.
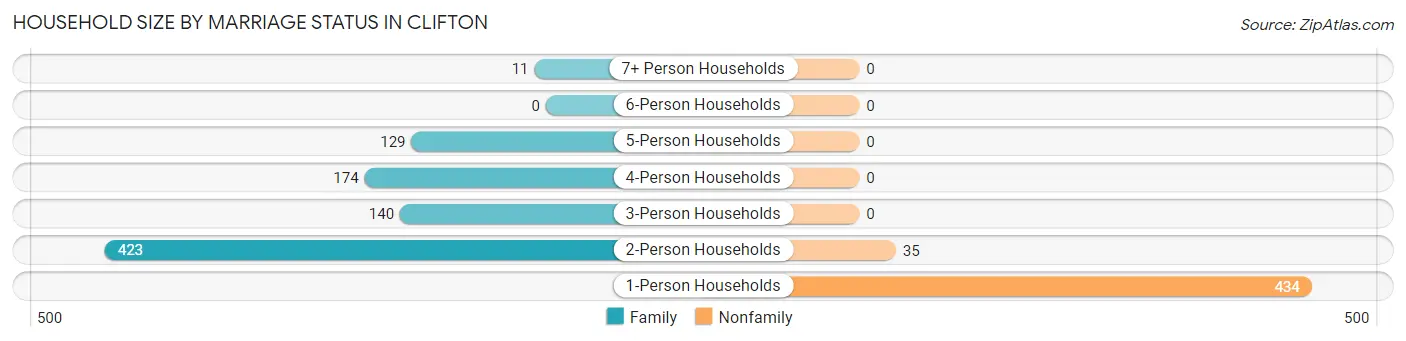
| Household Size | Family Households | Nonfamily Households |
| 1-Person Households | - | 434 (32.2%) |
| 2-Person Households | 423 (31.4%) | 35 (2.6%) |
| 3-Person Households | 140 (10.4%) | 0 (0.0%) |
| 4-Person Households | 174 (12.9%) | 0 (0.0%) |
| 5-Person Households | 129 (9.6%) | 0 (0.0%) |
| 6-Person Households | 0 (0.0%) | 0 (0.0%) |
| 7+ Person Households | 11 (0.8%) | 0 (0.0%) |
| Total | 877 (65.2%) | 469 (34.8%) |
Female Fertility in Clifton
Fertility by Age in Clifton
| Age Bracket | Women with Births | Births / 1,000 Women |
| 15 to 19 years | 0 (0.0%) | 0.0 |
| 20 to 34 years | 0 (0.0%) | 0.0 |
| 35 to 50 years | 0 (0.0%) | 0.0 |
| Total | 0 (0.0%) | 0.0 |
Fertility by Age by Marriage Status in Clifton
| Age Bracket | Married | Unmarried |
| 15 to 19 years | 0 (0.0%) | 0 (0.0%) |
| 20 to 34 years | 0 (0.0%) | 0 (0.0%) |
| 35 to 50 years | 0 (0.0%) | 0 (0.0%) |
| Total | 0 (0.0%) | 0 (0.0%) |
Fertility by Education in Clifton
| Educational Attainment | Women with Births | Births / 1,000 Women |
| Less than High School | 0 (0.0%) | 0.0 |
| High School Diploma | 0 (0.0%) | 0.0 |
| College or Associate's Degree | 0 (0.0%) | 0.0 |
| Bachelor's Degree | 0 (0.0%) | 0.0 |
| Graduate Degree | 0 (0.0%) | 0.0 |
| Total | 0 (0.0%) | 0.0 |
Fertility by Education by Marriage Status in Clifton
| Educational Attainment | Married | Unmarried |
| Less than High School | 0 (0.0%) | 0 (0.0%) |
| High School Diploma | 0 (0.0%) | 0 (0.0%) |
| College or Associate's Degree | 0 (0.0%) | 0 (0.0%) |
| Bachelor's Degree | 0 (0.0%) | 0 (0.0%) |
| Graduate Degree | 0 (0.0%) | 0 (0.0%) |
| Total | 0 (0.0%) | 0 (0.0%) |
Employment Characteristics in Clifton
Employment by Class of Employer in Clifton
Among the 1,437 employed individuals in Clifton, private company employees (878 | 61.1%), local government employees (224 | 15.6%), and not-for-profit organizations (122 | 8.5%) make up the most common classes of employment.
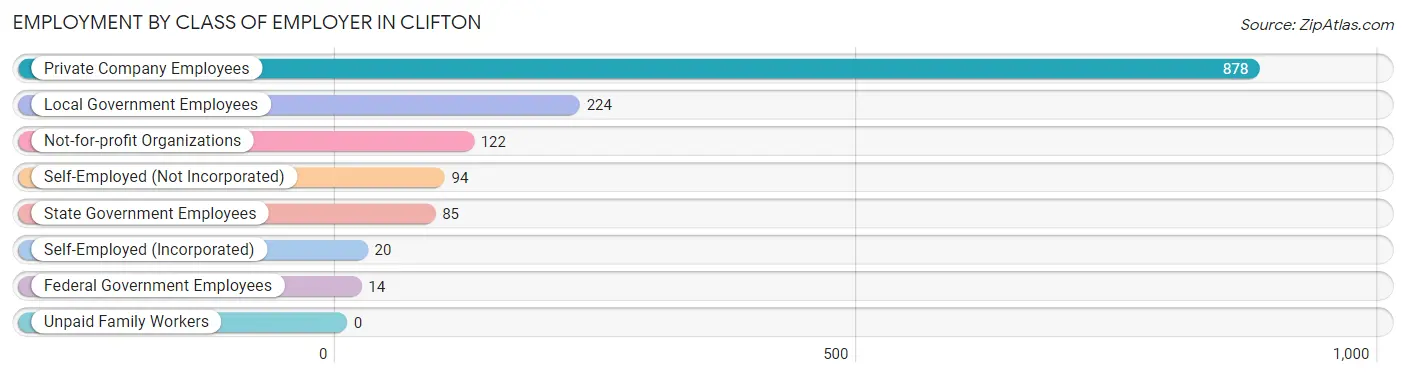
| Employer Class | # Employees | % Employees |
| Private Company Employees | 878 | 61.1% |
| Self-Employed (Incorporated) | 20 | 1.4% |
| Self-Employed (Not Incorporated) | 94 | 6.5% |
| Not-for-profit Organizations | 122 | 8.5% |
| Local Government Employees | 224 | 15.6% |
| State Government Employees | 85 | 5.9% |
| Federal Government Employees | 14 | 1.0% |
| Unpaid Family Workers | 0 | 0.0% |
| Total | 1,437 | 100.0% |
Employment Status by Age in Clifton
According to the labor force statistics for Clifton, out of the total population over 16 years of age (2,868), 55.2% or 1,583 individuals are in the labor force, with 5.2% or 82 of them unemployed. The age group with the highest labor force participation rate is 20 to 24 years, with 100.0% or 65 individuals in the labor force. Within the labor force, the 45 to 54 years age range has the highest percentage of unemployed individuals, with 17.0% or 52 of them being unemployed.
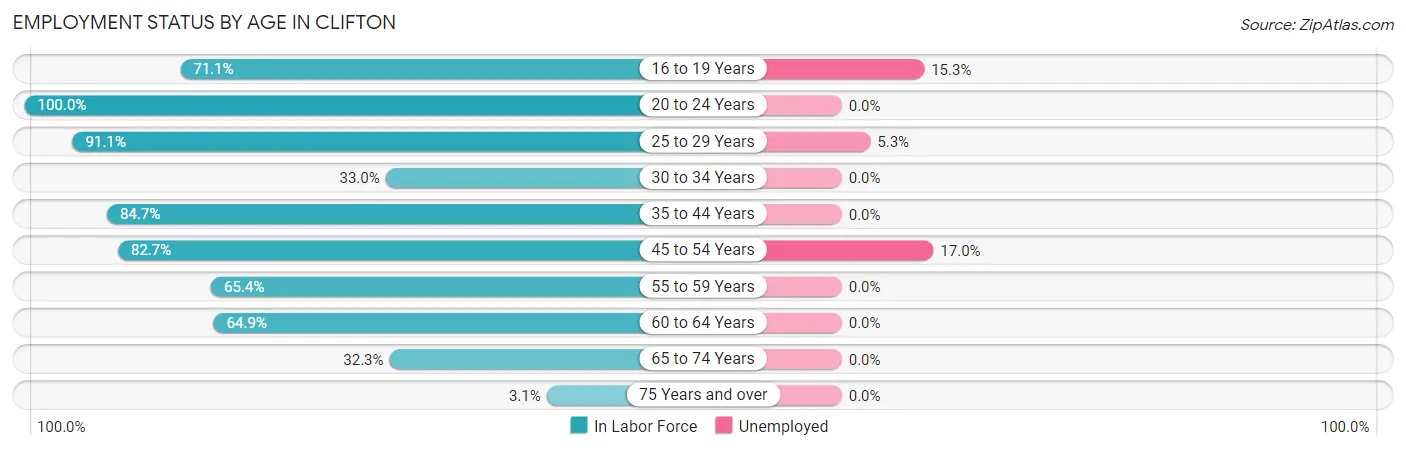
| Age Bracket | In Labor Force | Unemployed |
| 16 to 19 Years | 118 (71.1%) | 18 (15.3%) |
| 20 to 24 Years | 65 (100.0%) | 0 (0.0%) |
| 25 to 29 Years | 247 (91.1%) | 13 (5.3%) |
| 30 to 34 Years | 35 (33.0%) | 0 (0.0%) |
| 35 to 44 Years | 337 (84.7%) | 0 (0.0%) |
| 45 to 54 Years | 306 (82.7%) | 52 (17.0%) |
| 55 to 59 Years | 170 (65.4%) | 0 (0.0%) |
| 60 to 64 Years | 157 (64.9%) | 0 (0.0%) |
| 65 to 74 Years | 130 (32.3%) | 0 (0.0%) |
| 75 Years and over | 18 (3.1%) | 0 (0.0%) |
| Total | 1,583 (55.2%) | 82 (5.2%) |
Employment Status by Educational Attainment in Clifton
According to labor force statistics for Clifton, 76.0% of individuals (1,252) out of the total population between 25 and 64 years of age (1,647) are in the labor force, with 5.2% or 65 of them being unemployed. The group with the highest labor force participation rate are those with the educational attainment of high school diploma, with 85.7% or 462 individuals in the labor force. Within the labor force, individuals with high school diploma education have the highest percentage of unemployment, with 11.3% or 52 of them being unemployed.
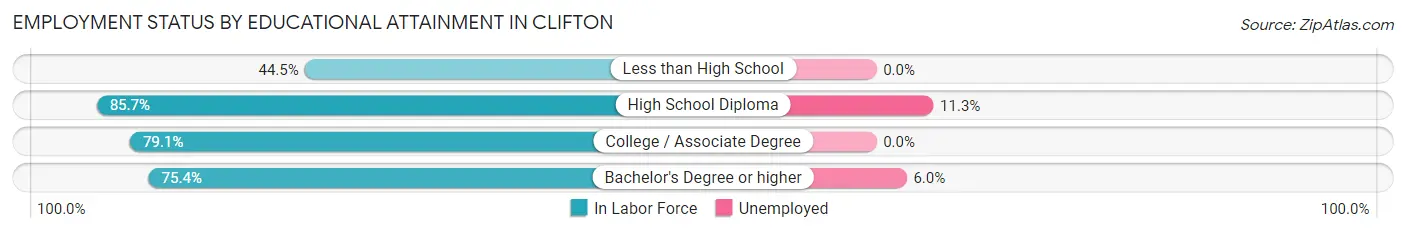
| Educational Attainment | In Labor Force | Unemployed |
| Less than High School | 98 (44.5%) | 0 (0.0%) |
| High School Diploma | 462 (85.7%) | 61 (11.3%) |
| College / Associate Degree | 474 (79.1%) | 0 (0.0%) |
| Bachelor's Degree or higher | 218 (75.4%) | 17 (6.0%) |
| Total | 1,252 (76.0%) | 86 (5.2%) |
Employment Occupations by Sex in Clifton
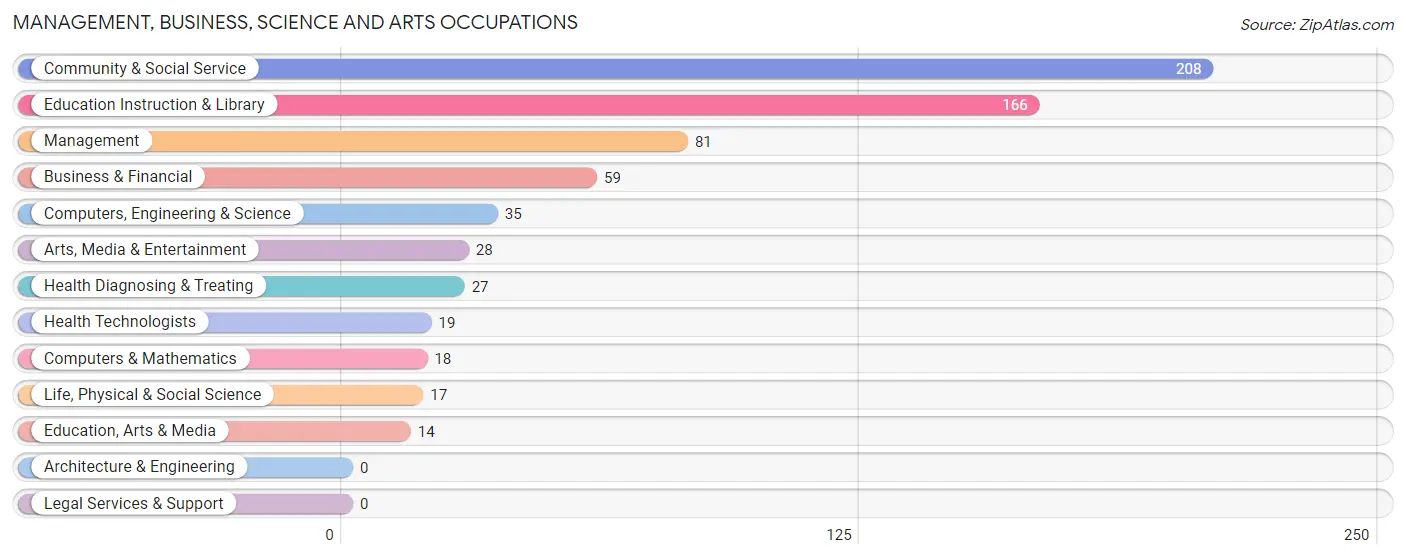
Management, Business, Science and Arts Occupations
The most common Management, Business, Science and Arts occupations in Clifton are Community & Social Service (208 | 13.9%), Education Instruction & Library (166 | 11.1%), Management (81 | 5.4%), Business & Financial (59 | 3.9%), and Computers, Engineering & Science (35 | 2.3%).
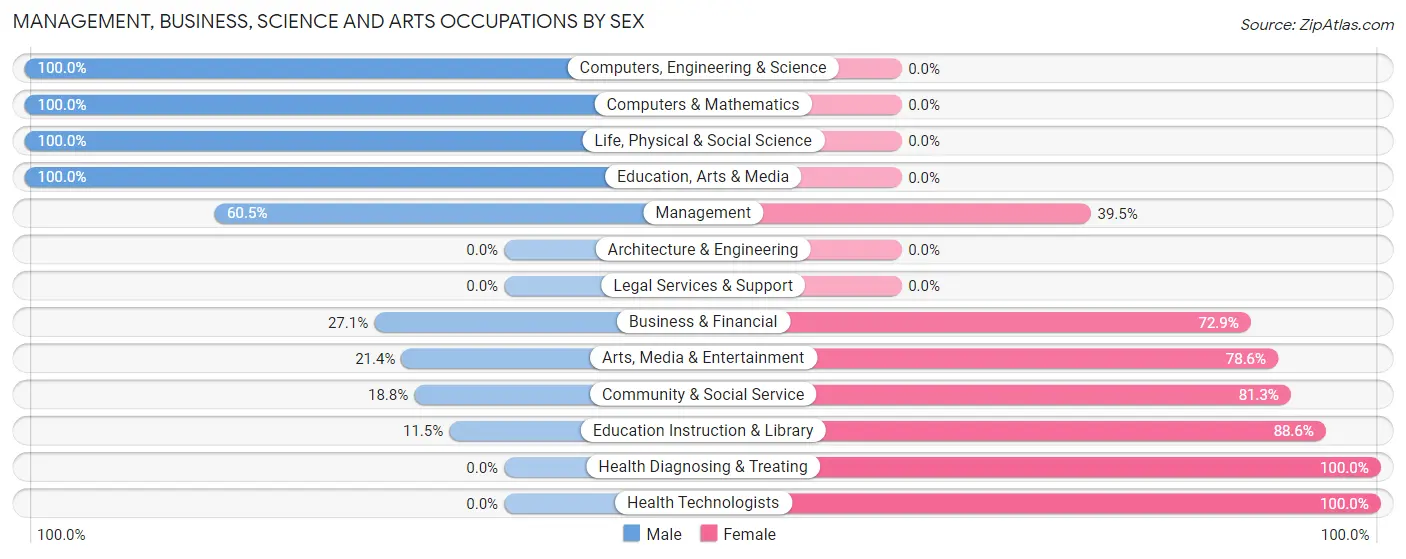
Management, Business, Science and Arts Occupations by Sex
Within the Management, Business, Science and Arts occupations in Clifton, the most male-oriented occupations are Computers, Engineering & Science (100.0%), Computers & Mathematics (100.0%), and Life, Physical & Social Science (100.0%), while the most female-oriented occupations are Health Diagnosing & Treating (100.0%), Health Technologists (100.0%), and Education Instruction & Library (88.5%).
| Occupation | Male | Female |
| Management | 49 (60.5%) | 32 (39.5%) |
| Business & Financial | 16 (27.1%) | 43 (72.9%) |
| Computers, Engineering & Science | 35 (100.0%) | 0 (0.0%) |
| Computers & Mathematics | 18 (100.0%) | 0 (0.0%) |
| Architecture & Engineering | 0 (0.0%) | 0 (0.0%) |
| Life, Physical & Social Science | 17 (100.0%) | 0 (0.0%) |
| Community & Social Service | 39 (18.8%) | 169 (81.2%) |
| Education, Arts & Media | 14 (100.0%) | 0 (0.0%) |
| Legal Services & Support | 0 (0.0%) | 0 (0.0%) |
| Education Instruction & Library | 19 (11.5%) | 147 (88.5%) |
| Arts, Media & Entertainment | 6 (21.4%) | 22 (78.6%) |
| Health Diagnosing & Treating | 0 (0.0%) | 27 (100.0%) |
| Health Technologists | 0 (0.0%) | 19 (100.0%) |
| Total (Category) | 139 (33.9%) | 271 (66.1%) |
| Total (Overall) | 738 (49.2%) | 762 (50.8%) |
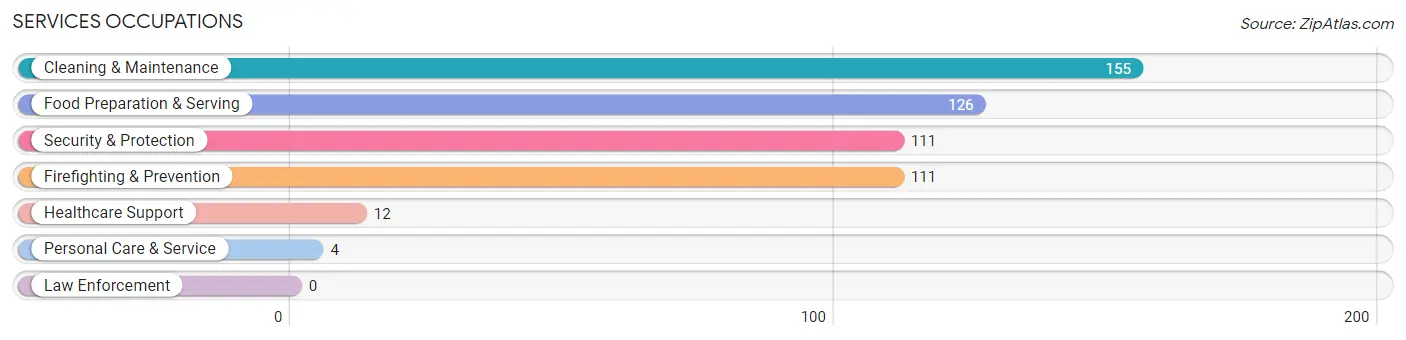
Services Occupations
The most common Services occupations in Clifton are Cleaning & Maintenance (155 | 10.3%), Food Preparation & Serving (126 | 8.4%), Security & Protection (111 | 7.4%), Firefighting & Prevention (111 | 7.4%), and Healthcare Support (12 | 0.8%).
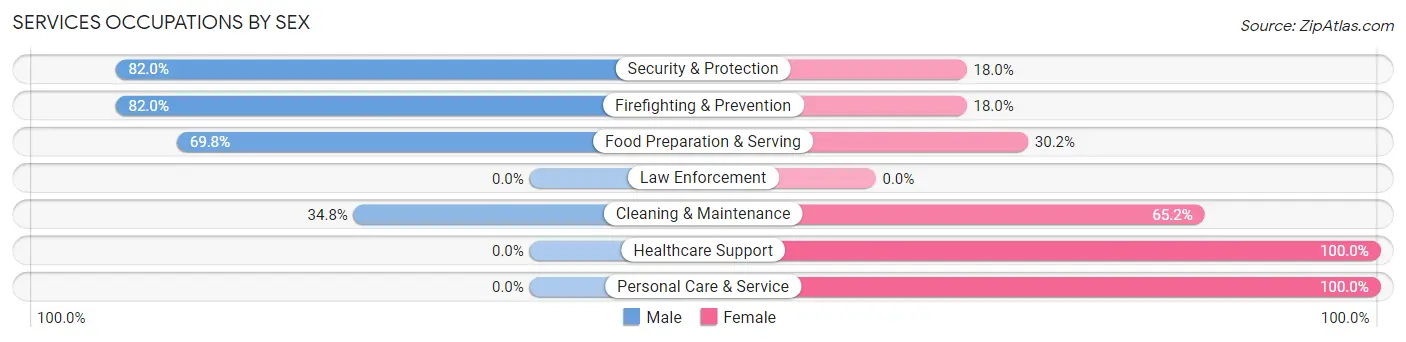
Services Occupations by Sex
Within the Services occupations in Clifton, the most male-oriented occupations are Security & Protection (82.0%), Firefighting & Prevention (82.0%), and Food Preparation & Serving (69.8%), while the most female-oriented occupations are Healthcare Support (100.0%), Personal Care & Service (100.0%), and Cleaning & Maintenance (65.2%).
| Occupation | Male | Female |
| Healthcare Support | 0 (0.0%) | 12 (100.0%) |
| Security & Protection | 91 (82.0%) | 20 (18.0%) |
| Firefighting & Prevention | 91 (82.0%) | 20 (18.0%) |
| Law Enforcement | 0 (0.0%) | 0 (0.0%) |
| Food Preparation & Serving | 88 (69.8%) | 38 (30.2%) |
| Cleaning & Maintenance | 54 (34.8%) | 101 (65.2%) |
| Personal Care & Service | 0 (0.0%) | 4 (100.0%) |
| Total (Category) | 233 (57.1%) | 175 (42.9%) |
| Total (Overall) | 738 (49.2%) | 762 (50.8%) |
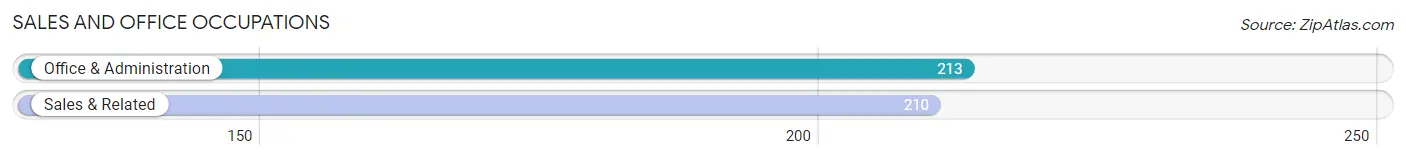
Sales and Office Occupations
The most common Sales and Office occupations in Clifton are Office & Administration (213 | 14.2%), and Sales & Related (210 | 14.0%).
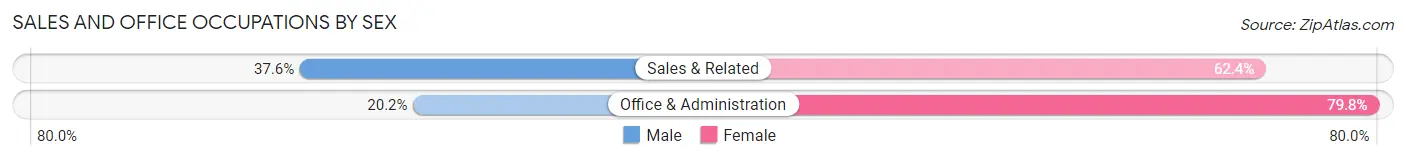
Sales and Office Occupations by Sex
| Occupation | Male | Female |
| Sales & Related | 79 (37.6%) | 131 (62.4%) |
| Office & Administration | 43 (20.2%) | 170 (79.8%) |
| Total (Category) | 122 (28.8%) | 301 (71.2%) |
| Total (Overall) | 738 (49.2%) | 762 (50.8%) |
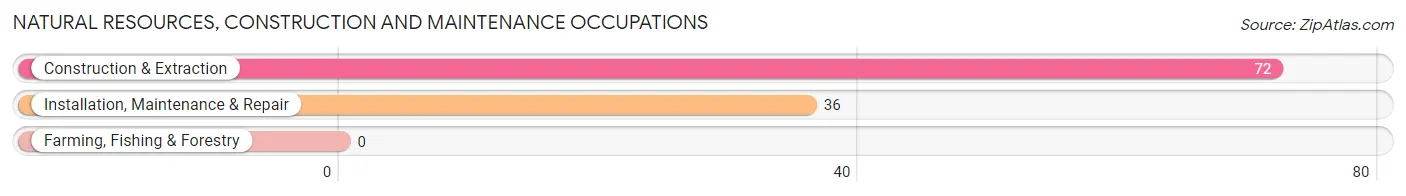
Natural Resources, Construction and Maintenance Occupations
The most common Natural Resources, Construction and Maintenance occupations in Clifton are Construction & Extraction (72 | 4.8%), and Installation, Maintenance & Repair (36 | 2.4%).
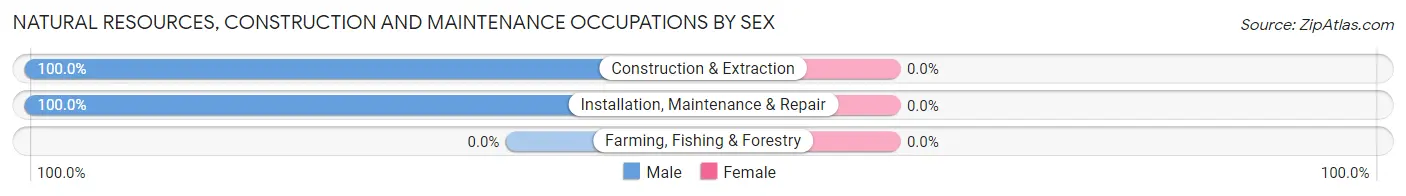
Natural Resources, Construction and Maintenance Occupations by Sex
| Occupation | Male | Female |
| Farming, Fishing & Forestry | 0 (0.0%) | 0 (0.0%) |
| Construction & Extraction | 72 (100.0%) | 0 (0.0%) |
| Installation, Maintenance & Repair | 36 (100.0%) | 0 (0.0%) |
| Total (Category) | 108 (100.0%) | 0 (0.0%) |
| Total (Overall) | 738 (49.2%) | 762 (50.8%) |
Production, Transportation and Moving Occupations
The most common Production, Transportation and Moving occupations in Clifton are Transportation (109 | 7.3%), and Production (42 | 2.8%).
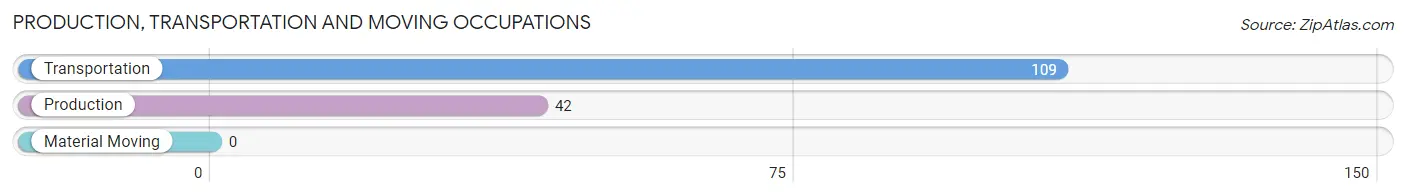
Production, Transportation and Moving Occupations by Sex
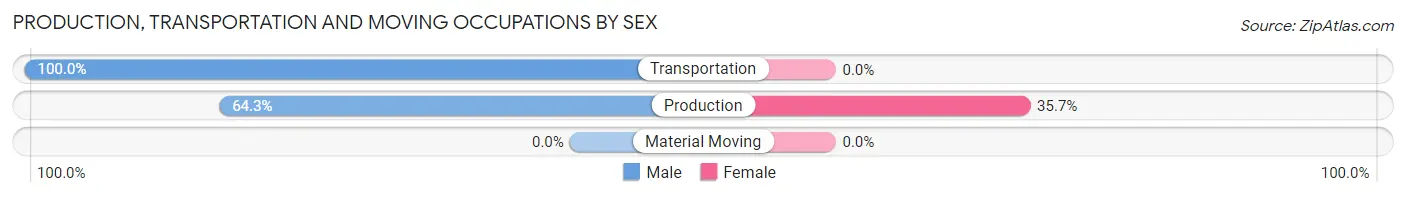
| Occupation | Male | Female |
| Production | 27 (64.3%) | 15 (35.7%) |
| Transportation | 109 (100.0%) | 0 (0.0%) |
| Material Moving | 0 (0.0%) | 0 (0.0%) |
| Total (Category) | 136 (90.1%) | 15 (9.9%) |
| Total (Overall) | 738 (49.2%) | 762 (50.8%) |
Employment Industries by Sex in Clifton
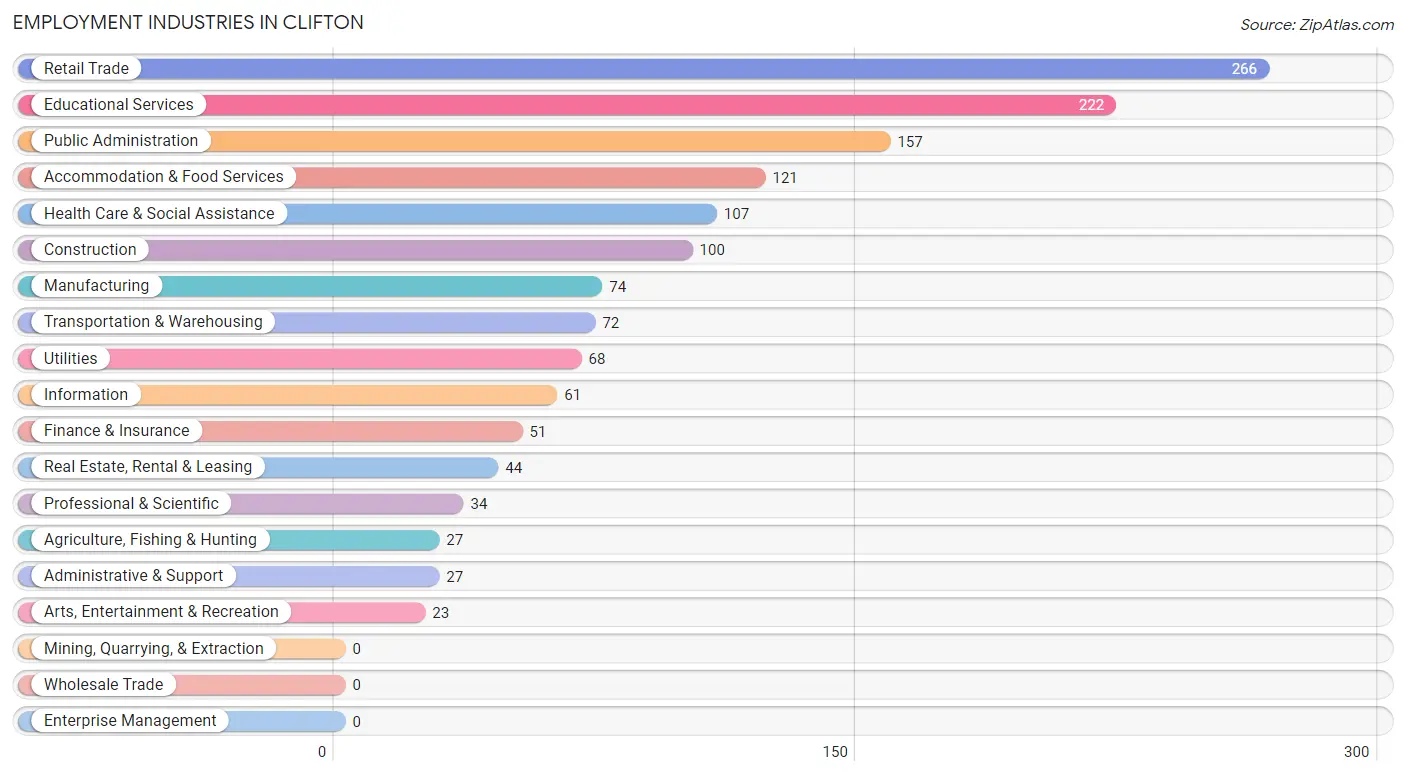
Employment Industries in Clifton
The major employment industries in Clifton include Retail Trade (266 | 17.7%), Educational Services (222 | 14.8%), Public Administration (157 | 10.5%), Accommodation & Food Services (121 | 8.1%), and Health Care & Social Assistance (107 | 7.1%).
Employment Industries by Sex in Clifton
The Clifton industries that see more men than women are Agriculture, Fishing & Hunting (100.0%), Transportation & Warehousing (100.0%), and Utilities (100.0%), whereas the industries that tend to have a higher number of women are Real Estate, Rental & Leasing (100.0%), Health Care & Social Assistance (100.0%), and Educational Services (96.0%).
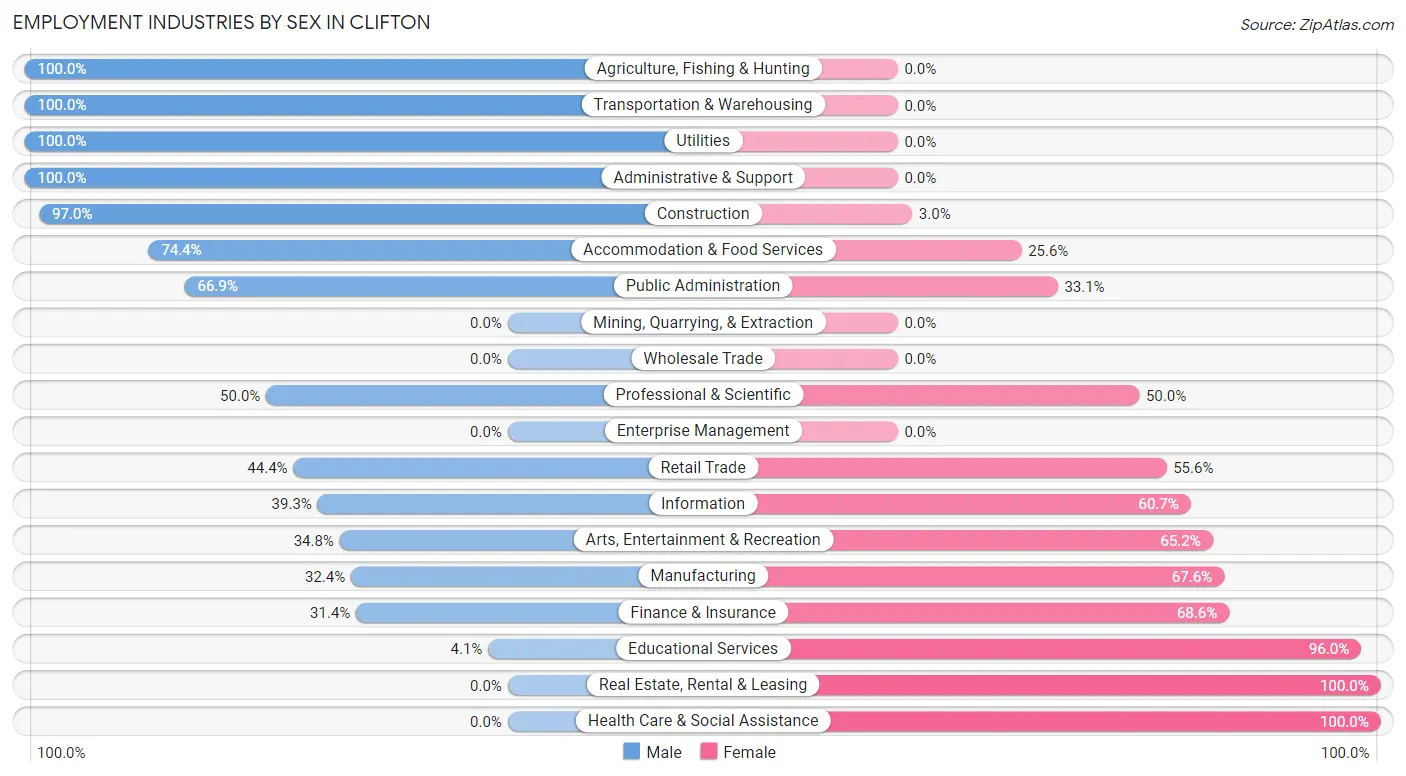
| Industry | Male | Female |
| Agriculture, Fishing & Hunting | 27 (100.0%) | 0 (0.0%) |
| Mining, Quarrying, & Extraction | 0 (0.0%) | 0 (0.0%) |
| Construction | 97 (97.0%) | 3 (3.0%) |
| Manufacturing | 24 (32.4%) | 50 (67.6%) |
| Wholesale Trade | 0 (0.0%) | 0 (0.0%) |
| Retail Trade | 118 (44.4%) | 148 (55.6%) |
| Transportation & Warehousing | 72 (100.0%) | 0 (0.0%) |
| Utilities | 68 (100.0%) | 0 (0.0%) |
| Information | 24 (39.3%) | 37 (60.7%) |
| Finance & Insurance | 16 (31.4%) | 35 (68.6%) |
| Real Estate, Rental & Leasing | 0 (0.0%) | 44 (100.0%) |
| Professional & Scientific | 17 (50.0%) | 17 (50.0%) |
| Enterprise Management | 0 (0.0%) | 0 (0.0%) |
| Administrative & Support | 27 (100.0%) | 0 (0.0%) |
| Educational Services | 9 (4.1%) | 213 (96.0%) |
| Health Care & Social Assistance | 0 (0.0%) | 107 (100.0%) |
| Arts, Entertainment & Recreation | 8 (34.8%) | 15 (65.2%) |
| Accommodation & Food Services | 90 (74.4%) | 31 (25.6%) |
| Public Administration | 105 (66.9%) | 52 (33.1%) |
| Total | 738 (49.2%) | 762 (50.8%) |
Education in Clifton
School Enrollment in Clifton
The most common levels of schooling among the 855 students in Clifton are middle school (274 | 32.1%), high school (249 | 29.1%), and college / undergraduate (172 | 20.1%).
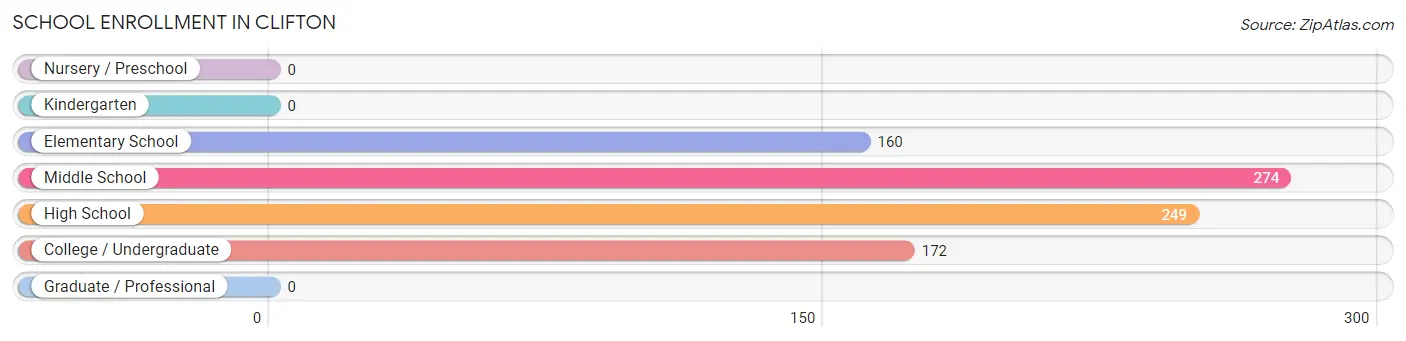
| School Level | # Students | % Students |
| Nursery / Preschool | 0 | 0.0% |
| Kindergarten | 0 | 0.0% |
| Elementary School | 160 | 18.7% |
| Middle School | 274 | 32.1% |
| High School | 249 | 29.1% |
| College / Undergraduate | 172 | 20.1% |
| Graduate / Professional | 0 | 0.0% |
| Total | 855 | 100.0% |
School Enrollment by Age by Funding Source in Clifton
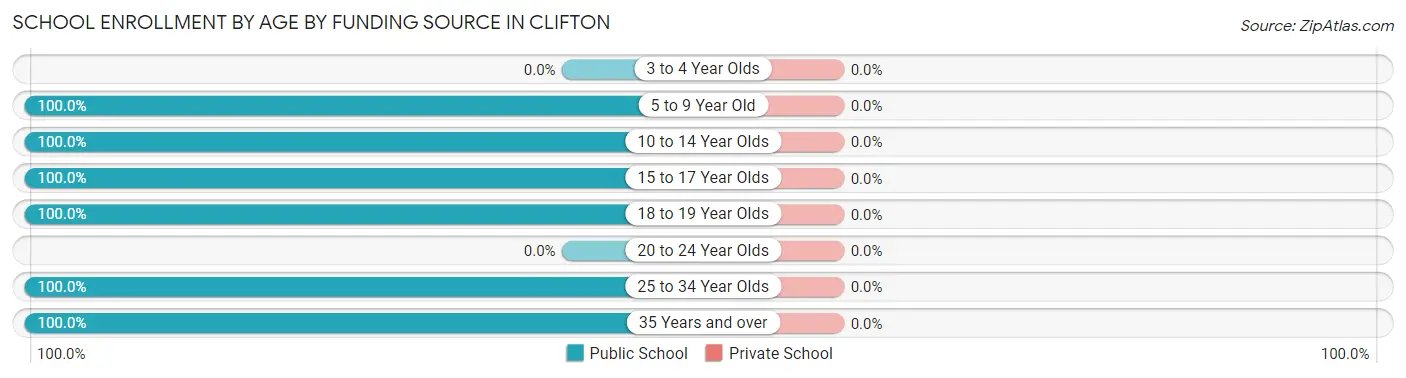
| Age Bracket | Public School | Private School |
| 3 to 4 Year Olds | 0 (0.0%) | 0 (0.0%) |
| 5 to 9 Year Old | 141 (100.0%) | 0 (0.0%) |
| 10 to 14 Year Olds | 358 (100.0%) | 0 (0.0%) |
| 15 to 17 Year Olds | 105 (100.0%) | 0 (0.0%) |
| 18 to 19 Year Olds | 86 (100.0%) | 0 (0.0%) |
| 20 to 24 Year Olds | 0 (0.0%) | 0 (0.0%) |
| 25 to 34 Year Olds | 86 (100.0%) | 0 (0.0%) |
| 35 Years and over | 79 (100.0%) | 0 (0.0%) |
| Total | 855 (100.0%) | 0 (0.0%) |
Educational Attainment by Field of Study in Clifton
Education (175 | 28.0%), science & technology (122 | 19.6%), bio, nature & agricultural (84 | 13.5%), business (55 | 8.8%), and visual & performing arts (43 | 6.9%) are the most common fields of study among 624 individuals in Clifton who have obtained a bachelor's degree or higher.
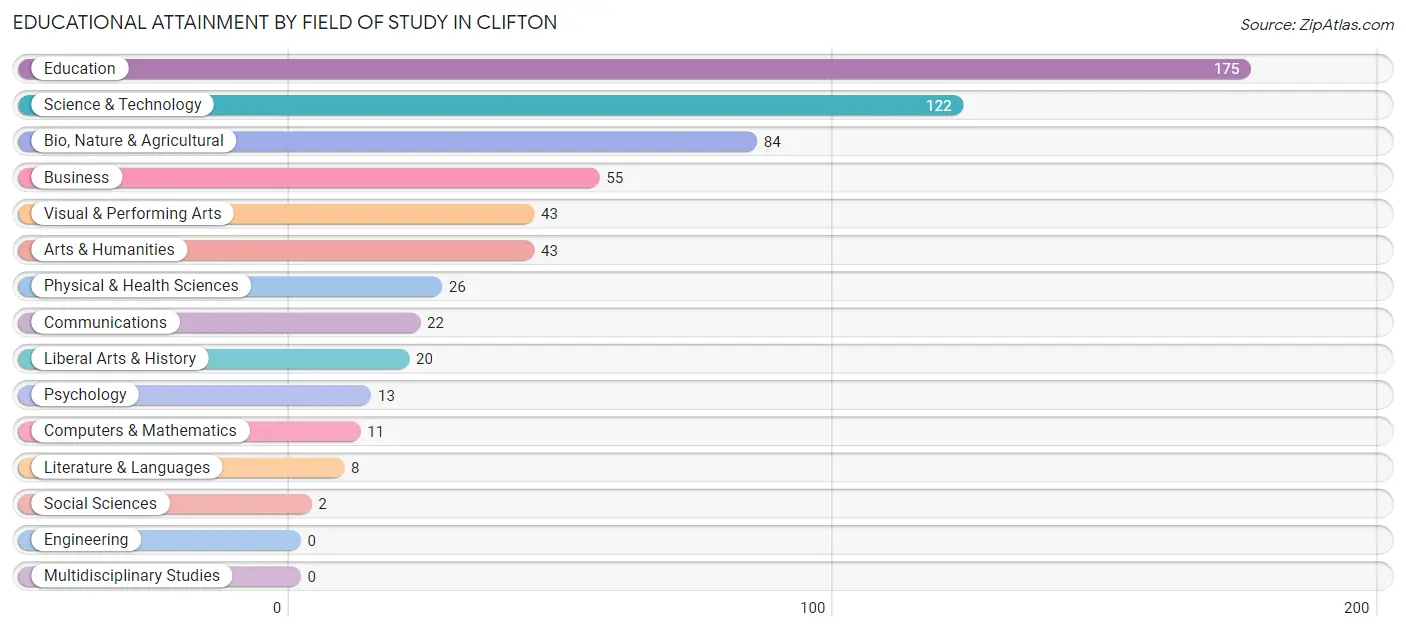
| Field of Study | # Graduates | % Graduates |
| Computers & Mathematics | 11 | 1.8% |
| Bio, Nature & Agricultural | 84 | 13.5% |
| Physical & Health Sciences | 26 | 4.2% |
| Psychology | 13 | 2.1% |
| Social Sciences | 2 | 0.3% |
| Engineering | 0 | 0.0% |
| Multidisciplinary Studies | 0 | 0.0% |
| Science & Technology | 122 | 19.6% |
| Business | 55 | 8.8% |
| Education | 175 | 28.0% |
| Literature & Languages | 8 | 1.3% |
| Liberal Arts & History | 20 | 3.2% |
| Visual & Performing Arts | 43 | 6.9% |
| Communications | 22 | 3.5% |
| Arts & Humanities | 43 | 6.9% |
| Total | 624 | 100.0% |
Transportation & Commute in Clifton
Vehicle Availability by Sex in Clifton
The most prevalent vehicle ownership categories in Clifton are males with 2 vehicles (350, accounting for 49.2%) and females with 2 vehicles (376, making up 48.5%).
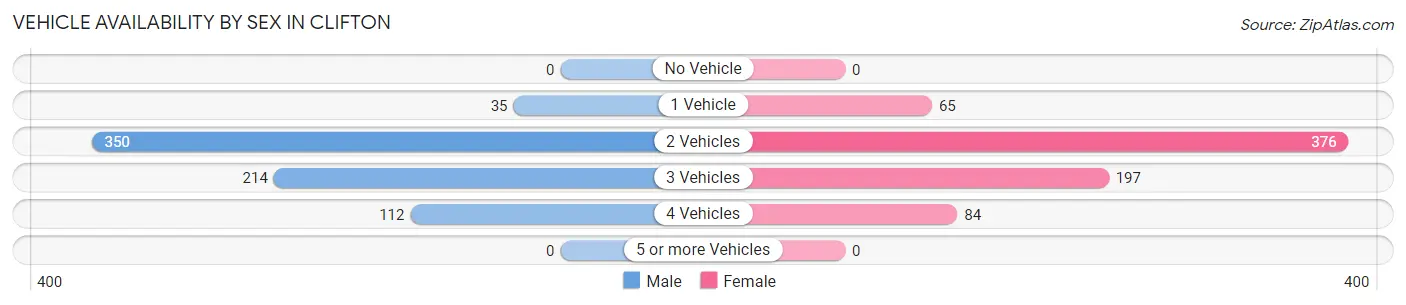
| Vehicles Available | Male | Female |
| No Vehicle | 0 (0.0%) | 0 (0.0%) |
| 1 Vehicle | 35 (4.9%) | 65 (9.0%) |
| 2 Vehicles | 350 (49.2%) | 376 (52.1%) |
| 3 Vehicles | 214 (30.1%) | 197 (27.3%) |
| 4 Vehicles | 112 (15.8%) | 84 (11.6%) |
| 5 or more Vehicles | 0 (0.0%) | 0 (0.0%) |
| Total | 711 (100.0%) | 722 (100.0%) |
Commute Time in Clifton
The most frequently occuring commute durations in Clifton are less than 5 minutes (382 commuters, 28.2%), 5 to 9 minutes (279 commuters, 20.6%), and 45 to 59 minutes (192 commuters, 14.2%).
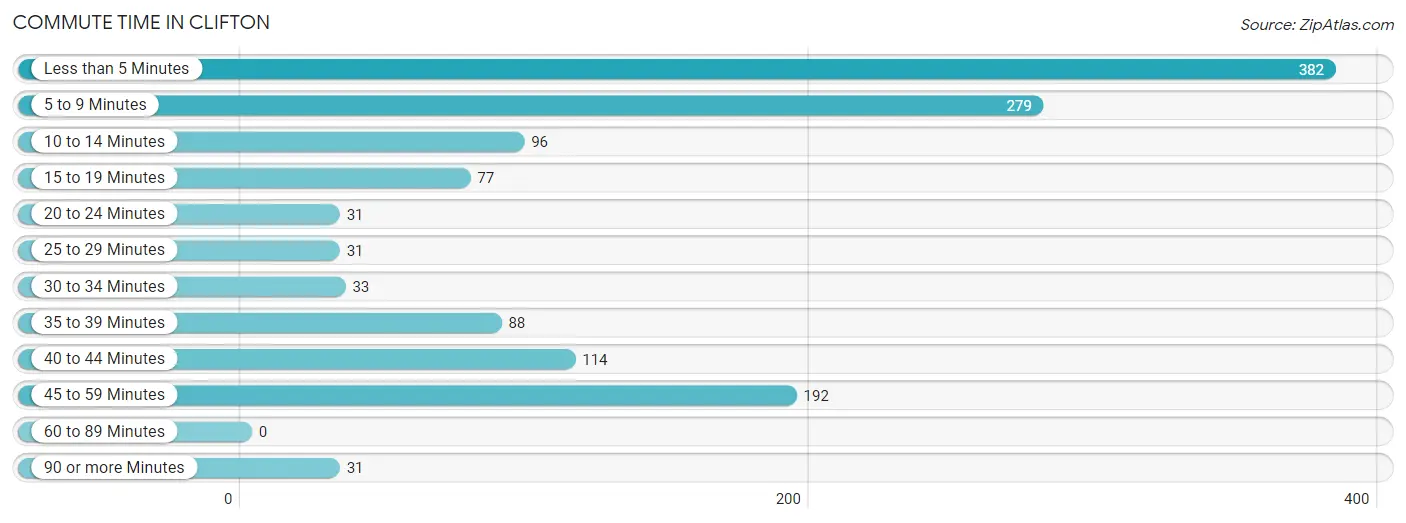
| Commute Time | # Commuters | % Commuters |
| Less than 5 Minutes | 382 | 28.2% |
| 5 to 9 Minutes | 279 | 20.6% |
| 10 to 14 Minutes | 96 | 7.1% |
| 15 to 19 Minutes | 77 | 5.7% |
| 20 to 24 Minutes | 31 | 2.3% |
| 25 to 29 Minutes | 31 | 2.3% |
| 30 to 34 Minutes | 33 | 2.4% |
| 35 to 39 Minutes | 88 | 6.5% |
| 40 to 44 Minutes | 114 | 8.4% |
| 45 to 59 Minutes | 192 | 14.2% |
| 60 to 89 Minutes | 0 | 0.0% |
| 90 or more Minutes | 31 | 2.3% |
Commute Time by Sex in Clifton
The most common commute times in Clifton are 5 to 9 minutes (141 commuters, 21.1%) for males and less than 5 minutes (274 commuters, 39.9%) for females.
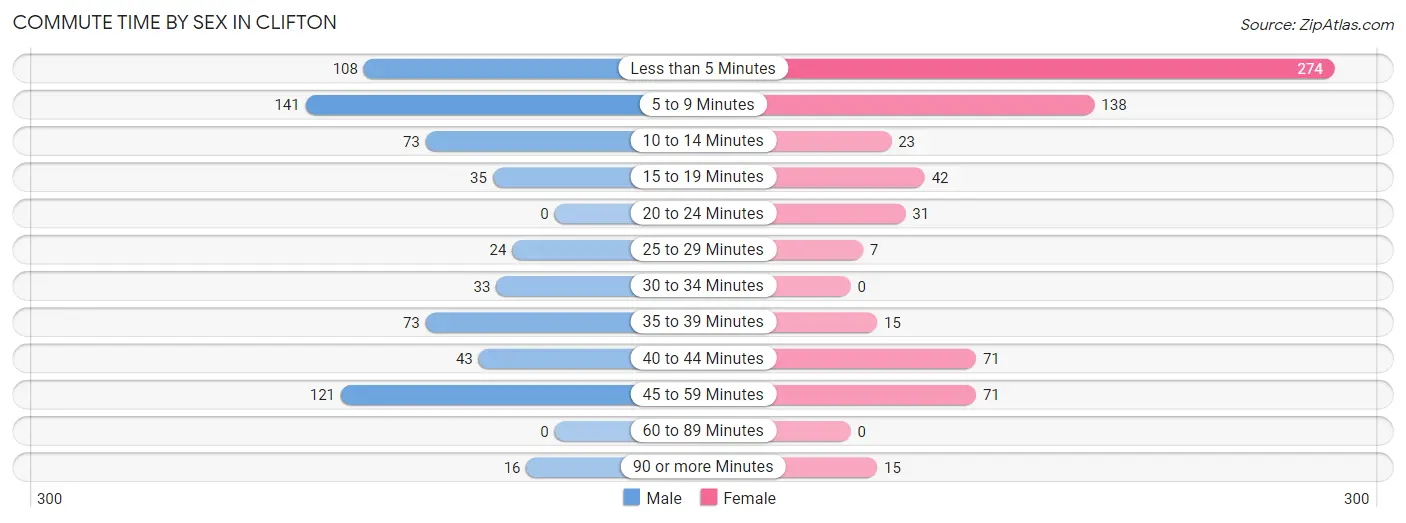
| Commute Time | Male | Female |
| Less than 5 Minutes | 108 (16.2%) | 274 (39.9%) |
| 5 to 9 Minutes | 141 (21.1%) | 138 (20.1%) |
| 10 to 14 Minutes | 73 (10.9%) | 23 (3.4%) |
| 15 to 19 Minutes | 35 (5.2%) | 42 (6.1%) |
| 20 to 24 Minutes | 0 (0.0%) | 31 (4.5%) |
| 25 to 29 Minutes | 24 (3.6%) | 7 (1.0%) |
| 30 to 34 Minutes | 33 (5.0%) | 0 (0.0%) |
| 35 to 39 Minutes | 73 (10.9%) | 15 (2.2%) |
| 40 to 44 Minutes | 43 (6.5%) | 71 (10.3%) |
| 45 to 59 Minutes | 121 (18.1%) | 71 (10.3%) |
| 60 to 89 Minutes | 0 (0.0%) | 0 (0.0%) |
| 90 or more Minutes | 16 (2.4%) | 15 (2.2%) |
Time of Departure to Work by Sex in Clifton
The most frequent times of departure to work in Clifton are 6:00 AM to 6:29 AM (162, 24.3%) for males and 7:00 AM to 7:29 AM (349, 50.8%) for females.
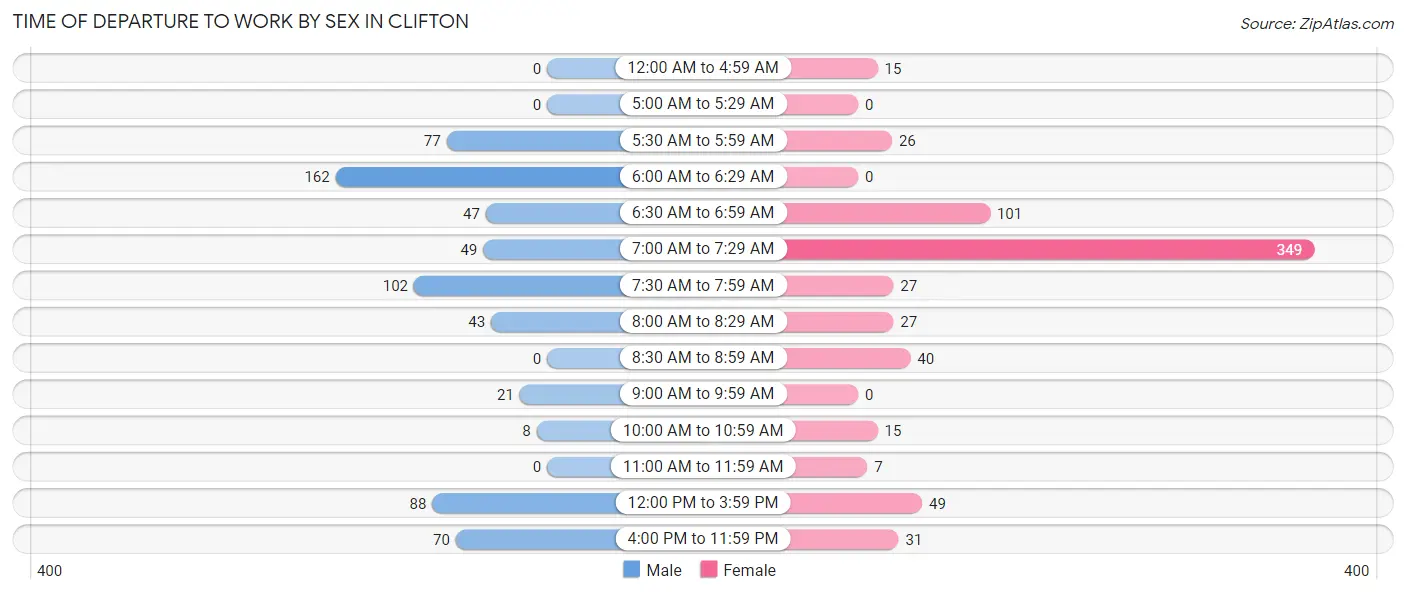
| Time of Departure | Male | Female |
| 12:00 AM to 4:59 AM | 0 (0.0%) | 15 (2.2%) |
| 5:00 AM to 5:29 AM | 0 (0.0%) | 0 (0.0%) |
| 5:30 AM to 5:59 AM | 77 (11.5%) | 26 (3.8%) |
| 6:00 AM to 6:29 AM | 162 (24.3%) | 0 (0.0%) |
| 6:30 AM to 6:59 AM | 47 (7.0%) | 101 (14.7%) |
| 7:00 AM to 7:29 AM | 49 (7.3%) | 349 (50.8%) |
| 7:30 AM to 7:59 AM | 102 (15.3%) | 27 (3.9%) |
| 8:00 AM to 8:29 AM | 43 (6.5%) | 27 (3.9%) |
| 8:30 AM to 8:59 AM | 0 (0.0%) | 40 (5.8%) |
| 9:00 AM to 9:59 AM | 21 (3.2%) | 0 (0.0%) |
| 10:00 AM to 10:59 AM | 8 (1.2%) | 15 (2.2%) |
| 11:00 AM to 11:59 AM | 0 (0.0%) | 7 (1.0%) |
| 12:00 PM to 3:59 PM | 88 (13.2%) | 49 (7.1%) |
| 4:00 PM to 11:59 PM | 70 (10.5%) | 31 (4.5%) |
| Total | 667 (100.0%) | 687 (100.0%) |
Housing Occupancy in Clifton
Occupancy by Ownership in Clifton
Of the total 1,346 dwellings in Clifton, owner-occupied units account for 901 (66.9%), while renter-occupied units make up 445 (33.1%).
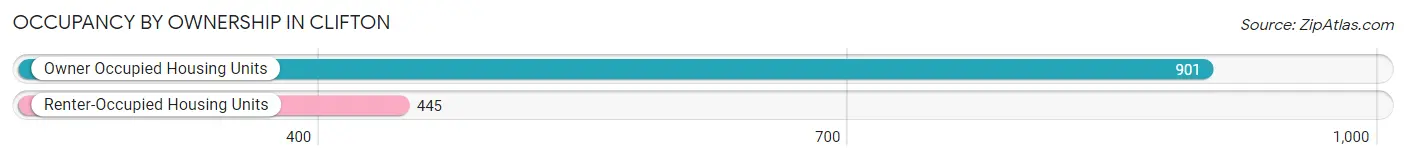
| Occupancy | # Housing Units | % Housing Units |
| Owner Occupied Housing Units | 901 | 66.9% |
| Renter-Occupied Housing Units | 445 | 33.1% |
| Total Occupied Housing Units | 1,346 | 100.0% |
Occupancy by Household Size in Clifton
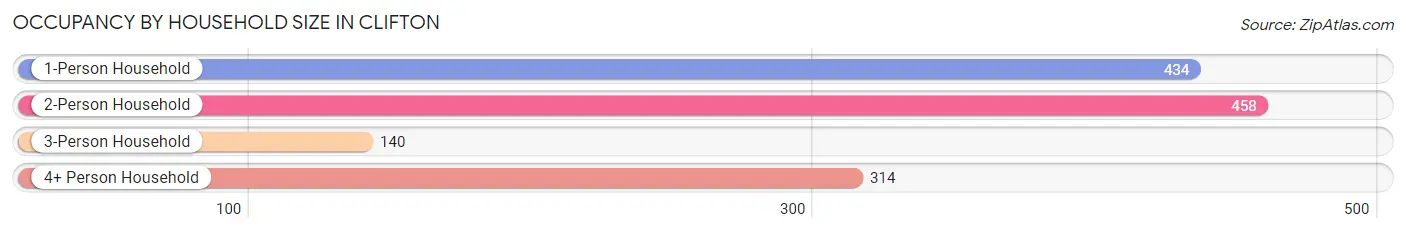
| Household Size | # Housing Units | % Housing Units |
| 1-Person Household | 434 | 32.2% |
| 2-Person Household | 458 | 34.0% |
| 3-Person Household | 140 | 10.4% |
| 4+ Person Household | 314 | 23.3% |
| Total Housing Units | 1,346 | 100.0% |
Occupancy by Ownership by Household Size in Clifton
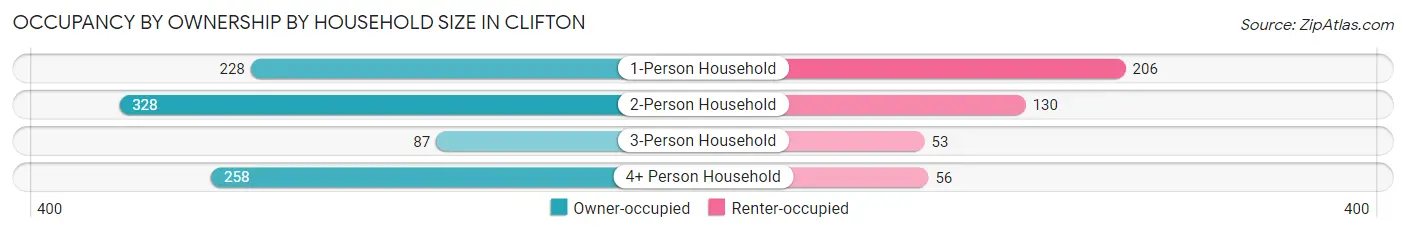
| Household Size | Owner-occupied | Renter-occupied |
| 1-Person Household | 228 (52.5%) | 206 (47.5%) |
| 2-Person Household | 328 (71.6%) | 130 (28.4%) |
| 3-Person Household | 87 (62.1%) | 53 (37.9%) |
| 4+ Person Household | 258 (82.2%) | 56 (17.8%) |
| Total Housing Units | 901 (66.9%) | 445 (33.1%) |
Occupancy by Educational Attainment in Clifton
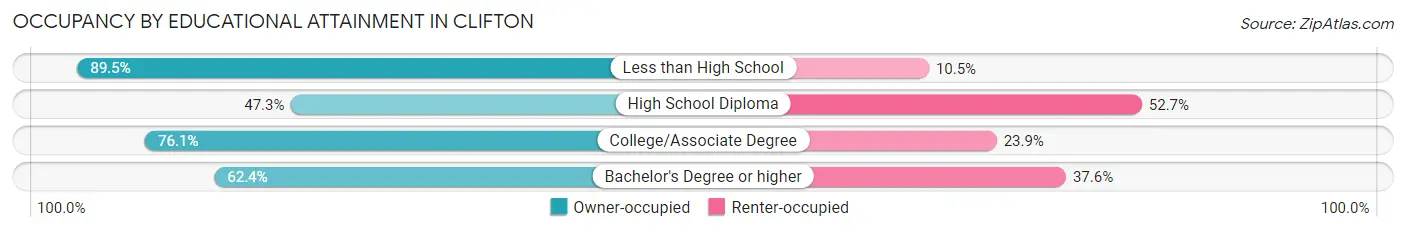
| Household Size | Owner-occupied | Renter-occupied |
| Less than High School | 214 (89.5%) | 25 (10.5%) |
| High School Diploma | 168 (47.3%) | 187 (52.7%) |
| College/Associate Degree | 277 (76.1%) | 87 (23.9%) |
| Bachelor's Degree or higher | 242 (62.4%) | 146 (37.6%) |
Occupancy by Age of Householder in Clifton
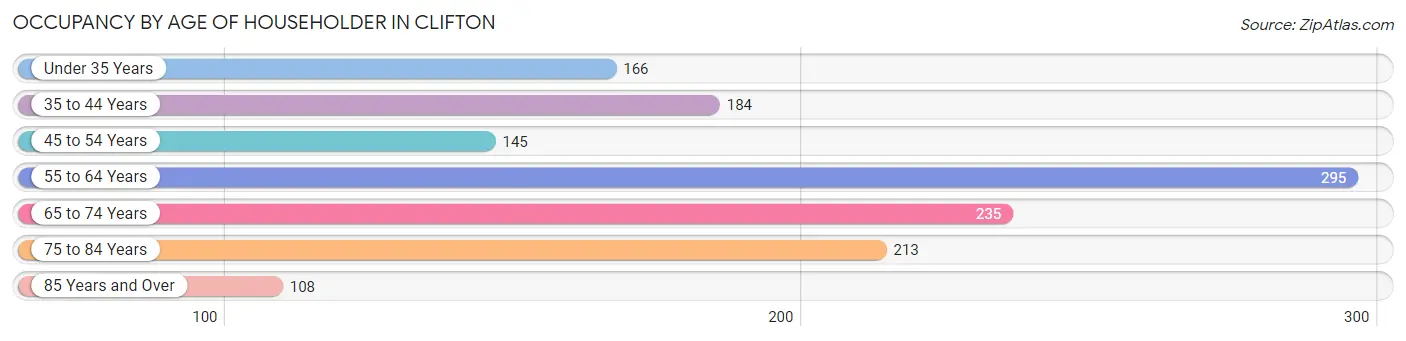
| Age Bracket | # Households | % Households |
| Under 35 Years | 166 | 12.3% |
| 35 to 44 Years | 184 | 13.7% |
| 45 to 54 Years | 145 | 10.8% |
| 55 to 64 Years | 295 | 21.9% |
| 65 to 74 Years | 235 | 17.5% |
| 75 to 84 Years | 213 | 15.8% |
| 85 Years and Over | 108 | 8.0% |
| Total | 1,346 | 100.0% |
Housing Finances in Clifton
Median Income by Occupancy in Clifton
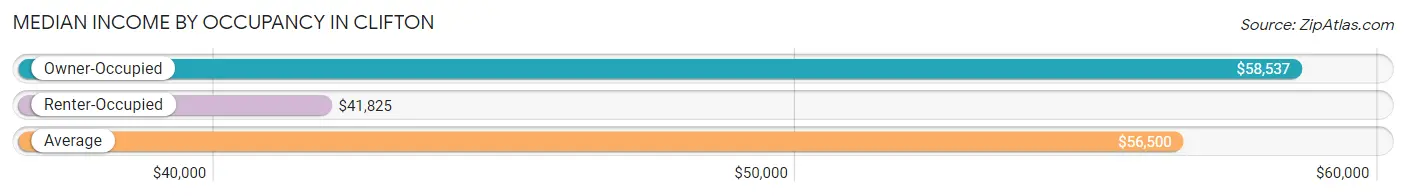
| Occupancy Type | # Households | Median Income |
| Owner-Occupied | 901 (66.9%) | $58,537 |
| Renter-Occupied | 445 (33.1%) | $41,825 |
| Average | 1,346 (100.0%) | $56,500 |
Occupancy by Householder Income Bracket in Clifton
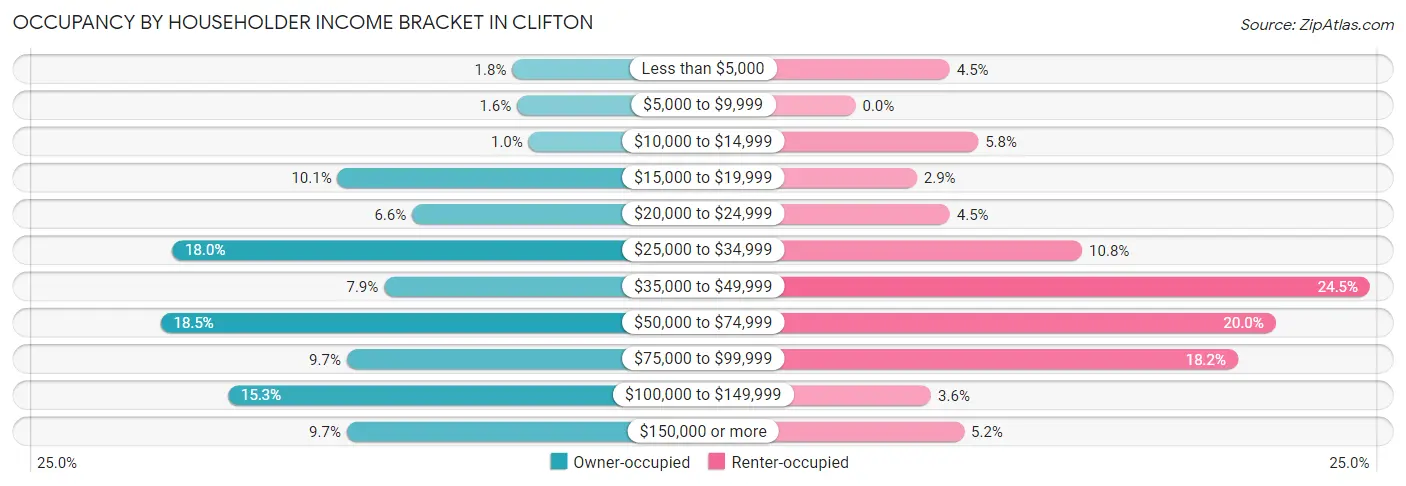
| Income Bracket | Owner-occupied | Renter-occupied |
| Less than $5,000 | 16 (1.8%) | 20 (4.5%) |
| $5,000 to $9,999 | 14 (1.5%) | 0 (0.0%) |
| $10,000 to $14,999 | 9 (1.0%) | 26 (5.8%) |
| $15,000 to $19,999 | 91 (10.1%) | 13 (2.9%) |
| $20,000 to $24,999 | 59 (6.6%) | 20 (4.5%) |
| $25,000 to $34,999 | 162 (18.0%) | 48 (10.8%) |
| $35,000 to $49,999 | 71 (7.9%) | 109 (24.5%) |
| $50,000 to $74,999 | 167 (18.5%) | 89 (20.0%) |
| $75,000 to $99,999 | 87 (9.7%) | 81 (18.2%) |
| $100,000 to $149,999 | 138 (15.3%) | 16 (3.6%) |
| $150,000 or more | 87 (9.7%) | 23 (5.2%) |
| Total | 901 (100.0%) | 445 (100.0%) |
Monthly Housing Cost Tiers in Clifton
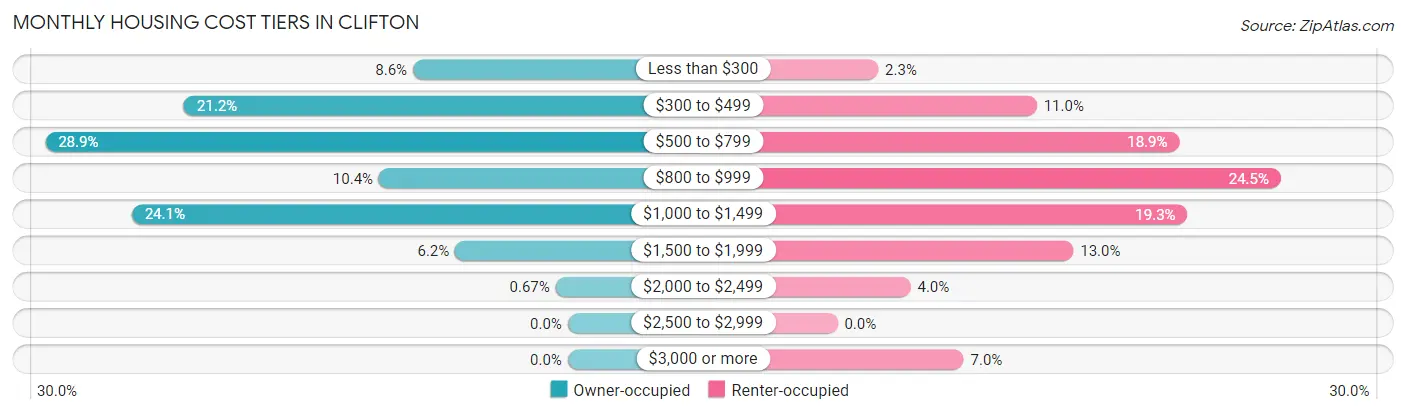
| Monthly Cost | Owner-occupied | Renter-occupied |
| Less than $300 | 77 (8.6%) | 10 (2.2%) |
| $300 to $499 | 191 (21.2%) | 49 (11.0%) |
| $500 to $799 | 260 (28.9%) | 84 (18.9%) |
| $800 to $999 | 94 (10.4%) | 109 (24.5%) |
| $1,000 to $1,499 | 217 (24.1%) | 86 (19.3%) |
| $1,500 to $1,999 | 56 (6.2%) | 58 (13.0%) |
| $2,000 to $2,499 | 6 (0.7%) | 18 (4.0%) |
| $2,500 to $2,999 | 0 (0.0%) | 0 (0.0%) |
| $3,000 or more | 0 (0.0%) | 31 (7.0%) |
| Total | 901 (100.0%) | 445 (100.0%) |
Physical Housing Characteristics in Clifton
Housing Structures in Clifton
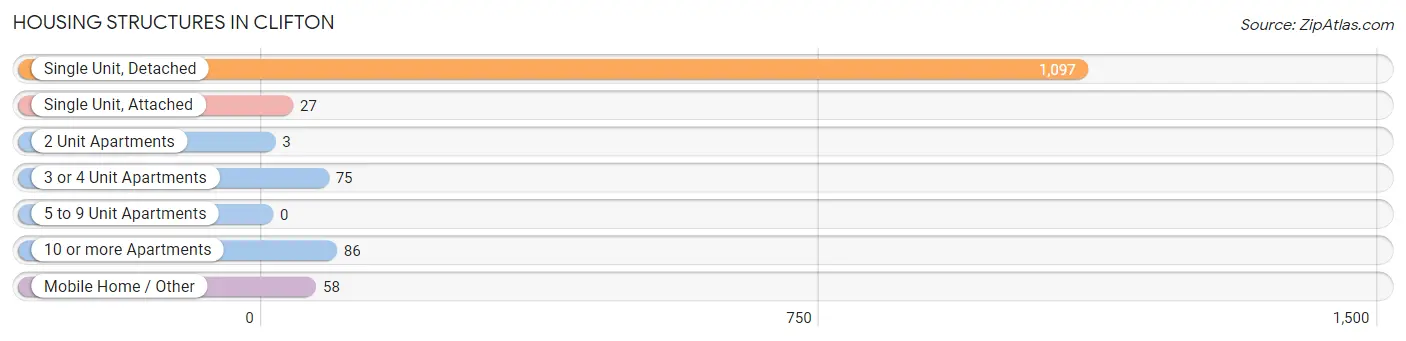
| Structure Type | # Housing Units | % Housing Units |
| Single Unit, Detached | 1,097 | 81.5% |
| Single Unit, Attached | 27 | 2.0% |
| 2 Unit Apartments | 3 | 0.2% |
| 3 or 4 Unit Apartments | 75 | 5.6% |
| 5 to 9 Unit Apartments | 0 | 0.0% |
| 10 or more Apartments | 86 | 6.4% |
| Mobile Home / Other | 58 | 4.3% |
| Total | 1,346 | 100.0% |
Housing Structures by Occupancy in Clifton
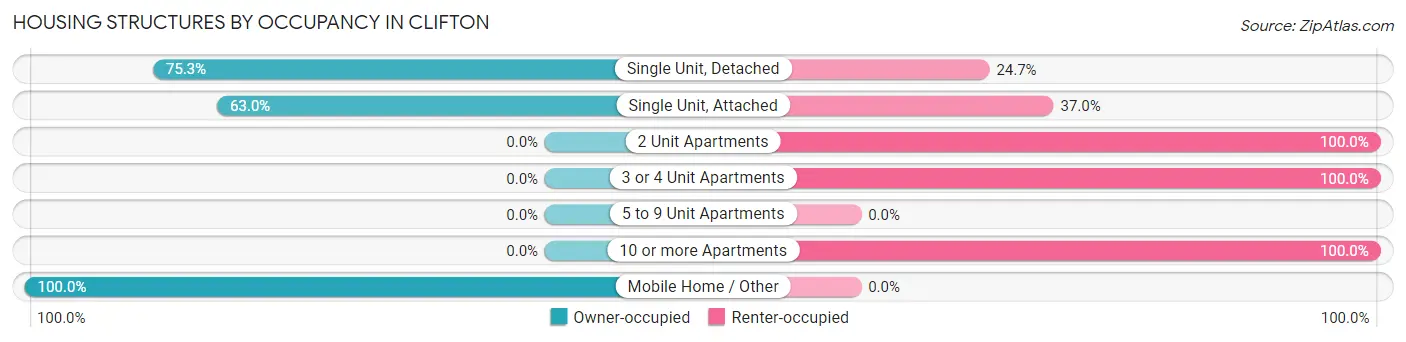
| Structure Type | Owner-occupied | Renter-occupied |
| Single Unit, Detached | 826 (75.3%) | 271 (24.7%) |
| Single Unit, Attached | 17 (63.0%) | 10 (37.0%) |
| 2 Unit Apartments | 0 (0.0%) | 3 (100.0%) |
| 3 or 4 Unit Apartments | 0 (0.0%) | 75 (100.0%) |
| 5 to 9 Unit Apartments | 0 (0.0%) | 0 (0.0%) |
| 10 or more Apartments | 0 (0.0%) | 86 (100.0%) |
| Mobile Home / Other | 58 (100.0%) | 0 (0.0%) |
| Total | 901 (66.9%) | 445 (33.1%) |
Housing Structures by Number of Rooms in Clifton
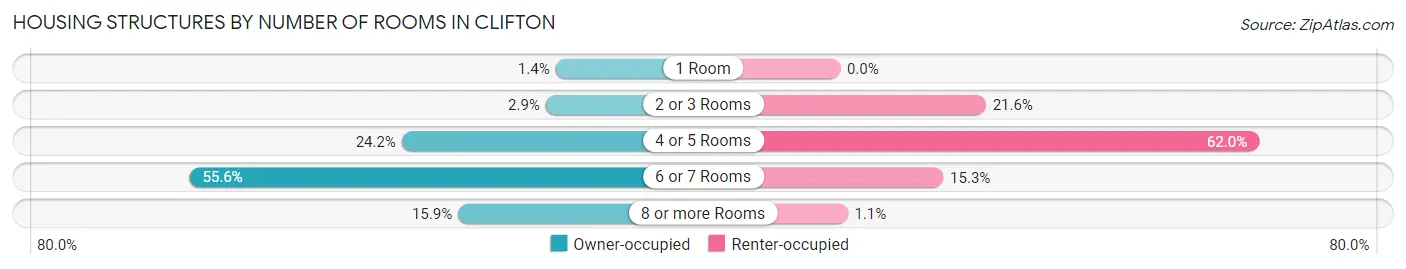
| Number of Rooms | Owner-occupied | Renter-occupied |
| 1 Room | 13 (1.4%) | 0 (0.0%) |
| 2 or 3 Rooms | 26 (2.9%) | 96 (21.6%) |
| 4 or 5 Rooms | 218 (24.2%) | 276 (62.0%) |
| 6 or 7 Rooms | 501 (55.6%) | 68 (15.3%) |
| 8 or more Rooms | 143 (15.9%) | 5 (1.1%) |
| Total | 901 (100.0%) | 445 (100.0%) |
Housing Structure by Heating Type in Clifton
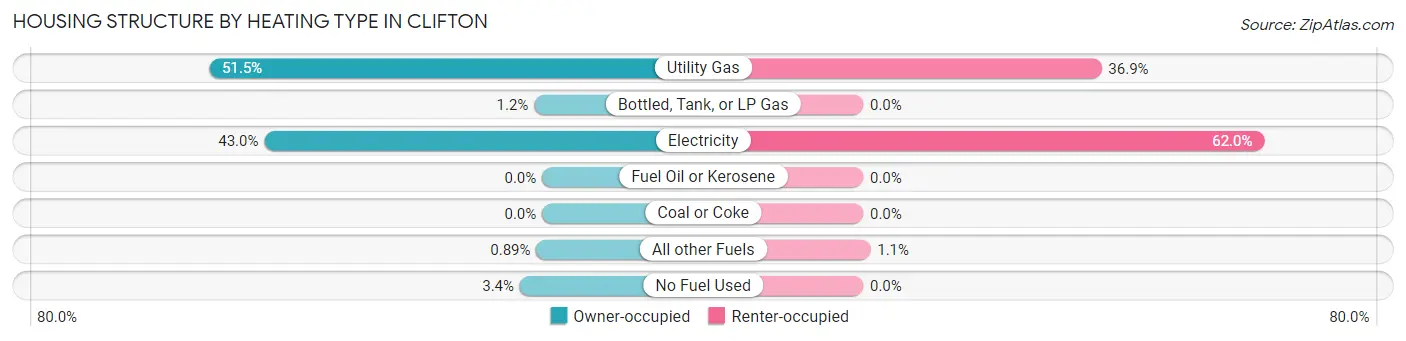
| Heating Type | Owner-occupied | Renter-occupied |
| Utility Gas | 464 (51.5%) | 164 (36.8%) |
| Bottled, Tank, or LP Gas | 11 (1.2%) | 0 (0.0%) |
| Electricity | 387 (42.9%) | 276 (62.0%) |
| Fuel Oil or Kerosene | 0 (0.0%) | 0 (0.0%) |
| Coal or Coke | 0 (0.0%) | 0 (0.0%) |
| All other Fuels | 8 (0.9%) | 5 (1.1%) |
| No Fuel Used | 31 (3.4%) | 0 (0.0%) |
| Total | 901 (100.0%) | 445 (100.0%) |
Household Vehicle Usage in Clifton
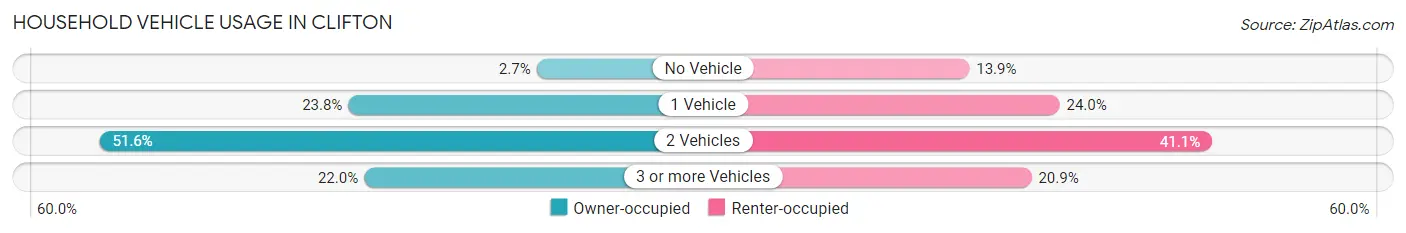
| Vehicles per Household | Owner-occupied | Renter-occupied |
| No Vehicle | 24 (2.7%) | 62 (13.9%) |
| 1 Vehicle | 214 (23.7%) | 107 (24.0%) |
| 2 Vehicles | 465 (51.6%) | 183 (41.1%) |
| 3 or more Vehicles | 198 (22.0%) | 93 (20.9%) |
| Total | 901 (100.0%) | 445 (100.0%) |
Real Estate & Mortgages in Clifton
Real Estate and Mortgage Overview in Clifton
| Characteristic | Without Mortgage | With Mortgage |
| Housing Units | 572 | 329 |
| Median Property Value | $98,100 | $134,700 |
| Median Household Income | $49,531 | $40 |
| Monthly Housing Costs | $525 | $0 |
| Real Estate Taxes | $1,605 | $0 |
Property Value by Mortgage Status in Clifton
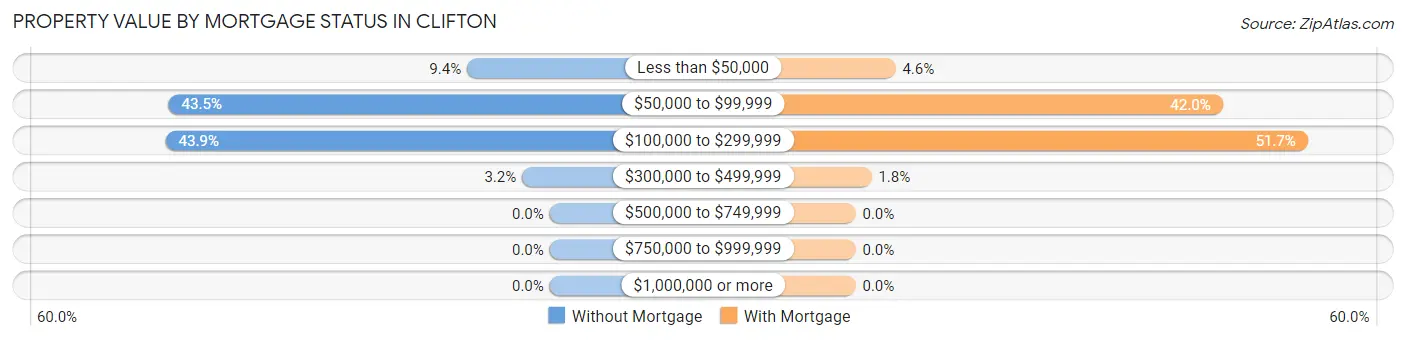
| Property Value | Without Mortgage | With Mortgage |
| Less than $50,000 | 54 (9.4%) | 15 (4.6%) |
| $50,000 to $99,999 | 249 (43.5%) | 138 (41.9%) |
| $100,000 to $299,999 | 251 (43.9%) | 170 (51.7%) |
| $300,000 to $499,999 | 18 (3.2%) | 6 (1.8%) |
| $500,000 to $749,999 | 0 (0.0%) | 0 (0.0%) |
| $750,000 to $999,999 | 0 (0.0%) | 0 (0.0%) |
| $1,000,000 or more | 0 (0.0%) | 0 (0.0%) |
| Total | 572 (100.0%) | 329 (100.0%) |
Household Income by Mortgage Status in Clifton
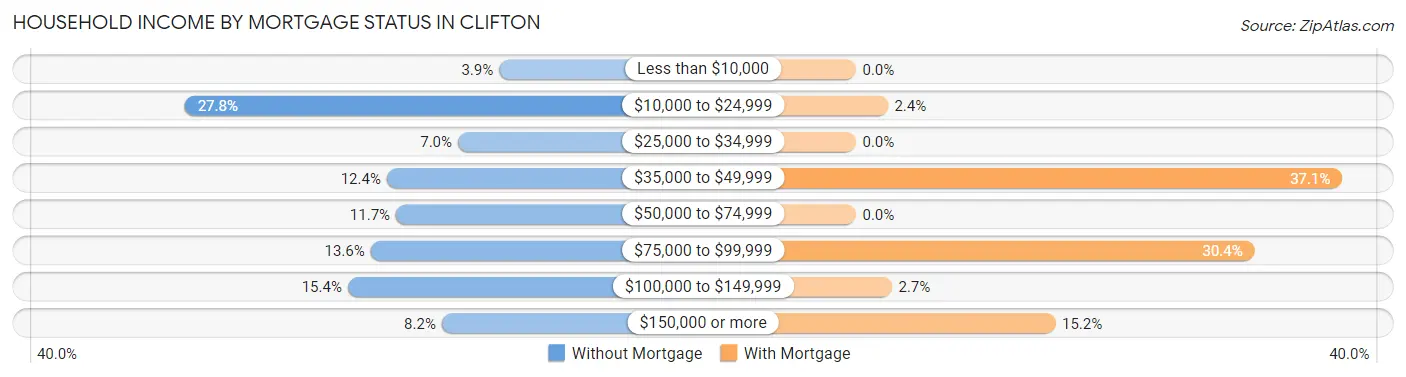
| Household Income | Without Mortgage | With Mortgage |
| Less than $10,000 | 22 (3.8%) | 0 (0.0%) |
| $10,000 to $24,999 | 159 (27.8%) | 8 (2.4%) |
| $25,000 to $34,999 | 40 (7.0%) | 0 (0.0%) |
| $35,000 to $49,999 | 71 (12.4%) | 122 (37.1%) |
| $50,000 to $74,999 | 67 (11.7%) | 0 (0.0%) |
| $75,000 to $99,999 | 78 (13.6%) | 100 (30.4%) |
| $100,000 to $149,999 | 88 (15.4%) | 9 (2.7%) |
| $150,000 or more | 47 (8.2%) | 50 (15.2%) |
| Total | 572 (100.0%) | 329 (100.0%) |
Property Value to Household Income Ratio in Clifton
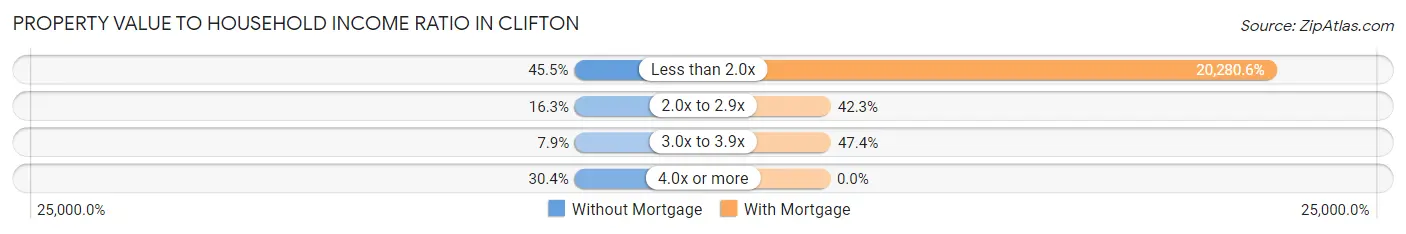
| Value-to-Income Ratio | Without Mortgage | With Mortgage |
| Less than 2.0x | 260 (45.5%) | 66,723 (20,280.5%) |
| 2.0x to 2.9x | 93 (16.3%) | 139 (42.2%) |
| 3.0x to 3.9x | 45 (7.9%) | 156 (47.4%) |
| 4.0x or more | 174 (30.4%) | 0 (0.0%) |
| Total | 572 (100.0%) | 329 (100.0%) |
Real Estate Taxes by Mortgage Status in Clifton
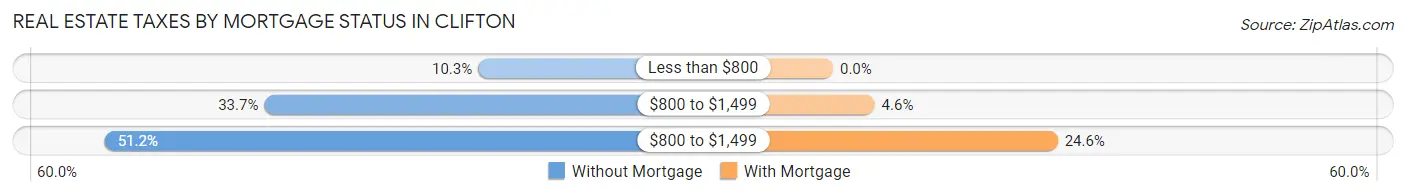
| Property Taxes | Without Mortgage | With Mortgage |
| Less than $800 | 59 (10.3%) | 0 (0.0%) |
| $800 to $1,499 | 193 (33.7%) | 15 (4.6%) |
| $800 to $1,499 | 293 (51.2%) | 81 (24.6%) |
| Total | 572 (100.0%) | 329 (100.0%) |
Health & Disability in Clifton
Health Insurance Coverage by Age in Clifton
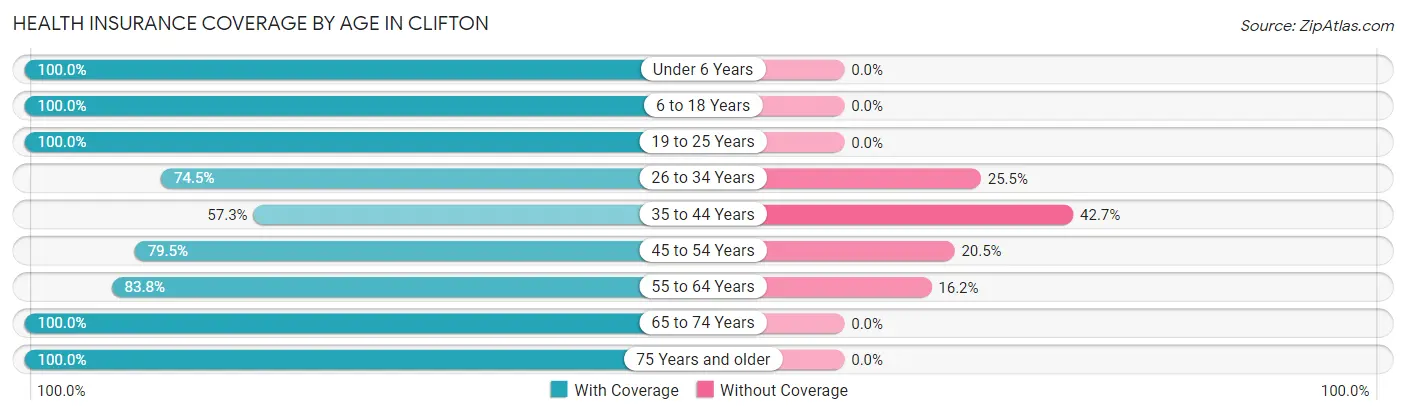
| Age Bracket | With Coverage | Without Coverage |
| Under 6 Years | 41 (100.0%) | 0 (0.0%) |
| 6 to 18 Years | 705 (100.0%) | 0 (0.0%) |
| 19 to 25 Years | 104 (100.0%) | 0 (0.0%) |
| 26 to 34 Years | 281 (74.5%) | 96 (25.5%) |
| 35 to 44 Years | 223 (57.3%) | 166 (42.7%) |
| 45 to 54 Years | 294 (79.5%) | 76 (20.5%) |
| 55 to 64 Years | 397 (83.8%) | 77 (16.2%) |
| 65 to 74 Years | 383 (100.0%) | 0 (0.0%) |
| 75 Years and older | 396 (100.0%) | 0 (0.0%) |
| Total | 2,824 (87.2%) | 415 (12.8%) |
Health Insurance Coverage by Citizenship Status in Clifton
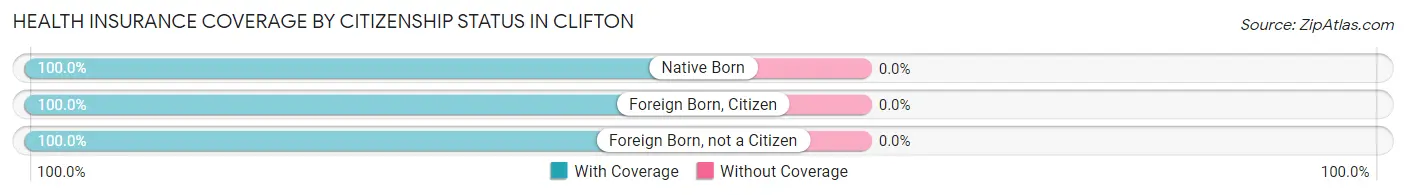
| Citizenship Status | With Coverage | Without Coverage |
| Native Born | 41 (100.0%) | 0 (0.0%) |
| Foreign Born, Citizen | 705 (100.0%) | 0 (0.0%) |
| Foreign Born, not a Citizen | 104 (100.0%) | 0 (0.0%) |
Health Insurance Coverage by Household Income in Clifton
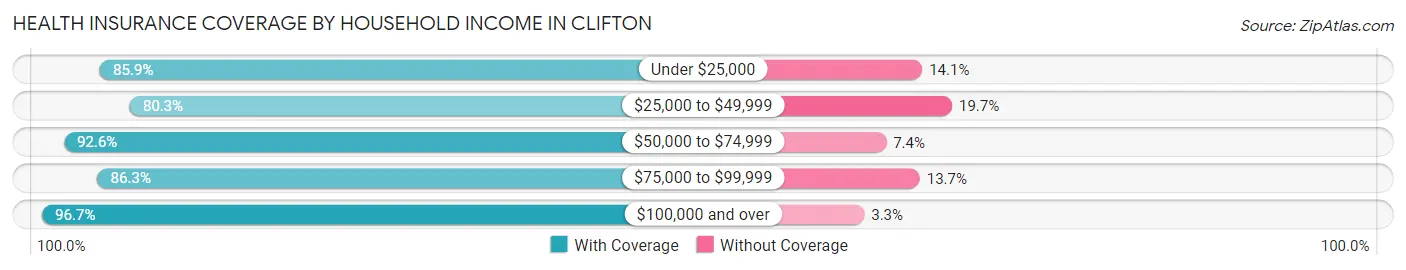
| Household Income | With Coverage | Without Coverage |
| Under $25,000 | 322 (85.9%) | 53 (14.1%) |
| $25,000 to $49,999 | 973 (80.3%) | 239 (19.7%) |
| $50,000 to $74,999 | 615 (92.6%) | 49 (7.4%) |
| $75,000 to $99,999 | 347 (86.3%) | 55 (13.7%) |
| $100,000 and over | 561 (96.7%) | 19 (3.3%) |
Public vs Private Health Insurance Coverage by Age in Clifton
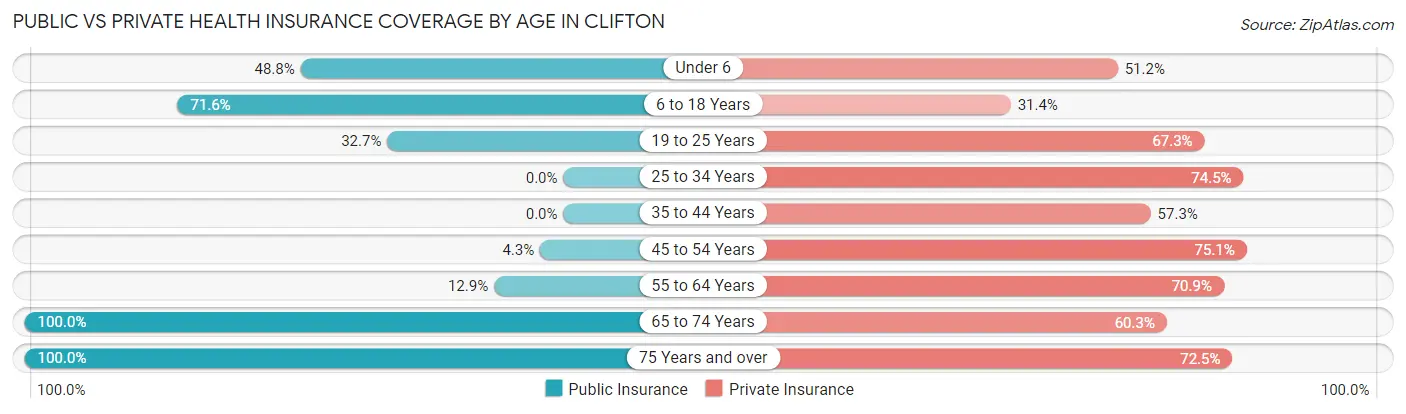
| Age Bracket | Public Insurance | Private Insurance |
| Under 6 | 20 (48.8%) | 21 (51.2%) |
| 6 to 18 Years | 505 (71.6%) | 221 (31.4%) |
| 19 to 25 Years | 34 (32.7%) | 70 (67.3%) |
| 25 to 34 Years | 0 (0.0%) | 281 (74.5%) |
| 35 to 44 Years | 0 (0.0%) | 223 (57.3%) |
| 45 to 54 Years | 16 (4.3%) | 278 (75.1%) |
| 55 to 64 Years | 61 (12.9%) | 336 (70.9%) |
| 65 to 74 Years | 383 (100.0%) | 231 (60.3%) |
| 75 Years and over | 396 (100.0%) | 287 (72.5%) |
| Total | 1,415 (43.7%) | 1,948 (60.1%) |
Disability Status by Sex by Age in Clifton
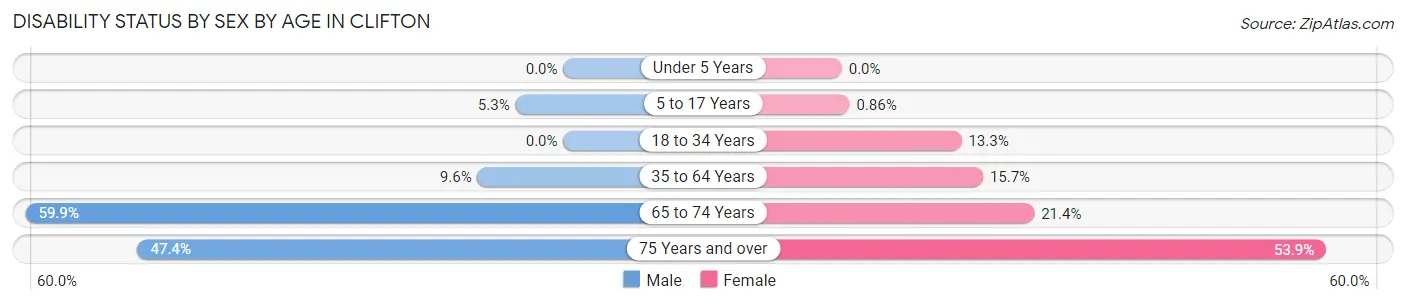
| Age Bracket | Male | Female |
| Under 5 Years | 0 (0.0%) | 0 (0.0%) |
| 5 to 17 Years | 21 (5.3%) | 2 (0.9%) |
| 18 to 34 Years | 0 (0.0%) | 32 (13.3%) |
| 35 to 64 Years | 54 (9.6%) | 105 (15.7%) |
| 65 to 74 Years | 112 (59.9%) | 42 (21.4%) |
| 75 Years and over | 55 (47.4%) | 151 (53.9%) |
Disability Class by Sex by Age in Clifton
Disability Class: Hearing Difficulty
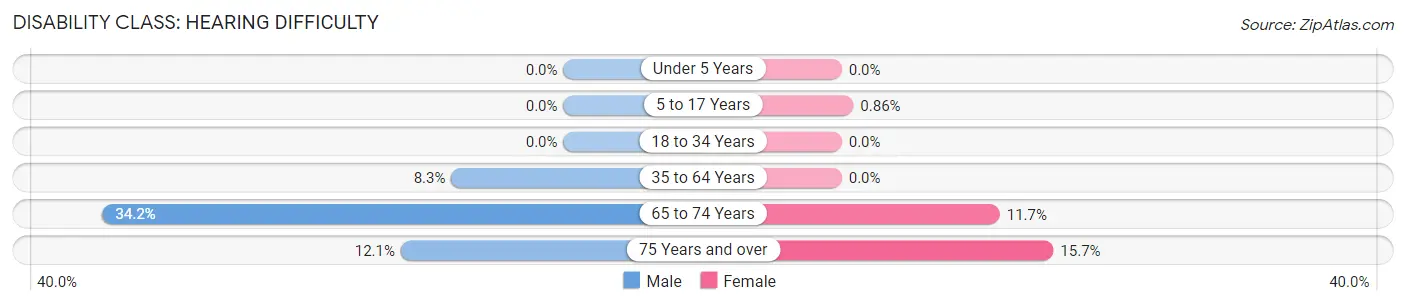
| Age Bracket | Male | Female |
| Under 5 Years | 0 (0.0%) | 0 (0.0%) |
| 5 to 17 Years | 0 (0.0%) | 2 (0.9%) |
| 18 to 34 Years | 0 (0.0%) | 0 (0.0%) |
| 35 to 64 Years | 47 (8.3%) | 0 (0.0%) |
| 65 to 74 Years | 64 (34.2%) | 23 (11.7%) |
| 75 Years and over | 14 (12.1%) | 44 (15.7%) |
Disability Class: Vision Difficulty
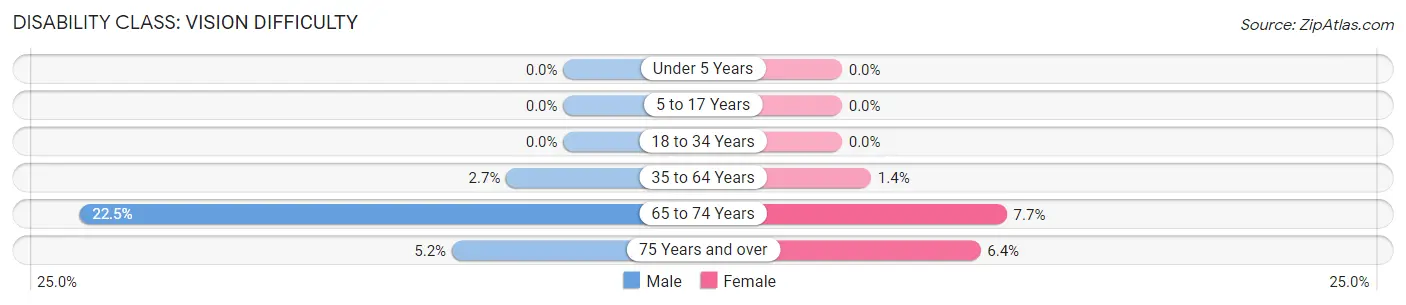
| Age Bracket | Male | Female |
| Under 5 Years | 0 (0.0%) | 0 (0.0%) |
| 5 to 17 Years | 0 (0.0%) | 0 (0.0%) |
| 18 to 34 Years | 0 (0.0%) | 0 (0.0%) |
| 35 to 64 Years | 15 (2.6%) | 9 (1.3%) |
| 65 to 74 Years | 42 (22.5%) | 15 (7.6%) |
| 75 Years and over | 6 (5.2%) | 18 (6.4%) |
Disability Class: Cognitive Difficulty
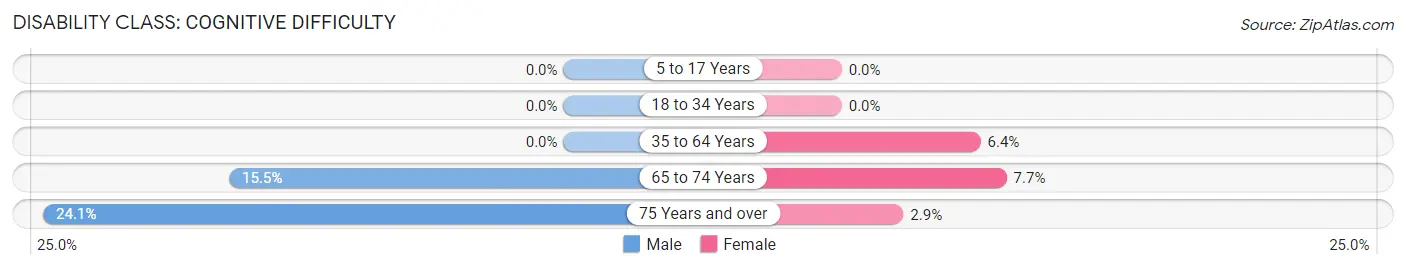
| Age Bracket | Male | Female |
| 5 to 17 Years | 0 (0.0%) | 0 (0.0%) |
| 18 to 34 Years | 0 (0.0%) | 0 (0.0%) |
| 35 to 64 Years | 0 (0.0%) | 43 (6.4%) |
| 65 to 74 Years | 29 (15.5%) | 15 (7.6%) |
| 75 Years and over | 28 (24.1%) | 8 (2.9%) |
Disability Class: Ambulatory Difficulty
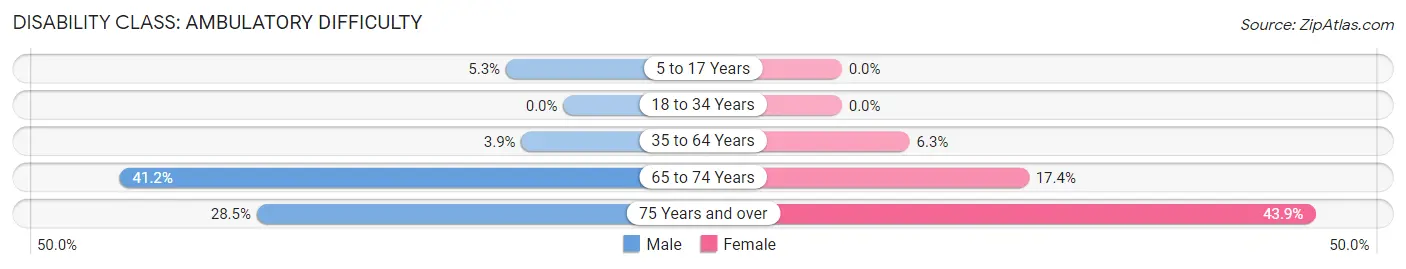
| Age Bracket | Male | Female |
| 5 to 17 Years | 21 (5.3%) | 0 (0.0%) |
| 18 to 34 Years | 0 (0.0%) | 0 (0.0%) |
| 35 to 64 Years | 22 (3.9%) | 42 (6.3%) |
| 65 to 74 Years | 77 (41.2%) | 34 (17.3%) |
| 75 Years and over | 33 (28.4%) | 123 (43.9%) |
Disability Class: Self-Care Difficulty
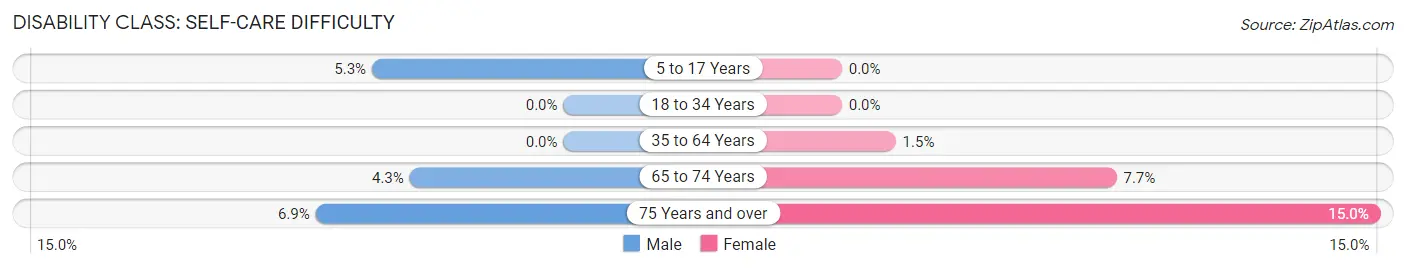
| Age Bracket | Male | Female |
| 5 to 17 Years | 21 (5.3%) | 0 (0.0%) |
| 18 to 34 Years | 0 (0.0%) | 0 (0.0%) |
| 35 to 64 Years | 0 (0.0%) | 10 (1.5%) |
| 65 to 74 Years | 8 (4.3%) | 15 (7.6%) |
| 75 Years and over | 8 (6.9%) | 42 (15.0%) |
Technology Access in Clifton
Computing Device Access in Clifton
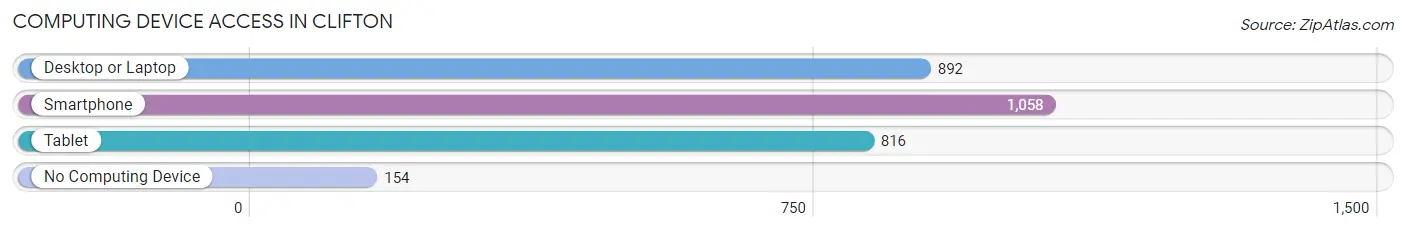
| Device Type | # Households | % Households |
| Desktop or Laptop | 892 | 66.3% |
| Smartphone | 1,058 | 78.6% |
| Tablet | 816 | 60.6% |
| No Computing Device | 154 | 11.4% |
| Total | 1,346 | 100.0% |
Internet Access in Clifton
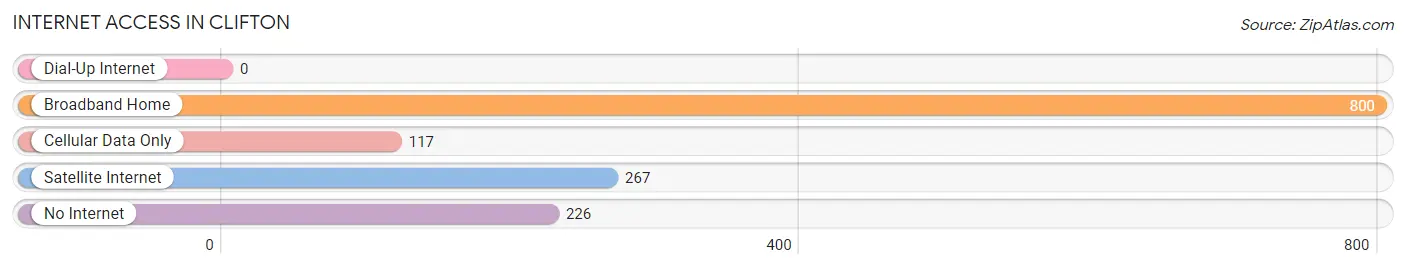
| Internet Type | # Households | % Households |
| Dial-Up Internet | 0 | 0.0% |
| Broadband Home | 800 | 59.4% |
| Cellular Data Only | 117 | 8.7% |
| Satellite Internet | 267 | 19.8% |
| No Internet | 226 | 16.8% |
| Total | 1,346 | 100.0% |
Clifton Summary
Clifton, Texas is a small town located in Bosque County, Texas, United States. It is situated on the banks of the Brazos River, about 50 miles south of Waco. The population was 1,619 at the 2010 census.
History
Clifton was founded in 1854 by a group of settlers from Kentucky and Tennessee. The town was named after Clifton, Tennessee, the hometown of one of the settlers. The town was incorporated in 1876 and was the county seat of Bosque County until 1890, when the county seat was moved to Meridian.
Clifton was an important stop on the Chisholm Trail, which was used by cowboys to drive cattle from Texas to Kansas. The town was also a major shipping point for cotton and other agricultural products.
Geography
Clifton is located at 31°45'25" North, 97°25'45" West (31.756944, -97.429167). According to the United States Census Bureau, the town has a total area of 1.2 square miles (3.1 km2), all of it land.
Economy
The economy of Clifton is largely based on agriculture. The town is home to several farms and ranches, as well as a number of small businesses. The town is also home to a number of manufacturing companies, including a furniture factory and a plastics plant.
Demographics
As of the census of 2000, there were 1,619 people, 645 households, and 441 families residing in the town. The population density was 1,346.2 people per square mile (519.3/km2). There were 717 housing units at an average density of 590.2 per square mile (227.7/km2). The racial makeup of the town was 81.45% White, 0.37% African American, 0.31% Native American, 0.12% Asian, 15.90% from other races, and 1.85% from two or more races. Hispanic or Latino of any race were 28.45% of the population.
There were 645 households, out of which 32.2% had children under the age of 18 living with them, 51.7% were married couples living together, 11.7% had a female householder with no husband present, and 32.2% were non-families. 28.7% of all households were made up of individuals, and 16.2% had someone living alone who was 65 years of age or older. The average household size was 2.50 and the average family size was 3.09.
In the town, the population was spread out, with 27.2% under the age of 18, 8.2% from 18 to 24, 25.2% from 25 to 44, 21.2% from 45 to 64, and 18.2% who were 65 years of age or older. The median age was 37 years. For every 100 females, there were 87.2 males. For every 100 females age 18 and over, there were 81.2 males.
The median income for a household in the town was $27,500, and the median income for a family was $32,500. Males had a median income of $27,500 versus $20,000 for females. The per capita income for the town was $14,845. About 14.2% of families and 17.2% of the population were below the poverty line, including 22.2% of those under age 18 and 14.2% of those age 65 or over.
Common Questions
What is Per Capita Income in Clifton?
Per Capita income in Clifton is $27,885.
What is the Median Family Income in Clifton?
Median Family Income in Clifton is $66,760.
What is the Median Household income in Clifton?
Median Household Income in Clifton is $56,500.
What is Income or Wage Gap in Clifton?
Income or Wage Gap in Clifton is 20.3%.
Women in Clifton earn 79.7 cents for every dollar earned by a man.
What is Inequality or Gini Index in Clifton?
Inequality or Gini Index in Clifton is 0.42.
What is the Total Population of Clifton?
Total Population of Clifton is 3,487.
What is the Total Male Population of Clifton?
Total Male Population of Clifton is 1,664.
What is the Total Female Population of Clifton?
Total Female Population of Clifton is 1,823.
What is the Ratio of Males per 100 Females in Clifton?
There are 91.28 Males per 100 Females in Clifton.
What is the Ratio of Females per 100 Males in Clifton?
There are 109.56 Females per 100 Males in Clifton.
What is the Median Population Age in Clifton?
Median Population Age in Clifton is 48.9 Years.
What is the Average Family Size in Clifton
Average Family Size in Clifton is 3.0 People.
What is the Average Household Size in Clifton
Average Household Size in Clifton is 2.4 People.
How Large is the Labor Force in Clifton?
There are 1,583 People in the Labor Forcein in Clifton.
What is the Percentage of People in the Labor Force in Clifton?
55.2% of People are in the Labor Force in Clifton.
What is the Unemployment Rate in Clifton?
Unemployment Rate in Clifton is 5.2%.