Chester, TX Map & Demographics
Chester Map
Chester Overview
$34,454
PER CAPITA INCOME
$102,917
AVG FAMILY INCOME
$66,250
AVG HOUSEHOLD INCOME
17.9%
WAGE / INCOME GAP [ % ]
82.1¢/ $1
WAGE / INCOME GAP [ $ ]
0.40
INEQUALITY / GINI INDEX
262
TOTAL POPULATION
140
MALE POPULATION
122
FEMALE POPULATION
114.75
MALES / 100 FEMALES
87.14
FEMALES / 100 MALES
47.3
MEDIAN AGE
3.1
AVG FAMILY SIZE
2.7
AVG HOUSEHOLD SIZE
132
LABOR FORCE [ PEOPLE ]
58.7%
PERCENT IN LABOR FORCE
6.8%
UNEMPLOYMENT RATE
Chester Zip Codes
Chester Area Codes
Income in Chester
Income Overview in Chester
Per Capita Income in Chester is $34,454, while median incomes of families and households are $102,917 and $66,250 respectively.
| Characteristic | Number | Measure |
| Per Capita Income | 262 | $34,454 |
| Median Family Income | 75 | $102,917 |
| Mean Family Income | 75 | $112,185 |
| Median Household Income | 98 | $66,250 |
| Mean Household Income | 98 | $93,315 |
| Income Deficit | 75 | $0 |
| Wage / Income Gap (%) | 262 | 17.87% |
| Wage / Income Gap ($) | 262 | 82.13¢ per $1 |
| Gini / Inequality Index | 262 | 0.40 |
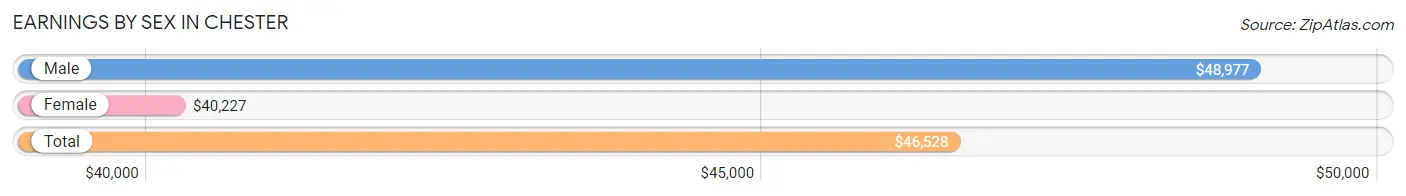
Earnings by Sex in Chester
Average Earnings in Chester are $46,528, $48,977 for men and $40,227 for women, a difference of 17.9%.
| Sex | Number | Average Earnings |
| Male | 77 (62.6%) | $48,977 |
| Female | 46 (37.4%) | $40,227 |
| Total | 123 (100.0%) | $46,528 |
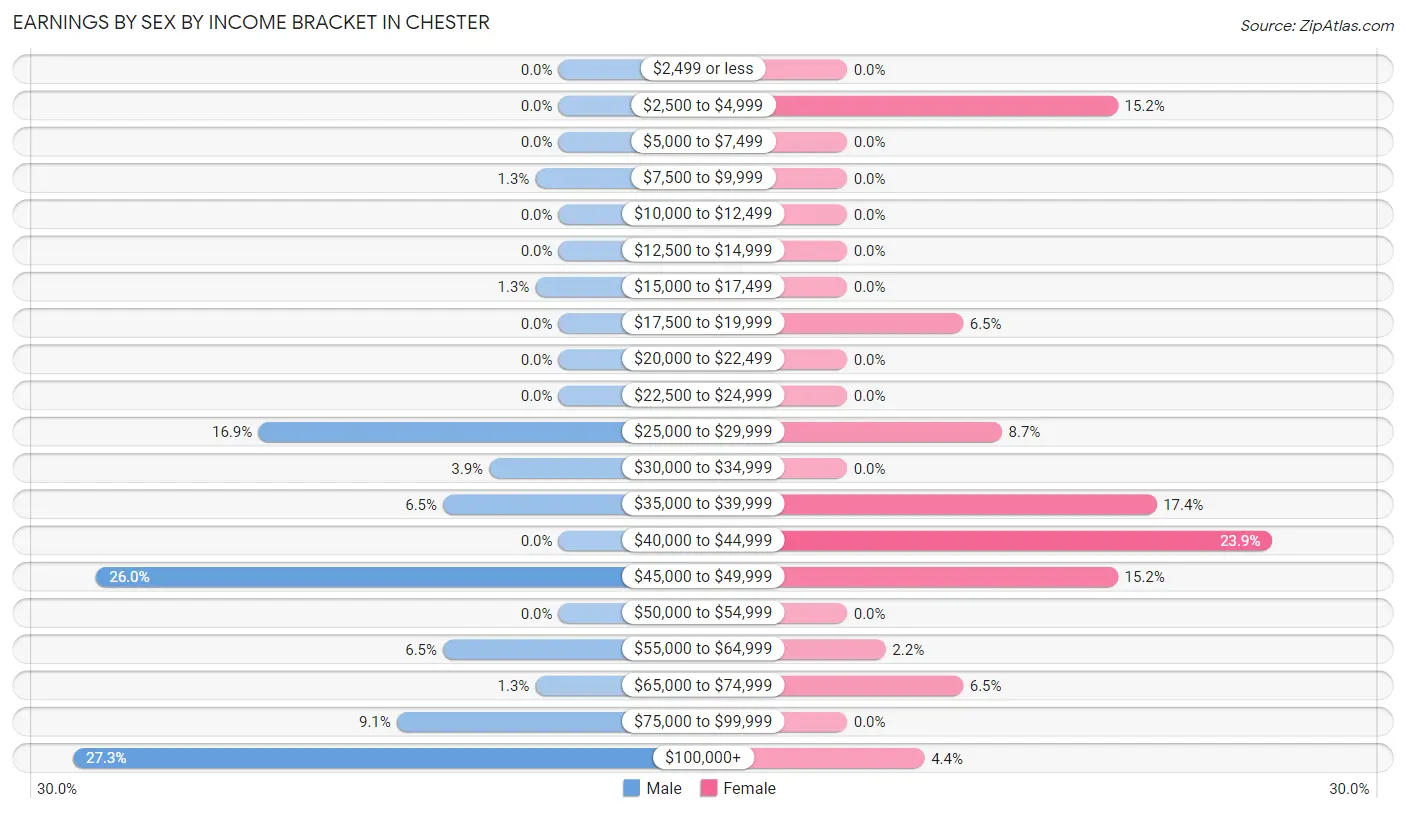
Earnings by Sex by Income Bracket in Chester
The most common earnings brackets in Chester are $100,000+ for men (21 | 27.3%) and $40,000 to $44,999 for women (11 | 23.9%).
| Income | Male | Female |
| $2,499 or less | 0 (0.0%) | 0 (0.0%) |
| $2,500 to $4,999 | 0 (0.0%) | 7 (15.2%) |
| $5,000 to $7,499 | 0 (0.0%) | 0 (0.0%) |
| $7,500 to $9,999 | 1 (1.3%) | 0 (0.0%) |
| $10,000 to $12,499 | 0 (0.0%) | 0 (0.0%) |
| $12,500 to $14,999 | 0 (0.0%) | 0 (0.0%) |
| $15,000 to $17,499 | 1 (1.3%) | 0 (0.0%) |
| $17,500 to $19,999 | 0 (0.0%) | 3 (6.5%) |
| $20,000 to $22,499 | 0 (0.0%) | 0 (0.0%) |
| $22,500 to $24,999 | 0 (0.0%) | 0 (0.0%) |
| $25,000 to $29,999 | 13 (16.9%) | 4 (8.7%) |
| $30,000 to $34,999 | 3 (3.9%) | 0 (0.0%) |
| $35,000 to $39,999 | 5 (6.5%) | 8 (17.4%) |
| $40,000 to $44,999 | 0 (0.0%) | 11 (23.9%) |
| $45,000 to $49,999 | 20 (26.0%) | 7 (15.2%) |
| $50,000 to $54,999 | 0 (0.0%) | 0 (0.0%) |
| $55,000 to $64,999 | 5 (6.5%) | 1 (2.2%) |
| $65,000 to $74,999 | 1 (1.3%) | 3 (6.5%) |
| $75,000 to $99,999 | 7 (9.1%) | 0 (0.0%) |
| $100,000+ | 21 (27.3%) | 2 (4.3%) |
| Total | 77 (100.0%) | 46 (100.0%) |
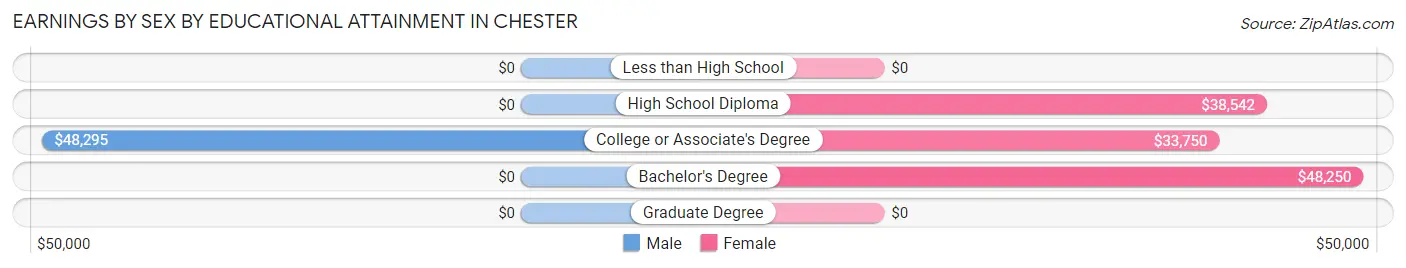
Earnings by Sex by Educational Attainment in Chester
Average earnings in Chester are $49,091 for men and $39,844 for women, a difference of 18.8%. Men with an educational attainment of college or associate's degree enjoy the highest average annual earnings of $48,295, while those with college or associate's degree education earn the least with $48,295. Women with an educational attainment of bachelor's degree earn the most with the average annual earnings of $48,250, while those with college or associate's degree education have the smallest earnings of $33,750.
| Educational Attainment | Male Income | Female Income |
| Less than High School | - | - |
| High School Diploma | - | - |
| College or Associate's Degree | $48,295 | $33,750 |
| Bachelor's Degree | - | - |
| Graduate Degree | - | - |
| Total | $49,091 | $39,844 |
Family Income in Chester
Family Income Brackets in Chester
According to the Chester family income data, there are 17 families falling into the $100,000 to $149,999 income range, which is the most common income bracket and makes up 22.7% of all families.
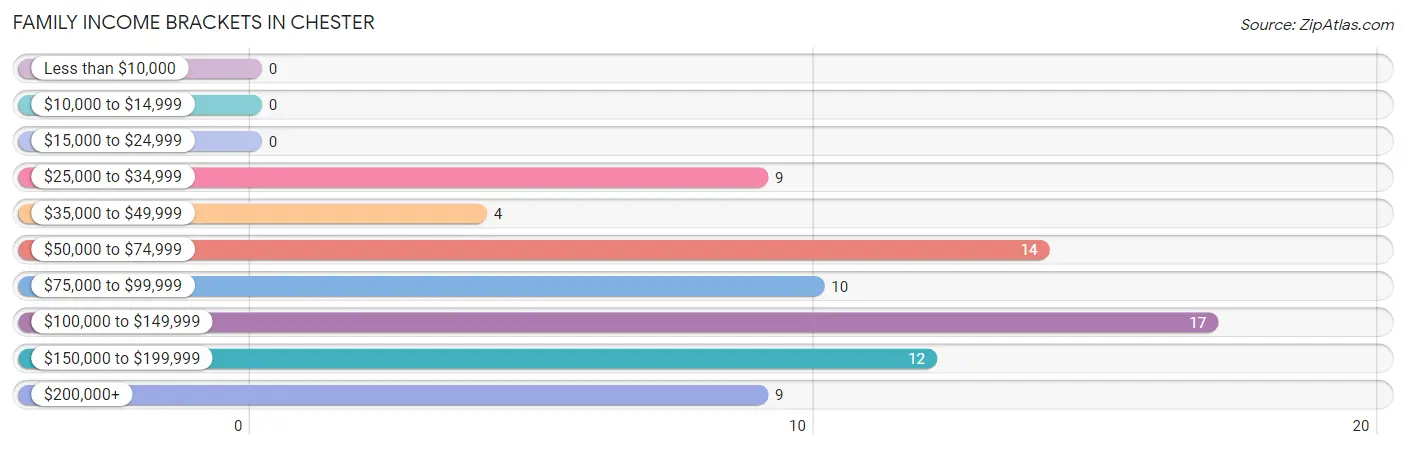
| Income Bracket | # Families | % Families |
| Less than $10,000 | 0 | 0.0% |
| $10,000 to $14,999 | 0 | 0.0% |
| $15,000 to $24,999 | 0 | 0.0% |
| $25,000 to $34,999 | 9 | 12.0% |
| $35,000 to $49,999 | 4 | 5.3% |
| $50,000 to $74,999 | 14 | 18.7% |
| $75,000 to $99,999 | 10 | 13.3% |
| $100,000 to $149,999 | 17 | 22.7% |
| $150,000 to $199,999 | 12 | 16.0% |
| $200,000+ | 9 | 12.0% |
Family Income by Famaliy Size in Chester
3-person families (29 | 38.7%) account for the highest median family income in Chester with $117,708 per family, while 3-person families (29 | 38.7%) have the highest median income of $39,236 per family member.
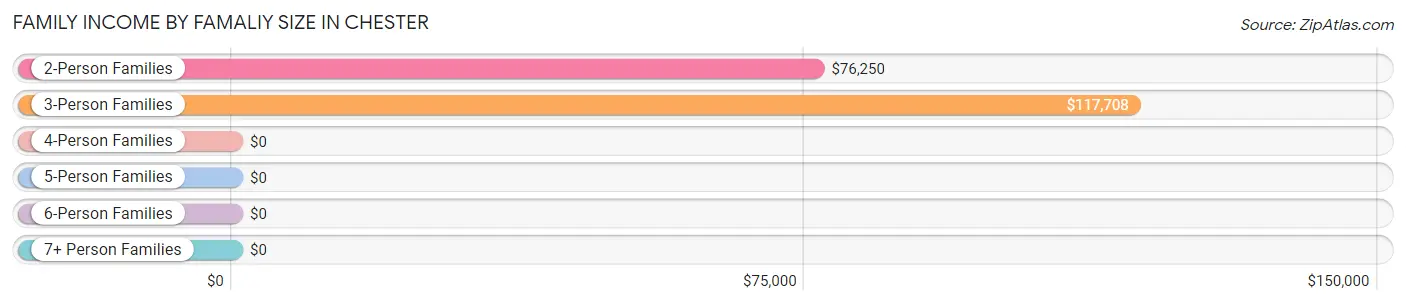
| Income Bracket | # Families | Median Income |
| 2-Person Families | 27 (36.0%) | $76,250 |
| 3-Person Families | 29 (38.7%) | $117,708 |
| 4-Person Families | 8 (10.7%) | $0 |
| 5-Person Families | 5 (6.7%) | $0 |
| 6-Person Families | 2 (2.7%) | $0 |
| 7+ Person Families | 4 (5.3%) | $0 |
| Total | 75 (100.0%) | $102,917 |
Family Income by Number of Earners in Chester
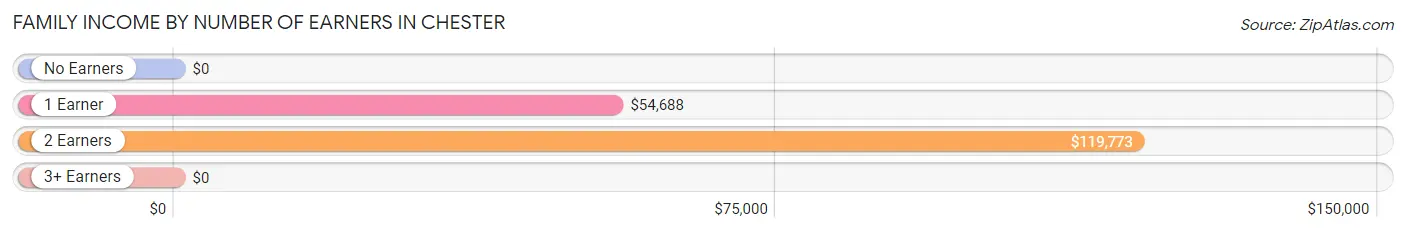
| Number of Earners | # Families | Median Income |
| No Earners | 5 (6.7%) | $0 |
| 1 Earner | 29 (38.7%) | $54,688 |
| 2 Earners | 40 (53.3%) | $119,773 |
| 3+ Earners | 1 (1.3%) | $0 |
| Total | 75 (100.0%) | $102,917 |
Household Income in Chester
Household Income Brackets in Chester
With 17 households falling in the category, the $35,000 to $49,999 income range is the most frequent in Chester, accounting for 17.3% of all households. In contrast, only 2 households (2.0%) fall into the $10,000 to $14,999 income bracket, making it the least populous group.
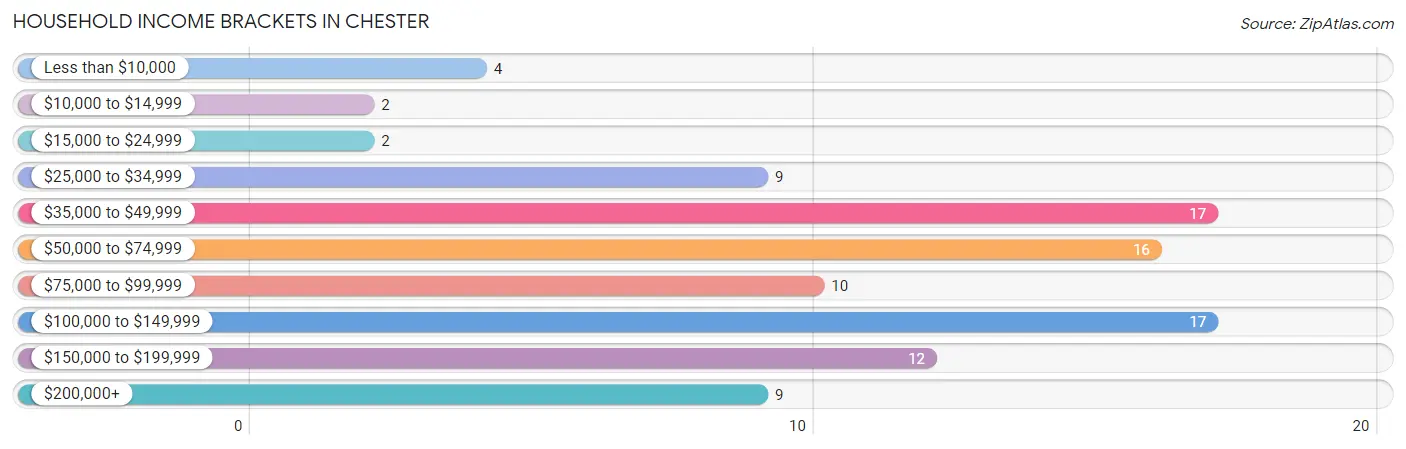
| Income Bracket | # Households | % Households |
| Less than $10,000 | 4 | 4.1% |
| $10,000 to $14,999 | 2 | 2.0% |
| $15,000 to $24,999 | 2 | 2.0% |
| $25,000 to $34,999 | 9 | 9.2% |
| $35,000 to $49,999 | 17 | 17.3% |
| $50,000 to $74,999 | 16 | 16.3% |
| $75,000 to $99,999 | 10 | 10.2% |
| $100,000 to $149,999 | 17 | 17.3% |
| $150,000 to $199,999 | 12 | 12.2% |
| $200,000+ | 9 | 9.2% |
Household Income by Householder Age in Chester
The median household income in Chester is $66,250, with the highest median household income of $119,375 found in the 45 to 64 years age bracket for the primary householder. A total of 47 households (48.0%) fall into this category.
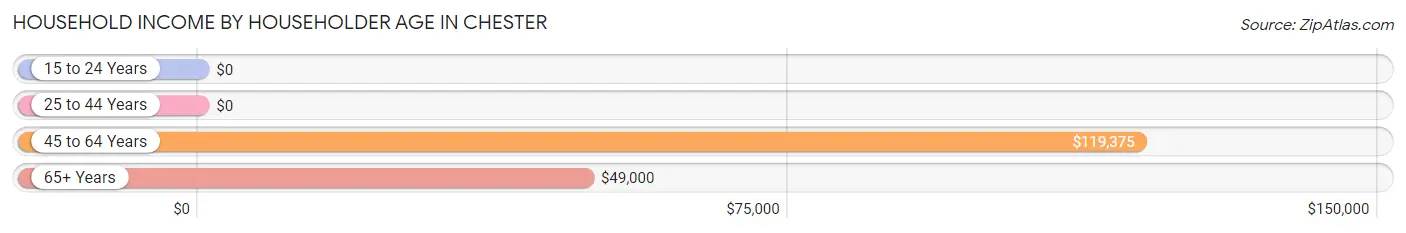
| Income Bracket | # Households | Median Income |
| 15 to 24 Years | 0 (0.0%) | $0 |
| 25 to 44 Years | 21 (21.4%) | $0 |
| 45 to 64 Years | 47 (48.0%) | $119,375 |
| 65+ Years | 30 (30.6%) | $49,000 |
| Total | 98 (100.0%) | $66,250 |
Poverty in Chester
Income Below Poverty by Sex and Age in Chester
With 7.9% poverty level for males and 10.7% for females among the residents of Chester, 55 to 64 year old males and 12 to 14 year old females are the most vulnerable to poverty, with 7 males (35.0%) and 1 females (100.0%) in their respective age groups living below the poverty level.
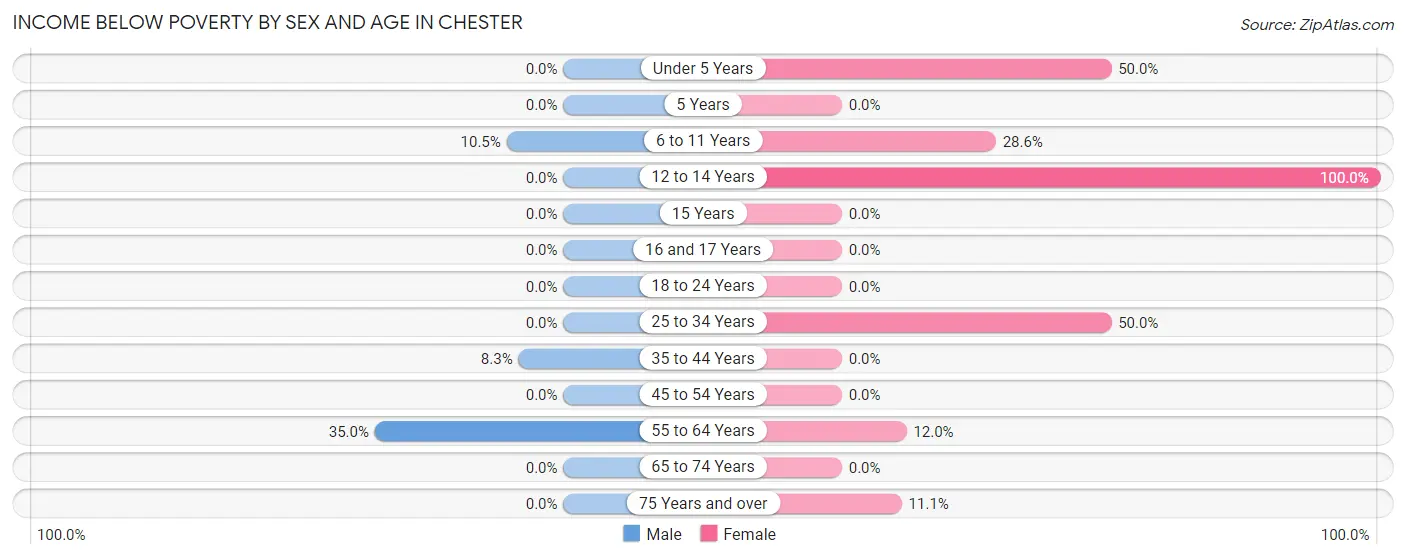
| Age Bracket | Male | Female |
| Under 5 Years | 0 (0.0%) | 2 (50.0%) |
| 5 Years | 0 (0.0%) | 0 (0.0%) |
| 6 to 11 Years | 2 (10.5%) | 2 (28.6%) |
| 12 to 14 Years | 0 (0.0%) | 1 (100.0%) |
| 15 Years | 0 (0.0%) | 0 (0.0%) |
| 16 and 17 Years | 0 (0.0%) | 0 (0.0%) |
| 18 to 24 Years | 0 (0.0%) | 0 (0.0%) |
| 25 to 34 Years | 0 (0.0%) | 3 (50.0%) |
| 35 to 44 Years | 2 (8.3%) | 0 (0.0%) |
| 45 to 54 Years | 0 (0.0%) | 0 (0.0%) |
| 55 to 64 Years | 7 (35.0%) | 3 (12.0%) |
| 65 to 74 Years | 0 (0.0%) | 0 (0.0%) |
| 75 Years and over | 0 (0.0%) | 2 (11.1%) |
| Total | 11 (7.9%) | 13 (10.7%) |
Income Above Poverty by Sex and Age in Chester
According to the poverty statistics in Chester, males aged 5 years and females aged 18 to 24 years are the age groups that are most secure financially, with 100.0% of males and 100.0% of females in these age groups living above the poverty line.
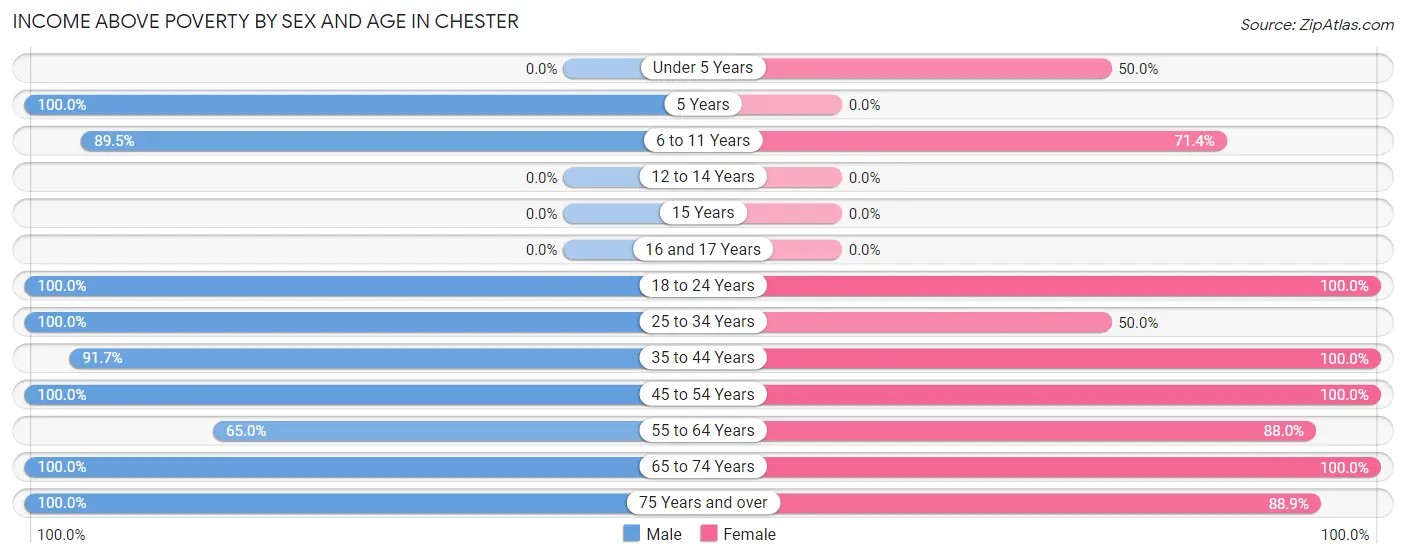
| Age Bracket | Male | Female |
| Under 5 Years | 0 (0.0%) | 2 (50.0%) |
| 5 Years | 6 (100.0%) | 0 (0.0%) |
| 6 to 11 Years | 17 (89.5%) | 5 (71.4%) |
| 12 to 14 Years | 0 (0.0%) | 0 (0.0%) |
| 15 Years | 0 (0.0%) | 0 (0.0%) |
| 16 and 17 Years | 0 (0.0%) | 0 (0.0%) |
| 18 to 24 Years | 7 (100.0%) | 11 (100.0%) |
| 25 to 34 Years | 18 (100.0%) | 3 (50.0%) |
| 35 to 44 Years | 22 (91.7%) | 5 (100.0%) |
| 45 to 54 Years | 21 (100.0%) | 29 (100.0%) |
| 55 to 64 Years | 13 (65.0%) | 22 (88.0%) |
| 65 to 74 Years | 6 (100.0%) | 16 (100.0%) |
| 75 Years and over | 19 (100.0%) | 16 (88.9%) |
| Total | 129 (92.1%) | 109 (89.3%) |
Income Below Poverty Among Married-Couple Families in Chester
The poverty statistics for married-couple families in Chester show that 3.3% or 2 of the total 60 families live below the poverty line. Families with 3 or 4 children have the highest poverty rate of 33.3%, comprising of 2 families. On the other hand, families with no children have the lowest poverty rate of 0.0%, which includes 0 families.
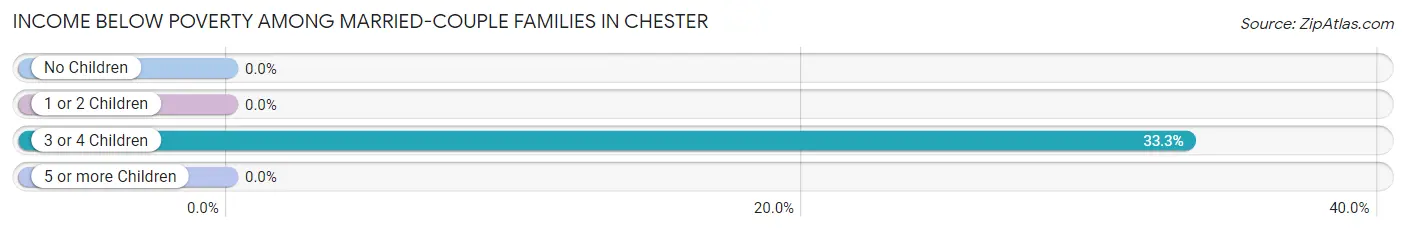
| Children | Above Poverty | Below Poverty |
| No Children | 45 (100.0%) | 0 (0.0%) |
| 1 or 2 Children | 9 (100.0%) | 0 (0.0%) |
| 3 or 4 Children | 4 (66.7%) | 2 (33.3%) |
| 5 or more Children | 0 (0.0%) | 0 (0.0%) |
| Total | 58 (96.7%) | 2 (3.3%) |
Income Below Poverty Among Single-Parent Households in Chester
| Children | Single Father | Single Mother |
| No Children | 0 (0.0%) | 0 (0.0%) |
| 1 or 2 Children | 0 (0.0%) | 0 (0.0%) |
| 3 or 4 Children | 0 (0.0%) | 0 (0.0%) |
| 5 or more Children | 0 (0.0%) | 0 (0.0%) |
| Total | 0 (0.0%) | 0 (0.0%) |
Income Below Poverty Among Married-Couple vs Single-Parent Households in Chester
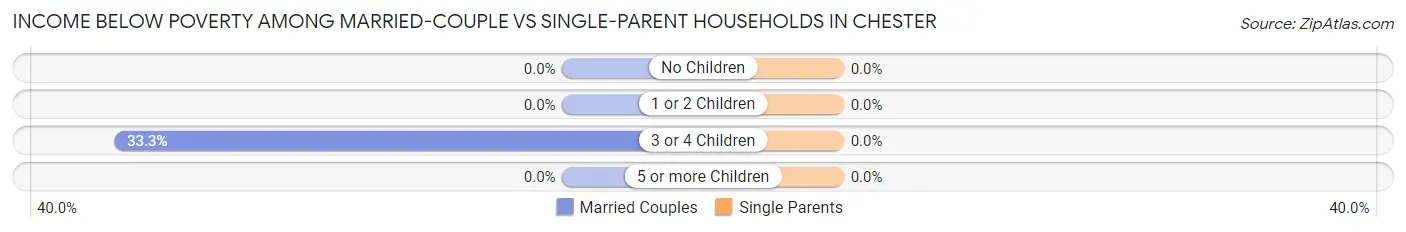
| Children | Married-Couple Families | Single-Parent Households |
| No Children | 0 (0.0%) | 0 (0.0%) |
| 1 or 2 Children | 0 (0.0%) | 0 (0.0%) |
| 3 or 4 Children | 2 (33.3%) | 0 (0.0%) |
| 5 or more Children | 0 (0.0%) | 0 (0.0%) |
| Total | 2 (3.3%) | 0 (0.0%) |
Race in Chester
The most populous races in Chester are White / Caucasian (245 | 93.5%), Hispanic or Latino (12 | 4.6%), and Some other Race (12 | 4.6%).
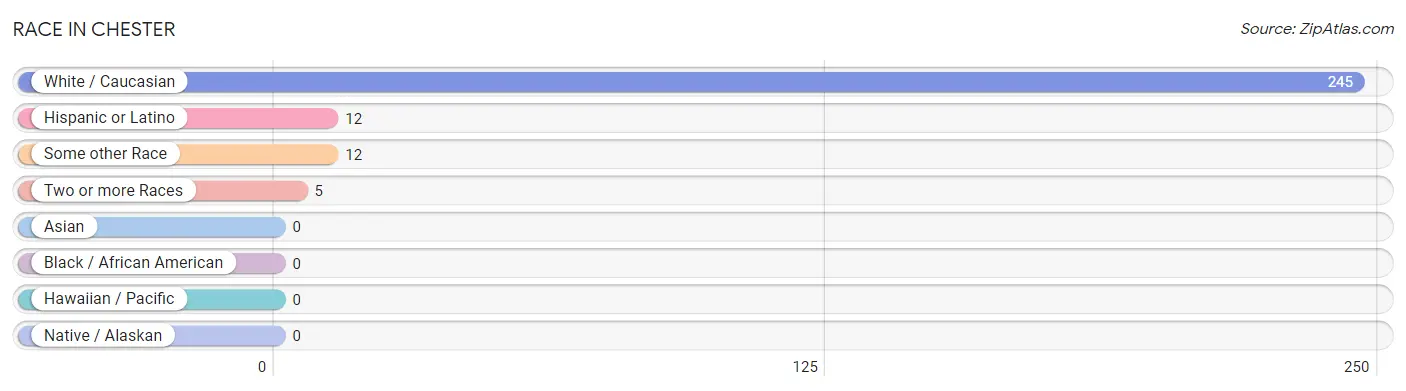
| Race | # Population | % Population |
| Asian | 0 | 0.0% |
| Black / African American | 0 | 0.0% |
| Hawaiian / Pacific | 0 | 0.0% |
| Hispanic or Latino | 12 | 4.6% |
| Native / Alaskan | 0 | 0.0% |
| White / Caucasian | 245 | 93.5% |
| Two or more Races | 5 | 1.9% |
| Some other Race | 12 | 4.6% |
| Total | 262 | 100.0% |
Ancestry in Chester
The most populous ancestries reported in Chester are American (63 | 24.0%), German (36 | 13.7%), English (34 | 13.0%), Irish (15 | 5.7%), and French (12 | 4.6%), together accounting for 61.1% of all Chester residents.
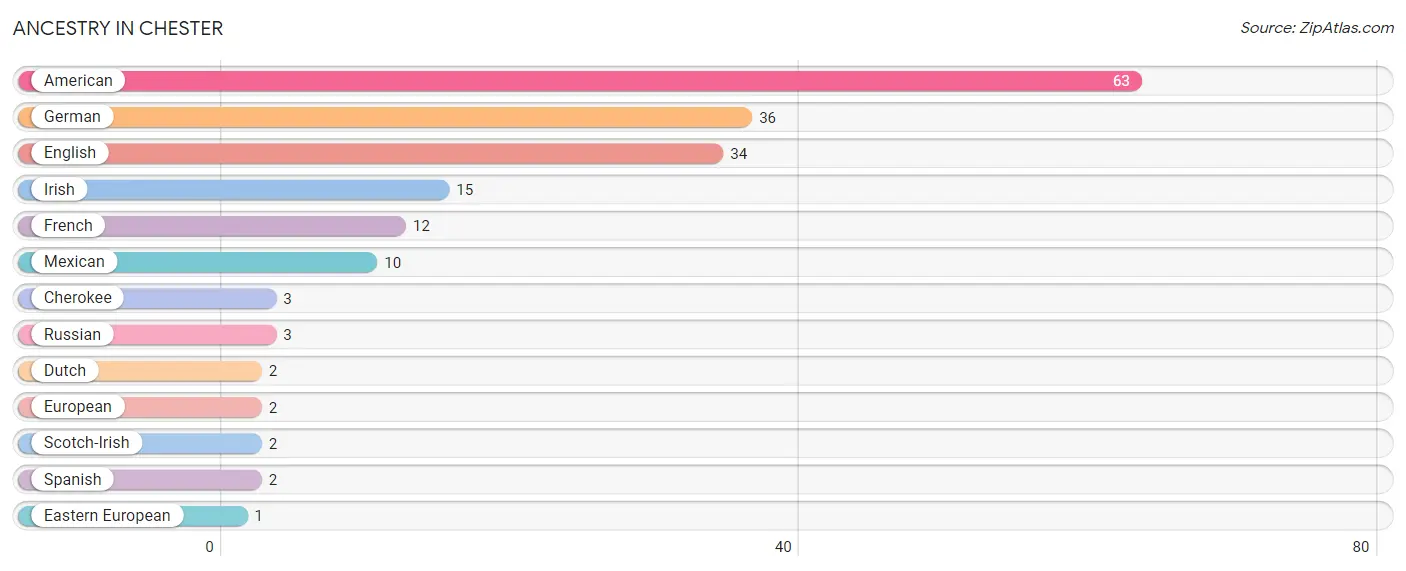
| Ancestry | # Population | % Population |
| American | 63 | 24.0% |
| Cherokee | 3 | 1.1% |
| Dutch | 2 | 0.8% |
| Eastern European | 1 | 0.4% |
| English | 34 | 13.0% |
| European | 2 | 0.8% |
| French | 12 | 4.6% |
| German | 36 | 13.7% |
| Irish | 15 | 5.7% |
| Mexican | 10 | 3.8% |
| Russian | 3 | 1.1% |
| Scotch-Irish | 2 | 0.8% |
| Spanish | 2 | 0.8% | View All 13 Rows |
Immigrants in Chester
The most numerous immigrant groups reported in Chester came from Europe (4 | 1.5%), Central America (3 | 1.1%), Latin America (3 | 1.1%), Mexico (3 | 1.1%), and England (2 | 0.8%), together accounting for 5.7% of all Chester residents.
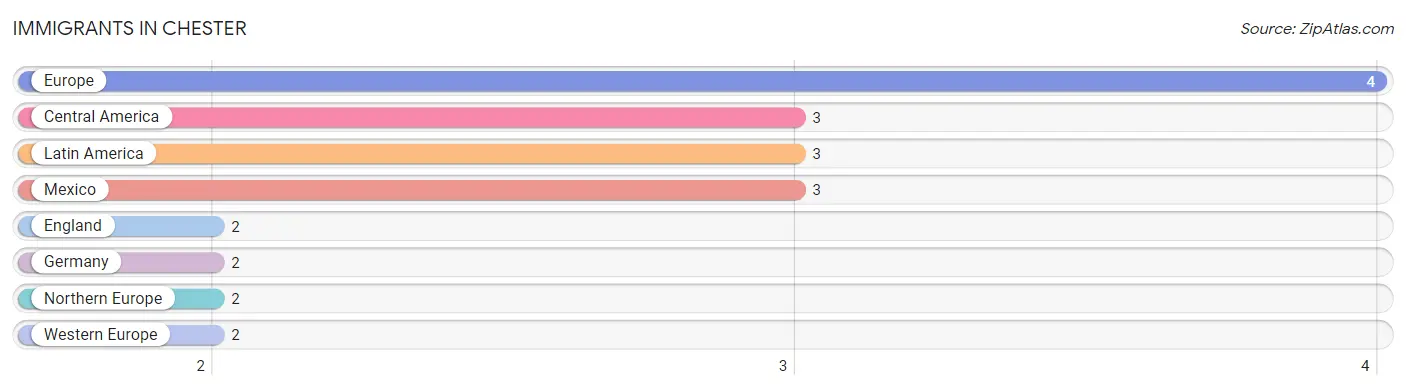
| Immigration Origin | # Population | % Population |
| Central America | 3 | 1.1% |
| England | 2 | 0.8% |
| Europe | 4 | 1.5% |
| Germany | 2 | 0.8% |
| Latin America | 3 | 1.1% |
| Mexico | 3 | 1.1% |
| Northern Europe | 2 | 0.8% |
| Western Europe | 2 | 0.8% | View All 8 Rows |
Sex and Age in Chester
Sex and Age in Chester
The most populous age groups in Chester are 35 to 39 Years (22 | 15.7%) for men and 45 to 49 Years (21 | 17.2%) for women.
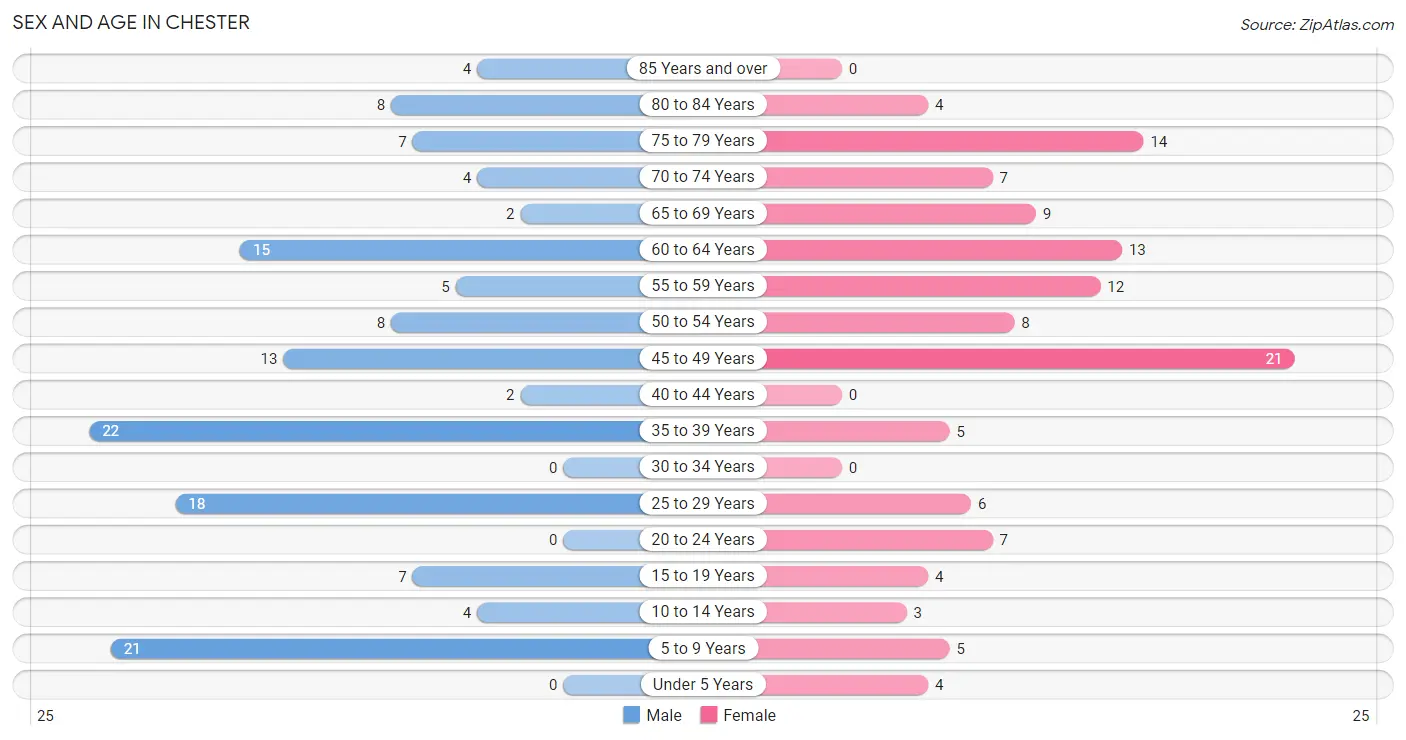
| Age Bracket | Male | Female |
| Under 5 Years | 0 (0.0%) | 4 (3.3%) |
| 5 to 9 Years | 21 (15.0%) | 5 (4.1%) |
| 10 to 14 Years | 4 (2.9%) | 3 (2.5%) |
| 15 to 19 Years | 7 (5.0%) | 4 (3.3%) |
| 20 to 24 Years | 0 (0.0%) | 7 (5.7%) |
| 25 to 29 Years | 18 (12.9%) | 6 (4.9%) |
| 30 to 34 Years | 0 (0.0%) | 0 (0.0%) |
| 35 to 39 Years | 22 (15.7%) | 5 (4.1%) |
| 40 to 44 Years | 2 (1.4%) | 0 (0.0%) |
| 45 to 49 Years | 13 (9.3%) | 21 (17.2%) |
| 50 to 54 Years | 8 (5.7%) | 8 (6.6%) |
| 55 to 59 Years | 5 (3.6%) | 12 (9.8%) |
| 60 to 64 Years | 15 (10.7%) | 13 (10.7%) |
| 65 to 69 Years | 2 (1.4%) | 9 (7.4%) |
| 70 to 74 Years | 4 (2.9%) | 7 (5.7%) |
| 75 to 79 Years | 7 (5.0%) | 14 (11.5%) |
| 80 to 84 Years | 8 (5.7%) | 4 (3.3%) |
| 85 Years and over | 4 (2.9%) | 0 (0.0%) |
| Total | 140 (100.0%) | 122 (100.0%) |
Families and Households in Chester
Median Family Size in Chester
The median family size in Chester is 3.11 persons per family, with single male/father families (1 | 1.3%) accounting for the largest median family size of 4 persons per family. On the other hand, single female/mother families (14 | 18.7%) represent the smallest median family size with 2.86 persons per family.
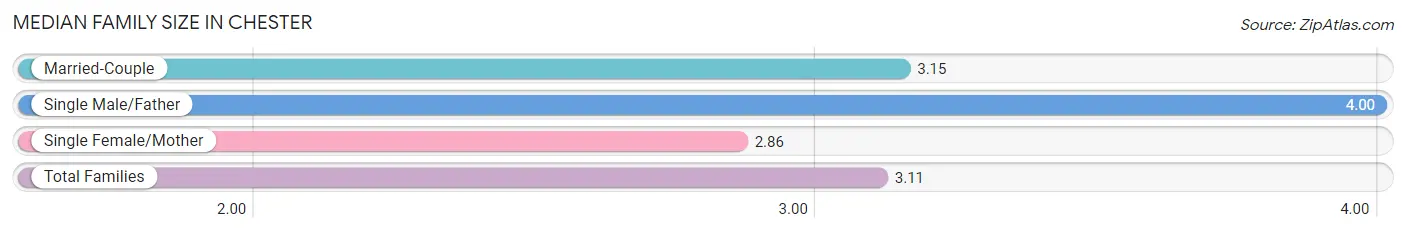
| Family Type | # Families | Family Size |
| Married-Couple | 60 (80.0%) | 3.15 |
| Single Male/Father | 1 (1.3%) | 4.00 |
| Single Female/Mother | 14 (18.7%) | 2.86 |
| Total Families | 75 (100.0%) | 3.11 |
Median Household Size in Chester
The median household size in Chester is 2.67 persons per household, with single male/father households (1 | 1.0%) accounting for the largest median household size of 4 persons per household. non-family households (23 | 23.5%) represent the smallest median household size with 1.26 persons per household.
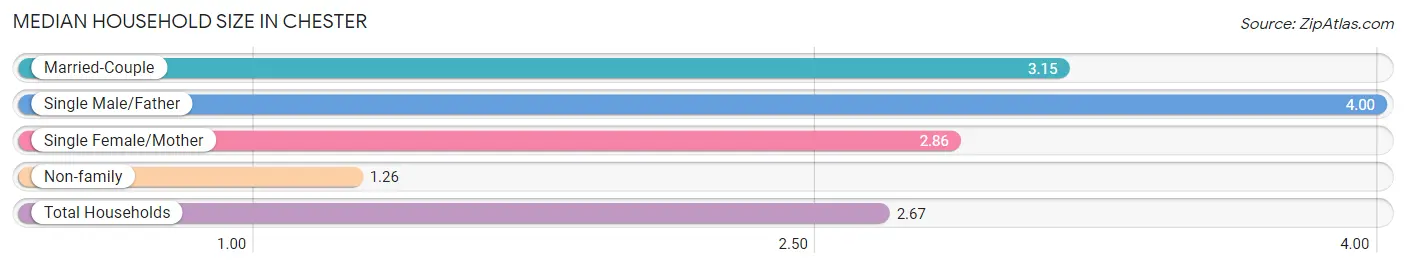
| Household Type | # Households | Household Size |
| Married-Couple | 60 (61.2%) | 3.15 |
| Single Male/Father | 1 (1.0%) | 4.00 |
| Single Female/Mother | 14 (14.3%) | 2.86 |
| Non-family | 23 (23.5%) | 1.26 |
| Total Households | 98 (100.0%) | 2.67 |
Household Size by Marriage Status in Chester
Out of a total of 98 households in Chester, 75 (76.5%) are family households, while 23 (23.5%) are nonfamily households. The most numerous type of family households are 3-person households, comprising 29, and the most common type of nonfamily households are 1-person households, comprising 20.
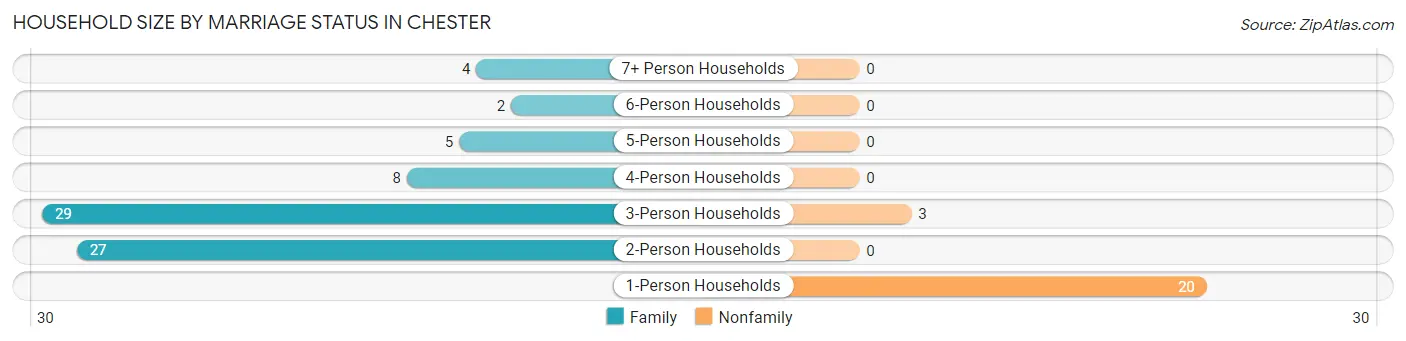
| Household Size | Family Households | Nonfamily Households |
| 1-Person Households | - | 20 (20.4%) |
| 2-Person Households | 27 (27.6%) | 0 (0.0%) |
| 3-Person Households | 29 (29.6%) | 3 (3.1%) |
| 4-Person Households | 8 (8.2%) | 0 (0.0%) |
| 5-Person Households | 5 (5.1%) | 0 (0.0%) |
| 6-Person Households | 2 (2.0%) | 0 (0.0%) |
| 7+ Person Households | 4 (4.1%) | 0 (0.0%) |
| Total | 75 (76.5%) | 23 (23.5%) |
Female Fertility in Chester
Fertility by Age in Chester
Average fertility rate in Chester is 20.0 births per 1,000 women. Women in the age bracket of 20 to 34 years have the highest fertility rate with 77.0 births per 1,000 women. Women in the age bracket of 20 to 34 years acount for 100.0% of all women with births.
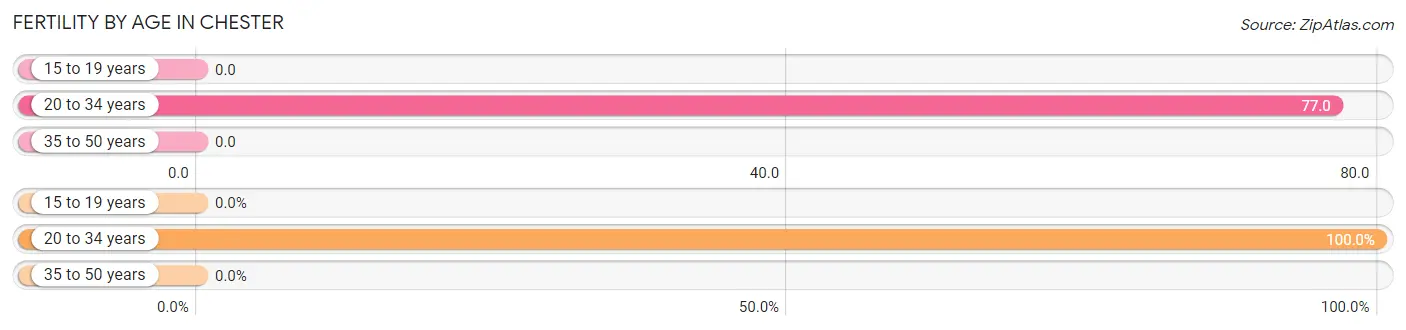
| Age Bracket | Women with Births | Births / 1,000 Women |
| 15 to 19 years | 0 (0.0%) | 0.0 |
| 20 to 34 years | 1 (100.0%) | 77.0 |
| 35 to 50 years | 0 (0.0%) | 0.0 |
| Total | 1 (100.0%) | 20.0 |
Fertility by Age by Marriage Status in Chester
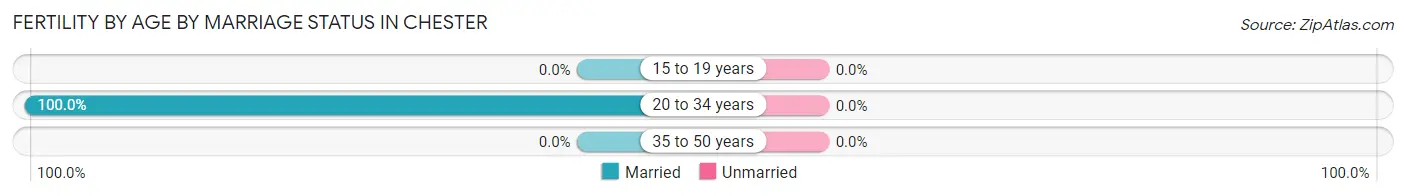
| Age Bracket | Married | Unmarried |
| 15 to 19 years | 0 (0.0%) | 0 (0.0%) |
| 20 to 34 years | 1 (100.0%) | 0 (0.0%) |
| 35 to 50 years | 0 (0.0%) | 0 (0.0%) |
| Total | 1 (100.0%) | 0 (0.0%) |
Fertility by Education in Chester
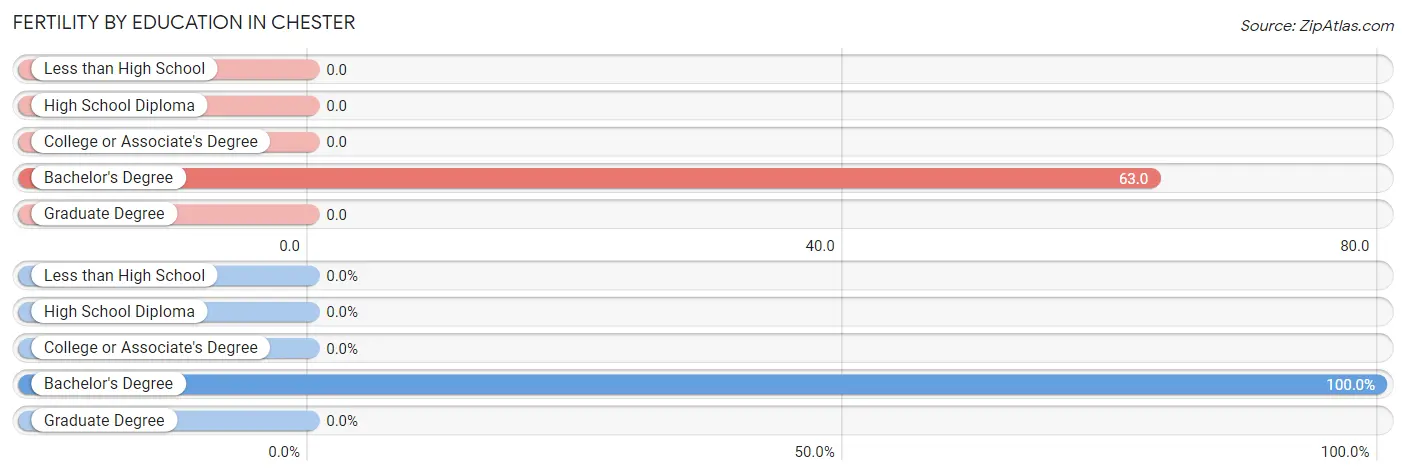
| Educational Attainment | Women with Births | Births / 1,000 Women |
| Less than High School | 0 (0.0%) | 0.0 |
| High School Diploma | 0 (0.0%) | 0.0 |
| College or Associate's Degree | 0 (0.0%) | 0.0 |
| Bachelor's Degree | 1 (100.0%) | 63.0 |
| Graduate Degree | 0 (0.0%) | 0.0 |
| Total | 1 (100.0%) | 20.0 |
Fertility by Education by Marriage Status in Chester
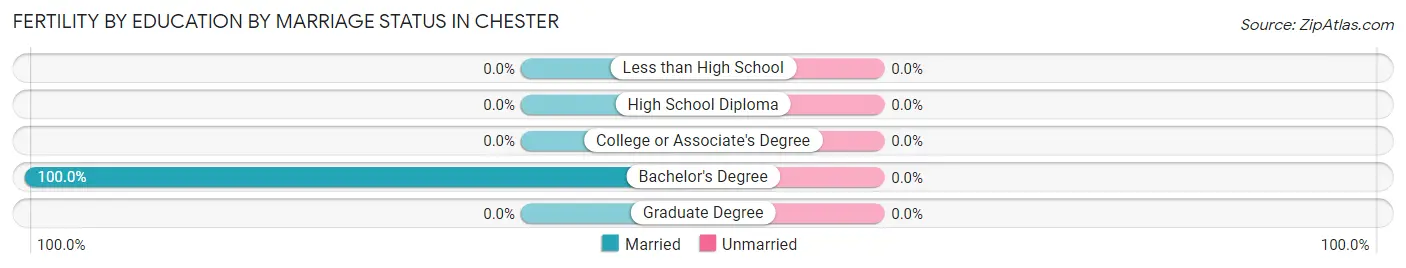
| Educational Attainment | Married | Unmarried |
| Less than High School | 0 (0.0%) | 0 (0.0%) |
| High School Diploma | 0 (0.0%) | 0 (0.0%) |
| College or Associate's Degree | 0 (0.0%) | 0 (0.0%) |
| Bachelor's Degree | 1 (100.0%) | 0 (0.0%) |
| Graduate Degree | 0 (0.0%) | 0 (0.0%) |
| Total | 1 (100.0%) | 0 (0.0%) |
Employment Characteristics in Chester
Employment by Class of Employer in Chester
Among the 123 employed individuals in Chester, private company employees (72 | 58.5%), local government employees (14 | 11.4%), and self-employed (not incorporated) (12 | 9.8%) make up the most common classes of employment.
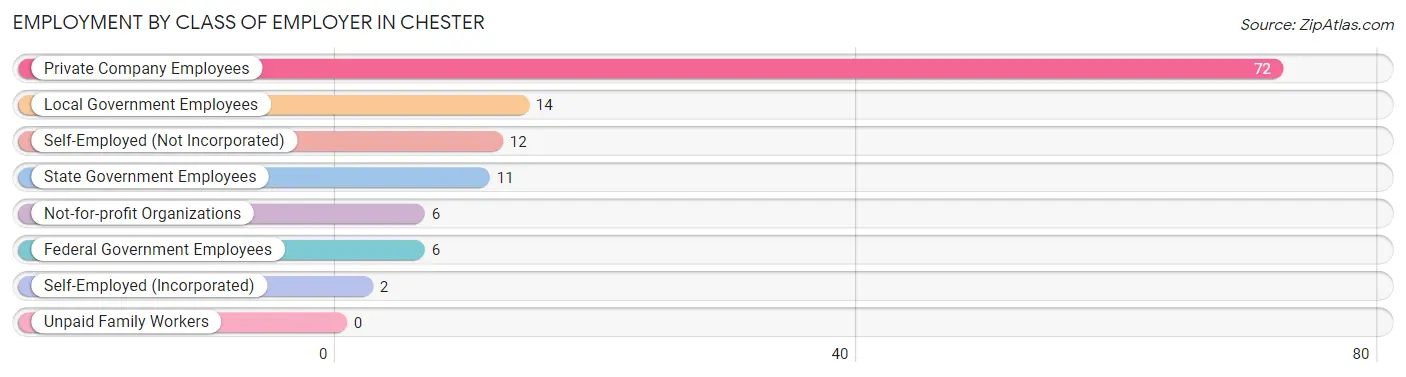
| Employer Class | # Employees | % Employees |
| Private Company Employees | 72 | 58.5% |
| Self-Employed (Incorporated) | 2 | 1.6% |
| Self-Employed (Not Incorporated) | 12 | 9.8% |
| Not-for-profit Organizations | 6 | 4.9% |
| Local Government Employees | 14 | 11.4% |
| State Government Employees | 11 | 8.9% |
| Federal Government Employees | 6 | 4.9% |
| Unpaid Family Workers | 0 | 0.0% |
| Total | 123 | 100.0% |
Employment Status by Age in Chester
According to the labor force statistics for Chester, out of the total population over 16 years of age (225), 58.7% or 132 individuals are in the labor force, with 6.8% or 9 of them unemployed. The age group with the highest labor force participation rate is 20 to 24 years, with 100.0% or 7 individuals in the labor force. Within the labor force, the 60 to 64 years age range has the highest percentage of unemployed individuals, with 60.0% or 9 of them being unemployed.
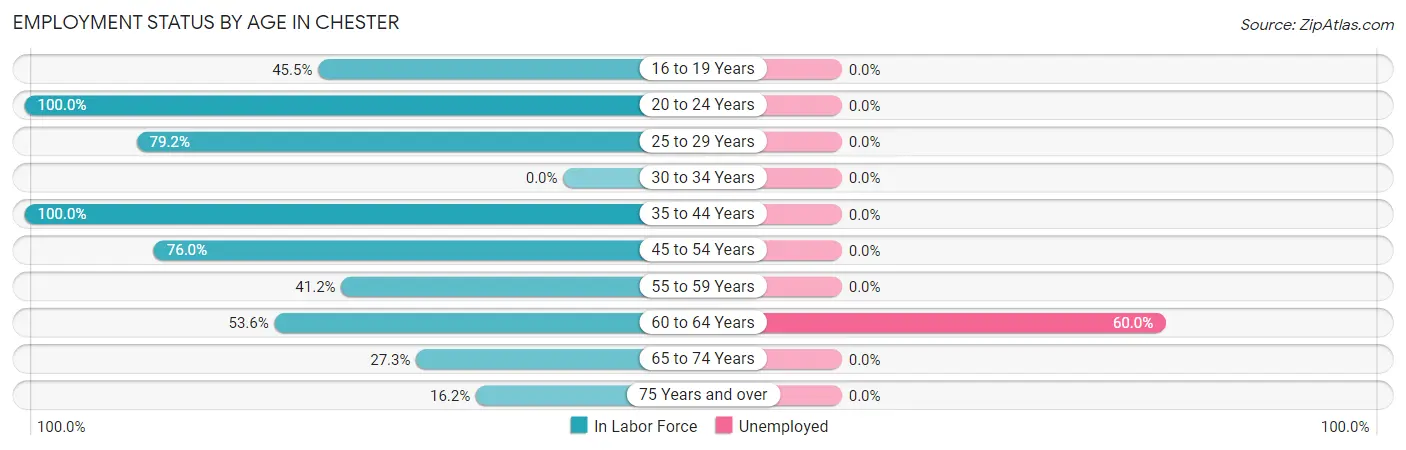
| Age Bracket | In Labor Force | Unemployed |
| 16 to 19 Years | 5 (45.5%) | 0 (0.0%) |
| 20 to 24 Years | 7 (100.0%) | 0 (0.0%) |
| 25 to 29 Years | 19 (79.2%) | 0 (0.0%) |
| 30 to 34 Years | 0 (0.0%) | 0 (0.0%) |
| 35 to 44 Years | 29 (100.0%) | 0 (0.0%) |
| 45 to 54 Years | 38 (76.0%) | 0 (0.0%) |
| 55 to 59 Years | 7 (41.2%) | 0 (0.0%) |
| 60 to 64 Years | 15 (53.6%) | 9 (60.0%) |
| 65 to 74 Years | 6 (27.3%) | 0 (0.0%) |
| 75 Years and over | 6 (16.2%) | 0 (0.0%) |
| Total | 132 (58.7%) | 9 (6.8%) |
Employment Status by Educational Attainment in Chester
According to labor force statistics for Chester, 73.0% of individuals (108) out of the total population between 25 and 64 years of age (148) are in the labor force, with 8.3% or 9 of them being unemployed. The group with the highest labor force participation rate are those with the educational attainment of bachelor's degree or higher, with 87.5% or 28 individuals in the labor force. Within the labor force, individuals with college / associate degree education have the highest percentage of unemployment, with 26.5% or 9 of them being unemployed.
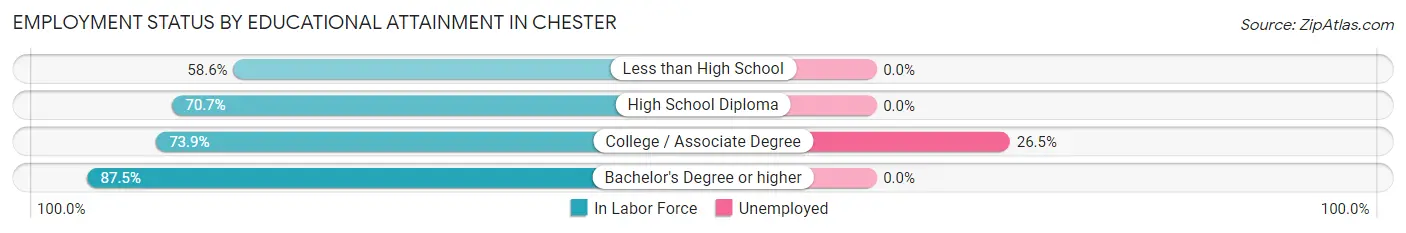
| Educational Attainment | In Labor Force | Unemployed |
| Less than High School | 17 (58.6%) | 0 (0.0%) |
| High School Diploma | 29 (70.7%) | 0 (0.0%) |
| College / Associate Degree | 34 (73.9%) | 12 (26.5%) |
| Bachelor's Degree or higher | 28 (87.5%) | 0 (0.0%) |
| Total | 108 (73.0%) | 12 (8.3%) |
Employment Occupations by Sex in Chester
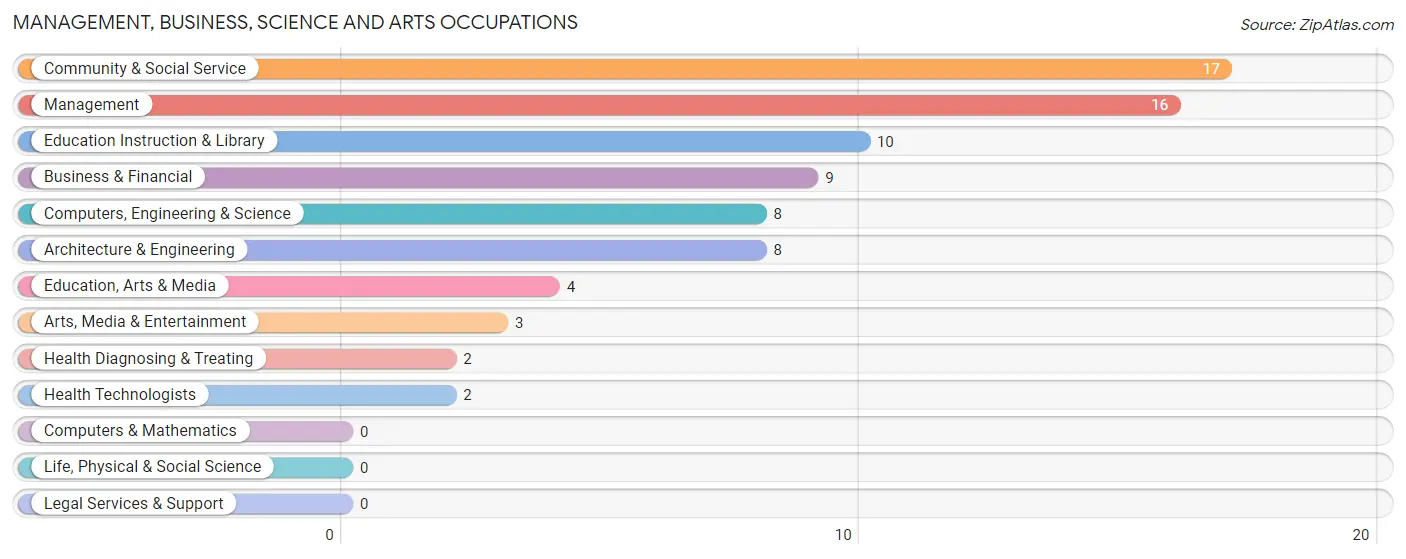
Management, Business, Science and Arts Occupations
The most common Management, Business, Science and Arts occupations in Chester are Community & Social Service (17 | 13.8%), Management (16 | 13.0%), Education Instruction & Library (10 | 8.1%), Business & Financial (9 | 7.3%), and Computers, Engineering & Science (8 | 6.5%).
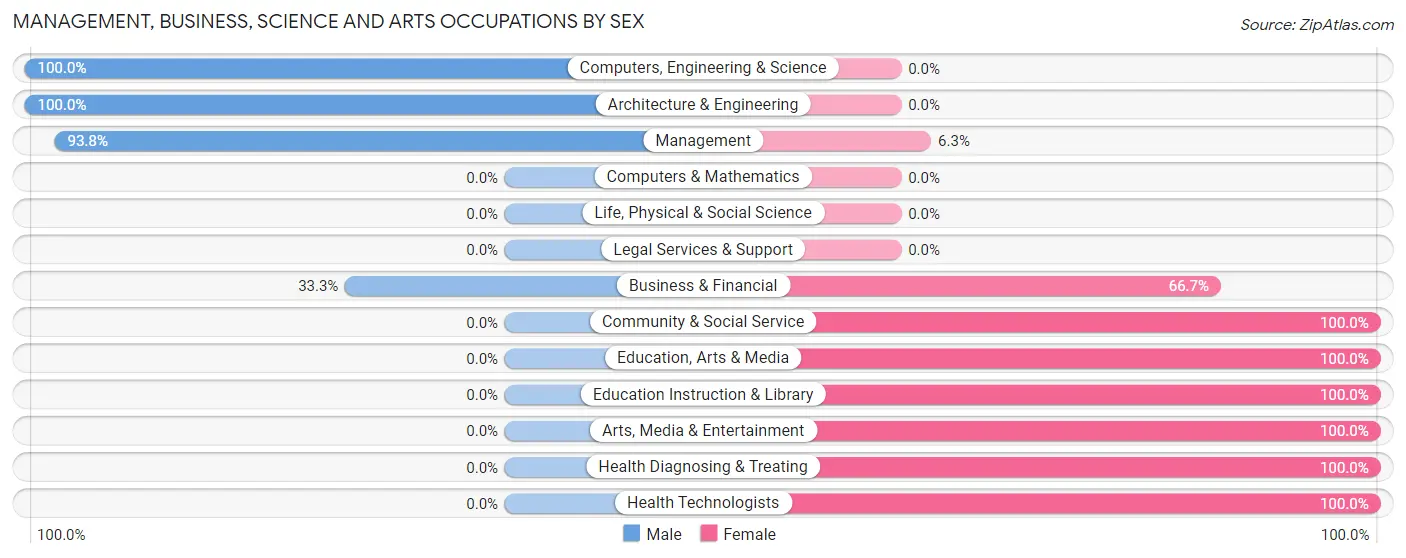
Management, Business, Science and Arts Occupations by Sex
Within the Management, Business, Science and Arts occupations in Chester, the most male-oriented occupations are Computers, Engineering & Science (100.0%), Architecture & Engineering (100.0%), and Management (93.8%), while the most female-oriented occupations are Community & Social Service (100.0%), Education, Arts & Media (100.0%), and Education Instruction & Library (100.0%).
| Occupation | Male | Female |
| Management | 15 (93.8%) | 1 (6.2%) |
| Business & Financial | 3 (33.3%) | 6 (66.7%) |
| Computers, Engineering & Science | 8 (100.0%) | 0 (0.0%) |
| Computers & Mathematics | 0 (0.0%) | 0 (0.0%) |
| Architecture & Engineering | 8 (100.0%) | 0 (0.0%) |
| Life, Physical & Social Science | 0 (0.0%) | 0 (0.0%) |
| Community & Social Service | 0 (0.0%) | 17 (100.0%) |
| Education, Arts & Media | 0 (0.0%) | 4 (100.0%) |
| Legal Services & Support | 0 (0.0%) | 0 (0.0%) |
| Education Instruction & Library | 0 (0.0%) | 10 (100.0%) |
| Arts, Media & Entertainment | 0 (0.0%) | 3 (100.0%) |
| Health Diagnosing & Treating | 0 (0.0%) | 2 (100.0%) |
| Health Technologists | 0 (0.0%) | 2 (100.0%) |
| Total (Category) | 26 (50.0%) | 26 (50.0%) |
| Total (Overall) | 77 (62.6%) | 46 (37.4%) |
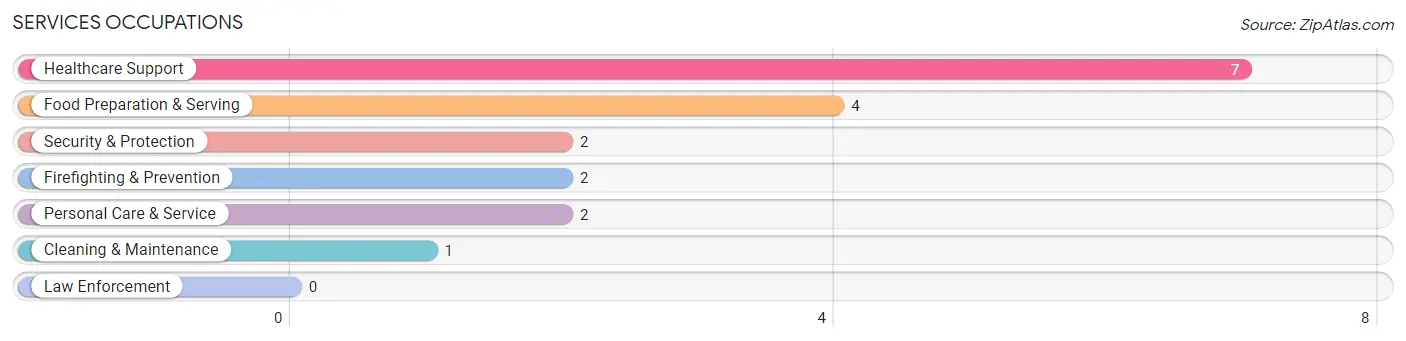
Services Occupations
The most common Services occupations in Chester are Healthcare Support (7 | 5.7%), Food Preparation & Serving (4 | 3.3%), Security & Protection (2 | 1.6%), Firefighting & Prevention (2 | 1.6%), and Personal Care & Service (2 | 1.6%).
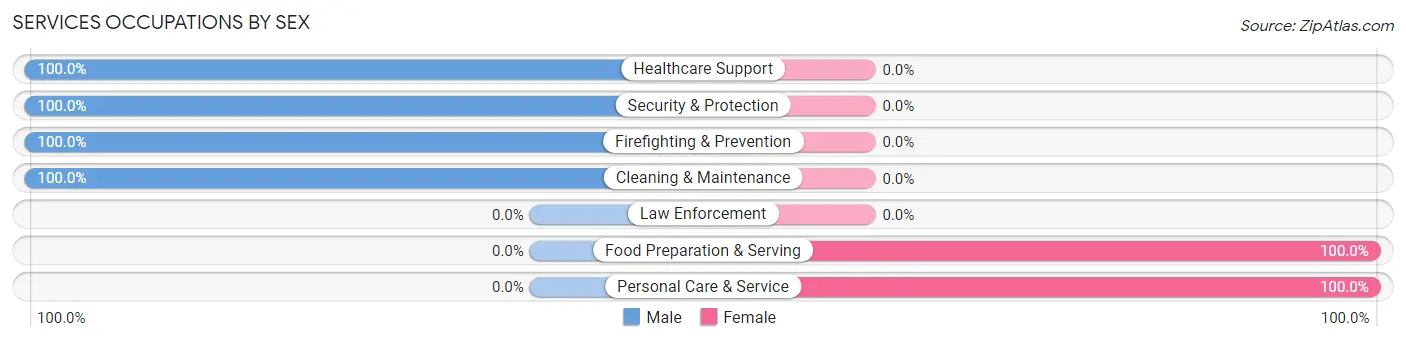
Services Occupations by Sex
Within the Services occupations in Chester, the most male-oriented occupations are Healthcare Support (100.0%), Security & Protection (100.0%), and Firefighting & Prevention (100.0%), while the most female-oriented occupations are Food Preparation & Serving (100.0%), and Personal Care & Service (100.0%).
| Occupation | Male | Female |
| Healthcare Support | 7 (100.0%) | 0 (0.0%) |
| Security & Protection | 2 (100.0%) | 0 (0.0%) |
| Firefighting & Prevention | 2 (100.0%) | 0 (0.0%) |
| Law Enforcement | 0 (0.0%) | 0 (0.0%) |
| Food Preparation & Serving | 0 (0.0%) | 4 (100.0%) |
| Cleaning & Maintenance | 1 (100.0%) | 0 (0.0%) |
| Personal Care & Service | 0 (0.0%) | 2 (100.0%) |
| Total (Category) | 10 (62.5%) | 6 (37.5%) |
| Total (Overall) | 77 (62.6%) | 46 (37.4%) |
Sales and Office Occupations
The most common Sales and Office occupations in Chester are Office & Administration (12 | 9.8%), and Sales & Related (7 | 5.7%).
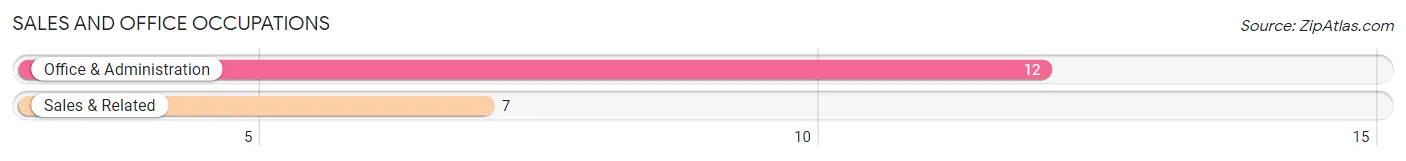
Sales and Office Occupations by Sex

| Occupation | Male | Female |
| Sales & Related | 7 (100.0%) | 0 (0.0%) |
| Office & Administration | 0 (0.0%) | 12 (100.0%) |
| Total (Category) | 7 (36.8%) | 12 (63.2%) |
| Total (Overall) | 77 (62.6%) | 46 (37.4%) |
Natural Resources, Construction and Maintenance Occupations
The most common Natural Resources, Construction and Maintenance occupations in Chester are Construction & Extraction (12 | 9.8%), and Installation, Maintenance & Repair (2 | 1.6%).
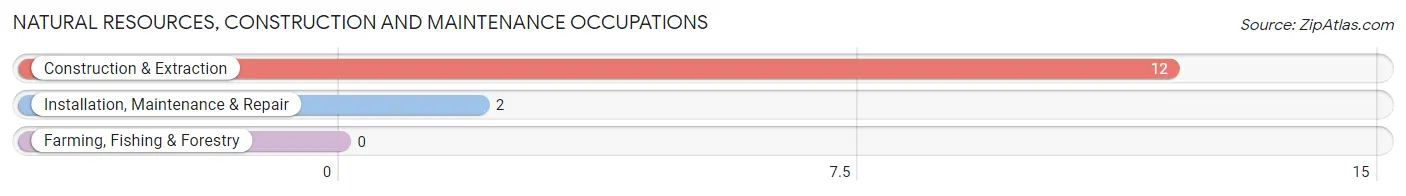
Natural Resources, Construction and Maintenance Occupations by Sex
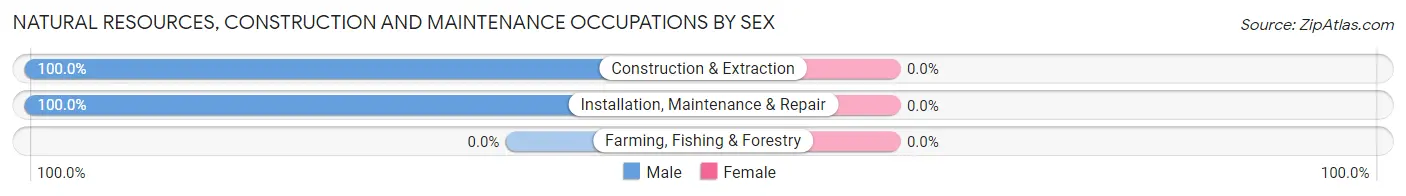
| Occupation | Male | Female |
| Farming, Fishing & Forestry | 0 (0.0%) | 0 (0.0%) |
| Construction & Extraction | 12 (100.0%) | 0 (0.0%) |
| Installation, Maintenance & Repair | 2 (100.0%) | 0 (0.0%) |
| Total (Category) | 14 (100.0%) | 0 (0.0%) |
| Total (Overall) | 77 (62.6%) | 46 (37.4%) |
Production, Transportation and Moving Occupations
The most common Production, Transportation and Moving occupations in Chester are Transportation (11 | 8.9%), Material Moving (7 | 5.7%), and Production (4 | 3.3%).
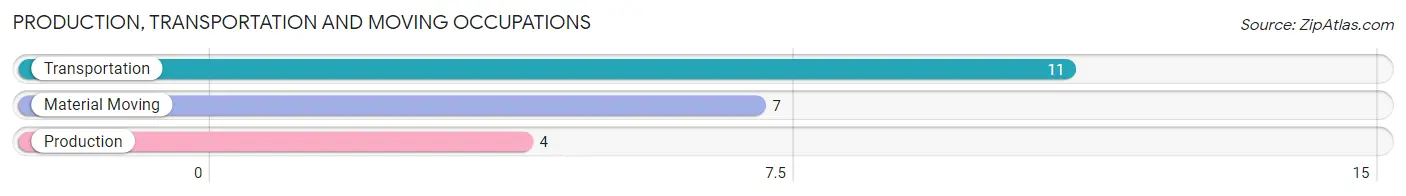
Production, Transportation and Moving Occupations by Sex
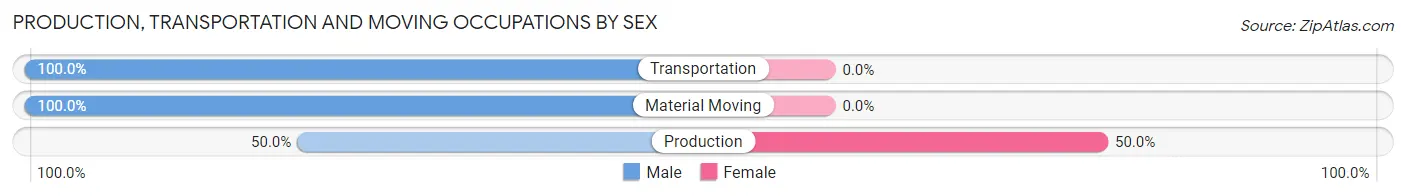
| Occupation | Male | Female |
| Production | 2 (50.0%) | 2 (50.0%) |
| Transportation | 11 (100.0%) | 0 (0.0%) |
| Material Moving | 7 (100.0%) | 0 (0.0%) |
| Total (Category) | 20 (90.9%) | 2 (9.1%) |
| Total (Overall) | 77 (62.6%) | 46 (37.4%) |
Employment Industries by Sex in Chester
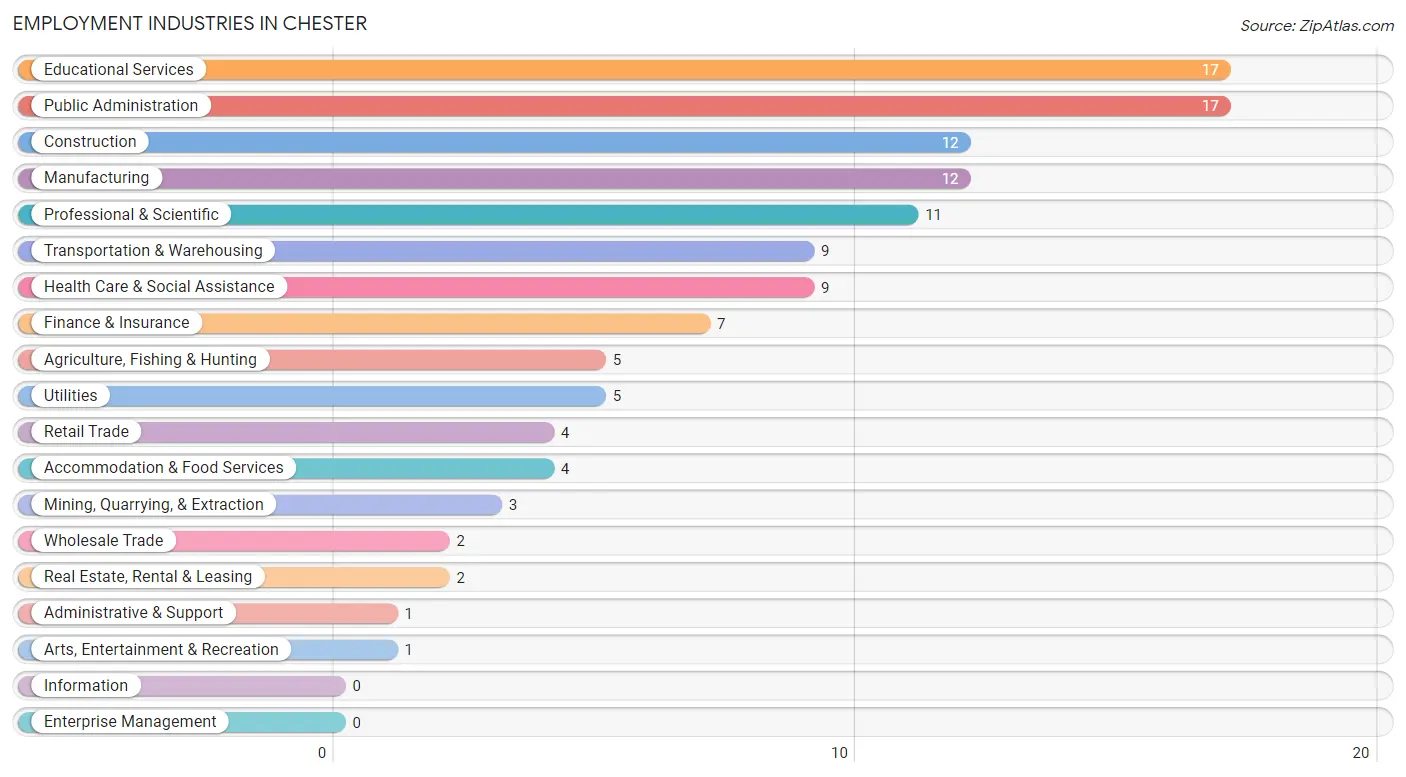
Employment Industries in Chester
The major employment industries in Chester include Educational Services (17 | 13.8%), Public Administration (17 | 13.8%), Construction (12 | 9.8%), Manufacturing (12 | 9.8%), and Professional & Scientific (11 | 8.9%).
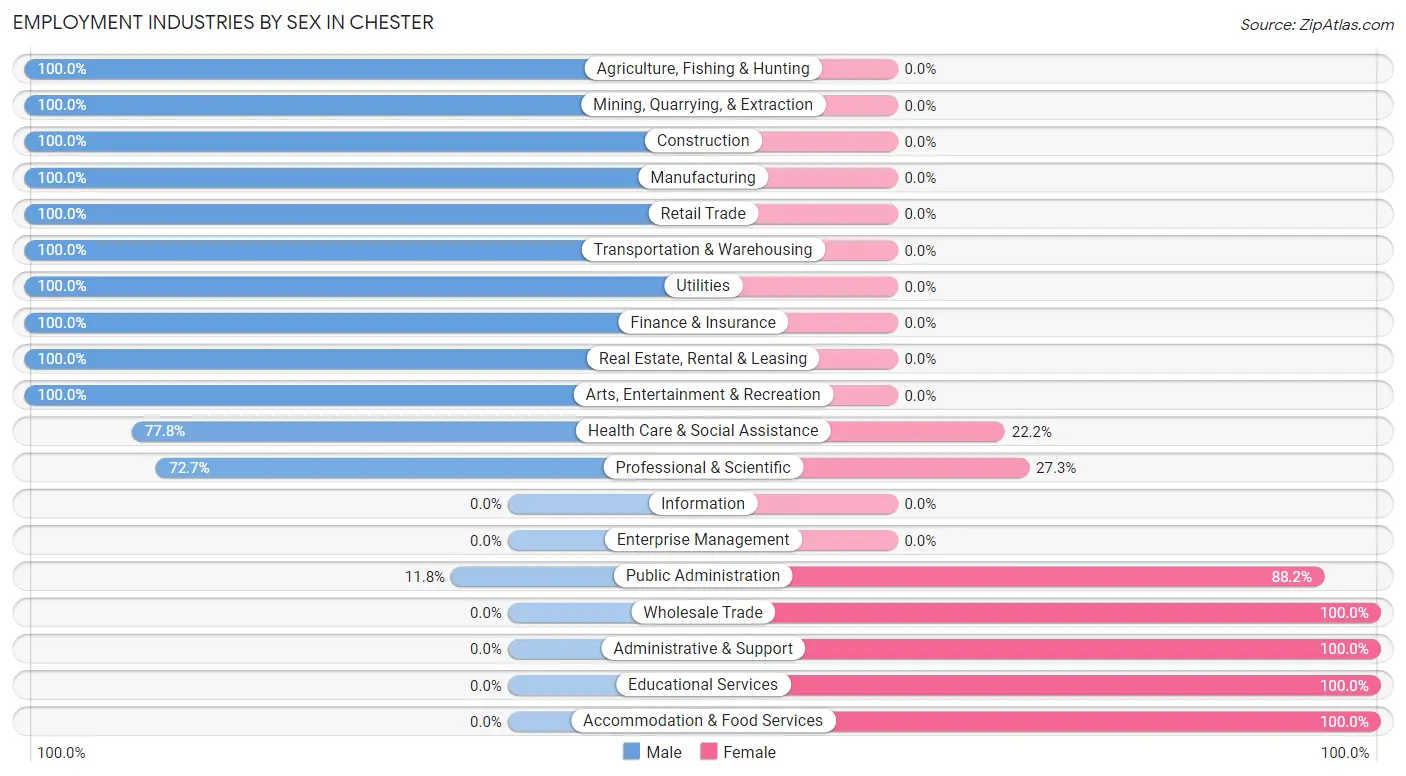
Employment Industries by Sex in Chester
The Chester industries that see more men than women are Agriculture, Fishing & Hunting (100.0%), Mining, Quarrying, & Extraction (100.0%), and Construction (100.0%), whereas the industries that tend to have a higher number of women are Wholesale Trade (100.0%), Administrative & Support (100.0%), and Educational Services (100.0%).
| Industry | Male | Female |
| Agriculture, Fishing & Hunting | 5 (100.0%) | 0 (0.0%) |
| Mining, Quarrying, & Extraction | 3 (100.0%) | 0 (0.0%) |
| Construction | 12 (100.0%) | 0 (0.0%) |
| Manufacturing | 12 (100.0%) | 0 (0.0%) |
| Wholesale Trade | 0 (0.0%) | 2 (100.0%) |
| Retail Trade | 4 (100.0%) | 0 (0.0%) |
| Transportation & Warehousing | 9 (100.0%) | 0 (0.0%) |
| Utilities | 5 (100.0%) | 0 (0.0%) |
| Information | 0 (0.0%) | 0 (0.0%) |
| Finance & Insurance | 7 (100.0%) | 0 (0.0%) |
| Real Estate, Rental & Leasing | 2 (100.0%) | 0 (0.0%) |
| Professional & Scientific | 8 (72.7%) | 3 (27.3%) |
| Enterprise Management | 0 (0.0%) | 0 (0.0%) |
| Administrative & Support | 0 (0.0%) | 1 (100.0%) |
| Educational Services | 0 (0.0%) | 17 (100.0%) |
| Health Care & Social Assistance | 7 (77.8%) | 2 (22.2%) |
| Arts, Entertainment & Recreation | 1 (100.0%) | 0 (0.0%) |
| Accommodation & Food Services | 0 (0.0%) | 4 (100.0%) |
| Public Administration | 2 (11.8%) | 15 (88.2%) |
| Total | 77 (62.6%) | 46 (37.4%) |
Education in Chester
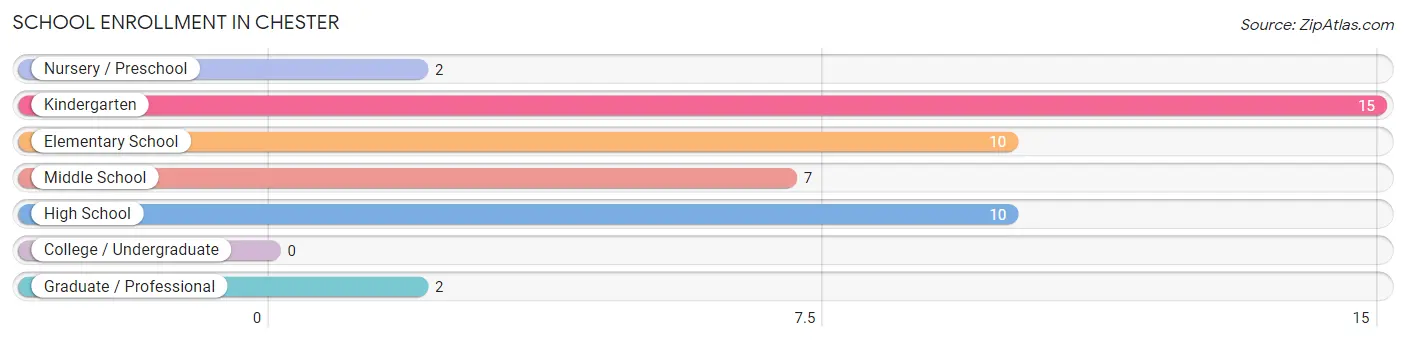
School Enrollment in Chester
The most common levels of schooling among the 46 students in Chester are kindergarten (15 | 32.6%), elementary school (10 | 21.7%), and high school (10 | 21.7%).
| School Level | # Students | % Students |
| Nursery / Preschool | 2 | 4.3% |
| Kindergarten | 15 | 32.6% |
| Elementary School | 10 | 21.7% |
| Middle School | 7 | 15.2% |
| High School | 10 | 21.7% |
| College / Undergraduate | 0 | 0.0% |
| Graduate / Professional | 2 | 4.3% |
| Total | 46 | 100.0% |
School Enrollment by Age by Funding Source in Chester
Out of a total of 46 students who are enrolled in schools in Chester, 4 (8.7%) attend a private institution, while the remaining 42 (91.3%) are enrolled in public schools. The age group of 3 to 4 year olds has the highest likelihood of being enrolled in private schools, with 2 (100.0% in the age bracket) enrolled. Conversely, the age group of 5 to 9 year old has the lowest likelihood of being enrolled in a private school, with 25 (100.0% in the age bracket) attending a public institution.
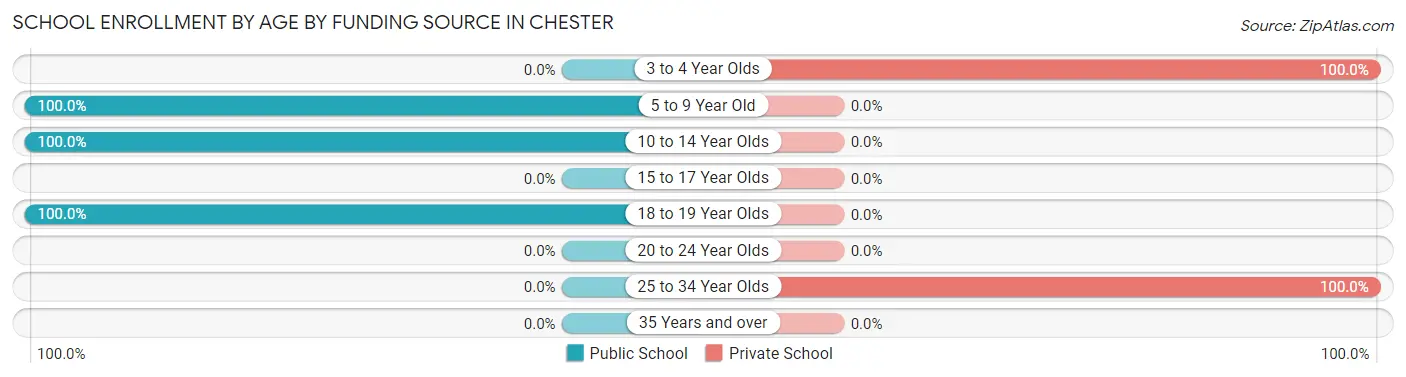
| Age Bracket | Public School | Private School |
| 3 to 4 Year Olds | 0 (0.0%) | 2 (100.0%) |
| 5 to 9 Year Old | 25 (100.0%) | 0 (0.0%) |
| 10 to 14 Year Olds | 7 (100.0%) | 0 (0.0%) |
| 15 to 17 Year Olds | 0 (0.0%) | 0 (0.0%) |
| 18 to 19 Year Olds | 10 (100.0%) | 0 (0.0%) |
| 20 to 24 Year Olds | 0 (0.0%) | 0 (0.0%) |
| 25 to 34 Year Olds | 0 (0.0%) | 2 (100.0%) |
| 35 Years and over | 0 (0.0%) | 0 (0.0%) |
| Total | 42 (91.3%) | 4 (8.7%) |
Educational Attainment by Field of Study in Chester
Education (16 | 41.0%), business (6 | 15.4%), bio, nature & agricultural (5 | 12.8%), communications (4 | 10.3%), and arts & humanities (4 | 10.3%) are the most common fields of study among 39 individuals in Chester who have obtained a bachelor's degree or higher.
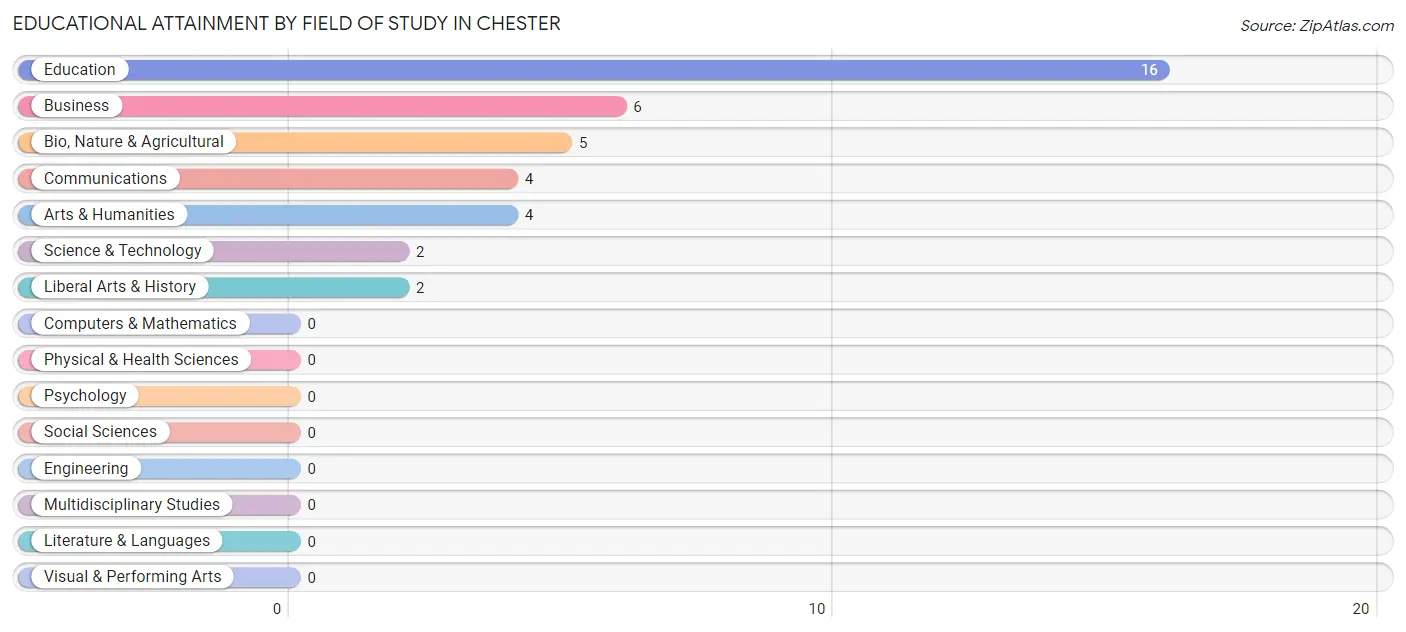
| Field of Study | # Graduates | % Graduates |
| Computers & Mathematics | 0 | 0.0% |
| Bio, Nature & Agricultural | 5 | 12.8% |
| Physical & Health Sciences | 0 | 0.0% |
| Psychology | 0 | 0.0% |
| Social Sciences | 0 | 0.0% |
| Engineering | 0 | 0.0% |
| Multidisciplinary Studies | 0 | 0.0% |
| Science & Technology | 2 | 5.1% |
| Business | 6 | 15.4% |
| Education | 16 | 41.0% |
| Literature & Languages | 0 | 0.0% |
| Liberal Arts & History | 2 | 5.1% |
| Visual & Performing Arts | 0 | 0.0% |
| Communications | 4 | 10.3% |
| Arts & Humanities | 4 | 10.3% |
| Total | 39 | 100.0% |
Transportation & Commute in Chester
Vehicle Availability by Sex in Chester
The most prevalent vehicle ownership categories in Chester are males with 2 vehicles (59, accounting for 76.6%) and females with 2 vehicles (31, making up 128.3%).
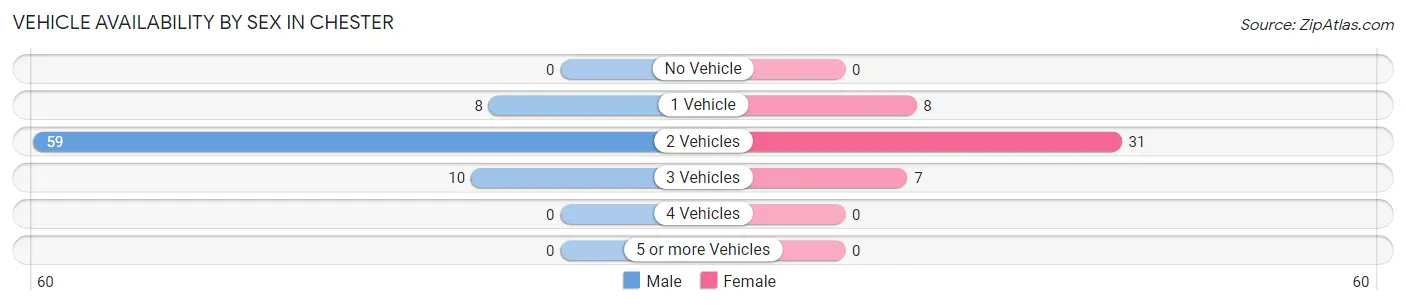
| Vehicles Available | Male | Female |
| No Vehicle | 0 (0.0%) | 0 (0.0%) |
| 1 Vehicle | 8 (10.4%) | 8 (17.4%) |
| 2 Vehicles | 59 (76.6%) | 31 (67.4%) |
| 3 Vehicles | 10 (13.0%) | 7 (15.2%) |
| 4 Vehicles | 0 (0.0%) | 0 (0.0%) |
| 5 or more Vehicles | 0 (0.0%) | 0 (0.0%) |
| Total | 77 (100.0%) | 46 (100.0%) |
Commute Time in Chester
The most frequently occuring commute durations in Chester are 15 to 19 minutes (34 commuters, 30.1%), 60 to 89 minutes (20 commuters, 17.7%), and 45 to 59 minutes (14 commuters, 12.4%).
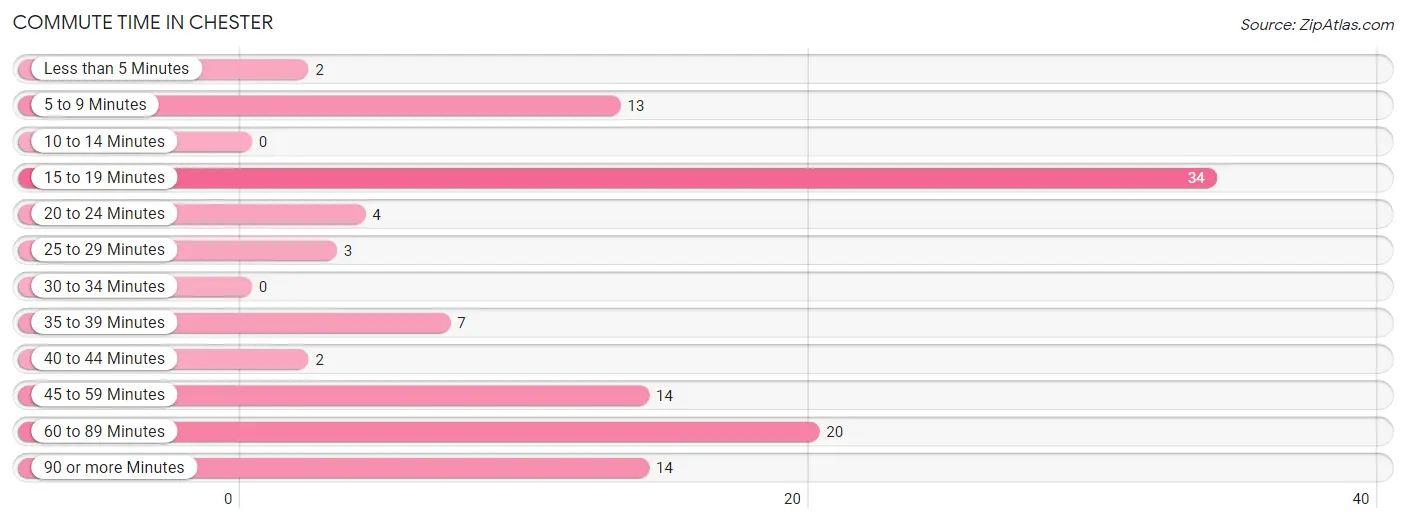
| Commute Time | # Commuters | % Commuters |
| Less than 5 Minutes | 2 | 1.8% |
| 5 to 9 Minutes | 13 | 11.5% |
| 10 to 14 Minutes | 0 | 0.0% |
| 15 to 19 Minutes | 34 | 30.1% |
| 20 to 24 Minutes | 4 | 3.5% |
| 25 to 29 Minutes | 3 | 2.6% |
| 30 to 34 Minutes | 0 | 0.0% |
| 35 to 39 Minutes | 7 | 6.2% |
| 40 to 44 Minutes | 2 | 1.8% |
| 45 to 59 Minutes | 14 | 12.4% |
| 60 to 89 Minutes | 20 | 17.7% |
| 90 or more Minutes | 14 | 12.4% |
Commute Time by Sex in Chester
The most common commute times in Chester are 15 to 19 minutes (18 commuters, 25.7%) for males and 15 to 19 minutes (16 commuters, 37.2%) for females.
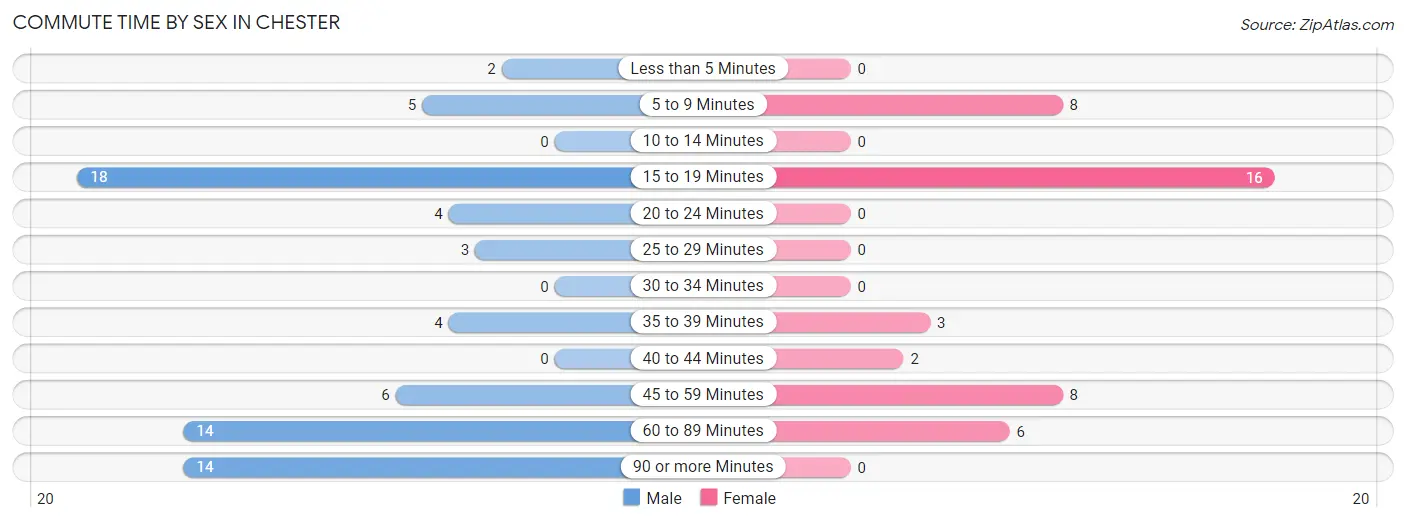
| Commute Time | Male | Female |
| Less than 5 Minutes | 2 (2.9%) | 0 (0.0%) |
| 5 to 9 Minutes | 5 (7.1%) | 8 (18.6%) |
| 10 to 14 Minutes | 0 (0.0%) | 0 (0.0%) |
| 15 to 19 Minutes | 18 (25.7%) | 16 (37.2%) |
| 20 to 24 Minutes | 4 (5.7%) | 0 (0.0%) |
| 25 to 29 Minutes | 3 (4.3%) | 0 (0.0%) |
| 30 to 34 Minutes | 0 (0.0%) | 0 (0.0%) |
| 35 to 39 Minutes | 4 (5.7%) | 3 (7.0%) |
| 40 to 44 Minutes | 0 (0.0%) | 2 (4.6%) |
| 45 to 59 Minutes | 6 (8.6%) | 8 (18.6%) |
| 60 to 89 Minutes | 14 (20.0%) | 6 (14.0%) |
| 90 or more Minutes | 14 (20.0%) | 0 (0.0%) |
Time of Departure to Work by Sex in Chester
The most frequent times of departure to work in Chester are 7:00 AM to 7:29 AM (21, 30.0%) for males and 6:30 AM to 6:59 AM (13, 30.2%) for females.
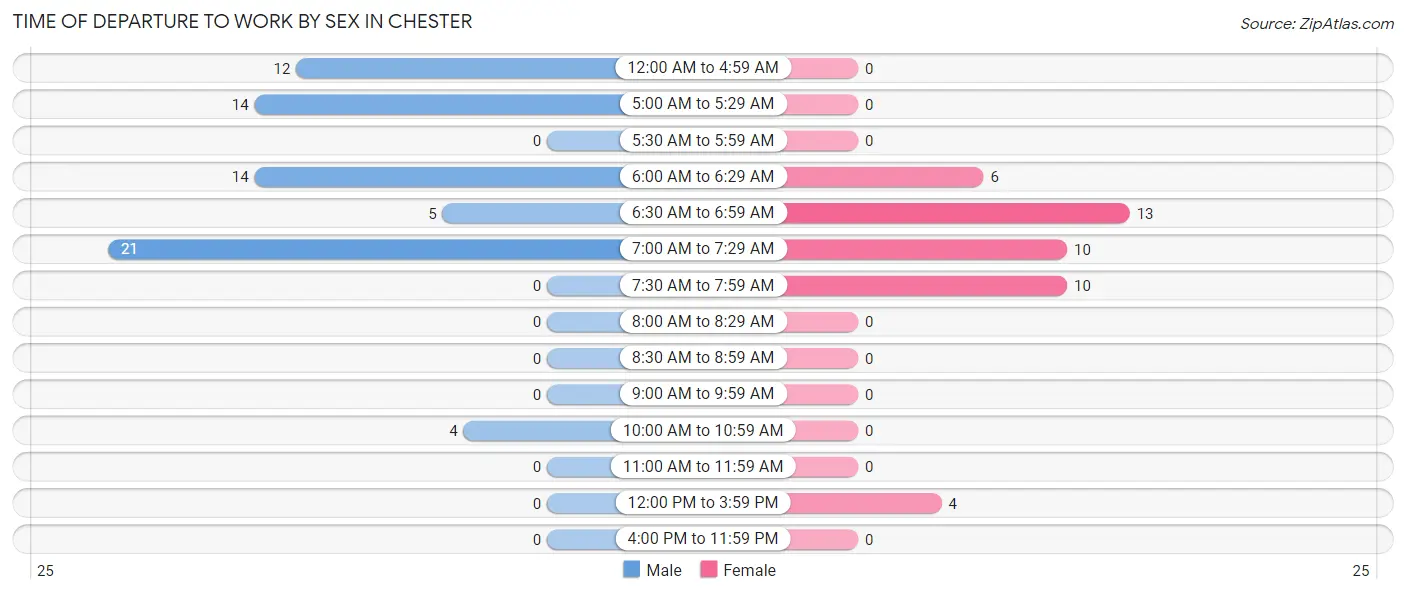
| Time of Departure | Male | Female |
| 12:00 AM to 4:59 AM | 12 (17.1%) | 0 (0.0%) |
| 5:00 AM to 5:29 AM | 14 (20.0%) | 0 (0.0%) |
| 5:30 AM to 5:59 AM | 0 (0.0%) | 0 (0.0%) |
| 6:00 AM to 6:29 AM | 14 (20.0%) | 6 (14.0%) |
| 6:30 AM to 6:59 AM | 5 (7.1%) | 13 (30.2%) |
| 7:00 AM to 7:29 AM | 21 (30.0%) | 10 (23.3%) |
| 7:30 AM to 7:59 AM | 0 (0.0%) | 10 (23.3%) |
| 8:00 AM to 8:29 AM | 0 (0.0%) | 0 (0.0%) |
| 8:30 AM to 8:59 AM | 0 (0.0%) | 0 (0.0%) |
| 9:00 AM to 9:59 AM | 0 (0.0%) | 0 (0.0%) |
| 10:00 AM to 10:59 AM | 4 (5.7%) | 0 (0.0%) |
| 11:00 AM to 11:59 AM | 0 (0.0%) | 0 (0.0%) |
| 12:00 PM to 3:59 PM | 0 (0.0%) | 4 (9.3%) |
| 4:00 PM to 11:59 PM | 0 (0.0%) | 0 (0.0%) |
| Total | 70 (100.0%) | 43 (100.0%) |
Housing Occupancy in Chester
Occupancy by Ownership in Chester
Of the total 98 dwellings in Chester, owner-occupied units account for 83 (84.7%), while renter-occupied units make up 15 (15.3%).
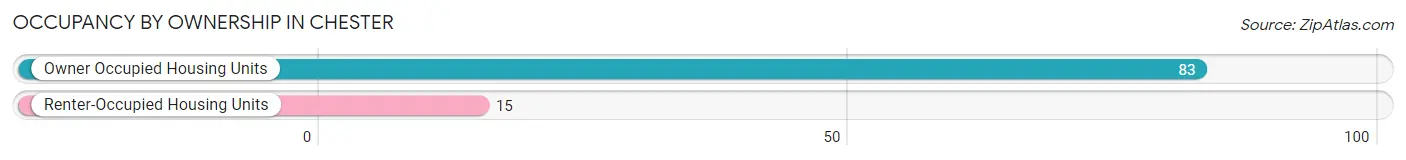
| Occupancy | # Housing Units | % Housing Units |
| Owner Occupied Housing Units | 83 | 84.7% |
| Renter-Occupied Housing Units | 15 | 15.3% |
| Total Occupied Housing Units | 98 | 100.0% |
Occupancy by Household Size in Chester
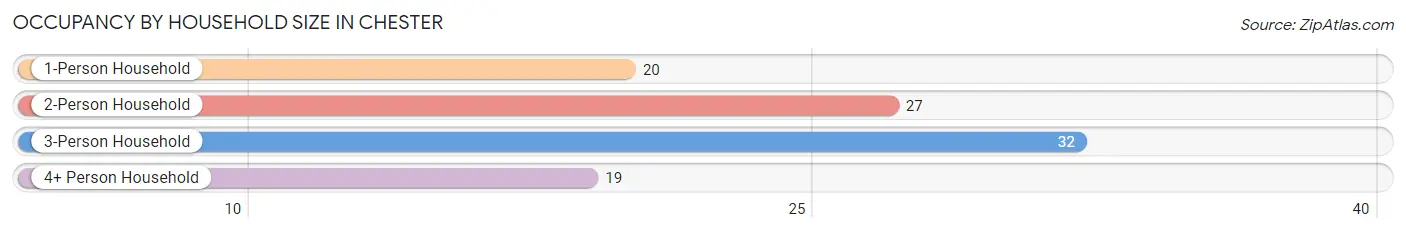
| Household Size | # Housing Units | % Housing Units |
| 1-Person Household | 20 | 20.4% |
| 2-Person Household | 27 | 27.6% |
| 3-Person Household | 32 | 32.7% |
| 4+ Person Household | 19 | 19.4% |
| Total Housing Units | 98 | 100.0% |
Occupancy by Ownership by Household Size in Chester
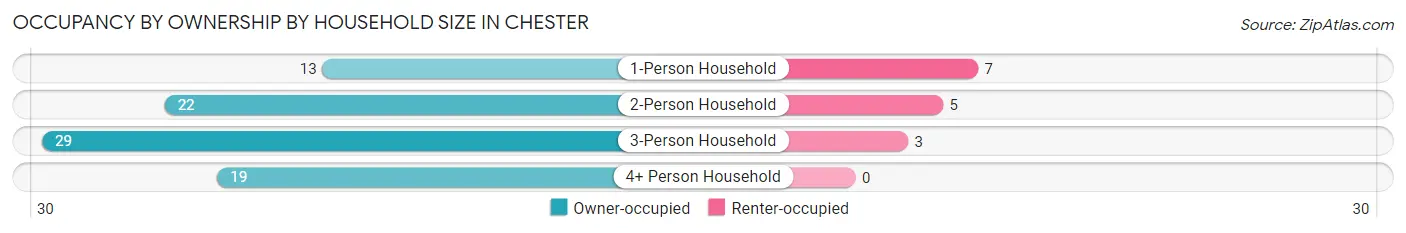
| Household Size | Owner-occupied | Renter-occupied |
| 1-Person Household | 13 (65.0%) | 7 (35.0%) |
| 2-Person Household | 22 (81.5%) | 5 (18.5%) |
| 3-Person Household | 29 (90.6%) | 3 (9.4%) |
| 4+ Person Household | 19 (100.0%) | 0 (0.0%) |
| Total Housing Units | 83 (84.7%) | 15 (15.3%) |
Occupancy by Educational Attainment in Chester
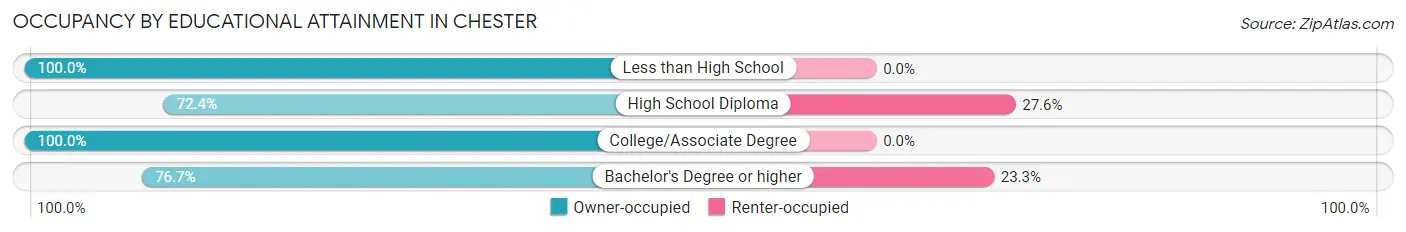
| Household Size | Owner-occupied | Renter-occupied |
| Less than High School | 14 (100.0%) | 0 (0.0%) |
| High School Diploma | 21 (72.4%) | 8 (27.6%) |
| College/Associate Degree | 25 (100.0%) | 0 (0.0%) |
| Bachelor's Degree or higher | 23 (76.7%) | 7 (23.3%) |
Occupancy by Age of Householder in Chester
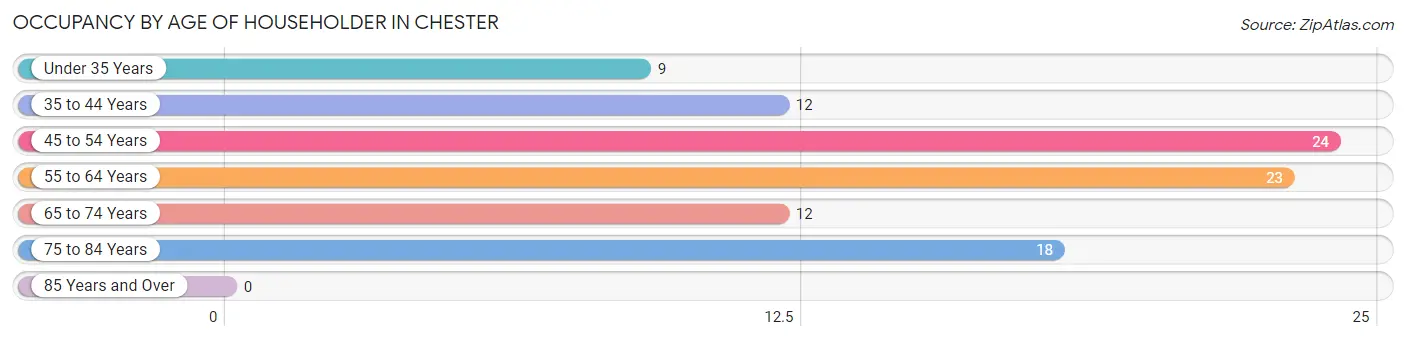
| Age Bracket | # Households | % Households |
| Under 35 Years | 9 | 9.2% |
| 35 to 44 Years | 12 | 12.2% |
| 45 to 54 Years | 24 | 24.5% |
| 55 to 64 Years | 23 | 23.5% |
| 65 to 74 Years | 12 | 12.2% |
| 75 to 84 Years | 18 | 18.4% |
| 85 Years and Over | 0 | 0.0% |
| Total | 98 | 100.0% |
Housing Finances in Chester
Median Income by Occupancy in Chester
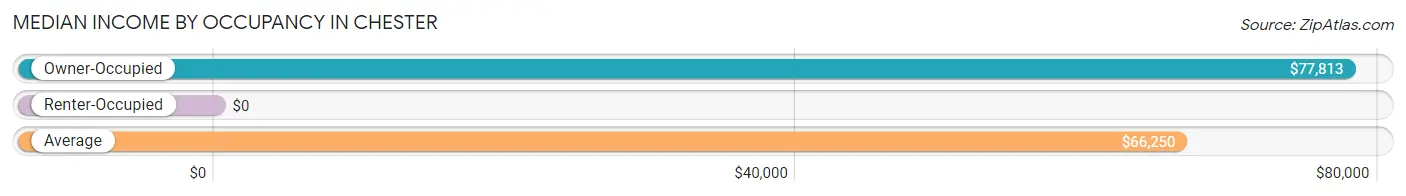
| Occupancy Type | # Households | Median Income |
| Owner-Occupied | 83 (84.7%) | $77,813 |
| Renter-Occupied | 15 (15.3%) | $0 |
| Average | 98 (100.0%) | $66,250 |
Occupancy by Householder Income Bracket in Chester
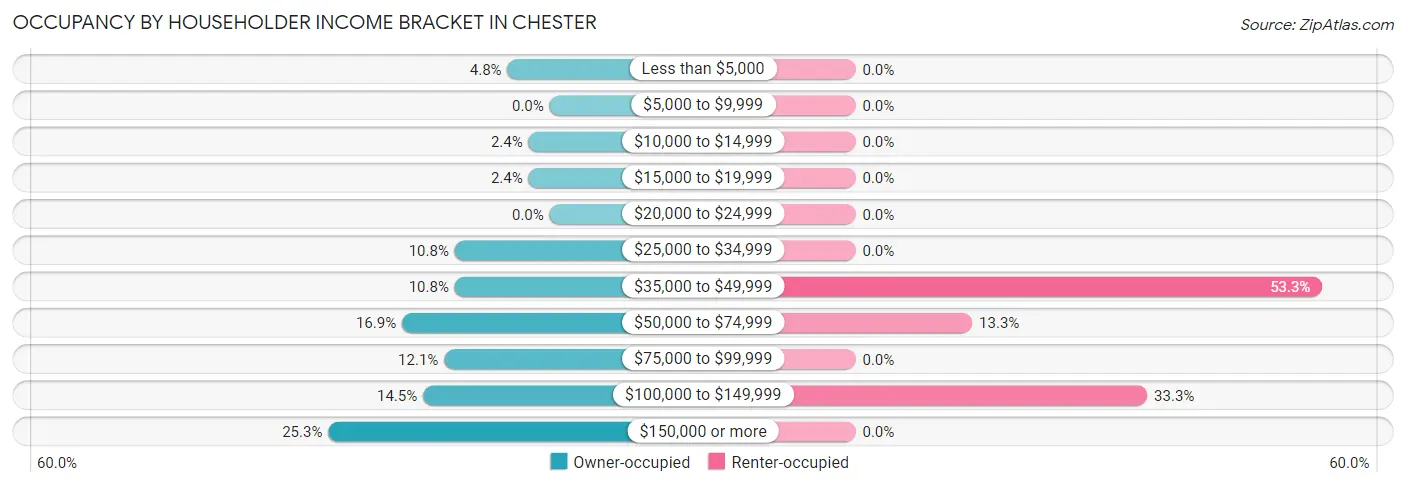
| Income Bracket | Owner-occupied | Renter-occupied |
| Less than $5,000 | 4 (4.8%) | 0 (0.0%) |
| $5,000 to $9,999 | 0 (0.0%) | 0 (0.0%) |
| $10,000 to $14,999 | 2 (2.4%) | 0 (0.0%) |
| $15,000 to $19,999 | 2 (2.4%) | 0 (0.0%) |
| $20,000 to $24,999 | 0 (0.0%) | 0 (0.0%) |
| $25,000 to $34,999 | 9 (10.8%) | 0 (0.0%) |
| $35,000 to $49,999 | 9 (10.8%) | 8 (53.3%) |
| $50,000 to $74,999 | 14 (16.9%) | 2 (13.3%) |
| $75,000 to $99,999 | 10 (12.0%) | 0 (0.0%) |
| $100,000 to $149,999 | 12 (14.5%) | 5 (33.3%) |
| $150,000 or more | 21 (25.3%) | 0 (0.0%) |
| Total | 83 (100.0%) | 15 (100.0%) |
Monthly Housing Cost Tiers in Chester
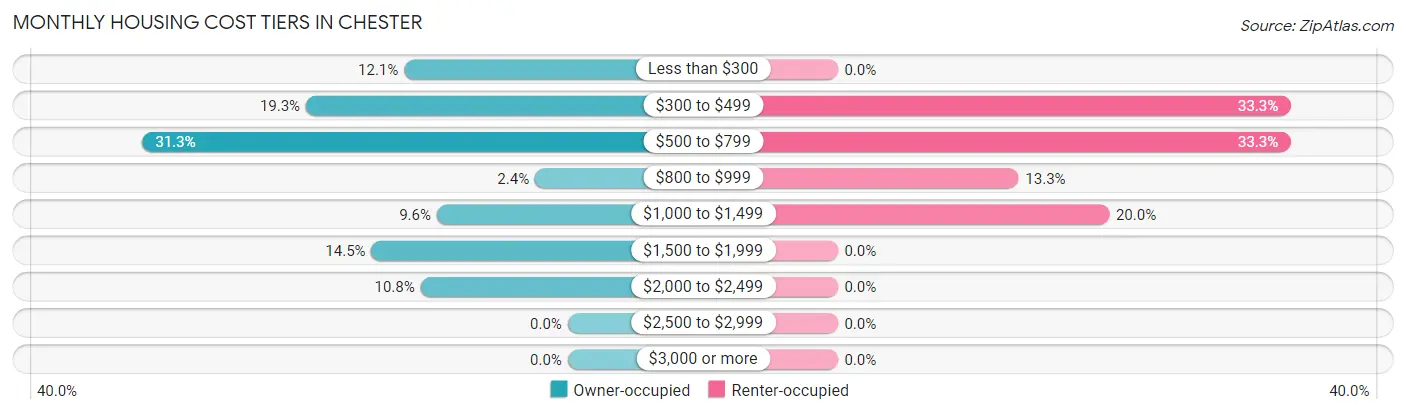
| Monthly Cost | Owner-occupied | Renter-occupied |
| Less than $300 | 10 (12.0%) | 0 (0.0%) |
| $300 to $499 | 16 (19.3%) | 5 (33.3%) |
| $500 to $799 | 26 (31.3%) | 5 (33.3%) |
| $800 to $999 | 2 (2.4%) | 2 (13.3%) |
| $1,000 to $1,499 | 8 (9.6%) | 3 (20.0%) |
| $1,500 to $1,999 | 12 (14.5%) | 0 (0.0%) |
| $2,000 to $2,499 | 9 (10.8%) | 0 (0.0%) |
| $2,500 to $2,999 | 0 (0.0%) | 0 (0.0%) |
| $3,000 or more | 0 (0.0%) | 0 (0.0%) |
| Total | 83 (100.0%) | 15 (100.0%) |
Physical Housing Characteristics in Chester
Housing Structures in Chester
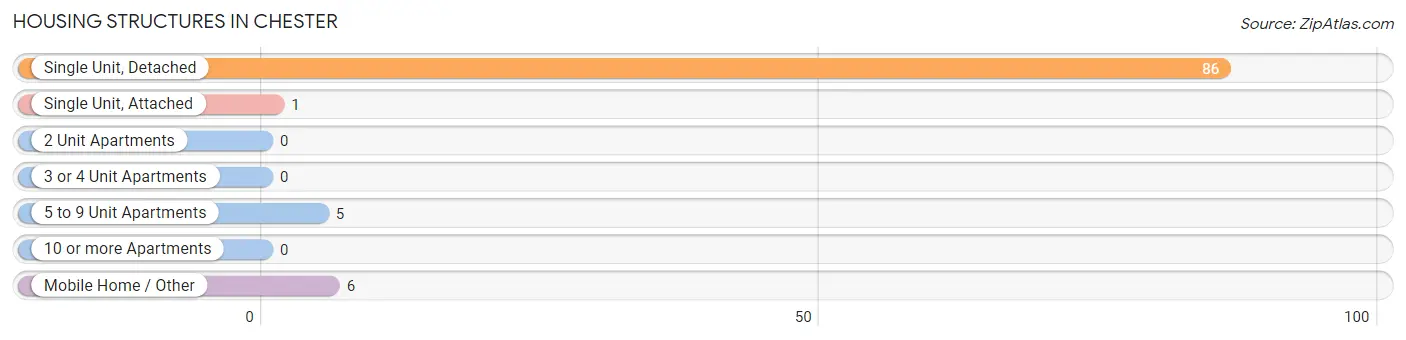
| Structure Type | # Housing Units | % Housing Units |
| Single Unit, Detached | 86 | 87.8% |
| Single Unit, Attached | 1 | 1.0% |
| 2 Unit Apartments | 0 | 0.0% |
| 3 or 4 Unit Apartments | 0 | 0.0% |
| 5 to 9 Unit Apartments | 5 | 5.1% |
| 10 or more Apartments | 0 | 0.0% |
| Mobile Home / Other | 6 | 6.1% |
| Total | 98 | 100.0% |
Housing Structures by Occupancy in Chester
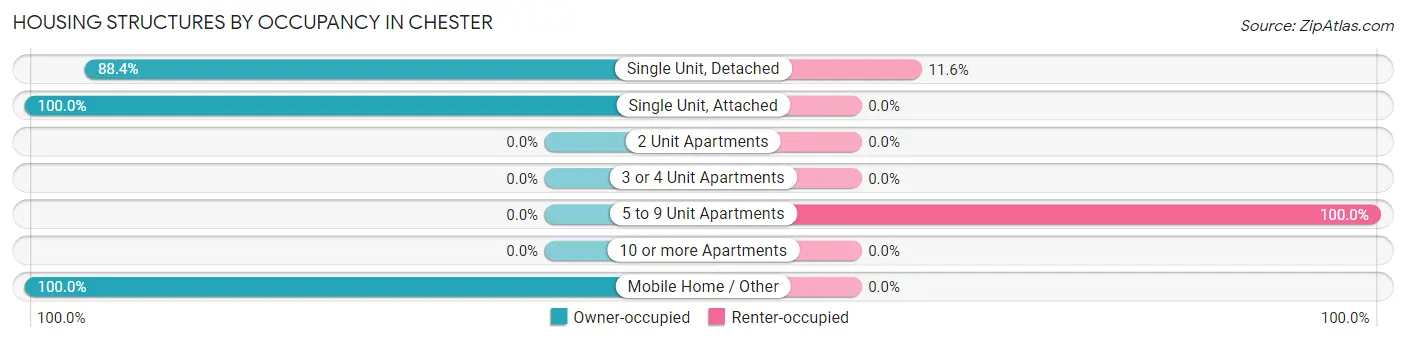
| Structure Type | Owner-occupied | Renter-occupied |
| Single Unit, Detached | 76 (88.4%) | 10 (11.6%) |
| Single Unit, Attached | 1 (100.0%) | 0 (0.0%) |
| 2 Unit Apartments | 0 (0.0%) | 0 (0.0%) |
| 3 or 4 Unit Apartments | 0 (0.0%) | 0 (0.0%) |
| 5 to 9 Unit Apartments | 0 (0.0%) | 5 (100.0%) |
| 10 or more Apartments | 0 (0.0%) | 0 (0.0%) |
| Mobile Home / Other | 6 (100.0%) | 0 (0.0%) |
| Total | 83 (84.7%) | 15 (15.3%) |
Housing Structures by Number of Rooms in Chester
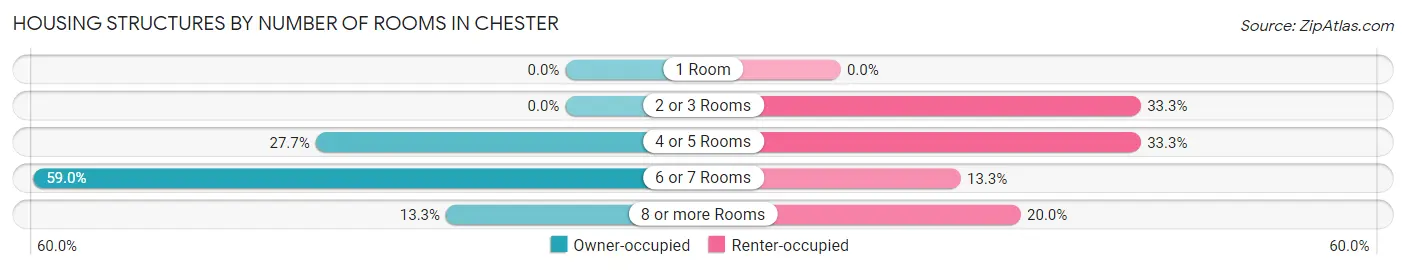
| Number of Rooms | Owner-occupied | Renter-occupied |
| 1 Room | 0 (0.0%) | 0 (0.0%) |
| 2 or 3 Rooms | 0 (0.0%) | 5 (33.3%) |
| 4 or 5 Rooms | 23 (27.7%) | 5 (33.3%) |
| 6 or 7 Rooms | 49 (59.0%) | 2 (13.3%) |
| 8 or more Rooms | 11 (13.3%) | 3 (20.0%) |
| Total | 83 (100.0%) | 15 (100.0%) |
Housing Structure by Heating Type in Chester
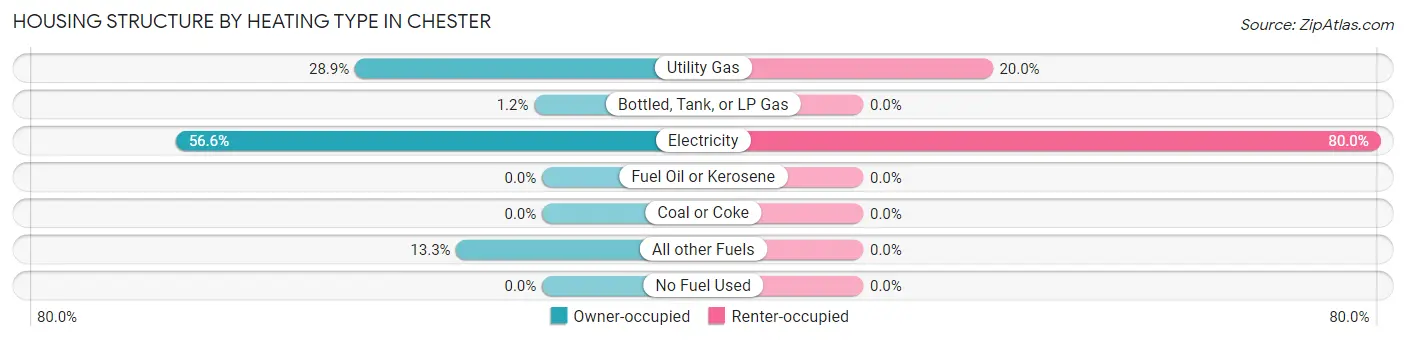
| Heating Type | Owner-occupied | Renter-occupied |
| Utility Gas | 24 (28.9%) | 3 (20.0%) |
| Bottled, Tank, or LP Gas | 1 (1.2%) | 0 (0.0%) |
| Electricity | 47 (56.6%) | 12 (80.0%) |
| Fuel Oil or Kerosene | 0 (0.0%) | 0 (0.0%) |
| Coal or Coke | 0 (0.0%) | 0 (0.0%) |
| All other Fuels | 11 (13.3%) | 0 (0.0%) |
| No Fuel Used | 0 (0.0%) | 0 (0.0%) |
| Total | 83 (100.0%) | 15 (100.0%) |
Household Vehicle Usage in Chester
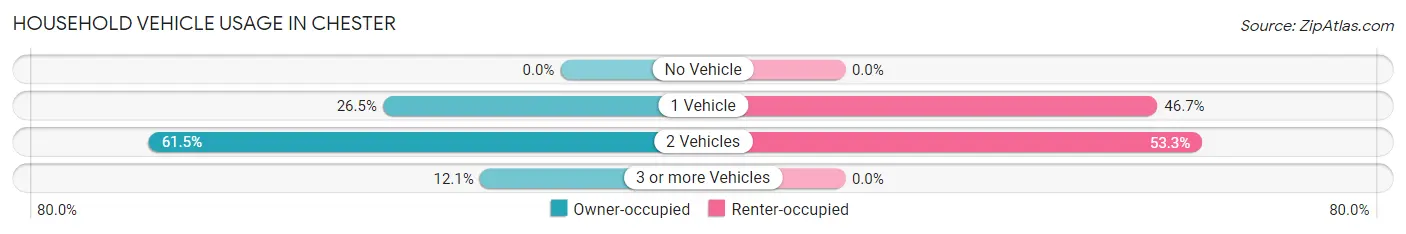
| Vehicles per Household | Owner-occupied | Renter-occupied |
| No Vehicle | 0 (0.0%) | 0 (0.0%) |
| 1 Vehicle | 22 (26.5%) | 7 (46.7%) |
| 2 Vehicles | 51 (61.5%) | 8 (53.3%) |
| 3 or more Vehicles | 10 (12.0%) | 0 (0.0%) |
| Total | 83 (100.0%) | 15 (100.0%) |
Real Estate & Mortgages in Chester
Real Estate and Mortgage Overview in Chester
| Characteristic | Without Mortgage | With Mortgage |
| Housing Units | 48 | 35 |
| Median Property Value | $89,000 | $0 |
| Median Household Income | $53,750 | $14 |
| Monthly Housing Costs | $478 | $0 |
| Real Estate Taxes | $1,107 | $0 |
Property Value by Mortgage Status in Chester
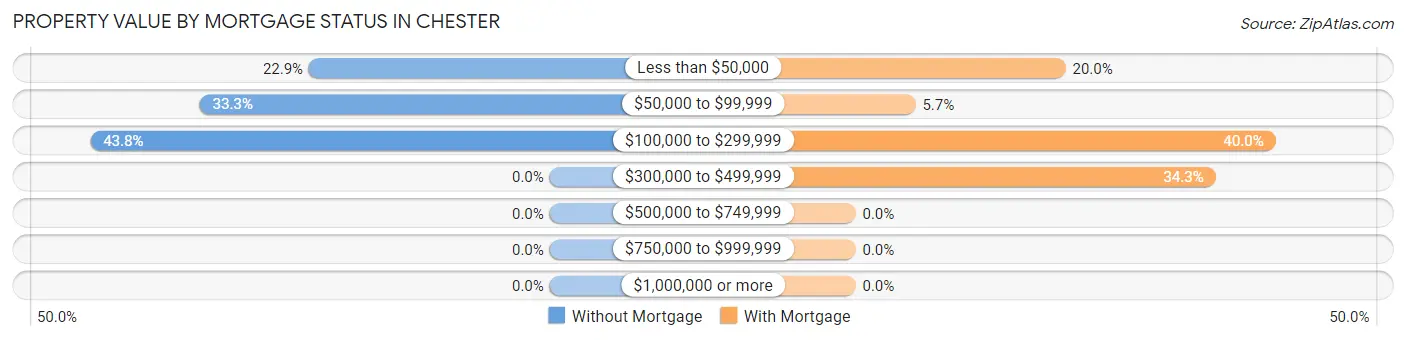
| Property Value | Without Mortgage | With Mortgage |
| Less than $50,000 | 11 (22.9%) | 7 (20.0%) |
| $50,000 to $99,999 | 16 (33.3%) | 2 (5.7%) |
| $100,000 to $299,999 | 21 (43.8%) | 14 (40.0%) |
| $300,000 to $499,999 | 0 (0.0%) | 12 (34.3%) |
| $500,000 to $749,999 | 0 (0.0%) | 0 (0.0%) |
| $750,000 to $999,999 | 0 (0.0%) | 0 (0.0%) |
| $1,000,000 or more | 0 (0.0%) | 0 (0.0%) |
| Total | 48 (100.0%) | 35 (100.0%) |
Household Income by Mortgage Status in Chester
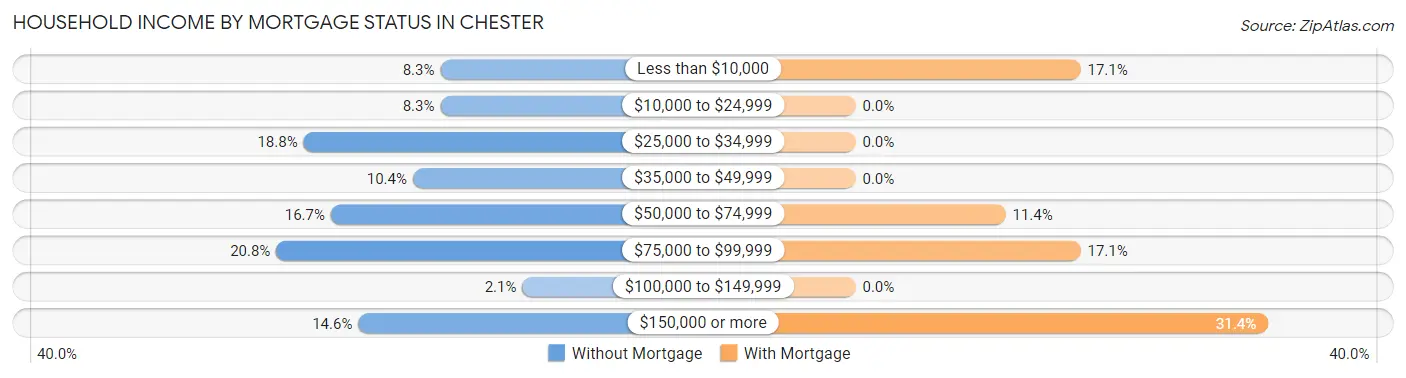
| Household Income | Without Mortgage | With Mortgage |
| Less than $10,000 | 4 (8.3%) | 6 (17.1%) |
| $10,000 to $24,999 | 4 (8.3%) | 0 (0.0%) |
| $25,000 to $34,999 | 9 (18.8%) | 0 (0.0%) |
| $35,000 to $49,999 | 5 (10.4%) | 0 (0.0%) |
| $50,000 to $74,999 | 8 (16.7%) | 4 (11.4%) |
| $75,000 to $99,999 | 10 (20.8%) | 6 (17.1%) |
| $100,000 to $149,999 | 1 (2.1%) | 0 (0.0%) |
| $150,000 or more | 7 (14.6%) | 11 (31.4%) |
| Total | 48 (100.0%) | 35 (100.0%) |
Property Value to Household Income Ratio in Chester
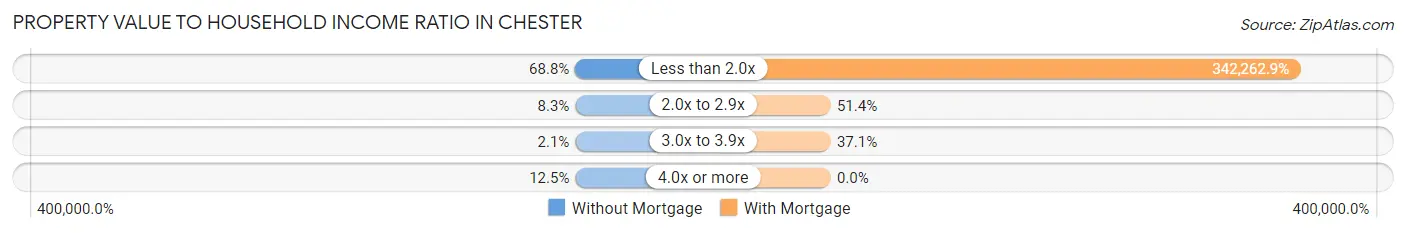
| Value-to-Income Ratio | Without Mortgage | With Mortgage |
| Less than 2.0x | 33 (68.8%) | 119,792 (342,262.9%) |
| 2.0x to 2.9x | 4 (8.3%) | 18 (51.4%) |
| 3.0x to 3.9x | 1 (2.1%) | 13 (37.1%) |
| 4.0x or more | 6 (12.5%) | 0 (0.0%) |
| Total | 48 (100.0%) | 35 (100.0%) |
Real Estate Taxes by Mortgage Status in Chester
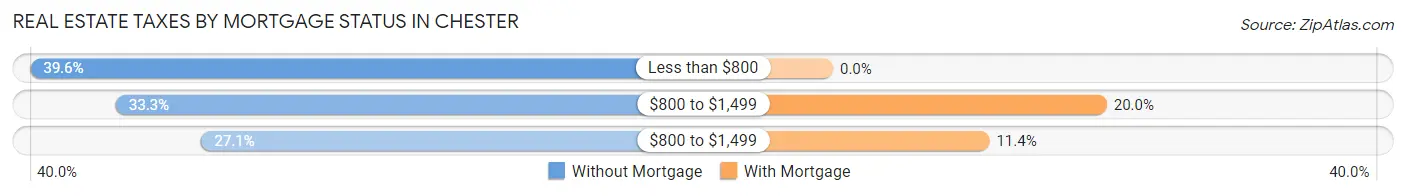
| Property Taxes | Without Mortgage | With Mortgage |
| Less than $800 | 19 (39.6%) | 0 (0.0%) |
| $800 to $1,499 | 16 (33.3%) | 7 (20.0%) |
| $800 to $1,499 | 13 (27.1%) | 4 (11.4%) |
| Total | 48 (100.0%) | 35 (100.0%) |
Health & Disability in Chester
Health Insurance Coverage by Age in Chester
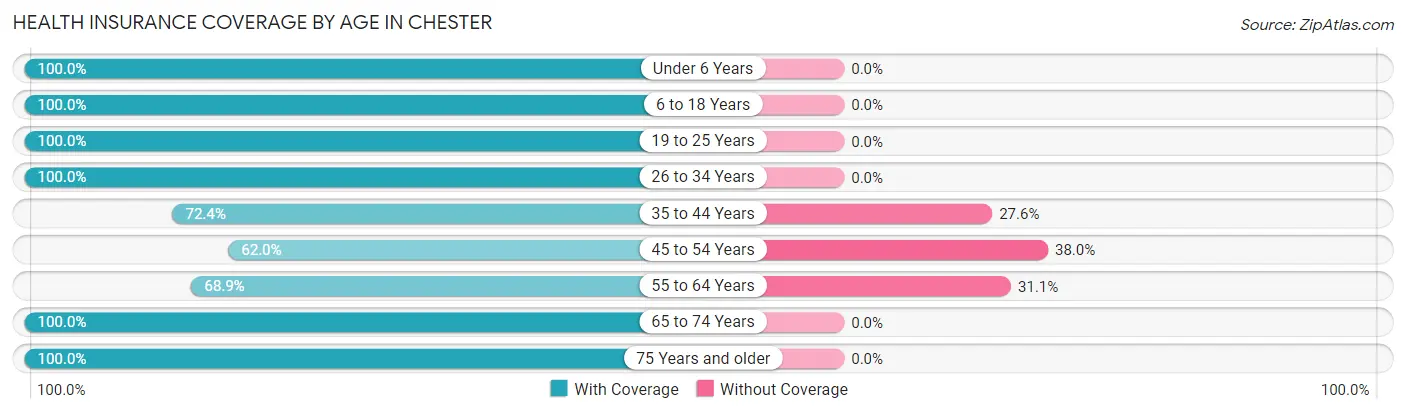
| Age Bracket | With Coverage | Without Coverage |
| Under 6 Years | 10 (100.0%) | 0 (0.0%) |
| 6 to 18 Years | 37 (100.0%) | 0 (0.0%) |
| 19 to 25 Years | 16 (100.0%) | 0 (0.0%) |
| 26 to 34 Years | 16 (100.0%) | 0 (0.0%) |
| 35 to 44 Years | 21 (72.4%) | 8 (27.6%) |
| 45 to 54 Years | 31 (62.0%) | 19 (38.0%) |
| 55 to 64 Years | 31 (68.9%) | 14 (31.1%) |
| 65 to 74 Years | 22 (100.0%) | 0 (0.0%) |
| 75 Years and older | 37 (100.0%) | 0 (0.0%) |
| Total | 221 (84.4%) | 41 (15.7%) |
Health Insurance Coverage by Citizenship Status in Chester
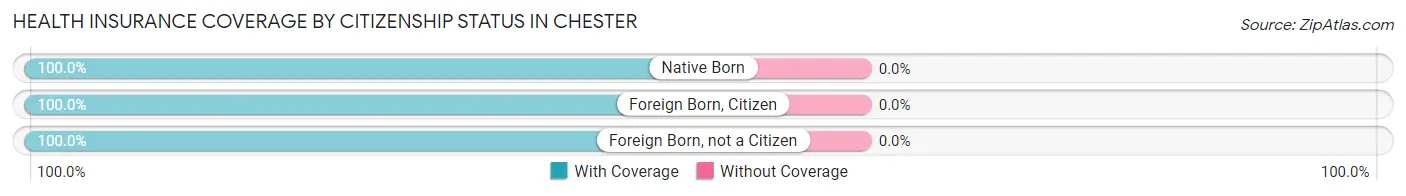
| Citizenship Status | With Coverage | Without Coverage |
| Native Born | 10 (100.0%) | 0 (0.0%) |
| Foreign Born, Citizen | 37 (100.0%) | 0 (0.0%) |
| Foreign Born, not a Citizen | 16 (100.0%) | 0 (0.0%) |
Health Insurance Coverage by Household Income in Chester
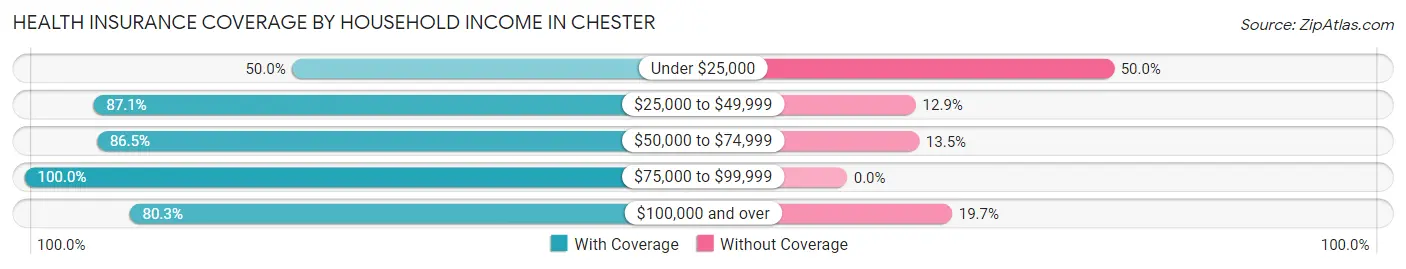
| Household Income | With Coverage | Without Coverage |
| Under $25,000 | 4 (50.0%) | 4 (50.0%) |
| $25,000 to $49,999 | 54 (87.1%) | 8 (12.9%) |
| $50,000 to $74,999 | 32 (86.5%) | 5 (13.5%) |
| $75,000 to $99,999 | 33 (100.0%) | 0 (0.0%) |
| $100,000 and over | 98 (80.3%) | 24 (19.7%) |
Public vs Private Health Insurance Coverage by Age in Chester
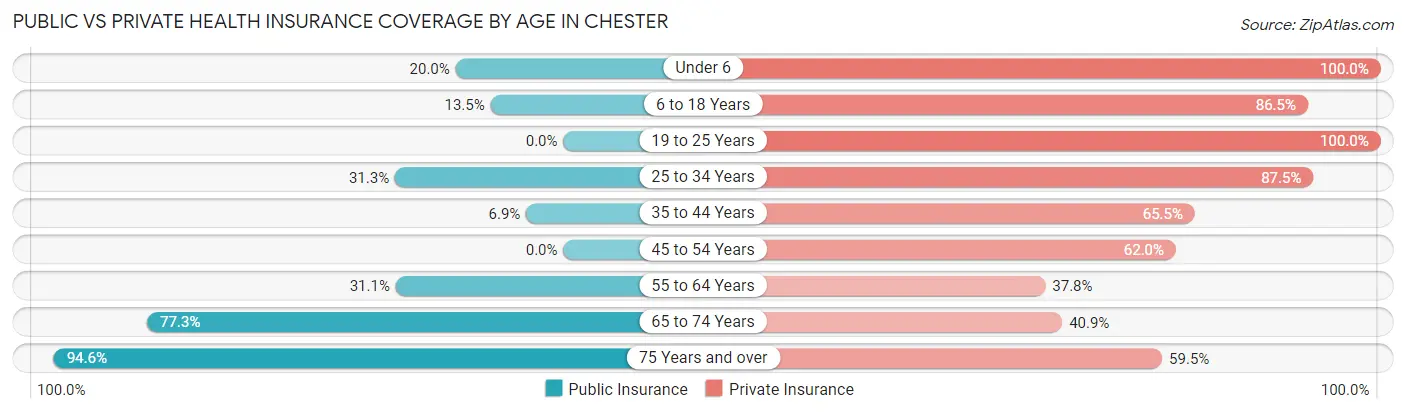
| Age Bracket | Public Insurance | Private Insurance |
| Under 6 | 2 (20.0%) | 10 (100.0%) |
| 6 to 18 Years | 5 (13.5%) | 32 (86.5%) |
| 19 to 25 Years | 0 (0.0%) | 16 (100.0%) |
| 25 to 34 Years | 5 (31.2%) | 14 (87.5%) |
| 35 to 44 Years | 2 (6.9%) | 19 (65.5%) |
| 45 to 54 Years | 0 (0.0%) | 31 (62.0%) |
| 55 to 64 Years | 14 (31.1%) | 17 (37.8%) |
| 65 to 74 Years | 17 (77.3%) | 9 (40.9%) |
| 75 Years and over | 35 (94.6%) | 22 (59.5%) |
| Total | 80 (30.5%) | 170 (64.9%) |
Disability Status by Sex by Age in Chester
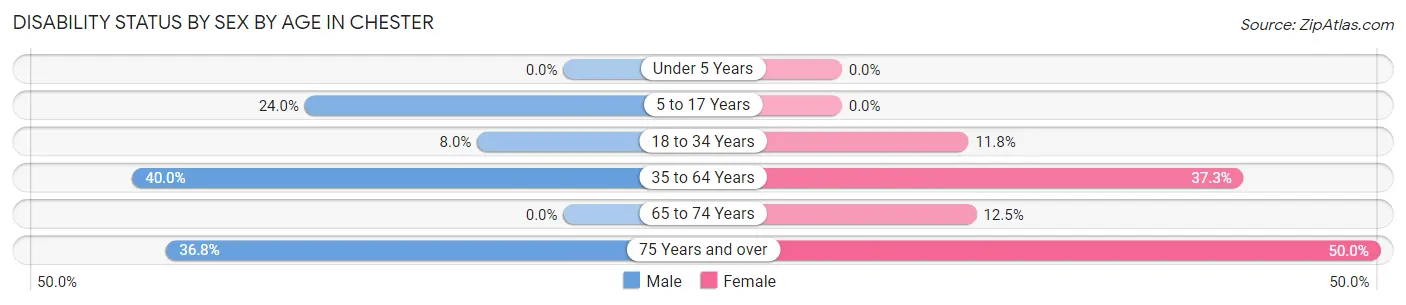
| Age Bracket | Male | Female |
| Under 5 Years | 0 (0.0%) | 0 (0.0%) |
| 5 to 17 Years | 6 (24.0%) | 0 (0.0%) |
| 18 to 34 Years | 2 (8.0%) | 2 (11.8%) |
| 35 to 64 Years | 26 (40.0%) | 22 (37.3%) |
| 65 to 74 Years | 0 (0.0%) | 2 (12.5%) |
| 75 Years and over | 7 (36.8%) | 9 (50.0%) |
Disability Class by Sex by Age in Chester
Disability Class: Hearing Difficulty
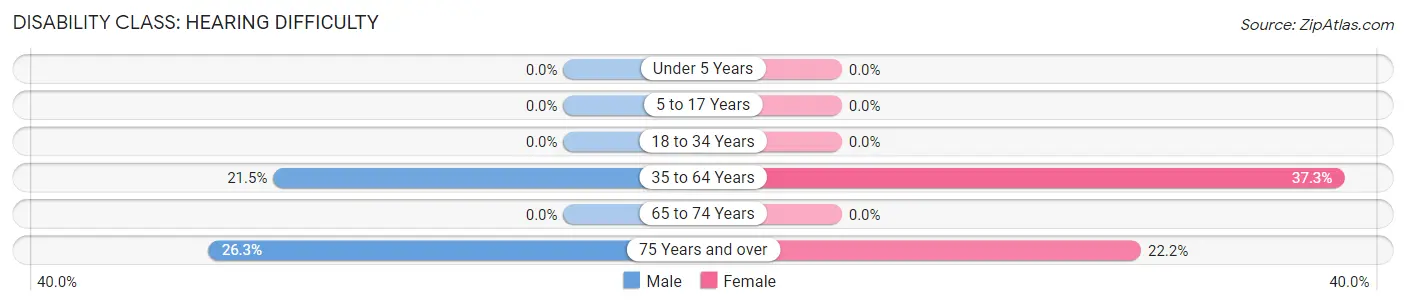
| Age Bracket | Male | Female |
| Under 5 Years | 0 (0.0%) | 0 (0.0%) |
| 5 to 17 Years | 0 (0.0%) | 0 (0.0%) |
| 18 to 34 Years | 0 (0.0%) | 0 (0.0%) |
| 35 to 64 Years | 14 (21.5%) | 22 (37.3%) |
| 65 to 74 Years | 0 (0.0%) | 0 (0.0%) |
| 75 Years and over | 5 (26.3%) | 4 (22.2%) |
Disability Class: Vision Difficulty
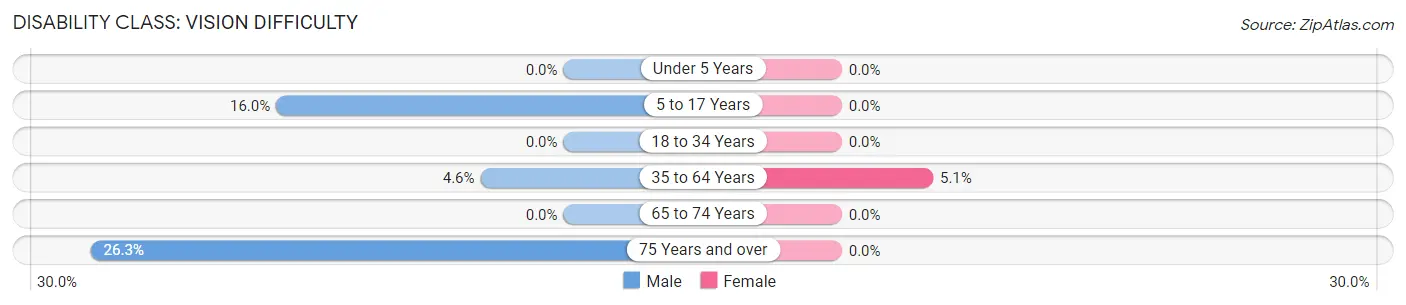
| Age Bracket | Male | Female |
| Under 5 Years | 0 (0.0%) | 0 (0.0%) |
| 5 to 17 Years | 4 (16.0%) | 0 (0.0%) |
| 18 to 34 Years | 0 (0.0%) | 0 (0.0%) |
| 35 to 64 Years | 3 (4.6%) | 3 (5.1%) |
| 65 to 74 Years | 0 (0.0%) | 0 (0.0%) |
| 75 Years and over | 5 (26.3%) | 0 (0.0%) |
Disability Class: Cognitive Difficulty
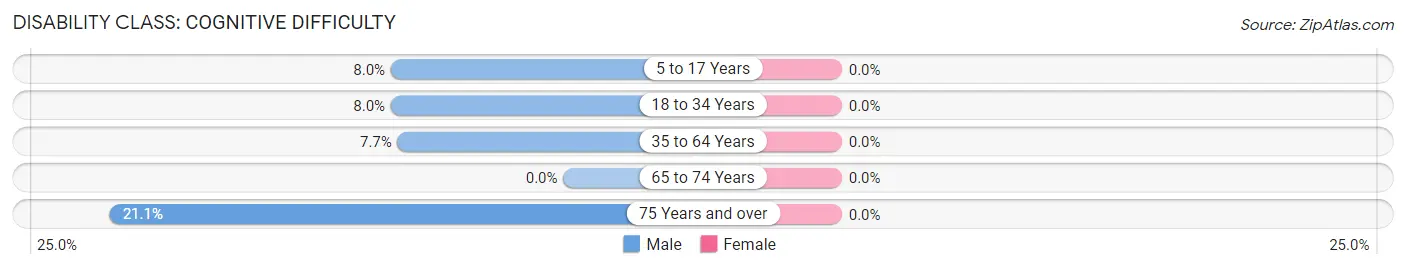
| Age Bracket | Male | Female |
| 5 to 17 Years | 2 (8.0%) | 0 (0.0%) |
| 18 to 34 Years | 2 (8.0%) | 0 (0.0%) |
| 35 to 64 Years | 5 (7.7%) | 0 (0.0%) |
| 65 to 74 Years | 0 (0.0%) | 0 (0.0%) |
| 75 Years and over | 4 (21.0%) | 0 (0.0%) |
Disability Class: Ambulatory Difficulty
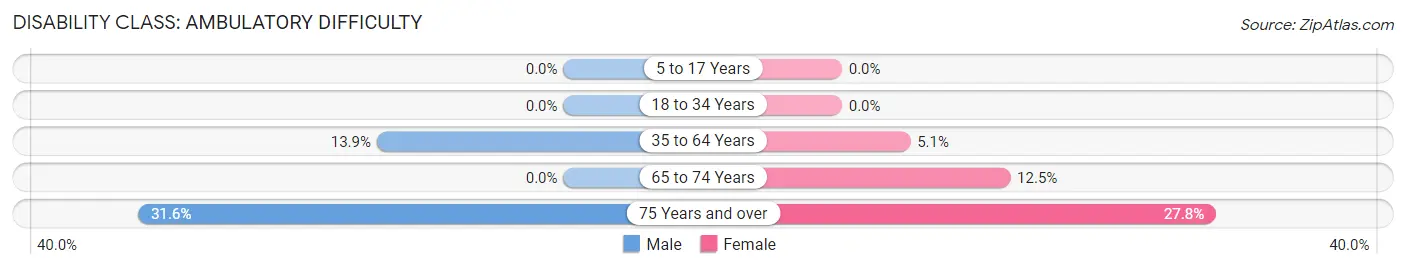
| Age Bracket | Male | Female |
| 5 to 17 Years | 0 (0.0%) | 0 (0.0%) |
| 18 to 34 Years | 0 (0.0%) | 0 (0.0%) |
| 35 to 64 Years | 9 (13.9%) | 3 (5.1%) |
| 65 to 74 Years | 0 (0.0%) | 2 (12.5%) |
| 75 Years and over | 6 (31.6%) | 5 (27.8%) |
Disability Class: Self-Care Difficulty
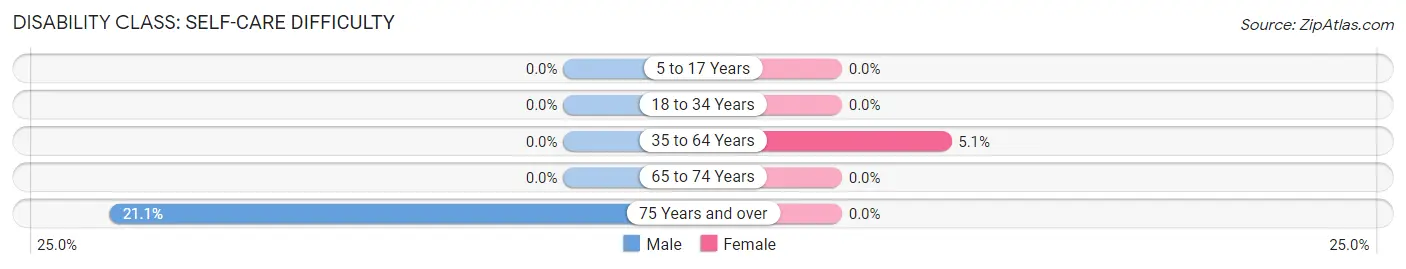
| Age Bracket | Male | Female |
| 5 to 17 Years | 0 (0.0%) | 0 (0.0%) |
| 18 to 34 Years | 0 (0.0%) | 0 (0.0%) |
| 35 to 64 Years | 0 (0.0%) | 3 (5.1%) |
| 65 to 74 Years | 0 (0.0%) | 0 (0.0%) |
| 75 Years and over | 4 (21.0%) | 0 (0.0%) |
Technology Access in Chester
Computing Device Access in Chester
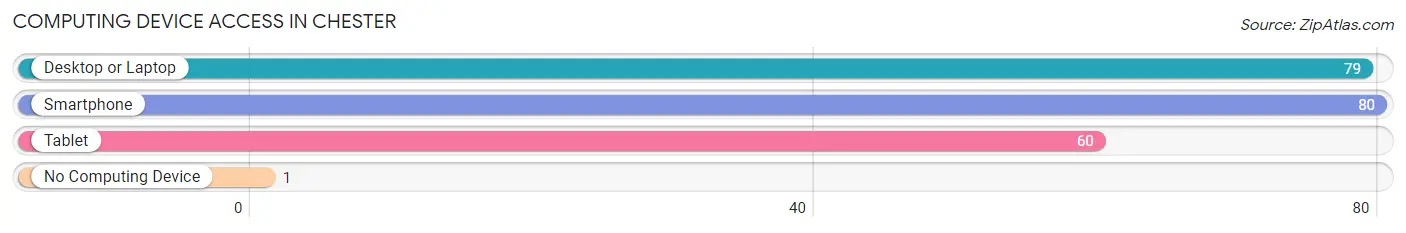
| Device Type | # Households | % Households |
| Desktop or Laptop | 79 | 80.6% |
| Smartphone | 80 | 81.6% |
| Tablet | 60 | 61.2% |
| No Computing Device | 1 | 1.0% |
| Total | 98 | 100.0% |
Internet Access in Chester
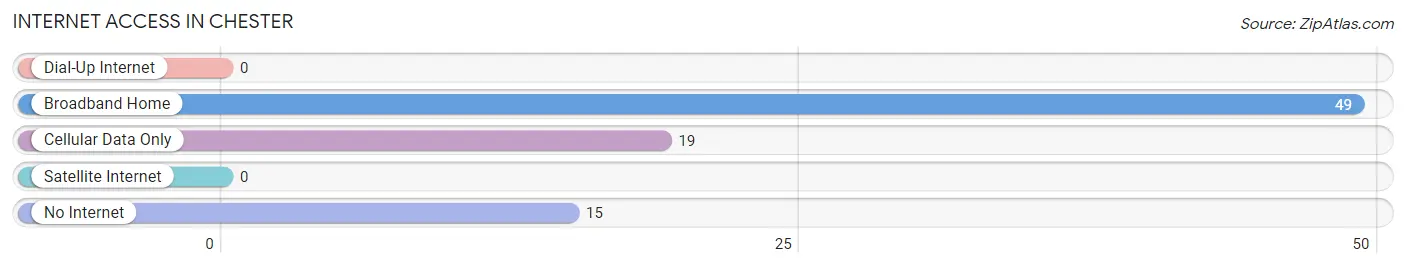
| Internet Type | # Households | % Households |
| Dial-Up Internet | 0 | 0.0% |
| Broadband Home | 49 | 50.0% |
| Cellular Data Only | 19 | 19.4% |
| Satellite Internet | 0 | 0.0% |
| No Internet | 15 | 15.3% |
| Total | 98 | 100.0% |
Chester Summary
Chester, Texas is a small town located in the northeast corner of Harrison County, Texas. It is situated on the banks of the Sabine River, which forms the border between Texas and Louisiana. The town was founded in 1837 and is named after the nearby Chester Plantation, which was owned by the prominent Harrison family. The town has a population of approximately 1,000 people and is part of the Longview Metropolitan Statistical Area.
Geography
Chester is located in the northeast corner of Harrison County, Texas, on the banks of the Sabine River. The town is situated at an elevation of approximately 200 feet above sea level. The climate in Chester is humid subtropical, with hot summers and mild winters. The average annual temperature is around 70 degrees Fahrenheit. The average annual precipitation is around 45 inches.
The town is surrounded by a number of small towns and rural communities, including Longview, Marshall, and Kilgore. The nearest major city is Shreveport, Louisiana, which is located approximately 40 miles to the east.
Economy
The economy of Chester is largely based on agriculture and timber production. The town is home to several large timber companies, including Weyerhaeuser and International Paper. The town also has a number of small businesses, including restaurants, retail stores, and service providers.
The town is also home to a number of manufacturing companies, including a paper mill, a furniture factory, and a plastics plant. The town is also home to a number of oil and gas companies, including Chevron and ExxonMobil.
Demographics
As of the 2010 census, the population of Chester was 1,000 people. The racial makeup of the town was 94.2% White, 2.2% African American, 0.2% Native American, 0.2% Asian, 0.2% Pacific Islander, and 2.2% from other races. The median household income was $31,250, and the median family income was $37,500.
The town is served by the Chester Independent School District, which consists of one elementary school, one middle school, and one high school. The town is also home to a number of churches, including the First United Methodist Church, the First Baptist Church, and the Church of Christ.
Conclusion
Chester, Texas is a small town located in the northeast corner of Harrison County, Texas. It is situated on the banks of the Sabine River, which forms the border between Texas and Louisiana. The town was founded in 1837 and is named after the nearby Chester Plantation, which was owned by the prominent Harrison family. The town has a population of approximately 1,000 people and is part of the Longview Metropolitan Statistical Area. The economy of Chester is largely based on agriculture and timber production, and the town is home to a number of manufacturing companies, oil and gas companies, and small businesses. The racial makeup of the town is 94.2% White, 2.2% African American, 0.2% Native American, 0.2% Asian, 0.2% Pacific Islander, and 2.2% from other races. The median household income was $31,250, and the median family income was $37,500. The town is served by the Chester Independent School District, which consists of one elementary school, one middle school, and one high school.
Common Questions
What is Per Capita Income in Chester?
Per Capita income in Chester is $34,454.
What is the Median Family Income in Chester?
Median Family Income in Chester is $102,917.
What is the Median Household income in Chester?
Median Household Income in Chester is $66,250.
What is Income or Wage Gap in Chester?
Income or Wage Gap in Chester is 17.9%.
Women in Chester earn 82.1 cents for every dollar earned by a man.
What is Inequality or Gini Index in Chester?
Inequality or Gini Index in Chester is 0.40.
What is the Total Population of Chester?
Total Population of Chester is 262.
What is the Total Male Population of Chester?
Total Male Population of Chester is 140.
What is the Total Female Population of Chester?
Total Female Population of Chester is 122.
What is the Ratio of Males per 100 Females in Chester?
There are 114.75 Males per 100 Females in Chester.
What is the Ratio of Females per 100 Males in Chester?
There are 87.14 Females per 100 Males in Chester.
What is the Median Population Age in Chester?
Median Population Age in Chester is 47.3 Years.
What is the Average Family Size in Chester
Average Family Size in Chester is 3.1 People.
What is the Average Household Size in Chester
Average Household Size in Chester is 2.7 People.
How Large is the Labor Force in Chester?
There are 132 People in the Labor Forcein in Chester.
What is the Percentage of People in the Labor Force in Chester?
58.7% of People are in the Labor Force in Chester.
What is the Unemployment Rate in Chester?
Unemployment Rate in Chester is 6.8%.