Centerville, TX Map & Demographics
Centerville Map
Centerville Overview
$24,132
PER CAPITA INCOME
$65,833
AVG FAMILY INCOME
$45,813
AVG HOUSEHOLD INCOME
$14,567
FAMILY INCOME DEFICIT
0.44
INEQUALITY / GINI INDEX
1,266
TOTAL POPULATION
571
MALE POPULATION
695
FEMALE POPULATION
82.16
MALES / 100 FEMALES
121.72
FEMALES / 100 MALES
37.6
MEDIAN AGE
3.8
AVG FAMILY SIZE
2.8
AVG HOUSEHOLD SIZE
696
LABOR FORCE [ PEOPLE ]
60.4%
PERCENT IN LABOR FORCE
1.3%
UNEMPLOYMENT RATE
Centerville Zip Codes
Centerville Area Codes
Income in Centerville
Income Overview in Centerville
Per Capita Income in Centerville is $24,132, while median incomes of families and households are $65,833 and $45,813 respectively.
| Characteristic | Number | Measure |
| Per Capita Income | 1,266 | $24,132 |
| Median Family Income | 272 | $65,833 |
| Mean Family Income | 272 | $80,569 |
| Median Household Income | 427 | $45,813 |
| Mean Household Income | 427 | $64,882 |
| Income Deficit | 272 | $14,567 |
| Wage / Income Gap (%) | 1,266 | 0.00% |
| Wage / Income Gap ($) | 1,266 | 100.00¢ per $1 |
| Gini / Inequality Index | 1,266 | 0.44 |
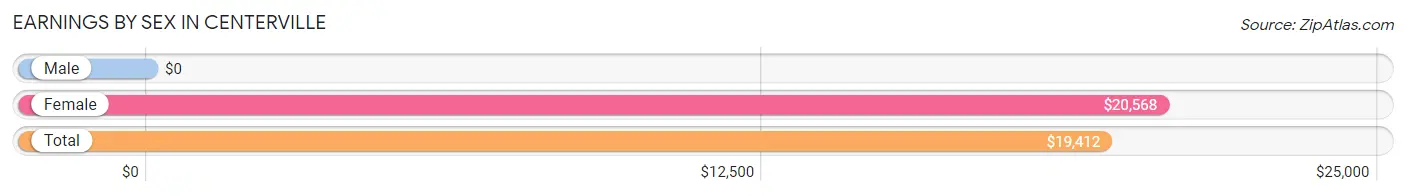
Earnings by Sex in Centerville
| Sex | Number | Average Earnings |
| Male | 247 (34.5%) | $0 |
| Female | 469 (65.5%) | $20,568 |
| Total | 716 (100.0%) | $19,412 |
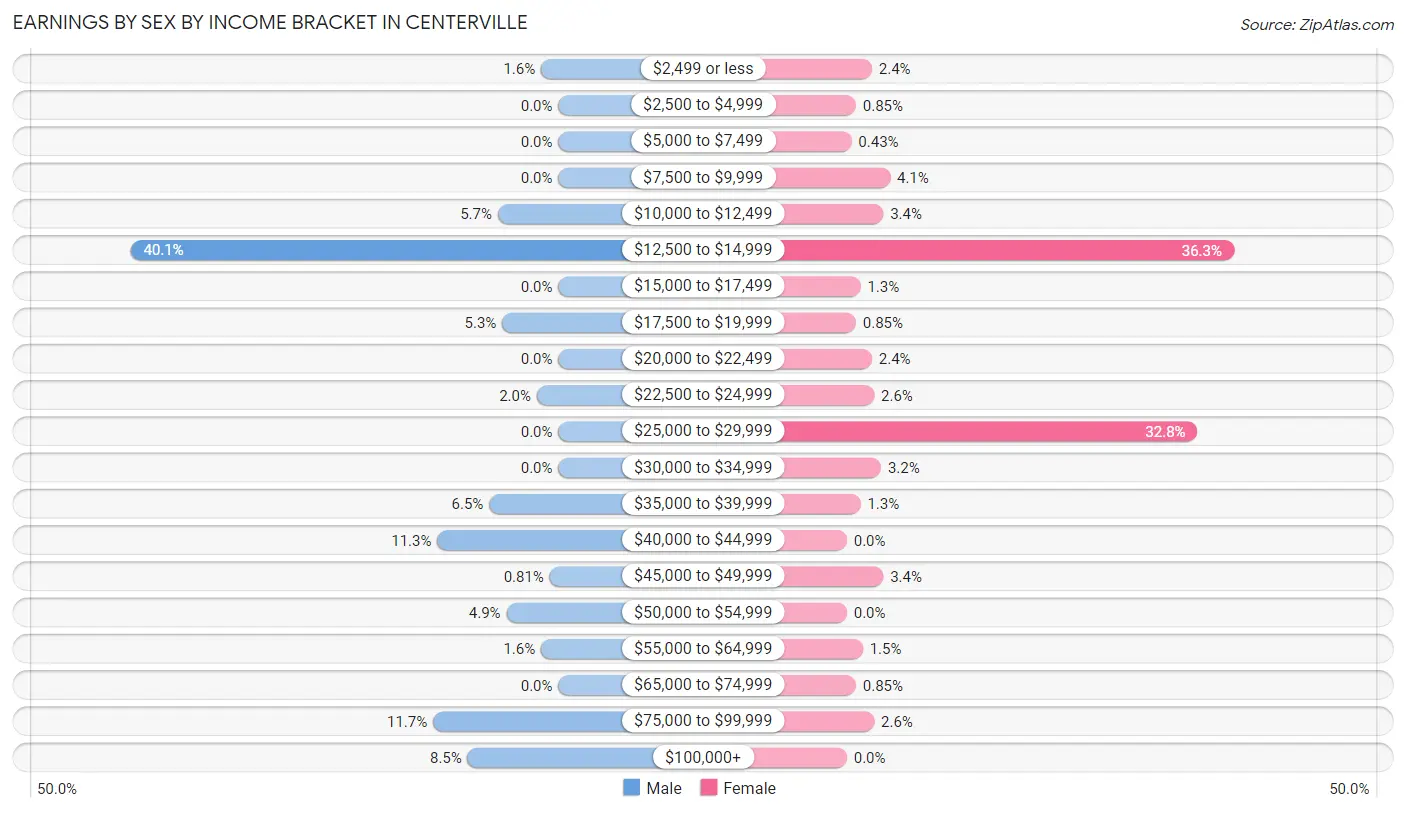
Earnings by Sex by Income Bracket in Centerville
The most common earnings brackets in Centerville are $12,500 to $14,999 for men (99 | 40.1%) and $12,500 to $14,999 for women (170 | 36.2%).
| Income | Male | Female |
| $2,499 or less | 4 (1.6%) | 11 (2.4%) |
| $2,500 to $4,999 | 0 (0.0%) | 4 (0.9%) |
| $5,000 to $7,499 | 0 (0.0%) | 2 (0.4%) |
| $7,500 to $9,999 | 0 (0.0%) | 19 (4.1%) |
| $10,000 to $12,499 | 14 (5.7%) | 16 (3.4%) |
| $12,500 to $14,999 | 99 (40.1%) | 170 (36.2%) |
| $15,000 to $17,499 | 0 (0.0%) | 6 (1.3%) |
| $17,500 to $19,999 | 13 (5.3%) | 4 (0.9%) |
| $20,000 to $22,499 | 0 (0.0%) | 11 (2.4%) |
| $22,500 to $24,999 | 5 (2.0%) | 12 (2.6%) |
| $25,000 to $29,999 | 0 (0.0%) | 154 (32.8%) |
| $30,000 to $34,999 | 0 (0.0%) | 15 (3.2%) |
| $35,000 to $39,999 | 16 (6.5%) | 6 (1.3%) |
| $40,000 to $44,999 | 28 (11.3%) | 0 (0.0%) |
| $45,000 to $49,999 | 2 (0.8%) | 16 (3.4%) |
| $50,000 to $54,999 | 12 (4.9%) | 0 (0.0%) |
| $55,000 to $64,999 | 4 (1.6%) | 7 (1.5%) |
| $65,000 to $74,999 | 0 (0.0%) | 4 (0.9%) |
| $75,000 to $99,999 | 29 (11.7%) | 12 (2.6%) |
| $100,000+ | 21 (8.5%) | 0 (0.0%) |
| Total | 247 (100.0%) | 469 (100.0%) |
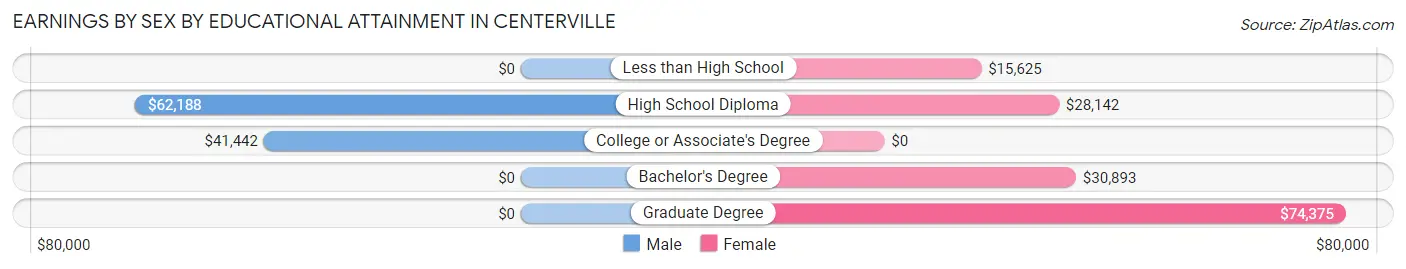
Earnings by Sex by Educational Attainment in Centerville
Average earnings in Centerville are $46,250 for men and $28,480 for women, a difference of 38.4%. Men with an educational attainment of high school diploma enjoy the highest average annual earnings of $62,188, while those with college or associate's degree education earn the least with $41,442. Women with an educational attainment of graduate degree earn the most with the average annual earnings of $74,375, while those with less than high school education have the smallest earnings of $15,625.
| Educational Attainment | Male Income | Female Income |
| Less than High School | - | - |
| High School Diploma | $62,188 | $28,142 |
| College or Associate's Degree | $41,442 | $0 |
| Bachelor's Degree | - | - |
| Graduate Degree | - | - |
| Total | $46,250 | $28,480 |
Family Income in Centerville
Family Income Brackets in Centerville
According to the Centerville family income data, there are 89 families falling into the $35,000 to $49,999 income range, which is the most common income bracket and makes up 32.7% of all families.
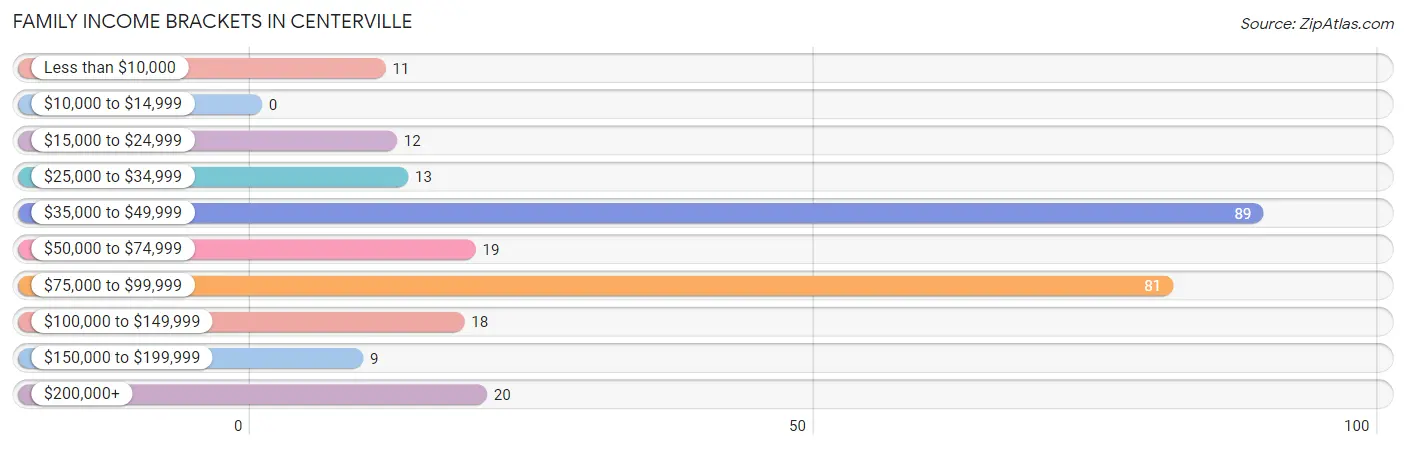
| Income Bracket | # Families | % Families |
| Less than $10,000 | 11 | 4.0% |
| $10,000 to $14,999 | 0 | 0.0% |
| $15,000 to $24,999 | 12 | 4.4% |
| $25,000 to $34,999 | 13 | 4.8% |
| $35,000 to $49,999 | 89 | 32.7% |
| $50,000 to $74,999 | 19 | 7.0% |
| $75,000 to $99,999 | 81 | 29.8% |
| $100,000 to $149,999 | 18 | 6.6% |
| $150,000 to $199,999 | 9 | 3.3% |
| $200,000+ | 20 | 7.4% |
Family Income by Famaliy Size in Centerville
3-person families (35 | 12.9%) account for the highest median family income in Centerville with $105,313 per family, while 3-person families (35 | 12.9%) have the highest median income of $35,104 per family member.
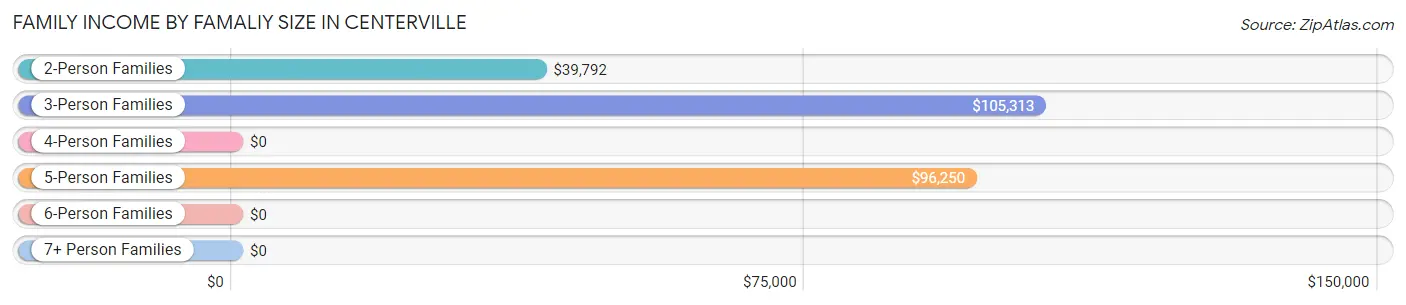
| Income Bracket | # Families | Median Income |
| 2-Person Families | 143 (52.6%) | $39,792 |
| 3-Person Families | 35 (12.9%) | $105,313 |
| 4-Person Families | 6 (2.2%) | $0 |
| 5-Person Families | 82 (30.1%) | $96,250 |
| 6-Person Families | 0 (0.0%) | $0 |
| 7+ Person Families | 6 (2.2%) | $0 |
| Total | 272 (100.0%) | $65,833 |
Family Income by Number of Earners in Centerville
The median family income in Centerville is $65,833, with families comprising 3+ earners (83) having the highest median family income of $96,334, while families with no earners (74) have the lowest median family income of $36,563, accounting for 30.5% and 27.2% of families, respectively.
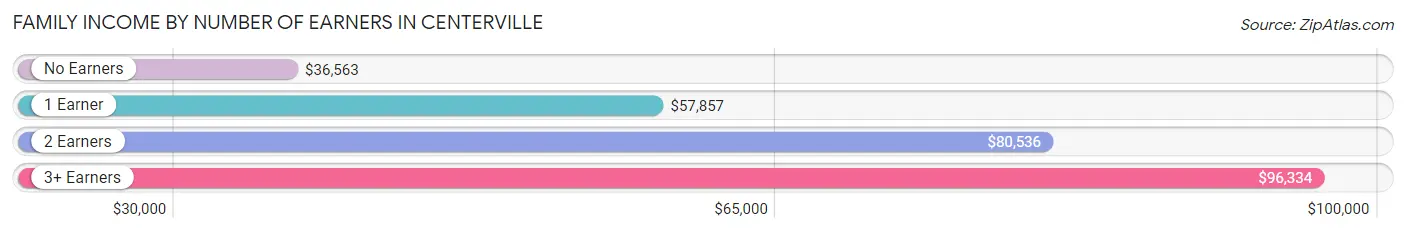
| Number of Earners | # Families | Median Income |
| No Earners | 74 (27.2%) | $36,563 |
| 1 Earner | 36 (13.2%) | $57,857 |
| 2 Earners | 79 (29.0%) | $80,536 |
| 3+ Earners | 83 (30.5%) | $96,334 |
| Total | 272 (100.0%) | $65,833 |
Household Income in Centerville
Household Income Brackets in Centerville
With 118 households falling in the category, the $15,000 to $24,999 income range is the most frequent in Centerville, accounting for 27.6% of all households. In contrast, only 3 households (0.7%) fall into the $10,000 to $14,999 income bracket, making it the least populous group.
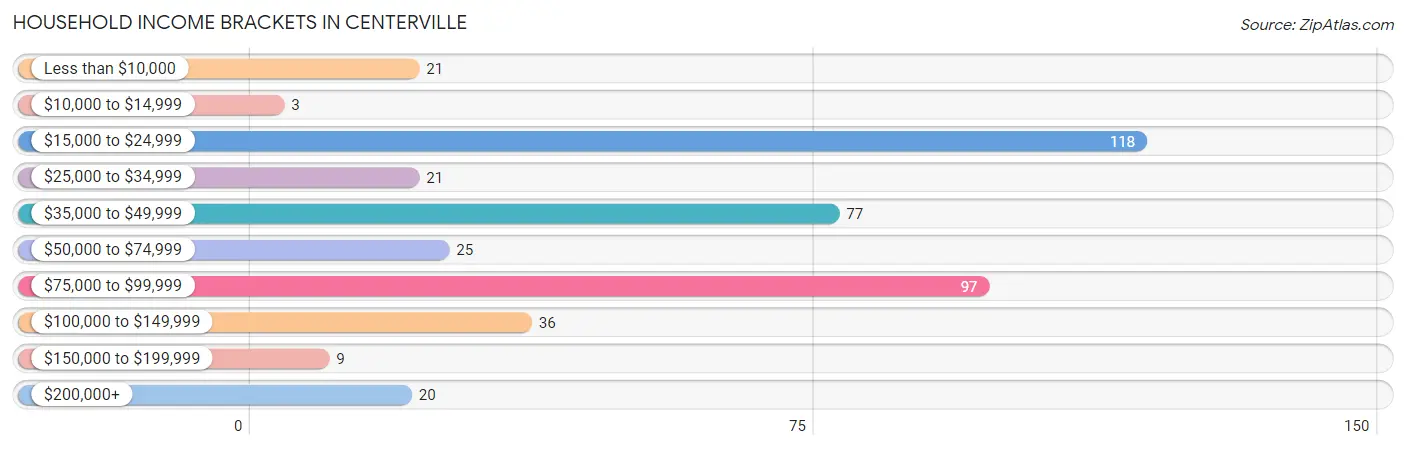
| Income Bracket | # Households | % Households |
| Less than $10,000 | 21 | 4.9% |
| $10,000 to $14,999 | 3 | 0.7% |
| $15,000 to $24,999 | 118 | 27.6% |
| $25,000 to $34,999 | 21 | 4.9% |
| $35,000 to $49,999 | 77 | 18.0% |
| $50,000 to $74,999 | 25 | 5.9% |
| $75,000 to $99,999 | 97 | 22.7% |
| $100,000 to $149,999 | 36 | 8.4% |
| $150,000 to $199,999 | 9 | 2.1% |
| $200,000+ | 20 | 4.7% |
Household Income by Householder Age in Centerville
The median household income in Centerville is $45,813, with the highest median household income of $95,473 found in the 25 to 44 years age bracket for the primary householder. A total of 152 households (35.6%) fall into this category. Meanwhile, the 15 to 24 years age bracket for the primary householder has the lowest median household income of $0, with 14 households (3.3%) in this group.
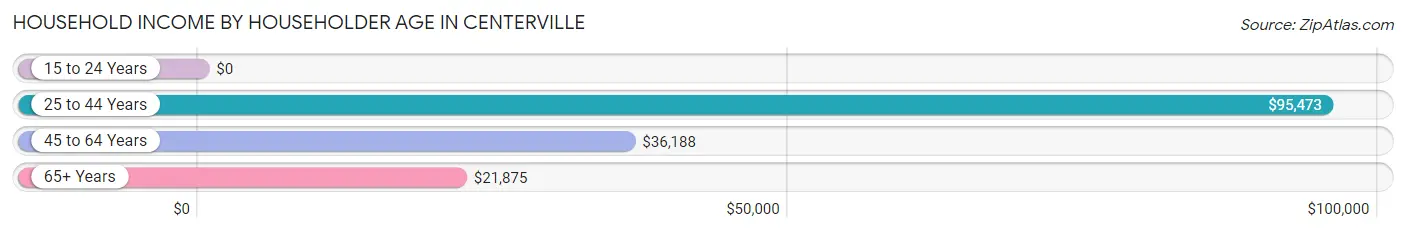
| Income Bracket | # Households | Median Income |
| 15 to 24 Years | 14 (3.3%) | $0 |
| 25 to 44 Years | 152 (35.6%) | $95,473 |
| 45 to 64 Years | 140 (32.8%) | $36,188 |
| 65+ Years | 121 (28.3%) | $21,875 |
| Total | 427 (100.0%) | $45,813 |
Poverty in Centerville
Income Below Poverty by Sex and Age in Centerville
With 5.5% poverty level for males and 5.9% for females among the residents of Centerville, 16 and 17 year old males and 6 to 11 year old females are the most vulnerable to poverty, with 2 males (40.0%) and 8 females (36.4%) in their respective age groups living below the poverty level.
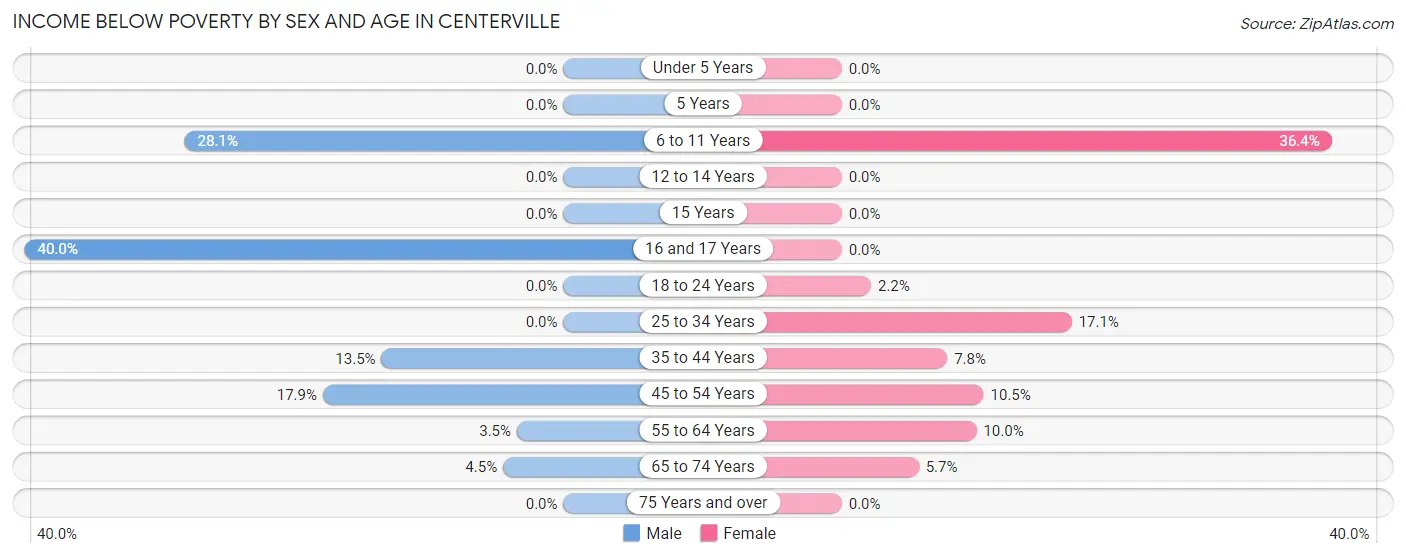
| Age Bracket | Male | Female |
| Under 5 Years | 0 (0.0%) | 0 (0.0%) |
| 5 Years | 0 (0.0%) | 0 (0.0%) |
| 6 to 11 Years | 9 (28.1%) | 8 (36.4%) |
| 12 to 14 Years | 0 (0.0%) | 0 (0.0%) |
| 15 Years | 0 (0.0%) | 0 (0.0%) |
| 16 and 17 Years | 2 (40.0%) | 0 (0.0%) |
| 18 to 24 Years | 0 (0.0%) | 2 (2.2%) |
| 25 to 34 Years | 0 (0.0%) | 7 (17.1%) |
| 35 to 44 Years | 5 (13.5%) | 9 (7.8%) |
| 45 to 54 Years | 5 (17.9%) | 4 (10.5%) |
| 55 to 64 Years | 5 (3.5%) | 8 (10.0%) |
| 65 to 74 Years | 3 (4.5%) | 2 (5.7%) |
| 75 Years and over | 0 (0.0%) | 0 (0.0%) |
| Total | 29 (5.5%) | 40 (5.9%) |
Income Above Poverty by Sex and Age in Centerville
According to the poverty statistics in Centerville, males aged under 5 years and females aged under 5 years are the age groups that are most secure financially, with 100.0% of males and 100.0% of females in these age groups living above the poverty line.
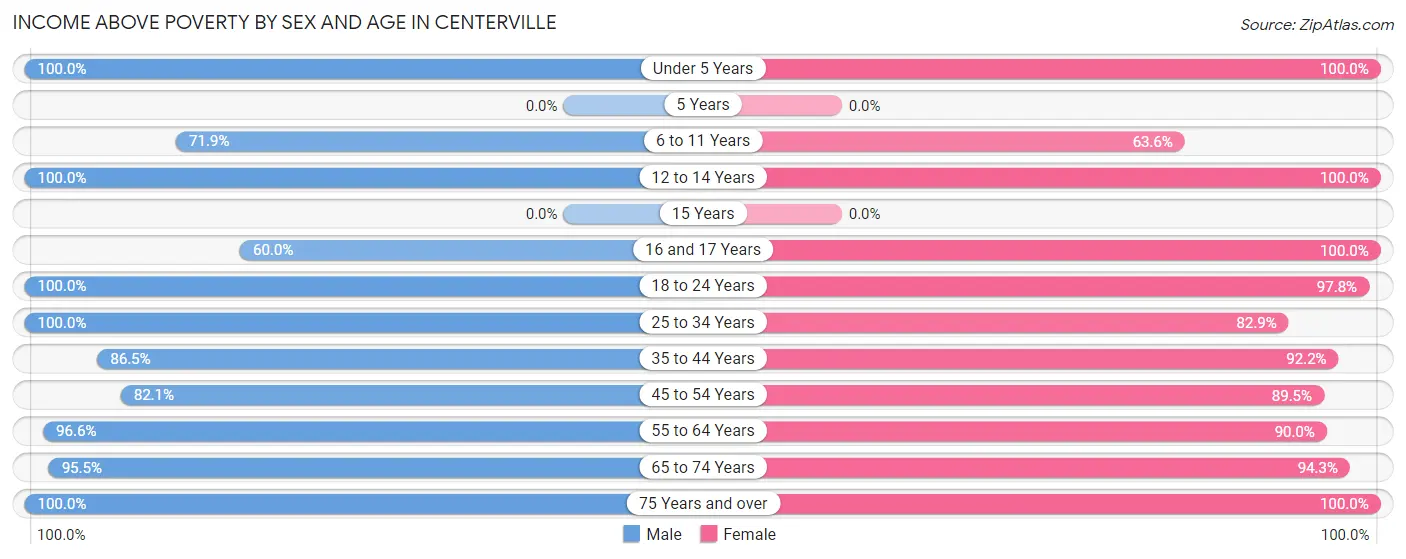
| Age Bracket | Male | Female |
| Under 5 Years | 11 (100.0%) | 5 (100.0%) |
| 5 Years | 0 (0.0%) | 0 (0.0%) |
| 6 to 11 Years | 23 (71.9%) | 14 (63.6%) |
| 12 to 14 Years | 15 (100.0%) | 28 (100.0%) |
| 15 Years | 0 (0.0%) | 0 (0.0%) |
| 16 and 17 Years | 3 (60.0%) | 183 (100.0%) |
| 18 to 24 Years | 113 (100.0%) | 90 (97.8%) |
| 25 to 34 Years | 47 (100.0%) | 34 (82.9%) |
| 35 to 44 Years | 32 (86.5%) | 106 (92.2%) |
| 45 to 54 Years | 23 (82.1%) | 34 (89.5%) |
| 55 to 64 Years | 140 (96.6%) | 72 (90.0%) |
| 65 to 74 Years | 64 (95.5%) | 33 (94.3%) |
| 75 Years and over | 28 (100.0%) | 35 (100.0%) |
| Total | 499 (94.5%) | 634 (94.1%) |
Income Below Poverty Among Married-Couple Families in Centerville
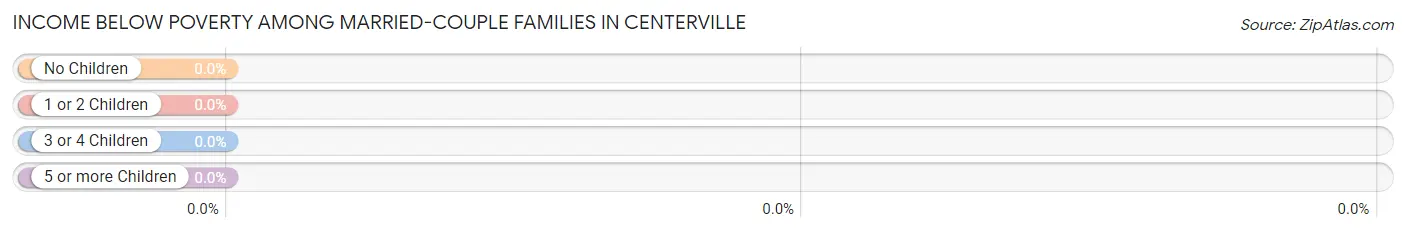
| Children | Above Poverty | Below Poverty |
| No Children | 123 (100.0%) | 0 (0.0%) |
| 1 or 2 Children | 92 (100.0%) | 0 (0.0%) |
| 3 or 4 Children | 10 (100.0%) | 0 (0.0%) |
| 5 or more Children | 0 (0.0%) | 0 (0.0%) |
| Total | 225 (100.0%) | 0 (0.0%) |
Income Below Poverty Among Single-Parent Households in Centerville
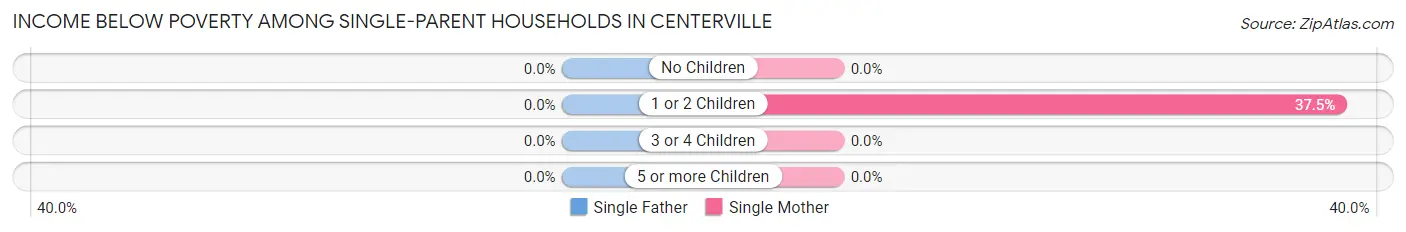
| Children | Single Father | Single Mother |
| No Children | 0 (0.0%) | 0 (0.0%) |
| 1 or 2 Children | 0 (0.0%) | 15 (37.5%) |
| 3 or 4 Children | 0 (0.0%) | 0 (0.0%) |
| 5 or more Children | 0 (0.0%) | 0 (0.0%) |
| Total | 0 (0.0%) | 15 (34.9%) |
Income Below Poverty Among Married-Couple vs Single-Parent Households in Centerville
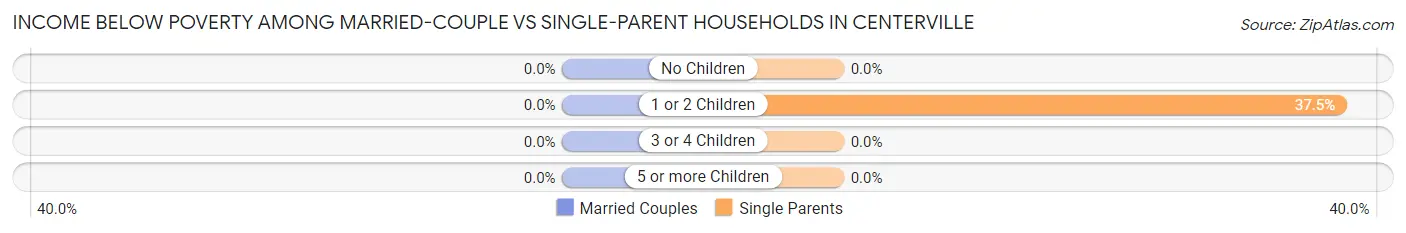
| Children | Married-Couple Families | Single-Parent Households |
| No Children | 0 (0.0%) | 0 (0.0%) |
| 1 or 2 Children | 0 (0.0%) | 15 (37.5%) |
| 3 or 4 Children | 0 (0.0%) | 0 (0.0%) |
| 5 or more Children | 0 (0.0%) | 0 (0.0%) |
| Total | 0 (0.0%) | 15 (31.9%) |
Race in Centerville
The most populous races in Centerville are White / Caucasian (680 | 53.7%), Black / African American (541 | 42.7%), and Hispanic or Latino (62 | 4.9%).
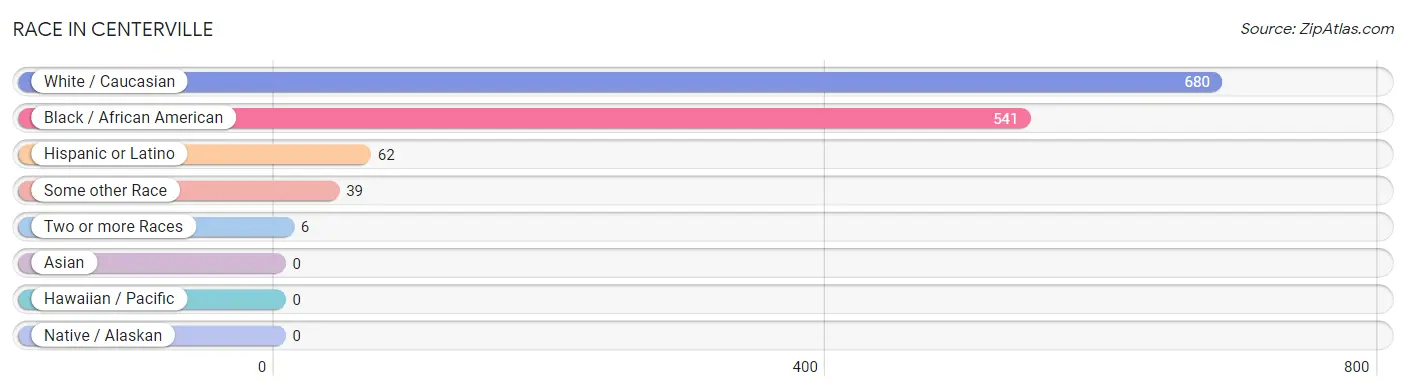
| Race | # Population | % Population |
| Asian | 0 | 0.0% |
| Black / African American | 541 | 42.7% |
| Hawaiian / Pacific | 0 | 0.0% |
| Hispanic or Latino | 62 | 4.9% |
| Native / Alaskan | 0 | 0.0% |
| White / Caucasian | 680 | 53.7% |
| Two or more Races | 6 | 0.5% |
| Some other Race | 39 | 3.1% |
| Total | 1,266 | 100.0% |
Ancestry in Centerville
The most populous ancestries reported in Centerville are American (82 | 6.5%), English (76 | 6.0%), German (54 | 4.3%), Central American (33 | 2.6%), and Mexican (29 | 2.3%), together accounting for 21.6% of all Centerville residents.
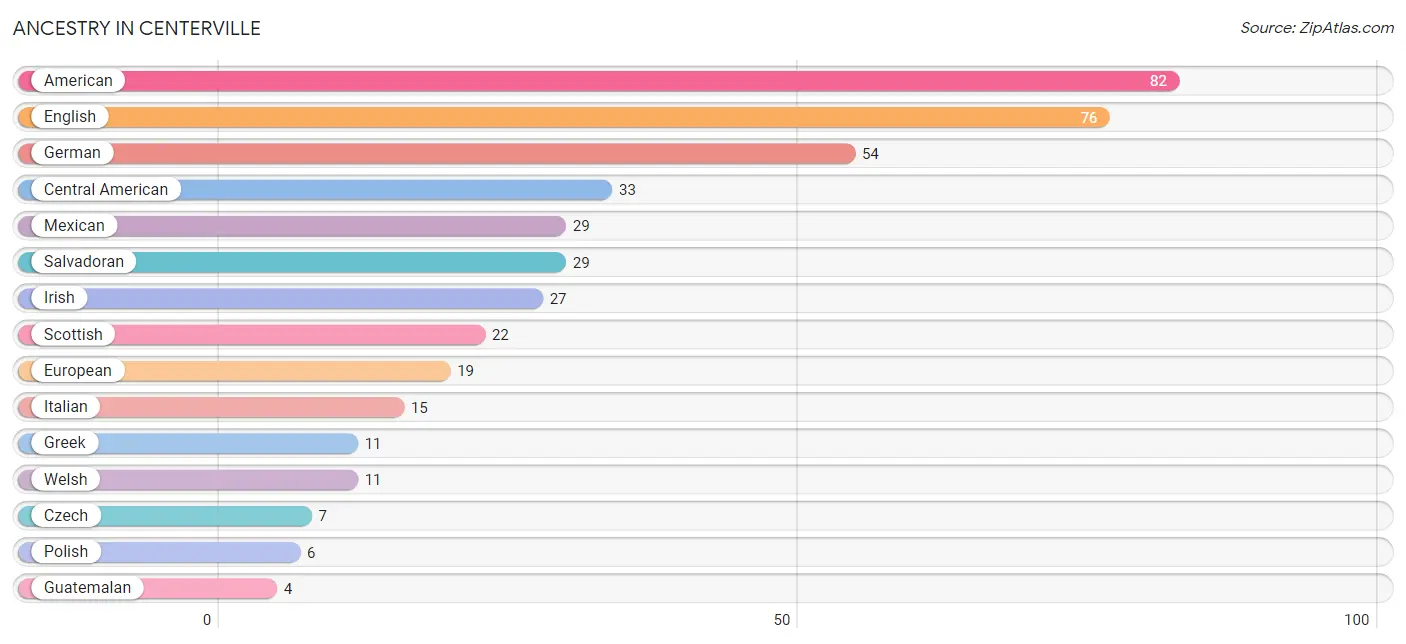
| Ancestry | # Population | % Population |
| American | 82 | 6.5% |
| Central American | 33 | 2.6% |
| Czech | 7 | 0.5% |
| English | 76 | 6.0% |
| European | 19 | 1.5% |
| German | 54 | 4.3% |
| Greek | 11 | 0.9% |
| Guatemalan | 4 | 0.3% |
| Irish | 27 | 2.1% |
| Italian | 15 | 1.2% |
| Mexican | 29 | 2.3% |
| Polish | 6 | 0.5% |
| Salvadoran | 29 | 2.3% |
| Scottish | 22 | 1.7% |
| Welsh | 11 | 0.9% | View All 15 Rows |
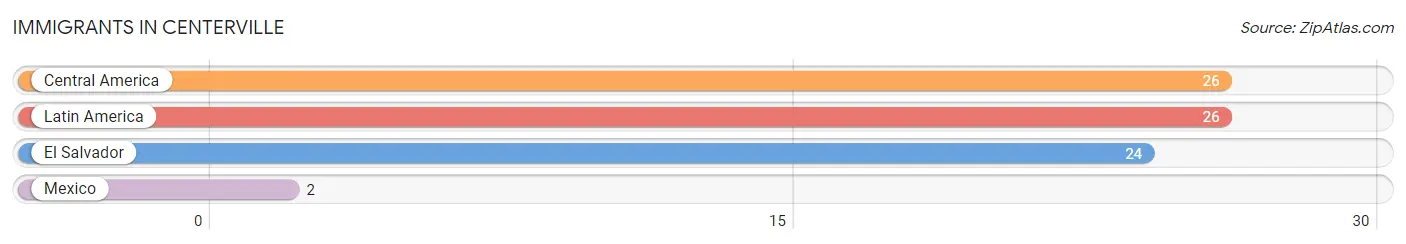
Immigrants in Centerville
The most numerous immigrant groups reported in Centerville came from Central America (26 | 2.1%), Latin America (26 | 2.1%), El Salvador (24 | 1.9%), and Mexico (2 | 0.2%), together accounting for 6.2% of all Centerville residents.
| Immigration Origin | # Population | % Population |
| Central America | 26 | 2.1% |
| El Salvador | 24 | 1.9% |
| Latin America | 26 | 2.1% |
| Mexico | 2 | 0.2% | View All 4 Rows |
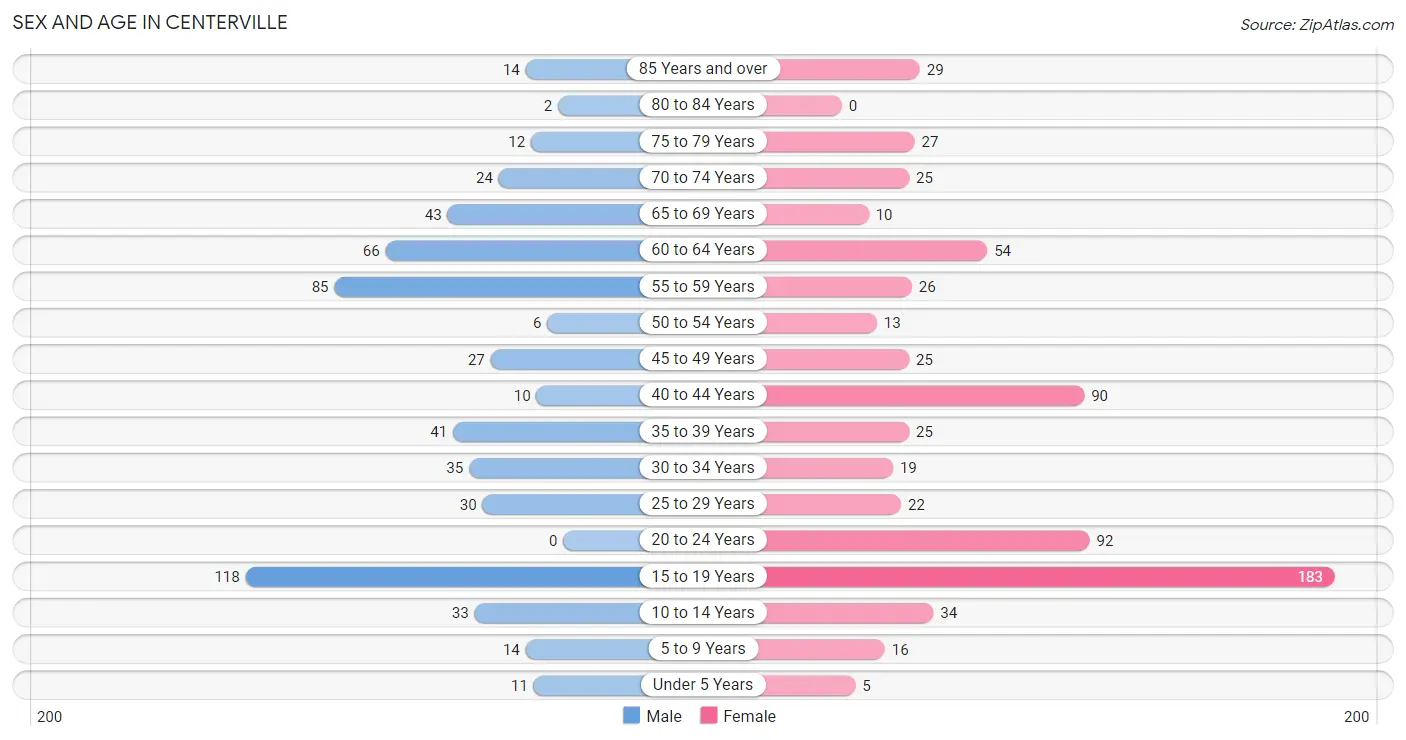
Sex and Age in Centerville
Sex and Age in Centerville
The most populous age groups in Centerville are 15 to 19 Years (118 | 20.7%) for men and 15 to 19 Years (183 | 26.3%) for women.
| Age Bracket | Male | Female |
| Under 5 Years | 11 (1.9%) | 5 (0.7%) |
| 5 to 9 Years | 14 (2.5%) | 16 (2.3%) |
| 10 to 14 Years | 33 (5.8%) | 34 (4.9%) |
| 15 to 19 Years | 118 (20.7%) | 183 (26.3%) |
| 20 to 24 Years | 0 (0.0%) | 92 (13.2%) |
| 25 to 29 Years | 30 (5.2%) | 22 (3.2%) |
| 30 to 34 Years | 35 (6.1%) | 19 (2.7%) |
| 35 to 39 Years | 41 (7.2%) | 25 (3.6%) |
| 40 to 44 Years | 10 (1.8%) | 90 (13.0%) |
| 45 to 49 Years | 27 (4.7%) | 25 (3.6%) |
| 50 to 54 Years | 6 (1.1%) | 13 (1.9%) |
| 55 to 59 Years | 85 (14.9%) | 26 (3.7%) |
| 60 to 64 Years | 66 (11.6%) | 54 (7.8%) |
| 65 to 69 Years | 43 (7.5%) | 10 (1.4%) |
| 70 to 74 Years | 24 (4.2%) | 25 (3.6%) |
| 75 to 79 Years | 12 (2.1%) | 27 (3.9%) |
| 80 to 84 Years | 2 (0.4%) | 0 (0.0%) |
| 85 Years and over | 14 (2.5%) | 29 (4.2%) |
| Total | 571 (100.0%) | 695 (100.0%) |
Families and Households in Centerville
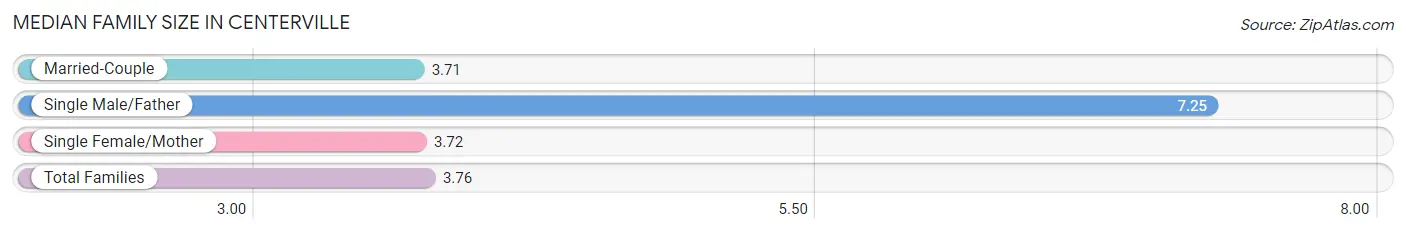
Median Family Size in Centerville
The median family size in Centerville is 3.76 persons per family, with single male/father families (4 | 1.5%) accounting for the largest median family size of 7.25 persons per family. On the other hand, married-couple families (225 | 82.7%) represent the smallest median family size with 3.71 persons per family.
| Family Type | # Families | Family Size |
| Married-Couple | 225 (82.7%) | 3.71 |
| Single Male/Father | 4 (1.5%) | 7.25 |
| Single Female/Mother | 43 (15.8%) | 3.72 |
| Total Families | 272 (100.0%) | 3.76 |
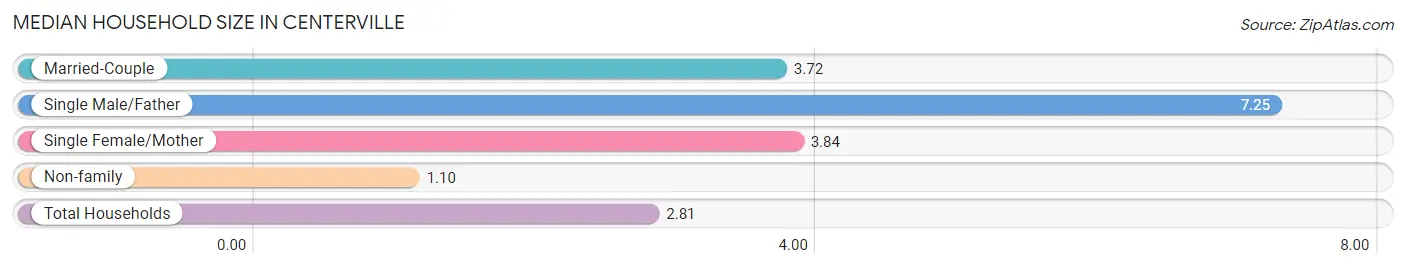
Median Household Size in Centerville
The median household size in Centerville is 2.81 persons per household, with single male/father households (4 | 0.9%) accounting for the largest median household size of 7.25 persons per household. non-family households (155 | 36.3%) represent the smallest median household size with 1.10 persons per household.
| Household Type | # Households | Household Size |
| Married-Couple | 225 (52.7%) | 3.72 |
| Single Male/Father | 4 (0.9%) | 7.25 |
| Single Female/Mother | 43 (10.1%) | 3.84 |
| Non-family | 155 (36.3%) | 1.10 |
| Total Households | 427 (100.0%) | 2.81 |
Household Size by Marriage Status in Centerville
Out of a total of 427 households in Centerville, 272 (63.7%) are family households, while 155 (36.3%) are nonfamily households. The most numerous type of family households are 2-person households, comprising 131, and the most common type of nonfamily households are 1-person households, comprising 143.
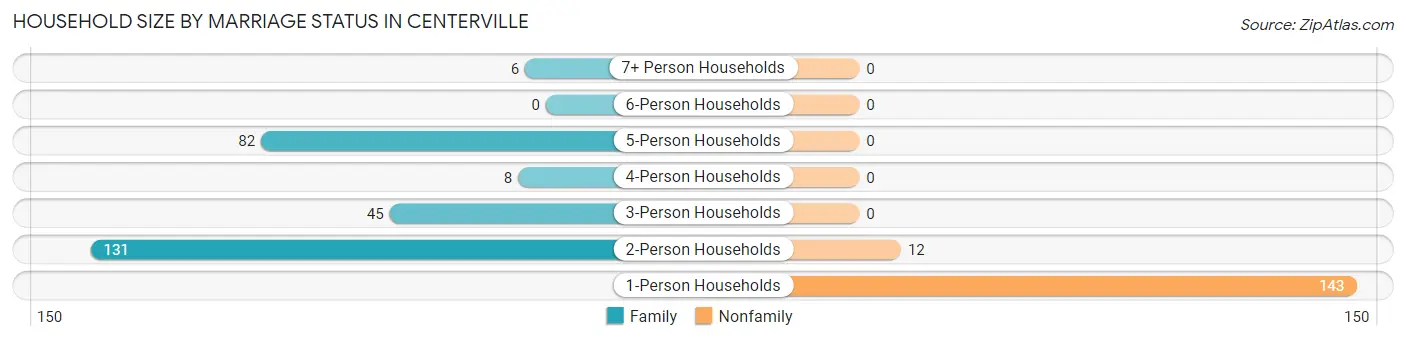
| Household Size | Family Households | Nonfamily Households |
| 1-Person Households | - | 143 (33.5%) |
| 2-Person Households | 131 (30.7%) | 12 (2.8%) |
| 3-Person Households | 45 (10.5%) | 0 (0.0%) |
| 4-Person Households | 8 (1.9%) | 0 (0.0%) |
| 5-Person Households | 82 (19.2%) | 0 (0.0%) |
| 6-Person Households | 0 (0.0%) | 0 (0.0%) |
| 7+ Person Households | 6 (1.4%) | 0 (0.0%) |
| Total | 272 (63.7%) | 155 (36.3%) |
Female Fertility in Centerville
Fertility by Age in Centerville
| Age Bracket | Women with Births | Births / 1,000 Women |
| 15 to 19 years | 0 (0.0%) | 0.0 |
| 20 to 34 years | 0 (0.0%) | 0.0 |
| 35 to 50 years | 0 (0.0%) | 0.0 |
| Total | 0 (0.0%) | 0.0 |
Fertility by Age by Marriage Status in Centerville
| Age Bracket | Married | Unmarried |
| 15 to 19 years | 0 (0.0%) | 0 (0.0%) |
| 20 to 34 years | 0 (0.0%) | 0 (0.0%) |
| 35 to 50 years | 0 (0.0%) | 0 (0.0%) |
| Total | 0 (0.0%) | 0 (0.0%) |
Fertility by Education in Centerville
| Educational Attainment | Women with Births | Births / 1,000 Women |
| Less than High School | 0 (0.0%) | 0.0 |
| High School Diploma | 0 (0.0%) | 0.0 |
| College or Associate's Degree | 0 (0.0%) | 0.0 |
| Bachelor's Degree | 0 (0.0%) | 0.0 |
| Graduate Degree | 0 (0.0%) | 0.0 |
| Total | 0 (0.0%) | 0.0 |
Fertility by Education by Marriage Status in Centerville
| Educational Attainment | Married | Unmarried |
| Less than High School | 0 (0.0%) | 0 (0.0%) |
| High School Diploma | 0 (0.0%) | 0 (0.0%) |
| College or Associate's Degree | 0 (0.0%) | 0 (0.0%) |
| Bachelor's Degree | 0 (0.0%) | 0 (0.0%) |
| Graduate Degree | 0 (0.0%) | 0 (0.0%) |
| Total | 0 (0.0%) | 0 (0.0%) |
Employment Characteristics in Centerville
Employment by Class of Employer in Centerville
Among the 687 employed individuals in Centerville, private company employees (574 | 83.6%), state government employees (55 | 8.0%), and local government employees (28 | 4.1%) make up the most common classes of employment.
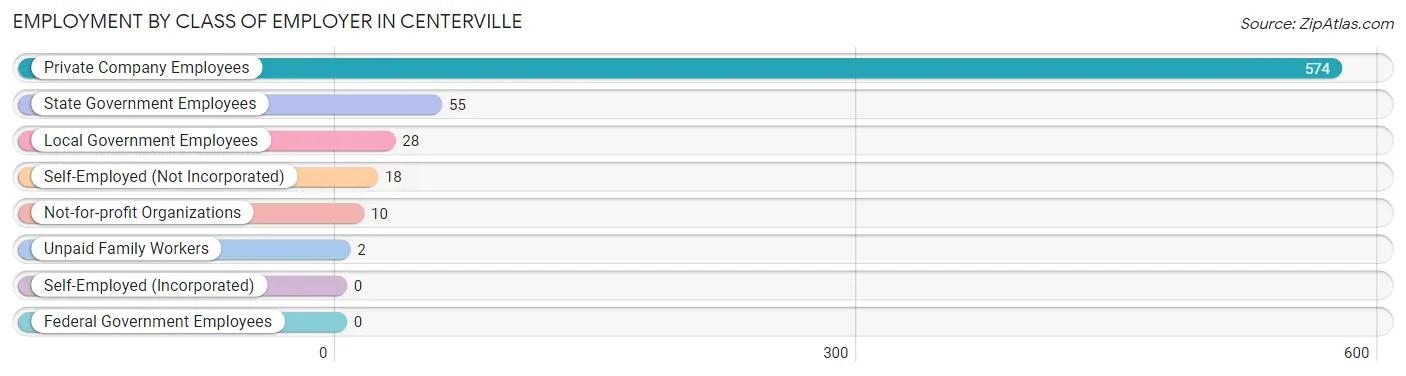
| Employer Class | # Employees | % Employees |
| Private Company Employees | 574 | 83.6% |
| Self-Employed (Incorporated) | 0 | 0.0% |
| Self-Employed (Not Incorporated) | 18 | 2.6% |
| Not-for-profit Organizations | 10 | 1.5% |
| Local Government Employees | 28 | 4.1% |
| State Government Employees | 55 | 8.0% |
| Federal Government Employees | 0 | 0.0% |
| Unpaid Family Workers | 2 | 0.3% |
| Total | 687 | 100.0% |
Employment Status by Age in Centerville
According to the labor force statistics for Centerville, out of the total population over 16 years of age (1,153), 60.4% or 696 individuals are in the labor force, with 1.3% or 9 of them unemployed. The age group with the highest labor force participation rate is 20 to 24 years, with 100.0% or 92 individuals in the labor force. Within the labor force, the 35 to 44 years age range has the highest percentage of unemployed individuals, with 6.5% or 9 of them being unemployed.
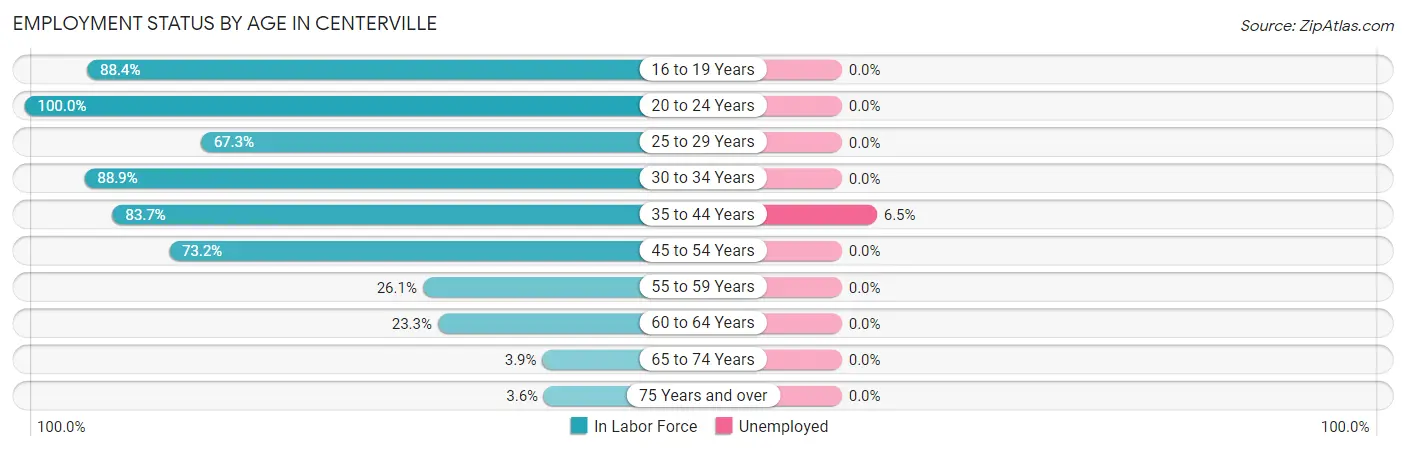
| Age Bracket | In Labor Force | Unemployed |
| 16 to 19 Years | 266 (88.4%) | 0 (0.0%) |
| 20 to 24 Years | 92 (100.0%) | 0 (0.0%) |
| 25 to 29 Years | 35 (67.3%) | 0 (0.0%) |
| 30 to 34 Years | 48 (88.9%) | 0 (0.0%) |
| 35 to 44 Years | 139 (83.7%) | 9 (6.5%) |
| 45 to 54 Years | 52 (73.2%) | 0 (0.0%) |
| 55 to 59 Years | 29 (26.1%) | 0 (0.0%) |
| 60 to 64 Years | 28 (23.3%) | 0 (0.0%) |
| 65 to 74 Years | 4 (3.9%) | 0 (0.0%) |
| 75 Years and over | 3 (3.6%) | 0 (0.0%) |
| Total | 696 (60.4%) | 9 (1.3%) |
Employment Status by Educational Attainment in Centerville
According to labor force statistics for Centerville, 57.7% of individuals (331) out of the total population between 25 and 64 years of age (574) are in the labor force, with 2.7% or 9 of them being unemployed. The group with the highest labor force participation rate are those with the educational attainment of bachelor's degree or higher, with 95.9% or 71 individuals in the labor force. Within the labor force, individuals with high school diploma education have the highest percentage of unemployment, with 5.6% or 9 of them being unemployed.
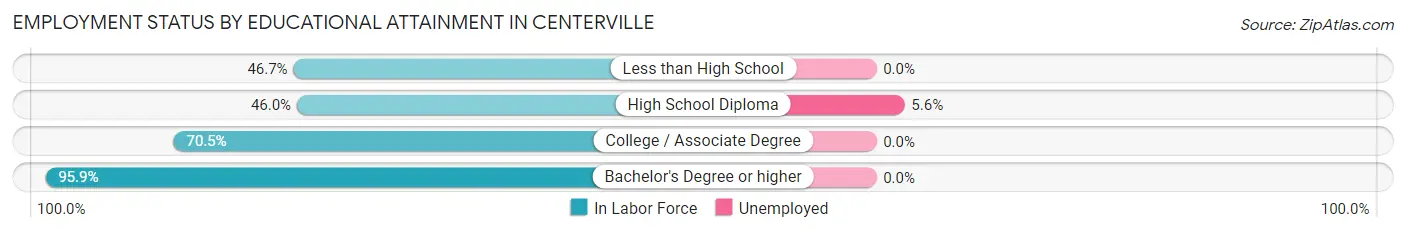
| Educational Attainment | In Labor Force | Unemployed |
| Less than High School | 14 (46.7%) | 0 (0.0%) |
| High School Diploma | 160 (46.0%) | 19 (5.6%) |
| College / Associate Degree | 86 (70.5%) | 0 (0.0%) |
| Bachelor's Degree or higher | 71 (95.9%) | 0 (0.0%) |
| Total | 331 (57.7%) | 15 (2.7%) |
Employment Occupations by Sex in Centerville
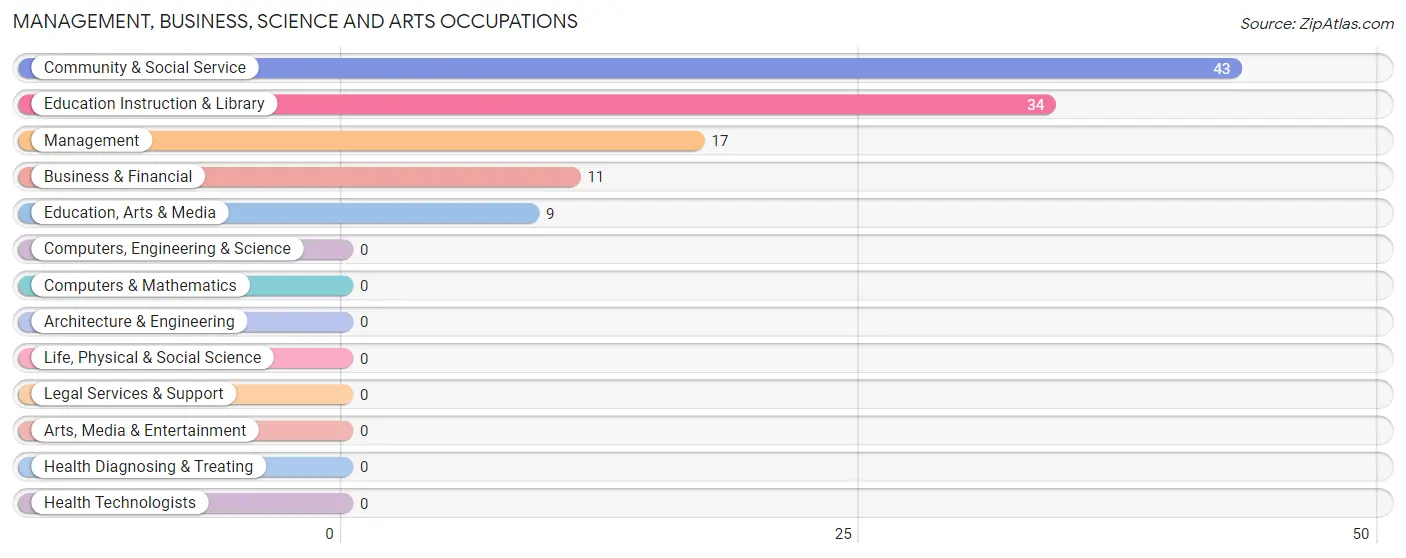
Management, Business, Science and Arts Occupations
The most common Management, Business, Science and Arts occupations in Centerville are Community & Social Service (43 | 6.3%), Education Instruction & Library (34 | 5.0%), Management (17 | 2.5%), Business & Financial (11 | 1.6%), and Education, Arts & Media (9 | 1.3%).
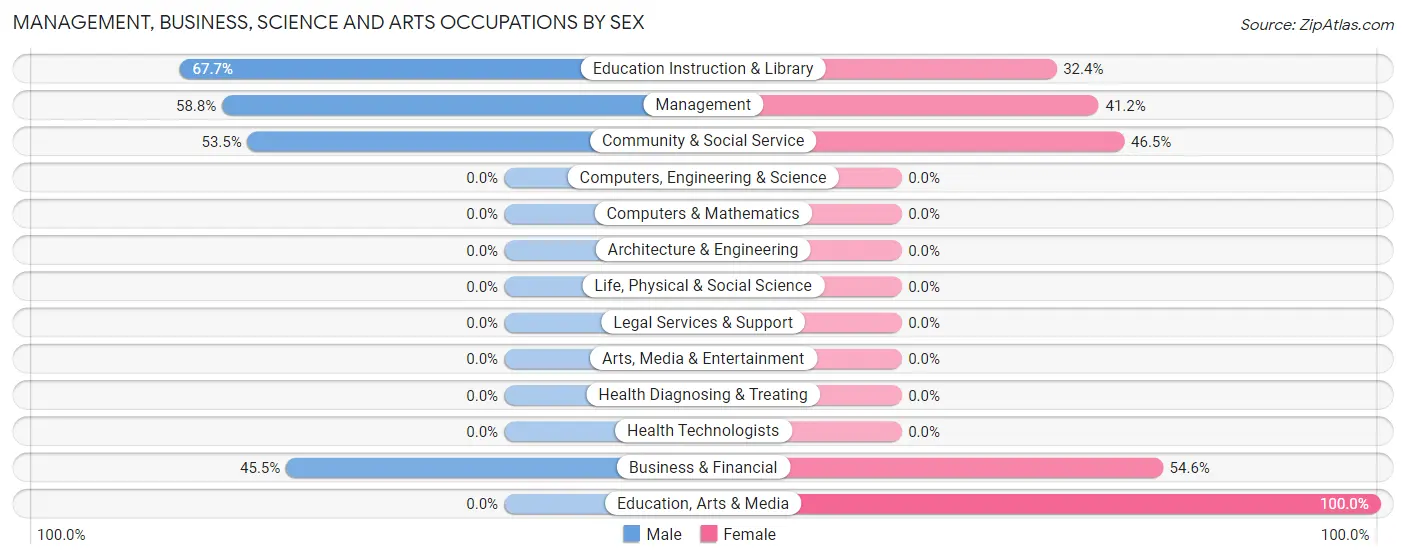
Management, Business, Science and Arts Occupations by Sex
Within the Management, Business, Science and Arts occupations in Centerville, the most male-oriented occupations are Education Instruction & Library (67.6%), Management (58.8%), and Community & Social Service (53.5%), while the most female-oriented occupations are Education, Arts & Media (100.0%), Business & Financial (54.5%), and Community & Social Service (46.5%).
| Occupation | Male | Female |
| Management | 10 (58.8%) | 7 (41.2%) |
| Business & Financial | 5 (45.5%) | 6 (54.5%) |
| Computers, Engineering & Science | 0 (0.0%) | 0 (0.0%) |
| Computers & Mathematics | 0 (0.0%) | 0 (0.0%) |
| Architecture & Engineering | 0 (0.0%) | 0 (0.0%) |
| Life, Physical & Social Science | 0 (0.0%) | 0 (0.0%) |
| Community & Social Service | 23 (53.5%) | 20 (46.5%) |
| Education, Arts & Media | 0 (0.0%) | 9 (100.0%) |
| Legal Services & Support | 0 (0.0%) | 0 (0.0%) |
| Education Instruction & Library | 23 (67.6%) | 11 (32.4%) |
| Arts, Media & Entertainment | 0 (0.0%) | 0 (0.0%) |
| Health Diagnosing & Treating | 0 (0.0%) | 0 (0.0%) |
| Health Technologists | 0 (0.0%) | 0 (0.0%) |
| Total (Category) | 38 (53.5%) | 33 (46.5%) |
| Total (Overall) | 227 (33.0%) | 460 (67.0%) |
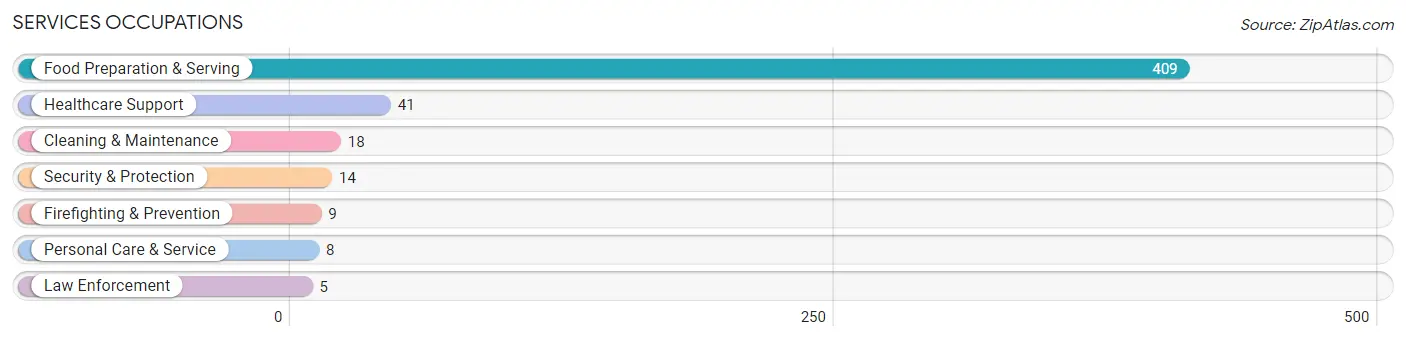
Services Occupations
The most common Services occupations in Centerville are Food Preparation & Serving (409 | 59.5%), Healthcare Support (41 | 6.0%), Cleaning & Maintenance (18 | 2.6%), Security & Protection (14 | 2.0%), and Firefighting & Prevention (9 | 1.3%).
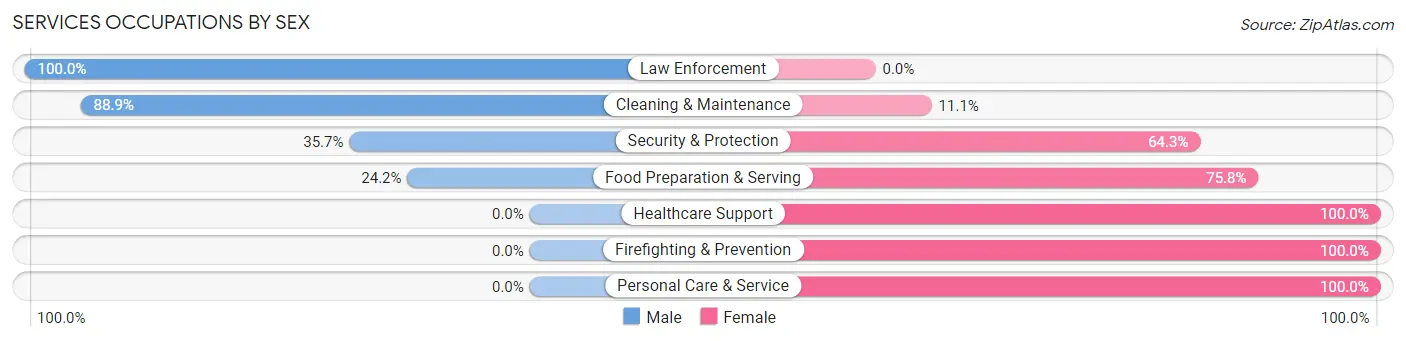
Services Occupations by Sex
Within the Services occupations in Centerville, the most male-oriented occupations are Law Enforcement (100.0%), Cleaning & Maintenance (88.9%), and Security & Protection (35.7%), while the most female-oriented occupations are Healthcare Support (100.0%), Firefighting & Prevention (100.0%), and Personal Care & Service (100.0%).
| Occupation | Male | Female |
| Healthcare Support | 0 (0.0%) | 41 (100.0%) |
| Security & Protection | 5 (35.7%) | 9 (64.3%) |
| Firefighting & Prevention | 0 (0.0%) | 9 (100.0%) |
| Law Enforcement | 5 (100.0%) | 0 (0.0%) |
| Food Preparation & Serving | 99 (24.2%) | 310 (75.8%) |
| Cleaning & Maintenance | 16 (88.9%) | 2 (11.1%) |
| Personal Care & Service | 0 (0.0%) | 8 (100.0%) |
| Total (Category) | 120 (24.5%) | 370 (75.5%) |
| Total (Overall) | 227 (33.0%) | 460 (67.0%) |
Sales and Office Occupations
The most common Sales and Office occupations in Centerville are Office & Administration (29 | 4.2%), and Sales & Related (28 | 4.1%).

Sales and Office Occupations by Sex

| Occupation | Male | Female |
| Sales & Related | 16 (57.1%) | 12 (42.9%) |
| Office & Administration | 0 (0.0%) | 29 (100.0%) |
| Total (Category) | 16 (28.1%) | 41 (71.9%) |
| Total (Overall) | 227 (33.0%) | 460 (67.0%) |
Natural Resources, Construction and Maintenance Occupations
The most common Natural Resources, Construction and Maintenance occupations in Centerville are Installation, Maintenance & Repair (27 | 3.9%), Construction & Extraction (21 | 3.1%), and Farming, Fishing & Forestry (4 | 0.6%).

Natural Resources, Construction and Maintenance Occupations by Sex

| Occupation | Male | Female |
| Farming, Fishing & Forestry | 4 (100.0%) | 0 (0.0%) |
| Construction & Extraction | 21 (100.0%) | 0 (0.0%) |
| Installation, Maintenance & Repair | 27 (100.0%) | 0 (0.0%) |
| Total (Category) | 52 (100.0%) | 0 (0.0%) |
| Total (Overall) | 227 (33.0%) | 460 (67.0%) |
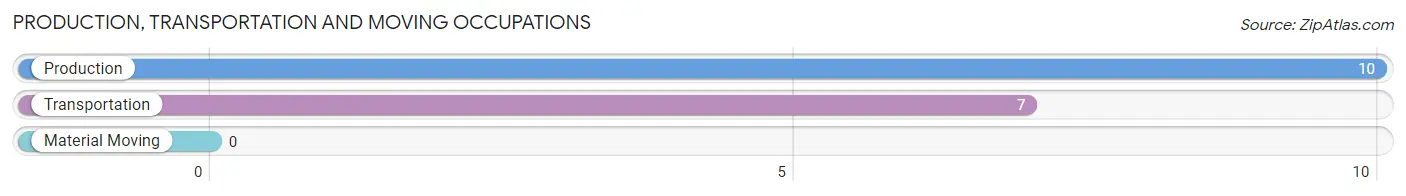
Production, Transportation and Moving Occupations
The most common Production, Transportation and Moving occupations in Centerville are Production (10 | 1.5%), and Transportation (7 | 1.0%).
Production, Transportation and Moving Occupations by Sex
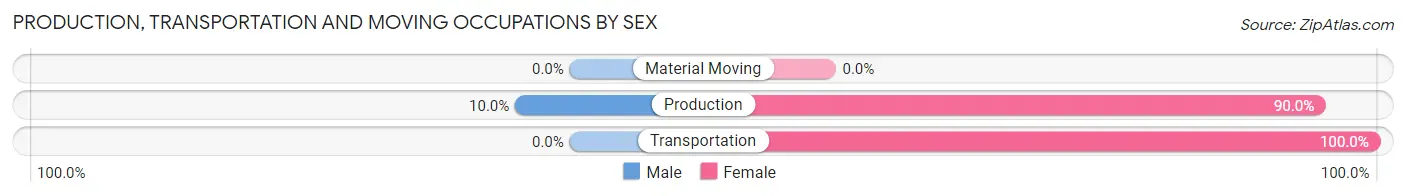
| Occupation | Male | Female |
| Production | 1 (10.0%) | 9 (90.0%) |
| Transportation | 0 (0.0%) | 7 (100.0%) |
| Material Moving | 0 (0.0%) | 0 (0.0%) |
| Total (Category) | 1 (5.9%) | 16 (94.1%) |
| Total (Overall) | 227 (33.0%) | 460 (67.0%) |
Employment Industries by Sex in Centerville
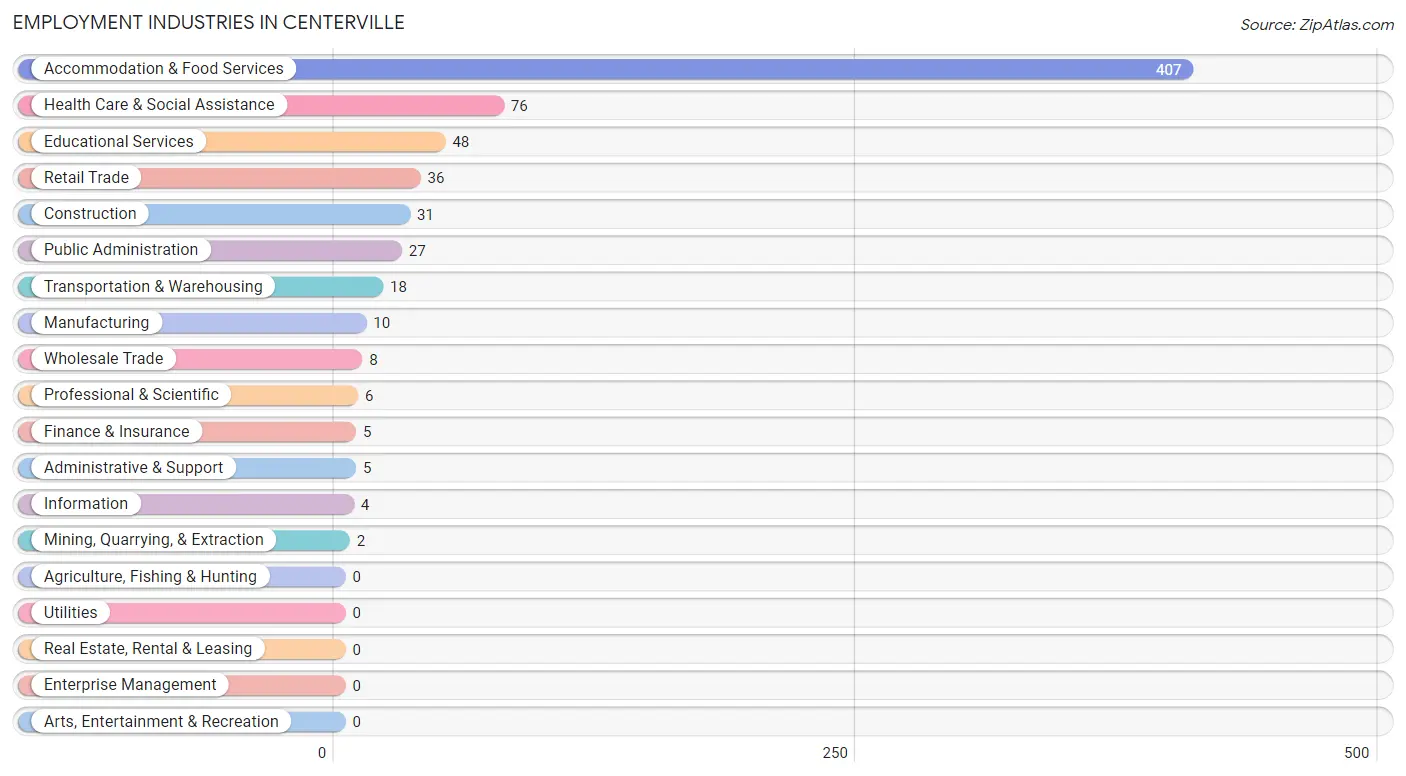
Employment Industries in Centerville
The major employment industries in Centerville include Accommodation & Food Services (407 | 59.2%), Health Care & Social Assistance (76 | 11.1%), Educational Services (48 | 7.0%), Retail Trade (36 | 5.2%), and Construction (31 | 4.5%).
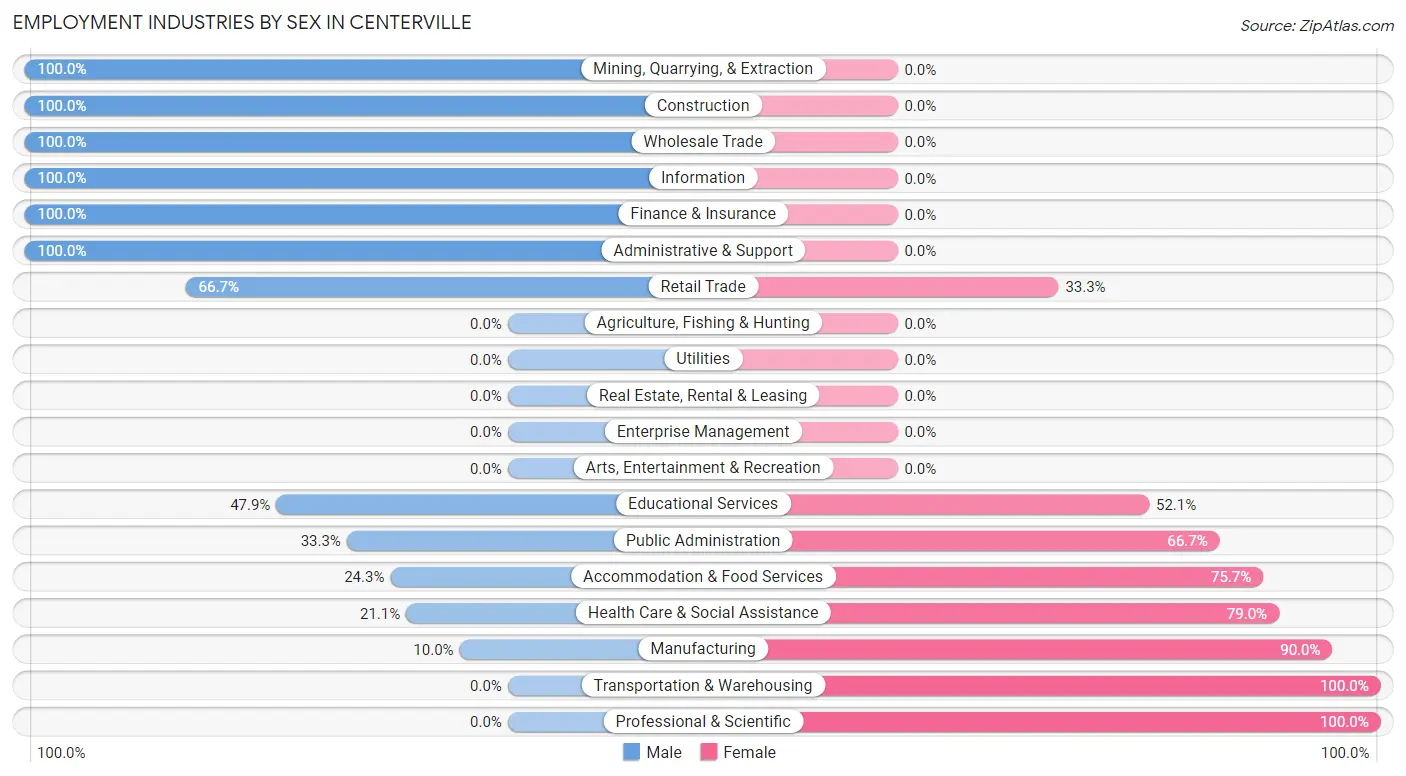
Employment Industries by Sex in Centerville
The Centerville industries that see more men than women are Mining, Quarrying, & Extraction (100.0%), Construction (100.0%), and Wholesale Trade (100.0%), whereas the industries that tend to have a higher number of women are Transportation & Warehousing (100.0%), Professional & Scientific (100.0%), and Manufacturing (90.0%).
| Industry | Male | Female |
| Agriculture, Fishing & Hunting | 0 (0.0%) | 0 (0.0%) |
| Mining, Quarrying, & Extraction | 2 (100.0%) | 0 (0.0%) |
| Construction | 31 (100.0%) | 0 (0.0%) |
| Manufacturing | 1 (10.0%) | 9 (90.0%) |
| Wholesale Trade | 8 (100.0%) | 0 (0.0%) |
| Retail Trade | 24 (66.7%) | 12 (33.3%) |
| Transportation & Warehousing | 0 (0.0%) | 18 (100.0%) |
| Utilities | 0 (0.0%) | 0 (0.0%) |
| Information | 4 (100.0%) | 0 (0.0%) |
| Finance & Insurance | 5 (100.0%) | 0 (0.0%) |
| Real Estate, Rental & Leasing | 0 (0.0%) | 0 (0.0%) |
| Professional & Scientific | 0 (0.0%) | 6 (100.0%) |
| Enterprise Management | 0 (0.0%) | 0 (0.0%) |
| Administrative & Support | 5 (100.0%) | 0 (0.0%) |
| Educational Services | 23 (47.9%) | 25 (52.1%) |
| Health Care & Social Assistance | 16 (21.0%) | 60 (78.9%) |
| Arts, Entertainment & Recreation | 0 (0.0%) | 0 (0.0%) |
| Accommodation & Food Services | 99 (24.3%) | 308 (75.7%) |
| Public Administration | 9 (33.3%) | 18 (66.7%) |
| Total | 227 (33.0%) | 460 (67.0%) |
Education in Centerville
School Enrollment in Centerville
The most common levels of schooling among the 417 students in Centerville are high school (287 | 68.8%), middle school (53 | 12.7%), and elementary school (34 | 8.2%).
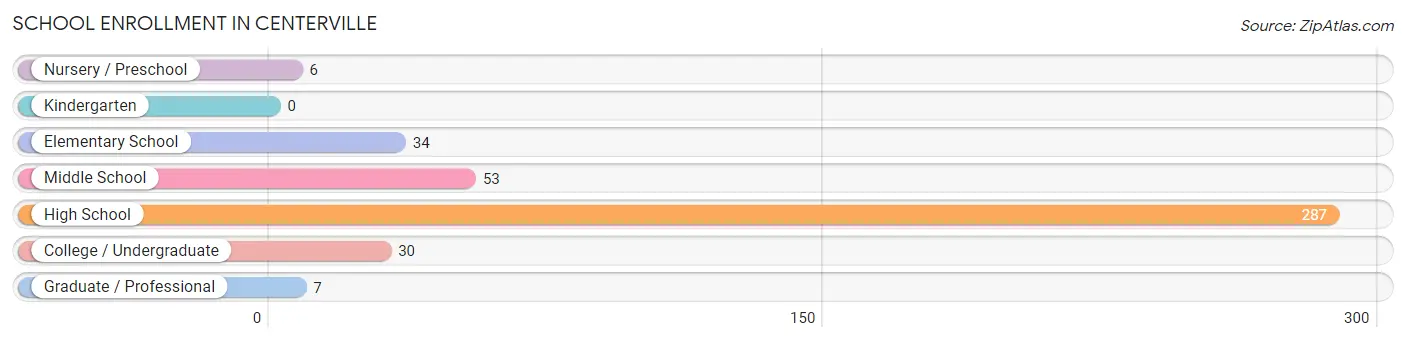
| School Level | # Students | % Students |
| Nursery / Preschool | 6 | 1.4% |
| Kindergarten | 0 | 0.0% |
| Elementary School | 34 | 8.2% |
| Middle School | 53 | 12.7% |
| High School | 287 | 68.8% |
| College / Undergraduate | 30 | 7.2% |
| Graduate / Professional | 7 | 1.7% |
| Total | 417 | 100.0% |
School Enrollment by Age by Funding Source in Centerville
Out of a total of 417 students who are enrolled in schools in Centerville, 16 (3.8%) attend a private institution, while the remaining 401 (96.2%) are enrolled in public schools. The age group of 10 to 14 year olds has the highest likelihood of being enrolled in private schools, with 11 (17.5% in the age bracket) enrolled. Conversely, the age group of 15 to 17 year olds has the lowest likelihood of being enrolled in a private school, with 188 (100.0% in the age bracket) attending a public institution.
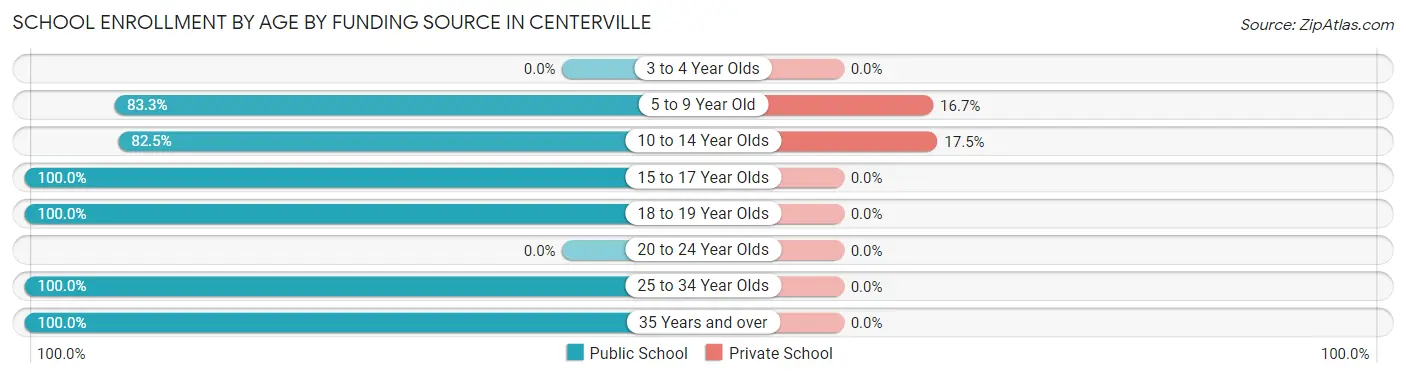
| Age Bracket | Public School | Private School |
| 3 to 4 Year Olds | 0 (0.0%) | 0 (0.0%) |
| 5 to 9 Year Old | 25 (83.3%) | 5 (16.7%) |
| 10 to 14 Year Olds | 52 (82.5%) | 11 (17.5%) |
| 15 to 17 Year Olds | 188 (100.0%) | 0 (0.0%) |
| 18 to 19 Year Olds | 99 (100.0%) | 0 (0.0%) |
| 20 to 24 Year Olds | 0 (0.0%) | 0 (0.0%) |
| 25 to 34 Year Olds | 17 (100.0%) | 0 (0.0%) |
| 35 Years and over | 20 (100.0%) | 0 (0.0%) |
| Total | 401 (96.2%) | 16 (3.8%) |
Educational Attainment by Field of Study in Centerville
Education (43 | 35.0%), bio, nature & agricultural (26 | 21.1%), business (23 | 18.7%), arts & humanities (12 | 9.8%), and physical & health sciences (9 | 7.3%) are the most common fields of study among 123 individuals in Centerville who have obtained a bachelor's degree or higher.
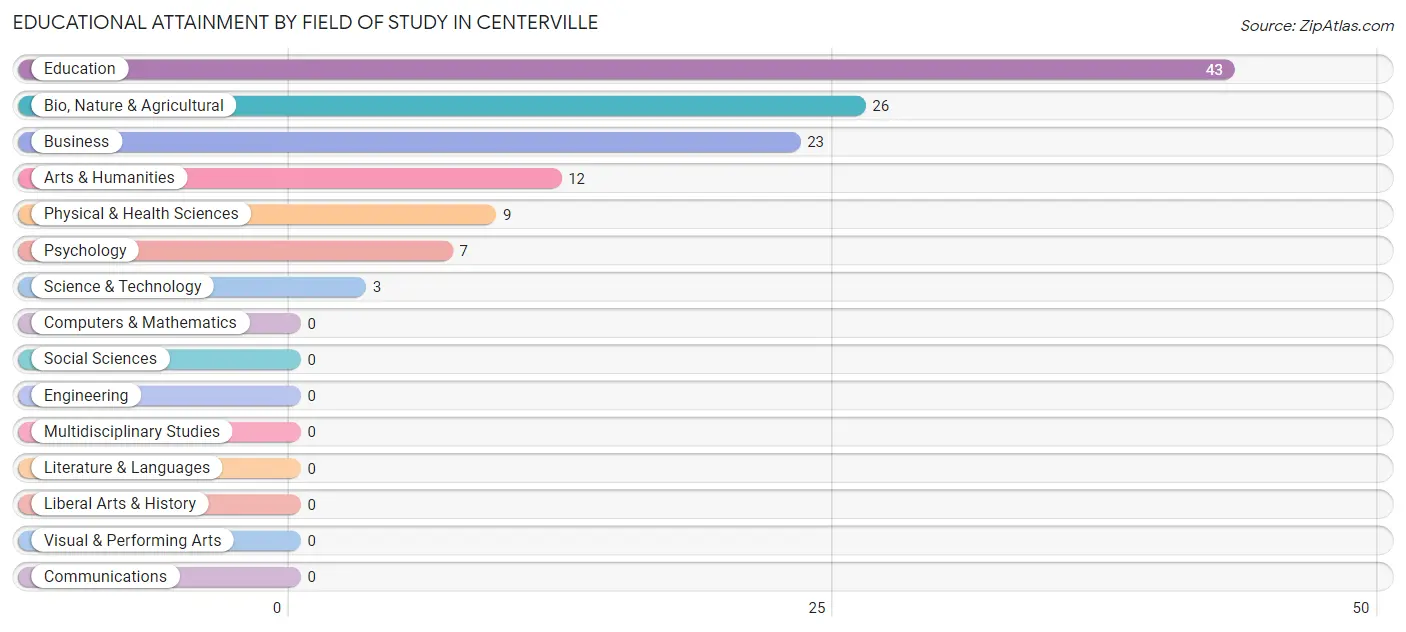
| Field of Study | # Graduates | % Graduates |
| Computers & Mathematics | 0 | 0.0% |
| Bio, Nature & Agricultural | 26 | 21.1% |
| Physical & Health Sciences | 9 | 7.3% |
| Psychology | 7 | 5.7% |
| Social Sciences | 0 | 0.0% |
| Engineering | 0 | 0.0% |
| Multidisciplinary Studies | 0 | 0.0% |
| Science & Technology | 3 | 2.4% |
| Business | 23 | 18.7% |
| Education | 43 | 35.0% |
| Literature & Languages | 0 | 0.0% |
| Liberal Arts & History | 0 | 0.0% |
| Visual & Performing Arts | 0 | 0.0% |
| Communications | 0 | 0.0% |
| Arts & Humanities | 12 | 9.8% |
| Total | 123 | 100.0% |
Transportation & Commute in Centerville
Vehicle Availability by Sex in Centerville
The most prevalent vehicle ownership categories in Centerville are males with 2 vehicles (160, accounting for 70.5%) and females with 2 vehicles (367, making up 34.8%).
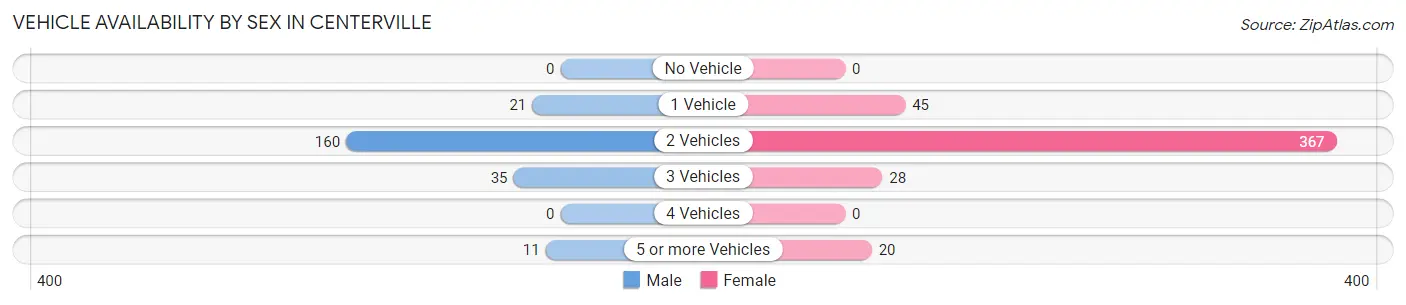
| Vehicles Available | Male | Female |
| No Vehicle | 0 (0.0%) | 0 (0.0%) |
| 1 Vehicle | 21 (9.2%) | 45 (9.8%) |
| 2 Vehicles | 160 (70.5%) | 367 (79.8%) |
| 3 Vehicles | 35 (15.4%) | 28 (6.1%) |
| 4 Vehicles | 0 (0.0%) | 0 (0.0%) |
| 5 or more Vehicles | 11 (4.9%) | 20 (4.3%) |
| Total | 227 (100.0%) | 460 (100.0%) |
Commute Time in Centerville
The most frequently occuring commute durations in Centerville are 15 to 19 minutes (251 commuters, 36.6%), 10 to 14 minutes (100 commuters, 14.6%), and 30 to 34 minutes (89 commuters, 13.0%).
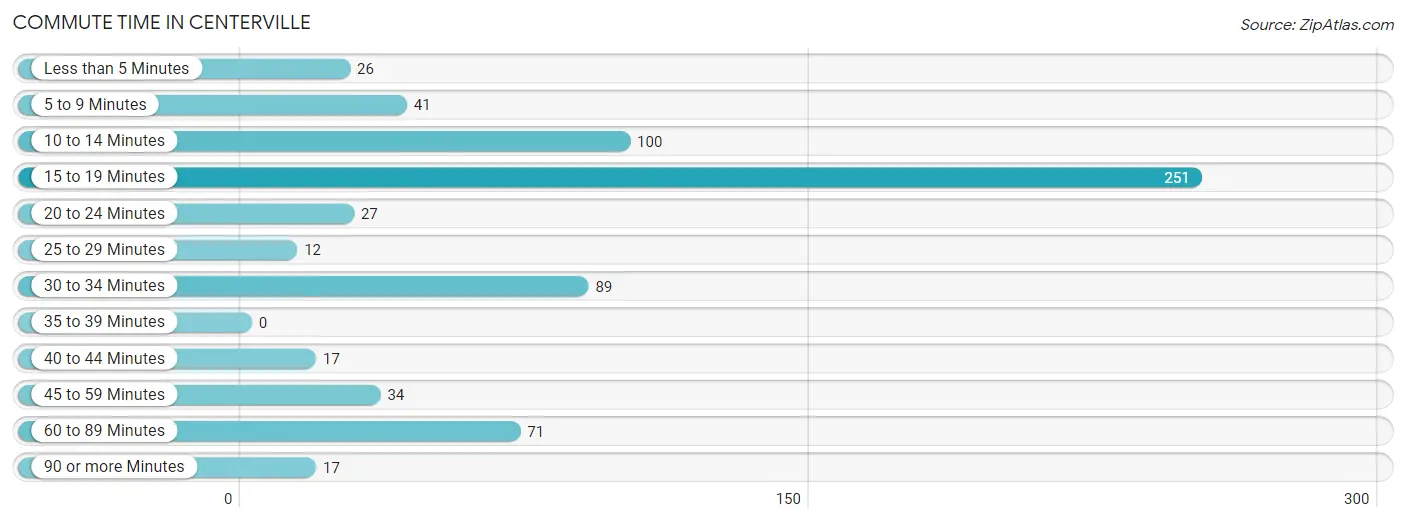
| Commute Time | # Commuters | % Commuters |
| Less than 5 Minutes | 26 | 3.8% |
| 5 to 9 Minutes | 41 | 6.0% |
| 10 to 14 Minutes | 100 | 14.6% |
| 15 to 19 Minutes | 251 | 36.6% |
| 20 to 24 Minutes | 27 | 3.9% |
| 25 to 29 Minutes | 12 | 1.8% |
| 30 to 34 Minutes | 89 | 13.0% |
| 35 to 39 Minutes | 0 | 0.0% |
| 40 to 44 Minutes | 17 | 2.5% |
| 45 to 59 Minutes | 34 | 5.0% |
| 60 to 89 Minutes | 71 | 10.4% |
| 90 or more Minutes | 17 | 2.5% |
Commute Time by Sex in Centerville
The most common commute times in Centerville are 10 to 14 minutes (100 commuters, 44.1%) for males and 15 to 19 minutes (236 commuters, 51.5%) for females.
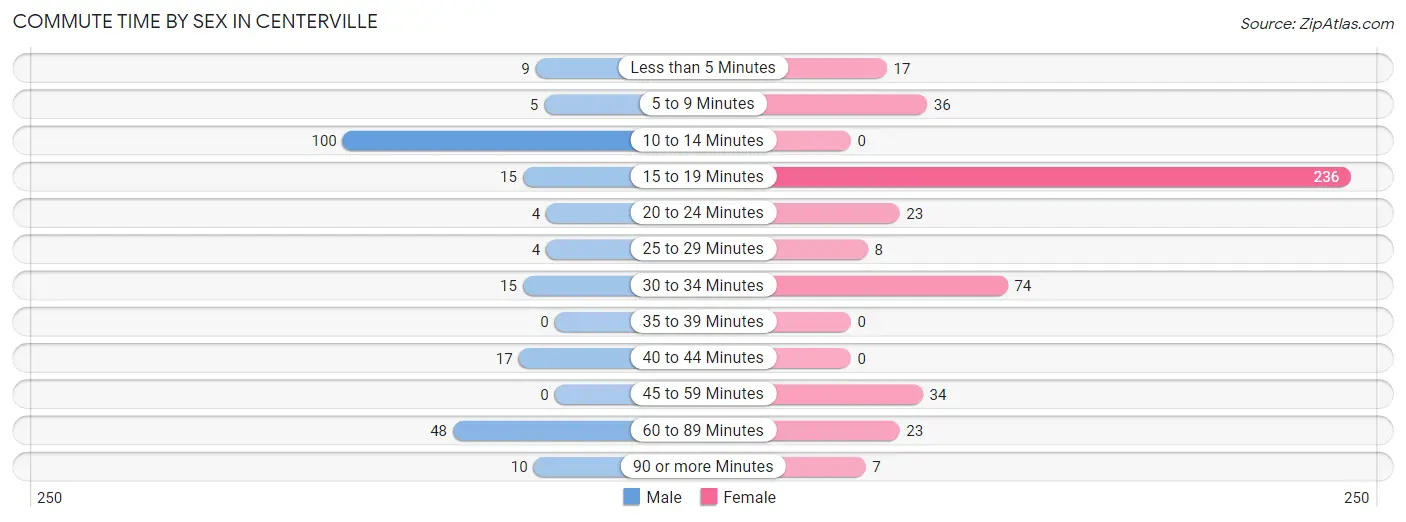
| Commute Time | Male | Female |
| Less than 5 Minutes | 9 (4.0%) | 17 (3.7%) |
| 5 to 9 Minutes | 5 (2.2%) | 36 (7.9%) |
| 10 to 14 Minutes | 100 (44.1%) | 0 (0.0%) |
| 15 to 19 Minutes | 15 (6.6%) | 236 (51.5%) |
| 20 to 24 Minutes | 4 (1.8%) | 23 (5.0%) |
| 25 to 29 Minutes | 4 (1.8%) | 8 (1.8%) |
| 30 to 34 Minutes | 15 (6.6%) | 74 (16.2%) |
| 35 to 39 Minutes | 0 (0.0%) | 0 (0.0%) |
| 40 to 44 Minutes | 17 (7.5%) | 0 (0.0%) |
| 45 to 59 Minutes | 0 (0.0%) | 34 (7.4%) |
| 60 to 89 Minutes | 48 (21.1%) | 23 (5.0%) |
| 90 or more Minutes | 10 (4.4%) | 7 (1.5%) |
Time of Departure to Work by Sex in Centerville
The most frequent times of departure to work in Centerville are 12:00 PM to 3:59 PM (99, 43.6%) for males and 4:00 PM to 11:59 PM (269, 58.7%) for females.
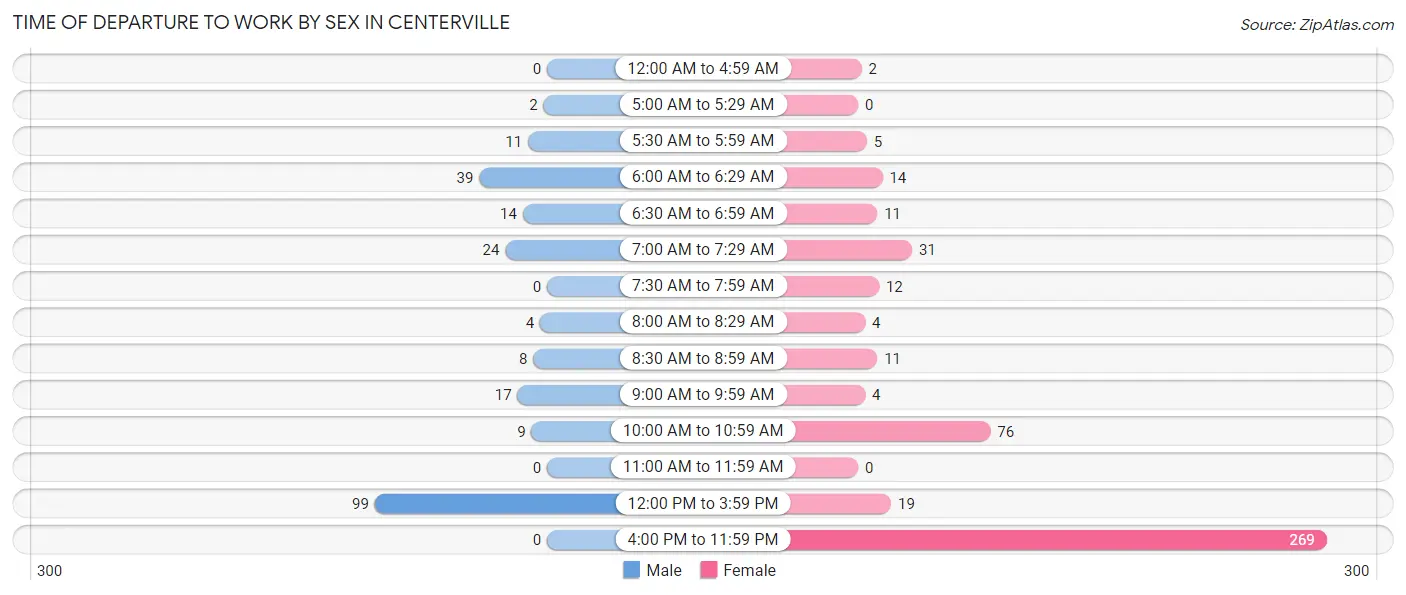
| Time of Departure | Male | Female |
| 12:00 AM to 4:59 AM | 0 (0.0%) | 2 (0.4%) |
| 5:00 AM to 5:29 AM | 2 (0.9%) | 0 (0.0%) |
| 5:30 AM to 5:59 AM | 11 (4.9%) | 5 (1.1%) |
| 6:00 AM to 6:29 AM | 39 (17.2%) | 14 (3.1%) |
| 6:30 AM to 6:59 AM | 14 (6.2%) | 11 (2.4%) |
| 7:00 AM to 7:29 AM | 24 (10.6%) | 31 (6.8%) |
| 7:30 AM to 7:59 AM | 0 (0.0%) | 12 (2.6%) |
| 8:00 AM to 8:29 AM | 4 (1.8%) | 4 (0.9%) |
| 8:30 AM to 8:59 AM | 8 (3.5%) | 11 (2.4%) |
| 9:00 AM to 9:59 AM | 17 (7.5%) | 4 (0.9%) |
| 10:00 AM to 10:59 AM | 9 (4.0%) | 76 (16.6%) |
| 11:00 AM to 11:59 AM | 0 (0.0%) | 0 (0.0%) |
| 12:00 PM to 3:59 PM | 99 (43.6%) | 19 (4.2%) |
| 4:00 PM to 11:59 PM | 0 (0.0%) | 269 (58.7%) |
| Total | 227 (100.0%) | 458 (100.0%) |
Housing Occupancy in Centerville
Occupancy by Ownership in Centerville
Of the total 427 dwellings in Centerville, owner-occupied units account for 293 (68.6%), while renter-occupied units make up 134 (31.4%).
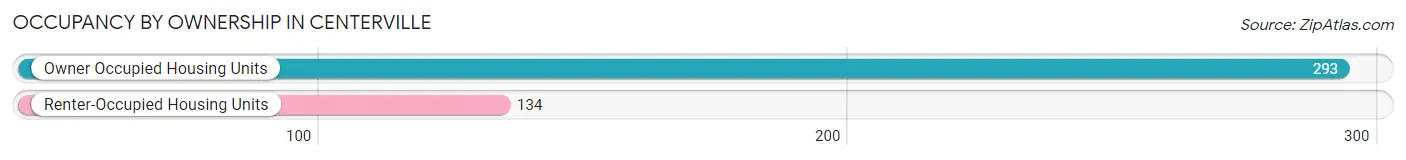
| Occupancy | # Housing Units | % Housing Units |
| Owner Occupied Housing Units | 293 | 68.6% |
| Renter-Occupied Housing Units | 134 | 31.4% |
| Total Occupied Housing Units | 427 | 100.0% |
Occupancy by Household Size in Centerville
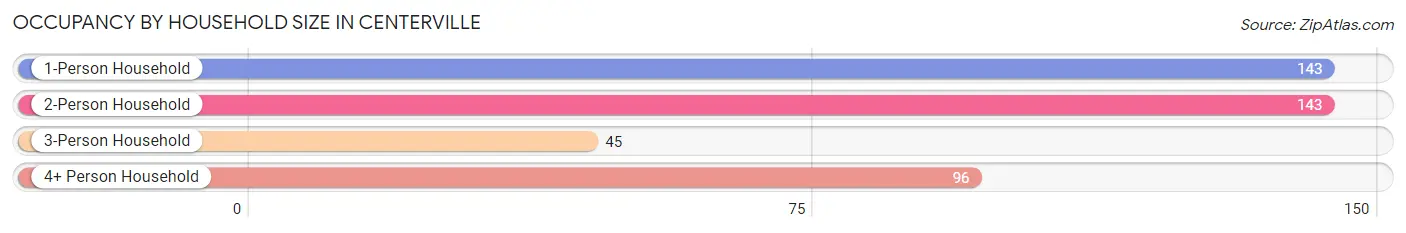
| Household Size | # Housing Units | % Housing Units |
| 1-Person Household | 143 | 33.5% |
| 2-Person Household | 143 | 33.5% |
| 3-Person Household | 45 | 10.5% |
| 4+ Person Household | 96 | 22.5% |
| Total Housing Units | 427 | 100.0% |
Occupancy by Ownership by Household Size in Centerville
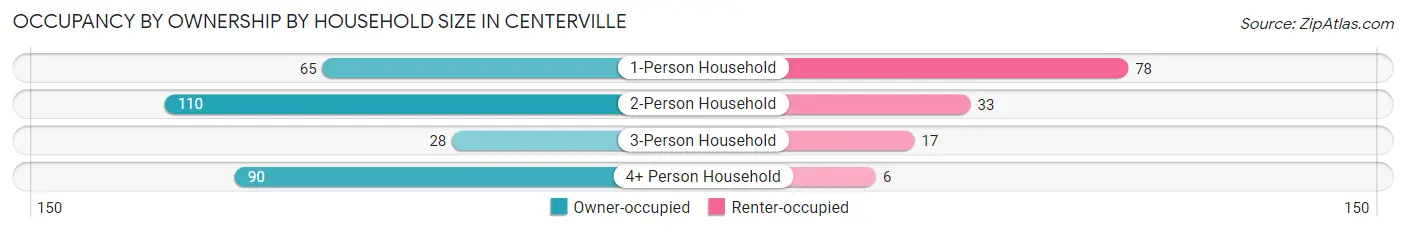
| Household Size | Owner-occupied | Renter-occupied |
| 1-Person Household | 65 (45.5%) | 78 (54.5%) |
| 2-Person Household | 110 (76.9%) | 33 (23.1%) |
| 3-Person Household | 28 (62.2%) | 17 (37.8%) |
| 4+ Person Household | 90 (93.8%) | 6 (6.2%) |
| Total Housing Units | 293 (68.6%) | 134 (31.4%) |
Occupancy by Educational Attainment in Centerville
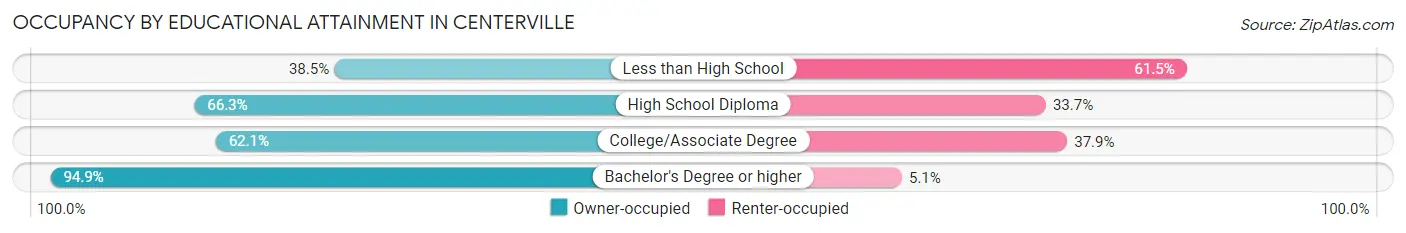
| Household Size | Owner-occupied | Renter-occupied |
| Less than High School | 10 (38.5%) | 16 (61.5%) |
| High School Diploma | 132 (66.3%) | 67 (33.7%) |
| College/Associate Degree | 77 (62.1%) | 47 (37.9%) |
| Bachelor's Degree or higher | 74 (94.9%) | 4 (5.1%) |
Occupancy by Age of Householder in Centerville
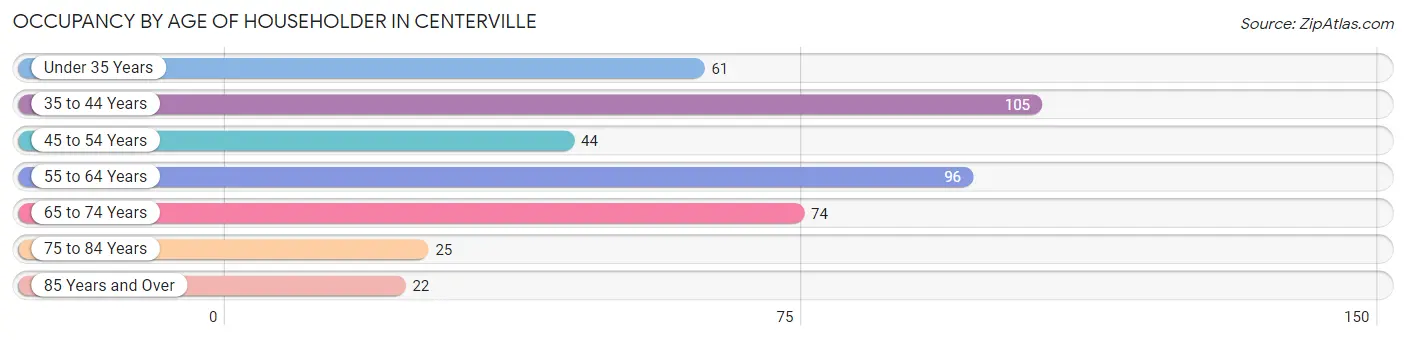
| Age Bracket | # Households | % Households |
| Under 35 Years | 61 | 14.3% |
| 35 to 44 Years | 105 | 24.6% |
| 45 to 54 Years | 44 | 10.3% |
| 55 to 64 Years | 96 | 22.5% |
| 65 to 74 Years | 74 | 17.3% |
| 75 to 84 Years | 25 | 5.9% |
| 85 Years and Over | 22 | 5.1% |
| Total | 427 | 100.0% |
Housing Finances in Centerville
Median Income by Occupancy in Centerville
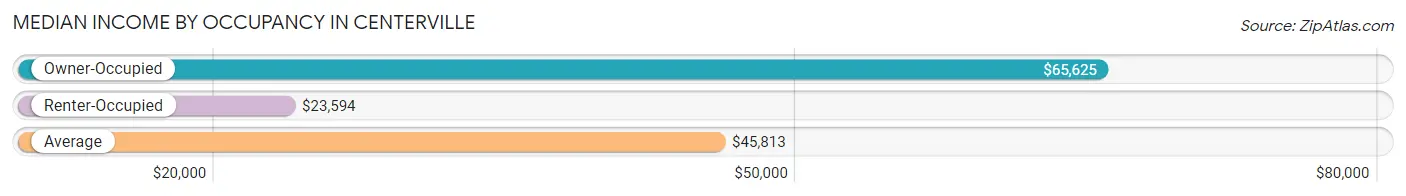
| Occupancy Type | # Households | Median Income |
| Owner-Occupied | 293 (68.6%) | $65,625 |
| Renter-Occupied | 134 (31.4%) | $23,594 |
| Average | 427 (100.0%) | $45,813 |
Occupancy by Householder Income Bracket in Centerville
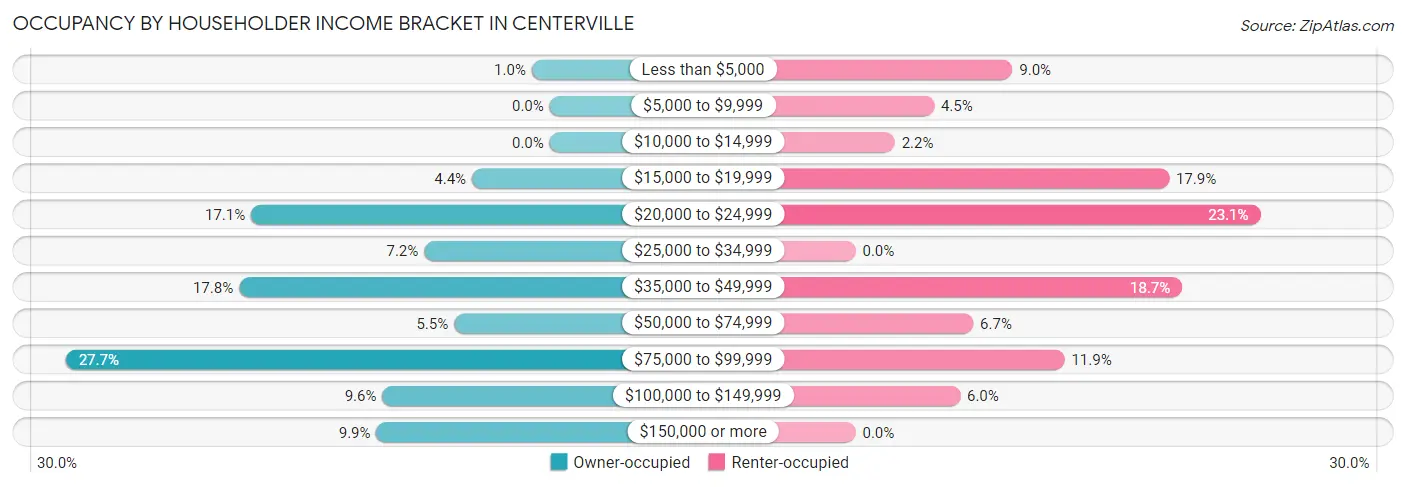
| Income Bracket | Owner-occupied | Renter-occupied |
| Less than $5,000 | 3 (1.0%) | 12 (9.0%) |
| $5,000 to $9,999 | 0 (0.0%) | 6 (4.5%) |
| $10,000 to $14,999 | 0 (0.0%) | 3 (2.2%) |
| $15,000 to $19,999 | 13 (4.4%) | 24 (17.9%) |
| $20,000 to $24,999 | 50 (17.1%) | 31 (23.1%) |
| $25,000 to $34,999 | 21 (7.2%) | 0 (0.0%) |
| $35,000 to $49,999 | 52 (17.7%) | 25 (18.7%) |
| $50,000 to $74,999 | 16 (5.5%) | 9 (6.7%) |
| $75,000 to $99,999 | 81 (27.7%) | 16 (11.9%) |
| $100,000 to $149,999 | 28 (9.6%) | 8 (6.0%) |
| $150,000 or more | 29 (9.9%) | 0 (0.0%) |
| Total | 293 (100.0%) | 134 (100.0%) |
Monthly Housing Cost Tiers in Centerville
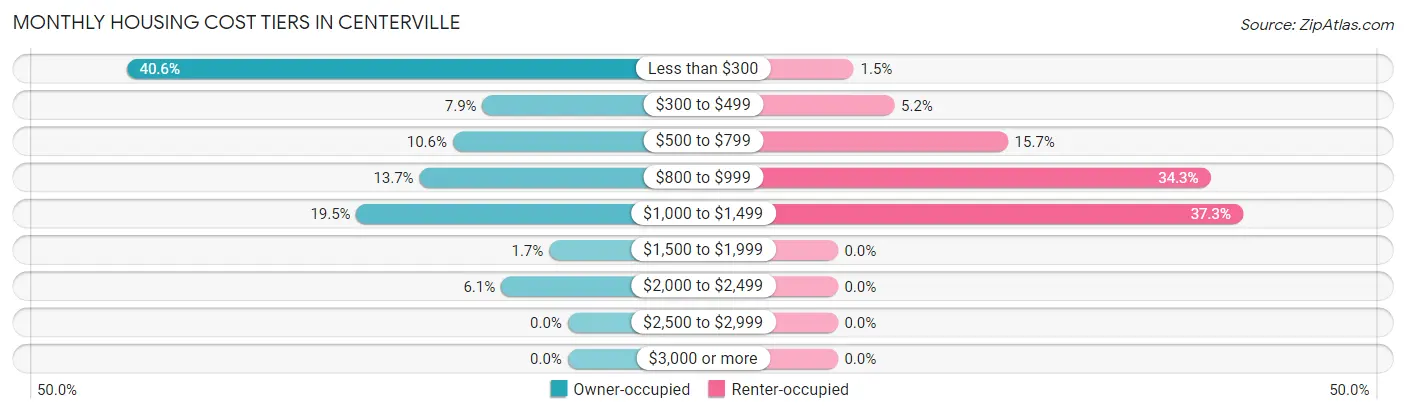
| Monthly Cost | Owner-occupied | Renter-occupied |
| Less than $300 | 119 (40.6%) | 2 (1.5%) |
| $300 to $499 | 23 (7.9%) | 7 (5.2%) |
| $500 to $799 | 31 (10.6%) | 21 (15.7%) |
| $800 to $999 | 40 (13.7%) | 46 (34.3%) |
| $1,000 to $1,499 | 57 (19.5%) | 50 (37.3%) |
| $1,500 to $1,999 | 5 (1.7%) | 0 (0.0%) |
| $2,000 to $2,499 | 18 (6.1%) | 0 (0.0%) |
| $2,500 to $2,999 | 0 (0.0%) | 0 (0.0%) |
| $3,000 or more | 0 (0.0%) | 0 (0.0%) |
| Total | 293 (100.0%) | 134 (100.0%) |
Physical Housing Characteristics in Centerville
Housing Structures in Centerville
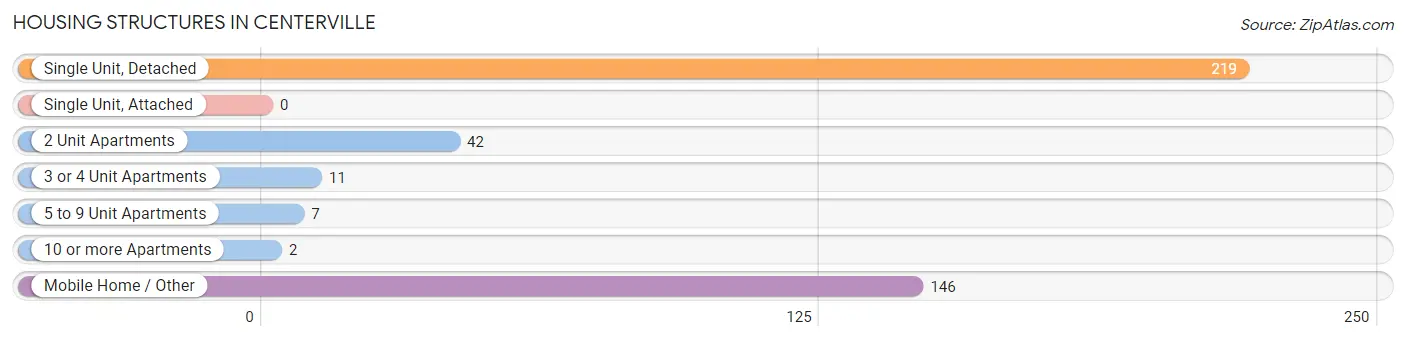
| Structure Type | # Housing Units | % Housing Units |
| Single Unit, Detached | 219 | 51.3% |
| Single Unit, Attached | 0 | 0.0% |
| 2 Unit Apartments | 42 | 9.8% |
| 3 or 4 Unit Apartments | 11 | 2.6% |
| 5 to 9 Unit Apartments | 7 | 1.6% |
| 10 or more Apartments | 2 | 0.5% |
| Mobile Home / Other | 146 | 34.2% |
| Total | 427 | 100.0% |
Housing Structures by Occupancy in Centerville
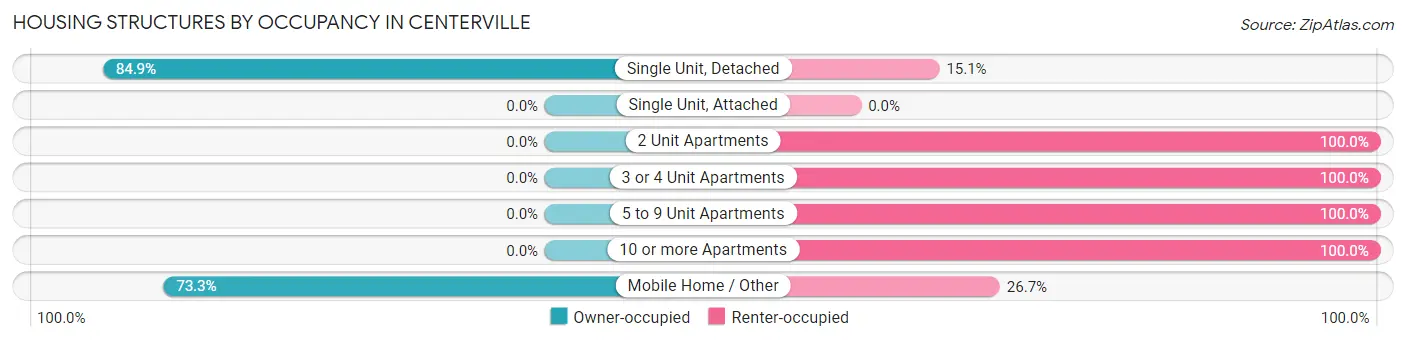
| Structure Type | Owner-occupied | Renter-occupied |
| Single Unit, Detached | 186 (84.9%) | 33 (15.1%) |
| Single Unit, Attached | 0 (0.0%) | 0 (0.0%) |
| 2 Unit Apartments | 0 (0.0%) | 42 (100.0%) |
| 3 or 4 Unit Apartments | 0 (0.0%) | 11 (100.0%) |
| 5 to 9 Unit Apartments | 0 (0.0%) | 7 (100.0%) |
| 10 or more Apartments | 0 (0.0%) | 2 (100.0%) |
| Mobile Home / Other | 107 (73.3%) | 39 (26.7%) |
| Total | 293 (68.6%) | 134 (31.4%) |
Housing Structures by Number of Rooms in Centerville
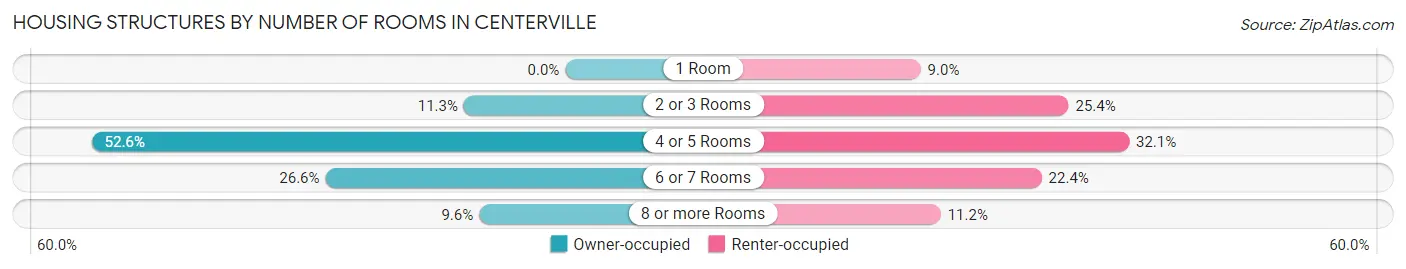
| Number of Rooms | Owner-occupied | Renter-occupied |
| 1 Room | 0 (0.0%) | 12 (9.0%) |
| 2 or 3 Rooms | 33 (11.3%) | 34 (25.4%) |
| 4 or 5 Rooms | 154 (52.6%) | 43 (32.1%) |
| 6 or 7 Rooms | 78 (26.6%) | 30 (22.4%) |
| 8 or more Rooms | 28 (9.6%) | 15 (11.2%) |
| Total | 293 (100.0%) | 134 (100.0%) |
Housing Structure by Heating Type in Centerville
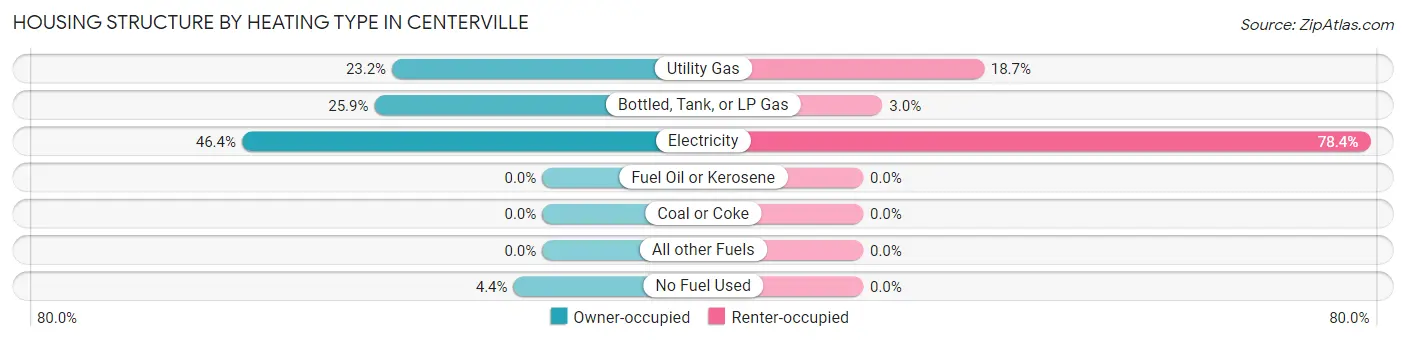
| Heating Type | Owner-occupied | Renter-occupied |
| Utility Gas | 68 (23.2%) | 25 (18.7%) |
| Bottled, Tank, or LP Gas | 76 (25.9%) | 4 (3.0%) |
| Electricity | 136 (46.4%) | 105 (78.4%) |
| Fuel Oil or Kerosene | 0 (0.0%) | 0 (0.0%) |
| Coal or Coke | 0 (0.0%) | 0 (0.0%) |
| All other Fuels | 0 (0.0%) | 0 (0.0%) |
| No Fuel Used | 13 (4.4%) | 0 (0.0%) |
| Total | 293 (100.0%) | 134 (100.0%) |
Household Vehicle Usage in Centerville
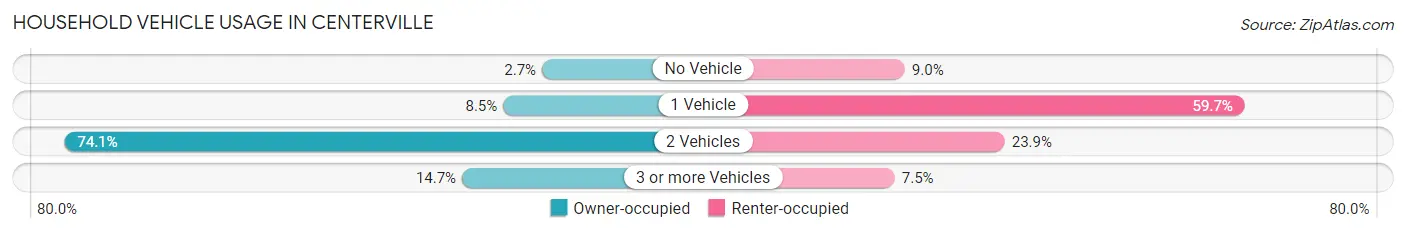
| Vehicles per Household | Owner-occupied | Renter-occupied |
| No Vehicle | 8 (2.7%) | 12 (9.0%) |
| 1 Vehicle | 25 (8.5%) | 80 (59.7%) |
| 2 Vehicles | 217 (74.1%) | 32 (23.9%) |
| 3 or more Vehicles | 43 (14.7%) | 10 (7.5%) |
| Total | 293 (100.0%) | 134 (100.0%) |
Real Estate & Mortgages in Centerville
Real Estate and Mortgage Overview in Centerville
| Characteristic | Without Mortgage | With Mortgage |
| Housing Units | 199 | 94 |
| Median Property Value | $58,100 | $162,500 |
| Median Household Income | $95,084 | $17 |
| Monthly Housing Costs | $288 | $0 |
| Real Estate Taxes | - | - |
Property Value by Mortgage Status in Centerville
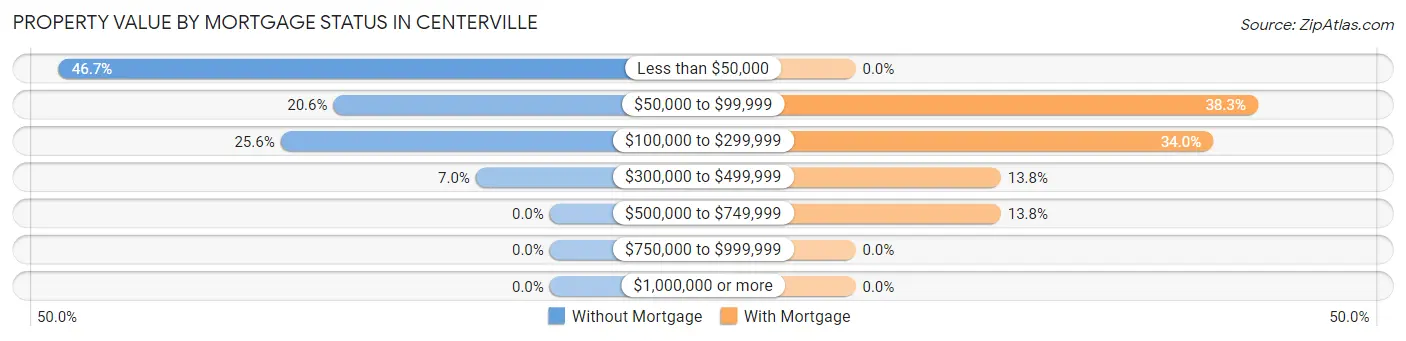
| Property Value | Without Mortgage | With Mortgage |
| Less than $50,000 | 93 (46.7%) | 0 (0.0%) |
| $50,000 to $99,999 | 41 (20.6%) | 36 (38.3%) |
| $100,000 to $299,999 | 51 (25.6%) | 32 (34.0%) |
| $300,000 to $499,999 | 14 (7.0%) | 13 (13.8%) |
| $500,000 to $749,999 | 0 (0.0%) | 13 (13.8%) |
| $750,000 to $999,999 | 0 (0.0%) | 0 (0.0%) |
| $1,000,000 or more | 0 (0.0%) | 0 (0.0%) |
| Total | 199 (100.0%) | 94 (100.0%) |
Household Income by Mortgage Status in Centerville
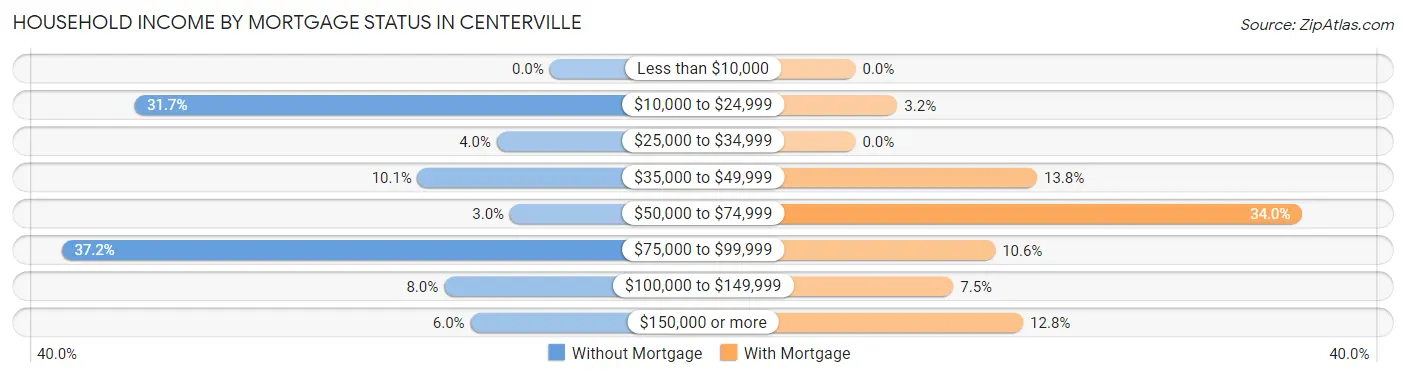
| Household Income | Without Mortgage | With Mortgage |
| Less than $10,000 | 0 (0.0%) | 0 (0.0%) |
| $10,000 to $24,999 | 63 (31.7%) | 3 (3.2%) |
| $25,000 to $34,999 | 8 (4.0%) | 0 (0.0%) |
| $35,000 to $49,999 | 20 (10.1%) | 13 (13.8%) |
| $50,000 to $74,999 | 6 (3.0%) | 32 (34.0%) |
| $75,000 to $99,999 | 74 (37.2%) | 10 (10.6%) |
| $100,000 to $149,999 | 16 (8.0%) | 7 (7.4%) |
| $150,000 or more | 12 (6.0%) | 12 (12.8%) |
| Total | 199 (100.0%) | 94 (100.0%) |
Property Value to Household Income Ratio in Centerville
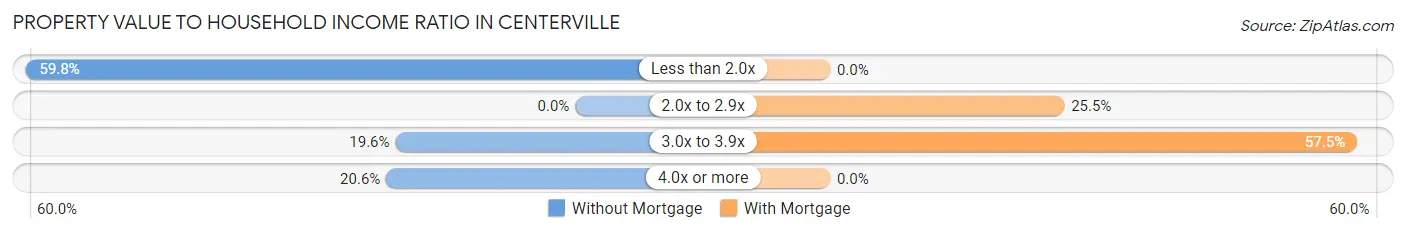
| Value-to-Income Ratio | Without Mortgage | With Mortgage |
| Less than 2.0x | 119 (59.8%) | 0 (0.0%) |
| 2.0x to 2.9x | 0 (0.0%) | 24 (25.5%) |
| 3.0x to 3.9x | 39 (19.6%) | 54 (57.5%) |
| 4.0x or more | 41 (20.6%) | 0 (0.0%) |
| Total | 199 (100.0%) | 94 (100.0%) |
Real Estate Taxes by Mortgage Status in Centerville
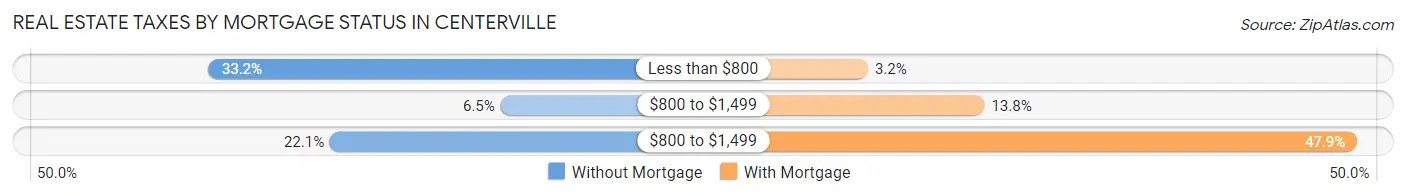
| Property Taxes | Without Mortgage | With Mortgage |
| Less than $800 | 66 (33.2%) | 3 (3.2%) |
| $800 to $1,499 | 13 (6.5%) | 13 (13.8%) |
| $800 to $1,499 | 44 (22.1%) | 45 (47.9%) |
| Total | 199 (100.0%) | 94 (100.0%) |
Health & Disability in Centerville
Health Insurance Coverage by Age in Centerville
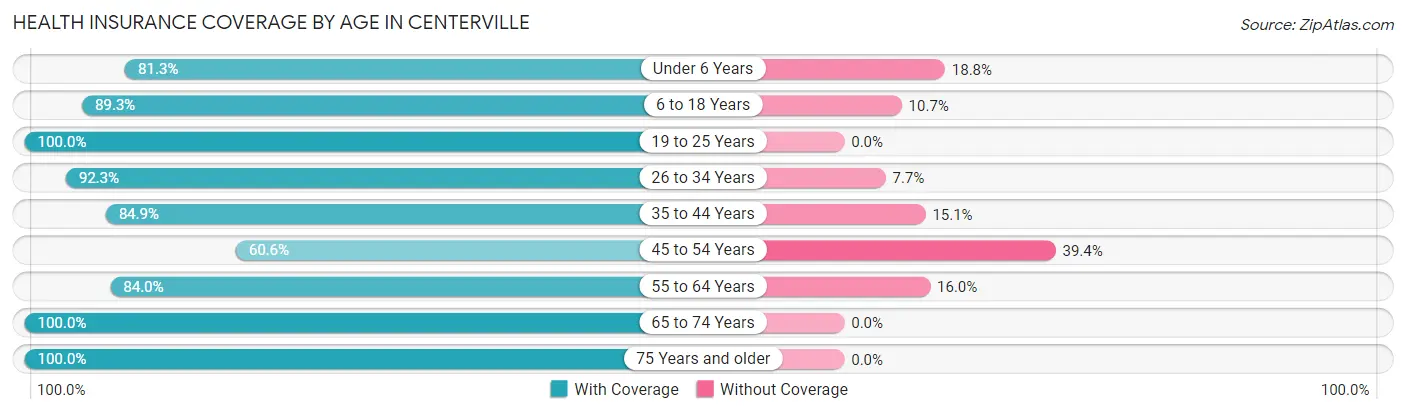
| Age Bracket | With Coverage | Without Coverage |
| Under 6 Years | 13 (81.2%) | 3 (18.8%) |
| 6 to 18 Years | 267 (89.3%) | 32 (10.7%) |
| 19 to 25 Years | 201 (100.0%) | 0 (0.0%) |
| 26 to 34 Years | 72 (92.3%) | 6 (7.7%) |
| 35 to 44 Years | 129 (84.9%) | 23 (15.1%) |
| 45 to 54 Years | 40 (60.6%) | 26 (39.4%) |
| 55 to 64 Years | 189 (84.0%) | 36 (16.0%) |
| 65 to 74 Years | 102 (100.0%) | 0 (0.0%) |
| 75 Years and older | 63 (100.0%) | 0 (0.0%) |
| Total | 1,076 (89.5%) | 126 (10.5%) |
Health Insurance Coverage by Citizenship Status in Centerville

| Citizenship Status | With Coverage | Without Coverage |
| Native Born | 13 (81.2%) | 3 (18.8%) |
| Foreign Born, Citizen | 267 (89.3%) | 32 (10.7%) |
| Foreign Born, not a Citizen | 201 (100.0%) | 0 (0.0%) |
Health Insurance Coverage by Household Income in Centerville
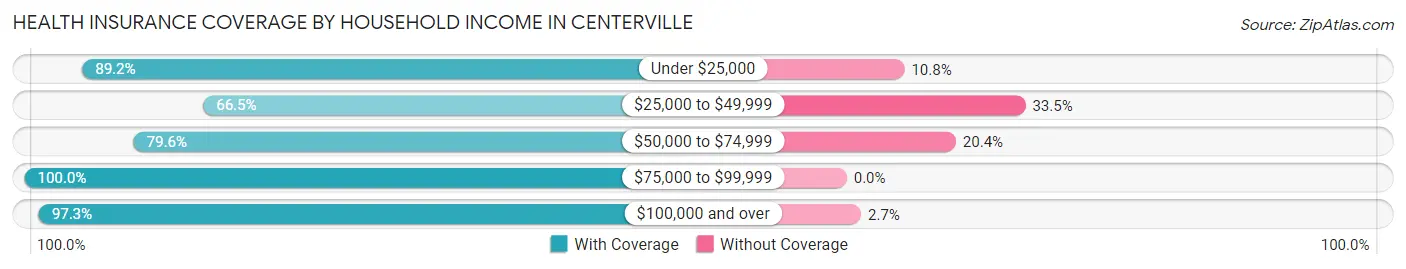
| Household Income | With Coverage | Without Coverage |
| Under $25,000 | 165 (89.2%) | 20 (10.8%) |
| $25,000 to $49,999 | 147 (66.5%) | 74 (33.5%) |
| $50,000 to $74,999 | 109 (79.6%) | 28 (20.4%) |
| $75,000 to $99,999 | 510 (100.0%) | 0 (0.0%) |
| $100,000 and over | 145 (97.3%) | 4 (2.7%) |
Public vs Private Health Insurance Coverage by Age in Centerville
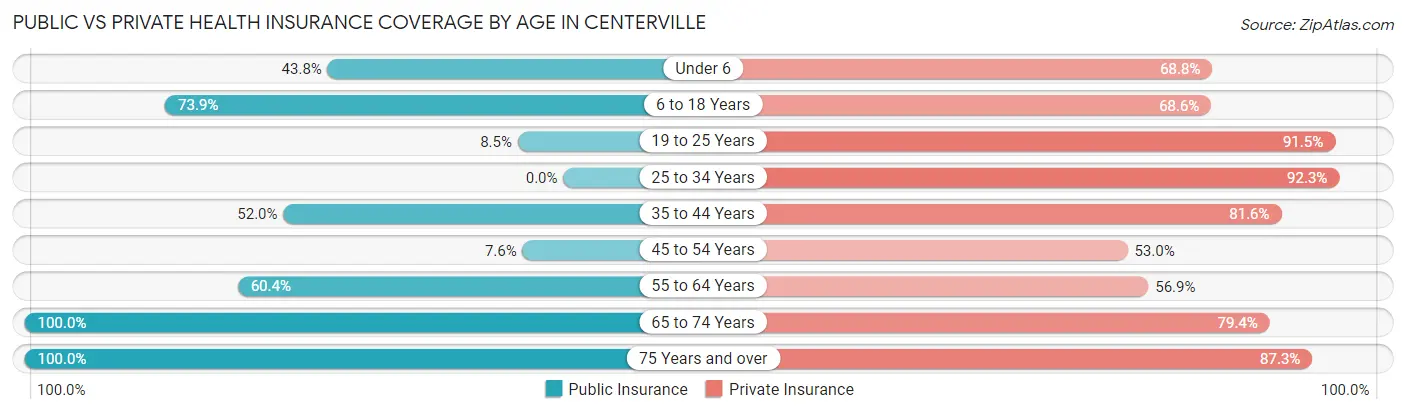
| Age Bracket | Public Insurance | Private Insurance |
| Under 6 | 7 (43.8%) | 11 (68.8%) |
| 6 to 18 Years | 221 (73.9%) | 205 (68.6%) |
| 19 to 25 Years | 17 (8.5%) | 184 (91.5%) |
| 25 to 34 Years | 0 (0.0%) | 72 (92.3%) |
| 35 to 44 Years | 79 (52.0%) | 124 (81.6%) |
| 45 to 54 Years | 5 (7.6%) | 35 (53.0%) |
| 55 to 64 Years | 136 (60.4%) | 128 (56.9%) |
| 65 to 74 Years | 102 (100.0%) | 81 (79.4%) |
| 75 Years and over | 63 (100.0%) | 55 (87.3%) |
| Total | 630 (52.4%) | 895 (74.5%) |
Disability Status by Sex by Age in Centerville
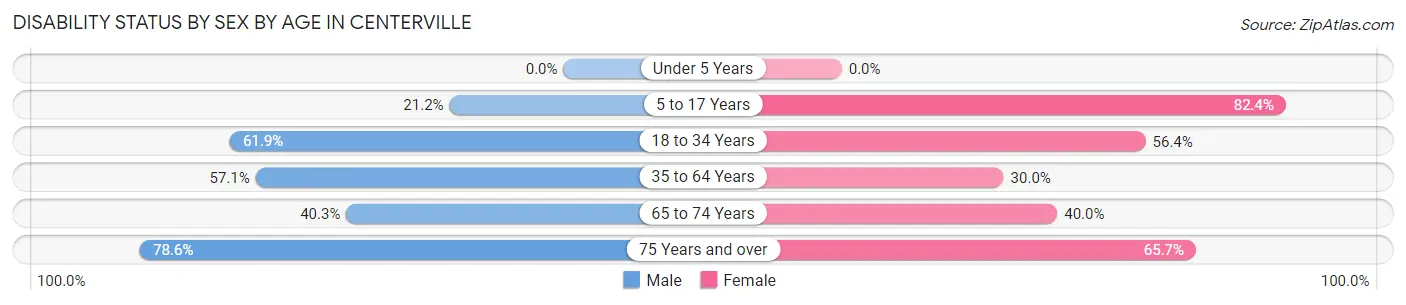
| Age Bracket | Male | Female |
| Under 5 Years | 0 (0.0%) | 0 (0.0%) |
| 5 to 17 Years | 11 (21.1%) | 192 (82.4%) |
| 18 to 34 Years | 99 (61.9%) | 75 (56.4%) |
| 35 to 64 Years | 120 (57.1%) | 70 (30.0%) |
| 65 to 74 Years | 27 (40.3%) | 14 (40.0%) |
| 75 Years and over | 22 (78.6%) | 23 (65.7%) |
Disability Class by Sex by Age in Centerville
Disability Class: Hearing Difficulty
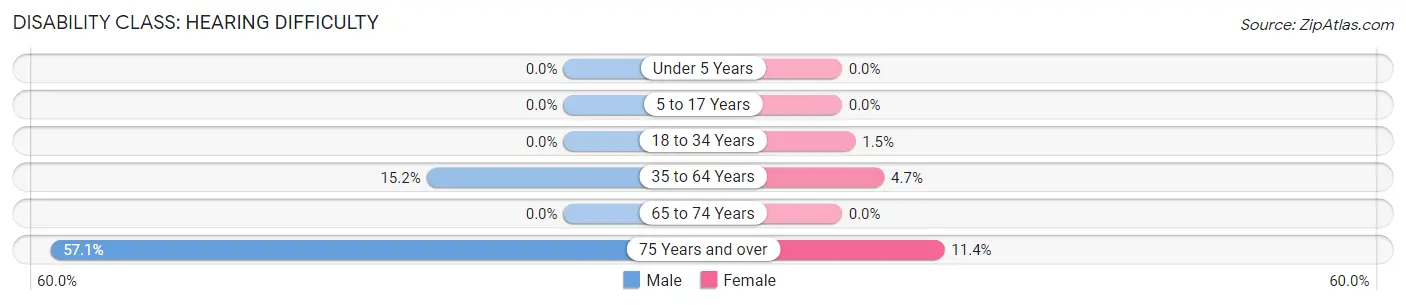
| Age Bracket | Male | Female |
| Under 5 Years | 0 (0.0%) | 0 (0.0%) |
| 5 to 17 Years | 0 (0.0%) | 0 (0.0%) |
| 18 to 34 Years | 0 (0.0%) | 2 (1.5%) |
| 35 to 64 Years | 32 (15.2%) | 11 (4.7%) |
| 65 to 74 Years | 0 (0.0%) | 0 (0.0%) |
| 75 Years and over | 16 (57.1%) | 4 (11.4%) |
Disability Class: Vision Difficulty
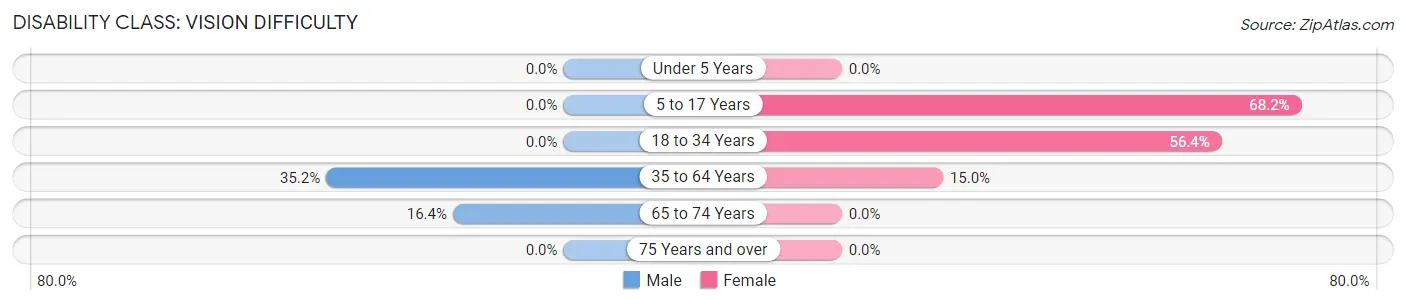
| Age Bracket | Male | Female |
| Under 5 Years | 0 (0.0%) | 0 (0.0%) |
| 5 to 17 Years | 0 (0.0%) | 159 (68.2%) |
| 18 to 34 Years | 0 (0.0%) | 75 (56.4%) |
| 35 to 64 Years | 74 (35.2%) | 35 (15.0%) |
| 65 to 74 Years | 11 (16.4%) | 0 (0.0%) |
| 75 Years and over | 0 (0.0%) | 0 (0.0%) |
Disability Class: Cognitive Difficulty
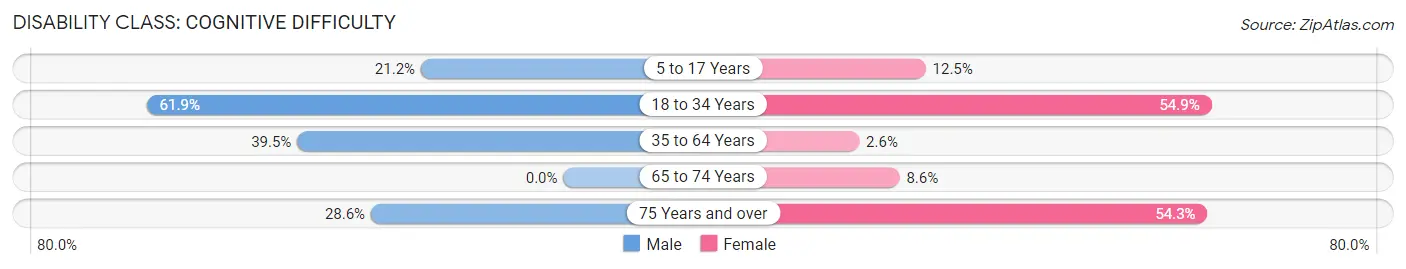
| Age Bracket | Male | Female |
| 5 to 17 Years | 11 (21.1%) | 29 (12.4%) |
| 18 to 34 Years | 99 (61.9%) | 73 (54.9%) |
| 35 to 64 Years | 83 (39.5%) | 6 (2.6%) |
| 65 to 74 Years | 0 (0.0%) | 3 (8.6%) |
| 75 Years and over | 8 (28.6%) | 19 (54.3%) |
Disability Class: Ambulatory Difficulty
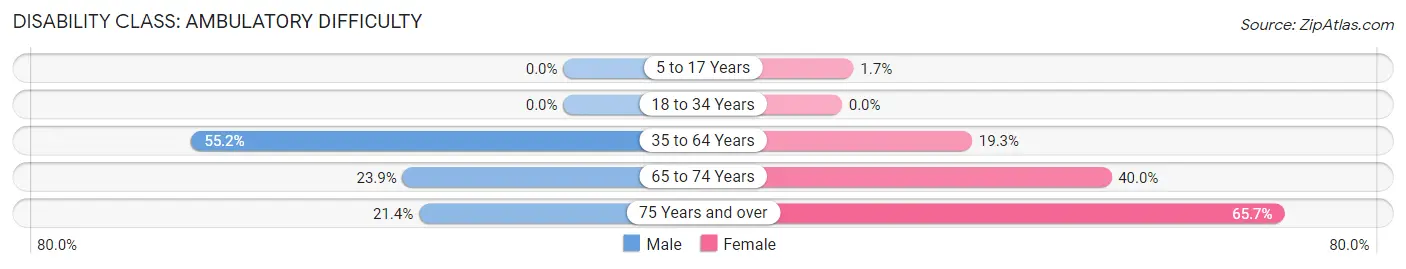
| Age Bracket | Male | Female |
| 5 to 17 Years | 0 (0.0%) | 4 (1.7%) |
| 18 to 34 Years | 0 (0.0%) | 0 (0.0%) |
| 35 to 64 Years | 116 (55.2%) | 45 (19.3%) |
| 65 to 74 Years | 16 (23.9%) | 14 (40.0%) |
| 75 Years and over | 6 (21.4%) | 23 (65.7%) |
Disability Class: Self-Care Difficulty
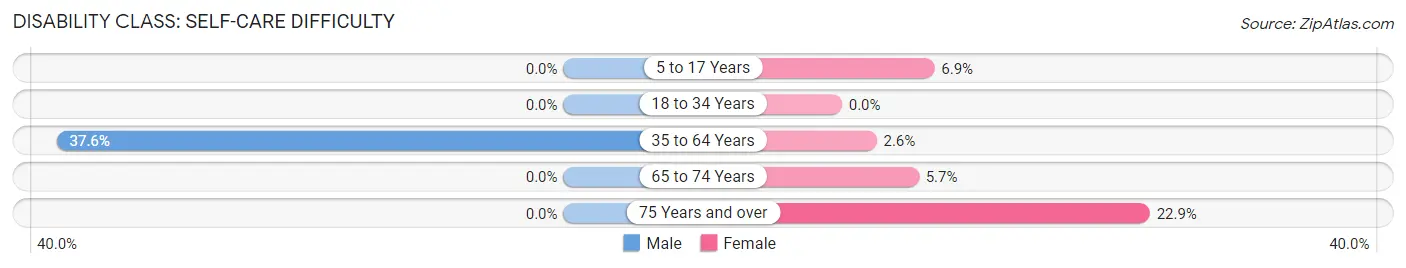
| Age Bracket | Male | Female |
| 5 to 17 Years | 0 (0.0%) | 16 (6.9%) |
| 18 to 34 Years | 0 (0.0%) | 0 (0.0%) |
| 35 to 64 Years | 79 (37.6%) | 6 (2.6%) |
| 65 to 74 Years | 0 (0.0%) | 2 (5.7%) |
| 75 Years and over | 0 (0.0%) | 8 (22.9%) |
Technology Access in Centerville
Computing Device Access in Centerville
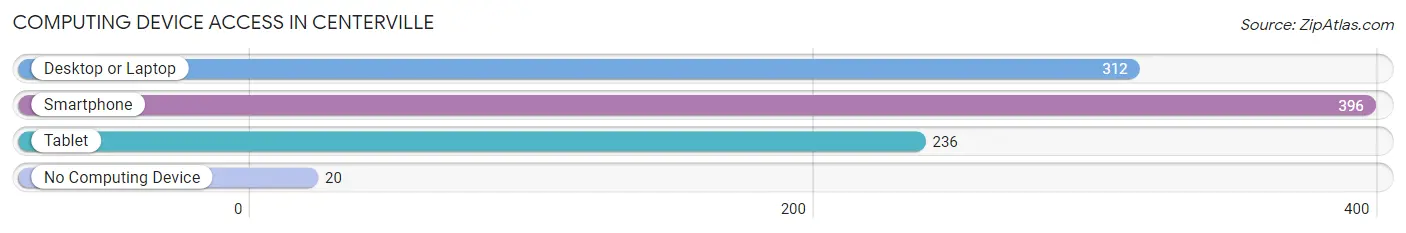
| Device Type | # Households | % Households |
| Desktop or Laptop | 312 | 73.1% |
| Smartphone | 396 | 92.7% |
| Tablet | 236 | 55.3% |
| No Computing Device | 20 | 4.7% |
| Total | 427 | 100.0% |
Internet Access in Centerville
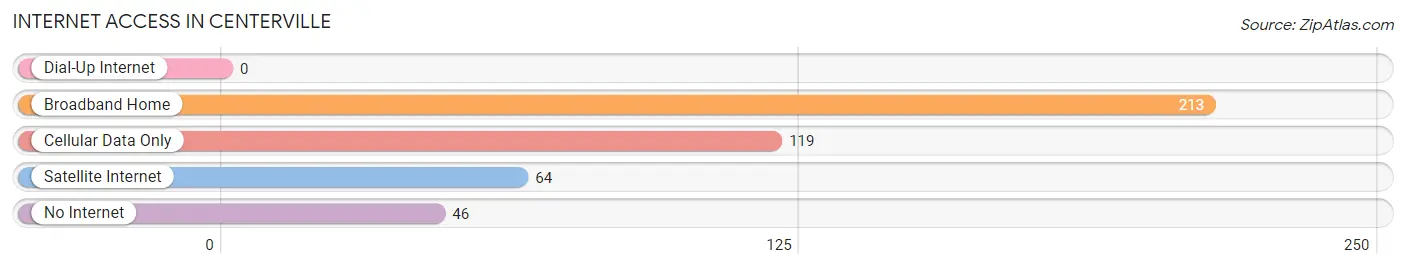
| Internet Type | # Households | % Households |
| Dial-Up Internet | 0 | 0.0% |
| Broadband Home | 213 | 49.9% |
| Cellular Data Only | 119 | 27.9% |
| Satellite Internet | 64 | 15.0% |
| No Internet | 46 | 10.8% |
| Total | 427 | 100.0% |
Centerville Summary
Centerville, Texas is a small town located in Leon County, Texas. It is situated about halfway between Dallas and Houston, and is part of the larger East Texas region. The town has a population of just over 1,000 people, and is known for its rural charm and friendly atmosphere.
History
Centerville was founded in 1846 by a group of settlers from Tennessee. The town was originally called “Centerville” because it was located at the center of Leon County. The town was officially incorporated in 1848, and the first post office was established in 1849.
In the late 19th century, Centerville was a thriving agricultural community. Cotton was the main crop, and the town was home to several cotton gins. The town also had a number of stores, churches, and other businesses.
In the early 20th century, the town began to decline as the cotton industry moved away. The population dropped from a peak of 1,500 in the 1920s to just over 1,000 in the 2000s.
Geography
Centerville is located in the East Texas region of the state, about halfway between Dallas and Houston. The town is situated on the western edge of Leon County, and is bordered by the towns of Jewett, Oakwood, and Normangee.
The town is situated on the western edge of the Blackland Prairie, a region of rolling hills and fertile soil. The area is known for its mild climate and abundant rainfall.
The town is located at the intersection of State Highway 7 and Farm to Market Road 8. The nearest major airport is in Dallas, about 90 miles away.
Economy
Centerville’s economy is largely based on agriculture. The town is home to several farms, and the surrounding area is known for its production of cotton, corn, and other crops.
The town also has a number of small businesses, including a grocery store, a hardware store, and a few restaurants. There is also a small manufacturing plant in the town.
Demographics
As of the 2010 census, the population of Centerville was 1,072. The town is predominantly white, with a small African American population. The median household income is $35,000, and the median home value is $90,000.
The town is served by the Leon County School District, which includes two elementary schools, a middle school, and a high school. The town also has a public library and a number of churches.
Conclusion
Centerville, Texas is a small town located in Leon County, Texas. It is situated about halfway between Dallas and Houston, and is part of the larger East Texas region. The town has a population of just over 1,000 people, and is known for its rural charm and friendly atmosphere. The town’s economy is largely based on agriculture, and it is home to several small businesses. The town is served by the Leon County School District, and has a public library and a number of churches. Centerville is a great place to live for those looking for a quiet, rural lifestyle.
Common Questions
What is Per Capita Income in Centerville?
Per Capita income in Centerville is $24,132.
What is the Median Family Income in Centerville?
Median Family Income in Centerville is $65,833.
What is the Median Household income in Centerville?
Median Household Income in Centerville is $45,813.
What is Family Income Deficit in Centerville?
Family Income Deficit in Centerville is $14,567.
Families that are below poverty line in Centerville earn $14,567 less on average than the poverty threshold level.
What is Inequality or Gini Index in Centerville?
Inequality or Gini Index in Centerville is 0.44.
What is the Total Population of Centerville?
Total Population of Centerville is 1,266.
What is the Total Male Population of Centerville?
Total Male Population of Centerville is 571.
What is the Total Female Population of Centerville?
Total Female Population of Centerville is 695.
What is the Ratio of Males per 100 Females in Centerville?
There are 82.16 Males per 100 Females in Centerville.
What is the Ratio of Females per 100 Males in Centerville?
There are 121.72 Females per 100 Males in Centerville.
What is the Median Population Age in Centerville?
Median Population Age in Centerville is 37.6 Years.
What is the Average Family Size in Centerville
Average Family Size in Centerville is 3.8 People.
What is the Average Household Size in Centerville
Average Household Size in Centerville is 2.8 People.
How Large is the Labor Force in Centerville?
There are 696 People in the Labor Forcein in Centerville.
What is the Percentage of People in the Labor Force in Centerville?
60.4% of People are in the Labor Force in Centerville.
What is the Unemployment Rate in Centerville?
Unemployment Rate in Centerville is 1.3%.