Center, TX Map & Demographics
Center Map
Center Overview
$27,101
PER CAPITA INCOME
$52,912
AVG FAMILY INCOME
$57,875
AVG HOUSEHOLD INCOME
60.4%
WAGE / INCOME GAP [ % ]
39.6¢/ $1
WAGE / INCOME GAP [ $ ]
0.46
INEQUALITY / GINI INDEX
5,221
TOTAL POPULATION
2,544
MALE POPULATION
2,677
FEMALE POPULATION
95.03
MALES / 100 FEMALES
105.23
FEMALES / 100 MALES
38.2
MEDIAN AGE
3.1
AVG FAMILY SIZE
2.7
AVG HOUSEHOLD SIZE
2,507
LABOR FORCE [ PEOPLE ]
62.8%
PERCENT IN LABOR FORCE
3.6%
UNEMPLOYMENT RATE
Center Zip Codes
Center Area Codes
Income in Center
Income Overview in Center
Per Capita Income in Center is $27,101, while median incomes of families and households are $52,912 and $57,875 respectively.
| Characteristic | Number | Measure |
| Per Capita Income | 5,221 | $27,101 |
| Median Family Income | 1,329 | $52,912 |
| Mean Family Income | 1,329 | $70,560 |
| Median Household Income | 1,852 | $57,875 |
| Mean Household Income | 1,852 | $70,713 |
| Income Deficit | 1,329 | $0 |
| Wage / Income Gap (%) | 5,221 | 60.37% |
| Wage / Income Gap ($) | 5,221 | 39.63¢ per $1 |
| Gini / Inequality Index | 5,221 | 0.46 |
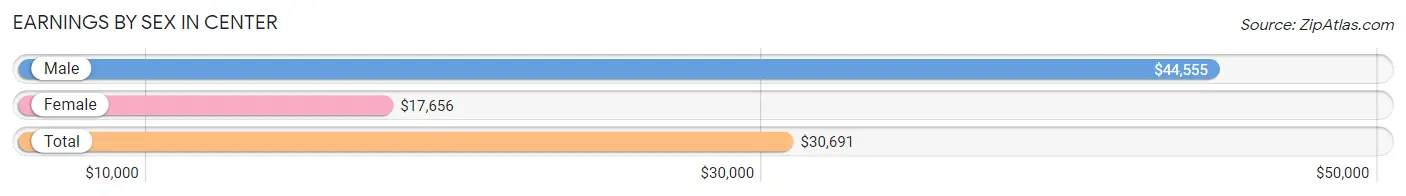
Earnings by Sex in Center
Average Earnings in Center are $30,691, $44,555 for men and $17,656 for women, a difference of 60.4%.
| Sex | Number | Average Earnings |
| Male | 1,461 (55.7%) | $44,555 |
| Female | 1,160 (44.3%) | $17,656 |
| Total | 2,621 (100.0%) | $30,691 |
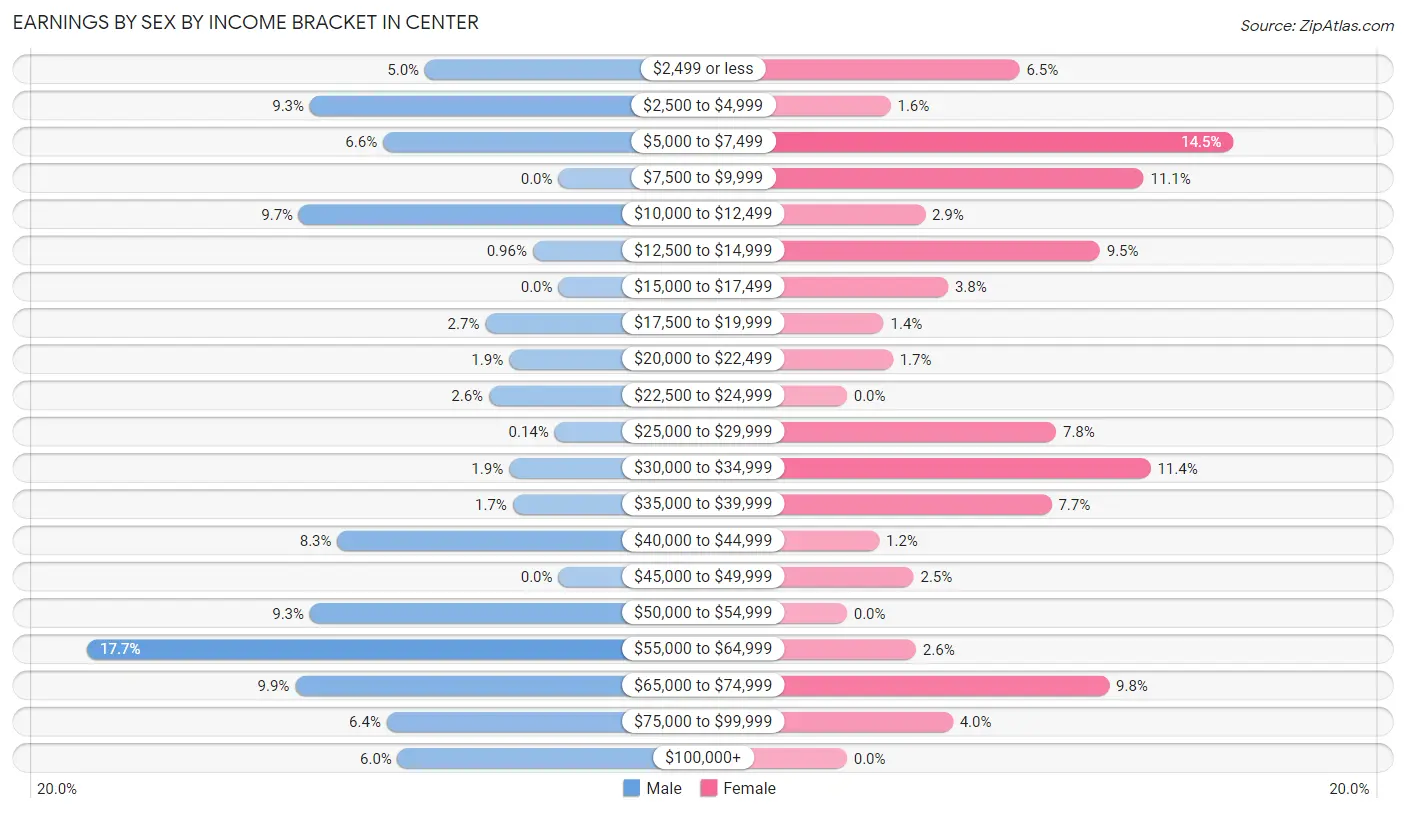
Earnings by Sex by Income Bracket in Center
The most common earnings brackets in Center are $55,000 to $64,999 for men (258 | 17.7%) and $5,000 to $7,499 for women (168 | 14.5%).
| Income | Male | Female |
| $2,499 or less | 73 (5.0%) | 75 (6.5%) |
| $2,500 to $4,999 | 136 (9.3%) | 19 (1.6%) |
| $5,000 to $7,499 | 96 (6.6%) | 168 (14.5%) |
| $7,500 to $9,999 | 0 (0.0%) | 129 (11.1%) |
| $10,000 to $12,499 | 142 (9.7%) | 34 (2.9%) |
| $12,500 to $14,999 | 14 (1.0%) | 110 (9.5%) |
| $15,000 to $17,499 | 0 (0.0%) | 44 (3.8%) |
| $17,500 to $19,999 | 40 (2.7%) | 16 (1.4%) |
| $20,000 to $22,499 | 27 (1.8%) | 20 (1.7%) |
| $22,500 to $24,999 | 38 (2.6%) | 0 (0.0%) |
| $25,000 to $29,999 | 2 (0.1%) | 91 (7.8%) |
| $30,000 to $34,999 | 27 (1.8%) | 132 (11.4%) |
| $35,000 to $39,999 | 25 (1.7%) | 89 (7.7%) |
| $40,000 to $44,999 | 121 (8.3%) | 14 (1.2%) |
| $45,000 to $49,999 | 0 (0.0%) | 29 (2.5%) |
| $50,000 to $54,999 | 136 (9.3%) | 0 (0.0%) |
| $55,000 to $64,999 | 258 (17.7%) | 30 (2.6%) |
| $65,000 to $74,999 | 144 (9.9%) | 114 (9.8%) |
| $75,000 to $99,999 | 94 (6.4%) | 46 (4.0%) |
| $100,000+ | 88 (6.0%) | 0 (0.0%) |
| Total | 1,461 (100.0%) | 1,160 (100.0%) |
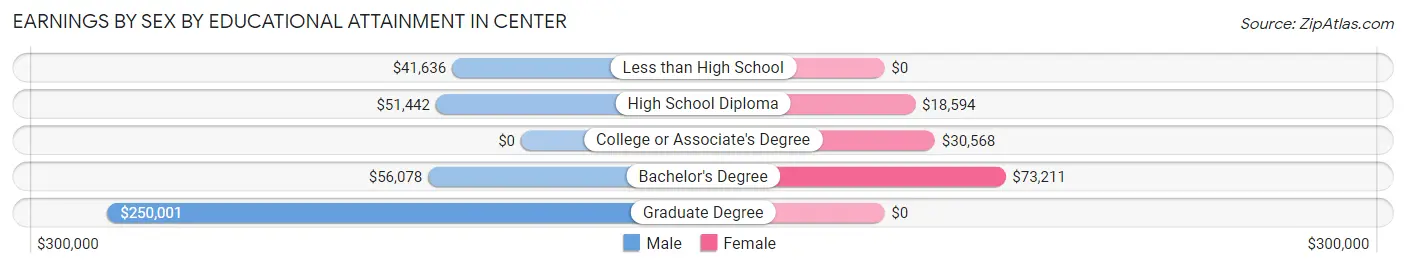
Earnings by Sex by Educational Attainment in Center
Average earnings in Center are $51,765 for men and $26,186 for women, a difference of 49.4%. Men with an educational attainment of graduate degree enjoy the highest average annual earnings of $250,001, while those with less than high school education earn the least with $41,636. Women with an educational attainment of bachelor's degree earn the most with the average annual earnings of $73,211, while those with high school diploma education have the smallest earnings of $18,594.
| Educational Attainment | Male Income | Female Income |
| Less than High School | $41,636 | $0 |
| High School Diploma | $51,442 | $18,594 |
| College or Associate's Degree | - | - |
| Bachelor's Degree | $56,078 | $73,211 |
| Graduate Degree | $250,001 | $0 |
| Total | $51,765 | $26,186 |
Family Income in Center
Family Income Brackets in Center
According to the Center family income data, there are 365 families falling into the $50,000 to $74,999 income range, which is the most common income bracket and makes up 27.5% of all families. Conversely, the $150,000 to $199,999 income bracket is the least frequent group with only 16 families (1.2%) belonging to this category.
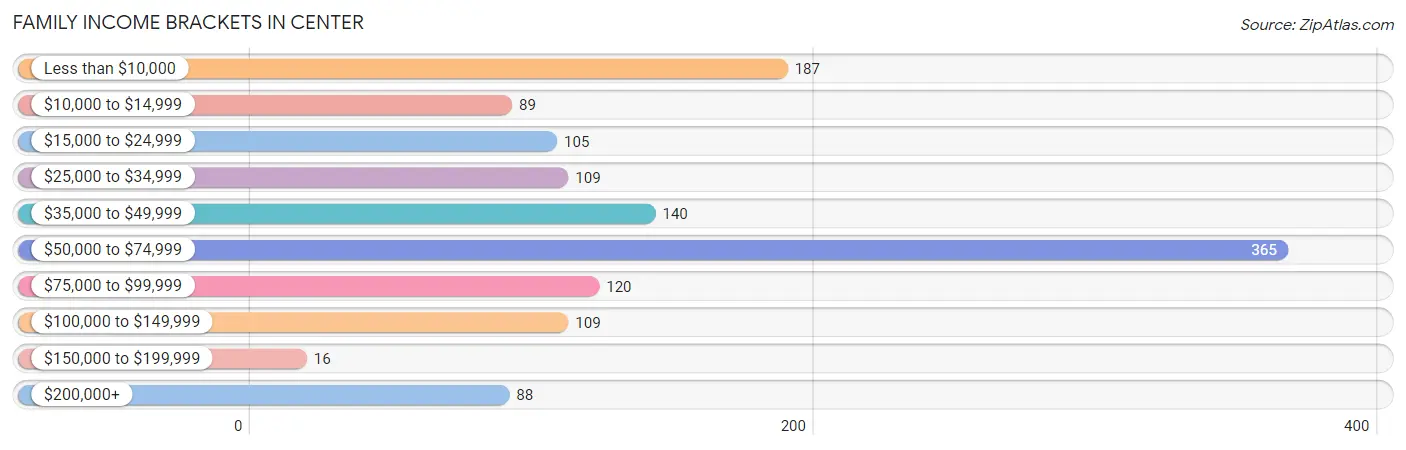
| Income Bracket | # Families | % Families |
| Less than $10,000 | 187 | 14.1% |
| $10,000 to $14,999 | 89 | 6.7% |
| $15,000 to $24,999 | 105 | 7.9% |
| $25,000 to $34,999 | 109 | 8.2% |
| $35,000 to $49,999 | 140 | 10.5% |
| $50,000 to $74,999 | 365 | 27.5% |
| $75,000 to $99,999 | 120 | 9.0% |
| $100,000 to $149,999 | 109 | 8.2% |
| $150,000 to $199,999 | 16 | 1.2% |
| $200,000+ | 88 | 6.6% |
Family Income by Famaliy Size in Center
3-person families (407 | 30.6%) account for the highest median family income in Center with $63,343 per family, while 3-person families (407 | 30.6%) have the highest median income of $21,114 per family member.
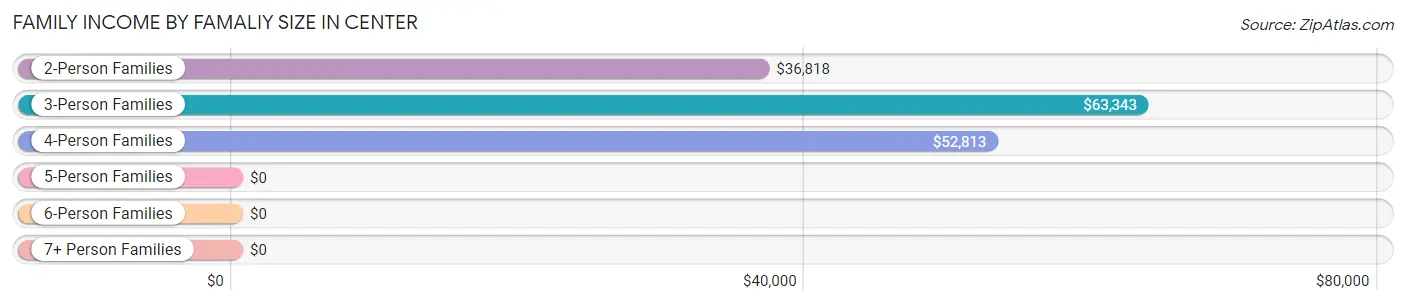
| Income Bracket | # Families | Median Income |
| 2-Person Families | 644 (48.5%) | $36,818 |
| 3-Person Families | 407 (30.6%) | $63,343 |
| 4-Person Families | 59 (4.4%) | $52,813 |
| 5-Person Families | 99 (7.4%) | $0 |
| 6-Person Families | 84 (6.3%) | $0 |
| 7+ Person Families | 36 (2.7%) | $0 |
| Total | 1,329 (100.0%) | $52,912 |
Family Income by Number of Earners in Center
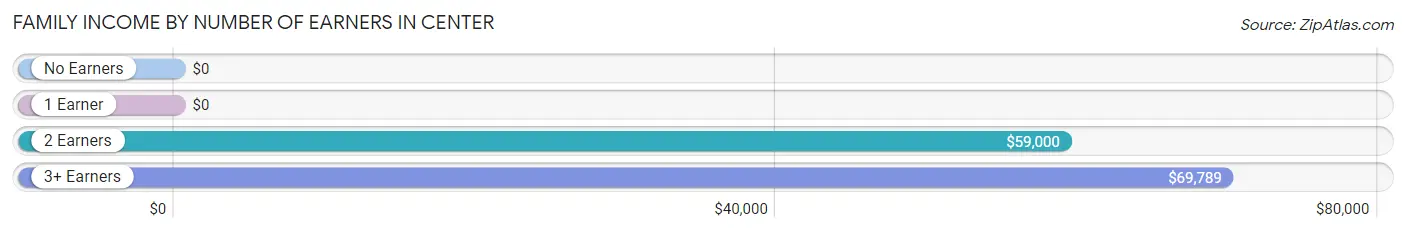
| Number of Earners | # Families | Median Income |
| No Earners | 281 (21.1%) | $0 |
| 1 Earner | 582 (43.8%) | $0 |
| 2 Earners | 336 (25.3%) | $59,000 |
| 3+ Earners | 130 (9.8%) | $69,789 |
| Total | 1,329 (100.0%) | $52,912 |
Household Income in Center
Household Income Brackets in Center
With 415 households falling in the category, the $50,000 to $74,999 income range is the most frequent in Center, accounting for 22.4% of all households. In contrast, only 17 households (0.9%) fall into the $150,000 to $199,999 income bracket, making it the least populous group.
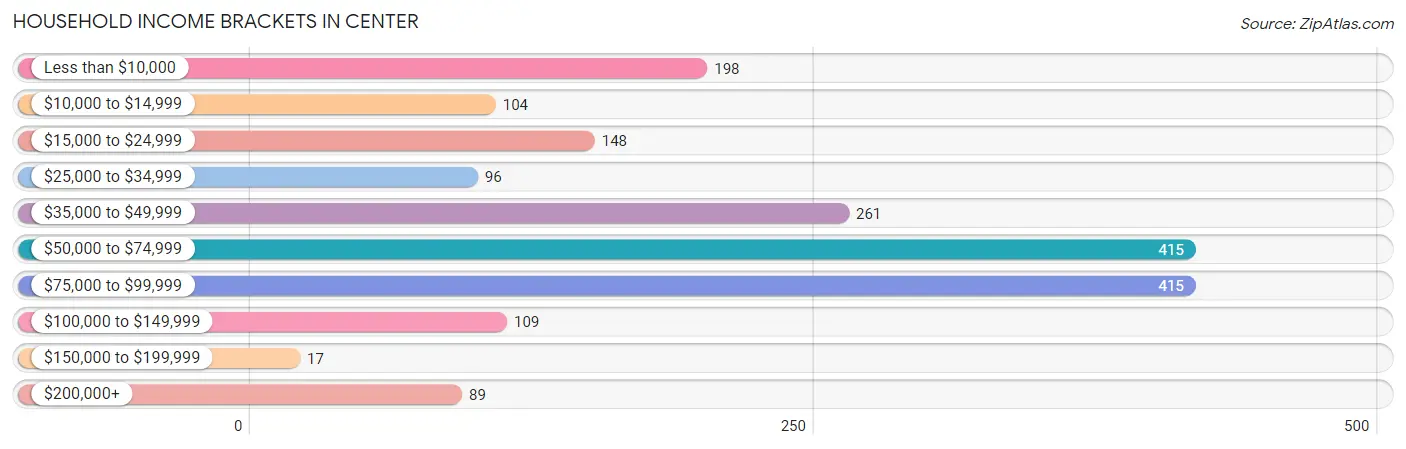
| Income Bracket | # Households | % Households |
| Less than $10,000 | 198 | 10.7% |
| $10,000 to $14,999 | 104 | 5.6% |
| $15,000 to $24,999 | 148 | 8.0% |
| $25,000 to $34,999 | 96 | 5.2% |
| $35,000 to $49,999 | 261 | 14.1% |
| $50,000 to $74,999 | 415 | 22.4% |
| $75,000 to $99,999 | 415 | 22.4% |
| $100,000 to $149,999 | 109 | 5.9% |
| $150,000 to $199,999 | 17 | 0.9% |
| $200,000+ | 89 | 4.8% |
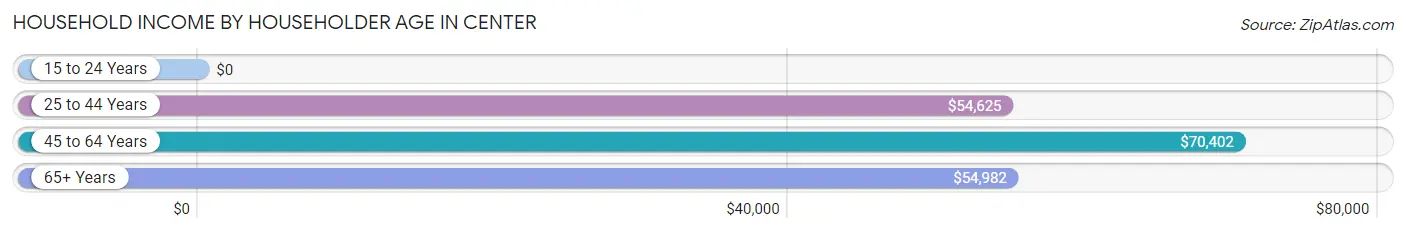
Household Income by Householder Age in Center
The median household income in Center is $57,875, with the highest median household income of $70,402 found in the 45 to 64 years age bracket for the primary householder. A total of 694 households (37.5%) fall into this category. Meanwhile, the 15 to 24 years age bracket for the primary householder has the lowest median household income of $0, with 93 households (5.0%) in this group.
| Income Bracket | # Households | Median Income |
| 15 to 24 Years | 93 (5.0%) | $0 |
| 25 to 44 Years | 540 (29.2%) | $54,625 |
| 45 to 64 Years | 694 (37.5%) | $70,402 |
| 65+ Years | 525 (28.3%) | $54,982 |
| Total | 1,852 (100.0%) | $57,875 |
Poverty in Center
Income Below Poverty by Sex and Age in Center
With 31.9% poverty level for males and 30.6% for females among the residents of Center, under 5 year old males and 12 to 14 year old females are the most vulnerable to poverty, with 151 males (100.0%) and 81 females (71.1%) in their respective age groups living below the poverty level.
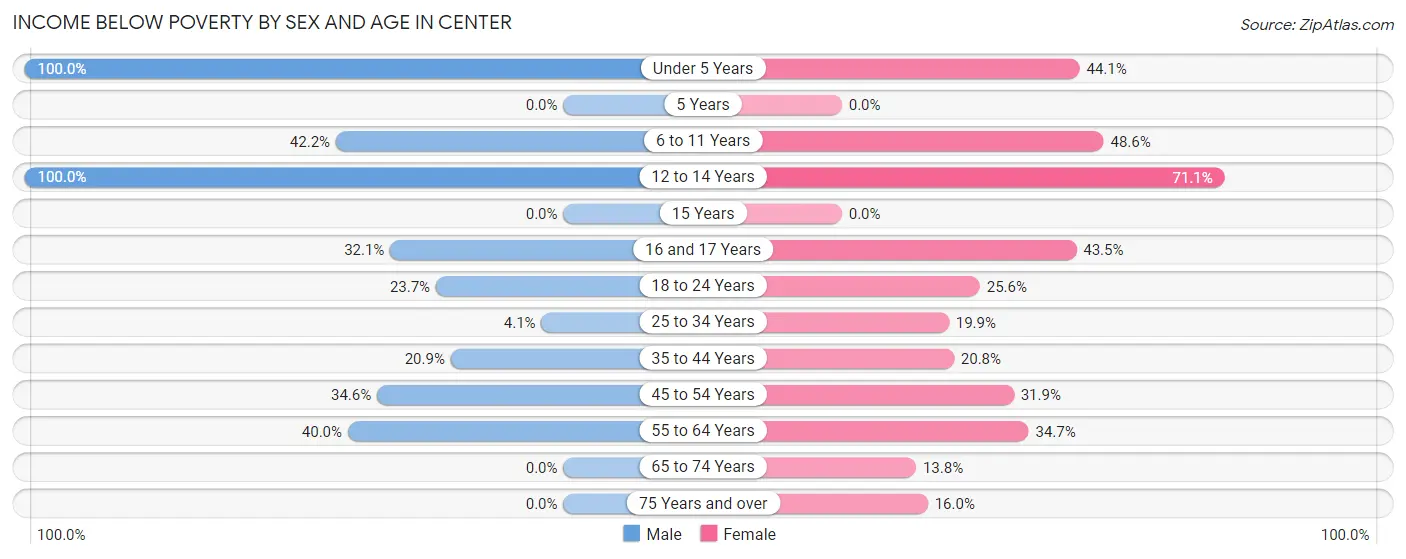
| Age Bracket | Male | Female |
| Under 5 Years | 151 (100.0%) | 109 (44.1%) |
| 5 Years | 0 (0.0%) | 0 (0.0%) |
| 6 to 11 Years | 141 (42.2%) | 86 (48.6%) |
| 12 to 14 Years | 111 (100.0%) | 81 (71.1%) |
| 15 Years | 0 (0.0%) | 0 (0.0%) |
| 16 and 17 Years | 36 (32.1%) | 47 (43.5%) |
| 18 to 24 Years | 57 (23.6%) | 73 (25.6%) |
| 25 to 34 Years | 10 (4.1%) | 58 (19.9%) |
| 35 to 44 Years | 79 (20.9%) | 47 (20.8%) |
| 45 to 54 Years | 111 (34.6%) | 105 (31.9%) |
| 55 to 64 Years | 90 (40.0%) | 121 (34.7%) |
| 65 to 74 Years | 0 (0.0%) | 42 (13.8%) |
| 75 Years and over | 0 (0.0%) | 26 (16.0%) |
| Total | 786 (31.9%) | 795 (30.6%) |
Income Above Poverty by Sex and Age in Center
According to the poverty statistics in Center, males aged 5 years and females aged 65 to 74 years are the age groups that are most secure financially, with 100.0% of males and 86.2% of females in these age groups living above the poverty line.
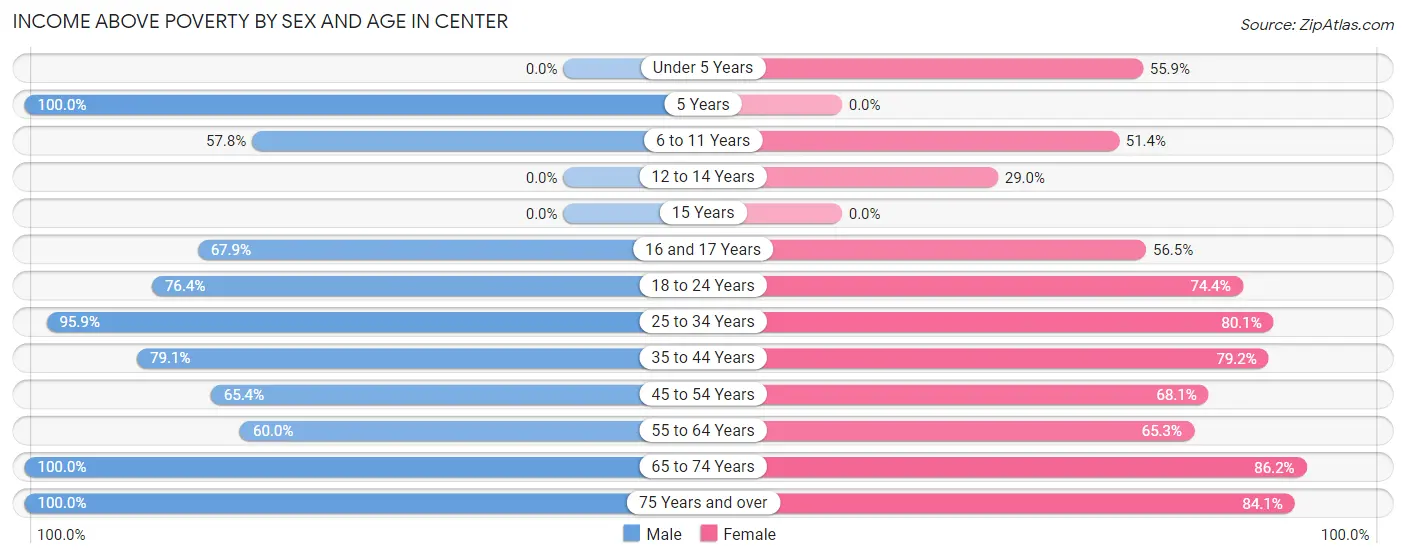
| Age Bracket | Male | Female |
| Under 5 Years | 0 (0.0%) | 138 (55.9%) |
| 5 Years | 95 (100.0%) | 0 (0.0%) |
| 6 to 11 Years | 193 (57.8%) | 91 (51.4%) |
| 12 to 14 Years | 0 (0.0%) | 33 (28.9%) |
| 15 Years | 0 (0.0%) | 0 (0.0%) |
| 16 and 17 Years | 76 (67.9%) | 61 (56.5%) |
| 18 to 24 Years | 184 (76.3%) | 212 (74.4%) |
| 25 to 34 Years | 236 (95.9%) | 234 (80.1%) |
| 35 to 44 Years | 299 (79.1%) | 179 (79.2%) |
| 45 to 54 Years | 210 (65.4%) | 224 (68.1%) |
| 55 to 64 Years | 135 (60.0%) | 228 (65.3%) |
| 65 to 74 Years | 140 (100.0%) | 263 (86.2%) |
| 75 Years and over | 112 (100.0%) | 137 (84.1%) |
| Total | 1,680 (68.1%) | 1,800 (69.4%) |
Income Below Poverty Among Married-Couple Families in Center
The poverty statistics for married-couple families in Center show that 16.2% or 116 of the total 718 families live below the poverty line. Families with 3 or 4 children have the highest poverty rate of 100.0%, comprising of 28 families. On the other hand, families with 1 or 2 children have the lowest poverty rate of 0.0%, which includes 0 families.
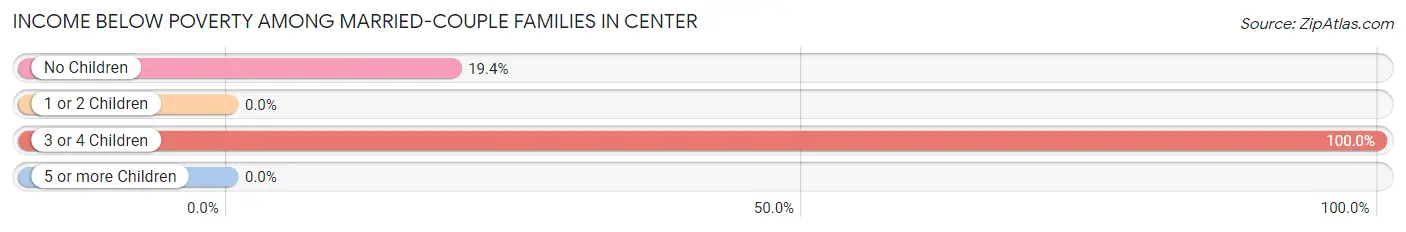
| Children | Above Poverty | Below Poverty |
| No Children | 365 (80.6%) | 88 (19.4%) |
| 1 or 2 Children | 237 (100.0%) | 0 (0.0%) |
| 3 or 4 Children | 0 (0.0%) | 28 (100.0%) |
| 5 or more Children | 0 (0.0%) | 0 (0.0%) |
| Total | 602 (83.8%) | 116 (16.2%) |
Income Below Poverty Among Single-Parent Households in Center
According to the poverty data in Center, 4.6% or 12 single-father households and 66.2% or 231 single-mother households are living below the poverty line. Among single-father households, those with no children have the highest poverty rate, with 12 households (20.7%) experiencing poverty. Likewise, among single-mother households, those with 5 or more children have the highest poverty rate, with 76 households (100.0%) falling below the poverty line.
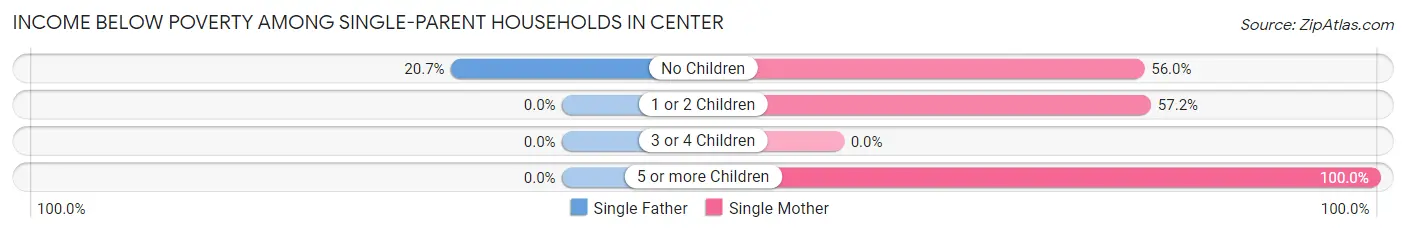
| Children | Single Father | Single Mother |
| No Children | 12 (20.7%) | 56 (56.0%) |
| 1 or 2 Children | 0 (0.0%) | 99 (57.2%) |
| 3 or 4 Children | 0 (0.0%) | 0 (0.0%) |
| 5 or more Children | 0 (0.0%) | 76 (100.0%) |
| Total | 12 (4.6%) | 231 (66.2%) |
Income Below Poverty Among Married-Couple vs Single-Parent Households in Center
The poverty data for Center shows that 116 of the married-couple family households (16.2%) and 243 of the single-parent households (39.8%) are living below the poverty level. Within the married-couple family households, those with 3 or 4 children have the highest poverty rate, with 28 households (100.0%) falling below the poverty line. Among the single-parent households, those with 5 or more children have the highest poverty rate, with 76 household (100.0%) living below poverty.
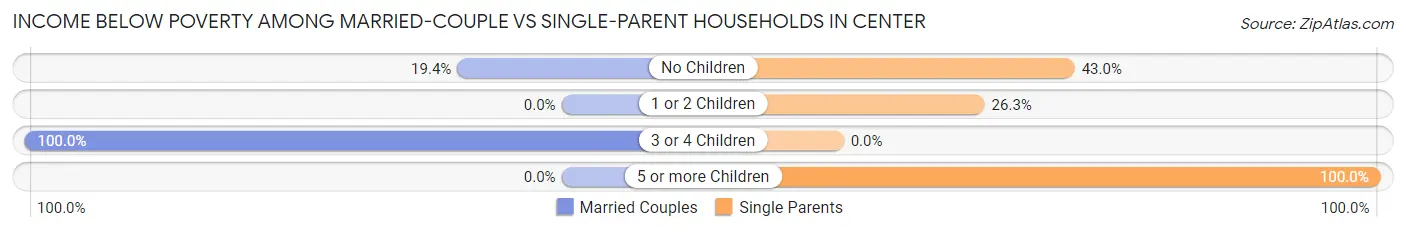
| Children | Married-Couple Families | Single-Parent Households |
| No Children | 88 (19.4%) | 68 (43.0%) |
| 1 or 2 Children | 0 (0.0%) | 99 (26.3%) |
| 3 or 4 Children | 28 (100.0%) | 0 (0.0%) |
| 5 or more Children | 0 (0.0%) | 76 (100.0%) |
| Total | 116 (16.2%) | 243 (39.8%) |
Race in Center
The most populous races in Center are White / Caucasian (3,098 | 59.3%), Hispanic or Latino (1,387 | 26.6%), and Black / African American (1,361 | 26.1%).
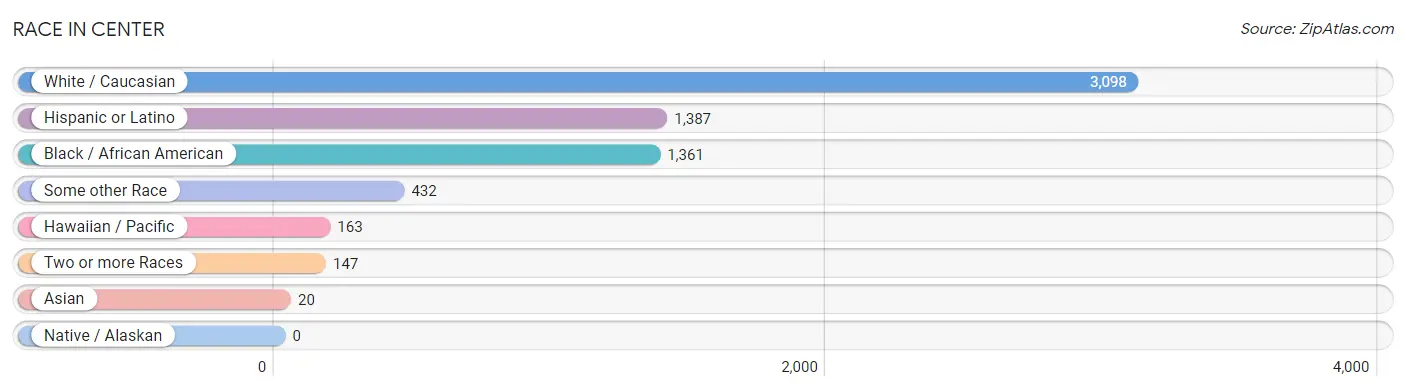
| Race | # Population | % Population |
| Asian | 20 | 0.4% |
| Black / African American | 1,361 | 26.1% |
| Hawaiian / Pacific | 163 | 3.1% |
| Hispanic or Latino | 1,387 | 26.6% |
| Native / Alaskan | 0 | 0.0% |
| White / Caucasian | 3,098 | 59.3% |
| Two or more Races | 147 | 2.8% |
| Some other Race | 432 | 8.3% |
| Total | 5,221 | 100.0% |
Ancestry in Center
The most populous ancestries reported in Center are Mexican (1,319 | 25.3%), Irish (564 | 10.8%), American (406 | 7.8%), Italian (355 | 6.8%), and German (184 | 3.5%), together accounting for 54.2% of all Center residents.
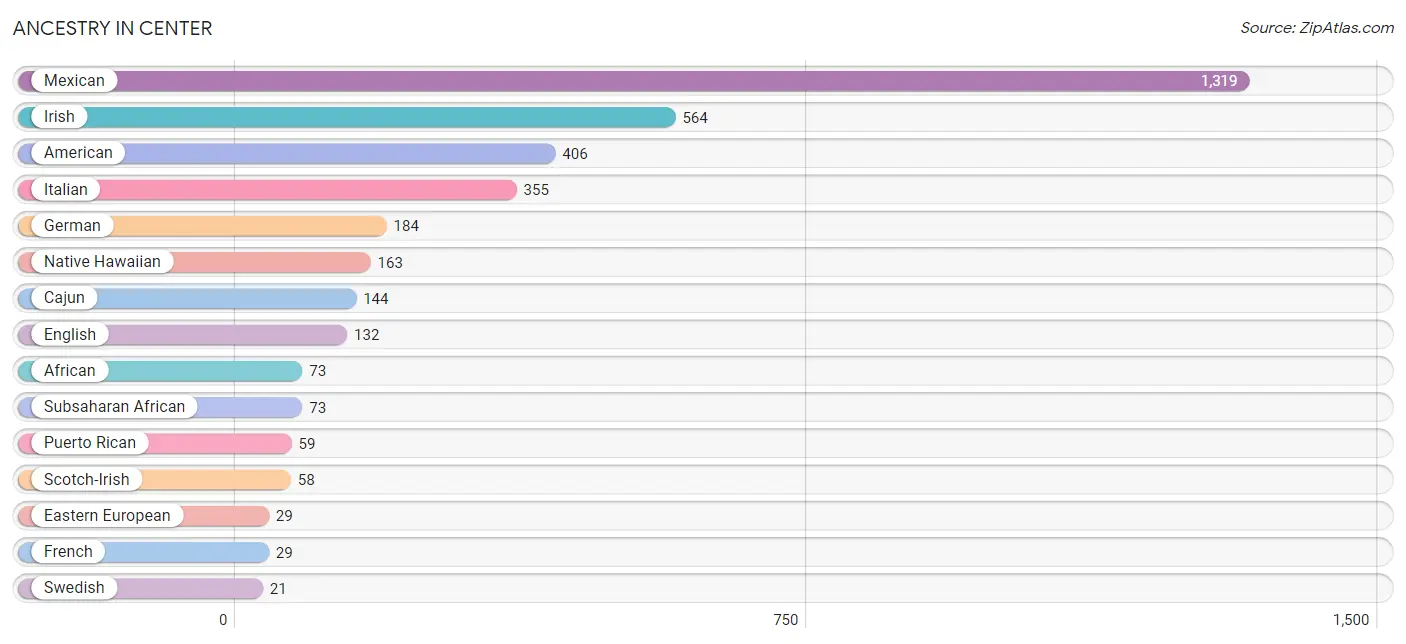
| Ancestry | # Population | % Population |
| African | 73 | 1.4% |
| American | 406 | 7.8% |
| Bhutanese | 20 | 0.4% |
| Cajun | 144 | 2.8% |
| Dutch | 11 | 0.2% |
| Eastern European | 29 | 0.6% |
| English | 132 | 2.5% |
| French | 29 | 0.6% |
| German | 184 | 3.5% |
| Irish | 564 | 10.8% |
| Italian | 355 | 6.8% |
| Mexican | 1,319 | 25.3% |
| Native Hawaiian | 163 | 3.1% |
| Puerto Rican | 59 | 1.1% |
| Scotch-Irish | 58 | 1.1% |
| Subsaharan African | 73 | 1.4% |
| Swedish | 21 | 0.4% | View All 17 Rows |
Immigrants in Center
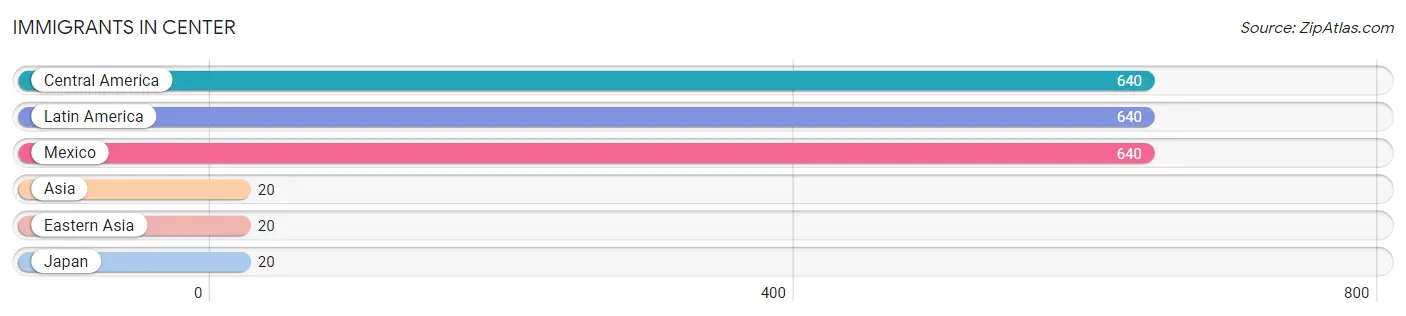
The most numerous immigrant groups reported in Center came from Central America (640 | 12.3%), Latin America (640 | 12.3%), Mexico (640 | 12.3%), Asia (20 | 0.4%), and Eastern Asia (20 | 0.4%), together accounting for 37.5% of all Center residents.
| Immigration Origin | # Population | % Population |
| Asia | 20 | 0.4% |
| Central America | 640 | 12.3% |
| Eastern Asia | 20 | 0.4% |
| Japan | 20 | 0.4% |
| Latin America | 640 | 12.3% |
| Mexico | 640 | 12.3% | View All 6 Rows |
Sex and Age in Center
Sex and Age in Center
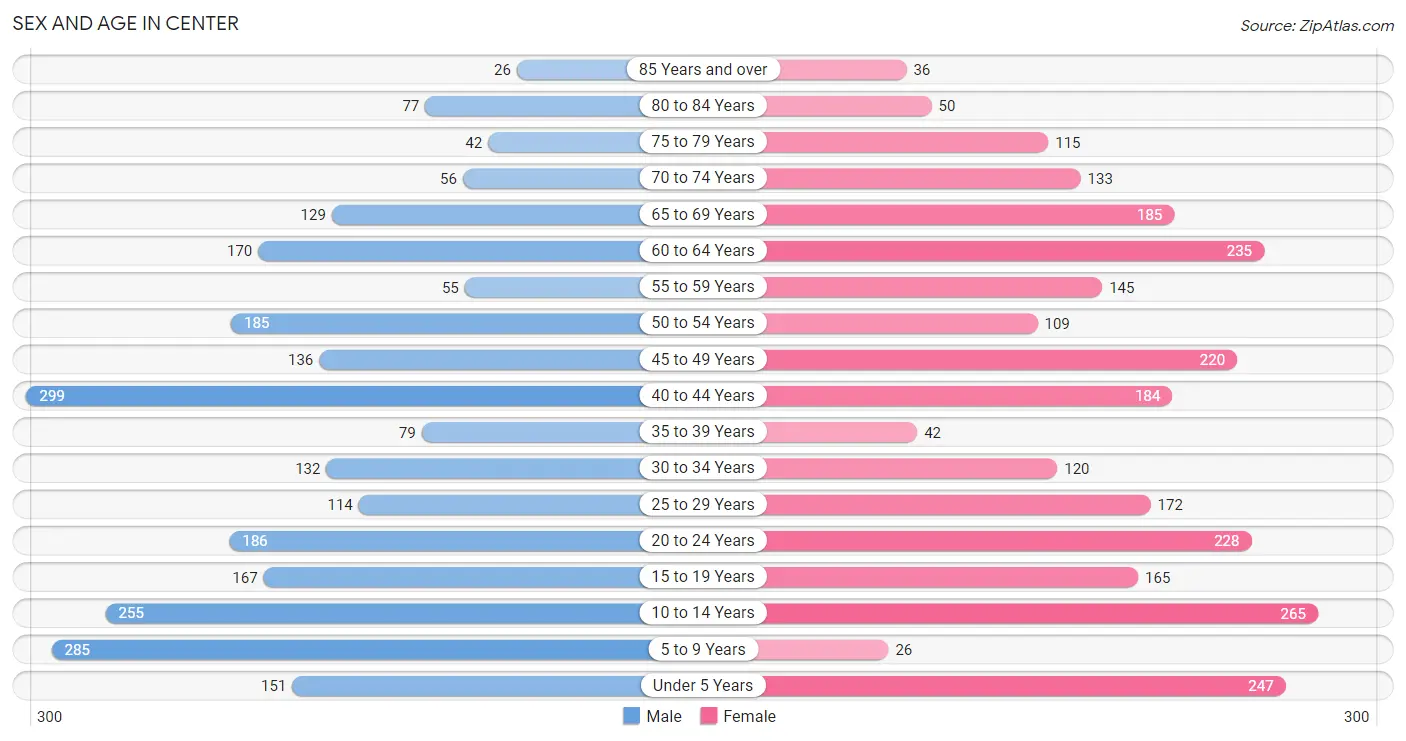
The most populous age groups in Center are 40 to 44 Years (299 | 11.7%) for men and 10 to 14 Years (265 | 9.9%) for women.
| Age Bracket | Male | Female |
| Under 5 Years | 151 (5.9%) | 247 (9.2%) |
| 5 to 9 Years | 285 (11.2%) | 26 (1.0%) |
| 10 to 14 Years | 255 (10.0%) | 265 (9.9%) |
| 15 to 19 Years | 167 (6.6%) | 165 (6.2%) |
| 20 to 24 Years | 186 (7.3%) | 228 (8.5%) |
| 25 to 29 Years | 114 (4.5%) | 172 (6.4%) |
| 30 to 34 Years | 132 (5.2%) | 120 (4.5%) |
| 35 to 39 Years | 79 (3.1%) | 42 (1.6%) |
| 40 to 44 Years | 299 (11.7%) | 184 (6.9%) |
| 45 to 49 Years | 136 (5.3%) | 220 (8.2%) |
| 50 to 54 Years | 185 (7.3%) | 109 (4.1%) |
| 55 to 59 Years | 55 (2.2%) | 145 (5.4%) |
| 60 to 64 Years | 170 (6.7%) | 235 (8.8%) |
| 65 to 69 Years | 129 (5.1%) | 185 (6.9%) |
| 70 to 74 Years | 56 (2.2%) | 133 (5.0%) |
| 75 to 79 Years | 42 (1.7%) | 115 (4.3%) |
| 80 to 84 Years | 77 (3.0%) | 50 (1.9%) |
| 85 Years and over | 26 (1.0%) | 36 (1.3%) |
| Total | 2,544 (100.0%) | 2,677 (100.0%) |
Families and Households in Center
Median Family Size in Center
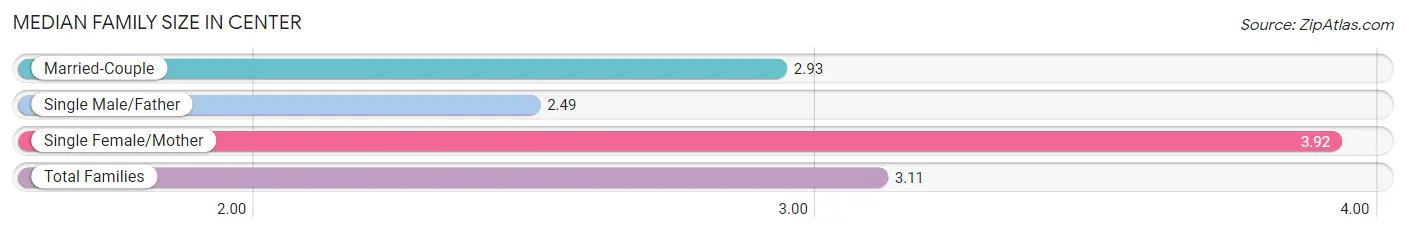
The median family size in Center is 3.11 persons per family, with single female/mother families (349 | 26.3%) accounting for the largest median family size of 3.92 persons per family. On the other hand, single male/father families (262 | 19.7%) represent the smallest median family size with 2.49 persons per family.
| Family Type | # Families | Family Size |
| Married-Couple | 718 (54.0%) | 2.93 |
| Single Male/Father | 262 (19.7%) | 2.49 |
| Single Female/Mother | 349 (26.3%) | 3.92 |
| Total Families | 1,329 (100.0%) | 3.11 |
Median Household Size in Center
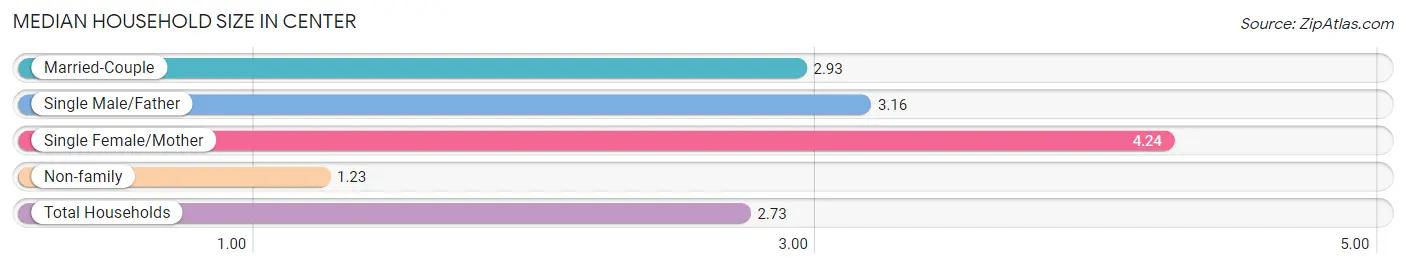
The median household size in Center is 2.73 persons per household, with single female/mother households (349 | 18.8%) accounting for the largest median household size of 4.24 persons per household. non-family households (523 | 28.2%) represent the smallest median household size with 1.23 persons per household.
| Household Type | # Households | Household Size |
| Married-Couple | 718 (38.8%) | 2.93 |
| Single Male/Father | 262 (14.1%) | 3.16 |
| Single Female/Mother | 349 (18.8%) | 4.24 |
| Non-family | 523 (28.2%) | 1.23 |
| Total Households | 1,852 (100.0%) | 2.73 |
Household Size by Marriage Status in Center
Out of a total of 1,852 households in Center, 1,329 (71.8%) are family households, while 523 (28.2%) are nonfamily households. The most numerous type of family households are 2-person households, comprising 603, and the most common type of nonfamily households are 1-person households, comprising 413.
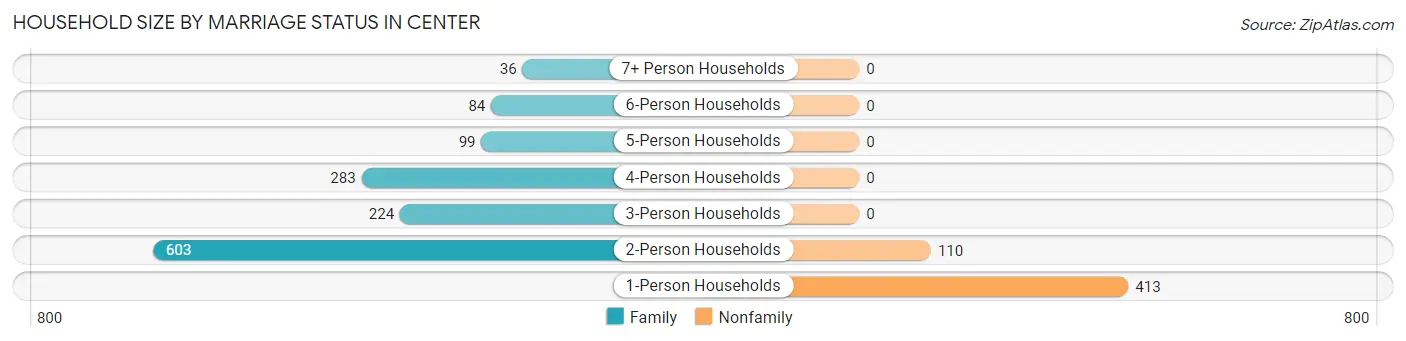
| Household Size | Family Households | Nonfamily Households |
| 1-Person Households | - | 413 (22.3%) |
| 2-Person Households | 603 (32.6%) | 110 (5.9%) |
| 3-Person Households | 224 (12.1%) | 0 (0.0%) |
| 4-Person Households | 283 (15.3%) | 0 (0.0%) |
| 5-Person Households | 99 (5.3%) | 0 (0.0%) |
| 6-Person Households | 84 (4.5%) | 0 (0.0%) |
| 7+ Person Households | 36 (1.9%) | 0 (0.0%) |
| Total | 1,329 (71.8%) | 523 (28.2%) |
Female Fertility in Center
Fertility by Age in Center
Average fertility rate in Center is 15.0 births per 1,000 women. Women in the age bracket of 20 to 34 years have the highest fertility rate with 33.0 births per 1,000 women. Women in the age bracket of 20 to 34 years acount for 100.0% of all women with births.
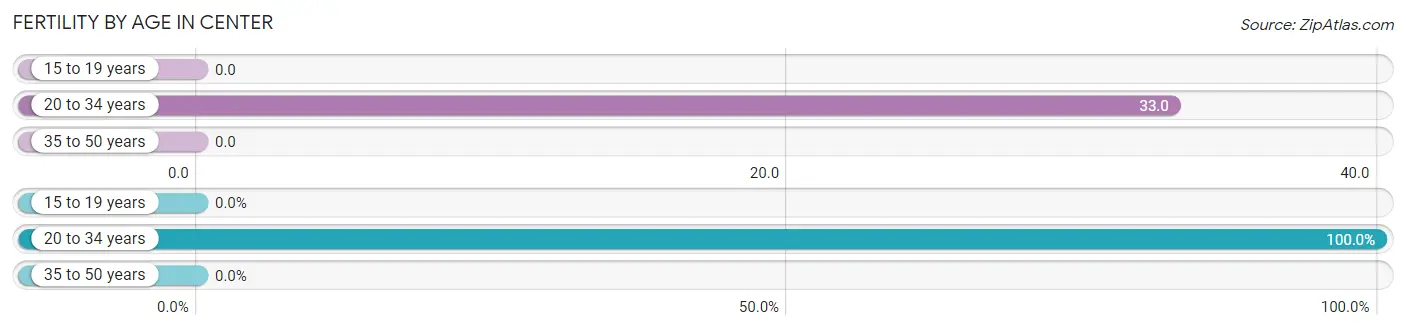
| Age Bracket | Women with Births | Births / 1,000 Women |
| 15 to 19 years | 0 (0.0%) | 0.0 |
| 20 to 34 years | 17 (100.0%) | 33.0 |
| 35 to 50 years | 0 (0.0%) | 0.0 |
| Total | 17 (100.0%) | 15.0 |
Fertility by Age by Marriage Status in Center
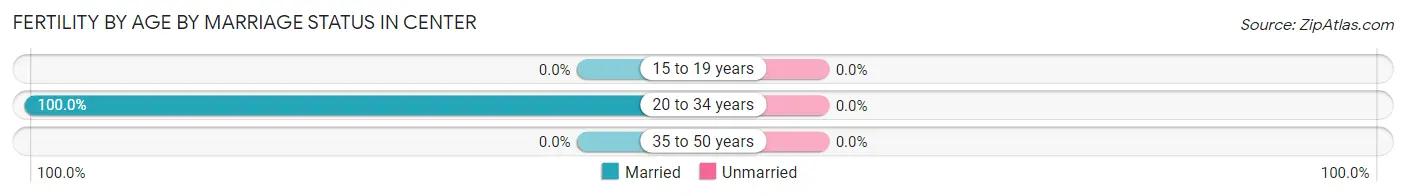
| Age Bracket | Married | Unmarried |
| 15 to 19 years | 0 (0.0%) | 0 (0.0%) |
| 20 to 34 years | 17 (100.0%) | 0 (0.0%) |
| 35 to 50 years | 0 (0.0%) | 0 (0.0%) |
| Total | 17 (100.0%) | 0 (0.0%) |
Fertility by Education in Center
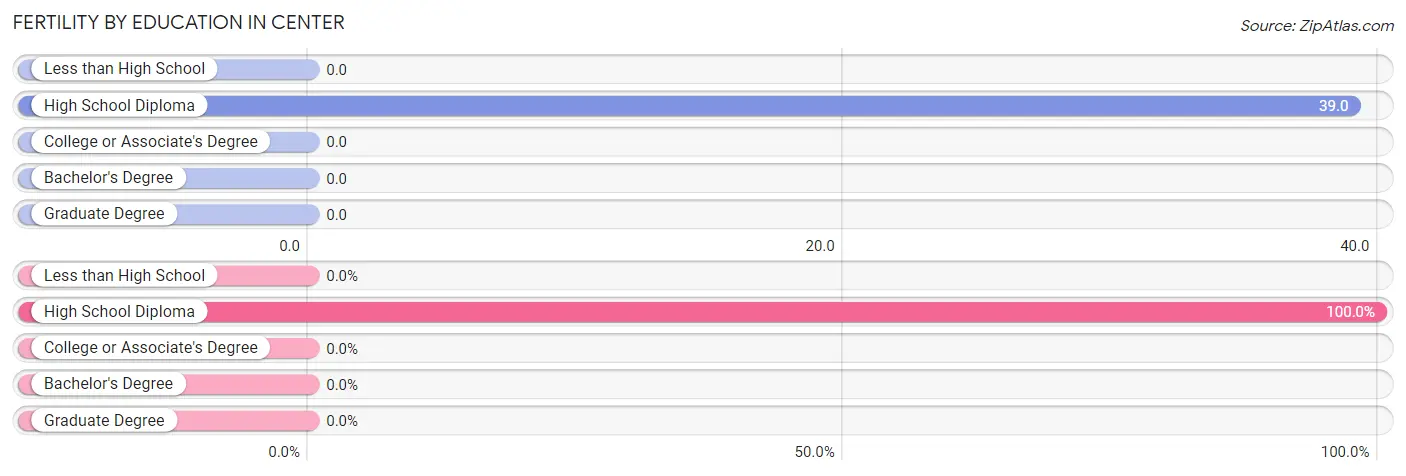
| Educational Attainment | Women with Births | Births / 1,000 Women |
| Less than High School | 0 (0.0%) | 0.0 |
| High School Diploma | 17 (100.0%) | 39.0 |
| College or Associate's Degree | 0 (0.0%) | 0.0 |
| Bachelor's Degree | 0 (0.0%) | 0.0 |
| Graduate Degree | 0 (0.0%) | 0.0 |
| Total | 17 (100.0%) | 15.0 |
Fertility by Education by Marriage Status in Center
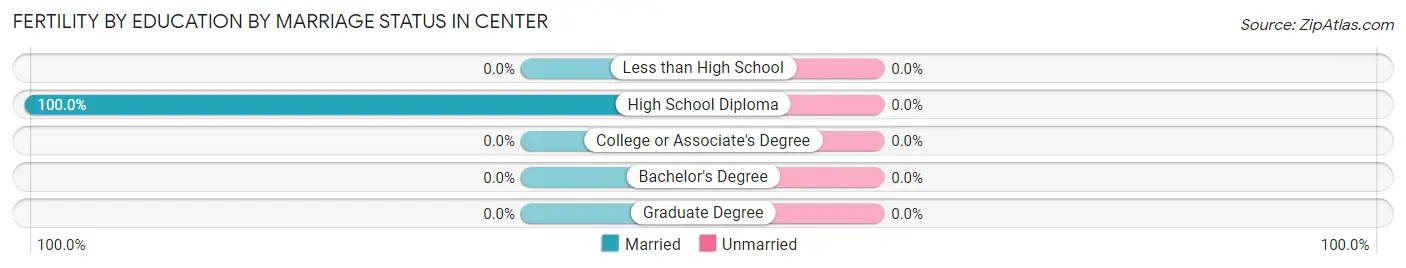
| Educational Attainment | Married | Unmarried |
| Less than High School | 0 (0.0%) | 0 (0.0%) |
| High School Diploma | 17 (100.0%) | 0 (0.0%) |
| College or Associate's Degree | 0 (0.0%) | 0 (0.0%) |
| Bachelor's Degree | 0 (0.0%) | 0 (0.0%) |
| Graduate Degree | 0 (0.0%) | 0 (0.0%) |
| Total | 17 (100.0%) | 0 (0.0%) |
Employment Characteristics in Center
Employment by Class of Employer in Center
Among the 2,417 employed individuals in Center, private company employees (1,764 | 73.0%), not-for-profit organizations (180 | 7.4%), and self-employed (not incorporated) (156 | 6.5%) make up the most common classes of employment.
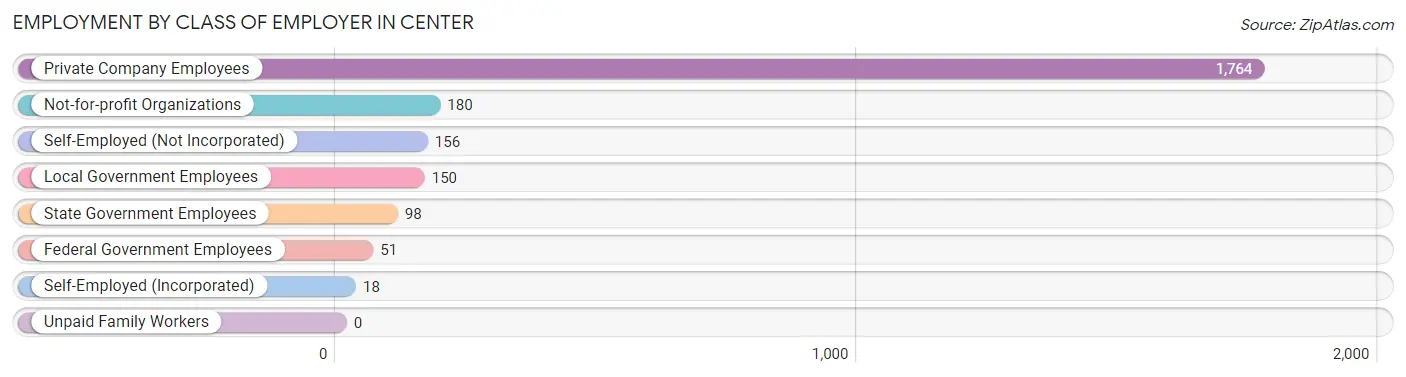
| Employer Class | # Employees | % Employees |
| Private Company Employees | 1,764 | 73.0% |
| Self-Employed (Incorporated) | 18 | 0.7% |
| Self-Employed (Not Incorporated) | 156 | 6.5% |
| Not-for-profit Organizations | 180 | 7.4% |
| Local Government Employees | 150 | 6.2% |
| State Government Employees | 98 | 4.1% |
| Federal Government Employees | 51 | 2.1% |
| Unpaid Family Workers | 0 | 0.0% |
| Total | 2,417 | 100.0% |
Employment Status by Age in Center
According to the labor force statistics for Center, out of the total population over 16 years of age (3,992), 62.8% or 2,507 individuals are in the labor force, with 3.6% or 90 of them unemployed. The age group with the highest labor force participation rate is 30 to 34 years, with 100.0% or 252 individuals in the labor force. Within the labor force, the 25 to 29 years age range has the highest percentage of unemployed individuals, with 10.8% or 25 of them being unemployed.
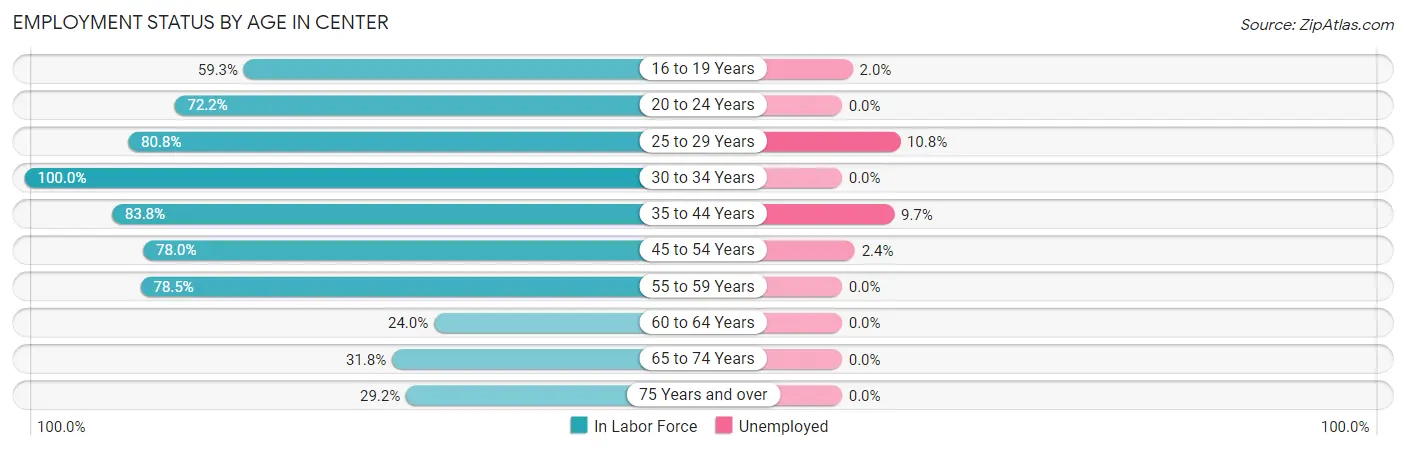
| Age Bracket | In Labor Force | Unemployed |
| 16 to 19 Years | 197 (59.3%) | 4 (2.0%) |
| 20 to 24 Years | 299 (72.2%) | 0 (0.0%) |
| 25 to 29 Years | 231 (80.8%) | 25 (10.8%) |
| 30 to 34 Years | 252 (100.0%) | 0 (0.0%) |
| 35 to 44 Years | 506 (83.8%) | 49 (9.7%) |
| 45 to 54 Years | 507 (78.0%) | 12 (2.4%) |
| 55 to 59 Years | 157 (78.5%) | 0 (0.0%) |
| 60 to 64 Years | 97 (24.0%) | 0 (0.0%) |
| 65 to 74 Years | 160 (31.8%) | 0 (0.0%) |
| 75 Years and over | 101 (29.2%) | 0 (0.0%) |
| Total | 2,507 (62.8%) | 90 (3.6%) |
Employment Status by Educational Attainment in Center
According to labor force statistics for Center, 73.0% of individuals (1,750) out of the total population between 25 and 64 years of age (2,397) are in the labor force, with 4.9% or 86 of them being unemployed. The group with the highest labor force participation rate are those with the educational attainment of bachelor's degree or higher, with 86.1% or 192 individuals in the labor force. Within the labor force, individuals with high school diploma education have the highest percentage of unemployment, with 7.4% or 61 of them being unemployed.
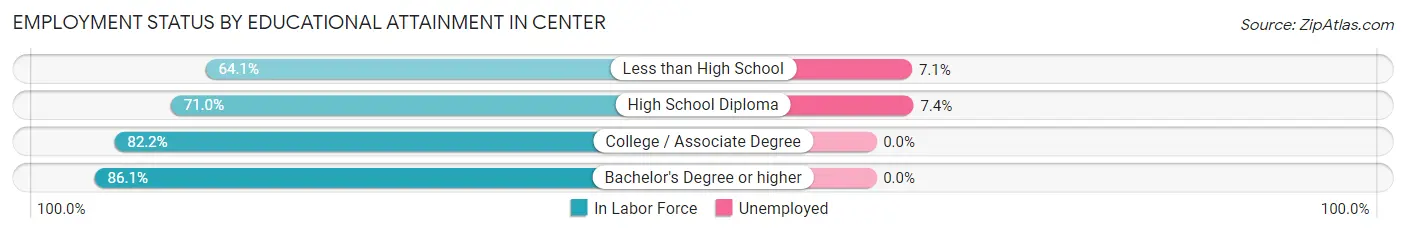
| Educational Attainment | In Labor Force | Unemployed |
| Less than High School | 354 (64.1%) | 39 (7.1%) |
| High School Diploma | 820 (71.0%) | 85 (7.4%) |
| College / Associate Degree | 384 (82.2%) | 0 (0.0%) |
| Bachelor's Degree or higher | 192 (86.1%) | 0 (0.0%) |
| Total | 1,750 (73.0%) | 117 (4.9%) |
Employment Occupations by Sex in Center
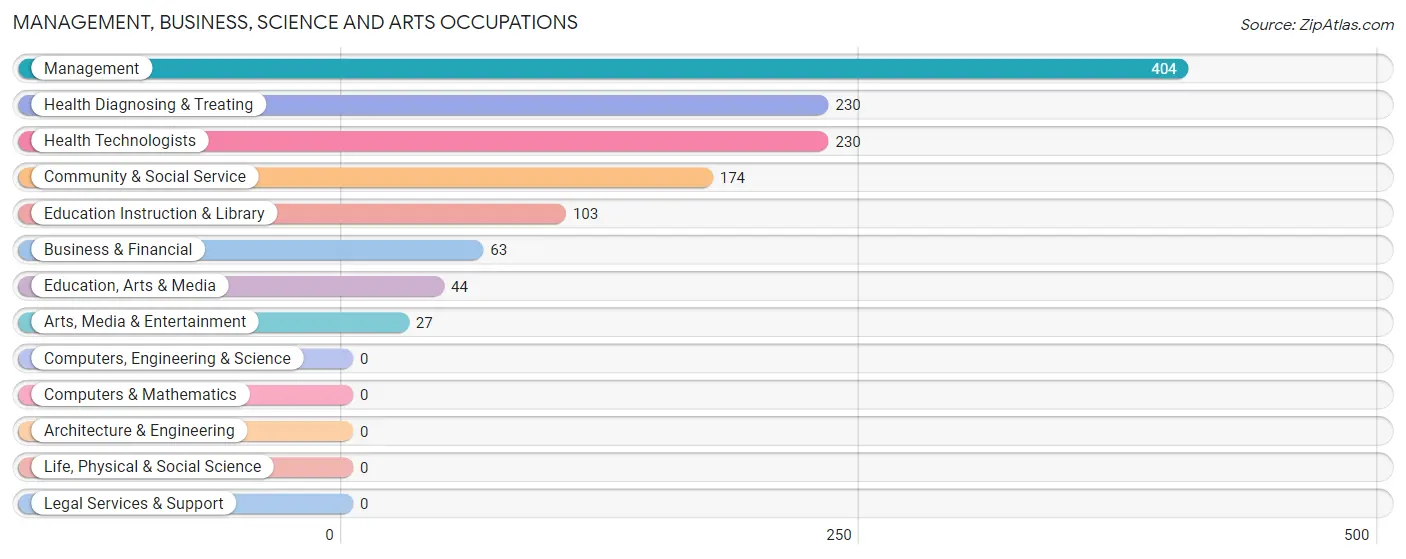
Management, Business, Science and Arts Occupations
The most common Management, Business, Science and Arts occupations in Center are Management (404 | 16.7%), Health Diagnosing & Treating (230 | 9.5%), Health Technologists (230 | 9.5%), Community & Social Service (174 | 7.2%), and Education Instruction & Library (103 | 4.3%).
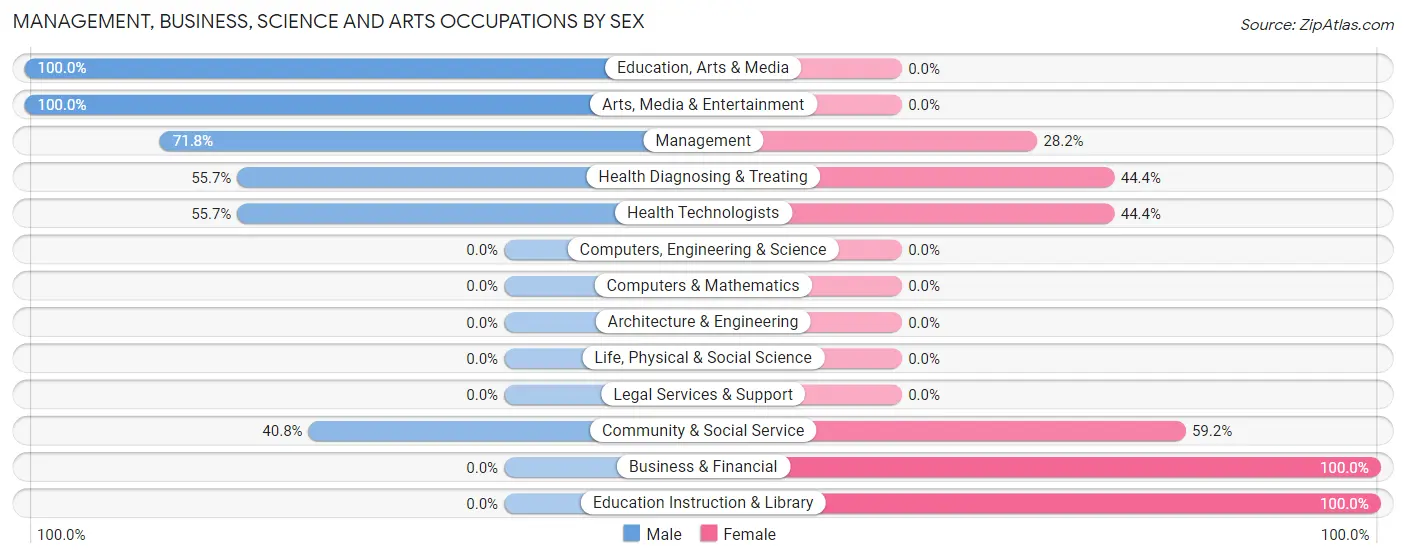
Management, Business, Science and Arts Occupations by Sex
Within the Management, Business, Science and Arts occupations in Center, the most male-oriented occupations are Education, Arts & Media (100.0%), Arts, Media & Entertainment (100.0%), and Management (71.8%), while the most female-oriented occupations are Business & Financial (100.0%), Education Instruction & Library (100.0%), and Community & Social Service (59.2%).
| Occupation | Male | Female |
| Management | 290 (71.8%) | 114 (28.2%) |
| Business & Financial | 0 (0.0%) | 63 (100.0%) |
| Computers, Engineering & Science | 0 (0.0%) | 0 (0.0%) |
| Computers & Mathematics | 0 (0.0%) | 0 (0.0%) |
| Architecture & Engineering | 0 (0.0%) | 0 (0.0%) |
| Life, Physical & Social Science | 0 (0.0%) | 0 (0.0%) |
| Community & Social Service | 71 (40.8%) | 103 (59.2%) |
| Education, Arts & Media | 44 (100.0%) | 0 (0.0%) |
| Legal Services & Support | 0 (0.0%) | 0 (0.0%) |
| Education Instruction & Library | 0 (0.0%) | 103 (100.0%) |
| Arts, Media & Entertainment | 27 (100.0%) | 0 (0.0%) |
| Health Diagnosing & Treating | 128 (55.6%) | 102 (44.4%) |
| Health Technologists | 128 (55.6%) | 102 (44.4%) |
| Total (Category) | 489 (56.1%) | 382 (43.9%) |
| Total (Overall) | 1,367 (56.6%) | 1,050 (43.4%) |
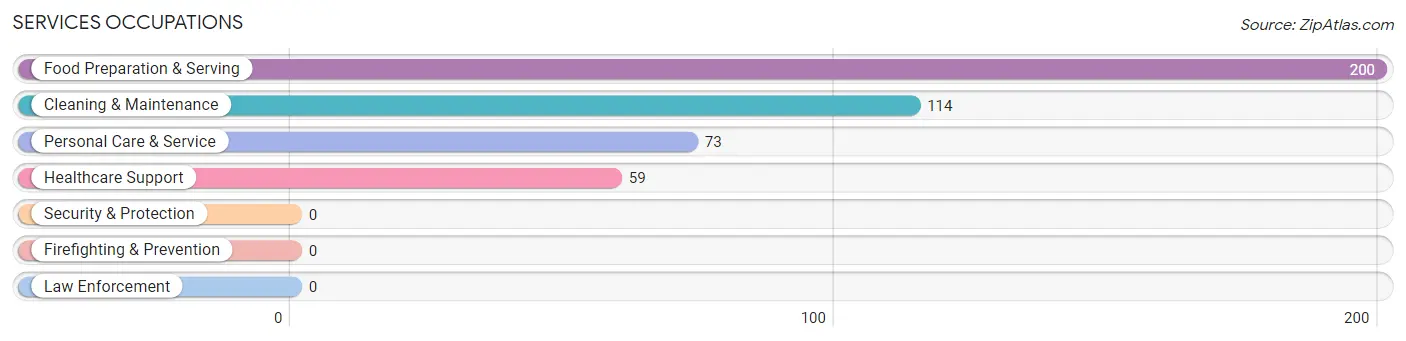
Services Occupations
The most common Services occupations in Center are Food Preparation & Serving (200 | 8.3%), Cleaning & Maintenance (114 | 4.7%), Personal Care & Service (73 | 3.0%), and Healthcare Support (59 | 2.4%).
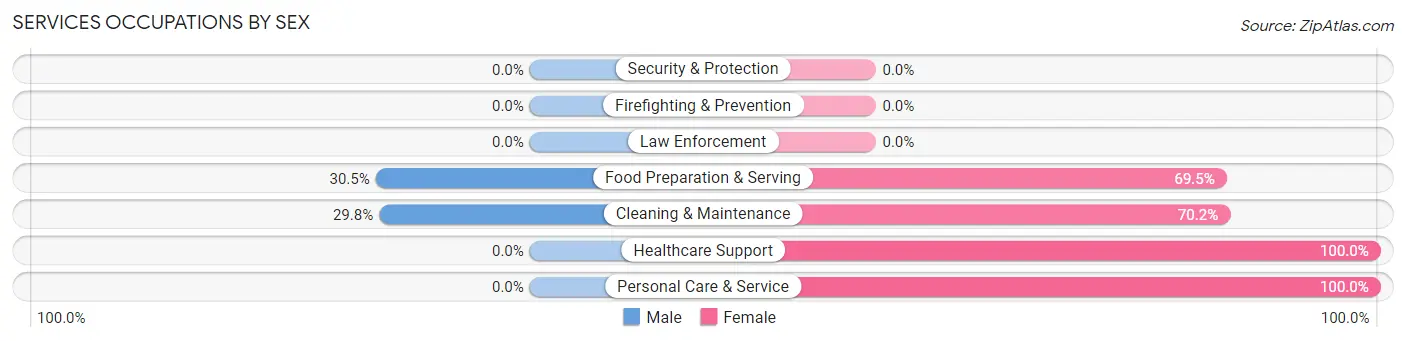
Services Occupations by Sex
Within the Services occupations in Center, the most male-oriented occupations are Food Preparation & Serving (30.5%), and Cleaning & Maintenance (29.8%), while the most female-oriented occupations are Healthcare Support (100.0%), Personal Care & Service (100.0%), and Cleaning & Maintenance (70.2%).
| Occupation | Male | Female |
| Healthcare Support | 0 (0.0%) | 59 (100.0%) |
| Security & Protection | 0 (0.0%) | 0 (0.0%) |
| Firefighting & Prevention | 0 (0.0%) | 0 (0.0%) |
| Law Enforcement | 0 (0.0%) | 0 (0.0%) |
| Food Preparation & Serving | 61 (30.5%) | 139 (69.5%) |
| Cleaning & Maintenance | 34 (29.8%) | 80 (70.2%) |
| Personal Care & Service | 0 (0.0%) | 73 (100.0%) |
| Total (Category) | 95 (21.3%) | 351 (78.7%) |
| Total (Overall) | 1,367 (56.6%) | 1,050 (43.4%) |
Sales and Office Occupations
The most common Sales and Office occupations in Center are Sales & Related (251 | 10.4%), and Office & Administration (188 | 7.8%).
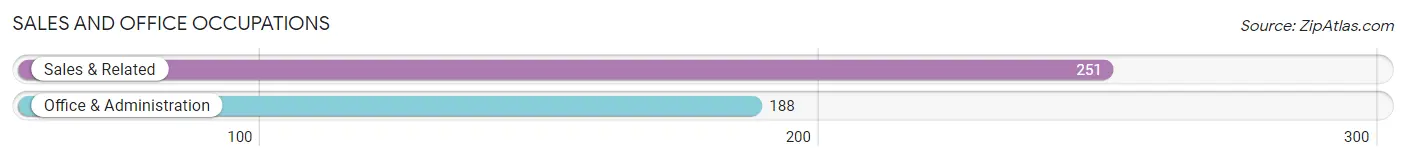
Sales and Office Occupations by Sex
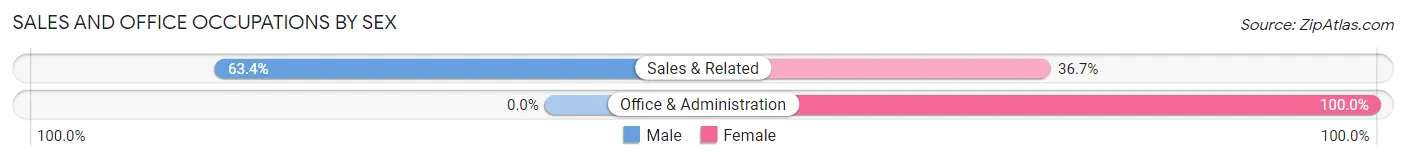
| Occupation | Male | Female |
| Sales & Related | 159 (63.3%) | 92 (36.6%) |
| Office & Administration | 0 (0.0%) | 188 (100.0%) |
| Total (Category) | 159 (36.2%) | 280 (63.8%) |
| Total (Overall) | 1,367 (56.6%) | 1,050 (43.4%) |
Natural Resources, Construction and Maintenance Occupations
The most common Natural Resources, Construction and Maintenance occupations in Center are Construction & Extraction (129 | 5.3%), and Farming, Fishing & Forestry (41 | 1.7%).
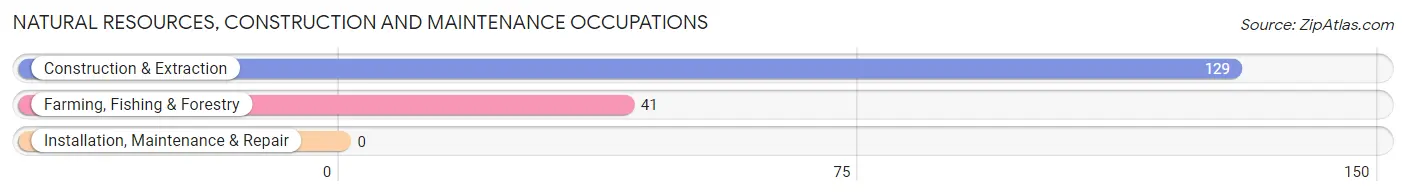
Natural Resources, Construction and Maintenance Occupations by Sex
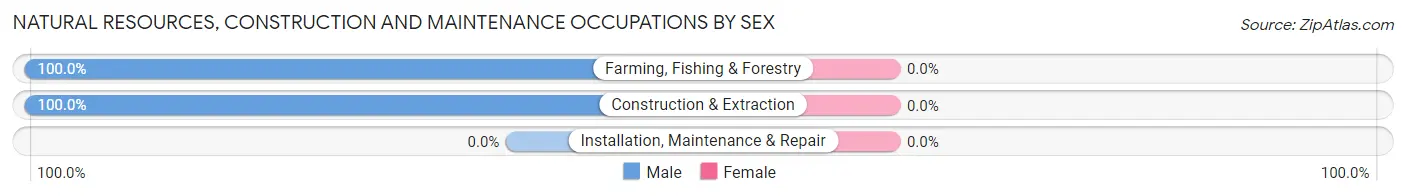
| Occupation | Male | Female |
| Farming, Fishing & Forestry | 41 (100.0%) | 0 (0.0%) |
| Construction & Extraction | 129 (100.0%) | 0 (0.0%) |
| Installation, Maintenance & Repair | 0 (0.0%) | 0 (0.0%) |
| Total (Category) | 170 (100.0%) | 0 (0.0%) |
| Total (Overall) | 1,367 (56.6%) | 1,050 (43.4%) |
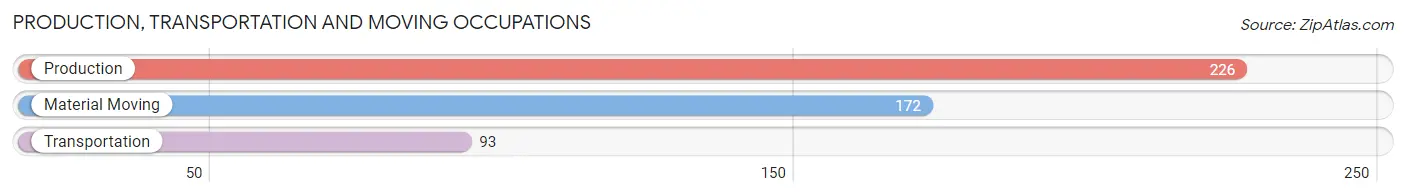
Production, Transportation and Moving Occupations
The most common Production, Transportation and Moving occupations in Center are Production (226 | 9.3%), Material Moving (172 | 7.1%), and Transportation (93 | 3.8%).
Production, Transportation and Moving Occupations by Sex
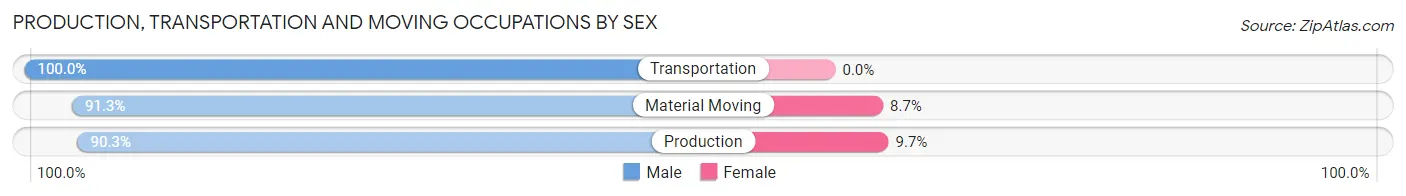
| Occupation | Male | Female |
| Production | 204 (90.3%) | 22 (9.7%) |
| Transportation | 93 (100.0%) | 0 (0.0%) |
| Material Moving | 157 (91.3%) | 15 (8.7%) |
| Total (Category) | 454 (92.5%) | 37 (7.5%) |
| Total (Overall) | 1,367 (56.6%) | 1,050 (43.4%) |
Employment Industries by Sex in Center
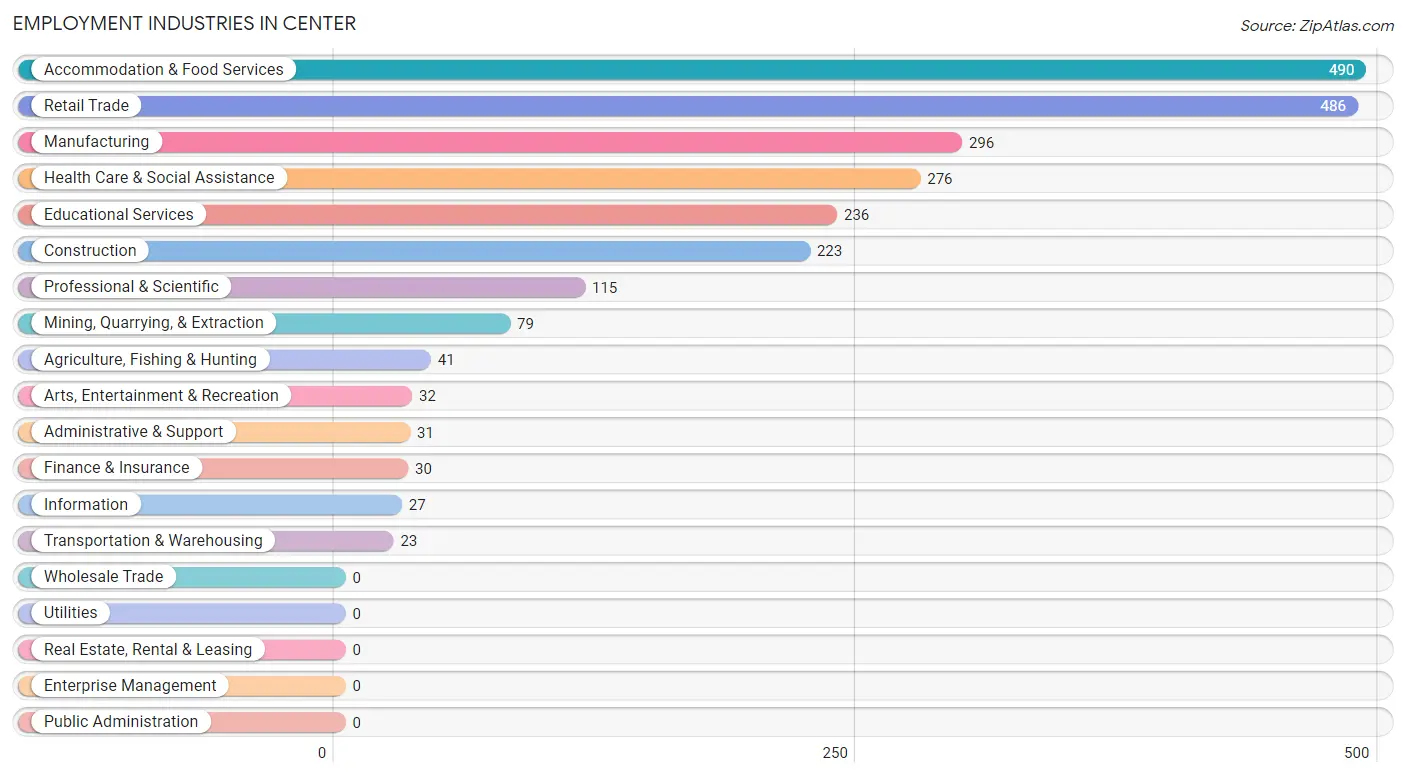
Employment Industries in Center
The major employment industries in Center include Accommodation & Food Services (490 | 20.3%), Retail Trade (486 | 20.1%), Manufacturing (296 | 12.2%), Health Care & Social Assistance (276 | 11.4%), and Educational Services (236 | 9.8%).
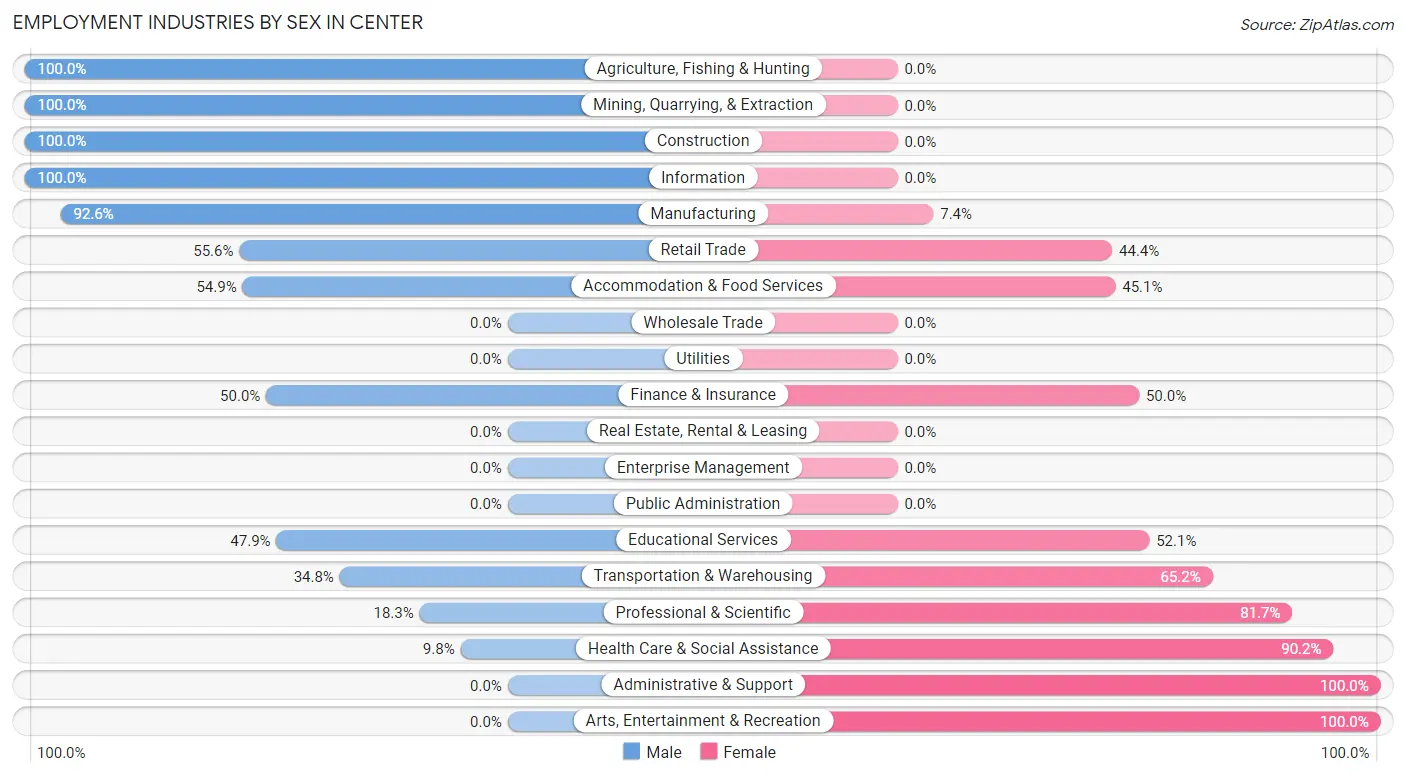
Employment Industries by Sex in Center
The Center industries that see more men than women are Agriculture, Fishing & Hunting (100.0%), Mining, Quarrying, & Extraction (100.0%), and Construction (100.0%), whereas the industries that tend to have a higher number of women are Administrative & Support (100.0%), Arts, Entertainment & Recreation (100.0%), and Health Care & Social Assistance (90.2%).
| Industry | Male | Female |
| Agriculture, Fishing & Hunting | 41 (100.0%) | 0 (0.0%) |
| Mining, Quarrying, & Extraction | 79 (100.0%) | 0 (0.0%) |
| Construction | 223 (100.0%) | 0 (0.0%) |
| Manufacturing | 274 (92.6%) | 22 (7.4%) |
| Wholesale Trade | 0 (0.0%) | 0 (0.0%) |
| Retail Trade | 270 (55.6%) | 216 (44.4%) |
| Transportation & Warehousing | 8 (34.8%) | 15 (65.2%) |
| Utilities | 0 (0.0%) | 0 (0.0%) |
| Information | 27 (100.0%) | 0 (0.0%) |
| Finance & Insurance | 15 (50.0%) | 15 (50.0%) |
| Real Estate, Rental & Leasing | 0 (0.0%) | 0 (0.0%) |
| Professional & Scientific | 21 (18.3%) | 94 (81.7%) |
| Enterprise Management | 0 (0.0%) | 0 (0.0%) |
| Administrative & Support | 0 (0.0%) | 31 (100.0%) |
| Educational Services | 113 (47.9%) | 123 (52.1%) |
| Health Care & Social Assistance | 27 (9.8%) | 249 (90.2%) |
| Arts, Entertainment & Recreation | 0 (0.0%) | 32 (100.0%) |
| Accommodation & Food Services | 269 (54.9%) | 221 (45.1%) |
| Public Administration | 0 (0.0%) | 0 (0.0%) |
| Total | 1,367 (56.6%) | 1,050 (43.4%) |
Education in Center
School Enrollment in Center
The most common levels of schooling among the 1,483 students in Center are middle school (520 | 35.1%), nursery / preschool (246 | 16.6%), and college / undergraduate (231 | 15.6%).
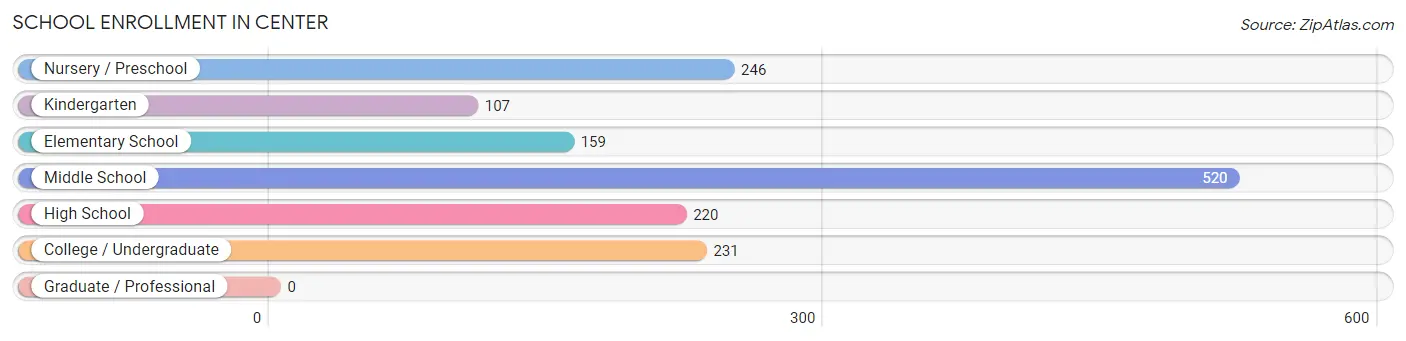
| School Level | # Students | % Students |
| Nursery / Preschool | 246 | 16.6% |
| Kindergarten | 107 | 7.2% |
| Elementary School | 159 | 10.7% |
| Middle School | 520 | 35.1% |
| High School | 220 | 14.8% |
| College / Undergraduate | 231 | 15.6% |
| Graduate / Professional | 0 | 0.0% |
| Total | 1,483 | 100.0% |
School Enrollment by Age by Funding Source in Center
Out of a total of 1,483 students who are enrolled in schools in Center, 49 (3.3%) attend a private institution, while the remaining 1,434 (96.7%) are enrolled in public schools. The age group of 5 to 9 year old has the highest likelihood of being enrolled in private schools, with 49 (15.8% in the age bracket) enrolled. Conversely, the age group of 3 to 4 year olds has the lowest likelihood of being enrolled in a private school, with 201 (100.0% in the age bracket) attending a public institution.
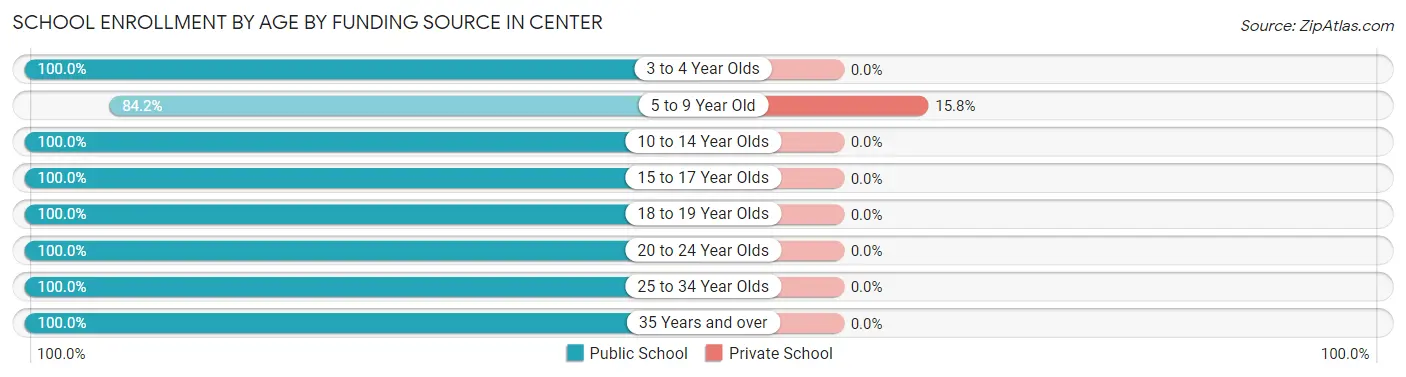
| Age Bracket | Public School | Private School |
| 3 to 4 Year Olds | 201 (100.0%) | 0 (0.0%) |
| 5 to 9 Year Old | 262 (84.2%) | 49 (15.8%) |
| 10 to 14 Year Olds | 520 (100.0%) | 0 (0.0%) |
| 15 to 17 Year Olds | 220 (100.0%) | 0 (0.0%) |
| 18 to 19 Year Olds | 26 (100.0%) | 0 (0.0%) |
| 20 to 24 Year Olds | 30 (100.0%) | 0 (0.0%) |
| 25 to 34 Year Olds | 114 (100.0%) | 0 (0.0%) |
| 35 Years and over | 61 (100.0%) | 0 (0.0%) |
| Total | 1,434 (96.7%) | 49 (3.3%) |
Educational Attainment by Field of Study in Center
Science & technology (120 | 26.1%), business (93 | 20.3%), social sciences (58 | 12.6%), computers & mathematics (38 | 8.3%), and education (38 | 8.3%) are the most common fields of study among 459 individuals in Center who have obtained a bachelor's degree or higher.

| Field of Study | # Graduates | % Graduates |
| Computers & Mathematics | 38 | 8.3% |
| Bio, Nature & Agricultural | 23 | 5.0% |
| Physical & Health Sciences | 29 | 6.3% |
| Psychology | 16 | 3.5% |
| Social Sciences | 58 | 12.6% |
| Engineering | 7 | 1.5% |
| Multidisciplinary Studies | 0 | 0.0% |
| Science & Technology | 120 | 26.1% |
| Business | 93 | 20.3% |
| Education | 38 | 8.3% |
| Literature & Languages | 0 | 0.0% |
| Liberal Arts & History | 16 | 3.5% |
| Visual & Performing Arts | 0 | 0.0% |
| Communications | 0 | 0.0% |
| Arts & Humanities | 21 | 4.6% |
| Total | 459 | 100.0% |
Transportation & Commute in Center
Vehicle Availability by Sex in Center
The most prevalent vehicle ownership categories in Center are males with 2 vehicles (959, accounting for 70.3%) and females with 2 vehicles (447, making up 91.3%).
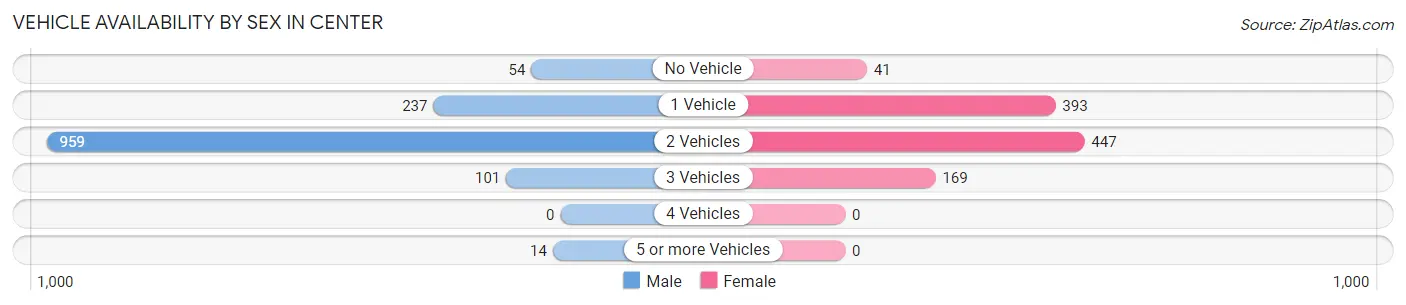
| Vehicles Available | Male | Female |
| No Vehicle | 54 (4.0%) | 41 (3.9%) |
| 1 Vehicle | 237 (17.4%) | 393 (37.4%) |
| 2 Vehicles | 959 (70.3%) | 447 (42.6%) |
| 3 Vehicles | 101 (7.4%) | 169 (16.1%) |
| 4 Vehicles | 0 (0.0%) | 0 (0.0%) |
| 5 or more Vehicles | 14 (1.0%) | 0 (0.0%) |
| Total | 1,365 (100.0%) | 1,050 (100.0%) |
Commute Time in Center
The most frequently occuring commute durations in Center are 5 to 9 minutes (837 commuters, 35.8%), 15 to 19 minutes (331 commuters, 14.2%), and less than 5 minutes (312 commuters, 13.3%).
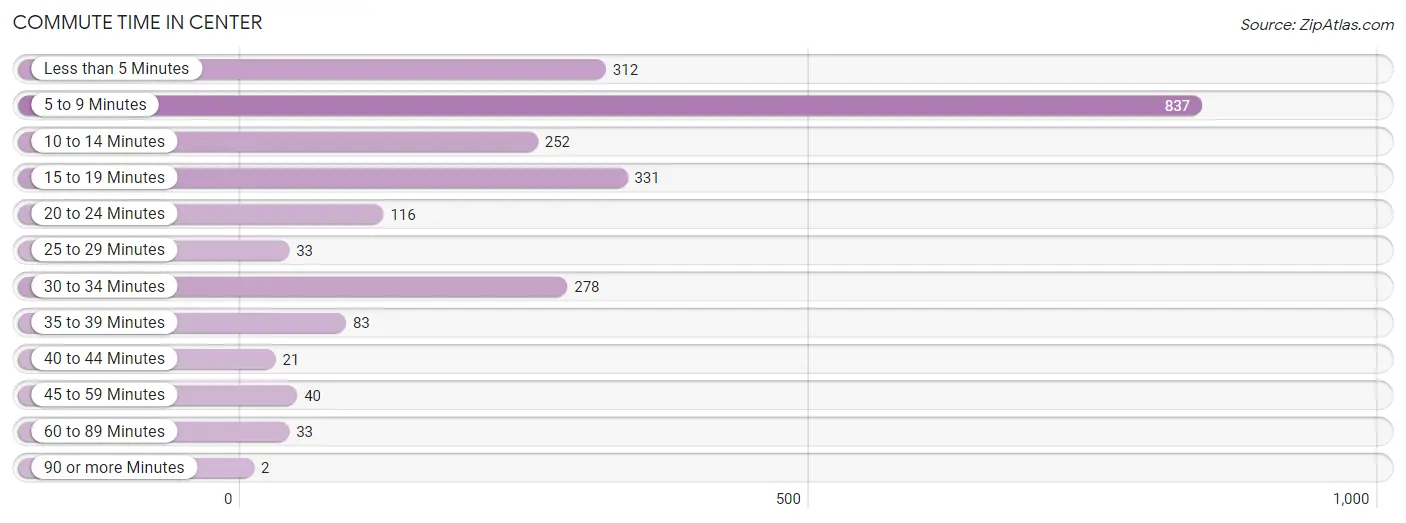
| Commute Time | # Commuters | % Commuters |
| Less than 5 Minutes | 312 | 13.3% |
| 5 to 9 Minutes | 837 | 35.8% |
| 10 to 14 Minutes | 252 | 10.8% |
| 15 to 19 Minutes | 331 | 14.2% |
| 20 to 24 Minutes | 116 | 5.0% |
| 25 to 29 Minutes | 33 | 1.4% |
| 30 to 34 Minutes | 278 | 11.9% |
| 35 to 39 Minutes | 83 | 3.5% |
| 40 to 44 Minutes | 21 | 0.9% |
| 45 to 59 Minutes | 40 | 1.7% |
| 60 to 89 Minutes | 33 | 1.4% |
| 90 or more Minutes | 2 | 0.1% |
Commute Time by Sex in Center
The most common commute times in Center are 5 to 9 minutes (397 commuters, 29.0%) for males and 5 to 9 minutes (440 commuters, 45.3%) for females.
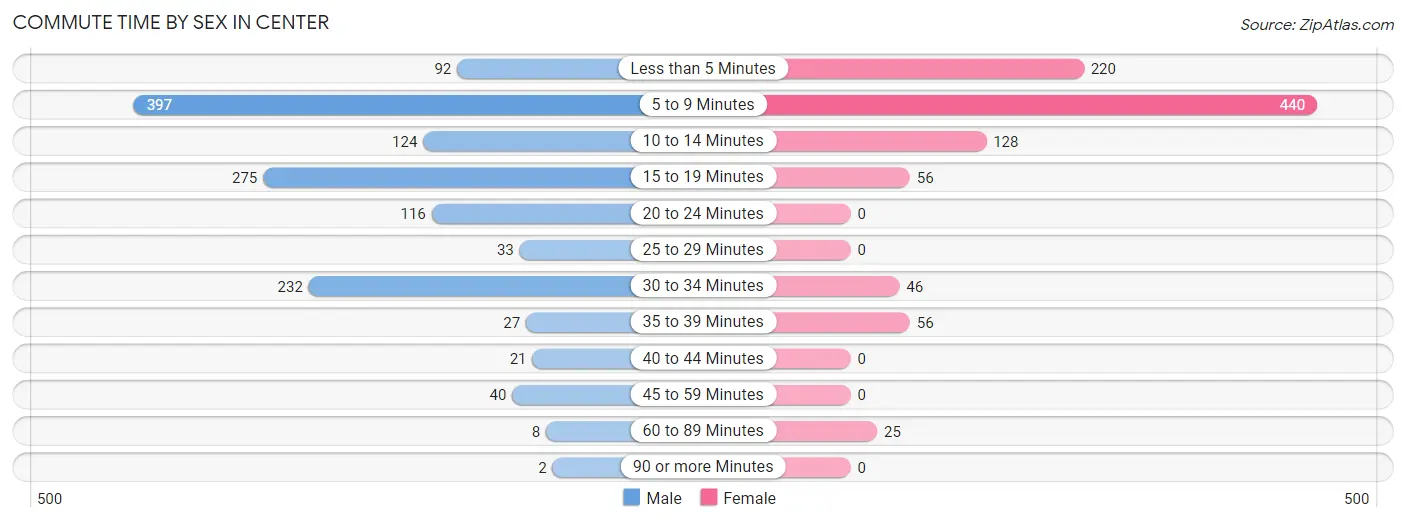
| Commute Time | Male | Female |
| Less than 5 Minutes | 92 (6.7%) | 220 (22.7%) |
| 5 to 9 Minutes | 397 (29.0%) | 440 (45.3%) |
| 10 to 14 Minutes | 124 (9.1%) | 128 (13.2%) |
| 15 to 19 Minutes | 275 (20.1%) | 56 (5.8%) |
| 20 to 24 Minutes | 116 (8.5%) | 0 (0.0%) |
| 25 to 29 Minutes | 33 (2.4%) | 0 (0.0%) |
| 30 to 34 Minutes | 232 (17.0%) | 46 (4.7%) |
| 35 to 39 Minutes | 27 (2.0%) | 56 (5.8%) |
| 40 to 44 Minutes | 21 (1.5%) | 0 (0.0%) |
| 45 to 59 Minutes | 40 (2.9%) | 0 (0.0%) |
| 60 to 89 Minutes | 8 (0.6%) | 25 (2.6%) |
| 90 or more Minutes | 2 (0.2%) | 0 (0.0%) |
Time of Departure to Work by Sex in Center
The most frequent times of departure to work in Center are 8:00 AM to 8:29 AM (334, 24.4%) for males and 8:00 AM to 8:29 AM (208, 21.4%) for females.
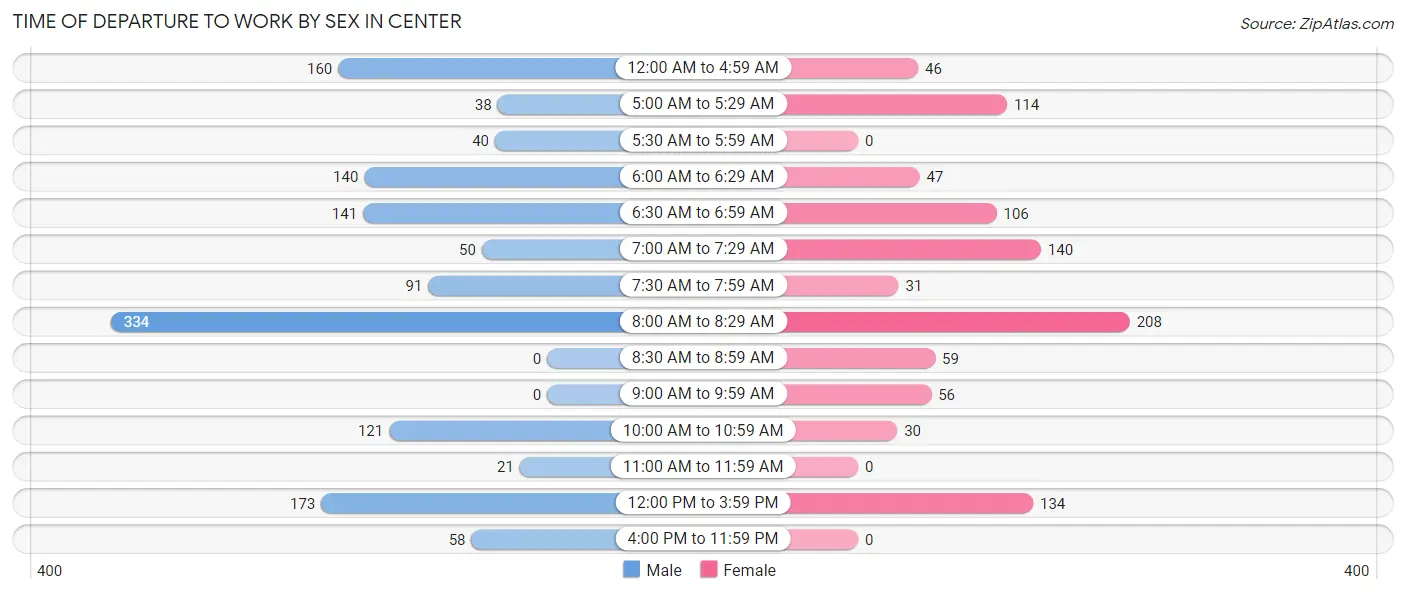
| Time of Departure | Male | Female |
| 12:00 AM to 4:59 AM | 160 (11.7%) | 46 (4.7%) |
| 5:00 AM to 5:29 AM | 38 (2.8%) | 114 (11.7%) |
| 5:30 AM to 5:59 AM | 40 (2.9%) | 0 (0.0%) |
| 6:00 AM to 6:29 AM | 140 (10.2%) | 47 (4.8%) |
| 6:30 AM to 6:59 AM | 141 (10.3%) | 106 (10.9%) |
| 7:00 AM to 7:29 AM | 50 (3.7%) | 140 (14.4%) |
| 7:30 AM to 7:59 AM | 91 (6.7%) | 31 (3.2%) |
| 8:00 AM to 8:29 AM | 334 (24.4%) | 208 (21.4%) |
| 8:30 AM to 8:59 AM | 0 (0.0%) | 59 (6.1%) |
| 9:00 AM to 9:59 AM | 0 (0.0%) | 56 (5.8%) |
| 10:00 AM to 10:59 AM | 121 (8.8%) | 30 (3.1%) |
| 11:00 AM to 11:59 AM | 21 (1.5%) | 0 (0.0%) |
| 12:00 PM to 3:59 PM | 173 (12.7%) | 134 (13.8%) |
| 4:00 PM to 11:59 PM | 58 (4.2%) | 0 (0.0%) |
| Total | 1,367 (100.0%) | 971 (100.0%) |
Housing Occupancy in Center
Occupancy by Ownership in Center
Of the total 1,852 dwellings in Center, owner-occupied units account for 1,078 (58.2%), while renter-occupied units make up 774 (41.8%).
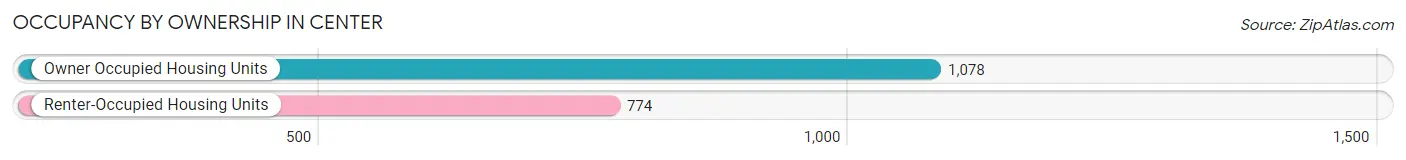
| Occupancy | # Housing Units | % Housing Units |
| Owner Occupied Housing Units | 1,078 | 58.2% |
| Renter-Occupied Housing Units | 774 | 41.8% |
| Total Occupied Housing Units | 1,852 | 100.0% |
Occupancy by Household Size in Center
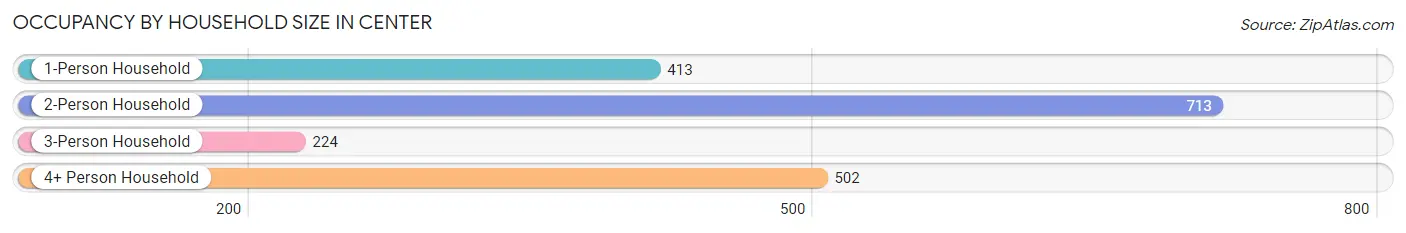
| Household Size | # Housing Units | % Housing Units |
| 1-Person Household | 413 | 22.3% |
| 2-Person Household | 713 | 38.5% |
| 3-Person Household | 224 | 12.1% |
| 4+ Person Household | 502 | 27.1% |
| Total Housing Units | 1,852 | 100.0% |
Occupancy by Ownership by Household Size in Center
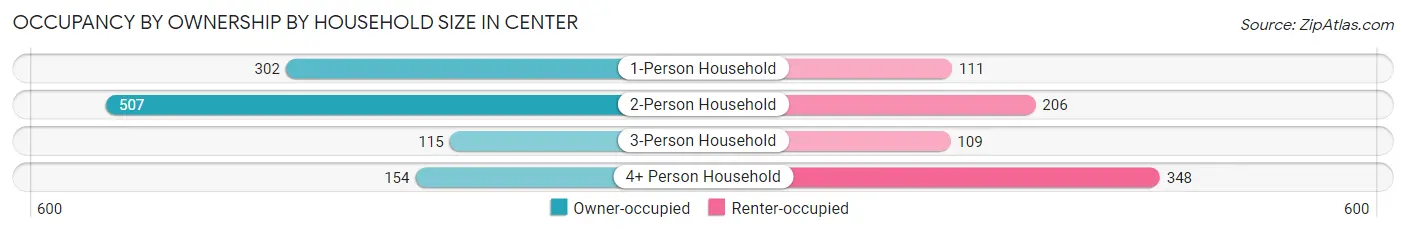
| Household Size | Owner-occupied | Renter-occupied |
| 1-Person Household | 302 (73.1%) | 111 (26.9%) |
| 2-Person Household | 507 (71.1%) | 206 (28.9%) |
| 3-Person Household | 115 (51.3%) | 109 (48.7%) |
| 4+ Person Household | 154 (30.7%) | 348 (69.3%) |
| Total Housing Units | 1,078 (58.2%) | 774 (41.8%) |
Occupancy by Educational Attainment in Center
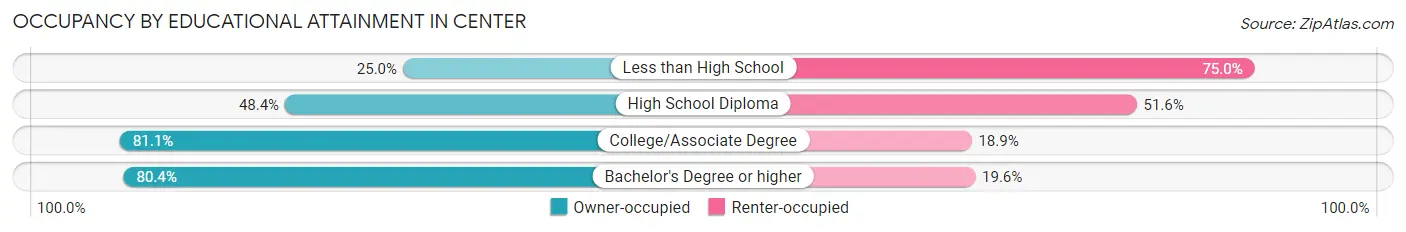
| Household Size | Owner-occupied | Renter-occupied |
| Less than High School | 71 (25.0%) | 213 (75.0%) |
| High School Diploma | 388 (48.4%) | 414 (51.6%) |
| College/Associate Degree | 369 (81.1%) | 86 (18.9%) |
| Bachelor's Degree or higher | 250 (80.4%) | 61 (19.6%) |
Occupancy by Age of Householder in Center
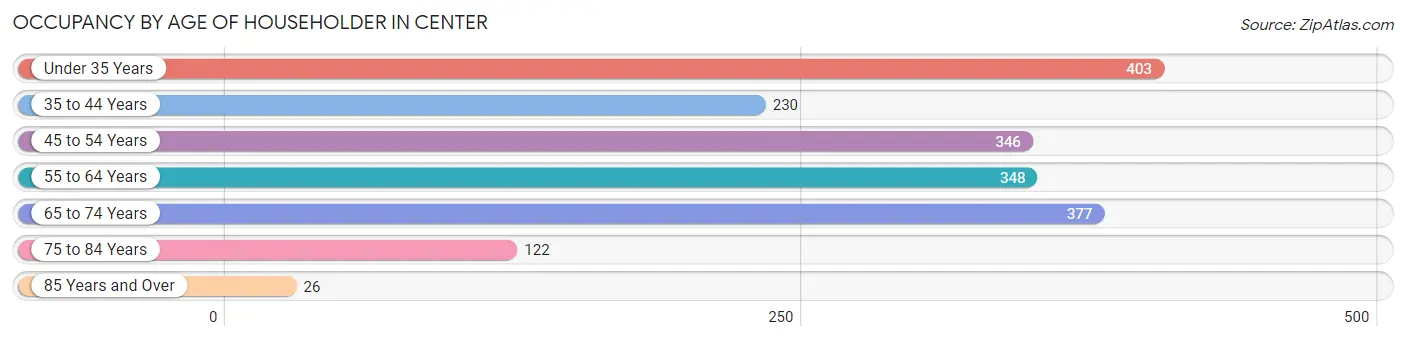
| Age Bracket | # Households | % Households |
| Under 35 Years | 403 | 21.8% |
| 35 to 44 Years | 230 | 12.4% |
| 45 to 54 Years | 346 | 18.7% |
| 55 to 64 Years | 348 | 18.8% |
| 65 to 74 Years | 377 | 20.4% |
| 75 to 84 Years | 122 | 6.6% |
| 85 Years and Over | 26 | 1.4% |
| Total | 1,852 | 100.0% |
Housing Finances in Center
Median Income by Occupancy in Center
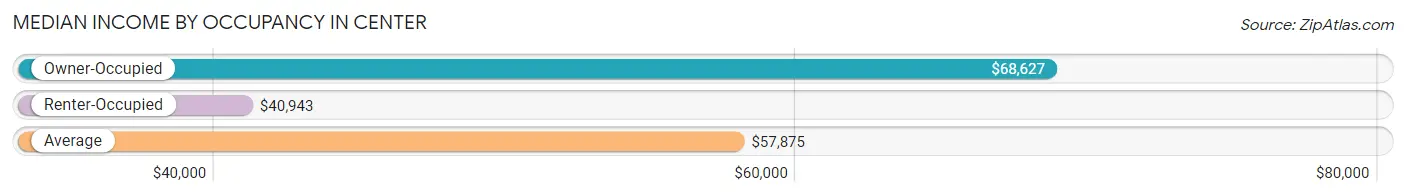
| Occupancy Type | # Households | Median Income |
| Owner-Occupied | 1,078 (58.2%) | $68,627 |
| Renter-Occupied | 774 (41.8%) | $40,943 |
| Average | 1,852 (100.0%) | $57,875 |
Occupancy by Householder Income Bracket in Center
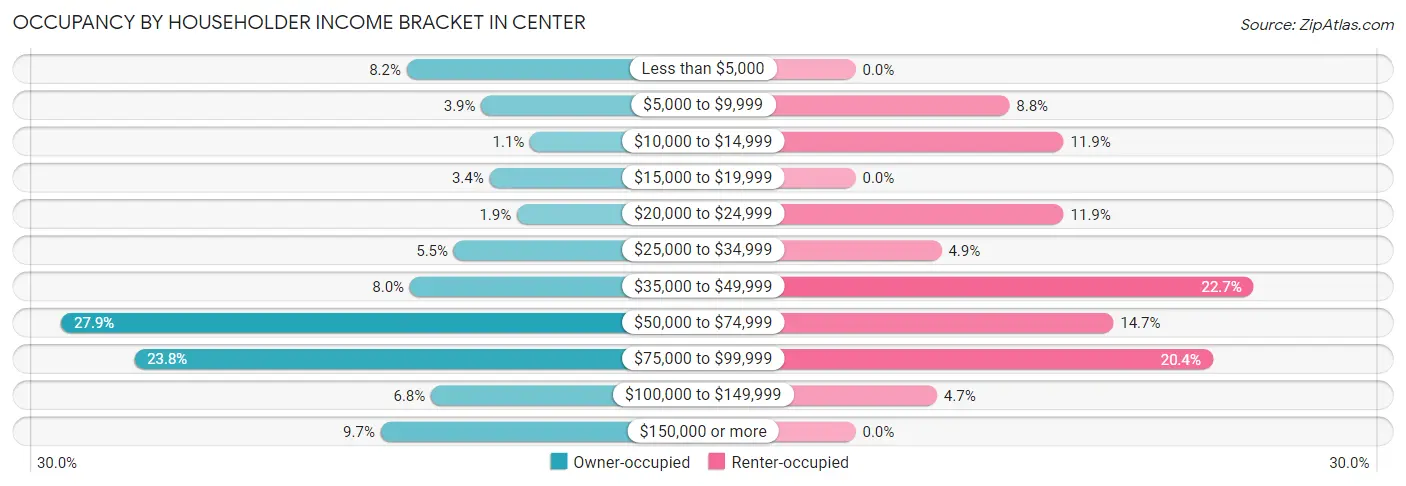
| Income Bracket | Owner-occupied | Renter-occupied |
| Less than $5,000 | 88 (8.2%) | 0 (0.0%) |
| $5,000 to $9,999 | 42 (3.9%) | 68 (8.8%) |
| $10,000 to $14,999 | 12 (1.1%) | 92 (11.9%) |
| $15,000 to $19,999 | 37 (3.4%) | 0 (0.0%) |
| $20,000 to $24,999 | 20 (1.9%) | 92 (11.9%) |
| $25,000 to $34,999 | 59 (5.5%) | 38 (4.9%) |
| $35,000 to $49,999 | 86 (8.0%) | 176 (22.7%) |
| $50,000 to $74,999 | 301 (27.9%) | 114 (14.7%) |
| $75,000 to $99,999 | 256 (23.7%) | 158 (20.4%) |
| $100,000 to $149,999 | 73 (6.8%) | 36 (4.6%) |
| $150,000 or more | 104 (9.7%) | 0 (0.0%) |
| Total | 1,078 (100.0%) | 774 (100.0%) |
Monthly Housing Cost Tiers in Center
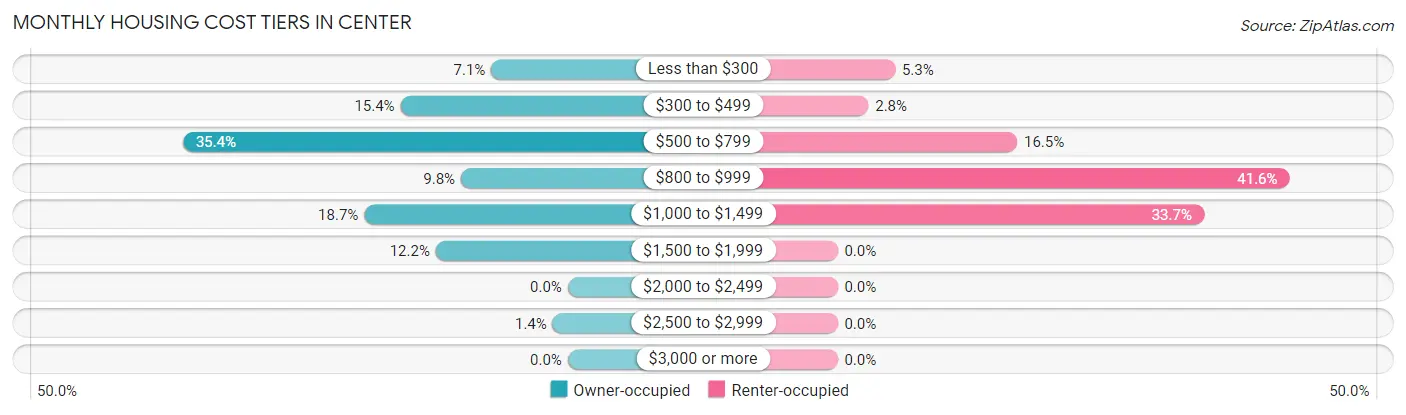
| Monthly Cost | Owner-occupied | Renter-occupied |
| Less than $300 | 76 (7.0%) | 41 (5.3%) |
| $300 to $499 | 166 (15.4%) | 22 (2.8%) |
| $500 to $799 | 382 (35.4%) | 128 (16.5%) |
| $800 to $999 | 106 (9.8%) | 322 (41.6%) |
| $1,000 to $1,499 | 202 (18.7%) | 261 (33.7%) |
| $1,500 to $1,999 | 131 (12.1%) | 0 (0.0%) |
| $2,000 to $2,499 | 0 (0.0%) | 0 (0.0%) |
| $2,500 to $2,999 | 15 (1.4%) | 0 (0.0%) |
| $3,000 or more | 0 (0.0%) | 0 (0.0%) |
| Total | 1,078 (100.0%) | 774 (100.0%) |
Physical Housing Characteristics in Center
Housing Structures in Center
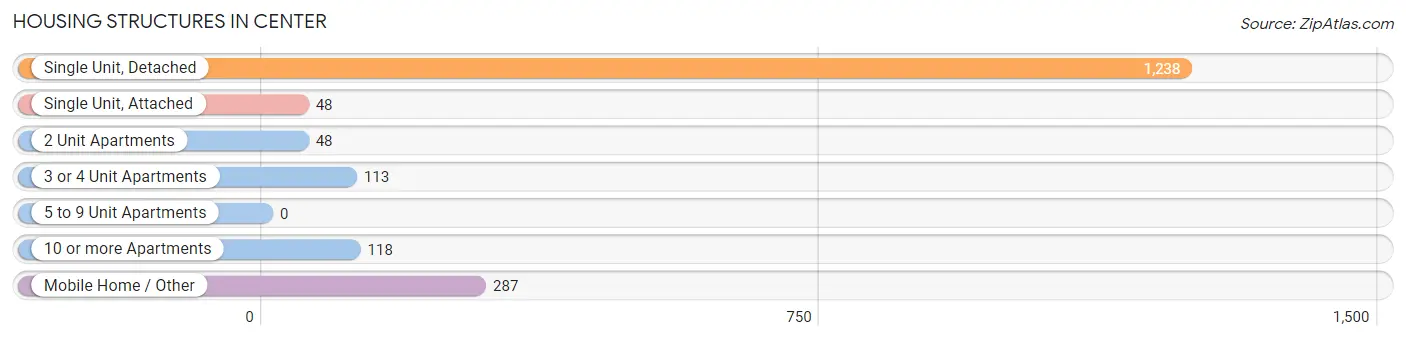
| Structure Type | # Housing Units | % Housing Units |
| Single Unit, Detached | 1,238 | 66.8% |
| Single Unit, Attached | 48 | 2.6% |
| 2 Unit Apartments | 48 | 2.6% |
| 3 or 4 Unit Apartments | 113 | 6.1% |
| 5 to 9 Unit Apartments | 0 | 0.0% |
| 10 or more Apartments | 118 | 6.4% |
| Mobile Home / Other | 287 | 15.5% |
| Total | 1,852 | 100.0% |
Housing Structures by Occupancy in Center
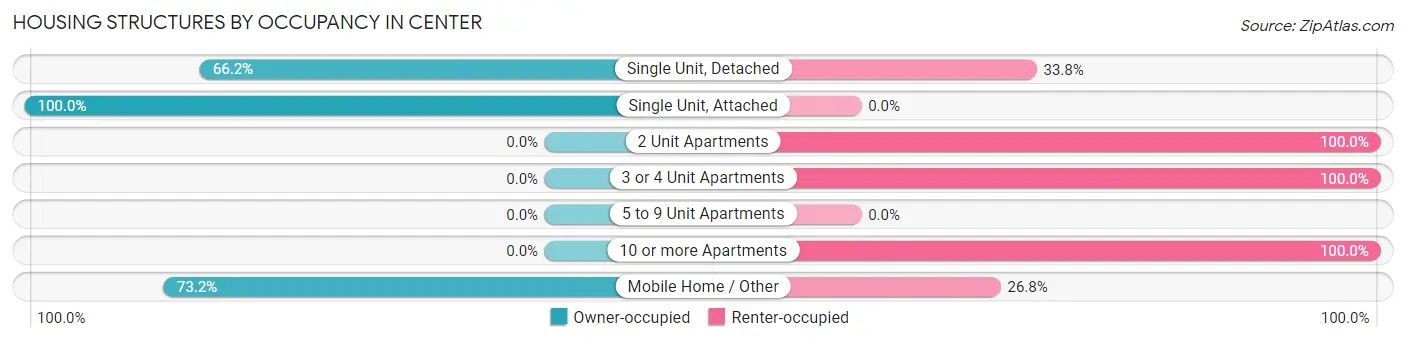
| Structure Type | Owner-occupied | Renter-occupied |
| Single Unit, Detached | 820 (66.2%) | 418 (33.8%) |
| Single Unit, Attached | 48 (100.0%) | 0 (0.0%) |
| 2 Unit Apartments | 0 (0.0%) | 48 (100.0%) |
| 3 or 4 Unit Apartments | 0 (0.0%) | 113 (100.0%) |
| 5 to 9 Unit Apartments | 0 (0.0%) | 0 (0.0%) |
| 10 or more Apartments | 0 (0.0%) | 118 (100.0%) |
| Mobile Home / Other | 210 (73.2%) | 77 (26.8%) |
| Total | 1,078 (58.2%) | 774 (41.8%) |
Housing Structures by Number of Rooms in Center
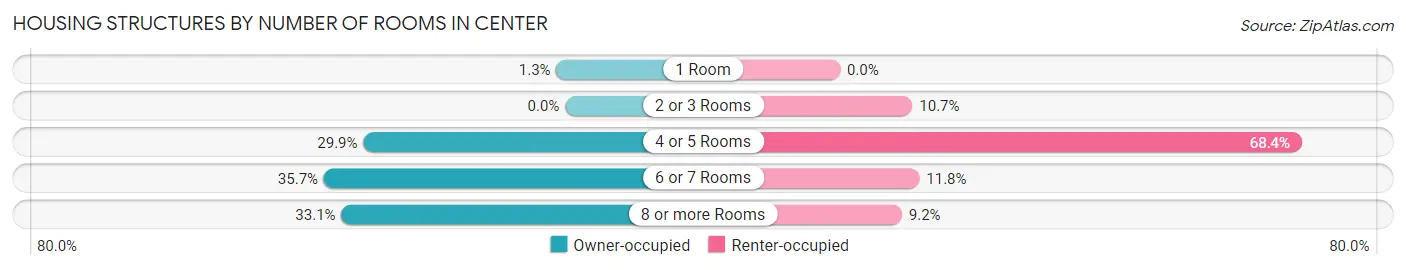
| Number of Rooms | Owner-occupied | Renter-occupied |
| 1 Room | 14 (1.3%) | 0 (0.0%) |
| 2 or 3 Rooms | 0 (0.0%) | 83 (10.7%) |
| 4 or 5 Rooms | 322 (29.9%) | 529 (68.3%) |
| 6 or 7 Rooms | 385 (35.7%) | 91 (11.8%) |
| 8 or more Rooms | 357 (33.1%) | 71 (9.2%) |
| Total | 1,078 (100.0%) | 774 (100.0%) |
Housing Structure by Heating Type in Center
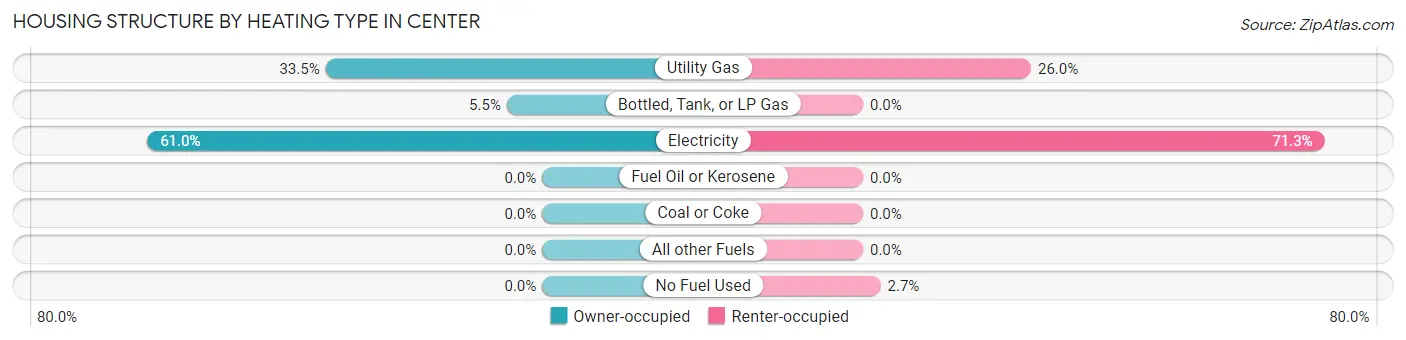
| Heating Type | Owner-occupied | Renter-occupied |
| Utility Gas | 361 (33.5%) | 201 (26.0%) |
| Bottled, Tank, or LP Gas | 59 (5.5%) | 0 (0.0%) |
| Electricity | 658 (61.0%) | 552 (71.3%) |
| Fuel Oil or Kerosene | 0 (0.0%) | 0 (0.0%) |
| Coal or Coke | 0 (0.0%) | 0 (0.0%) |
| All other Fuels | 0 (0.0%) | 0 (0.0%) |
| No Fuel Used | 0 (0.0%) | 21 (2.7%) |
| Total | 1,078 (100.0%) | 774 (100.0%) |
Household Vehicle Usage in Center
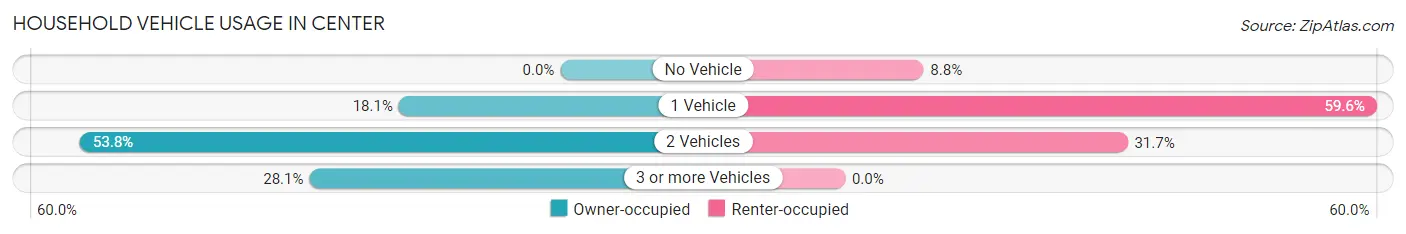
| Vehicles per Household | Owner-occupied | Renter-occupied |
| No Vehicle | 0 (0.0%) | 68 (8.8%) |
| 1 Vehicle | 195 (18.1%) | 461 (59.6%) |
| 2 Vehicles | 580 (53.8%) | 245 (31.7%) |
| 3 or more Vehicles | 303 (28.1%) | 0 (0.0%) |
| Total | 1,078 (100.0%) | 774 (100.0%) |
Real Estate & Mortgages in Center
Real Estate and Mortgage Overview in Center
| Characteristic | Without Mortgage | With Mortgage |
| Housing Units | 617 | 461 |
| Median Property Value | - | - |
| Median Household Income | $67,072 | $16 |
| Monthly Housing Costs | $545 | $0 |
| Real Estate Taxes | $962 | $30 |
Property Value by Mortgage Status in Center
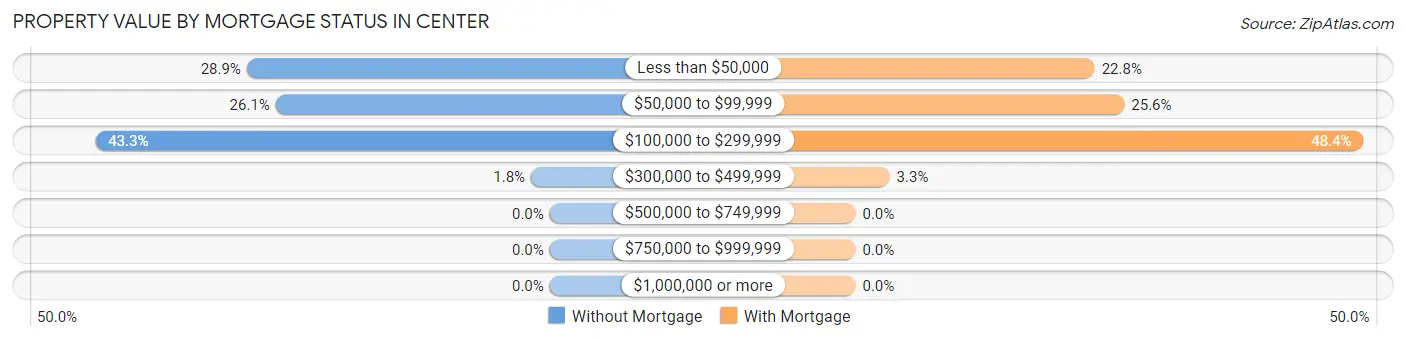
| Property Value | Without Mortgage | With Mortgage |
| Less than $50,000 | 178 (28.8%) | 105 (22.8%) |
| $50,000 to $99,999 | 161 (26.1%) | 118 (25.6%) |
| $100,000 to $299,999 | 267 (43.3%) | 223 (48.4%) |
| $300,000 to $499,999 | 11 (1.8%) | 15 (3.3%) |
| $500,000 to $749,999 | 0 (0.0%) | 0 (0.0%) |
| $750,000 to $999,999 | 0 (0.0%) | 0 (0.0%) |
| $1,000,000 or more | 0 (0.0%) | 0 (0.0%) |
| Total | 617 (100.0%) | 461 (100.0%) |
Household Income by Mortgage Status in Center
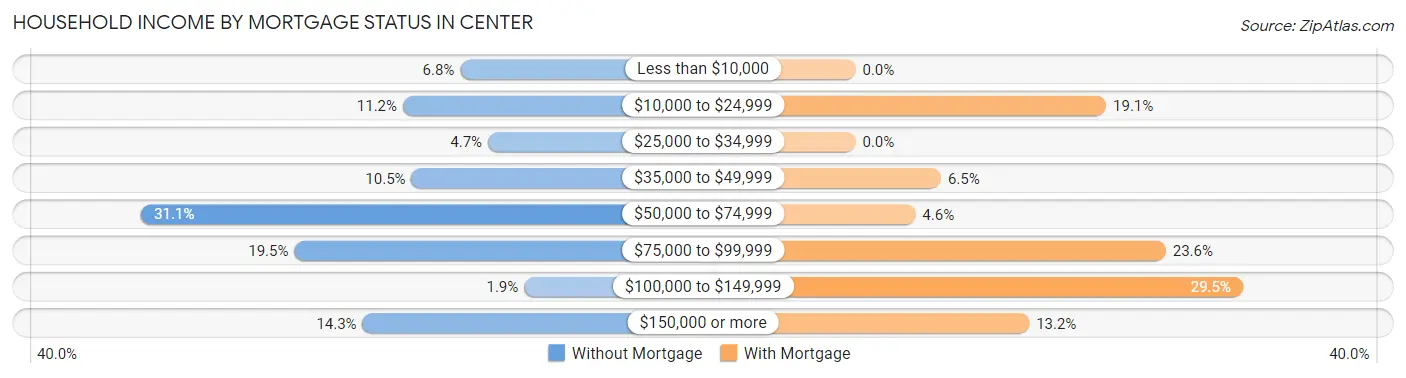
| Household Income | Without Mortgage | With Mortgage |
| Less than $10,000 | 42 (6.8%) | 0 (0.0%) |
| $10,000 to $24,999 | 69 (11.2%) | 88 (19.1%) |
| $25,000 to $34,999 | 29 (4.7%) | 0 (0.0%) |
| $35,000 to $49,999 | 65 (10.5%) | 30 (6.5%) |
| $50,000 to $74,999 | 192 (31.1%) | 21 (4.6%) |
| $75,000 to $99,999 | 120 (19.5%) | 109 (23.6%) |
| $100,000 to $149,999 | 12 (1.9%) | 136 (29.5%) |
| $150,000 or more | 88 (14.3%) | 61 (13.2%) |
| Total | 617 (100.0%) | 461 (100.0%) |
Property Value to Household Income Ratio in Center
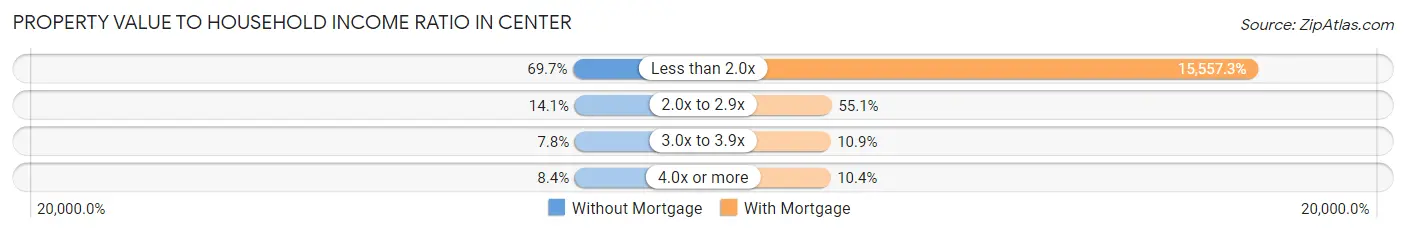
| Value-to-Income Ratio | Without Mortgage | With Mortgage |
| Less than 2.0x | 430 (69.7%) | 71,719 (15,557.3%) |
| 2.0x to 2.9x | 87 (14.1%) | 254 (55.1%) |
| 3.0x to 3.9x | 48 (7.8%) | 50 (10.8%) |
| 4.0x or more | 52 (8.4%) | 48 (10.4%) |
| Total | 617 (100.0%) | 461 (100.0%) |
Real Estate Taxes by Mortgage Status in Center
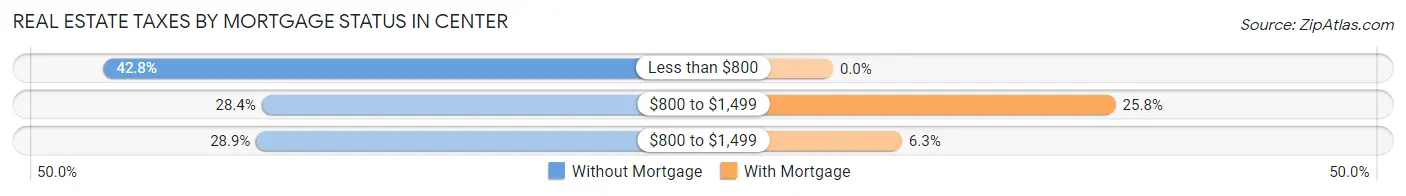
| Property Taxes | Without Mortgage | With Mortgage |
| Less than $800 | 264 (42.8%) | 0 (0.0%) |
| $800 to $1,499 | 175 (28.4%) | 119 (25.8%) |
| $800 to $1,499 | 178 (28.8%) | 29 (6.3%) |
| Total | 617 (100.0%) | 461 (100.0%) |
Health & Disability in Center
Health Insurance Coverage by Age in Center
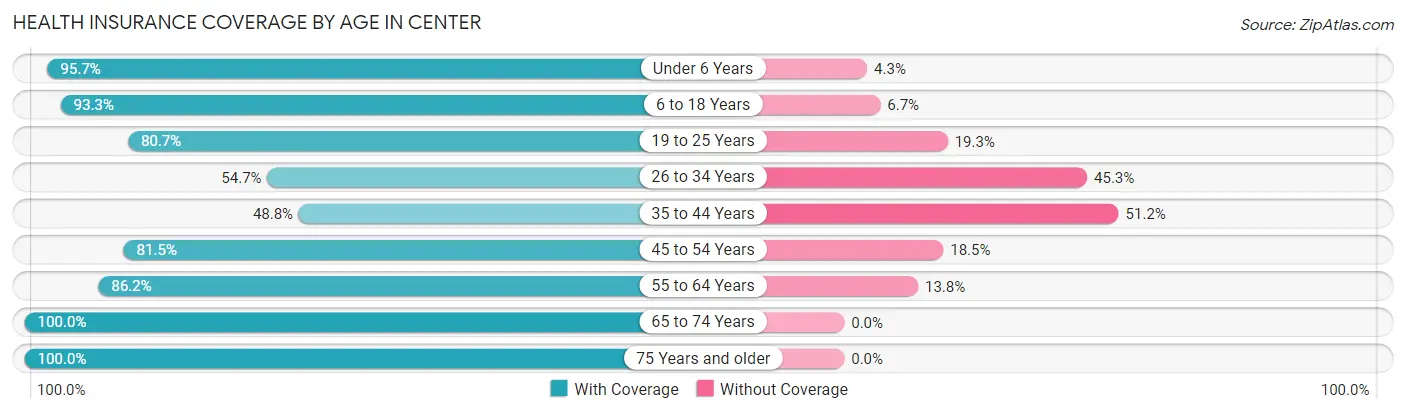
| Age Bracket | With Coverage | Without Coverage |
| Under 6 Years | 472 (95.7%) | 21 (4.3%) |
| 6 to 18 Years | 971 (93.3%) | 70 (6.7%) |
| 19 to 25 Years | 448 (80.7%) | 107 (19.3%) |
| 26 to 34 Years | 232 (54.7%) | 192 (45.3%) |
| 35 to 44 Years | 295 (48.8%) | 309 (51.2%) |
| 45 to 54 Years | 530 (81.5%) | 120 (18.5%) |
| 55 to 64 Years | 495 (86.2%) | 79 (13.8%) |
| 65 to 74 Years | 445 (100.0%) | 0 (0.0%) |
| 75 Years and older | 275 (100.0%) | 0 (0.0%) |
| Total | 4,163 (82.3%) | 898 (17.7%) |
Health Insurance Coverage by Citizenship Status in Center
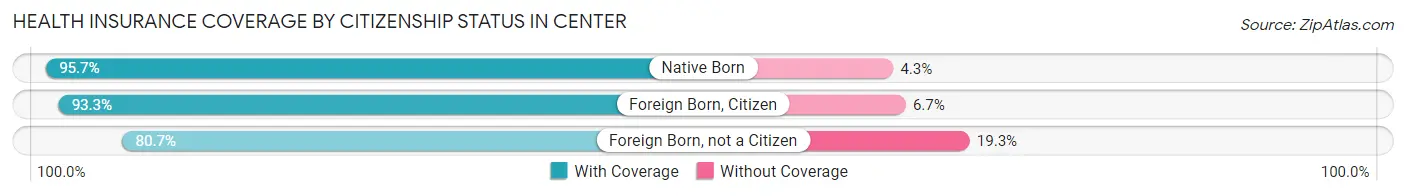
| Citizenship Status | With Coverage | Without Coverage |
| Native Born | 472 (95.7%) | 21 (4.3%) |
| Foreign Born, Citizen | 971 (93.3%) | 70 (6.7%) |
| Foreign Born, not a Citizen | 448 (80.7%) | 107 (19.3%) |
Health Insurance Coverage by Household Income in Center
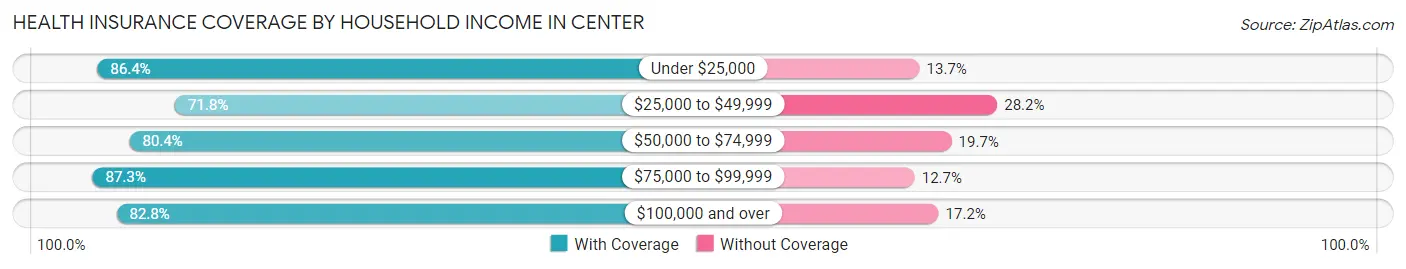
| Household Income | With Coverage | Without Coverage |
| Under $25,000 | 1,151 (86.4%) | 182 (13.7%) |
| $25,000 to $49,999 | 718 (71.8%) | 282 (28.2%) |
| $50,000 to $74,999 | 650 (80.3%) | 159 (19.7%) |
| $75,000 to $99,999 | 1,137 (87.3%) | 166 (12.7%) |
| $100,000 and over | 505 (82.8%) | 105 (17.2%) |
Public vs Private Health Insurance Coverage by Age in Center
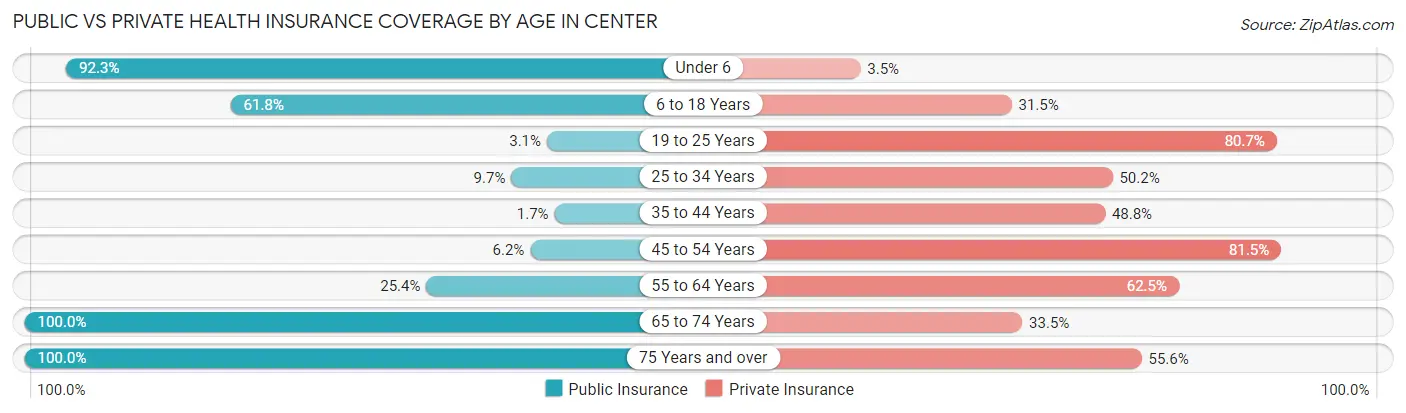
| Age Bracket | Public Insurance | Private Insurance |
| Under 6 | 455 (92.3%) | 17 (3.5%) |
| 6 to 18 Years | 643 (61.8%) | 328 (31.5%) |
| 19 to 25 Years | 17 (3.1%) | 448 (80.7%) |
| 25 to 34 Years | 41 (9.7%) | 213 (50.2%) |
| 35 to 44 Years | 10 (1.7%) | 295 (48.8%) |
| 45 to 54 Years | 40 (6.1%) | 530 (81.5%) |
| 55 to 64 Years | 146 (25.4%) | 359 (62.5%) |
| 65 to 74 Years | 445 (100.0%) | 149 (33.5%) |
| 75 Years and over | 275 (100.0%) | 153 (55.6%) |
| Total | 2,072 (40.9%) | 2,492 (49.2%) |
Disability Status by Sex by Age in Center
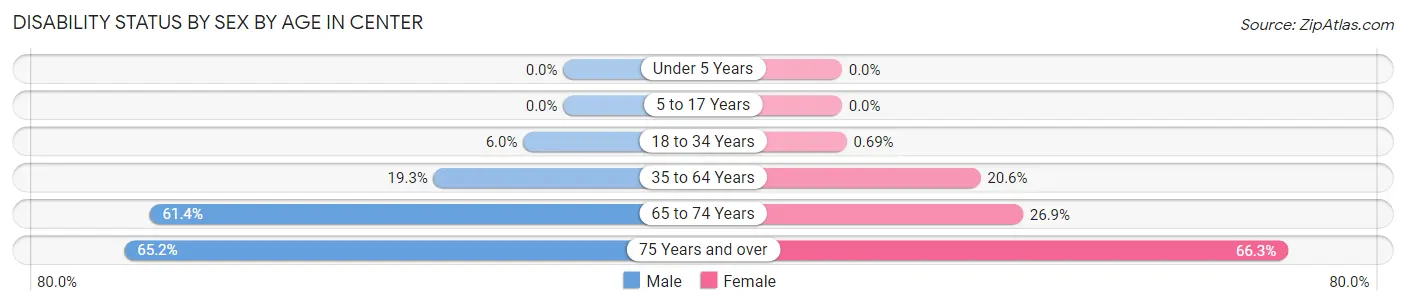
| Age Bracket | Male | Female |
| Under 5 Years | 0 (0.0%) | 0 (0.0%) |
| 5 to 17 Years | 0 (0.0%) | 0 (0.0%) |
| 18 to 34 Years | 29 (5.9%) | 4 (0.7%) |
| 35 to 64 Years | 178 (19.3%) | 186 (20.6%) |
| 65 to 74 Years | 86 (61.4%) | 82 (26.9%) |
| 75 Years and over | 73 (65.2%) | 108 (66.3%) |
Disability Class by Sex by Age in Center
Disability Class: Hearing Difficulty
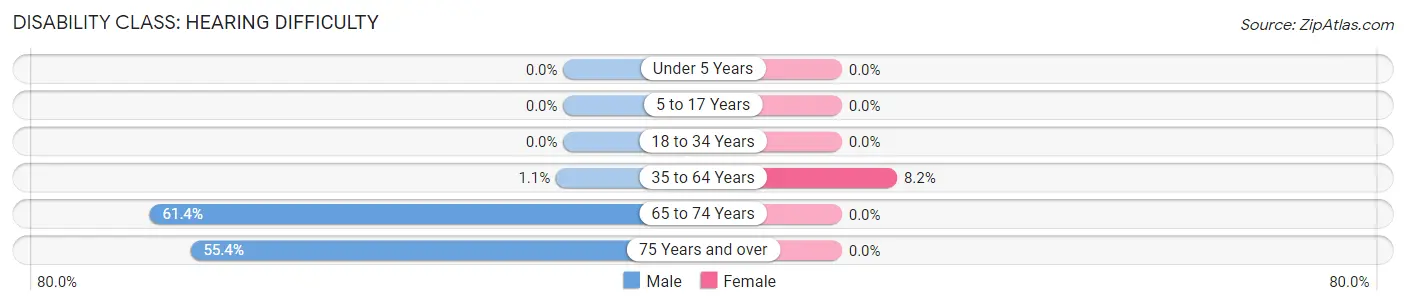
| Age Bracket | Male | Female |
| Under 5 Years | 0 (0.0%) | 0 (0.0%) |
| 5 to 17 Years | 0 (0.0%) | 0 (0.0%) |
| 18 to 34 Years | 0 (0.0%) | 0 (0.0%) |
| 35 to 64 Years | 10 (1.1%) | 74 (8.2%) |
| 65 to 74 Years | 86 (61.4%) | 0 (0.0%) |
| 75 Years and over | 62 (55.4%) | 0 (0.0%) |
Disability Class: Vision Difficulty
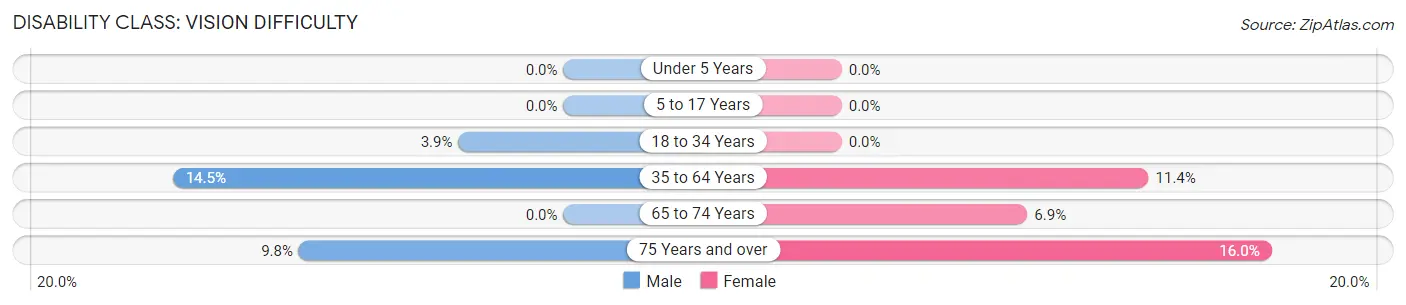
| Age Bracket | Male | Female |
| Under 5 Years | 0 (0.0%) | 0 (0.0%) |
| 5 to 17 Years | 0 (0.0%) | 0 (0.0%) |
| 18 to 34 Years | 19 (3.9%) | 0 (0.0%) |
| 35 to 64 Years | 134 (14.5%) | 103 (11.4%) |
| 65 to 74 Years | 0 (0.0%) | 21 (6.9%) |
| 75 Years and over | 11 (9.8%) | 26 (16.0%) |
Disability Class: Cognitive Difficulty
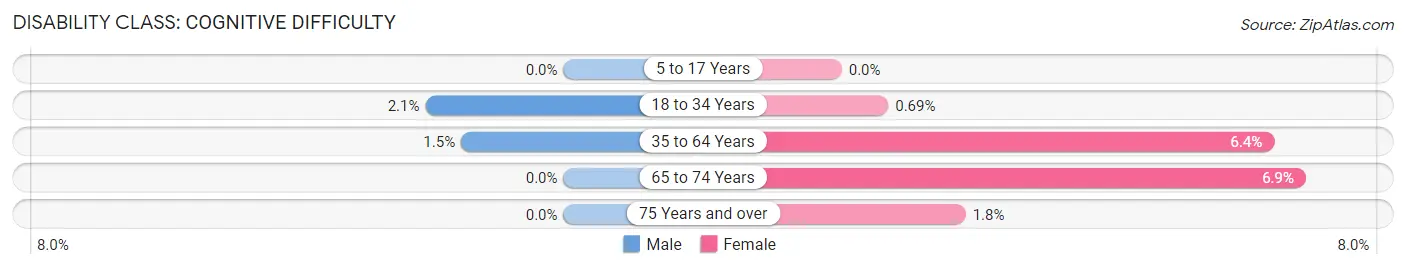
| Age Bracket | Male | Female |
| 5 to 17 Years | 0 (0.0%) | 0 (0.0%) |
| 18 to 34 Years | 10 (2.1%) | 4 (0.7%) |
| 35 to 64 Years | 14 (1.5%) | 58 (6.4%) |
| 65 to 74 Years | 0 (0.0%) | 21 (6.9%) |
| 75 Years and over | 0 (0.0%) | 3 (1.8%) |
Disability Class: Ambulatory Difficulty
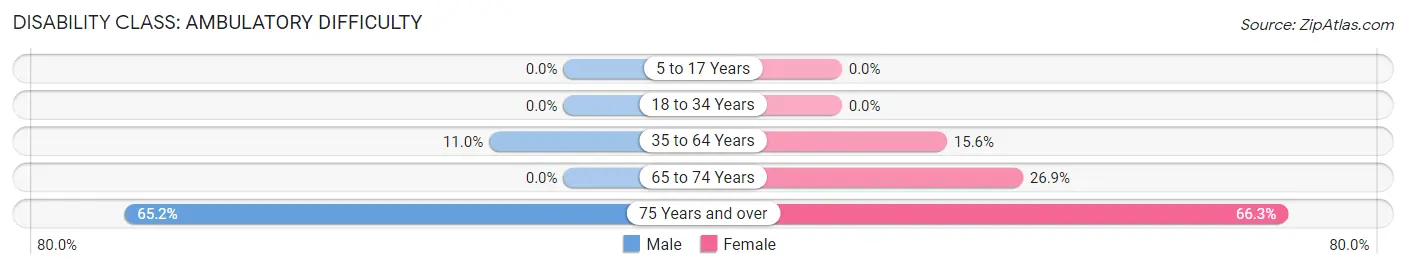
| Age Bracket | Male | Female |
| 5 to 17 Years | 0 (0.0%) | 0 (0.0%) |
| 18 to 34 Years | 0 (0.0%) | 0 (0.0%) |
| 35 to 64 Years | 102 (11.0%) | 141 (15.6%) |
| 65 to 74 Years | 0 (0.0%) | 82 (26.9%) |
| 75 Years and over | 73 (65.2%) | 108 (66.3%) |
Disability Class: Self-Care Difficulty
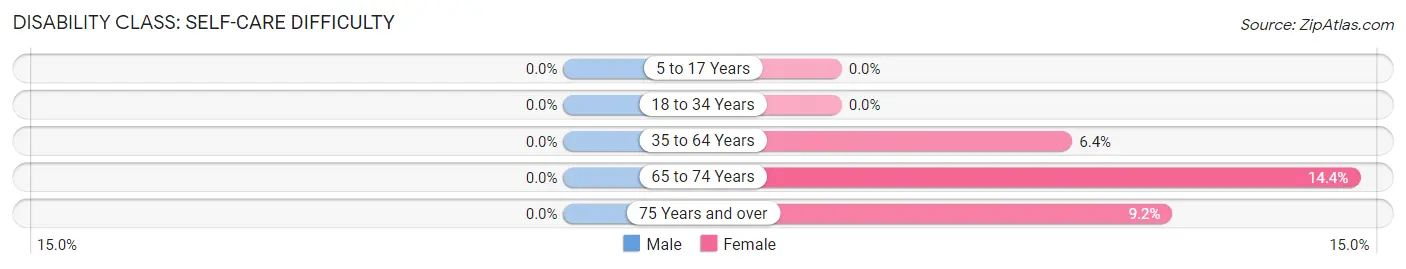
| Age Bracket | Male | Female |
| 5 to 17 Years | 0 (0.0%) | 0 (0.0%) |
| 18 to 34 Years | 0 (0.0%) | 0 (0.0%) |
| 35 to 64 Years | 0 (0.0%) | 58 (6.4%) |
| 65 to 74 Years | 0 (0.0%) | 44 (14.4%) |
| 75 Years and over | 0 (0.0%) | 15 (9.2%) |
Technology Access in Center
Computing Device Access in Center
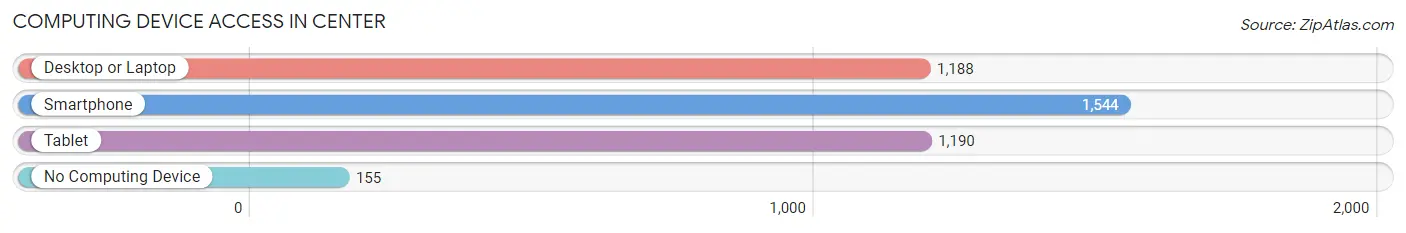
| Device Type | # Households | % Households |
| Desktop or Laptop | 1,188 | 64.1% |
| Smartphone | 1,544 | 83.4% |
| Tablet | 1,190 | 64.2% |
| No Computing Device | 155 | 8.4% |
| Total | 1,852 | 100.0% |
Internet Access in Center
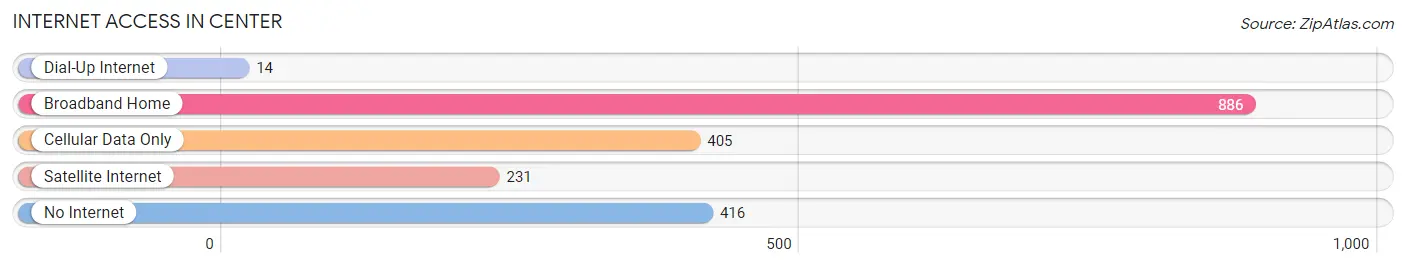
| Internet Type | # Households | % Households |
| Dial-Up Internet | 14 | 0.8% |
| Broadband Home | 886 | 47.8% |
| Cellular Data Only | 405 | 21.9% |
| Satellite Internet | 231 | 12.5% |
| No Internet | 416 | 22.5% |
| Total | 1,852 | 100.0% |
Center Summary
Center, Texas is a small city located in the heart of Shelby County, Texas. It is situated in the Piney Woods region of East Texas, approximately 100 miles north of Houston and 140 miles east of Dallas. The city is home to a population of approximately 5,000 people and is the county seat of Shelby County.
History
The area that is now Center was first settled in the early 1830s by a group of settlers from Alabama. The settlement was originally known as “Cotton Gin” due to the presence of a cotton gin in the area. In 1846, the settlement was renamed “Center” after the center of the county. The city was officially incorporated in 1854 and was designated as the county seat of Shelby County.
In the late 19th century, Center was a thriving agricultural center, with cotton, corn, and other crops being grown in the area. The city was also home to several sawmills and lumber companies. In the early 20th century, the city began to experience a period of growth and development, with the construction of a railroad line and the opening of several businesses.
Geography
Center is located in the Piney Woods region of East Texas, approximately 100 miles north of Houston and 140 miles east of Dallas. The city is situated in the center of Shelby County, and is surrounded by the towns of Joaquin, Tenaha, Timpson, and Garrison. The city is located at the intersection of U.S. Highway 96 and State Highway 7.
The terrain of the area is mostly flat, with some rolling hills in the surrounding area. The climate is humid subtropical, with hot summers and mild winters. The average annual temperature is around 70 degrees Fahrenheit, with an average annual precipitation of around 45 inches.
Economy
The economy of Center is largely based on agriculture and timber. The city is home to several large farms and ranches, as well as several timber companies. The city is also home to several manufacturing companies, including a paper mill and a furniture factory.
The city is also home to several retail stores, restaurants, and other businesses. The city is served by the Center Independent School District, which serves the city and the surrounding area.
Demographics
As of the 2010 census, the population of Center was 5,099. The racial makeup of the city was 79.3% White, 17.2% African American, 0.7% Native American, 0.3% Asian, 0.1% Pacific Islander, 1.2% from other races, and 1.4% from two or more races. Hispanic or Latino of any race were 4.2% of the population.
The median income for a household in the city was $30,938, and the median income for a family was $37,917. The per capita income for the city was $15,945. About 17.2% of families and 20.3% of the population were below the poverty line, including 28.2% of those under age 18 and 14.2% of those age 65 or over.
Center is a small city with a rich history and a diverse economy. The city is home to a variety of businesses, from agriculture and timber to manufacturing and retail. The city is also home to a diverse population, with a variety of racial and ethnic backgrounds. Center is a great place to live, work, and raise a family.
Common Questions
What is Per Capita Income in Center?
Per Capita income in Center is $27,101.
What is the Median Family Income in Center?
Median Family Income in Center is $52,912.
What is the Median Household income in Center?
Median Household Income in Center is $57,875.
What is Income or Wage Gap in Center?
Income or Wage Gap in Center is 60.4%.
Women in Center earn 39.6 cents for every dollar earned by a man.
What is Inequality or Gini Index in Center?
Inequality or Gini Index in Center is 0.46.
What is the Total Population of Center?
Total Population of Center is 5,221.
What is the Total Male Population of Center?
Total Male Population of Center is 2,544.
What is the Total Female Population of Center?
Total Female Population of Center is 2,677.
What is the Ratio of Males per 100 Females in Center?
There are 95.03 Males per 100 Females in Center.
What is the Ratio of Females per 100 Males in Center?
There are 105.23 Females per 100 Males in Center.
What is the Median Population Age in Center?
Median Population Age in Center is 38.2 Years.
What is the Average Family Size in Center
Average Family Size in Center is 3.1 People.
What is the Average Household Size in Center
Average Household Size in Center is 2.7 People.
How Large is the Labor Force in Center?
There are 2,507 People in the Labor Forcein in Center.
What is the Percentage of People in the Labor Force in Center?
62.8% of People are in the Labor Force in Center.
What is the Unemployment Rate in Center?
Unemployment Rate in Center is 3.6%.