Cedar Hill, TX Map & Demographics
Cedar Hill Map
Cedar Hill Overview
$35,280
PER CAPITA INCOME
$98,413
AVG FAMILY INCOME
$84,132
AVG HOUSEHOLD INCOME
15.4%
WAGE / INCOME GAP [ % ]
84.6¢/ $1
WAGE / INCOME GAP [ $ ]
$10,862
FAMILY INCOME DEFICIT
0.41
INEQUALITY / GINI INDEX
48,733
TOTAL POPULATION
23,522
MALE POPULATION
25,211
FEMALE POPULATION
93.30
MALES / 100 FEMALES
107.18
FEMALES / 100 MALES
35.3
MEDIAN AGE
3.6
AVG FAMILY SIZE
3.0
AVG HOUSEHOLD SIZE
25,650
LABOR FORCE [ PEOPLE ]
69.7%
PERCENT IN LABOR FORCE
6.9%
UNEMPLOYMENT RATE
Cedar Hill Zip Codes
Income in Cedar Hill
Income Overview in Cedar Hill
Per Capita Income in Cedar Hill is $35,280, while median incomes of families and households are $98,413 and $84,132 respectively.
| Characteristic | Number | Measure |
| Per Capita Income | 48,733 | $35,280 |
| Median Family Income | 11,652 | $98,413 |
| Mean Family Income | 11,652 | $116,644 |
| Median Household Income | 16,071 | $84,132 |
| Mean Household Income | 16,071 | $103,851 |
| Income Deficit | 11,652 | $10,862 |
| Wage / Income Gap (%) | 48,733 | 15.36% |
| Wage / Income Gap ($) | 48,733 | 84.64¢ per $1 |
| Gini / Inequality Index | 48,733 | 0.41 |
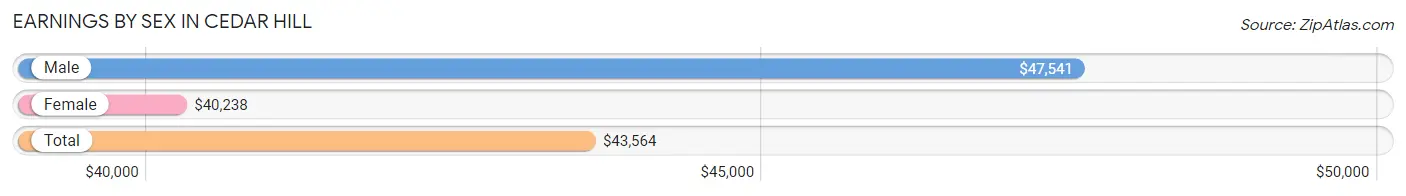
Earnings by Sex in Cedar Hill
Average Earnings in Cedar Hill are $43,564, $47,541 for men and $40,238 for women, a difference of 15.4%.
| Sex | Number | Average Earnings |
| Male | 12,912 (47.9%) | $47,541 |
| Female | 14,028 (52.1%) | $40,238 |
| Total | 26,940 (100.0%) | $43,564 |
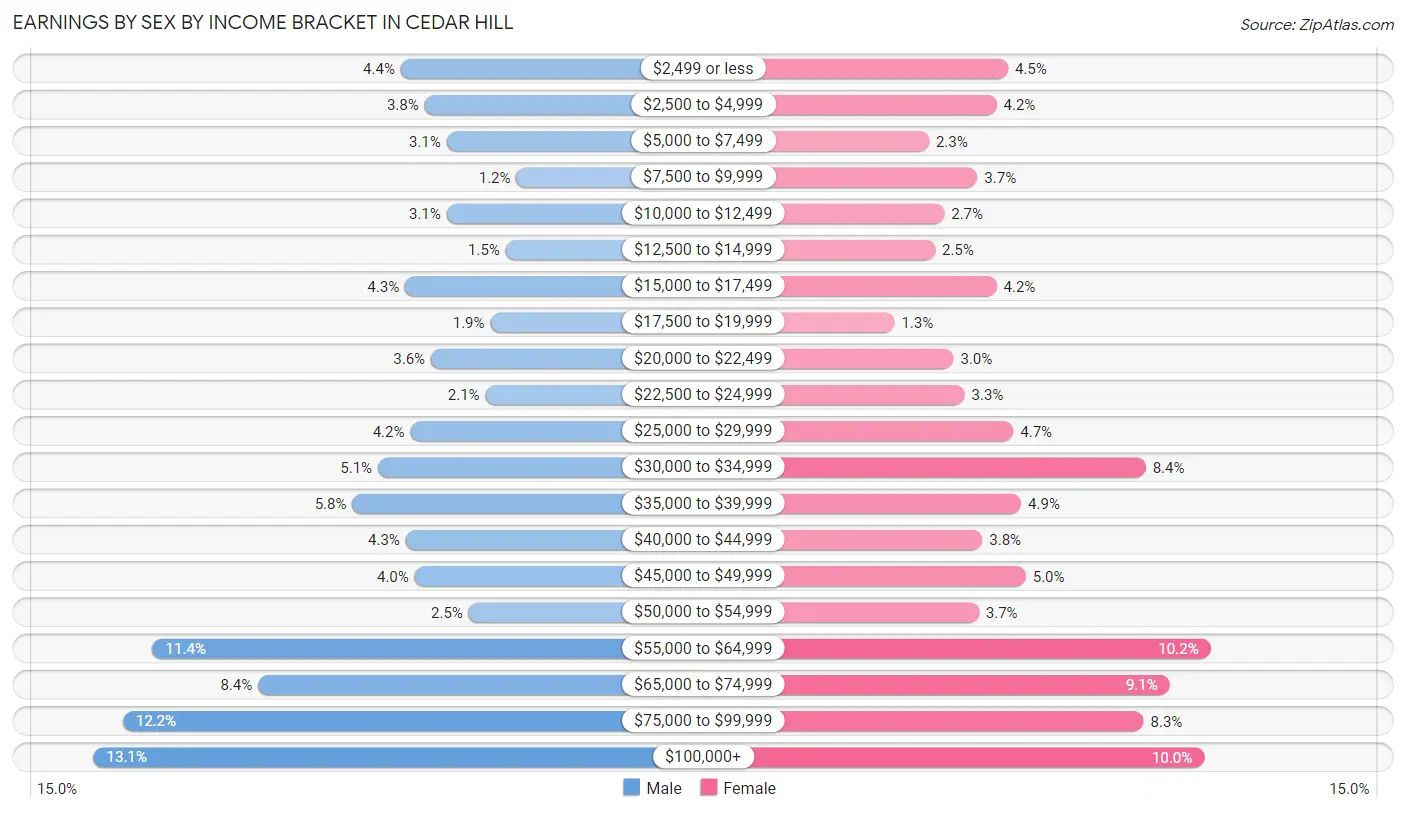
Earnings by Sex by Income Bracket in Cedar Hill
The most common earnings brackets in Cedar Hill are $100,000+ for men (1,686 | 13.1%) and $55,000 to $64,999 for women (1,433 | 10.2%).
| Income | Male | Female |
| $2,499 or less | 572 (4.4%) | 636 (4.5%) |
| $2,500 to $4,999 | 486 (3.8%) | 591 (4.2%) |
| $5,000 to $7,499 | 406 (3.1%) | 324 (2.3%) |
| $7,500 to $9,999 | 152 (1.2%) | 515 (3.7%) |
| $10,000 to $12,499 | 406 (3.1%) | 384 (2.7%) |
| $12,500 to $14,999 | 191 (1.5%) | 348 (2.5%) |
| $15,000 to $17,499 | 556 (4.3%) | 591 (4.2%) |
| $17,500 to $19,999 | 247 (1.9%) | 188 (1.3%) |
| $20,000 to $22,499 | 462 (3.6%) | 421 (3.0%) |
| $22,500 to $24,999 | 265 (2.1%) | 464 (3.3%) |
| $25,000 to $29,999 | 537 (4.2%) | 656 (4.7%) |
| $30,000 to $34,999 | 654 (5.1%) | 1,179 (8.4%) |
| $35,000 to $39,999 | 748 (5.8%) | 688 (4.9%) |
| $40,000 to $44,999 | 554 (4.3%) | 534 (3.8%) |
| $45,000 to $49,999 | 522 (4.0%) | 705 (5.0%) |
| $50,000 to $54,999 | 326 (2.5%) | 520 (3.7%) |
| $55,000 to $64,999 | 1,472 (11.4%) | 1,433 (10.2%) |
| $65,000 to $74,999 | 1,090 (8.4%) | 1,272 (9.1%) |
| $75,000 to $99,999 | 1,580 (12.2%) | 1,170 (8.3%) |
| $100,000+ | 1,686 (13.1%) | 1,409 (10.0%) |
| Total | 12,912 (100.0%) | 14,028 (100.0%) |
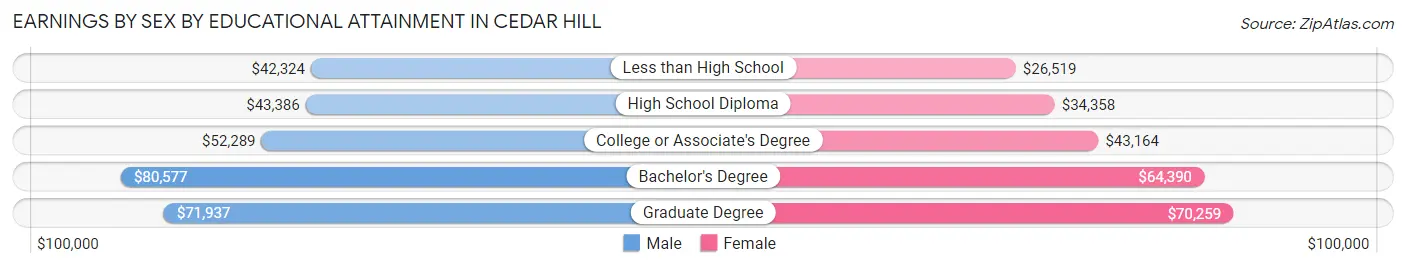
Earnings by Sex by Educational Attainment in Cedar Hill
Average earnings in Cedar Hill are $56,113 for men and $46,614 for women, a difference of 16.9%. Men with an educational attainment of bachelor's degree enjoy the highest average annual earnings of $80,577, while those with less than high school education earn the least with $42,324. Women with an educational attainment of graduate degree earn the most with the average annual earnings of $70,259, while those with less than high school education have the smallest earnings of $26,519.
| Educational Attainment | Male Income | Female Income |
| Less than High School | $42,324 | $26,519 |
| High School Diploma | $43,386 | $34,358 |
| College or Associate's Degree | $52,289 | $43,164 |
| Bachelor's Degree | $80,577 | $64,390 |
| Graduate Degree | $71,937 | $70,259 |
| Total | $56,113 | $46,614 |
Family Income in Cedar Hill
Family Income Brackets in Cedar Hill
According to the Cedar Hill family income data, there are 2,925 families falling into the $100,000 to $149,999 income range, which is the most common income bracket and makes up 25.1% of all families. Conversely, the $10,000 to $14,999 income bracket is the least frequent group with only 151 families (1.3%) belonging to this category.
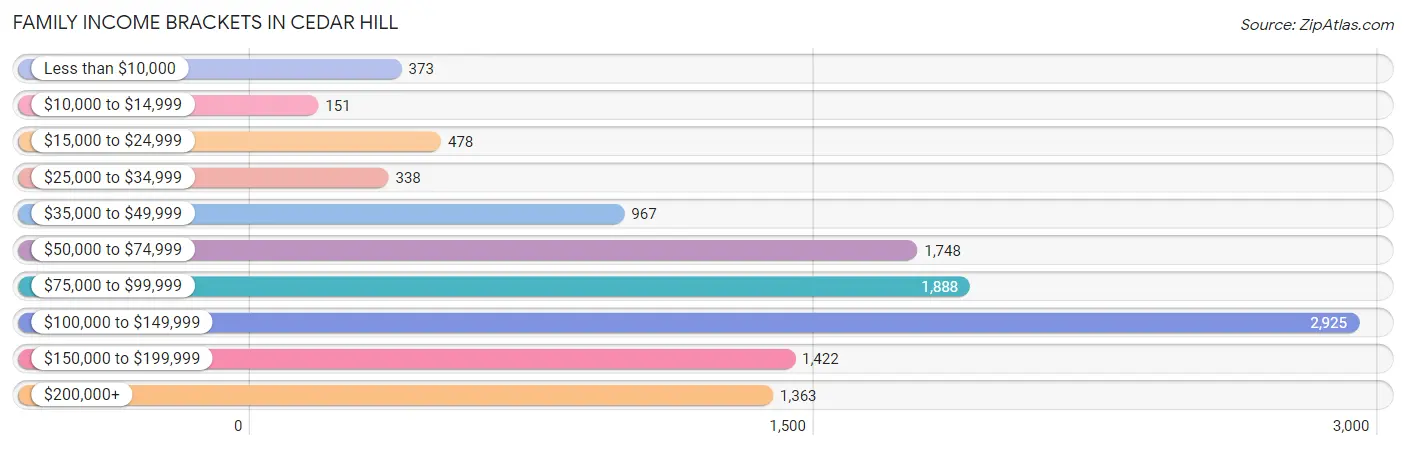
| Income Bracket | # Families | % Families |
| Less than $10,000 | 373 | 3.2% |
| $10,000 to $14,999 | 151 | 1.3% |
| $15,000 to $24,999 | 478 | 4.1% |
| $25,000 to $34,999 | 338 | 2.9% |
| $35,000 to $49,999 | 967 | 8.3% |
| $50,000 to $74,999 | 1,748 | 15.0% |
| $75,000 to $99,999 | 1,888 | 16.2% |
| $100,000 to $149,999 | 2,925 | 25.1% |
| $150,000 to $199,999 | 1,422 | 12.2% |
| $200,000+ | 1,363 | 11.7% |
Family Income by Famaliy Size in Cedar Hill
4-person families (2,248 | 19.3%) account for the highest median family income in Cedar Hill with $123,816 per family, while 2-person families (4,312 | 37.0%) have the highest median income of $44,648 per family member.
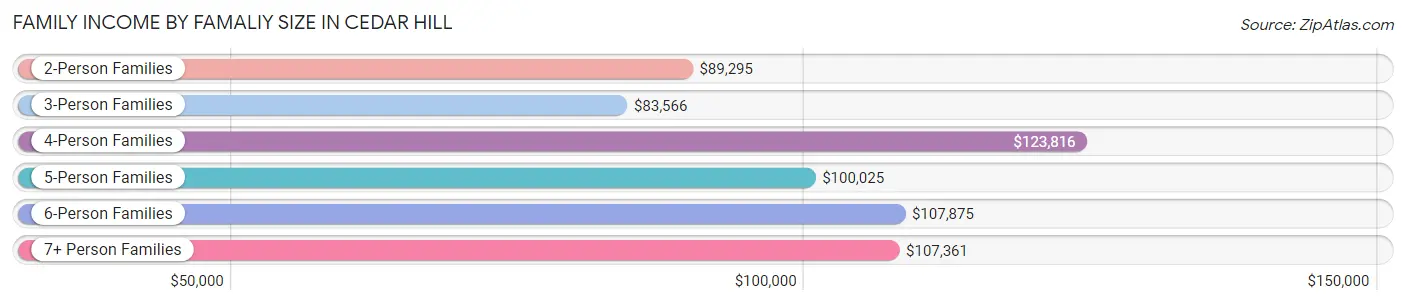
| Income Bracket | # Families | Median Income |
| 2-Person Families | 4,312 (37.0%) | $89,295 |
| 3-Person Families | 2,958 (25.4%) | $83,566 |
| 4-Person Families | 2,248 (19.3%) | $123,816 |
| 5-Person Families | 1,096 (9.4%) | $100,025 |
| 6-Person Families | 678 (5.8%) | $107,875 |
| 7+ Person Families | 360 (3.1%) | $107,361 |
| Total | 11,652 (100.0%) | $98,413 |
Family Income by Number of Earners in Cedar Hill
The median family income in Cedar Hill is $98,413, with families comprising 3+ earners (2,285) having the highest median family income of $136,375, while families with no earners (863) have the lowest median family income of $44,441, accounting for 19.6% and 7.4% of families, respectively.
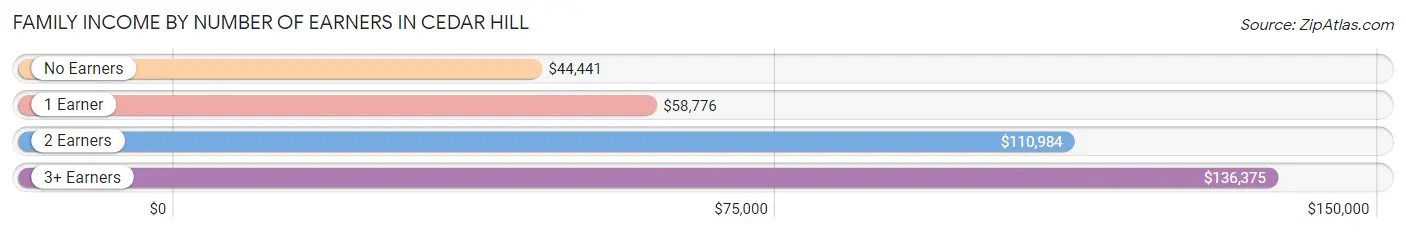
| Number of Earners | # Families | Median Income |
| No Earners | 863 (7.4%) | $44,441 |
| 1 Earner | 3,407 (29.2%) | $58,776 |
| 2 Earners | 5,097 (43.7%) | $110,984 |
| 3+ Earners | 2,285 (19.6%) | $136,375 |
| Total | 11,652 (100.0%) | $98,413 |
Household Income in Cedar Hill
Household Income Brackets in Cedar Hill
With 3,391 households falling in the category, the $100,000 to $149,999 income range is the most frequent in Cedar Hill, accounting for 21.1% of all households. In contrast, only 321 households (2.0%) fall into the $10,000 to $14,999 income bracket, making it the least populous group.
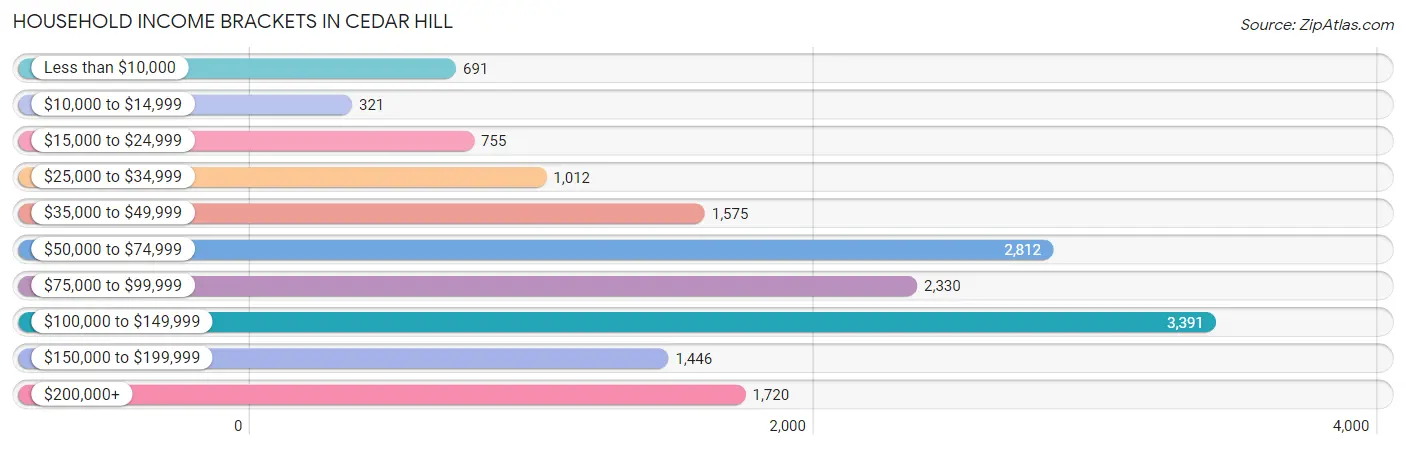
| Income Bracket | # Households | % Households |
| Less than $10,000 | 691 | 4.3% |
| $10,000 to $14,999 | 321 | 2.0% |
| $15,000 to $24,999 | 755 | 4.7% |
| $25,000 to $34,999 | 1,012 | 6.3% |
| $35,000 to $49,999 | 1,575 | 9.8% |
| $50,000 to $74,999 | 2,812 | 17.5% |
| $75,000 to $99,999 | 2,330 | 14.5% |
| $100,000 to $149,999 | 3,391 | 21.1% |
| $150,000 to $199,999 | 1,446 | 9.0% |
| $200,000+ | 1,720 | 10.7% |
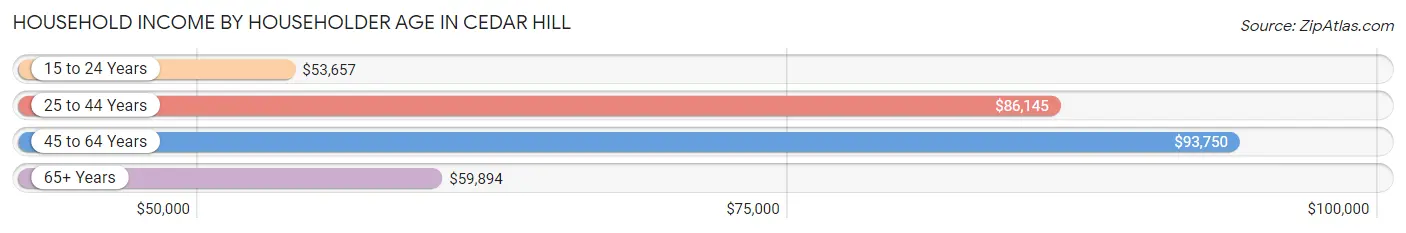
Household Income by Householder Age in Cedar Hill
The median household income in Cedar Hill is $84,132, with the highest median household income of $93,750 found in the 45 to 64 years age bracket for the primary householder. A total of 7,496 households (46.6%) fall into this category. Meanwhile, the 15 to 24 years age bracket for the primary householder has the lowest median household income of $53,657, with 189 households (1.2%) in this group.
| Income Bracket | # Households | Median Income |
| 15 to 24 Years | 189 (1.2%) | $53,657 |
| 25 to 44 Years | 5,568 (34.6%) | $86,145 |
| 45 to 64 Years | 7,496 (46.6%) | $93,750 |
| 65+ Years | 2,818 (17.5%) | $59,894 |
| Total | 16,071 (100.0%) | $84,132 |
Poverty in Cedar Hill
Income Below Poverty by Sex and Age in Cedar Hill
With 11.4% poverty level for males and 8.4% for females among the residents of Cedar Hill, 6 to 11 year old males and 5 year old females are the most vulnerable to poverty, with 688 males (29.9%) and 112 females (20.8%) in their respective age groups living below the poverty level.
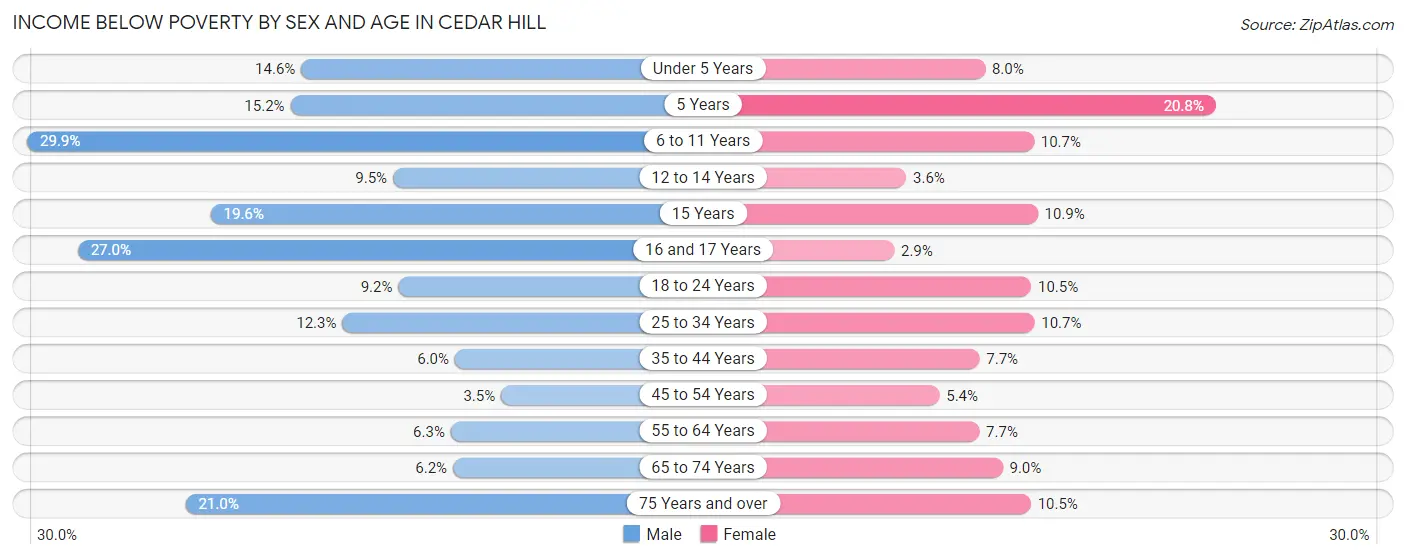
| Age Bracket | Male | Female |
| Under 5 Years | 202 (14.6%) | 108 (8.0%) |
| 5 Years | 64 (15.2%) | 112 (20.8%) |
| 6 to 11 Years | 688 (29.9%) | 214 (10.7%) |
| 12 to 14 Years | 141 (9.5%) | 47 (3.6%) |
| 15 Years | 77 (19.6%) | 34 (10.9%) |
| 16 and 17 Years | 222 (27.0%) | 23 (2.9%) |
| 18 to 24 Years | 223 (9.2%) | 191 (10.5%) |
| 25 to 34 Years | 334 (12.3%) | 374 (10.7%) |
| 35 to 44 Years | 162 (6.0%) | 279 (7.7%) |
| 45 to 54 Years | 117 (3.5%) | 177 (5.4%) |
| 55 to 64 Years | 156 (6.3%) | 282 (7.6%) |
| 65 to 74 Years | 119 (6.1%) | 195 (8.9%) |
| 75 Years and over | 121 (21.0%) | 63 (10.5%) |
| Total | 2,626 (11.4%) | 2,099 (8.4%) |
Income Above Poverty by Sex and Age in Cedar Hill
According to the poverty statistics in Cedar Hill, males aged 45 to 54 years and females aged 16 and 17 years are the age groups that are most secure financially, with 96.5% of males and 97.1% of females in these age groups living above the poverty line.

| Age Bracket | Male | Female |
| Under 5 Years | 1,182 (85.4%) | 1,247 (92.0%) |
| 5 Years | 357 (84.8%) | 426 (79.2%) |
| 6 to 11 Years | 1,616 (70.1%) | 1,788 (89.3%) |
| 12 to 14 Years | 1,345 (90.5%) | 1,266 (96.4%) |
| 15 Years | 315 (80.4%) | 278 (89.1%) |
| 16 and 17 Years | 599 (73.0%) | 767 (97.1%) |
| 18 to 24 Years | 2,204 (90.8%) | 1,622 (89.5%) |
| 25 to 34 Years | 2,380 (87.7%) | 3,115 (89.3%) |
| 35 to 44 Years | 2,521 (94.0%) | 3,361 (92.3%) |
| 45 to 54 Years | 3,257 (96.5%) | 3,082 (94.6%) |
| 55 to 64 Years | 2,334 (93.7%) | 3,403 (92.3%) |
| 65 to 74 Years | 1,815 (93.9%) | 1,983 (91.0%) |
| 75 Years and over | 454 (79.0%) | 536 (89.5%) |
| Total | 20,379 (88.6%) | 22,874 (91.6%) |
Income Below Poverty Among Married-Couple Families in Cedar Hill
The poverty statistics for married-couple families in Cedar Hill show that 4.4% or 369 of the total 8,333 families live below the poverty line. Families with 3 or 4 children have the highest poverty rate of 5.8%, comprising of 56 families. On the other hand, families with 1 or 2 children have the lowest poverty rate of 4.0%, which includes 109 families.
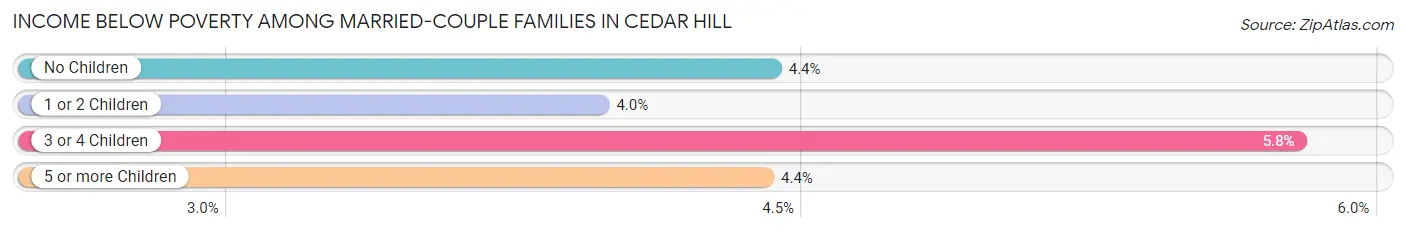
| Children | Above Poverty | Below Poverty |
| No Children | 4,325 (95.6%) | 200 (4.4%) |
| 1 or 2 Children | 2,640 (96.0%) | 109 (4.0%) |
| 3 or 4 Children | 912 (94.2%) | 56 (5.8%) |
| 5 or more Children | 87 (95.6%) | 4 (4.4%) |
| Total | 7,964 (95.6%) | 369 (4.4%) |
Income Below Poverty Among Single-Parent Households in Cedar Hill
According to the poverty data in Cedar Hill, 29.8% or 256 single-father households and 15.6% or 383 single-mother households are living below the poverty line. Among single-father households, those with 1 or 2 children have the highest poverty rate, with 235 households (36.3%) experiencing poverty. Likewise, among single-mother households, those with 5 or more children have the highest poverty rate, with 56 households (100.0%) falling below the poverty line.
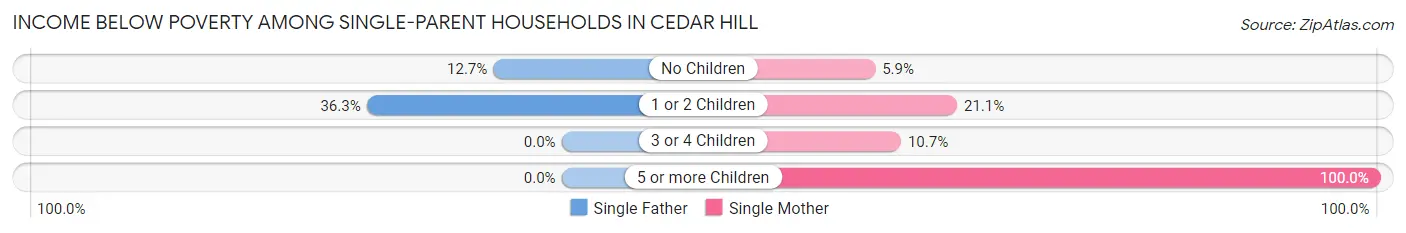
| Children | Single Father | Single Mother |
| No Children | 21 (12.7%) | 55 (5.9%) |
| 1 or 2 Children | 235 (36.3%) | 233 (21.1%) |
| 3 or 4 Children | 0 (0.0%) | 39 (10.7%) |
| 5 or more Children | 0 (0.0%) | 56 (100.0%) |
| Total | 256 (29.8%) | 383 (15.6%) |
Income Below Poverty Among Married-Couple vs Single-Parent Households in Cedar Hill
The poverty data for Cedar Hill shows that 369 of the married-couple family households (4.4%) and 639 of the single-parent households (19.3%) are living below the poverty level. Within the married-couple family households, those with 3 or 4 children have the highest poverty rate, with 56 households (5.8%) falling below the poverty line. Among the single-parent households, those with 5 or more children have the highest poverty rate, with 56 household (100.0%) living below poverty.
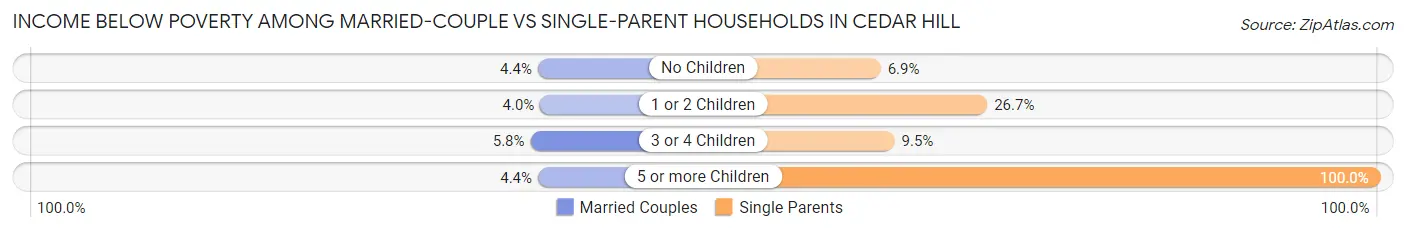
| Children | Married-Couple Families | Single-Parent Households |
| No Children | 200 (4.4%) | 76 (6.9%) |
| 1 or 2 Children | 109 (4.0%) | 468 (26.7%) |
| 3 or 4 Children | 56 (5.8%) | 39 (9.5%) |
| 5 or more Children | 4 (4.4%) | 56 (100.0%) |
| Total | 369 (4.4%) | 639 (19.3%) |
Race in Cedar Hill
The most populous races in Cedar Hill are Black / African American (24,504 | 50.3%), White / Caucasian (15,457 | 31.7%), and Hispanic or Latino (12,889 | 26.5%).
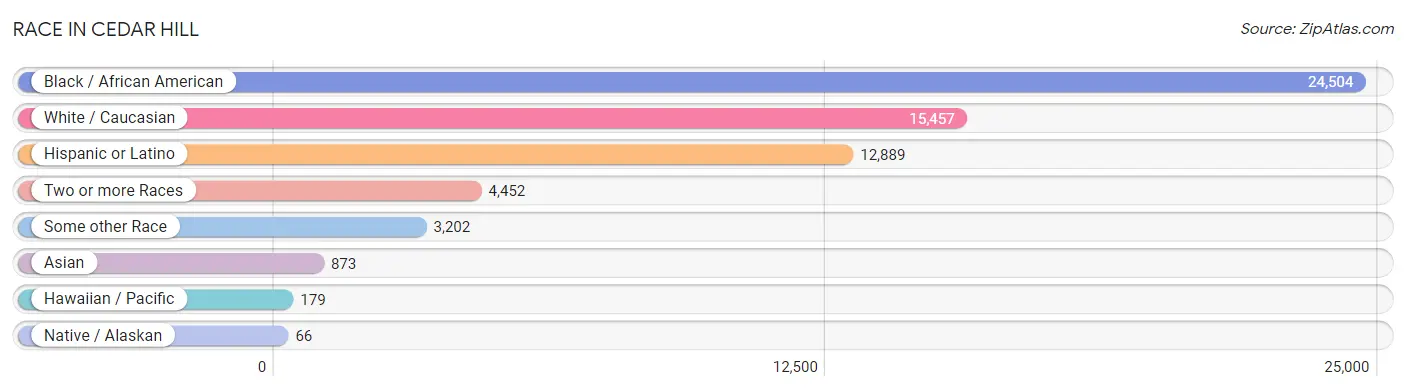
| Race | # Population | % Population |
| Asian | 873 | 1.8% |
| Black / African American | 24,504 | 50.3% |
| Hawaiian / Pacific | 179 | 0.4% |
| Hispanic or Latino | 12,889 | 26.5% |
| Native / Alaskan | 66 | 0.1% |
| White / Caucasian | 15,457 | 31.7% |
| Two or more Races | 4,452 | 9.1% |
| Some other Race | 3,202 | 6.6% |
| Total | 48,733 | 100.0% |
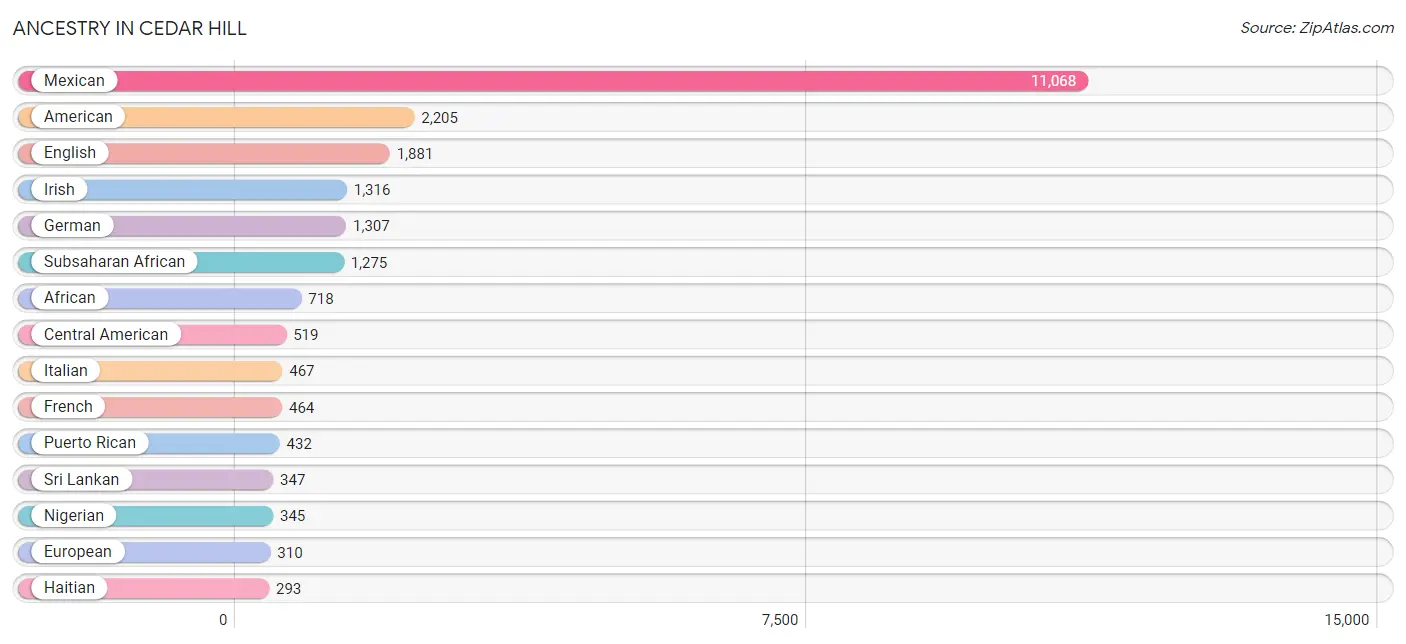
Ancestry in Cedar Hill
The most populous ancestries reported in Cedar Hill are Mexican (11,068 | 22.7%), American (2,205 | 4.5%), English (1,881 | 3.9%), Irish (1,316 | 2.7%), and German (1,307 | 2.7%), together accounting for 36.5% of all Cedar Hill residents.
| Ancestry | # Population | % Population |
| African | 718 | 1.5% |
| Albanian | 9 | 0.0% |
| American | 2,205 | 4.5% |
| Apache | 20 | 0.0% |
| Arab | 32 | 0.1% |
| Argentinean | 42 | 0.1% |
| Armenian | 9 | 0.0% |
| Bangladeshi | 18 | 0.0% |
| Barbadian | 43 | 0.1% |
| Belgian | 32 | 0.1% |
| Belizean | 73 | 0.2% |
| Bhutanese | 66 | 0.1% |
| Blackfeet | 22 | 0.1% |
| Brazilian | 125 | 0.3% |
| British | 175 | 0.4% |
| British West Indian | 86 | 0.2% |
| Burmese | 134 | 0.3% |
| Cajun | 8 | 0.0% |
| Canadian | 76 | 0.2% |
| Central American | 519 | 1.1% |
| Central American Indian | 169 | 0.4% |
| Cherokee | 77 | 0.2% |
| Chickasaw | 81 | 0.2% |
| Chinese | 8 | 0.0% |
| Chippewa | 5 | 0.0% |
| Choctaw | 79 | 0.2% |
| Colombian | 6 | 0.0% |
| Costa Rican | 19 | 0.0% |
| Croatian | 8 | 0.0% |
| Cuban | 135 | 0.3% |
| Czech | 48 | 0.1% |
| Czechoslovakian | 28 | 0.1% |
| Danish | 33 | 0.1% |
| Dominican | 188 | 0.4% |
| Dutch | 57 | 0.1% |
| Eastern European | 27 | 0.1% |
| Ecuadorian | 47 | 0.1% |
| English | 1,881 | 3.9% |
| Ethiopian | 160 | 0.3% |
| European | 310 | 0.6% |
| Finnish | 14 | 0.0% |
| French | 464 | 0.9% |
| French Canadian | 61 | 0.1% |
| German | 1,307 | 2.7% |
| Ghanaian | 157 | 0.3% |
| Greek | 21 | 0.0% |
| Guamanian / Chamorro | 199 | 0.4% |
| Guatemalan | 21 | 0.0% |
| Haitian | 293 | 0.6% |
| Honduran | 201 | 0.4% |
| Hungarian | 16 | 0.0% |
| Indian (Asian) | 3 | 0.0% |
| Iranian | 10 | 0.0% |
| Irish | 1,316 | 2.7% |
| Iroquois | 36 | 0.1% |
| Italian | 467 | 1.0% |
| Jamaican | 21 | 0.0% |
| Japanese | 6 | 0.0% |
| Korean | 253 | 0.5% |
| Lithuanian | 49 | 0.1% |
| Lumbee | 27 | 0.1% |
| Malaysian | 20 | 0.0% |
| Mexican | 11,068 | 22.7% |
| Mexican American Indian | 40 | 0.1% |
| Navajo | 16 | 0.0% |
| Nicaraguan | 39 | 0.1% |
| Nigerian | 345 | 0.7% |
| Northern European | 61 | 0.1% |
| Norwegian | 168 | 0.3% |
| Pakistani | 134 | 0.3% |
| Palestinian | 32 | 0.1% |
| Pennsylvania German | 54 | 0.1% |
| Peruvian | 76 | 0.2% |
| Polish | 210 | 0.4% |
| Portuguese | 21 | 0.0% |
| Puerto Rican | 432 | 0.9% |
| Romanian | 26 | 0.1% |
| Russian | 49 | 0.1% |
| Salvadoran | 239 | 0.5% |
| Samoan | 15 | 0.0% |
| Scotch-Irish | 118 | 0.2% |
| Scottish | 195 | 0.4% |
| Slovak | 5 | 0.0% |
| South American | 171 | 0.4% |
| Spaniard | 67 | 0.1% |
| Spanish | 71 | 0.2% |
| Spanish American Indian | 103 | 0.2% |
| Sri Lankan | 347 | 0.7% |
| Subsaharan African | 1,275 | 2.6% |
| Swedish | 131 | 0.3% |
| Swiss | 36 | 0.1% |
| Thai | 93 | 0.2% |
| Ukrainian | 54 | 0.1% |
| Welsh | 169 | 0.4% |
| West Indian | 85 | 0.2% |
| Zimbabwean | 18 | 0.0% | View All 96 Rows |
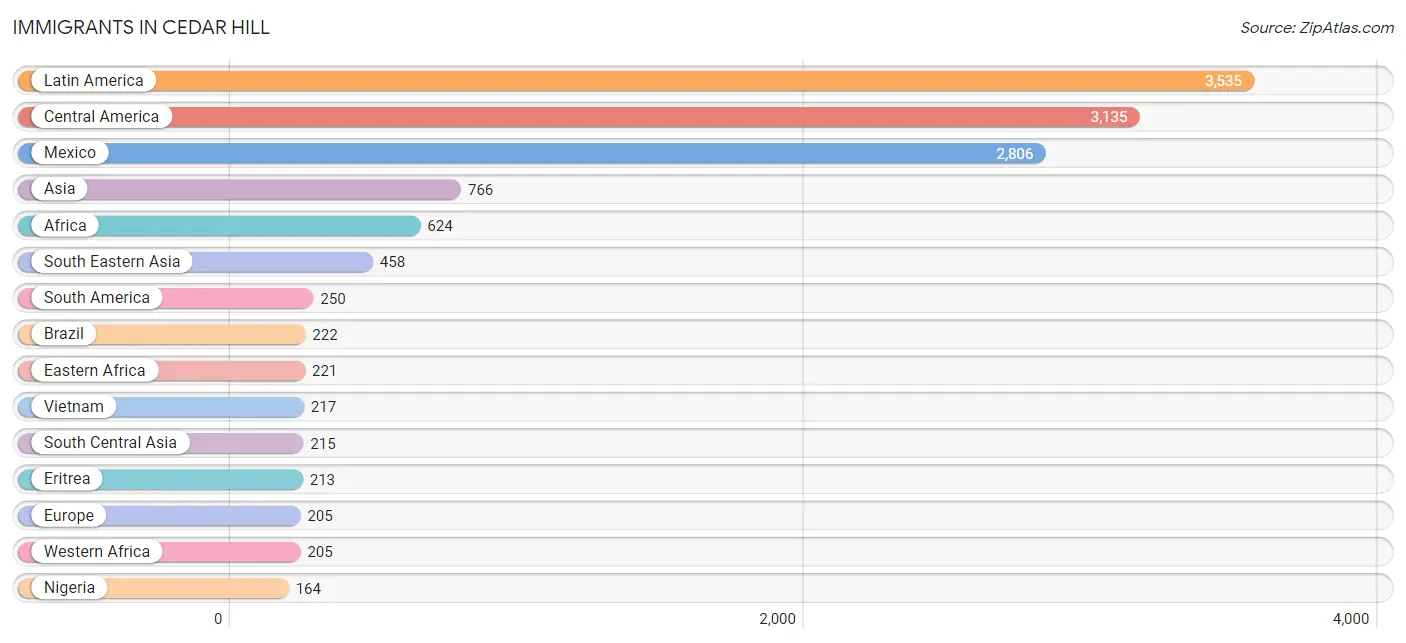
Immigrants in Cedar Hill
The most numerous immigrant groups reported in Cedar Hill came from Latin America (3,535 | 7.2%), Central America (3,135 | 6.4%), Mexico (2,806 | 5.8%), Asia (766 | 1.6%), and Africa (624 | 1.3%), together accounting for 22.3% of all Cedar Hill residents.
| Immigration Origin | # Population | % Population |
| Africa | 624 | 1.3% |
| Asia | 766 | 1.6% |
| Bangladesh | 6 | 0.0% |
| Belgium | 8 | 0.0% |
| Belize | 30 | 0.1% |
| Brazil | 222 | 0.5% |
| Cambodia | 6 | 0.0% |
| Canada | 78 | 0.2% |
| Caribbean | 150 | 0.3% |
| Central America | 3,135 | 6.4% |
| Congo | 28 | 0.1% |
| Cuba | 91 | 0.2% |
| Eastern Africa | 221 | 0.4% |
| Eastern Asia | 69 | 0.1% |
| Eastern Europe | 61 | 0.1% |
| El Salvador | 132 | 0.3% |
| Eritrea | 213 | 0.4% |
| Europe | 205 | 0.4% |
| Germany | 78 | 0.2% |
| Ghana | 31 | 0.1% |
| Guatemala | 16 | 0.0% |
| Honduras | 101 | 0.2% |
| India | 114 | 0.2% |
| Italy | 9 | 0.0% |
| Jamaica | 59 | 0.1% |
| Korea | 69 | 0.1% |
| Laos | 20 | 0.0% |
| Latin America | 3,535 | 7.2% |
| Mexico | 2,806 | 5.8% |
| Middle Africa | 47 | 0.1% |
| Nicaragua | 50 | 0.1% |
| Nigeria | 164 | 0.3% |
| Northern Europe | 49 | 0.1% |
| Oceania | 15 | 0.0% |
| Pakistan | 95 | 0.2% |
| Peru | 28 | 0.1% |
| Philippines | 141 | 0.3% |
| Romania | 18 | 0.0% |
| Russia | 43 | 0.1% |
| South America | 250 | 0.5% |
| South Central Asia | 215 | 0.4% |
| South Eastern Asia | 458 | 0.9% |
| Southern Europe | 9 | 0.0% |
| Thailand | 74 | 0.2% |
| Turkey | 9 | 0.0% |
| Vietnam | 217 | 0.4% |
| Western Africa | 205 | 0.4% |
| Western Asia | 9 | 0.0% |
| Western Europe | 86 | 0.2% |
| Zaire | 19 | 0.0% | View All 50 Rows |
Sex and Age in Cedar Hill
Sex and Age in Cedar Hill
The most populous age groups in Cedar Hill are 10 to 14 Years (2,740 | 11.7%) for men and 60 to 64 Years (1,998 | 7.9%) for women.
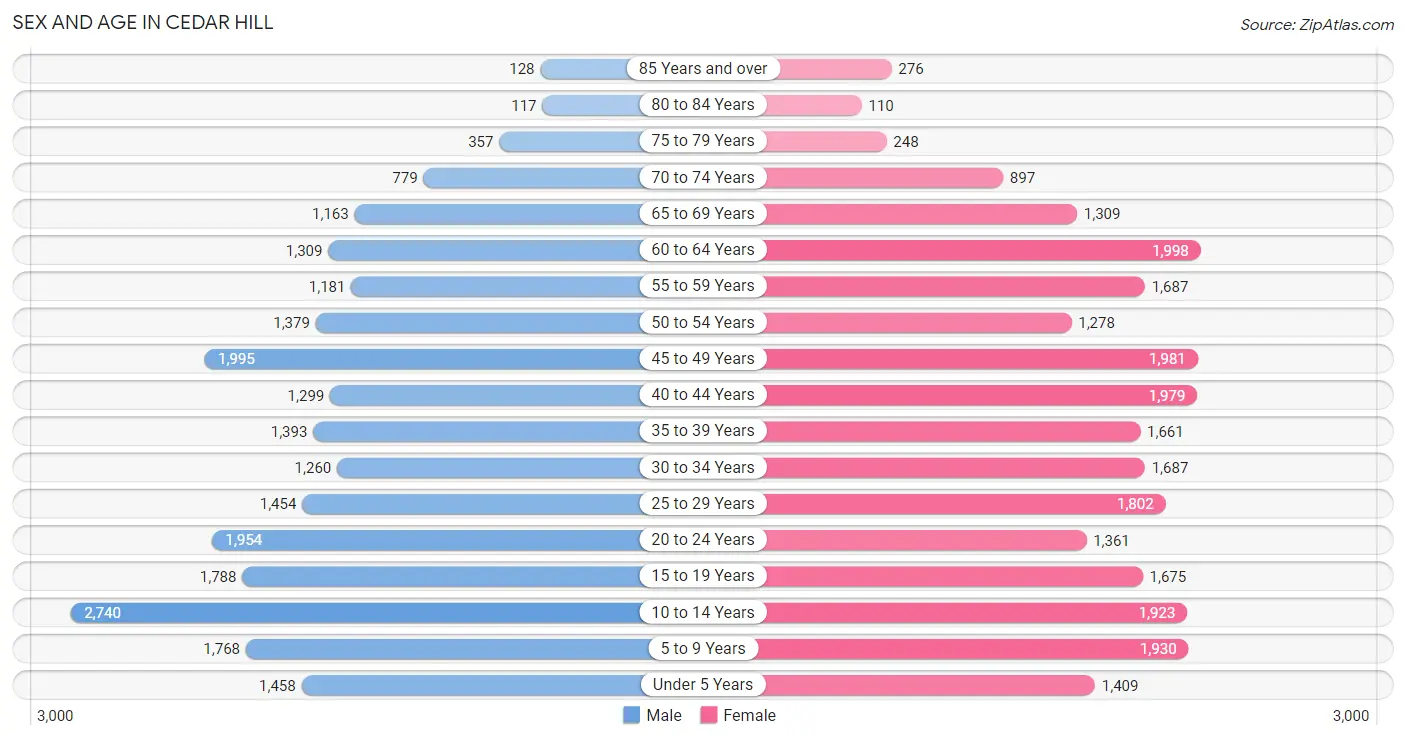
| Age Bracket | Male | Female |
| Under 5 Years | 1,458 (6.2%) | 1,409 (5.6%) |
| 5 to 9 Years | 1,768 (7.5%) | 1,930 (7.7%) |
| 10 to 14 Years | 2,740 (11.7%) | 1,923 (7.6%) |
| 15 to 19 Years | 1,788 (7.6%) | 1,675 (6.6%) |
| 20 to 24 Years | 1,954 (8.3%) | 1,361 (5.4%) |
| 25 to 29 Years | 1,454 (6.2%) | 1,802 (7.1%) |
| 30 to 34 Years | 1,260 (5.4%) | 1,687 (6.7%) |
| 35 to 39 Years | 1,393 (5.9%) | 1,661 (6.6%) |
| 40 to 44 Years | 1,299 (5.5%) | 1,979 (7.9%) |
| 45 to 49 Years | 1,995 (8.5%) | 1,981 (7.9%) |
| 50 to 54 Years | 1,379 (5.9%) | 1,278 (5.1%) |
| 55 to 59 Years | 1,181 (5.0%) | 1,687 (6.7%) |
| 60 to 64 Years | 1,309 (5.6%) | 1,998 (7.9%) |
| 65 to 69 Years | 1,163 (4.9%) | 1,309 (5.2%) |
| 70 to 74 Years | 779 (3.3%) | 897 (3.6%) |
| 75 to 79 Years | 357 (1.5%) | 248 (1.0%) |
| 80 to 84 Years | 117 (0.5%) | 110 (0.4%) |
| 85 Years and over | 128 (0.5%) | 276 (1.1%) |
| Total | 23,522 (100.0%) | 25,211 (100.0%) |
Families and Households in Cedar Hill
Median Family Size in Cedar Hill
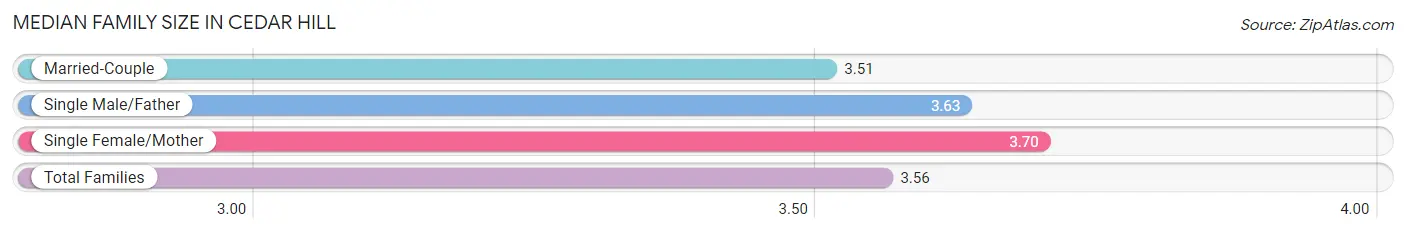
The median family size in Cedar Hill is 3.56 persons per family, with single female/mother families (2,461 | 21.1%) accounting for the largest median family size of 3.7 persons per family. On the other hand, married-couple families (8,333 | 71.5%) represent the smallest median family size with 3.51 persons per family.
| Family Type | # Families | Family Size |
| Married-Couple | 8,333 (71.5%) | 3.51 |
| Single Male/Father | 858 (7.4%) | 3.63 |
| Single Female/Mother | 2,461 (21.1%) | 3.70 |
| Total Families | 11,652 (100.0%) | 3.56 |
Median Household Size in Cedar Hill
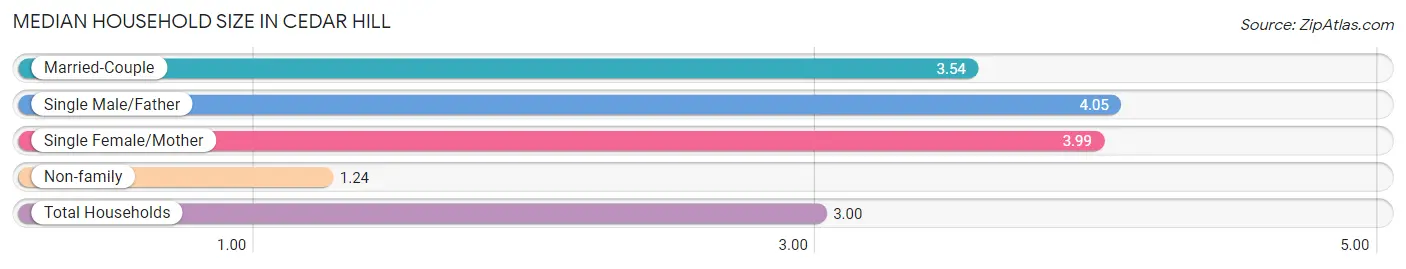
The median household size in Cedar Hill is 3.00 persons per household, with single male/father households (858 | 5.3%) accounting for the largest median household size of 4.05 persons per household. non-family households (4,419 | 27.5%) represent the smallest median household size with 1.24 persons per household.
| Household Type | # Households | Household Size |
| Married-Couple | 8,333 (51.8%) | 3.54 |
| Single Male/Father | 858 (5.3%) | 4.05 |
| Single Female/Mother | 2,461 (15.3%) | 3.99 |
| Non-family | 4,419 (27.5%) | 1.24 |
| Total Households | 16,071 (100.0%) | 3.00 |
Household Size by Marriage Status in Cedar Hill
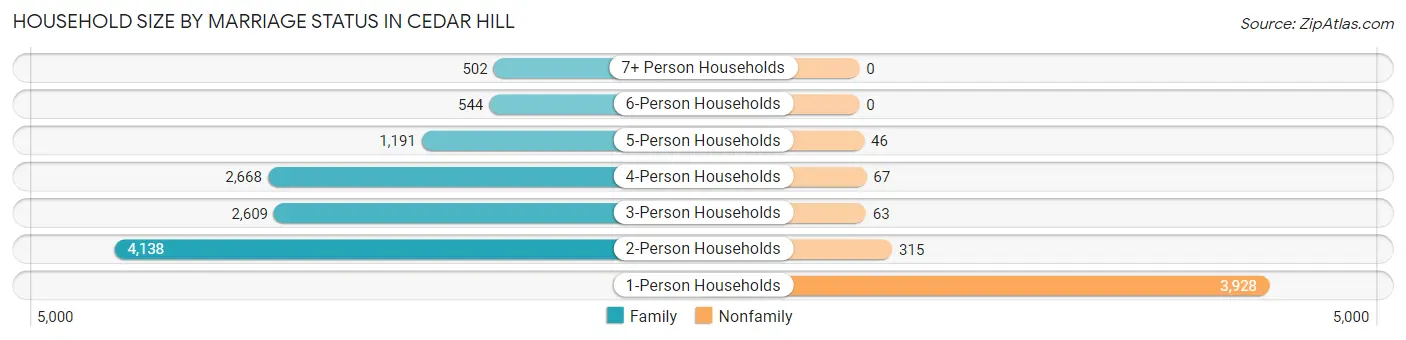
Out of a total of 16,071 households in Cedar Hill, 11,652 (72.5%) are family households, while 4,419 (27.5%) are nonfamily households. The most numerous type of family households are 2-person households, comprising 4,138, and the most common type of nonfamily households are 1-person households, comprising 3,928.
| Household Size | Family Households | Nonfamily Households |
| 1-Person Households | - | 3,928 (24.4%) |
| 2-Person Households | 4,138 (25.8%) | 315 (2.0%) |
| 3-Person Households | 2,609 (16.2%) | 63 (0.4%) |
| 4-Person Households | 2,668 (16.6%) | 67 (0.4%) |
| 5-Person Households | 1,191 (7.4%) | 46 (0.3%) |
| 6-Person Households | 544 (3.4%) | 0 (0.0%) |
| 7+ Person Households | 502 (3.1%) | 0 (0.0%) |
| Total | 11,652 (72.5%) | 4,419 (27.5%) |
Female Fertility in Cedar Hill
Fertility by Age in Cedar Hill
Average fertility rate in Cedar Hill is 52.0 births per 1,000 women. Women in the age bracket of 20 to 34 years have the highest fertility rate with 98.0 births per 1,000 women. Women in the age bracket of 20 to 34 years acount for 73.2% of all women with births.
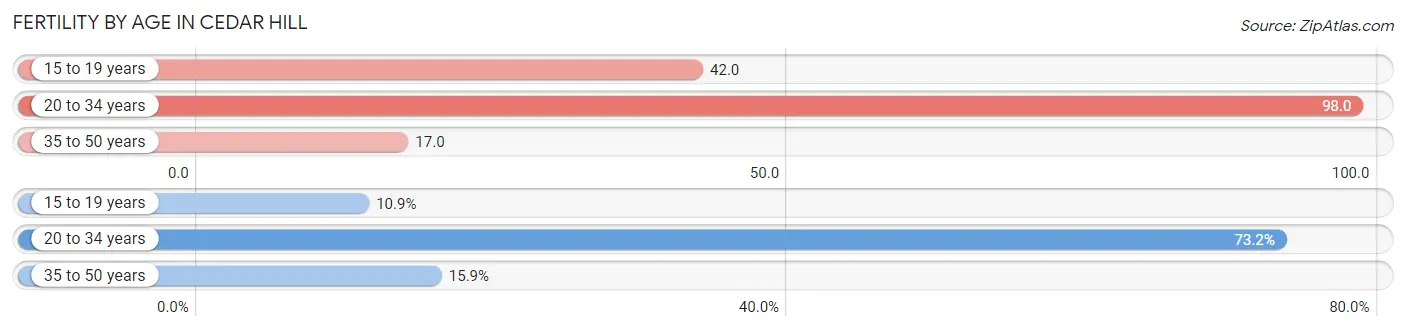
| Age Bracket | Women with Births | Births / 1,000 Women |
| 15 to 19 years | 71 (10.9%) | 42.0 |
| 20 to 34 years | 475 (73.2%) | 98.0 |
| 35 to 50 years | 103 (15.9%) | 17.0 |
| Total | 649 (100.0%) | 52.0 |
Fertility by Age by Marriage Status in Cedar Hill
41.8% of women with births (649) in Cedar Hill are married. The highest percentage of unmarried women with births falls into 15 to 19 years age bracket with 100.0% of them unmarried at the time of birth, while the lowest percentage of unmarried women with births belong to 35 to 50 years age bracket with 14.6% of them unmarried.
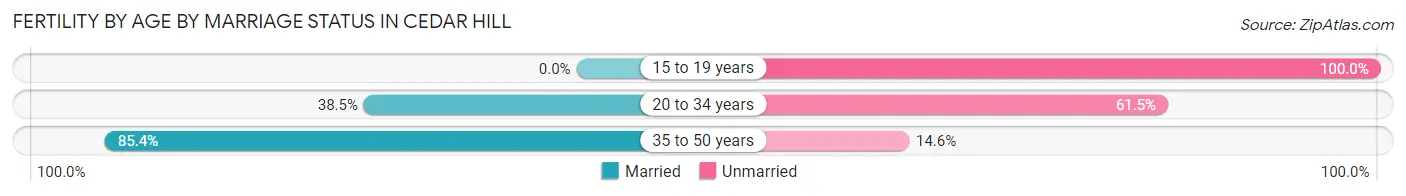
| Age Bracket | Married | Unmarried |
| 15 to 19 years | 0 (0.0%) | 71 (100.0%) |
| 20 to 34 years | 183 (38.5%) | 292 (61.5%) |
| 35 to 50 years | 88 (85.4%) | 15 (14.6%) |
| Total | 271 (41.8%) | 378 (58.2%) |
Fertility by Education in Cedar Hill
Average fertility rate in Cedar Hill is 52.0 births per 1,000 women. Women with the education attainment of college or associate's degree have the highest fertility rate of 86.0 births per 1,000 women, while women with the education attainment of graduate degree have the lowest fertility at 5.0 births per 1,000 women. Women with the education attainment of college or associate's degree represent 65.2% of all women with births.
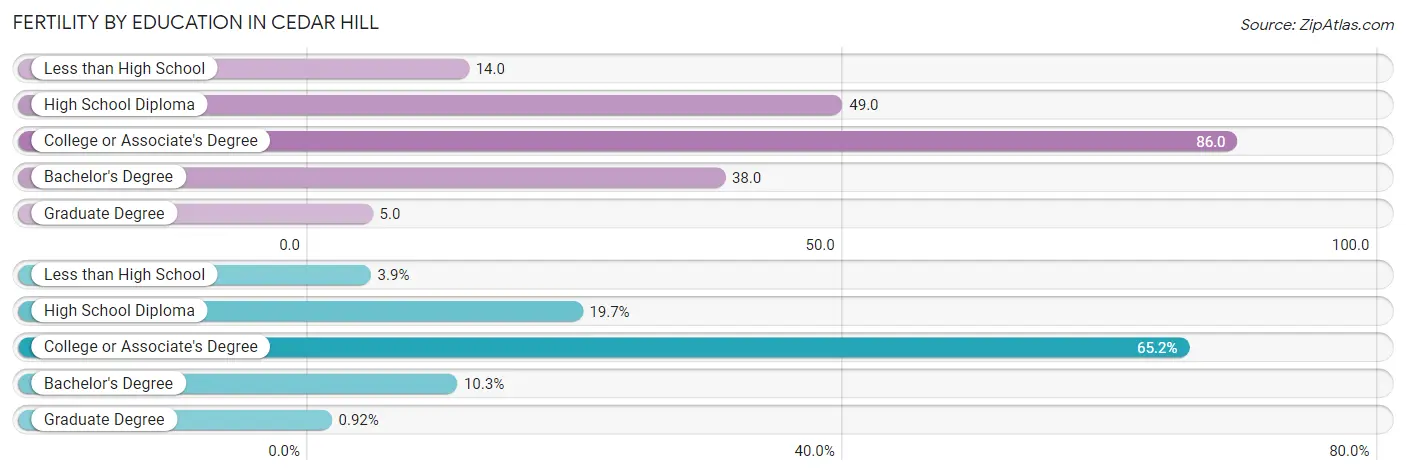
| Educational Attainment | Women with Births | Births / 1,000 Women |
| Less than High School | 25 (3.8%) | 14.0 |
| High School Diploma | 128 (19.7%) | 49.0 |
| College or Associate's Degree | 423 (65.2%) | 86.0 |
| Bachelor's Degree | 67 (10.3%) | 38.0 |
| Graduate Degree | 6 (0.9%) | 5.0 |
| Total | 649 (100.0%) | 52.0 |
Fertility by Education by Marriage Status in Cedar Hill
58.2% of women with births in Cedar Hill are unmarried. Women with the educational attainment of graduate degree are most likely to be married with 100.0% of them married at childbirth, while women with the educational attainment of less than high school are least likely to be married with 100.0% of them unmarried at childbirth.
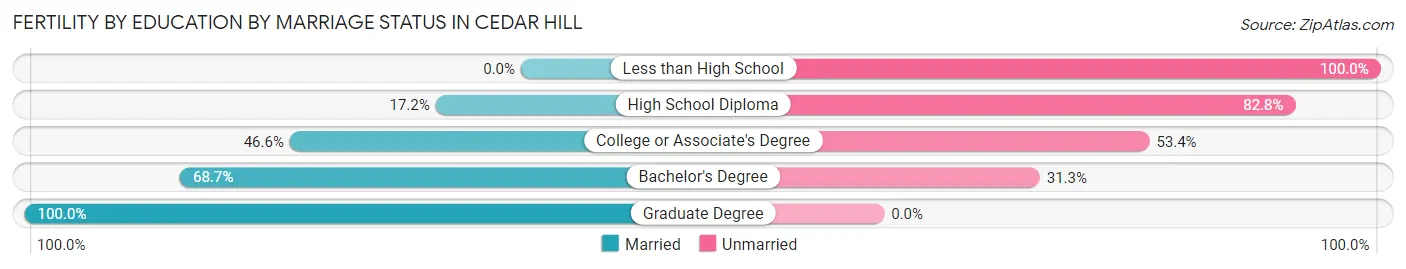
| Educational Attainment | Married | Unmarried |
| Less than High School | 0 (0.0%) | 25 (100.0%) |
| High School Diploma | 22 (17.2%) | 106 (82.8%) |
| College or Associate's Degree | 197 (46.6%) | 226 (53.4%) |
| Bachelor's Degree | 46 (68.7%) | 21 (31.3%) |
| Graduate Degree | 6 (100.0%) | 0 (0.0%) |
| Total | 271 (41.8%) | 378 (58.2%) |
Employment Characteristics in Cedar Hill
Employment by Class of Employer in Cedar Hill
Among the 23,086 employed individuals in Cedar Hill, private company employees (15,583 | 67.5%), not-for-profit organizations (1,881 | 8.2%), and local government employees (1,518 | 6.6%) make up the most common classes of employment.
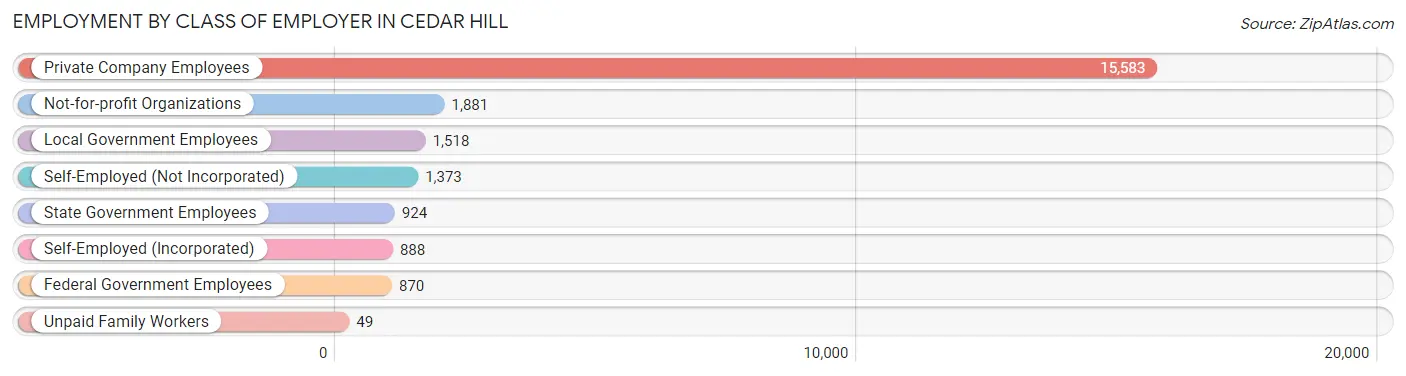
| Employer Class | # Employees | % Employees |
| Private Company Employees | 15,583 | 67.5% |
| Self-Employed (Incorporated) | 888 | 3.8% |
| Self-Employed (Not Incorporated) | 1,373 | 5.9% |
| Not-for-profit Organizations | 1,881 | 8.2% |
| Local Government Employees | 1,518 | 6.6% |
| State Government Employees | 924 | 4.0% |
| Federal Government Employees | 870 | 3.8% |
| Unpaid Family Workers | 49 | 0.2% |
| Total | 23,086 | 100.0% |
Employment Status by Age in Cedar Hill
According to the labor force statistics for Cedar Hill, out of the total population over 16 years of age (36,801), 69.7% or 25,650 individuals are in the labor force, with 6.9% or 1,770 of them unemployed. The age group with the highest labor force participation rate is 35 to 44 years, with 89.7% or 5,680 individuals in the labor force. Within the labor force, the 16 to 19 years age range has the highest percentage of unemployed individuals, with 25.7% or 203 of them being unemployed.
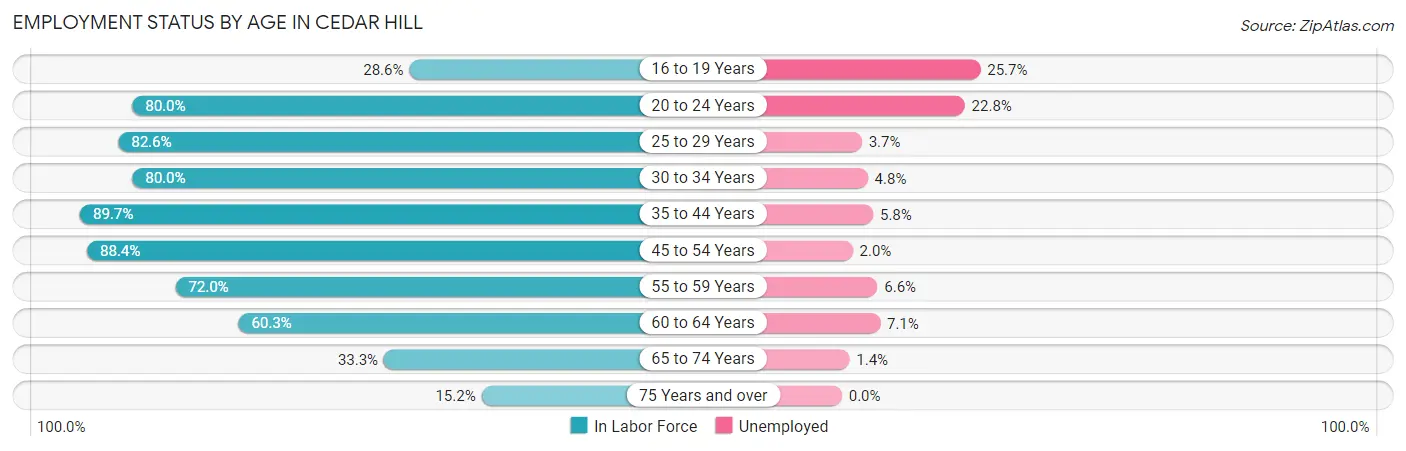
| Age Bracket | In Labor Force | Unemployed |
| 16 to 19 Years | 789 (28.6%) | 203 (25.7%) |
| 20 to 24 Years | 2,652 (80.0%) | 605 (22.8%) |
| 25 to 29 Years | 2,689 (82.6%) | 99 (3.7%) |
| 30 to 34 Years | 2,358 (80.0%) | 113 (4.8%) |
| 35 to 44 Years | 5,680 (89.7%) | 329 (5.8%) |
| 45 to 54 Years | 5,864 (88.4%) | 117 (2.0%) |
| 55 to 59 Years | 2,065 (72.0%) | 136 (6.6%) |
| 60 to 64 Years | 1,994 (60.3%) | 142 (7.1%) |
| 65 to 74 Years | 1,381 (33.3%) | 19 (1.4%) |
| 75 Years and over | 188 (15.2%) | 0 (0.0%) |
| Total | 25,650 (69.7%) | 1,770 (6.9%) |
Employment Status by Educational Attainment in Cedar Hill
According to labor force statistics for Cedar Hill, 81.5% of individuals (20,655) out of the total population between 25 and 64 years of age (25,343) are in the labor force, with 4.5% or 929 of them being unemployed. The group with the highest labor force participation rate are those with the educational attainment of bachelor's degree or higher, with 89.5% or 6,452 individuals in the labor force. Within the labor force, individuals with less than high school education have the highest percentage of unemployment, with 8.7% or 117 of them being unemployed.
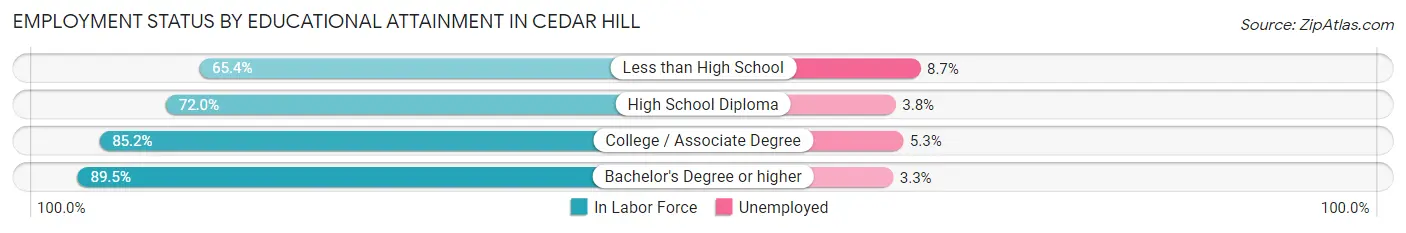
| Educational Attainment | In Labor Force | Unemployed |
| Less than High School | 1,342 (65.4%) | 179 (8.7%) |
| High School Diploma | 4,609 (72.0%) | 243 (3.8%) |
| College / Associate Degree | 8,248 (85.2%) | 513 (5.3%) |
| Bachelor's Degree or higher | 6,452 (89.5%) | 238 (3.3%) |
| Total | 20,655 (81.5%) | 1,140 (4.5%) |
Employment Occupations by Sex in Cedar Hill
Management, Business, Science and Arts Occupations
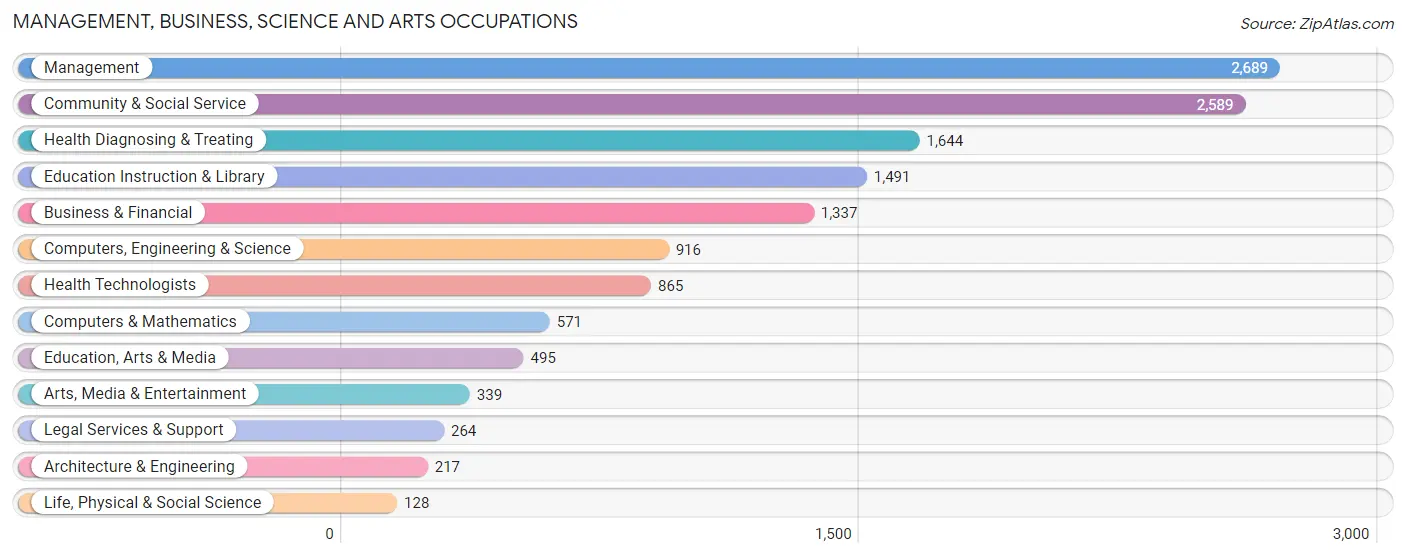
The most common Management, Business, Science and Arts occupations in Cedar Hill are Management (2,689 | 11.3%), Community & Social Service (2,589 | 10.9%), Health Diagnosing & Treating (1,644 | 6.9%), Education Instruction & Library (1,491 | 6.2%), and Business & Financial (1,337 | 5.6%).
Management, Business, Science and Arts Occupations by Sex
Within the Management, Business, Science and Arts occupations in Cedar Hill, the most male-oriented occupations are Architecture & Engineering (89.4%), Arts, Media & Entertainment (68.1%), and Computers, Engineering & Science (62.2%), while the most female-oriented occupations are Health Technologists (97.3%), Health Diagnosing & Treating (89.8%), and Education, Arts & Media (85.1%).
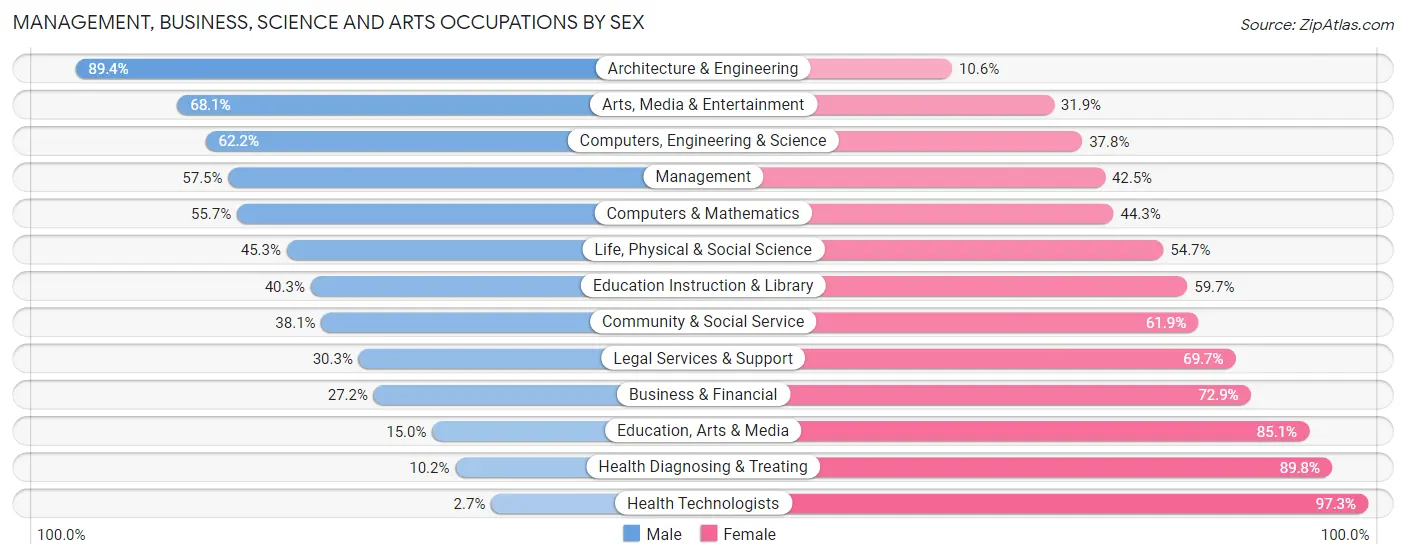
| Occupation | Male | Female |
| Management | 1,546 (57.5%) | 1,143 (42.5%) |
| Business & Financial | 363 (27.2%) | 974 (72.9%) |
| Computers, Engineering & Science | 570 (62.2%) | 346 (37.8%) |
| Computers & Mathematics | 318 (55.7%) | 253 (44.3%) |
| Architecture & Engineering | 194 (89.4%) | 23 (10.6%) |
| Life, Physical & Social Science | 58 (45.3%) | 70 (54.7%) |
| Community & Social Service | 986 (38.1%) | 1,603 (61.9%) |
| Education, Arts & Media | 74 (14.9%) | 421 (85.1%) |
| Legal Services & Support | 80 (30.3%) | 184 (69.7%) |
| Education Instruction & Library | 601 (40.3%) | 890 (59.7%) |
| Arts, Media & Entertainment | 231 (68.1%) | 108 (31.9%) |
| Health Diagnosing & Treating | 167 (10.2%) | 1,477 (89.8%) |
| Health Technologists | 23 (2.7%) | 842 (97.3%) |
| Total (Category) | 3,632 (39.6%) | 5,543 (60.4%) |
| Total (Overall) | 11,313 (47.5%) | 12,524 (52.5%) |
Services Occupations
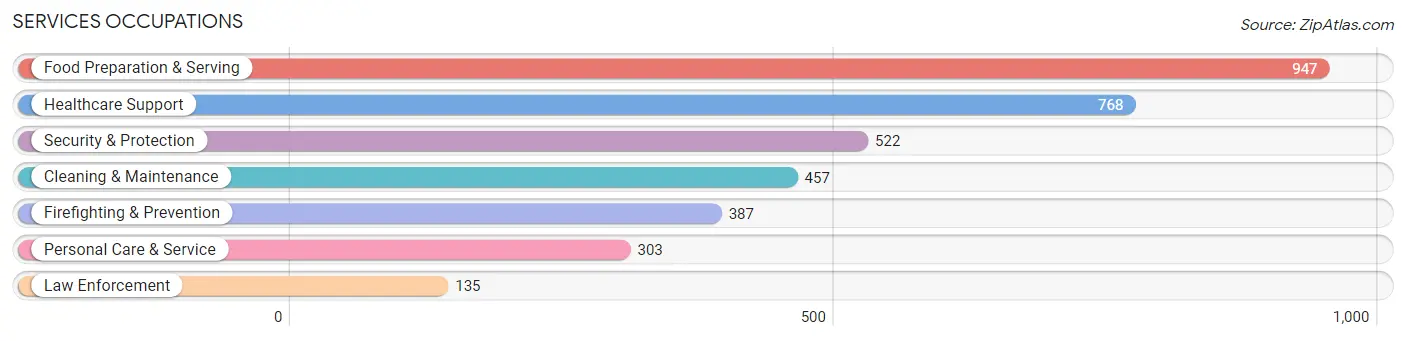
The most common Services occupations in Cedar Hill are Food Preparation & Serving (947 | 4.0%), Healthcare Support (768 | 3.2%), Security & Protection (522 | 2.2%), Cleaning & Maintenance (457 | 1.9%), and Firefighting & Prevention (387 | 1.6%).
Services Occupations by Sex
Within the Services occupations in Cedar Hill, the most male-oriented occupations are Firefighting & Prevention (84.8%), Security & Protection (79.5%), and Law Enforcement (64.4%), while the most female-oriented occupations are Healthcare Support (87.6%), Personal Care & Service (76.9%), and Cleaning & Maintenance (49.7%).
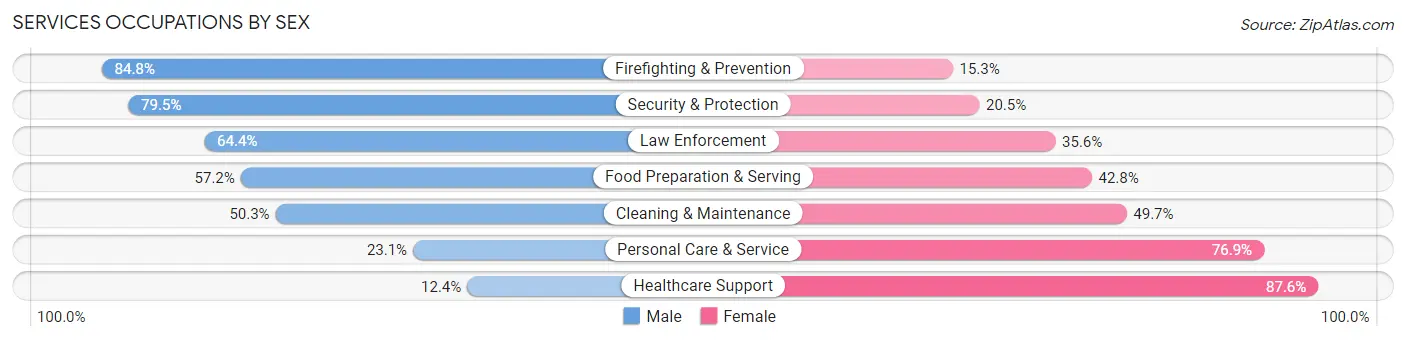
| Occupation | Male | Female |
| Healthcare Support | 95 (12.4%) | 673 (87.6%) |
| Security & Protection | 415 (79.5%) | 107 (20.5%) |
| Firefighting & Prevention | 328 (84.8%) | 59 (15.2%) |
| Law Enforcement | 87 (64.4%) | 48 (35.6%) |
| Food Preparation & Serving | 542 (57.2%) | 405 (42.8%) |
| Cleaning & Maintenance | 230 (50.3%) | 227 (49.7%) |
| Personal Care & Service | 70 (23.1%) | 233 (76.9%) |
| Total (Category) | 1,352 (45.1%) | 1,645 (54.9%) |
| Total (Overall) | 11,313 (47.5%) | 12,524 (52.5%) |
Sales and Office Occupations
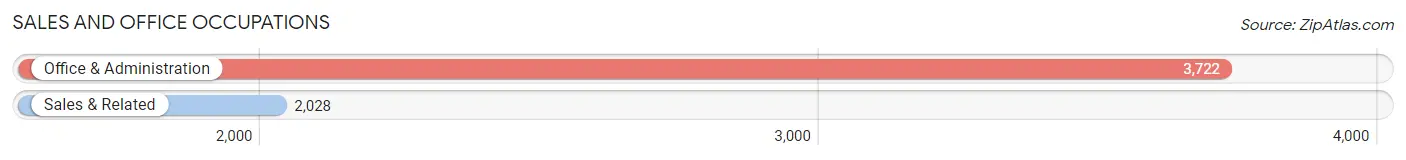
The most common Sales and Office occupations in Cedar Hill are Office & Administration (3,722 | 15.6%), and Sales & Related (2,028 | 8.5%).
Sales and Office Occupations by Sex
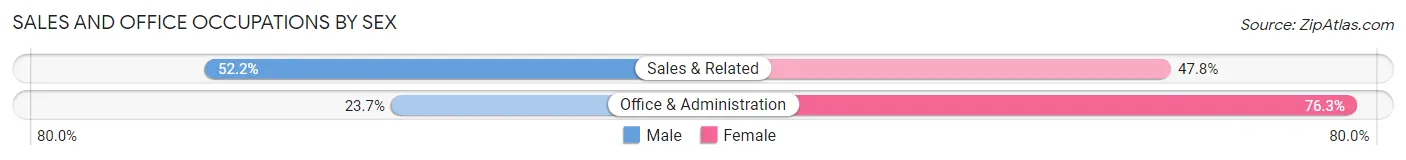
| Occupation | Male | Female |
| Sales & Related | 1,059 (52.2%) | 969 (47.8%) |
| Office & Administration | 881 (23.7%) | 2,841 (76.3%) |
| Total (Category) | 1,940 (33.7%) | 3,810 (66.3%) |
| Total (Overall) | 11,313 (47.5%) | 12,524 (52.5%) |
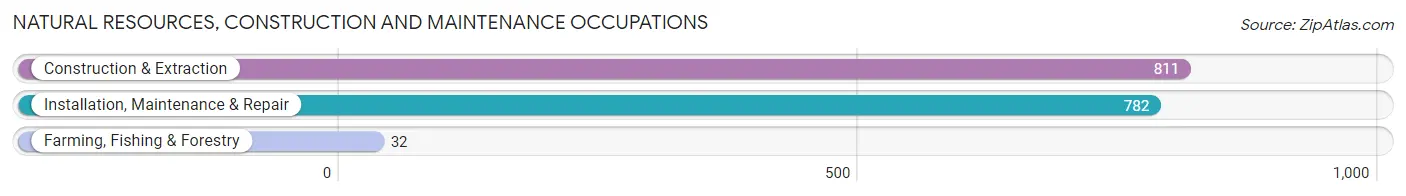
Natural Resources, Construction and Maintenance Occupations
The most common Natural Resources, Construction and Maintenance occupations in Cedar Hill are Construction & Extraction (811 | 3.4%), Installation, Maintenance & Repair (782 | 3.3%), and Farming, Fishing & Forestry (32 | 0.1%).
Natural Resources, Construction and Maintenance Occupations by Sex
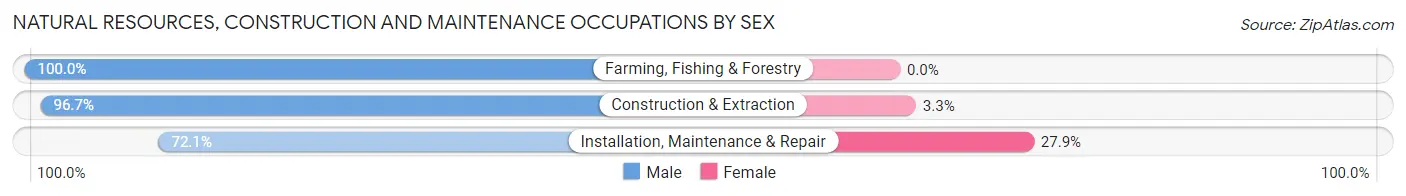
| Occupation | Male | Female |
| Farming, Fishing & Forestry | 32 (100.0%) | 0 (0.0%) |
| Construction & Extraction | 784 (96.7%) | 27 (3.3%) |
| Installation, Maintenance & Repair | 564 (72.1%) | 218 (27.9%) |
| Total (Category) | 1,380 (84.9%) | 245 (15.1%) |
| Total (Overall) | 11,313 (47.5%) | 12,524 (52.5%) |
Production, Transportation and Moving Occupations
The most common Production, Transportation and Moving occupations in Cedar Hill are Transportation (1,563 | 6.6%), Material Moving (1,422 | 6.0%), and Production (1,305 | 5.5%).

Production, Transportation and Moving Occupations by Sex
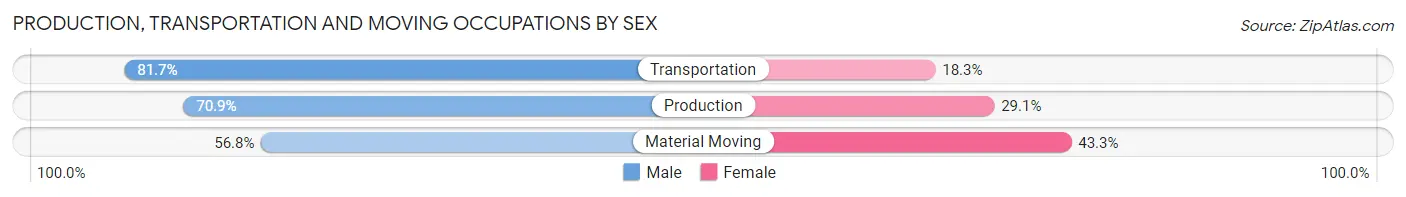
| Occupation | Male | Female |
| Production | 925 (70.9%) | 380 (29.1%) |
| Transportation | 1,277 (81.7%) | 286 (18.3%) |
| Material Moving | 807 (56.8%) | 615 (43.2%) |
| Total (Category) | 3,009 (70.1%) | 1,281 (29.9%) |
| Total (Overall) | 11,313 (47.5%) | 12,524 (52.5%) |
Employment Industries by Sex in Cedar Hill
Employment Industries in Cedar Hill
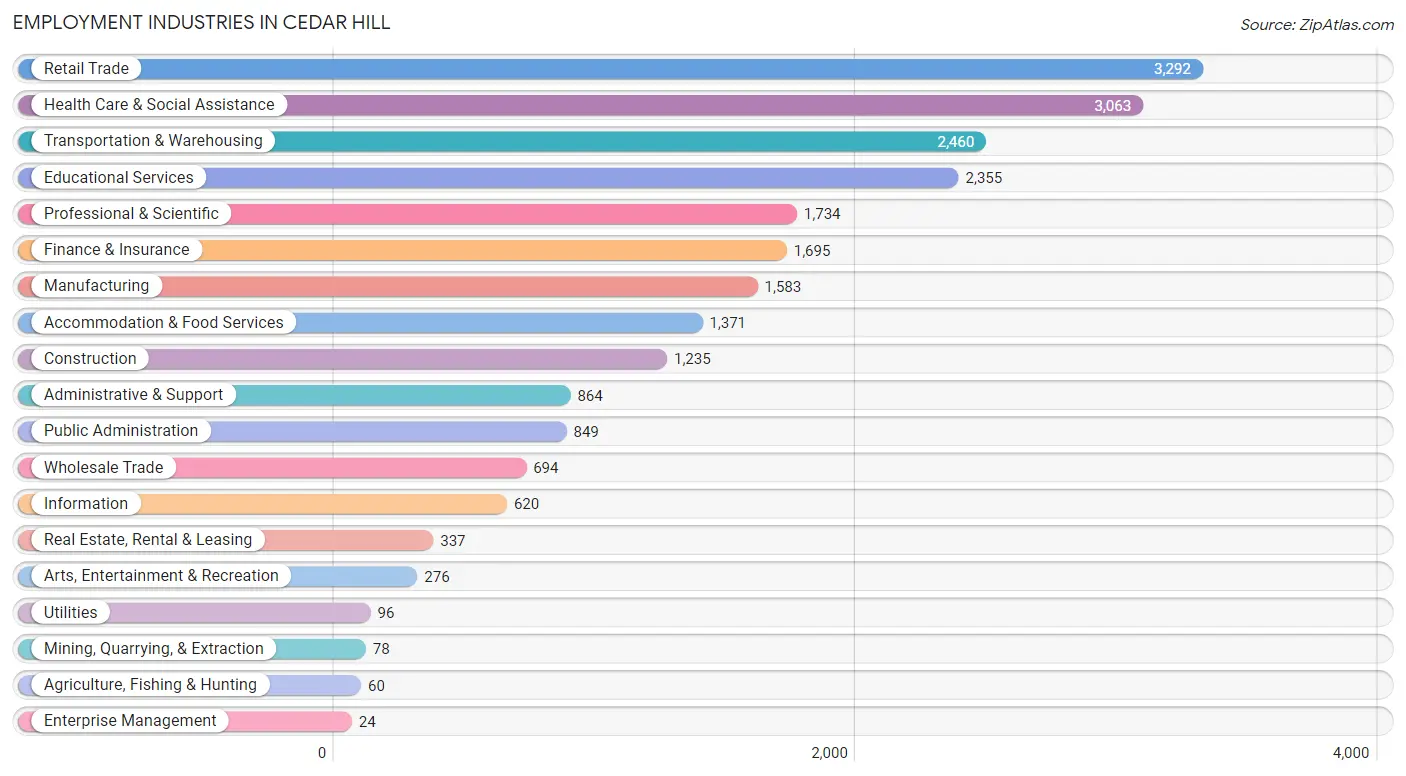
The major employment industries in Cedar Hill include Retail Trade (3,292 | 13.8%), Health Care & Social Assistance (3,063 | 12.9%), Transportation & Warehousing (2,460 | 10.3%), Educational Services (2,355 | 9.9%), and Professional & Scientific (1,734 | 7.3%).
Employment Industries by Sex in Cedar Hill
The Cedar Hill industries that see more men than women are Mining, Quarrying, & Extraction (100.0%), Enterprise Management (100.0%), and Construction (85.5%), whereas the industries that tend to have a higher number of women are Health Care & Social Assistance (88.1%), Public Administration (75.0%), and Educational Services (62.9%).
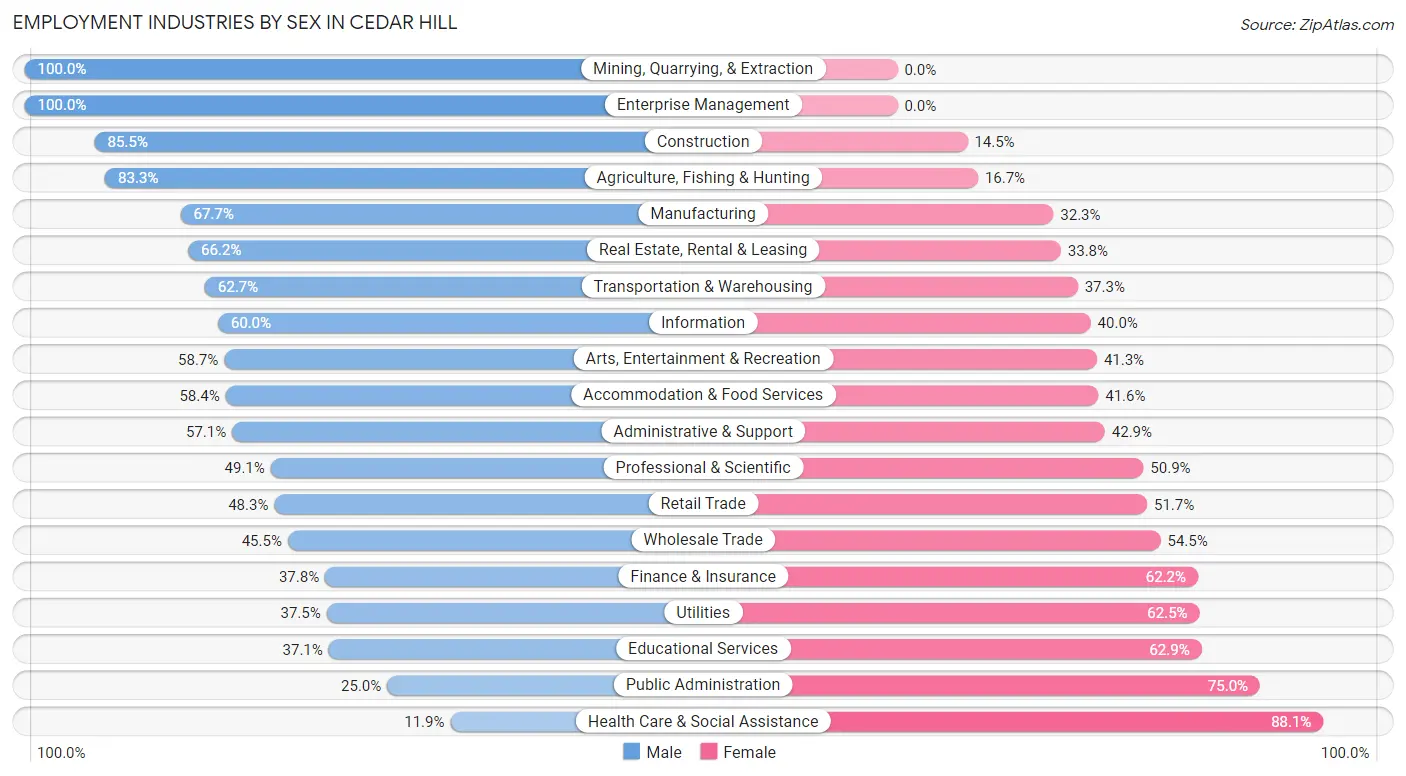
| Industry | Male | Female |
| Agriculture, Fishing & Hunting | 50 (83.3%) | 10 (16.7%) |
| Mining, Quarrying, & Extraction | 78 (100.0%) | 0 (0.0%) |
| Construction | 1,056 (85.5%) | 179 (14.5%) |
| Manufacturing | 1,072 (67.7%) | 511 (32.3%) |
| Wholesale Trade | 316 (45.5%) | 378 (54.5%) |
| Retail Trade | 1,591 (48.3%) | 1,701 (51.7%) |
| Transportation & Warehousing | 1,542 (62.7%) | 918 (37.3%) |
| Utilities | 36 (37.5%) | 60 (62.5%) |
| Information | 372 (60.0%) | 248 (40.0%) |
| Finance & Insurance | 641 (37.8%) | 1,054 (62.2%) |
| Real Estate, Rental & Leasing | 223 (66.2%) | 114 (33.8%) |
| Professional & Scientific | 851 (49.1%) | 883 (50.9%) |
| Enterprise Management | 24 (100.0%) | 0 (0.0%) |
| Administrative & Support | 493 (57.1%) | 371 (42.9%) |
| Educational Services | 873 (37.1%) | 1,482 (62.9%) |
| Health Care & Social Assistance | 364 (11.9%) | 2,699 (88.1%) |
| Arts, Entertainment & Recreation | 162 (58.7%) | 114 (41.3%) |
| Accommodation & Food Services | 801 (58.4%) | 570 (41.6%) |
| Public Administration | 212 (25.0%) | 637 (75.0%) |
| Total | 11,313 (47.5%) | 12,524 (52.5%) |
Education in Cedar Hill
School Enrollment in Cedar Hill
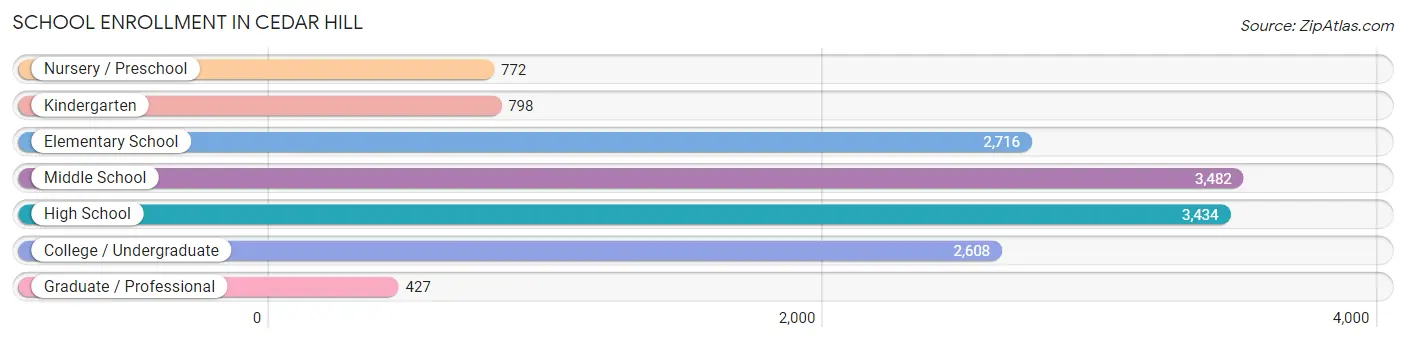
The most common levels of schooling among the 14,237 students in Cedar Hill are middle school (3,482 | 24.5%), high school (3,434 | 24.1%), and elementary school (2,716 | 19.1%).
| School Level | # Students | % Students |
| Nursery / Preschool | 772 | 5.4% |
| Kindergarten | 798 | 5.6% |
| Elementary School | 2,716 | 19.1% |
| Middle School | 3,482 | 24.5% |
| High School | 3,434 | 24.1% |
| College / Undergraduate | 2,608 | 18.3% |
| Graduate / Professional | 427 | 3.0% |
| Total | 14,237 | 100.0% |
School Enrollment by Age by Funding Source in Cedar Hill
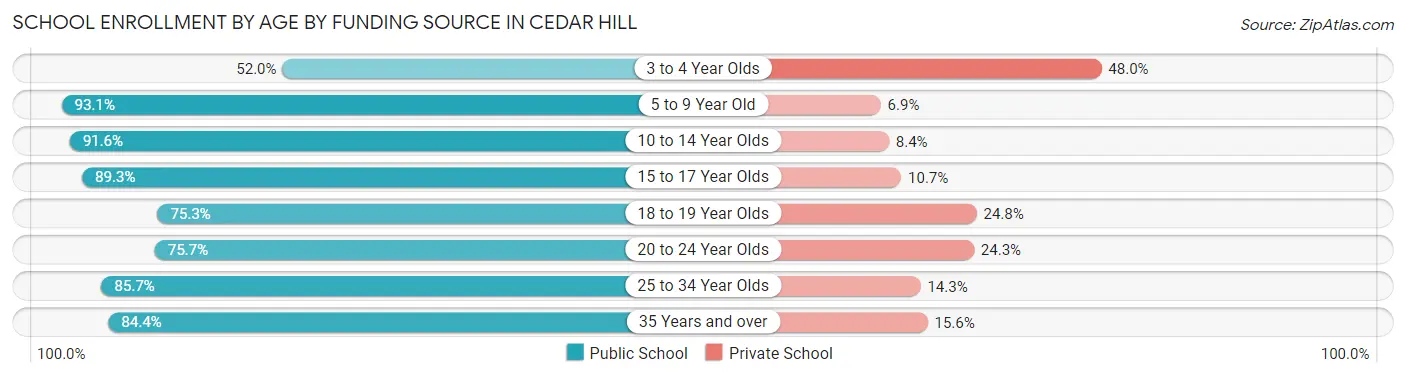
Out of a total of 14,237 students who are enrolled in schools in Cedar Hill, 1,794 (12.6%) attend a private institution, while the remaining 12,443 (87.4%) are enrolled in public schools. The age group of 3 to 4 year olds has the highest likelihood of being enrolled in private schools, with 217 (48.0% in the age bracket) enrolled. Conversely, the age group of 5 to 9 year old has the lowest likelihood of being enrolled in a private school, with 3,204 (93.1% in the age bracket) attending a public institution.
| Age Bracket | Public School | Private School |
| 3 to 4 Year Olds | 235 (52.0%) | 217 (48.0%) |
| 5 to 9 Year Old | 3,204 (93.1%) | 237 (6.9%) |
| 10 to 14 Year Olds | 4,236 (91.6%) | 389 (8.4%) |
| 15 to 17 Year Olds | 2,036 (89.3%) | 244 (10.7%) |
| 18 to 19 Year Olds | 672 (75.2%) | 221 (24.7%) |
| 20 to 24 Year Olds | 896 (75.7%) | 287 (24.3%) |
| 25 to 34 Year Olds | 515 (85.7%) | 86 (14.3%) |
| 35 Years and over | 643 (84.4%) | 119 (15.6%) |
| Total | 12,443 (87.4%) | 1,794 (12.6%) |
Educational Attainment by Field of Study in Cedar Hill
Business (1,702 | 18.1%), education (1,070 | 11.4%), science & technology (1,060 | 11.3%), social sciences (895 | 9.5%), and bio, nature & agricultural (738 | 7.8%) are the most common fields of study among 9,413 individuals in Cedar Hill who have obtained a bachelor's degree or higher.
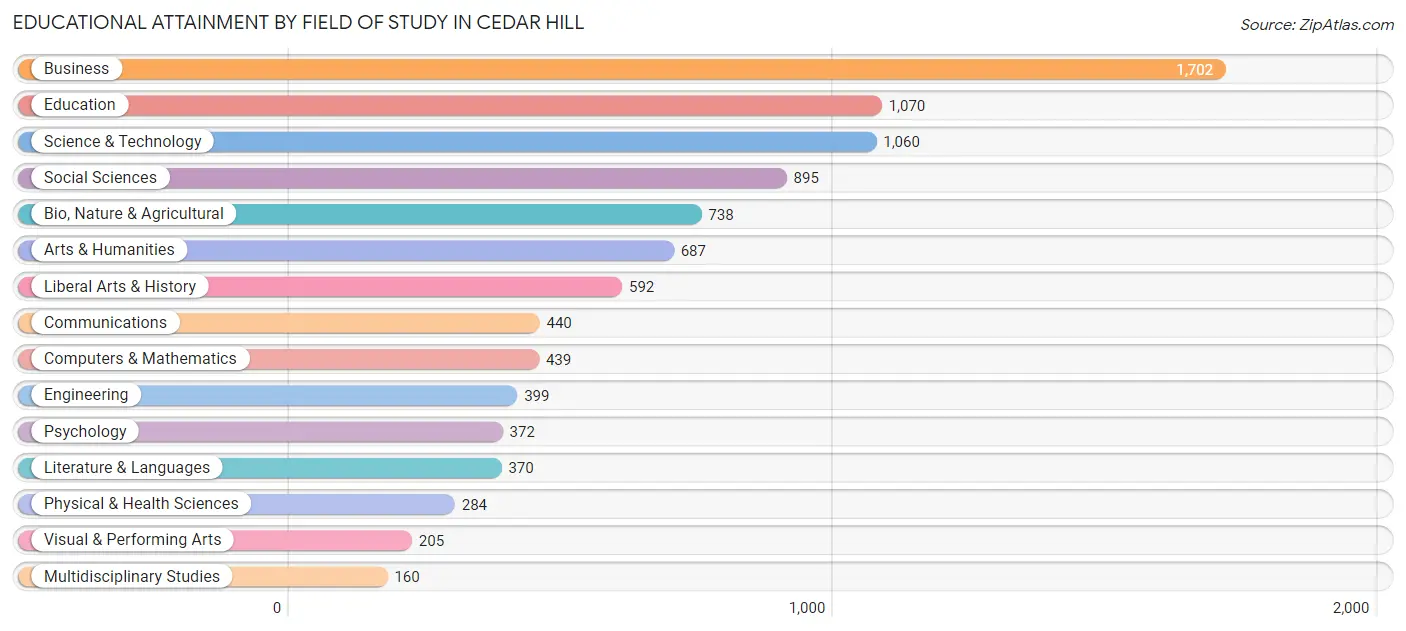
| Field of Study | # Graduates | % Graduates |
| Computers & Mathematics | 439 | 4.7% |
| Bio, Nature & Agricultural | 738 | 7.8% |
| Physical & Health Sciences | 284 | 3.0% |
| Psychology | 372 | 4.0% |
| Social Sciences | 895 | 9.5% |
| Engineering | 399 | 4.2% |
| Multidisciplinary Studies | 160 | 1.7% |
| Science & Technology | 1,060 | 11.3% |
| Business | 1,702 | 18.1% |
| Education | 1,070 | 11.4% |
| Literature & Languages | 370 | 3.9% |
| Liberal Arts & History | 592 | 6.3% |
| Visual & Performing Arts | 205 | 2.2% |
| Communications | 440 | 4.7% |
| Arts & Humanities | 687 | 7.3% |
| Total | 9,413 | 100.0% |
Transportation & Commute in Cedar Hill
Vehicle Availability by Sex in Cedar Hill
The most prevalent vehicle ownership categories in Cedar Hill are males with 2 vehicles (4,315, accounting for 39.3%) and females with 2 vehicles (4,658, making up 36.1%).
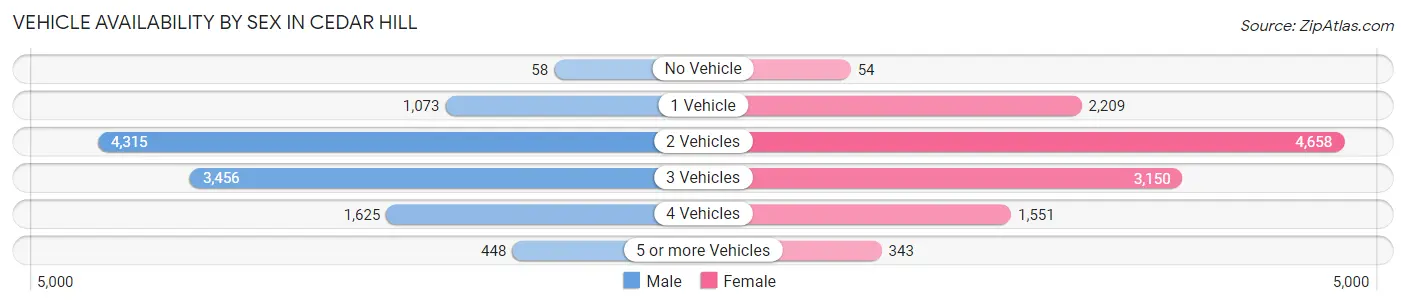
| Vehicles Available | Male | Female |
| No Vehicle | 58 (0.5%) | 54 (0.4%) |
| 1 Vehicle | 1,073 (9.8%) | 2,209 (18.5%) |
| 2 Vehicles | 4,315 (39.3%) | 4,658 (38.9%) |
| 3 Vehicles | 3,456 (31.5%) | 3,150 (26.3%) |
| 4 Vehicles | 1,625 (14.8%) | 1,551 (13.0%) |
| 5 or more Vehicles | 448 (4.1%) | 343 (2.9%) |
| Total | 10,975 (100.0%) | 11,965 (100.0%) |
Commute Time in Cedar Hill
The most frequently occuring commute durations in Cedar Hill are 30 to 34 minutes (3,205 commuters, 16.0%), 45 to 59 minutes (2,827 commuters, 14.1%), and 20 to 24 minutes (2,441 commuters, 12.2%).
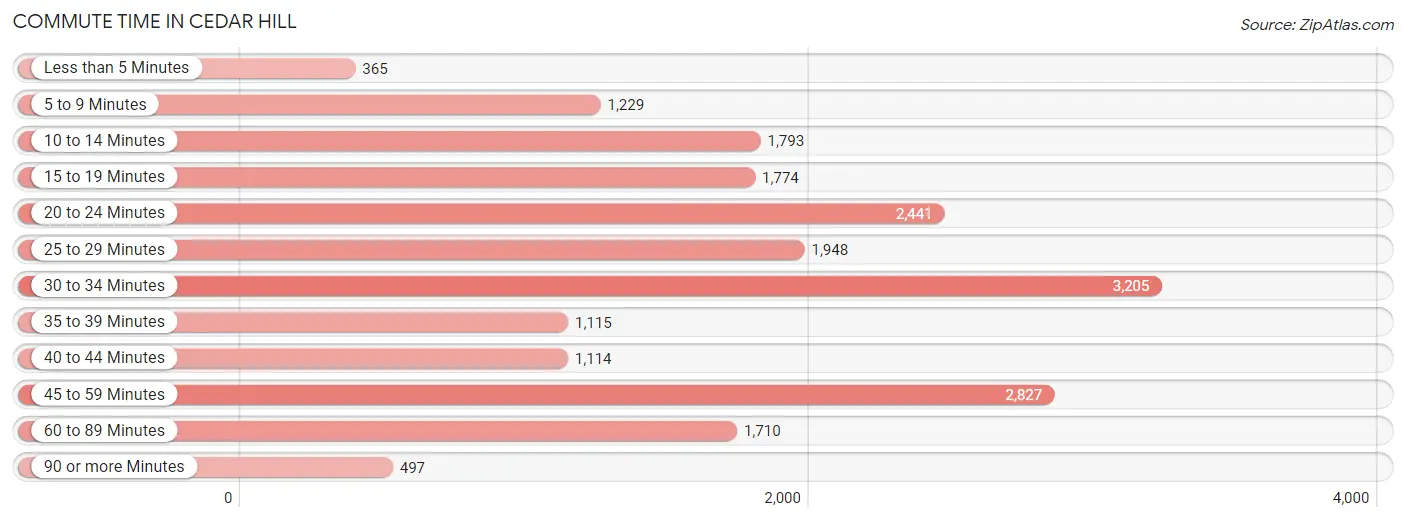
| Commute Time | # Commuters | % Commuters |
| Less than 5 Minutes | 365 | 1.8% |
| 5 to 9 Minutes | 1,229 | 6.1% |
| 10 to 14 Minutes | 1,793 | 9.0% |
| 15 to 19 Minutes | 1,774 | 8.9% |
| 20 to 24 Minutes | 2,441 | 12.2% |
| 25 to 29 Minutes | 1,948 | 9.7% |
| 30 to 34 Minutes | 3,205 | 16.0% |
| 35 to 39 Minutes | 1,115 | 5.6% |
| 40 to 44 Minutes | 1,114 | 5.6% |
| 45 to 59 Minutes | 2,827 | 14.1% |
| 60 to 89 Minutes | 1,710 | 8.5% |
| 90 or more Minutes | 497 | 2.5% |
Commute Time by Sex in Cedar Hill
The most common commute times in Cedar Hill are 30 to 34 minutes (1,617 commuters, 16.1%) for males and 30 to 34 minutes (1,588 commuters, 15.9%) for females.
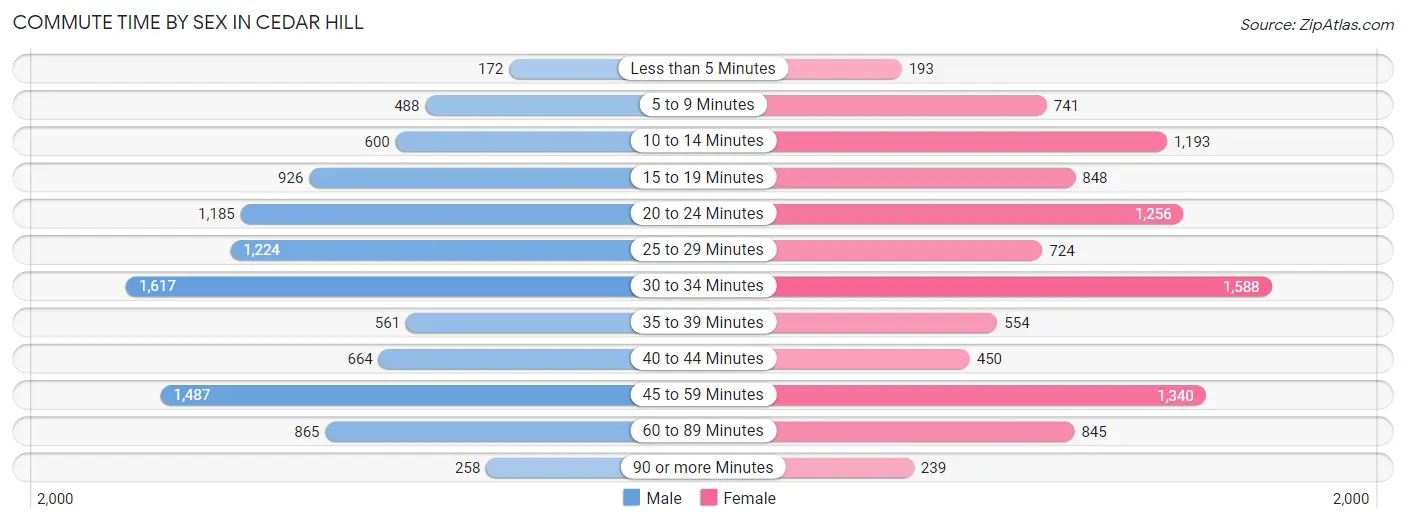
| Commute Time | Male | Female |
| Less than 5 Minutes | 172 (1.7%) | 193 (1.9%) |
| 5 to 9 Minutes | 488 (4.9%) | 741 (7.4%) |
| 10 to 14 Minutes | 600 (6.0%) | 1,193 (12.0%) |
| 15 to 19 Minutes | 926 (9.2%) | 848 (8.5%) |
| 20 to 24 Minutes | 1,185 (11.8%) | 1,256 (12.6%) |
| 25 to 29 Minutes | 1,224 (12.2%) | 724 (7.3%) |
| 30 to 34 Minutes | 1,617 (16.1%) | 1,588 (15.9%) |
| 35 to 39 Minutes | 561 (5.6%) | 554 (5.6%) |
| 40 to 44 Minutes | 664 (6.6%) | 450 (4.5%) |
| 45 to 59 Minutes | 1,487 (14.8%) | 1,340 (13.4%) |
| 60 to 89 Minutes | 865 (8.6%) | 845 (8.5%) |
| 90 or more Minutes | 258 (2.6%) | 239 (2.4%) |
Time of Departure to Work by Sex in Cedar Hill
The most frequent times of departure to work in Cedar Hill are 7:00 AM to 7:29 AM (1,711, 17.0%) for males and 7:00 AM to 7:29 AM (1,547, 15.5%) for females.
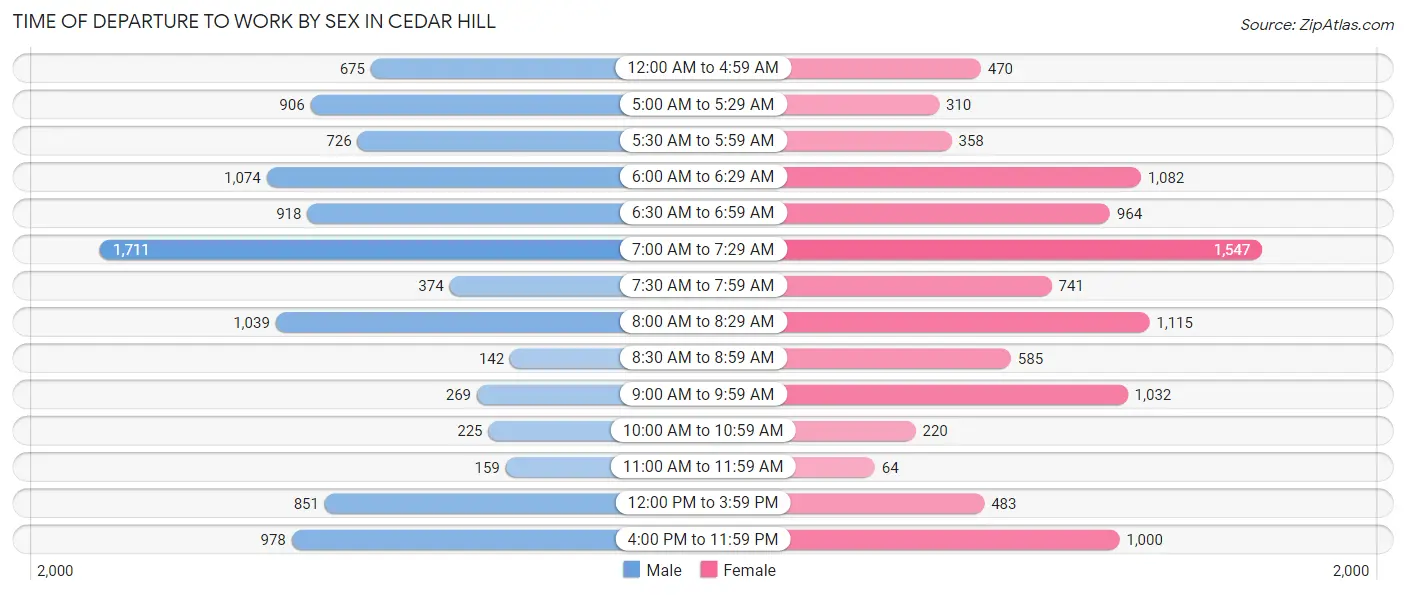
| Time of Departure | Male | Female |
| 12:00 AM to 4:59 AM | 675 (6.7%) | 470 (4.7%) |
| 5:00 AM to 5:29 AM | 906 (9.0%) | 310 (3.1%) |
| 5:30 AM to 5:59 AM | 726 (7.2%) | 358 (3.6%) |
| 6:00 AM to 6:29 AM | 1,074 (10.7%) | 1,082 (10.8%) |
| 6:30 AM to 6:59 AM | 918 (9.1%) | 964 (9.7%) |
| 7:00 AM to 7:29 AM | 1,711 (17.0%) | 1,547 (15.5%) |
| 7:30 AM to 7:59 AM | 374 (3.7%) | 741 (7.4%) |
| 8:00 AM to 8:29 AM | 1,039 (10.3%) | 1,115 (11.2%) |
| 8:30 AM to 8:59 AM | 142 (1.4%) | 585 (5.9%) |
| 9:00 AM to 9:59 AM | 269 (2.7%) | 1,032 (10.3%) |
| 10:00 AM to 10:59 AM | 225 (2.2%) | 220 (2.2%) |
| 11:00 AM to 11:59 AM | 159 (1.6%) | 64 (0.6%) |
| 12:00 PM to 3:59 PM | 851 (8.5%) | 483 (4.8%) |
| 4:00 PM to 11:59 PM | 978 (9.7%) | 1,000 (10.0%) |
| Total | 10,047 (100.0%) | 9,971 (100.0%) |
Housing Occupancy in Cedar Hill
Occupancy by Ownership in Cedar Hill
Of the total 16,071 dwellings in Cedar Hill, owner-occupied units account for 11,313 (70.4%), while renter-occupied units make up 4,758 (29.6%).
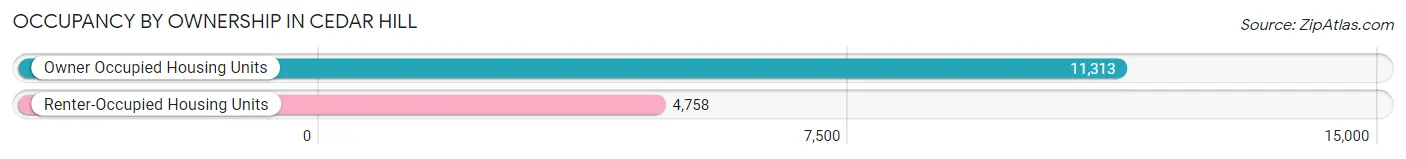
| Occupancy | # Housing Units | % Housing Units |
| Owner Occupied Housing Units | 11,313 | 70.4% |
| Renter-Occupied Housing Units | 4,758 | 29.6% |
| Total Occupied Housing Units | 16,071 | 100.0% |
Occupancy by Household Size in Cedar Hill
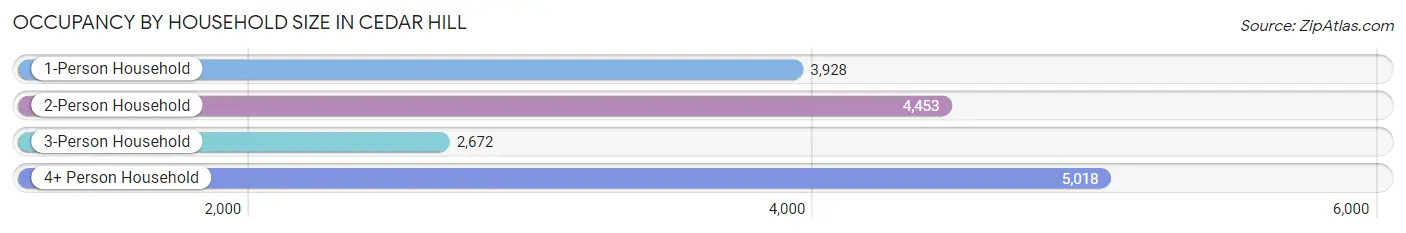
| Household Size | # Housing Units | % Housing Units |
| 1-Person Household | 3,928 | 24.4% |
| 2-Person Household | 4,453 | 27.7% |
| 3-Person Household | 2,672 | 16.6% |
| 4+ Person Household | 5,018 | 31.2% |
| Total Housing Units | 16,071 | 100.0% |
Occupancy by Ownership by Household Size in Cedar Hill
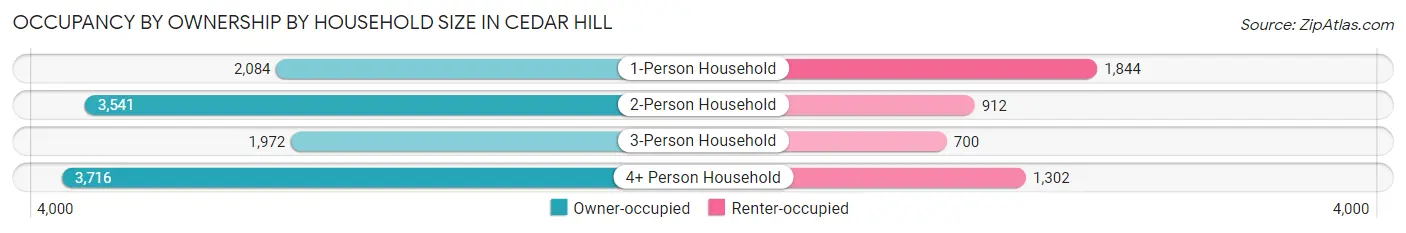
| Household Size | Owner-occupied | Renter-occupied |
| 1-Person Household | 2,084 (53.0%) | 1,844 (46.9%) |
| 2-Person Household | 3,541 (79.5%) | 912 (20.5%) |
| 3-Person Household | 1,972 (73.8%) | 700 (26.2%) |
| 4+ Person Household | 3,716 (74.1%) | 1,302 (26.0%) |
| Total Housing Units | 11,313 (70.4%) | 4,758 (29.6%) |
Occupancy by Educational Attainment in Cedar Hill
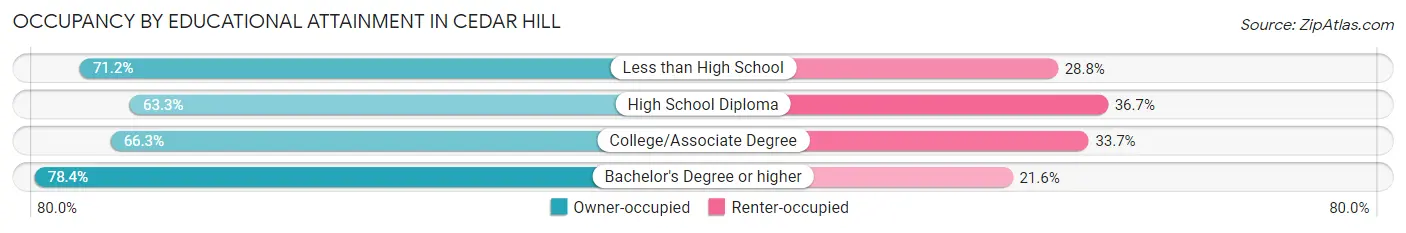
| Household Size | Owner-occupied | Renter-occupied |
| Less than High School | 710 (71.2%) | 287 (28.8%) |
| High School Diploma | 2,091 (63.3%) | 1,214 (36.7%) |
| College/Associate Degree | 3,922 (66.3%) | 1,991 (33.7%) |
| Bachelor's Degree or higher | 4,590 (78.4%) | 1,266 (21.6%) |
Occupancy by Age of Householder in Cedar Hill
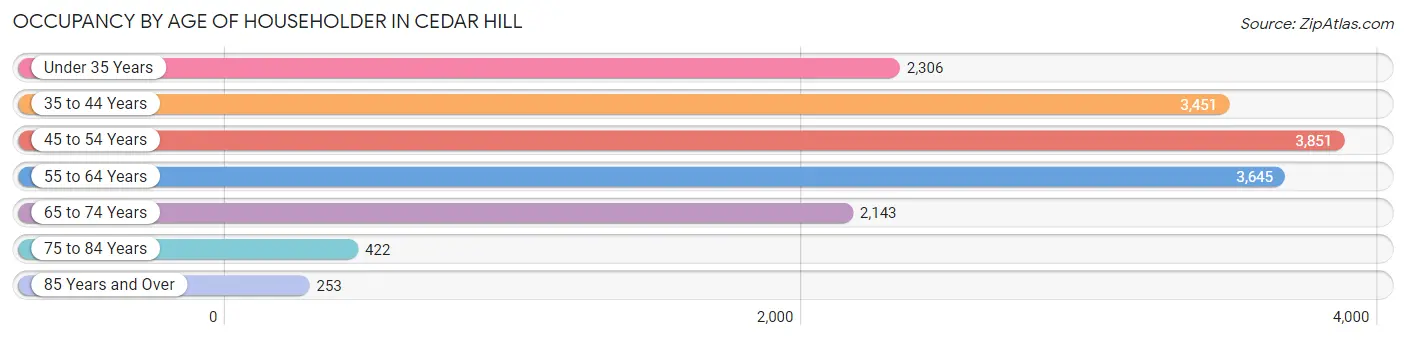
| Age Bracket | # Households | % Households |
| Under 35 Years | 2,306 | 14.3% |
| 35 to 44 Years | 3,451 | 21.5% |
| 45 to 54 Years | 3,851 | 24.0% |
| 55 to 64 Years | 3,645 | 22.7% |
| 65 to 74 Years | 2,143 | 13.3% |
| 75 to 84 Years | 422 | 2.6% |
| 85 Years and Over | 253 | 1.6% |
| Total | 16,071 | 100.0% |
Housing Finances in Cedar Hill
Median Income by Occupancy in Cedar Hill
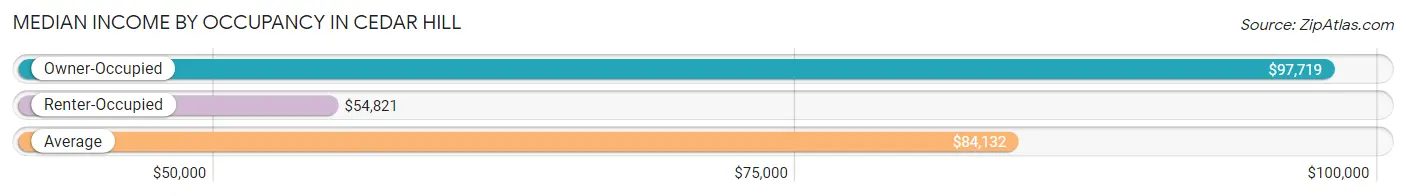
| Occupancy Type | # Households | Median Income |
| Owner-Occupied | 11,313 (70.4%) | $97,719 |
| Renter-Occupied | 4,758 (29.6%) | $54,821 |
| Average | 16,071 (100.0%) | $84,132 |
Occupancy by Householder Income Bracket in Cedar Hill
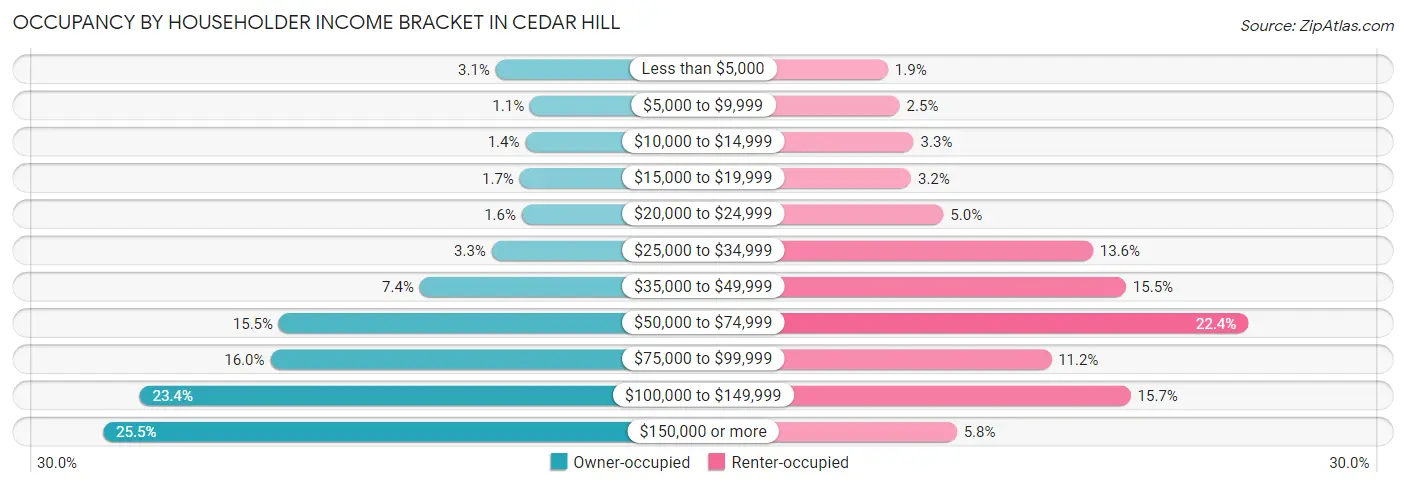
| Income Bracket | Owner-occupied | Renter-occupied |
| Less than $5,000 | 349 (3.1%) | 88 (1.8%) |
| $5,000 to $9,999 | 127 (1.1%) | 120 (2.5%) |
| $10,000 to $14,999 | 157 (1.4%) | 158 (3.3%) |
| $15,000 to $19,999 | 193 (1.7%) | 151 (3.2%) |
| $20,000 to $24,999 | 180 (1.6%) | 239 (5.0%) |
| $25,000 to $34,999 | 375 (3.3%) | 645 (13.6%) |
| $35,000 to $49,999 | 839 (7.4%) | 735 (15.4%) |
| $50,000 to $74,999 | 1,750 (15.5%) | 1,067 (22.4%) |
| $75,000 to $99,999 | 1,806 (16.0%) | 532 (11.2%) |
| $100,000 to $149,999 | 2,651 (23.4%) | 748 (15.7%) |
| $150,000 or more | 2,886 (25.5%) | 275 (5.8%) |
| Total | 11,313 (100.0%) | 4,758 (100.0%) |
Monthly Housing Cost Tiers in Cedar Hill
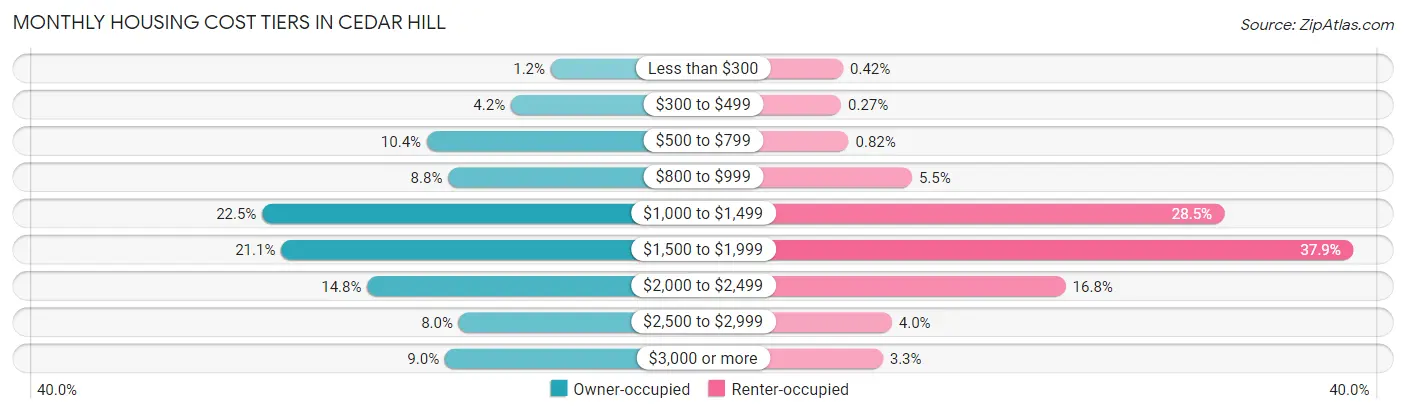
| Monthly Cost | Owner-occupied | Renter-occupied |
| Less than $300 | 140 (1.2%) | 20 (0.4%) |
| $300 to $499 | 473 (4.2%) | 13 (0.3%) |
| $500 to $799 | 1,173 (10.4%) | 39 (0.8%) |
| $800 to $999 | 995 (8.8%) | 261 (5.5%) |
| $1,000 to $1,499 | 2,545 (22.5%) | 1,354 (28.5%) |
| $1,500 to $1,999 | 2,387 (21.1%) | 1,805 (37.9%) |
| $2,000 to $2,499 | 1,670 (14.8%) | 800 (16.8%) |
| $2,500 to $2,999 | 907 (8.0%) | 191 (4.0%) |
| $3,000 or more | 1,023 (9.0%) | 159 (3.3%) |
| Total | 11,313 (100.0%) | 4,758 (100.0%) |
Physical Housing Characteristics in Cedar Hill
Housing Structures in Cedar Hill
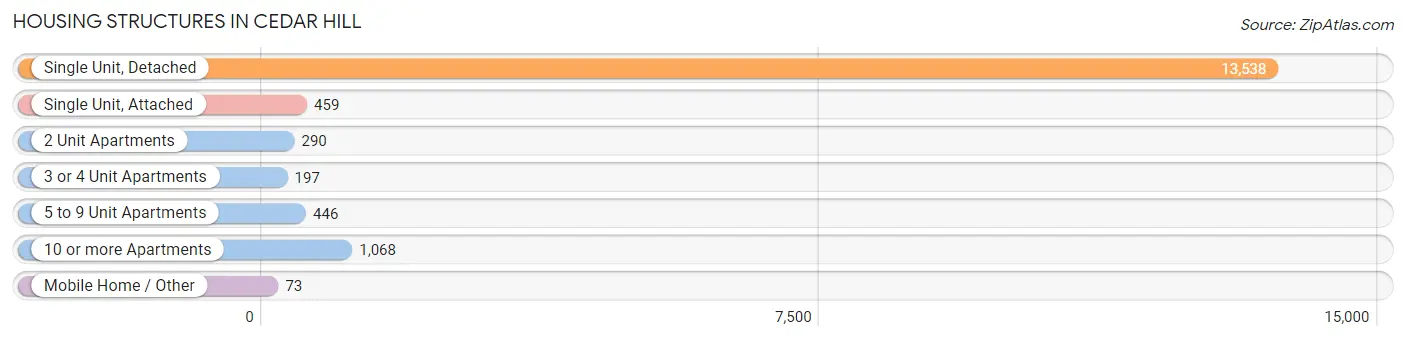
| Structure Type | # Housing Units | % Housing Units |
| Single Unit, Detached | 13,538 | 84.2% |
| Single Unit, Attached | 459 | 2.9% |
| 2 Unit Apartments | 290 | 1.8% |
| 3 or 4 Unit Apartments | 197 | 1.2% |
| 5 to 9 Unit Apartments | 446 | 2.8% |
| 10 or more Apartments | 1,068 | 6.7% |
| Mobile Home / Other | 73 | 0.4% |
| Total | 16,071 | 100.0% |
Housing Structures by Occupancy in Cedar Hill
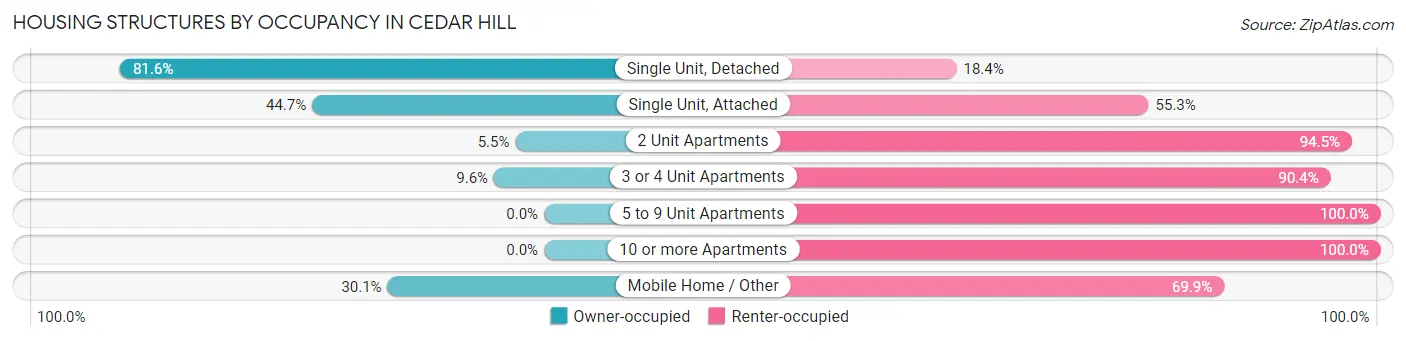
| Structure Type | Owner-occupied | Renter-occupied |
| Single Unit, Detached | 11,051 (81.6%) | 2,487 (18.4%) |
| Single Unit, Attached | 205 (44.7%) | 254 (55.3%) |
| 2 Unit Apartments | 16 (5.5%) | 274 (94.5%) |
| 3 or 4 Unit Apartments | 19 (9.6%) | 178 (90.4%) |
| 5 to 9 Unit Apartments | 0 (0.0%) | 446 (100.0%) |
| 10 or more Apartments | 0 (0.0%) | 1,068 (100.0%) |
| Mobile Home / Other | 22 (30.1%) | 51 (69.9%) |
| Total | 11,313 (70.4%) | 4,758 (29.6%) |
Housing Structures by Number of Rooms in Cedar Hill
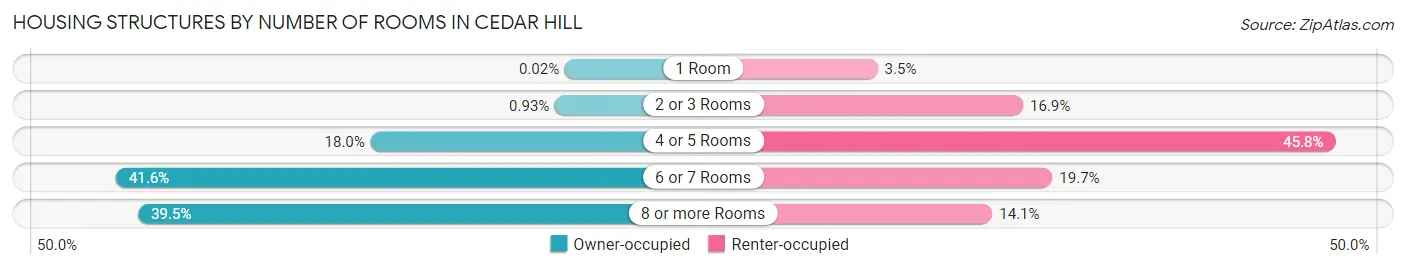
| Number of Rooms | Owner-occupied | Renter-occupied |
| 1 Room | 2 (0.0%) | 166 (3.5%) |
| 2 or 3 Rooms | 105 (0.9%) | 806 (16.9%) |
| 4 or 5 Rooms | 2,036 (18.0%) | 2,180 (45.8%) |
| 6 or 7 Rooms | 4,700 (41.5%) | 935 (19.7%) |
| 8 or more Rooms | 4,470 (39.5%) | 671 (14.1%) |
| Total | 11,313 (100.0%) | 4,758 (100.0%) |
Housing Structure by Heating Type in Cedar Hill
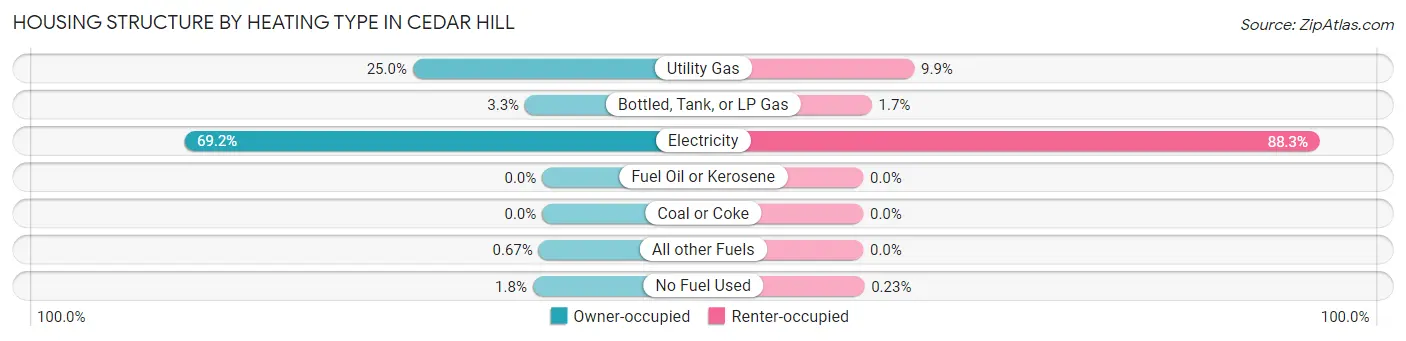
| Heating Type | Owner-occupied | Renter-occupied |
| Utility Gas | 2,828 (25.0%) | 469 (9.9%) |
| Bottled, Tank, or LP Gas | 375 (3.3%) | 79 (1.7%) |
| Electricity | 7,829 (69.2%) | 4,199 (88.2%) |
| Fuel Oil or Kerosene | 0 (0.0%) | 0 (0.0%) |
| Coal or Coke | 0 (0.0%) | 0 (0.0%) |
| All other Fuels | 76 (0.7%) | 0 (0.0%) |
| No Fuel Used | 205 (1.8%) | 11 (0.2%) |
| Total | 11,313 (100.0%) | 4,758 (100.0%) |
Household Vehicle Usage in Cedar Hill
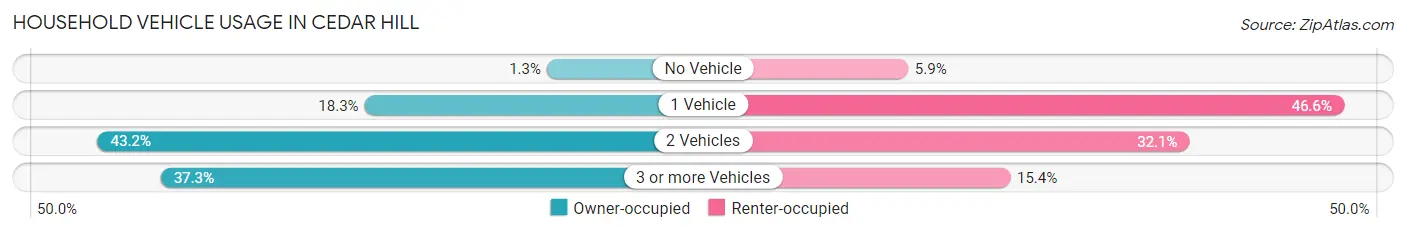
| Vehicles per Household | Owner-occupied | Renter-occupied |
| No Vehicle | 141 (1.3%) | 280 (5.9%) |
| 1 Vehicle | 2,068 (18.3%) | 2,216 (46.6%) |
| 2 Vehicles | 4,885 (43.2%) | 1,529 (32.1%) |
| 3 or more Vehicles | 4,219 (37.3%) | 733 (15.4%) |
| Total | 11,313 (100.0%) | 4,758 (100.0%) |
Real Estate & Mortgages in Cedar Hill
Real Estate and Mortgage Overview in Cedar Hill
| Characteristic | Without Mortgage | With Mortgage |
| Housing Units | 3,219 | 8,094 |
| Median Property Value | $228,800 | $255,600 |
| Median Household Income | $81,141 | $2,431 |
| Monthly Housing Costs | $808 | $984 |
| Real Estate Taxes | $3,859 | $269 |
Property Value by Mortgage Status in Cedar Hill
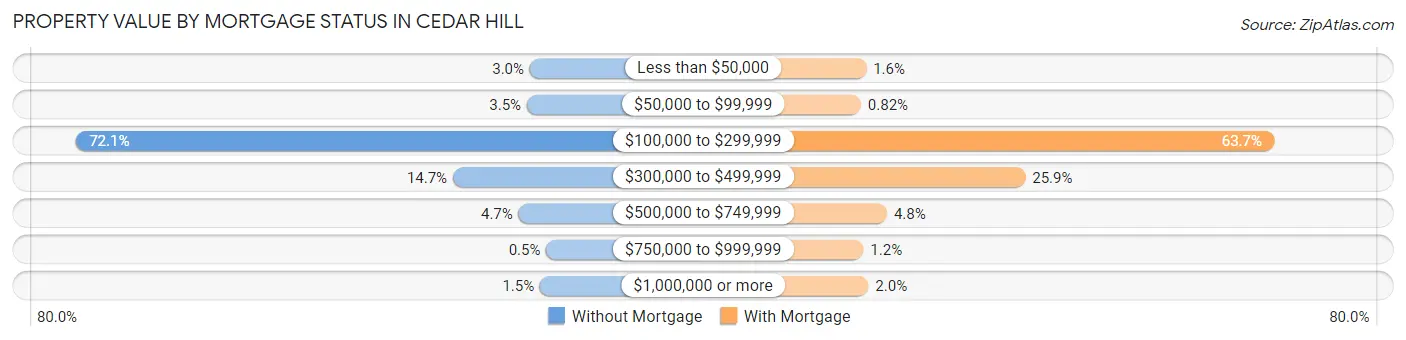
| Property Value | Without Mortgage | With Mortgage |
| Less than $50,000 | 97 (3.0%) | 132 (1.6%) |
| $50,000 to $99,999 | 111 (3.5%) | 66 (0.8%) |
| $100,000 to $299,999 | 2,322 (72.1%) | 5,158 (63.7%) |
| $300,000 to $499,999 | 474 (14.7%) | 2,094 (25.9%) |
| $500,000 to $749,999 | 152 (4.7%) | 388 (4.8%) |
| $750,000 to $999,999 | 16 (0.5%) | 97 (1.2%) |
| $1,000,000 or more | 47 (1.5%) | 159 (2.0%) |
| Total | 3,219 (100.0%) | 8,094 (100.0%) |
Household Income by Mortgage Status in Cedar Hill
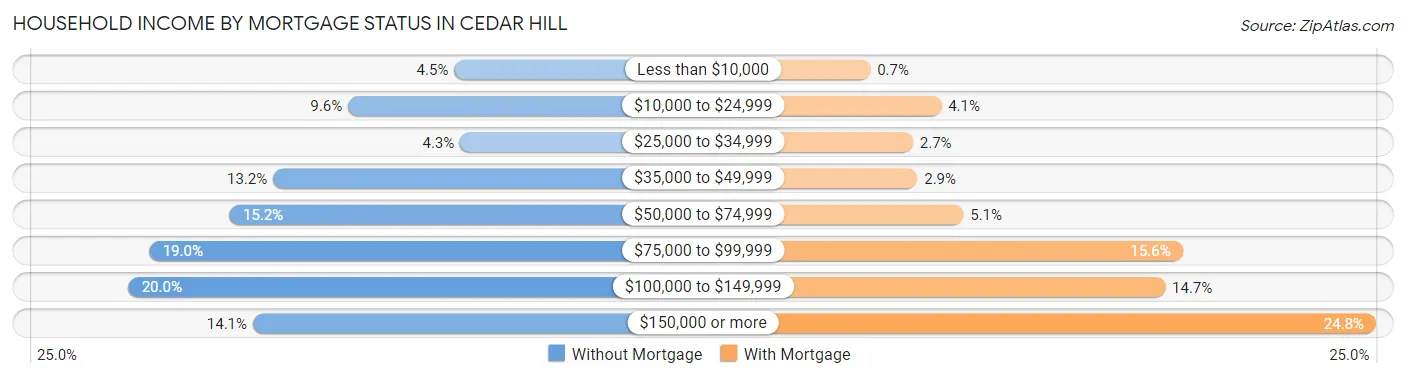
| Household Income | Without Mortgage | With Mortgage |
| Less than $10,000 | 146 (4.5%) | 57 (0.7%) |
| $10,000 to $24,999 | 309 (9.6%) | 330 (4.1%) |
| $25,000 to $34,999 | 137 (4.3%) | 221 (2.7%) |
| $35,000 to $49,999 | 424 (13.2%) | 238 (2.9%) |
| $50,000 to $74,999 | 490 (15.2%) | 415 (5.1%) |
| $75,000 to $99,999 | 613 (19.0%) | 1,260 (15.6%) |
| $100,000 to $149,999 | 645 (20.0%) | 1,193 (14.7%) |
| $150,000 or more | 455 (14.1%) | 2,006 (24.8%) |
| Total | 3,219 (100.0%) | 8,094 (100.0%) |
Property Value to Household Income Ratio in Cedar Hill
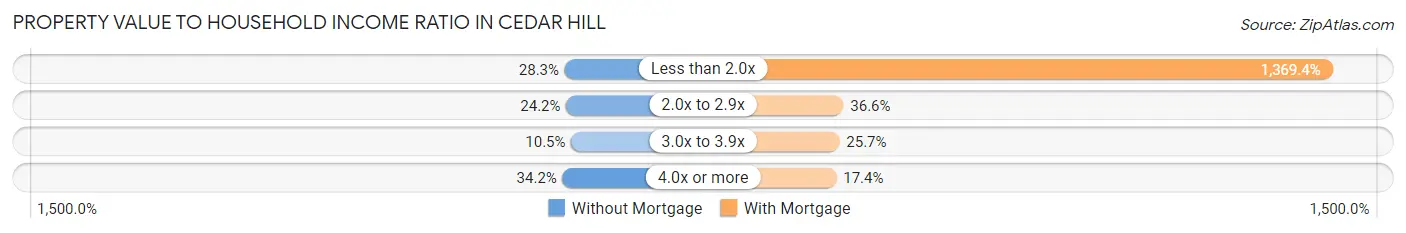
| Value-to-Income Ratio | Without Mortgage | With Mortgage |
| Less than 2.0x | 911 (28.3%) | 110,839 (1,369.4%) |
| 2.0x to 2.9x | 779 (24.2%) | 2,961 (36.6%) |
| 3.0x to 3.9x | 338 (10.5%) | 2,083 (25.7%) |
| 4.0x or more | 1,102 (34.2%) | 1,410 (17.4%) |
| Total | 3,219 (100.0%) | 8,094 (100.0%) |
Real Estate Taxes by Mortgage Status in Cedar Hill
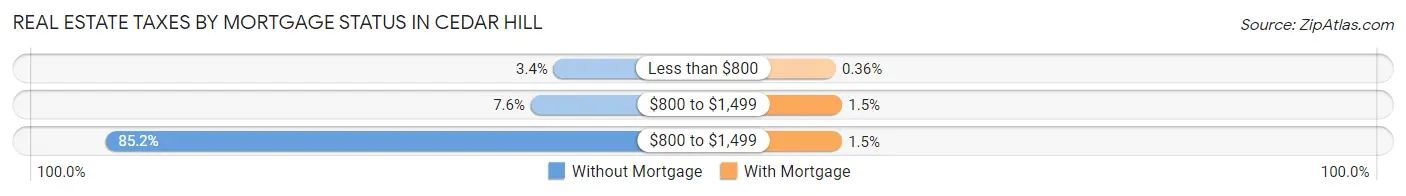
| Property Taxes | Without Mortgage | With Mortgage |
| Less than $800 | 108 (3.4%) | 29 (0.4%) |
| $800 to $1,499 | 243 (7.5%) | 122 (1.5%) |
| $800 to $1,499 | 2,744 (85.2%) | 121 (1.5%) |
| Total | 3,219 (100.0%) | 8,094 (100.0%) |
Health & Disability in Cedar Hill
Health Insurance Coverage by Age in Cedar Hill
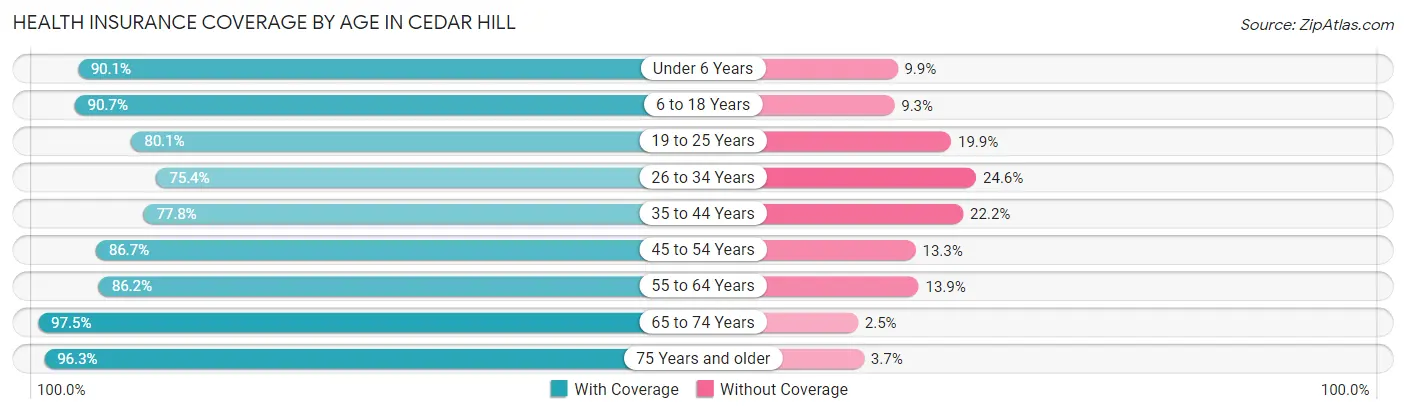
| Age Bracket | With Coverage | Without Coverage |
| Under 6 Years | 3,447 (90.1%) | 379 (9.9%) |
| 6 to 18 Years | 9,195 (90.7%) | 945 (9.3%) |
| 19 to 25 Years | 3,551 (80.1%) | 883 (19.9%) |
| 26 to 34 Years | 4,330 (75.4%) | 1,411 (24.6%) |
| 35 to 44 Years | 4,921 (77.8%) | 1,402 (22.2%) |
| 45 to 54 Years | 5,752 (86.7%) | 881 (13.3%) |
| 55 to 64 Years | 5,320 (86.2%) | 855 (13.9%) |
| 65 to 74 Years | 4,008 (97.5%) | 104 (2.5%) |
| 75 Years and older | 1,131 (96.3%) | 43 (3.7%) |
| Total | 41,655 (85.8%) | 6,903 (14.2%) |
Health Insurance Coverage by Citizenship Status in Cedar Hill
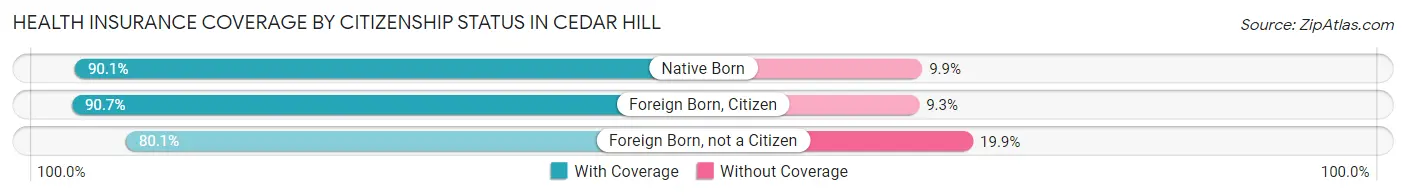
| Citizenship Status | With Coverage | Without Coverage |
| Native Born | 3,447 (90.1%) | 379 (9.9%) |
| Foreign Born, Citizen | 9,195 (90.7%) | 945 (9.3%) |
| Foreign Born, not a Citizen | 3,551 (80.1%) | 883 (19.9%) |
Health Insurance Coverage by Household Income in Cedar Hill
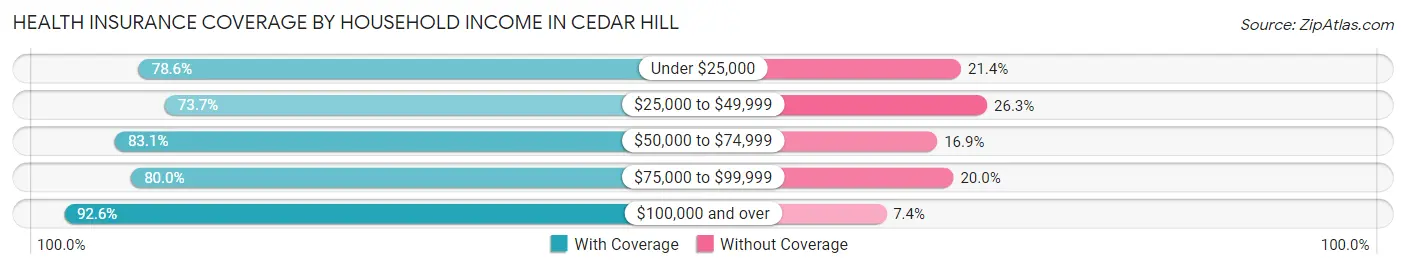
| Household Income | With Coverage | Without Coverage |
| Under $25,000 | 2,925 (78.6%) | 797 (21.4%) |
| $25,000 to $49,999 | 4,099 (73.7%) | 1,462 (26.3%) |
| $50,000 to $74,999 | 5,827 (83.1%) | 1,188 (16.9%) |
| $75,000 to $99,999 | 6,519 (80.0%) | 1,629 (20.0%) |
| $100,000 and over | 22,004 (92.6%) | 1,753 (7.4%) |
Public vs Private Health Insurance Coverage by Age in Cedar Hill
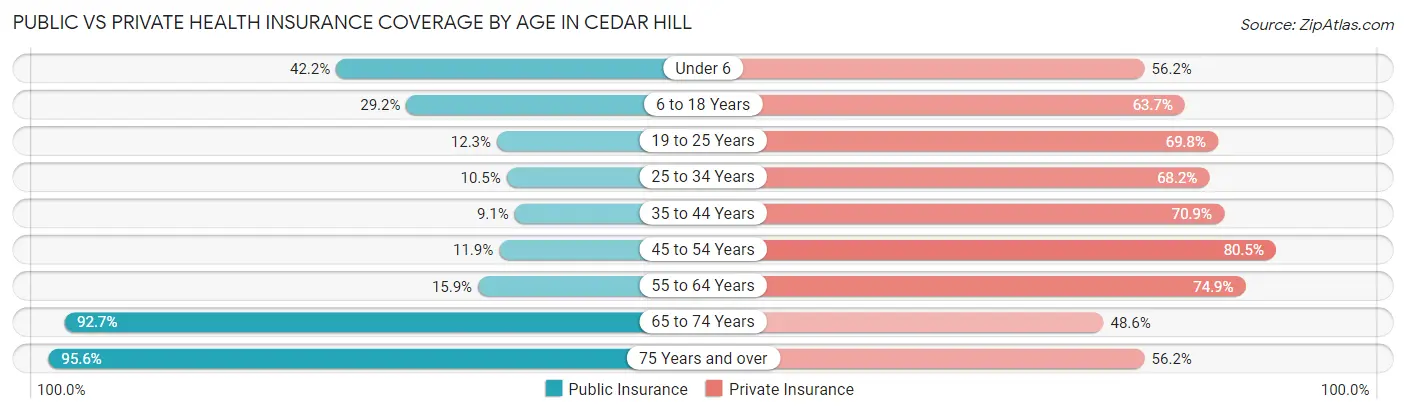
| Age Bracket | Public Insurance | Private Insurance |
| Under 6 | 1,614 (42.2%) | 2,151 (56.2%) |
| 6 to 18 Years | 2,956 (29.1%) | 6,454 (63.6%) |
| 19 to 25 Years | 547 (12.3%) | 3,094 (69.8%) |
| 25 to 34 Years | 605 (10.5%) | 3,915 (68.2%) |
| 35 to 44 Years | 573 (9.1%) | 4,483 (70.9%) |
| 45 to 54 Years | 791 (11.9%) | 5,342 (80.5%) |
| 55 to 64 Years | 979 (15.9%) | 4,625 (74.9%) |
| 65 to 74 Years | 3,810 (92.7%) | 1,998 (48.6%) |
| 75 Years and over | 1,122 (95.6%) | 660 (56.2%) |
| Total | 12,997 (26.8%) | 32,722 (67.4%) |
Disability Status by Sex by Age in Cedar Hill
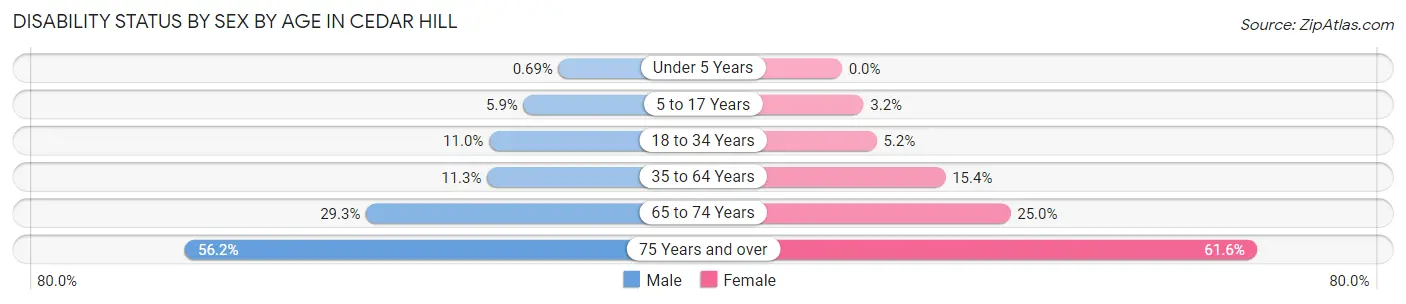
| Age Bracket | Male | Female |
| Under 5 Years | 10 (0.7%) | 0 (0.0%) |
| 5 to 17 Years | 336 (5.9%) | 159 (3.2%) |
| 18 to 34 Years | 572 (11.0%) | 279 (5.1%) |
| 35 to 64 Years | 965 (11.3%) | 1,626 (15.4%) |
| 65 to 74 Years | 566 (29.3%) | 545 (25.0%) |
| 75 Years and over | 323 (56.2%) | 369 (61.6%) |
Disability Class by Sex by Age in Cedar Hill
Disability Class: Hearing Difficulty
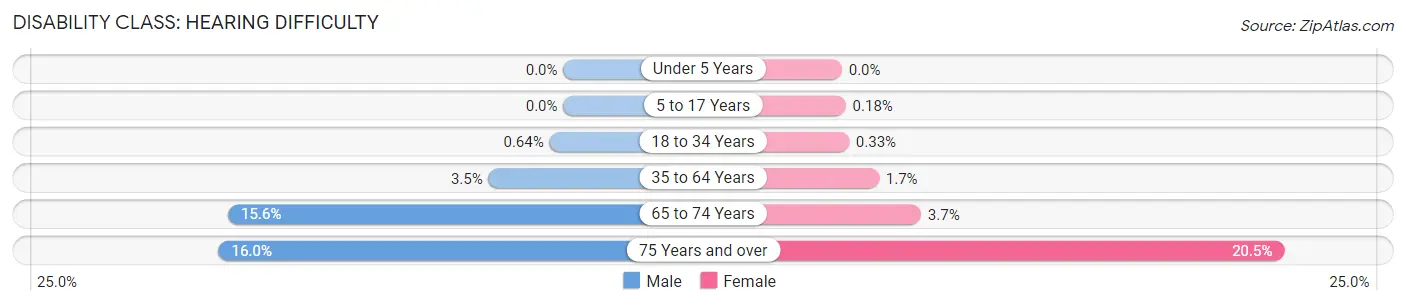
| Age Bracket | Male | Female |
| Under 5 Years | 0 (0.0%) | 0 (0.0%) |
| 5 to 17 Years | 0 (0.0%) | 9 (0.2%) |
| 18 to 34 Years | 33 (0.6%) | 18 (0.3%) |
| 35 to 64 Years | 297 (3.5%) | 182 (1.7%) |
| 65 to 74 Years | 301 (15.6%) | 80 (3.7%) |
| 75 Years and over | 92 (16.0%) | 123 (20.5%) |
Disability Class: Vision Difficulty
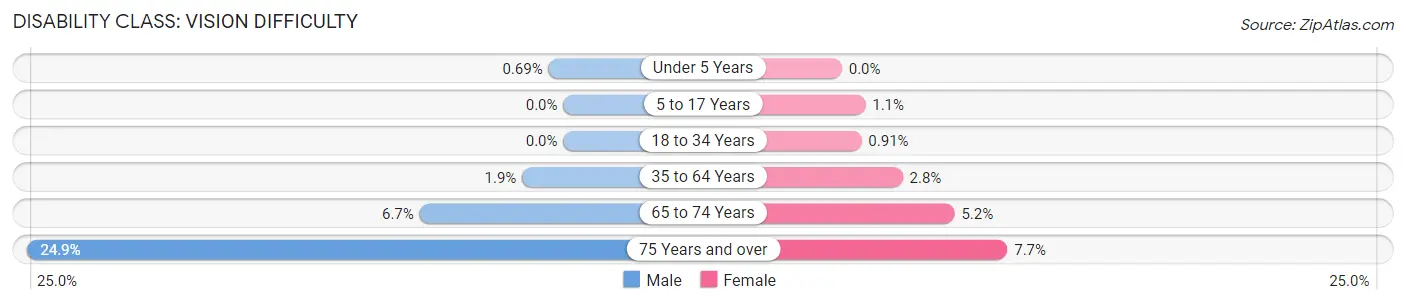
| Age Bracket | Male | Female |
| Under 5 Years | 10 (0.7%) | 0 (0.0%) |
| 5 to 17 Years | 0 (0.0%) | 54 (1.1%) |
| 18 to 34 Years | 0 (0.0%) | 49 (0.9%) |
| 35 to 64 Years | 163 (1.9%) | 298 (2.8%) |
| 65 to 74 Years | 129 (6.7%) | 114 (5.2%) |
| 75 Years and over | 143 (24.9%) | 46 (7.7%) |
Disability Class: Cognitive Difficulty
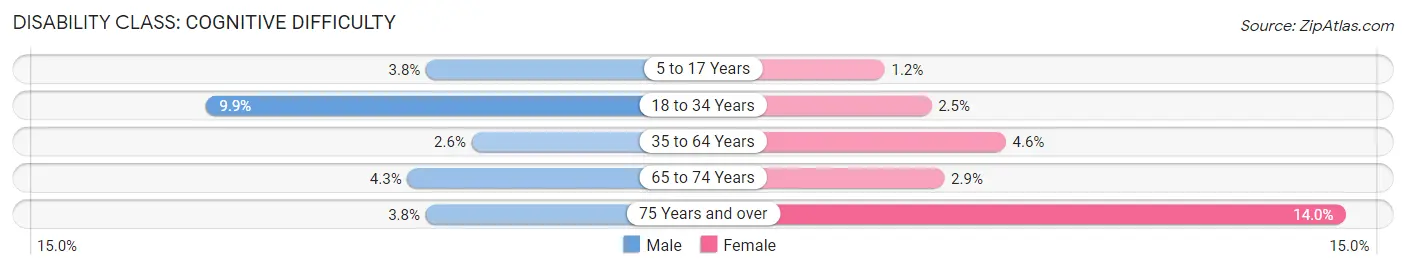
| Age Bracket | Male | Female |
| 5 to 17 Years | 218 (3.8%) | 59 (1.2%) |
| 18 to 34 Years | 516 (9.9%) | 135 (2.5%) |
| 35 to 64 Years | 218 (2.5%) | 483 (4.6%) |
| 65 to 74 Years | 84 (4.3%) | 62 (2.9%) |
| 75 Years and over | 22 (3.8%) | 84 (14.0%) |
Disability Class: Ambulatory Difficulty
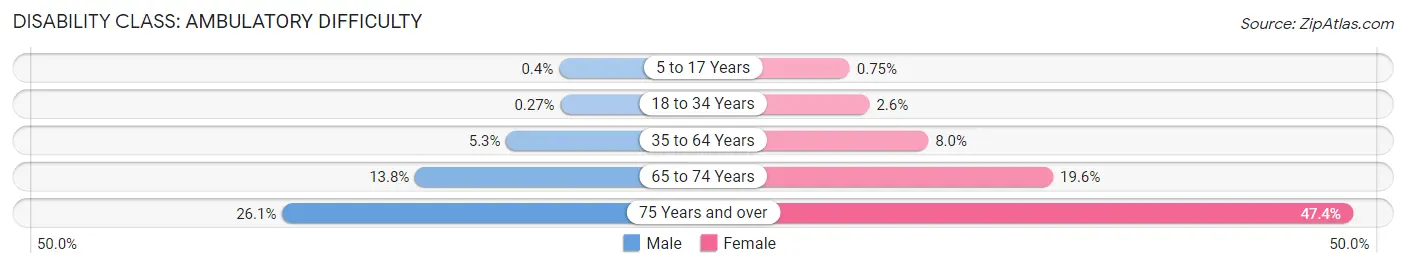
| Age Bracket | Male | Female |
| 5 to 17 Years | 23 (0.4%) | 37 (0.7%) |
| 18 to 34 Years | 14 (0.3%) | 139 (2.6%) |
| 35 to 64 Years | 452 (5.3%) | 849 (8.0%) |
| 65 to 74 Years | 266 (13.8%) | 427 (19.6%) |
| 75 Years and over | 150 (26.1%) | 284 (47.4%) |
Disability Class: Self-Care Difficulty
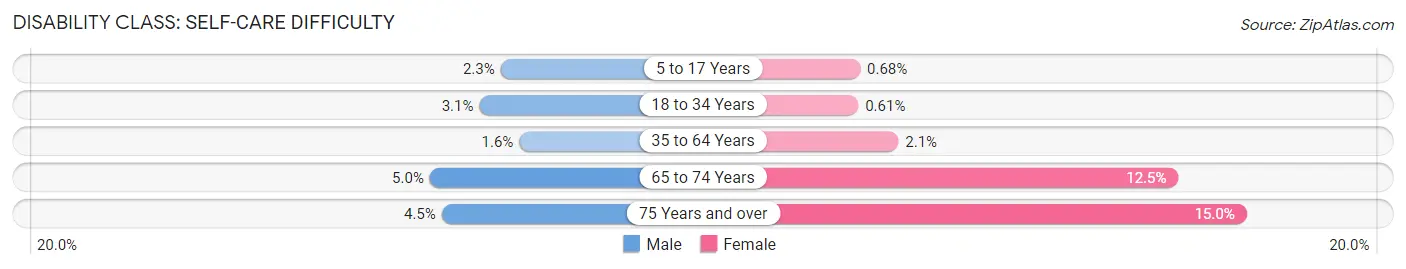
| Age Bracket | Male | Female |
| 5 to 17 Years | 133 (2.3%) | 34 (0.7%) |
| 18 to 34 Years | 162 (3.1%) | 33 (0.6%) |
| 35 to 64 Years | 140 (1.6%) | 222 (2.1%) |
| 65 to 74 Years | 96 (5.0%) | 272 (12.5%) |
| 75 Years and over | 26 (4.5%) | 90 (15.0%) |
Technology Access in Cedar Hill
Computing Device Access in Cedar Hill
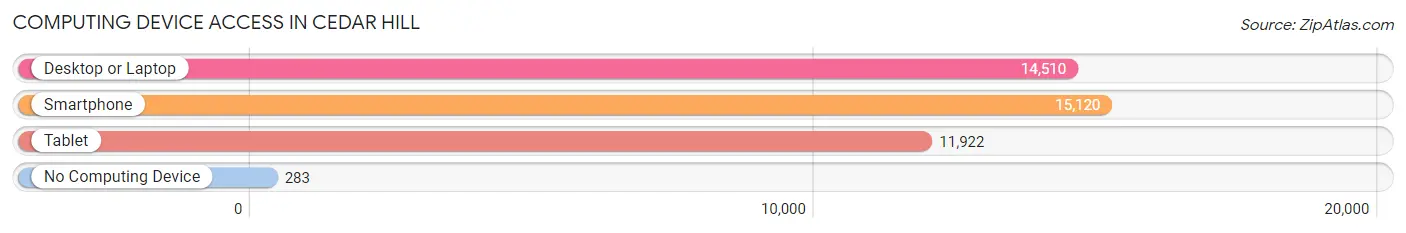
| Device Type | # Households | % Households |
| Desktop or Laptop | 14,510 | 90.3% |
| Smartphone | 15,120 | 94.1% |
| Tablet | 11,922 | 74.2% |
| No Computing Device | 283 | 1.8% |
| Total | 16,071 | 100.0% |
Internet Access in Cedar Hill
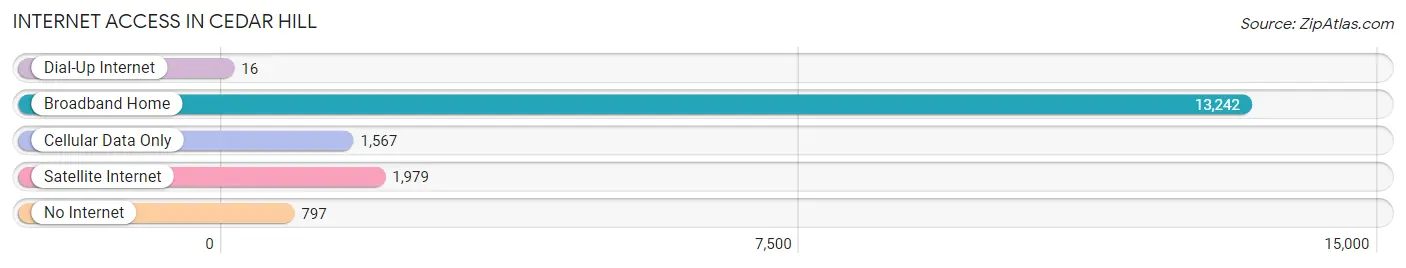
| Internet Type | # Households | % Households |
| Dial-Up Internet | 16 | 0.1% |
| Broadband Home | 13,242 | 82.4% |
| Cellular Data Only | 1,567 | 9.8% |
| Satellite Internet | 1,979 | 12.3% |
| No Internet | 797 | 5.0% |
| Total | 16,071 | 100.0% |
Cedar Hill Summary
Cedar Hill is a city located in Dallas and Ellis Counties in the state of Texas. It is part of the Dallas-Fort Worth-Arlington metropolitan area and is located approximately 16 miles southwest of downtown Dallas. The city had a population of 45,028 at the 2010 census, making it the third largest city in Dallas County.
History
Cedar Hill was founded in 1846 by a small group of settlers from the Peters Colony. The area was originally known as Cedar Hill because of the abundance of cedar trees in the area. The settlers built a log cabin schoolhouse and a church, and the area quickly grew. By the late 1800s, Cedar Hill had become a thriving community with a population of over 500.
In the early 1900s, the city began to experience rapid growth due to the arrival of the railroad. The population increased to over 1,000 by 1910 and to over 2,000 by 1920. The city was officially incorporated in 1969 and has since grown to become the third largest city in Dallas County.
Geography
Cedar Hill is located at 32°35'25" North, 96°56'45" West (32.590278, -96.945278). The city is situated on the eastern edge of the Dallas-Fort Worth Metroplex, approximately 16 miles southwest of downtown Dallas. The city covers an area of 24.2 square miles and has an elevation of 645 feet.
The city is located in the Blackland Prairie region of Texas, which is characterized by rolling hills and grasslands. The area is known for its rich soil and abundant wildlife. The city is also home to several parks and recreational areas, including Cedar Hill State Park, Joe Pool Lake, and Cedar Hill Nature Preserve.
Economy
Cedar Hill is a rapidly growing city with a diverse economy. The city is home to several major employers, including the University of Texas at Dallas, Dallas County Community College District, and the Dallas/Fort Worth International Airport. The city also has a thriving retail sector, with several major shopping centers and outlets.
The city is also home to several major manufacturing companies, including Texas Instruments, Lockheed Martin, and Raytheon. The city is also home to several major healthcare providers, including Texas Health Resources and Baylor Scott & White Health.
Demographics
As of the 2010 census, the city had a population of 45,028. The racial makeup of the city was 57.2% White, 24.3% African American, 0.7% Native American, 3.2% Asian, 0.1% Pacific Islander, 11.7% from other races, and 2.8% from two or more races. Hispanic or Latino of any race were 24.3% of the population.
The median income for a household in the city was $50,945, and the median income for a family was $60,945. The per capita income for the city was $25,945. About 11.7% of families and 14.3% of the population were below the poverty line, including 19.3% of those under age 18 and 8.3% of those age 65 or over.
Common Questions
What is Per Capita Income in Cedar Hill?
Per Capita income in Cedar Hill is $35,280.
What is the Median Family Income in Cedar Hill?
Median Family Income in Cedar Hill is $98,413.
What is the Median Household income in Cedar Hill?
Median Household Income in Cedar Hill is $84,132.
What is Income or Wage Gap in Cedar Hill?
Income or Wage Gap in Cedar Hill is 15.4%.
Women in Cedar Hill earn 84.6 cents for every dollar earned by a man.
What is Family Income Deficit in Cedar Hill?
Family Income Deficit in Cedar Hill is $10,862.
Families that are below poverty line in Cedar Hill earn $10,862 less on average than the poverty threshold level.
What is Inequality or Gini Index in Cedar Hill?
Inequality or Gini Index in Cedar Hill is 0.41.
What is the Total Population of Cedar Hill?
Total Population of Cedar Hill is 48,733.
What is the Total Male Population of Cedar Hill?
Total Male Population of Cedar Hill is 23,522.
What is the Total Female Population of Cedar Hill?
Total Female Population of Cedar Hill is 25,211.
What is the Ratio of Males per 100 Females in Cedar Hill?
There are 93.30 Males per 100 Females in Cedar Hill.
What is the Ratio of Females per 100 Males in Cedar Hill?
There are 107.18 Females per 100 Males in Cedar Hill.
What is the Median Population Age in Cedar Hill?
Median Population Age in Cedar Hill is 35.3 Years.
What is the Average Family Size in Cedar Hill
Average Family Size in Cedar Hill is 3.6 People.
What is the Average Household Size in Cedar Hill
Average Household Size in Cedar Hill is 3.0 People.
How Large is the Labor Force in Cedar Hill?
There are 25,650 People in the Labor Forcein in Cedar Hill.
What is the Percentage of People in the Labor Force in Cedar Hill?
69.7% of People are in the Labor Force in Cedar Hill.
What is the Unemployment Rate in Cedar Hill?
Unemployment Rate in Cedar Hill is 6.9%.