Carbon, TX Map & Demographics
Carbon Map
Carbon Overview
$35,706
PER CAPITA INCOME
$56,406
AVG FAMILY INCOME
$55,833
AVG HOUSEHOLD INCOME
0.49
INEQUALITY / GINI INDEX
287
TOTAL POPULATION
154
MALE POPULATION
133
FEMALE POPULATION
115.79
MALES / 100 FEMALES
86.36
FEMALES / 100 MALES
40.9
MEDIAN AGE
3.4
AVG FAMILY SIZE
2.6
AVG HOUSEHOLD SIZE
113
LABOR FORCE [ PEOPLE ]
49.8%
PERCENT IN LABOR FORCE
3.5%
UNEMPLOYMENT RATE
Carbon Zip Codes
Carbon Area Codes
Income in Carbon
Income Overview in Carbon
Per Capita Income in Carbon is $35,706, while median incomes of families and households are $56,406 and $55,833 respectively.
| Characteristic | Number | Measure |
| Per Capita Income | 287 | $35,706 |
| Median Family Income | 73 | $56,406 |
| Mean Family Income | 73 | $85,627 |
| Median Household Income | 112 | $55,833 |
| Mean Household Income | 112 | $79,834 |
| Income Deficit | 73 | $0 |
| Wage / Income Gap (%) | 287 | 0.00% |
| Wage / Income Gap ($) | 287 | 100.00¢ per $1 |
| Gini / Inequality Index | 287 | 0.49 |
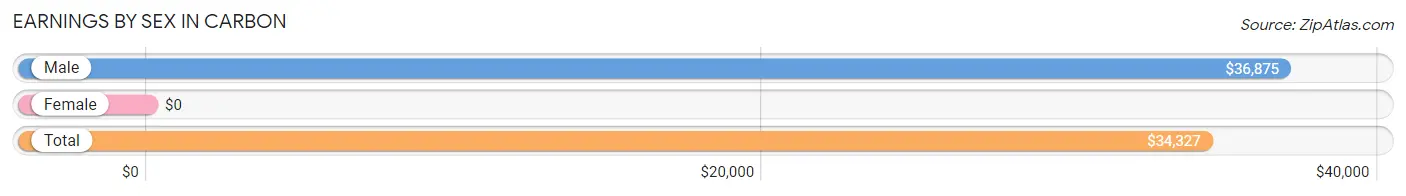
Earnings by Sex in Carbon
| Sex | Number | Average Earnings |
| Male | 73 (62.4%) | $36,875 |
| Female | 44 (37.6%) | $0 |
| Total | 117 (100.0%) | $34,327 |
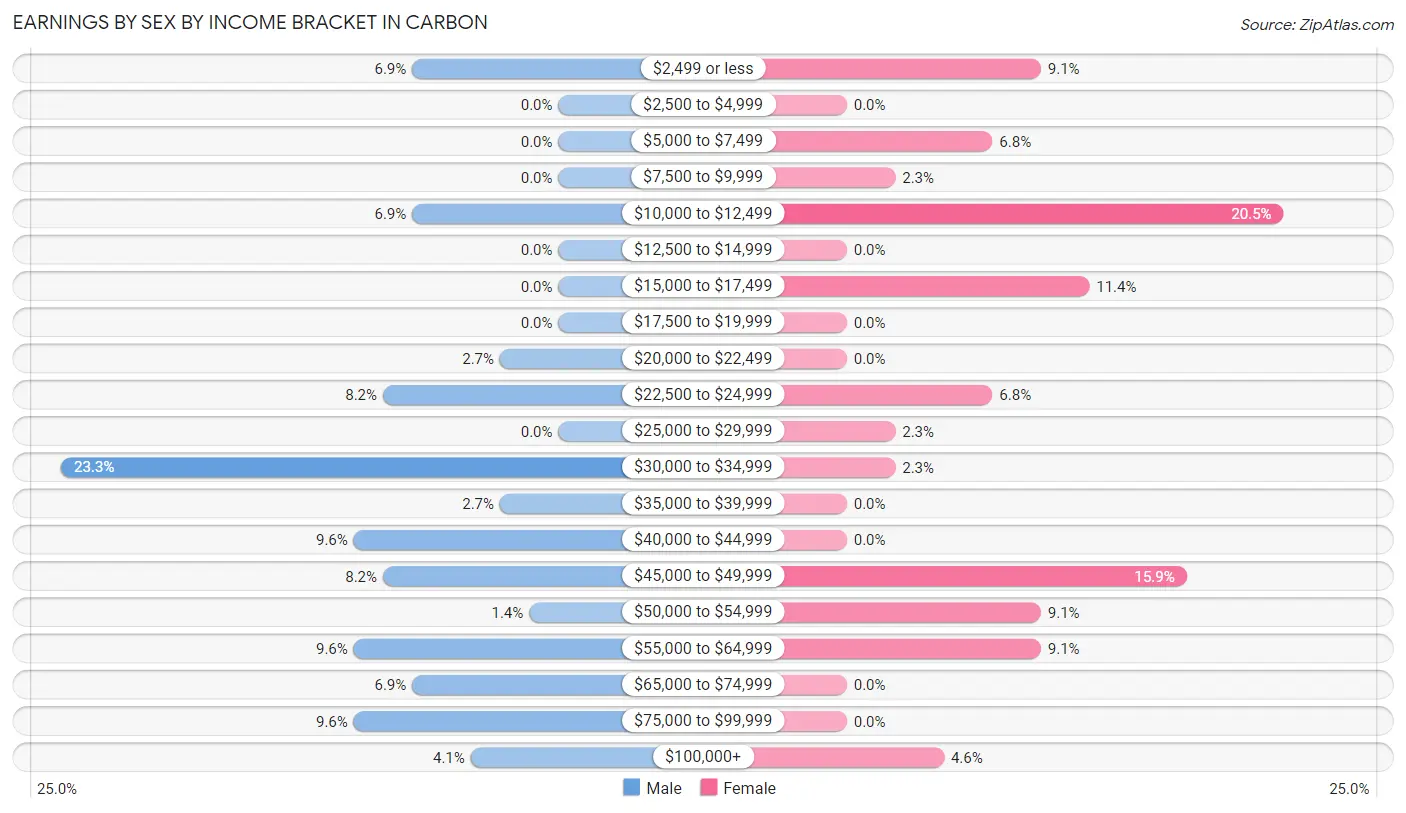
Earnings by Sex by Income Bracket in Carbon
The most common earnings brackets in Carbon are $30,000 to $34,999 for men (17 | 23.3%) and $10,000 to $12,499 for women (9 | 20.4%).
| Income | Male | Female |
| $2,499 or less | 5 (6.9%) | 4 (9.1%) |
| $2,500 to $4,999 | 0 (0.0%) | 0 (0.0%) |
| $5,000 to $7,499 | 0 (0.0%) | 3 (6.8%) |
| $7,500 to $9,999 | 0 (0.0%) | 1 (2.3%) |
| $10,000 to $12,499 | 5 (6.9%) | 9 (20.4%) |
| $12,500 to $14,999 | 0 (0.0%) | 0 (0.0%) |
| $15,000 to $17,499 | 0 (0.0%) | 5 (11.4%) |
| $17,500 to $19,999 | 0 (0.0%) | 0 (0.0%) |
| $20,000 to $22,499 | 2 (2.7%) | 0 (0.0%) |
| $22,500 to $24,999 | 6 (8.2%) | 3 (6.8%) |
| $25,000 to $29,999 | 0 (0.0%) | 1 (2.3%) |
| $30,000 to $34,999 | 17 (23.3%) | 1 (2.3%) |
| $35,000 to $39,999 | 2 (2.7%) | 0 (0.0%) |
| $40,000 to $44,999 | 7 (9.6%) | 0 (0.0%) |
| $45,000 to $49,999 | 6 (8.2%) | 7 (15.9%) |
| $50,000 to $54,999 | 1 (1.4%) | 4 (9.1%) |
| $55,000 to $64,999 | 7 (9.6%) | 4 (9.1%) |
| $65,000 to $74,999 | 5 (6.9%) | 0 (0.0%) |
| $75,000 to $99,999 | 7 (9.6%) | 0 (0.0%) |
| $100,000+ | 3 (4.1%) | 2 (4.5%) |
| Total | 73 (100.0%) | 44 (100.0%) |
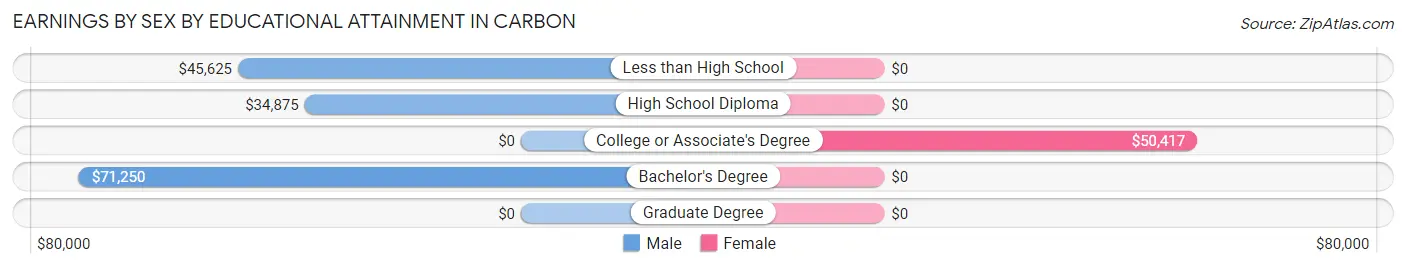
Earnings by Sex by Educational Attainment in Carbon
| Educational Attainment | Male Income | Female Income |
| Less than High School | $45,625 | $0 |
| High School Diploma | $34,875 | $0 |
| College or Associate's Degree | - | - |
| Bachelor's Degree | $71,250 | $0 |
| Graduate Degree | - | - |
| Total | $43,000 | $0 |
Family Income in Carbon
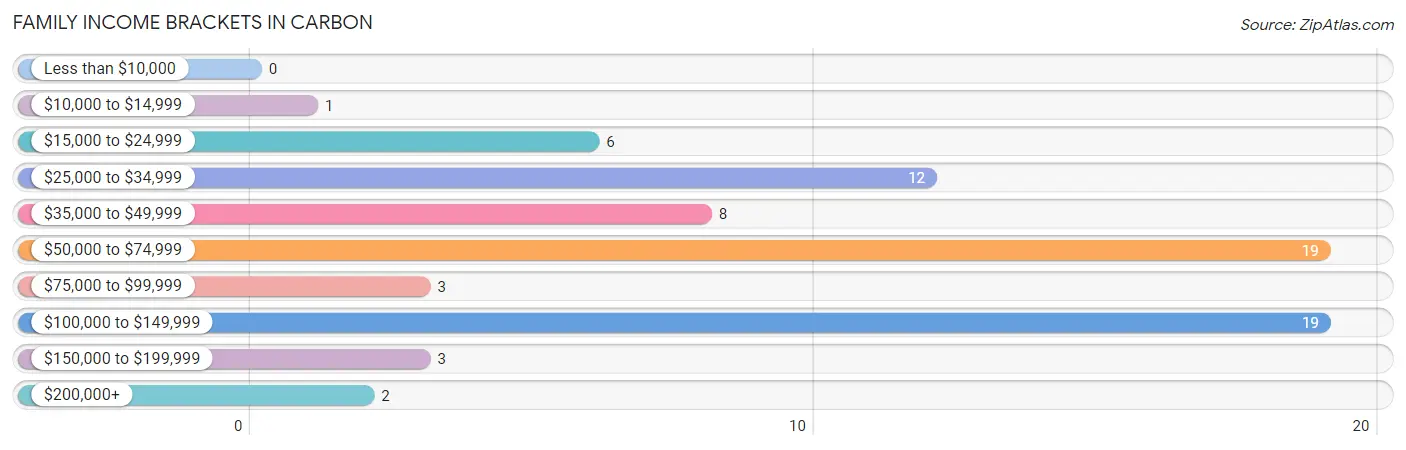
Family Income Brackets in Carbon
According to the Carbon family income data, there are 19 families falling into the $50,000 to $74,999 income range, which is the most common income bracket and makes up 26.0% of all families.
| Income Bracket | # Families | % Families |
| Less than $10,000 | 0 | 0.0% |
| $10,000 to $14,999 | 1 | 1.4% |
| $15,000 to $24,999 | 6 | 8.2% |
| $25,000 to $34,999 | 12 | 16.4% |
| $35,000 to $49,999 | 8 | 11.0% |
| $50,000 to $74,999 | 19 | 26.0% |
| $75,000 to $99,999 | 3 | 4.1% |
| $100,000 to $149,999 | 19 | 26.0% |
| $150,000 to $199,999 | 3 | 4.1% |
| $200,000+ | 2 | 2.7% |
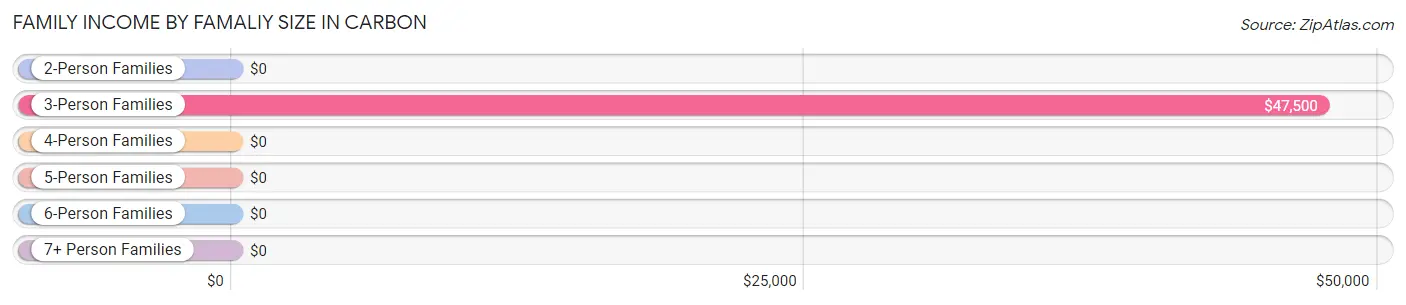
Family Income by Famaliy Size in Carbon
3-person families (6 | 8.2%) account for the highest median family income in Carbon with $47,500 per family, while 3-person families (6 | 8.2%) have the highest median income of $15,833 per family member.
| Income Bracket | # Families | Median Income |
| 2-Person Families | 34 (46.6%) | $0 |
| 3-Person Families | 6 (8.2%) | $47,500 |
| 4-Person Families | 18 (24.7%) | $0 |
| 5-Person Families | 10 (13.7%) | $0 |
| 6-Person Families | 0 (0.0%) | $0 |
| 7+ Person Families | 5 (6.9%) | $0 |
| Total | 73 (100.0%) | $56,406 |
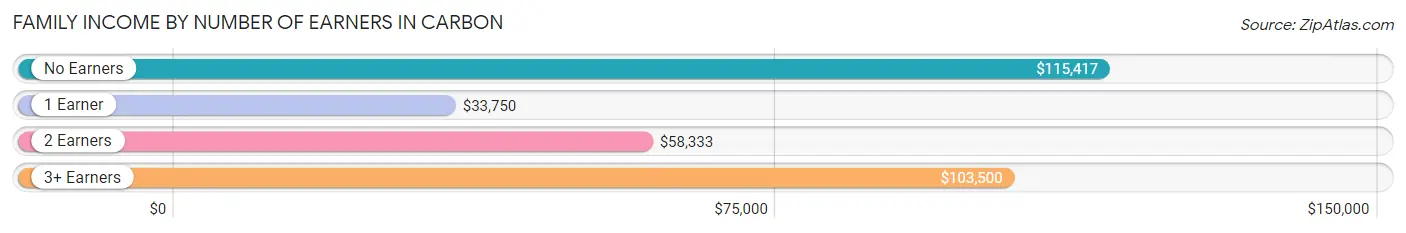
Family Income by Number of Earners in Carbon
The median family income in Carbon is $56,406, with families comprising no earners (10) having the highest median family income of $115,417, while families with 1 earner (27) have the lowest median family income of $33,750, accounting for 13.7% and 37.0% of families, respectively.
| Number of Earners | # Families | Median Income |
| No Earners | 10 (13.7%) | $115,417 |
| 1 Earner | 27 (37.0%) | $33,750 |
| 2 Earners | 28 (38.4%) | $58,333 |
| 3+ Earners | 8 (11.0%) | $103,500 |
| Total | 73 (100.0%) | $56,406 |
Household Income in Carbon
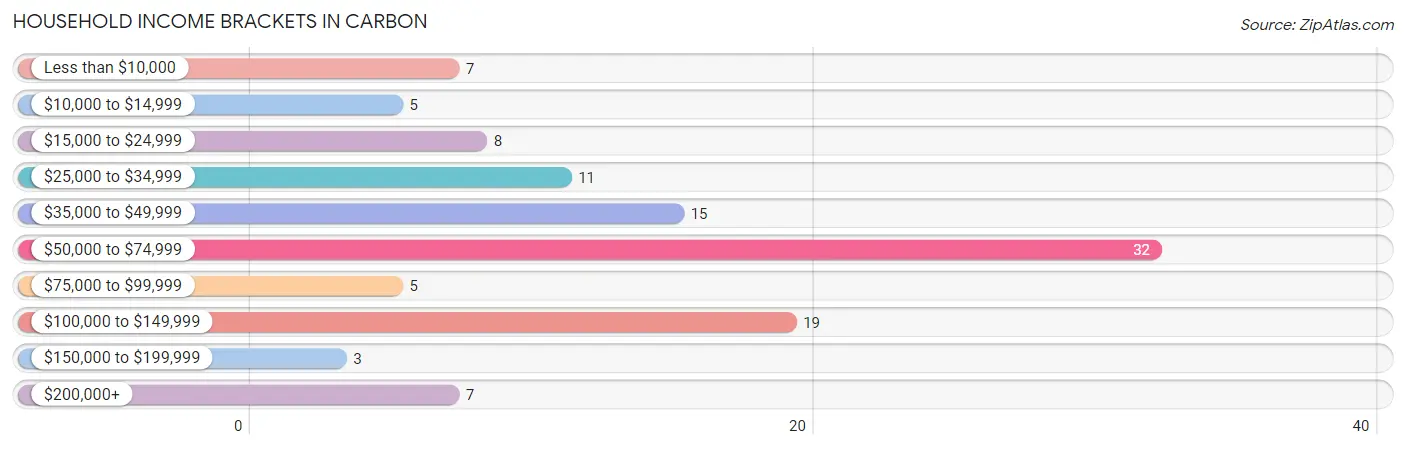
Household Income Brackets in Carbon
With 32 households falling in the category, the $50,000 to $74,999 income range is the most frequent in Carbon, accounting for 28.6% of all households. In contrast, only 3 households (2.7%) fall into the $150,000 to $199,999 income bracket, making it the least populous group.
| Income Bracket | # Households | % Households |
| Less than $10,000 | 7 | 6.3% |
| $10,000 to $14,999 | 5 | 4.5% |
| $15,000 to $24,999 | 8 | 7.1% |
| $25,000 to $34,999 | 11 | 9.8% |
| $35,000 to $49,999 | 15 | 13.4% |
| $50,000 to $74,999 | 32 | 28.6% |
| $75,000 to $99,999 | 5 | 4.5% |
| $100,000 to $149,999 | 19 | 17.0% |
| $150,000 to $199,999 | 3 | 2.7% |
| $200,000+ | 7 | 6.3% |
Household Income by Householder Age in Carbon
The median household income in Carbon is $55,833, with the highest median household income of $56,563 found in the 25 to 44 years age bracket for the primary householder. A total of 38 households (33.9%) fall into this category.
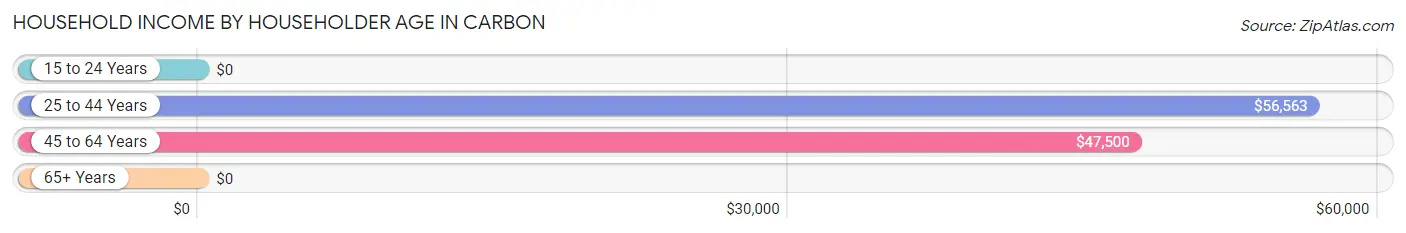
| Income Bracket | # Households | Median Income |
| 15 to 24 Years | 0 (0.0%) | $0 |
| 25 to 44 Years | 38 (33.9%) | $56,563 |
| 45 to 64 Years | 40 (35.7%) | $47,500 |
| 65+ Years | 34 (30.4%) | $0 |
| Total | 112 (100.0%) | $55,833 |
Poverty in Carbon
Income Below Poverty by Sex and Age in Carbon
With 9.1% poverty level for males and 17.3% for females among the residents of Carbon, 35 to 44 year old males and 6 to 11 year old females are the most vulnerable to poverty, with 8 males (47.1%) and 8 females (44.4%) in their respective age groups living below the poverty level.
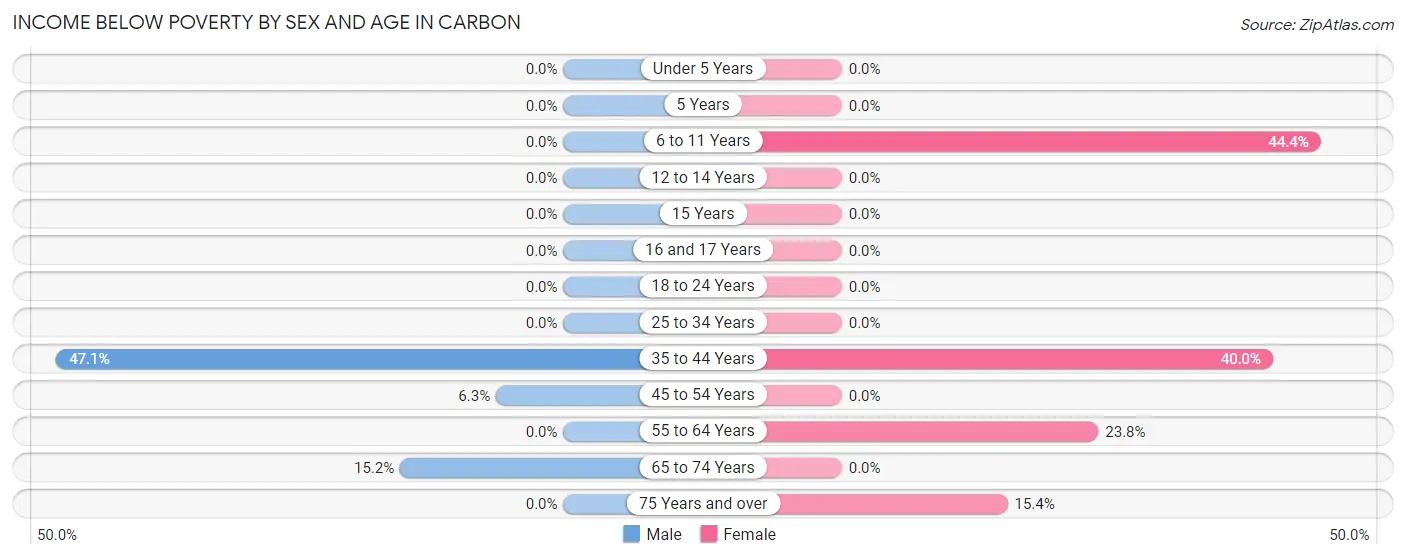
| Age Bracket | Male | Female |
| Under 5 Years | 0 (0.0%) | 0 (0.0%) |
| 5 Years | 0 (0.0%) | 0 (0.0%) |
| 6 to 11 Years | 0 (0.0%) | 8 (44.4%) |
| 12 to 14 Years | 0 (0.0%) | 0 (0.0%) |
| 15 Years | 0 (0.0%) | 0 (0.0%) |
| 16 and 17 Years | 0 (0.0%) | 0 (0.0%) |
| 18 to 24 Years | 0 (0.0%) | 0 (0.0%) |
| 25 to 34 Years | 0 (0.0%) | 0 (0.0%) |
| 35 to 44 Years | 8 (47.1%) | 8 (40.0%) |
| 45 to 54 Years | 1 (6.2%) | 0 (0.0%) |
| 55 to 64 Years | 0 (0.0%) | 5 (23.8%) |
| 65 to 74 Years | 5 (15.1%) | 0 (0.0%) |
| 75 Years and over | 0 (0.0%) | 2 (15.4%) |
| Total | 14 (9.1%) | 23 (17.3%) |
Income Above Poverty by Sex and Age in Carbon
According to the poverty statistics in Carbon, males aged under 5 years and females aged under 5 years are the age groups that are most secure financially, with 100.0% of males and 100.0% of females in these age groups living above the poverty line.
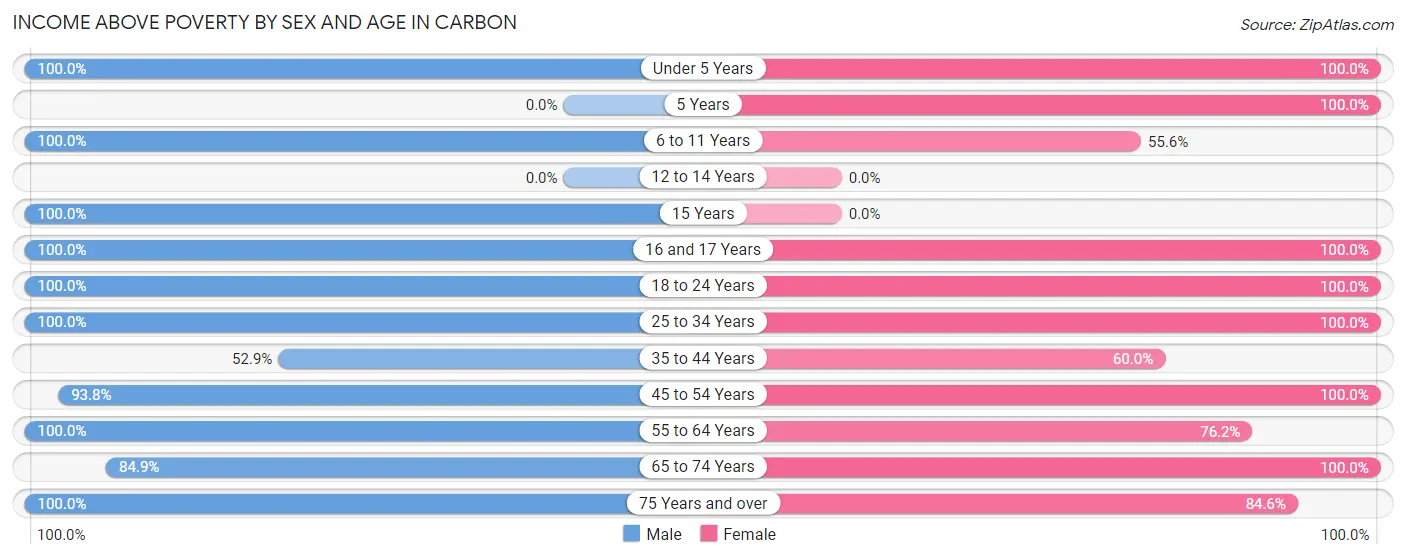
| Age Bracket | Male | Female |
| Under 5 Years | 6 (100.0%) | 13 (100.0%) |
| 5 Years | 0 (0.0%) | 5 (100.0%) |
| 6 to 11 Years | 15 (100.0%) | 10 (55.6%) |
| 12 to 14 Years | 0 (0.0%) | 0 (0.0%) |
| 15 Years | 3 (100.0%) | 0 (0.0%) |
| 16 and 17 Years | 9 (100.0%) | 4 (100.0%) |
| 18 to 24 Years | 2 (100.0%) | 9 (100.0%) |
| 25 to 34 Years | 22 (100.0%) | 18 (100.0%) |
| 35 to 44 Years | 9 (52.9%) | 12 (60.0%) |
| 45 to 54 Years | 15 (93.8%) | 7 (100.0%) |
| 55 to 64 Years | 23 (100.0%) | 16 (76.2%) |
| 65 to 74 Years | 28 (84.9%) | 5 (100.0%) |
| 75 Years and over | 8 (100.0%) | 11 (84.6%) |
| Total | 140 (90.9%) | 110 (82.7%) |
Income Below Poverty Among Married-Couple Families in Carbon
The poverty statistics for married-couple families in Carbon show that 11.9% or 7 of the total 59 families live below the poverty line. Families with 1 or 2 children have the highest poverty rate of 28.6%, comprising of 6 families. On the other hand, families with 3 or 4 children have the lowest poverty rate of 0.0%, which includes 0 families.
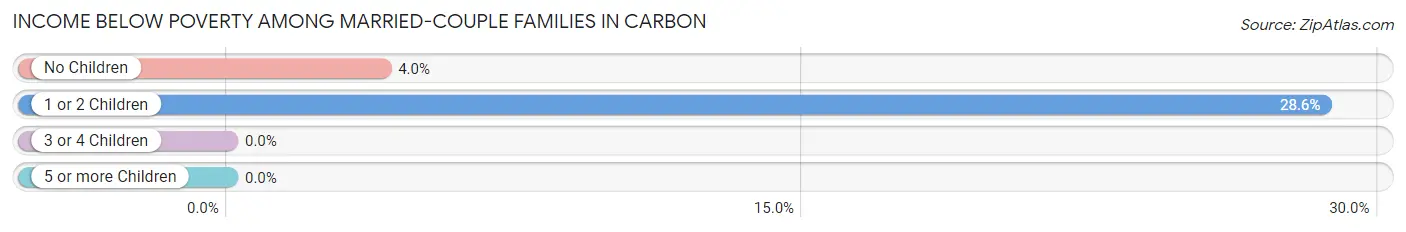
| Children | Above Poverty | Below Poverty |
| No Children | 24 (96.0%) | 1 (4.0%) |
| 1 or 2 Children | 15 (71.4%) | 6 (28.6%) |
| 3 or 4 Children | 13 (100.0%) | 0 (0.0%) |
| 5 or more Children | 0 (0.0%) | 0 (0.0%) |
| Total | 52 (88.1%) | 7 (11.9%) |
Income Below Poverty Among Single-Parent Households in Carbon
| Children | Single Father | Single Mother |
| No Children | 0 (0.0%) | 0 (0.0%) |
| 1 or 2 Children | 0 (0.0%) | 0 (0.0%) |
| 3 or 4 Children | 0 (0.0%) | 0 (0.0%) |
| 5 or more Children | 0 (0.0%) | 0 (0.0%) |
| Total | 0 (0.0%) | 0 (0.0%) |
Income Below Poverty Among Married-Couple vs Single-Parent Households in Carbon
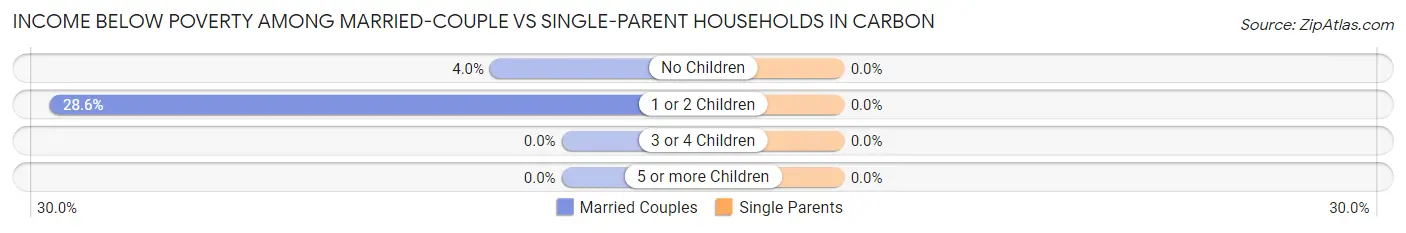
| Children | Married-Couple Families | Single-Parent Households |
| No Children | 1 (4.0%) | 0 (0.0%) |
| 1 or 2 Children | 6 (28.6%) | 0 (0.0%) |
| 3 or 4 Children | 0 (0.0%) | 0 (0.0%) |
| 5 or more Children | 0 (0.0%) | 0 (0.0%) |
| Total | 7 (11.9%) | 0 (0.0%) |
Race in Carbon
The most populous races in Carbon are White / Caucasian (219 | 76.3%), Hispanic or Latino (109 | 38.0%), and Two or more Races (68 | 23.7%).
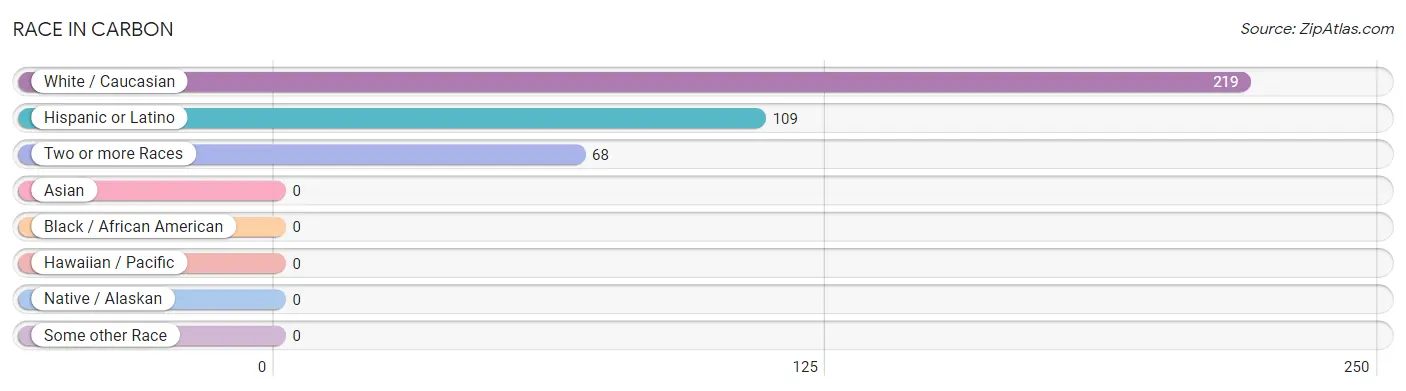
| Race | # Population | % Population |
| Asian | 0 | 0.0% |
| Black / African American | 0 | 0.0% |
| Hawaiian / Pacific | 0 | 0.0% |
| Hispanic or Latino | 109 | 38.0% |
| Native / Alaskan | 0 | 0.0% |
| White / Caucasian | 219 | 76.3% |
| Two or more Races | 68 | 23.7% |
| Some other Race | 0 | 0.0% |
| Total | 287 | 100.0% |
Ancestry in Carbon
The most populous ancestries reported in Carbon are Mexican (109 | 38.0%), European (35 | 12.2%), English (26 | 9.1%), American (22 | 7.7%), and Irish (17 | 5.9%), together accounting for 72.8% of all Carbon residents.
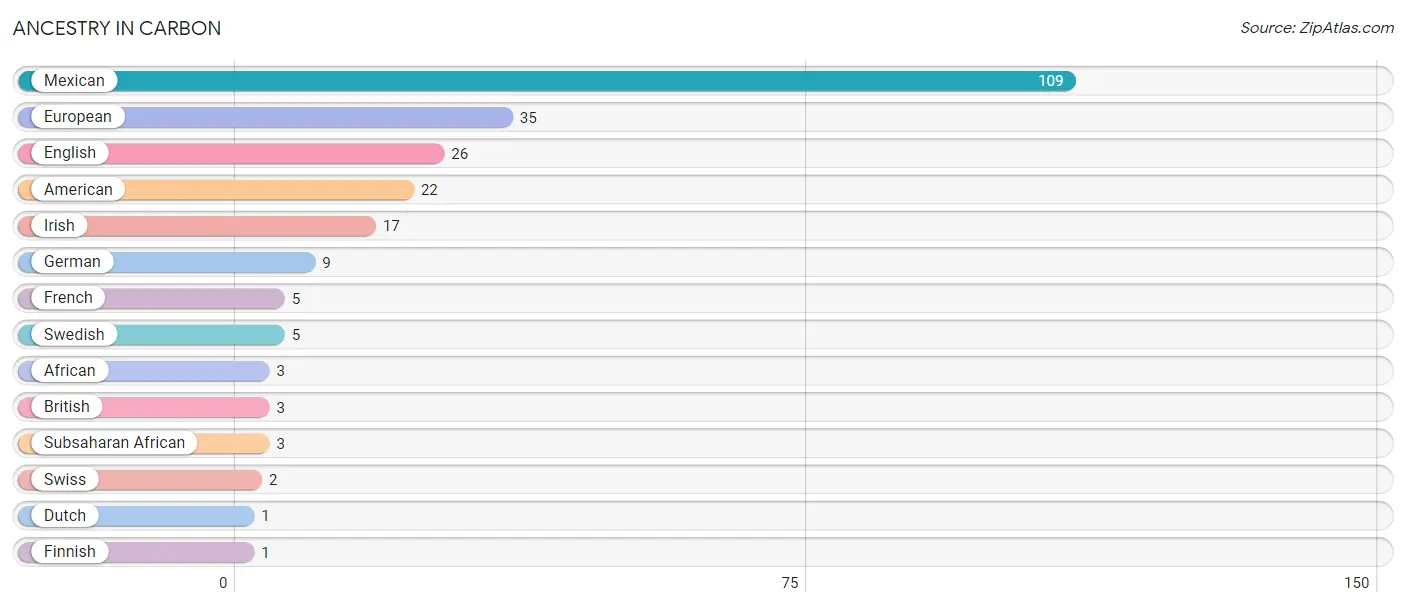
| Ancestry | # Population | % Population |
| African | 3 | 1.1% |
| American | 22 | 7.7% |
| British | 3 | 1.1% |
| Dutch | 1 | 0.4% |
| English | 26 | 9.1% |
| European | 35 | 12.2% |
| Finnish | 1 | 0.4% |
| French | 5 | 1.7% |
| German | 9 | 3.1% |
| Irish | 17 | 5.9% |
| Mexican | 109 | 38.0% |
| Subsaharan African | 3 | 1.1% |
| Swedish | 5 | 1.7% |
| Swiss | 2 | 0.7% | View All 14 Rows |
Immigrants in Carbon
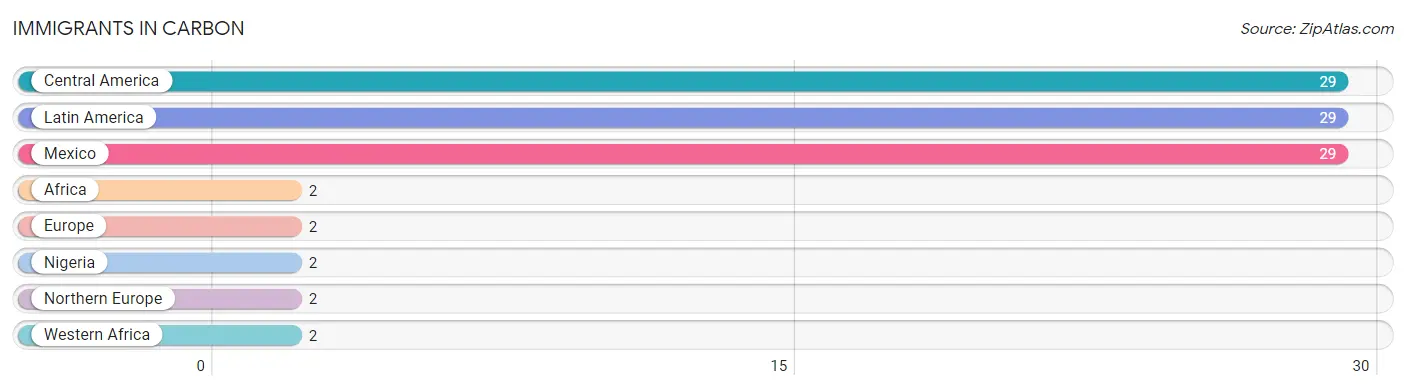
The most numerous immigrant groups reported in Carbon came from Central America (29 | 10.1%), Latin America (29 | 10.1%), Mexico (29 | 10.1%), Africa (2 | 0.7%), and Europe (2 | 0.7%), together accounting for 31.7% of all Carbon residents.
| Immigration Origin | # Population | % Population |
| Africa | 2 | 0.7% |
| Central America | 29 | 10.1% |
| Europe | 2 | 0.7% |
| Latin America | 29 | 10.1% |
| Mexico | 29 | 10.1% |
| Nigeria | 2 | 0.7% |
| Northern Europe | 2 | 0.7% |
| Western Africa | 2 | 0.7% | View All 8 Rows |
Sex and Age in Carbon
Sex and Age in Carbon
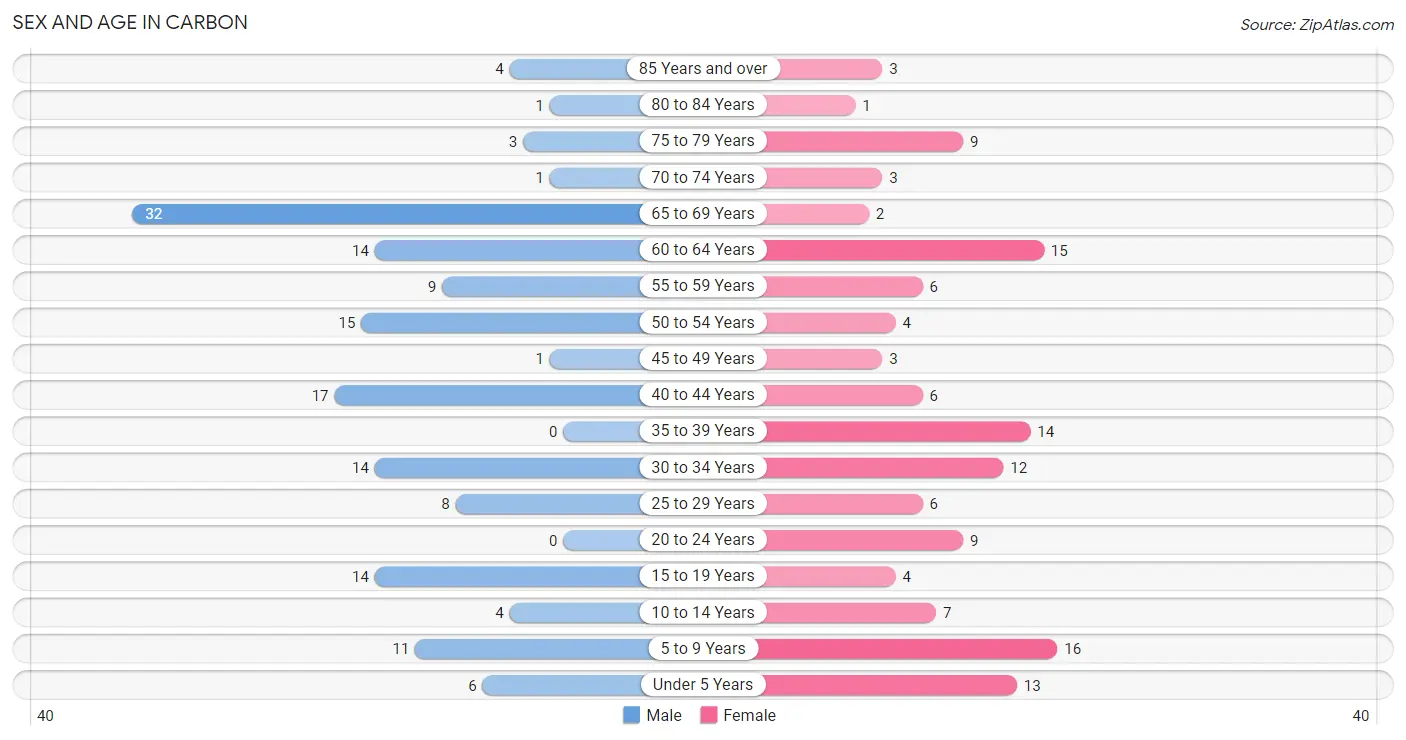
The most populous age groups in Carbon are 65 to 69 Years (32 | 20.8%) for men and 5 to 9 Years (16 | 12.0%) for women.
| Age Bracket | Male | Female |
| Under 5 Years | 6 (3.9%) | 13 (9.8%) |
| 5 to 9 Years | 11 (7.1%) | 16 (12.0%) |
| 10 to 14 Years | 4 (2.6%) | 7 (5.3%) |
| 15 to 19 Years | 14 (9.1%) | 4 (3.0%) |
| 20 to 24 Years | 0 (0.0%) | 9 (6.8%) |
| 25 to 29 Years | 8 (5.2%) | 6 (4.5%) |
| 30 to 34 Years | 14 (9.1%) | 12 (9.0%) |
| 35 to 39 Years | 0 (0.0%) | 14 (10.5%) |
| 40 to 44 Years | 17 (11.0%) | 6 (4.5%) |
| 45 to 49 Years | 1 (0.6%) | 3 (2.3%) |
| 50 to 54 Years | 15 (9.7%) | 4 (3.0%) |
| 55 to 59 Years | 9 (5.8%) | 6 (4.5%) |
| 60 to 64 Years | 14 (9.1%) | 15 (11.3%) |
| 65 to 69 Years | 32 (20.8%) | 2 (1.5%) |
| 70 to 74 Years | 1 (0.6%) | 3 (2.3%) |
| 75 to 79 Years | 3 (1.9%) | 9 (6.8%) |
| 80 to 84 Years | 1 (0.6%) | 1 (0.7%) |
| 85 Years and over | 4 (2.6%) | 3 (2.3%) |
| Total | 154 (100.0%) | 133 (100.0%) |
Families and Households in Carbon
Median Family Size in Carbon
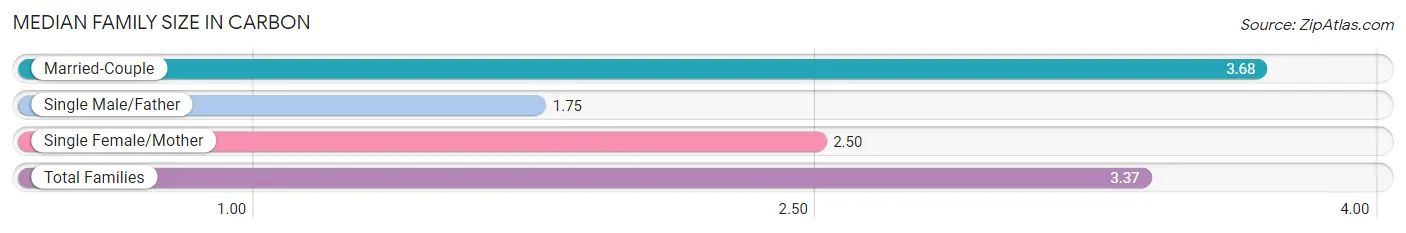
The median family size in Carbon is 3.37 persons per family, with married-couple families (59 | 80.8%) accounting for the largest median family size of 3.68 persons per family. On the other hand, single male/father families (8 | 11.0%) represent the smallest median family size with 1.75 persons per family.
| Family Type | # Families | Family Size |
| Married-Couple | 59 (80.8%) | 3.68 |
| Single Male/Father | 8 (11.0%) | 1.75 |
| Single Female/Mother | 6 (8.2%) | 2.50 |
| Total Families | 73 (100.0%) | 3.37 |
Median Household Size in Carbon
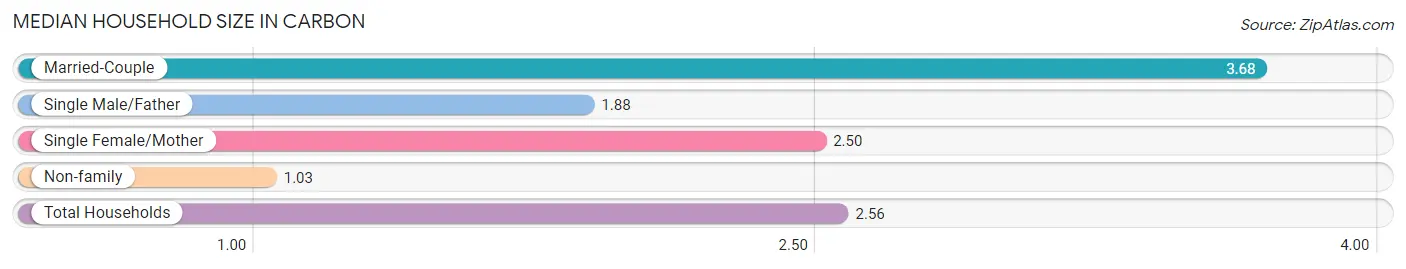
The median household size in Carbon is 2.56 persons per household, with married-couple households (59 | 52.7%) accounting for the largest median household size of 3.68 persons per household. non-family households (39 | 34.8%) represent the smallest median household size with 1.03 persons per household.
| Household Type | # Households | Household Size |
| Married-Couple | 59 (52.7%) | 3.68 |
| Single Male/Father | 8 (7.1%) | 1.88 |
| Single Female/Mother | 6 (5.4%) | 2.50 |
| Non-family | 39 (34.8%) | 1.03 |
| Total Households | 112 (100.0%) | 2.56 |
Household Size by Marriage Status in Carbon
Out of a total of 112 households in Carbon, 73 (65.2%) are family households, while 39 (34.8%) are nonfamily households. The most numerous type of family households are 2-person households, comprising 33, and the most common type of nonfamily households are 1-person households, comprising 37.
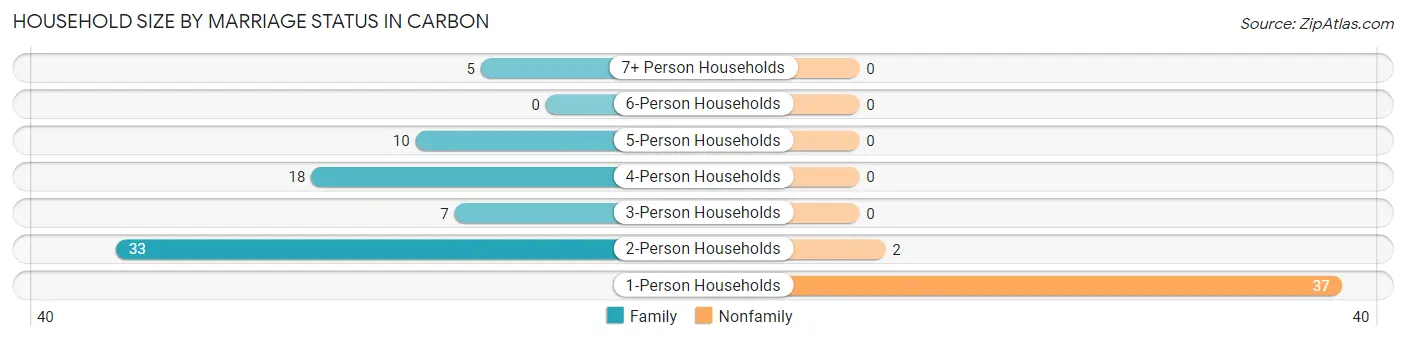
| Household Size | Family Households | Nonfamily Households |
| 1-Person Households | - | 37 (33.0%) |
| 2-Person Households | 33 (29.5%) | 2 (1.8%) |
| 3-Person Households | 7 (6.2%) | 0 (0.0%) |
| 4-Person Households | 18 (16.1%) | 0 (0.0%) |
| 5-Person Households | 10 (8.9%) | 0 (0.0%) |
| 6-Person Households | 0 (0.0%) | 0 (0.0%) |
| 7+ Person Households | 5 (4.5%) | 0 (0.0%) |
| Total | 73 (65.2%) | 39 (34.8%) |
Female Fertility in Carbon
Fertility by Age in Carbon
Average fertility rate in Carbon is 204.0 births per 1,000 women. Women in the age bracket of 20 to 34 years have the highest fertility rate with 407.0 births per 1,000 women. Women in the age bracket of 20 to 34 years acount for 100.0% of all women with births.
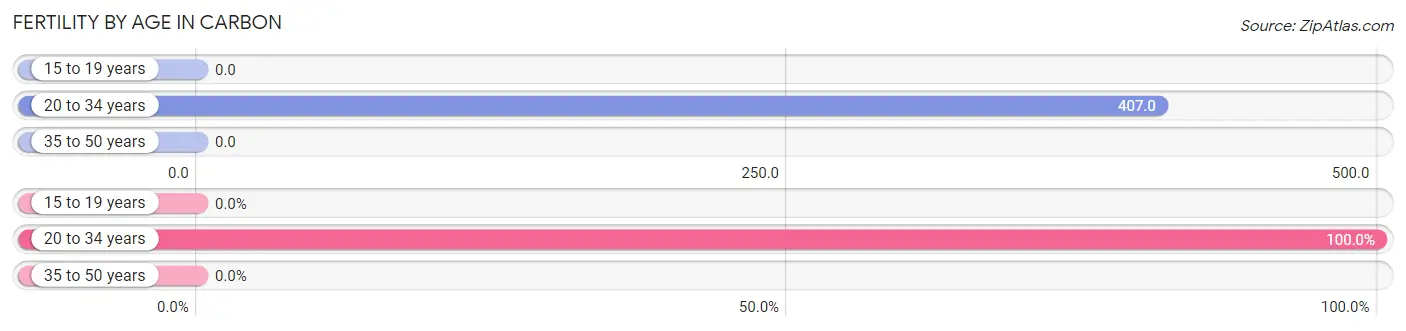
| Age Bracket | Women with Births | Births / 1,000 Women |
| 15 to 19 years | 0 (0.0%) | 0.0 |
| 20 to 34 years | 11 (100.0%) | 407.0 |
| 35 to 50 years | 0 (0.0%) | 0.0 |
| Total | 11 (100.0%) | 204.0 |
Fertility by Age by Marriage Status in Carbon
54.5% of women with births (11) in Carbon are married. The highest percentage of unmarried women with births falls into 20 to 34 years age bracket with 45.5% of them unmarried at the time of birth, while the lowest percentage of unmarried women with births belong to 20 to 34 years age bracket with 45.5% of them unmarried.
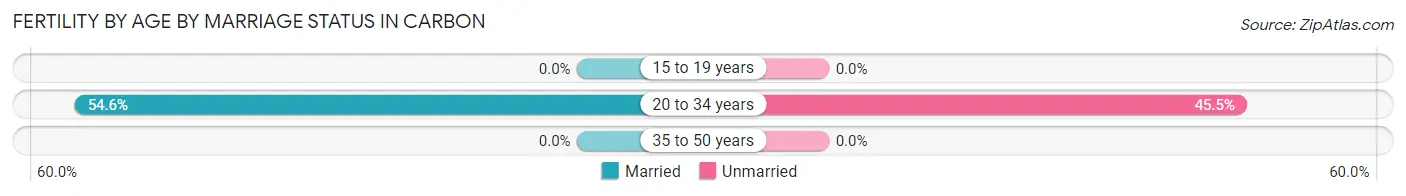
| Age Bracket | Married | Unmarried |
| 15 to 19 years | 0 (0.0%) | 0 (0.0%) |
| 20 to 34 years | 6 (54.5%) | 5 (45.5%) |
| 35 to 50 years | 0 (0.0%) | 0 (0.0%) |
| Total | 6 (54.5%) | 5 (45.5%) |
Fertility by Education in Carbon
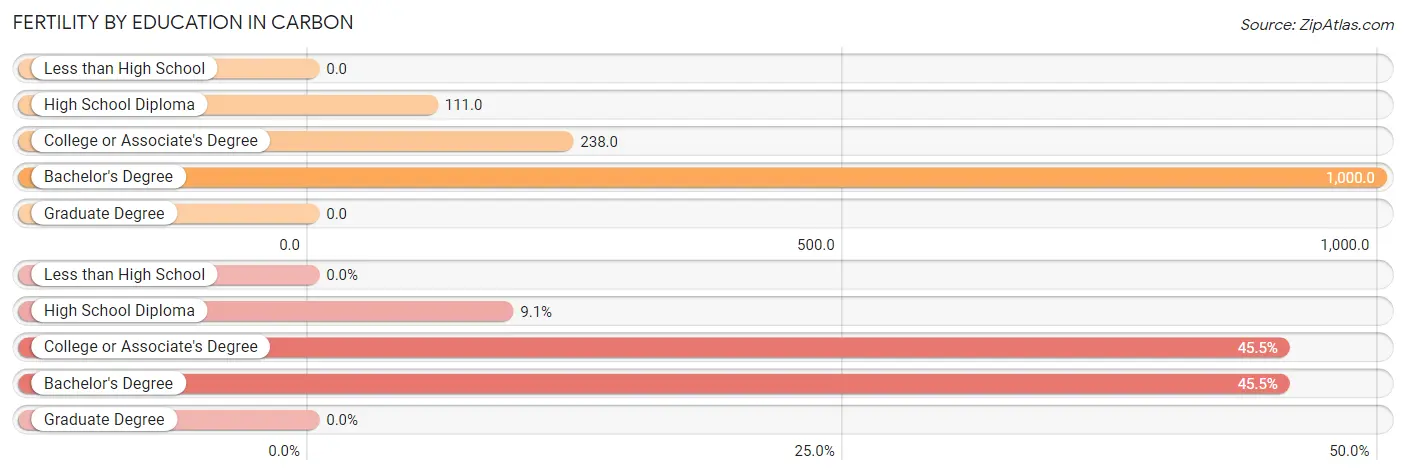
| Educational Attainment | Women with Births | Births / 1,000 Women |
| Less than High School | 0 (0.0%) | 0.0 |
| High School Diploma | 1 (9.1%) | 111.0 |
| College or Associate's Degree | 5 (45.5%) | 238.0 |
| Bachelor's Degree | 5 (45.5%) | 1,000.0 |
| Graduate Degree | 0 (0.0%) | 0.0 |
| Total | 11 (100.0%) | 204.0 |
Fertility by Education by Marriage Status in Carbon
45.5% of women with births in Carbon are unmarried. Women with the educational attainment of high school diploma are most likely to be married with 100.0% of them married at childbirth, while women with the educational attainment of college or associate's degree are least likely to be married with 100.0% of them unmarried at childbirth.
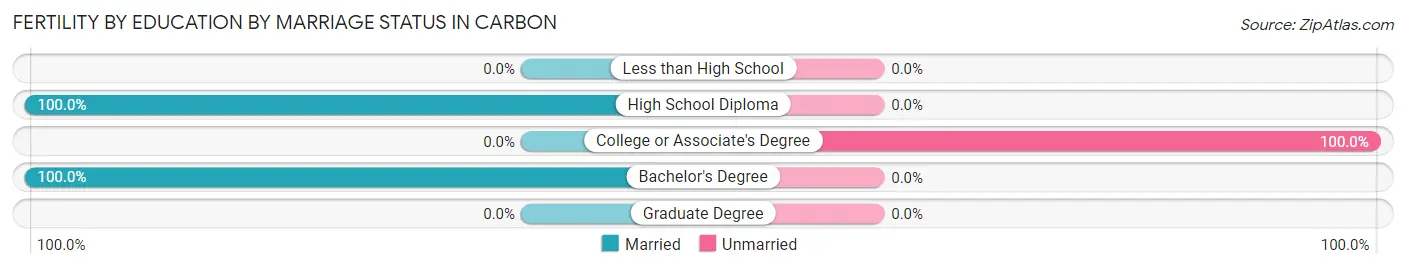
| Educational Attainment | Married | Unmarried |
| Less than High School | 0 (0.0%) | 0 (0.0%) |
| High School Diploma | 1 (100.0%) | 0 (0.0%) |
| College or Associate's Degree | 0 (0.0%) | 5 (100.0%) |
| Bachelor's Degree | 5 (100.0%) | 0 (0.0%) |
| Graduate Degree | 0 (0.0%) | 0 (0.0%) |
| Total | 6 (54.5%) | 5 (45.5%) |
Employment Characteristics in Carbon
Employment by Class of Employer in Carbon
Among the 107 employed individuals in Carbon, private company employees (79 | 73.8%), self-employed (not incorporated) (16 | 14.9%), and local government employees (7 | 6.5%) make up the most common classes of employment.
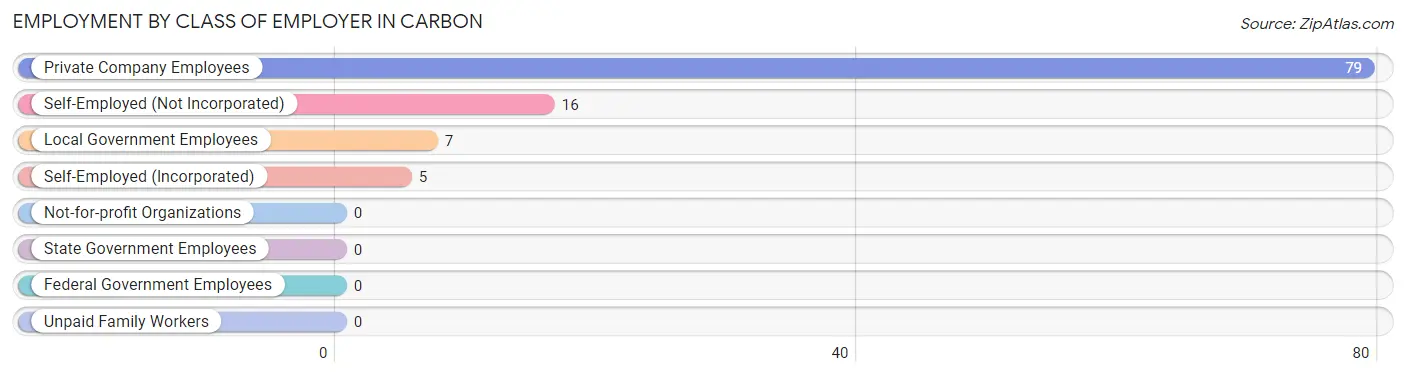
| Employer Class | # Employees | % Employees |
| Private Company Employees | 79 | 73.8% |
| Self-Employed (Incorporated) | 5 | 4.7% |
| Self-Employed (Not Incorporated) | 16 | 14.9% |
| Not-for-profit Organizations | 0 | 0.0% |
| Local Government Employees | 7 | 6.5% |
| State Government Employees | 0 | 0.0% |
| Federal Government Employees | 0 | 0.0% |
| Unpaid Family Workers | 0 | 0.0% |
| Total | 107 | 100.0% |
Employment Status by Age in Carbon
According to the labor force statistics for Carbon, out of the total population over 16 years of age (227), 49.8% or 113 individuals are in the labor force, with 3.5% or 4 of them unemployed. The age group with the highest labor force participation rate is 25 to 29 years, with 92.9% or 13 individuals in the labor force. Within the labor force, the 65 to 74 years age range has the highest percentage of unemployed individuals, with 33.3% or 4 of them being unemployed.
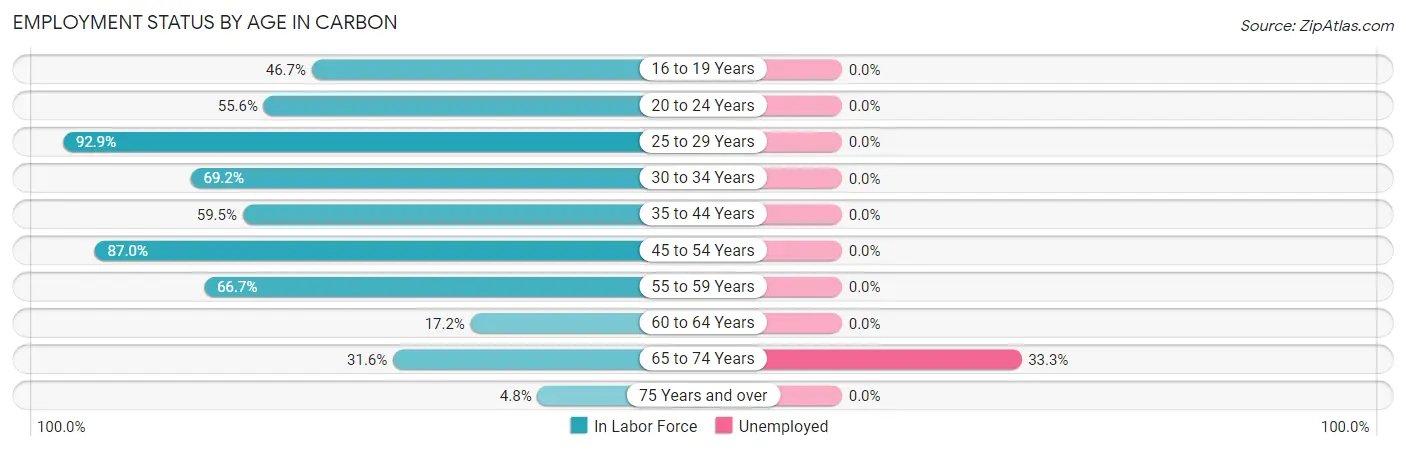
| Age Bracket | In Labor Force | Unemployed |
| 16 to 19 Years | 7 (46.7%) | 0 (0.0%) |
| 20 to 24 Years | 5 (55.6%) | 0 (0.0%) |
| 25 to 29 Years | 13 (92.9%) | 0 (0.0%) |
| 30 to 34 Years | 18 (69.2%) | 0 (0.0%) |
| 35 to 44 Years | 22 (59.5%) | 0 (0.0%) |
| 45 to 54 Years | 20 (87.0%) | 0 (0.0%) |
| 55 to 59 Years | 10 (66.7%) | 0 (0.0%) |
| 60 to 64 Years | 5 (17.2%) | 0 (0.0%) |
| 65 to 74 Years | 12 (31.6%) | 4 (33.3%) |
| 75 Years and over | 1 (4.8%) | 0 (0.0%) |
| Total | 113 (49.8%) | 4 (3.5%) |
Employment Status by Educational Attainment in Carbon
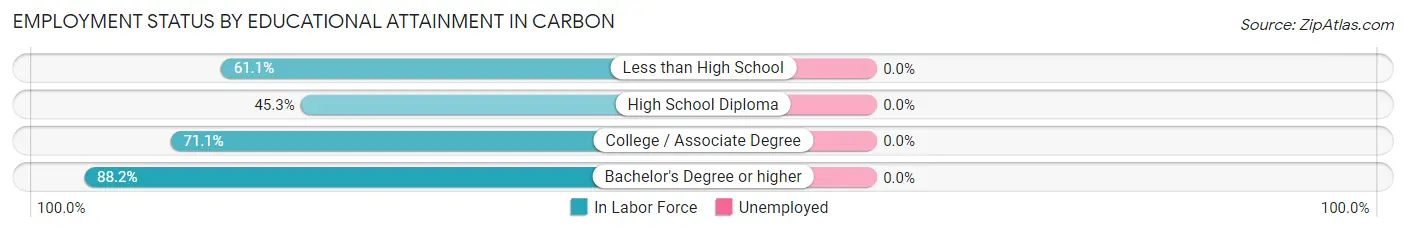
| Educational Attainment | In Labor Force | Unemployed |
| Less than High School | 22 (61.1%) | 0 (0.0%) |
| High School Diploma | 24 (45.3%) | 0 (0.0%) |
| College / Associate Degree | 27 (71.1%) | 0 (0.0%) |
| Bachelor's Degree or higher | 15 (88.2%) | 0 (0.0%) |
| Total | 88 (61.1%) | 0 (0.0%) |
Employment Occupations by Sex in Carbon
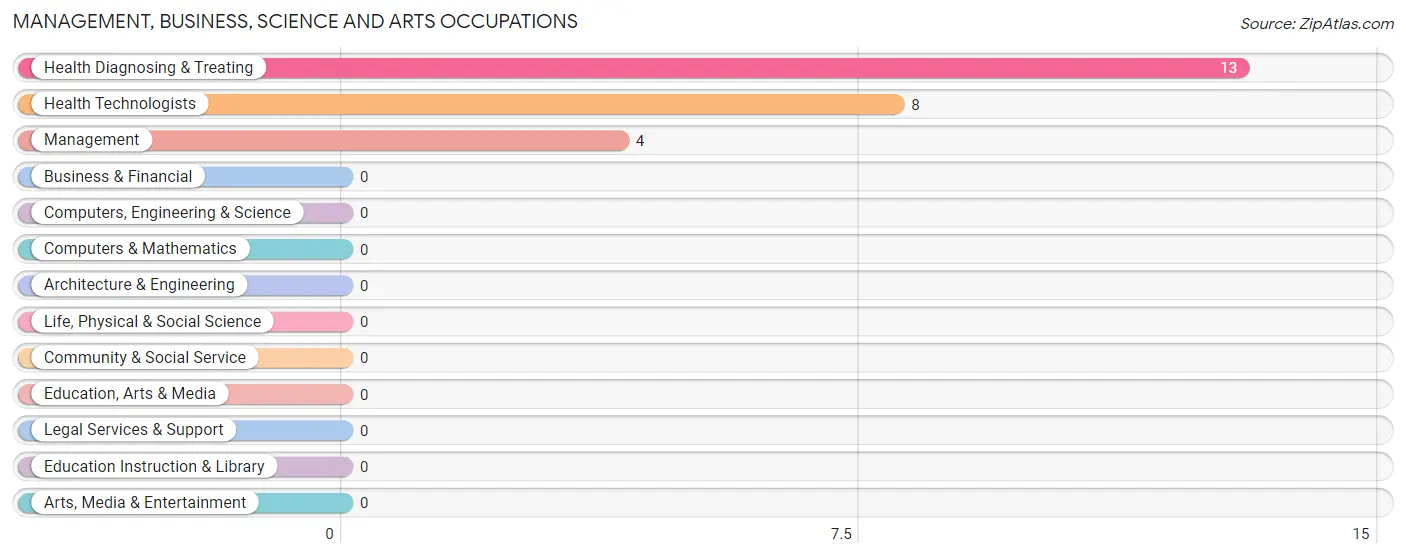
Management, Business, Science and Arts Occupations
The most common Management, Business, Science and Arts occupations in Carbon are Health Diagnosing & Treating (13 | 11.9%), Health Technologists (8 | 7.3%), and Management (4 | 3.7%).
Management, Business, Science and Arts Occupations by Sex
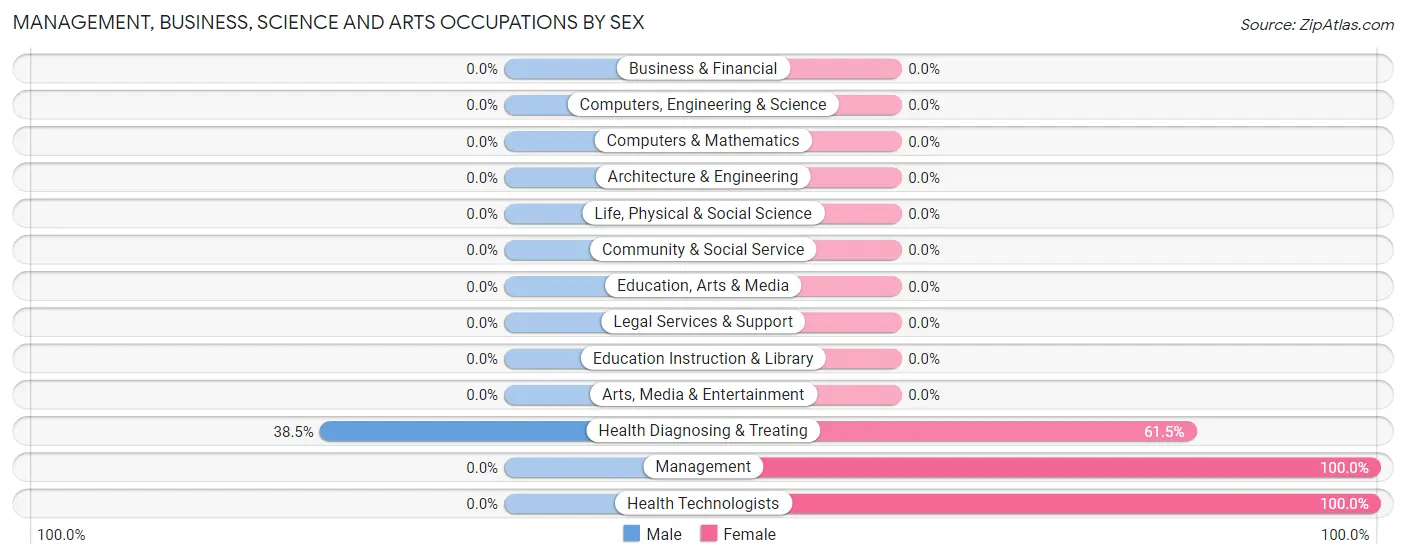
| Occupation | Male | Female |
| Management | 0 (0.0%) | 4 (100.0%) |
| Business & Financial | 0 (0.0%) | 0 (0.0%) |
| Computers, Engineering & Science | 0 (0.0%) | 0 (0.0%) |
| Computers & Mathematics | 0 (0.0%) | 0 (0.0%) |
| Architecture & Engineering | 0 (0.0%) | 0 (0.0%) |
| Life, Physical & Social Science | 0 (0.0%) | 0 (0.0%) |
| Community & Social Service | 0 (0.0%) | 0 (0.0%) |
| Education, Arts & Media | 0 (0.0%) | 0 (0.0%) |
| Legal Services & Support | 0 (0.0%) | 0 (0.0%) |
| Education Instruction & Library | 0 (0.0%) | 0 (0.0%) |
| Arts, Media & Entertainment | 0 (0.0%) | 0 (0.0%) |
| Health Diagnosing & Treating | 5 (38.5%) | 8 (61.5%) |
| Health Technologists | 0 (0.0%) | 8 (100.0%) |
| Total (Category) | 5 (29.4%) | 12 (70.6%) |
| Total (Overall) | 73 (67.0%) | 36 (33.0%) |
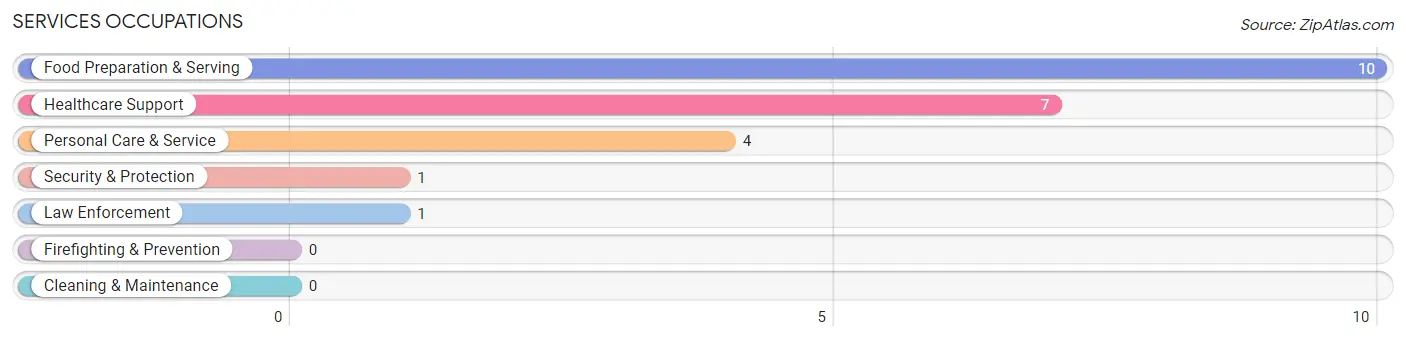
Services Occupations
The most common Services occupations in Carbon are Food Preparation & Serving (10 | 9.2%), Healthcare Support (7 | 6.4%), Personal Care & Service (4 | 3.7%), Security & Protection (1 | 0.9%), and Law Enforcement (1 | 0.9%).
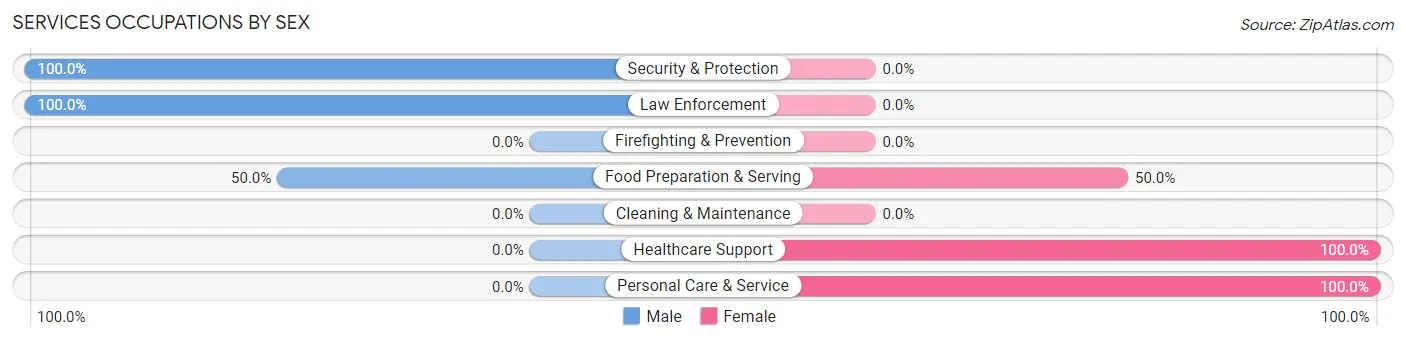
Services Occupations by Sex
Within the Services occupations in Carbon, the most male-oriented occupations are Security & Protection (100.0%), Law Enforcement (100.0%), and Food Preparation & Serving (50.0%), while the most female-oriented occupations are Healthcare Support (100.0%), Personal Care & Service (100.0%), and Food Preparation & Serving (50.0%).
| Occupation | Male | Female |
| Healthcare Support | 0 (0.0%) | 7 (100.0%) |
| Security & Protection | 1 (100.0%) | 0 (0.0%) |
| Firefighting & Prevention | 0 (0.0%) | 0 (0.0%) |
| Law Enforcement | 1 (100.0%) | 0 (0.0%) |
| Food Preparation & Serving | 5 (50.0%) | 5 (50.0%) |
| Cleaning & Maintenance | 0 (0.0%) | 0 (0.0%) |
| Personal Care & Service | 0 (0.0%) | 4 (100.0%) |
| Total (Category) | 6 (27.3%) | 16 (72.7%) |
| Total (Overall) | 73 (67.0%) | 36 (33.0%) |
Sales and Office Occupations
The most common Sales and Office occupations in Carbon are Office & Administration (8 | 7.3%), and Sales & Related (5 | 4.6%).
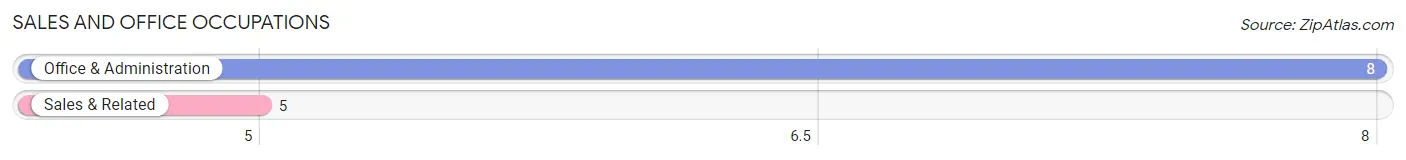
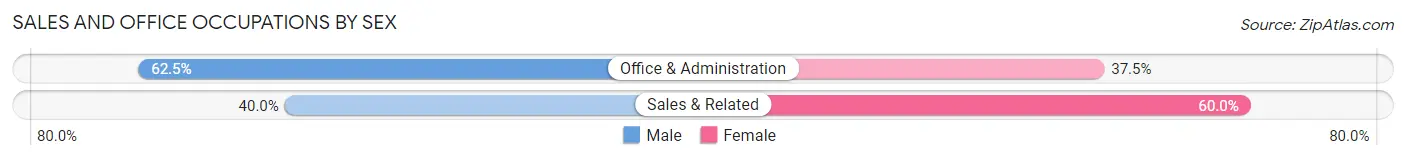
Sales and Office Occupations by Sex
| Occupation | Male | Female |
| Sales & Related | 2 (40.0%) | 3 (60.0%) |
| Office & Administration | 5 (62.5%) | 3 (37.5%) |
| Total (Category) | 7 (53.8%) | 6 (46.2%) |
| Total (Overall) | 73 (67.0%) | 36 (33.0%) |
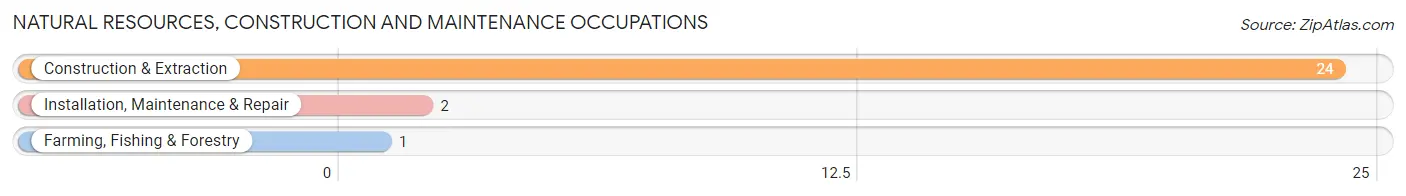
Natural Resources, Construction and Maintenance Occupations
The most common Natural Resources, Construction and Maintenance occupations in Carbon are Construction & Extraction (24 | 22.0%), Installation, Maintenance & Repair (2 | 1.8%), and Farming, Fishing & Forestry (1 | 0.9%).
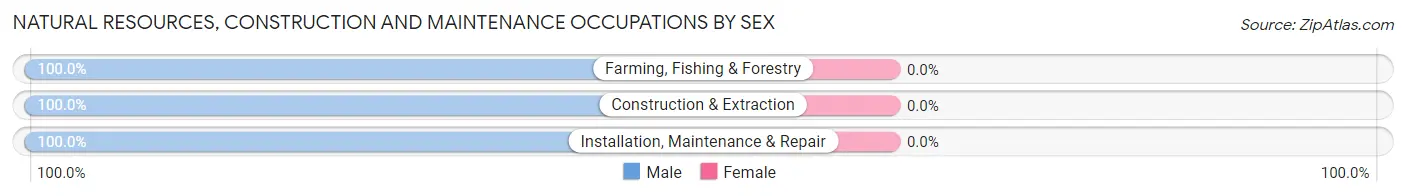
Natural Resources, Construction and Maintenance Occupations by Sex
| Occupation | Male | Female |
| Farming, Fishing & Forestry | 1 (100.0%) | 0 (0.0%) |
| Construction & Extraction | 24 (100.0%) | 0 (0.0%) |
| Installation, Maintenance & Repair | 2 (100.0%) | 0 (0.0%) |
| Total (Category) | 27 (100.0%) | 0 (0.0%) |
| Total (Overall) | 73 (67.0%) | 36 (33.0%) |
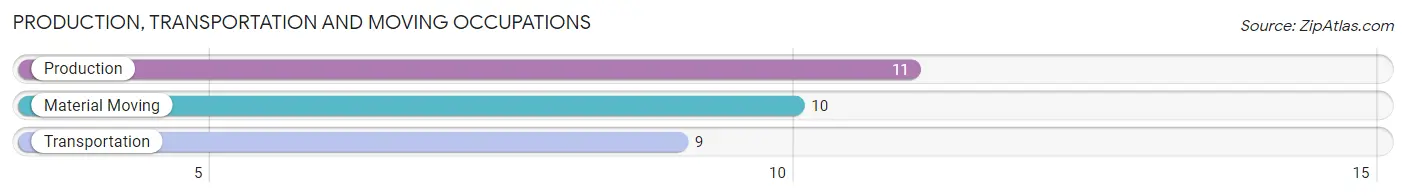
Production, Transportation and Moving Occupations
The most common Production, Transportation and Moving occupations in Carbon are Production (11 | 10.1%), Material Moving (10 | 9.2%), and Transportation (9 | 8.3%).
Production, Transportation and Moving Occupations by Sex
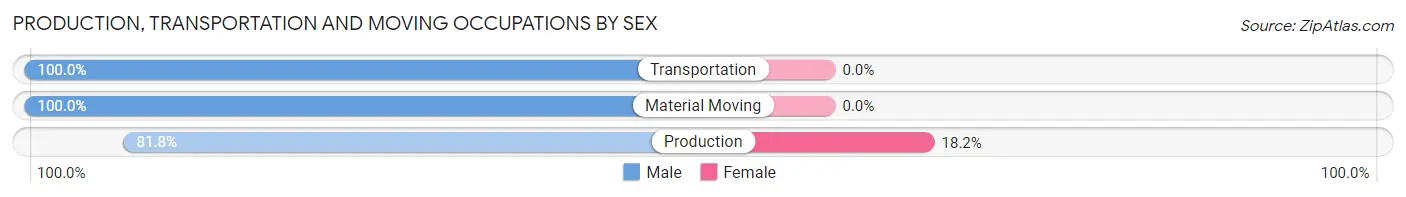
| Occupation | Male | Female |
| Production | 9 (81.8%) | 2 (18.2%) |
| Transportation | 9 (100.0%) | 0 (0.0%) |
| Material Moving | 10 (100.0%) | 0 (0.0%) |
| Total (Category) | 28 (93.3%) | 2 (6.7%) |
| Total (Overall) | 73 (67.0%) | 36 (33.0%) |
Employment Industries by Sex in Carbon
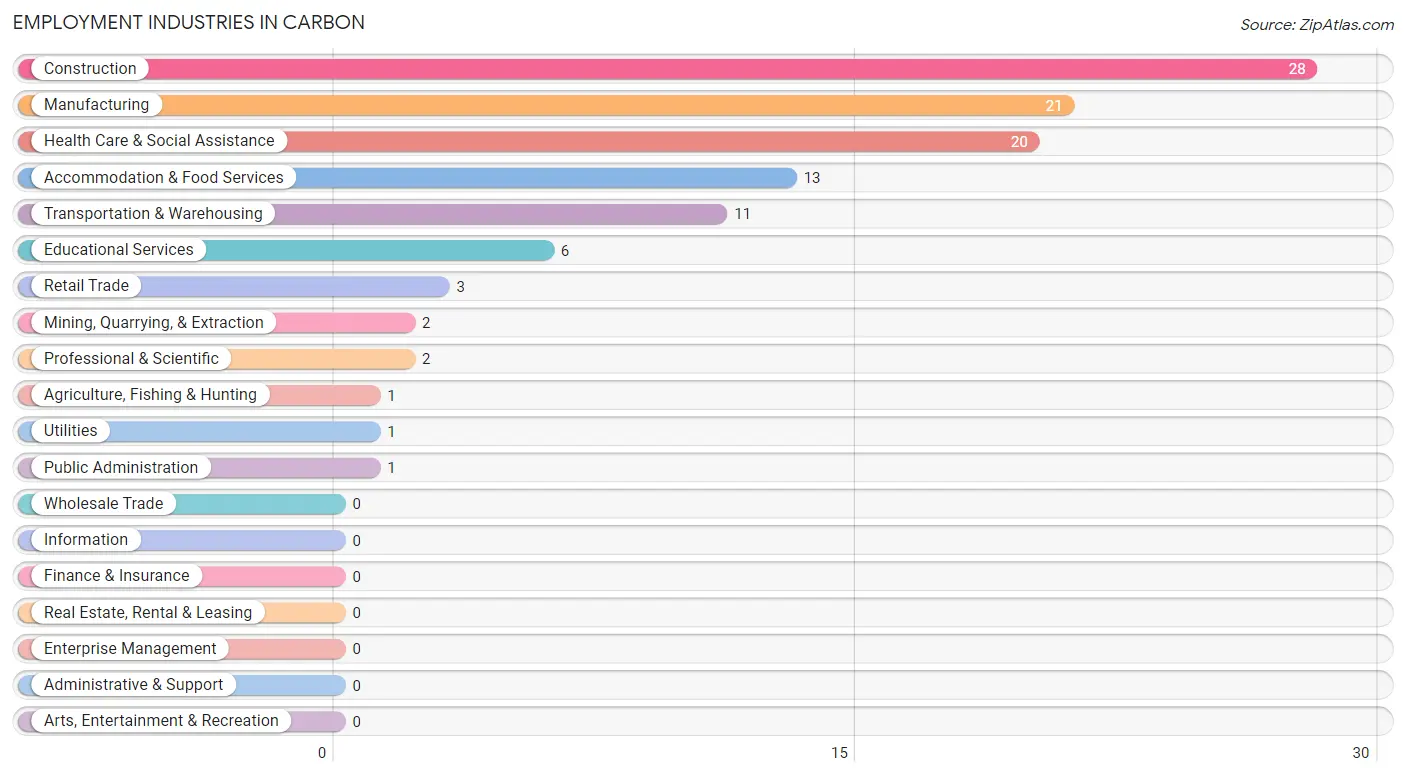
Employment Industries in Carbon
The major employment industries in Carbon include Construction (28 | 25.7%), Manufacturing (21 | 19.3%), Health Care & Social Assistance (20 | 18.3%), Accommodation & Food Services (13 | 11.9%), and Transportation & Warehousing (11 | 10.1%).
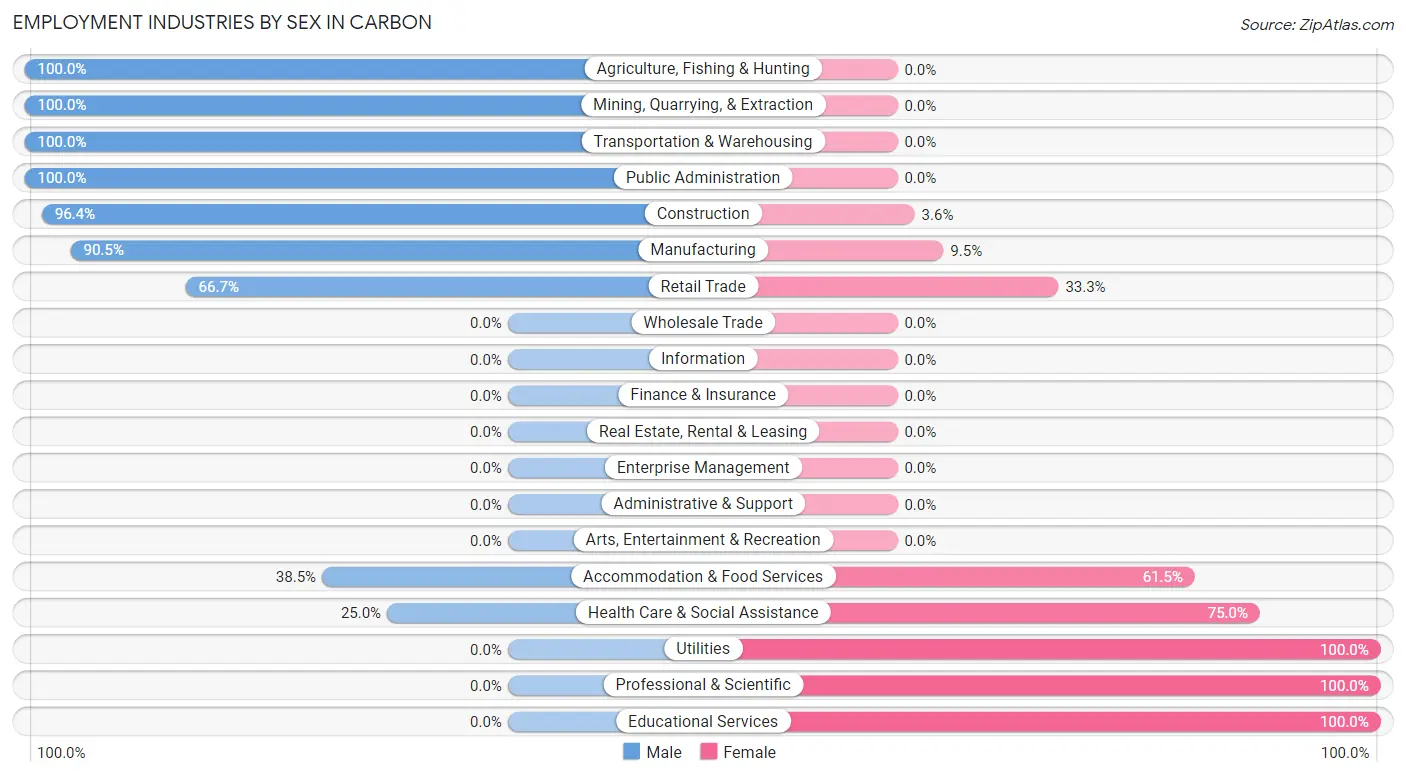
Employment Industries by Sex in Carbon
The Carbon industries that see more men than women are Agriculture, Fishing & Hunting (100.0%), Mining, Quarrying, & Extraction (100.0%), and Transportation & Warehousing (100.0%), whereas the industries that tend to have a higher number of women are Utilities (100.0%), Professional & Scientific (100.0%), and Educational Services (100.0%).
| Industry | Male | Female |
| Agriculture, Fishing & Hunting | 1 (100.0%) | 0 (0.0%) |
| Mining, Quarrying, & Extraction | 2 (100.0%) | 0 (0.0%) |
| Construction | 27 (96.4%) | 1 (3.6%) |
| Manufacturing | 19 (90.5%) | 2 (9.5%) |
| Wholesale Trade | 0 (0.0%) | 0 (0.0%) |
| Retail Trade | 2 (66.7%) | 1 (33.3%) |
| Transportation & Warehousing | 11 (100.0%) | 0 (0.0%) |
| Utilities | 0 (0.0%) | 1 (100.0%) |
| Information | 0 (0.0%) | 0 (0.0%) |
| Finance & Insurance | 0 (0.0%) | 0 (0.0%) |
| Real Estate, Rental & Leasing | 0 (0.0%) | 0 (0.0%) |
| Professional & Scientific | 0 (0.0%) | 2 (100.0%) |
| Enterprise Management | 0 (0.0%) | 0 (0.0%) |
| Administrative & Support | 0 (0.0%) | 0 (0.0%) |
| Educational Services | 0 (0.0%) | 6 (100.0%) |
| Health Care & Social Assistance | 5 (25.0%) | 15 (75.0%) |
| Arts, Entertainment & Recreation | 0 (0.0%) | 0 (0.0%) |
| Accommodation & Food Services | 5 (38.5%) | 8 (61.5%) |
| Public Administration | 1 (100.0%) | 0 (0.0%) |
| Total | 73 (67.0%) | 36 (33.0%) |
Education in Carbon
School Enrollment in Carbon
The most common levels of schooling among the 79 students in Carbon are elementary school (22 | 27.9%), high school (16 | 20.3%), and college / undergraduate (16 | 20.3%).
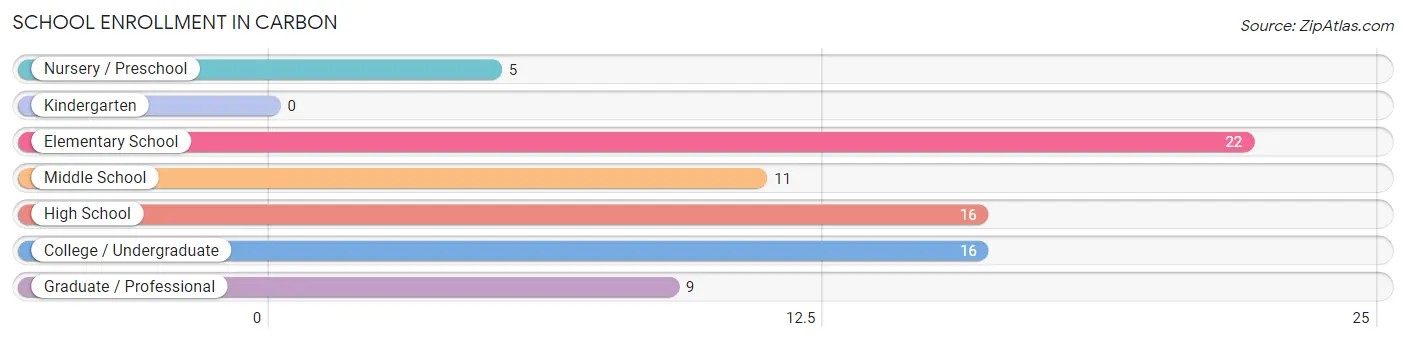
| School Level | # Students | % Students |
| Nursery / Preschool | 5 | 6.3% |
| Kindergarten | 0 | 0.0% |
| Elementary School | 22 | 27.9% |
| Middle School | 11 | 13.9% |
| High School | 16 | 20.3% |
| College / Undergraduate | 16 | 20.3% |
| Graduate / Professional | 9 | 11.4% |
| Total | 79 | 100.0% |
School Enrollment by Age by Funding Source in Carbon
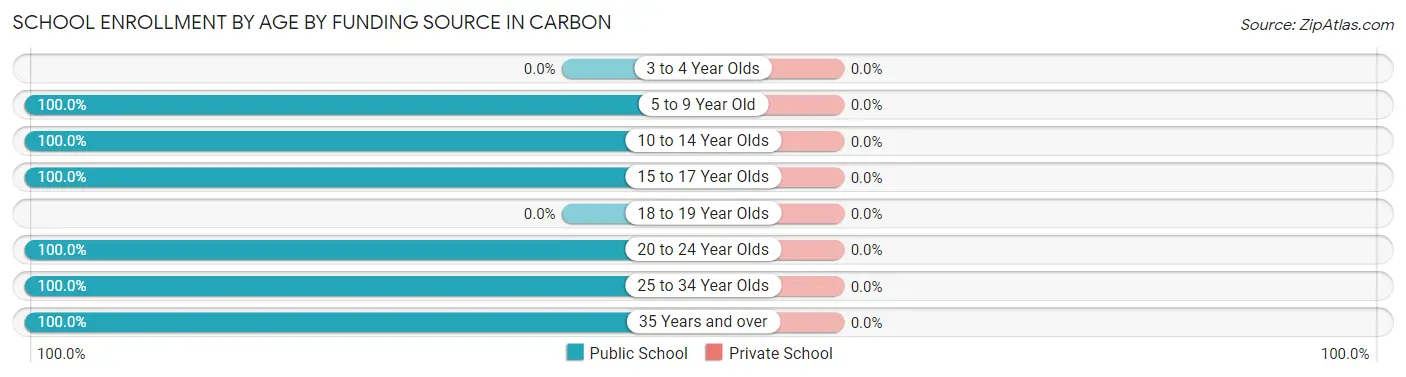
| Age Bracket | Public School | Private School |
| 3 to 4 Year Olds | 0 (0.0%) | 0 (0.0%) |
| 5 to 9 Year Old | 27 (100.0%) | 0 (0.0%) |
| 10 to 14 Year Olds | 11 (100.0%) | 0 (0.0%) |
| 15 to 17 Year Olds | 16 (100.0%) | 0 (0.0%) |
| 18 to 19 Year Olds | 0 (0.0%) | 0 (0.0%) |
| 20 to 24 Year Olds | 8 (100.0%) | 0 (0.0%) |
| 25 to 34 Year Olds | 13 (100.0%) | 0 (0.0%) |
| 35 Years and over | 4 (100.0%) | 0 (0.0%) |
| Total | 79 (100.0%) | 0 (0.0%) |
Educational Attainment by Field of Study in Carbon
Science & technology (5 | 20.0%), psychology (4 | 16.0%), arts & humanities (4 | 16.0%), business (3 | 12.0%), and education (3 | 12.0%) are the most common fields of study among 25 individuals in Carbon who have obtained a bachelor's degree or higher.
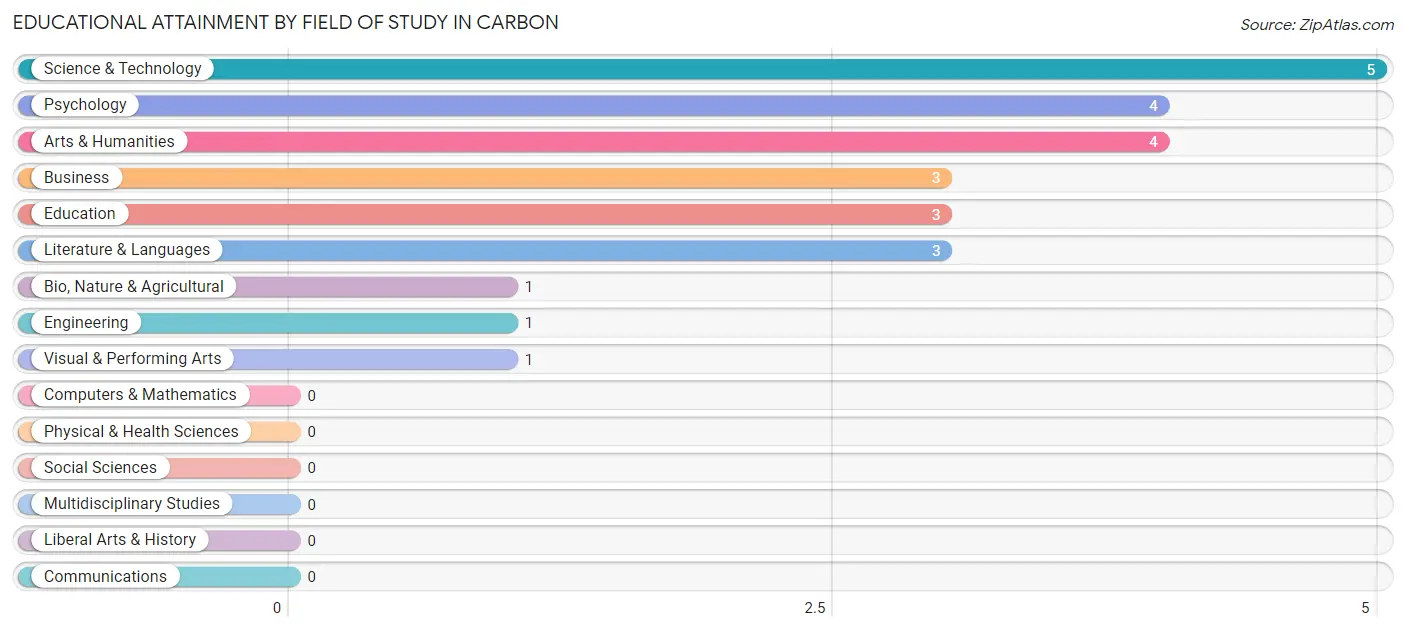
| Field of Study | # Graduates | % Graduates |
| Computers & Mathematics | 0 | 0.0% |
| Bio, Nature & Agricultural | 1 | 4.0% |
| Physical & Health Sciences | 0 | 0.0% |
| Psychology | 4 | 16.0% |
| Social Sciences | 0 | 0.0% |
| Engineering | 1 | 4.0% |
| Multidisciplinary Studies | 0 | 0.0% |
| Science & Technology | 5 | 20.0% |
| Business | 3 | 12.0% |
| Education | 3 | 12.0% |
| Literature & Languages | 3 | 12.0% |
| Liberal Arts & History | 0 | 0.0% |
| Visual & Performing Arts | 1 | 4.0% |
| Communications | 0 | 0.0% |
| Arts & Humanities | 4 | 16.0% |
| Total | 25 | 100.0% |
Transportation & Commute in Carbon
Vehicle Availability by Sex in Carbon
The most prevalent vehicle ownership categories in Carbon are males with 2 vehicles (38, accounting for 52.8%) and females with 2 vehicles (18, making up 108.6%).
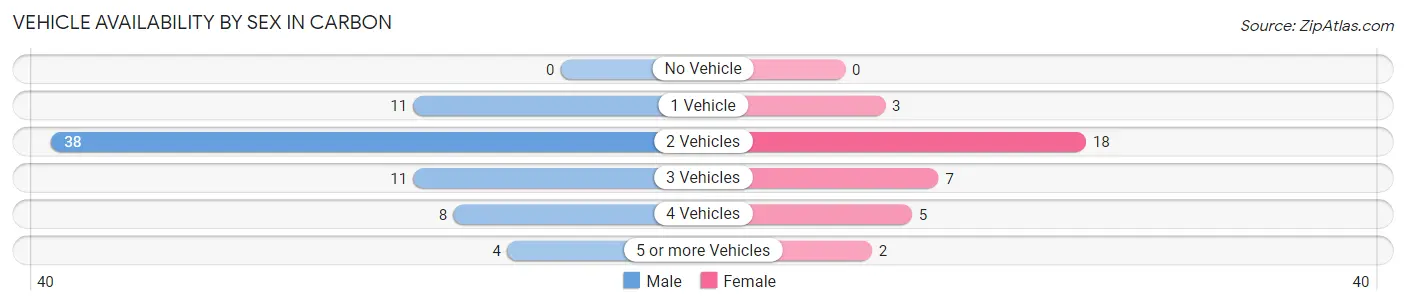
| Vehicles Available | Male | Female |
| No Vehicle | 0 (0.0%) | 0 (0.0%) |
| 1 Vehicle | 11 (15.3%) | 3 (8.6%) |
| 2 Vehicles | 38 (52.8%) | 18 (51.4%) |
| 3 Vehicles | 11 (15.3%) | 7 (20.0%) |
| 4 Vehicles | 8 (11.1%) | 5 (14.3%) |
| 5 or more Vehicles | 4 (5.6%) | 2 (5.7%) |
| Total | 72 (100.0%) | 35 (100.0%) |
Commute Time in Carbon
The most frequently occuring commute durations in Carbon are 15 to 19 minutes (30 commuters, 30.0%), 30 to 34 minutes (19 commuters, 19.0%), and 10 to 14 minutes (14 commuters, 14.0%).
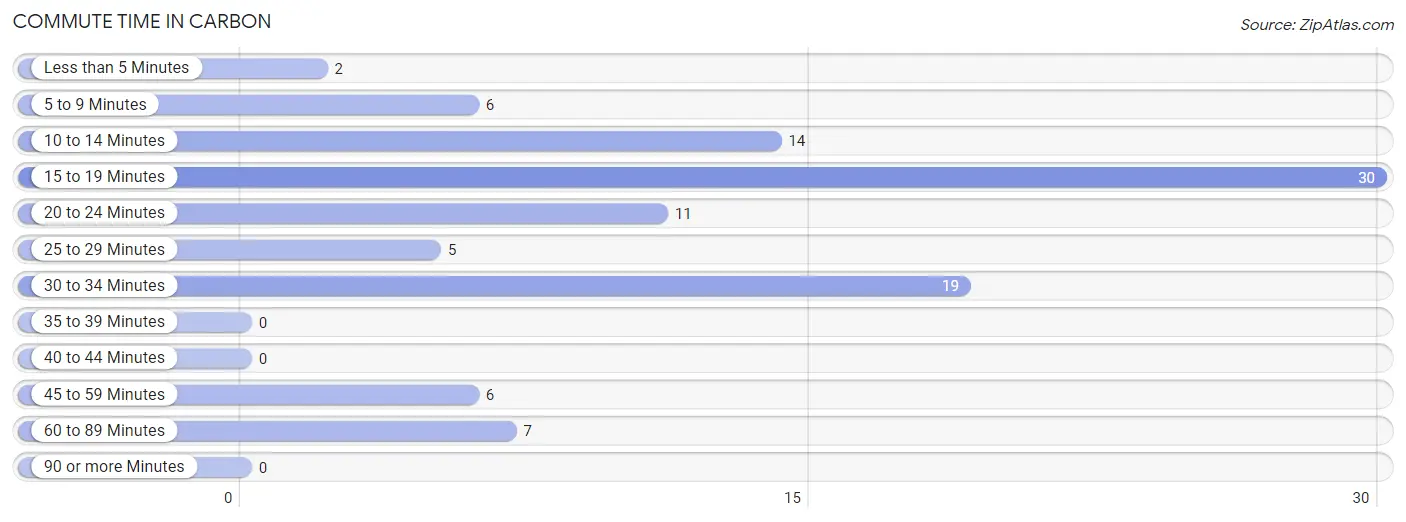
| Commute Time | # Commuters | % Commuters |
| Less than 5 Minutes | 2 | 2.0% |
| 5 to 9 Minutes | 6 | 6.0% |
| 10 to 14 Minutes | 14 | 14.0% |
| 15 to 19 Minutes | 30 | 30.0% |
| 20 to 24 Minutes | 11 | 11.0% |
| 25 to 29 Minutes | 5 | 5.0% |
| 30 to 34 Minutes | 19 | 19.0% |
| 35 to 39 Minutes | 0 | 0.0% |
| 40 to 44 Minutes | 0 | 0.0% |
| 45 to 59 Minutes | 6 | 6.0% |
| 60 to 89 Minutes | 7 | 7.0% |
| 90 or more Minutes | 0 | 0.0% |
Commute Time by Sex in Carbon
The most common commute times in Carbon are 15 to 19 minutes (25 commuters, 38.5%) for males and 10 to 14 minutes (13 commuters, 37.1%) for females.
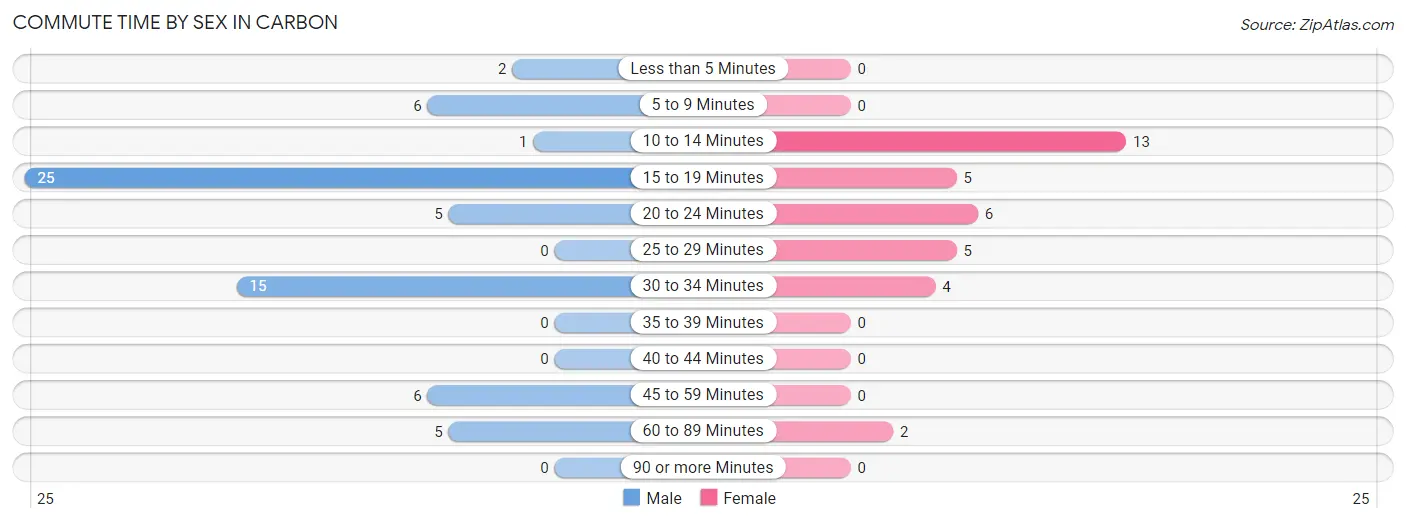
| Commute Time | Male | Female |
| Less than 5 Minutes | 2 (3.1%) | 0 (0.0%) |
| 5 to 9 Minutes | 6 (9.2%) | 0 (0.0%) |
| 10 to 14 Minutes | 1 (1.5%) | 13 (37.1%) |
| 15 to 19 Minutes | 25 (38.5%) | 5 (14.3%) |
| 20 to 24 Minutes | 5 (7.7%) | 6 (17.1%) |
| 25 to 29 Minutes | 0 (0.0%) | 5 (14.3%) |
| 30 to 34 Minutes | 15 (23.1%) | 4 (11.4%) |
| 35 to 39 Minutes | 0 (0.0%) | 0 (0.0%) |
| 40 to 44 Minutes | 0 (0.0%) | 0 (0.0%) |
| 45 to 59 Minutes | 6 (9.2%) | 0 (0.0%) |
| 60 to 89 Minutes | 5 (7.7%) | 2 (5.7%) |
| 90 or more Minutes | 0 (0.0%) | 0 (0.0%) |
Time of Departure to Work by Sex in Carbon
The most frequent times of departure to work in Carbon are 6:30 AM to 6:59 AM (19, 29.2%) for males and 7:30 AM to 7:59 AM (12, 34.3%) for females.
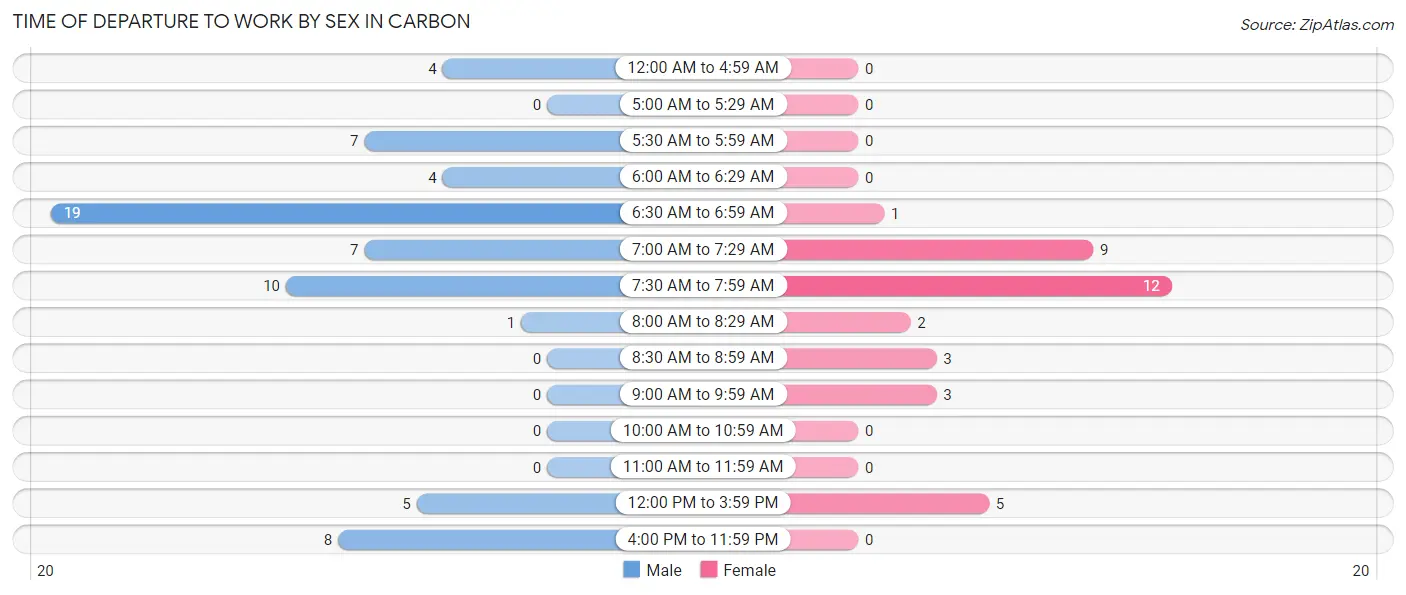
| Time of Departure | Male | Female |
| 12:00 AM to 4:59 AM | 4 (6.1%) | 0 (0.0%) |
| 5:00 AM to 5:29 AM | 0 (0.0%) | 0 (0.0%) |
| 5:30 AM to 5:59 AM | 7 (10.8%) | 0 (0.0%) |
| 6:00 AM to 6:29 AM | 4 (6.1%) | 0 (0.0%) |
| 6:30 AM to 6:59 AM | 19 (29.2%) | 1 (2.9%) |
| 7:00 AM to 7:29 AM | 7 (10.8%) | 9 (25.7%) |
| 7:30 AM to 7:59 AM | 10 (15.4%) | 12 (34.3%) |
| 8:00 AM to 8:29 AM | 1 (1.5%) | 2 (5.7%) |
| 8:30 AM to 8:59 AM | 0 (0.0%) | 3 (8.6%) |
| 9:00 AM to 9:59 AM | 0 (0.0%) | 3 (8.6%) |
| 10:00 AM to 10:59 AM | 0 (0.0%) | 0 (0.0%) |
| 11:00 AM to 11:59 AM | 0 (0.0%) | 0 (0.0%) |
| 12:00 PM to 3:59 PM | 5 (7.7%) | 5 (14.3%) |
| 4:00 PM to 11:59 PM | 8 (12.3%) | 0 (0.0%) |
| Total | 65 (100.0%) | 35 (100.0%) |
Housing Occupancy in Carbon
Occupancy by Ownership in Carbon
Of the total 112 dwellings in Carbon, owner-occupied units account for 94 (83.9%), while renter-occupied units make up 18 (16.1%).
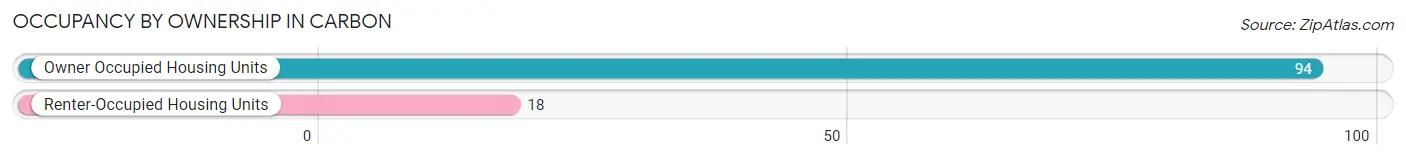
| Occupancy | # Housing Units | % Housing Units |
| Owner Occupied Housing Units | 94 | 83.9% |
| Renter-Occupied Housing Units | 18 | 16.1% |
| Total Occupied Housing Units | 112 | 100.0% |
Occupancy by Household Size in Carbon
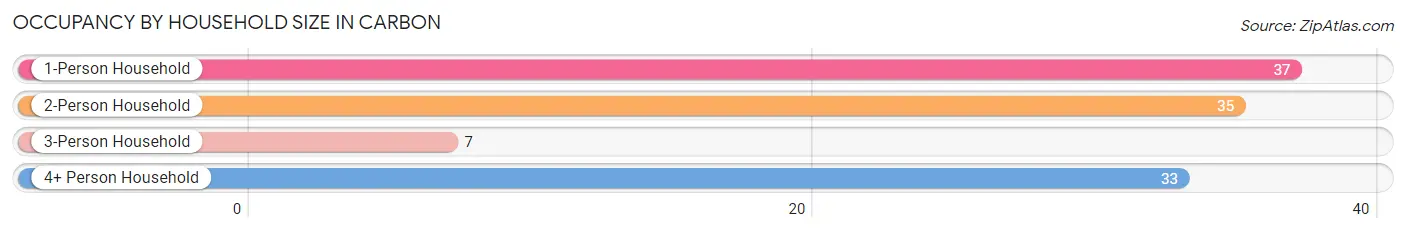
| Household Size | # Housing Units | % Housing Units |
| 1-Person Household | 37 | 33.0% |
| 2-Person Household | 35 | 31.2% |
| 3-Person Household | 7 | 6.2% |
| 4+ Person Household | 33 | 29.5% |
| Total Housing Units | 112 | 100.0% |
Occupancy by Ownership by Household Size in Carbon
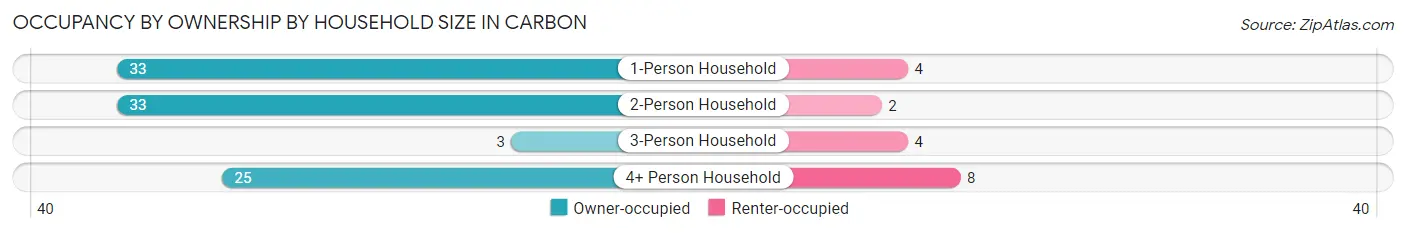
| Household Size | Owner-occupied | Renter-occupied |
| 1-Person Household | 33 (89.2%) | 4 (10.8%) |
| 2-Person Household | 33 (94.3%) | 2 (5.7%) |
| 3-Person Household | 3 (42.9%) | 4 (57.1%) |
| 4+ Person Household | 25 (75.8%) | 8 (24.2%) |
| Total Housing Units | 94 (83.9%) | 18 (16.1%) |
Occupancy by Educational Attainment in Carbon
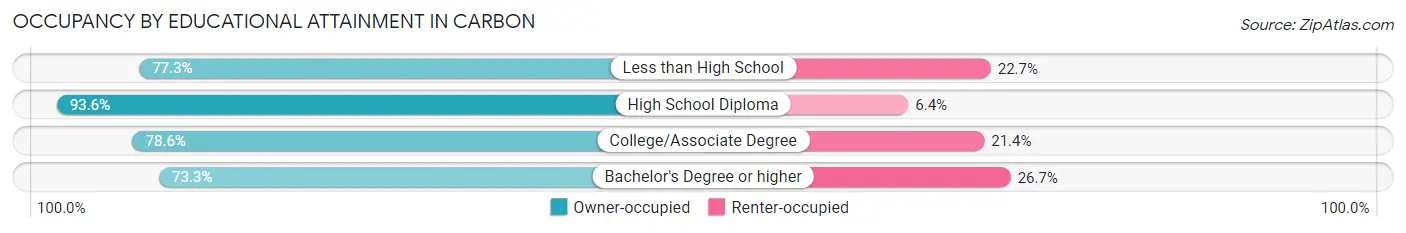
| Household Size | Owner-occupied | Renter-occupied |
| Less than High School | 17 (77.3%) | 5 (22.7%) |
| High School Diploma | 44 (93.6%) | 3 (6.4%) |
| College/Associate Degree | 22 (78.6%) | 6 (21.4%) |
| Bachelor's Degree or higher | 11 (73.3%) | 4 (26.7%) |
Occupancy by Age of Householder in Carbon
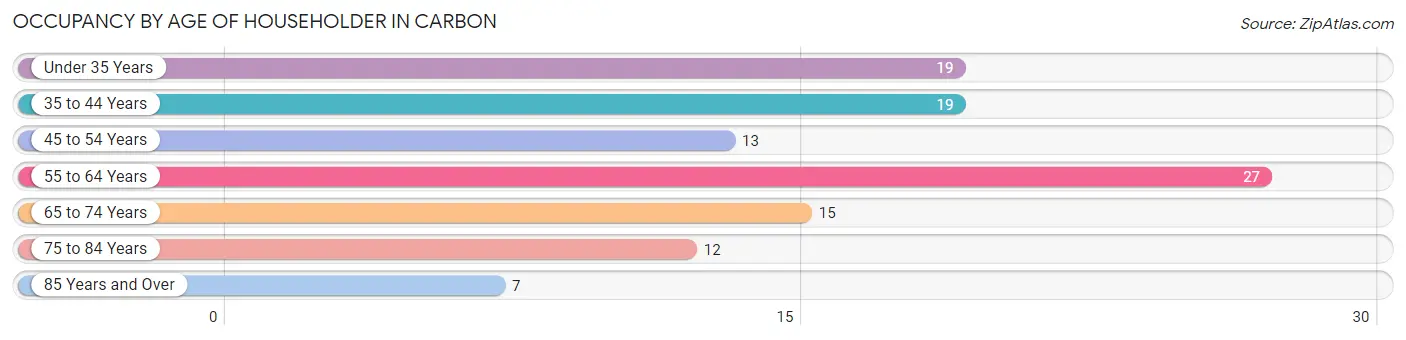
| Age Bracket | # Households | % Households |
| Under 35 Years | 19 | 17.0% |
| 35 to 44 Years | 19 | 17.0% |
| 45 to 54 Years | 13 | 11.6% |
| 55 to 64 Years | 27 | 24.1% |
| 65 to 74 Years | 15 | 13.4% |
| 75 to 84 Years | 12 | 10.7% |
| 85 Years and Over | 7 | 6.2% |
| Total | 112 | 100.0% |
Housing Finances in Carbon
Median Income by Occupancy in Carbon
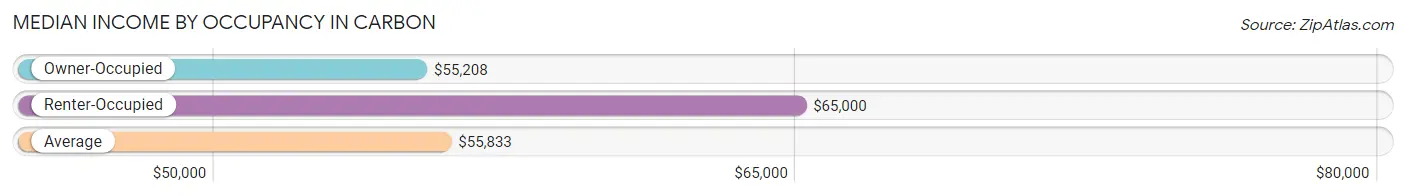
| Occupancy Type | # Households | Median Income |
| Owner-Occupied | 94 (83.9%) | $55,208 |
| Renter-Occupied | 18 (16.1%) | $65,000 |
| Average | 112 (100.0%) | $55,833 |
Occupancy by Householder Income Bracket in Carbon
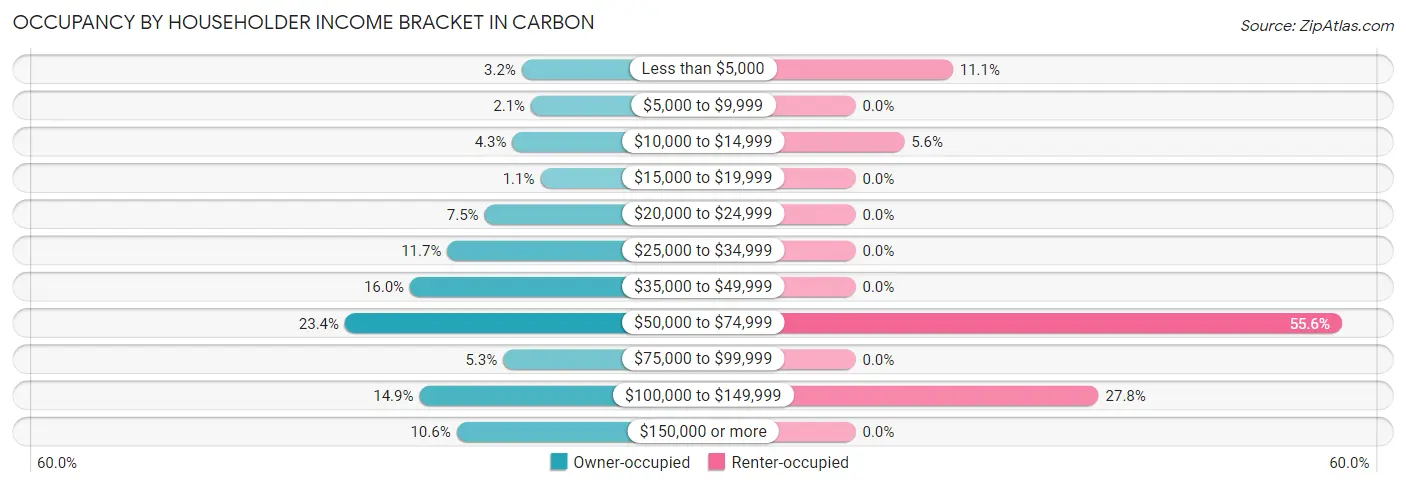
| Income Bracket | Owner-occupied | Renter-occupied |
| Less than $5,000 | 3 (3.2%) | 2 (11.1%) |
| $5,000 to $9,999 | 2 (2.1%) | 0 (0.0%) |
| $10,000 to $14,999 | 4 (4.3%) | 1 (5.6%) |
| $15,000 to $19,999 | 1 (1.1%) | 0 (0.0%) |
| $20,000 to $24,999 | 7 (7.4%) | 0 (0.0%) |
| $25,000 to $34,999 | 11 (11.7%) | 0 (0.0%) |
| $35,000 to $49,999 | 15 (16.0%) | 0 (0.0%) |
| $50,000 to $74,999 | 22 (23.4%) | 10 (55.6%) |
| $75,000 to $99,999 | 5 (5.3%) | 0 (0.0%) |
| $100,000 to $149,999 | 14 (14.9%) | 5 (27.8%) |
| $150,000 or more | 10 (10.6%) | 0 (0.0%) |
| Total | 94 (100.0%) | 18 (100.0%) |
Monthly Housing Cost Tiers in Carbon
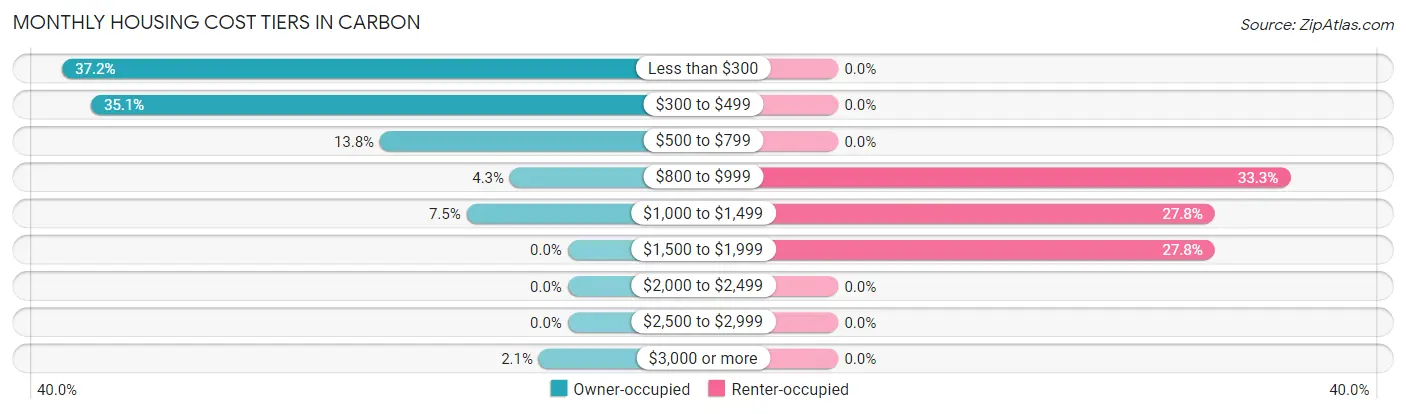
| Monthly Cost | Owner-occupied | Renter-occupied |
| Less than $300 | 35 (37.2%) | 0 (0.0%) |
| $300 to $499 | 33 (35.1%) | 0 (0.0%) |
| $500 to $799 | 13 (13.8%) | 0 (0.0%) |
| $800 to $999 | 4 (4.3%) | 6 (33.3%) |
| $1,000 to $1,499 | 7 (7.4%) | 5 (27.8%) |
| $1,500 to $1,999 | 0 (0.0%) | 5 (27.8%) |
| $2,000 to $2,499 | 0 (0.0%) | 0 (0.0%) |
| $2,500 to $2,999 | 0 (0.0%) | 0 (0.0%) |
| $3,000 or more | 2 (2.1%) | 0 (0.0%) |
| Total | 94 (100.0%) | 18 (100.0%) |
Physical Housing Characteristics in Carbon
Housing Structures in Carbon
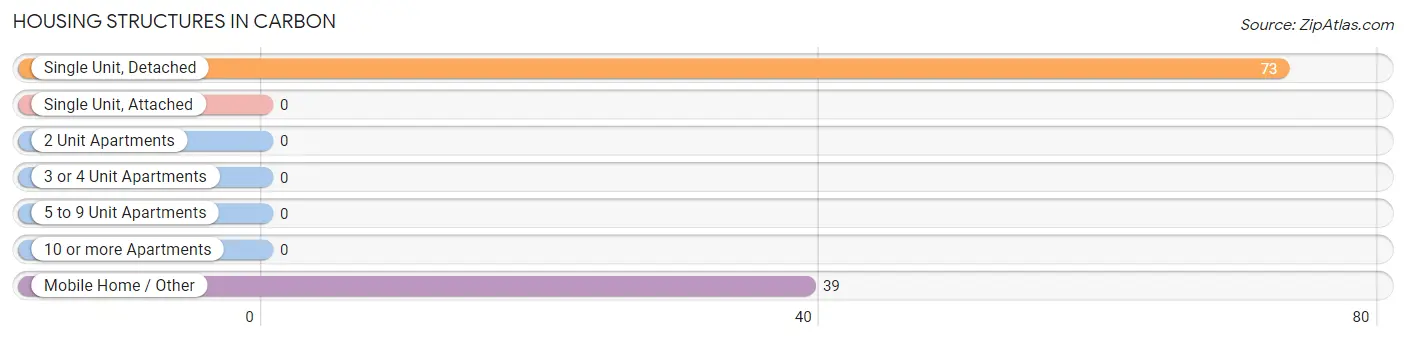
| Structure Type | # Housing Units | % Housing Units |
| Single Unit, Detached | 73 | 65.2% |
| Single Unit, Attached | 0 | 0.0% |
| 2 Unit Apartments | 0 | 0.0% |
| 3 or 4 Unit Apartments | 0 | 0.0% |
| 5 to 9 Unit Apartments | 0 | 0.0% |
| 10 or more Apartments | 0 | 0.0% |
| Mobile Home / Other | 39 | 34.8% |
| Total | 112 | 100.0% |
Housing Structures by Occupancy in Carbon
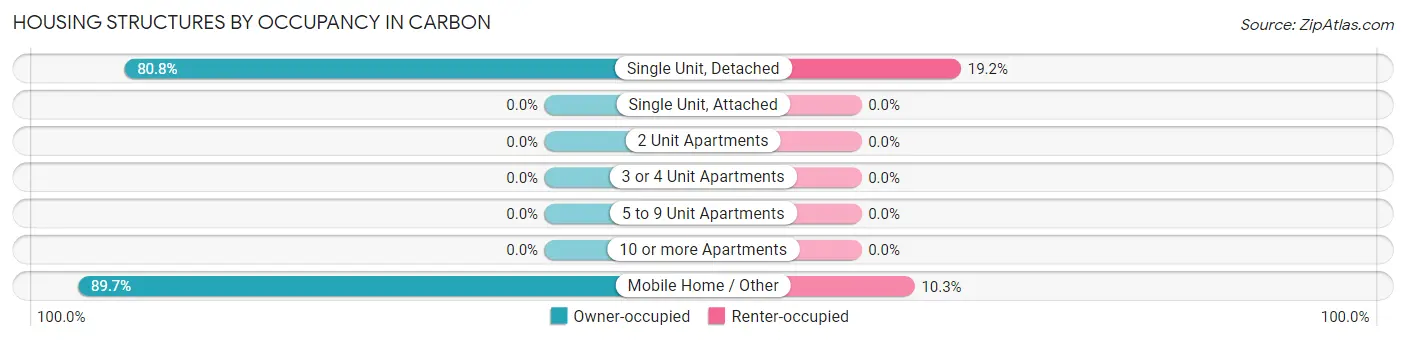
| Structure Type | Owner-occupied | Renter-occupied |
| Single Unit, Detached | 59 (80.8%) | 14 (19.2%) |
| Single Unit, Attached | 0 (0.0%) | 0 (0.0%) |
| 2 Unit Apartments | 0 (0.0%) | 0 (0.0%) |
| 3 or 4 Unit Apartments | 0 (0.0%) | 0 (0.0%) |
| 5 to 9 Unit Apartments | 0 (0.0%) | 0 (0.0%) |
| 10 or more Apartments | 0 (0.0%) | 0 (0.0%) |
| Mobile Home / Other | 35 (89.7%) | 4 (10.3%) |
| Total | 94 (83.9%) | 18 (16.1%) |
Housing Structures by Number of Rooms in Carbon
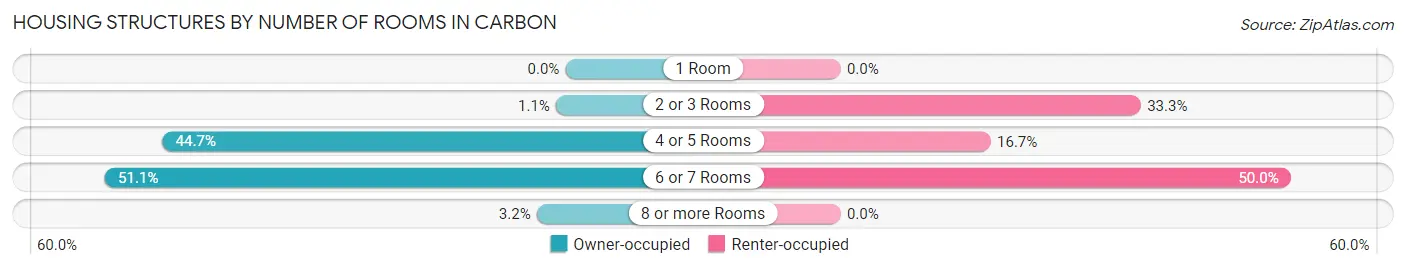
| Number of Rooms | Owner-occupied | Renter-occupied |
| 1 Room | 0 (0.0%) | 0 (0.0%) |
| 2 or 3 Rooms | 1 (1.1%) | 6 (33.3%) |
| 4 or 5 Rooms | 42 (44.7%) | 3 (16.7%) |
| 6 or 7 Rooms | 48 (51.1%) | 9 (50.0%) |
| 8 or more Rooms | 3 (3.2%) | 0 (0.0%) |
| Total | 94 (100.0%) | 18 (100.0%) |
Housing Structure by Heating Type in Carbon
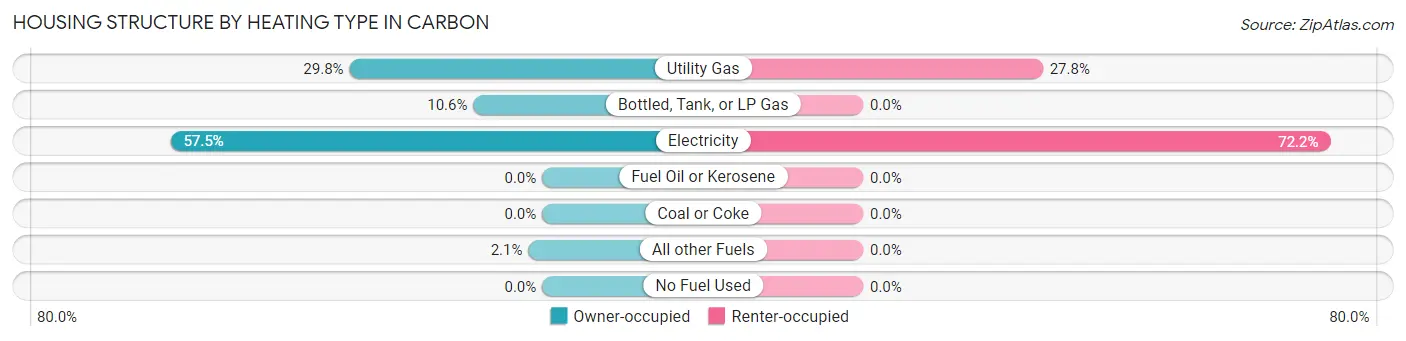
| Heating Type | Owner-occupied | Renter-occupied |
| Utility Gas | 28 (29.8%) | 5 (27.8%) |
| Bottled, Tank, or LP Gas | 10 (10.6%) | 0 (0.0%) |
| Electricity | 54 (57.5%) | 13 (72.2%) |
| Fuel Oil or Kerosene | 0 (0.0%) | 0 (0.0%) |
| Coal or Coke | 0 (0.0%) | 0 (0.0%) |
| All other Fuels | 2 (2.1%) | 0 (0.0%) |
| No Fuel Used | 0 (0.0%) | 0 (0.0%) |
| Total | 94 (100.0%) | 18 (100.0%) |
Household Vehicle Usage in Carbon
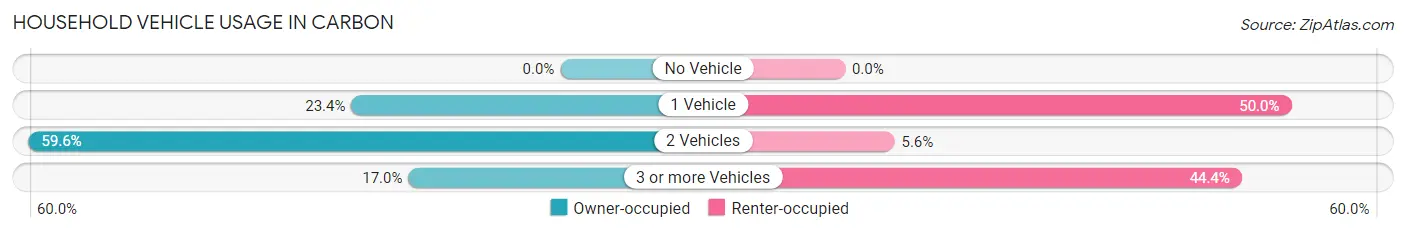
| Vehicles per Household | Owner-occupied | Renter-occupied |
| No Vehicle | 0 (0.0%) | 0 (0.0%) |
| 1 Vehicle | 22 (23.4%) | 9 (50.0%) |
| 2 Vehicles | 56 (59.6%) | 1 (5.6%) |
| 3 or more Vehicles | 16 (17.0%) | 8 (44.4%) |
| Total | 94 (100.0%) | 18 (100.0%) |
Real Estate & Mortgages in Carbon
Real Estate and Mortgage Overview in Carbon
| Characteristic | Without Mortgage | With Mortgage |
| Housing Units | 71 | 23 |
| Median Property Value | $33,800 | $58,300 |
| Median Household Income | $54,375 | $4 |
| Monthly Housing Costs | $304 | $2 |
| Real Estate Taxes | $369 | $0 |
Property Value by Mortgage Status in Carbon
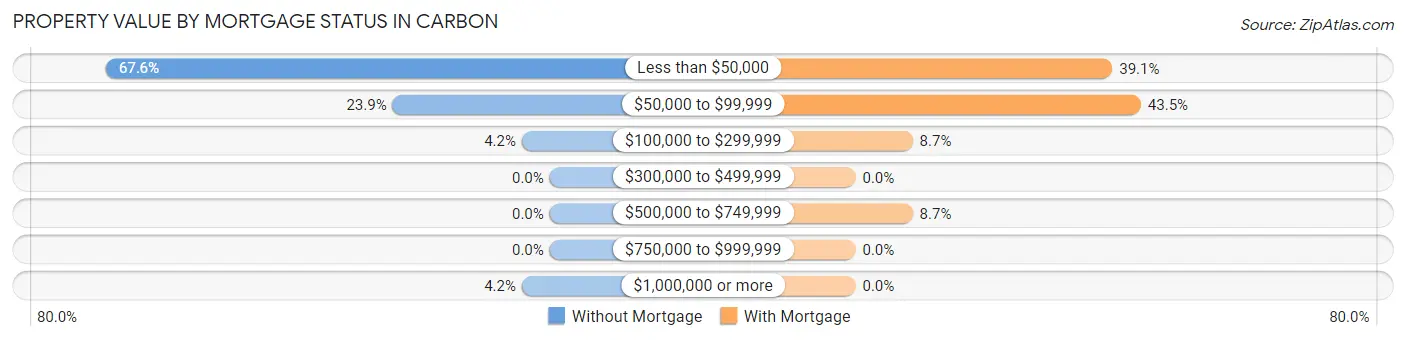
| Property Value | Without Mortgage | With Mortgage |
| Less than $50,000 | 48 (67.6%) | 9 (39.1%) |
| $50,000 to $99,999 | 17 (23.9%) | 10 (43.5%) |
| $100,000 to $299,999 | 3 (4.2%) | 2 (8.7%) |
| $300,000 to $499,999 | 0 (0.0%) | 0 (0.0%) |
| $500,000 to $749,999 | 0 (0.0%) | 2 (8.7%) |
| $750,000 to $999,999 | 0 (0.0%) | 0 (0.0%) |
| $1,000,000 or more | 3 (4.2%) | 0 (0.0%) |
| Total | 71 (100.0%) | 23 (100.0%) |
Household Income by Mortgage Status in Carbon
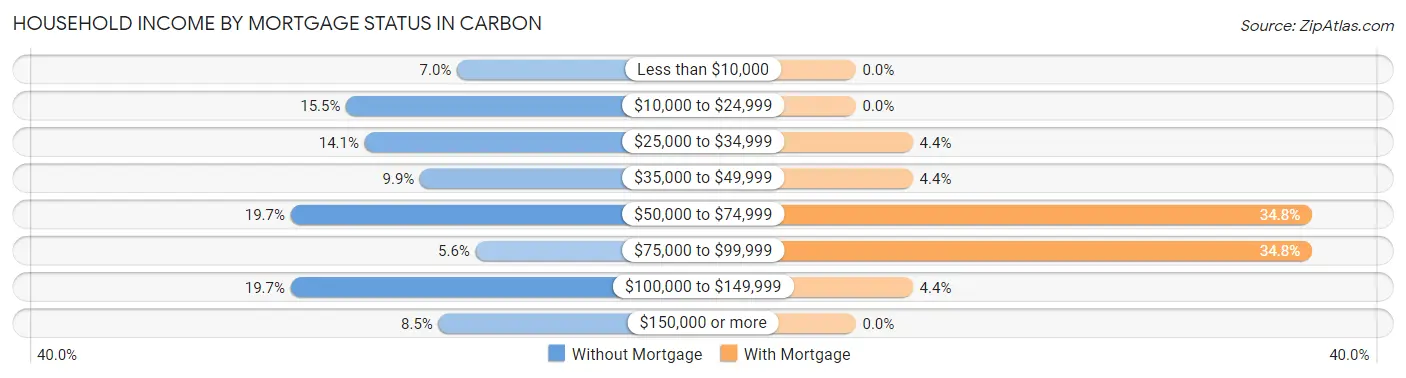
| Household Income | Without Mortgage | With Mortgage |
| Less than $10,000 | 5 (7.0%) | 0 (0.0%) |
| $10,000 to $24,999 | 11 (15.5%) | 0 (0.0%) |
| $25,000 to $34,999 | 10 (14.1%) | 1 (4.3%) |
| $35,000 to $49,999 | 7 (9.9%) | 1 (4.3%) |
| $50,000 to $74,999 | 14 (19.7%) | 8 (34.8%) |
| $75,000 to $99,999 | 4 (5.6%) | 8 (34.8%) |
| $100,000 to $149,999 | 14 (19.7%) | 1 (4.3%) |
| $150,000 or more | 6 (8.5%) | 0 (0.0%) |
| Total | 71 (100.0%) | 23 (100.0%) |
Property Value to Household Income Ratio in Carbon
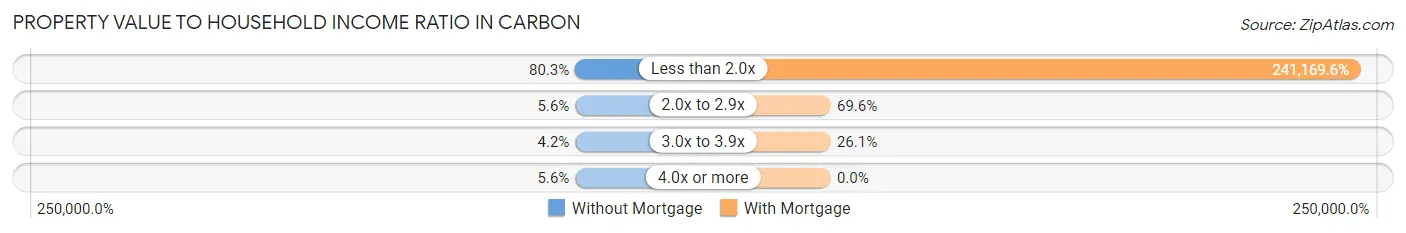
| Value-to-Income Ratio | Without Mortgage | With Mortgage |
| Less than 2.0x | 57 (80.3%) | 55,469 (241,169.6%) |
| 2.0x to 2.9x | 4 (5.6%) | 16 (69.6%) |
| 3.0x to 3.9x | 3 (4.2%) | 6 (26.1%) |
| 4.0x or more | 4 (5.6%) | 0 (0.0%) |
| Total | 71 (100.0%) | 23 (100.0%) |
Real Estate Taxes by Mortgage Status in Carbon
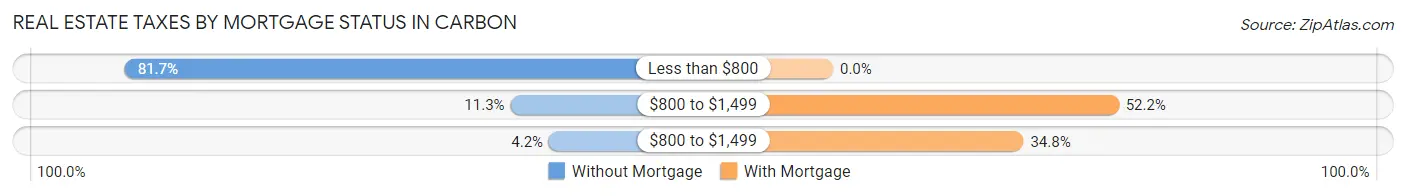
| Property Taxes | Without Mortgage | With Mortgage |
| Less than $800 | 58 (81.7%) | 0 (0.0%) |
| $800 to $1,499 | 8 (11.3%) | 12 (52.2%) |
| $800 to $1,499 | 3 (4.2%) | 8 (34.8%) |
| Total | 71 (100.0%) | 23 (100.0%) |
Health & Disability in Carbon
Health Insurance Coverage by Age in Carbon
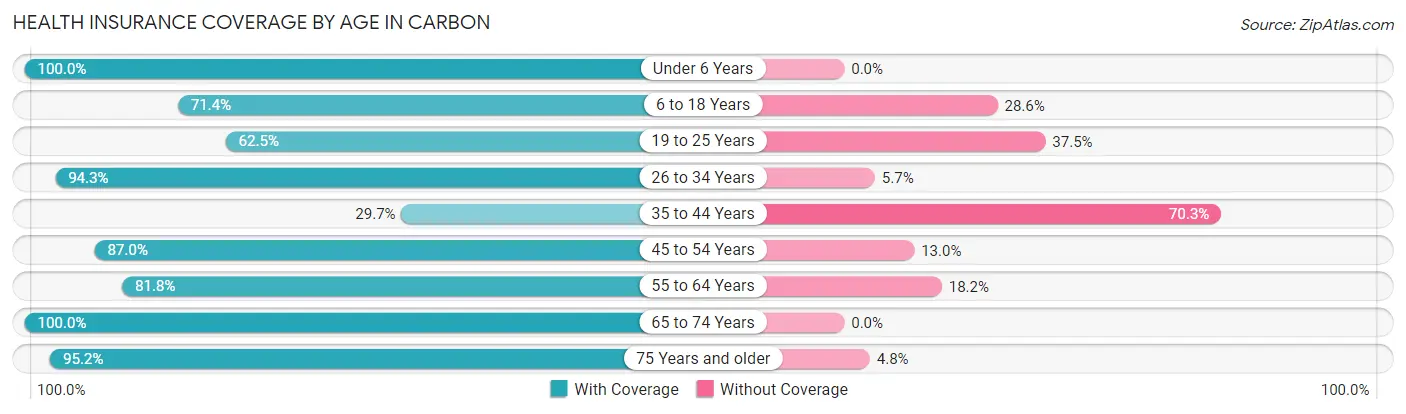
| Age Bracket | With Coverage | Without Coverage |
| Under 6 Years | 24 (100.0%) | 0 (0.0%) |
| 6 to 18 Years | 35 (71.4%) | 14 (28.6%) |
| 19 to 25 Years | 10 (62.5%) | 6 (37.5%) |
| 26 to 34 Years | 33 (94.3%) | 2 (5.7%) |
| 35 to 44 Years | 11 (29.7%) | 26 (70.3%) |
| 45 to 54 Years | 20 (87.0%) | 3 (13.0%) |
| 55 to 64 Years | 36 (81.8%) | 8 (18.2%) |
| 65 to 74 Years | 38 (100.0%) | 0 (0.0%) |
| 75 Years and older | 20 (95.2%) | 1 (4.8%) |
| Total | 227 (79.1%) | 60 (20.9%) |
Health Insurance Coverage by Citizenship Status in Carbon
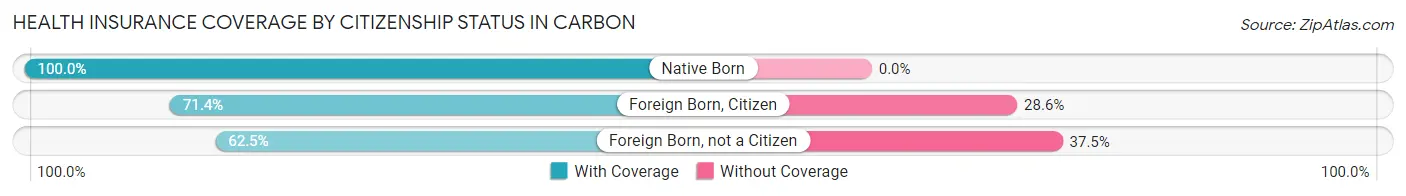
| Citizenship Status | With Coverage | Without Coverage |
| Native Born | 24 (100.0%) | 0 (0.0%) |
| Foreign Born, Citizen | 35 (71.4%) | 14 (28.6%) |
| Foreign Born, not a Citizen | 10 (62.5%) | 6 (37.5%) |
Health Insurance Coverage by Household Income in Carbon
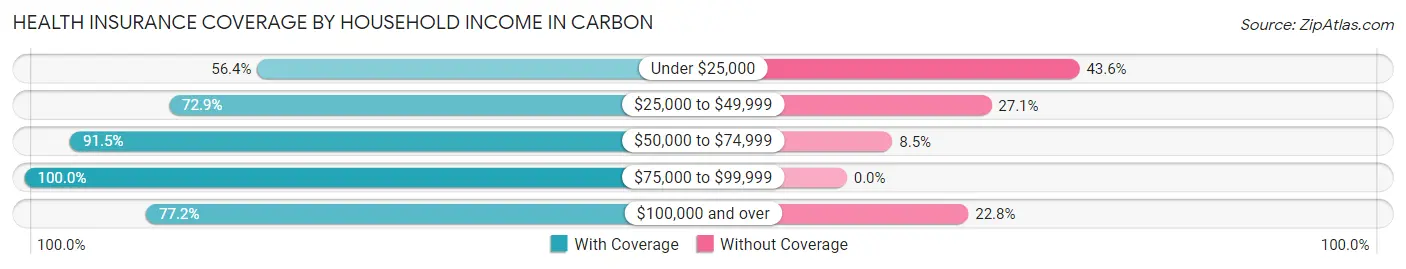
| Household Income | With Coverage | Without Coverage |
| Under $25,000 | 22 (56.4%) | 17 (43.6%) |
| $25,000 to $49,999 | 35 (72.9%) | 13 (27.1%) |
| $50,000 to $74,999 | 75 (91.5%) | 7 (8.5%) |
| $75,000 to $99,999 | 17 (100.0%) | 0 (0.0%) |
| $100,000 and over | 78 (77.2%) | 23 (22.8%) |
Public vs Private Health Insurance Coverage by Age in Carbon
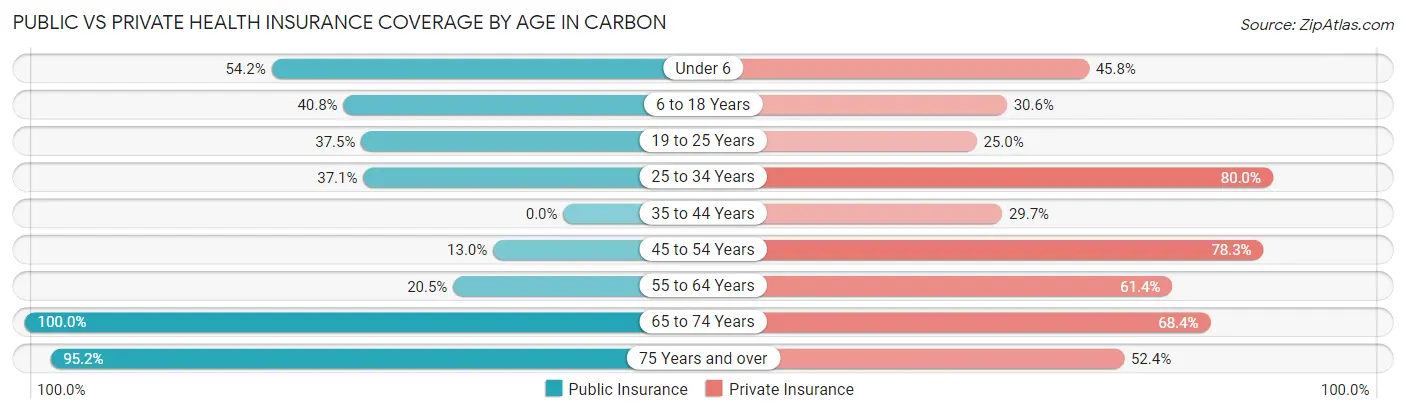
| Age Bracket | Public Insurance | Private Insurance |
| Under 6 | 13 (54.2%) | 11 (45.8%) |
| 6 to 18 Years | 20 (40.8%) | 15 (30.6%) |
| 19 to 25 Years | 6 (37.5%) | 4 (25.0%) |
| 25 to 34 Years | 13 (37.1%) | 28 (80.0%) |
| 35 to 44 Years | 0 (0.0%) | 11 (29.7%) |
| 45 to 54 Years | 3 (13.0%) | 18 (78.3%) |
| 55 to 64 Years | 9 (20.4%) | 27 (61.4%) |
| 65 to 74 Years | 38 (100.0%) | 26 (68.4%) |
| 75 Years and over | 20 (95.2%) | 11 (52.4%) |
| Total | 122 (42.5%) | 151 (52.6%) |
Disability Status by Sex by Age in Carbon
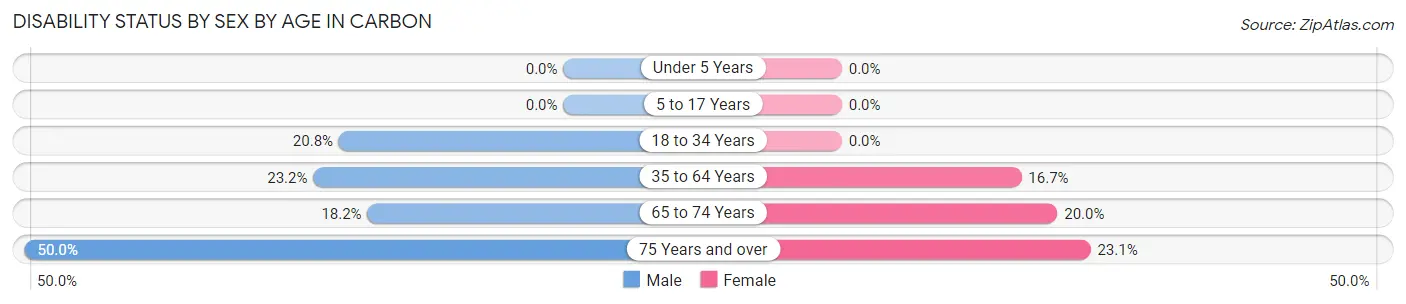
| Age Bracket | Male | Female |
| Under 5 Years | 0 (0.0%) | 0 (0.0%) |
| 5 to 17 Years | 0 (0.0%) | 0 (0.0%) |
| 18 to 34 Years | 5 (20.8%) | 0 (0.0%) |
| 35 to 64 Years | 13 (23.2%) | 8 (16.7%) |
| 65 to 74 Years | 6 (18.2%) | 1 (20.0%) |
| 75 Years and over | 4 (50.0%) | 3 (23.1%) |
Disability Class by Sex by Age in Carbon
Disability Class: Hearing Difficulty
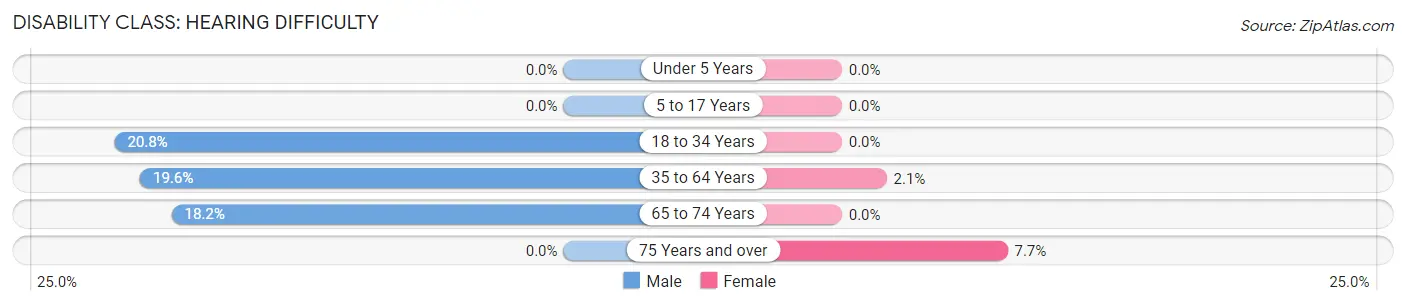
| Age Bracket | Male | Female |
| Under 5 Years | 0 (0.0%) | 0 (0.0%) |
| 5 to 17 Years | 0 (0.0%) | 0 (0.0%) |
| 18 to 34 Years | 5 (20.8%) | 0 (0.0%) |
| 35 to 64 Years | 11 (19.6%) | 1 (2.1%) |
| 65 to 74 Years | 6 (18.2%) | 0 (0.0%) |
| 75 Years and over | 0 (0.0%) | 1 (7.7%) |
Disability Class: Vision Difficulty
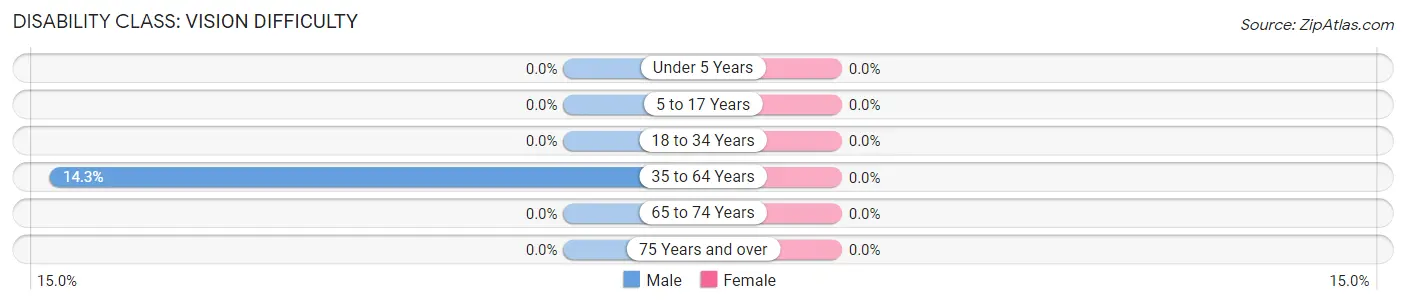
| Age Bracket | Male | Female |
| Under 5 Years | 0 (0.0%) | 0 (0.0%) |
| 5 to 17 Years | 0 (0.0%) | 0 (0.0%) |
| 18 to 34 Years | 0 (0.0%) | 0 (0.0%) |
| 35 to 64 Years | 8 (14.3%) | 0 (0.0%) |
| 65 to 74 Years | 0 (0.0%) | 0 (0.0%) |
| 75 Years and over | 0 (0.0%) | 0 (0.0%) |
Disability Class: Cognitive Difficulty
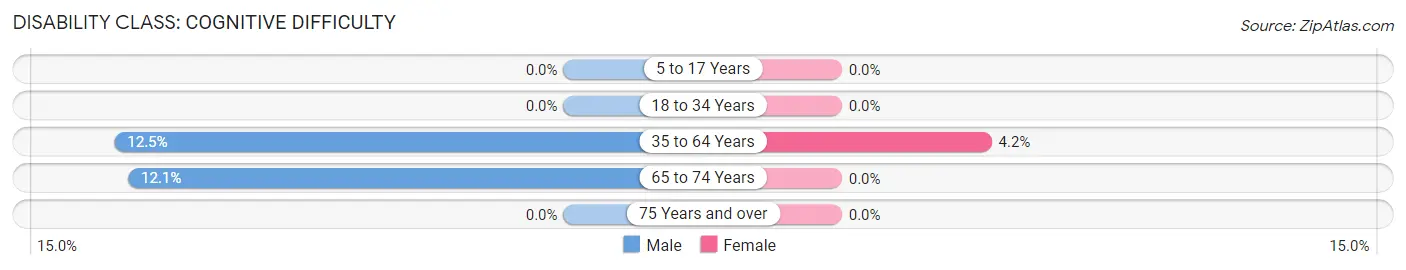
| Age Bracket | Male | Female |
| 5 to 17 Years | 0 (0.0%) | 0 (0.0%) |
| 18 to 34 Years | 0 (0.0%) | 0 (0.0%) |
| 35 to 64 Years | 7 (12.5%) | 2 (4.2%) |
| 65 to 74 Years | 4 (12.1%) | 0 (0.0%) |
| 75 Years and over | 0 (0.0%) | 0 (0.0%) |
Disability Class: Ambulatory Difficulty
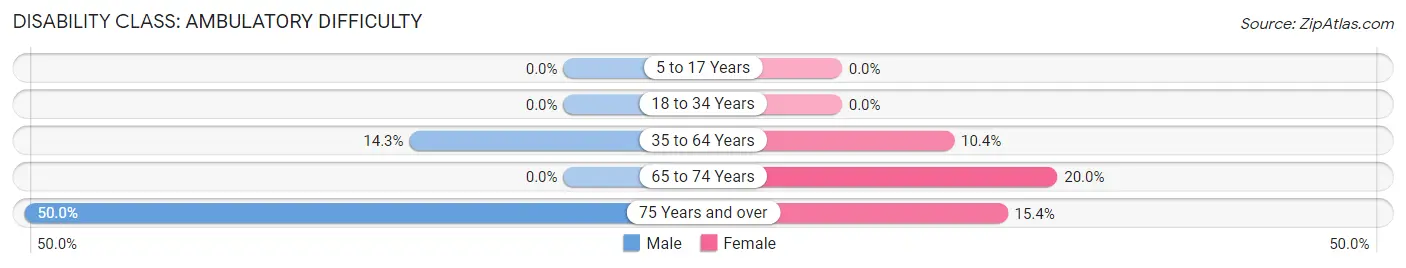
| Age Bracket | Male | Female |
| 5 to 17 Years | 0 (0.0%) | 0 (0.0%) |
| 18 to 34 Years | 0 (0.0%) | 0 (0.0%) |
| 35 to 64 Years | 8 (14.3%) | 5 (10.4%) |
| 65 to 74 Years | 0 (0.0%) | 1 (20.0%) |
| 75 Years and over | 4 (50.0%) | 2 (15.4%) |
Disability Class: Self-Care Difficulty
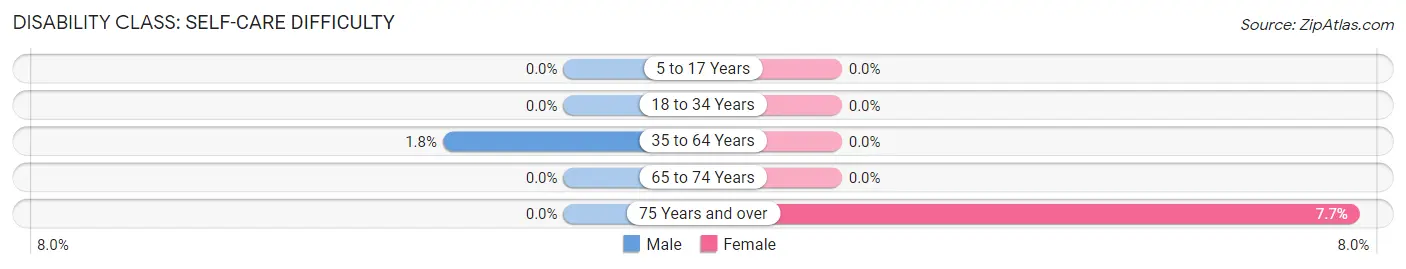
| Age Bracket | Male | Female |
| 5 to 17 Years | 0 (0.0%) | 0 (0.0%) |
| 18 to 34 Years | 0 (0.0%) | 0 (0.0%) |
| 35 to 64 Years | 1 (1.8%) | 0 (0.0%) |
| 65 to 74 Years | 0 (0.0%) | 0 (0.0%) |
| 75 Years and over | 0 (0.0%) | 1 (7.7%) |
Technology Access in Carbon
Computing Device Access in Carbon
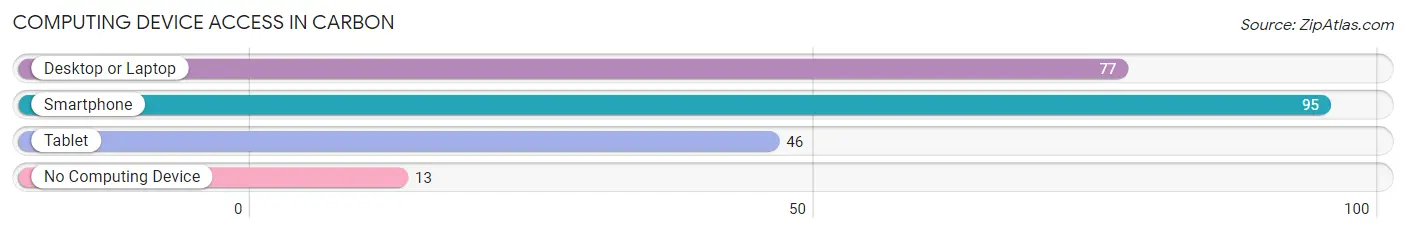
| Device Type | # Households | % Households |
| Desktop or Laptop | 77 | 68.8% |
| Smartphone | 95 | 84.8% |
| Tablet | 46 | 41.1% |
| No Computing Device | 13 | 11.6% |
| Total | 112 | 100.0% |
Internet Access in Carbon
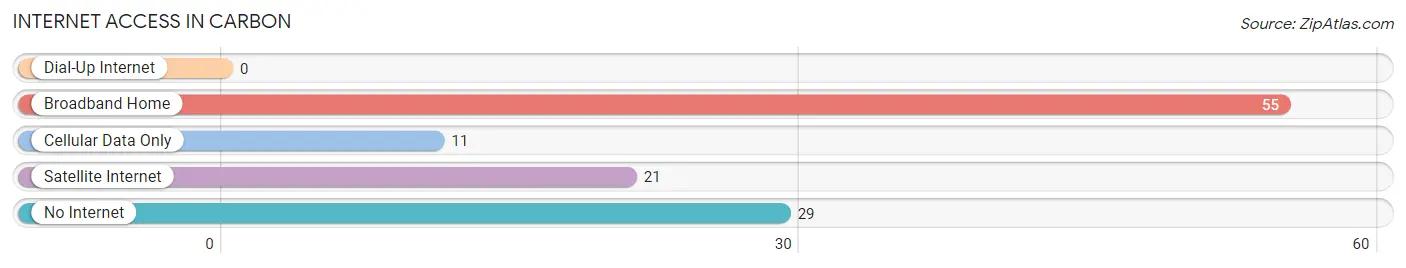
| Internet Type | # Households | % Households |
| Dial-Up Internet | 0 | 0.0% |
| Broadband Home | 55 | 49.1% |
| Cellular Data Only | 11 | 9.8% |
| Satellite Internet | 21 | 18.8% |
| No Internet | 29 | 25.9% |
| Total | 112 | 100.0% |
Carbon Summary
Carbon, Texas is a small unincorporated community located in the western part of the state, in the county of Runnels. It is situated about 20 miles south of Abilene and about 10 miles east of Ballinger. The population of Carbon was estimated to be around 200 people in the year 2000.
Geography
Carbon is located in the western part of Texas, in the county of Runnels. It is situated about 20 miles south of Abilene and about 10 miles east of Ballinger. The terrain of the area is mostly flat with some rolling hills. The climate is semi-arid with hot summers and mild winters. The average annual precipitation is about 20 inches.
Economy
The economy of Carbon is largely based on agriculture. The main crops grown in the area are cotton, corn, wheat, and sorghum. Livestock production is also important, with cattle and sheep being the main animals raised. There are also some small businesses in the area, such as a grocery store, a gas station, and a few restaurants.
Demographics
The population of Carbon was estimated to be around 200 people in the year 2000. The racial makeup of the town was 97.5% White, 0.5% African American, 0.5% Native American, and 1.5% from other races. The median household income was $25,000 and the median family income was $30,000. The per capita income was $14,000.
History
Carbon was first settled in the late 1800s by ranchers and farmers. The town was named after the nearby Carbon Creek. The first post office was established in 1891. In the early 1900s, the town was a stop on the Texas and Pacific Railway. The town grew slowly over the years, but never really developed into a large town.
In the late 20th century, the town began to decline as many of the residents moved away to larger cities. The population of Carbon has remained relatively stable since then, with only a few new residents moving in.
Conclusion
Carbon, Texas is a small unincorporated community located in the western part of the state, in the county of Runnels. It is situated about 20 miles south of Abilene and about 10 miles east of Ballinger. The population of Carbon was estimated to be around 200 people in the year 2000. The economy of Carbon is largely based on agriculture, with cotton, corn, wheat, and sorghum being the main crops grown in the area. Livestock production is also important, with cattle and sheep being the main animals raised. The racial makeup of the town was 97.5% White, 0.5% African American, 0.5% Native American, and 1.5% from other races. The median household income was $25,000 and the median family income was $30,000. The per capita income was $14,000. Carbon was first settled in the late 1800s by ranchers and farmers and has remained relatively stable since then.
Common Questions
What is Per Capita Income in Carbon?
Per Capita income in Carbon is $35,706.
What is the Median Family Income in Carbon?
Median Family Income in Carbon is $56,406.
What is the Median Household income in Carbon?
Median Household Income in Carbon is $55,833.
What is Inequality or Gini Index in Carbon?
Inequality or Gini Index in Carbon is 0.49.
What is the Total Population of Carbon?
Total Population of Carbon is 287.
What is the Total Male Population of Carbon?
Total Male Population of Carbon is 154.
What is the Total Female Population of Carbon?
Total Female Population of Carbon is 133.
What is the Ratio of Males per 100 Females in Carbon?
There are 115.79 Males per 100 Females in Carbon.
What is the Ratio of Females per 100 Males in Carbon?
There are 86.36 Females per 100 Males in Carbon.
What is the Median Population Age in Carbon?
Median Population Age in Carbon is 40.9 Years.
What is the Average Family Size in Carbon
Average Family Size in Carbon is 3.4 People.
What is the Average Household Size in Carbon
Average Household Size in Carbon is 2.6 People.
How Large is the Labor Force in Carbon?
There are 113 People in the Labor Forcein in Carbon.
What is the Percentage of People in the Labor Force in Carbon?
49.8% of People are in the Labor Force in Carbon.
What is the Unemployment Rate in Carbon?
Unemployment Rate in Carbon is 3.5%.