Calvert, TX Map & Demographics
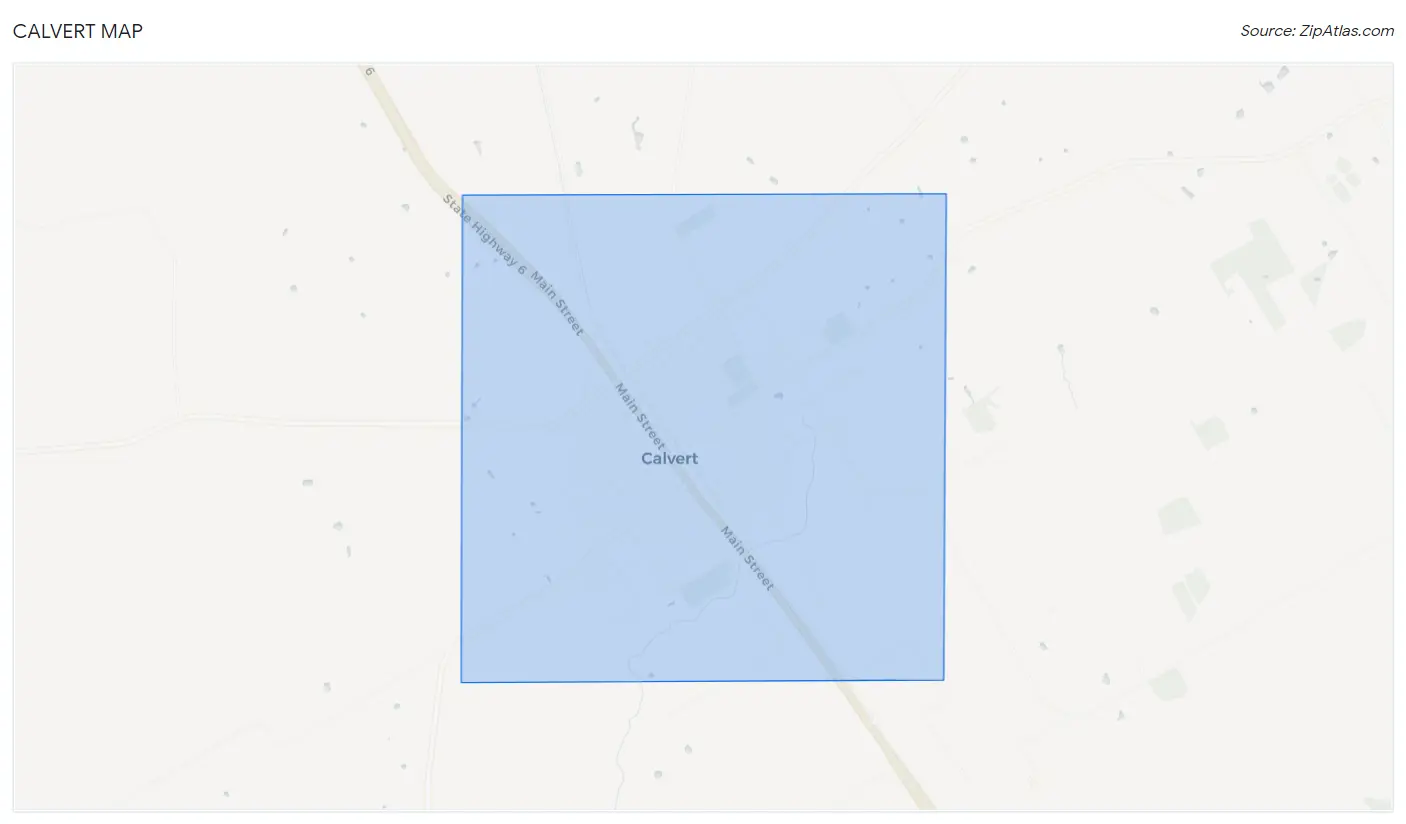
Calvert Map
Calvert Overview
$27,622
PER CAPITA INCOME
$75,042
AVG FAMILY INCOME
$63,750
AVG HOUSEHOLD INCOME
28.5%
WAGE / INCOME GAP [ % ]
71.5¢/ $1
WAGE / INCOME GAP [ $ ]
0.35
INEQUALITY / GINI INDEX
996
TOTAL POPULATION
430
MALE POPULATION
566
FEMALE POPULATION
75.97
MALES / 100 FEMALES
131.63
FEMALES / 100 MALES
39.9
MEDIAN AGE
2.9
AVG FAMILY SIZE
2.4
AVG HOUSEHOLD SIZE
407
LABOR FORCE [ PEOPLE ]
54.9%
PERCENT IN LABOR FORCE
9.8%
UNEMPLOYMENT RATE
Calvert Zip Codes
Calvert Area Codes
Income in Calvert
Income Overview in Calvert
Per Capita Income in Calvert is $27,622, while median incomes of families and households are $75,042 and $63,750 respectively.
| Characteristic | Number | Measure |
| Per Capita Income | 996 | $27,622 |
| Median Family Income | 304 | $75,042 |
| Mean Family Income | 304 | $71,922 |
| Median Household Income | 400 | $63,750 |
| Mean Household Income | 400 | $66,518 |
| Income Deficit | 304 | $0 |
| Wage / Income Gap (%) | 996 | 28.48% |
| Wage / Income Gap ($) | 996 | 71.52¢ per $1 |
| Gini / Inequality Index | 996 | 0.35 |
Earnings by Sex in Calvert
Average Earnings in Calvert are $45,632, $55,817 for men and $39,922 for women, a difference of 28.5%.
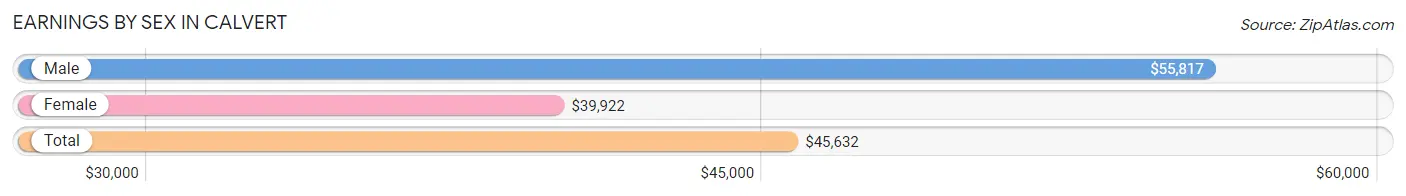
| Sex | Number | Average Earnings |
| Male | 171 (38.9%) | $55,817 |
| Female | 269 (61.1%) | $39,922 |
| Total | 440 (100.0%) | $45,632 |
Earnings by Sex by Income Bracket in Calvert
The most common earnings brackets in Calvert are $100,000+ for men (31 | 18.1%) and $45,000 to $49,999 for women (109 | 40.5%).
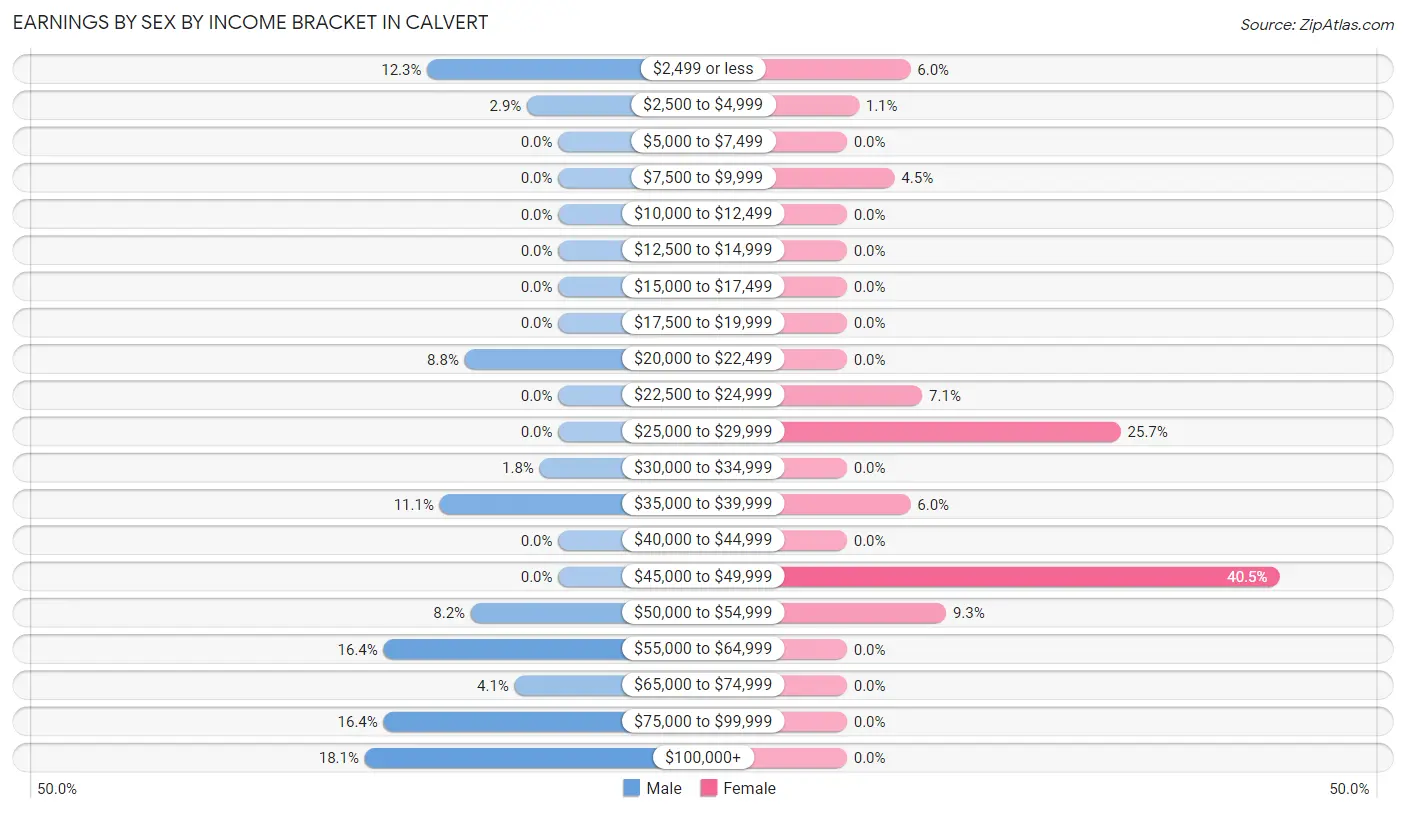
| Income | Male | Female |
| $2,499 or less | 21 (12.3%) | 16 (5.9%) |
| $2,500 to $4,999 | 5 (2.9%) | 3 (1.1%) |
| $5,000 to $7,499 | 0 (0.0%) | 0 (0.0%) |
| $7,500 to $9,999 | 0 (0.0%) | 12 (4.5%) |
| $10,000 to $12,499 | 0 (0.0%) | 0 (0.0%) |
| $12,500 to $14,999 | 0 (0.0%) | 0 (0.0%) |
| $15,000 to $17,499 | 0 (0.0%) | 0 (0.0%) |
| $17,500 to $19,999 | 0 (0.0%) | 0 (0.0%) |
| $20,000 to $22,499 | 15 (8.8%) | 0 (0.0%) |
| $22,500 to $24,999 | 0 (0.0%) | 19 (7.1%) |
| $25,000 to $29,999 | 0 (0.0%) | 69 (25.7%) |
| $30,000 to $34,999 | 3 (1.8%) | 0 (0.0%) |
| $35,000 to $39,999 | 19 (11.1%) | 16 (5.9%) |
| $40,000 to $44,999 | 0 (0.0%) | 0 (0.0%) |
| $45,000 to $49,999 | 0 (0.0%) | 109 (40.5%) |
| $50,000 to $54,999 | 14 (8.2%) | 25 (9.3%) |
| $55,000 to $64,999 | 28 (16.4%) | 0 (0.0%) |
| $65,000 to $74,999 | 7 (4.1%) | 0 (0.0%) |
| $75,000 to $99,999 | 28 (16.4%) | 0 (0.0%) |
| $100,000+ | 31 (18.1%) | 0 (0.0%) |
| Total | 171 (100.0%) | 269 (100.0%) |
Earnings by Sex by Educational Attainment in Calvert
Average earnings in Calvert are $55,817 for men and $29,293 for women, a difference of 47.5%. Men with an educational attainment of high school diploma enjoy the highest average annual earnings of $102,670, while those with college or associate's degree education earn the least with $38,523. Women with an educational attainment of college or associate's degree earn the most with the average annual earnings of $29,833, while those with college or associate's degree education have the smallest earnings of $29,833.
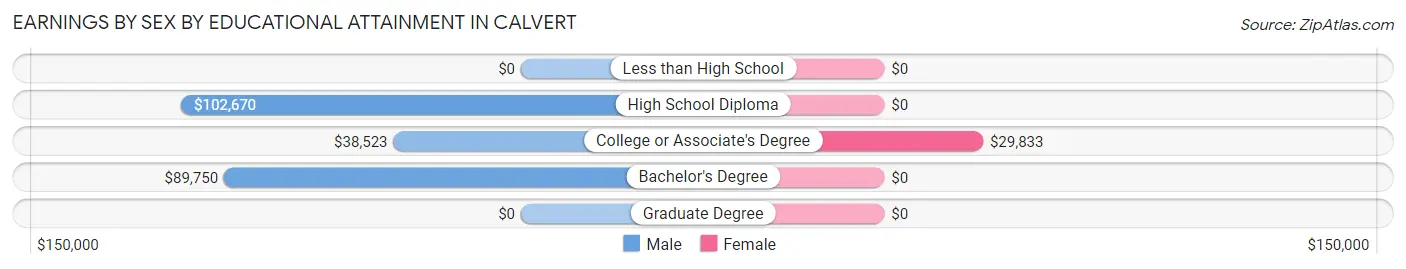
| Educational Attainment | Male Income | Female Income |
| Less than High School | - | - |
| High School Diploma | $102,670 | $0 |
| College or Associate's Degree | $38,523 | $29,833 |
| Bachelor's Degree | $89,750 | $0 |
| Graduate Degree | - | - |
| Total | $55,817 | $29,293 |
Family Income in Calvert
Family Income Brackets in Calvert
According to the Calvert family income data, there are 92 families falling into the $75,000 to $99,999 income range, which is the most common income bracket and makes up 30.3% of all families.
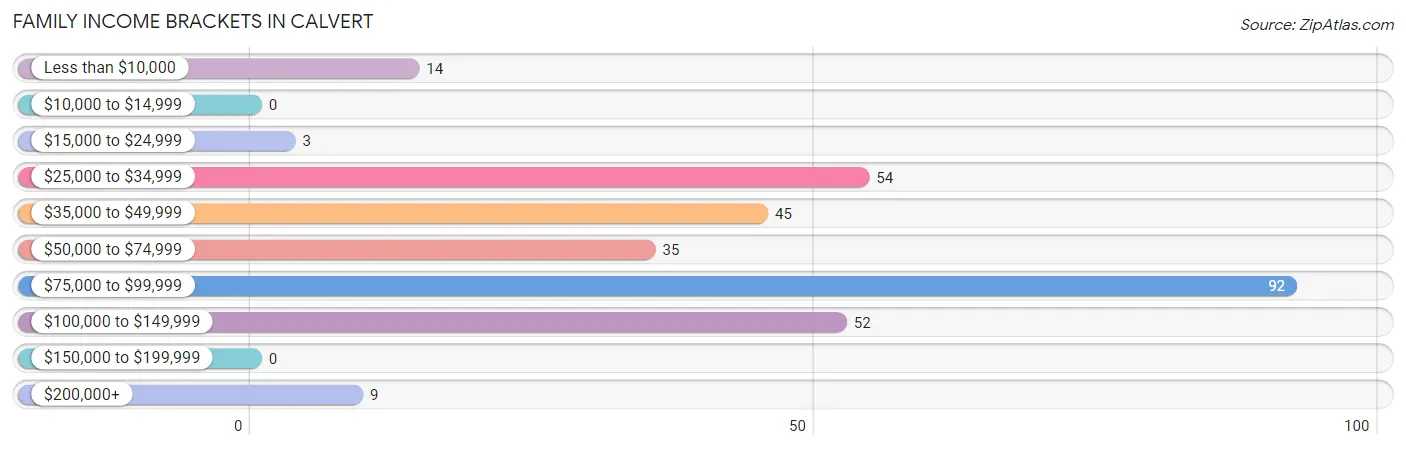
| Income Bracket | # Families | % Families |
| Less than $10,000 | 14 | 4.6% |
| $10,000 to $14,999 | 0 | 0.0% |
| $15,000 to $24,999 | 3 | 1.0% |
| $25,000 to $34,999 | 54 | 17.8% |
| $35,000 to $49,999 | 45 | 14.8% |
| $50,000 to $74,999 | 35 | 11.5% |
| $75,000 to $99,999 | 92 | 30.3% |
| $100,000 to $149,999 | 52 | 17.1% |
| $150,000 to $199,999 | 0 | 0.0% |
| $200,000+ | 9 | 3.0% |
Family Income by Famaliy Size in Calvert
3-person families (51 | 16.8%) account for the highest median family income in Calvert with $120,650 per family, while 3-person families (51 | 16.8%) have the highest median income of $40,217 per family member.
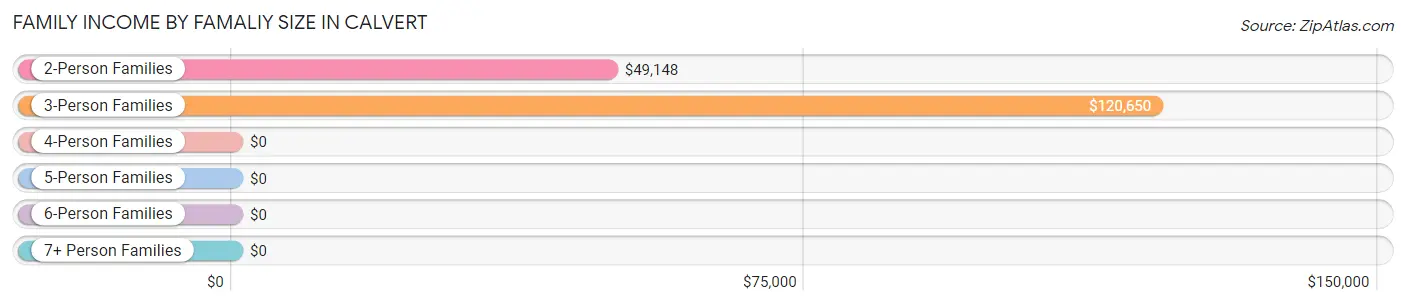
| Income Bracket | # Families | Median Income |
| 2-Person Families | 173 (56.9%) | $49,148 |
| 3-Person Families | 51 (16.8%) | $120,650 |
| 4-Person Families | 75 (24.7%) | $0 |
| 5-Person Families | 5 (1.6%) | $0 |
| 6-Person Families | 0 (0.0%) | $0 |
| 7+ Person Families | 0 (0.0%) | $0 |
| Total | 304 (100.0%) | $75,042 |
Family Income by Number of Earners in Calvert
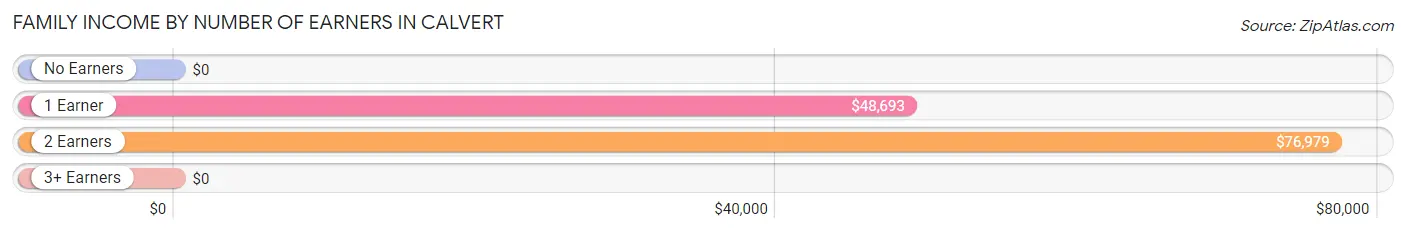
| Number of Earners | # Families | Median Income |
| No Earners | 50 (16.5%) | $0 |
| 1 Earner | 147 (48.4%) | $48,693 |
| 2 Earners | 105 (34.5%) | $76,979 |
| 3+ Earners | 2 (0.7%) | $0 |
| Total | 304 (100.0%) | $75,042 |
Household Income in Calvert
Household Income Brackets in Calvert
With 102 households falling in the category, the $75,000 to $99,999 income range is the most frequent in Calvert, accounting for 25.5% of all households.
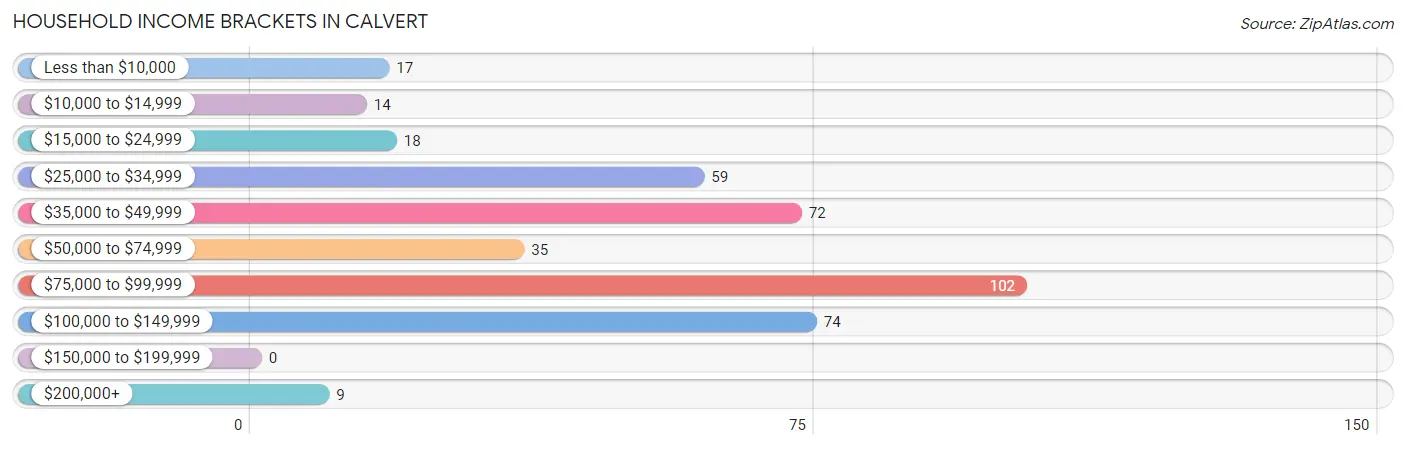
| Income Bracket | # Households | % Households |
| Less than $10,000 | 17 | 4.3% |
| $10,000 to $14,999 | 14 | 3.5% |
| $15,000 to $24,999 | 18 | 4.5% |
| $25,000 to $34,999 | 59 | 14.8% |
| $35,000 to $49,999 | 72 | 18.0% |
| $50,000 to $74,999 | 35 | 8.8% |
| $75,000 to $99,999 | 102 | 25.5% |
| $100,000 to $149,999 | 74 | 18.5% |
| $150,000 to $199,999 | 0 | 0.0% |
| $200,000+ | 9 | 2.3% |
Household Income by Householder Age in Calvert
The median household income in Calvert is $63,750, with the highest median household income of $77,083 found in the 25 to 44 years age bracket for the primary householder. A total of 172 households (43.0%) fall into this category.
| Income Bracket | # Households | Median Income |
| 15 to 24 Years | 0 (0.0%) | $0 |
| 25 to 44 Years | 172 (43.0%) | $77,083 |
| 45 to 64 Years | 125 (31.2%) | $48,239 |
| 65+ Years | 103 (25.8%) | $31,793 |
| Total | 400 (100.0%) | $63,750 |
Poverty in Calvert
Income Below Poverty by Sex and Age in Calvert
With 0.5% poverty level for males and 9.3% for females among the residents of Calvert, 75 year old and over males and 75 year old and over females are the most vulnerable to poverty, with 2 males (5.6%) and 12 females (70.6%) in their respective age groups living below the poverty level.
| Age Bracket | Male | Female |
| Under 5 Years | 0 (0.0%) | 0 (0.0%) |
| 5 Years | 0 (0.0%) | 0 (0.0%) |
| 6 to 11 Years | 0 (0.0%) | 0 (0.0%) |
| 12 to 14 Years | 0 (0.0%) | 0 (0.0%) |
| 15 Years | 0 (0.0%) | 0 (0.0%) |
| 16 and 17 Years | 0 (0.0%) | 13 (39.4%) |
| 18 to 24 Years | 0 (0.0%) | 0 (0.0%) |
| 25 to 34 Years | 0 (0.0%) | 14 (46.7%) |
| 35 to 44 Years | 0 (0.0%) | 0 (0.0%) |
| 45 to 54 Years | 0 (0.0%) | 0 (0.0%) |
| 55 to 64 Years | 0 (0.0%) | 13 (21.7%) |
| 65 to 74 Years | 0 (0.0%) | 0 (0.0%) |
| 75 Years and over | 2 (5.6%) | 12 (70.6%) |
| Total | 2 (0.5%) | 52 (9.3%) |
Income Above Poverty by Sex and Age in Calvert
According to the poverty statistics in Calvert, males aged under 5 years and females aged 6 to 11 years are the age groups that are most secure financially, with 100.0% of males and 100.0% of females in these age groups living above the poverty line.
| Age Bracket | Male | Female |
| Under 5 Years | 29 (100.0%) | 0 (0.0%) |
| 5 Years | 0 (0.0%) | 0 (0.0%) |
| 6 to 11 Years | 43 (100.0%) | 12 (100.0%) |
| 12 to 14 Years | 66 (100.0%) | 40 (100.0%) |
| 15 Years | 11 (100.0%) | 53 (100.0%) |
| 16 and 17 Years | 15 (100.0%) | 20 (60.6%) |
| 18 to 24 Years | 0 (0.0%) | 89 (100.0%) |
| 25 to 34 Years | 24 (100.0%) | 16 (53.3%) |
| 35 to 44 Years | 60 (100.0%) | 107 (100.0%) |
| 45 to 54 Years | 29 (100.0%) | 42 (100.0%) |
| 55 to 64 Years | 50 (100.0%) | 47 (78.3%) |
| 65 to 74 Years | 56 (100.0%) | 77 (100.0%) |
| 75 Years and over | 34 (94.4%) | 5 (29.4%) |
| Total | 417 (99.5%) | 508 (90.7%) |
Income Below Poverty Among Married-Couple Families in Calvert
| Children | Above Poverty | Below Poverty |
| No Children | 132 (100.0%) | 0 (0.0%) |
| 1 or 2 Children | 20 (100.0%) | 0 (0.0%) |
| 3 or 4 Children | 0 (0.0%) | 0 (0.0%) |
| 5 or more Children | 0 (0.0%) | 0 (0.0%) |
| Total | 152 (100.0%) | 0 (0.0%) |
Income Below Poverty Among Single-Parent Households in Calvert
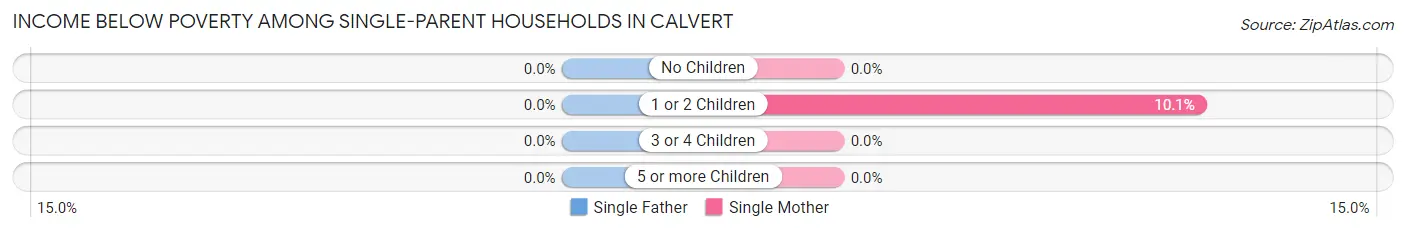
| Children | Single Father | Single Mother |
| No Children | 0 (0.0%) | 0 (0.0%) |
| 1 or 2 Children | 0 (0.0%) | 14 (10.1%) |
| 3 or 4 Children | 0 (0.0%) | 0 (0.0%) |
| 5 or more Children | 0 (0.0%) | 0 (0.0%) |
| Total | 0 (0.0%) | 14 (10.1%) |
Income Below Poverty Among Married-Couple vs Single-Parent Households in Calvert
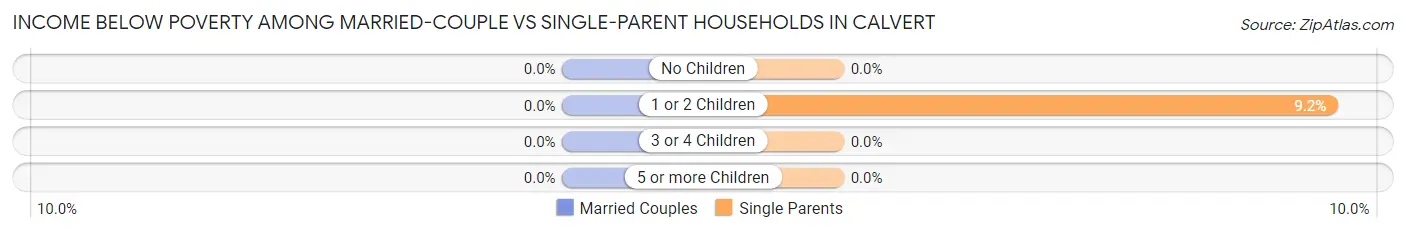
| Children | Married-Couple Families | Single-Parent Households |
| No Children | 0 (0.0%) | 0 (0.0%) |
| 1 or 2 Children | 0 (0.0%) | 14 (9.2%) |
| 3 or 4 Children | 0 (0.0%) | 0 (0.0%) |
| 5 or more Children | 0 (0.0%) | 0 (0.0%) |
| Total | 0 (0.0%) | 14 (9.2%) |
Race in Calvert
The most populous races in Calvert are Black / African American (609 | 61.1%), White / Caucasian (381 | 38.3%), and Hispanic or Latino (98 | 9.8%).
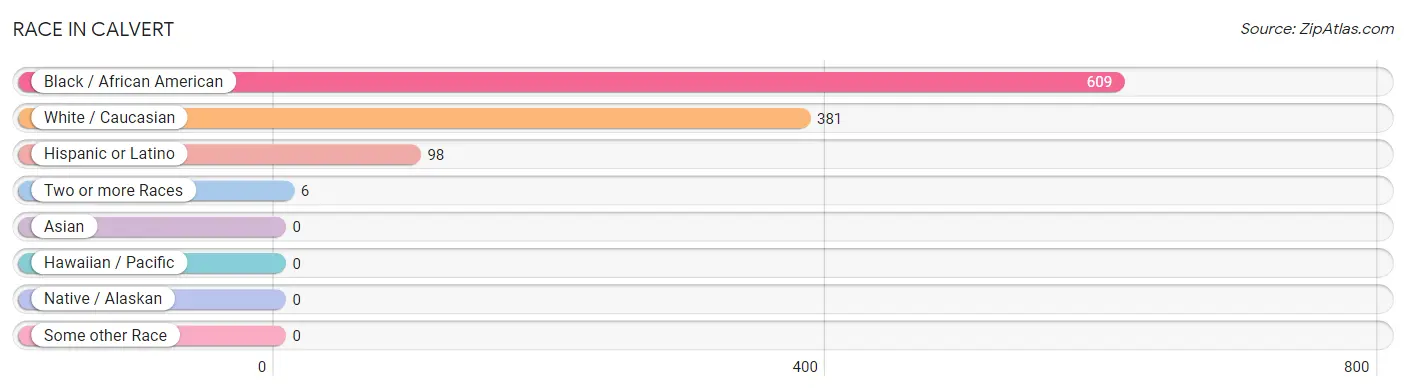
| Race | # Population | % Population |
| Asian | 0 | 0.0% |
| Black / African American | 609 | 61.1% |
| Hawaiian / Pacific | 0 | 0.0% |
| Hispanic or Latino | 98 | 9.8% |
| Native / Alaskan | 0 | 0.0% |
| White / Caucasian | 381 | 38.3% |
| Two or more Races | 6 | 0.6% |
| Some other Race | 0 | 0.0% |
| Total | 996 | 100.0% |
Ancestry in Calvert
The most populous ancestries reported in Calvert are Mexican (96 | 9.6%), German (60 | 6.0%), English (53 | 5.3%), Irish (29 | 2.9%), and American (28 | 2.8%), together accounting for 26.7% of all Calvert residents.
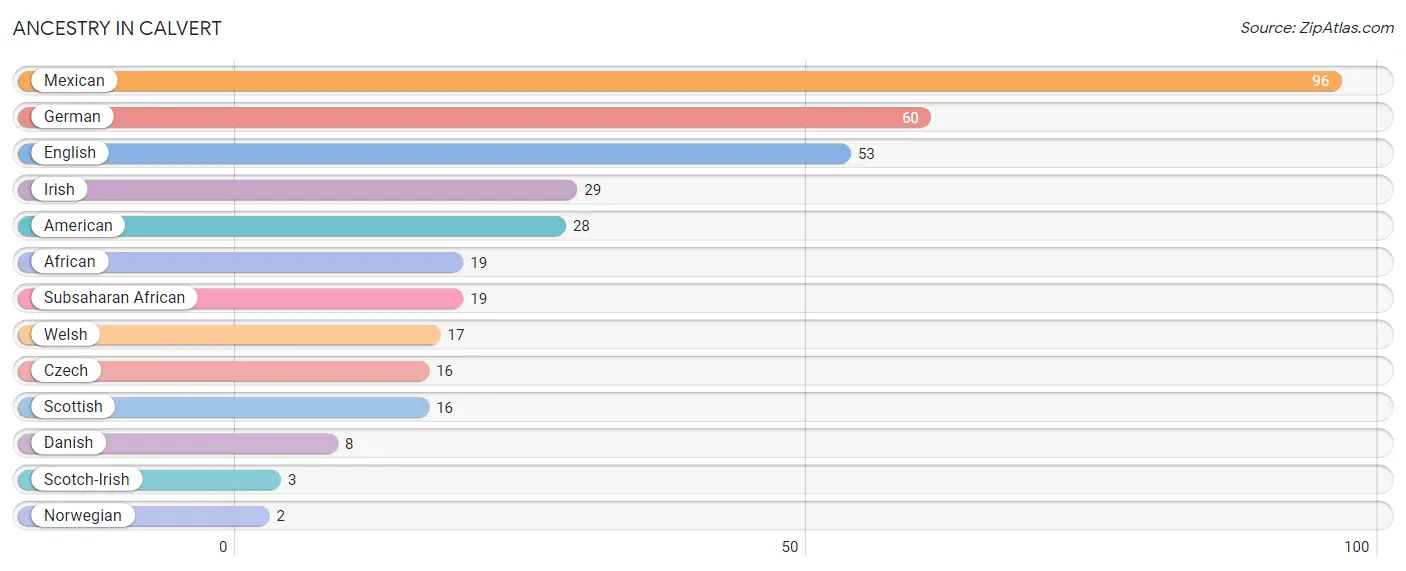
| Ancestry | # Population | % Population |
| African | 19 | 1.9% |
| American | 28 | 2.8% |
| Czech | 16 | 1.6% |
| Danish | 8 | 0.8% |
| English | 53 | 5.3% |
| German | 60 | 6.0% |
| Irish | 29 | 2.9% |
| Mexican | 96 | 9.6% |
| Norwegian | 2 | 0.2% |
| Scotch-Irish | 3 | 0.3% |
| Scottish | 16 | 1.6% |
| Subsaharan African | 19 | 1.9% |
| Welsh | 17 | 1.7% | View All 13 Rows |
Immigrants in Calvert
The most numerous immigrant groups reported in Calvert came from Central America (16 | 1.6%), Europe (16 | 1.6%), Latin America (16 | 1.6%), Mexico (16 | 1.6%), and Northern Europe (16 | 1.6%), together accounting for 8.1% of all Calvert residents.
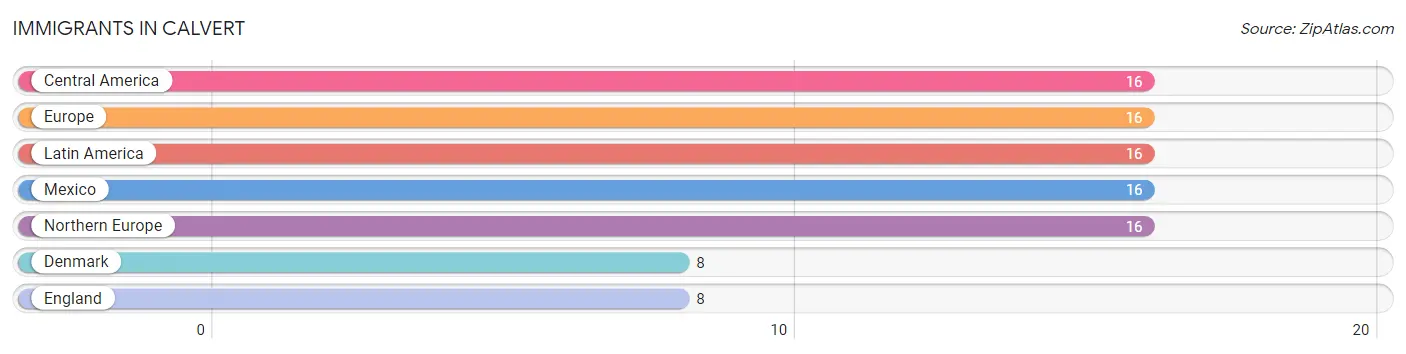
| Immigration Origin | # Population | % Population |
| Central America | 16 | 1.6% |
| Denmark | 8 | 0.8% |
| England | 8 | 0.8% |
| Europe | 16 | 1.6% |
| Latin America | 16 | 1.6% |
| Mexico | 16 | 1.6% |
| Northern Europe | 16 | 1.6% | View All 7 Rows |
Sex and Age in Calvert
Sex and Age in Calvert
The most populous age groups in Calvert are 10 to 14 Years (66 | 15.3%) for men and 15 to 19 Years (105 | 18.5%) for women.
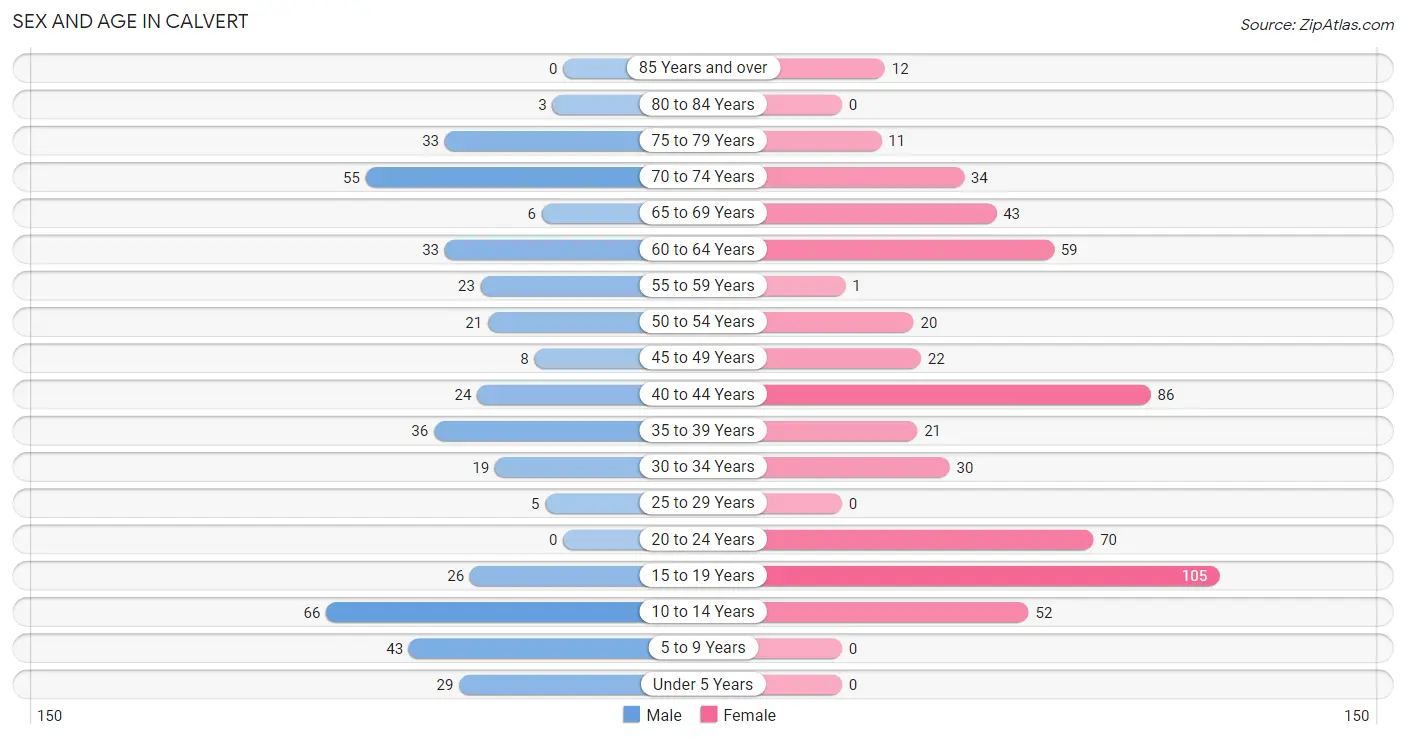
| Age Bracket | Male | Female |
| Under 5 Years | 29 (6.7%) | 0 (0.0%) |
| 5 to 9 Years | 43 (10.0%) | 0 (0.0%) |
| 10 to 14 Years | 66 (15.3%) | 52 (9.2%) |
| 15 to 19 Years | 26 (6.0%) | 105 (18.5%) |
| 20 to 24 Years | 0 (0.0%) | 70 (12.4%) |
| 25 to 29 Years | 5 (1.2%) | 0 (0.0%) |
| 30 to 34 Years | 19 (4.4%) | 30 (5.3%) |
| 35 to 39 Years | 36 (8.4%) | 21 (3.7%) |
| 40 to 44 Years | 24 (5.6%) | 86 (15.2%) |
| 45 to 49 Years | 8 (1.9%) | 22 (3.9%) |
| 50 to 54 Years | 21 (4.9%) | 20 (3.5%) |
| 55 to 59 Years | 23 (5.3%) | 1 (0.2%) |
| 60 to 64 Years | 33 (7.7%) | 59 (10.4%) |
| 65 to 69 Years | 6 (1.4%) | 43 (7.6%) |
| 70 to 74 Years | 55 (12.8%) | 34 (6.0%) |
| 75 to 79 Years | 33 (7.7%) | 11 (1.9%) |
| 80 to 84 Years | 3 (0.7%) | 0 (0.0%) |
| 85 Years and over | 0 (0.0%) | 12 (2.1%) |
| Total | 430 (100.0%) | 566 (100.0%) |
Families and Households in Calvert
Median Family Size in Calvert
The median family size in Calvert is 2.90 persons per family, with single female/mother families (138 | 45.4%) accounting for the largest median family size of 3.36 persons per family. On the other hand, single male/father families (14 | 4.6%) represent the smallest median family size with 1.79 persons per family.
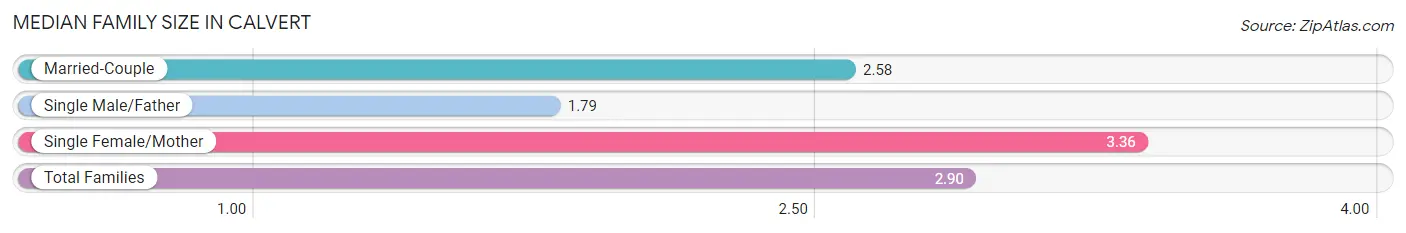
| Family Type | # Families | Family Size |
| Married-Couple | 152 (50.0%) | 2.58 |
| Single Male/Father | 14 (4.6%) | 1.79 |
| Single Female/Mother | 138 (45.4%) | 3.36 |
| Total Families | 304 (100.0%) | 2.90 |
Median Household Size in Calvert
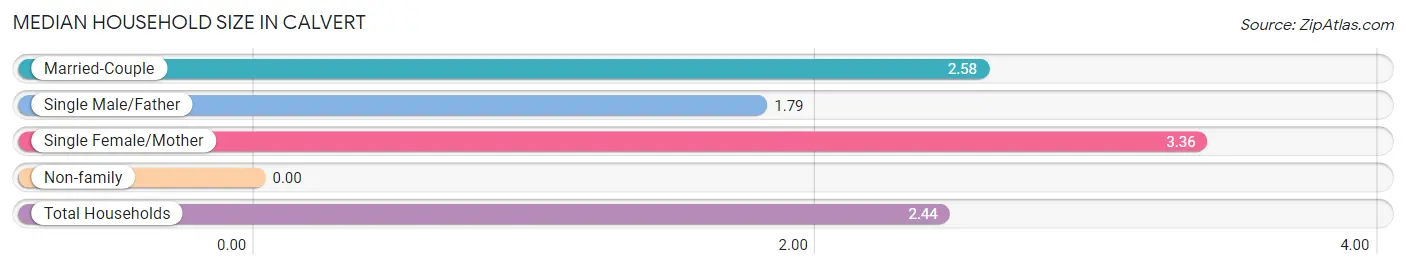
| Household Type | # Households | Household Size |
| Married-Couple | 152 (38.0%) | 2.58 |
| Single Male/Father | 14 (3.5%) | 1.79 |
| Single Female/Mother | 138 (34.5%) | 3.36 |
| Non-family | 96 (24.0%) | - |
| Total Households | 400 (100.0%) | 2.44 |
Household Size by Marriage Status in Calvert
Out of a total of 400 households in Calvert, 304 (76.0%) are family households, while 96 (24.0%) are nonfamily households. The most numerous type of family households are 2-person households, comprising 173, and the most common type of nonfamily households are 1-person households, comprising 96.
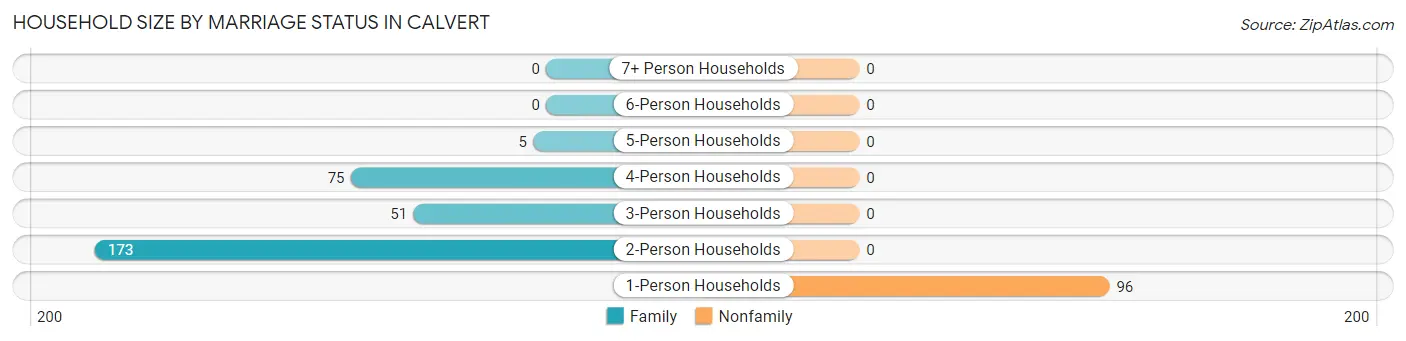
| Household Size | Family Households | Nonfamily Households |
| 1-Person Households | - | 96 (24.0%) |
| 2-Person Households | 173 (43.2%) | 0 (0.0%) |
| 3-Person Households | 51 (12.8%) | 0 (0.0%) |
| 4-Person Households | 75 (18.8%) | 0 (0.0%) |
| 5-Person Households | 5 (1.3%) | 0 (0.0%) |
| 6-Person Households | 0 (0.0%) | 0 (0.0%) |
| 7+ Person Households | 0 (0.0%) | 0 (0.0%) |
| Total | 304 (76.0%) | 96 (24.0%) |
Female Fertility in Calvert
Fertility by Age in Calvert
Average fertility rate in Calvert is 15.0 births per 1,000 women. Women in the age bracket of 35 to 50 years have the highest fertility rate with 39.0 births per 1,000 women. Women in the age bracket of 35 to 50 years acount for 100.0% of all women with births.

| Age Bracket | Women with Births | Births / 1,000 Women |
| 15 to 19 years | 0 (0.0%) | 0.0 |
| 20 to 34 years | 0 (0.0%) | 0.0 |
| 35 to 50 years | 5 (100.0%) | 39.0 |
| Total | 5 (100.0%) | 15.0 |
Fertility by Age by Marriage Status in Calvert
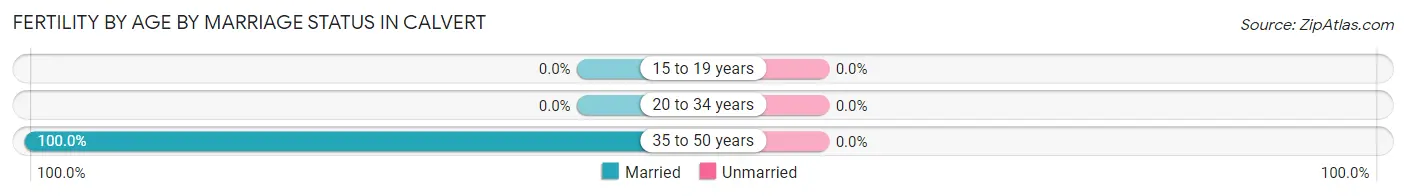
| Age Bracket | Married | Unmarried |
| 15 to 19 years | 0 (0.0%) | 0 (0.0%) |
| 20 to 34 years | 0 (0.0%) | 0 (0.0%) |
| 35 to 50 years | 5 (100.0%) | 0 (0.0%) |
| Total | 5 (100.0%) | 0 (0.0%) |
Fertility by Education in Calvert
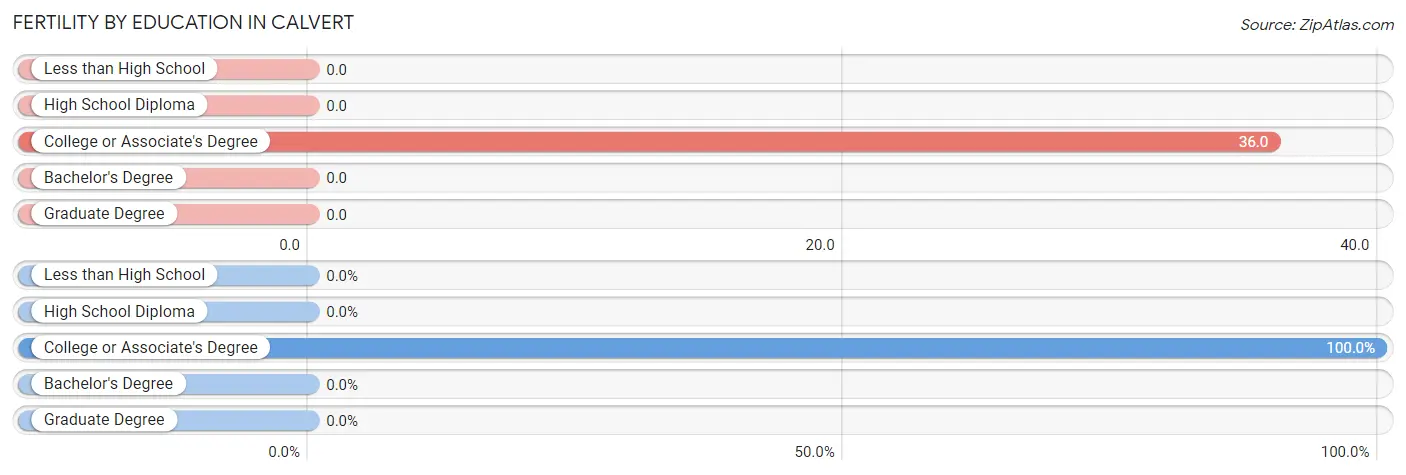
| Educational Attainment | Women with Births | Births / 1,000 Women |
| Less than High School | 0 (0.0%) | 0.0 |
| High School Diploma | 0 (0.0%) | 0.0 |
| College or Associate's Degree | 5 (100.0%) | 36.0 |
| Bachelor's Degree | 0 (0.0%) | 0.0 |
| Graduate Degree | 0 (0.0%) | 0.0 |
| Total | 5 (100.0%) | 15.0 |
Fertility by Education by Marriage Status in Calvert
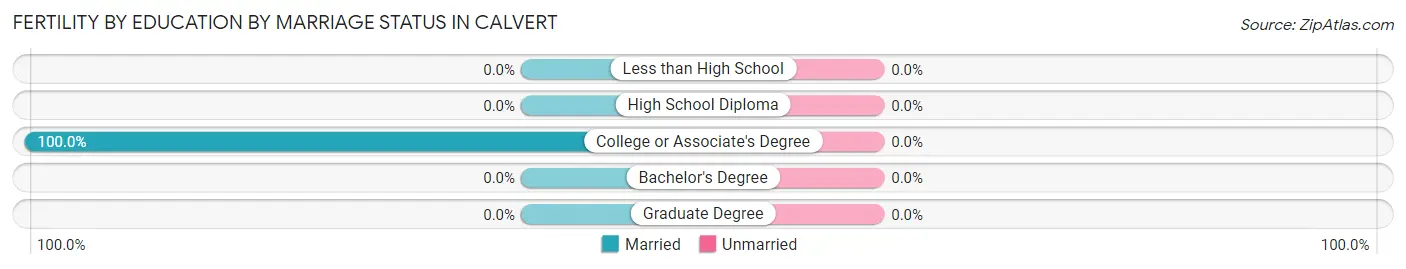
| Educational Attainment | Married | Unmarried |
| Less than High School | 0 (0.0%) | 0 (0.0%) |
| High School Diploma | 0 (0.0%) | 0 (0.0%) |
| College or Associate's Degree | 5 (100.0%) | 0 (0.0%) |
| Bachelor's Degree | 0 (0.0%) | 0 (0.0%) |
| Graduate Degree | 0 (0.0%) | 0 (0.0%) |
| Total | 5 (100.0%) | 0 (0.0%) |
Employment Characteristics in Calvert
Employment by Class of Employer in Calvert
Among the 367 employed individuals in Calvert, private company employees (196 | 53.4%), state government employees (118 | 32.2%), and local government employees (25 | 6.8%) make up the most common classes of employment.
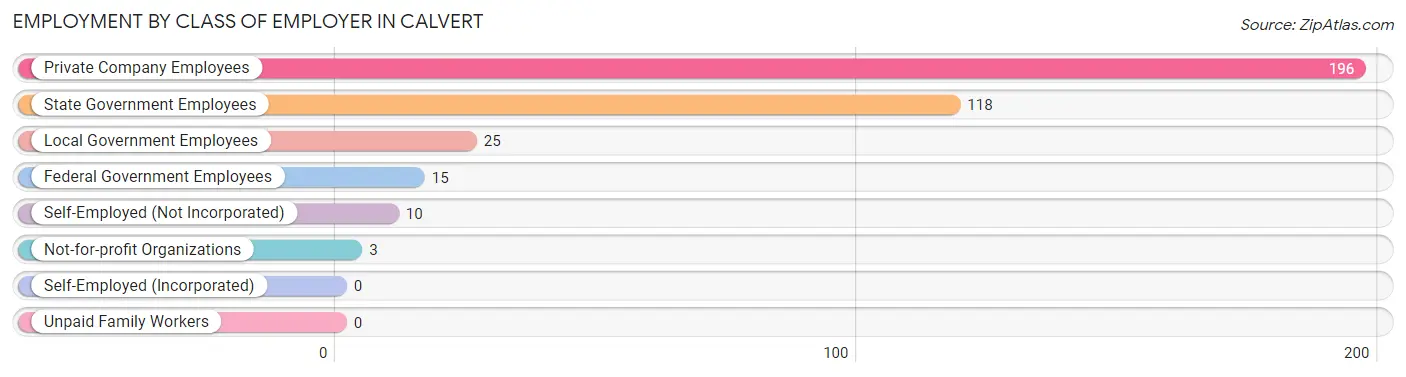
| Employer Class | # Employees | % Employees |
| Private Company Employees | 196 | 53.4% |
| Self-Employed (Incorporated) | 0 | 0.0% |
| Self-Employed (Not Incorporated) | 10 | 2.7% |
| Not-for-profit Organizations | 3 | 0.8% |
| Local Government Employees | 25 | 6.8% |
| State Government Employees | 118 | 32.2% |
| Federal Government Employees | 15 | 4.1% |
| Unpaid Family Workers | 0 | 0.0% |
| Total | 367 | 100.0% |
Employment Status by Age in Calvert
According to the labor force statistics for Calvert, out of the total population over 16 years of age (742), 54.9% or 407 individuals are in the labor force, with 9.8% or 40 of them unemployed. The age group with the highest labor force participation rate is 20 to 24 years, with 100.0% or 70 individuals in the labor force. Within the labor force, the 25 to 29 years age range has the highest percentage of unemployed individuals, with 100.0% or 5 of them being unemployed.
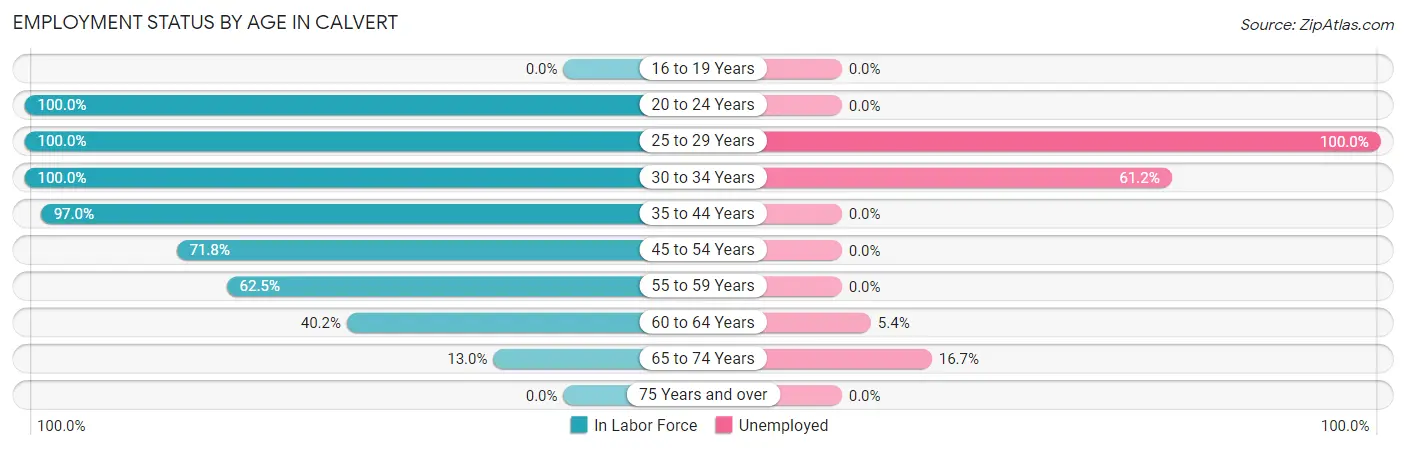
| Age Bracket | In Labor Force | Unemployed |
| 16 to 19 Years | 0 (0.0%) | 0 (0.0%) |
| 20 to 24 Years | 70 (100.0%) | 0 (0.0%) |
| 25 to 29 Years | 5 (100.0%) | 5 (100.0%) |
| 30 to 34 Years | 49 (100.0%) | 30 (61.2%) |
| 35 to 44 Years | 162 (97.0%) | 0 (0.0%) |
| 45 to 54 Years | 51 (71.8%) | 0 (0.0%) |
| 55 to 59 Years | 15 (62.5%) | 0 (0.0%) |
| 60 to 64 Years | 37 (40.2%) | 2 (5.4%) |
| 65 to 74 Years | 18 (13.0%) | 3 (16.7%) |
| 75 Years and over | 0 (0.0%) | 0 (0.0%) |
| Total | 407 (54.9%) | 40 (9.8%) |
Employment Status by Educational Attainment in Calvert
According to labor force statistics for Calvert, 78.2% of individuals (319) out of the total population between 25 and 64 years of age (408) are in the labor force, with 11.6% or 37 of them being unemployed. The group with the highest labor force participation rate are those with the educational attainment of bachelor's degree or higher, with 88.1% or 96 individuals in the labor force. Within the labor force, individuals with high school diploma education have the highest percentage of unemployment, with 24.1% or 14 of them being unemployed.
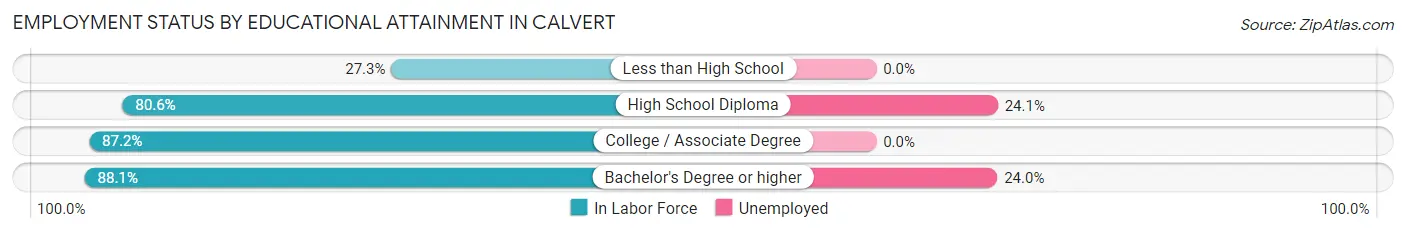
| Educational Attainment | In Labor Force | Unemployed |
| Less than High School | 15 (27.3%) | 0 (0.0%) |
| High School Diploma | 58 (80.6%) | 17 (24.1%) |
| College / Associate Degree | 150 (87.2%) | 0 (0.0%) |
| Bachelor's Degree or higher | 96 (88.1%) | 26 (24.0%) |
| Total | 319 (78.2%) | 47 (11.6%) |
Employment Occupations by Sex in Calvert
Management, Business, Science and Arts Occupations
The most common Management, Business, Science and Arts occupations in Calvert are Community & Social Service (17 | 4.6%), Computers, Engineering & Science (16 | 4.4%), Computers & Mathematics (16 | 4.4%), Education Instruction & Library (14 | 3.8%), and Education, Arts & Media (3 | 0.8%).
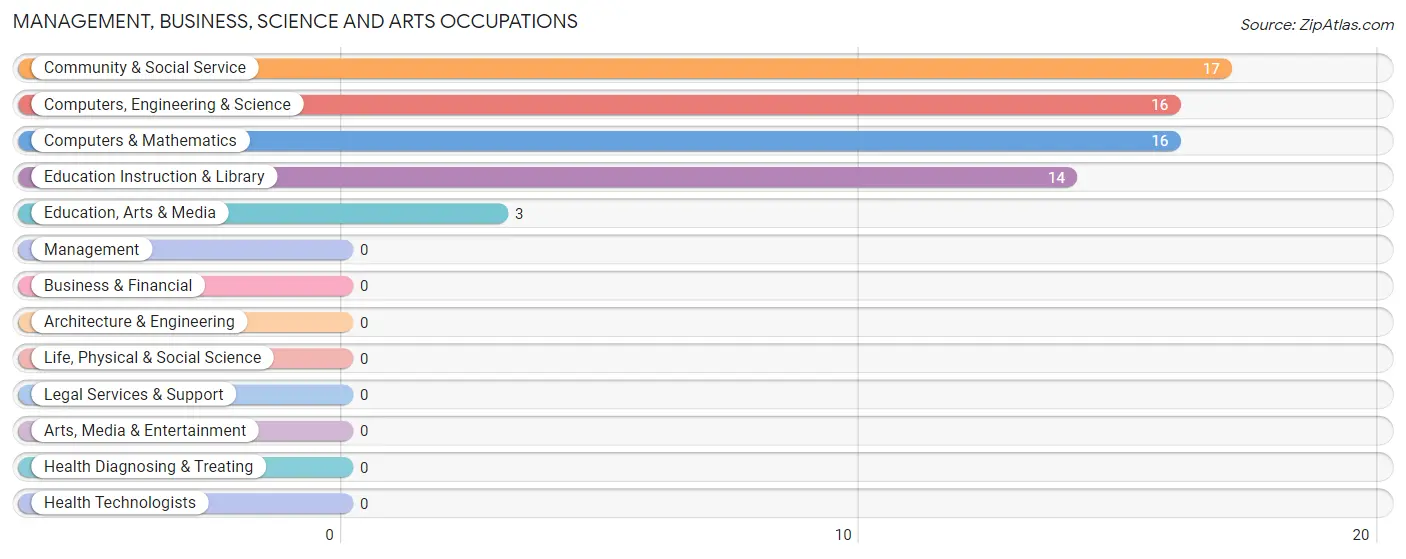
Management, Business, Science and Arts Occupations by Sex
Within the Management, Business, Science and Arts occupations in Calvert, the most male-oriented occupations are Education Instruction & Library (100.0%), and Community & Social Service (82.4%), while the most female-oriented occupations are Computers, Engineering & Science (100.0%), Computers & Mathematics (100.0%), and Education, Arts & Media (100.0%).
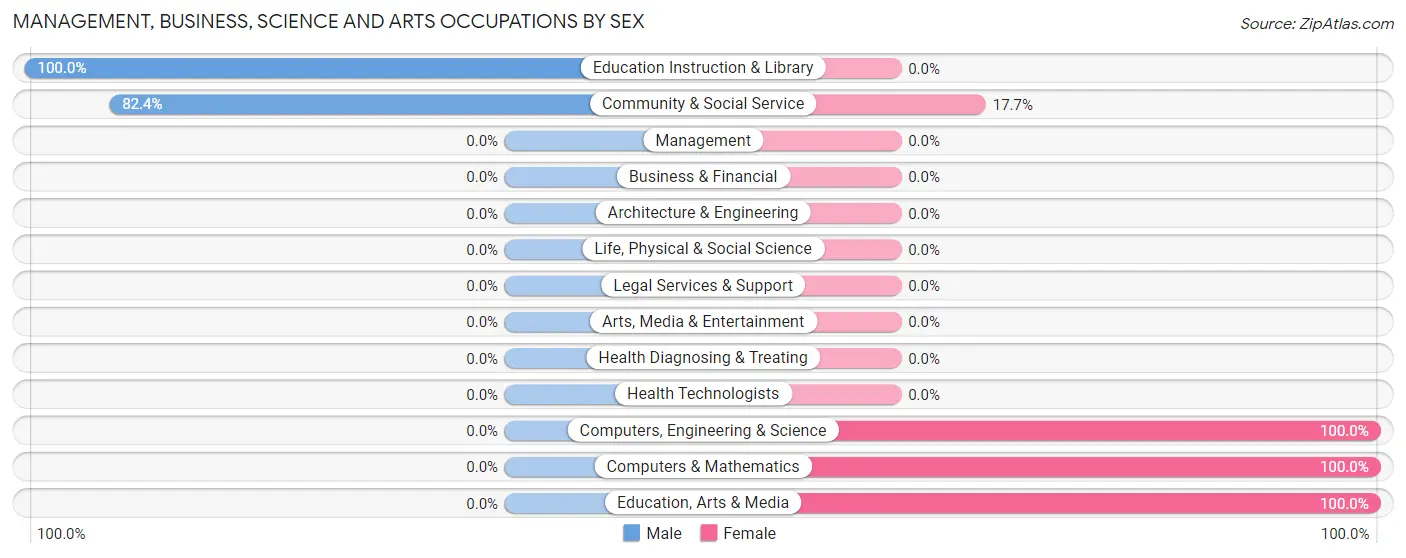
| Occupation | Male | Female |
| Management | 0 (0.0%) | 0 (0.0%) |
| Business & Financial | 0 (0.0%) | 0 (0.0%) |
| Computers, Engineering & Science | 0 (0.0%) | 16 (100.0%) |
| Computers & Mathematics | 0 (0.0%) | 16 (100.0%) |
| Architecture & Engineering | 0 (0.0%) | 0 (0.0%) |
| Life, Physical & Social Science | 0 (0.0%) | 0 (0.0%) |
| Community & Social Service | 14 (82.4%) | 3 (17.6%) |
| Education, Arts & Media | 0 (0.0%) | 3 (100.0%) |
| Legal Services & Support | 0 (0.0%) | 0 (0.0%) |
| Education Instruction & Library | 14 (100.0%) | 0 (0.0%) |
| Arts, Media & Entertainment | 0 (0.0%) | 0 (0.0%) |
| Health Diagnosing & Treating | 0 (0.0%) | 0 (0.0%) |
| Health Technologists | 0 (0.0%) | 0 (0.0%) |
| Total (Category) | 14 (42.4%) | 19 (57.6%) |
| Total (Overall) | 133 (36.2%) | 234 (63.8%) |
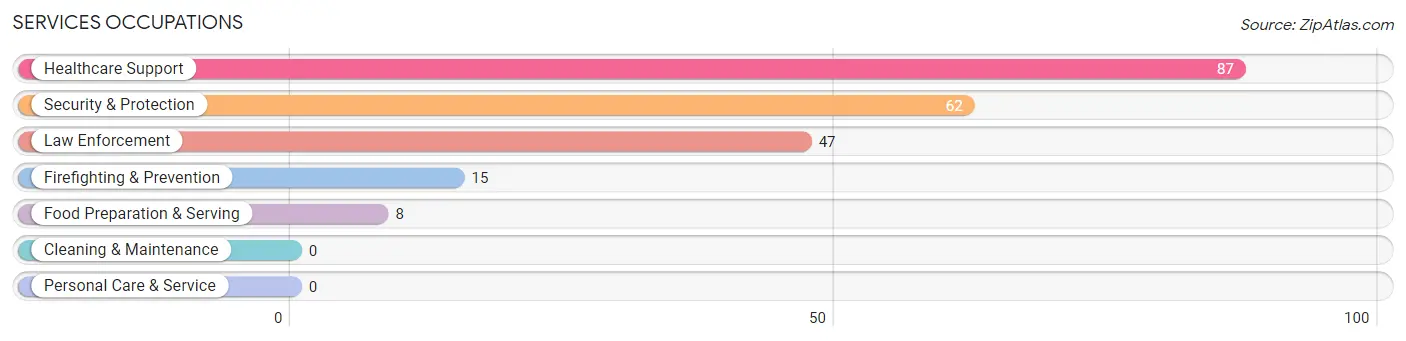
Services Occupations
The most common Services occupations in Calvert are Healthcare Support (87 | 23.7%), Security & Protection (62 | 16.9%), Law Enforcement (47 | 12.8%), Firefighting & Prevention (15 | 4.1%), and Food Preparation & Serving (8 | 2.2%).
Services Occupations by Sex
Within the Services occupations in Calvert, the most male-oriented occupations are Firefighting & Prevention (100.0%), Food Preparation & Serving (100.0%), and Security & Protection (24.2%), while the most female-oriented occupations are Healthcare Support (100.0%), Law Enforcement (100.0%), and Security & Protection (75.8%).
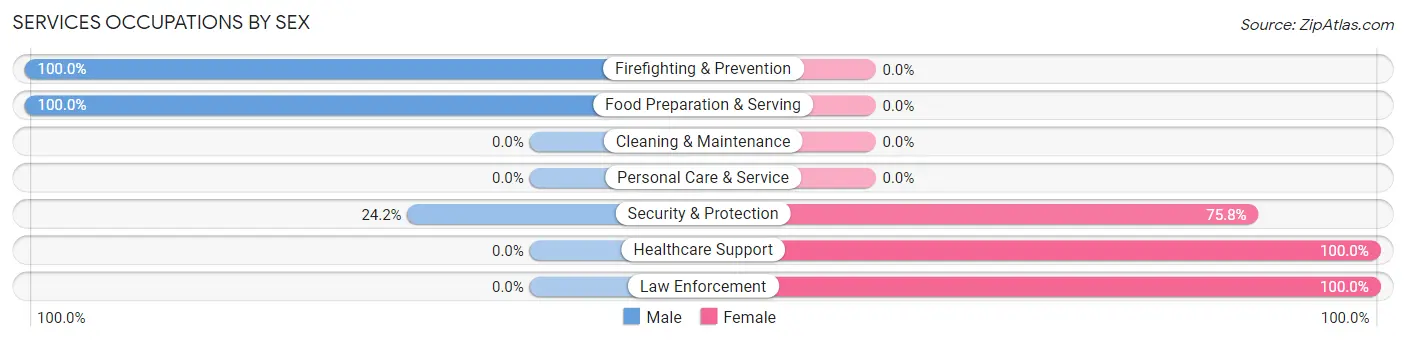
| Occupation | Male | Female |
| Healthcare Support | 0 (0.0%) | 87 (100.0%) |
| Security & Protection | 15 (24.2%) | 47 (75.8%) |
| Firefighting & Prevention | 15 (100.0%) | 0 (0.0%) |
| Law Enforcement | 0 (0.0%) | 47 (100.0%) |
| Food Preparation & Serving | 8 (100.0%) | 0 (0.0%) |
| Cleaning & Maintenance | 0 (0.0%) | 0 (0.0%) |
| Personal Care & Service | 0 (0.0%) | 0 (0.0%) |
| Total (Category) | 23 (14.6%) | 134 (85.4%) |
| Total (Overall) | 133 (36.2%) | 234 (63.8%) |
Sales and Office Occupations
The most common Sales and Office occupations in Calvert are , and Office & Administration (21 | 5.7%).
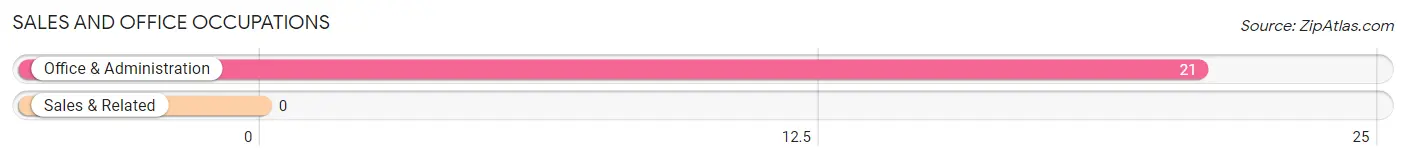
Sales and Office Occupations by Sex
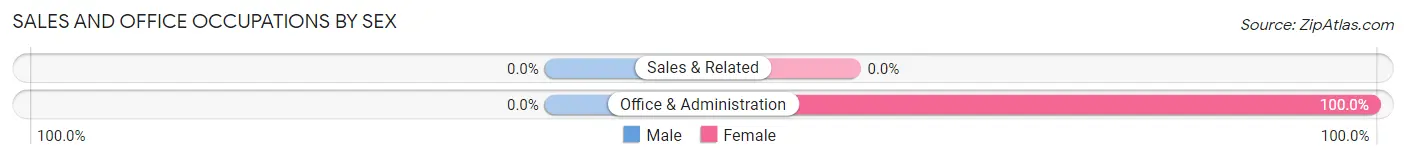
| Occupation | Male | Female |
| Sales & Related | 0 (0.0%) | 0 (0.0%) |
| Office & Administration | 0 (0.0%) | 21 (100.0%) |
| Total (Category) | 0 (0.0%) | 21 (100.0%) |
| Total (Overall) | 133 (36.2%) | 234 (63.8%) |
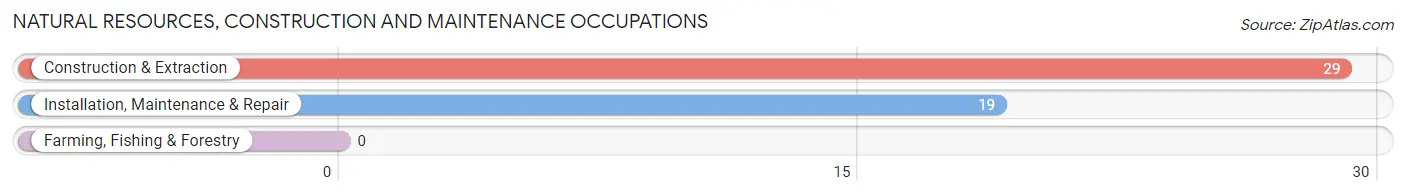
Natural Resources, Construction and Maintenance Occupations
The most common Natural Resources, Construction and Maintenance occupations in Calvert are Construction & Extraction (29 | 7.9%), and Installation, Maintenance & Repair (19 | 5.2%).
Natural Resources, Construction and Maintenance Occupations by Sex
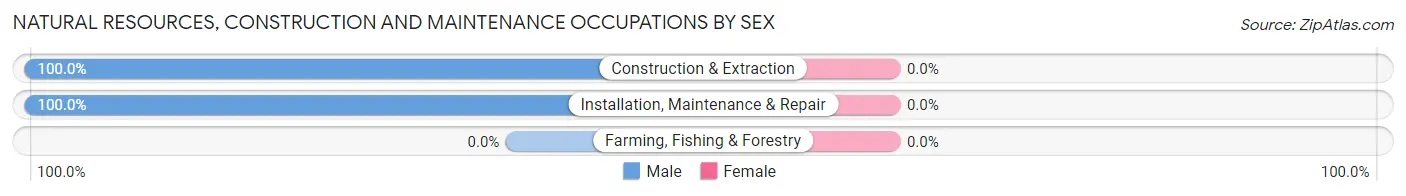
| Occupation | Male | Female |
| Farming, Fishing & Forestry | 0 (0.0%) | 0 (0.0%) |
| Construction & Extraction | 29 (100.0%) | 0 (0.0%) |
| Installation, Maintenance & Repair | 19 (100.0%) | 0 (0.0%) |
| Total (Category) | 48 (100.0%) | 0 (0.0%) |
| Total (Overall) | 133 (36.2%) | 234 (63.8%) |
Production, Transportation and Moving Occupations
The most common Production, Transportation and Moving occupations in Calvert are Material Moving (60 | 16.4%), Production (38 | 10.3%), and Transportation (10 | 2.7%).
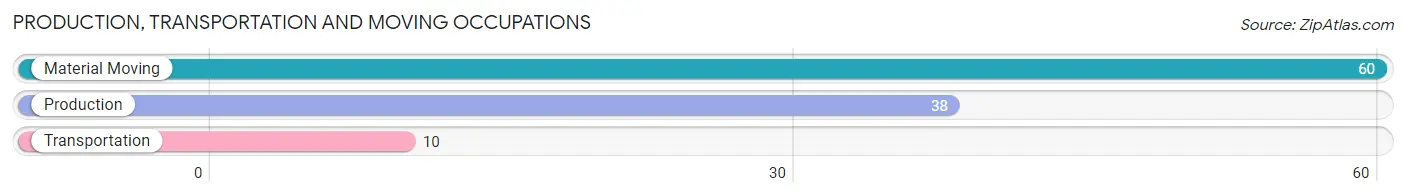
Production, Transportation and Moving Occupations by Sex
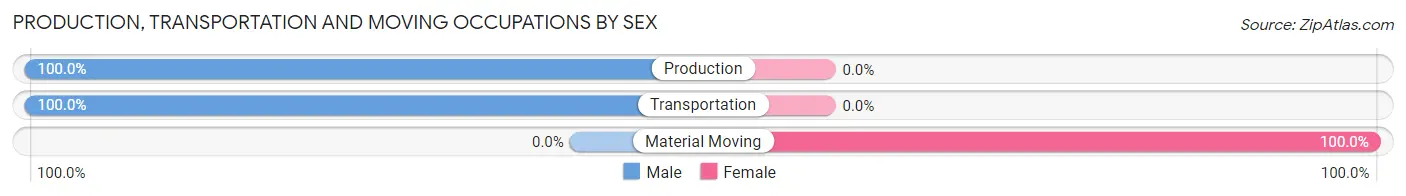
| Occupation | Male | Female |
| Production | 38 (100.0%) | 0 (0.0%) |
| Transportation | 10 (100.0%) | 0 (0.0%) |
| Material Moving | 0 (0.0%) | 60 (100.0%) |
| Total (Category) | 48 (44.4%) | 60 (55.6%) |
| Total (Overall) | 133 (36.2%) | 234 (63.8%) |
Employment Industries by Sex in Calvert
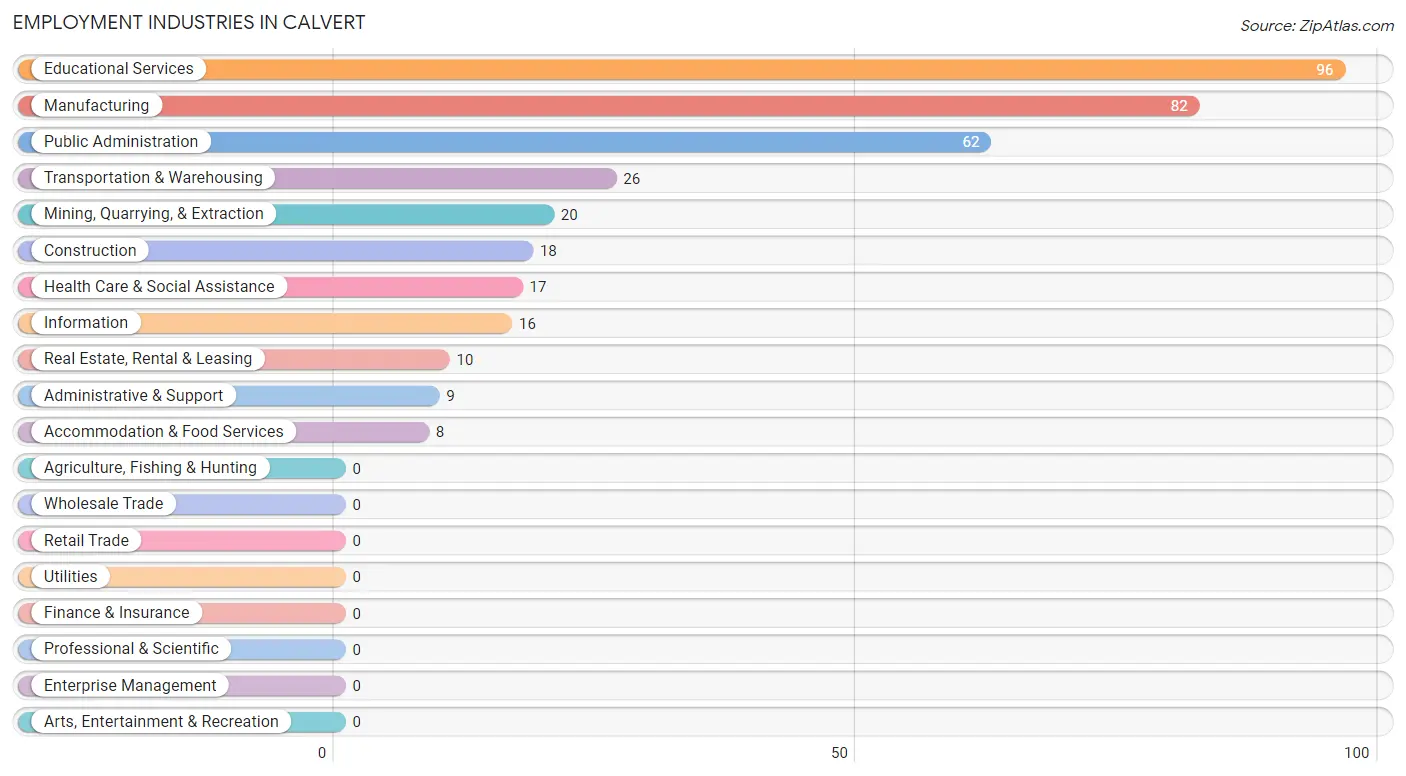
Employment Industries in Calvert
The major employment industries in Calvert include Educational Services (96 | 26.2%), Manufacturing (82 | 22.3%), Public Administration (62 | 16.9%), Transportation & Warehousing (26 | 7.1%), and Mining, Quarrying, & Extraction (20 | 5.4%).
Employment Industries by Sex in Calvert
The Calvert industries that see more men than women are Mining, Quarrying, & Extraction (100.0%), Construction (100.0%), and Transportation & Warehousing (100.0%), whereas the industries that tend to have a higher number of women are Information (100.0%), Administrative & Support (100.0%), and Health Care & Social Assistance (100.0%).
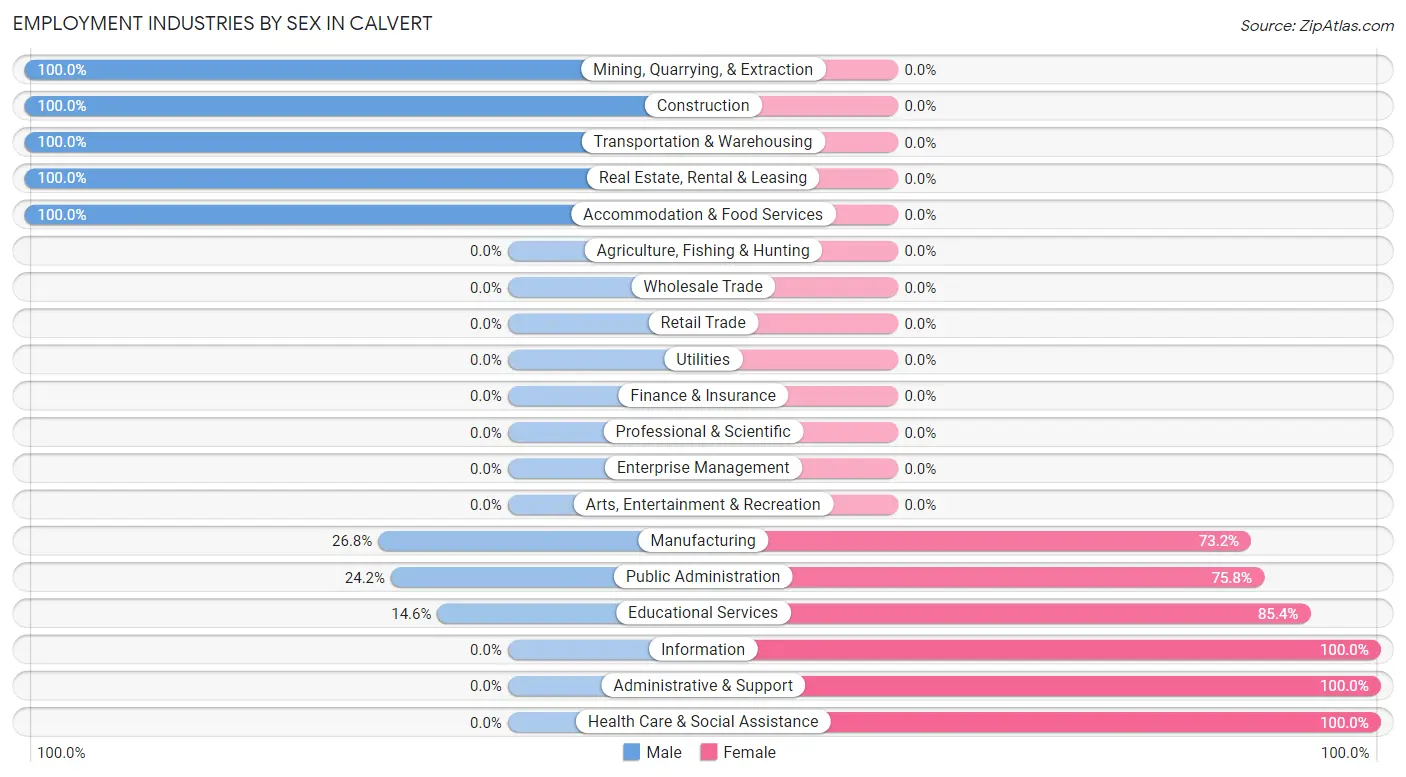
| Industry | Male | Female |
| Agriculture, Fishing & Hunting | 0 (0.0%) | 0 (0.0%) |
| Mining, Quarrying, & Extraction | 20 (100.0%) | 0 (0.0%) |
| Construction | 18 (100.0%) | 0 (0.0%) |
| Manufacturing | 22 (26.8%) | 60 (73.2%) |
| Wholesale Trade | 0 (0.0%) | 0 (0.0%) |
| Retail Trade | 0 (0.0%) | 0 (0.0%) |
| Transportation & Warehousing | 26 (100.0%) | 0 (0.0%) |
| Utilities | 0 (0.0%) | 0 (0.0%) |
| Information | 0 (0.0%) | 16 (100.0%) |
| Finance & Insurance | 0 (0.0%) | 0 (0.0%) |
| Real Estate, Rental & Leasing | 10 (100.0%) | 0 (0.0%) |
| Professional & Scientific | 0 (0.0%) | 0 (0.0%) |
| Enterprise Management | 0 (0.0%) | 0 (0.0%) |
| Administrative & Support | 0 (0.0%) | 9 (100.0%) |
| Educational Services | 14 (14.6%) | 82 (85.4%) |
| Health Care & Social Assistance | 0 (0.0%) | 17 (100.0%) |
| Arts, Entertainment & Recreation | 0 (0.0%) | 0 (0.0%) |
| Accommodation & Food Services | 8 (100.0%) | 0 (0.0%) |
| Public Administration | 15 (24.2%) | 47 (75.8%) |
| Total | 133 (36.2%) | 234 (63.8%) |
Education in Calvert
School Enrollment in Calvert
The most common levels of schooling among the 322 students in Calvert are high school (125 | 38.8%), middle school (105 | 32.6%), and elementary school (43 | 13.4%).
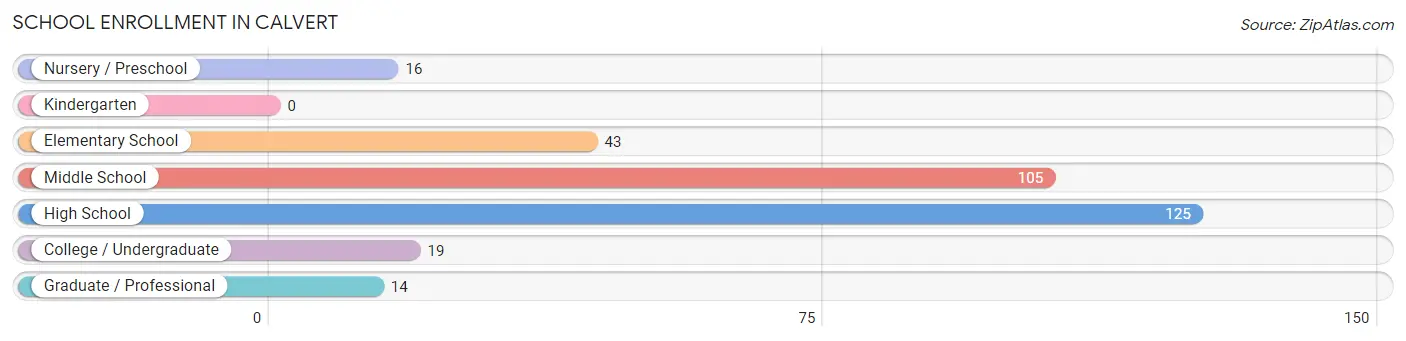
| School Level | # Students | % Students |
| Nursery / Preschool | 16 | 5.0% |
| Kindergarten | 0 | 0.0% |
| Elementary School | 43 | 13.4% |
| Middle School | 105 | 32.6% |
| High School | 125 | 38.8% |
| College / Undergraduate | 19 | 5.9% |
| Graduate / Professional | 14 | 4.3% |
| Total | 322 | 100.0% |
School Enrollment by Age by Funding Source in Calvert
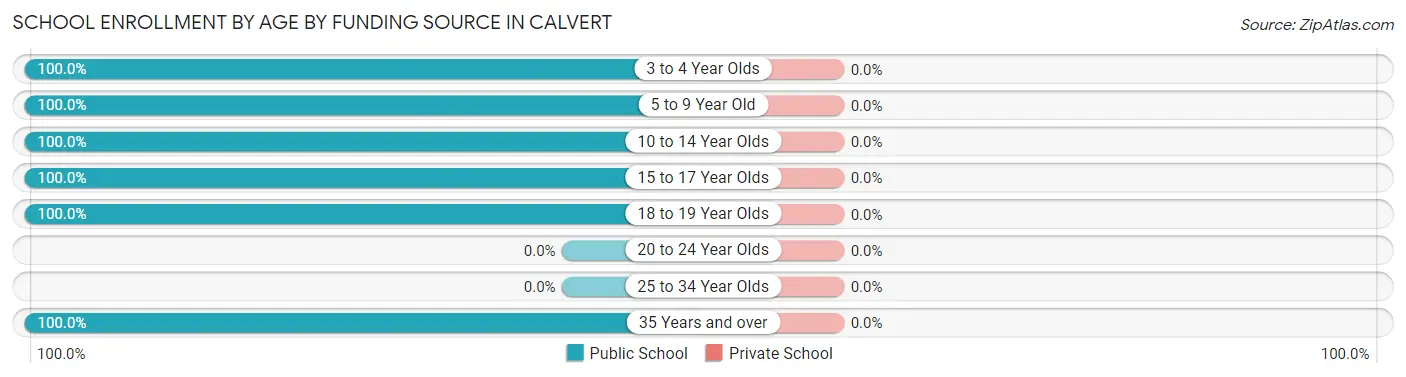
| Age Bracket | Public School | Private School |
| 3 to 4 Year Olds | 16 (100.0%) | 0 (0.0%) |
| 5 to 9 Year Old | 43 (100.0%) | 0 (0.0%) |
| 10 to 14 Year Olds | 118 (100.0%) | 0 (0.0%) |
| 15 to 17 Year Olds | 112 (100.0%) | 0 (0.0%) |
| 18 to 19 Year Olds | 19 (100.0%) | 0 (0.0%) |
| 20 to 24 Year Olds | 0 (0.0%) | 0 (0.0%) |
| 25 to 34 Year Olds | 0 (0.0%) | 0 (0.0%) |
| 35 Years and over | 14 (100.0%) | 0 (0.0%) |
| Total | 322 (100.0%) | 0 (0.0%) |
Educational Attainment by Field of Study in Calvert
Education (27 | 13.9%), social sciences (26 | 13.3%), science & technology (25 | 12.8%), literature & languages (25 | 12.8%), and business (23 | 11.8%) are the most common fields of study among 195 individuals in Calvert who have obtained a bachelor's degree or higher.
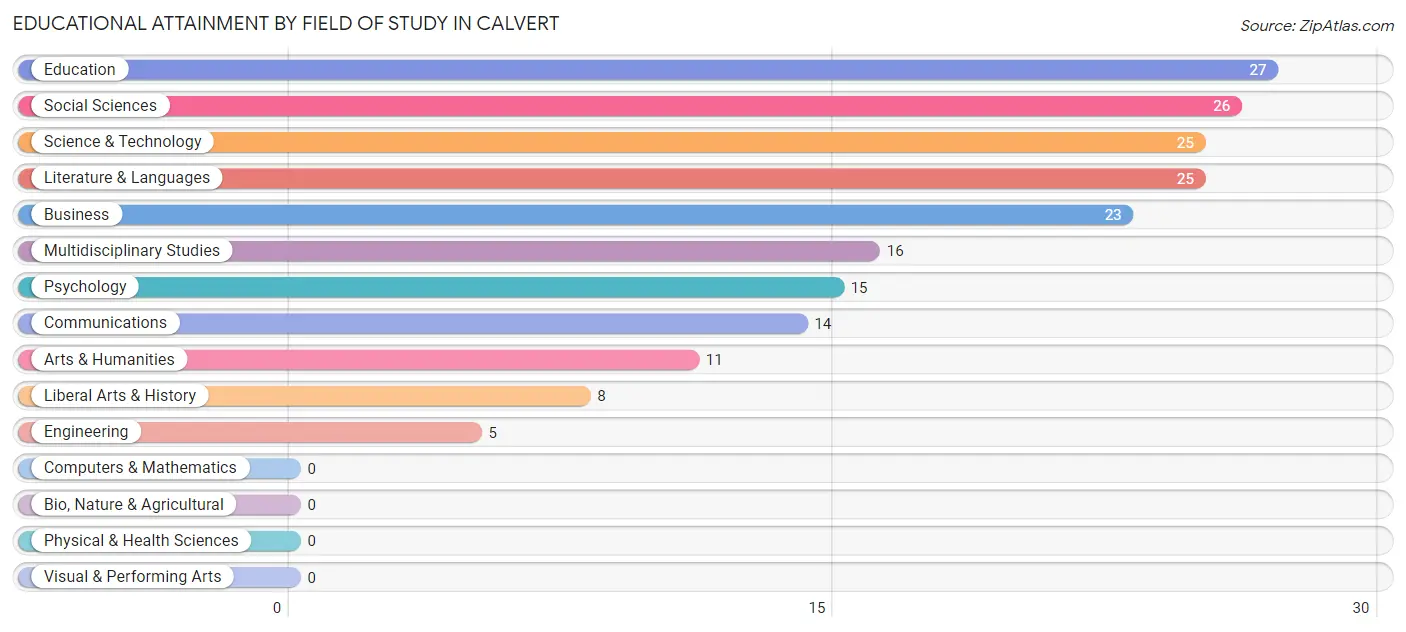
| Field of Study | # Graduates | % Graduates |
| Computers & Mathematics | 0 | 0.0% |
| Bio, Nature & Agricultural | 0 | 0.0% |
| Physical & Health Sciences | 0 | 0.0% |
| Psychology | 15 | 7.7% |
| Social Sciences | 26 | 13.3% |
| Engineering | 5 | 2.6% |
| Multidisciplinary Studies | 16 | 8.2% |
| Science & Technology | 25 | 12.8% |
| Business | 23 | 11.8% |
| Education | 27 | 13.9% |
| Literature & Languages | 25 | 12.8% |
| Liberal Arts & History | 8 | 4.1% |
| Visual & Performing Arts | 0 | 0.0% |
| Communications | 14 | 7.2% |
| Arts & Humanities | 11 | 5.6% |
| Total | 195 | 100.0% |
Transportation & Commute in Calvert
Vehicle Availability by Sex in Calvert
The most prevalent vehicle ownership categories in Calvert are males with 1 vehicle (86, accounting for 64.7%) and females with 1 vehicle (133, making up 36.7%).
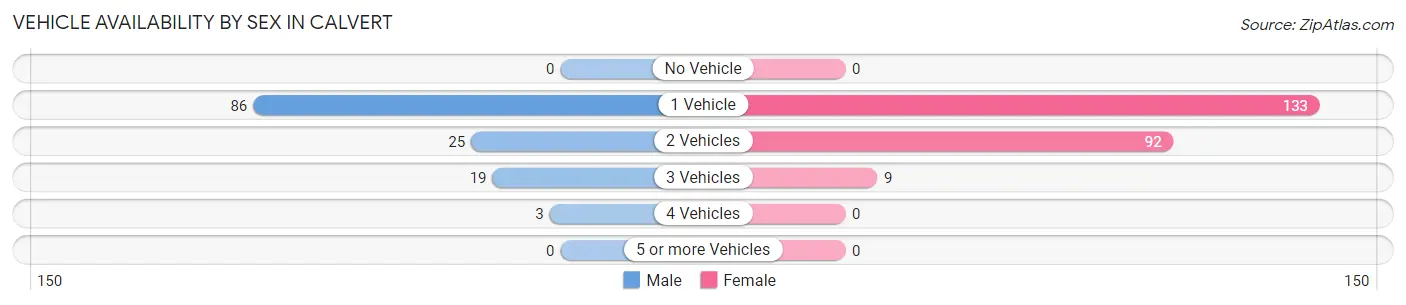
| Vehicles Available | Male | Female |
| No Vehicle | 0 (0.0%) | 0 (0.0%) |
| 1 Vehicle | 86 (64.7%) | 133 (56.8%) |
| 2 Vehicles | 25 (18.8%) | 92 (39.3%) |
| 3 Vehicles | 19 (14.3%) | 9 (3.8%) |
| 4 Vehicles | 3 (2.3%) | 0 (0.0%) |
| 5 or more Vehicles | 0 (0.0%) | 0 (0.0%) |
| Total | 133 (100.0%) | 234 (100.0%) |
Commute Time in Calvert
The most frequently occuring commute durations in Calvert are 40 to 44 minutes (79 commuters, 23.1%), 45 to 59 minutes (79 commuters, 23.1%), and 60 to 89 minutes (70 commuters, 20.5%).
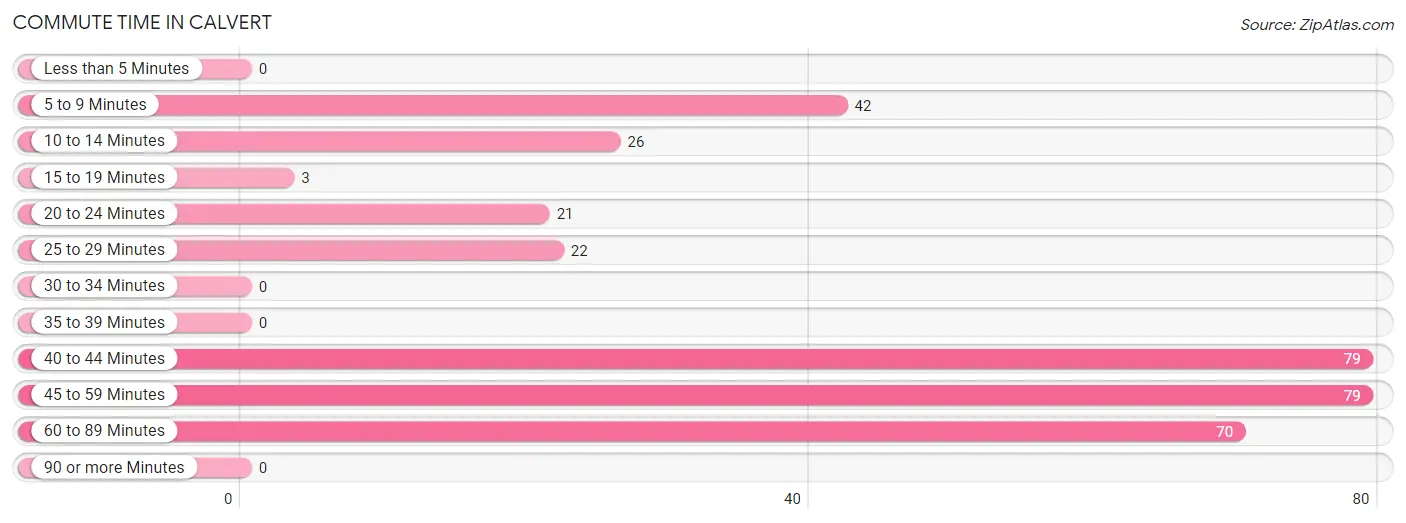
| Commute Time | # Commuters | % Commuters |
| Less than 5 Minutes | 0 | 0.0% |
| 5 to 9 Minutes | 42 | 12.3% |
| 10 to 14 Minutes | 26 | 7.6% |
| 15 to 19 Minutes | 3 | 0.9% |
| 20 to 24 Minutes | 21 | 6.1% |
| 25 to 29 Minutes | 22 | 6.4% |
| 30 to 34 Minutes | 0 | 0.0% |
| 35 to 39 Minutes | 0 | 0.0% |
| 40 to 44 Minutes | 79 | 23.1% |
| 45 to 59 Minutes | 79 | 23.1% |
| 60 to 89 Minutes | 70 | 20.5% |
| 90 or more Minutes | 0 | 0.0% |
Commute Time by Sex in Calvert
The most common commute times in Calvert are 5 to 9 minutes (39 commuters, 31.5%) for males and 60 to 89 minutes (70 commuters, 32.1%) for females.
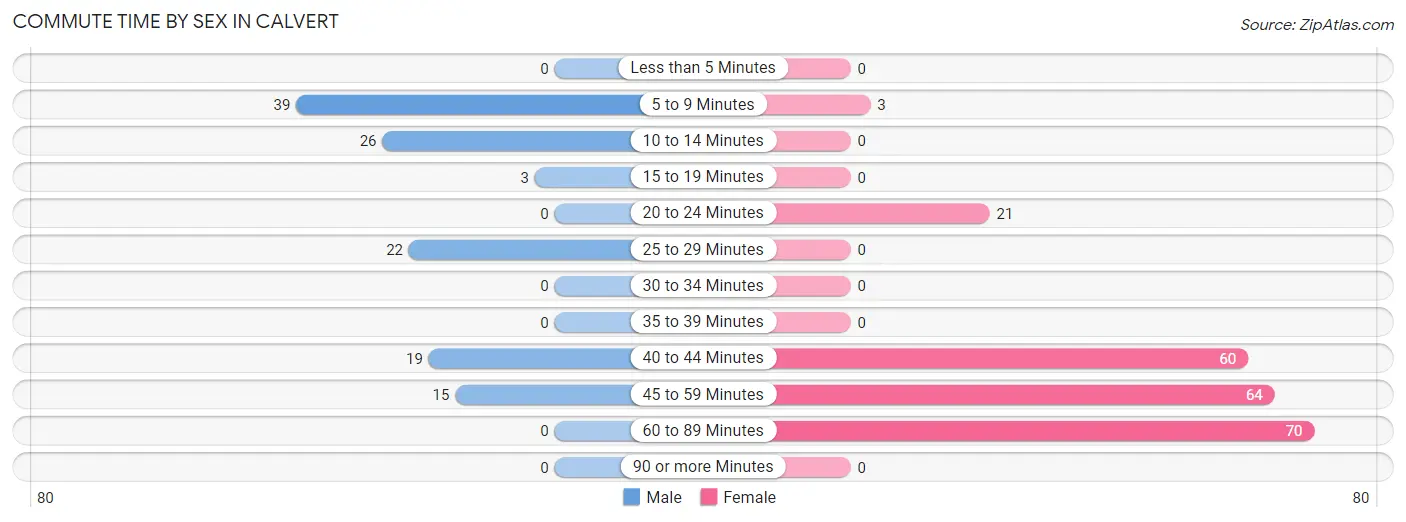
| Commute Time | Male | Female |
| Less than 5 Minutes | 0 (0.0%) | 0 (0.0%) |
| 5 to 9 Minutes | 39 (31.5%) | 3 (1.4%) |
| 10 to 14 Minutes | 26 (21.0%) | 0 (0.0%) |
| 15 to 19 Minutes | 3 (2.4%) | 0 (0.0%) |
| 20 to 24 Minutes | 0 (0.0%) | 21 (9.6%) |
| 25 to 29 Minutes | 22 (17.7%) | 0 (0.0%) |
| 30 to 34 Minutes | 0 (0.0%) | 0 (0.0%) |
| 35 to 39 Minutes | 0 (0.0%) | 0 (0.0%) |
| 40 to 44 Minutes | 19 (15.3%) | 60 (27.5%) |
| 45 to 59 Minutes | 15 (12.1%) | 64 (29.4%) |
| 60 to 89 Minutes | 0 (0.0%) | 70 (32.1%) |
| 90 or more Minutes | 0 (0.0%) | 0 (0.0%) |
Time of Departure to Work by Sex in Calvert
The most frequent times of departure to work in Calvert are 5:00 AM to 5:29 AM (34, 27.4%) for males and 4:00 PM to 11:59 PM (92, 42.2%) for females.
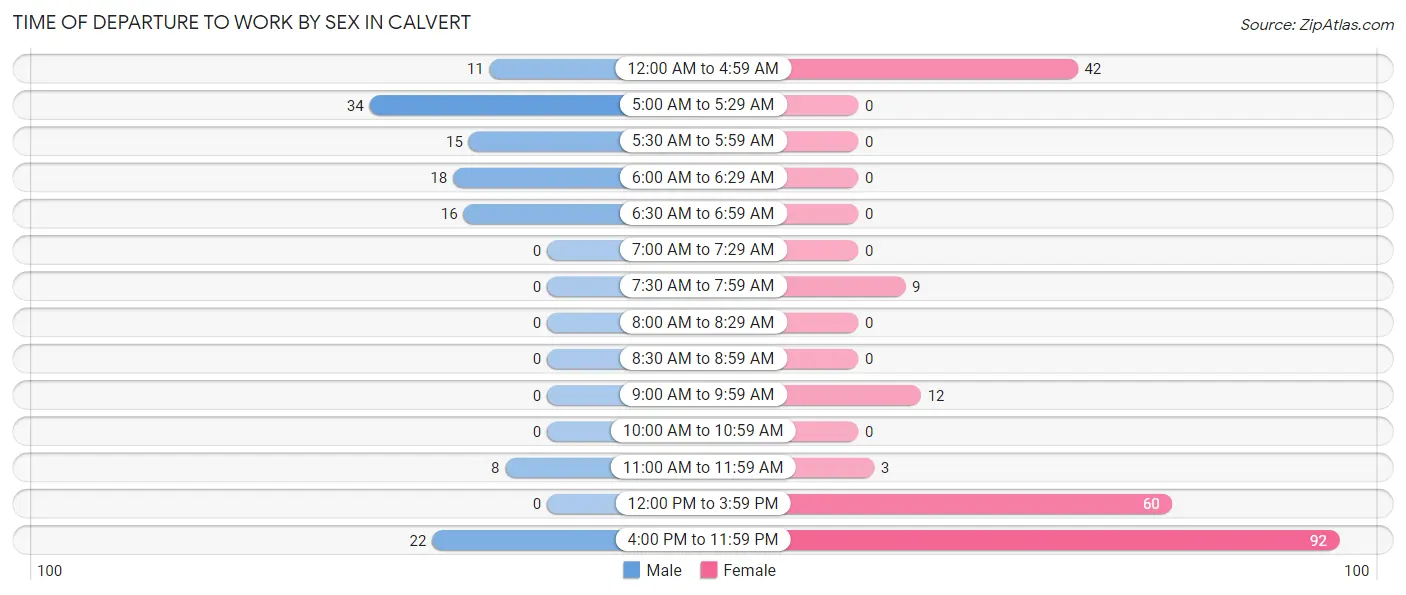
| Time of Departure | Male | Female |
| 12:00 AM to 4:59 AM | 11 (8.9%) | 42 (19.3%) |
| 5:00 AM to 5:29 AM | 34 (27.4%) | 0 (0.0%) |
| 5:30 AM to 5:59 AM | 15 (12.1%) | 0 (0.0%) |
| 6:00 AM to 6:29 AM | 18 (14.5%) | 0 (0.0%) |
| 6:30 AM to 6:59 AM | 16 (12.9%) | 0 (0.0%) |
| 7:00 AM to 7:29 AM | 0 (0.0%) | 0 (0.0%) |
| 7:30 AM to 7:59 AM | 0 (0.0%) | 9 (4.1%) |
| 8:00 AM to 8:29 AM | 0 (0.0%) | 0 (0.0%) |
| 8:30 AM to 8:59 AM | 0 (0.0%) | 0 (0.0%) |
| 9:00 AM to 9:59 AM | 0 (0.0%) | 12 (5.5%) |
| 10:00 AM to 10:59 AM | 0 (0.0%) | 0 (0.0%) |
| 11:00 AM to 11:59 AM | 8 (6.5%) | 3 (1.4%) |
| 12:00 PM to 3:59 PM | 0 (0.0%) | 60 (27.5%) |
| 4:00 PM to 11:59 PM | 22 (17.7%) | 92 (42.2%) |
| Total | 124 (100.0%) | 218 (100.0%) |
Housing Occupancy in Calvert
Occupancy by Ownership in Calvert
Of the total 400 dwellings in Calvert, owner-occupied units account for 213 (53.2%), while renter-occupied units make up 187 (46.8%).
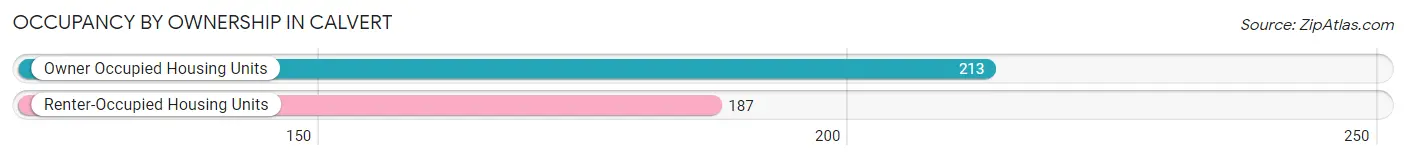
| Occupancy | # Housing Units | % Housing Units |
| Owner Occupied Housing Units | 213 | 53.2% |
| Renter-Occupied Housing Units | 187 | 46.8% |
| Total Occupied Housing Units | 400 | 100.0% |
Occupancy by Household Size in Calvert
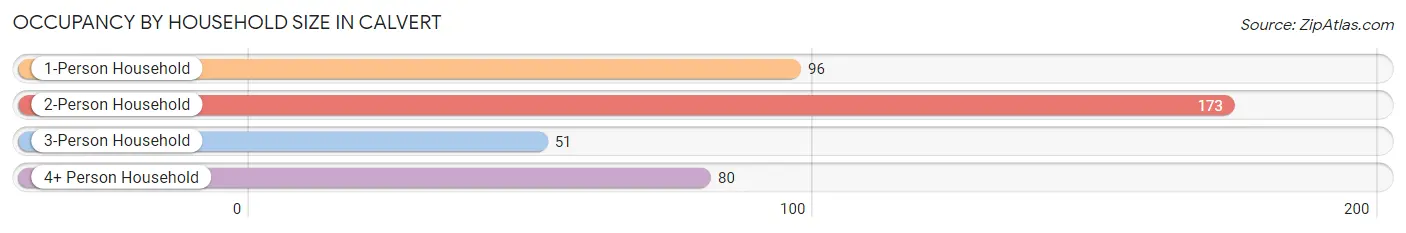
| Household Size | # Housing Units | % Housing Units |
| 1-Person Household | 96 | 24.0% |
| 2-Person Household | 173 | 43.2% |
| 3-Person Household | 51 | 12.8% |
| 4+ Person Household | 80 | 20.0% |
| Total Housing Units | 400 | 100.0% |
Occupancy by Ownership by Household Size in Calvert
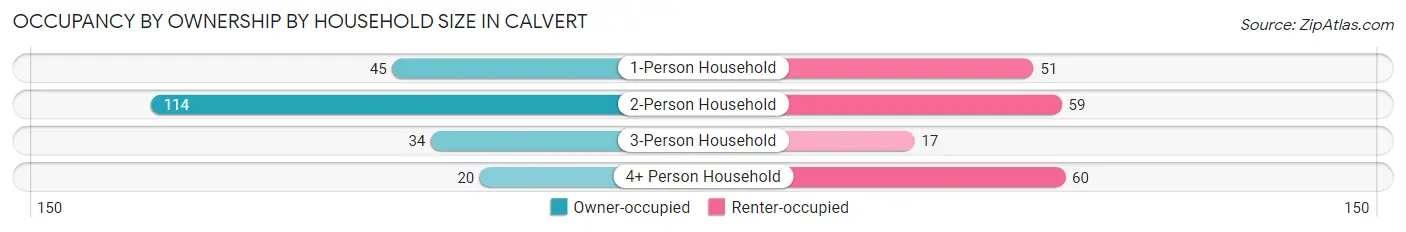
| Household Size | Owner-occupied | Renter-occupied |
| 1-Person Household | 45 (46.9%) | 51 (53.1%) |
| 2-Person Household | 114 (65.9%) | 59 (34.1%) |
| 3-Person Household | 34 (66.7%) | 17 (33.3%) |
| 4+ Person Household | 20 (25.0%) | 60 (75.0%) |
| Total Housing Units | 213 (53.2%) | 187 (46.8%) |
Occupancy by Educational Attainment in Calvert
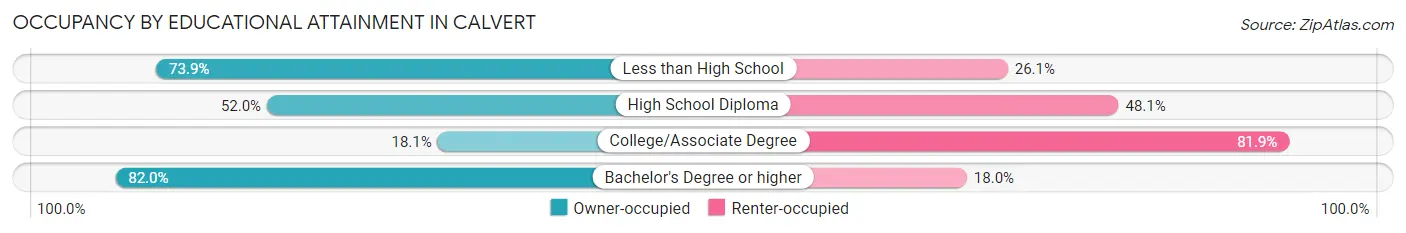
| Household Size | Owner-occupied | Renter-occupied |
| Less than High School | 34 (73.9%) | 12 (26.1%) |
| High School Diploma | 40 (51.9%) | 37 (48.0%) |
| College/Associate Degree | 25 (18.1%) | 113 (81.9%) |
| Bachelor's Degree or higher | 114 (82.0%) | 25 (18.0%) |
Occupancy by Age of Householder in Calvert
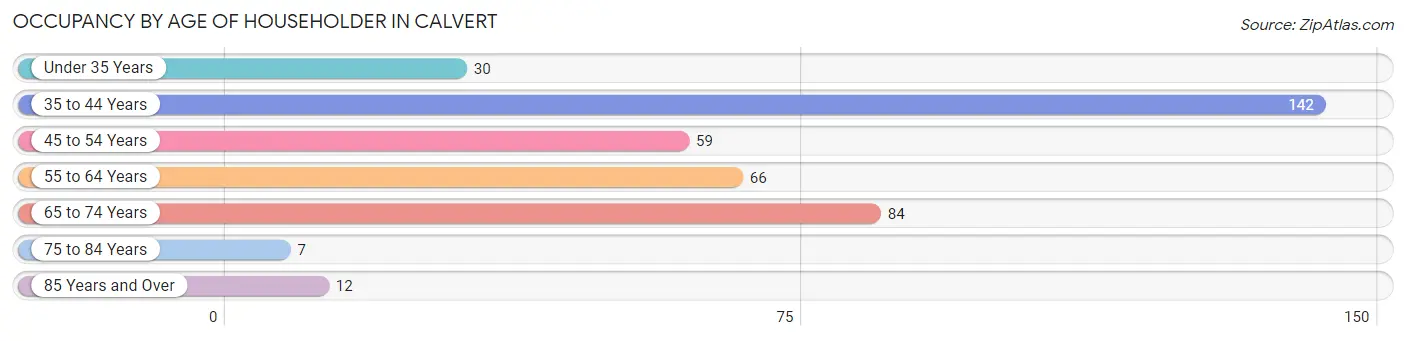
| Age Bracket | # Households | % Households |
| Under 35 Years | 30 | 7.5% |
| 35 to 44 Years | 142 | 35.5% |
| 45 to 54 Years | 59 | 14.7% |
| 55 to 64 Years | 66 | 16.5% |
| 65 to 74 Years | 84 | 21.0% |
| 75 to 84 Years | 7 | 1.8% |
| 85 Years and Over | 12 | 3.0% |
| Total | 400 | 100.0% |
Housing Finances in Calvert
Median Income by Occupancy in Calvert
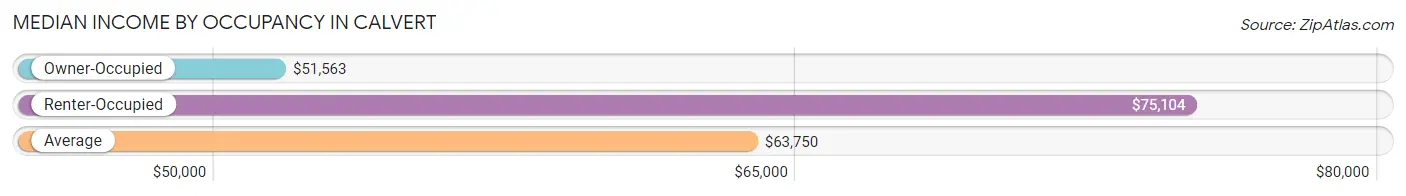
| Occupancy Type | # Households | Median Income |
| Owner-Occupied | 213 (53.2%) | $51,563 |
| Renter-Occupied | 187 (46.8%) | $75,104 |
| Average | 400 (100.0%) | $63,750 |
Occupancy by Householder Income Bracket in Calvert
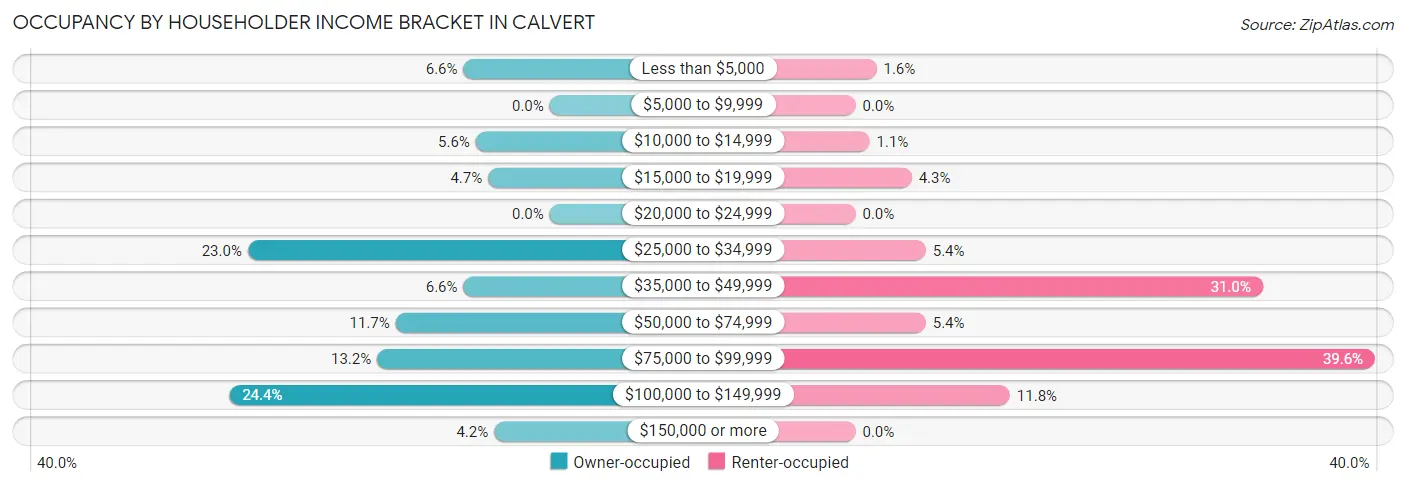
| Income Bracket | Owner-occupied | Renter-occupied |
| Less than $5,000 | 14 (6.6%) | 3 (1.6%) |
| $5,000 to $9,999 | 0 (0.0%) | 0 (0.0%) |
| $10,000 to $14,999 | 12 (5.6%) | 2 (1.1%) |
| $15,000 to $19,999 | 10 (4.7%) | 8 (4.3%) |
| $20,000 to $24,999 | 0 (0.0%) | 0 (0.0%) |
| $25,000 to $34,999 | 49 (23.0%) | 10 (5.3%) |
| $35,000 to $49,999 | 14 (6.6%) | 58 (31.0%) |
| $50,000 to $74,999 | 25 (11.7%) | 10 (5.3%) |
| $75,000 to $99,999 | 28 (13.2%) | 74 (39.6%) |
| $100,000 to $149,999 | 52 (24.4%) | 22 (11.8%) |
| $150,000 or more | 9 (4.2%) | 0 (0.0%) |
| Total | 213 (100.0%) | 187 (100.0%) |
Monthly Housing Cost Tiers in Calvert
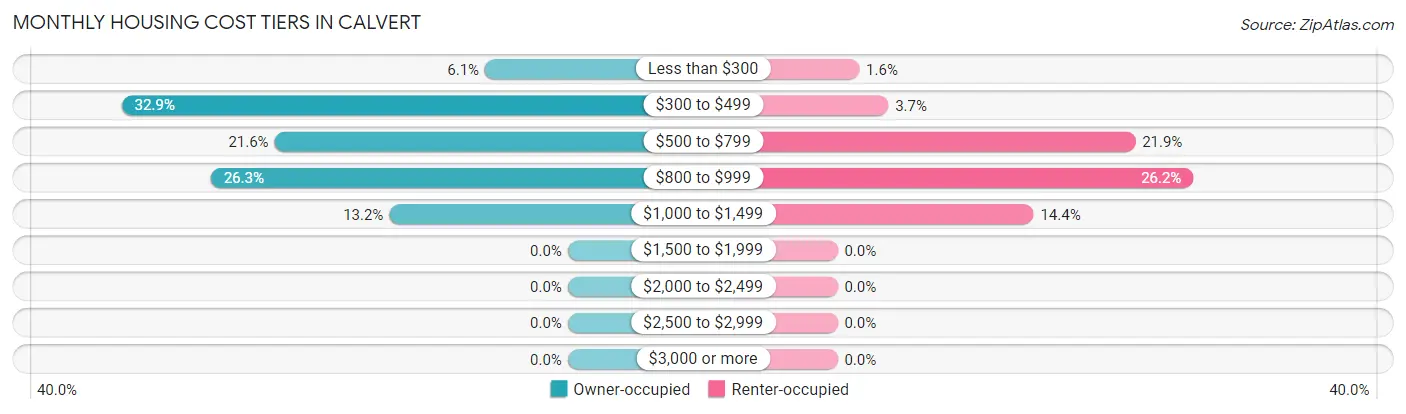
| Monthly Cost | Owner-occupied | Renter-occupied |
| Less than $300 | 13 (6.1%) | 3 (1.6%) |
| $300 to $499 | 70 (32.9%) | 7 (3.7%) |
| $500 to $799 | 46 (21.6%) | 41 (21.9%) |
| $800 to $999 | 56 (26.3%) | 49 (26.2%) |
| $1,000 to $1,499 | 28 (13.2%) | 27 (14.4%) |
| $1,500 to $1,999 | 0 (0.0%) | 0 (0.0%) |
| $2,000 to $2,499 | 0 (0.0%) | 0 (0.0%) |
| $2,500 to $2,999 | 0 (0.0%) | 0 (0.0%) |
| $3,000 or more | 0 (0.0%) | 0 (0.0%) |
| Total | 213 (100.0%) | 187 (100.0%) |
Physical Housing Characteristics in Calvert
Housing Structures in Calvert
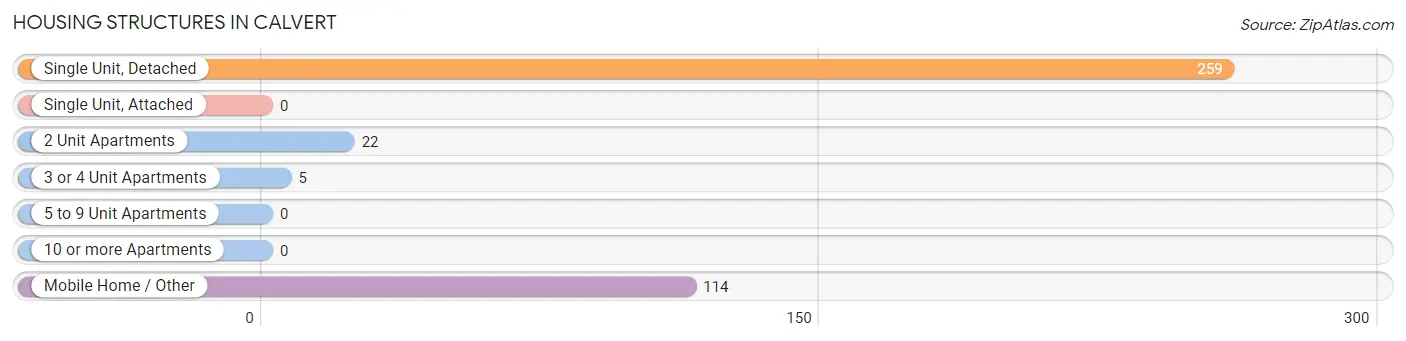
| Structure Type | # Housing Units | % Housing Units |
| Single Unit, Detached | 259 | 64.7% |
| Single Unit, Attached | 0 | 0.0% |
| 2 Unit Apartments | 22 | 5.5% |
| 3 or 4 Unit Apartments | 5 | 1.3% |
| 5 to 9 Unit Apartments | 0 | 0.0% |
| 10 or more Apartments | 0 | 0.0% |
| Mobile Home / Other | 114 | 28.5% |
| Total | 400 | 100.0% |
Housing Structures by Occupancy in Calvert
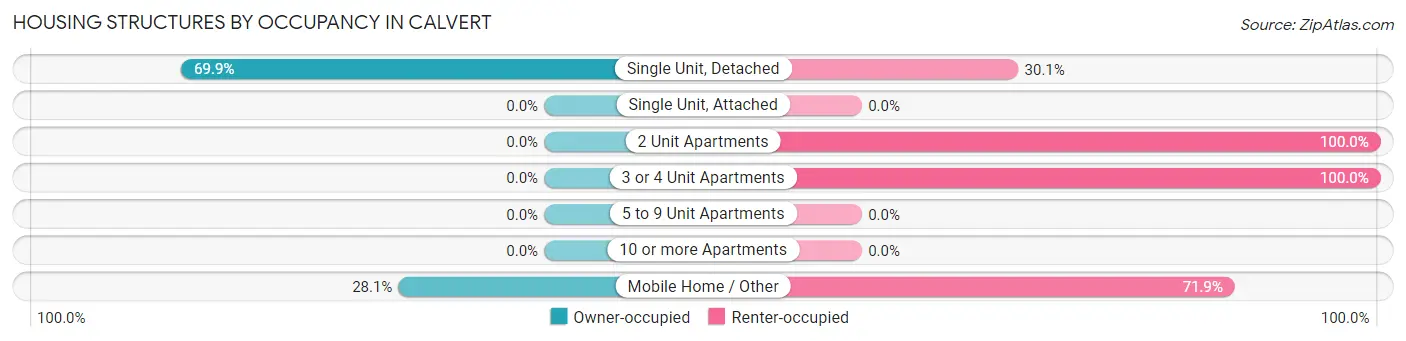
| Structure Type | Owner-occupied | Renter-occupied |
| Single Unit, Detached | 181 (69.9%) | 78 (30.1%) |
| Single Unit, Attached | 0 (0.0%) | 0 (0.0%) |
| 2 Unit Apartments | 0 (0.0%) | 22 (100.0%) |
| 3 or 4 Unit Apartments | 0 (0.0%) | 5 (100.0%) |
| 5 to 9 Unit Apartments | 0 (0.0%) | 0 (0.0%) |
| 10 or more Apartments | 0 (0.0%) | 0 (0.0%) |
| Mobile Home / Other | 32 (28.1%) | 82 (71.9%) |
| Total | 213 (53.2%) | 187 (46.8%) |
Housing Structures by Number of Rooms in Calvert
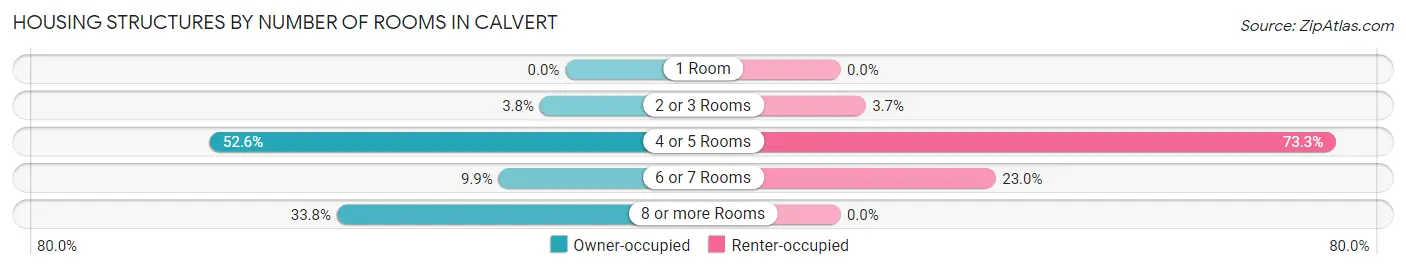
| Number of Rooms | Owner-occupied | Renter-occupied |
| 1 Room | 0 (0.0%) | 0 (0.0%) |
| 2 or 3 Rooms | 8 (3.8%) | 7 (3.7%) |
| 4 or 5 Rooms | 112 (52.6%) | 137 (73.3%) |
| 6 or 7 Rooms | 21 (9.9%) | 43 (23.0%) |
| 8 or more Rooms | 72 (33.8%) | 0 (0.0%) |
| Total | 213 (100.0%) | 187 (100.0%) |
Housing Structure by Heating Type in Calvert
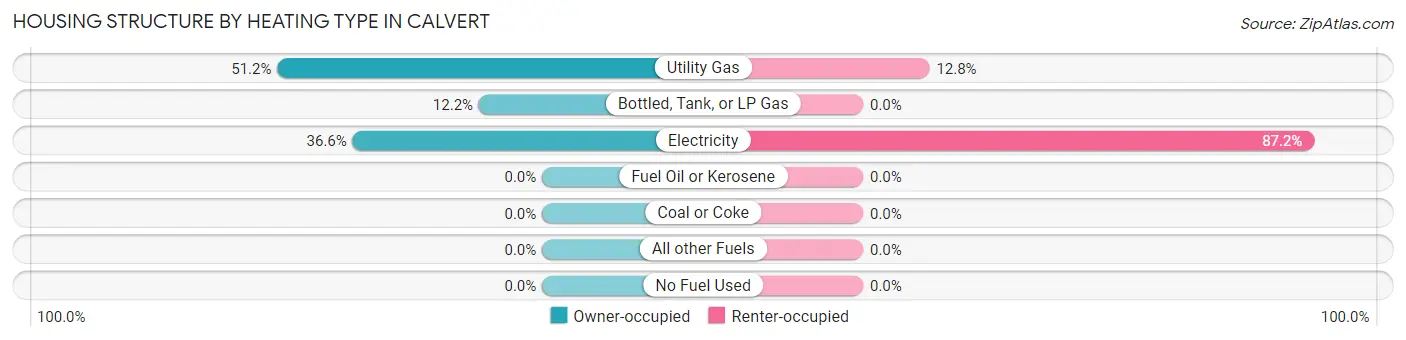
| Heating Type | Owner-occupied | Renter-occupied |
| Utility Gas | 109 (51.2%) | 24 (12.8%) |
| Bottled, Tank, or LP Gas | 26 (12.2%) | 0 (0.0%) |
| Electricity | 78 (36.6%) | 163 (87.2%) |
| Fuel Oil or Kerosene | 0 (0.0%) | 0 (0.0%) |
| Coal or Coke | 0 (0.0%) | 0 (0.0%) |
| All other Fuels | 0 (0.0%) | 0 (0.0%) |
| No Fuel Used | 0 (0.0%) | 0 (0.0%) |
| Total | 213 (100.0%) | 187 (100.0%) |
Household Vehicle Usage in Calvert
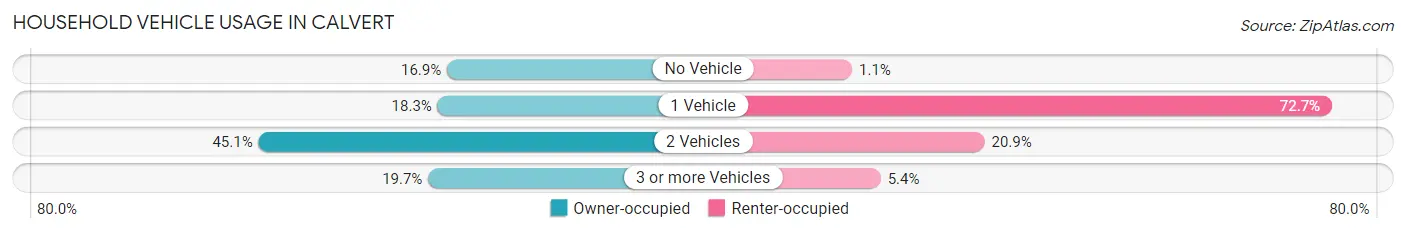
| Vehicles per Household | Owner-occupied | Renter-occupied |
| No Vehicle | 36 (16.9%) | 2 (1.1%) |
| 1 Vehicle | 39 (18.3%) | 136 (72.7%) |
| 2 Vehicles | 96 (45.1%) | 39 (20.9%) |
| 3 or more Vehicles | 42 (19.7%) | 10 (5.3%) |
| Total | 213 (100.0%) | 187 (100.0%) |
Real Estate & Mortgages in Calvert
Real Estate and Mortgage Overview in Calvert
| Characteristic | Without Mortgage | With Mortgage |
| Housing Units | 136 | 77 |
| Median Property Value | - | - |
| Median Household Income | - | - |
| Monthly Housing Costs | $446 | $0 |
| Real Estate Taxes | $943 | $0 |
Property Value by Mortgage Status in Calvert
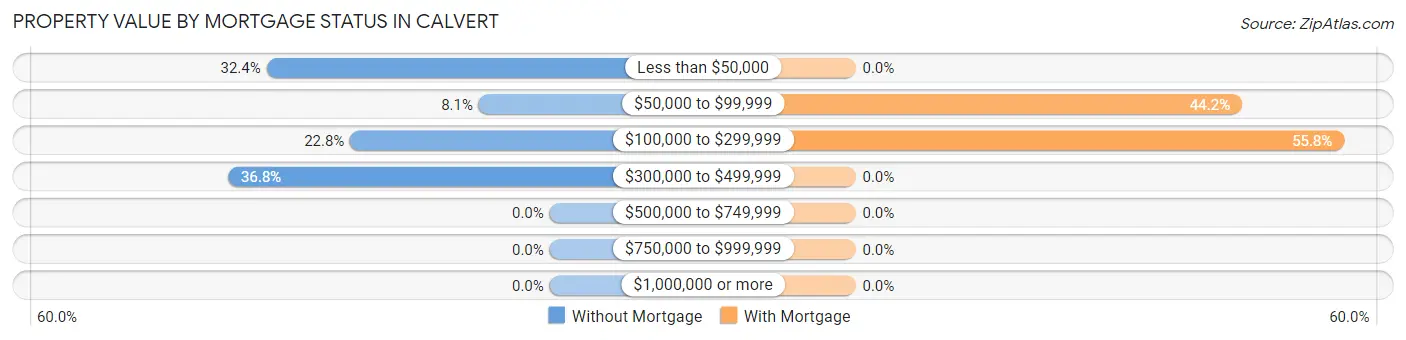
| Property Value | Without Mortgage | With Mortgage |
| Less than $50,000 | 44 (32.4%) | 0 (0.0%) |
| $50,000 to $99,999 | 11 (8.1%) | 34 (44.2%) |
| $100,000 to $299,999 | 31 (22.8%) | 43 (55.8%) |
| $300,000 to $499,999 | 50 (36.8%) | 0 (0.0%) |
| $500,000 to $749,999 | 0 (0.0%) | 0 (0.0%) |
| $750,000 to $999,999 | 0 (0.0%) | 0 (0.0%) |
| $1,000,000 or more | 0 (0.0%) | 0 (0.0%) |
| Total | 136 (100.0%) | 77 (100.0%) |
Household Income by Mortgage Status in Calvert
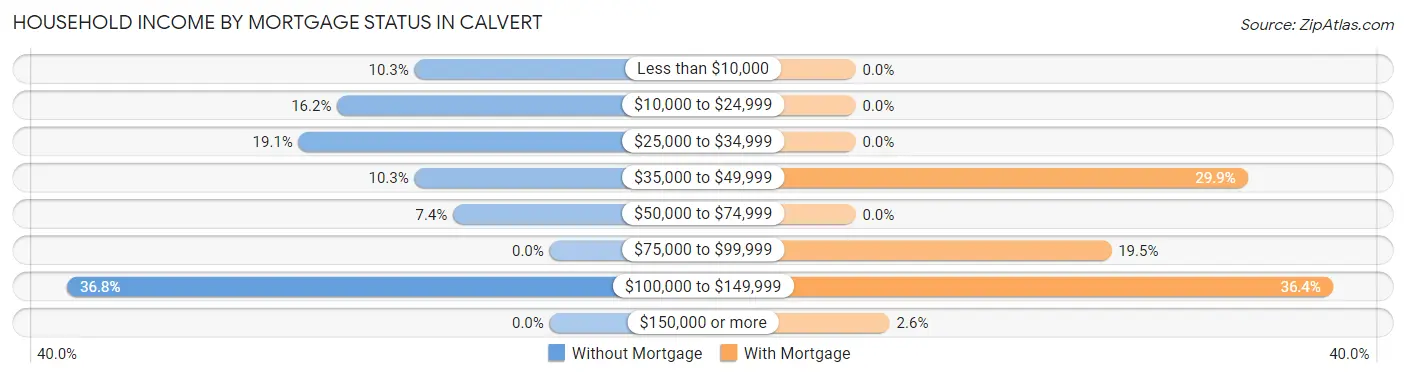
| Household Income | Without Mortgage | With Mortgage |
| Less than $10,000 | 14 (10.3%) | 0 (0.0%) |
| $10,000 to $24,999 | 22 (16.2%) | 0 (0.0%) |
| $25,000 to $34,999 | 26 (19.1%) | 0 (0.0%) |
| $35,000 to $49,999 | 14 (10.3%) | 23 (29.9%) |
| $50,000 to $74,999 | 10 (7.3%) | 0 (0.0%) |
| $75,000 to $99,999 | 0 (0.0%) | 15 (19.5%) |
| $100,000 to $149,999 | 50 (36.8%) | 28 (36.4%) |
| $150,000 or more | 0 (0.0%) | 2 (2.6%) |
| Total | 136 (100.0%) | 77 (100.0%) |
Property Value to Household Income Ratio in Calvert
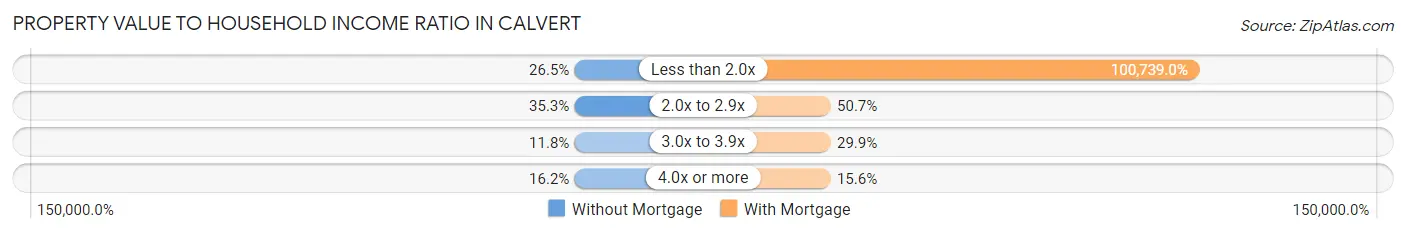
| Value-to-Income Ratio | Without Mortgage | With Mortgage |
| Less than 2.0x | 36 (26.5%) | 77,569 (100,739.0%) |
| 2.0x to 2.9x | 48 (35.3%) | 39 (50.6%) |
| 3.0x to 3.9x | 16 (11.8%) | 23 (29.9%) |
| 4.0x or more | 22 (16.2%) | 12 (15.6%) |
| Total | 136 (100.0%) | 77 (100.0%) |
Real Estate Taxes by Mortgage Status in Calvert
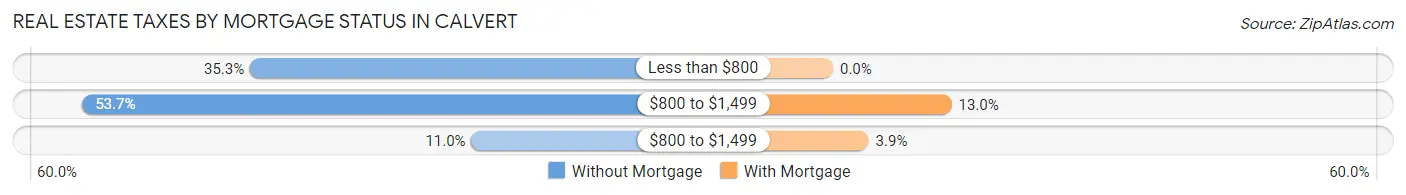
| Property Taxes | Without Mortgage | With Mortgage |
| Less than $800 | 48 (35.3%) | 0 (0.0%) |
| $800 to $1,499 | 73 (53.7%) | 10 (13.0%) |
| $800 to $1,499 | 15 (11.0%) | 3 (3.9%) |
| Total | 136 (100.0%) | 77 (100.0%) |
Health & Disability in Calvert
Health Insurance Coverage by Age in Calvert
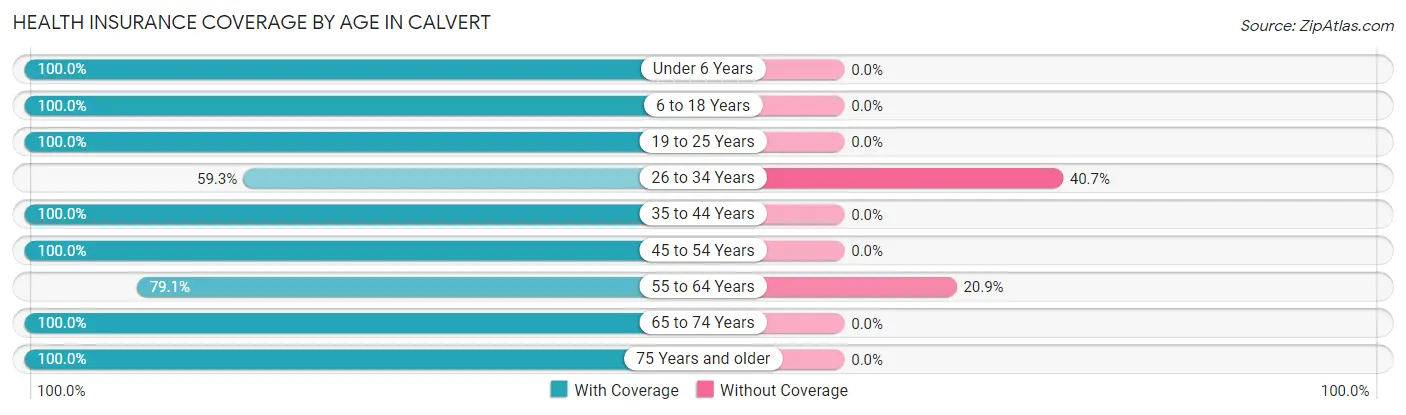
| Age Bracket | With Coverage | Without Coverage |
| Under 6 Years | 29 (100.0%) | 0 (0.0%) |
| 6 to 18 Years | 273 (100.0%) | 0 (0.0%) |
| 19 to 25 Years | 89 (100.0%) | 0 (0.0%) |
| 26 to 34 Years | 32 (59.3%) | 22 (40.7%) |
| 35 to 44 Years | 167 (100.0%) | 0 (0.0%) |
| 45 to 54 Years | 71 (100.0%) | 0 (0.0%) |
| 55 to 64 Years | 87 (79.1%) | 23 (20.9%) |
| 65 to 74 Years | 133 (100.0%) | 0 (0.0%) |
| 75 Years and older | 53 (100.0%) | 0 (0.0%) |
| Total | 934 (95.4%) | 45 (4.6%) |
Health Insurance Coverage by Citizenship Status in Calvert
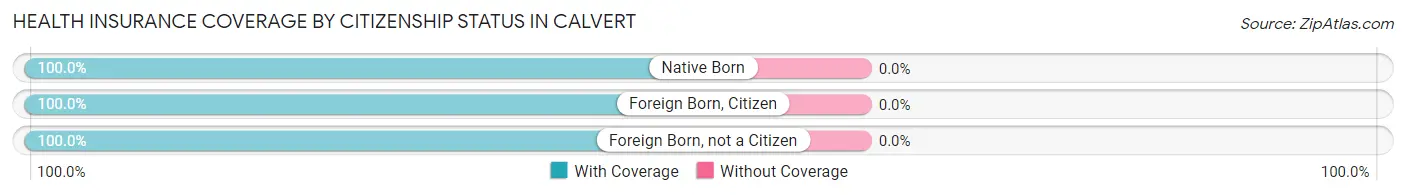
| Citizenship Status | With Coverage | Without Coverage |
| Native Born | 29 (100.0%) | 0 (0.0%) |
| Foreign Born, Citizen | 273 (100.0%) | 0 (0.0%) |
| Foreign Born, not a Citizen | 89 (100.0%) | 0 (0.0%) |
Health Insurance Coverage by Household Income in Calvert
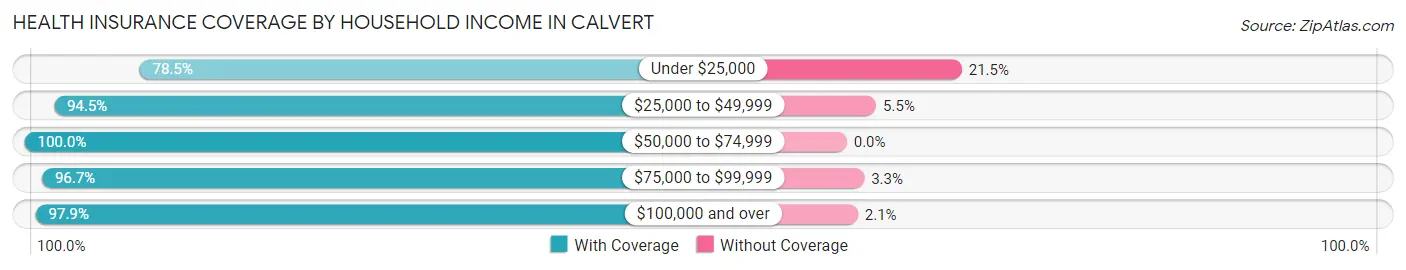
| Household Income | With Coverage | Without Coverage |
| Under $25,000 | 51 (78.5%) | 14 (21.5%) |
| $25,000 to $49,999 | 275 (94.5%) | 16 (5.5%) |
| $50,000 to $74,999 | 72 (100.0%) | 0 (0.0%) |
| $75,000 to $99,999 | 297 (96.7%) | 10 (3.3%) |
| $100,000 and over | 237 (97.9%) | 5 (2.1%) |
Public vs Private Health Insurance Coverage by Age in Calvert
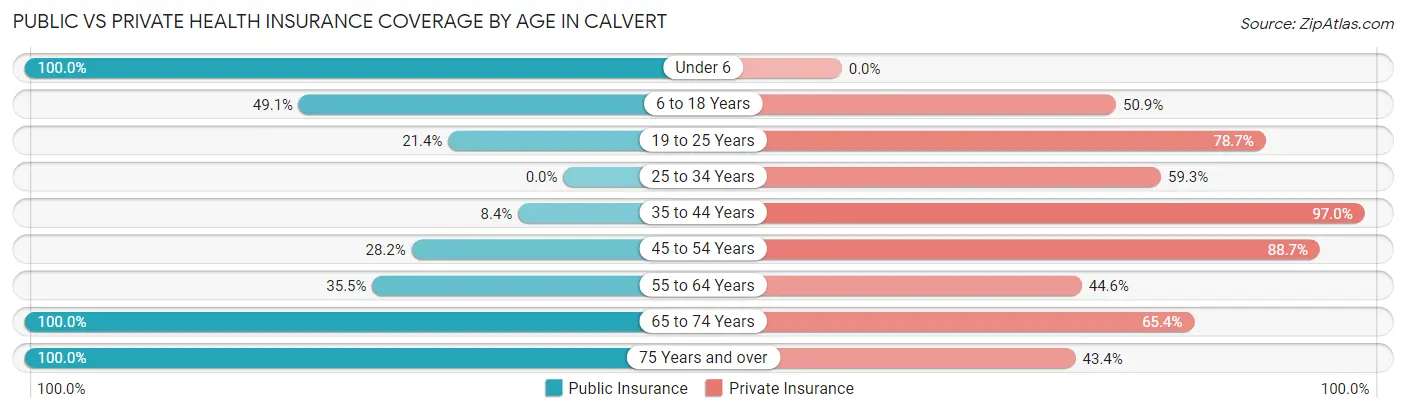
| Age Bracket | Public Insurance | Private Insurance |
| Under 6 | 29 (100.0%) | 0 (0.0%) |
| 6 to 18 Years | 134 (49.1%) | 139 (50.9%) |
| 19 to 25 Years | 19 (21.3%) | 70 (78.6%) |
| 25 to 34 Years | 0 (0.0%) | 32 (59.3%) |
| 35 to 44 Years | 14 (8.4%) | 162 (97.0%) |
| 45 to 54 Years | 20 (28.2%) | 63 (88.7%) |
| 55 to 64 Years | 39 (35.4%) | 49 (44.6%) |
| 65 to 74 Years | 133 (100.0%) | 87 (65.4%) |
| 75 Years and over | 53 (100.0%) | 23 (43.4%) |
| Total | 441 (45.1%) | 625 (63.8%) |
Disability Status by Sex by Age in Calvert
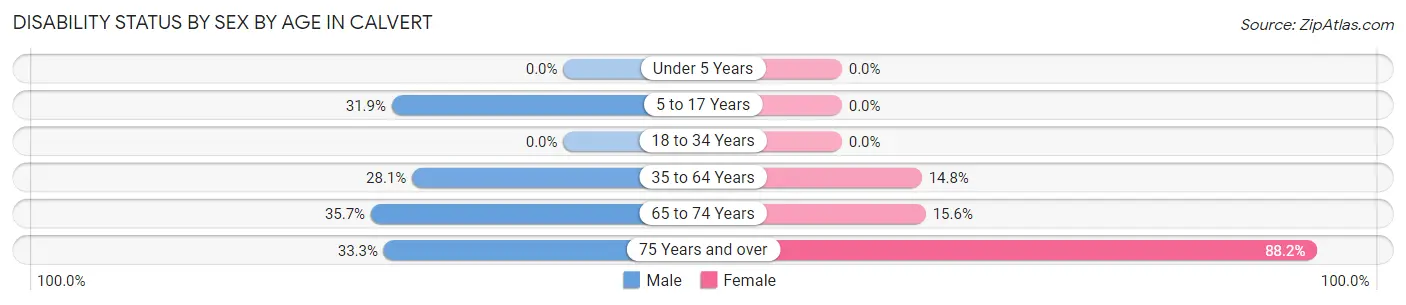
| Age Bracket | Male | Female |
| Under 5 Years | 0 (0.0%) | 0 (0.0%) |
| 5 to 17 Years | 43 (31.9%) | 0 (0.0%) |
| 18 to 34 Years | 0 (0.0%) | 0 (0.0%) |
| 35 to 64 Years | 39 (28.1%) | 31 (14.8%) |
| 65 to 74 Years | 20 (35.7%) | 12 (15.6%) |
| 75 Years and over | 12 (33.3%) | 15 (88.2%) |
Disability Class by Sex by Age in Calvert
Disability Class: Hearing Difficulty
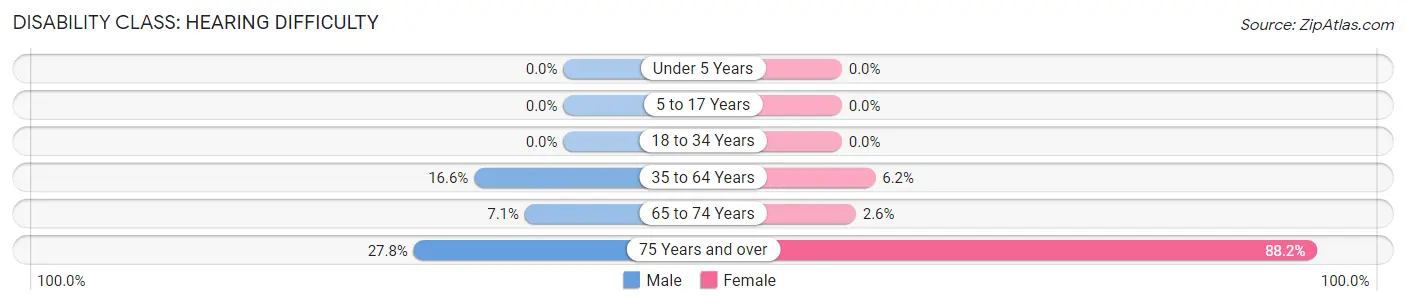
| Age Bracket | Male | Female |
| Under 5 Years | 0 (0.0%) | 0 (0.0%) |
| 5 to 17 Years | 0 (0.0%) | 0 (0.0%) |
| 18 to 34 Years | 0 (0.0%) | 0 (0.0%) |
| 35 to 64 Years | 23 (16.6%) | 13 (6.2%) |
| 65 to 74 Years | 4 (7.1%) | 2 (2.6%) |
| 75 Years and over | 10 (27.8%) | 15 (88.2%) |
Disability Class: Vision Difficulty
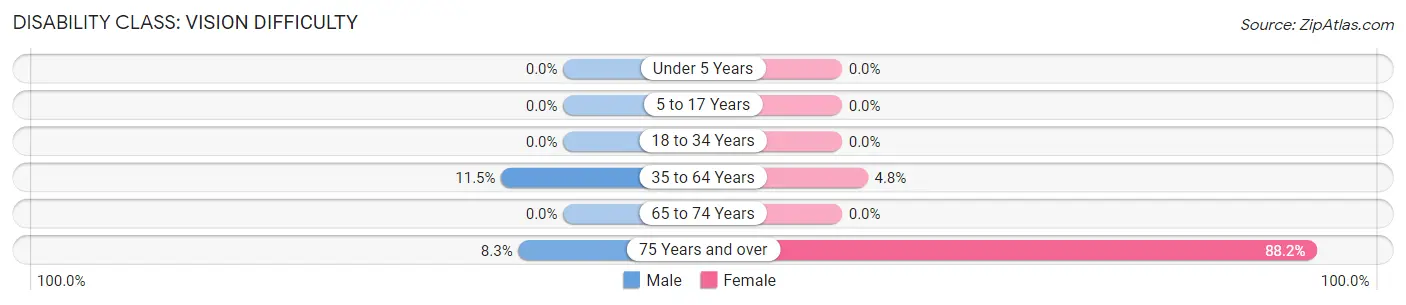
| Age Bracket | Male | Female |
| Under 5 Years | 0 (0.0%) | 0 (0.0%) |
| 5 to 17 Years | 0 (0.0%) | 0 (0.0%) |
| 18 to 34 Years | 0 (0.0%) | 0 (0.0%) |
| 35 to 64 Years | 16 (11.5%) | 10 (4.8%) |
| 65 to 74 Years | 0 (0.0%) | 0 (0.0%) |
| 75 Years and over | 3 (8.3%) | 15 (88.2%) |
Disability Class: Cognitive Difficulty
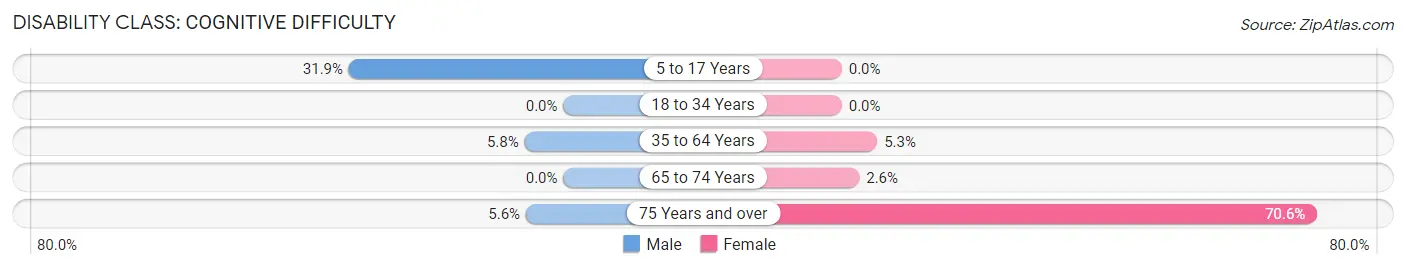
| Age Bracket | Male | Female |
| 5 to 17 Years | 43 (31.9%) | 0 (0.0%) |
| 18 to 34 Years | 0 (0.0%) | 0 (0.0%) |
| 35 to 64 Years | 8 (5.8%) | 11 (5.3%) |
| 65 to 74 Years | 0 (0.0%) | 2 (2.6%) |
| 75 Years and over | 2 (5.6%) | 12 (70.6%) |
Disability Class: Ambulatory Difficulty
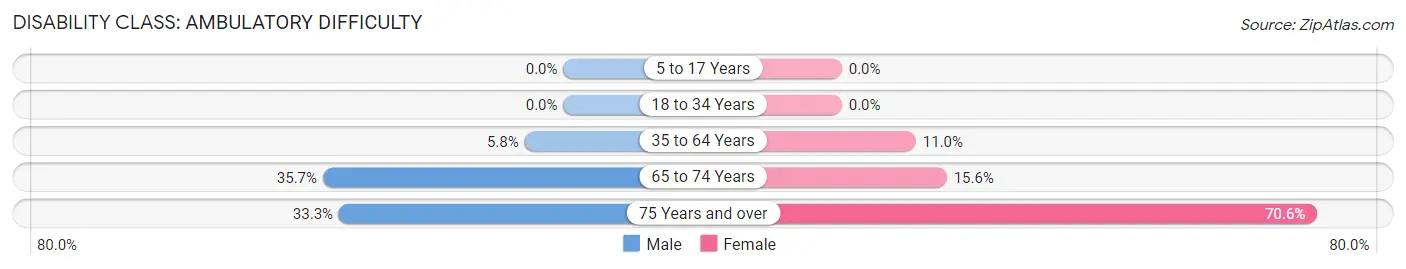
| Age Bracket | Male | Female |
| 5 to 17 Years | 0 (0.0%) | 0 (0.0%) |
| 18 to 34 Years | 0 (0.0%) | 0 (0.0%) |
| 35 to 64 Years | 8 (5.8%) | 23 (11.0%) |
| 65 to 74 Years | 20 (35.7%) | 12 (15.6%) |
| 75 Years and over | 12 (33.3%) | 12 (70.6%) |
Disability Class: Self-Care Difficulty
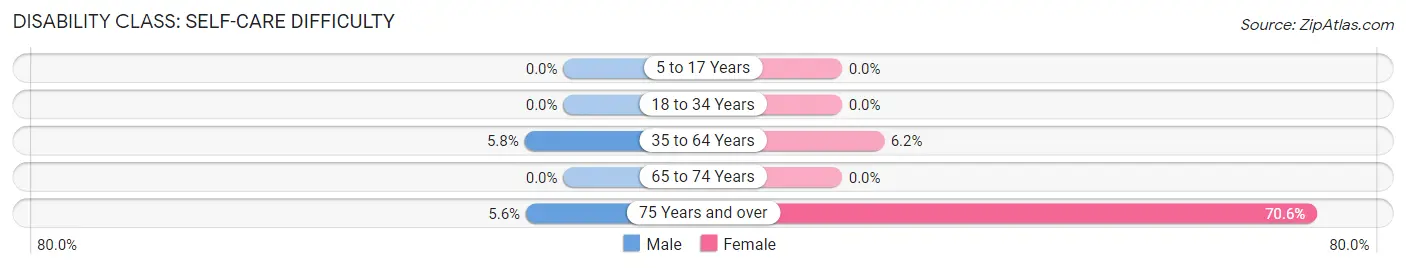
| Age Bracket | Male | Female |
| 5 to 17 Years | 0 (0.0%) | 0 (0.0%) |
| 18 to 34 Years | 0 (0.0%) | 0 (0.0%) |
| 35 to 64 Years | 8 (5.8%) | 13 (6.2%) |
| 65 to 74 Years | 0 (0.0%) | 0 (0.0%) |
| 75 Years and over | 2 (5.6%) | 12 (70.6%) |
Technology Access in Calvert
Computing Device Access in Calvert
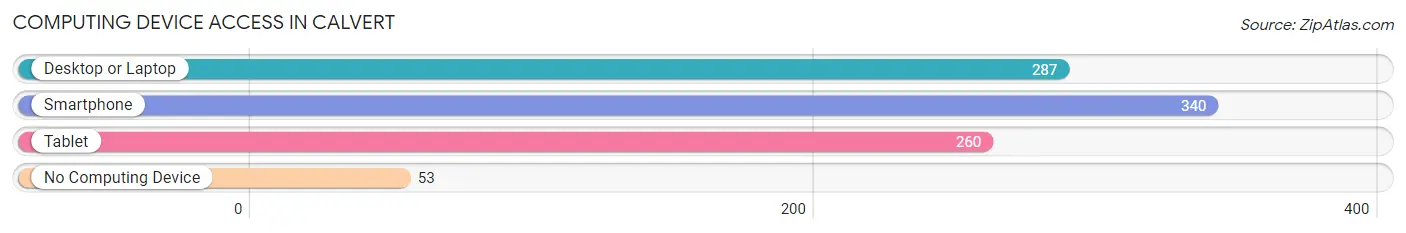
| Device Type | # Households | % Households |
| Desktop or Laptop | 287 | 71.8% |
| Smartphone | 340 | 85.0% |
| Tablet | 260 | 65.0% |
| No Computing Device | 53 | 13.3% |
| Total | 400 | 100.0% |
Internet Access in Calvert
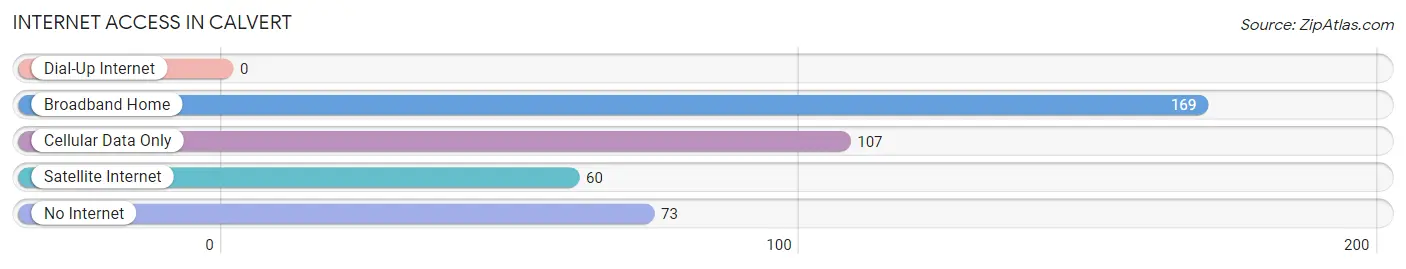
| Internet Type | # Households | % Households |
| Dial-Up Internet | 0 | 0.0% |
| Broadband Home | 169 | 42.2% |
| Cellular Data Only | 107 | 26.8% |
| Satellite Internet | 60 | 15.0% |
| No Internet | 73 | 18.2% |
| Total | 400 | 100.0% |
Calvert Summary
Calvert, Texas is a small town located in Robertson County, Texas. It is situated about halfway between Houston and Austin, and is part of the Bryan-College Station metropolitan area. The town has a population of 1,717 people, according to the 2010 census.
History
Calvert was founded in 1871 by a group of settlers from Kentucky and Tennessee. The town was named after Robert Calvert, a prominent local landowner. The town was incorporated in 1873 and quickly became a thriving agricultural center. Cotton was the main crop grown in the area, and the town was home to several cotton gins.
In the late 19th century, Calvert was a major stop on the Houston and Texas Central Railway. The railroad brought new economic opportunities to the town, and it soon became a center for commerce and industry. The town was home to several businesses, including a cotton gin, a sawmill, a gristmill, and a blacksmith shop.
Geography
Calvert is located in Robertson County, Texas, about halfway between Houston and Austin. The town is situated on the Brazos River, and is surrounded by rolling hills and wooded areas. The climate in Calvert is generally mild, with hot summers and mild winters.
Economy
Calvert’s economy is largely based on agriculture. Cotton is still the main crop grown in the area, and the town is home to several cotton gins. Other crops grown in the area include corn, wheat, and soybeans.
The town is also home to several small businesses, including a grocery store, a hardware store, and a few restaurants. The town is also home to a few manufacturing companies, including a furniture factory and a plastics factory.
Demographics
According to the 2010 census, Calvert has a population of 1,717 people. The town is predominantly white, with about 85% of the population identifying as white. The remaining 15% of the population is made up of African Americans, Hispanics, and other ethnicities.
The median household income in Calvert is $37,000, and the median home value is $90,000. The town has a low unemployment rate of 4.2%, and the poverty rate is 11.3%.
Calvert is a small town with a rich history and a vibrant economy. The town is home to a diverse population, and offers a variety of economic opportunities. With its close proximity to Houston and Austin, Calvert is an ideal place to live and work.
Common Questions
What is Per Capita Income in Calvert?
Per Capita income in Calvert is $27,622.
What is the Median Family Income in Calvert?
Median Family Income in Calvert is $75,042.
What is the Median Household income in Calvert?
Median Household Income in Calvert is $63,750.
What is Income or Wage Gap in Calvert?
Income or Wage Gap in Calvert is 28.5%.
Women in Calvert earn 71.5 cents for every dollar earned by a man.
What is Inequality or Gini Index in Calvert?
Inequality or Gini Index in Calvert is 0.35.
What is the Total Population of Calvert?
Total Population of Calvert is 996.
What is the Total Male Population of Calvert?
Total Male Population of Calvert is 430.
What is the Total Female Population of Calvert?
Total Female Population of Calvert is 566.
What is the Ratio of Males per 100 Females in Calvert?
There are 75.97 Males per 100 Females in Calvert.
What is the Ratio of Females per 100 Males in Calvert?
There are 131.63 Females per 100 Males in Calvert.
What is the Median Population Age in Calvert?
Median Population Age in Calvert is 39.9 Years.
What is the Average Family Size in Calvert
Average Family Size in Calvert is 2.9 People.
What is the Average Household Size in Calvert
Average Household Size in Calvert is 2.4 People.
How Large is the Labor Force in Calvert?
There are 407 People in the Labor Forcein in Calvert.
What is the Percentage of People in the Labor Force in Calvert?
54.9% of People are in the Labor Force in Calvert.
What is the Unemployment Rate in Calvert?
Unemployment Rate in Calvert is 9.8%.