Caldwell, TX Map & Demographics
Caldwell Map
Caldwell Overview
$32,898
PER CAPITA INCOME
$79,167
AVG FAMILY INCOME
$57,222
AVG HOUSEHOLD INCOME
17.8%
WAGE / INCOME GAP [ % ]
82.2¢/ $1
WAGE / INCOME GAP [ $ ]
$12,754
FAMILY INCOME DEFICIT
0.41
INEQUALITY / GINI INDEX
4,120
TOTAL POPULATION
2,076
MALE POPULATION
2,044
FEMALE POPULATION
101.57
MALES / 100 FEMALES
98.46
FEMALES / 100 MALES
40.2
MEDIAN AGE
3.2
AVG FAMILY SIZE
2.4
AVG HOUSEHOLD SIZE
1,894
LABOR FORCE [ PEOPLE ]
59.8%
PERCENT IN LABOR FORCE
0.2%
UNEMPLOYMENT RATE
Caldwell Zip Codes
Caldwell Area Codes
Income in Caldwell
Income Overview in Caldwell
Per Capita Income in Caldwell is $32,898, while median incomes of families and households are $79,167 and $57,222 respectively.
| Characteristic | Number | Measure |
| Per Capita Income | 4,120 | $32,898 |
| Median Family Income | 994 | $79,167 |
| Mean Family Income | 994 | $94,500 |
| Median Household Income | 1,622 | $57,222 |
| Mean Household Income | 1,622 | $81,004 |
| Income Deficit | 994 | $12,754 |
| Wage / Income Gap (%) | 4,120 | 17.76% |
| Wage / Income Gap ($) | 4,120 | 82.24¢ per $1 |
| Gini / Inequality Index | 4,120 | 0.41 |
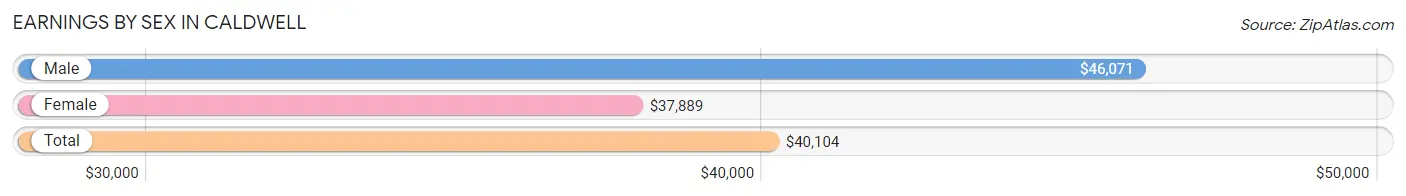
Earnings by Sex in Caldwell
Average Earnings in Caldwell are $40,104, $46,071 for men and $37,889 for women, a difference of 17.8%.
| Sex | Number | Average Earnings |
| Male | 1,182 (58.1%) | $46,071 |
| Female | 852 (41.9%) | $37,889 |
| Total | 2,034 (100.0%) | $40,104 |
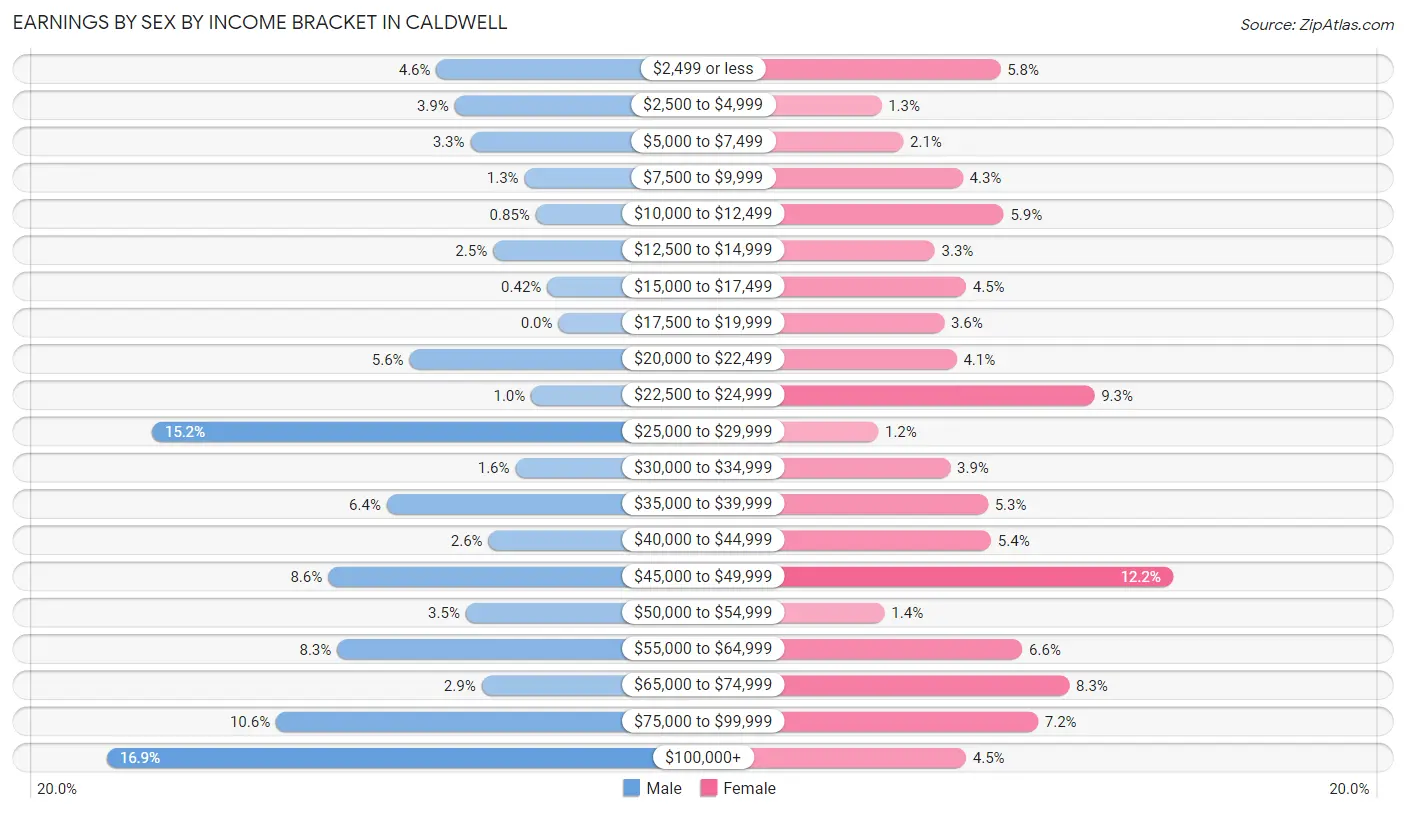
Earnings by Sex by Income Bracket in Caldwell
The most common earnings brackets in Caldwell are $100,000+ for men (200 | 16.9%) and $45,000 to $49,999 for women (104 | 12.2%).
| Income | Male | Female |
| $2,499 or less | 54 (4.6%) | 49 (5.8%) |
| $2,500 to $4,999 | 46 (3.9%) | 11 (1.3%) |
| $5,000 to $7,499 | 39 (3.3%) | 18 (2.1%) |
| $7,500 to $9,999 | 15 (1.3%) | 37 (4.3%) |
| $10,000 to $12,499 | 10 (0.9%) | 50 (5.9%) |
| $12,500 to $14,999 | 29 (2.5%) | 28 (3.3%) |
| $15,000 to $17,499 | 5 (0.4%) | 38 (4.5%) |
| $17,500 to $19,999 | 0 (0.0%) | 31 (3.6%) |
| $20,000 to $22,499 | 66 (5.6%) | 35 (4.1%) |
| $22,500 to $24,999 | 12 (1.0%) | 79 (9.3%) |
| $25,000 to $29,999 | 180 (15.2%) | 10 (1.2%) |
| $30,000 to $34,999 | 19 (1.6%) | 33 (3.9%) |
| $35,000 to $39,999 | 76 (6.4%) | 45 (5.3%) |
| $40,000 to $44,999 | 31 (2.6%) | 46 (5.4%) |
| $45,000 to $49,999 | 102 (8.6%) | 104 (12.2%) |
| $50,000 to $54,999 | 41 (3.5%) | 12 (1.4%) |
| $55,000 to $64,999 | 98 (8.3%) | 56 (6.6%) |
| $65,000 to $74,999 | 34 (2.9%) | 71 (8.3%) |
| $75,000 to $99,999 | 125 (10.6%) | 61 (7.2%) |
| $100,000+ | 200 (16.9%) | 38 (4.5%) |
| Total | 1,182 (100.0%) | 852 (100.0%) |
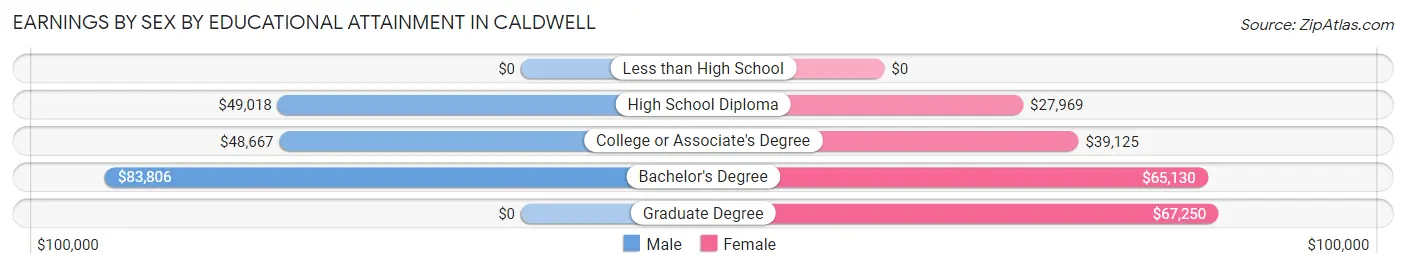
Earnings by Sex by Educational Attainment in Caldwell
Average earnings in Caldwell are $49,799 for men and $40,227 for women, a difference of 19.2%. Men with an educational attainment of bachelor's degree enjoy the highest average annual earnings of $83,806, while those with college or associate's degree education earn the least with $48,667. Women with an educational attainment of graduate degree earn the most with the average annual earnings of $67,250, while those with high school diploma education have the smallest earnings of $27,969.
| Educational Attainment | Male Income | Female Income |
| Less than High School | - | - |
| High School Diploma | $49,018 | $27,969 |
| College or Associate's Degree | $48,667 | $39,125 |
| Bachelor's Degree | $83,806 | $65,130 |
| Graduate Degree | - | - |
| Total | $49,799 | $40,227 |
Family Income in Caldwell
Family Income Brackets in Caldwell
According to the Caldwell family income data, there are 229 families falling into the $50,000 to $74,999 income range, which is the most common income bracket and makes up 23.0% of all families. Conversely, the $10,000 to $14,999 income bracket is the least frequent group with only 13 families (1.3%) belonging to this category.
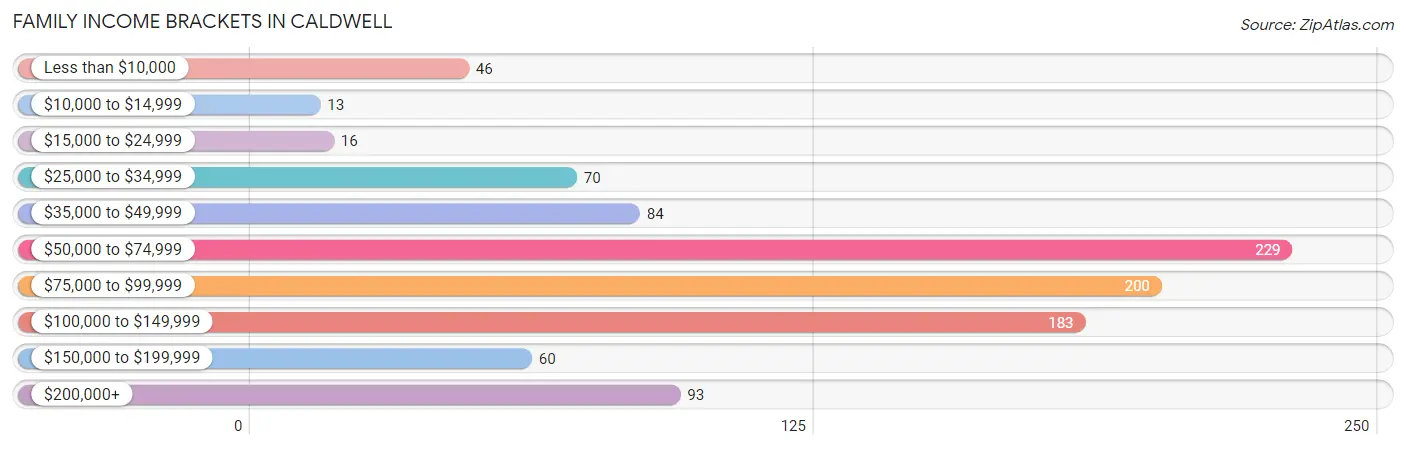
| Income Bracket | # Families | % Families |
| Less than $10,000 | 46 | 4.6% |
| $10,000 to $14,999 | 13 | 1.3% |
| $15,000 to $24,999 | 16 | 1.6% |
| $25,000 to $34,999 | 70 | 7.0% |
| $35,000 to $49,999 | 84 | 8.5% |
| $50,000 to $74,999 | 229 | 23.0% |
| $75,000 to $99,999 | 200 | 20.1% |
| $100,000 to $149,999 | 183 | 18.4% |
| $150,000 to $199,999 | 60 | 6.0% |
| $200,000+ | 93 | 9.4% |
Family Income by Famaliy Size in Caldwell
5-person families (112 | 11.3%) account for the highest median family income in Caldwell with $145,200 per family, while 3-person families (147 | 14.8%) have the highest median income of $32,175 per family member.
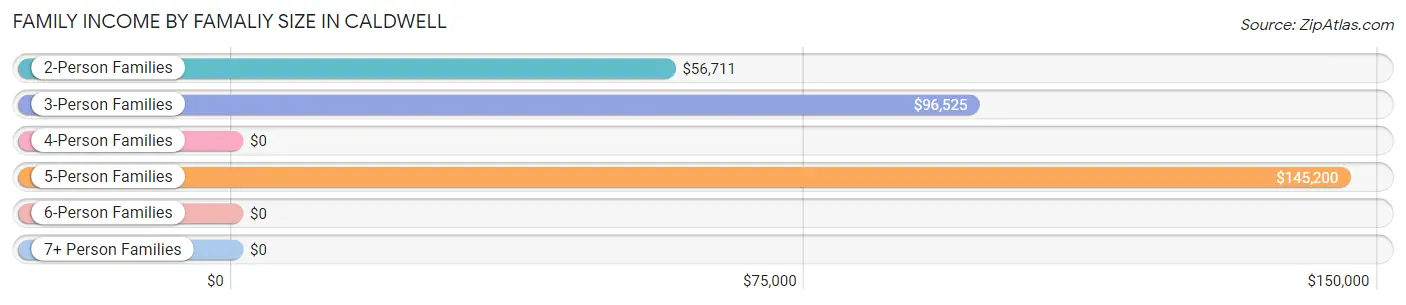
| Income Bracket | # Families | Median Income |
| 2-Person Families | 382 (38.4%) | $56,711 |
| 3-Person Families | 147 (14.8%) | $96,525 |
| 4-Person Families | 293 (29.5%) | $0 |
| 5-Person Families | 112 (11.3%) | $145,200 |
| 6-Person Families | 33 (3.3%) | $0 |
| 7+ Person Families | 27 (2.7%) | $0 |
| Total | 994 (100.0%) | $79,167 |
Family Income by Number of Earners in Caldwell
The median family income in Caldwell is $79,167, with families comprising 3+ earners (162) having the highest median family income of $110,242, while families with no earners (140) have the lowest median family income of $37,885, accounting for 16.3% and 14.1% of families, respectively.
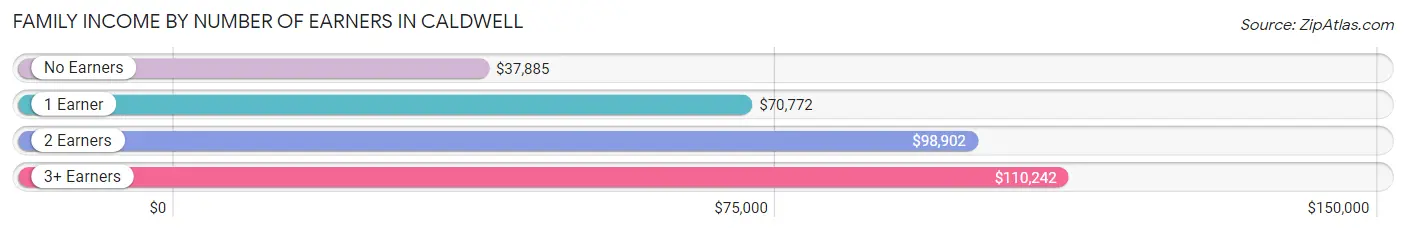
| Number of Earners | # Families | Median Income |
| No Earners | 140 (14.1%) | $37,885 |
| 1 Earner | 325 (32.7%) | $70,772 |
| 2 Earners | 367 (36.9%) | $98,902 |
| 3+ Earners | 162 (16.3%) | $110,242 |
| Total | 994 (100.0%) | $79,167 |
Household Income in Caldwell
Household Income Brackets in Caldwell
With 341 households falling in the category, the $50,000 to $74,999 income range is the most frequent in Caldwell, accounting for 21.0% of all households. In contrast, only 58 households (3.6%) fall into the less than $10,000 income bracket, making it the least populous group.
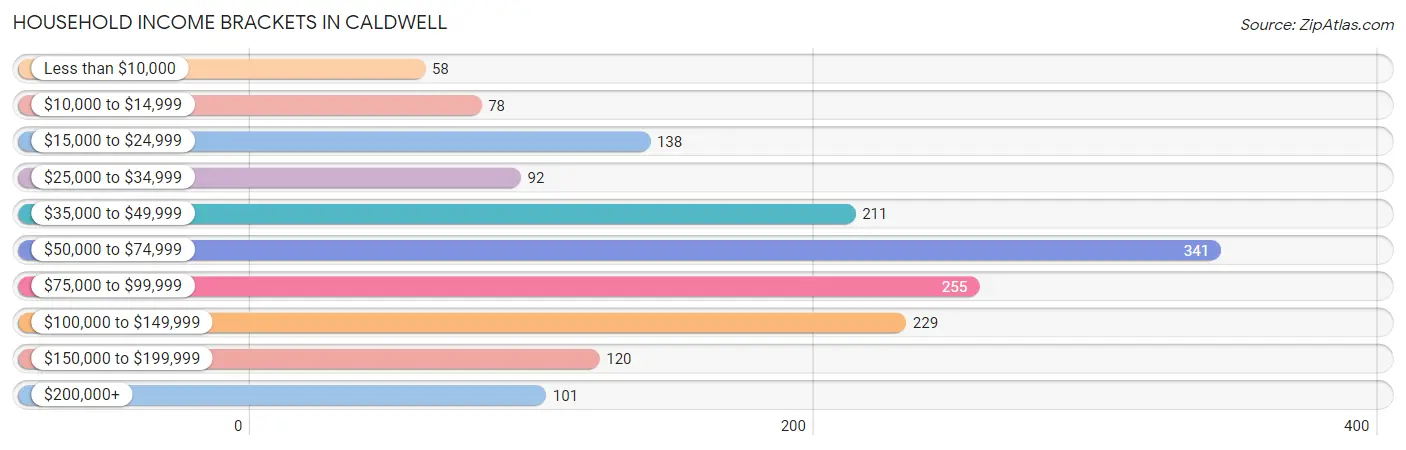
| Income Bracket | # Households | % Households |
| Less than $10,000 | 58 | 3.6% |
| $10,000 to $14,999 | 78 | 4.8% |
| $15,000 to $24,999 | 138 | 8.5% |
| $25,000 to $34,999 | 92 | 5.7% |
| $35,000 to $49,999 | 211 | 13.0% |
| $50,000 to $74,999 | 341 | 21.0% |
| $75,000 to $99,999 | 255 | 15.7% |
| $100,000 to $149,999 | 229 | 14.1% |
| $150,000 to $199,999 | 120 | 7.4% |
| $200,000+ | 101 | 6.2% |
Household Income by Householder Age in Caldwell
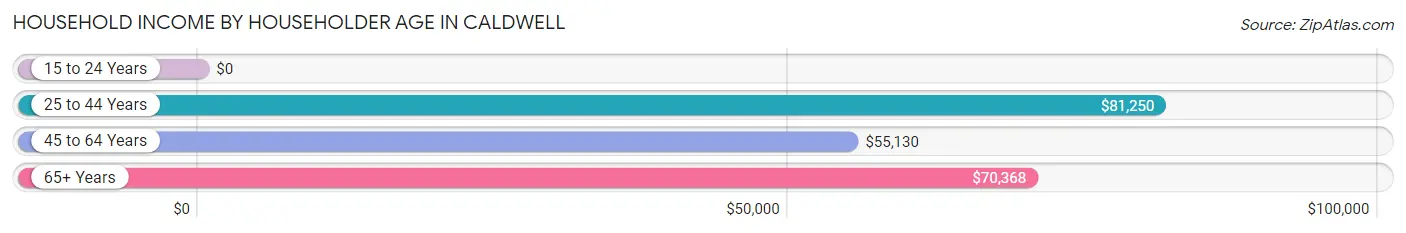
The median household income in Caldwell is $57,222, with the highest median household income of $81,250 found in the 25 to 44 years age bracket for the primary householder. A total of 491 households (30.3%) fall into this category. Meanwhile, the 15 to 24 years age bracket for the primary householder has the lowest median household income of $0, with 76 households (4.7%) in this group.
| Income Bracket | # Households | Median Income |
| 15 to 24 Years | 76 (4.7%) | $0 |
| 25 to 44 Years | 491 (30.3%) | $81,250 |
| 45 to 64 Years | 679 (41.9%) | $55,130 |
| 65+ Years | 376 (23.2%) | $70,368 |
| Total | 1,622 (100.0%) | $57,222 |
Poverty in Caldwell
Income Below Poverty by Sex and Age in Caldwell
With 9.4% poverty level for males and 19.9% for females among the residents of Caldwell, 5 year old males and 15 year old females are the most vulnerable to poverty, with 45 males (100.0%) and 15 females (100.0%) in their respective age groups living below the poverty level.
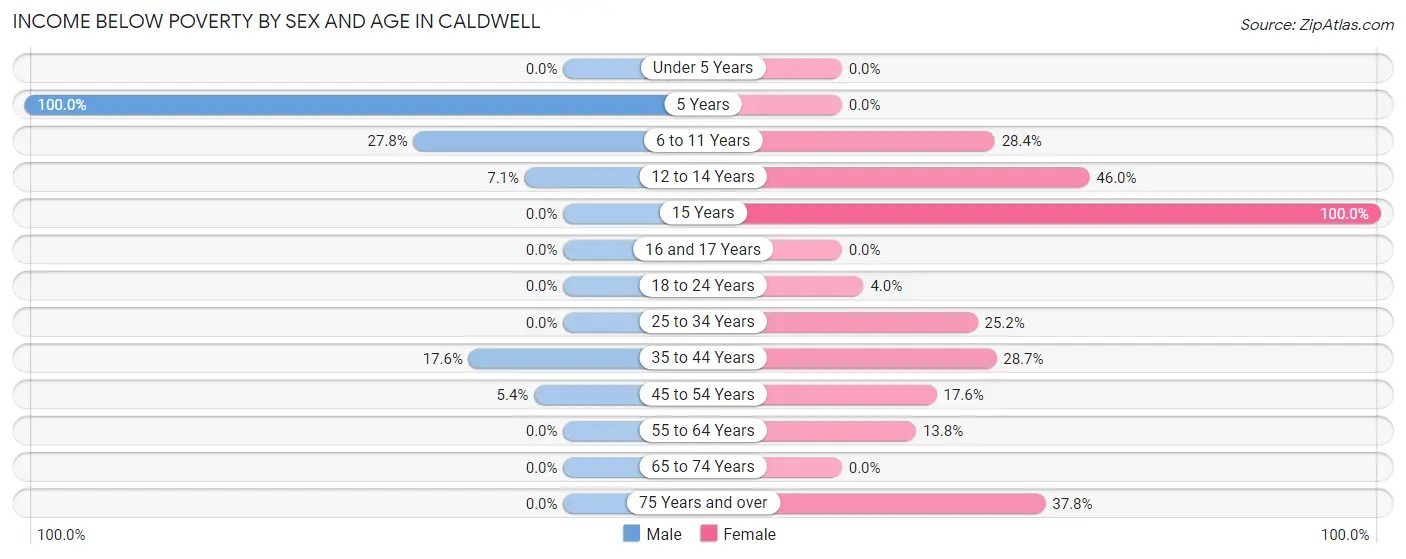
| Age Bracket | Male | Female |
| Under 5 Years | 0 (0.0%) | 0 (0.0%) |
| 5 Years | 45 (100.0%) | 0 (0.0%) |
| 6 to 11 Years | 67 (27.8%) | 42 (28.4%) |
| 12 to 14 Years | 4 (7.1%) | 51 (46.0%) |
| 15 Years | 0 (0.0%) | 15 (100.0%) |
| 16 and 17 Years | 0 (0.0%) | 0 (0.0%) |
| 18 to 24 Years | 0 (0.0%) | 5 (4.0%) |
| 25 to 34 Years | 0 (0.0%) | 62 (25.2%) |
| 35 to 44 Years | 49 (17.6%) | 74 (28.7%) |
| 45 to 54 Years | 17 (5.4%) | 58 (17.6%) |
| 55 to 64 Years | 0 (0.0%) | 34 (13.8%) |
| 65 to 74 Years | 0 (0.0%) | 0 (0.0%) |
| 75 Years and over | 0 (0.0%) | 51 (37.8%) |
| Total | 182 (9.4%) | 392 (19.9%) |
Income Above Poverty by Sex and Age in Caldwell
According to the poverty statistics in Caldwell, males aged under 5 years and females aged under 5 years are the age groups that are most secure financially, with 100.0% of males and 100.0% of females in these age groups living above the poverty line.
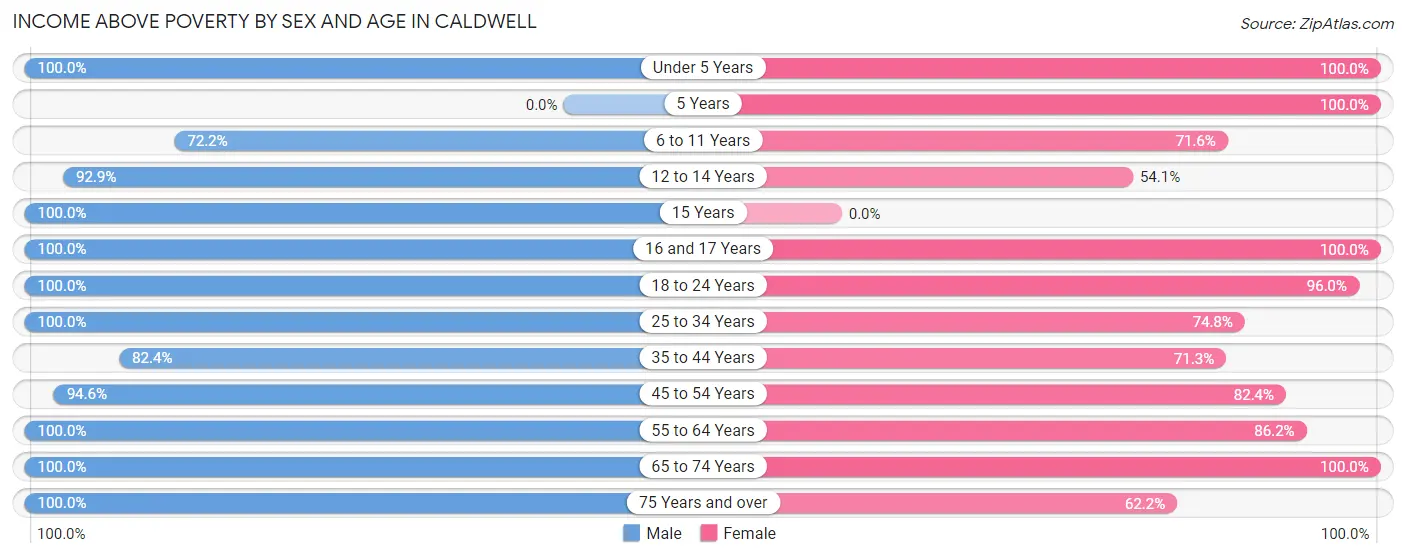
| Age Bracket | Male | Female |
| Under 5 Years | 155 (100.0%) | 91 (100.0%) |
| 5 Years | 0 (0.0%) | 68 (100.0%) |
| 6 to 11 Years | 174 (72.2%) | 106 (71.6%) |
| 12 to 14 Years | 52 (92.9%) | 60 (54.0%) |
| 15 Years | 5 (100.0%) | 0 (0.0%) |
| 16 and 17 Years | 62 (100.0%) | 52 (100.0%) |
| 18 to 24 Years | 127 (100.0%) | 119 (96.0%) |
| 25 to 34 Years | 211 (100.0%) | 184 (74.8%) |
| 35 to 44 Years | 230 (82.4%) | 184 (71.3%) |
| 45 to 54 Years | 297 (94.6%) | 272 (82.4%) |
| 55 to 64 Years | 222 (100.0%) | 213 (86.2%) |
| 65 to 74 Years | 135 (100.0%) | 143 (100.0%) |
| 75 Years and over | 92 (100.0%) | 84 (62.2%) |
| Total | 1,762 (90.6%) | 1,576 (80.1%) |
Income Below Poverty Among Married-Couple Families in Caldwell
The poverty statistics for married-couple families in Caldwell show that 10.1% or 79 of the total 784 families live below the poverty line. Families with 1 or 2 children have the highest poverty rate of 22.6%, comprising of 79 families. On the other hand, families with no children have the lowest poverty rate of 0.0%, which includes 0 families.
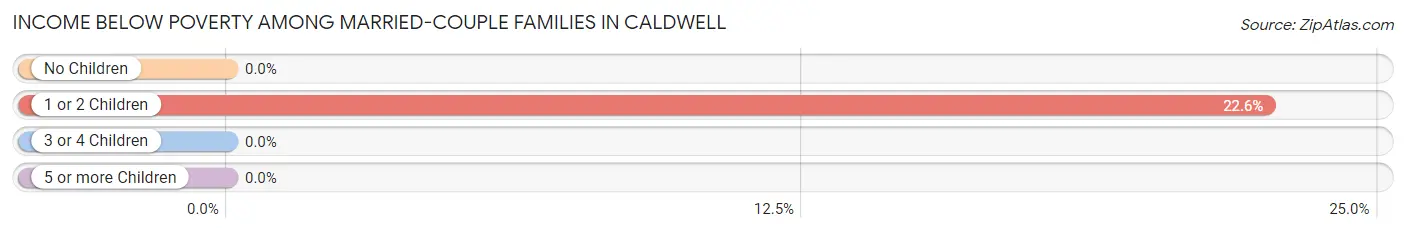
| Children | Above Poverty | Below Poverty |
| No Children | 316 (100.0%) | 0 (0.0%) |
| 1 or 2 Children | 271 (77.4%) | 79 (22.6%) |
| 3 or 4 Children | 118 (100.0%) | 0 (0.0%) |
| 5 or more Children | 0 (0.0%) | 0 (0.0%) |
| Total | 705 (89.9%) | 79 (10.1%) |
Income Below Poverty Among Single-Parent Households in Caldwell
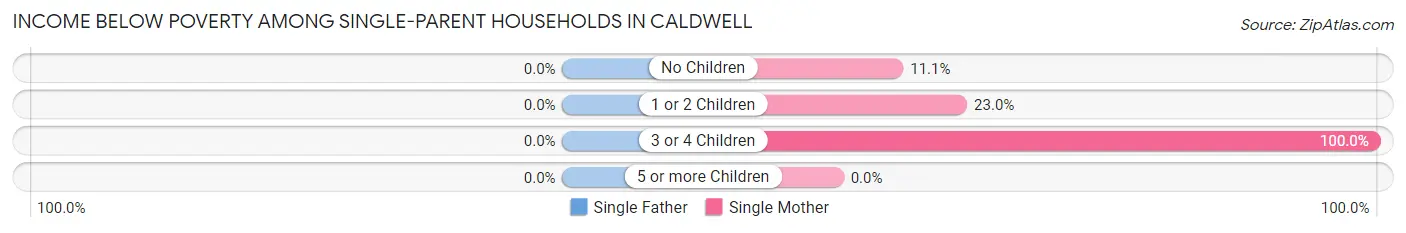
| Children | Single Father | Single Mother |
| No Children | 0 (0.0%) | 9 (11.1%) |
| 1 or 2 Children | 0 (0.0%) | 23 (23.0%) |
| 3 or 4 Children | 0 (0.0%) | 19 (100.0%) |
| 5 or more Children | 0 (0.0%) | 0 (0.0%) |
| Total | 0 (0.0%) | 51 (25.5%) |
Income Below Poverty Among Married-Couple vs Single-Parent Households in Caldwell
The poverty data for Caldwell shows that 79 of the married-couple family households (10.1%) and 51 of the single-parent households (24.3%) are living below the poverty level. Within the married-couple family households, those with 1 or 2 children have the highest poverty rate, with 79 households (22.6%) falling below the poverty line. Among the single-parent households, those with 3 or 4 children have the highest poverty rate, with 19 household (100.0%) living below poverty.
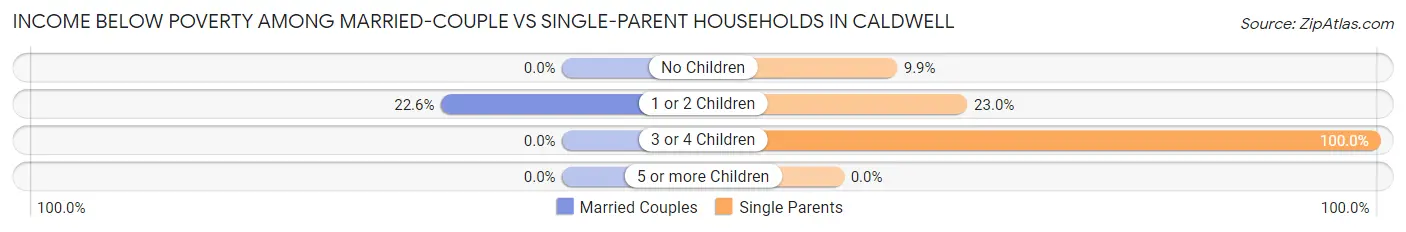
| Children | Married-Couple Families | Single-Parent Households |
| No Children | 0 (0.0%) | 9 (9.9%) |
| 1 or 2 Children | 79 (22.6%) | 23 (23.0%) |
| 3 or 4 Children | 0 (0.0%) | 19 (100.0%) |
| 5 or more Children | 0 (0.0%) | 0 (0.0%) |
| Total | 79 (10.1%) | 51 (24.3%) |
Race in Caldwell
The most populous races in Caldwell are White / Caucasian (2,733 | 66.3%), Hispanic or Latino (1,081 | 26.2%), and Black / African American (621 | 15.1%).
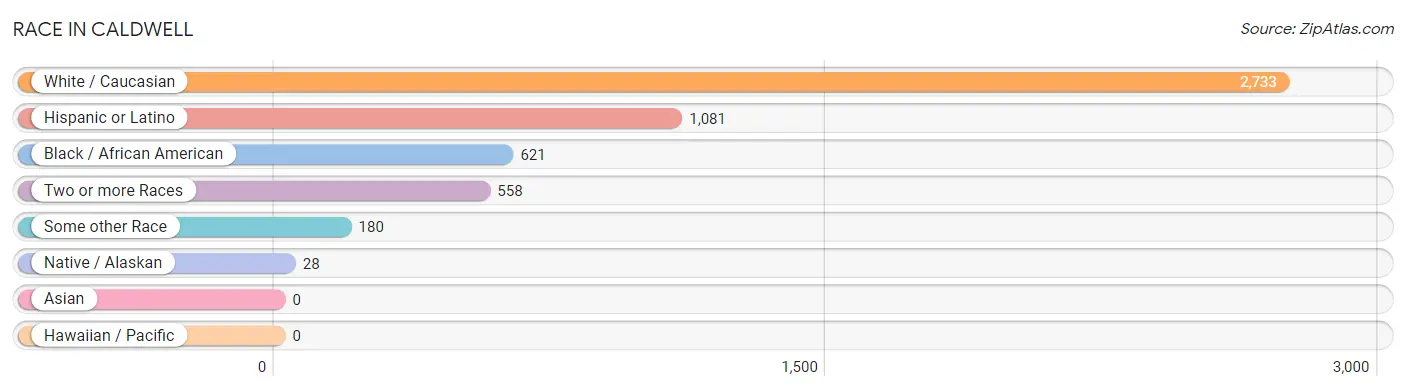
| Race | # Population | % Population |
| Asian | 0 | 0.0% |
| Black / African American | 621 | 15.1% |
| Hawaiian / Pacific | 0 | 0.0% |
| Hispanic or Latino | 1,081 | 26.2% |
| Native / Alaskan | 28 | 0.7% |
| White / Caucasian | 2,733 | 66.3% |
| Two or more Races | 558 | 13.5% |
| Some other Race | 180 | 4.4% |
| Total | 4,120 | 100.0% |
Ancestry in Caldwell
The most populous ancestries reported in Caldwell are Mexican (861 | 20.9%), German (567 | 13.8%), English (332 | 8.1%), Czech (313 | 7.6%), and Irish (276 | 6.7%), together accounting for 57.0% of all Caldwell residents.
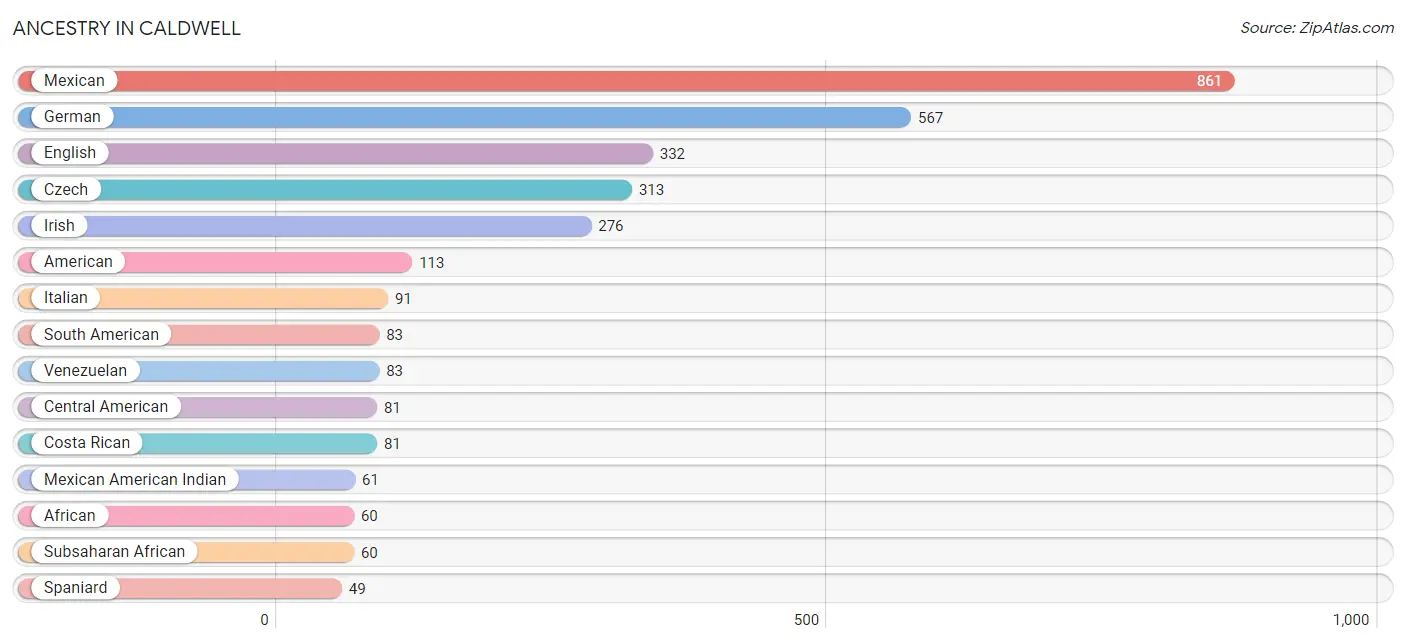
| Ancestry | # Population | % Population |
| African | 60 | 1.5% |
| American | 113 | 2.7% |
| Burmese | 21 | 0.5% |
| Central American | 81 | 2.0% |
| Cherokee | 25 | 0.6% |
| Costa Rican | 81 | 2.0% |
| Czech | 313 | 7.6% |
| Dutch | 28 | 0.7% |
| English | 332 | 8.1% |
| French | 46 | 1.1% |
| German | 567 | 13.8% |
| Greek | 13 | 0.3% |
| Guyanese | 6 | 0.2% |
| Irish | 276 | 6.7% |
| Italian | 91 | 2.2% |
| Mexican | 861 | 20.9% |
| Mexican American Indian | 61 | 1.5% |
| Polish | 13 | 0.3% |
| Puerto Rican | 7 | 0.2% |
| Scandinavian | 13 | 0.3% |
| Scotch-Irish | 39 | 0.9% |
| Scottish | 30 | 0.7% |
| South American | 83 | 2.0% |
| Spaniard | 49 | 1.2% |
| Subsaharan African | 60 | 1.5% |
| Swiss | 7 | 0.2% |
| Venezuelan | 83 | 2.0% |
| Yaqui | 13 | 0.3% | View All 28 Rows |
Immigrants in Caldwell
The most numerous immigrant groups reported in Caldwell came from Latin America (439 | 10.7%), Central America (356 | 8.6%), Mexico (263 | 6.4%), South America (83 | 2.0%), and Venezuela (83 | 2.0%), together accounting for 29.7% of all Caldwell residents.
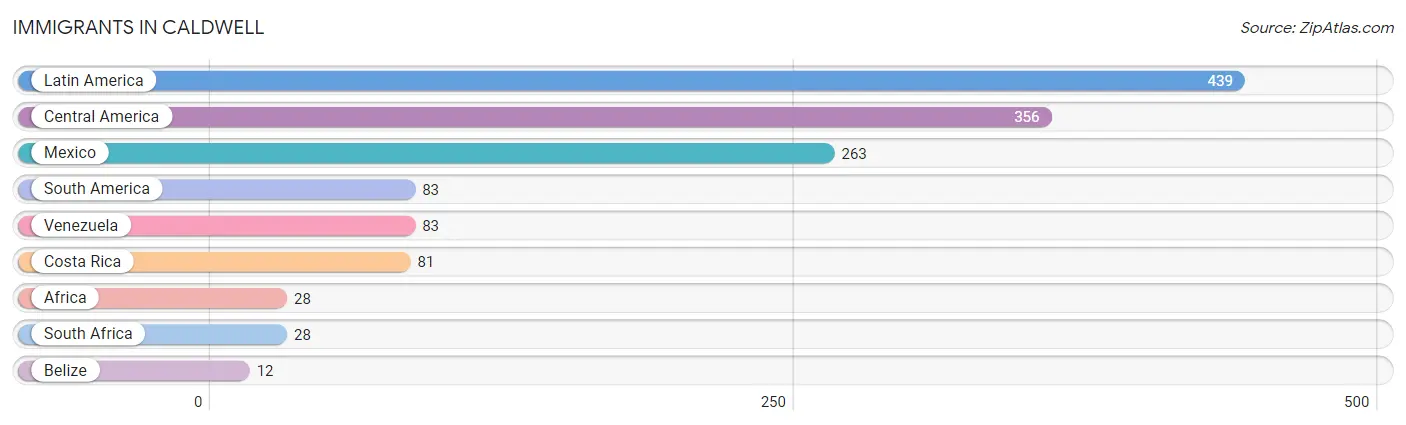
| Immigration Origin | # Population | % Population |
| Africa | 28 | 0.7% |
| Belize | 12 | 0.3% |
| Central America | 356 | 8.6% |
| Costa Rica | 81 | 2.0% |
| Latin America | 439 | 10.7% |
| Mexico | 263 | 6.4% |
| South Africa | 28 | 0.7% |
| South America | 83 | 2.0% |
| Venezuela | 83 | 2.0% | View All 9 Rows |
Sex and Age in Caldwell
Sex and Age in Caldwell
The most populous age groups in Caldwell are 50 to 54 Years (229 | 11.0%) for men and 45 to 49 Years (214 | 10.5%) for women.
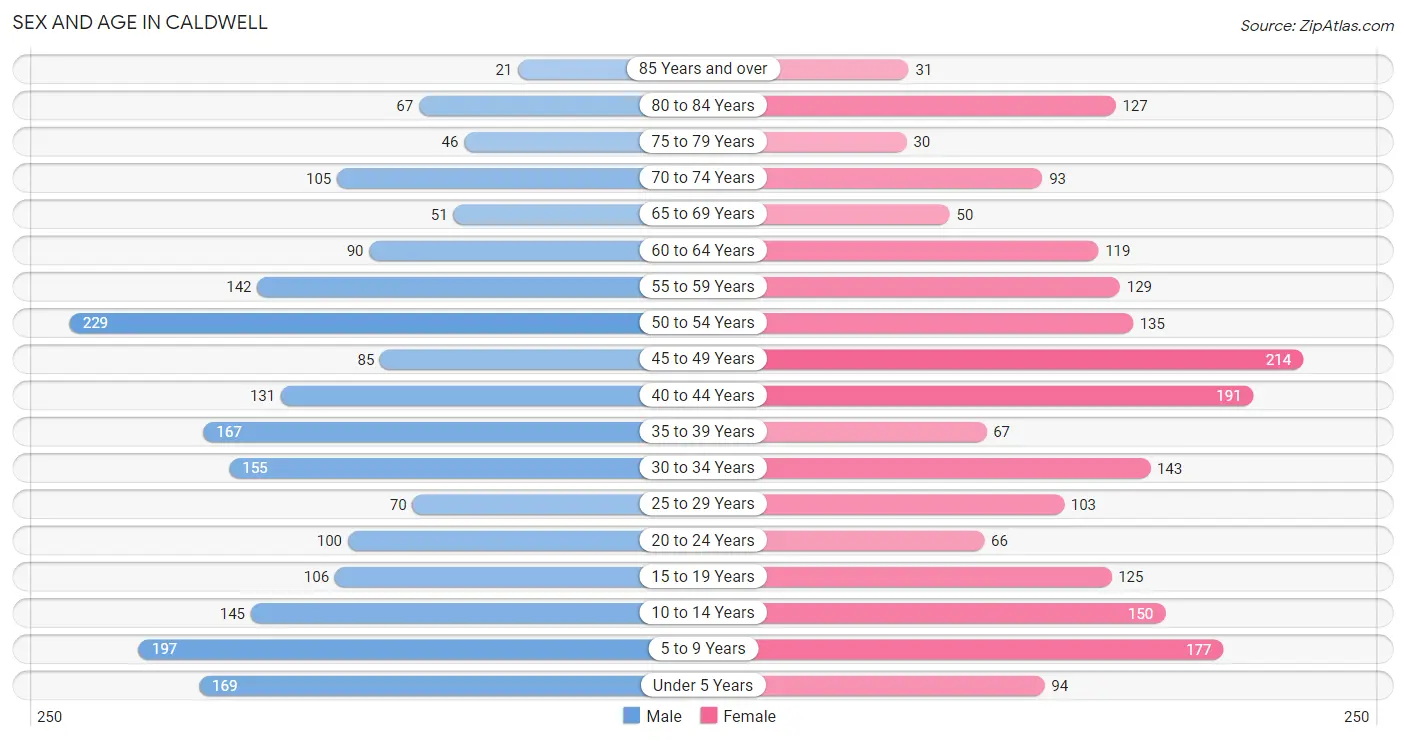
| Age Bracket | Male | Female |
| Under 5 Years | 169 (8.1%) | 94 (4.6%) |
| 5 to 9 Years | 197 (9.5%) | 177 (8.7%) |
| 10 to 14 Years | 145 (7.0%) | 150 (7.3%) |
| 15 to 19 Years | 106 (5.1%) | 125 (6.1%) |
| 20 to 24 Years | 100 (4.8%) | 66 (3.2%) |
| 25 to 29 Years | 70 (3.4%) | 103 (5.0%) |
| 30 to 34 Years | 155 (7.5%) | 143 (7.0%) |
| 35 to 39 Years | 167 (8.0%) | 67 (3.3%) |
| 40 to 44 Years | 131 (6.3%) | 191 (9.3%) |
| 45 to 49 Years | 85 (4.1%) | 214 (10.5%) |
| 50 to 54 Years | 229 (11.0%) | 135 (6.6%) |
| 55 to 59 Years | 142 (6.8%) | 129 (6.3%) |
| 60 to 64 Years | 90 (4.3%) | 119 (5.8%) |
| 65 to 69 Years | 51 (2.5%) | 50 (2.5%) |
| 70 to 74 Years | 105 (5.1%) | 93 (4.5%) |
| 75 to 79 Years | 46 (2.2%) | 30 (1.5%) |
| 80 to 84 Years | 67 (3.2%) | 127 (6.2%) |
| 85 Years and over | 21 (1.0%) | 31 (1.5%) |
| Total | 2,076 (100.0%) | 2,044 (100.0%) |
Families and Households in Caldwell
Median Family Size in Caldwell
The median family size in Caldwell is 3.18 persons per family, with married-couple families (784 | 78.9%) accounting for the largest median family size of 3.46 persons per family. On the other hand, single male/father families (10 | 1.0%) represent the smallest median family size with 1.70 persons per family.
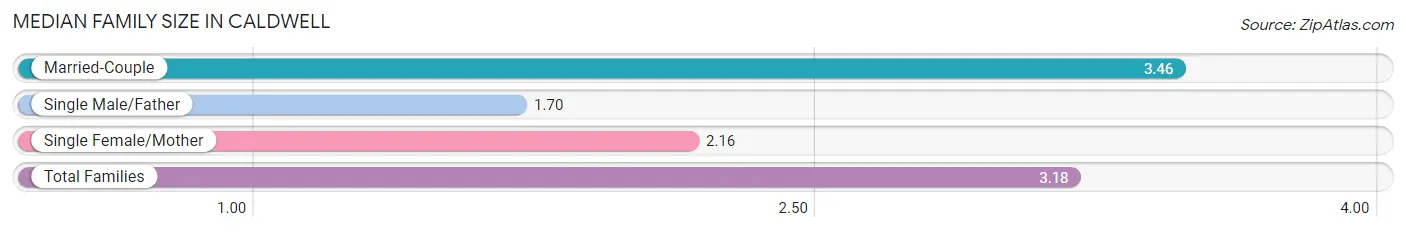
| Family Type | # Families | Family Size |
| Married-Couple | 784 (78.9%) | 3.46 |
| Single Male/Father | 10 (1.0%) | 1.70 |
| Single Female/Mother | 200 (20.1%) | 2.16 |
| Total Families | 994 (100.0%) | 3.18 |
Median Household Size in Caldwell
The median household size in Caldwell is 2.42 persons per household, with married-couple households (784 | 48.3%) accounting for the largest median household size of 3.47 persons per household. non-family households (628 | 38.7%) represent the smallest median household size with 1.13 persons per household.
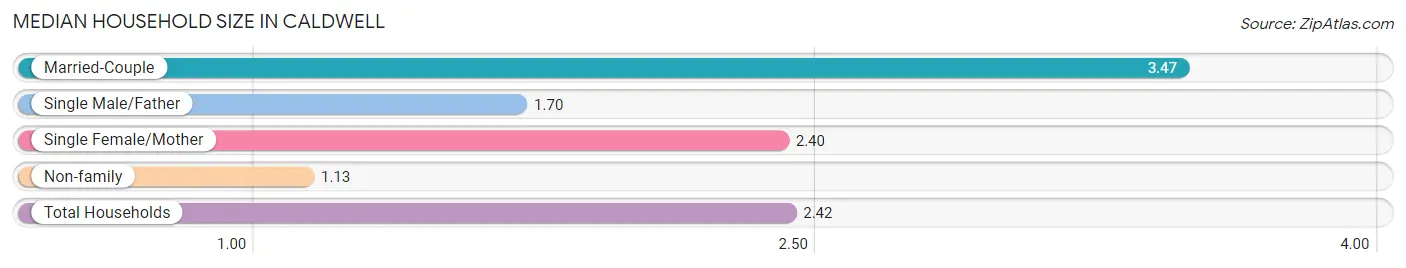
| Household Type | # Households | Household Size |
| Married-Couple | 784 (48.3%) | 3.47 |
| Single Male/Father | 10 (0.6%) | 1.70 |
| Single Female/Mother | 200 (12.3%) | 2.40 |
| Non-family | 628 (38.7%) | 1.13 |
| Total Households | 1,622 (100.0%) | 2.42 |
Household Size by Marriage Status in Caldwell
Out of a total of 1,622 households in Caldwell, 994 (61.3%) are family households, while 628 (38.7%) are nonfamily households. The most numerous type of family households are 2-person households, comprising 382, and the most common type of nonfamily households are 1-person households, comprising 494.
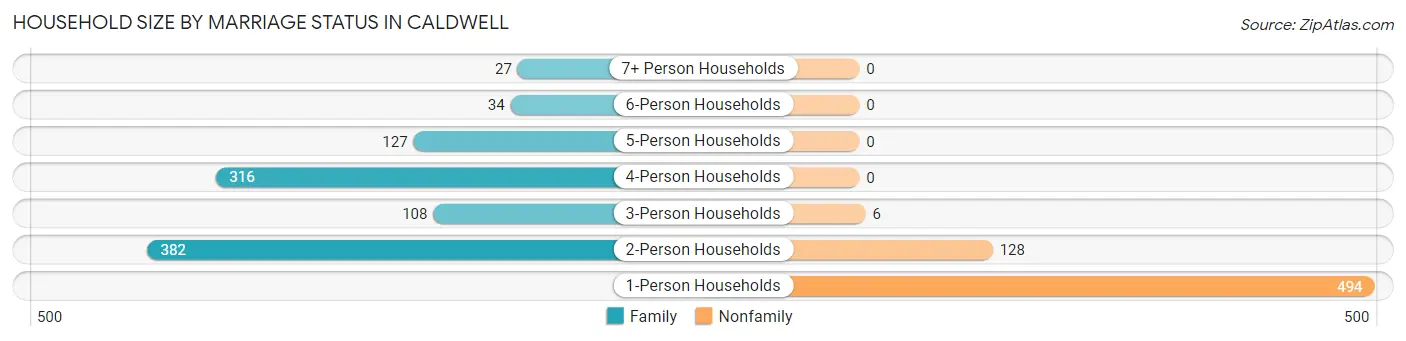
| Household Size | Family Households | Nonfamily Households |
| 1-Person Households | - | 494 (30.5%) |
| 2-Person Households | 382 (23.5%) | 128 (7.9%) |
| 3-Person Households | 108 (6.7%) | 6 (0.4%) |
| 4-Person Households | 316 (19.5%) | 0 (0.0%) |
| 5-Person Households | 127 (7.8%) | 0 (0.0%) |
| 6-Person Households | 34 (2.1%) | 0 (0.0%) |
| 7+ Person Households | 27 (1.7%) | 0 (0.0%) |
| Total | 994 (61.3%) | 628 (38.7%) |
Female Fertility in Caldwell
Fertility by Age in Caldwell
Average fertility rate in Caldwell is 26.0 births per 1,000 women. Women in the age bracket of 20 to 34 years have the highest fertility rate with 77.0 births per 1,000 women. Women in the age bracket of 20 to 34 years acount for 100.0% of all women with births.
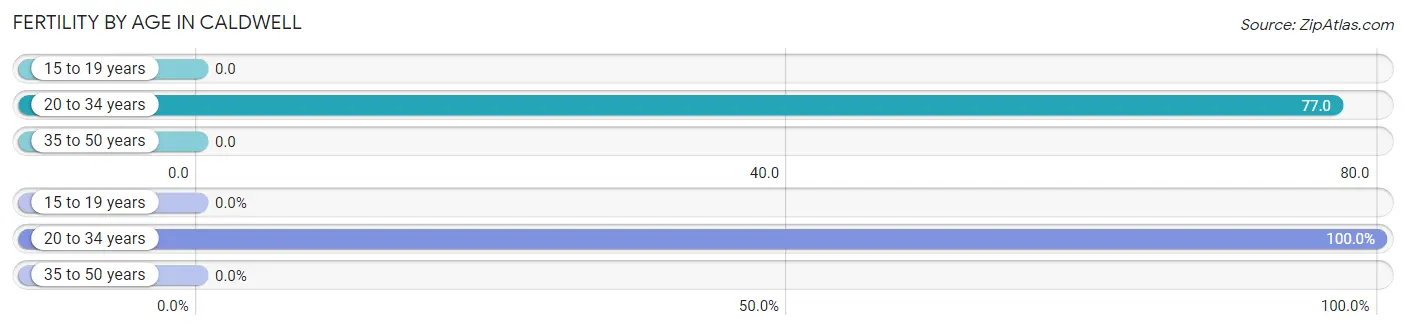
| Age Bracket | Women with Births | Births / 1,000 Women |
| 15 to 19 years | 0 (0.0%) | 0.0 |
| 20 to 34 years | 24 (100.0%) | 77.0 |
| 35 to 50 years | 0 (0.0%) | 0.0 |
| Total | 24 (100.0%) | 26.0 |
Fertility by Age by Marriage Status in Caldwell
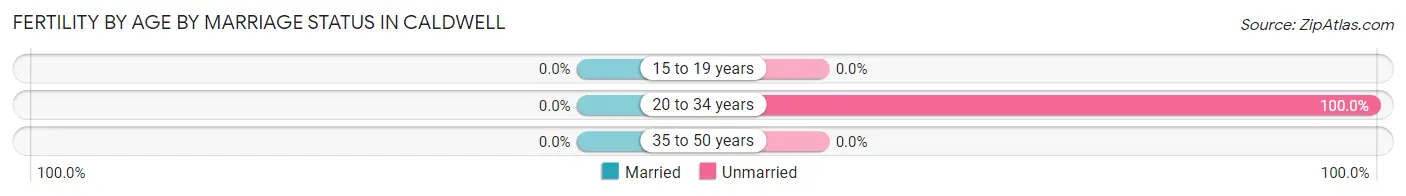
| Age Bracket | Married | Unmarried |
| 15 to 19 years | 0 (0.0%) | 0 (0.0%) |
| 20 to 34 years | 0 (0.0%) | 24 (100.0%) |
| 35 to 50 years | 0 (0.0%) | 0 (0.0%) |
| Total | 0 (0.0%) | 24 (100.0%) |
Fertility by Education in Caldwell
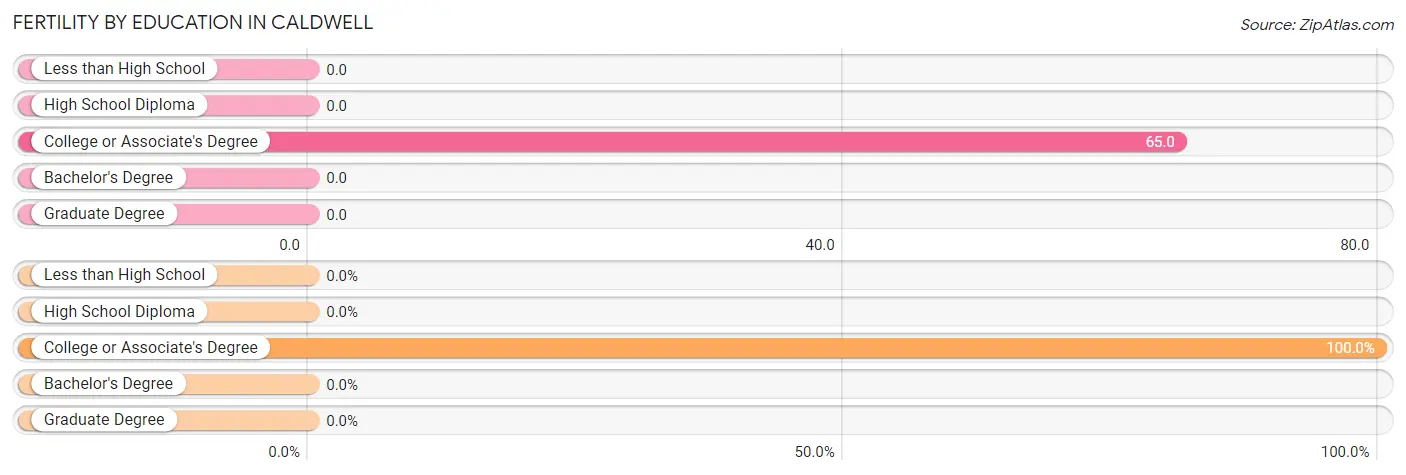
| Educational Attainment | Women with Births | Births / 1,000 Women |
| Less than High School | 0 (0.0%) | 0.0 |
| High School Diploma | 0 (0.0%) | 0.0 |
| College or Associate's Degree | 24 (100.0%) | 65.0 |
| Bachelor's Degree | 0 (0.0%) | 0.0 |
| Graduate Degree | 0 (0.0%) | 0.0 |
| Total | 24 (100.0%) | 26.0 |
Fertility by Education by Marriage Status in Caldwell
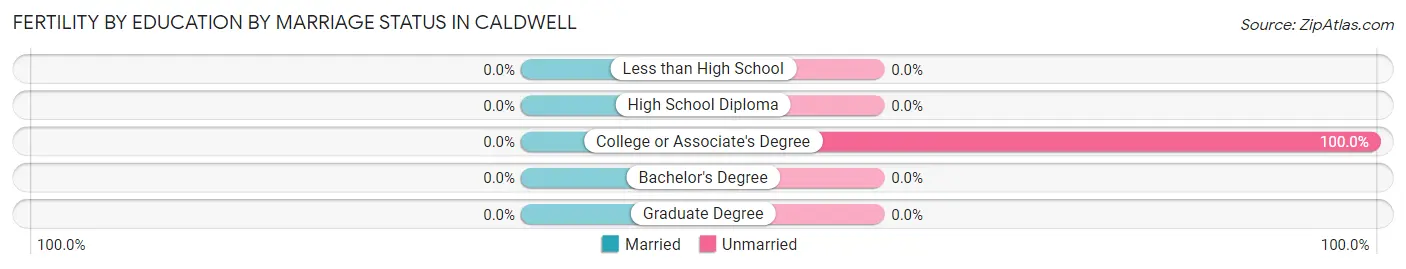
| Educational Attainment | Married | Unmarried |
| Less than High School | 0 (0.0%) | 0 (0.0%) |
| High School Diploma | 0 (0.0%) | 0 (0.0%) |
| College or Associate's Degree | 0 (0.0%) | 24 (100.0%) |
| Bachelor's Degree | 0 (0.0%) | 0 (0.0%) |
| Graduate Degree | 0 (0.0%) | 0 (0.0%) |
| Total | 0 (0.0%) | 24 (100.0%) |
Employment Characteristics in Caldwell
Employment by Class of Employer in Caldwell
Among the 1,823 employed individuals in Caldwell, private company employees (1,170 | 64.2%), local government employees (258 | 14.1%), and state government employees (210 | 11.5%) make up the most common classes of employment.
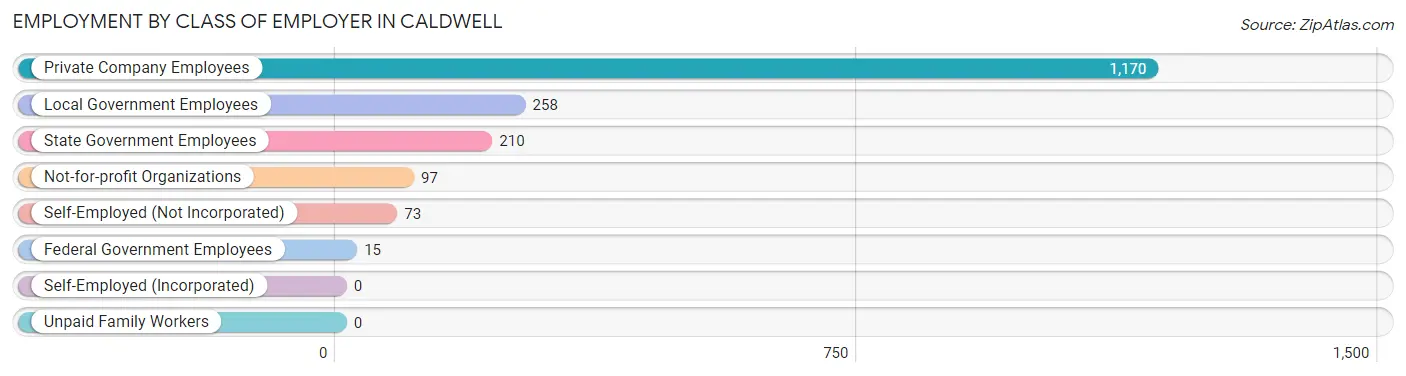
| Employer Class | # Employees | % Employees |
| Private Company Employees | 1,170 | 64.2% |
| Self-Employed (Incorporated) | 0 | 0.0% |
| Self-Employed (Not Incorporated) | 73 | 4.0% |
| Not-for-profit Organizations | 97 | 5.3% |
| Local Government Employees | 258 | 14.1% |
| State Government Employees | 210 | 11.5% |
| Federal Government Employees | 15 | 0.8% |
| Unpaid Family Workers | 0 | 0.0% |
| Total | 1,823 | 100.0% |
Employment Status by Age in Caldwell
According to the labor force statistics for Caldwell, out of the total population over 16 years of age (3,168), 59.8% or 1,894 individuals are in the labor force, with 0.2% or 4 of them unemployed. The age group with the highest labor force participation rate is 30 to 34 years, with 96.6% or 288 individuals in the labor force. Within the labor force, the 45 to 54 years age range has the highest percentage of unemployed individuals, with 0.8% or 4 of them being unemployed.
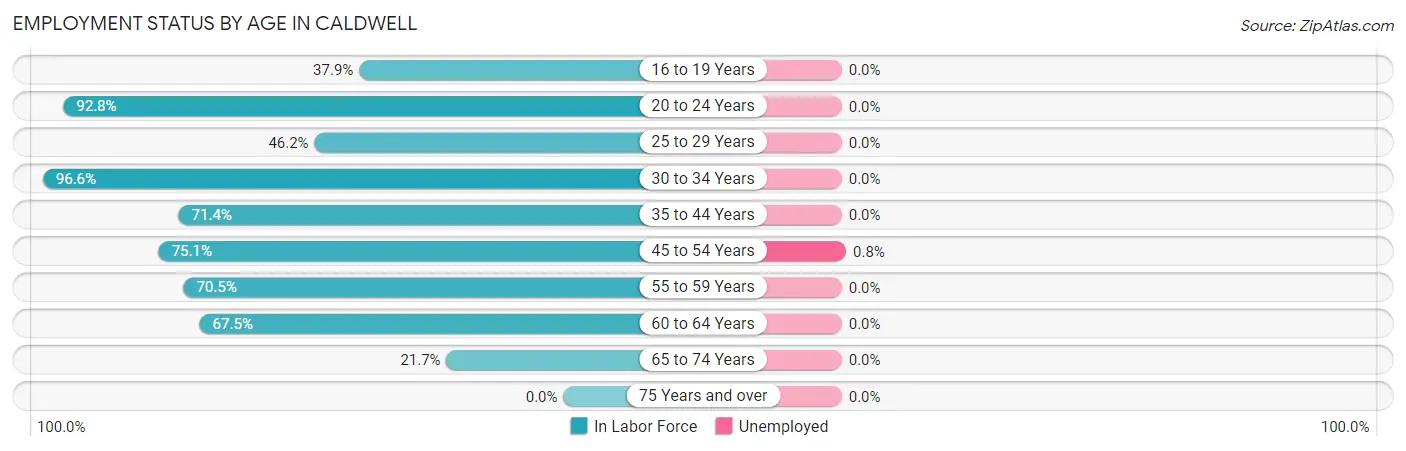
| Age Bracket | In Labor Force | Unemployed |
| 16 to 19 Years | 80 (37.9%) | 0 (0.0%) |
| 20 to 24 Years | 154 (92.8%) | 0 (0.0%) |
| 25 to 29 Years | 80 (46.2%) | 0 (0.0%) |
| 30 to 34 Years | 288 (96.6%) | 0 (0.0%) |
| 35 to 44 Years | 397 (71.4%) | 0 (0.0%) |
| 45 to 54 Years | 498 (75.1%) | 4 (0.8%) |
| 55 to 59 Years | 191 (70.5%) | 0 (0.0%) |
| 60 to 64 Years | 141 (67.5%) | 0 (0.0%) |
| 65 to 74 Years | 65 (21.7%) | 0 (0.0%) |
| 75 Years and over | 0 (0.0%) | 0 (0.0%) |
| Total | 1,894 (59.8%) | 4 (0.2%) |
Employment Status by Educational Attainment in Caldwell
According to labor force statistics for Caldwell, 73.5% of individuals (1,595) out of the total population between 25 and 64 years of age (2,170) are in the labor force, with 0.3% or 5 of them being unemployed. The group with the highest labor force participation rate are those with the educational attainment of bachelor's degree or higher, with 90.7% or 458 individuals in the labor force. Within the labor force, individuals with college / associate degree education have the highest percentage of unemployment, with 0.7% or 4 of them being unemployed.
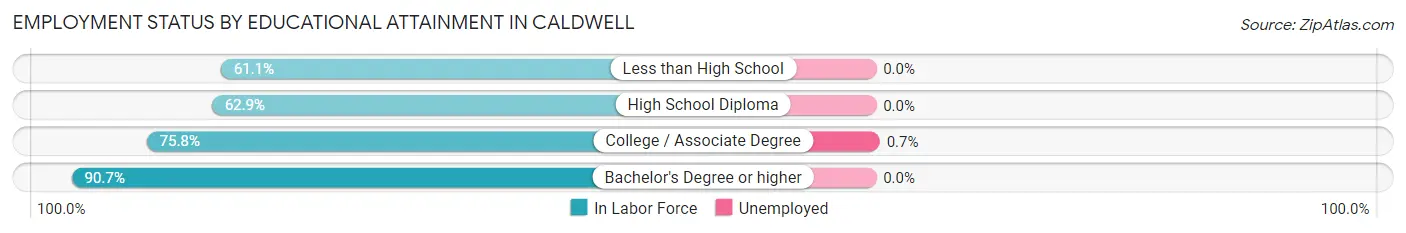
| Educational Attainment | In Labor Force | Unemployed |
| Less than High School | 162 (61.1%) | 0 (0.0%) |
| High School Diploma | 421 (62.9%) | 0 (0.0%) |
| College / Associate Degree | 554 (75.8%) | 5 (0.7%) |
| Bachelor's Degree or higher | 458 (90.7%) | 0 (0.0%) |
| Total | 1,595 (73.5%) | 7 (0.3%) |
Employment Occupations by Sex in Caldwell
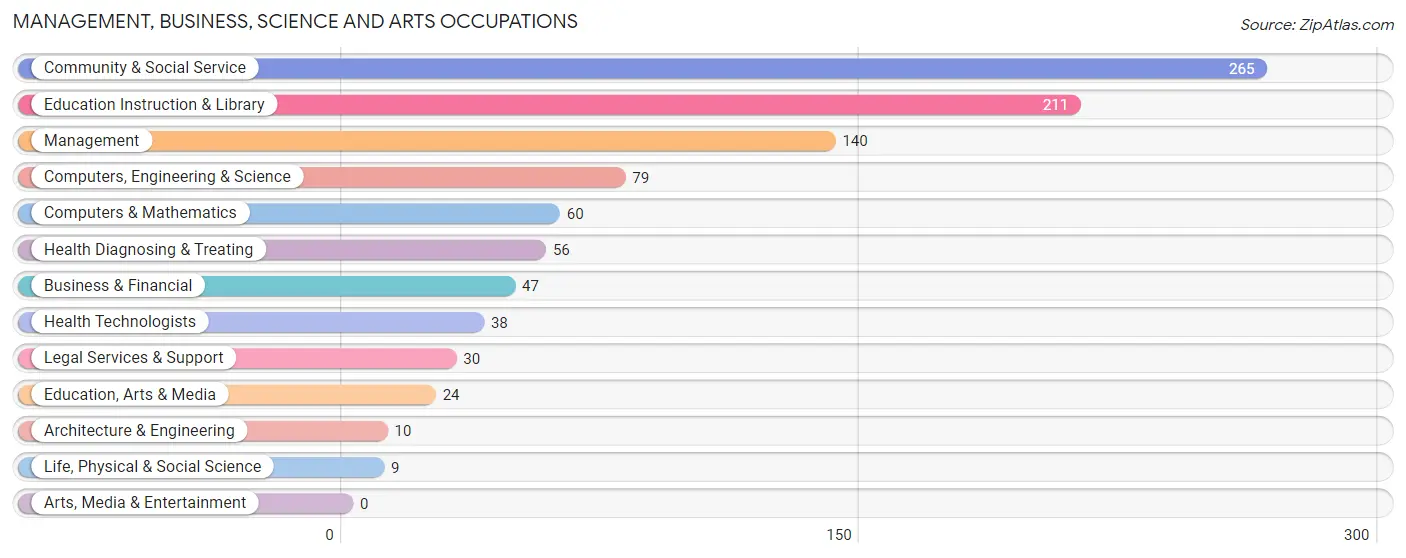
Management, Business, Science and Arts Occupations
The most common Management, Business, Science and Arts occupations in Caldwell are Community & Social Service (265 | 14.0%), Education Instruction & Library (211 | 11.2%), Management (140 | 7.4%), Computers, Engineering & Science (79 | 4.2%), and Computers & Mathematics (60 | 3.2%).
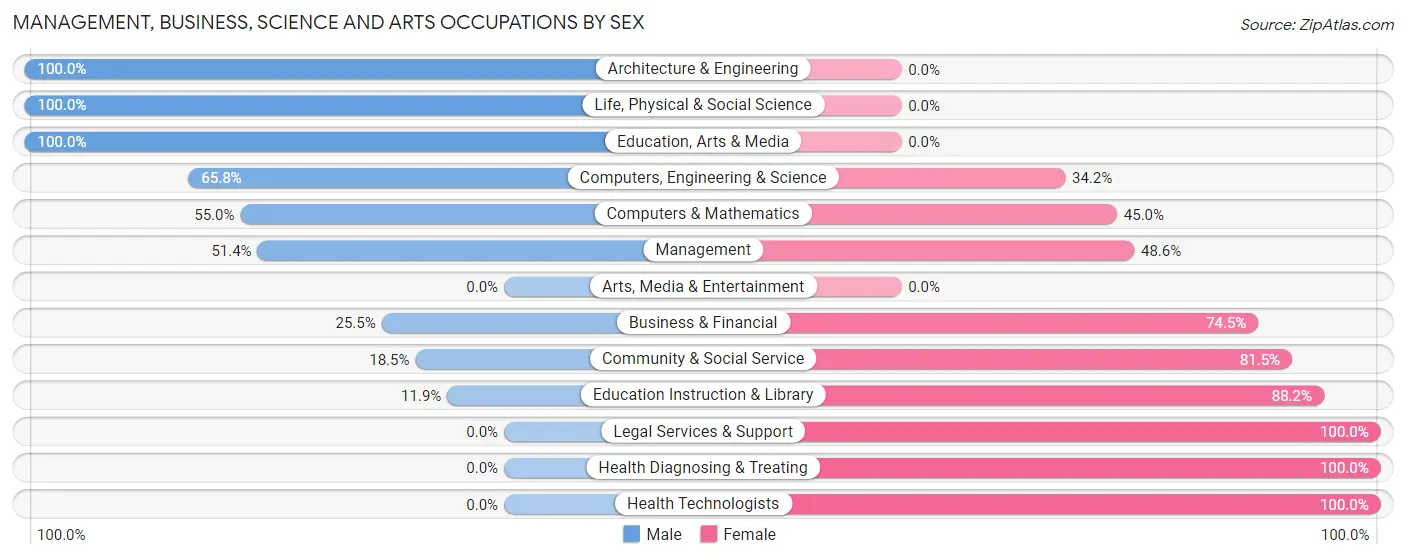
Management, Business, Science and Arts Occupations by Sex
Within the Management, Business, Science and Arts occupations in Caldwell, the most male-oriented occupations are Architecture & Engineering (100.0%), Life, Physical & Social Science (100.0%), and Education, Arts & Media (100.0%), while the most female-oriented occupations are Legal Services & Support (100.0%), Health Diagnosing & Treating (100.0%), and Health Technologists (100.0%).
| Occupation | Male | Female |
| Management | 72 (51.4%) | 68 (48.6%) |
| Business & Financial | 12 (25.5%) | 35 (74.5%) |
| Computers, Engineering & Science | 52 (65.8%) | 27 (34.2%) |
| Computers & Mathematics | 33 (55.0%) | 27 (45.0%) |
| Architecture & Engineering | 10 (100.0%) | 0 (0.0%) |
| Life, Physical & Social Science | 9 (100.0%) | 0 (0.0%) |
| Community & Social Service | 49 (18.5%) | 216 (81.5%) |
| Education, Arts & Media | 24 (100.0%) | 0 (0.0%) |
| Legal Services & Support | 0 (0.0%) | 30 (100.0%) |
| Education Instruction & Library | 25 (11.8%) | 186 (88.1%) |
| Arts, Media & Entertainment | 0 (0.0%) | 0 (0.0%) |
| Health Diagnosing & Treating | 0 (0.0%) | 56 (100.0%) |
| Health Technologists | 0 (0.0%) | 38 (100.0%) |
| Total (Category) | 185 (31.5%) | 402 (68.5%) |
| Total (Overall) | 1,062 (56.2%) | 828 (43.8%) |
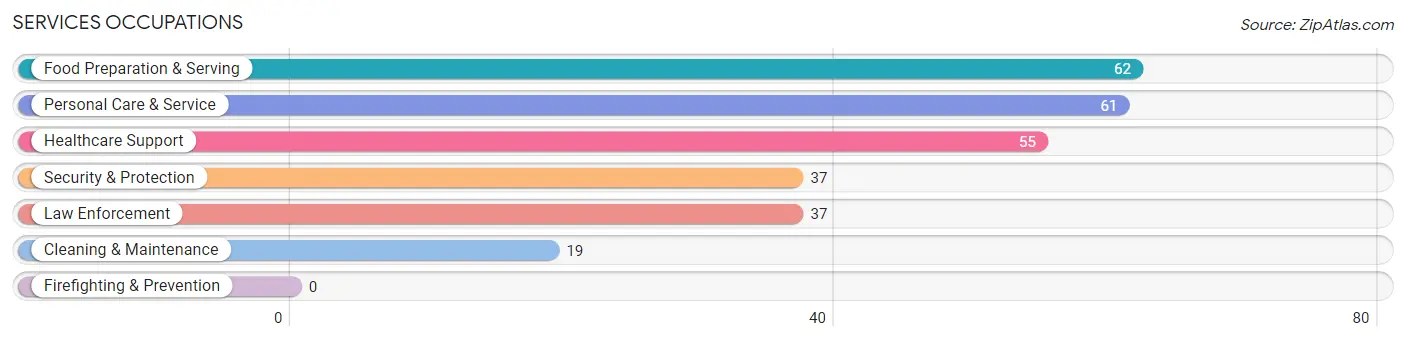
Services Occupations
The most common Services occupations in Caldwell are Food Preparation & Serving (62 | 3.3%), Personal Care & Service (61 | 3.2%), Healthcare Support (55 | 2.9%), Security & Protection (37 | 2.0%), and Law Enforcement (37 | 2.0%).
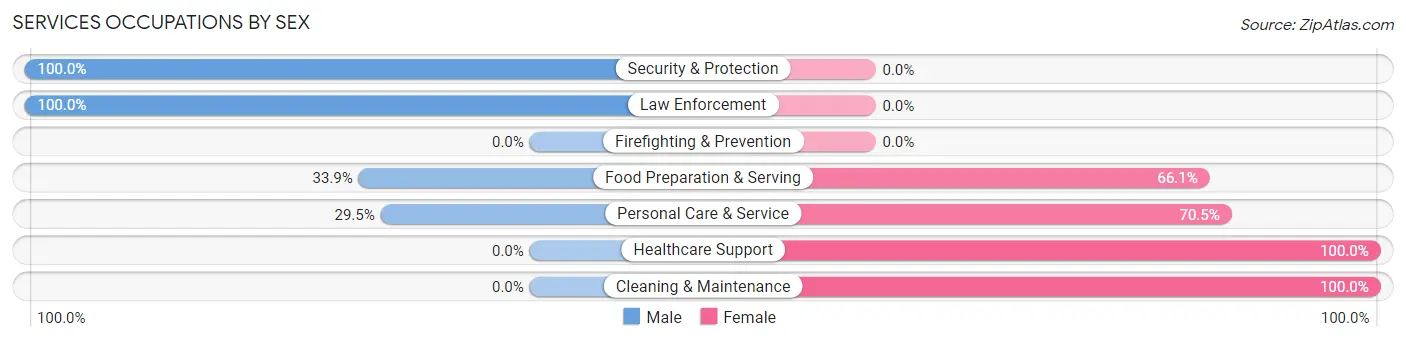
Services Occupations by Sex
Within the Services occupations in Caldwell, the most male-oriented occupations are Security & Protection (100.0%), Law Enforcement (100.0%), and Food Preparation & Serving (33.9%), while the most female-oriented occupations are Healthcare Support (100.0%), Cleaning & Maintenance (100.0%), and Personal Care & Service (70.5%).
| Occupation | Male | Female |
| Healthcare Support | 0 (0.0%) | 55 (100.0%) |
| Security & Protection | 37 (100.0%) | 0 (0.0%) |
| Firefighting & Prevention | 0 (0.0%) | 0 (0.0%) |
| Law Enforcement | 37 (100.0%) | 0 (0.0%) |
| Food Preparation & Serving | 21 (33.9%) | 41 (66.1%) |
| Cleaning & Maintenance | 0 (0.0%) | 19 (100.0%) |
| Personal Care & Service | 18 (29.5%) | 43 (70.5%) |
| Total (Category) | 76 (32.5%) | 158 (67.5%) |
| Total (Overall) | 1,062 (56.2%) | 828 (43.8%) |
Sales and Office Occupations
The most common Sales and Office occupations in Caldwell are Sales & Related (206 | 10.9%), and Office & Administration (205 | 10.8%).

Sales and Office Occupations by Sex

| Occupation | Male | Female |
| Sales & Related | 138 (67.0%) | 68 (33.0%) |
| Office & Administration | 82 (40.0%) | 123 (60.0%) |
| Total (Category) | 220 (53.5%) | 191 (46.5%) |
| Total (Overall) | 1,062 (56.2%) | 828 (43.8%) |
Natural Resources, Construction and Maintenance Occupations
The most common Natural Resources, Construction and Maintenance occupations in Caldwell are Construction & Extraction (188 | 10.0%), and Installation, Maintenance & Repair (122 | 6.5%).
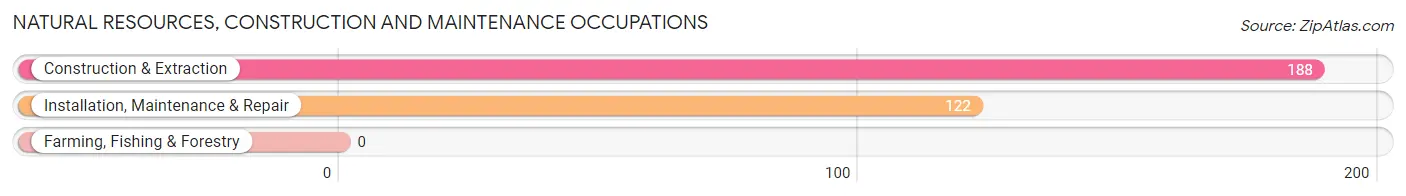
Natural Resources, Construction and Maintenance Occupations by Sex
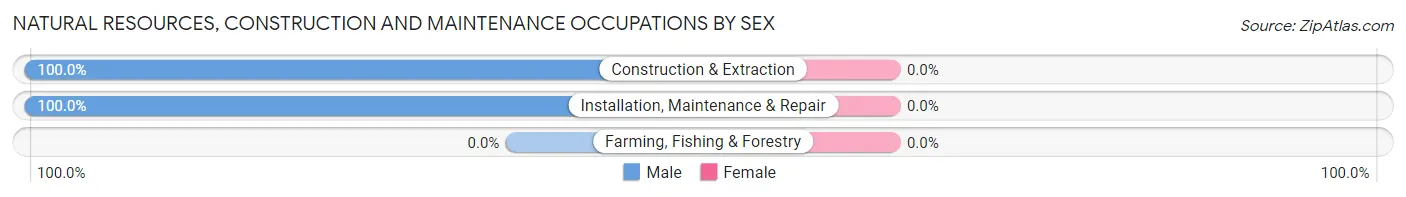
| Occupation | Male | Female |
| Farming, Fishing & Forestry | 0 (0.0%) | 0 (0.0%) |
| Construction & Extraction | 188 (100.0%) | 0 (0.0%) |
| Installation, Maintenance & Repair | 122 (100.0%) | 0 (0.0%) |
| Total (Category) | 310 (100.0%) | 0 (0.0%) |
| Total (Overall) | 1,062 (56.2%) | 828 (43.8%) |
Production, Transportation and Moving Occupations
The most common Production, Transportation and Moving occupations in Caldwell are Production (157 | 8.3%), Transportation (127 | 6.7%), and Material Moving (64 | 3.4%).
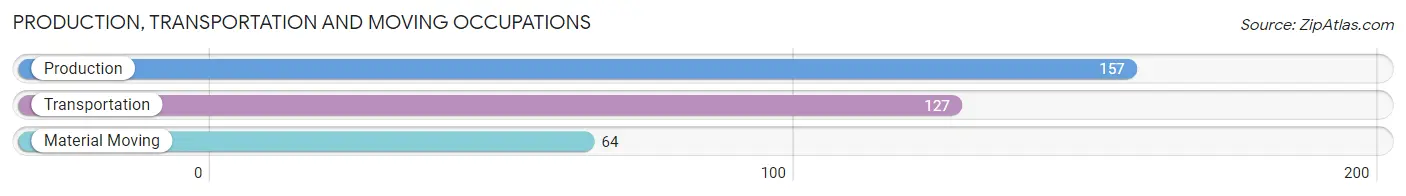
Production, Transportation and Moving Occupations by Sex
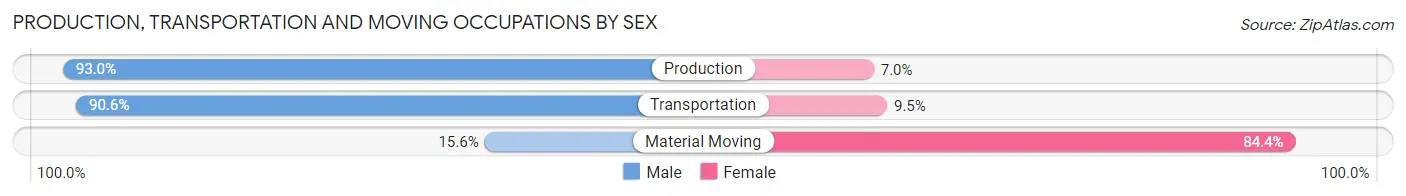
| Occupation | Male | Female |
| Production | 146 (93.0%) | 11 (7.0%) |
| Transportation | 115 (90.5%) | 12 (9.5%) |
| Material Moving | 10 (15.6%) | 54 (84.4%) |
| Total (Category) | 271 (77.9%) | 77 (22.1%) |
| Total (Overall) | 1,062 (56.2%) | 828 (43.8%) |
Employment Industries by Sex in Caldwell
Employment Industries in Caldwell
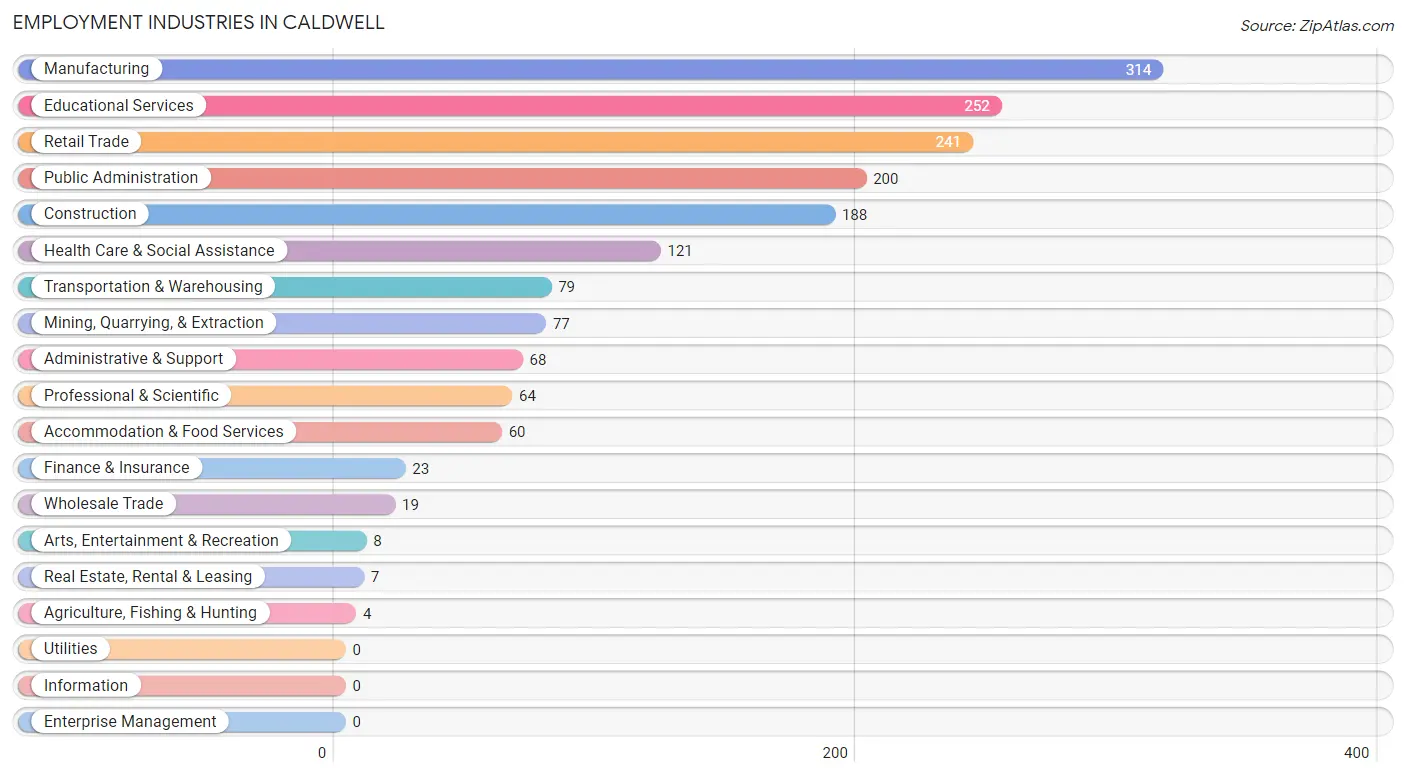
The major employment industries in Caldwell include Manufacturing (314 | 16.6%), Educational Services (252 | 13.3%), Retail Trade (241 | 12.8%), Public Administration (200 | 10.6%), and Construction (188 | 10.0%).
Employment Industries by Sex in Caldwell
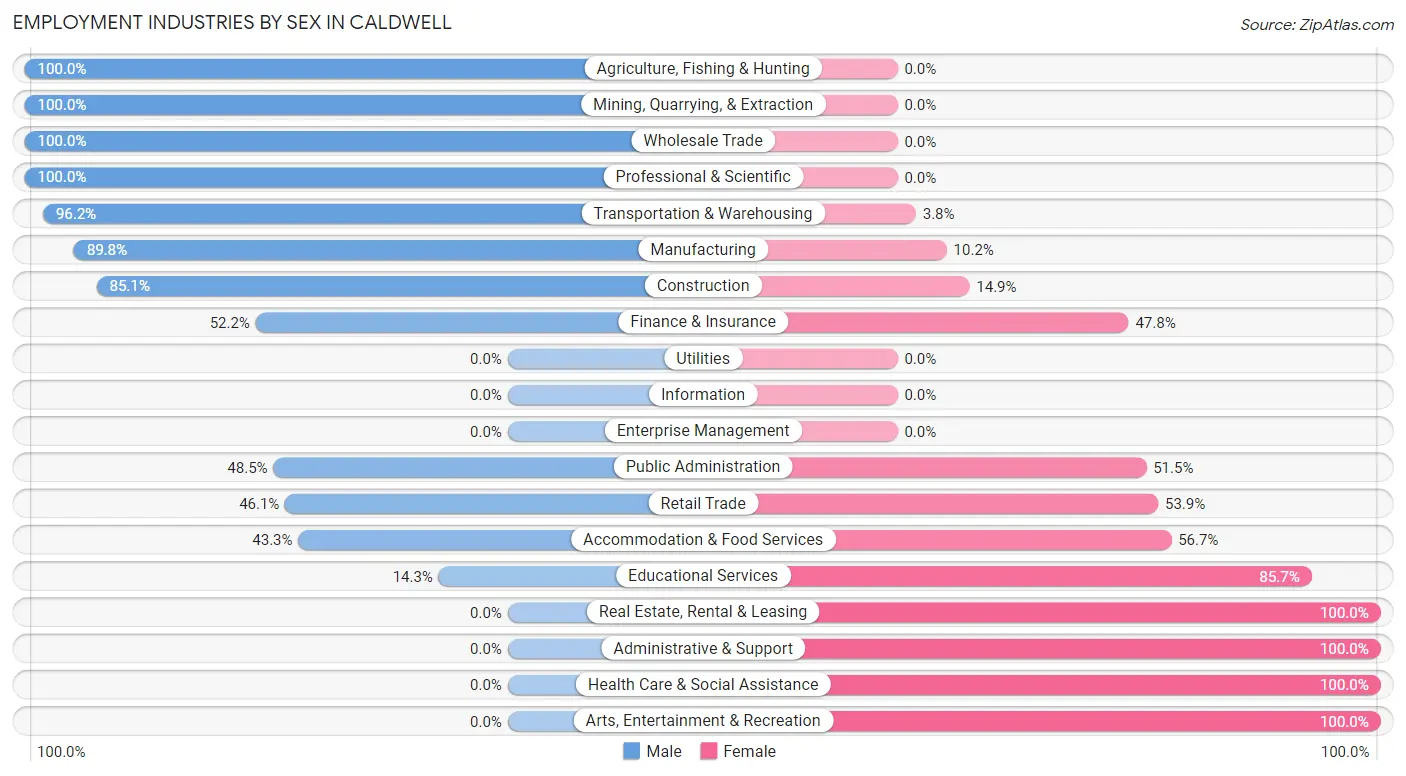
The Caldwell industries that see more men than women are Agriculture, Fishing & Hunting (100.0%), Mining, Quarrying, & Extraction (100.0%), and Wholesale Trade (100.0%), whereas the industries that tend to have a higher number of women are Real Estate, Rental & Leasing (100.0%), Administrative & Support (100.0%), and Health Care & Social Assistance (100.0%).
| Industry | Male | Female |
| Agriculture, Fishing & Hunting | 4 (100.0%) | 0 (0.0%) |
| Mining, Quarrying, & Extraction | 77 (100.0%) | 0 (0.0%) |
| Construction | 160 (85.1%) | 28 (14.9%) |
| Manufacturing | 282 (89.8%) | 32 (10.2%) |
| Wholesale Trade | 19 (100.0%) | 0 (0.0%) |
| Retail Trade | 111 (46.1%) | 130 (53.9%) |
| Transportation & Warehousing | 76 (96.2%) | 3 (3.8%) |
| Utilities | 0 (0.0%) | 0 (0.0%) |
| Information | 0 (0.0%) | 0 (0.0%) |
| Finance & Insurance | 12 (52.2%) | 11 (47.8%) |
| Real Estate, Rental & Leasing | 0 (0.0%) | 7 (100.0%) |
| Professional & Scientific | 64 (100.0%) | 0 (0.0%) |
| Enterprise Management | 0 (0.0%) | 0 (0.0%) |
| Administrative & Support | 0 (0.0%) | 68 (100.0%) |
| Educational Services | 36 (14.3%) | 216 (85.7%) |
| Health Care & Social Assistance | 0 (0.0%) | 121 (100.0%) |
| Arts, Entertainment & Recreation | 0 (0.0%) | 8 (100.0%) |
| Accommodation & Food Services | 26 (43.3%) | 34 (56.7%) |
| Public Administration | 97 (48.5%) | 103 (51.5%) |
| Total | 1,062 (56.2%) | 828 (43.8%) |
Education in Caldwell
School Enrollment in Caldwell
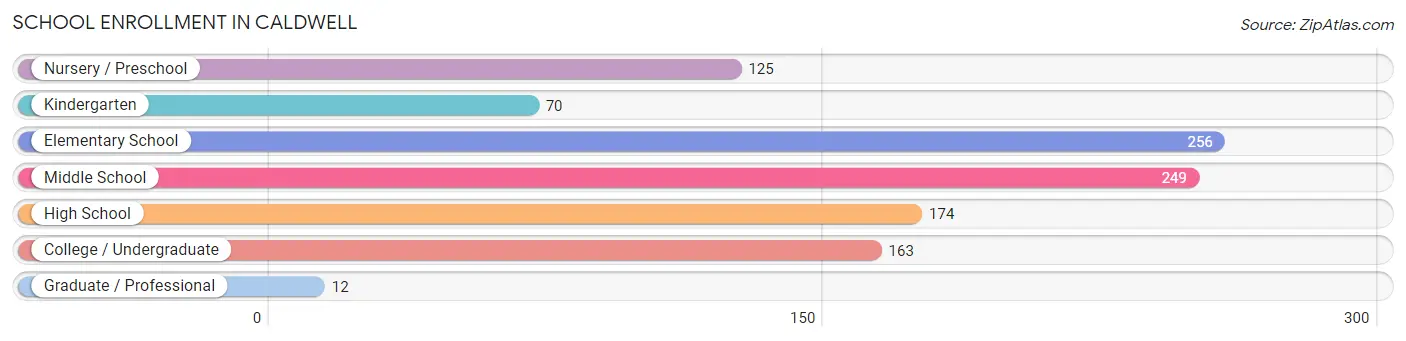
The most common levels of schooling among the 1,049 students in Caldwell are elementary school (256 | 24.4%), middle school (249 | 23.7%), and high school (174 | 16.6%).
| School Level | # Students | % Students |
| Nursery / Preschool | 125 | 11.9% |
| Kindergarten | 70 | 6.7% |
| Elementary School | 256 | 24.4% |
| Middle School | 249 | 23.7% |
| High School | 174 | 16.6% |
| College / Undergraduate | 163 | 15.5% |
| Graduate / Professional | 12 | 1.1% |
| Total | 1,049 | 100.0% |
School Enrollment by Age by Funding Source in Caldwell
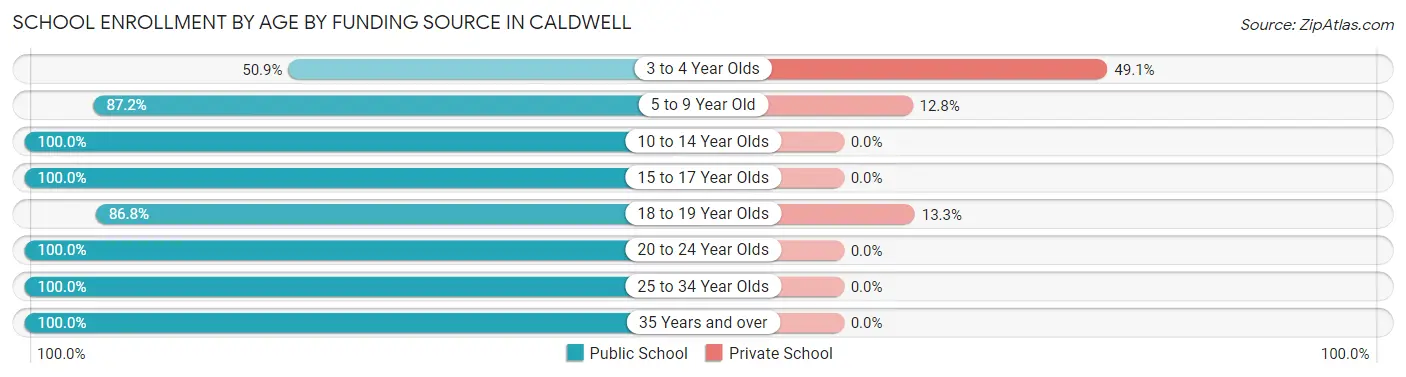
Out of a total of 1,049 students who are enrolled in schools in Caldwell, 87 (8.3%) attend a private institution, while the remaining 962 (91.7%) are enrolled in public schools. The age group of 3 to 4 year olds has the highest likelihood of being enrolled in private schools, with 28 (49.1% in the age bracket) enrolled. Conversely, the age group of 10 to 14 year olds has the lowest likelihood of being enrolled in a private school, with 291 (100.0% in the age bracket) attending a public institution.
| Age Bracket | Public School | Private School |
| 3 to 4 Year Olds | 29 (50.9%) | 28 (49.1%) |
| 5 to 9 Year Old | 326 (87.2%) | 48 (12.8%) |
| 10 to 14 Year Olds | 291 (100.0%) | 0 (0.0%) |
| 15 to 17 Year Olds | 134 (100.0%) | 0 (0.0%) |
| 18 to 19 Year Olds | 72 (86.8%) | 11 (13.3%) |
| 20 to 24 Year Olds | 24 (100.0%) | 0 (0.0%) |
| 25 to 34 Year Olds | 53 (100.0%) | 0 (0.0%) |
| 35 Years and over | 33 (100.0%) | 0 (0.0%) |
| Total | 962 (91.7%) | 87 (8.3%) |
Educational Attainment by Field of Study in Caldwell
Education (165 | 24.8%), liberal arts & history (160 | 24.1%), arts & humanities (89 | 13.4%), physical & health sciences (60 | 9.0%), and business (40 | 6.0%) are the most common fields of study among 664 individuals in Caldwell who have obtained a bachelor's degree or higher.
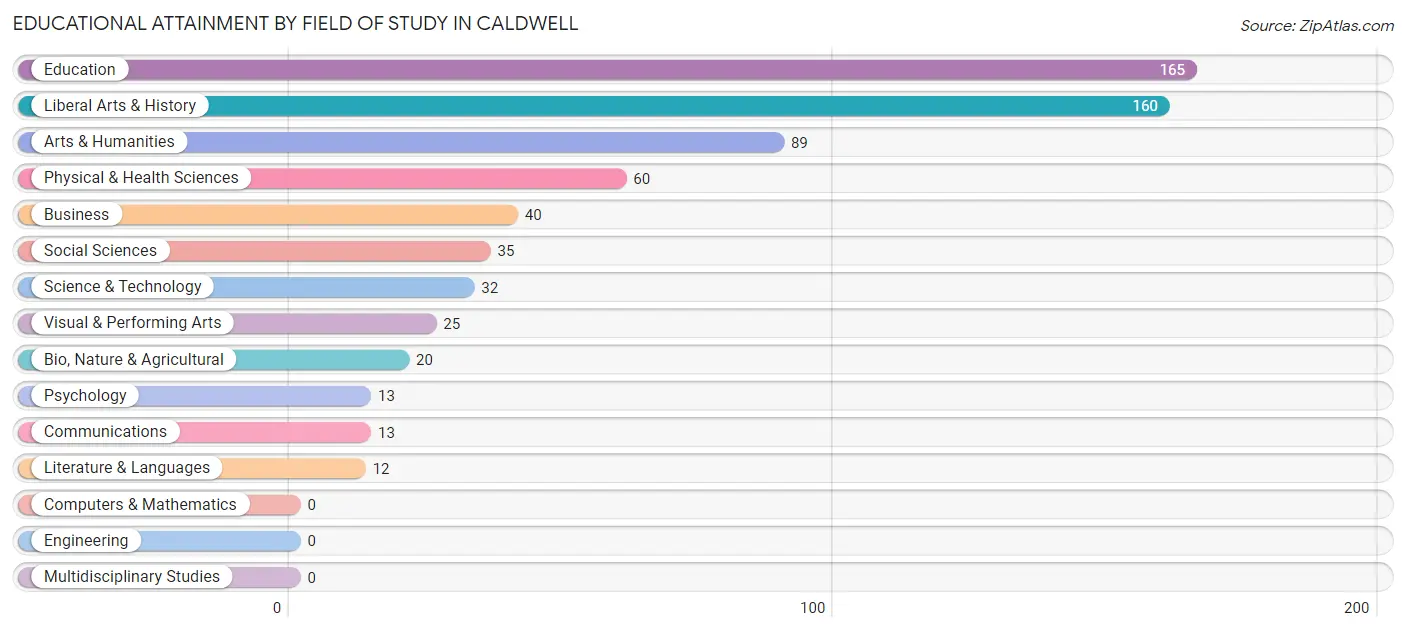
| Field of Study | # Graduates | % Graduates |
| Computers & Mathematics | 0 | 0.0% |
| Bio, Nature & Agricultural | 20 | 3.0% |
| Physical & Health Sciences | 60 | 9.0% |
| Psychology | 13 | 2.0% |
| Social Sciences | 35 | 5.3% |
| Engineering | 0 | 0.0% |
| Multidisciplinary Studies | 0 | 0.0% |
| Science & Technology | 32 | 4.8% |
| Business | 40 | 6.0% |
| Education | 165 | 24.8% |
| Literature & Languages | 12 | 1.8% |
| Liberal Arts & History | 160 | 24.1% |
| Visual & Performing Arts | 25 | 3.8% |
| Communications | 13 | 2.0% |
| Arts & Humanities | 89 | 13.4% |
| Total | 664 | 100.0% |
Transportation & Commute in Caldwell
Vehicle Availability by Sex in Caldwell
The most prevalent vehicle ownership categories in Caldwell are males with 2 vehicles (365, accounting for 36.6%) and females with 2 vehicles (369, making up 44.1%).
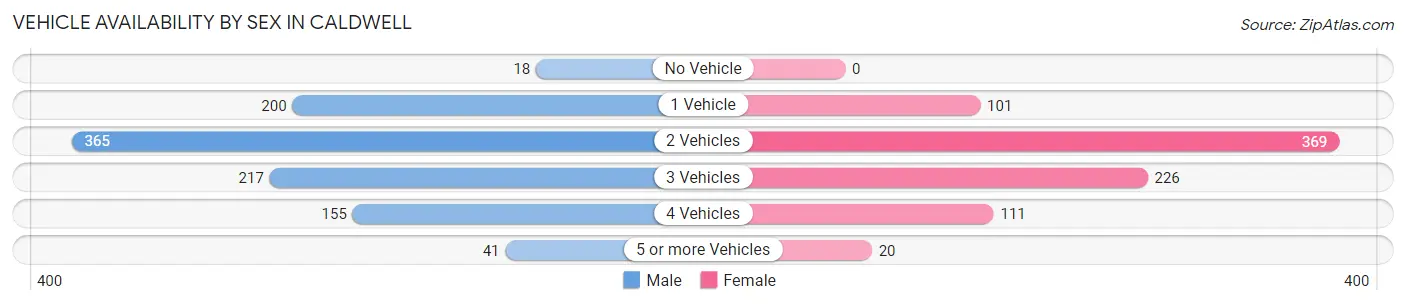
| Vehicles Available | Male | Female |
| No Vehicle | 18 (1.8%) | 0 (0.0%) |
| 1 Vehicle | 200 (20.1%) | 101 (12.2%) |
| 2 Vehicles | 365 (36.6%) | 369 (44.6%) |
| 3 Vehicles | 217 (21.8%) | 226 (27.3%) |
| 4 Vehicles | 155 (15.6%) | 111 (13.4%) |
| 5 or more Vehicles | 41 (4.1%) | 20 (2.4%) |
| Total | 996 (100.0%) | 827 (100.0%) |
Commute Time in Caldwell
The most frequently occuring commute durations in Caldwell are 5 to 9 minutes (605 commuters, 34.9%), 30 to 34 minutes (247 commuters, 14.3%), and 20 to 24 minutes (217 commuters, 12.5%).
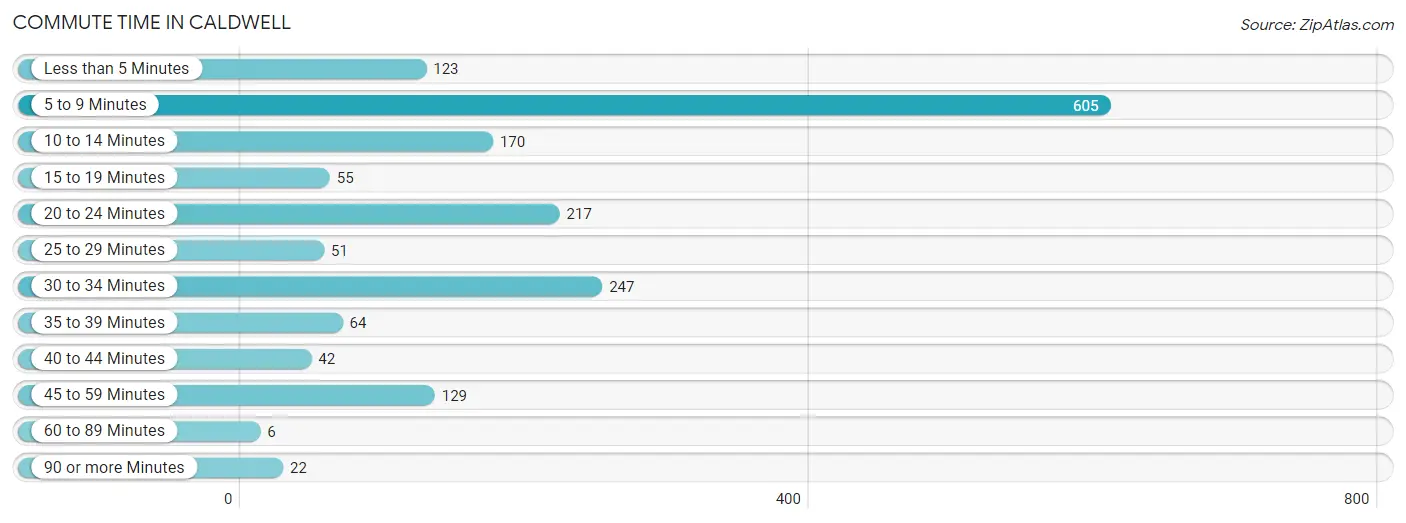
| Commute Time | # Commuters | % Commuters |
| Less than 5 Minutes | 123 | 7.1% |
| 5 to 9 Minutes | 605 | 34.9% |
| 10 to 14 Minutes | 170 | 9.8% |
| 15 to 19 Minutes | 55 | 3.2% |
| 20 to 24 Minutes | 217 | 12.5% |
| 25 to 29 Minutes | 51 | 2.9% |
| 30 to 34 Minutes | 247 | 14.3% |
| 35 to 39 Minutes | 64 | 3.7% |
| 40 to 44 Minutes | 42 | 2.4% |
| 45 to 59 Minutes | 129 | 7.4% |
| 60 to 89 Minutes | 6 | 0.4% |
| 90 or more Minutes | 22 | 1.3% |
Commute Time by Sex in Caldwell
The most common commute times in Caldwell are 5 to 9 minutes (344 commuters, 35.0%) for males and 5 to 9 minutes (261 commuters, 34.9%) for females.
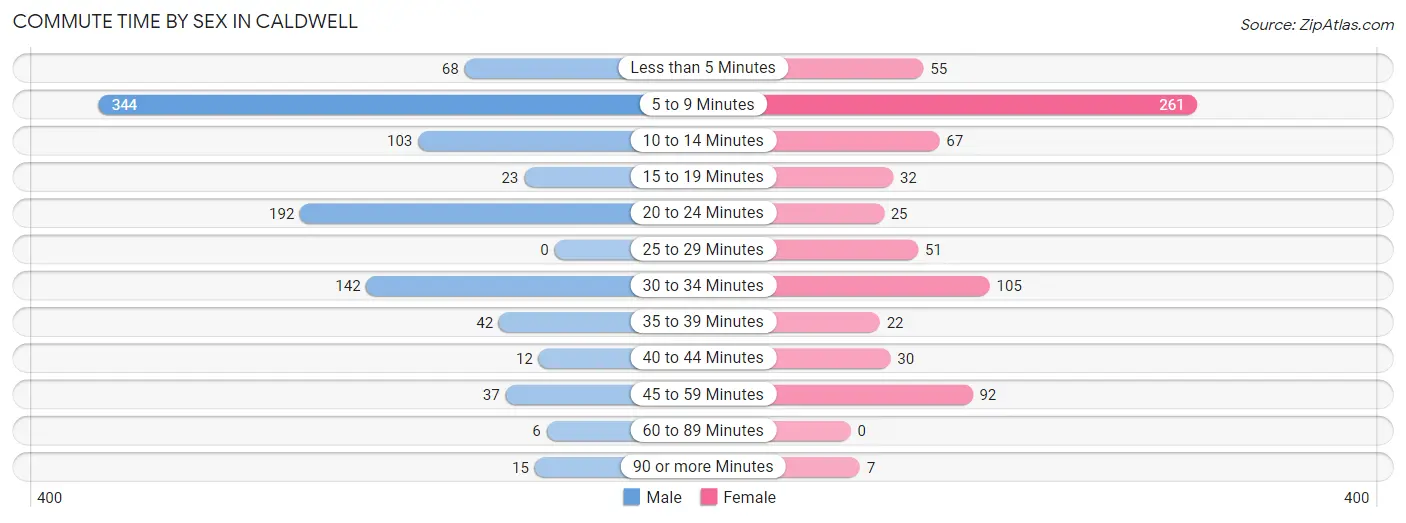
| Commute Time | Male | Female |
| Less than 5 Minutes | 68 (6.9%) | 55 (7.4%) |
| 5 to 9 Minutes | 344 (35.0%) | 261 (34.9%) |
| 10 to 14 Minutes | 103 (10.5%) | 67 (9.0%) |
| 15 to 19 Minutes | 23 (2.3%) | 32 (4.3%) |
| 20 to 24 Minutes | 192 (19.5%) | 25 (3.4%) |
| 25 to 29 Minutes | 0 (0.0%) | 51 (6.8%) |
| 30 to 34 Minutes | 142 (14.4%) | 105 (14.1%) |
| 35 to 39 Minutes | 42 (4.3%) | 22 (2.9%) |
| 40 to 44 Minutes | 12 (1.2%) | 30 (4.0%) |
| 45 to 59 Minutes | 37 (3.8%) | 92 (12.3%) |
| 60 to 89 Minutes | 6 (0.6%) | 0 (0.0%) |
| 90 or more Minutes | 15 (1.5%) | 7 (0.9%) |
Time of Departure to Work by Sex in Caldwell
The most frequent times of departure to work in Caldwell are 7:00 AM to 7:29 AM (332, 33.7%) for males and 7:00 AM to 7:29 AM (229, 30.7%) for females.
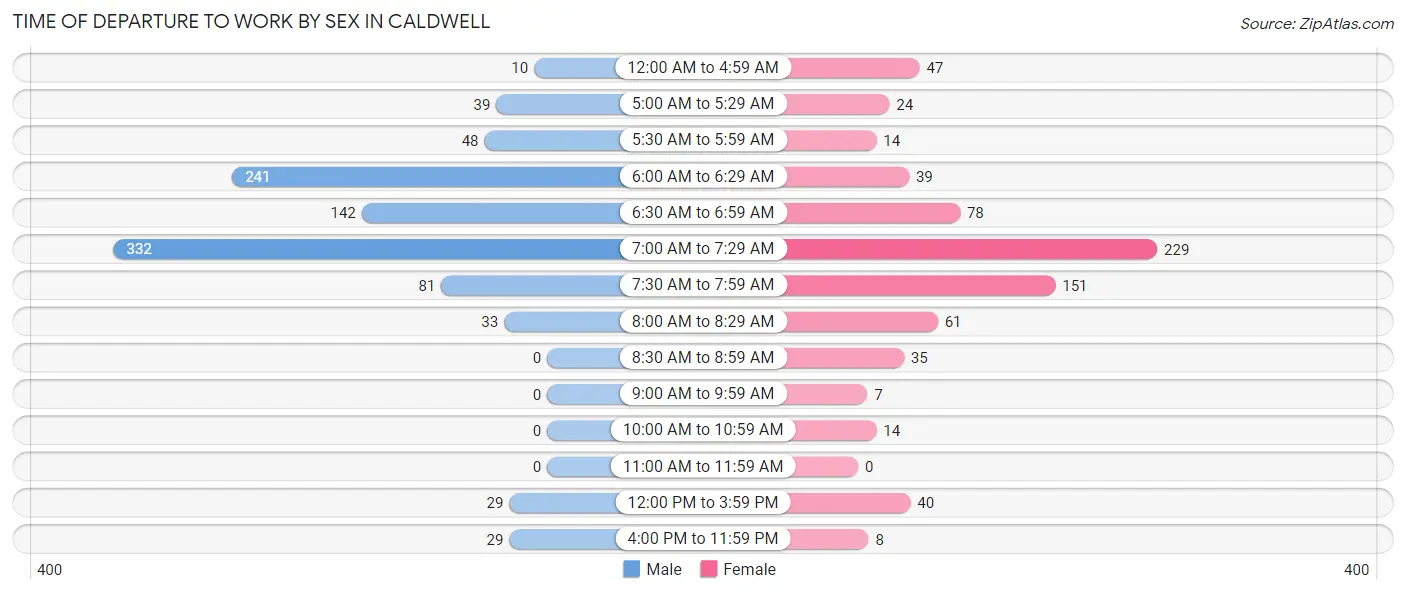
| Time of Departure | Male | Female |
| 12:00 AM to 4:59 AM | 10 (1.0%) | 47 (6.3%) |
| 5:00 AM to 5:29 AM | 39 (4.0%) | 24 (3.2%) |
| 5:30 AM to 5:59 AM | 48 (4.9%) | 14 (1.9%) |
| 6:00 AM to 6:29 AM | 241 (24.5%) | 39 (5.2%) |
| 6:30 AM to 6:59 AM | 142 (14.4%) | 78 (10.4%) |
| 7:00 AM to 7:29 AM | 332 (33.7%) | 229 (30.7%) |
| 7:30 AM to 7:59 AM | 81 (8.2%) | 151 (20.2%) |
| 8:00 AM to 8:29 AM | 33 (3.4%) | 61 (8.2%) |
| 8:30 AM to 8:59 AM | 0 (0.0%) | 35 (4.7%) |
| 9:00 AM to 9:59 AM | 0 (0.0%) | 7 (0.9%) |
| 10:00 AM to 10:59 AM | 0 (0.0%) | 14 (1.9%) |
| 11:00 AM to 11:59 AM | 0 (0.0%) | 0 (0.0%) |
| 12:00 PM to 3:59 PM | 29 (2.9%) | 40 (5.3%) |
| 4:00 PM to 11:59 PM | 29 (2.9%) | 8 (1.1%) |
| Total | 984 (100.0%) | 747 (100.0%) |
Housing Occupancy in Caldwell
Occupancy by Ownership in Caldwell
Of the total 1,622 dwellings in Caldwell, owner-occupied units account for 1,074 (66.2%), while renter-occupied units make up 548 (33.8%).
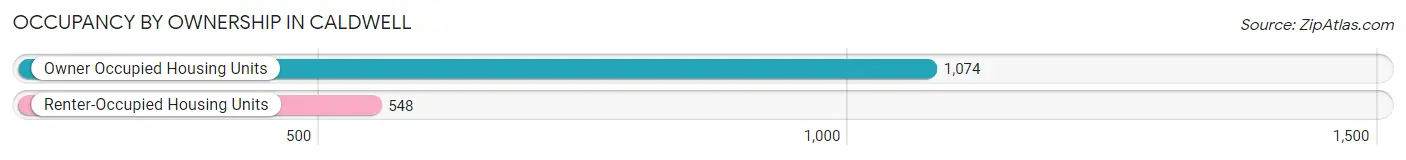
| Occupancy | # Housing Units | % Housing Units |
| Owner Occupied Housing Units | 1,074 | 66.2% |
| Renter-Occupied Housing Units | 548 | 33.8% |
| Total Occupied Housing Units | 1,622 | 100.0% |
Occupancy by Household Size in Caldwell
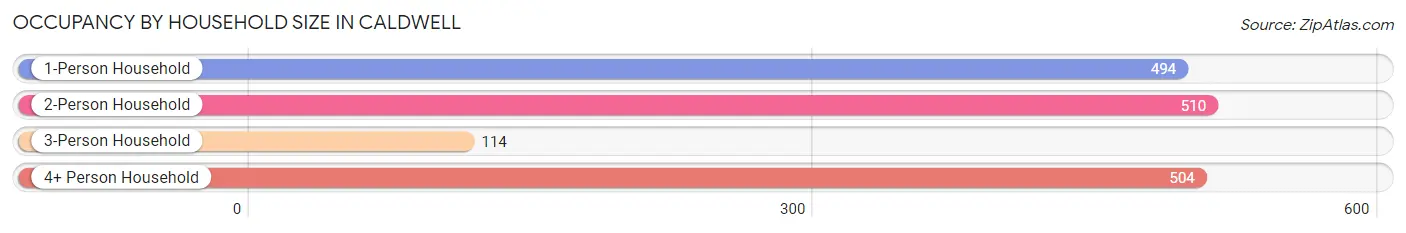
| Household Size | # Housing Units | % Housing Units |
| 1-Person Household | 494 | 30.5% |
| 2-Person Household | 510 | 31.4% |
| 3-Person Household | 114 | 7.0% |
| 4+ Person Household | 504 | 31.1% |
| Total Housing Units | 1,622 | 100.0% |
Occupancy by Ownership by Household Size in Caldwell
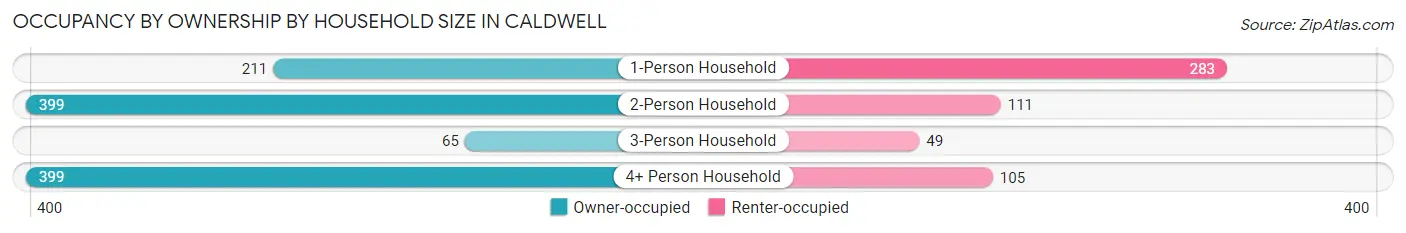
| Household Size | Owner-occupied | Renter-occupied |
| 1-Person Household | 211 (42.7%) | 283 (57.3%) |
| 2-Person Household | 399 (78.2%) | 111 (21.8%) |
| 3-Person Household | 65 (57.0%) | 49 (43.0%) |
| 4+ Person Household | 399 (79.2%) | 105 (20.8%) |
| Total Housing Units | 1,074 (66.2%) | 548 (33.8%) |
Occupancy by Educational Attainment in Caldwell
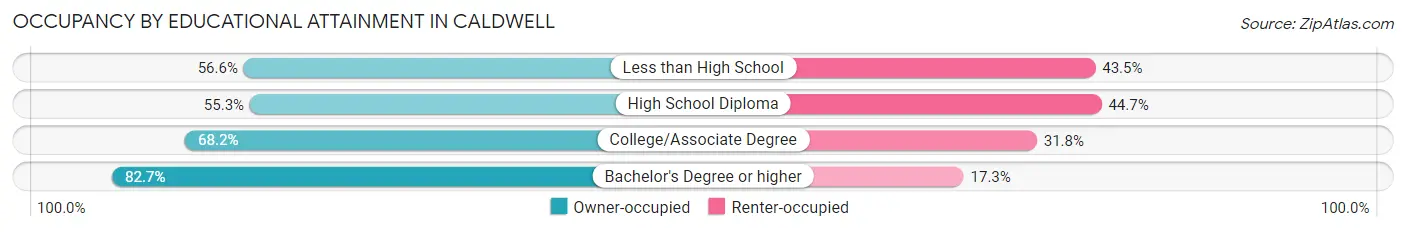
| Household Size | Owner-occupied | Renter-occupied |
| Less than High School | 95 (56.6%) | 73 (43.4%) |
| High School Diploma | 301 (55.3%) | 243 (44.7%) |
| College/Associate Degree | 349 (68.2%) | 163 (31.8%) |
| Bachelor's Degree or higher | 329 (82.7%) | 69 (17.3%) |
Occupancy by Age of Householder in Caldwell
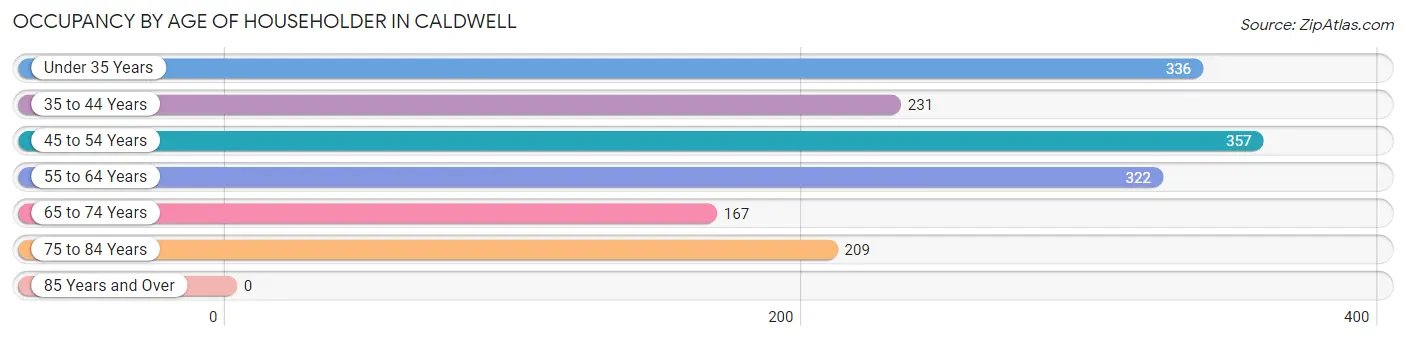
| Age Bracket | # Households | % Households |
| Under 35 Years | 336 | 20.7% |
| 35 to 44 Years | 231 | 14.2% |
| 45 to 54 Years | 357 | 22.0% |
| 55 to 64 Years | 322 | 19.9% |
| 65 to 74 Years | 167 | 10.3% |
| 75 to 84 Years | 209 | 12.9% |
| 85 Years and Over | 0 | 0.0% |
| Total | 1,622 | 100.0% |
Housing Finances in Caldwell
Median Income by Occupancy in Caldwell
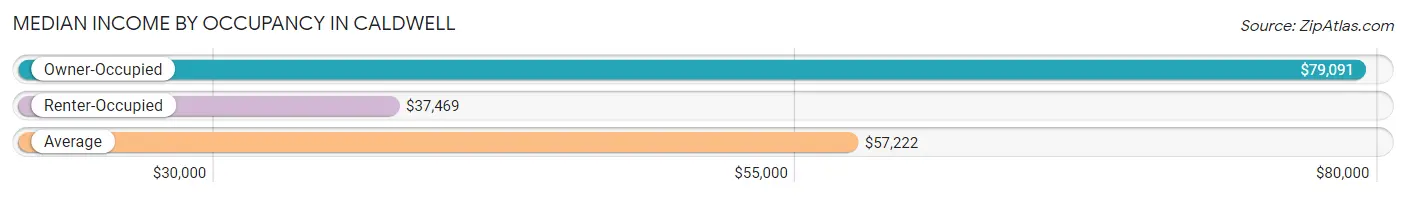
| Occupancy Type | # Households | Median Income |
| Owner-Occupied | 1,074 (66.2%) | $79,091 |
| Renter-Occupied | 548 (33.8%) | $37,469 |
| Average | 1,622 (100.0%) | $57,222 |
Occupancy by Householder Income Bracket in Caldwell
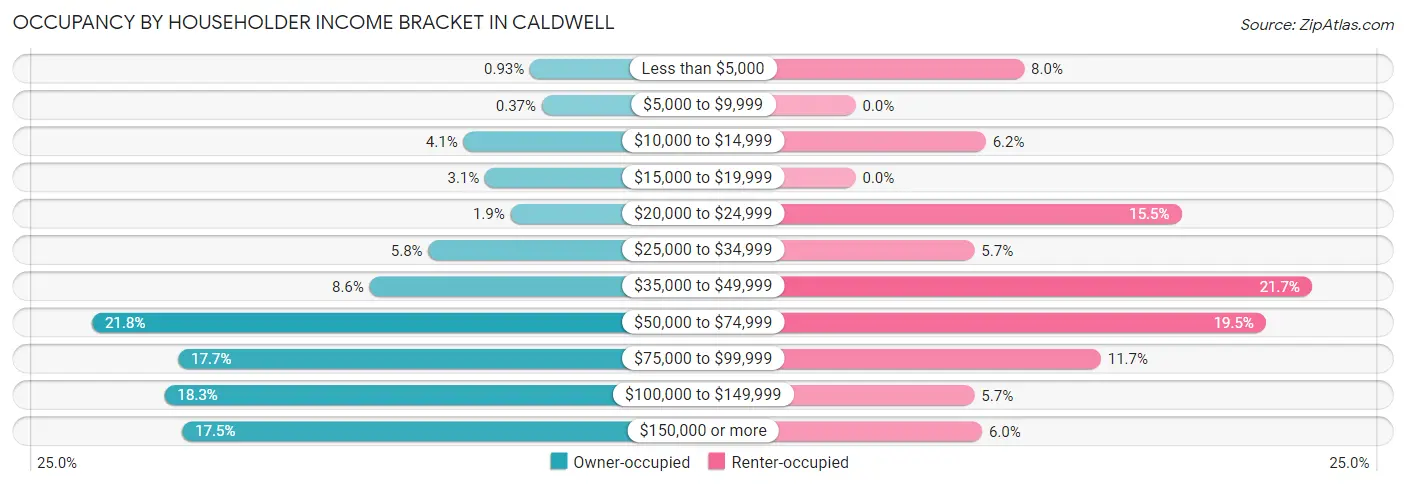
| Income Bracket | Owner-occupied | Renter-occupied |
| Less than $5,000 | 10 (0.9%) | 44 (8.0%) |
| $5,000 to $9,999 | 4 (0.4%) | 0 (0.0%) |
| $10,000 to $14,999 | 44 (4.1%) | 34 (6.2%) |
| $15,000 to $19,999 | 33 (3.1%) | 0 (0.0%) |
| $20,000 to $24,999 | 20 (1.9%) | 85 (15.5%) |
| $25,000 to $34,999 | 62 (5.8%) | 31 (5.7%) |
| $35,000 to $49,999 | 92 (8.6%) | 119 (21.7%) |
| $50,000 to $74,999 | 234 (21.8%) | 107 (19.5%) |
| $75,000 to $99,999 | 190 (17.7%) | 64 (11.7%) |
| $100,000 to $149,999 | 197 (18.3%) | 31 (5.7%) |
| $150,000 or more | 188 (17.5%) | 33 (6.0%) |
| Total | 1,074 (100.0%) | 548 (100.0%) |
Monthly Housing Cost Tiers in Caldwell
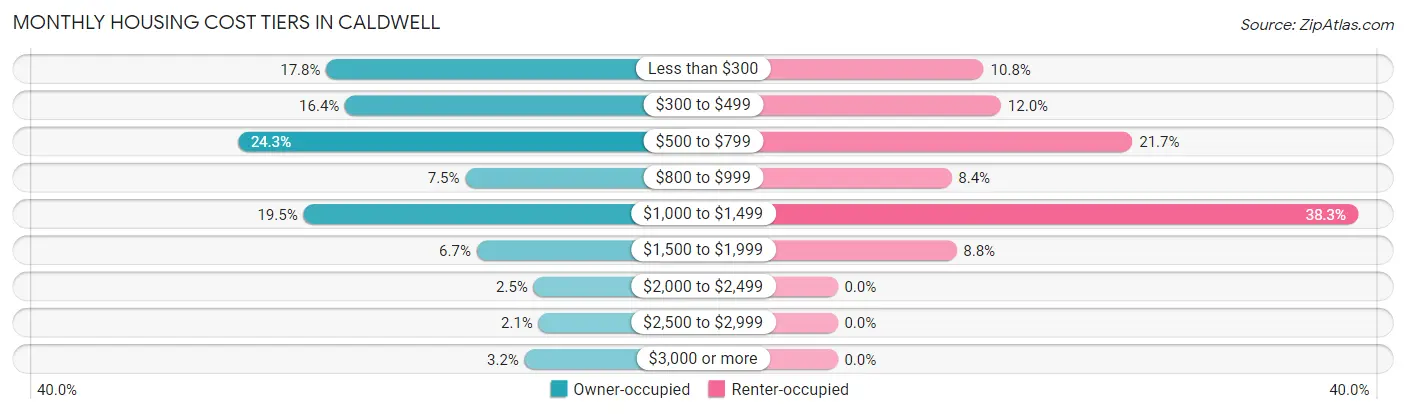
| Monthly Cost | Owner-occupied | Renter-occupied |
| Less than $300 | 191 (17.8%) | 59 (10.8%) |
| $300 to $499 | 176 (16.4%) | 66 (12.0%) |
| $500 to $799 | 261 (24.3%) | 119 (21.7%) |
| $800 to $999 | 81 (7.5%) | 46 (8.4%) |
| $1,000 to $1,499 | 209 (19.5%) | 210 (38.3%) |
| $1,500 to $1,999 | 72 (6.7%) | 48 (8.8%) |
| $2,000 to $2,499 | 27 (2.5%) | 0 (0.0%) |
| $2,500 to $2,999 | 23 (2.1%) | 0 (0.0%) |
| $3,000 or more | 34 (3.2%) | 0 (0.0%) |
| Total | 1,074 (100.0%) | 548 (100.0%) |
Physical Housing Characteristics in Caldwell
Housing Structures in Caldwell
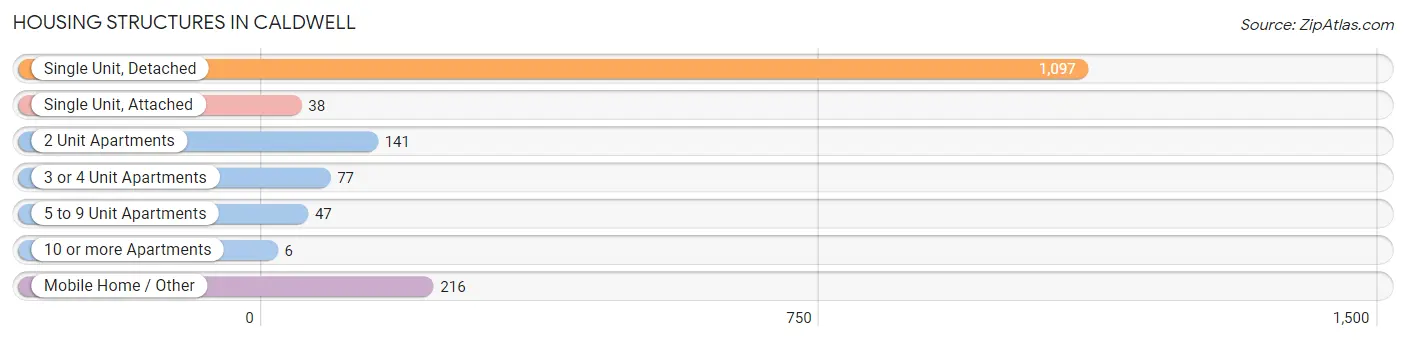
| Structure Type | # Housing Units | % Housing Units |
| Single Unit, Detached | 1,097 | 67.6% |
| Single Unit, Attached | 38 | 2.3% |
| 2 Unit Apartments | 141 | 8.7% |
| 3 or 4 Unit Apartments | 77 | 4.8% |
| 5 to 9 Unit Apartments | 47 | 2.9% |
| 10 or more Apartments | 6 | 0.4% |
| Mobile Home / Other | 216 | 13.3% |
| Total | 1,622 | 100.0% |
Housing Structures by Occupancy in Caldwell
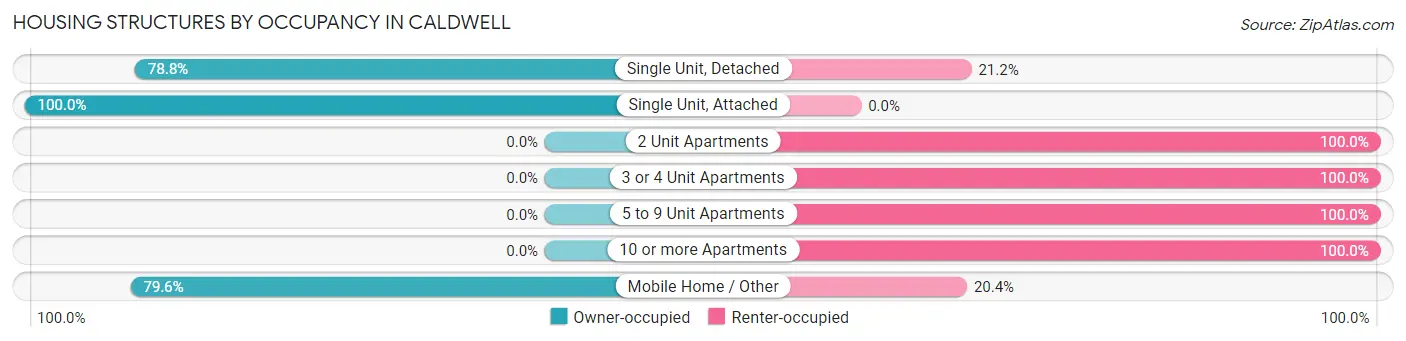
| Structure Type | Owner-occupied | Renter-occupied |
| Single Unit, Detached | 864 (78.8%) | 233 (21.2%) |
| Single Unit, Attached | 38 (100.0%) | 0 (0.0%) |
| 2 Unit Apartments | 0 (0.0%) | 141 (100.0%) |
| 3 or 4 Unit Apartments | 0 (0.0%) | 77 (100.0%) |
| 5 to 9 Unit Apartments | 0 (0.0%) | 47 (100.0%) |
| 10 or more Apartments | 0 (0.0%) | 6 (100.0%) |
| Mobile Home / Other | 172 (79.6%) | 44 (20.4%) |
| Total | 1,074 (66.2%) | 548 (33.8%) |
Housing Structures by Number of Rooms in Caldwell
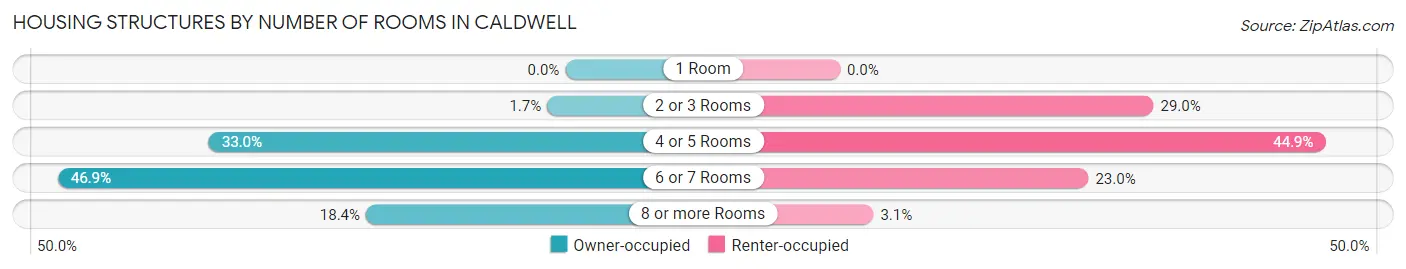
| Number of Rooms | Owner-occupied | Renter-occupied |
| 1 Room | 0 (0.0%) | 0 (0.0%) |
| 2 or 3 Rooms | 18 (1.7%) | 159 (29.0%) |
| 4 or 5 Rooms | 354 (33.0%) | 246 (44.9%) |
| 6 or 7 Rooms | 504 (46.9%) | 126 (23.0%) |
| 8 or more Rooms | 198 (18.4%) | 17 (3.1%) |
| Total | 1,074 (100.0%) | 548 (100.0%) |
Housing Structure by Heating Type in Caldwell
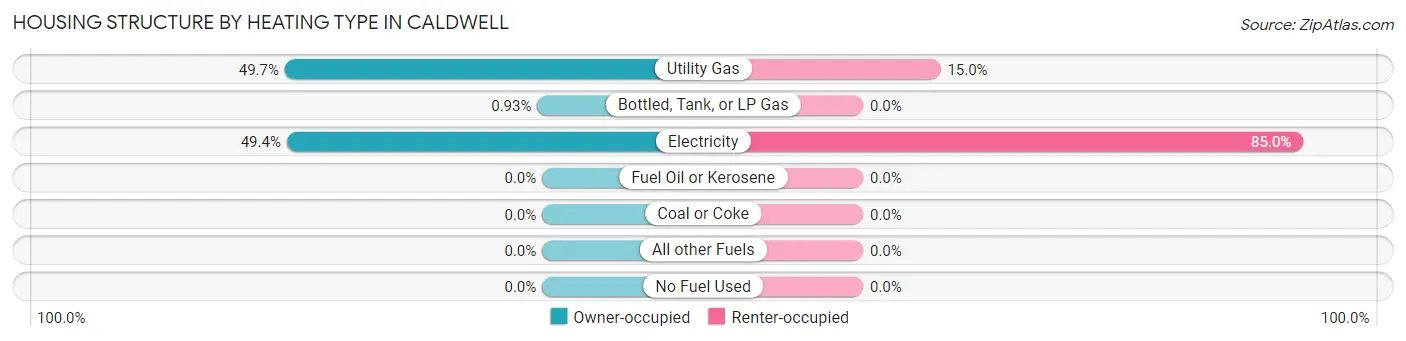
| Heating Type | Owner-occupied | Renter-occupied |
| Utility Gas | 534 (49.7%) | 82 (15.0%) |
| Bottled, Tank, or LP Gas | 10 (0.9%) | 0 (0.0%) |
| Electricity | 530 (49.3%) | 466 (85.0%) |
| Fuel Oil or Kerosene | 0 (0.0%) | 0 (0.0%) |
| Coal or Coke | 0 (0.0%) | 0 (0.0%) |
| All other Fuels | 0 (0.0%) | 0 (0.0%) |
| No Fuel Used | 0 (0.0%) | 0 (0.0%) |
| Total | 1,074 (100.0%) | 548 (100.0%) |
Household Vehicle Usage in Caldwell
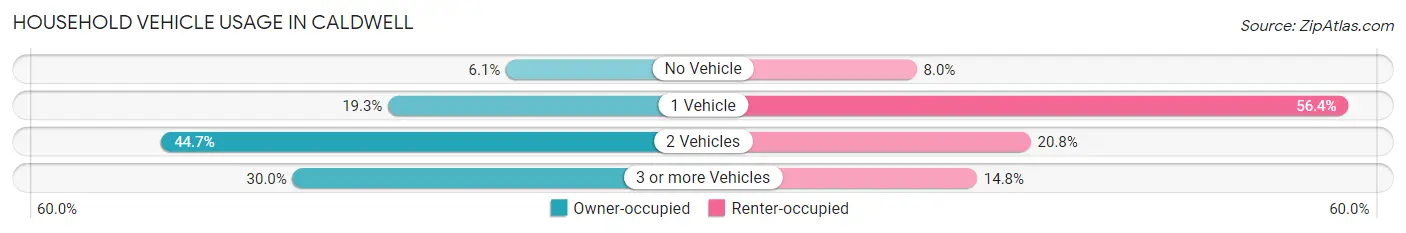
| Vehicles per Household | Owner-occupied | Renter-occupied |
| No Vehicle | 65 (6.0%) | 44 (8.0%) |
| 1 Vehicle | 207 (19.3%) | 309 (56.4%) |
| 2 Vehicles | 480 (44.7%) | 114 (20.8%) |
| 3 or more Vehicles | 322 (30.0%) | 81 (14.8%) |
| Total | 1,074 (100.0%) | 548 (100.0%) |
Real Estate & Mortgages in Caldwell
Real Estate and Mortgage Overview in Caldwell
| Characteristic | Without Mortgage | With Mortgage |
| Housing Units | 729 | 345 |
| Median Property Value | $131,800 | $191,500 |
| Median Household Income | $65,795 | $74 |
| Monthly Housing Costs | $498 | $34 |
| Real Estate Taxes | $1,589 | $0 |
Property Value by Mortgage Status in Caldwell
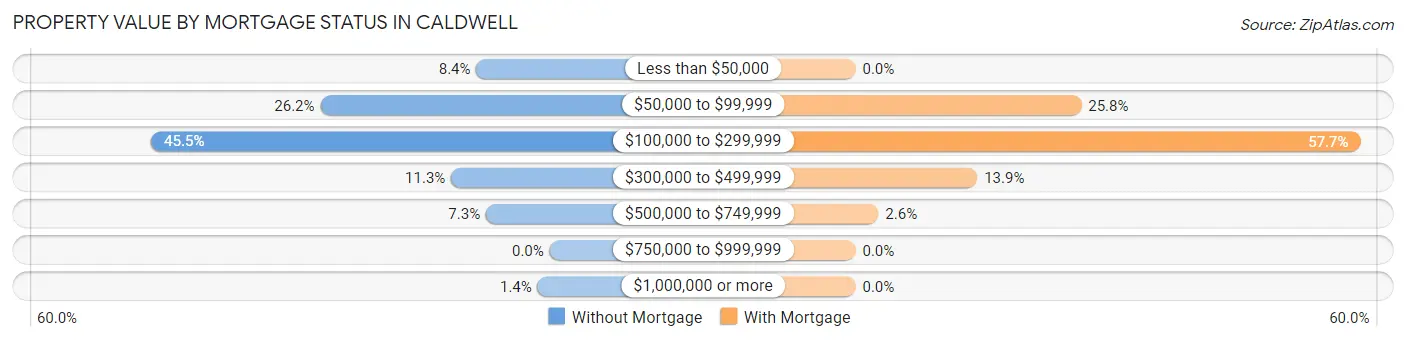
| Property Value | Without Mortgage | With Mortgage |
| Less than $50,000 | 61 (8.4%) | 0 (0.0%) |
| $50,000 to $99,999 | 191 (26.2%) | 89 (25.8%) |
| $100,000 to $299,999 | 332 (45.5%) | 199 (57.7%) |
| $300,000 to $499,999 | 82 (11.3%) | 48 (13.9%) |
| $500,000 to $749,999 | 53 (7.3%) | 9 (2.6%) |
| $750,000 to $999,999 | 0 (0.0%) | 0 (0.0%) |
| $1,000,000 or more | 10 (1.4%) | 0 (0.0%) |
| Total | 729 (100.0%) | 345 (100.0%) |
Household Income by Mortgage Status in Caldwell
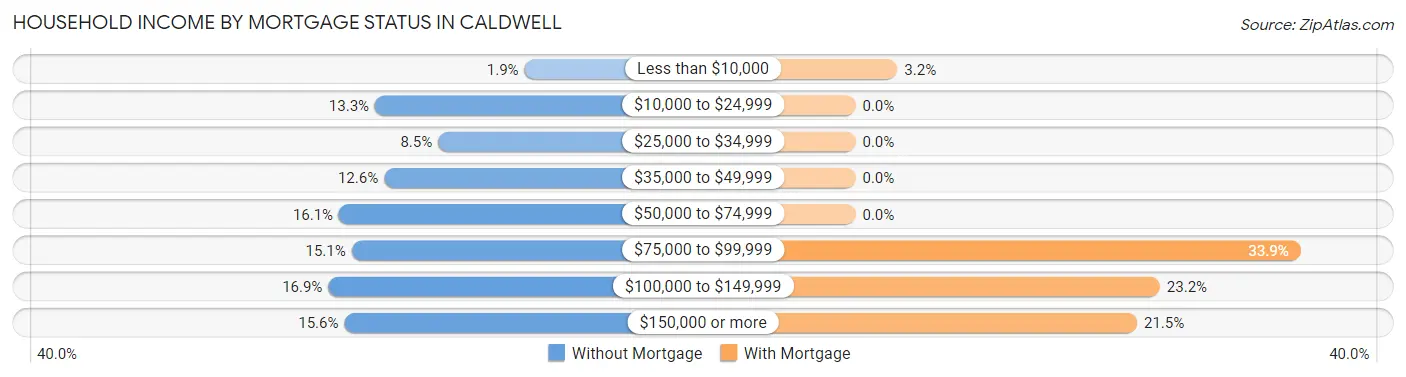
| Household Income | Without Mortgage | With Mortgage |
| Less than $10,000 | 14 (1.9%) | 11 (3.2%) |
| $10,000 to $24,999 | 97 (13.3%) | 0 (0.0%) |
| $25,000 to $34,999 | 62 (8.5%) | 0 (0.0%) |
| $35,000 to $49,999 | 92 (12.6%) | 0 (0.0%) |
| $50,000 to $74,999 | 117 (16.1%) | 0 (0.0%) |
| $75,000 to $99,999 | 110 (15.1%) | 117 (33.9%) |
| $100,000 to $149,999 | 123 (16.9%) | 80 (23.2%) |
| $150,000 or more | 114 (15.6%) | 74 (21.4%) |
| Total | 729 (100.0%) | 345 (100.0%) |
Property Value to Household Income Ratio in Caldwell
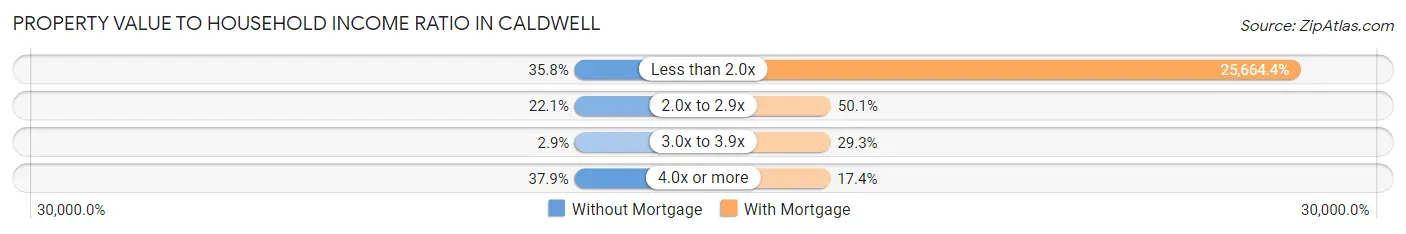
| Value-to-Income Ratio | Without Mortgage | With Mortgage |
| Less than 2.0x | 261 (35.8%) | 88,542 (25,664.4%) |
| 2.0x to 2.9x | 161 (22.1%) | 173 (50.1%) |
| 3.0x to 3.9x | 21 (2.9%) | 101 (29.3%) |
| 4.0x or more | 276 (37.9%) | 60 (17.4%) |
| Total | 729 (100.0%) | 345 (100.0%) |
Real Estate Taxes by Mortgage Status in Caldwell
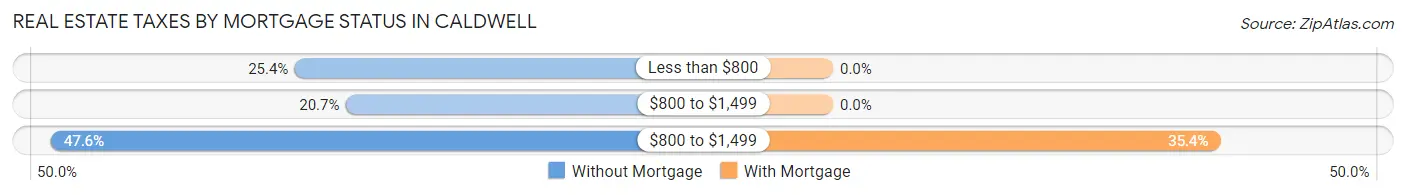
| Property Taxes | Without Mortgage | With Mortgage |
| Less than $800 | 185 (25.4%) | 0 (0.0%) |
| $800 to $1,499 | 151 (20.7%) | 0 (0.0%) |
| $800 to $1,499 | 347 (47.6%) | 122 (35.4%) |
| Total | 729 (100.0%) | 345 (100.0%) |
Health & Disability in Caldwell
Health Insurance Coverage by Age in Caldwell
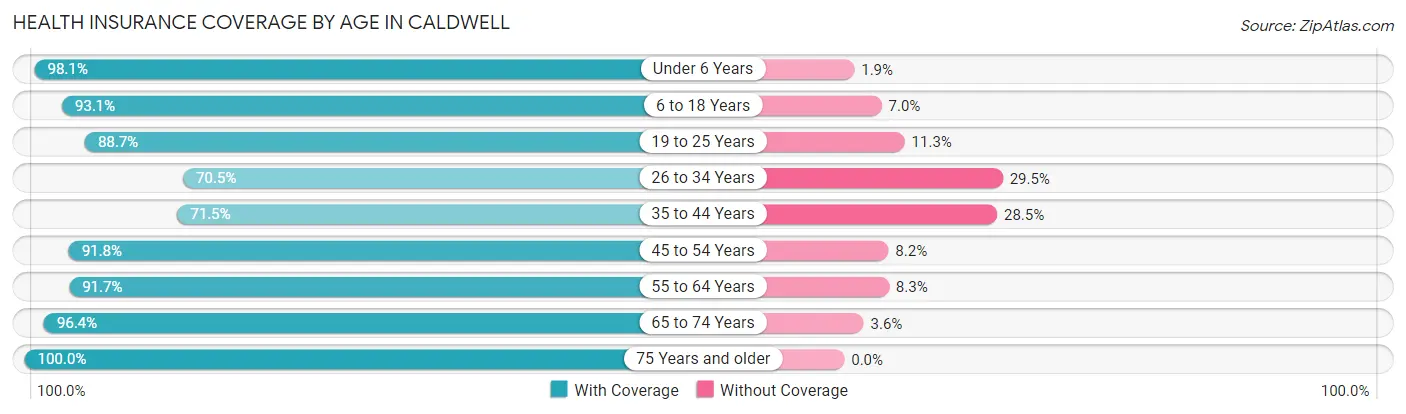
| Age Bracket | With Coverage | Without Coverage |
| Under 6 Years | 369 (98.1%) | 7 (1.9%) |
| 6 to 18 Years | 669 (93.0%) | 50 (7.0%) |
| 19 to 25 Years | 197 (88.7%) | 25 (11.3%) |
| 26 to 34 Years | 322 (70.5%) | 135 (29.5%) |
| 35 to 44 Years | 384 (71.5%) | 153 (28.5%) |
| 45 to 54 Years | 591 (91.8%) | 53 (8.2%) |
| 55 to 64 Years | 430 (91.7%) | 39 (8.3%) |
| 65 to 74 Years | 268 (96.4%) | 10 (3.6%) |
| 75 Years and older | 227 (100.0%) | 0 (0.0%) |
| Total | 3,457 (88.0%) | 472 (12.0%) |
Health Insurance Coverage by Citizenship Status in Caldwell
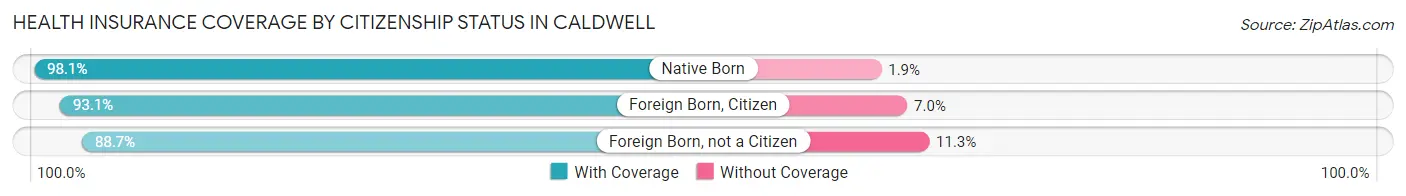
| Citizenship Status | With Coverage | Without Coverage |
| Native Born | 369 (98.1%) | 7 (1.9%) |
| Foreign Born, Citizen | 669 (93.0%) | 50 (7.0%) |
| Foreign Born, not a Citizen | 197 (88.7%) | 25 (11.3%) |
Health Insurance Coverage by Household Income in Caldwell
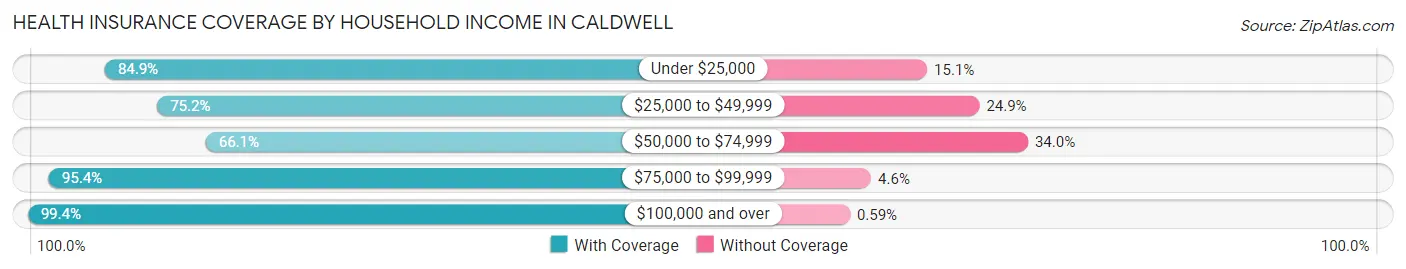
| Household Income | With Coverage | Without Coverage |
| Under $25,000 | 378 (84.9%) | 67 (15.1%) |
| $25,000 to $49,999 | 487 (75.1%) | 161 (24.8%) |
| $50,000 to $74,999 | 393 (66.0%) | 202 (34.0%) |
| $75,000 to $99,999 | 690 (95.4%) | 33 (4.6%) |
| $100,000 and over | 1,509 (99.4%) | 9 (0.6%) |
Public vs Private Health Insurance Coverage by Age in Caldwell
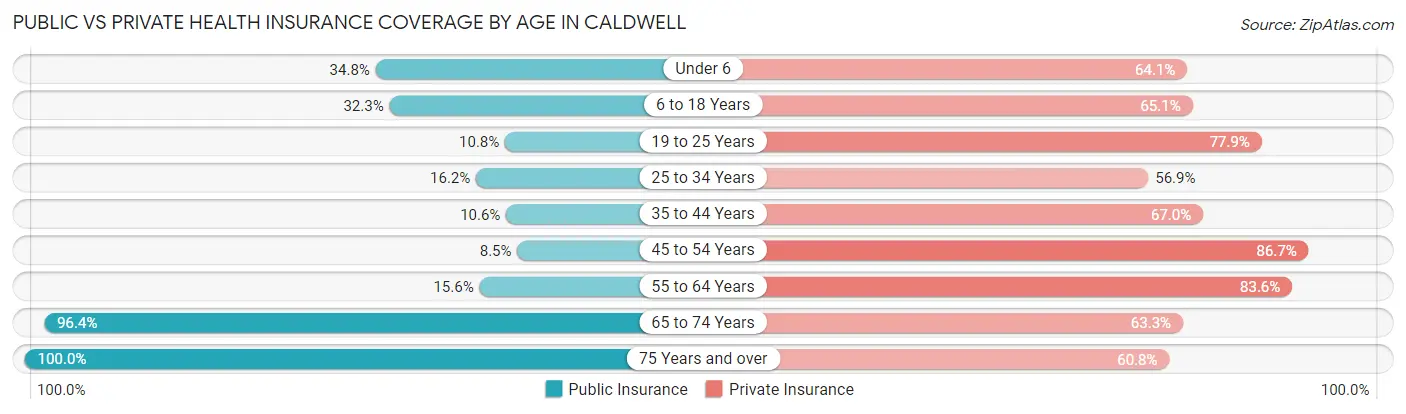
| Age Bracket | Public Insurance | Private Insurance |
| Under 6 | 131 (34.8%) | 241 (64.1%) |
| 6 to 18 Years | 232 (32.3%) | 468 (65.1%) |
| 19 to 25 Years | 24 (10.8%) | 173 (77.9%) |
| 25 to 34 Years | 74 (16.2%) | 260 (56.9%) |
| 35 to 44 Years | 57 (10.6%) | 360 (67.0%) |
| 45 to 54 Years | 55 (8.5%) | 558 (86.7%) |
| 55 to 64 Years | 73 (15.6%) | 392 (83.6%) |
| 65 to 74 Years | 268 (96.4%) | 176 (63.3%) |
| 75 Years and over | 227 (100.0%) | 138 (60.8%) |
| Total | 1,141 (29.0%) | 2,766 (70.4%) |
Disability Status by Sex by Age in Caldwell
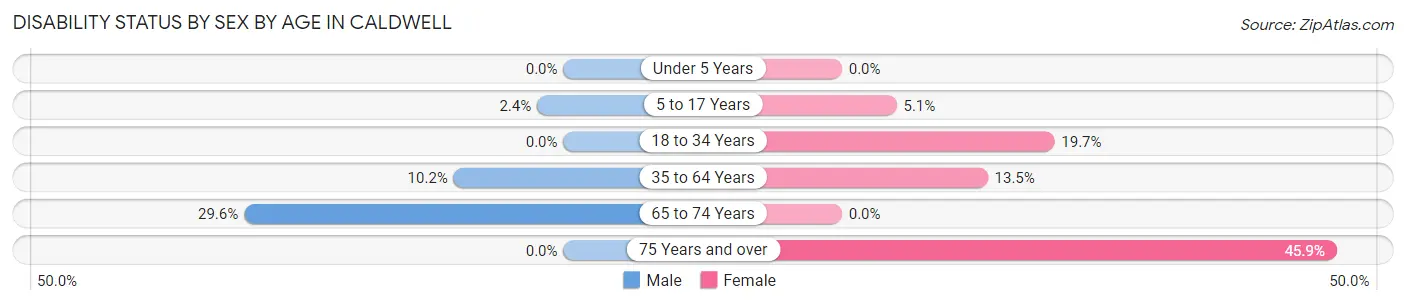
| Age Bracket | Male | Female |
| Under 5 Years | 0 (0.0%) | 0 (0.0%) |
| 5 to 17 Years | 10 (2.4%) | 20 (5.1%) |
| 18 to 34 Years | 0 (0.0%) | 73 (19.7%) |
| 35 to 64 Years | 83 (10.2%) | 113 (13.5%) |
| 65 to 74 Years | 40 (29.6%) | 0 (0.0%) |
| 75 Years and over | 0 (0.0%) | 62 (45.9%) |
Disability Class by Sex by Age in Caldwell
Disability Class: Hearing Difficulty
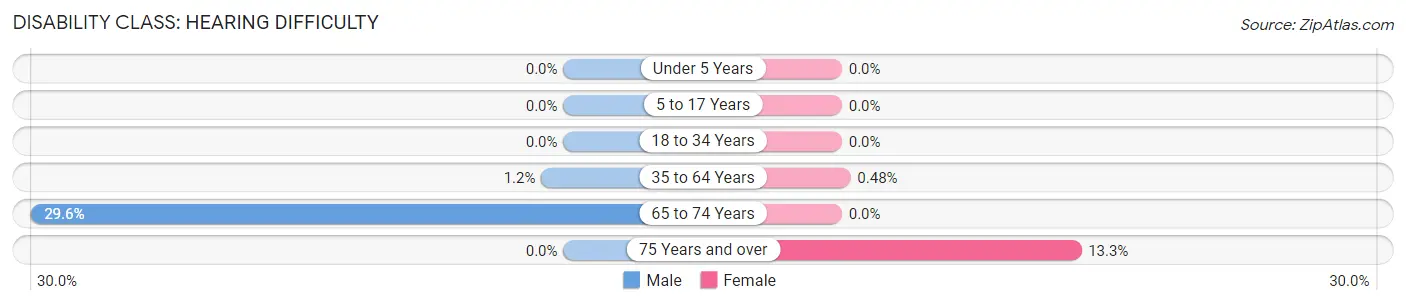
| Age Bracket | Male | Female |
| Under 5 Years | 0 (0.0%) | 0 (0.0%) |
| 5 to 17 Years | 0 (0.0%) | 0 (0.0%) |
| 18 to 34 Years | 0 (0.0%) | 0 (0.0%) |
| 35 to 64 Years | 10 (1.2%) | 4 (0.5%) |
| 65 to 74 Years | 40 (29.6%) | 0 (0.0%) |
| 75 Years and over | 0 (0.0%) | 18 (13.3%) |
Disability Class: Vision Difficulty
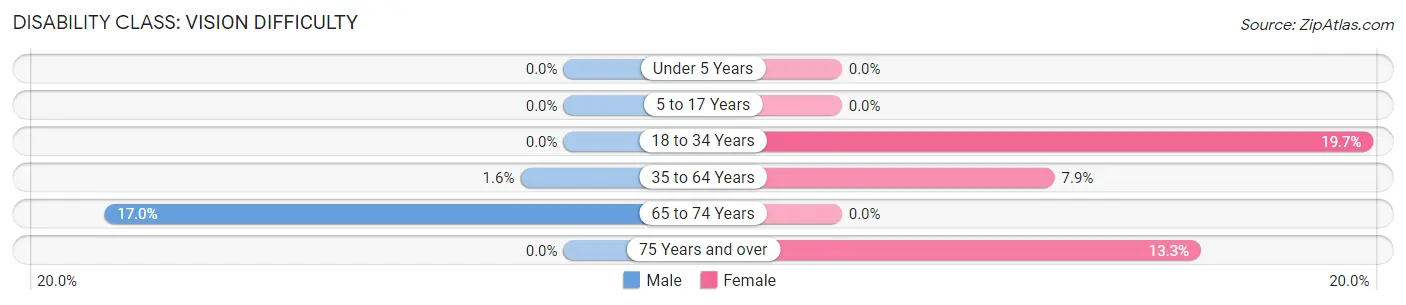
| Age Bracket | Male | Female |
| Under 5 Years | 0 (0.0%) | 0 (0.0%) |
| 5 to 17 Years | 0 (0.0%) | 0 (0.0%) |
| 18 to 34 Years | 0 (0.0%) | 73 (19.7%) |
| 35 to 64 Years | 13 (1.6%) | 66 (7.9%) |
| 65 to 74 Years | 23 (17.0%) | 0 (0.0%) |
| 75 Years and over | 0 (0.0%) | 18 (13.3%) |
Disability Class: Cognitive Difficulty
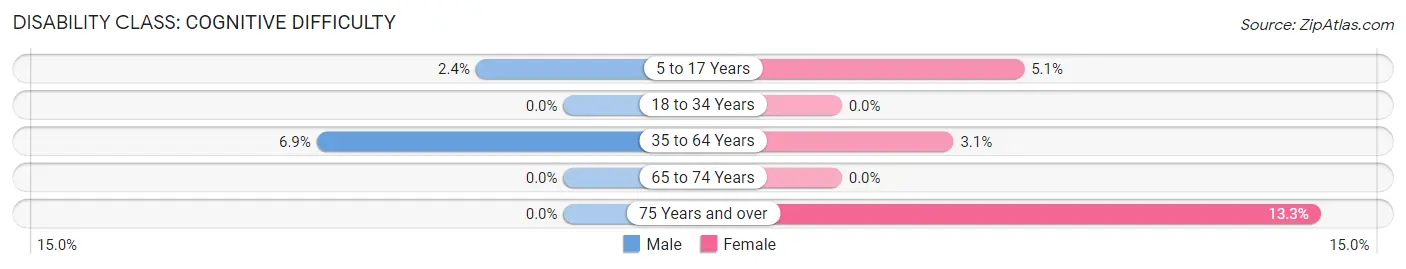
| Age Bracket | Male | Female |
| 5 to 17 Years | 10 (2.4%) | 20 (5.1%) |
| 18 to 34 Years | 0 (0.0%) | 0 (0.0%) |
| 35 to 64 Years | 56 (6.9%) | 26 (3.1%) |
| 65 to 74 Years | 0 (0.0%) | 0 (0.0%) |
| 75 Years and over | 0 (0.0%) | 18 (13.3%) |
Disability Class: Ambulatory Difficulty
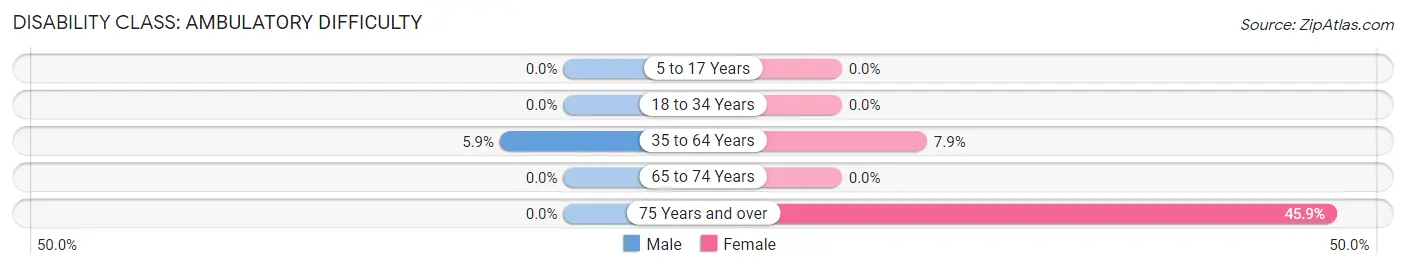
| Age Bracket | Male | Female |
| 5 to 17 Years | 0 (0.0%) | 0 (0.0%) |
| 18 to 34 Years | 0 (0.0%) | 0 (0.0%) |
| 35 to 64 Years | 48 (5.9%) | 66 (7.9%) |
| 65 to 74 Years | 0 (0.0%) | 0 (0.0%) |
| 75 Years and over | 0 (0.0%) | 62 (45.9%) |
Disability Class: Self-Care Difficulty
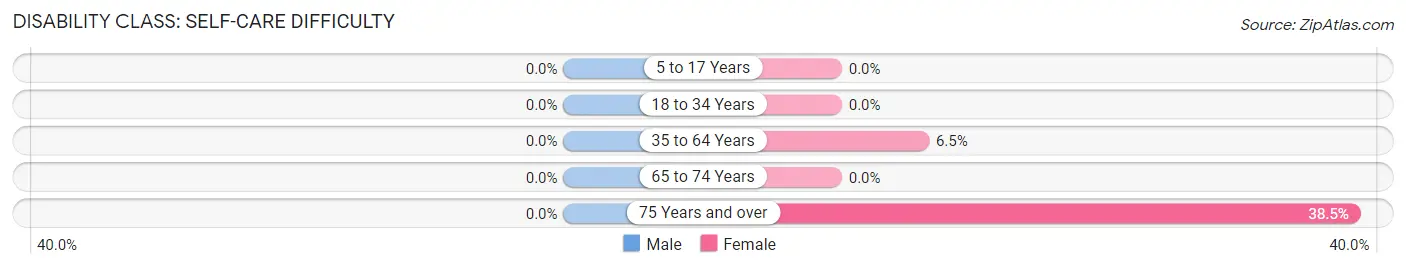
| Age Bracket | Male | Female |
| 5 to 17 Years | 0 (0.0%) | 0 (0.0%) |
| 18 to 34 Years | 0 (0.0%) | 0 (0.0%) |
| 35 to 64 Years | 0 (0.0%) | 54 (6.5%) |
| 65 to 74 Years | 0 (0.0%) | 0 (0.0%) |
| 75 Years and over | 0 (0.0%) | 52 (38.5%) |
Technology Access in Caldwell
Computing Device Access in Caldwell
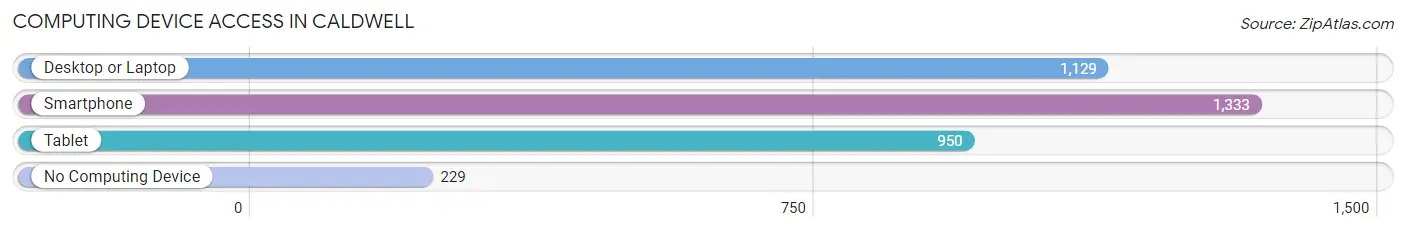
| Device Type | # Households | % Households |
| Desktop or Laptop | 1,129 | 69.6% |
| Smartphone | 1,333 | 82.2% |
| Tablet | 950 | 58.6% |
| No Computing Device | 229 | 14.1% |
| Total | 1,622 | 100.0% |
Internet Access in Caldwell
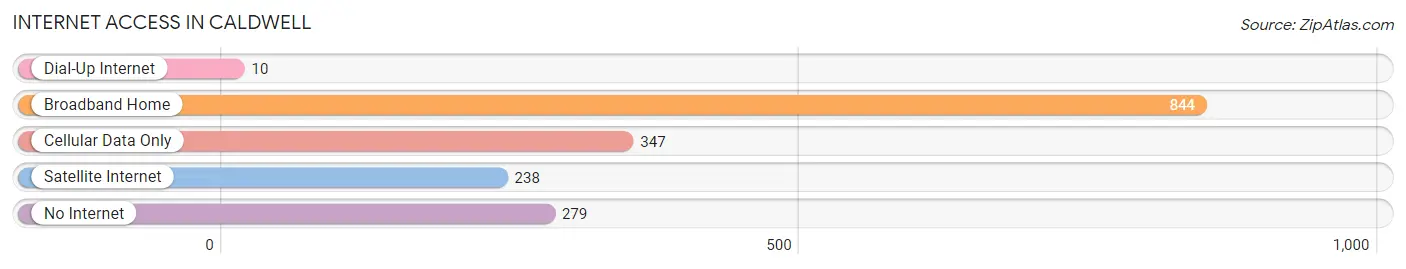
| Internet Type | # Households | % Households |
| Dial-Up Internet | 10 | 0.6% |
| Broadband Home | 844 | 52.0% |
| Cellular Data Only | 347 | 21.4% |
| Satellite Internet | 238 | 14.7% |
| No Internet | 279 | 17.2% |
| Total | 1,622 | 100.0% |
Caldwell Summary
Caldwell, Texas is a small city located in Burleson County, Texas, United States. It is situated about halfway between Austin and Houston, and is part of the Bryan-College Station metropolitan area. The population of Caldwell was 4,092 at the 2010 census.
History
Caldwell was founded in 1848 by James Caldwell, a veteran of the Texas Revolution. The town was originally known as Caldwell's Station, and was a stop on the stagecoach line between Houston and Austin. In 1872, the Houston and Texas Central Railway was built through the town, and the name was changed to Caldwell. The town was incorporated in 1876.
In the late 19th century, Caldwell was a center of cotton production and processing. The town was also home to several sawmills and gristmills. In the early 20th century, Caldwell was a major shipping point for livestock and agricultural products.
Geography
Caldwell is located at the intersection of U.S. Route 190 and State Highway 21, about halfway between Austin and Houston. The city is situated at the confluence of the Brazos and Little Brazos Rivers. The terrain is mostly flat, with some rolling hills in the surrounding area.
The climate in Caldwell is humid subtropical, with hot summers and mild winters. The average annual temperature is 68°F (20°C), and the average annual precipitation is 37 inches (94 cm).
Economy
Caldwell's economy is largely based on agriculture and manufacturing. The city is home to several large agricultural operations, including a cotton gin, a feed mill, and a poultry processing plant. The city is also home to several manufacturing companies, including a plastics manufacturer and a metal fabrication plant.
The city is also home to several retail stores, restaurants, and other businesses. The city is served by the Caldwell Independent School District.
Demographics
As of the 2010 census, the population of Caldwell was 4,092. The racial makeup of the city was 79.3% White, 15.2% Hispanic or Latino, 2.7% African American, 0.7% Native American, 0.4% Asian, and 1.5% from other races.
The median household income in Caldwell was $37,917, and the median family income was $45,938. The per capita income was $17,945. About 17.3% of the population was below the poverty line.
Conclusion
Caldwell, Texas is a small city located in Burleson County, Texas, United States. It is situated about halfway between Austin and Houston, and is part of the Bryan-College Station metropolitan area. The city was founded in 1848 by James Caldwell, a veteran of the Texas Revolution, and was originally known as Caldwell's Station. The economy of Caldwell is largely based on agriculture and manufacturing, and the city is home to several large agricultural operations and manufacturing companies. The population of Caldwell was 4,092 at the 2010 census, and the racial makeup of the city was 79.3% White, 15.2% Hispanic or Latino, 2.7% African American, 0.7% Native American, 0.4% Asian, and 1.5% from other races. The median household income in Caldwell was $37,917, and the median family income was $45,938. About 17.3% of the population was below the poverty line.
Common Questions
What is Per Capita Income in Caldwell?
Per Capita income in Caldwell is $32,898.
What is the Median Family Income in Caldwell?
Median Family Income in Caldwell is $79,167.
What is the Median Household income in Caldwell?
Median Household Income in Caldwell is $57,222.
What is Income or Wage Gap in Caldwell?
Income or Wage Gap in Caldwell is 17.8%.
Women in Caldwell earn 82.2 cents for every dollar earned by a man.
What is Family Income Deficit in Caldwell?
Family Income Deficit in Caldwell is $12,754.
Families that are below poverty line in Caldwell earn $12,754 less on average than the poverty threshold level.
What is Inequality or Gini Index in Caldwell?
Inequality or Gini Index in Caldwell is 0.41.
What is the Total Population of Caldwell?
Total Population of Caldwell is 4,120.
What is the Total Male Population of Caldwell?
Total Male Population of Caldwell is 2,076.
What is the Total Female Population of Caldwell?
Total Female Population of Caldwell is 2,044.
What is the Ratio of Males per 100 Females in Caldwell?
There are 101.57 Males per 100 Females in Caldwell.
What is the Ratio of Females per 100 Males in Caldwell?
There are 98.46 Females per 100 Males in Caldwell.
What is the Median Population Age in Caldwell?
Median Population Age in Caldwell is 40.2 Years.
What is the Average Family Size in Caldwell
Average Family Size in Caldwell is 3.2 People.
What is the Average Household Size in Caldwell
Average Household Size in Caldwell is 2.4 People.
How Large is the Labor Force in Caldwell?
There are 1,894 People in the Labor Forcein in Caldwell.
What is the Percentage of People in the Labor Force in Caldwell?
59.8% of People are in the Labor Force in Caldwell.
What is the Unemployment Rate in Caldwell?
Unemployment Rate in Caldwell is 0.2%.