Bullard, TX Map & Demographics
Bullard Map
Bullard Overview
$38,405
PER CAPITA INCOME
$119,653
AVG FAMILY INCOME
$104,141
AVG HOUSEHOLD INCOME
26.0%
WAGE / INCOME GAP [ % ]
74.0¢/ $1
WAGE / INCOME GAP [ $ ]
0.40
INEQUALITY / GINI INDEX
3,573
TOTAL POPULATION
1,801
MALE POPULATION
1,772
FEMALE POPULATION
101.64
MALES / 100 FEMALES
98.39
FEMALES / 100 MALES
33.6
MEDIAN AGE
3.7
AVG FAMILY SIZE
3.3
AVG HOUSEHOLD SIZE
1,673
LABOR FORCE [ PEOPLE ]
66.1%
PERCENT IN LABOR FORCE
1.9%
UNEMPLOYMENT RATE
Bullard Zip Codes
Bullard Area Codes
Income in Bullard
Income Overview in Bullard
Per Capita Income in Bullard is $38,405, while median incomes of families and households are $119,653 and $104,141 respectively.
| Characteristic | Number | Measure |
| Per Capita Income | 3,573 | $38,405 |
| Median Family Income | 889 | $119,653 |
| Mean Family Income | 889 | $131,615 |
| Median Household Income | 1,069 | $104,141 |
| Mean Household Income | 1,069 | $121,221 |
| Income Deficit | 889 | $0 |
| Wage / Income Gap (%) | 3,573 | 26.05% |
| Wage / Income Gap ($) | 3,573 | 73.95¢ per $1 |
| Gini / Inequality Index | 3,573 | 0.40 |
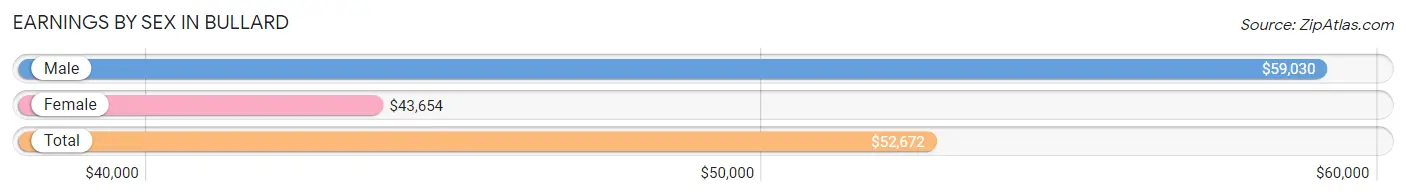
Earnings by Sex in Bullard
Average Earnings in Bullard are $52,672, $59,030 for men and $43,654 for women, a difference of 26.1%.
| Sex | Number | Average Earnings |
| Male | 1,019 (57.1%) | $59,030 |
| Female | 766 (42.9%) | $43,654 |
| Total | 1,785 (100.0%) | $52,672 |
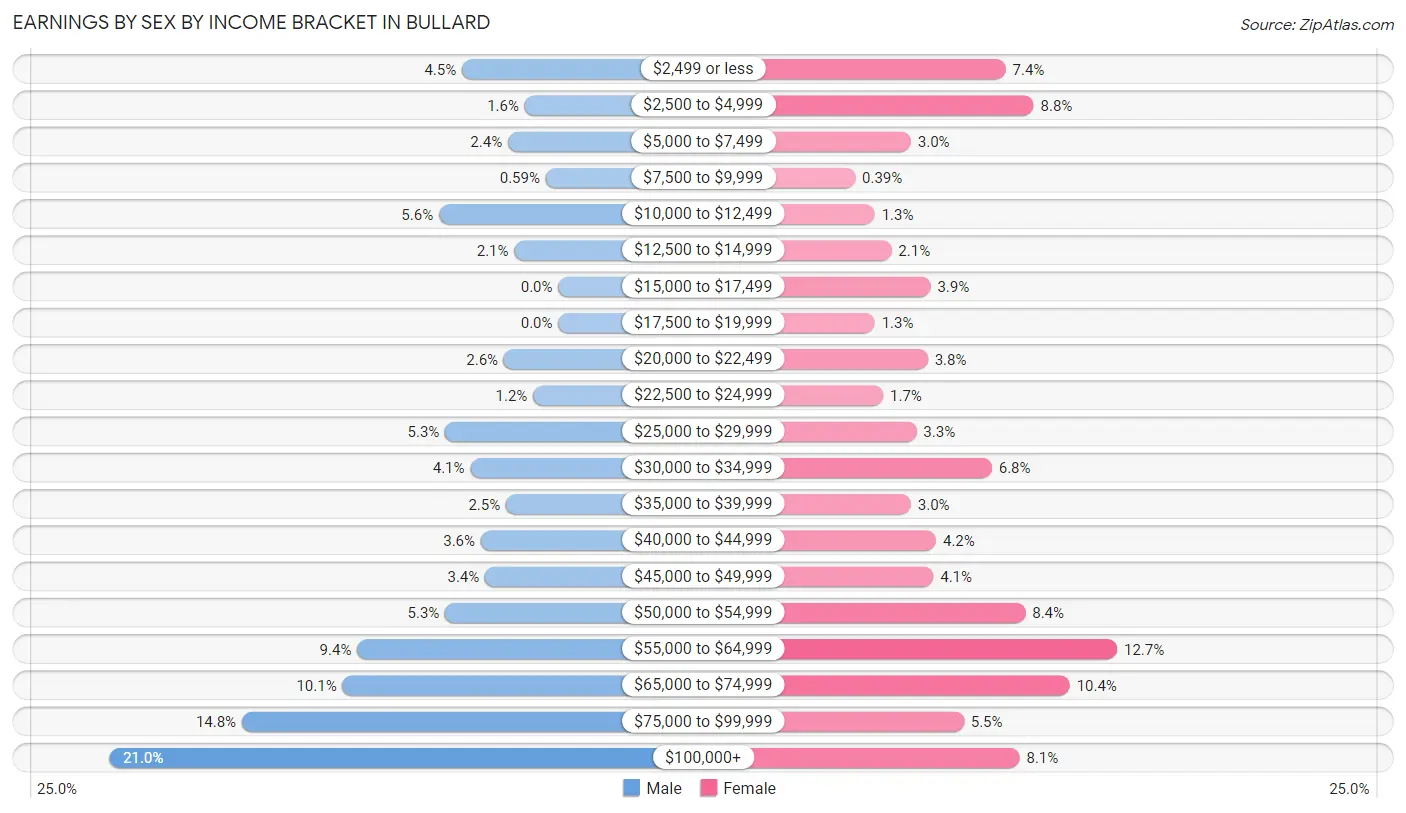
Earnings by Sex by Income Bracket in Bullard
The most common earnings brackets in Bullard are $100,000+ for men (214 | 21.0%) and $55,000 to $64,999 for women (97 | 12.7%).
| Income | Male | Female |
| $2,499 or less | 46 (4.5%) | 57 (7.4%) |
| $2,500 to $4,999 | 16 (1.6%) | 67 (8.7%) |
| $5,000 to $7,499 | 24 (2.4%) | 23 (3.0%) |
| $7,500 to $9,999 | 6 (0.6%) | 3 (0.4%) |
| $10,000 to $12,499 | 57 (5.6%) | 10 (1.3%) |
| $12,500 to $14,999 | 21 (2.1%) | 16 (2.1%) |
| $15,000 to $17,499 | 0 (0.0%) | 30 (3.9%) |
| $17,500 to $19,999 | 0 (0.0%) | 10 (1.3%) |
| $20,000 to $22,499 | 26 (2.5%) | 29 (3.8%) |
| $22,500 to $24,999 | 12 (1.2%) | 13 (1.7%) |
| $25,000 to $29,999 | 54 (5.3%) | 25 (3.3%) |
| $30,000 to $34,999 | 42 (4.1%) | 52 (6.8%) |
| $35,000 to $39,999 | 25 (2.5%) | 23 (3.0%) |
| $40,000 to $44,999 | 37 (3.6%) | 32 (4.2%) |
| $45,000 to $49,999 | 35 (3.4%) | 31 (4.1%) |
| $50,000 to $54,999 | 54 (5.3%) | 64 (8.4%) |
| $55,000 to $64,999 | 96 (9.4%) | 97 (12.7%) |
| $65,000 to $74,999 | 103 (10.1%) | 80 (10.4%) |
| $75,000 to $99,999 | 151 (14.8%) | 42 (5.5%) |
| $100,000+ | 214 (21.0%) | 62 (8.1%) |
| Total | 1,019 (100.0%) | 766 (100.0%) |
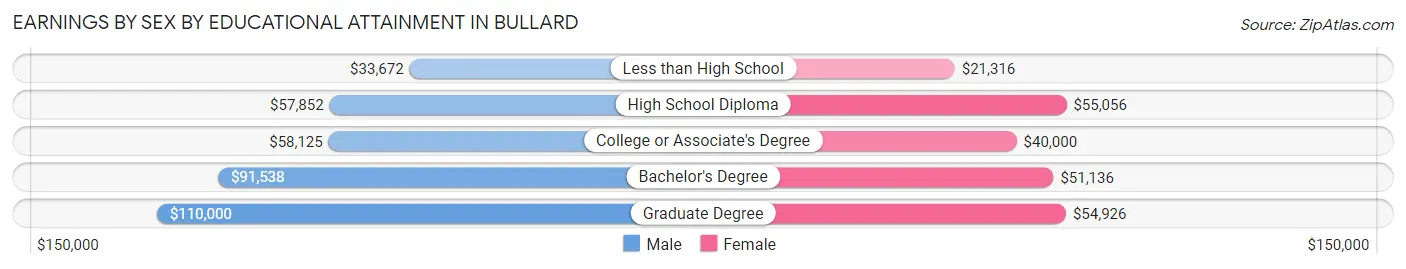
Earnings by Sex by Educational Attainment in Bullard
Average earnings in Bullard are $66,625 for men and $50,372 for women, a difference of 24.4%. Men with an educational attainment of graduate degree enjoy the highest average annual earnings of $110,000, while those with less than high school education earn the least with $33,672. Women with an educational attainment of high school diploma earn the most with the average annual earnings of $55,056, while those with less than high school education have the smallest earnings of $21,316.
| Educational Attainment | Male Income | Female Income |
| Less than High School | $33,672 | $21,316 |
| High School Diploma | $57,852 | $55,056 |
| College or Associate's Degree | $58,125 | $40,000 |
| Bachelor's Degree | $91,538 | $51,136 |
| Graduate Degree | $110,000 | $54,926 |
| Total | $66,625 | $50,372 |
Family Income in Bullard
Family Income Brackets in Bullard
According to the Bullard family income data, there are 245 families falling into the $100,000 to $149,999 income range, which is the most common income bracket and makes up 27.6% of all families. Conversely, the $15,000 to $24,999 income bracket is the least frequent group with only 20 families (2.2%) belonging to this category.
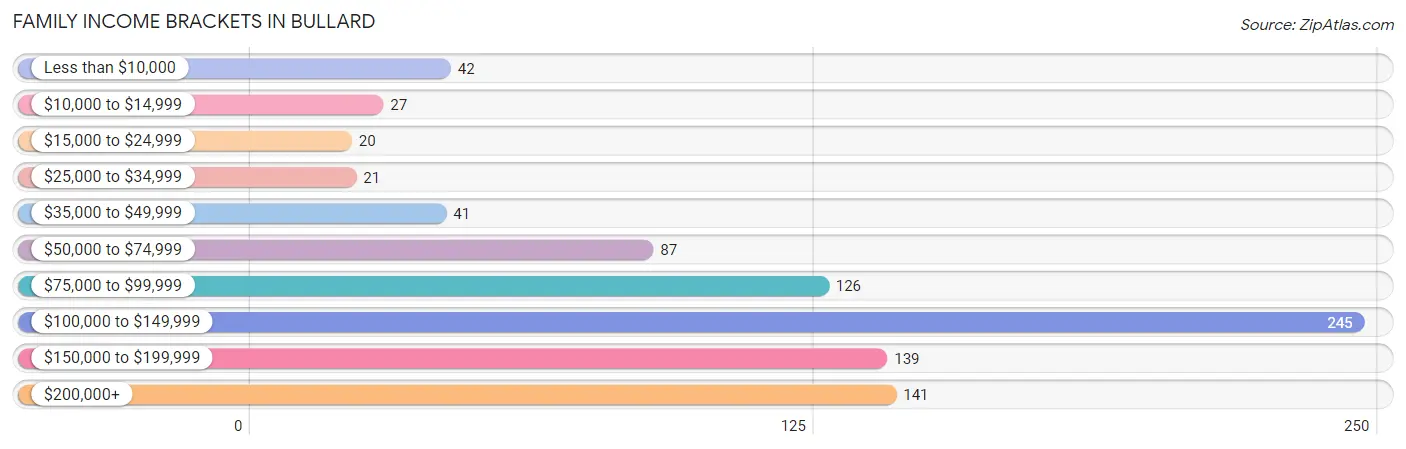
| Income Bracket | # Families | % Families |
| Less than $10,000 | 42 | 4.7% |
| $10,000 to $14,999 | 27 | 3.0% |
| $15,000 to $24,999 | 20 | 2.2% |
| $25,000 to $34,999 | 21 | 2.4% |
| $35,000 to $49,999 | 41 | 4.6% |
| $50,000 to $74,999 | 87 | 9.8% |
| $75,000 to $99,999 | 126 | 14.2% |
| $100,000 to $149,999 | 245 | 27.6% |
| $150,000 to $199,999 | 139 | 15.6% |
| $200,000+ | 141 | 15.9% |
Family Income by Famaliy Size in Bullard
6-person families (50 | 5.6%) account for the highest median family income in Bullard with $250,001 per family, while 2-person families (245 | 27.6%) have the highest median income of $42,812 per family member.
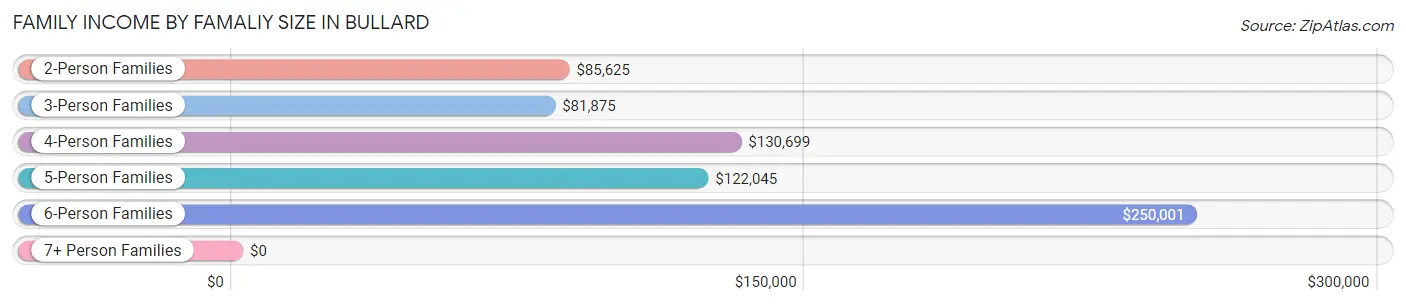
| Income Bracket | # Families | Median Income |
| 2-Person Families | 245 (27.6%) | $85,625 |
| 3-Person Families | 174 (19.6%) | $81,875 |
| 4-Person Families | 315 (35.4%) | $130,699 |
| 5-Person Families | 92 (10.3%) | $122,045 |
| 6-Person Families | 50 (5.6%) | $250,001 |
| 7+ Person Families | 13 (1.5%) | $0 |
| Total | 889 (100.0%) | $119,653 |
Family Income by Number of Earners in Bullard
The median family income in Bullard is $119,653, with families comprising 3+ earners (140) having the highest median family income of $151,667, while families with no earners (104) have the lowest median family income of $49,286, accounting for 15.8% and 11.7% of families, respectively.
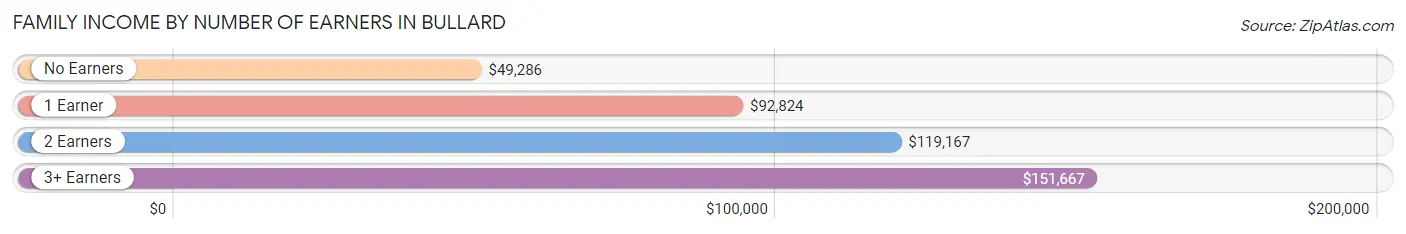
| Number of Earners | # Families | Median Income |
| No Earners | 104 (11.7%) | $49,286 |
| 1 Earner | 209 (23.5%) | $92,824 |
| 2 Earners | 436 (49.0%) | $119,167 |
| 3+ Earners | 140 (15.8%) | $151,667 |
| Total | 889 (100.0%) | $119,653 |
Household Income in Bullard
Household Income Brackets in Bullard
With 285 households falling in the category, the $100,000 to $149,999 income range is the most frequent in Bullard, accounting for 26.7% of all households. In contrast, only 24 households (2.2%) fall into the $15,000 to $24,999 income bracket, making it the least populous group.
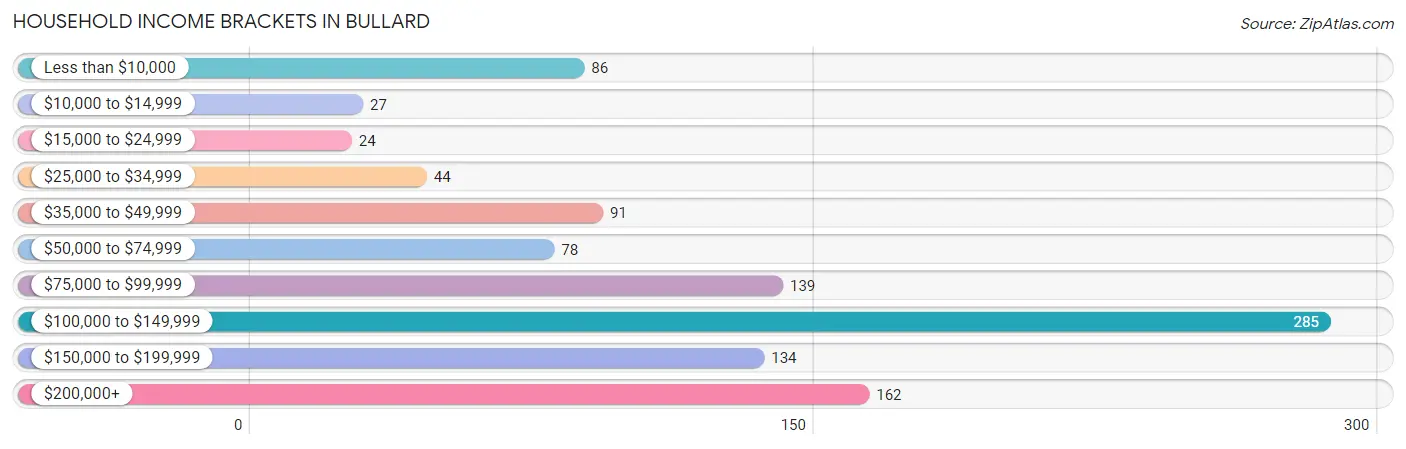
| Income Bracket | # Households | % Households |
| Less than $10,000 | 86 | 8.0% |
| $10,000 to $14,999 | 27 | 2.5% |
| $15,000 to $24,999 | 24 | 2.2% |
| $25,000 to $34,999 | 44 | 4.1% |
| $35,000 to $49,999 | 91 | 8.5% |
| $50,000 to $74,999 | 78 | 7.3% |
| $75,000 to $99,999 | 139 | 13.0% |
| $100,000 to $149,999 | 285 | 26.7% |
| $150,000 to $199,999 | 134 | 12.5% |
| $200,000+ | 162 | 15.2% |
Household Income by Householder Age in Bullard
The median household income in Bullard is $104,141, with the highest median household income of $118,750 found in the 45 to 64 years age bracket for the primary householder. A total of 318 households (29.7%) fall into this category.
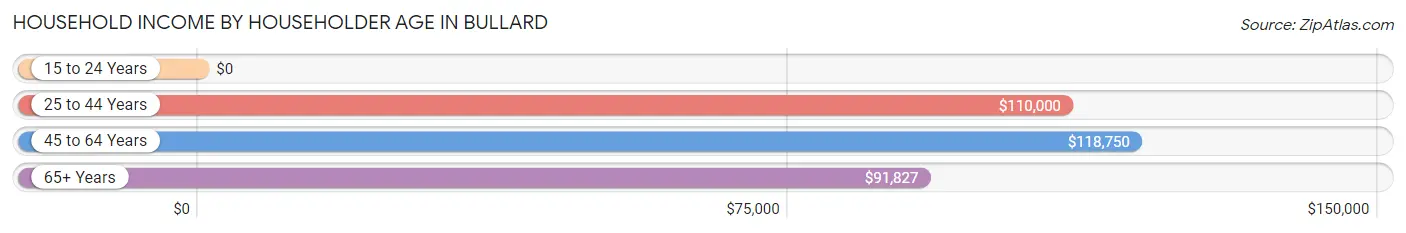
| Income Bracket | # Households | Median Income |
| 15 to 24 Years | 0 (0.0%) | $0 |
| 25 to 44 Years | 558 (52.2%) | $110,000 |
| 45 to 64 Years | 318 (29.7%) | $118,750 |
| 65+ Years | 193 (18.0%) | $91,827 |
| Total | 1,069 (100.0%) | $104,141 |
Poverty in Bullard
Income Below Poverty by Sex and Age in Bullard
With 11.8% poverty level for males and 7.5% for females among the residents of Bullard, under 5 year old males and 15 year old females are the most vulnerable to poverty, with 24 males (19.2%) and 19 females (47.5%) in their respective age groups living below the poverty level.
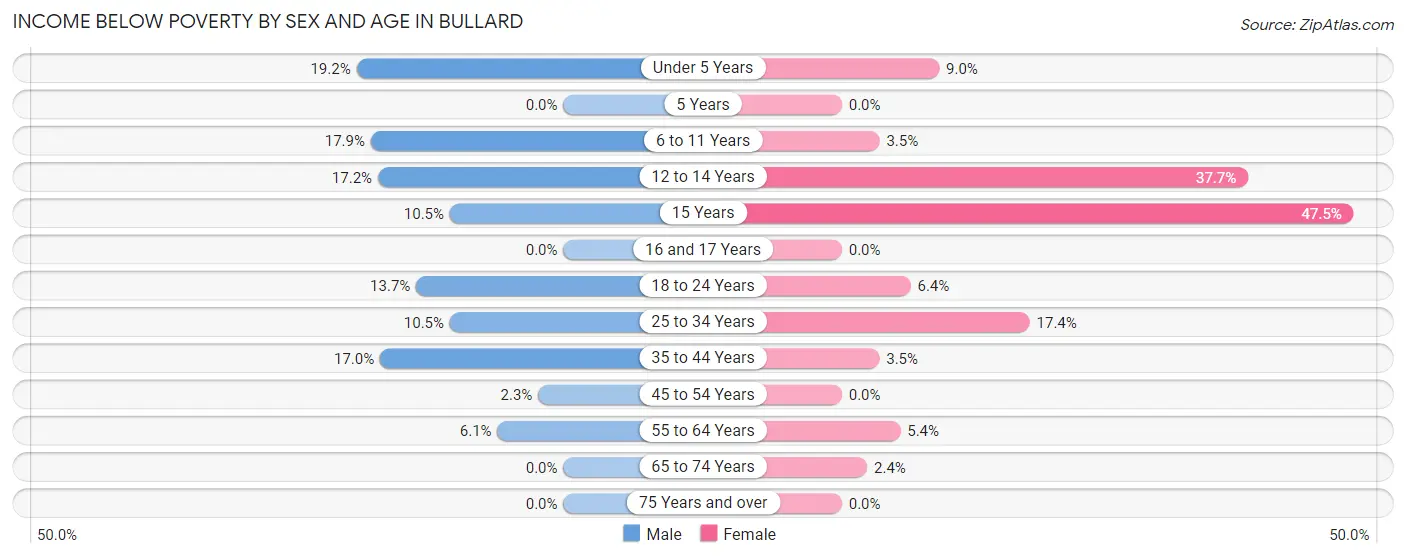
| Age Bracket | Male | Female |
| Under 5 Years | 24 (19.2%) | 14 (9.0%) |
| 5 Years | 0 (0.0%) | 0 (0.0%) |
| 6 to 11 Years | 37 (17.9%) | 9 (3.5%) |
| 12 to 14 Years | 21 (17.2%) | 23 (37.7%) |
| 15 Years | 4 (10.5%) | 19 (47.5%) |
| 16 and 17 Years | 0 (0.0%) | 0 (0.0%) |
| 18 to 24 Years | 25 (13.7%) | 6 (6.4%) |
| 25 to 34 Years | 24 (10.5%) | 42 (17.4%) |
| 35 to 44 Years | 67 (17.0%) | 11 (3.5%) |
| 45 to 54 Years | 4 (2.3%) | 0 (0.0%) |
| 55 to 64 Years | 6 (6.1%) | 5 (5.4%) |
| 65 to 74 Years | 0 (0.0%) | 4 (2.4%) |
| 75 Years and over | 0 (0.0%) | 0 (0.0%) |
| Total | 212 (11.8%) | 133 (7.5%) |
Income Above Poverty by Sex and Age in Bullard
According to the poverty statistics in Bullard, males aged 5 years and females aged 5 years are the age groups that are most secure financially, with 100.0% of males and 100.0% of females in these age groups living above the poverty line.
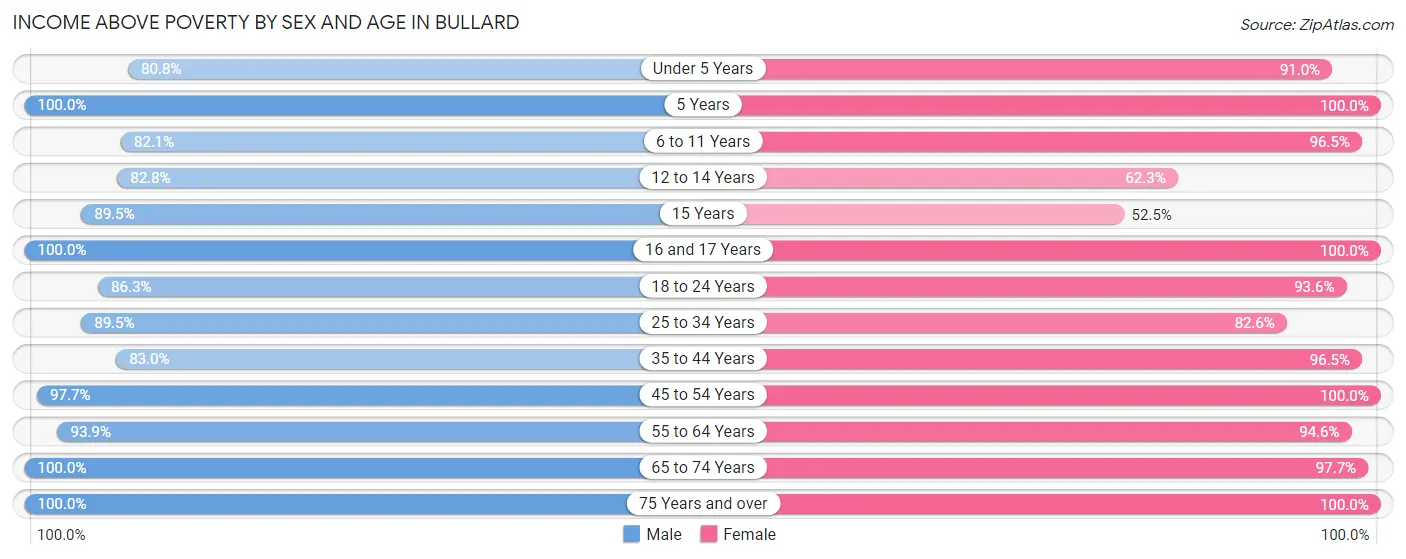
| Age Bracket | Male | Female |
| Under 5 Years | 101 (80.8%) | 141 (91.0%) |
| 5 Years | 34 (100.0%) | 3 (100.0%) |
| 6 to 11 Years | 170 (82.1%) | 248 (96.5%) |
| 12 to 14 Years | 101 (82.8%) | 38 (62.3%) |
| 15 Years | 34 (89.5%) | 21 (52.5%) |
| 16 and 17 Years | 35 (100.0%) | 66 (100.0%) |
| 18 to 24 Years | 158 (86.3%) | 88 (93.6%) |
| 25 to 34 Years | 204 (89.5%) | 199 (82.6%) |
| 35 to 44 Years | 327 (83.0%) | 305 (96.5%) |
| 45 to 54 Years | 167 (97.7%) | 209 (100.0%) |
| 55 to 64 Years | 92 (93.9%) | 87 (94.6%) |
| 65 to 74 Years | 64 (100.0%) | 166 (97.7%) |
| 75 Years and over | 102 (100.0%) | 68 (100.0%) |
| Total | 1,589 (88.2%) | 1,639 (92.5%) |
Income Below Poverty Among Married-Couple Families in Bullard
The poverty statistics for married-couple families in Bullard show that 3.0% or 21 of the total 690 families live below the poverty line. Families with 3 or 4 children have the highest poverty rate of 11.0%, comprising of 11 families. On the other hand, families with 1 or 2 children have the lowest poverty rate of 1.2%, which includes 4 families.
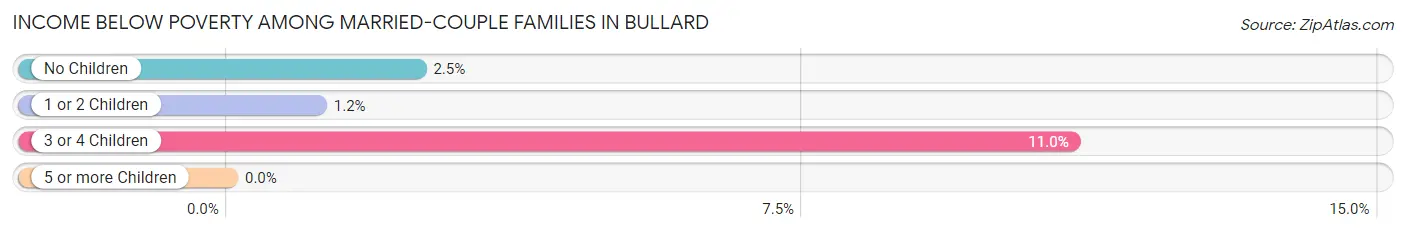
| Children | Above Poverty | Below Poverty |
| No Children | 238 (97.5%) | 6 (2.5%) |
| 1 or 2 Children | 342 (98.8%) | 4 (1.2%) |
| 3 or 4 Children | 89 (89.0%) | 11 (11.0%) |
| 5 or more Children | 0 (0.0%) | 0 (0.0%) |
| Total | 669 (97.0%) | 21 (3.0%) |
Income Below Poverty Among Single-Parent Households in Bullard
According to the poverty data in Bullard, 35.6% or 21 single-father households and 27.1% or 38 single-mother households are living below the poverty line. Among single-father households, those with no children have the highest poverty rate, with 21 households (56.8%) experiencing poverty. Likewise, among single-mother households, those with 3 or 4 children have the highest poverty rate, with 11 households (100.0%) falling below the poverty line.
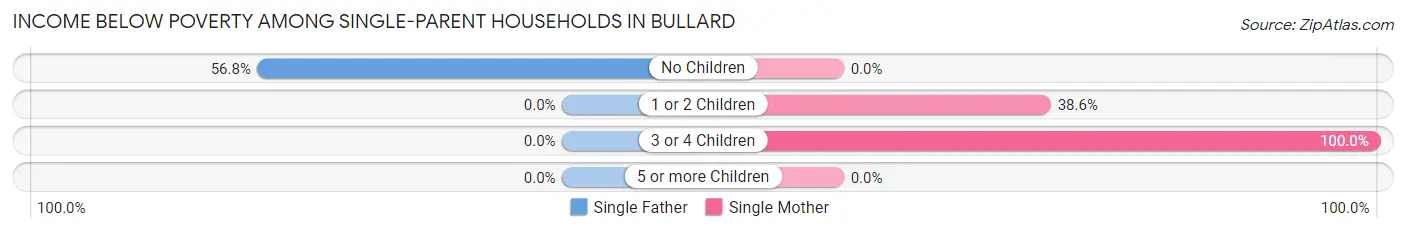
| Children | Single Father | Single Mother |
| No Children | 21 (56.8%) | 0 (0.0%) |
| 1 or 2 Children | 0 (0.0%) | 27 (38.6%) |
| 3 or 4 Children | 0 (0.0%) | 11 (100.0%) |
| 5 or more Children | 0 (0.0%) | 0 (0.0%) |
| Total | 21 (35.6%) | 38 (27.1%) |
Income Below Poverty Among Married-Couple vs Single-Parent Households in Bullard
The poverty data for Bullard shows that 21 of the married-couple family households (3.0%) and 59 of the single-parent households (29.6%) are living below the poverty level. Within the married-couple family households, those with 3 or 4 children have the highest poverty rate, with 11 households (11.0%) falling below the poverty line. Among the single-parent households, those with 3 or 4 children have the highest poverty rate, with 11 household (100.0%) living below poverty.
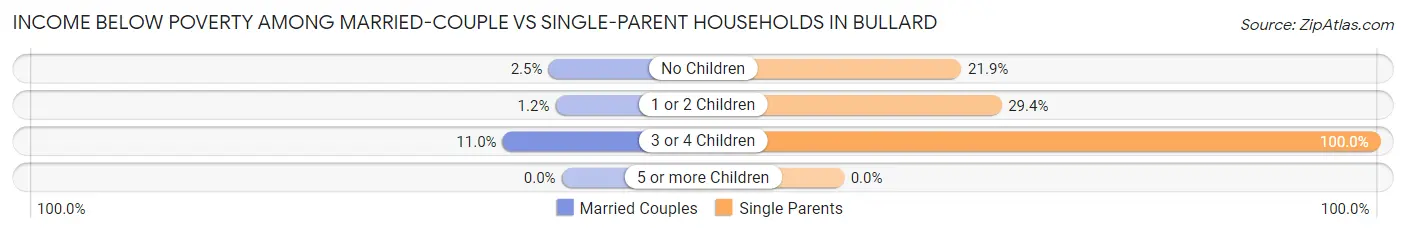
| Children | Married-Couple Families | Single-Parent Households |
| No Children | 6 (2.5%) | 21 (21.9%) |
| 1 or 2 Children | 4 (1.2%) | 27 (29.3%) |
| 3 or 4 Children | 11 (11.0%) | 11 (100.0%) |
| 5 or more Children | 0 (0.0%) | 0 (0.0%) |
| Total | 21 (3.0%) | 59 (29.6%) |
Race in Bullard
The most populous races in Bullard are White / Caucasian (2,975 | 83.3%), Hispanic or Latino (574 | 16.1%), and Two or more Races (330 | 9.2%).
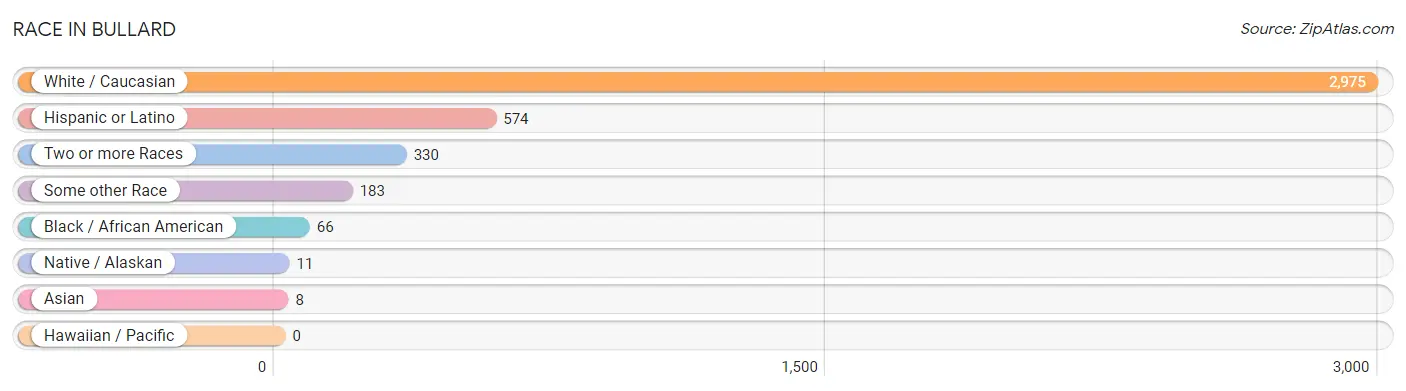
| Race | # Population | % Population |
| Asian | 8 | 0.2% |
| Black / African American | 66 | 1.8% |
| Hawaiian / Pacific | 0 | 0.0% |
| Hispanic or Latino | 574 | 16.1% |
| Native / Alaskan | 11 | 0.3% |
| White / Caucasian | 2,975 | 83.3% |
| Two or more Races | 330 | 9.2% |
| Some other Race | 183 | 5.1% |
| Total | 3,573 | 100.0% |
Ancestry in Bullard
The most populous ancestries reported in Bullard are American (598 | 16.7%), Mexican (480 | 13.4%), Irish (336 | 9.4%), English (323 | 9.0%), and German (186 | 5.2%), together accounting for 53.8% of all Bullard residents.
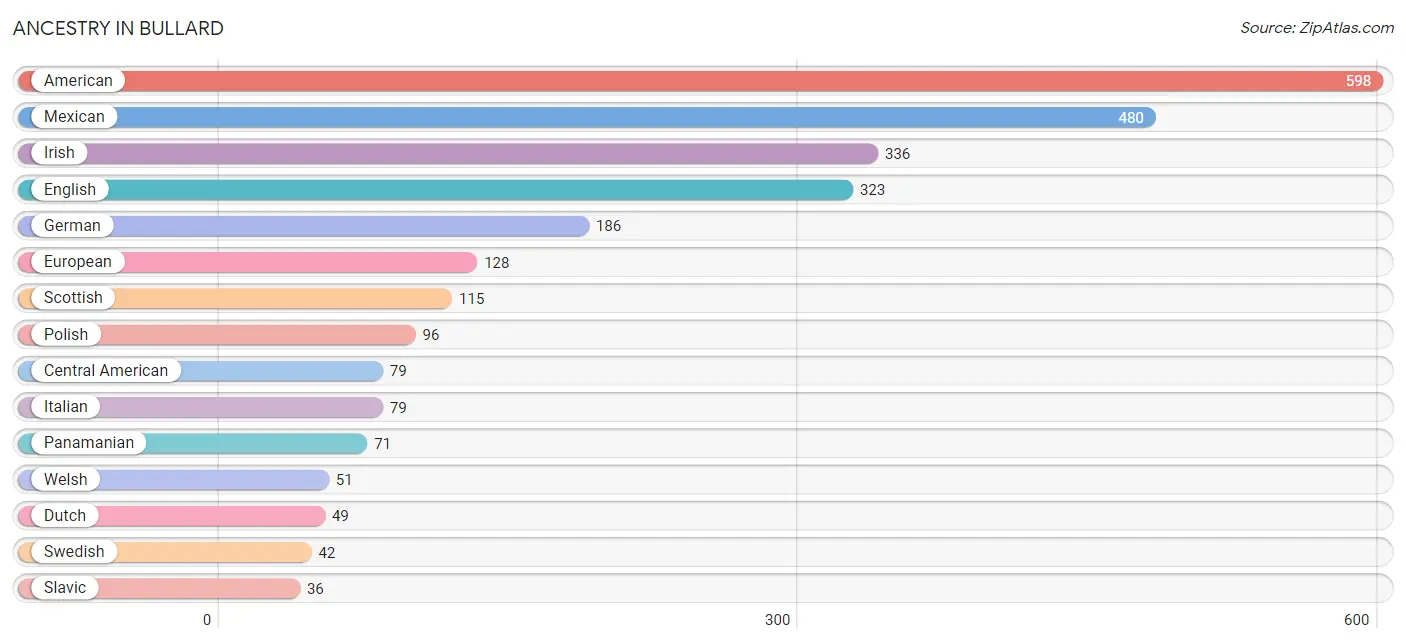
| Ancestry | # Population | % Population |
| American | 598 | 16.7% |
| Belgian | 4 | 0.1% |
| Bhutanese | 7 | 0.2% |
| British | 34 | 0.9% |
| Canadian | 9 | 0.3% |
| Central American | 79 | 2.2% |
| Cherokee | 32 | 0.9% |
| Colombian | 15 | 0.4% |
| Croatian | 3 | 0.1% |
| Czech | 1 | 0.0% |
| Danish | 4 | 0.1% |
| Dutch | 49 | 1.4% |
| English | 323 | 9.0% |
| European | 128 | 3.6% |
| French | 26 | 0.7% |
| French Canadian | 21 | 0.6% |
| German | 186 | 5.2% |
| Greek | 10 | 0.3% |
| Honduran | 8 | 0.2% |
| Irish | 336 | 9.4% |
| Italian | 79 | 2.2% |
| Korean | 8 | 0.2% |
| Mexican | 480 | 13.4% |
| Norwegian | 18 | 0.5% |
| Panamanian | 71 | 2.0% |
| Polish | 96 | 2.7% |
| Russian | 11 | 0.3% |
| Scotch-Irish | 8 | 0.2% |
| Scottish | 115 | 3.2% |
| Slavic | 36 | 1.0% |
| South African | 4 | 0.1% |
| South American | 15 | 0.4% |
| Subsaharan African | 4 | 0.1% |
| Swedish | 42 | 1.2% |
| Swiss | 3 | 0.1% |
| Welsh | 51 | 1.4% | View All 36 Rows |
Immigrants in Bullard
The most numerous immigrant groups reported in Bullard came from Latin America (96 | 2.7%), Central America (92 | 2.6%), Mexico (84 | 2.4%), Honduras (8 | 0.2%), and Asia (6 | 0.2%), together accounting for 8.0% of all Bullard residents.
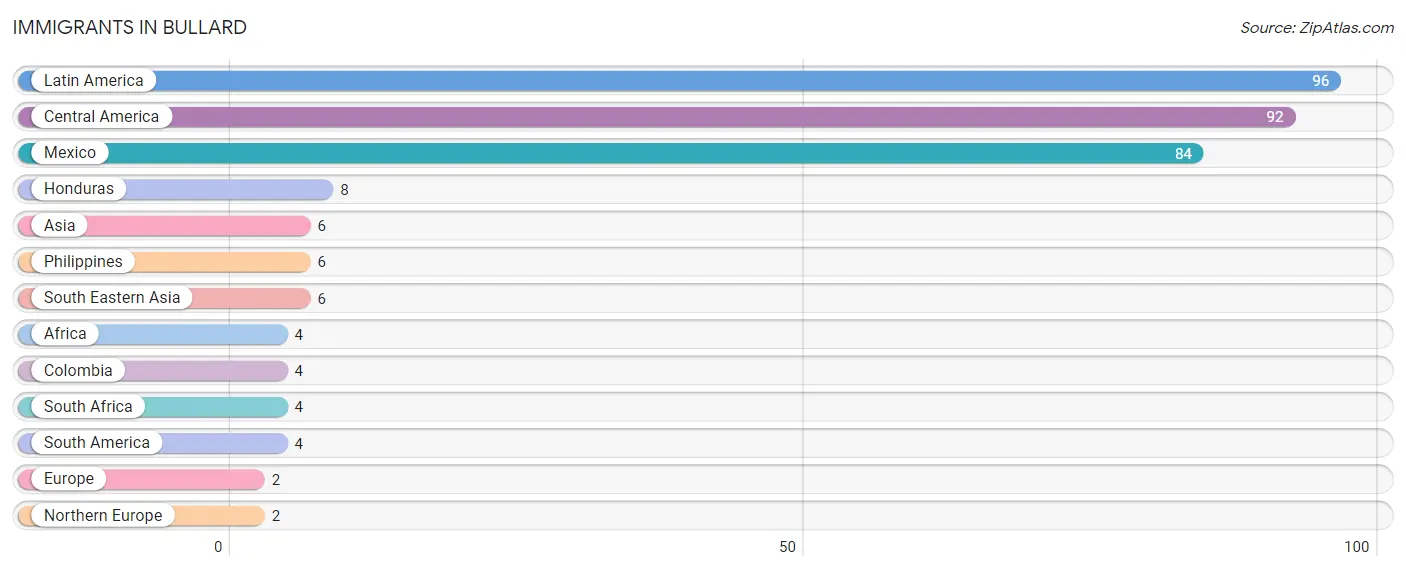
| Immigration Origin | # Population | % Population |
| Africa | 4 | 0.1% |
| Asia | 6 | 0.2% |
| Central America | 92 | 2.6% |
| Colombia | 4 | 0.1% |
| Europe | 2 | 0.1% |
| Honduras | 8 | 0.2% |
| Latin America | 96 | 2.7% |
| Mexico | 84 | 2.4% |
| Northern Europe | 2 | 0.1% |
| Philippines | 6 | 0.2% |
| South Africa | 4 | 0.1% |
| South America | 4 | 0.1% |
| South Eastern Asia | 6 | 0.2% | View All 13 Rows |
Sex and Age in Bullard
Sex and Age in Bullard
The most populous age groups in Bullard are 40 to 44 Years (291 | 16.2%) for men and 40 to 44 Years (195 | 11.0%) for women.
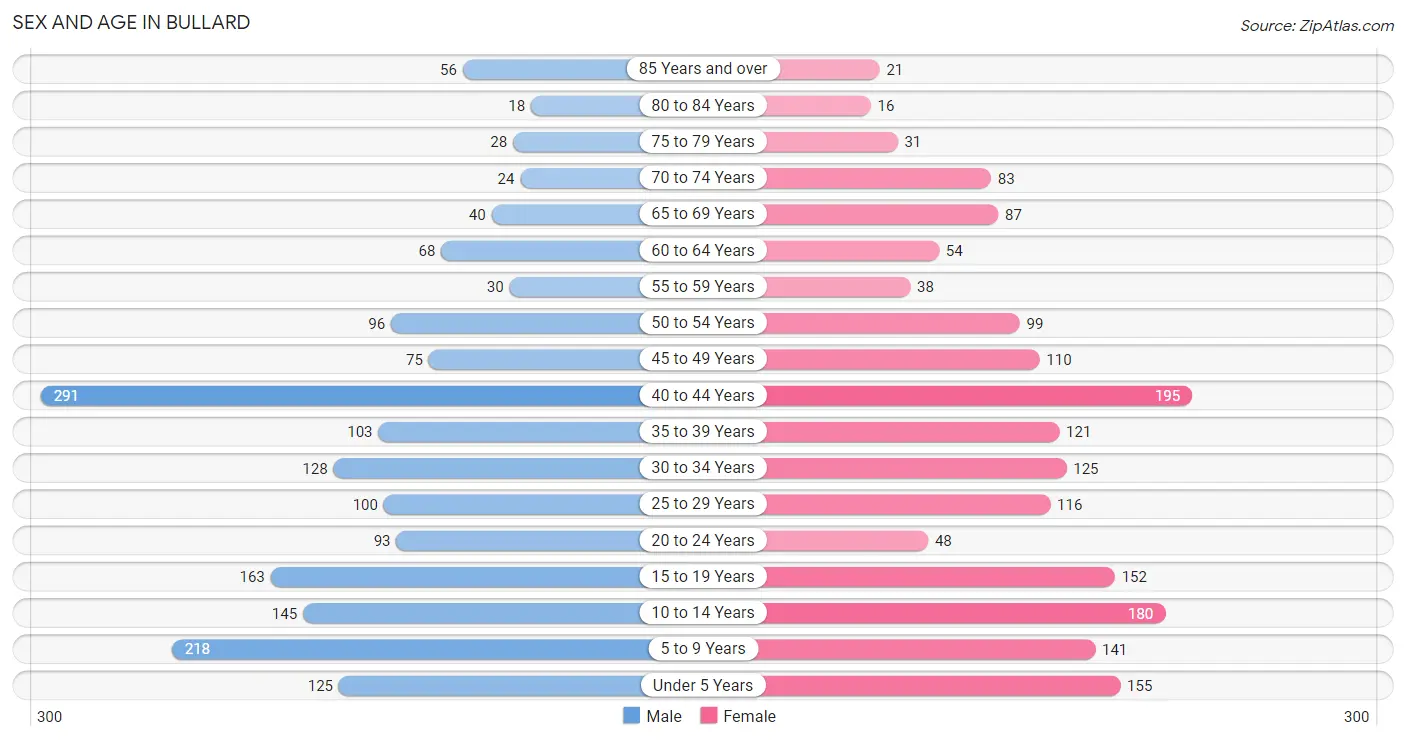
| Age Bracket | Male | Female |
| Under 5 Years | 125 (6.9%) | 155 (8.7%) |
| 5 to 9 Years | 218 (12.1%) | 141 (8.0%) |
| 10 to 14 Years | 145 (8.1%) | 180 (10.2%) |
| 15 to 19 Years | 163 (9.0%) | 152 (8.6%) |
| 20 to 24 Years | 93 (5.2%) | 48 (2.7%) |
| 25 to 29 Years | 100 (5.6%) | 116 (6.6%) |
| 30 to 34 Years | 128 (7.1%) | 125 (7.0%) |
| 35 to 39 Years | 103 (5.7%) | 121 (6.8%) |
| 40 to 44 Years | 291 (16.2%) | 195 (11.0%) |
| 45 to 49 Years | 75 (4.2%) | 110 (6.2%) |
| 50 to 54 Years | 96 (5.3%) | 99 (5.6%) |
| 55 to 59 Years | 30 (1.7%) | 38 (2.1%) |
| 60 to 64 Years | 68 (3.8%) | 54 (3.0%) |
| 65 to 69 Years | 40 (2.2%) | 87 (4.9%) |
| 70 to 74 Years | 24 (1.3%) | 83 (4.7%) |
| 75 to 79 Years | 28 (1.5%) | 31 (1.8%) |
| 80 to 84 Years | 18 (1.0%) | 16 (0.9%) |
| 85 Years and over | 56 (3.1%) | 21 (1.2%) |
| Total | 1,801 (100.0%) | 1,772 (100.0%) |
Families and Households in Bullard
Median Family Size in Bullard
The median family size in Bullard is 3.71 persons per family, with married-couple families (690 | 77.6%) accounting for the largest median family size of 3.79 persons per family. On the other hand, single male/father families (59 | 6.6%) represent the smallest median family size with 3.25 persons per family.
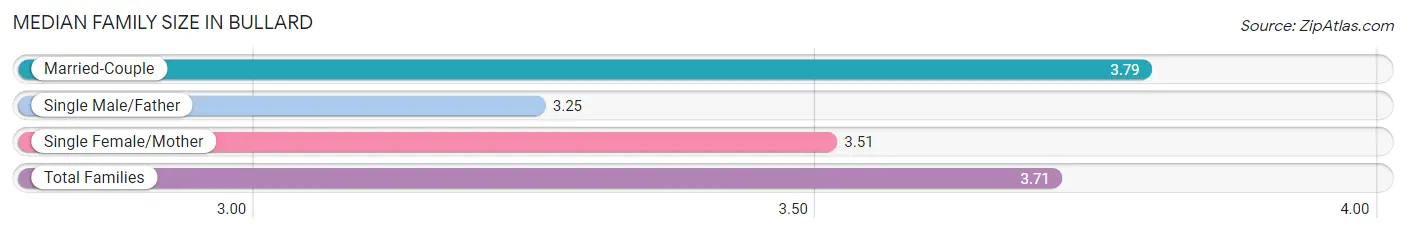
| Family Type | # Families | Family Size |
| Married-Couple | 690 (77.6%) | 3.79 |
| Single Male/Father | 59 (6.6%) | 3.25 |
| Single Female/Mother | 140 (15.8%) | 3.51 |
| Total Families | 889 (100.0%) | 3.71 |
Median Household Size in Bullard
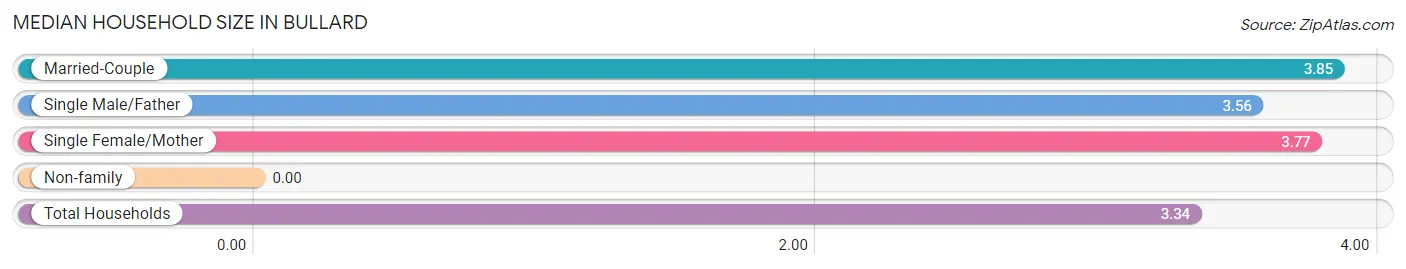
| Household Type | # Households | Household Size |
| Married-Couple | 690 (64.5%) | 3.85 |
| Single Male/Father | 59 (5.5%) | 3.56 |
| Single Female/Mother | 140 (13.1%) | 3.77 |
| Non-family | 180 (16.8%) | - |
| Total Households | 1,069 (100.0%) | 3.34 |
Household Size by Marriage Status in Bullard
Out of a total of 1,069 households in Bullard, 889 (83.2%) are family households, while 180 (16.8%) are nonfamily households. The most numerous type of family households are 4-person households, comprising 298, and the most common type of nonfamily households are 1-person households, comprising 180.
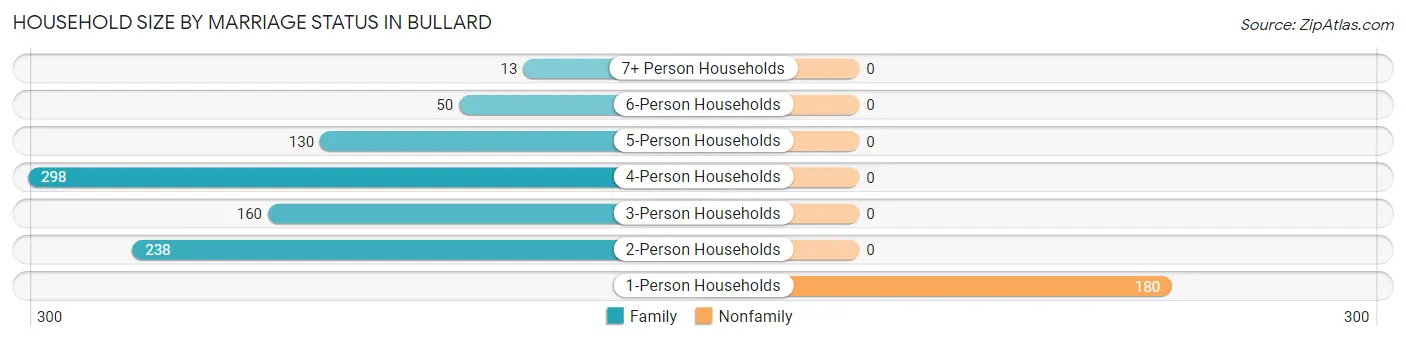
| Household Size | Family Households | Nonfamily Households |
| 1-Person Households | - | 180 (16.8%) |
| 2-Person Households | 238 (22.3%) | 0 (0.0%) |
| 3-Person Households | 160 (15.0%) | 0 (0.0%) |
| 4-Person Households | 298 (27.9%) | 0 (0.0%) |
| 5-Person Households | 130 (12.2%) | 0 (0.0%) |
| 6-Person Households | 50 (4.7%) | 0 (0.0%) |
| 7+ Person Households | 13 (1.2%) | 0 (0.0%) |
| Total | 889 (83.2%) | 180 (16.8%) |
Female Fertility in Bullard
Fertility by Age in Bullard
Average fertility rate in Bullard is 96.0 births per 1,000 women. Women in the age bracket of 20 to 34 years have the highest fertility rate with 280.0 births per 1,000 women. Women in the age bracket of 20 to 34 years acount for 96.4% of all women with births.
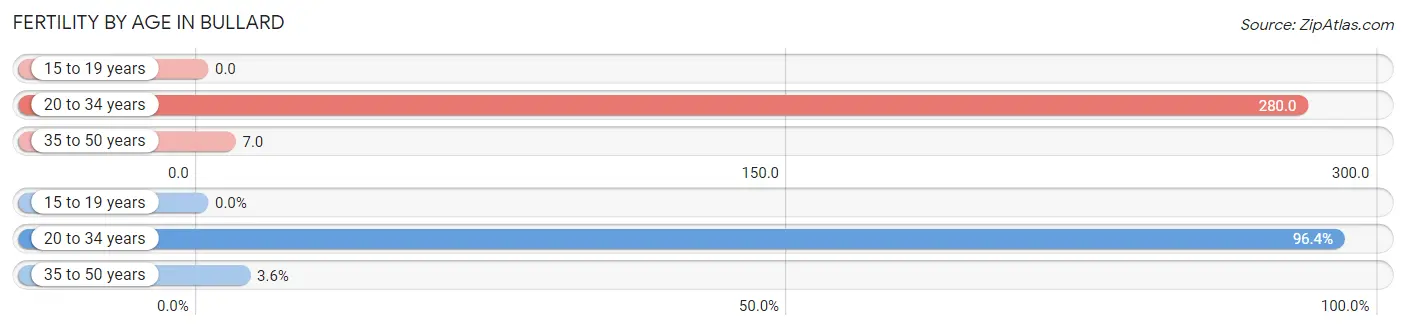
| Age Bracket | Women with Births | Births / 1,000 Women |
| 15 to 19 years | 0 (0.0%) | 0.0 |
| 20 to 34 years | 81 (96.4%) | 280.0 |
| 35 to 50 years | 3 (3.6%) | 7.0 |
| Total | 84 (100.0%) | 96.0 |
Fertility by Age by Marriage Status in Bullard
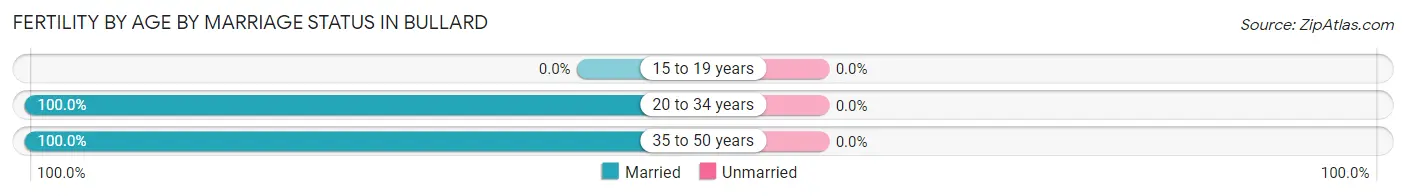
| Age Bracket | Married | Unmarried |
| 15 to 19 years | 0 (0.0%) | 0 (0.0%) |
| 20 to 34 years | 81 (100.0%) | 0 (0.0%) |
| 35 to 50 years | 3 (100.0%) | 0 (0.0%) |
| Total | 84 (100.0%) | 0 (0.0%) |
Fertility by Education in Bullard
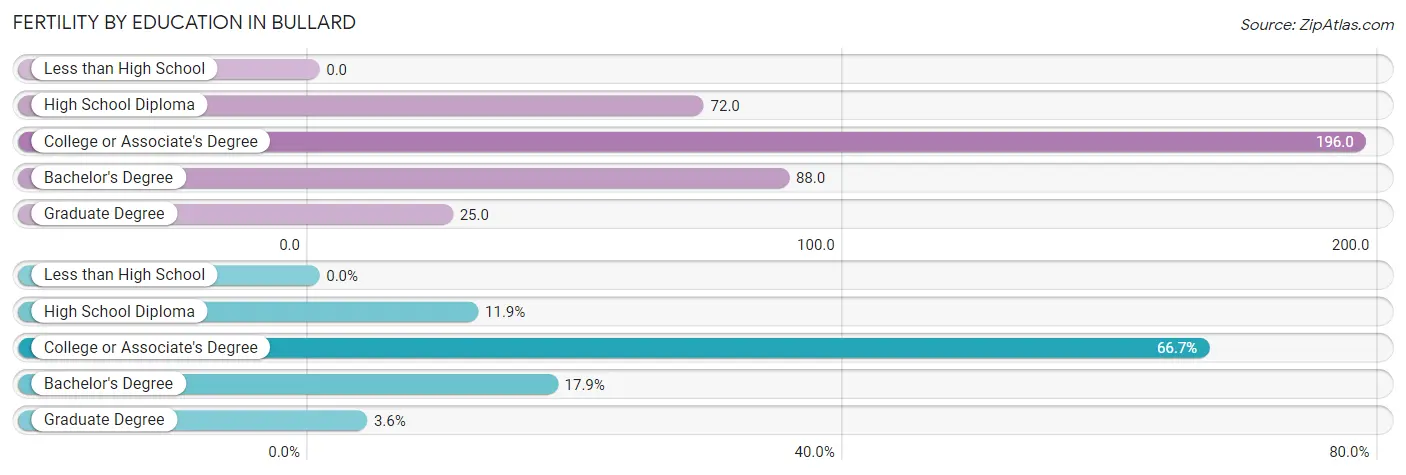
| Educational Attainment | Women with Births | Births / 1,000 Women |
| Less than High School | 0 (0.0%) | 0.0 |
| High School Diploma | 10 (11.9%) | 72.0 |
| College or Associate's Degree | 56 (66.7%) | 196.0 |
| Bachelor's Degree | 15 (17.9%) | 88.0 |
| Graduate Degree | 3 (3.6%) | 25.0 |
| Total | 84 (100.0%) | 96.0 |
Fertility by Education by Marriage Status in Bullard
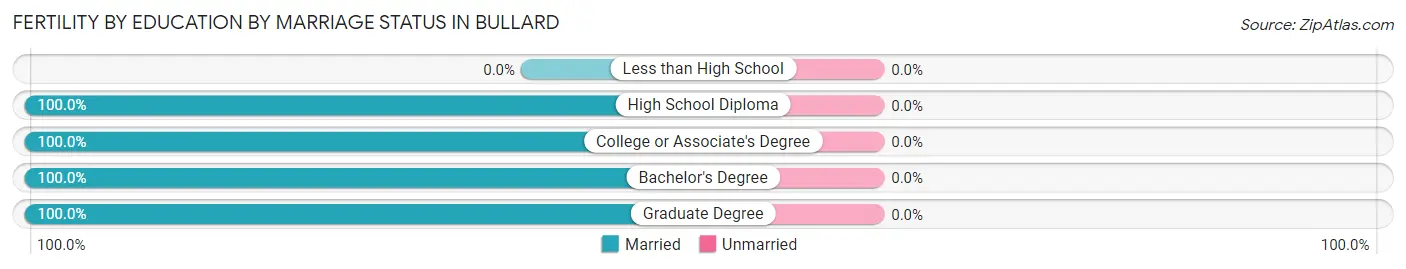
| Educational Attainment | Married | Unmarried |
| Less than High School | 0 (0.0%) | 0 (0.0%) |
| High School Diploma | 10 (100.0%) | 0 (0.0%) |
| College or Associate's Degree | 56 (100.0%) | 0 (0.0%) |
| Bachelor's Degree | 15 (100.0%) | 0 (0.0%) |
| Graduate Degree | 3 (100.0%) | 0 (0.0%) |
| Total | 84 (100.0%) | 0 (0.0%) |
Employment Characteristics in Bullard
Employment by Class of Employer in Bullard
Among the 1,595 employed individuals in Bullard, private company employees (1,136 | 71.2%), local government employees (270 | 16.9%), and self-employed (not incorporated) (69 | 4.3%) make up the most common classes of employment.
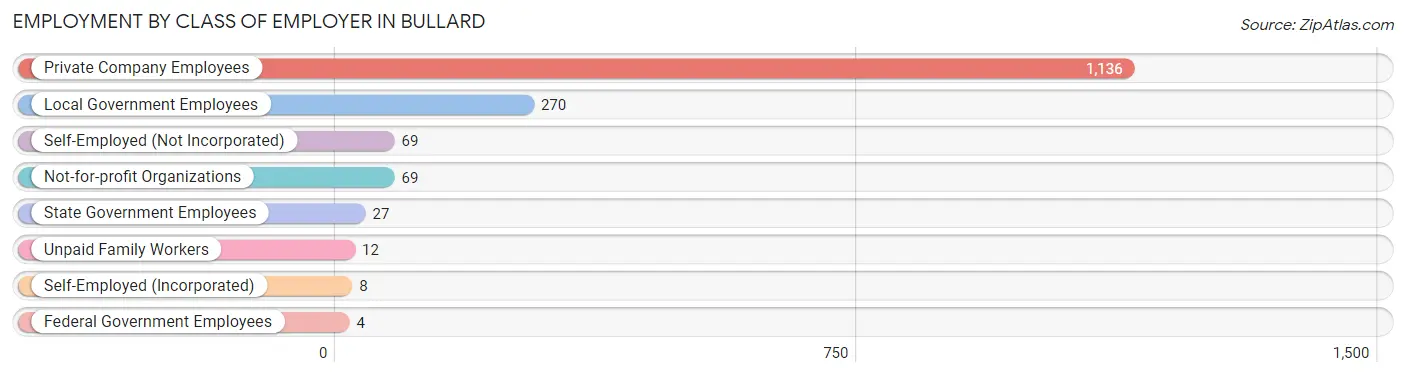
| Employer Class | # Employees | % Employees |
| Private Company Employees | 1,136 | 71.2% |
| Self-Employed (Incorporated) | 8 | 0.5% |
| Self-Employed (Not Incorporated) | 69 | 4.3% |
| Not-for-profit Organizations | 69 | 4.3% |
| Local Government Employees | 270 | 16.9% |
| State Government Employees | 27 | 1.7% |
| Federal Government Employees | 4 | 0.3% |
| Unpaid Family Workers | 12 | 0.7% |
| Total | 1,595 | 100.0% |
Employment Status by Age in Bullard
According to the labor force statistics for Bullard, out of the total population over 16 years of age (2,531), 66.1% or 1,673 individuals are in the labor force, with 1.9% or 32 of them unemployed. The age group with the highest labor force participation rate is 35 to 44 years, with 88.5% or 628 individuals in the labor force. Within the labor force, the 30 to 34 years age range has the highest percentage of unemployed individuals, with 6.8% or 14 of them being unemployed.
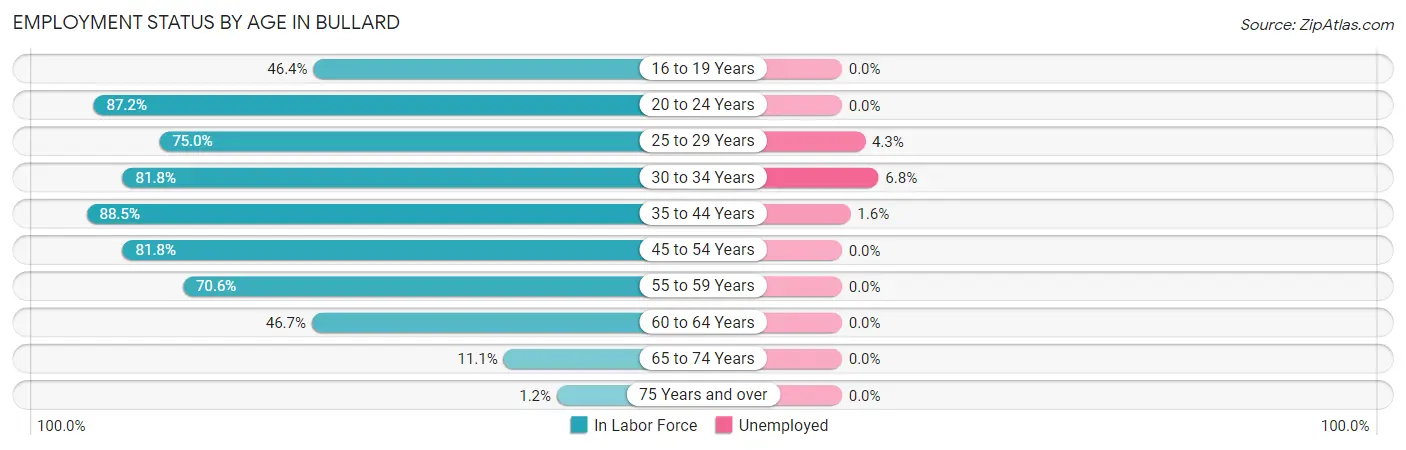
| Age Bracket | In Labor Force | Unemployed |
| 16 to 19 Years | 110 (46.4%) | 0 (0.0%) |
| 20 to 24 Years | 123 (87.2%) | 0 (0.0%) |
| 25 to 29 Years | 162 (75.0%) | 7 (4.3%) |
| 30 to 34 Years | 207 (81.8%) | 14 (6.8%) |
| 35 to 44 Years | 628 (88.5%) | 10 (1.6%) |
| 45 to 54 Years | 311 (81.8%) | 0 (0.0%) |
| 55 to 59 Years | 48 (70.6%) | 0 (0.0%) |
| 60 to 64 Years | 57 (46.7%) | 0 (0.0%) |
| 65 to 74 Years | 26 (11.1%) | 0 (0.0%) |
| 75 Years and over | 2 (1.2%) | 0 (0.0%) |
| Total | 1,673 (66.1%) | 32 (1.9%) |
Employment Status by Educational Attainment in Bullard
According to labor force statistics for Bullard, 80.8% of individuals (1,413) out of the total population between 25 and 64 years of age (1,749) are in the labor force, with 2.2% or 31 of them being unemployed. The group with the highest labor force participation rate are those with the educational attainment of bachelor's degree or higher, with 90.8% or 530 individuals in the labor force. Within the labor force, individuals with less than high school education have the highest percentage of unemployment, with 9.5% or 4 of them being unemployed.
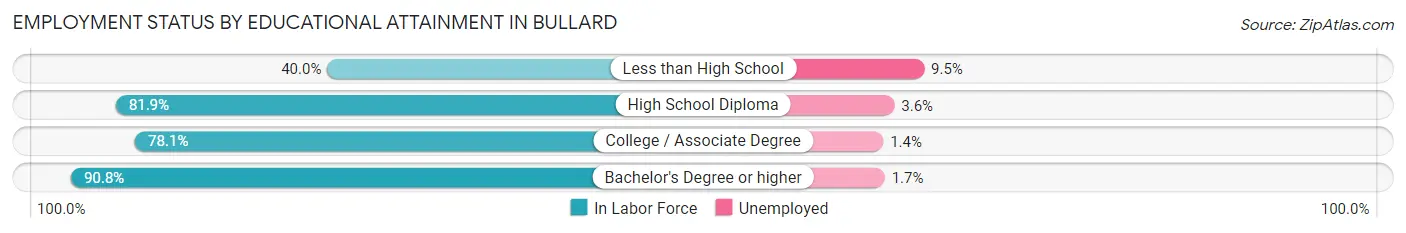
| Educational Attainment | In Labor Force | Unemployed |
| Less than High School | 42 (40.0%) | 10 (9.5%) |
| High School Diploma | 281 (81.9%) | 12 (3.6%) |
| College / Associate Degree | 560 (78.1%) | 10 (1.4%) |
| Bachelor's Degree or higher | 530 (90.8%) | 10 (1.7%) |
| Total | 1,413 (80.8%) | 38 (2.2%) |
Employment Occupations by Sex in Bullard
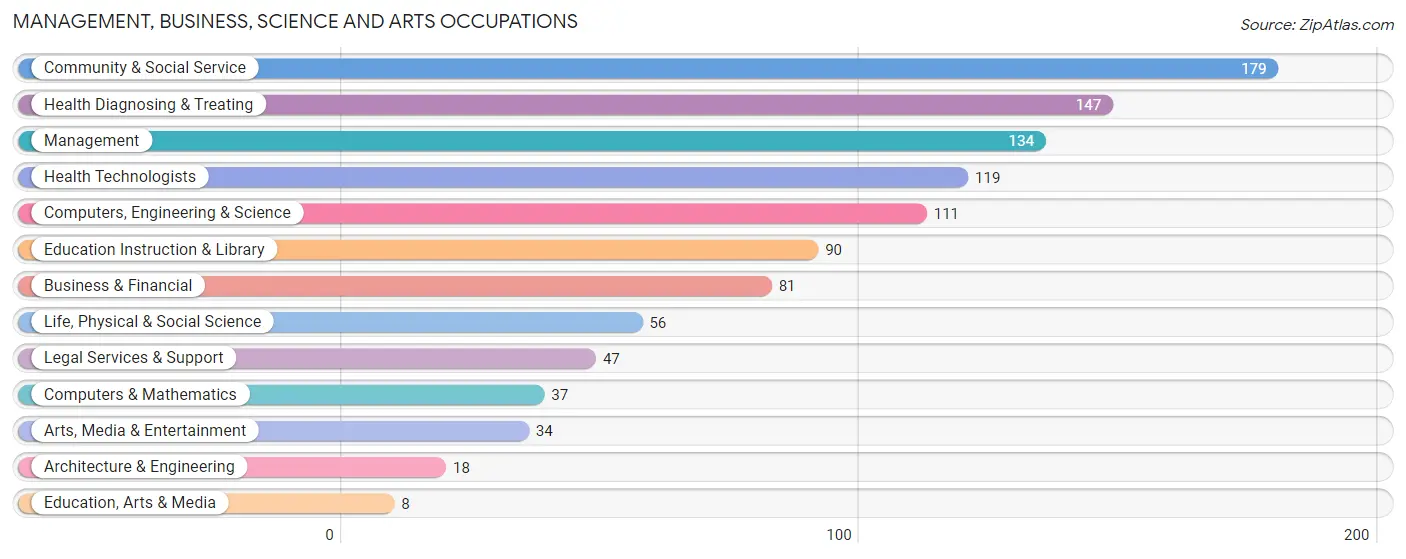
Management, Business, Science and Arts Occupations
The most common Management, Business, Science and Arts occupations in Bullard are Community & Social Service (179 | 10.9%), Health Diagnosing & Treating (147 | 8.9%), Management (134 | 8.2%), Health Technologists (119 | 7.2%), and Computers, Engineering & Science (111 | 6.8%).
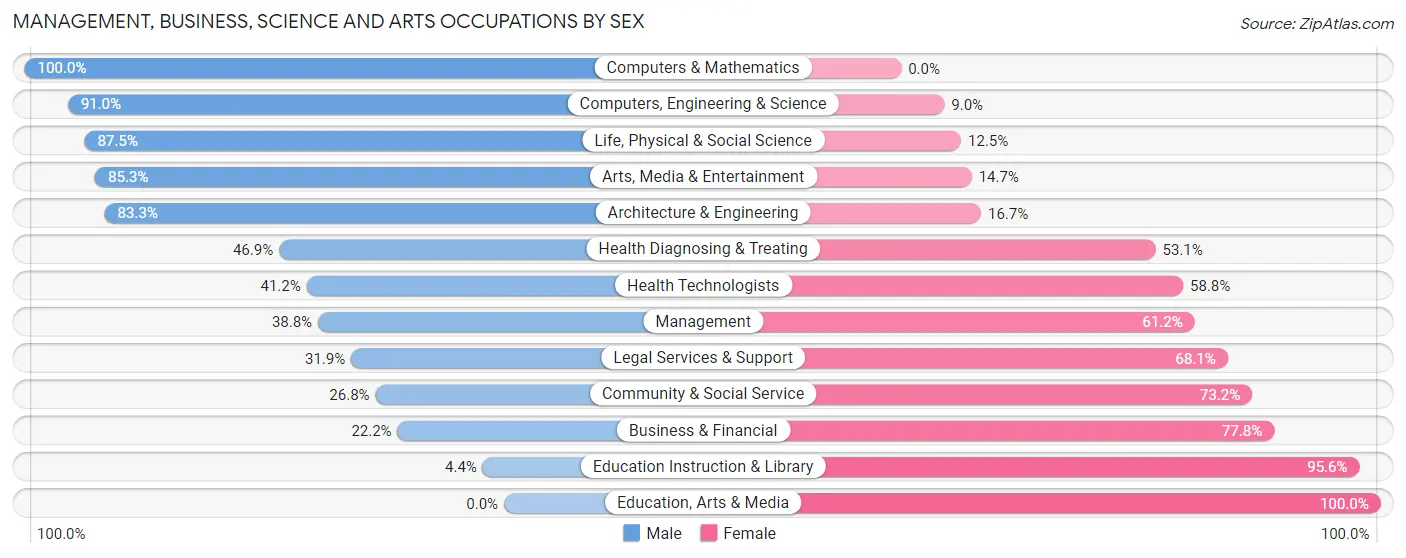
Management, Business, Science and Arts Occupations by Sex
Within the Management, Business, Science and Arts occupations in Bullard, the most male-oriented occupations are Computers & Mathematics (100.0%), Computers, Engineering & Science (91.0%), and Life, Physical & Social Science (87.5%), while the most female-oriented occupations are Education, Arts & Media (100.0%), Education Instruction & Library (95.6%), and Business & Financial (77.8%).
| Occupation | Male | Female |
| Management | 52 (38.8%) | 82 (61.2%) |
| Business & Financial | 18 (22.2%) | 63 (77.8%) |
| Computers, Engineering & Science | 101 (91.0%) | 10 (9.0%) |
| Computers & Mathematics | 37 (100.0%) | 0 (0.0%) |
| Architecture & Engineering | 15 (83.3%) | 3 (16.7%) |
| Life, Physical & Social Science | 49 (87.5%) | 7 (12.5%) |
| Community & Social Service | 48 (26.8%) | 131 (73.2%) |
| Education, Arts & Media | 0 (0.0%) | 8 (100.0%) |
| Legal Services & Support | 15 (31.9%) | 32 (68.1%) |
| Education Instruction & Library | 4 (4.4%) | 86 (95.6%) |
| Arts, Media & Entertainment | 29 (85.3%) | 5 (14.7%) |
| Health Diagnosing & Treating | 69 (46.9%) | 78 (53.1%) |
| Health Technologists | 49 (41.2%) | 70 (58.8%) |
| Total (Category) | 288 (44.2%) | 364 (55.8%) |
| Total (Overall) | 950 (57.8%) | 693 (42.2%) |
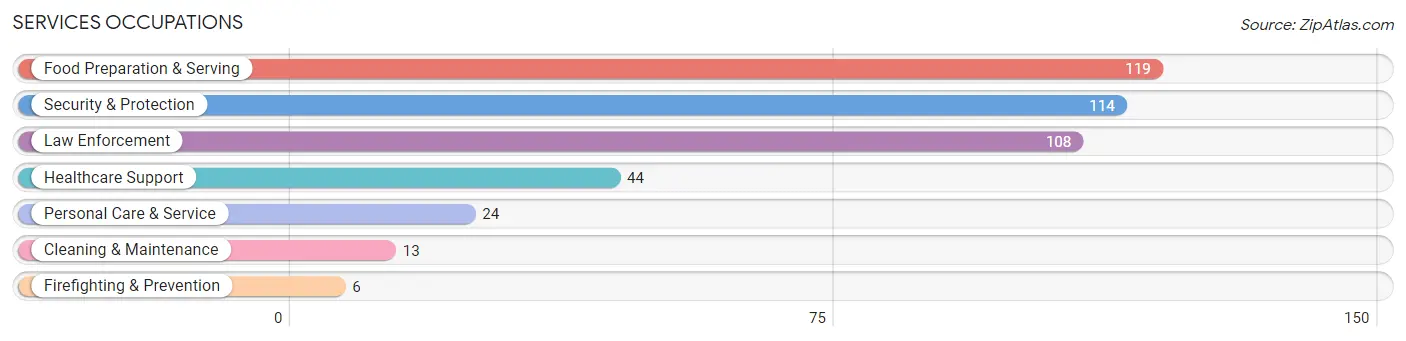
Services Occupations
The most common Services occupations in Bullard are Food Preparation & Serving (119 | 7.2%), Security & Protection (114 | 6.9%), Law Enforcement (108 | 6.6%), Healthcare Support (44 | 2.7%), and Personal Care & Service (24 | 1.5%).
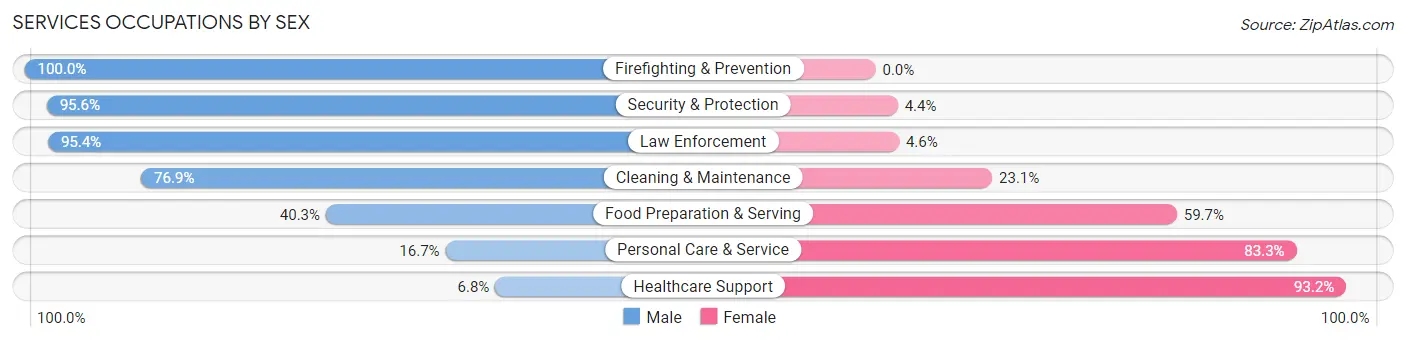
Services Occupations by Sex
Within the Services occupations in Bullard, the most male-oriented occupations are Firefighting & Prevention (100.0%), Security & Protection (95.6%), and Law Enforcement (95.4%), while the most female-oriented occupations are Healthcare Support (93.2%), Personal Care & Service (83.3%), and Food Preparation & Serving (59.7%).
| Occupation | Male | Female |
| Healthcare Support | 3 (6.8%) | 41 (93.2%) |
| Security & Protection | 109 (95.6%) | 5 (4.4%) |
| Firefighting & Prevention | 6 (100.0%) | 0 (0.0%) |
| Law Enforcement | 103 (95.4%) | 5 (4.6%) |
| Food Preparation & Serving | 48 (40.3%) | 71 (59.7%) |
| Cleaning & Maintenance | 10 (76.9%) | 3 (23.1%) |
| Personal Care & Service | 4 (16.7%) | 20 (83.3%) |
| Total (Category) | 174 (55.4%) | 140 (44.6%) |
| Total (Overall) | 950 (57.8%) | 693 (42.2%) |
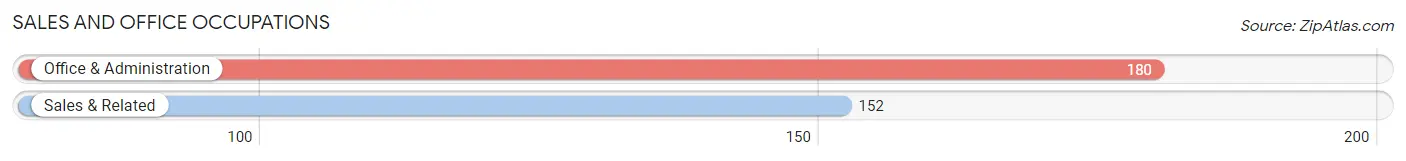
Sales and Office Occupations
The most common Sales and Office occupations in Bullard are Office & Administration (180 | 11.0%), and Sales & Related (152 | 9.2%).
Sales and Office Occupations by Sex
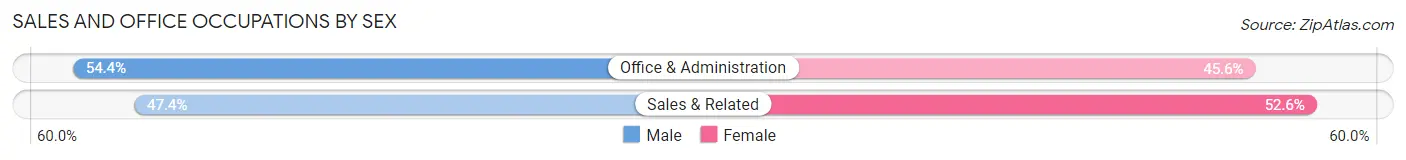
| Occupation | Male | Female |
| Sales & Related | 72 (47.4%) | 80 (52.6%) |
| Office & Administration | 98 (54.4%) | 82 (45.6%) |
| Total (Category) | 170 (51.2%) | 162 (48.8%) |
| Total (Overall) | 950 (57.8%) | 693 (42.2%) |
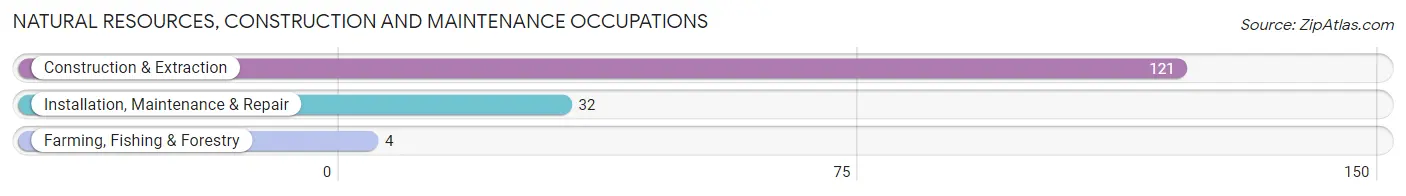
Natural Resources, Construction and Maintenance Occupations
The most common Natural Resources, Construction and Maintenance occupations in Bullard are Construction & Extraction (121 | 7.4%), Installation, Maintenance & Repair (32 | 1.9%), and Farming, Fishing & Forestry (4 | 0.2%).
Natural Resources, Construction and Maintenance Occupations by Sex
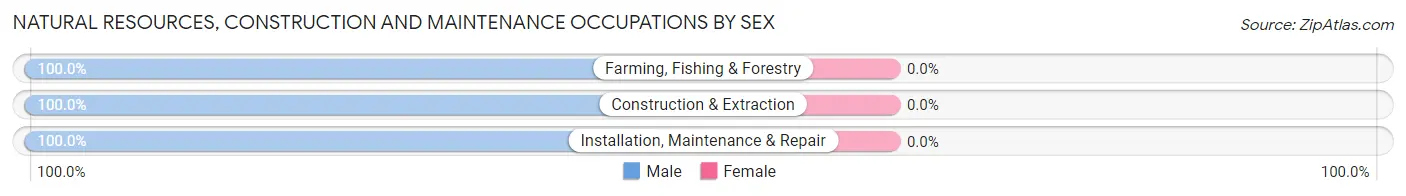
| Occupation | Male | Female |
| Farming, Fishing & Forestry | 4 (100.0%) | 0 (0.0%) |
| Construction & Extraction | 121 (100.0%) | 0 (0.0%) |
| Installation, Maintenance & Repair | 32 (100.0%) | 0 (0.0%) |
| Total (Category) | 157 (100.0%) | 0 (0.0%) |
| Total (Overall) | 950 (57.8%) | 693 (42.2%) |
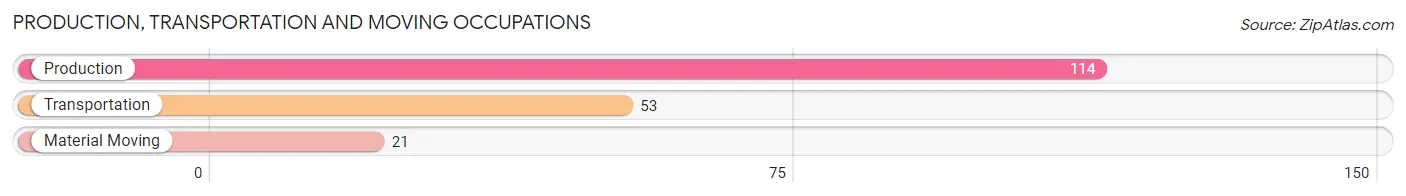
Production, Transportation and Moving Occupations
The most common Production, Transportation and Moving occupations in Bullard are Production (114 | 6.9%), Transportation (53 | 3.2%), and Material Moving (21 | 1.3%).
Production, Transportation and Moving Occupations by Sex
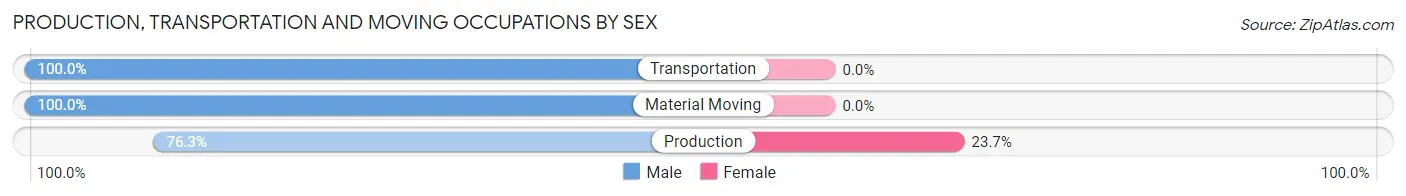
| Occupation | Male | Female |
| Production | 87 (76.3%) | 27 (23.7%) |
| Transportation | 53 (100.0%) | 0 (0.0%) |
| Material Moving | 21 (100.0%) | 0 (0.0%) |
| Total (Category) | 161 (85.6%) | 27 (14.4%) |
| Total (Overall) | 950 (57.8%) | 693 (42.2%) |
Employment Industries by Sex in Bullard
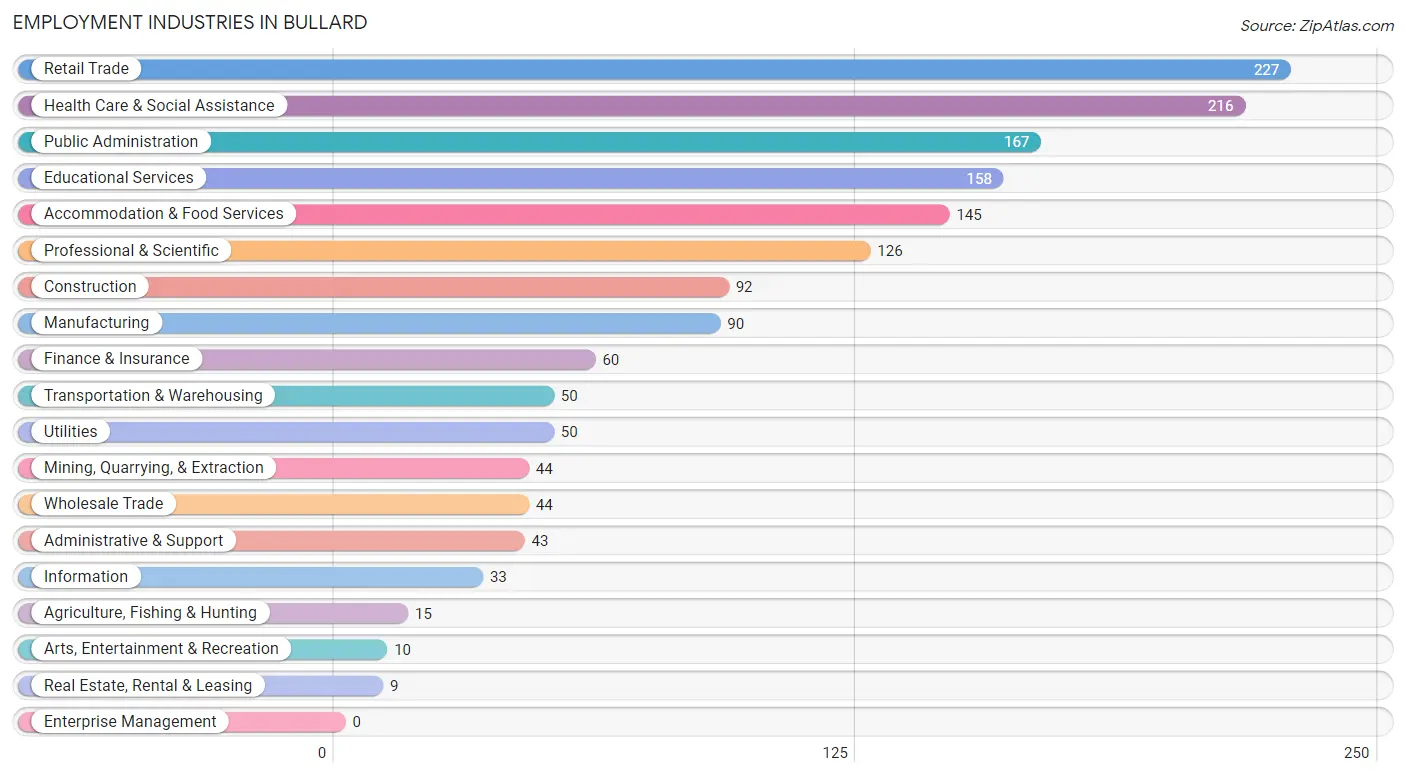
Employment Industries in Bullard
The major employment industries in Bullard include Retail Trade (227 | 13.8%), Health Care & Social Assistance (216 | 13.2%), Public Administration (167 | 10.2%), Educational Services (158 | 9.6%), and Accommodation & Food Services (145 | 8.8%).
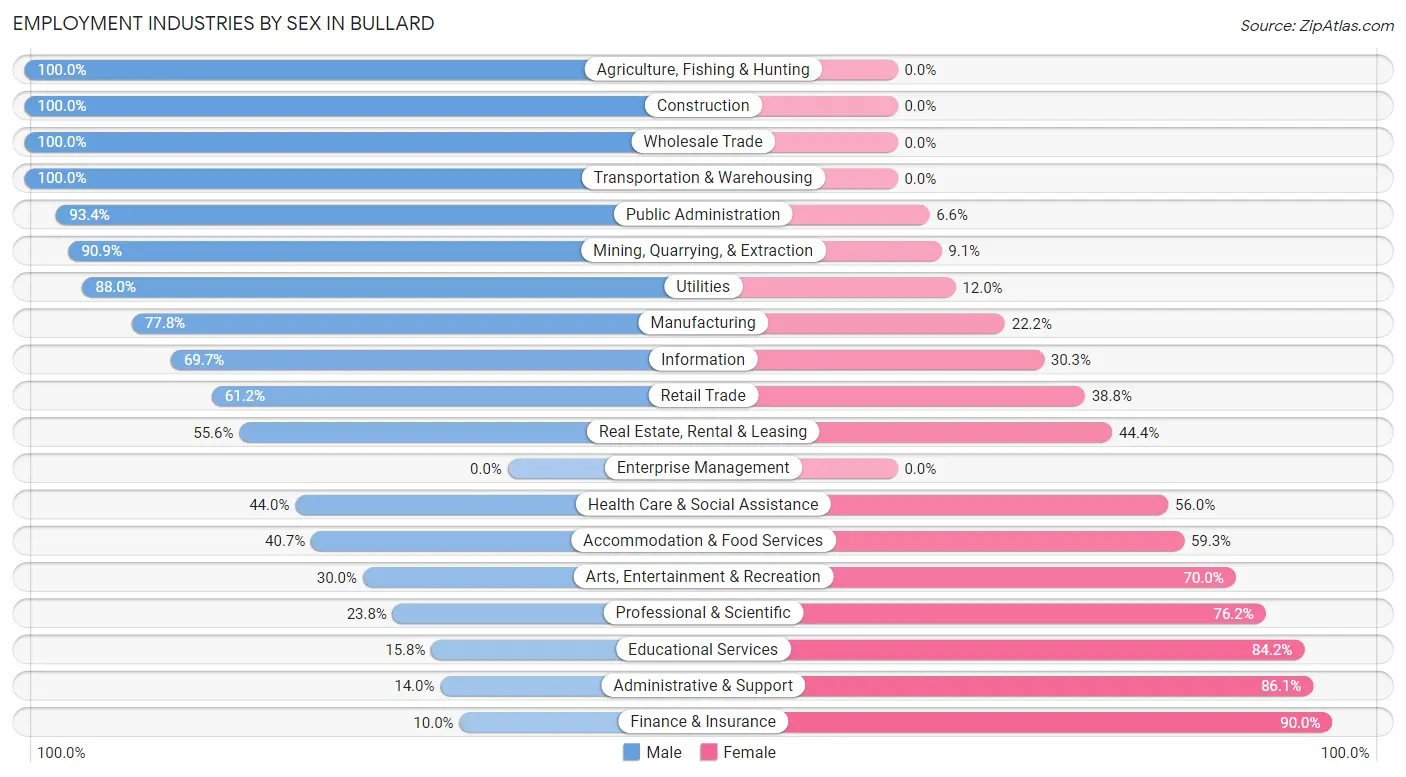
Employment Industries by Sex in Bullard
The Bullard industries that see more men than women are Agriculture, Fishing & Hunting (100.0%), Construction (100.0%), and Wholesale Trade (100.0%), whereas the industries that tend to have a higher number of women are Finance & Insurance (90.0%), Administrative & Support (86.1%), and Educational Services (84.2%).
| Industry | Male | Female |
| Agriculture, Fishing & Hunting | 15 (100.0%) | 0 (0.0%) |
| Mining, Quarrying, & Extraction | 40 (90.9%) | 4 (9.1%) |
| Construction | 92 (100.0%) | 0 (0.0%) |
| Manufacturing | 70 (77.8%) | 20 (22.2%) |
| Wholesale Trade | 44 (100.0%) | 0 (0.0%) |
| Retail Trade | 139 (61.2%) | 88 (38.8%) |
| Transportation & Warehousing | 50 (100.0%) | 0 (0.0%) |
| Utilities | 44 (88.0%) | 6 (12.0%) |
| Information | 23 (69.7%) | 10 (30.3%) |
| Finance & Insurance | 6 (10.0%) | 54 (90.0%) |
| Real Estate, Rental & Leasing | 5 (55.6%) | 4 (44.4%) |
| Professional & Scientific | 30 (23.8%) | 96 (76.2%) |
| Enterprise Management | 0 (0.0%) | 0 (0.0%) |
| Administrative & Support | 6 (14.0%) | 37 (86.1%) |
| Educational Services | 25 (15.8%) | 133 (84.2%) |
| Health Care & Social Assistance | 95 (44.0%) | 121 (56.0%) |
| Arts, Entertainment & Recreation | 3 (30.0%) | 7 (70.0%) |
| Accommodation & Food Services | 59 (40.7%) | 86 (59.3%) |
| Public Administration | 156 (93.4%) | 11 (6.6%) |
| Total | 950 (57.8%) | 693 (42.2%) |
Education in Bullard
School Enrollment in Bullard
The most common levels of schooling among the 1,201 students in Bullard are middle school (286 | 23.8%), elementary school (274 | 22.8%), and college / undergraduate (245 | 20.4%).
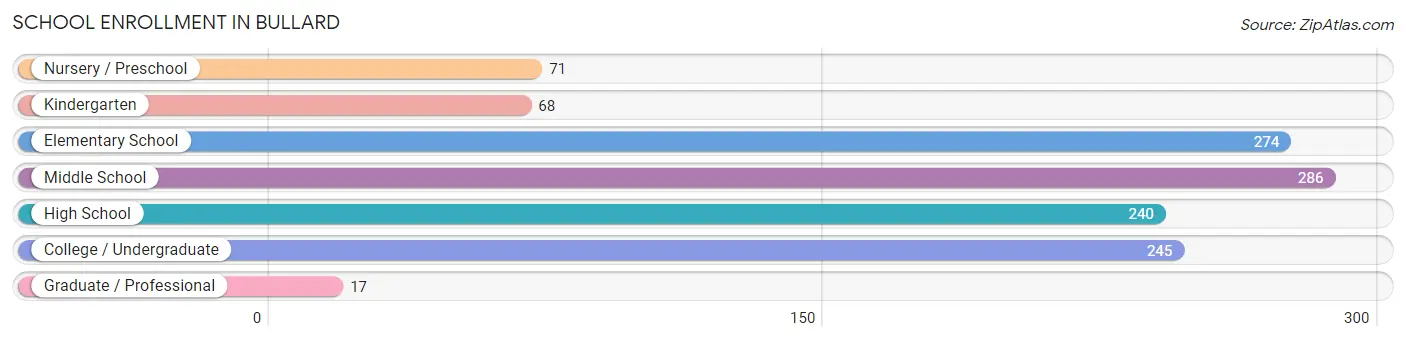
| School Level | # Students | % Students |
| Nursery / Preschool | 71 | 5.9% |
| Kindergarten | 68 | 5.7% |
| Elementary School | 274 | 22.8% |
| Middle School | 286 | 23.8% |
| High School | 240 | 20.0% |
| College / Undergraduate | 245 | 20.4% |
| Graduate / Professional | 17 | 1.4% |
| Total | 1,201 | 100.0% |
School Enrollment by Age by Funding Source in Bullard
Out of a total of 1,201 students who are enrolled in schools in Bullard, 131 (10.9%) attend a private institution, while the remaining 1,070 (89.1%) are enrolled in public schools. The age group of 25 to 34 year olds has the highest likelihood of being enrolled in private schools, with 10 (30.3% in the age bracket) enrolled. Conversely, the age group of 18 to 19 year olds has the lowest likelihood of being enrolled in a private school, with 104 (100.0% in the age bracket) attending a public institution.
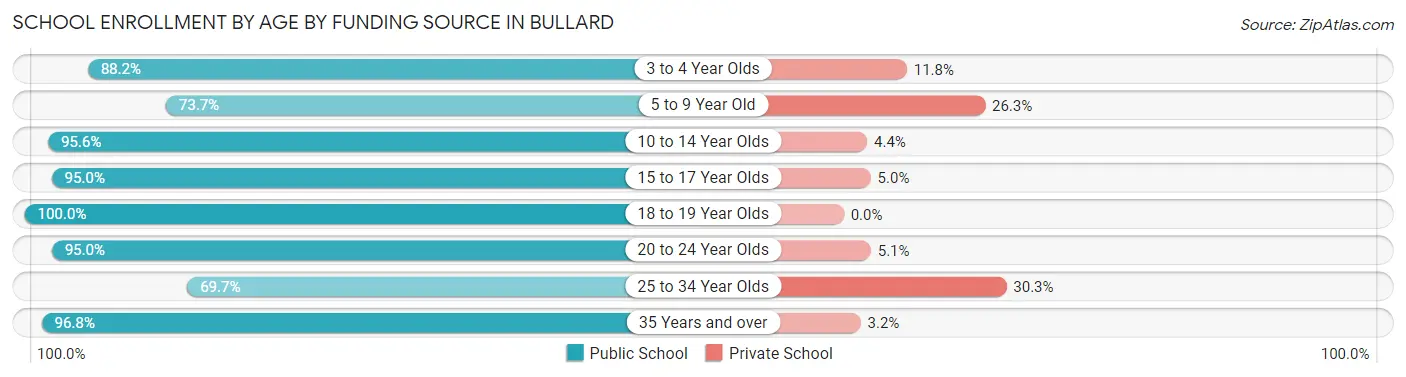
| Age Bracket | Public School | Private School |
| 3 to 4 Year Olds | 45 (88.2%) | 6 (11.8%) |
| 5 to 9 Year Old | 235 (73.7%) | 84 (26.3%) |
| 10 to 14 Year Olds | 307 (95.6%) | 14 (4.4%) |
| 15 to 17 Year Olds | 170 (95.0%) | 9 (5.0%) |
| 18 to 19 Year Olds | 104 (100.0%) | 0 (0.0%) |
| 20 to 24 Year Olds | 94 (95.0%) | 5 (5.1%) |
| 25 to 34 Year Olds | 23 (69.7%) | 10 (30.3%) |
| 35 Years and over | 92 (96.8%) | 3 (3.2%) |
| Total | 1,070 (89.1%) | 131 (10.9%) |
Educational Attainment by Field of Study in Bullard
Business (220 | 28.7%), science & technology (131 | 17.1%), education (130 | 17.0%), arts & humanities (73 | 9.5%), and bio, nature & agricultural (50 | 6.5%) are the most common fields of study among 766 individuals in Bullard who have obtained a bachelor's degree or higher.
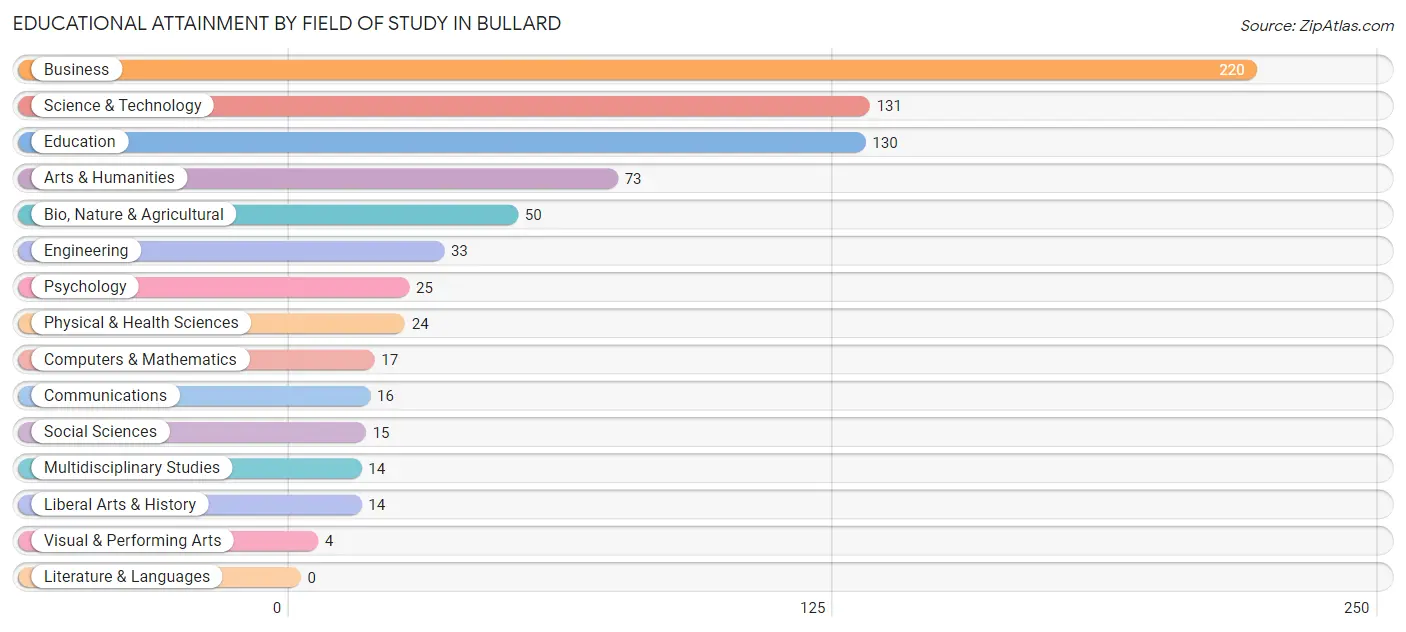
| Field of Study | # Graduates | % Graduates |
| Computers & Mathematics | 17 | 2.2% |
| Bio, Nature & Agricultural | 50 | 6.5% |
| Physical & Health Sciences | 24 | 3.1% |
| Psychology | 25 | 3.3% |
| Social Sciences | 15 | 2.0% |
| Engineering | 33 | 4.3% |
| Multidisciplinary Studies | 14 | 1.8% |
| Science & Technology | 131 | 17.1% |
| Business | 220 | 28.7% |
| Education | 130 | 17.0% |
| Literature & Languages | 0 | 0.0% |
| Liberal Arts & History | 14 | 1.8% |
| Visual & Performing Arts | 4 | 0.5% |
| Communications | 16 | 2.1% |
| Arts & Humanities | 73 | 9.5% |
| Total | 766 | 100.0% |
Transportation & Commute in Bullard
Vehicle Availability by Sex in Bullard
The most prevalent vehicle ownership categories in Bullard are males with 2 vehicles (468, accounting for 49.3%) and females with 2 vehicles (352, making up 72.6%).
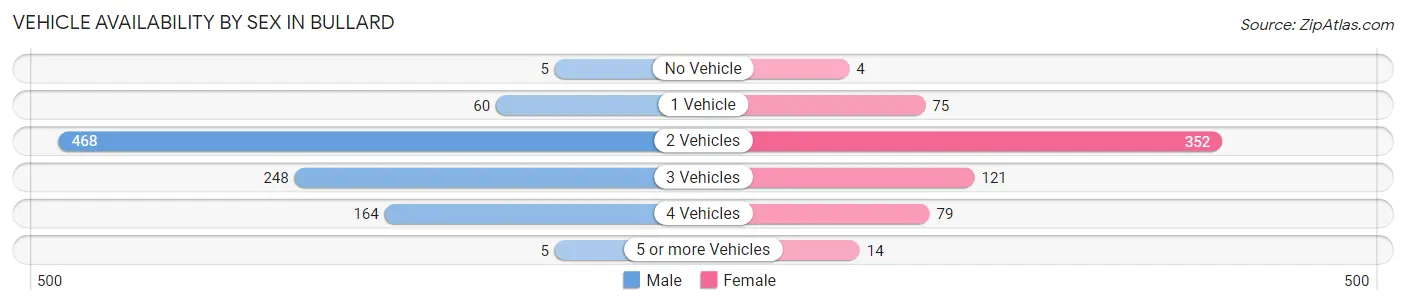
| Vehicles Available | Male | Female |
| No Vehicle | 5 (0.5%) | 4 (0.6%) |
| 1 Vehicle | 60 (6.3%) | 75 (11.6%) |
| 2 Vehicles | 468 (49.3%) | 352 (54.6%) |
| 3 Vehicles | 248 (26.1%) | 121 (18.8%) |
| 4 Vehicles | 164 (17.3%) | 79 (12.2%) |
| 5 or more Vehicles | 5 (0.5%) | 14 (2.2%) |
| Total | 950 (100.0%) | 645 (100.0%) |
Commute Time in Bullard
The most frequently occuring commute durations in Bullard are 20 to 24 minutes (238 commuters, 16.1%), 30 to 34 minutes (230 commuters, 15.6%), and 15 to 19 minutes (220 commuters, 14.9%).
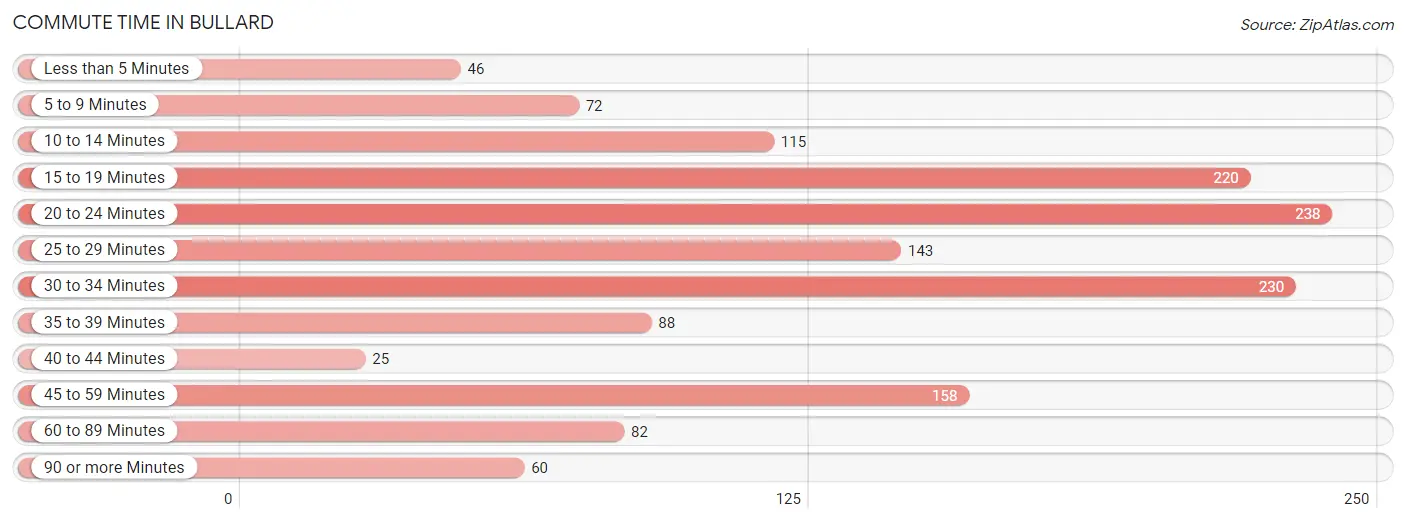
| Commute Time | # Commuters | % Commuters |
| Less than 5 Minutes | 46 | 3.1% |
| 5 to 9 Minutes | 72 | 4.9% |
| 10 to 14 Minutes | 115 | 7.8% |
| 15 to 19 Minutes | 220 | 14.9% |
| 20 to 24 Minutes | 238 | 16.1% |
| 25 to 29 Minutes | 143 | 9.7% |
| 30 to 34 Minutes | 230 | 15.6% |
| 35 to 39 Minutes | 88 | 6.0% |
| 40 to 44 Minutes | 25 | 1.7% |
| 45 to 59 Minutes | 158 | 10.7% |
| 60 to 89 Minutes | 82 | 5.6% |
| 90 or more Minutes | 60 | 4.1% |
Commute Time by Sex in Bullard
The most common commute times in Bullard are 20 to 24 minutes (167 commuters, 18.6%) for males and 30 to 34 minutes (159 commuters, 27.4%) for females.
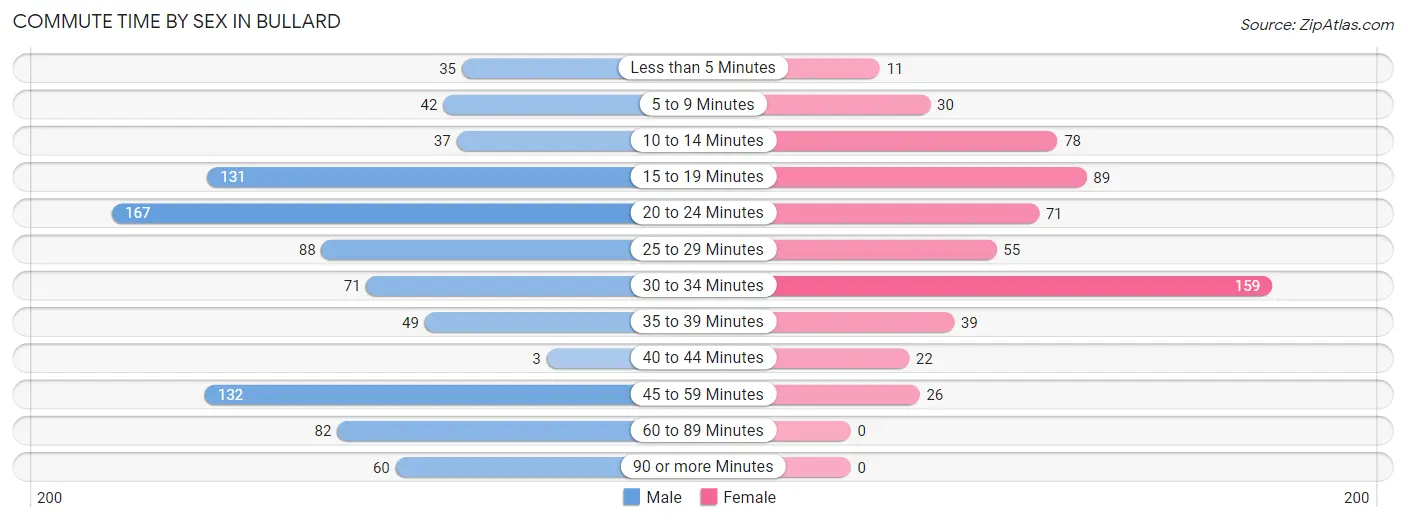
| Commute Time | Male | Female |
| Less than 5 Minutes | 35 (3.9%) | 11 (1.9%) |
| 5 to 9 Minutes | 42 (4.7%) | 30 (5.2%) |
| 10 to 14 Minutes | 37 (4.1%) | 78 (13.5%) |
| 15 to 19 Minutes | 131 (14.6%) | 89 (15.3%) |
| 20 to 24 Minutes | 167 (18.6%) | 71 (12.2%) |
| 25 to 29 Minutes | 88 (9.8%) | 55 (9.5%) |
| 30 to 34 Minutes | 71 (7.9%) | 159 (27.4%) |
| 35 to 39 Minutes | 49 (5.5%) | 39 (6.7%) |
| 40 to 44 Minutes | 3 (0.3%) | 22 (3.8%) |
| 45 to 59 Minutes | 132 (14.7%) | 26 (4.5%) |
| 60 to 89 Minutes | 82 (9.1%) | 0 (0.0%) |
| 90 or more Minutes | 60 (6.7%) | 0 (0.0%) |
Time of Departure to Work by Sex in Bullard
The most frequent times of departure to work in Bullard are 7:00 AM to 7:29 AM (234, 26.1%) for males and 7:00 AM to 7:29 AM (148, 25.5%) for females.
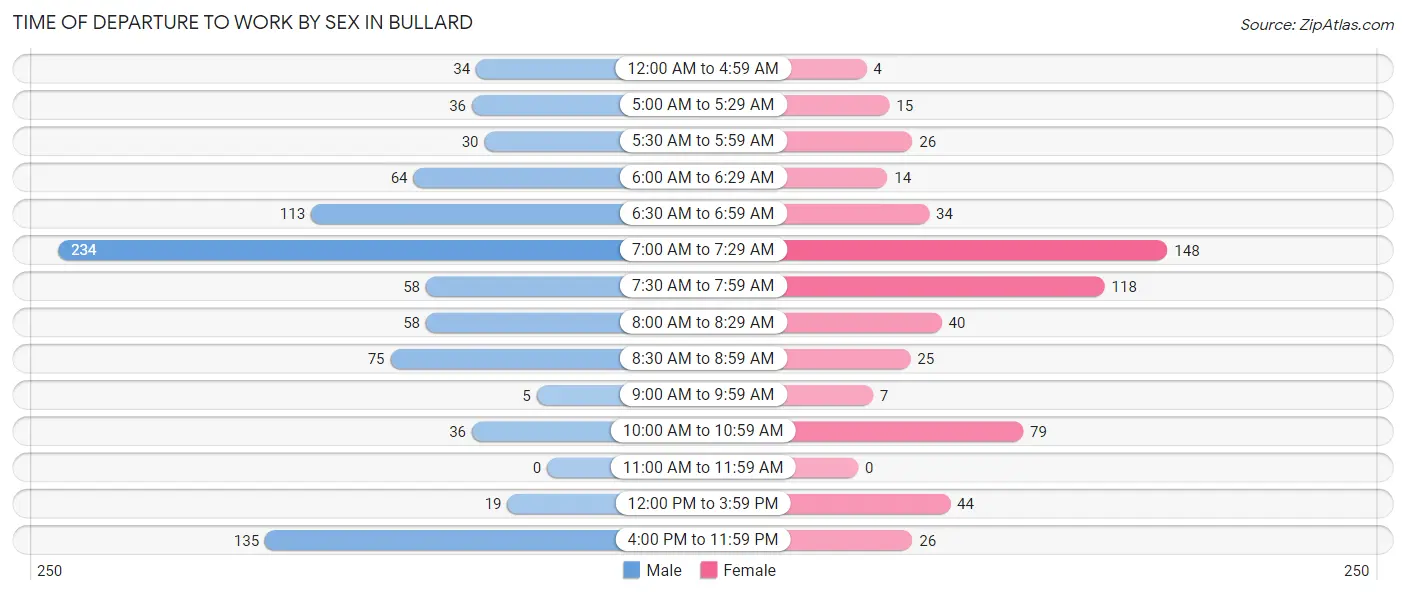
| Time of Departure | Male | Female |
| 12:00 AM to 4:59 AM | 34 (3.8%) | 4 (0.7%) |
| 5:00 AM to 5:29 AM | 36 (4.0%) | 15 (2.6%) |
| 5:30 AM to 5:59 AM | 30 (3.3%) | 26 (4.5%) |
| 6:00 AM to 6:29 AM | 64 (7.1%) | 14 (2.4%) |
| 6:30 AM to 6:59 AM | 113 (12.6%) | 34 (5.9%) |
| 7:00 AM to 7:29 AM | 234 (26.1%) | 148 (25.5%) |
| 7:30 AM to 7:59 AM | 58 (6.5%) | 118 (20.3%) |
| 8:00 AM to 8:29 AM | 58 (6.5%) | 40 (6.9%) |
| 8:30 AM to 8:59 AM | 75 (8.4%) | 25 (4.3%) |
| 9:00 AM to 9:59 AM | 5 (0.6%) | 7 (1.2%) |
| 10:00 AM to 10:59 AM | 36 (4.0%) | 79 (13.6%) |
| 11:00 AM to 11:59 AM | 0 (0.0%) | 0 (0.0%) |
| 12:00 PM to 3:59 PM | 19 (2.1%) | 44 (7.6%) |
| 4:00 PM to 11:59 PM | 135 (15.0%) | 26 (4.5%) |
| Total | 897 (100.0%) | 580 (100.0%) |
Housing Occupancy in Bullard
Occupancy by Ownership in Bullard
Of the total 1,069 dwellings in Bullard, owner-occupied units account for 840 (78.6%), while renter-occupied units make up 229 (21.4%).
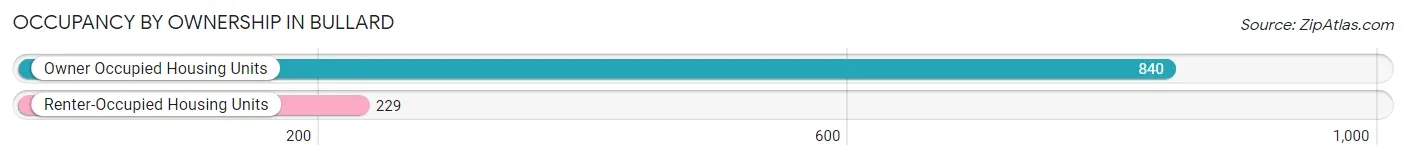
| Occupancy | # Housing Units | % Housing Units |
| Owner Occupied Housing Units | 840 | 78.6% |
| Renter-Occupied Housing Units | 229 | 21.4% |
| Total Occupied Housing Units | 1,069 | 100.0% |
Occupancy by Household Size in Bullard
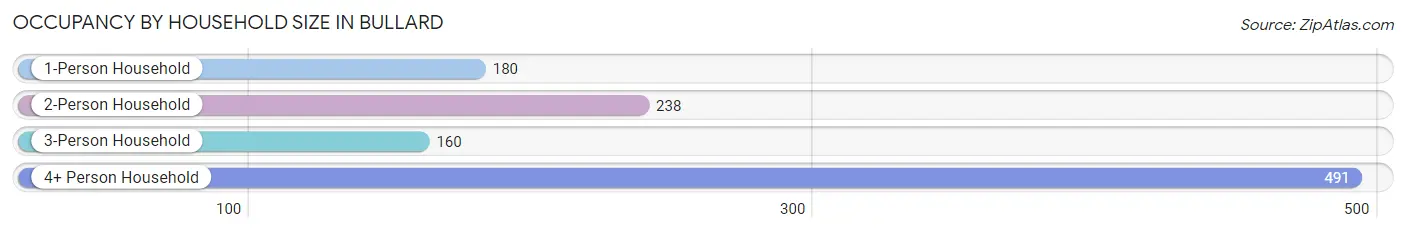
| Household Size | # Housing Units | % Housing Units |
| 1-Person Household | 180 | 16.8% |
| 2-Person Household | 238 | 22.3% |
| 3-Person Household | 160 | 15.0% |
| 4+ Person Household | 491 | 45.9% |
| Total Housing Units | 1,069 | 100.0% |
Occupancy by Ownership by Household Size in Bullard
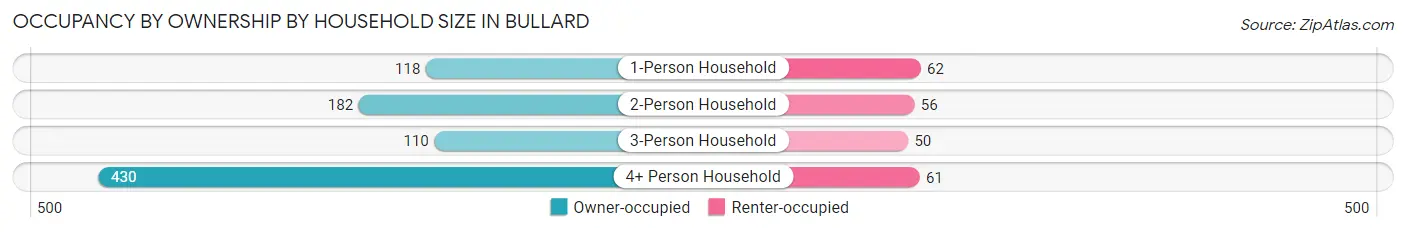
| Household Size | Owner-occupied | Renter-occupied |
| 1-Person Household | 118 (65.6%) | 62 (34.4%) |
| 2-Person Household | 182 (76.5%) | 56 (23.5%) |
| 3-Person Household | 110 (68.8%) | 50 (31.2%) |
| 4+ Person Household | 430 (87.6%) | 61 (12.4%) |
| Total Housing Units | 840 (78.6%) | 229 (21.4%) |
Occupancy by Educational Attainment in Bullard
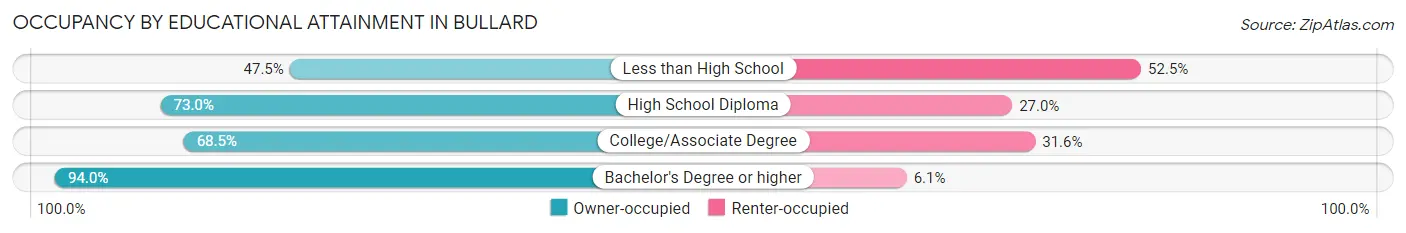
| Household Size | Owner-occupied | Renter-occupied |
| Less than High School | 28 (47.5%) | 31 (52.5%) |
| High School Diploma | 111 (73.0%) | 41 (27.0%) |
| College/Associate Degree | 282 (68.4%) | 130 (31.6%) |
| Bachelor's Degree or higher | 419 (94.0%) | 27 (6.0%) |
Occupancy by Age of Householder in Bullard
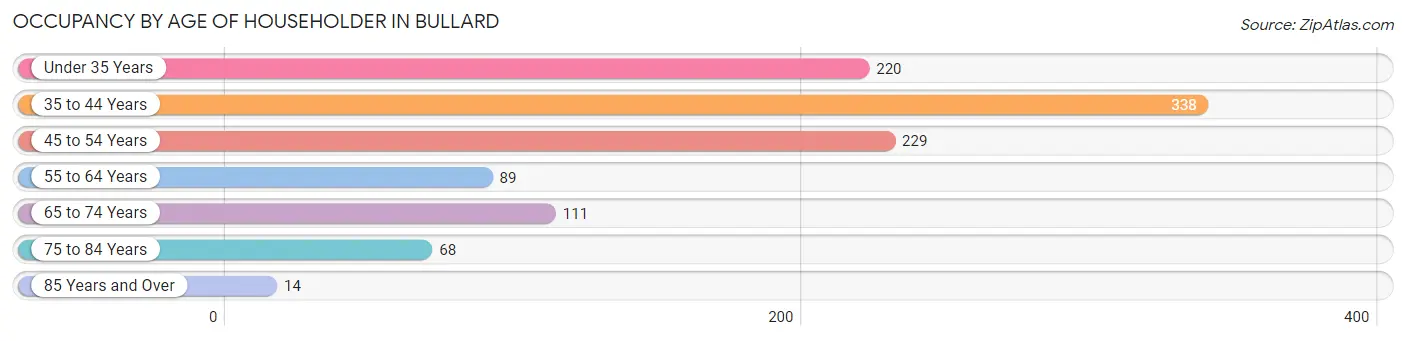
| Age Bracket | # Households | % Households |
| Under 35 Years | 220 | 20.6% |
| 35 to 44 Years | 338 | 31.6% |
| 45 to 54 Years | 229 | 21.4% |
| 55 to 64 Years | 89 | 8.3% |
| 65 to 74 Years | 111 | 10.4% |
| 75 to 84 Years | 68 | 6.4% |
| 85 Years and Over | 14 | 1.3% |
| Total | 1,069 | 100.0% |
Housing Finances in Bullard
Median Income by Occupancy in Bullard
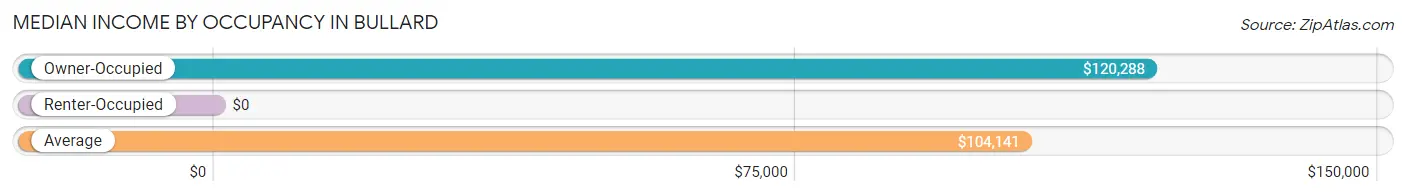
| Occupancy Type | # Households | Median Income |
| Owner-Occupied | 840 (78.6%) | $120,288 |
| Renter-Occupied | 229 (21.4%) | $0 |
| Average | 1,069 (100.0%) | $104,141 |
Occupancy by Householder Income Bracket in Bullard
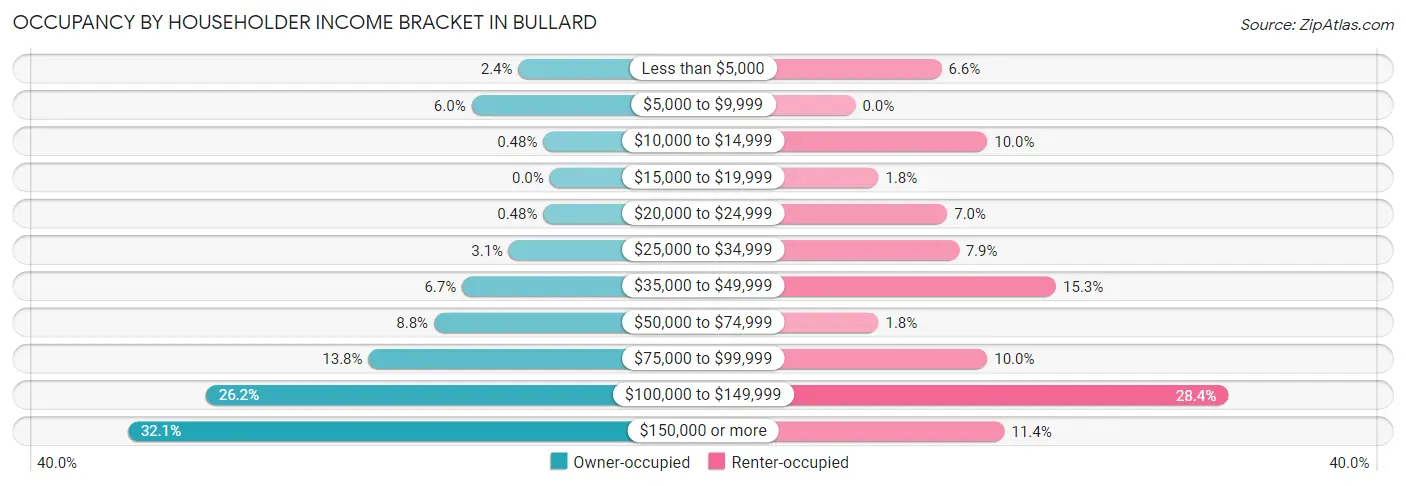
| Income Bracket | Owner-occupied | Renter-occupied |
| Less than $5,000 | 20 (2.4%) | 15 (6.6%) |
| $5,000 to $9,999 | 50 (5.9%) | 0 (0.0%) |
| $10,000 to $14,999 | 4 (0.5%) | 23 (10.0%) |
| $15,000 to $19,999 | 0 (0.0%) | 4 (1.8%) |
| $20,000 to $24,999 | 4 (0.5%) | 16 (7.0%) |
| $25,000 to $34,999 | 26 (3.1%) | 18 (7.9%) |
| $35,000 to $49,999 | 56 (6.7%) | 35 (15.3%) |
| $50,000 to $74,999 | 74 (8.8%) | 4 (1.8%) |
| $75,000 to $99,999 | 116 (13.8%) | 23 (10.0%) |
| $100,000 to $149,999 | 220 (26.2%) | 65 (28.4%) |
| $150,000 or more | 270 (32.1%) | 26 (11.4%) |
| Total | 840 (100.0%) | 229 (100.0%) |
Monthly Housing Cost Tiers in Bullard
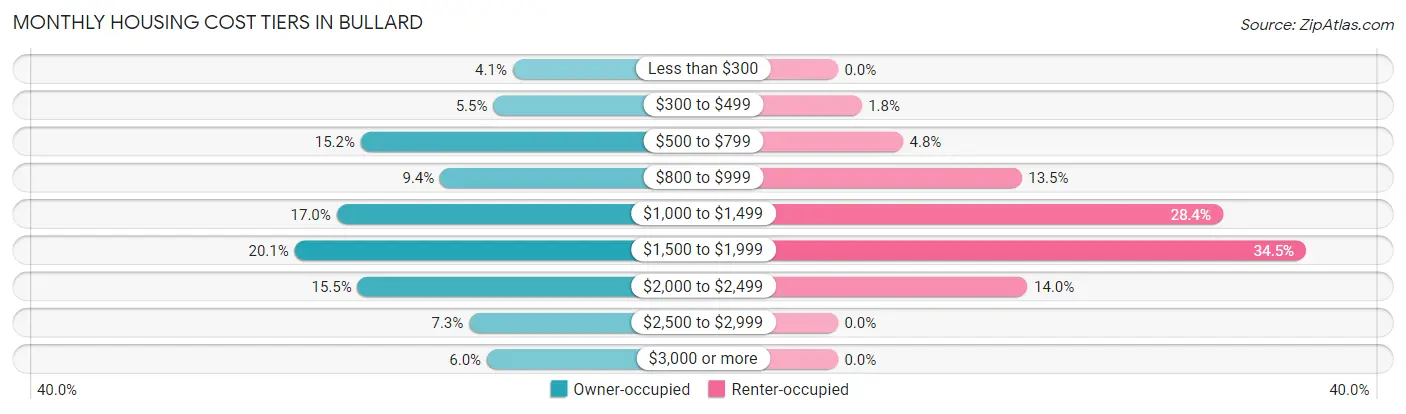
| Monthly Cost | Owner-occupied | Renter-occupied |
| Less than $300 | 34 (4.1%) | 0 (0.0%) |
| $300 to $499 | 46 (5.5%) | 4 (1.8%) |
| $500 to $799 | 128 (15.2%) | 11 (4.8%) |
| $800 to $999 | 79 (9.4%) | 31 (13.5%) |
| $1,000 to $1,499 | 143 (17.0%) | 65 (28.4%) |
| $1,500 to $1,999 | 169 (20.1%) | 79 (34.5%) |
| $2,000 to $2,499 | 130 (15.5%) | 32 (14.0%) |
| $2,500 to $2,999 | 61 (7.3%) | 0 (0.0%) |
| $3,000 or more | 50 (5.9%) | 0 (0.0%) |
| Total | 840 (100.0%) | 229 (100.0%) |
Physical Housing Characteristics in Bullard
Housing Structures in Bullard
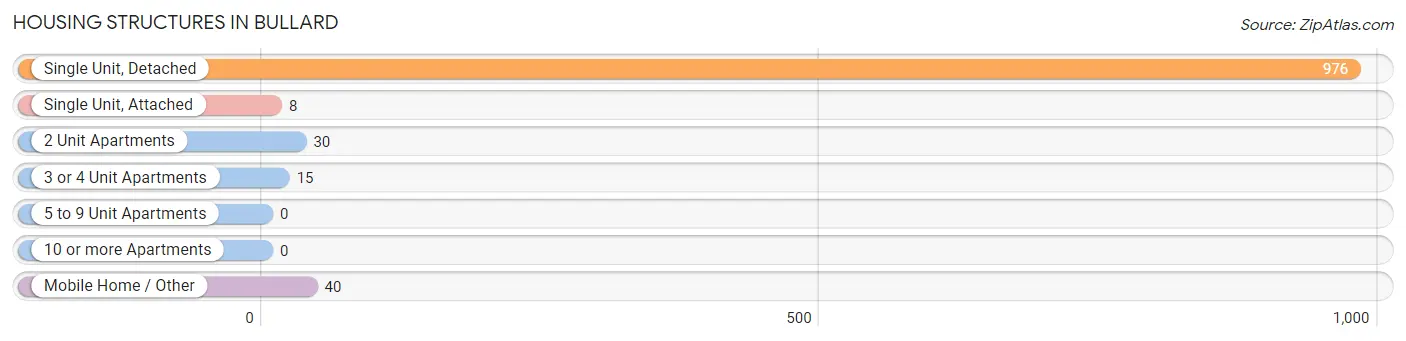
| Structure Type | # Housing Units | % Housing Units |
| Single Unit, Detached | 976 | 91.3% |
| Single Unit, Attached | 8 | 0.7% |
| 2 Unit Apartments | 30 | 2.8% |
| 3 or 4 Unit Apartments | 15 | 1.4% |
| 5 to 9 Unit Apartments | 0 | 0.0% |
| 10 or more Apartments | 0 | 0.0% |
| Mobile Home / Other | 40 | 3.7% |
| Total | 1,069 | 100.0% |
Housing Structures by Occupancy in Bullard
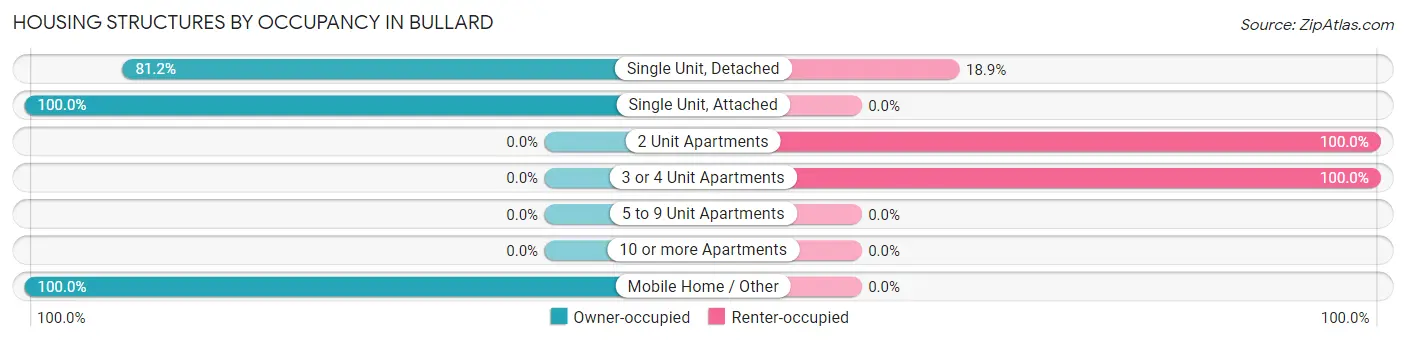
| Structure Type | Owner-occupied | Renter-occupied |
| Single Unit, Detached | 792 (81.1%) | 184 (18.9%) |
| Single Unit, Attached | 8 (100.0%) | 0 (0.0%) |
| 2 Unit Apartments | 0 (0.0%) | 30 (100.0%) |
| 3 or 4 Unit Apartments | 0 (0.0%) | 15 (100.0%) |
| 5 to 9 Unit Apartments | 0 (0.0%) | 0 (0.0%) |
| 10 or more Apartments | 0 (0.0%) | 0 (0.0%) |
| Mobile Home / Other | 40 (100.0%) | 0 (0.0%) |
| Total | 840 (78.6%) | 229 (21.4%) |
Housing Structures by Number of Rooms in Bullard
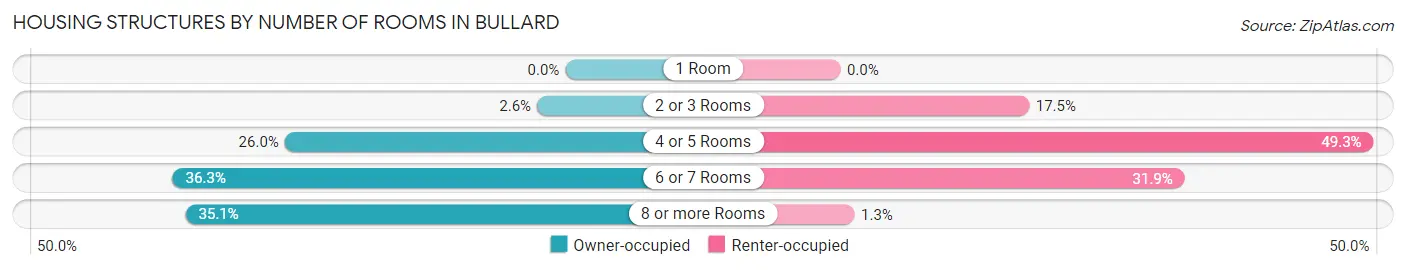
| Number of Rooms | Owner-occupied | Renter-occupied |
| 1 Room | 0 (0.0%) | 0 (0.0%) |
| 2 or 3 Rooms | 22 (2.6%) | 40 (17.5%) |
| 4 or 5 Rooms | 218 (26.0%) | 113 (49.3%) |
| 6 or 7 Rooms | 305 (36.3%) | 73 (31.9%) |
| 8 or more Rooms | 295 (35.1%) | 3 (1.3%) |
| Total | 840 (100.0%) | 229 (100.0%) |
Housing Structure by Heating Type in Bullard
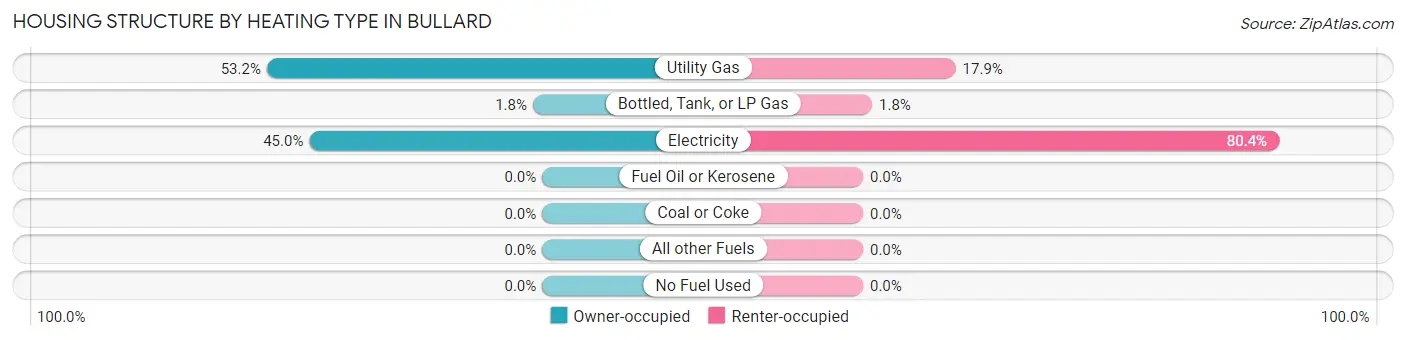
| Heating Type | Owner-occupied | Renter-occupied |
| Utility Gas | 447 (53.2%) | 41 (17.9%) |
| Bottled, Tank, or LP Gas | 15 (1.8%) | 4 (1.8%) |
| Electricity | 378 (45.0%) | 184 (80.3%) |
| Fuel Oil or Kerosene | 0 (0.0%) | 0 (0.0%) |
| Coal or Coke | 0 (0.0%) | 0 (0.0%) |
| All other Fuels | 0 (0.0%) | 0 (0.0%) |
| No Fuel Used | 0 (0.0%) | 0 (0.0%) |
| Total | 840 (100.0%) | 229 (100.0%) |
Household Vehicle Usage in Bullard
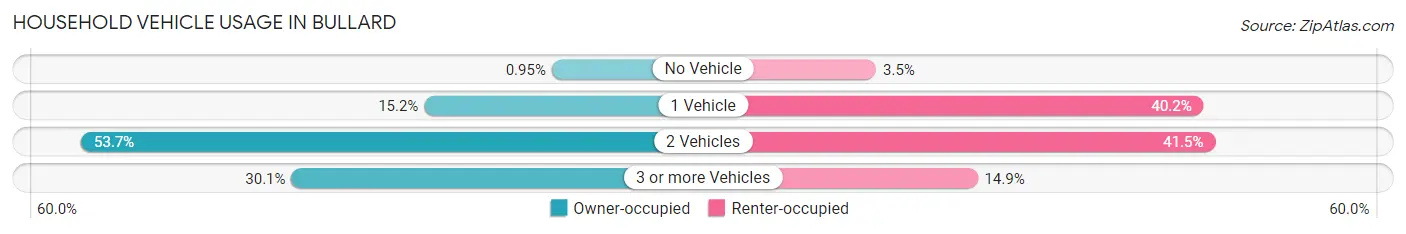
| Vehicles per Household | Owner-occupied | Renter-occupied |
| No Vehicle | 8 (0.9%) | 8 (3.5%) |
| 1 Vehicle | 128 (15.2%) | 92 (40.2%) |
| 2 Vehicles | 451 (53.7%) | 95 (41.5%) |
| 3 or more Vehicles | 253 (30.1%) | 34 (14.8%) |
| Total | 840 (100.0%) | 229 (100.0%) |
Real Estate & Mortgages in Bullard
Real Estate and Mortgage Overview in Bullard
| Characteristic | Without Mortgage | With Mortgage |
| Housing Units | 302 | 538 |
| Median Property Value | $172,700 | $275,300 |
| Median Household Income | $103,750 | $178 |
| Monthly Housing Costs | $802 | $50 |
| Real Estate Taxes | $4,580 | $59 |
Property Value by Mortgage Status in Bullard
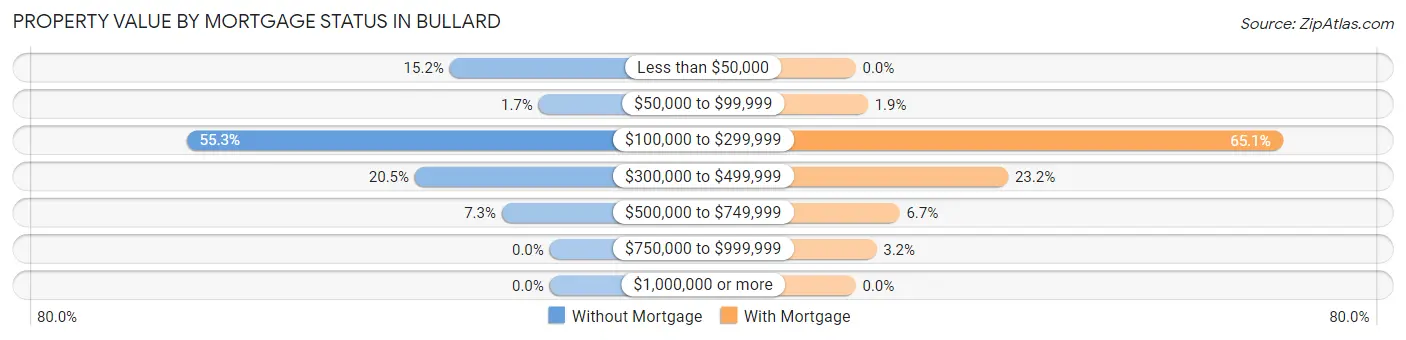
| Property Value | Without Mortgage | With Mortgage |
| Less than $50,000 | 46 (15.2%) | 0 (0.0%) |
| $50,000 to $99,999 | 5 (1.7%) | 10 (1.9%) |
| $100,000 to $299,999 | 167 (55.3%) | 350 (65.1%) |
| $300,000 to $499,999 | 62 (20.5%) | 125 (23.2%) |
| $500,000 to $749,999 | 22 (7.3%) | 36 (6.7%) |
| $750,000 to $999,999 | 0 (0.0%) | 17 (3.2%) |
| $1,000,000 or more | 0 (0.0%) | 0 (0.0%) |
| Total | 302 (100.0%) | 538 (100.0%) |
Household Income by Mortgage Status in Bullard
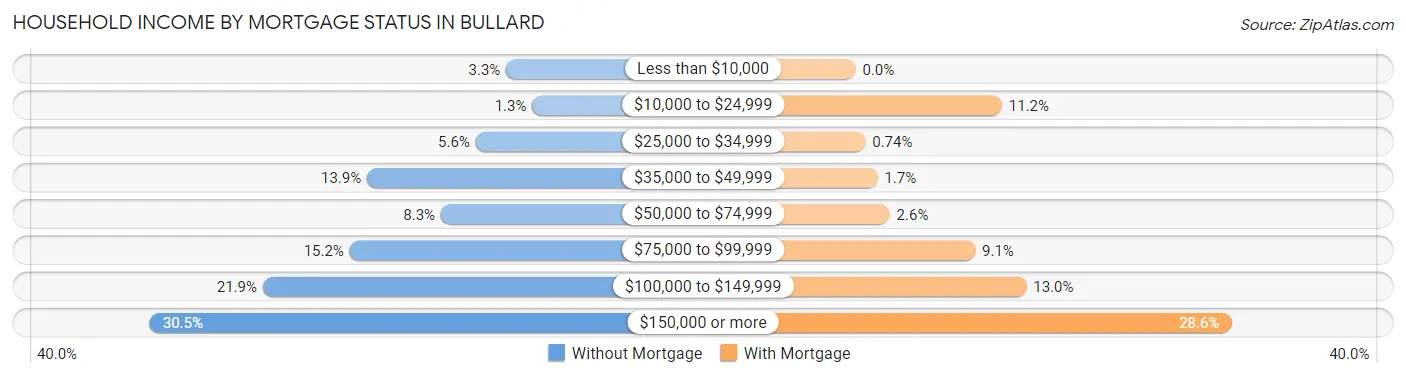
| Household Income | Without Mortgage | With Mortgage |
| Less than $10,000 | 10 (3.3%) | 0 (0.0%) |
| $10,000 to $24,999 | 4 (1.3%) | 60 (11.2%) |
| $25,000 to $34,999 | 17 (5.6%) | 4 (0.7%) |
| $35,000 to $49,999 | 42 (13.9%) | 9 (1.7%) |
| $50,000 to $74,999 | 25 (8.3%) | 14 (2.6%) |
| $75,000 to $99,999 | 46 (15.2%) | 49 (9.1%) |
| $100,000 to $149,999 | 66 (21.8%) | 70 (13.0%) |
| $150,000 or more | 92 (30.5%) | 154 (28.6%) |
| Total | 302 (100.0%) | 538 (100.0%) |
Property Value to Household Income Ratio in Bullard
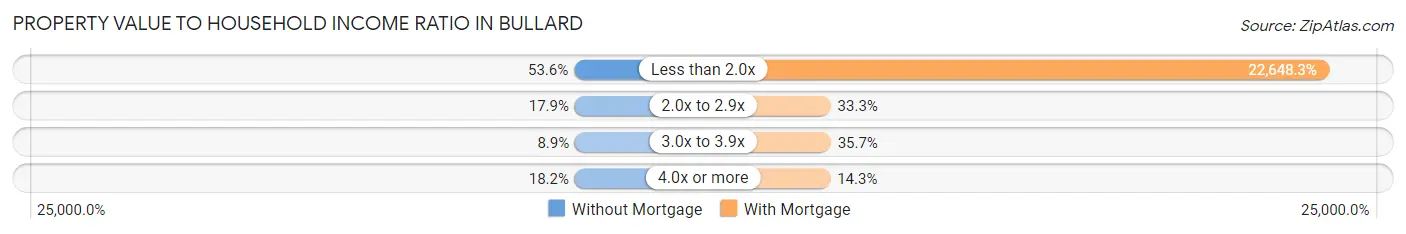
| Value-to-Income Ratio | Without Mortgage | With Mortgage |
| Less than 2.0x | 162 (53.6%) | 121,848 (22,648.3%) |
| 2.0x to 2.9x | 54 (17.9%) | 179 (33.3%) |
| 3.0x to 3.9x | 27 (8.9%) | 192 (35.7%) |
| 4.0x or more | 55 (18.2%) | 77 (14.3%) |
| Total | 302 (100.0%) | 538 (100.0%) |
Real Estate Taxes by Mortgage Status in Bullard
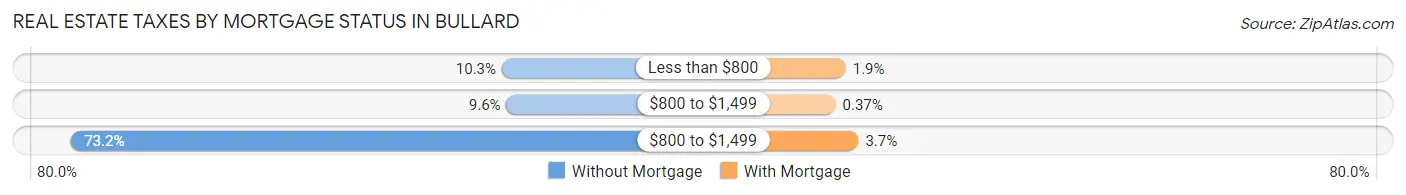
| Property Taxes | Without Mortgage | With Mortgage |
| Less than $800 | 31 (10.3%) | 10 (1.9%) |
| $800 to $1,499 | 29 (9.6%) | 2 (0.4%) |
| $800 to $1,499 | 221 (73.2%) | 20 (3.7%) |
| Total | 302 (100.0%) | 538 (100.0%) |
Health & Disability in Bullard
Health Insurance Coverage by Age in Bullard
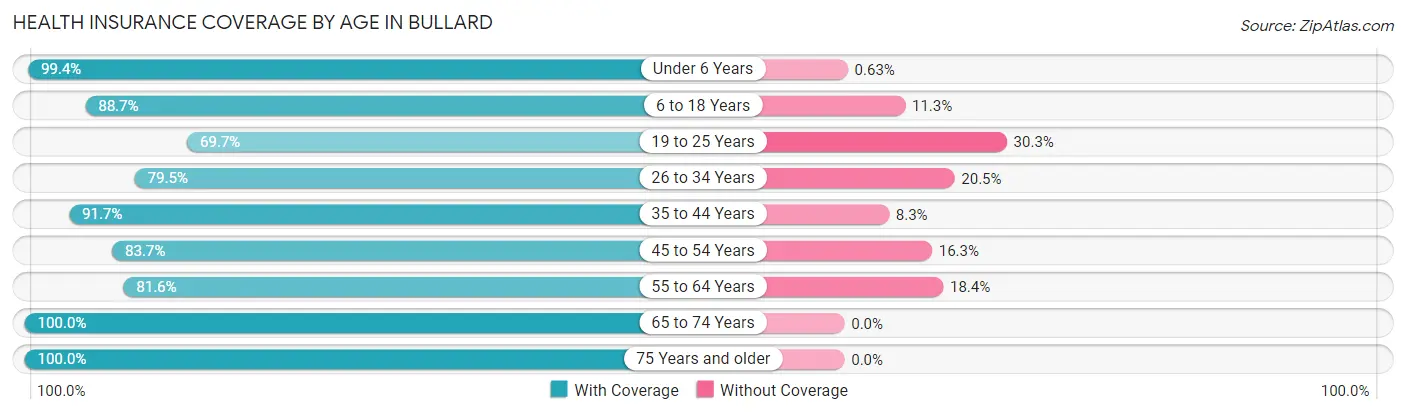
| Age Bracket | With Coverage | Without Coverage |
| Under 6 Years | 315 (99.4%) | 2 (0.6%) |
| 6 to 18 Years | 799 (88.7%) | 102 (11.3%) |
| 19 to 25 Years | 152 (69.7%) | 66 (30.3%) |
| 26 to 34 Years | 360 (79.5%) | 93 (20.5%) |
| 35 to 44 Years | 651 (91.7%) | 59 (8.3%) |
| 45 to 54 Years | 318 (83.7%) | 62 (16.3%) |
| 55 to 64 Years | 155 (81.6%) | 35 (18.4%) |
| 65 to 74 Years | 234 (100.0%) | 0 (0.0%) |
| 75 Years and older | 170 (100.0%) | 0 (0.0%) |
| Total | 3,154 (88.3%) | 419 (11.7%) |
Health Insurance Coverage by Citizenship Status in Bullard
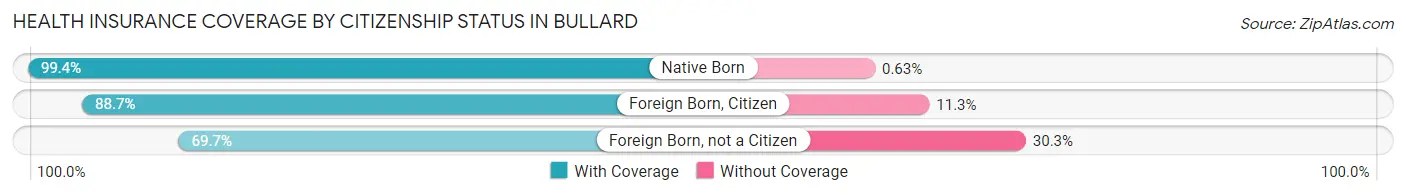
| Citizenship Status | With Coverage | Without Coverage |
| Native Born | 315 (99.4%) | 2 (0.6%) |
| Foreign Born, Citizen | 799 (88.7%) | 102 (11.3%) |
| Foreign Born, not a Citizen | 152 (69.7%) | 66 (30.3%) |
Health Insurance Coverage by Household Income in Bullard
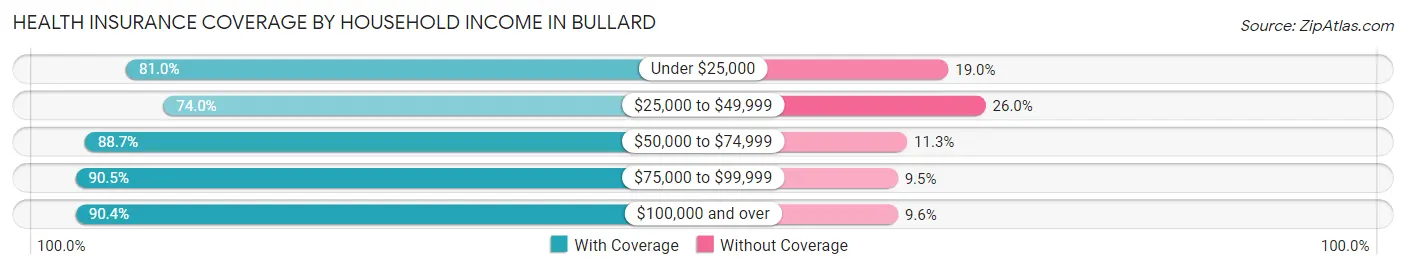
| Household Income | With Coverage | Without Coverage |
| Under $25,000 | 213 (81.0%) | 50 (19.0%) |
| $25,000 to $49,999 | 219 (74.0%) | 77 (26.0%) |
| $50,000 to $74,999 | 149 (88.7%) | 19 (11.3%) |
| $75,000 to $99,999 | 370 (90.5%) | 39 (9.5%) |
| $100,000 and over | 2,203 (90.4%) | 234 (9.6%) |
Public vs Private Health Insurance Coverage by Age in Bullard
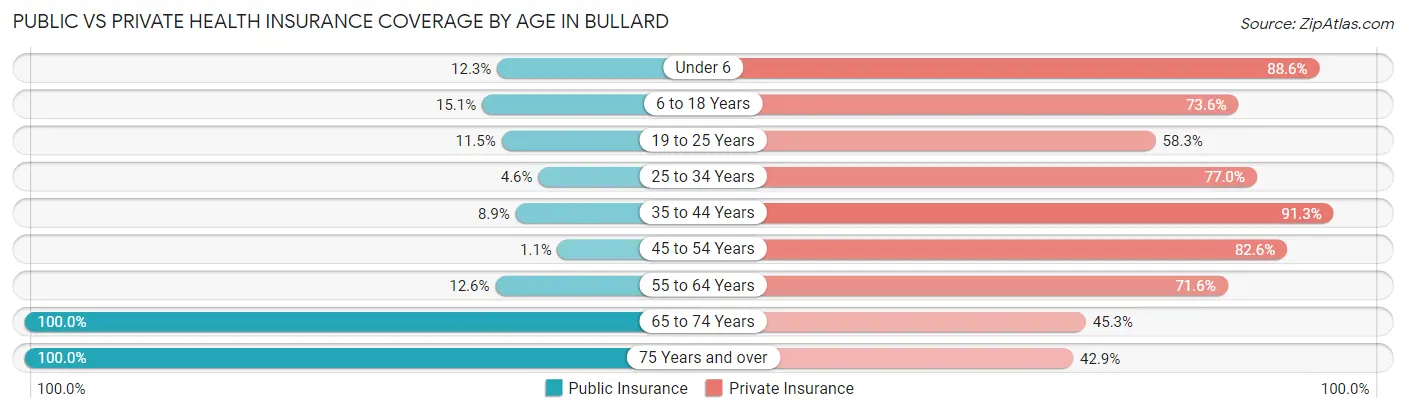
| Age Bracket | Public Insurance | Private Insurance |
| Under 6 | 39 (12.3%) | 281 (88.6%) |
| 6 to 18 Years | 136 (15.1%) | 663 (73.6%) |
| 19 to 25 Years | 25 (11.5%) | 127 (58.3%) |
| 25 to 34 Years | 21 (4.6%) | 349 (77.0%) |
| 35 to 44 Years | 63 (8.9%) | 648 (91.3%) |
| 45 to 54 Years | 4 (1.1%) | 314 (82.6%) |
| 55 to 64 Years | 24 (12.6%) | 136 (71.6%) |
| 65 to 74 Years | 234 (100.0%) | 106 (45.3%) |
| 75 Years and over | 170 (100.0%) | 73 (42.9%) |
| Total | 716 (20.0%) | 2,697 (75.5%) |
Disability Status by Sex by Age in Bullard
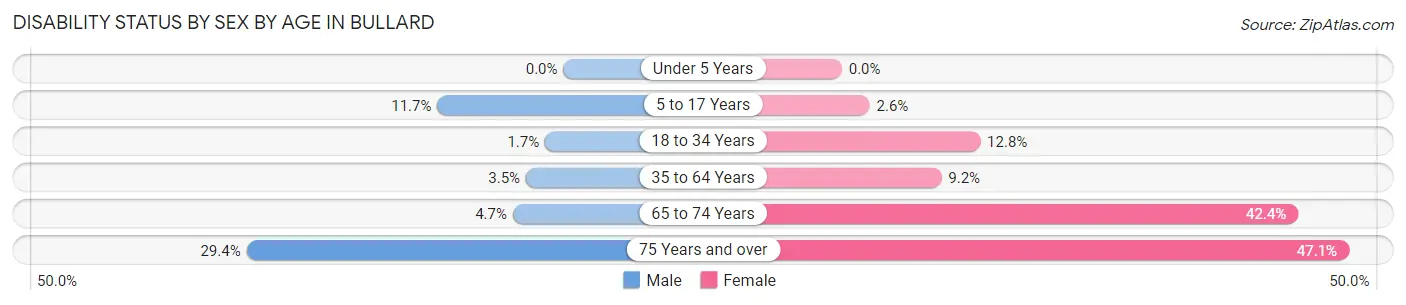
| Age Bracket | Male | Female |
| Under 5 Years | 0 (0.0%) | 0 (0.0%) |
| 5 to 17 Years | 51 (11.7%) | 11 (2.6%) |
| 18 to 34 Years | 7 (1.7%) | 43 (12.8%) |
| 35 to 64 Years | 23 (3.5%) | 57 (9.2%) |
| 65 to 74 Years | 3 (4.7%) | 72 (42.3%) |
| 75 Years and over | 30 (29.4%) | 32 (47.1%) |
Disability Class by Sex by Age in Bullard
Disability Class: Hearing Difficulty
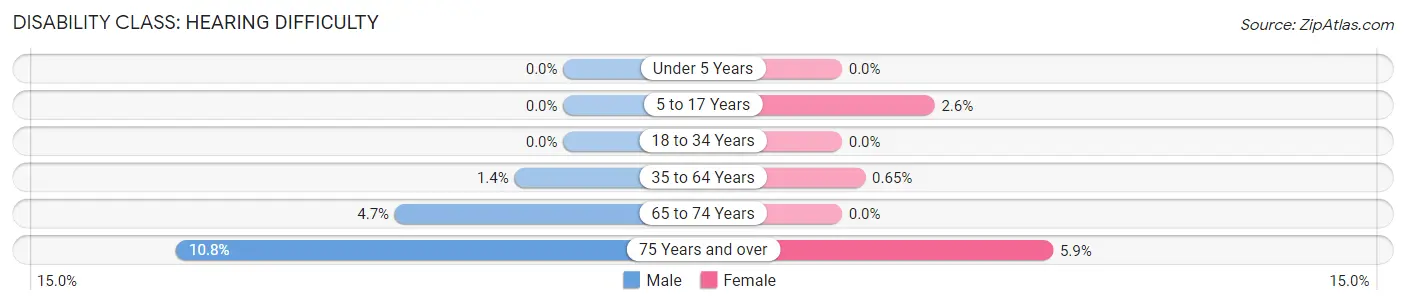
| Age Bracket | Male | Female |
| Under 5 Years | 0 (0.0%) | 0 (0.0%) |
| 5 to 17 Years | 0 (0.0%) | 11 (2.6%) |
| 18 to 34 Years | 0 (0.0%) | 0 (0.0%) |
| 35 to 64 Years | 9 (1.4%) | 4 (0.6%) |
| 65 to 74 Years | 3 (4.7%) | 0 (0.0%) |
| 75 Years and over | 11 (10.8%) | 4 (5.9%) |
Disability Class: Vision Difficulty
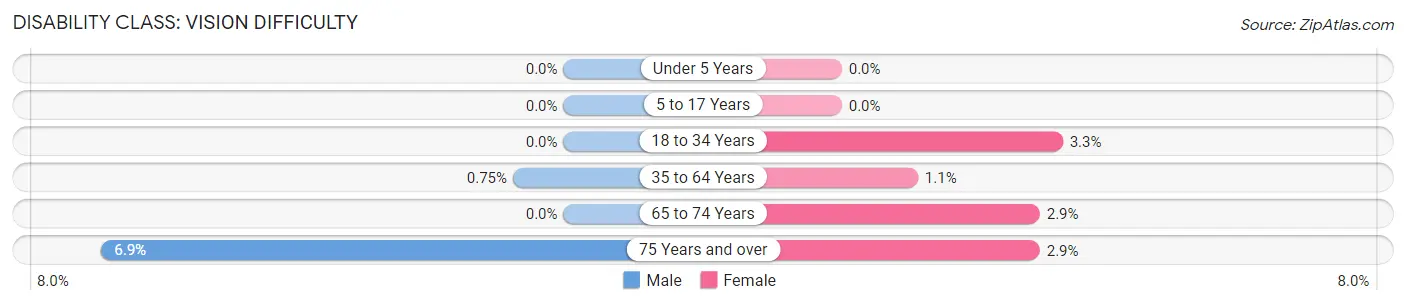
| Age Bracket | Male | Female |
| Under 5 Years | 0 (0.0%) | 0 (0.0%) |
| 5 to 17 Years | 0 (0.0%) | 0 (0.0%) |
| 18 to 34 Years | 0 (0.0%) | 11 (3.3%) |
| 35 to 64 Years | 5 (0.7%) | 7 (1.1%) |
| 65 to 74 Years | 0 (0.0%) | 5 (2.9%) |
| 75 Years and over | 7 (6.9%) | 2 (2.9%) |
Disability Class: Cognitive Difficulty
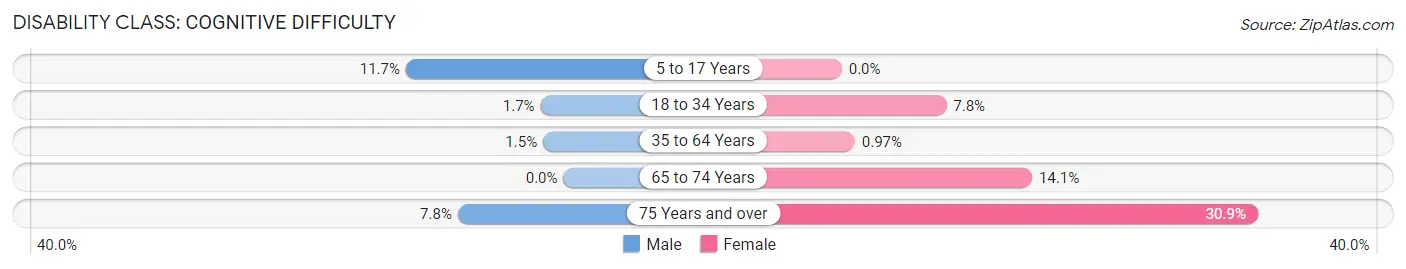
| Age Bracket | Male | Female |
| 5 to 17 Years | 51 (11.7%) | 0 (0.0%) |
| 18 to 34 Years | 7 (1.7%) | 26 (7.8%) |
| 35 to 64 Years | 10 (1.5%) | 6 (1.0%) |
| 65 to 74 Years | 0 (0.0%) | 24 (14.1%) |
| 75 Years and over | 8 (7.8%) | 21 (30.9%) |
Disability Class: Ambulatory Difficulty
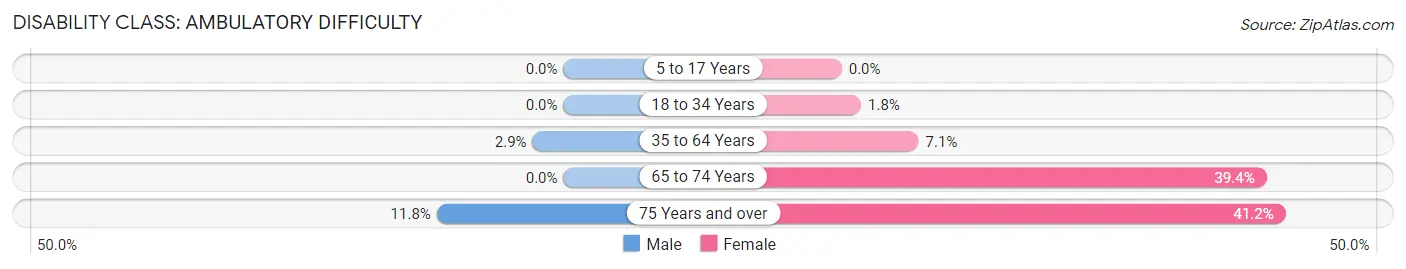
| Age Bracket | Male | Female |
| 5 to 17 Years | 0 (0.0%) | 0 (0.0%) |
| 18 to 34 Years | 0 (0.0%) | 6 (1.8%) |
| 35 to 64 Years | 19 (2.9%) | 44 (7.1%) |
| 65 to 74 Years | 0 (0.0%) | 67 (39.4%) |
| 75 Years and over | 12 (11.8%) | 28 (41.2%) |
Disability Class: Self-Care Difficulty
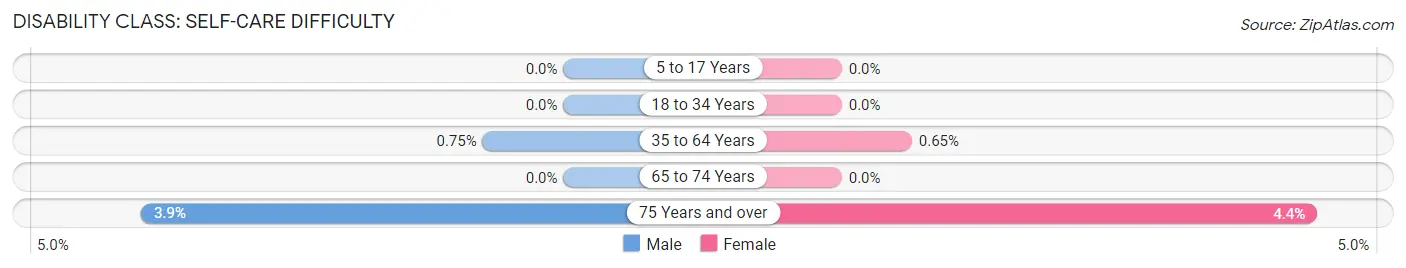
| Age Bracket | Male | Female |
| 5 to 17 Years | 0 (0.0%) | 0 (0.0%) |
| 18 to 34 Years | 0 (0.0%) | 0 (0.0%) |
| 35 to 64 Years | 5 (0.7%) | 4 (0.6%) |
| 65 to 74 Years | 0 (0.0%) | 0 (0.0%) |
| 75 Years and over | 4 (3.9%) | 3 (4.4%) |
Technology Access in Bullard
Computing Device Access in Bullard
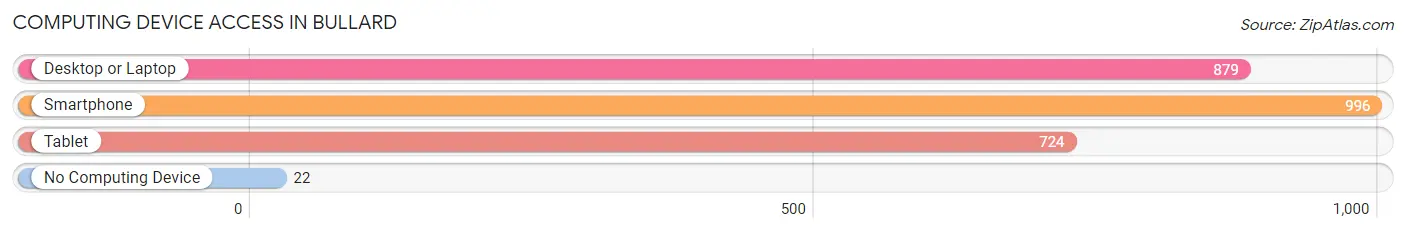
| Device Type | # Households | % Households |
| Desktop or Laptop | 879 | 82.2% |
| Smartphone | 996 | 93.2% |
| Tablet | 724 | 67.7% |
| No Computing Device | 22 | 2.1% |
| Total | 1,069 | 100.0% |
Internet Access in Bullard
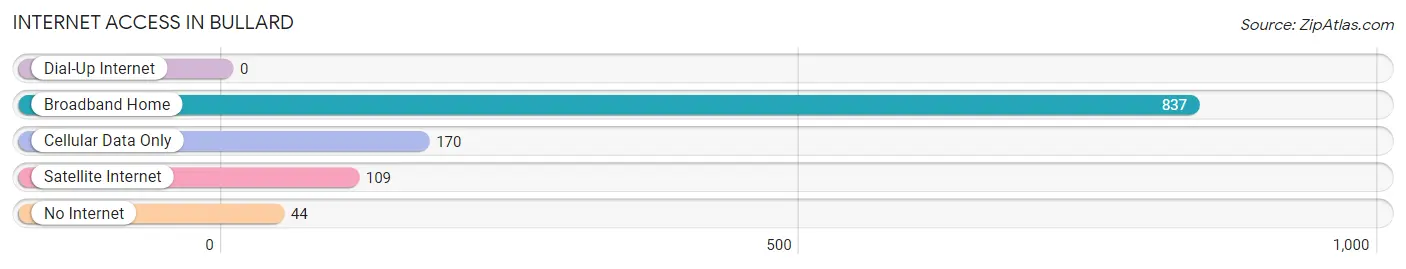
| Internet Type | # Households | % Households |
| Dial-Up Internet | 0 | 0.0% |
| Broadband Home | 837 | 78.3% |
| Cellular Data Only | 170 | 15.9% |
| Satellite Internet | 109 | 10.2% |
| No Internet | 44 | 4.1% |
| Total | 1,069 | 100.0% |
Bullard Summary
Bullard, Texas is a small town located in Smith County, Texas, United States. It is situated about 10 miles south of Tyler, the county seat. The population of Bullard was 2,363 at the 2010 census, up from 1,945 at the 2000 census.
History
The area that is now Bullard was first settled in the late 1840s by a group of settlers from Alabama. The settlement was originally known as "Pine Springs" due to the abundance of pine trees in the area. In 1854, the settlement was renamed "Bullard" after a local family.
The town was officially incorporated in 1891 and the first post office was established in 1892. The town grew slowly but steadily over the next few decades, with the population reaching 1,000 by the 1930s.
Geography
Bullard is located at 32°14'25" North, 95°25'17" West (32.240278, -95.421389). According to the United States Census Bureau, the town has a total area of 2.2 square miles, all of it land.
Economy
The economy of Bullard is largely based on agriculture and light industry. The town is home to several small businesses, including a feed store, a hardware store, and a lumber yard. The town also has a few restaurants and a few small retail stores.
The town is also home to a number of manufacturing plants, including a plastics plant, a metal fabrication plant, and a paper mill. The town is also home to a number of oil and gas wells.
Demographics
As of the census of 2000, there were 1,945 people, 745 households, and 545 families residing in the town. The population density was 876.2 people per square mile (338.3/km²). There were 809 housing units at an average density of 361.2 per square mile (139.5/km²). The racial makeup of the town was 87.90% White, 8.45% African American, 0.36% Native American, 0.36% Asian, 0.05% Pacific Islander, 1.67% from other races, and 1.71% from two or more races. Hispanic or Latino of any race were 3.45% of the population.
There were 745 households out of which 33.2% had children under the age of 18 living with them, 57.2% were married couples living together, 11.2% had a female householder with no husband present, and 27.2% were non-families. 24.2% of all households were made up of individuals and 11.2% had someone living alone who was 65 years of age or older. The average household size was 2.60 and the average family size was 3.09.
In the town, the population was spread out with 27.2% under the age of 18, 8.2% from 18 to 24, 28.2% from 25 to 44, 22.7% from 45 to 64, and 13.7% who were 65 years of age or older. The median age was 36 years. For every 100 females, there were 93.2 males. For every 100 females age 18 and over, there were 88.7 males.
The median income for a household in the town was $35,000, and the median income for a family was $41,250. Males had a median income of $30,000 versus $21,250 for females. The per capita income for the town was $17,845. About 8.2% of families and 10.2% of the population were below the poverty line, including 13.2% of those under age 18 and 8.2% of those age 65 or over.
Common Questions
What is Per Capita Income in Bullard?
Per Capita income in Bullard is $38,405.
What is the Median Family Income in Bullard?
Median Family Income in Bullard is $119,653.
What is the Median Household income in Bullard?
Median Household Income in Bullard is $104,141.
What is Income or Wage Gap in Bullard?
Income or Wage Gap in Bullard is 26.0%.
Women in Bullard earn 74.0 cents for every dollar earned by a man.
What is Inequality or Gini Index in Bullard?
Inequality or Gini Index in Bullard is 0.40.
What is the Total Population of Bullard?
Total Population of Bullard is 3,573.
What is the Total Male Population of Bullard?
Total Male Population of Bullard is 1,801.
What is the Total Female Population of Bullard?
Total Female Population of Bullard is 1,772.
What is the Ratio of Males per 100 Females in Bullard?
There are 101.64 Males per 100 Females in Bullard.
What is the Ratio of Females per 100 Males in Bullard?
There are 98.39 Females per 100 Males in Bullard.
What is the Median Population Age in Bullard?
Median Population Age in Bullard is 33.6 Years.
What is the Average Family Size in Bullard
Average Family Size in Bullard is 3.7 People.
What is the Average Household Size in Bullard
Average Household Size in Bullard is 3.3 People.
How Large is the Labor Force in Bullard?
There are 1,673 People in the Labor Forcein in Bullard.
What is the Percentage of People in the Labor Force in Bullard?
66.1% of People are in the Labor Force in Bullard.
What is the Unemployment Rate in Bullard?
Unemployment Rate in Bullard is 1.9%.