Buffalo Gap, TX Map & Demographics
Buffalo Gap Map
Buffalo Gap Overview
$29,027
PER CAPITA INCOME
$85,625
AVG FAMILY INCOME
$52,404
AVG HOUSEHOLD INCOME
57.8%
WAGE / INCOME GAP [ % ]
42.2¢/ $1
WAGE / INCOME GAP [ $ ]
0.44
INEQUALITY / GINI INDEX
579
TOTAL POPULATION
271
MALE POPULATION
308
FEMALE POPULATION
87.99
MALES / 100 FEMALES
113.65
FEMALES / 100 MALES
36.4
MEDIAN AGE
3.5
AVG FAMILY SIZE
2.6
AVG HOUSEHOLD SIZE
245
LABOR FORCE [ PEOPLE ]
53.1%
PERCENT IN LABOR FORCE
Buffalo Gap Zip Codes
Buffalo Gap Area Codes
Income in Buffalo Gap
Income Overview in Buffalo Gap
Per Capita Income in Buffalo Gap is $29,027, while median incomes of families and households are $85,625 and $52,404 respectively.
| Characteristic | Number | Measure |
| Per Capita Income | 579 | $29,027 |
| Median Family Income | 131 | $85,625 |
| Mean Family Income | 131 | $100,083 |
| Median Household Income | 207 | $52,404 |
| Mean Household Income | 207 | $75,636 |
| Income Deficit | 131 | $0 |
| Wage / Income Gap (%) | 579 | 57.84% |
| Wage / Income Gap ($) | 579 | 42.16¢ per $1 |
| Gini / Inequality Index | 579 | 0.44 |
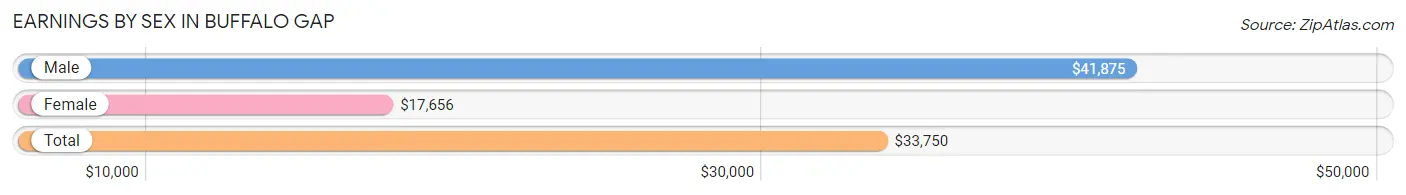
Earnings by Sex in Buffalo Gap
Average Earnings in Buffalo Gap are $33,750, $41,875 for men and $17,656 for women, a difference of 57.8%.
| Sex | Number | Average Earnings |
| Male | 137 (55.2%) | $41,875 |
| Female | 111 (44.8%) | $17,656 |
| Total | 248 (100.0%) | $33,750 |
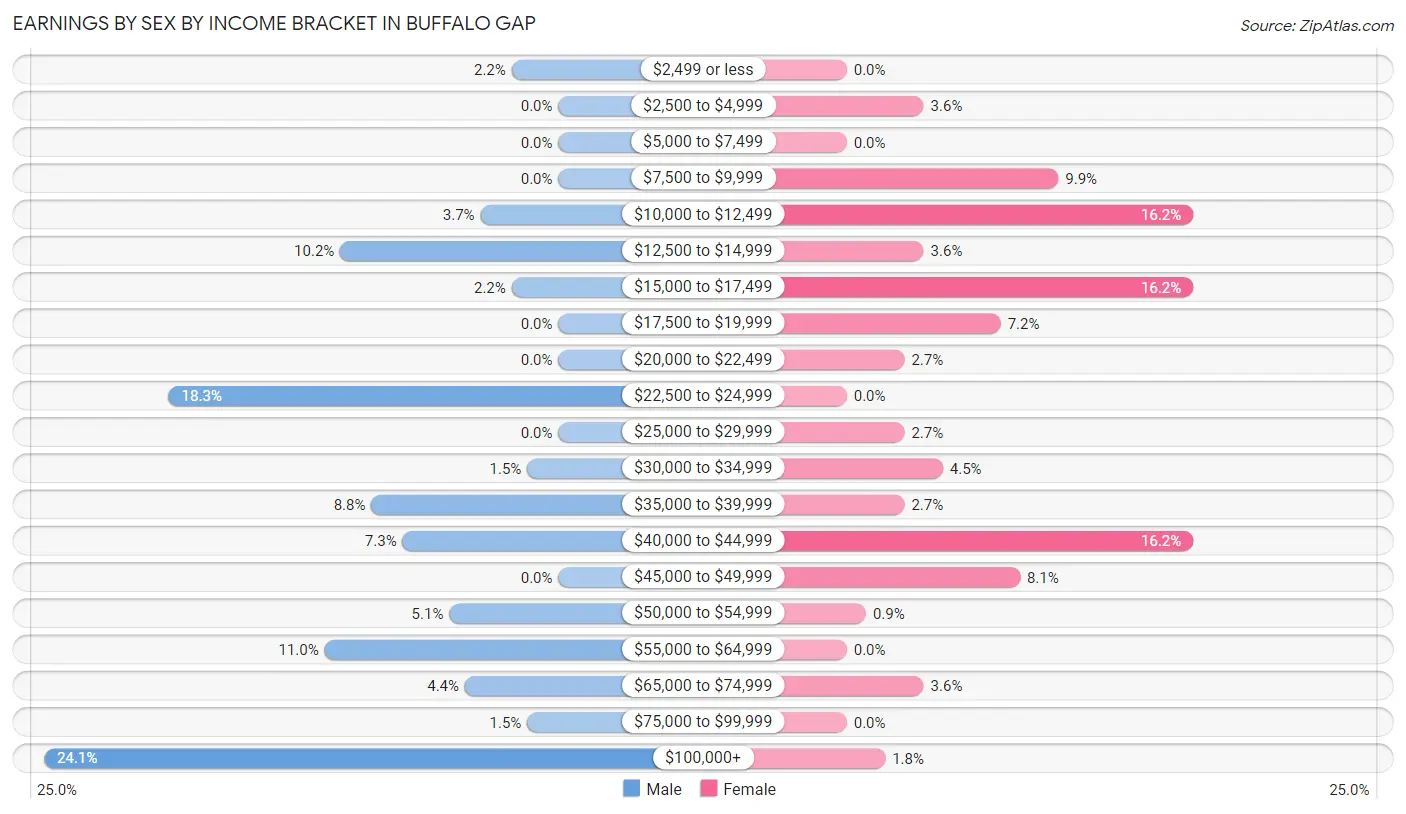
Earnings by Sex by Income Bracket in Buffalo Gap
The most common earnings brackets in Buffalo Gap are $100,000+ for men (33 | 24.1%) and $10,000 to $12,499 for women (18 | 16.2%).
| Income | Male | Female |
| $2,499 or less | 3 (2.2%) | 0 (0.0%) |
| $2,500 to $4,999 | 0 (0.0%) | 4 (3.6%) |
| $5,000 to $7,499 | 0 (0.0%) | 0 (0.0%) |
| $7,500 to $9,999 | 0 (0.0%) | 11 (9.9%) |
| $10,000 to $12,499 | 5 (3.6%) | 18 (16.2%) |
| $12,500 to $14,999 | 14 (10.2%) | 4 (3.6%) |
| $15,000 to $17,499 | 3 (2.2%) | 18 (16.2%) |
| $17,500 to $19,999 | 0 (0.0%) | 8 (7.2%) |
| $20,000 to $22,499 | 0 (0.0%) | 3 (2.7%) |
| $22,500 to $24,999 | 25 (18.2%) | 0 (0.0%) |
| $25,000 to $29,999 | 0 (0.0%) | 3 (2.7%) |
| $30,000 to $34,999 | 2 (1.5%) | 5 (4.5%) |
| $35,000 to $39,999 | 12 (8.8%) | 3 (2.7%) |
| $40,000 to $44,999 | 10 (7.3%) | 18 (16.2%) |
| $45,000 to $49,999 | 0 (0.0%) | 9 (8.1%) |
| $50,000 to $54,999 | 7 (5.1%) | 1 (0.9%) |
| $55,000 to $64,999 | 15 (11.0%) | 0 (0.0%) |
| $65,000 to $74,999 | 6 (4.4%) | 4 (3.6%) |
| $75,000 to $99,999 | 2 (1.5%) | 0 (0.0%) |
| $100,000+ | 33 (24.1%) | 2 (1.8%) |
| Total | 137 (100.0%) | 111 (100.0%) |
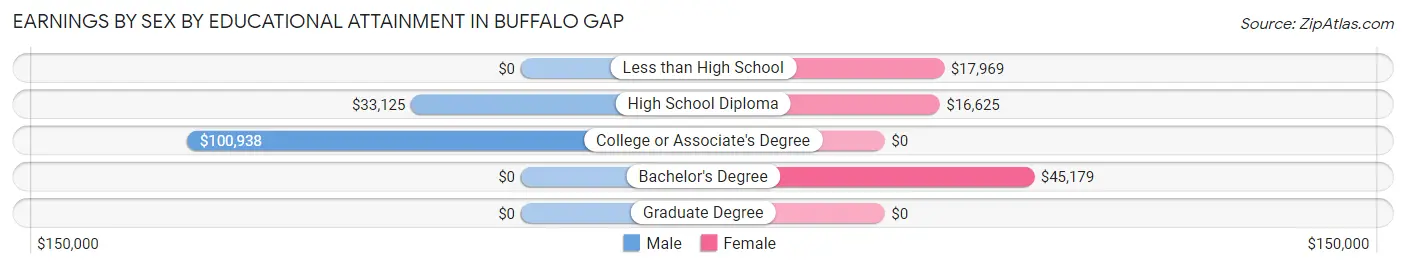
Earnings by Sex by Educational Attainment in Buffalo Gap
Average earnings in Buffalo Gap are $44,688 for men and $17,969 for women, a difference of 59.8%. Men with an educational attainment of college or associate's degree enjoy the highest average annual earnings of $100,938, while those with high school diploma education earn the least with $33,125. Women with an educational attainment of bachelor's degree earn the most with the average annual earnings of $45,179, while those with high school diploma education have the smallest earnings of $16,625.
| Educational Attainment | Male Income | Female Income |
| Less than High School | - | - |
| High School Diploma | $33,125 | $16,625 |
| College or Associate's Degree | $100,938 | $0 |
| Bachelor's Degree | - | - |
| Graduate Degree | - | - |
| Total | $44,688 | $17,969 |
Family Income in Buffalo Gap
Family Income Brackets in Buffalo Gap
According to the Buffalo Gap family income data, there are 37 families falling into the $100,000 to $149,999 income range, which is the most common income bracket and makes up 28.2% of all families.
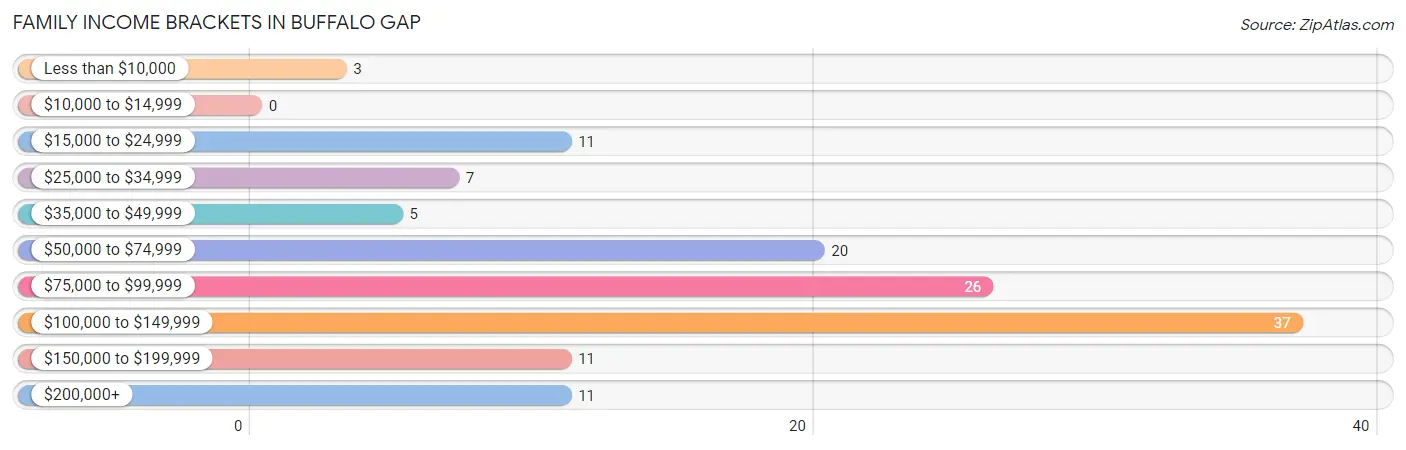
| Income Bracket | # Families | % Families |
| Less than $10,000 | 3 | 2.3% |
| $10,000 to $14,999 | 0 | 0.0% |
| $15,000 to $24,999 | 11 | 8.4% |
| $25,000 to $34,999 | 7 | 5.3% |
| $35,000 to $49,999 | 5 | 3.8% |
| $50,000 to $74,999 | 20 | 15.3% |
| $75,000 to $99,999 | 26 | 19.8% |
| $100,000 to $149,999 | 37 | 28.2% |
| $150,000 to $199,999 | 11 | 8.4% |
| $200,000+ | 11 | 8.4% |
Family Income by Famaliy Size in Buffalo Gap
3-person families (40 | 30.5%) account for the highest median family income in Buffalo Gap with $110,357 per family, while 2-person families (44 | 33.6%) have the highest median income of $37,728 per family member.
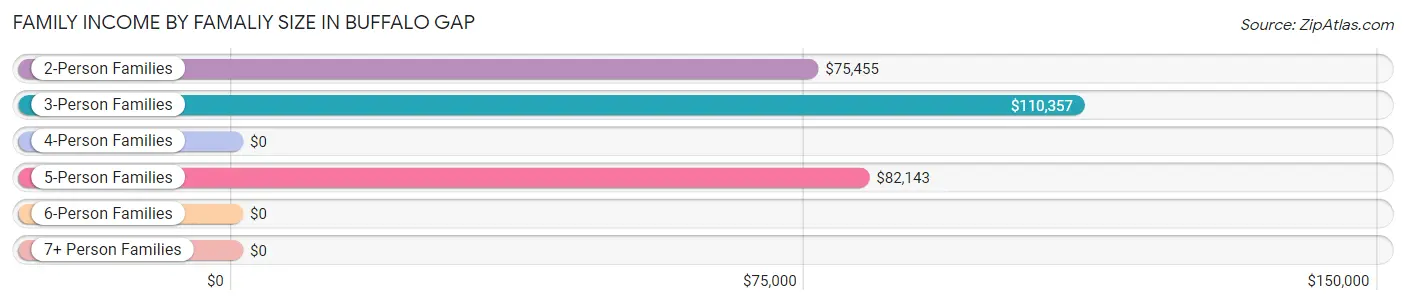
| Income Bracket | # Families | Median Income |
| 2-Person Families | 44 (33.6%) | $75,455 |
| 3-Person Families | 40 (30.5%) | $110,357 |
| 4-Person Families | 26 (19.9%) | $0 |
| 5-Person Families | 12 (9.2%) | $82,143 |
| 6-Person Families | 0 (0.0%) | $0 |
| 7+ Person Families | 9 (6.9%) | $0 |
| Total | 131 (100.0%) | $85,625 |
Family Income by Number of Earners in Buffalo Gap
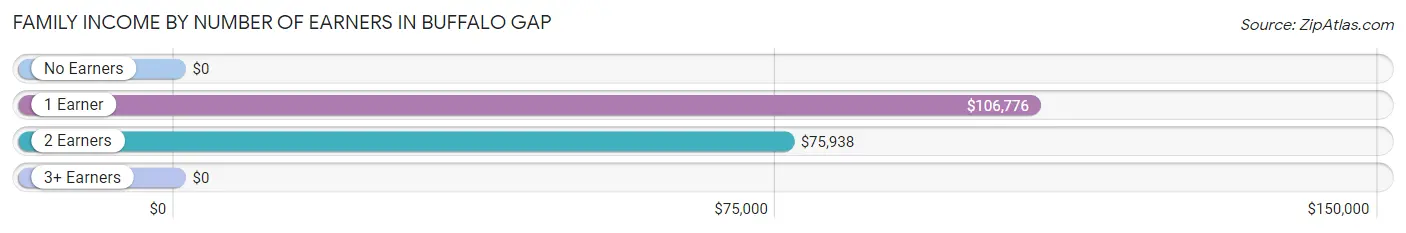
| Number of Earners | # Families | Median Income |
| No Earners | 24 (18.3%) | $0 |
| 1 Earner | 61 (46.6%) | $106,776 |
| 2 Earners | 37 (28.2%) | $75,938 |
| 3+ Earners | 9 (6.9%) | $0 |
| Total | 131 (100.0%) | $85,625 |
Household Income in Buffalo Gap
Household Income Brackets in Buffalo Gap
With 39 households falling in the category, the $100,000 to $149,999 income range is the most frequent in Buffalo Gap, accounting for 18.8% of all households. In contrast, only 3 households (1.5%) fall into the less than $10,000 income bracket, making it the least populous group.
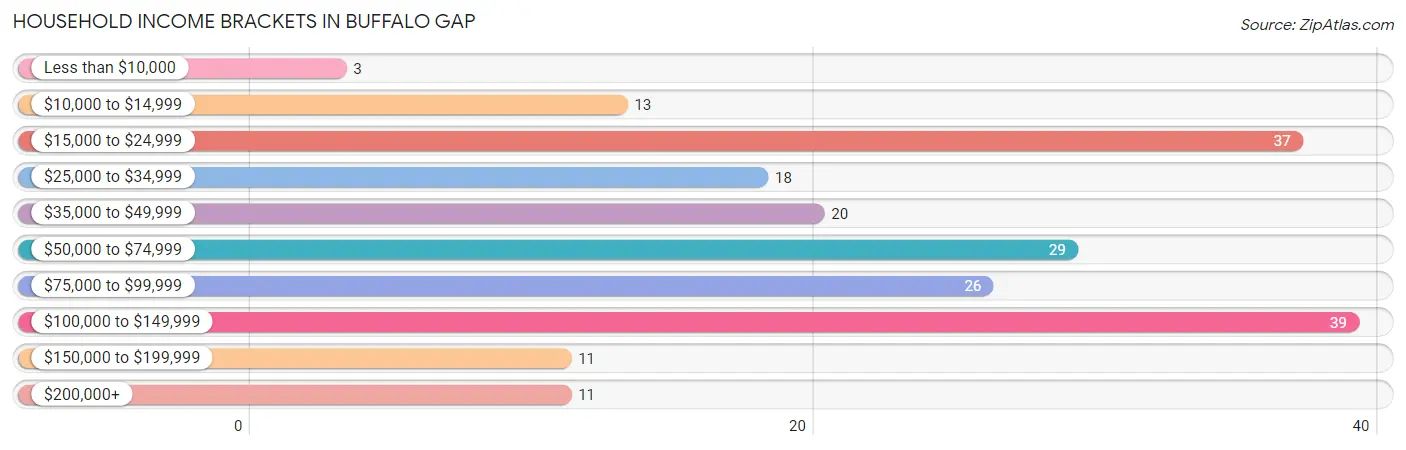
| Income Bracket | # Households | % Households |
| Less than $10,000 | 3 | 1.4% |
| $10,000 to $14,999 | 13 | 6.3% |
| $15,000 to $24,999 | 37 | 17.9% |
| $25,000 to $34,999 | 18 | 8.7% |
| $35,000 to $49,999 | 20 | 9.7% |
| $50,000 to $74,999 | 29 | 14.0% |
| $75,000 to $99,999 | 26 | 12.6% |
| $100,000 to $149,999 | 39 | 18.8% |
| $150,000 to $199,999 | 11 | 5.3% |
| $200,000+ | 11 | 5.3% |
Household Income by Householder Age in Buffalo Gap
The median household income in Buffalo Gap is $52,404, with the highest median household income of $73,333 found in the 45 to 64 years age bracket for the primary householder. A total of 46 households (22.2%) fall into this category. Meanwhile, the 15 to 24 years age bracket for the primary householder has the lowest median household income of $0, with 3 households (1.5%) in this group.
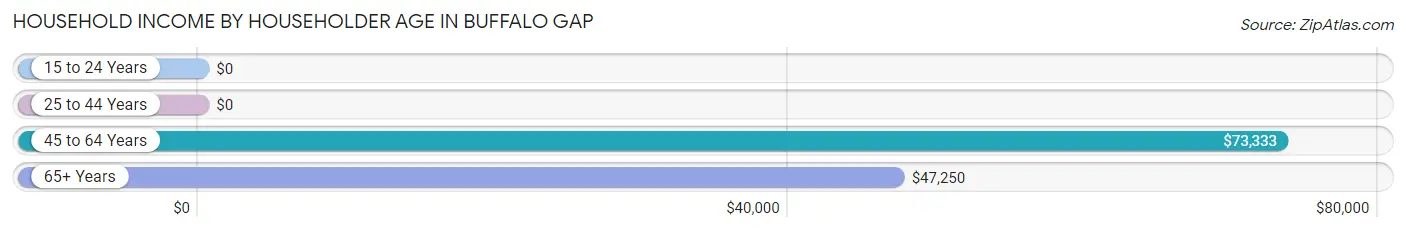
| Income Bracket | # Households | Median Income |
| 15 to 24 Years | 3 (1.5%) | $0 |
| 25 to 44 Years | 95 (45.9%) | $0 |
| 45 to 64 Years | 46 (22.2%) | $73,333 |
| 65+ Years | 63 (30.4%) | $47,250 |
| Total | 207 (100.0%) | $52,404 |
Poverty in Buffalo Gap
Income Below Poverty by Sex and Age in Buffalo Gap
With 16.6% poverty level for males and 28.6% for females among the residents of Buffalo Gap, 12 to 14 year old males and 12 to 14 year old females are the most vulnerable to poverty, with 20 males (100.0%) and 20 females (100.0%) in their respective age groups living below the poverty level.
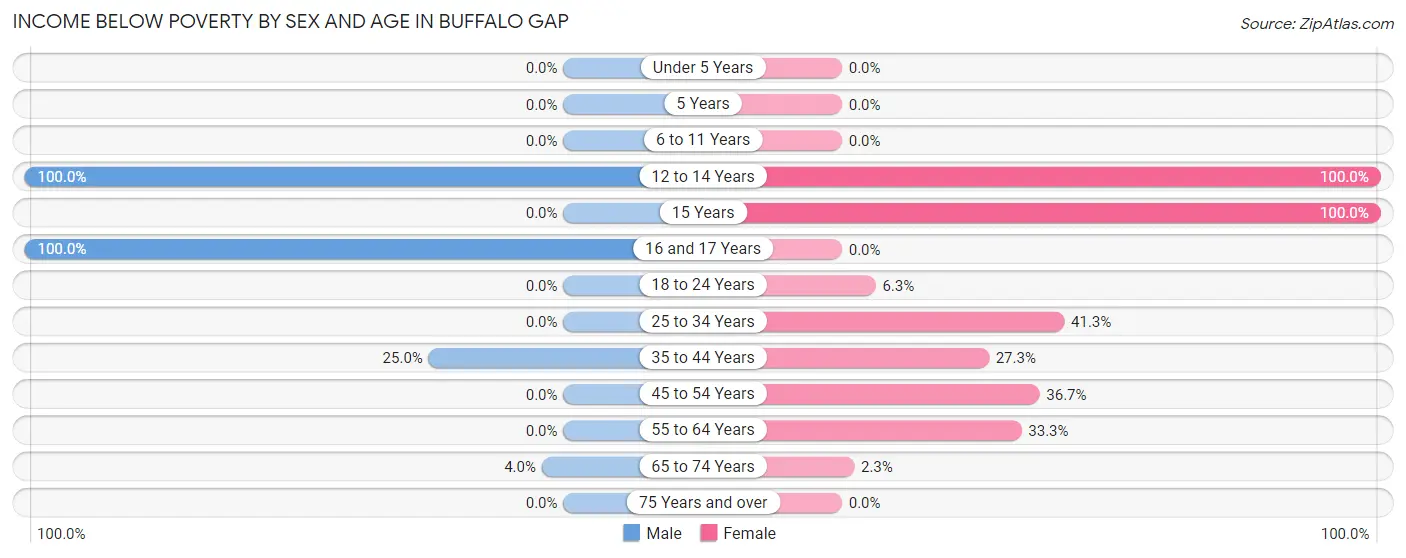
| Age Bracket | Male | Female |
| Under 5 Years | 0 (0.0%) | 0 (0.0%) |
| 5 Years | 0 (0.0%) | 0 (0.0%) |
| 6 to 11 Years | 0 (0.0%) | 0 (0.0%) |
| 12 to 14 Years | 20 (100.0%) | 20 (100.0%) |
| 15 Years | 0 (0.0%) | 10 (100.0%) |
| 16 and 17 Years | 8 (100.0%) | 0 (0.0%) |
| 18 to 24 Years | 0 (0.0%) | 2 (6.2%) |
| 25 to 34 Years | 0 (0.0%) | 26 (41.3%) |
| 35 to 44 Years | 16 (25.0%) | 9 (27.3%) |
| 45 to 54 Years | 0 (0.0%) | 11 (36.7%) |
| 55 to 64 Years | 0 (0.0%) | 9 (33.3%) |
| 65 to 74 Years | 1 (4.0%) | 1 (2.3%) |
| 75 Years and over | 0 (0.0%) | 0 (0.0%) |
| Total | 45 (16.6%) | 88 (28.6%) |
Income Above Poverty by Sex and Age in Buffalo Gap
According to the poverty statistics in Buffalo Gap, males aged under 5 years and females aged under 5 years are the age groups that are most secure financially, with 100.0% of males and 100.0% of females in these age groups living above the poverty line.
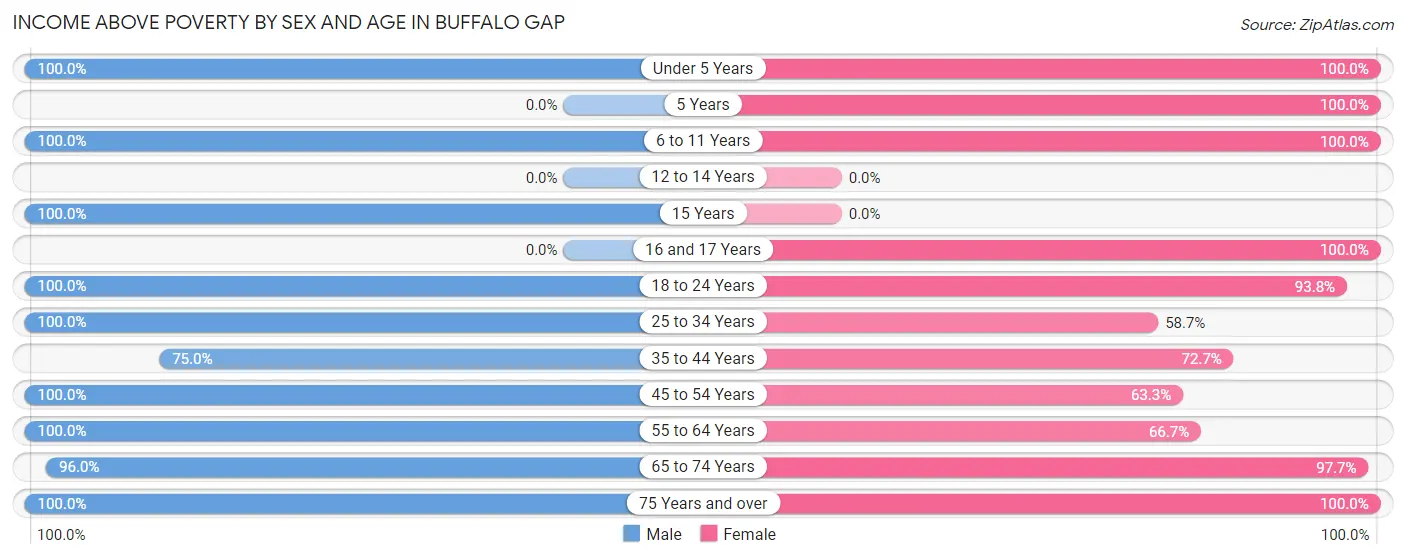
| Age Bracket | Male | Female |
| Under 5 Years | 8 (100.0%) | 12 (100.0%) |
| 5 Years | 0 (0.0%) | 4 (100.0%) |
| 6 to 11 Years | 19 (100.0%) | 4 (100.0%) |
| 12 to 14 Years | 0 (0.0%) | 0 (0.0%) |
| 15 Years | 21 (100.0%) | 0 (0.0%) |
| 16 and 17 Years | 0 (0.0%) | 11 (100.0%) |
| 18 to 24 Years | 19 (100.0%) | 30 (93.8%) |
| 25 to 34 Years | 32 (100.0%) | 37 (58.7%) |
| 35 to 44 Years | 48 (75.0%) | 24 (72.7%) |
| 45 to 54 Years | 8 (100.0%) | 19 (63.3%) |
| 55 to 64 Years | 25 (100.0%) | 18 (66.7%) |
| 65 to 74 Years | 24 (96.0%) | 43 (97.7%) |
| 75 Years and over | 22 (100.0%) | 18 (100.0%) |
| Total | 226 (83.4%) | 220 (71.4%) |
Income Below Poverty Among Married-Couple Families in Buffalo Gap
The poverty statistics for married-couple families in Buffalo Gap show that 3.0% or 3 of the total 100 families live below the poverty line. Families with no children have the highest poverty rate of 4.3%, comprising of 3 families. On the other hand, families with 1 or 2 children have the lowest poverty rate of 0.0%, which includes 0 families.
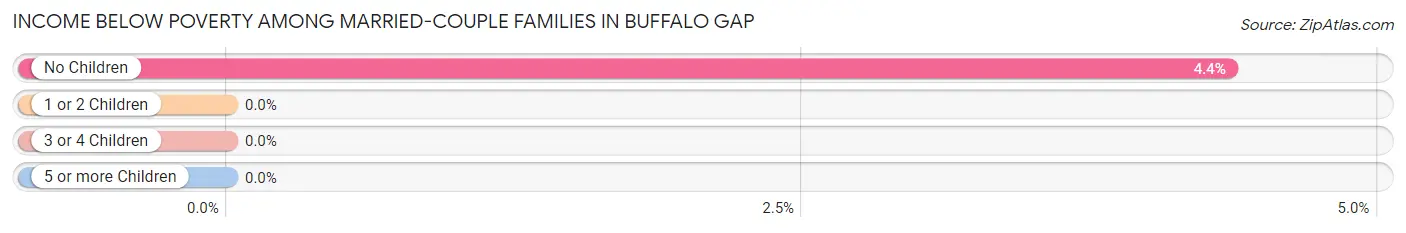
| Children | Above Poverty | Below Poverty |
| No Children | 66 (95.7%) | 3 (4.3%) |
| 1 or 2 Children | 28 (100.0%) | 0 (0.0%) |
| 3 or 4 Children | 3 (100.0%) | 0 (0.0%) |
| 5 or more Children | 0 (0.0%) | 0 (0.0%) |
| Total | 97 (97.0%) | 3 (3.0%) |
Income Below Poverty Among Single-Parent Households in Buffalo Gap
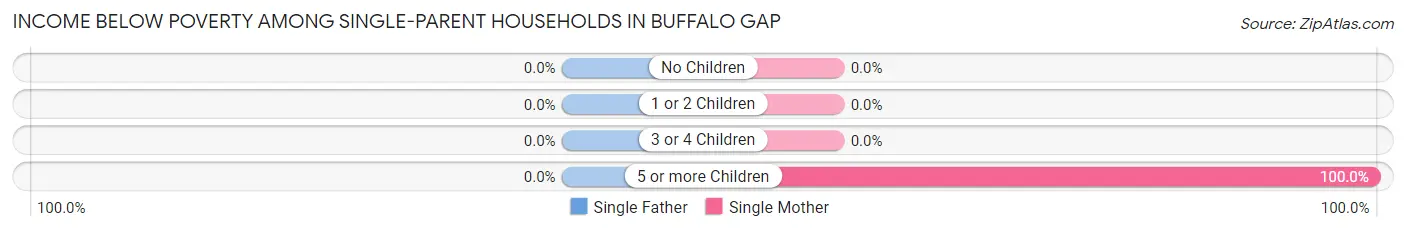
| Children | Single Father | Single Mother |
| No Children | 0 (0.0%) | 0 (0.0%) |
| 1 or 2 Children | 0 (0.0%) | 0 (0.0%) |
| 3 or 4 Children | 0 (0.0%) | 0 (0.0%) |
| 5 or more Children | 0 (0.0%) | 9 (100.0%) |
| Total | 0 (0.0%) | 9 (60.0%) |
Income Below Poverty Among Married-Couple vs Single-Parent Households in Buffalo Gap
The poverty data for Buffalo Gap shows that 3 of the married-couple family households (3.0%) and 9 of the single-parent households (29.0%) are living below the poverty level. Within the married-couple family households, those with no children have the highest poverty rate, with 3 households (4.3%) falling below the poverty line. Among the single-parent households, those with 5 or more children have the highest poverty rate, with 9 household (100.0%) living below poverty.
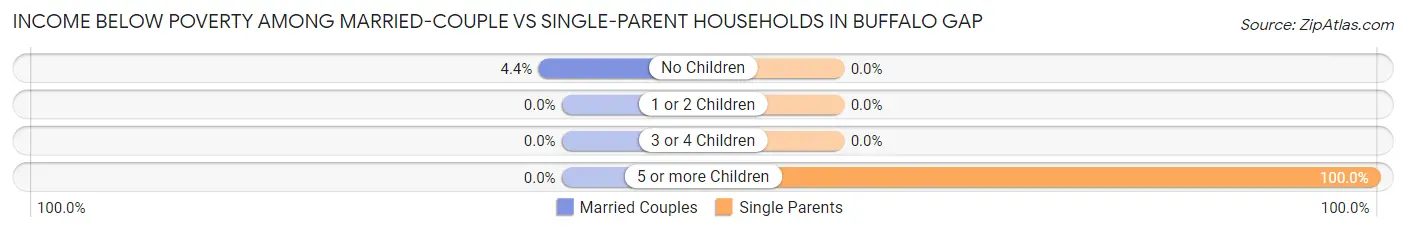
| Children | Married-Couple Families | Single-Parent Households |
| No Children | 3 (4.3%) | 0 (0.0%) |
| 1 or 2 Children | 0 (0.0%) | 0 (0.0%) |
| 3 or 4 Children | 0 (0.0%) | 0 (0.0%) |
| 5 or more Children | 0 (0.0%) | 9 (100.0%) |
| Total | 3 (3.0%) | 9 (29.0%) |
Race in Buffalo Gap
The most populous races in Buffalo Gap are White / Caucasian (543 | 93.8%), Hispanic or Latino (95 | 16.4%), and Black / African American (19 | 3.3%).
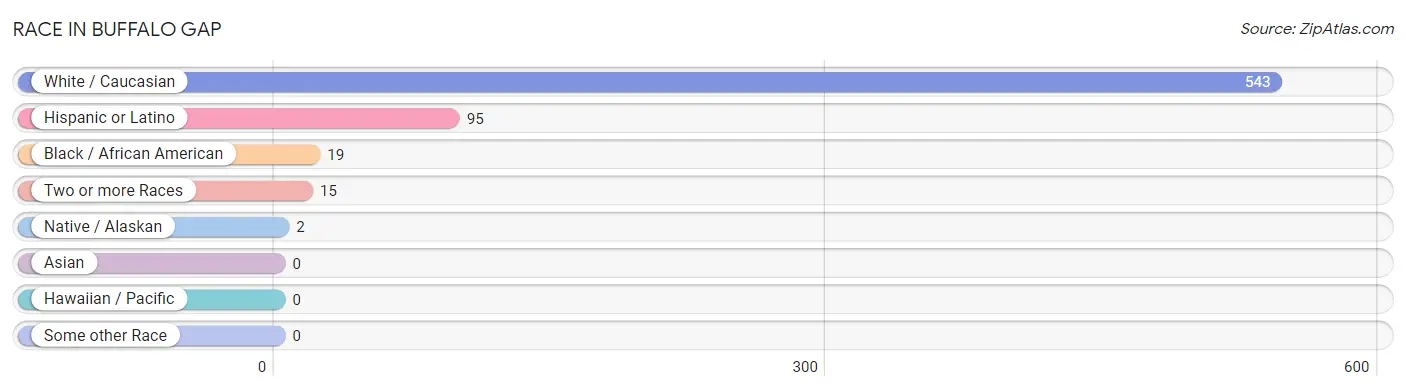
| Race | # Population | % Population |
| Asian | 0 | 0.0% |
| Black / African American | 19 | 3.3% |
| Hawaiian / Pacific | 0 | 0.0% |
| Hispanic or Latino | 95 | 16.4% |
| Native / Alaskan | 2 | 0.4% |
| White / Caucasian | 543 | 93.8% |
| Two or more Races | 15 | 2.6% |
| Some other Race | 0 | 0.0% |
| Total | 579 | 100.0% |
Ancestry in Buffalo Gap
The most populous ancestries reported in Buffalo Gap are German (134 | 23.1%), Mexican (95 | 16.4%), Irish (85 | 14.7%), English (38 | 6.6%), and American (19 | 3.3%), together accounting for 64.1% of all Buffalo Gap residents.
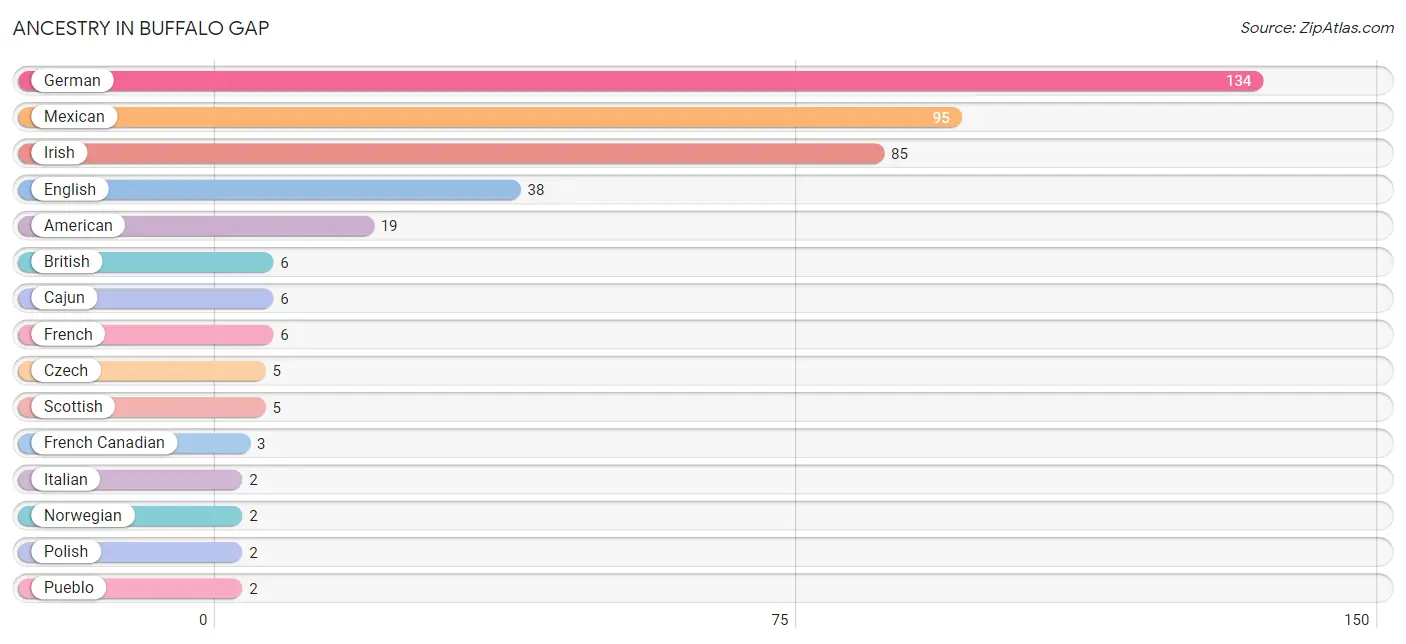
| Ancestry | # Population | % Population |
| American | 19 | 3.3% |
| British | 6 | 1.0% |
| Cajun | 6 | 1.0% |
| Czech | 5 | 0.9% |
| English | 38 | 6.6% |
| French | 6 | 1.0% |
| French Canadian | 3 | 0.5% |
| German | 134 | 23.1% |
| Irish | 85 | 14.7% |
| Italian | 2 | 0.4% |
| Mexican | 95 | 16.4% |
| Norwegian | 2 | 0.4% |
| Polish | 2 | 0.4% |
| Pueblo | 2 | 0.4% |
| Scotch-Irish | 1 | 0.2% |
| Scottish | 5 | 0.9% |
| Swedish | 2 | 0.4% |
| Ute | 2 | 0.4% | View All 18 Rows |
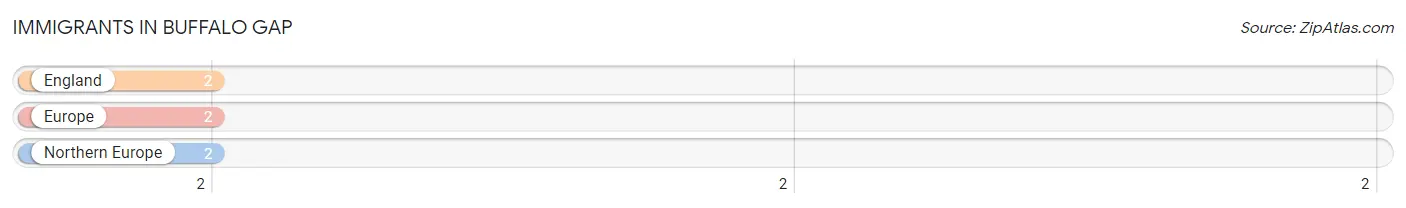
Immigrants in Buffalo Gap
The most numerous immigrant groups reported in Buffalo Gap came from England (2 | 0.4%), Europe (2 | 0.4%), and Northern Europe (2 | 0.4%), together accounting for 1.1% of all Buffalo Gap residents.
| Immigration Origin | # Population | % Population |
| England | 2 | 0.4% |
| Europe | 2 | 0.4% |
| Northern Europe | 2 | 0.4% | View All 3 Rows |
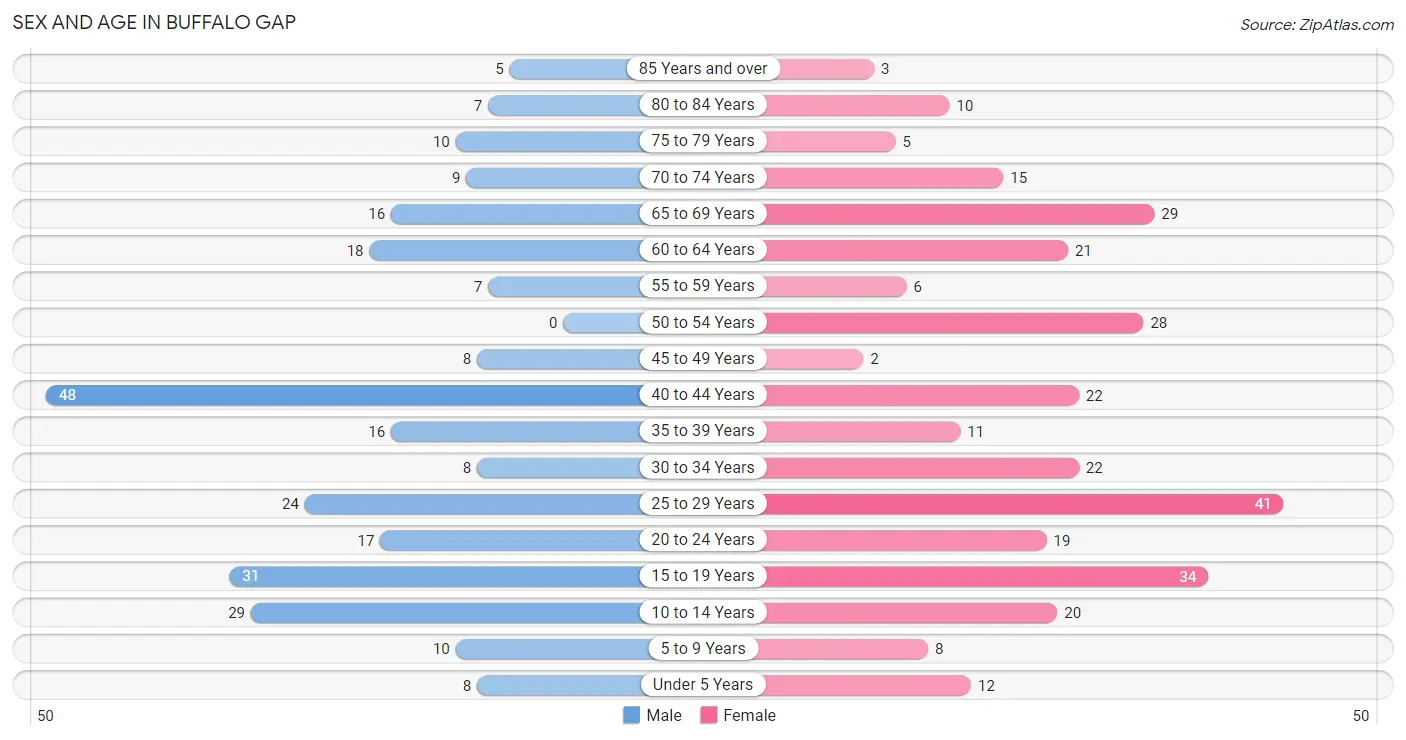
Sex and Age in Buffalo Gap
Sex and Age in Buffalo Gap
The most populous age groups in Buffalo Gap are 40 to 44 Years (48 | 17.7%) for men and 25 to 29 Years (41 | 13.3%) for women.
| Age Bracket | Male | Female |
| Under 5 Years | 8 (2.9%) | 12 (3.9%) |
| 5 to 9 Years | 10 (3.7%) | 8 (2.6%) |
| 10 to 14 Years | 29 (10.7%) | 20 (6.5%) |
| 15 to 19 Years | 31 (11.4%) | 34 (11.0%) |
| 20 to 24 Years | 17 (6.3%) | 19 (6.2%) |
| 25 to 29 Years | 24 (8.9%) | 41 (13.3%) |
| 30 to 34 Years | 8 (2.9%) | 22 (7.1%) |
| 35 to 39 Years | 16 (5.9%) | 11 (3.6%) |
| 40 to 44 Years | 48 (17.7%) | 22 (7.1%) |
| 45 to 49 Years | 8 (2.9%) | 2 (0.6%) |
| 50 to 54 Years | 0 (0.0%) | 28 (9.1%) |
| 55 to 59 Years | 7 (2.6%) | 6 (1.9%) |
| 60 to 64 Years | 18 (6.6%) | 21 (6.8%) |
| 65 to 69 Years | 16 (5.9%) | 29 (9.4%) |
| 70 to 74 Years | 9 (3.3%) | 15 (4.9%) |
| 75 to 79 Years | 10 (3.7%) | 5 (1.6%) |
| 80 to 84 Years | 7 (2.6%) | 10 (3.3%) |
| 85 Years and over | 5 (1.8%) | 3 (1.0%) |
| Total | 271 (100.0%) | 308 (100.0%) |
Families and Households in Buffalo Gap
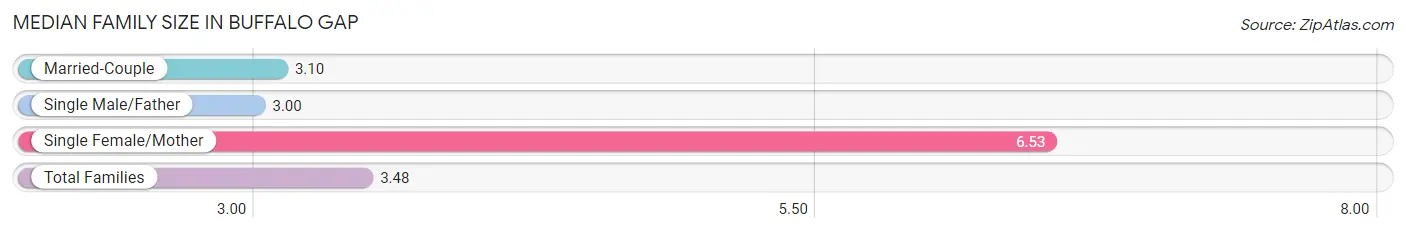
Median Family Size in Buffalo Gap
The median family size in Buffalo Gap is 3.48 persons per family, with single female/mother families (15 | 11.5%) accounting for the largest median family size of 6.53 persons per family. On the other hand, single male/father families (16 | 12.2%) represent the smallest median family size with 3.00 persons per family.
| Family Type | # Families | Family Size |
| Married-Couple | 100 (76.3%) | 3.10 |
| Single Male/Father | 16 (12.2%) | 3.00 |
| Single Female/Mother | 15 (11.5%) | 6.53 |
| Total Families | 131 (100.0%) | 3.48 |
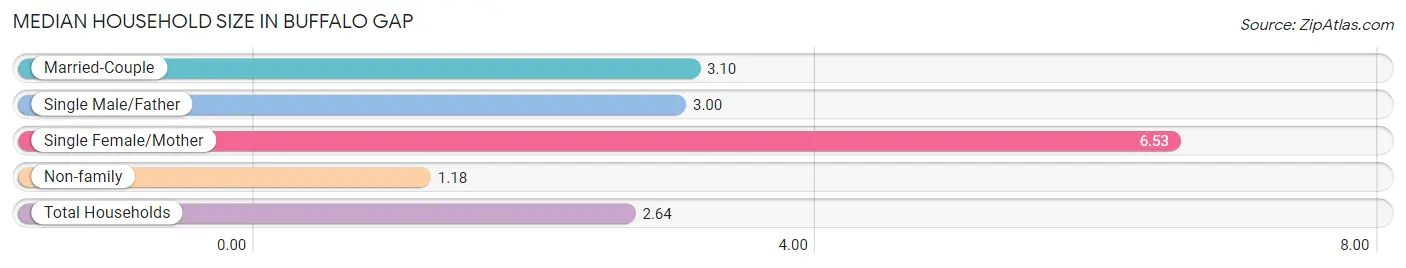
Median Household Size in Buffalo Gap
The median household size in Buffalo Gap is 2.64 persons per household, with single female/mother households (15 | 7.2%) accounting for the largest median household size of 6.53 persons per household. non-family households (76 | 36.7%) represent the smallest median household size with 1.18 persons per household.
| Household Type | # Households | Household Size |
| Married-Couple | 100 (48.3%) | 3.10 |
| Single Male/Father | 16 (7.7%) | 3.00 |
| Single Female/Mother | 15 (7.2%) | 6.53 |
| Non-family | 76 (36.7%) | 1.18 |
| Total Households | 207 (100.0%) | 2.64 |
Household Size by Marriage Status in Buffalo Gap
Out of a total of 207 households in Buffalo Gap, 131 (63.3%) are family households, while 76 (36.7%) are nonfamily households. The most numerous type of family households are 2-person households, comprising 44, and the most common type of nonfamily households are 1-person households, comprising 63.
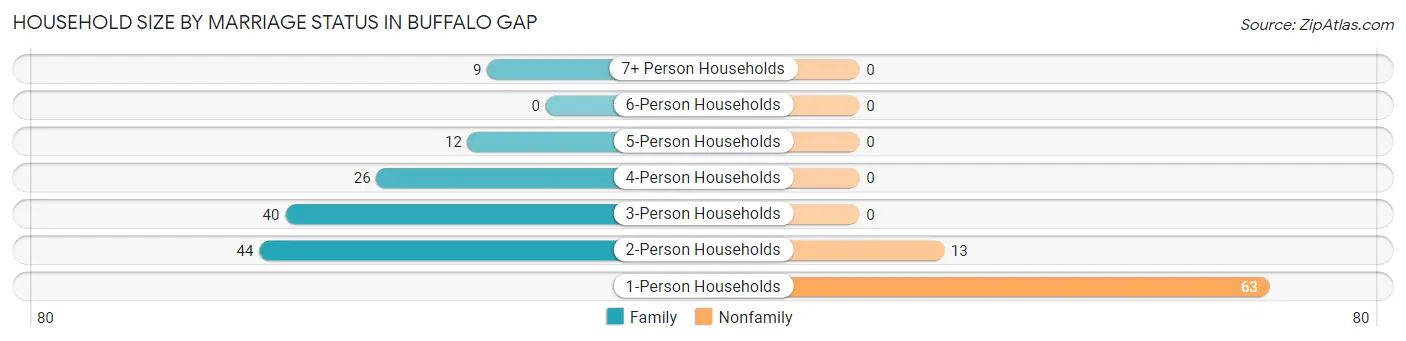
| Household Size | Family Households | Nonfamily Households |
| 1-Person Households | - | 63 (30.4%) |
| 2-Person Households | 44 (21.3%) | 13 (6.3%) |
| 3-Person Households | 40 (19.3%) | 0 (0.0%) |
| 4-Person Households | 26 (12.6%) | 0 (0.0%) |
| 5-Person Households | 12 (5.8%) | 0 (0.0%) |
| 6-Person Households | 0 (0.0%) | 0 (0.0%) |
| 7+ Person Households | 9 (4.3%) | 0 (0.0%) |
| Total | 131 (63.3%) | 76 (36.7%) |
Female Fertility in Buffalo Gap
Fertility by Age in Buffalo Gap
Average fertility rate in Buffalo Gap is 36.0 births per 1,000 women. Women in the age bracket of 20 to 34 years have the highest fertility rate with 73.0 births per 1,000 women. Women in the age bracket of 20 to 34 years acount for 100.0% of all women with births.
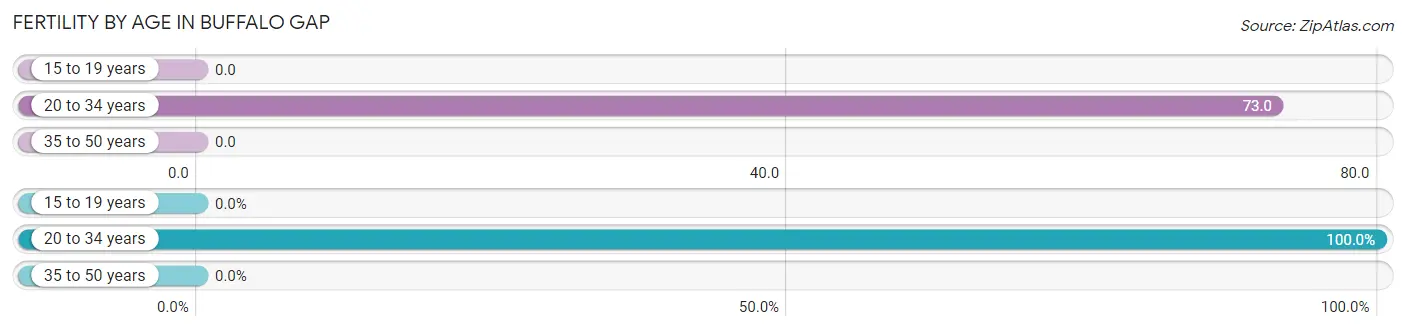
| Age Bracket | Women with Births | Births / 1,000 Women |
| 15 to 19 years | 0 (0.0%) | 0.0 |
| 20 to 34 years | 6 (100.0%) | 73.0 |
| 35 to 50 years | 0 (0.0%) | 0.0 |
| Total | 6 (100.0%) | 36.0 |
Fertility by Age by Marriage Status in Buffalo Gap
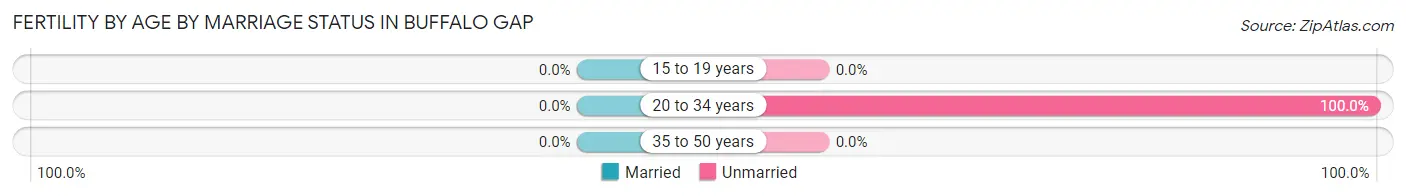
| Age Bracket | Married | Unmarried |
| 15 to 19 years | 0 (0.0%) | 0 (0.0%) |
| 20 to 34 years | 0 (0.0%) | 6 (100.0%) |
| 35 to 50 years | 0 (0.0%) | 0 (0.0%) |
| Total | 0 (0.0%) | 6 (100.0%) |
Fertility by Education in Buffalo Gap
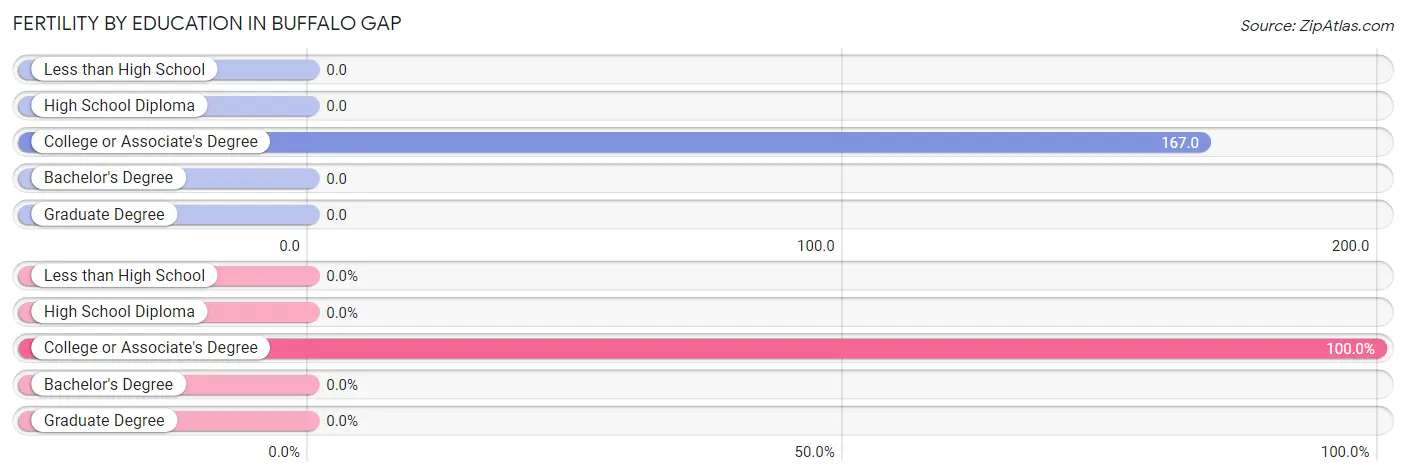
| Educational Attainment | Women with Births | Births / 1,000 Women |
| Less than High School | 0 (0.0%) | 0.0 |
| High School Diploma | 0 (0.0%) | 0.0 |
| College or Associate's Degree | 6 (100.0%) | 167.0 |
| Bachelor's Degree | 0 (0.0%) | 0.0 |
| Graduate Degree | 0 (0.0%) | 0.0 |
| Total | 6 (100.0%) | 36.0 |
Fertility by Education by Marriage Status in Buffalo Gap
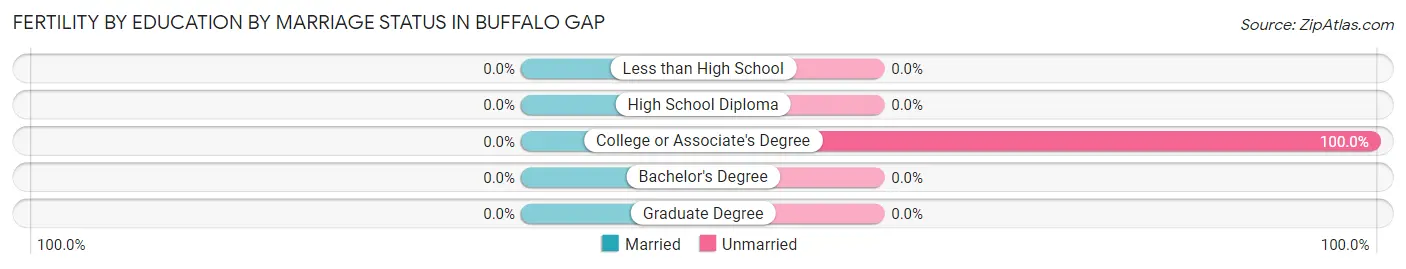
| Educational Attainment | Married | Unmarried |
| Less than High School | 0 (0.0%) | 0 (0.0%) |
| High School Diploma | 0 (0.0%) | 0 (0.0%) |
| College or Associate's Degree | 0 (0.0%) | 6 (100.0%) |
| Bachelor's Degree | 0 (0.0%) | 0 (0.0%) |
| Graduate Degree | 0 (0.0%) | 0 (0.0%) |
| Total | 0 (0.0%) | 6 (100.0%) |
Employment Characteristics in Buffalo Gap
Employment by Class of Employer in Buffalo Gap
Among the 238 employed individuals in Buffalo Gap, private company employees (132 | 55.5%), not-for-profit organizations (37 | 15.5%), and local government employees (36 | 15.1%) make up the most common classes of employment.
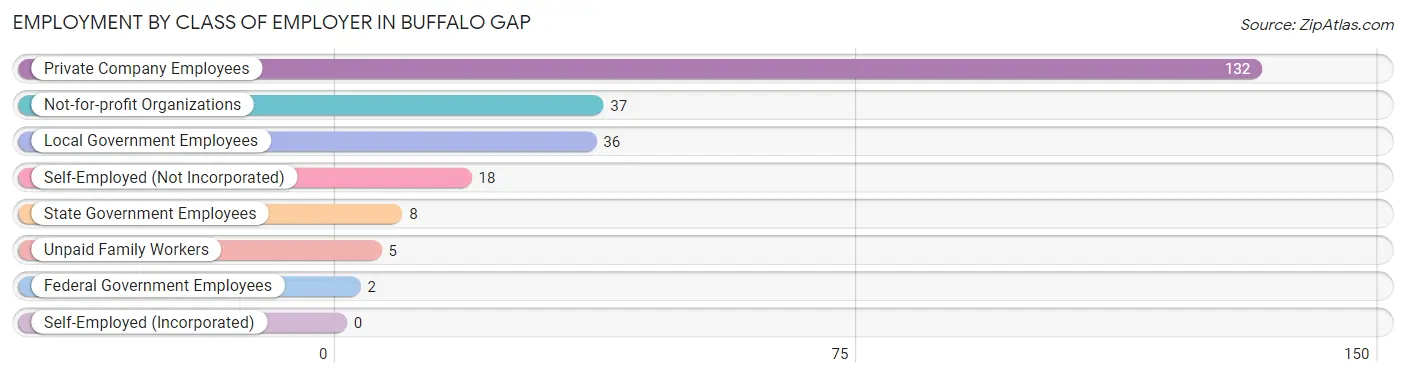
| Employer Class | # Employees | % Employees |
| Private Company Employees | 132 | 55.5% |
| Self-Employed (Incorporated) | 0 | 0.0% |
| Self-Employed (Not Incorporated) | 18 | 7.6% |
| Not-for-profit Organizations | 37 | 15.5% |
| Local Government Employees | 36 | 15.1% |
| State Government Employees | 8 | 3.4% |
| Federal Government Employees | 2 | 0.8% |
| Unpaid Family Workers | 5 | 2.1% |
| Total | 238 | 100.0% |
Employment Status by Age in Buffalo Gap
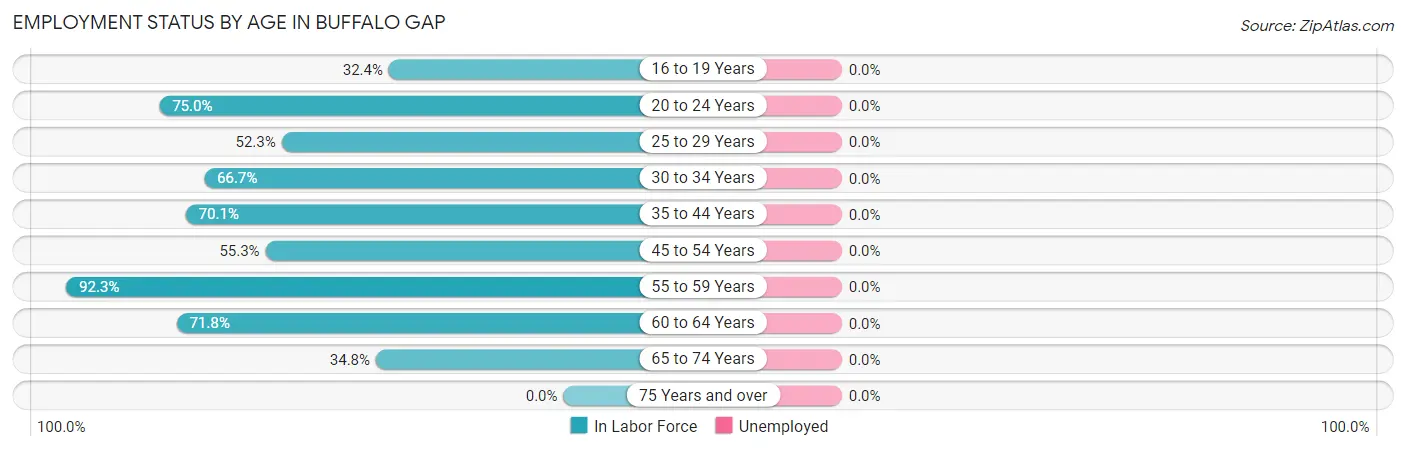
| Age Bracket | In Labor Force | Unemployed |
| 16 to 19 Years | 11 (32.4%) | 0 (0.0%) |
| 20 to 24 Years | 27 (75.0%) | 0 (0.0%) |
| 25 to 29 Years | 34 (52.3%) | 0 (0.0%) |
| 30 to 34 Years | 20 (66.7%) | 0 (0.0%) |
| 35 to 44 Years | 68 (70.1%) | 0 (0.0%) |
| 45 to 54 Years | 21 (55.3%) | 0 (0.0%) |
| 55 to 59 Years | 12 (92.3%) | 0 (0.0%) |
| 60 to 64 Years | 28 (71.8%) | 0 (0.0%) |
| 65 to 74 Years | 24 (34.8%) | 0 (0.0%) |
| 75 Years and over | 0 (0.0%) | 0 (0.0%) |
| Total | 245 (53.1%) | 0 (0.0%) |
Employment Status by Educational Attainment in Buffalo Gap
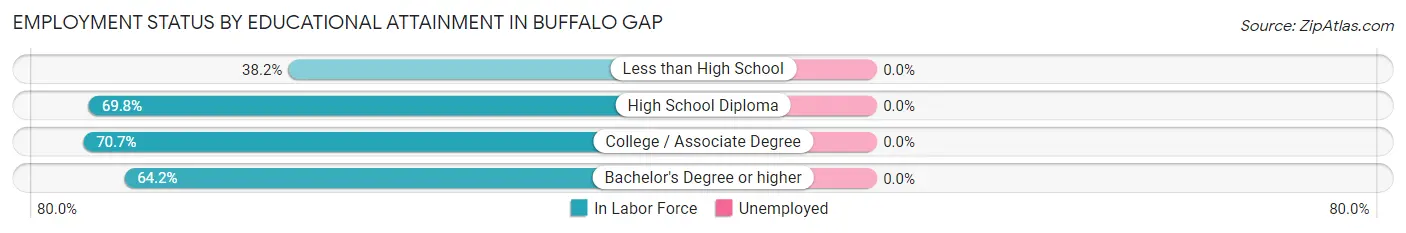
| Educational Attainment | In Labor Force | Unemployed |
| Less than High School | 13 (38.2%) | 0 (0.0%) |
| High School Diploma | 74 (69.8%) | 0 (0.0%) |
| College / Associate Degree | 53 (70.7%) | 0 (0.0%) |
| Bachelor's Degree or higher | 43 (64.2%) | 0 (0.0%) |
| Total | 183 (64.9%) | 0 (0.0%) |
Employment Occupations by Sex in Buffalo Gap
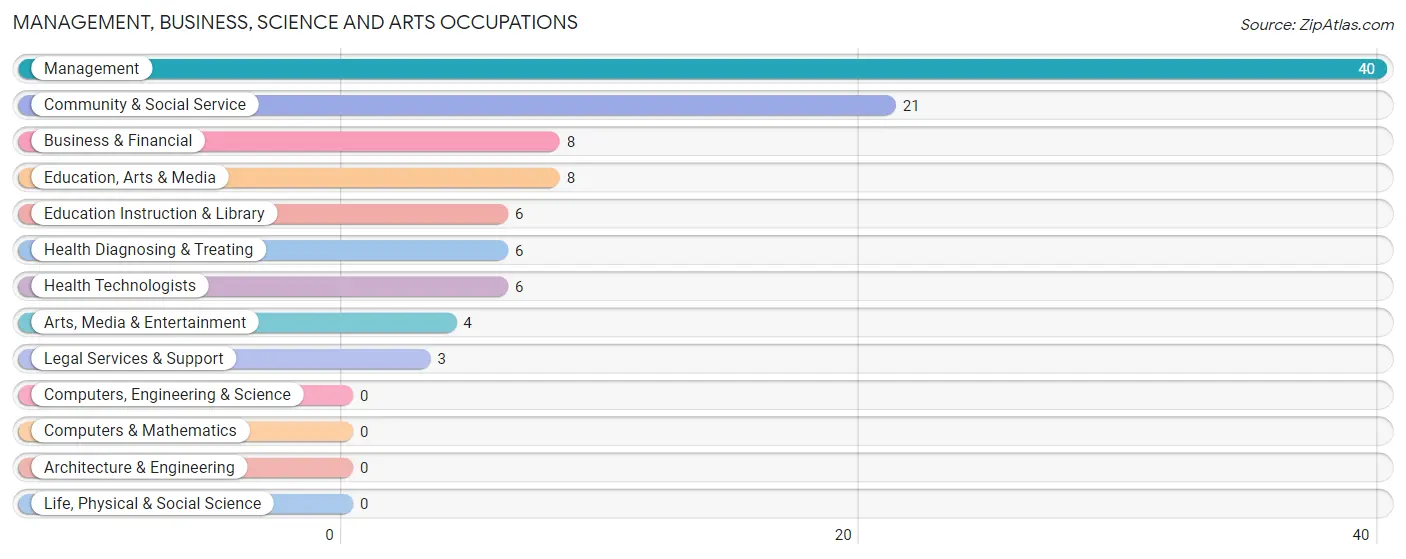
Management, Business, Science and Arts Occupations
The most common Management, Business, Science and Arts occupations in Buffalo Gap are Management (40 | 16.5%), Community & Social Service (21 | 8.6%), Business & Financial (8 | 3.3%), Education, Arts & Media (8 | 3.3%), and Education Instruction & Library (6 | 2.5%).
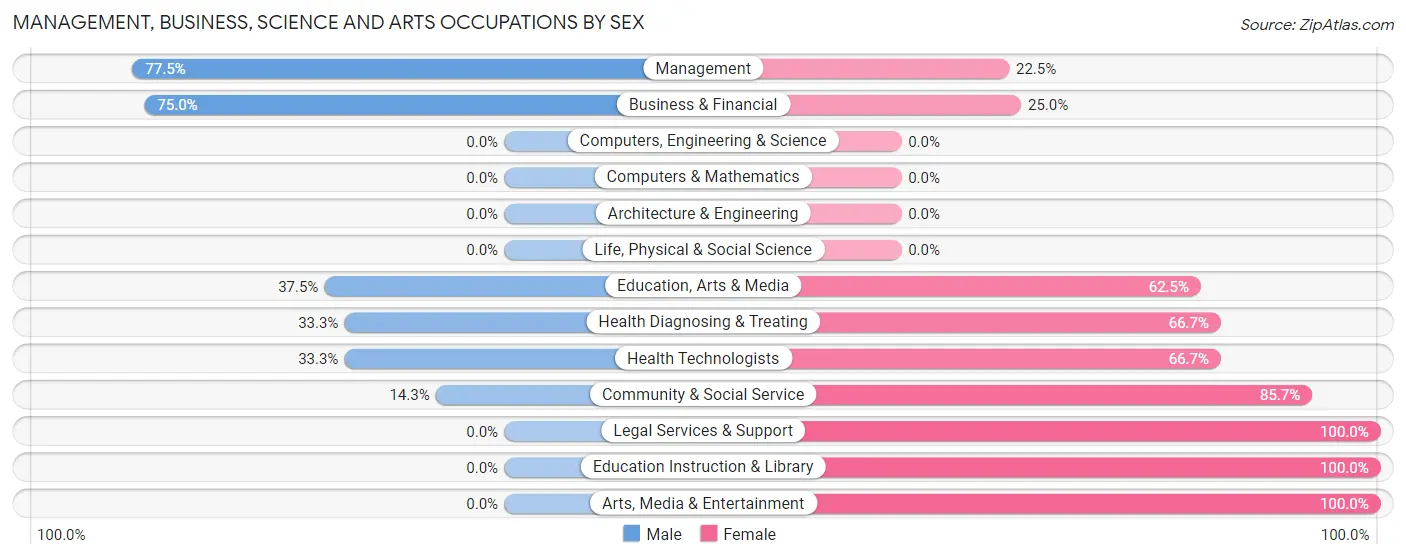
Management, Business, Science and Arts Occupations by Sex
Within the Management, Business, Science and Arts occupations in Buffalo Gap, the most male-oriented occupations are Management (77.5%), Business & Financial (75.0%), and Education, Arts & Media (37.5%), while the most female-oriented occupations are Legal Services & Support (100.0%), Education Instruction & Library (100.0%), and Arts, Media & Entertainment (100.0%).
| Occupation | Male | Female |
| Management | 31 (77.5%) | 9 (22.5%) |
| Business & Financial | 6 (75.0%) | 2 (25.0%) |
| Computers, Engineering & Science | 0 (0.0%) | 0 (0.0%) |
| Computers & Mathematics | 0 (0.0%) | 0 (0.0%) |
| Architecture & Engineering | 0 (0.0%) | 0 (0.0%) |
| Life, Physical & Social Science | 0 (0.0%) | 0 (0.0%) |
| Community & Social Service | 3 (14.3%) | 18 (85.7%) |
| Education, Arts & Media | 3 (37.5%) | 5 (62.5%) |
| Legal Services & Support | 0 (0.0%) | 3 (100.0%) |
| Education Instruction & Library | 0 (0.0%) | 6 (100.0%) |
| Arts, Media & Entertainment | 0 (0.0%) | 4 (100.0%) |
| Health Diagnosing & Treating | 2 (33.3%) | 4 (66.7%) |
| Health Technologists | 2 (33.3%) | 4 (66.7%) |
| Total (Category) | 42 (56.0%) | 33 (44.0%) |
| Total (Overall) | 132 (54.3%) | 111 (45.7%) |
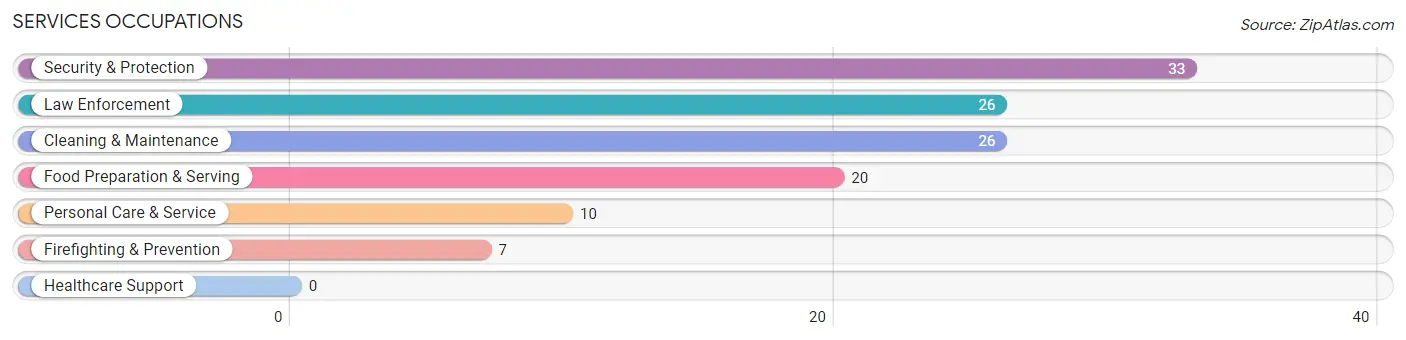
Services Occupations
The most common Services occupations in Buffalo Gap are Security & Protection (33 | 13.6%), Law Enforcement (26 | 10.7%), Cleaning & Maintenance (26 | 10.7%), Food Preparation & Serving (20 | 8.2%), and Personal Care & Service (10 | 4.1%).
Services Occupations by Sex
Within the Services occupations in Buffalo Gap, the most male-oriented occupations are Firefighting & Prevention (100.0%), Security & Protection (66.7%), and Law Enforcement (57.7%), while the most female-oriented occupations are Personal Care & Service (70.0%), Cleaning & Maintenance (69.2%), and Food Preparation & Serving (60.0%).

| Occupation | Male | Female |
| Healthcare Support | 0 (0.0%) | 0 (0.0%) |
| Security & Protection | 22 (66.7%) | 11 (33.3%) |
| Firefighting & Prevention | 7 (100.0%) | 0 (0.0%) |
| Law Enforcement | 15 (57.7%) | 11 (42.3%) |
| Food Preparation & Serving | 8 (40.0%) | 12 (60.0%) |
| Cleaning & Maintenance | 8 (30.8%) | 18 (69.2%) |
| Personal Care & Service | 3 (30.0%) | 7 (70.0%) |
| Total (Category) | 41 (46.1%) | 48 (53.9%) |
| Total (Overall) | 132 (54.3%) | 111 (45.7%) |
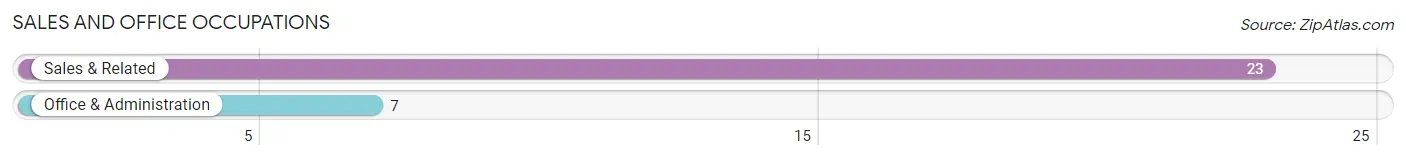
Sales and Office Occupations
The most common Sales and Office occupations in Buffalo Gap are Sales & Related (23 | 9.5%), and Office & Administration (7 | 2.9%).
Sales and Office Occupations by Sex
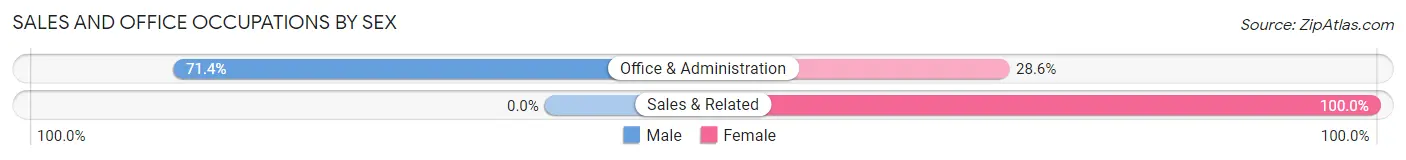
| Occupation | Male | Female |
| Sales & Related | 0 (0.0%) | 23 (100.0%) |
| Office & Administration | 5 (71.4%) | 2 (28.6%) |
| Total (Category) | 5 (16.7%) | 25 (83.3%) |
| Total (Overall) | 132 (54.3%) | 111 (45.7%) |
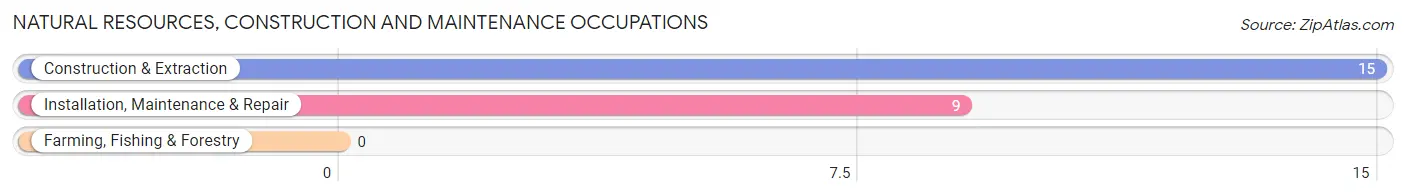
Natural Resources, Construction and Maintenance Occupations
The most common Natural Resources, Construction and Maintenance occupations in Buffalo Gap are Construction & Extraction (15 | 6.2%), and Installation, Maintenance & Repair (9 | 3.7%).
Natural Resources, Construction and Maintenance Occupations by Sex
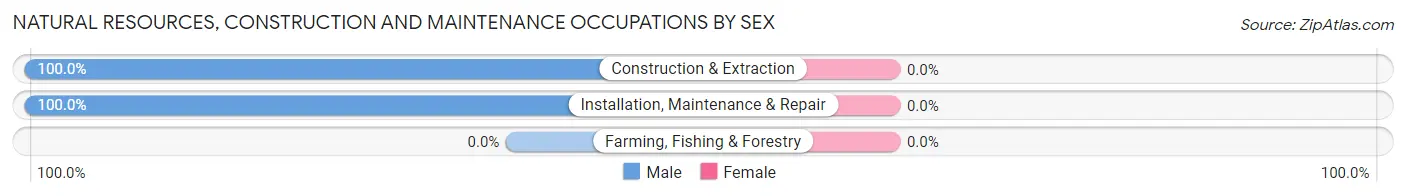
| Occupation | Male | Female |
| Farming, Fishing & Forestry | 0 (0.0%) | 0 (0.0%) |
| Construction & Extraction | 15 (100.0%) | 0 (0.0%) |
| Installation, Maintenance & Repair | 9 (100.0%) | 0 (0.0%) |
| Total (Category) | 24 (100.0%) | 0 (0.0%) |
| Total (Overall) | 132 (54.3%) | 111 (45.7%) |
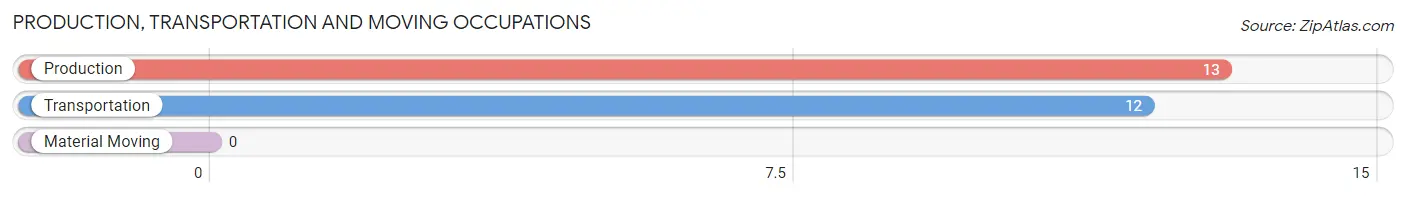
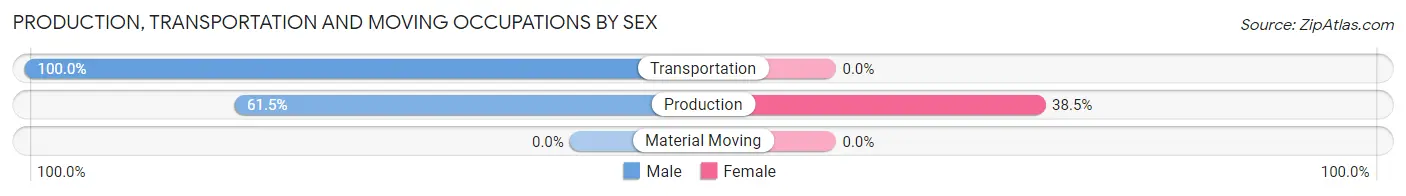
Production, Transportation and Moving Occupations
The most common Production, Transportation and Moving occupations in Buffalo Gap are Production (13 | 5.3%), and Transportation (12 | 4.9%).
Production, Transportation and Moving Occupations by Sex
| Occupation | Male | Female |
| Production | 8 (61.5%) | 5 (38.5%) |
| Transportation | 12 (100.0%) | 0 (0.0%) |
| Material Moving | 0 (0.0%) | 0 (0.0%) |
| Total (Category) | 20 (80.0%) | 5 (20.0%) |
| Total (Overall) | 132 (54.3%) | 111 (45.7%) |
Employment Industries by Sex in Buffalo Gap
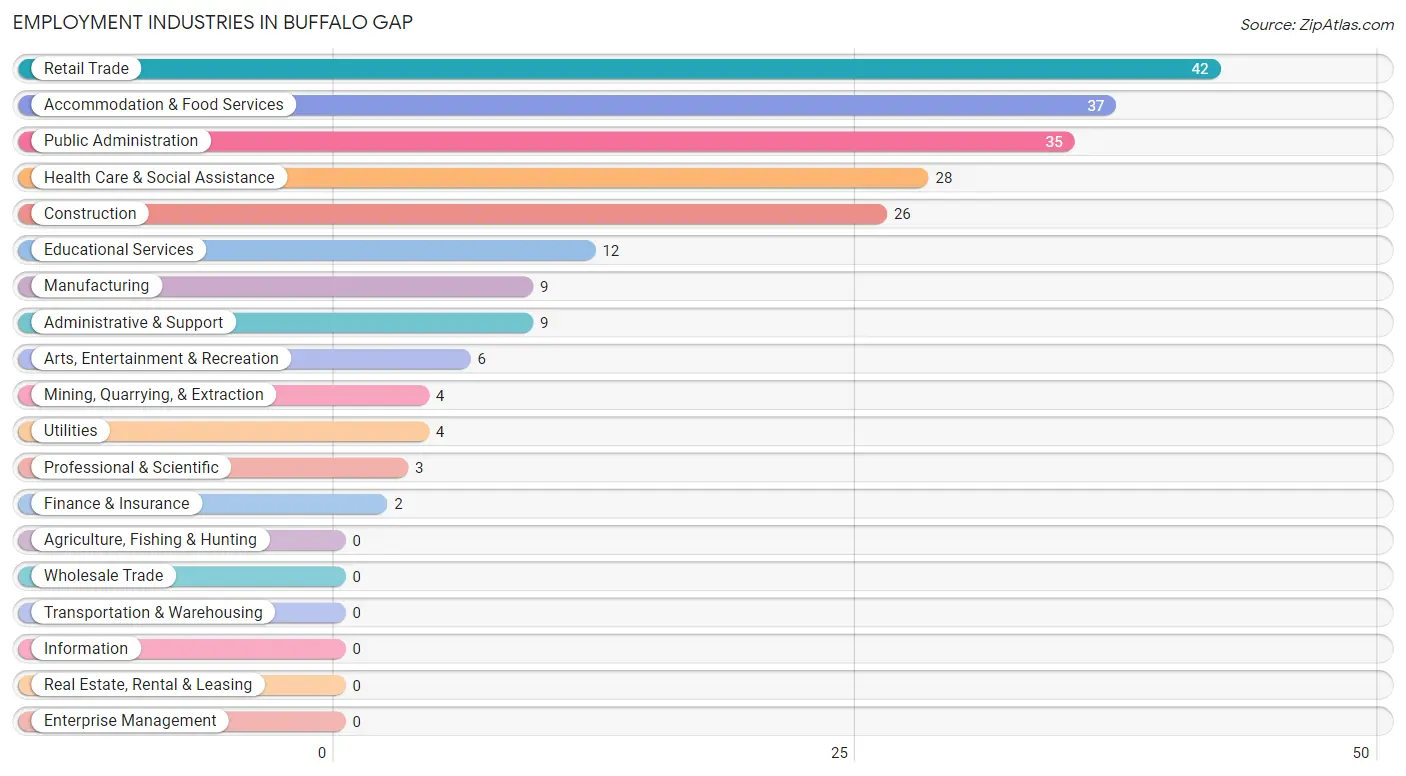
Employment Industries in Buffalo Gap
The major employment industries in Buffalo Gap include Retail Trade (42 | 17.3%), Accommodation & Food Services (37 | 15.2%), Public Administration (35 | 14.4%), Health Care & Social Assistance (28 | 11.5%), and Construction (26 | 10.7%).
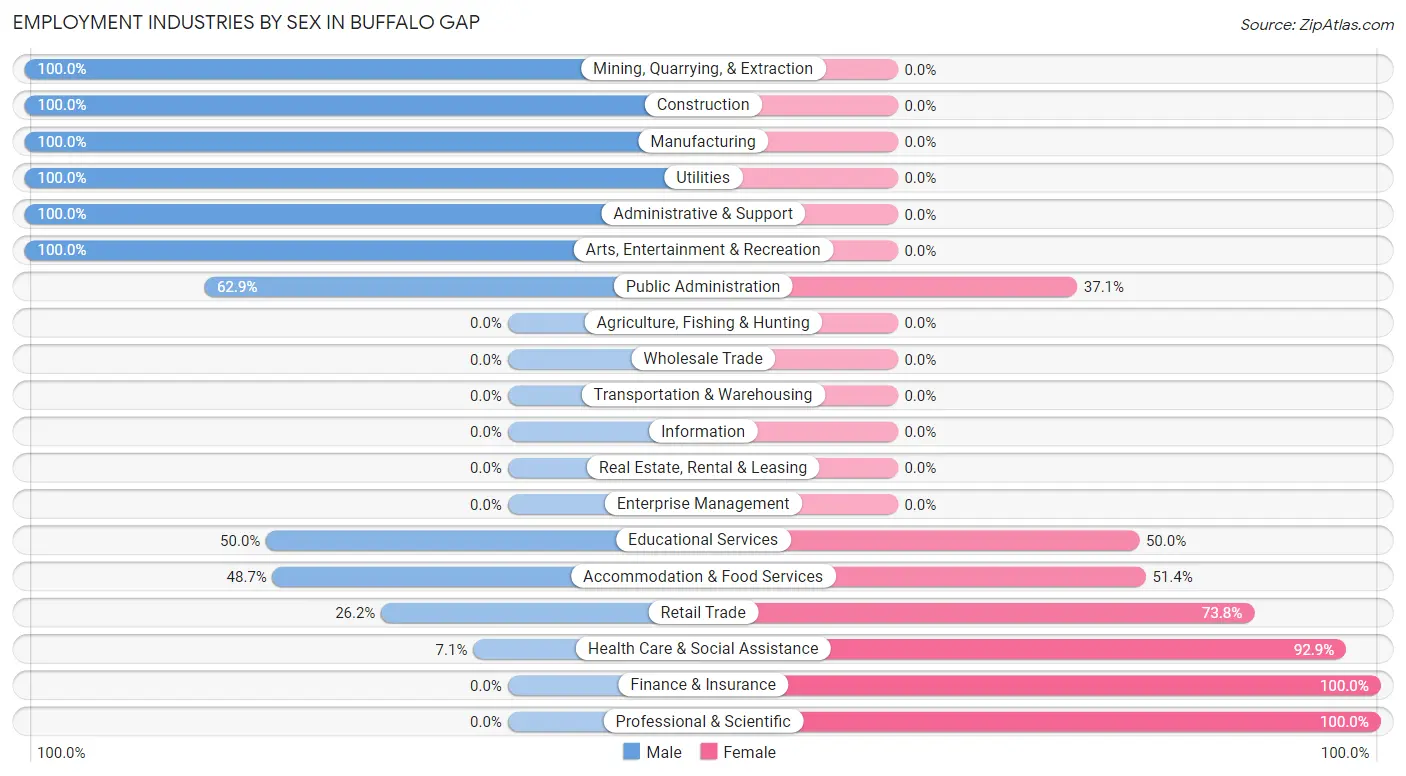
Employment Industries by Sex in Buffalo Gap
The Buffalo Gap industries that see more men than women are Mining, Quarrying, & Extraction (100.0%), Construction (100.0%), and Manufacturing (100.0%), whereas the industries that tend to have a higher number of women are Finance & Insurance (100.0%), Professional & Scientific (100.0%), and Health Care & Social Assistance (92.9%).
| Industry | Male | Female |
| Agriculture, Fishing & Hunting | 0 (0.0%) | 0 (0.0%) |
| Mining, Quarrying, & Extraction | 4 (100.0%) | 0 (0.0%) |
| Construction | 26 (100.0%) | 0 (0.0%) |
| Manufacturing | 9 (100.0%) | 0 (0.0%) |
| Wholesale Trade | 0 (0.0%) | 0 (0.0%) |
| Retail Trade | 11 (26.2%) | 31 (73.8%) |
| Transportation & Warehousing | 0 (0.0%) | 0 (0.0%) |
| Utilities | 4 (100.0%) | 0 (0.0%) |
| Information | 0 (0.0%) | 0 (0.0%) |
| Finance & Insurance | 0 (0.0%) | 2 (100.0%) |
| Real Estate, Rental & Leasing | 0 (0.0%) | 0 (0.0%) |
| Professional & Scientific | 0 (0.0%) | 3 (100.0%) |
| Enterprise Management | 0 (0.0%) | 0 (0.0%) |
| Administrative & Support | 9 (100.0%) | 0 (0.0%) |
| Educational Services | 6 (50.0%) | 6 (50.0%) |
| Health Care & Social Assistance | 2 (7.1%) | 26 (92.9%) |
| Arts, Entertainment & Recreation | 6 (100.0%) | 0 (0.0%) |
| Accommodation & Food Services | 18 (48.6%) | 19 (51.3%) |
| Public Administration | 22 (62.9%) | 13 (37.1%) |
| Total | 132 (54.3%) | 111 (45.7%) |
Education in Buffalo Gap
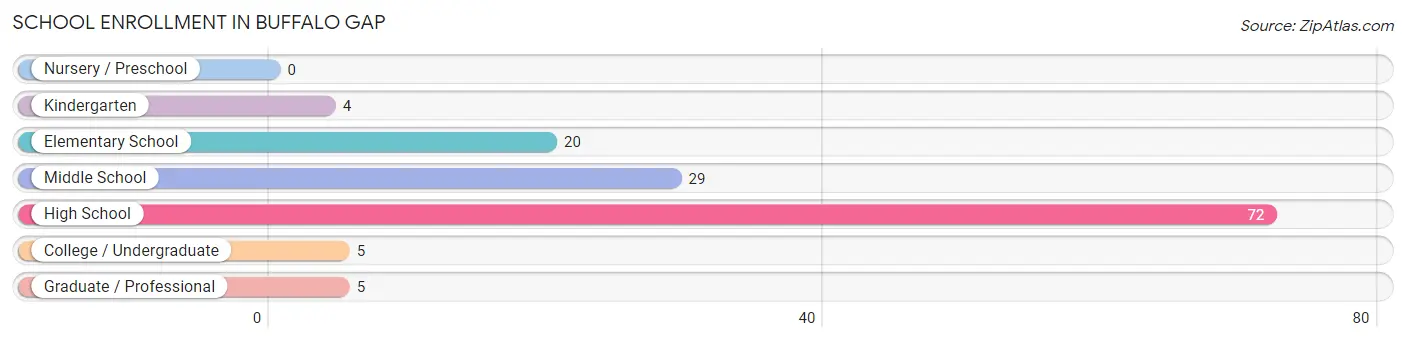
School Enrollment in Buffalo Gap
The most common levels of schooling among the 135 students in Buffalo Gap are high school (72 | 53.3%), middle school (29 | 21.5%), and elementary school (20 | 14.8%).
| School Level | # Students | % Students |
| Nursery / Preschool | 0 | 0.0% |
| Kindergarten | 4 | 3.0% |
| Elementary School | 20 | 14.8% |
| Middle School | 29 | 21.5% |
| High School | 72 | 53.3% |
| College / Undergraduate | 5 | 3.7% |
| Graduate / Professional | 5 | 3.7% |
| Total | 135 | 100.0% |
School Enrollment by Age by Funding Source in Buffalo Gap
Out of a total of 135 students who are enrolled in schools in Buffalo Gap, 7 (5.2%) attend a private institution, while the remaining 128 (94.8%) are enrolled in public schools. The age group of 35 years and over has the highest likelihood of being enrolled in private schools, with 2 (100.0% in the age bracket) enrolled. Conversely, the age group of 5 to 9 year old has the lowest likelihood of being enrolled in a private school, with 16 (100.0% in the age bracket) attending a public institution.
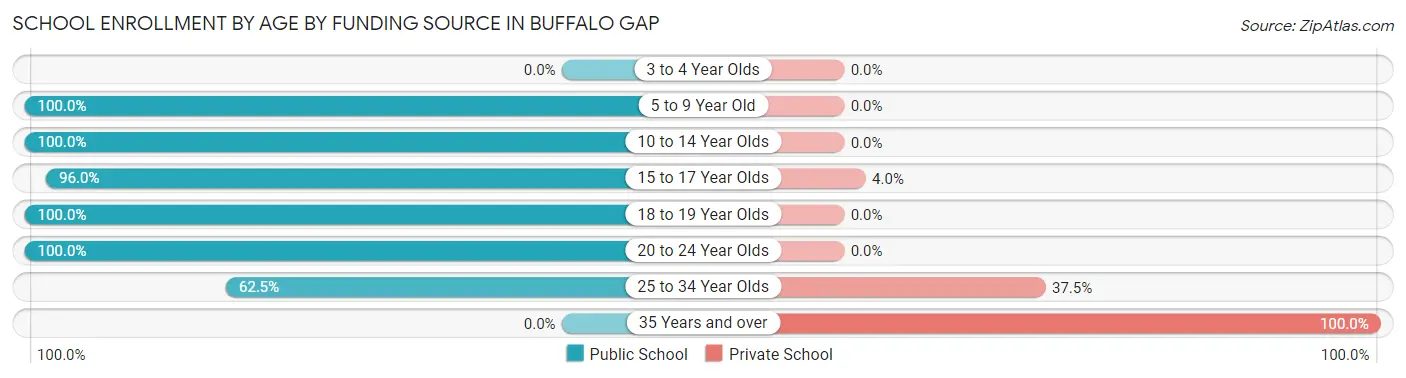
| Age Bracket | Public School | Private School |
| 3 to 4 Year Olds | 0 (0.0%) | 0 (0.0%) |
| 5 to 9 Year Old | 16 (100.0%) | 0 (0.0%) |
| 10 to 14 Year Olds | 49 (100.0%) | 0 (0.0%) |
| 15 to 17 Year Olds | 48 (96.0%) | 2 (4.0%) |
| 18 to 19 Year Olds | 2 (100.0%) | 0 (0.0%) |
| 20 to 24 Year Olds | 8 (100.0%) | 0 (0.0%) |
| 25 to 34 Year Olds | 5 (62.5%) | 3 (37.5%) |
| 35 Years and over | 0 (0.0%) | 2 (100.0%) |
| Total | 128 (94.8%) | 7 (5.2%) |
Educational Attainment by Field of Study in Buffalo Gap
Education (39 | 39.4%), business (17 | 17.2%), social sciences (13 | 13.1%), visual & performing arts (9 | 9.1%), and liberal arts & history (6 | 6.1%) are the most common fields of study among 99 individuals in Buffalo Gap who have obtained a bachelor's degree or higher.
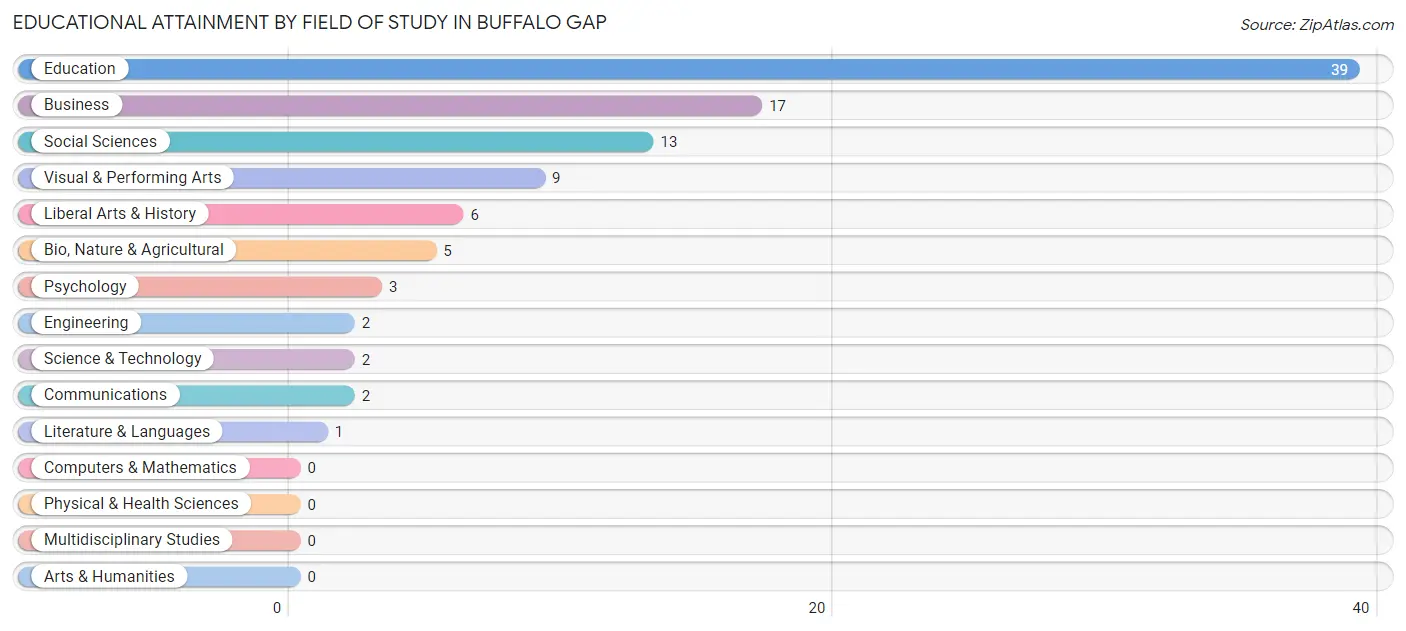
| Field of Study | # Graduates | % Graduates |
| Computers & Mathematics | 0 | 0.0% |
| Bio, Nature & Agricultural | 5 | 5.1% |
| Physical & Health Sciences | 0 | 0.0% |
| Psychology | 3 | 3.0% |
| Social Sciences | 13 | 13.1% |
| Engineering | 2 | 2.0% |
| Multidisciplinary Studies | 0 | 0.0% |
| Science & Technology | 2 | 2.0% |
| Business | 17 | 17.2% |
| Education | 39 | 39.4% |
| Literature & Languages | 1 | 1.0% |
| Liberal Arts & History | 6 | 6.1% |
| Visual & Performing Arts | 9 | 9.1% |
| Communications | 2 | 2.0% |
| Arts & Humanities | 0 | 0.0% |
| Total | 99 | 100.0% |
Transportation & Commute in Buffalo Gap
Vehicle Availability by Sex in Buffalo Gap
The most prevalent vehicle ownership categories in Buffalo Gap are males with 2 vehicles (57, accounting for 43.2%) and females with 2 vehicles (42, making up 58.2%).
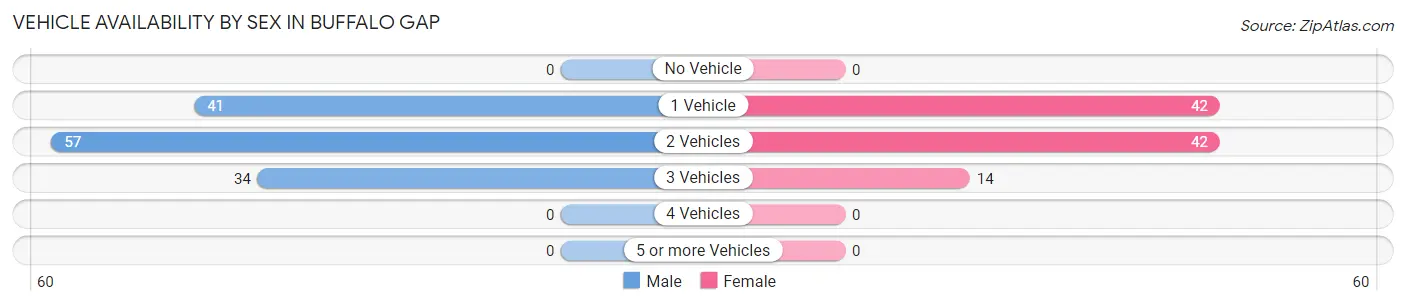
| Vehicles Available | Male | Female |
| No Vehicle | 0 (0.0%) | 0 (0.0%) |
| 1 Vehicle | 41 (31.1%) | 42 (42.9%) |
| 2 Vehicles | 57 (43.2%) | 42 (42.9%) |
| 3 Vehicles | 34 (25.8%) | 14 (14.3%) |
| 4 Vehicles | 0 (0.0%) | 0 (0.0%) |
| 5 or more Vehicles | 0 (0.0%) | 0 (0.0%) |
| Total | 132 (100.0%) | 98 (100.0%) |
Commute Time in Buffalo Gap
The most frequently occuring commute durations in Buffalo Gap are 20 to 24 minutes (87 commuters, 37.7%), 30 to 34 minutes (34 commuters, 14.7%), and 25 to 29 minutes (31 commuters, 13.4%).
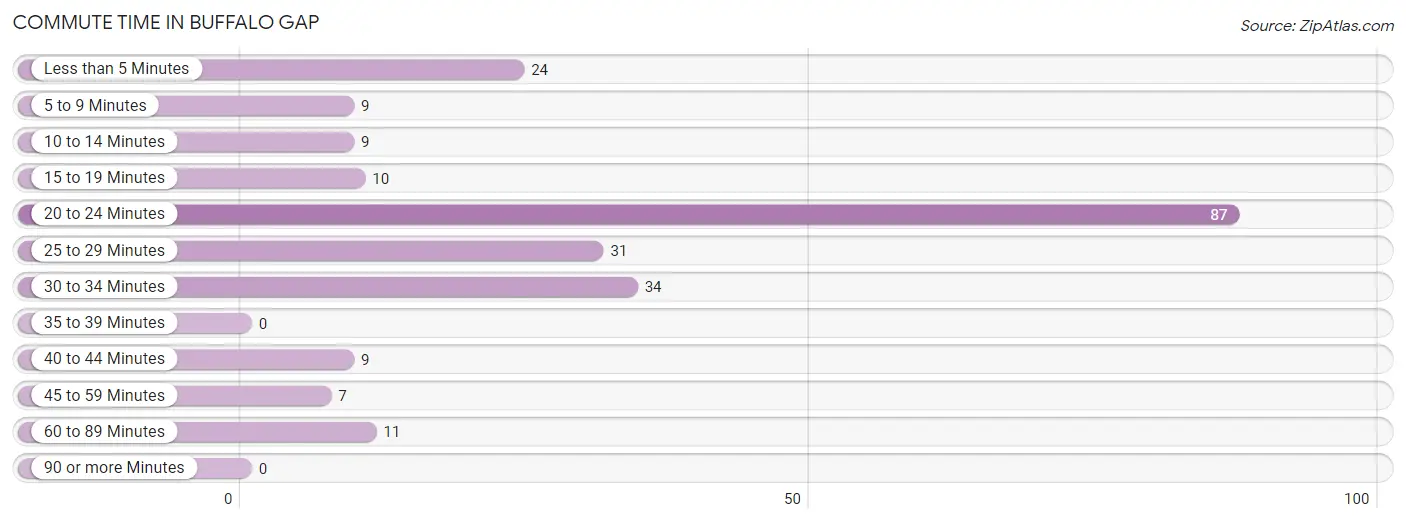
| Commute Time | # Commuters | % Commuters |
| Less than 5 Minutes | 24 | 10.4% |
| 5 to 9 Minutes | 9 | 3.9% |
| 10 to 14 Minutes | 9 | 3.9% |
| 15 to 19 Minutes | 10 | 4.3% |
| 20 to 24 Minutes | 87 | 37.7% |
| 25 to 29 Minutes | 31 | 13.4% |
| 30 to 34 Minutes | 34 | 14.7% |
| 35 to 39 Minutes | 0 | 0.0% |
| 40 to 44 Minutes | 9 | 3.9% |
| 45 to 59 Minutes | 7 | 3.0% |
| 60 to 89 Minutes | 11 | 4.8% |
| 90 or more Minutes | 0 | 0.0% |
Commute Time by Sex in Buffalo Gap
The most common commute times in Buffalo Gap are 20 to 24 minutes (51 commuters, 39.5%) for males and 20 to 24 minutes (36 commuters, 35.3%) for females.
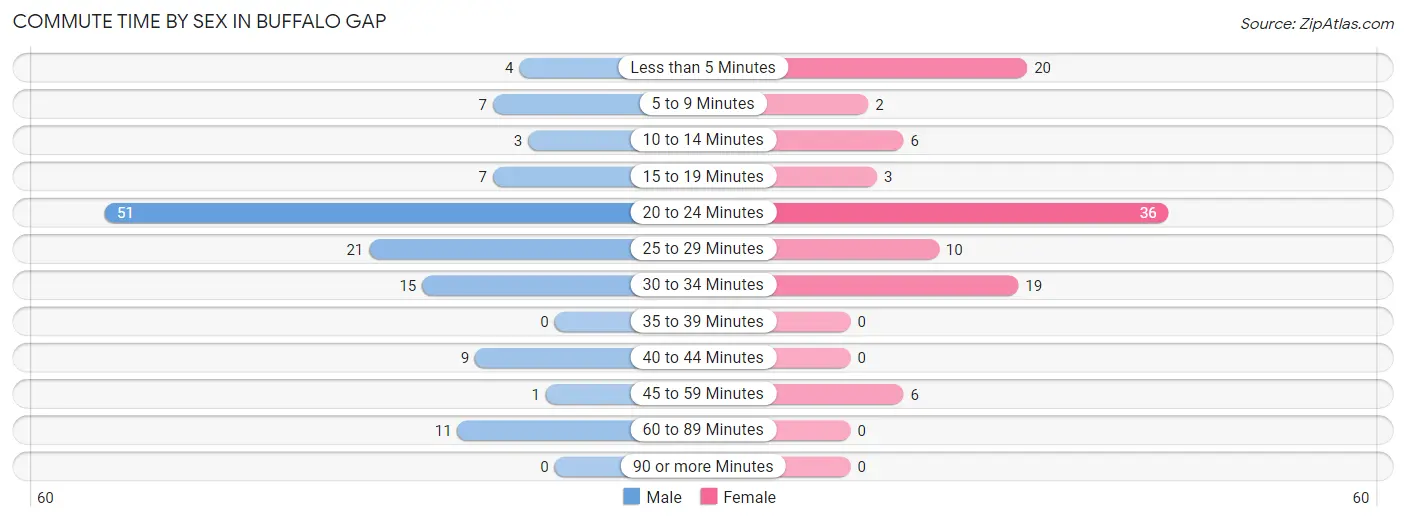
| Commute Time | Male | Female |
| Less than 5 Minutes | 4 (3.1%) | 20 (19.6%) |
| 5 to 9 Minutes | 7 (5.4%) | 2 (2.0%) |
| 10 to 14 Minutes | 3 (2.3%) | 6 (5.9%) |
| 15 to 19 Minutes | 7 (5.4%) | 3 (2.9%) |
| 20 to 24 Minutes | 51 (39.5%) | 36 (35.3%) |
| 25 to 29 Minutes | 21 (16.3%) | 10 (9.8%) |
| 30 to 34 Minutes | 15 (11.6%) | 19 (18.6%) |
| 35 to 39 Minutes | 0 (0.0%) | 0 (0.0%) |
| 40 to 44 Minutes | 9 (7.0%) | 0 (0.0%) |
| 45 to 59 Minutes | 1 (0.8%) | 6 (5.9%) |
| 60 to 89 Minutes | 11 (8.5%) | 0 (0.0%) |
| 90 or more Minutes | 0 (0.0%) | 0 (0.0%) |
Time of Departure to Work by Sex in Buffalo Gap
The most frequent times of departure to work in Buffalo Gap are 7:30 AM to 7:59 AM (38, 29.5%) for males and 4:00 PM to 11:59 PM (24, 23.5%) for females.
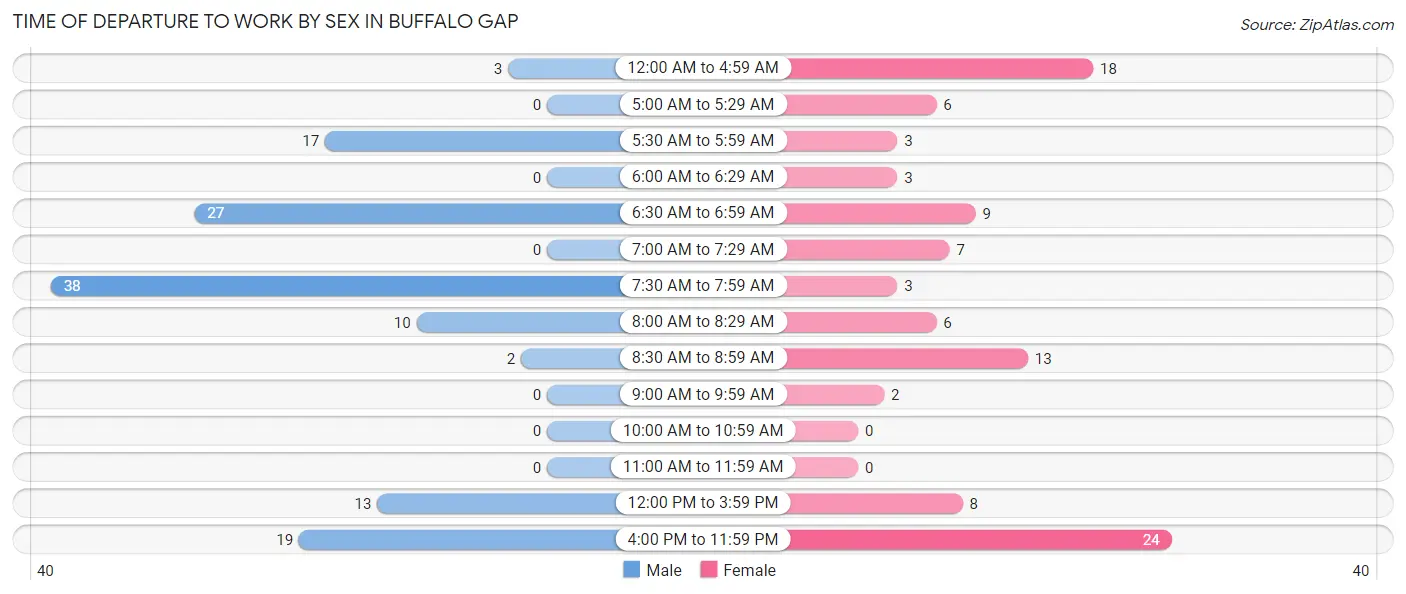
| Time of Departure | Male | Female |
| 12:00 AM to 4:59 AM | 3 (2.3%) | 18 (17.6%) |
| 5:00 AM to 5:29 AM | 0 (0.0%) | 6 (5.9%) |
| 5:30 AM to 5:59 AM | 17 (13.2%) | 3 (2.9%) |
| 6:00 AM to 6:29 AM | 0 (0.0%) | 3 (2.9%) |
| 6:30 AM to 6:59 AM | 27 (20.9%) | 9 (8.8%) |
| 7:00 AM to 7:29 AM | 0 (0.0%) | 7 (6.9%) |
| 7:30 AM to 7:59 AM | 38 (29.5%) | 3 (2.9%) |
| 8:00 AM to 8:29 AM | 10 (7.7%) | 6 (5.9%) |
| 8:30 AM to 8:59 AM | 2 (1.5%) | 13 (12.8%) |
| 9:00 AM to 9:59 AM | 0 (0.0%) | 2 (2.0%) |
| 10:00 AM to 10:59 AM | 0 (0.0%) | 0 (0.0%) |
| 11:00 AM to 11:59 AM | 0 (0.0%) | 0 (0.0%) |
| 12:00 PM to 3:59 PM | 13 (10.1%) | 8 (7.8%) |
| 4:00 PM to 11:59 PM | 19 (14.7%) | 24 (23.5%) |
| Total | 129 (100.0%) | 102 (100.0%) |
Housing Occupancy in Buffalo Gap
Occupancy by Ownership in Buffalo Gap
Of the total 207 dwellings in Buffalo Gap, owner-occupied units account for 132 (63.8%), while renter-occupied units make up 75 (36.2%).
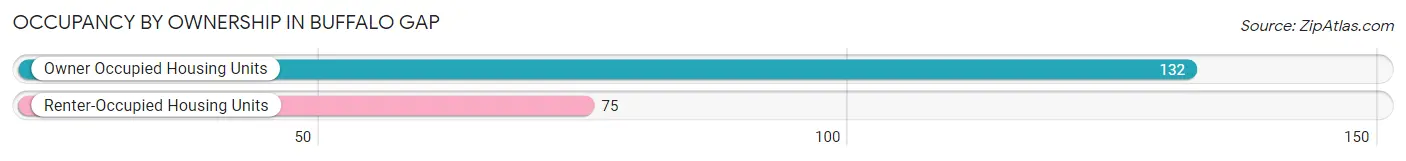
| Occupancy | # Housing Units | % Housing Units |
| Owner Occupied Housing Units | 132 | 63.8% |
| Renter-Occupied Housing Units | 75 | 36.2% |
| Total Occupied Housing Units | 207 | 100.0% |
Occupancy by Household Size in Buffalo Gap
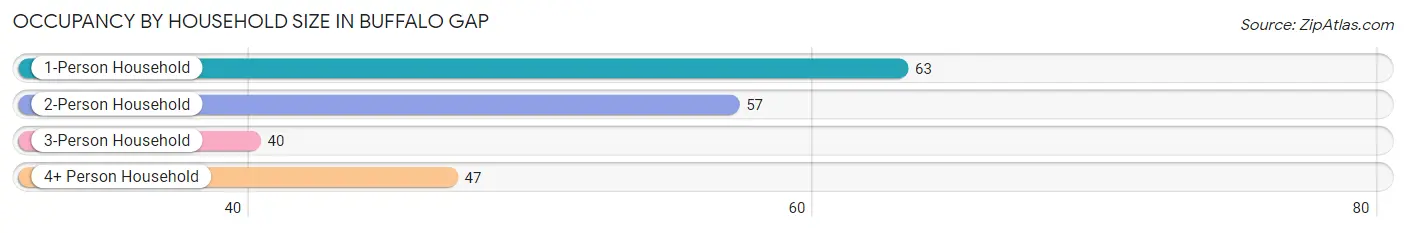
| Household Size | # Housing Units | % Housing Units |
| 1-Person Household | 63 | 30.4% |
| 2-Person Household | 57 | 27.5% |
| 3-Person Household | 40 | 19.3% |
| 4+ Person Household | 47 | 22.7% |
| Total Housing Units | 207 | 100.0% |
Occupancy by Ownership by Household Size in Buffalo Gap
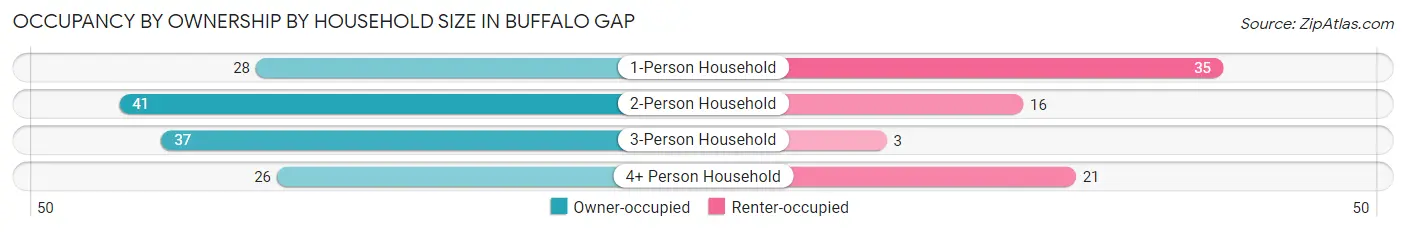
| Household Size | Owner-occupied | Renter-occupied |
| 1-Person Household | 28 (44.4%) | 35 (55.6%) |
| 2-Person Household | 41 (71.9%) | 16 (28.1%) |
| 3-Person Household | 37 (92.5%) | 3 (7.5%) |
| 4+ Person Household | 26 (55.3%) | 21 (44.7%) |
| Total Housing Units | 132 (63.8%) | 75 (36.2%) |
Occupancy by Educational Attainment in Buffalo Gap
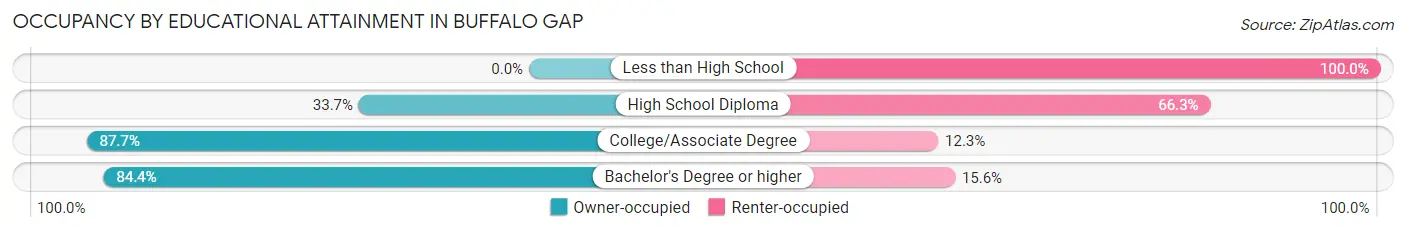
| Household Size | Owner-occupied | Renter-occupied |
| Less than High School | 0 (0.0%) | 3 (100.0%) |
| High School Diploma | 28 (33.7%) | 55 (66.3%) |
| College/Associate Degree | 50 (87.7%) | 7 (12.3%) |
| Bachelor's Degree or higher | 54 (84.4%) | 10 (15.6%) |
Occupancy by Age of Householder in Buffalo Gap
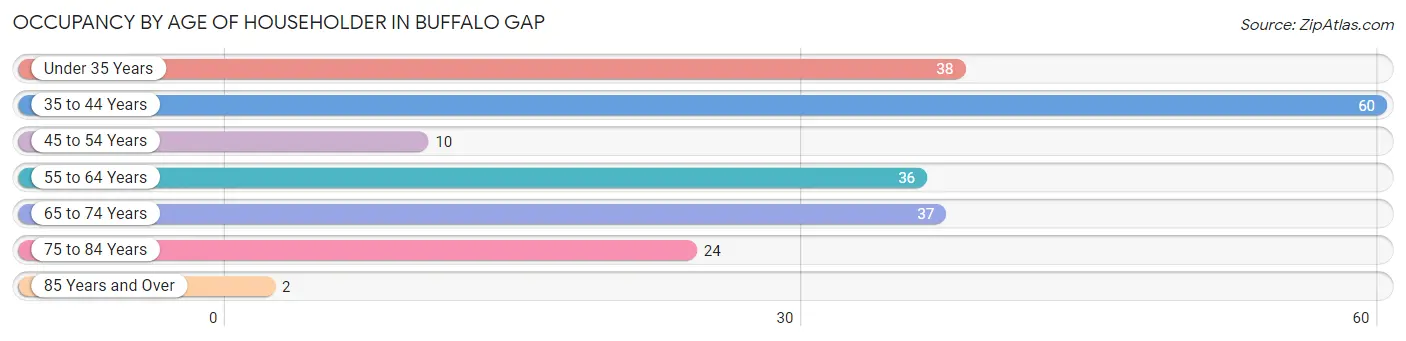
| Age Bracket | # Households | % Households |
| Under 35 Years | 38 | 18.4% |
| 35 to 44 Years | 60 | 29.0% |
| 45 to 54 Years | 10 | 4.8% |
| 55 to 64 Years | 36 | 17.4% |
| 65 to 74 Years | 37 | 17.9% |
| 75 to 84 Years | 24 | 11.6% |
| 85 Years and Over | 2 | 1.0% |
| Total | 207 | 100.0% |
Housing Finances in Buffalo Gap
Median Income by Occupancy in Buffalo Gap
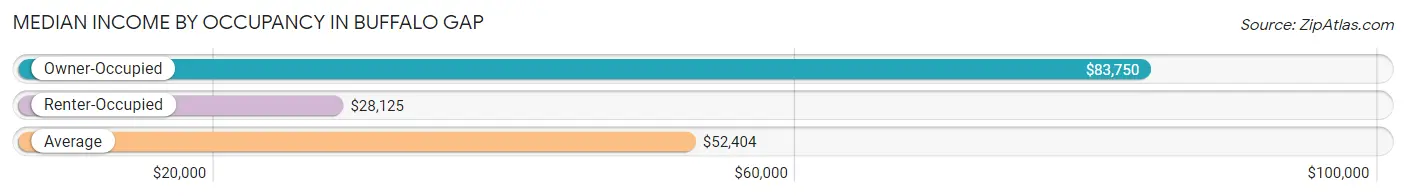
| Occupancy Type | # Households | Median Income |
| Owner-Occupied | 132 (63.8%) | $83,750 |
| Renter-Occupied | 75 (36.2%) | $28,125 |
| Average | 207 (100.0%) | $52,404 |
Occupancy by Householder Income Bracket in Buffalo Gap
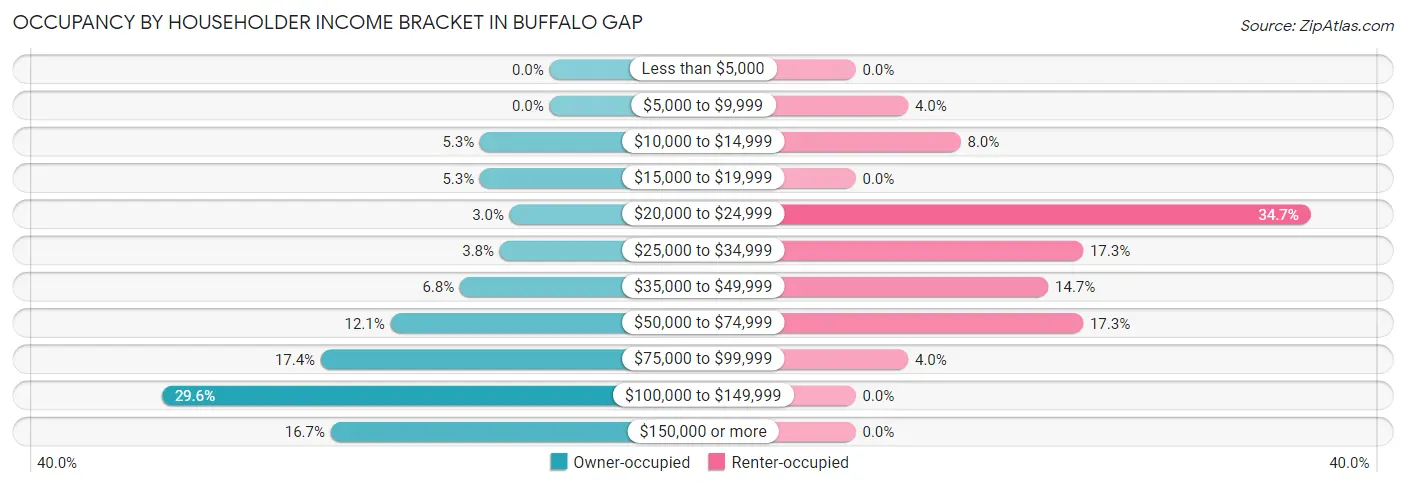
| Income Bracket | Owner-occupied | Renter-occupied |
| Less than $5,000 | 0 (0.0%) | 0 (0.0%) |
| $5,000 to $9,999 | 0 (0.0%) | 3 (4.0%) |
| $10,000 to $14,999 | 7 (5.3%) | 6 (8.0%) |
| $15,000 to $19,999 | 7 (5.3%) | 0 (0.0%) |
| $20,000 to $24,999 | 4 (3.0%) | 26 (34.7%) |
| $25,000 to $34,999 | 5 (3.8%) | 13 (17.3%) |
| $35,000 to $49,999 | 9 (6.8%) | 11 (14.7%) |
| $50,000 to $74,999 | 16 (12.1%) | 13 (17.3%) |
| $75,000 to $99,999 | 23 (17.4%) | 3 (4.0%) |
| $100,000 to $149,999 | 39 (29.5%) | 0 (0.0%) |
| $150,000 or more | 22 (16.7%) | 0 (0.0%) |
| Total | 132 (100.0%) | 75 (100.0%) |
Monthly Housing Cost Tiers in Buffalo Gap
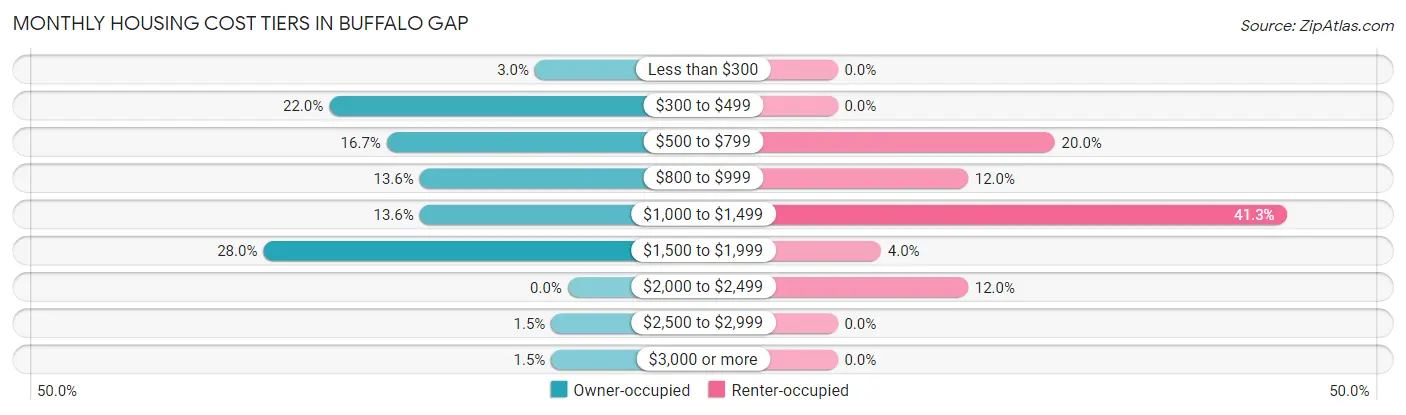
| Monthly Cost | Owner-occupied | Renter-occupied |
| Less than $300 | 4 (3.0%) | 0 (0.0%) |
| $300 to $499 | 29 (22.0%) | 0 (0.0%) |
| $500 to $799 | 22 (16.7%) | 15 (20.0%) |
| $800 to $999 | 18 (13.6%) | 9 (12.0%) |
| $1,000 to $1,499 | 18 (13.6%) | 31 (41.3%) |
| $1,500 to $1,999 | 37 (28.0%) | 3 (4.0%) |
| $2,000 to $2,499 | 0 (0.0%) | 9 (12.0%) |
| $2,500 to $2,999 | 2 (1.5%) | 0 (0.0%) |
| $3,000 or more | 2 (1.5%) | 0 (0.0%) |
| Total | 132 (100.0%) | 75 (100.0%) |
Physical Housing Characteristics in Buffalo Gap
Housing Structures in Buffalo Gap
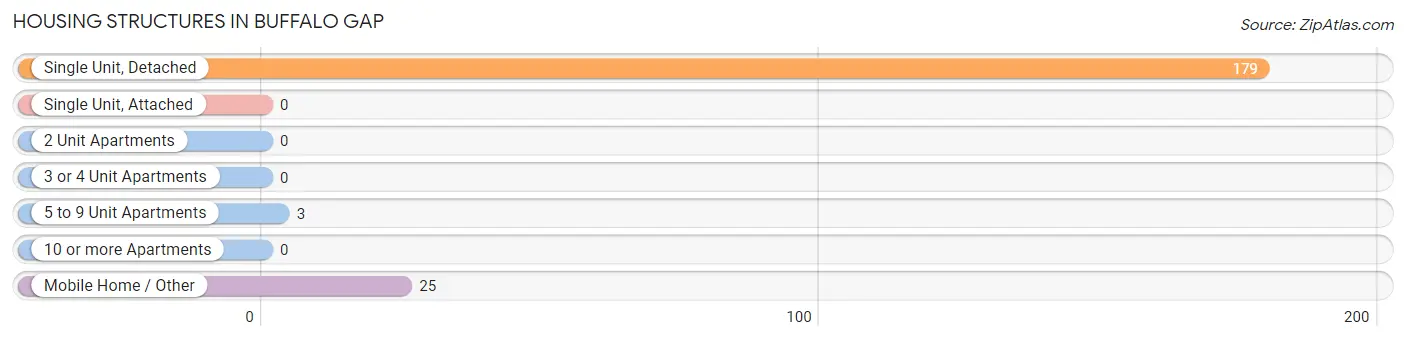
| Structure Type | # Housing Units | % Housing Units |
| Single Unit, Detached | 179 | 86.5% |
| Single Unit, Attached | 0 | 0.0% |
| 2 Unit Apartments | 0 | 0.0% |
| 3 or 4 Unit Apartments | 0 | 0.0% |
| 5 to 9 Unit Apartments | 3 | 1.5% |
| 10 or more Apartments | 0 | 0.0% |
| Mobile Home / Other | 25 | 12.1% |
| Total | 207 | 100.0% |
Housing Structures by Occupancy in Buffalo Gap
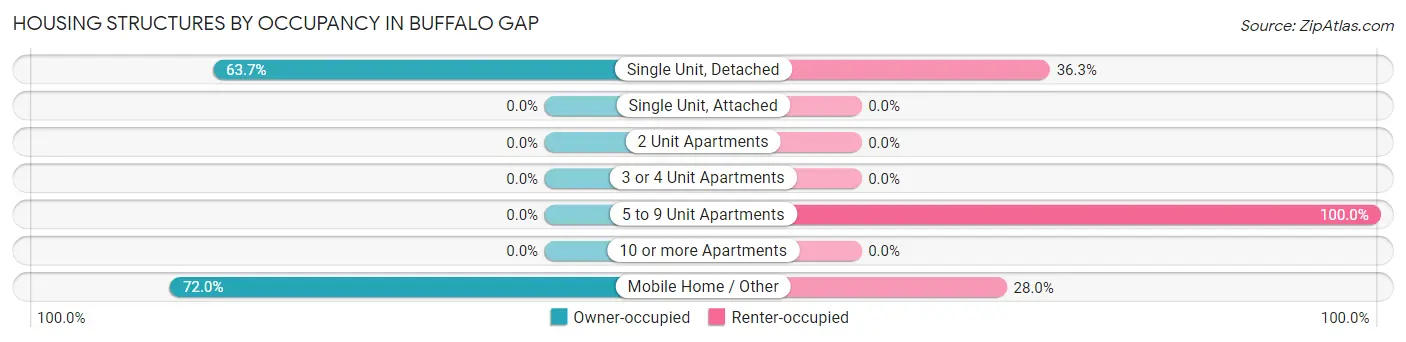
| Structure Type | Owner-occupied | Renter-occupied |
| Single Unit, Detached | 114 (63.7%) | 65 (36.3%) |
| Single Unit, Attached | 0 (0.0%) | 0 (0.0%) |
| 2 Unit Apartments | 0 (0.0%) | 0 (0.0%) |
| 3 or 4 Unit Apartments | 0 (0.0%) | 0 (0.0%) |
| 5 to 9 Unit Apartments | 0 (0.0%) | 3 (100.0%) |
| 10 or more Apartments | 0 (0.0%) | 0 (0.0%) |
| Mobile Home / Other | 18 (72.0%) | 7 (28.0%) |
| Total | 132 (63.8%) | 75 (36.2%) |
Housing Structures by Number of Rooms in Buffalo Gap
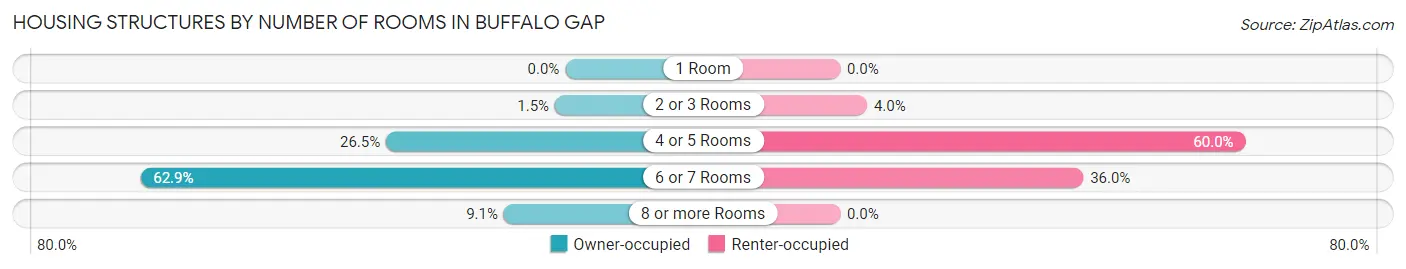
| Number of Rooms | Owner-occupied | Renter-occupied |
| 1 Room | 0 (0.0%) | 0 (0.0%) |
| 2 or 3 Rooms | 2 (1.5%) | 3 (4.0%) |
| 4 or 5 Rooms | 35 (26.5%) | 45 (60.0%) |
| 6 or 7 Rooms | 83 (62.9%) | 27 (36.0%) |
| 8 or more Rooms | 12 (9.1%) | 0 (0.0%) |
| Total | 132 (100.0%) | 75 (100.0%) |
Housing Structure by Heating Type in Buffalo Gap
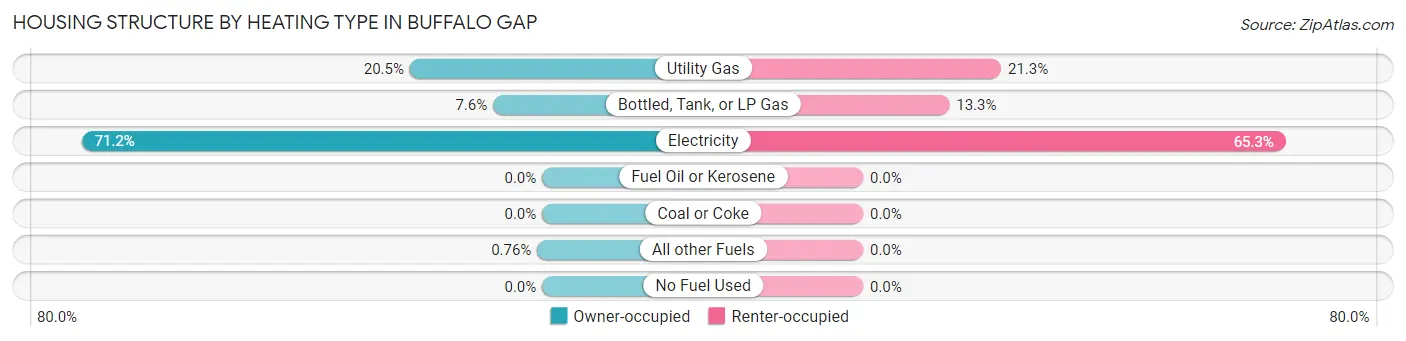
| Heating Type | Owner-occupied | Renter-occupied |
| Utility Gas | 27 (20.4%) | 16 (21.3%) |
| Bottled, Tank, or LP Gas | 10 (7.6%) | 10 (13.3%) |
| Electricity | 94 (71.2%) | 49 (65.3%) |
| Fuel Oil or Kerosene | 0 (0.0%) | 0 (0.0%) |
| Coal or Coke | 0 (0.0%) | 0 (0.0%) |
| All other Fuels | 1 (0.8%) | 0 (0.0%) |
| No Fuel Used | 0 (0.0%) | 0 (0.0%) |
| Total | 132 (100.0%) | 75 (100.0%) |
Household Vehicle Usage in Buffalo Gap
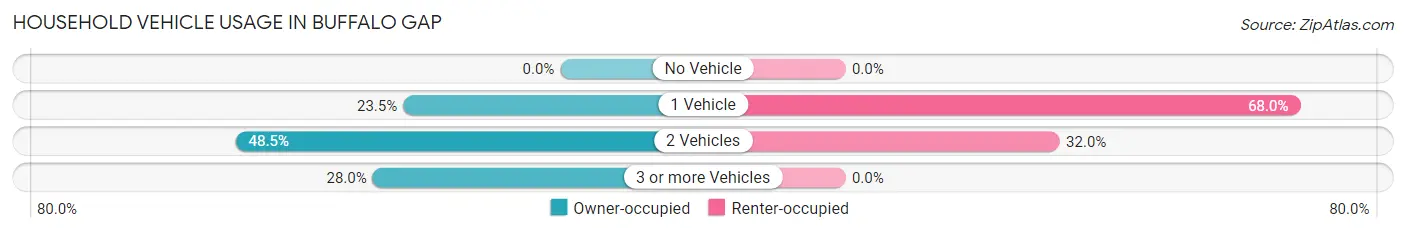
| Vehicles per Household | Owner-occupied | Renter-occupied |
| No Vehicle | 0 (0.0%) | 0 (0.0%) |
| 1 Vehicle | 31 (23.5%) | 51 (68.0%) |
| 2 Vehicles | 64 (48.5%) | 24 (32.0%) |
| 3 or more Vehicles | 37 (28.0%) | 0 (0.0%) |
| Total | 132 (100.0%) | 75 (100.0%) |
Real Estate & Mortgages in Buffalo Gap
Real Estate and Mortgage Overview in Buffalo Gap
| Characteristic | Without Mortgage | With Mortgage |
| Housing Units | 77 | 55 |
| Median Property Value | $117,800 | $256,300 |
| Median Household Income | $75,893 | $18 |
| Monthly Housing Costs | $579 | $2 |
| Real Estate Taxes | - | - |
Property Value by Mortgage Status in Buffalo Gap
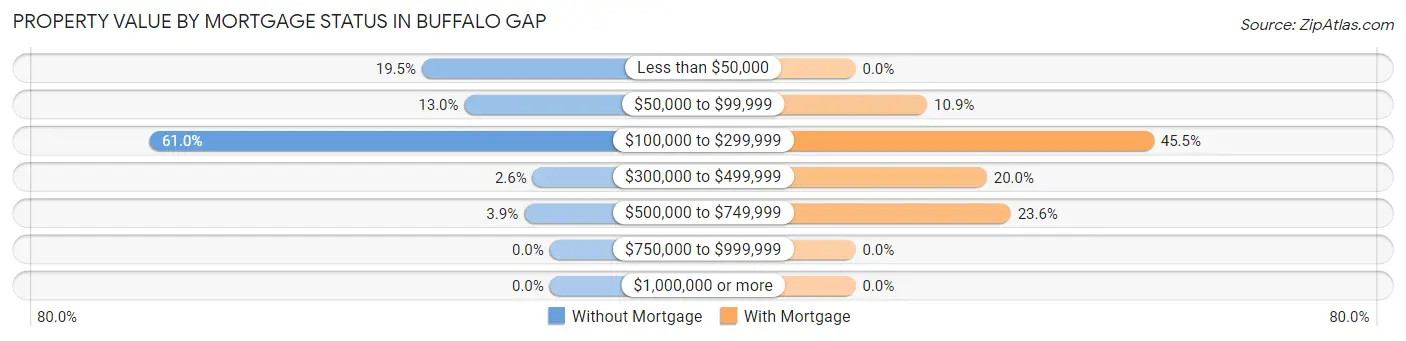
| Property Value | Without Mortgage | With Mortgage |
| Less than $50,000 | 15 (19.5%) | 0 (0.0%) |
| $50,000 to $99,999 | 10 (13.0%) | 6 (10.9%) |
| $100,000 to $299,999 | 47 (61.0%) | 25 (45.5%) |
| $300,000 to $499,999 | 2 (2.6%) | 11 (20.0%) |
| $500,000 to $749,999 | 3 (3.9%) | 13 (23.6%) |
| $750,000 to $999,999 | 0 (0.0%) | 0 (0.0%) |
| $1,000,000 or more | 0 (0.0%) | 0 (0.0%) |
| Total | 77 (100.0%) | 55 (100.0%) |
Household Income by Mortgage Status in Buffalo Gap
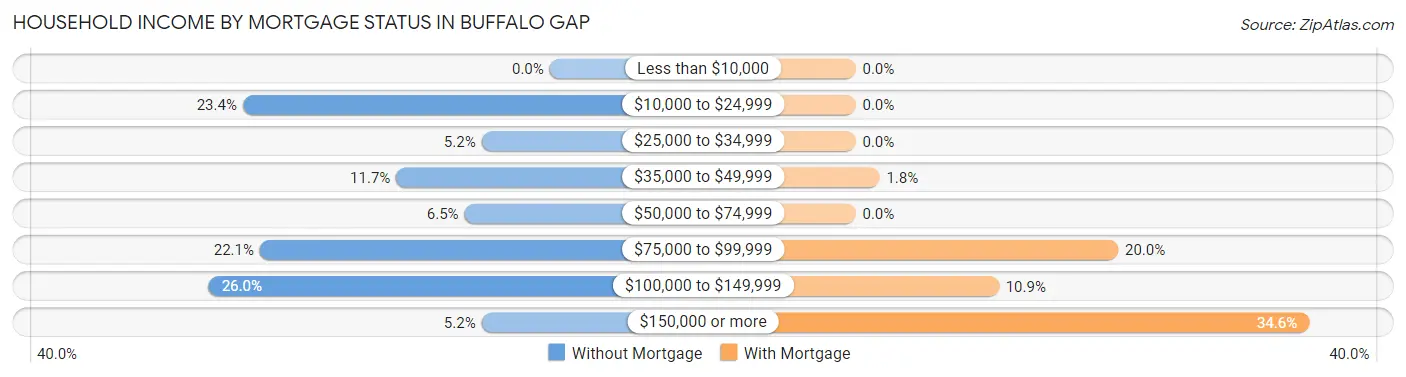
| Household Income | Without Mortgage | With Mortgage |
| Less than $10,000 | 0 (0.0%) | 0 (0.0%) |
| $10,000 to $24,999 | 18 (23.4%) | 0 (0.0%) |
| $25,000 to $34,999 | 4 (5.2%) | 0 (0.0%) |
| $35,000 to $49,999 | 9 (11.7%) | 1 (1.8%) |
| $50,000 to $74,999 | 5 (6.5%) | 0 (0.0%) |
| $75,000 to $99,999 | 17 (22.1%) | 11 (20.0%) |
| $100,000 to $149,999 | 20 (26.0%) | 6 (10.9%) |
| $150,000 or more | 4 (5.2%) | 19 (34.5%) |
| Total | 77 (100.0%) | 55 (100.0%) |
Property Value to Household Income Ratio in Buffalo Gap
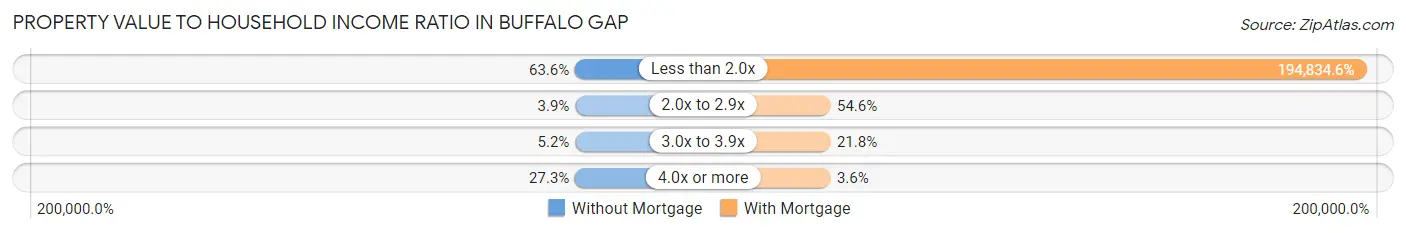
| Value-to-Income Ratio | Without Mortgage | With Mortgage |
| Less than 2.0x | 49 (63.6%) | 107,159 (194,834.5%) |
| 2.0x to 2.9x | 3 (3.9%) | 30 (54.5%) |
| 3.0x to 3.9x | 4 (5.2%) | 12 (21.8%) |
| 4.0x or more | 21 (27.3%) | 2 (3.6%) |
| Total | 77 (100.0%) | 55 (100.0%) |
Real Estate Taxes by Mortgage Status in Buffalo Gap
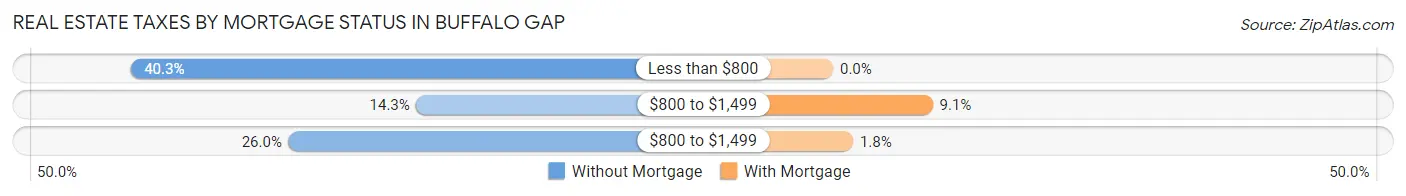
| Property Taxes | Without Mortgage | With Mortgage |
| Less than $800 | 31 (40.3%) | 0 (0.0%) |
| $800 to $1,499 | 11 (14.3%) | 5 (9.1%) |
| $800 to $1,499 | 20 (26.0%) | 1 (1.8%) |
| Total | 77 (100.0%) | 55 (100.0%) |
Health & Disability in Buffalo Gap
Health Insurance Coverage by Age in Buffalo Gap
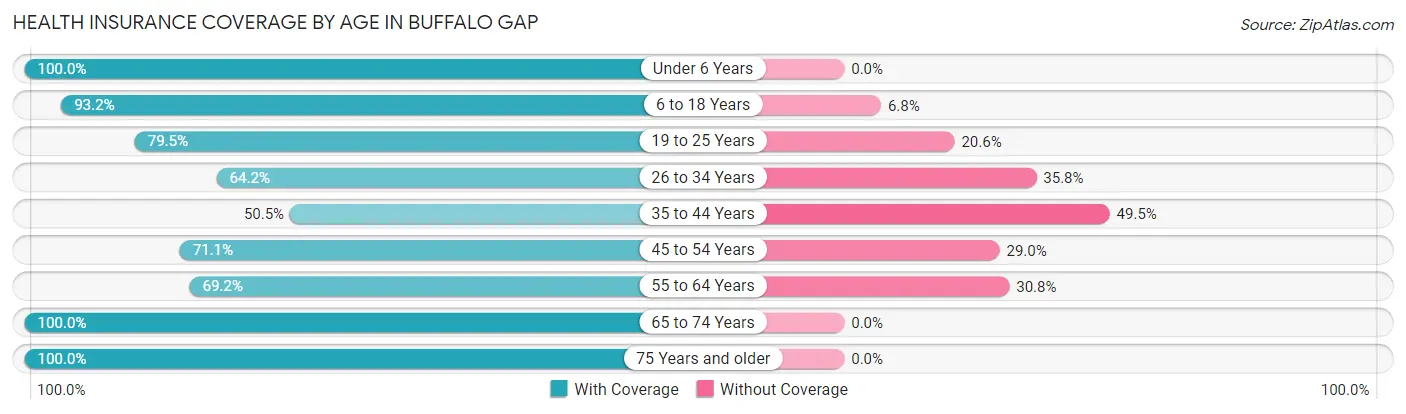
| Age Bracket | With Coverage | Without Coverage |
| Under 6 Years | 24 (100.0%) | 0 (0.0%) |
| 6 to 18 Years | 109 (93.2%) | 8 (6.8%) |
| 19 to 25 Years | 58 (79.4%) | 15 (20.5%) |
| 26 to 34 Years | 43 (64.2%) | 24 (35.8%) |
| 35 to 44 Years | 49 (50.5%) | 48 (49.5%) |
| 45 to 54 Years | 27 (71.1%) | 11 (28.9%) |
| 55 to 64 Years | 36 (69.2%) | 16 (30.8%) |
| 65 to 74 Years | 69 (100.0%) | 0 (0.0%) |
| 75 Years and older | 40 (100.0%) | 0 (0.0%) |
| Total | 455 (78.9%) | 122 (21.1%) |
Health Insurance Coverage by Citizenship Status in Buffalo Gap
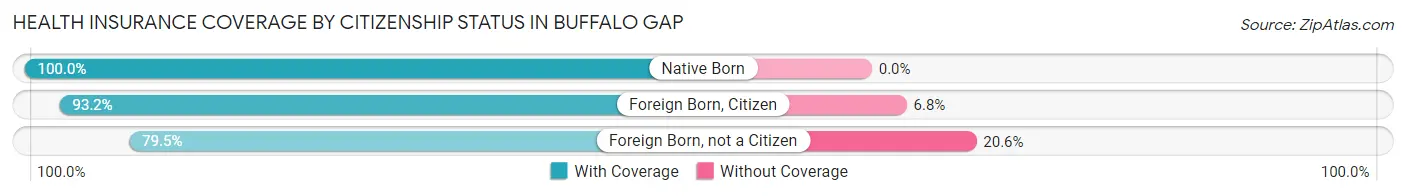
| Citizenship Status | With Coverage | Without Coverage |
| Native Born | 24 (100.0%) | 0 (0.0%) |
| Foreign Born, Citizen | 109 (93.2%) | 8 (6.8%) |
| Foreign Born, not a Citizen | 58 (79.4%) | 15 (20.5%) |
Health Insurance Coverage by Household Income in Buffalo Gap
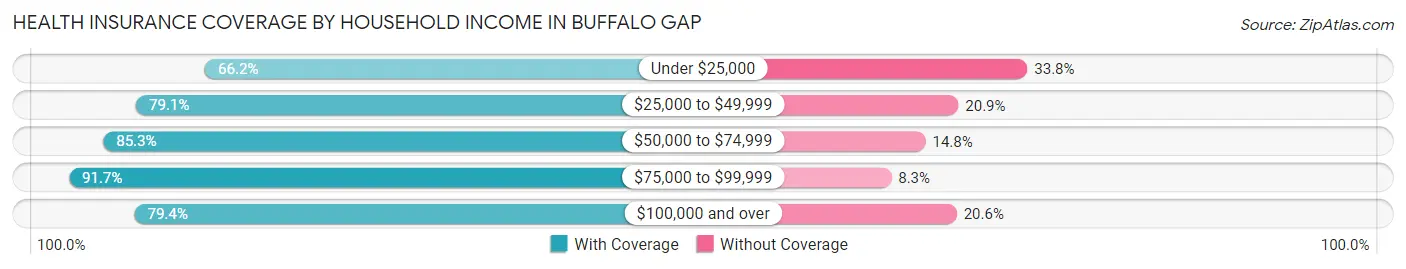
| Household Income | With Coverage | Without Coverage |
| Under $25,000 | 88 (66.2%) | 45 (33.8%) |
| $25,000 to $49,999 | 53 (79.1%) | 14 (20.9%) |
| $50,000 to $74,999 | 52 (85.3%) | 9 (14.7%) |
| $75,000 to $99,999 | 77 (91.7%) | 7 (8.3%) |
| $100,000 and over | 158 (79.4%) | 41 (20.6%) |
Public vs Private Health Insurance Coverage by Age in Buffalo Gap
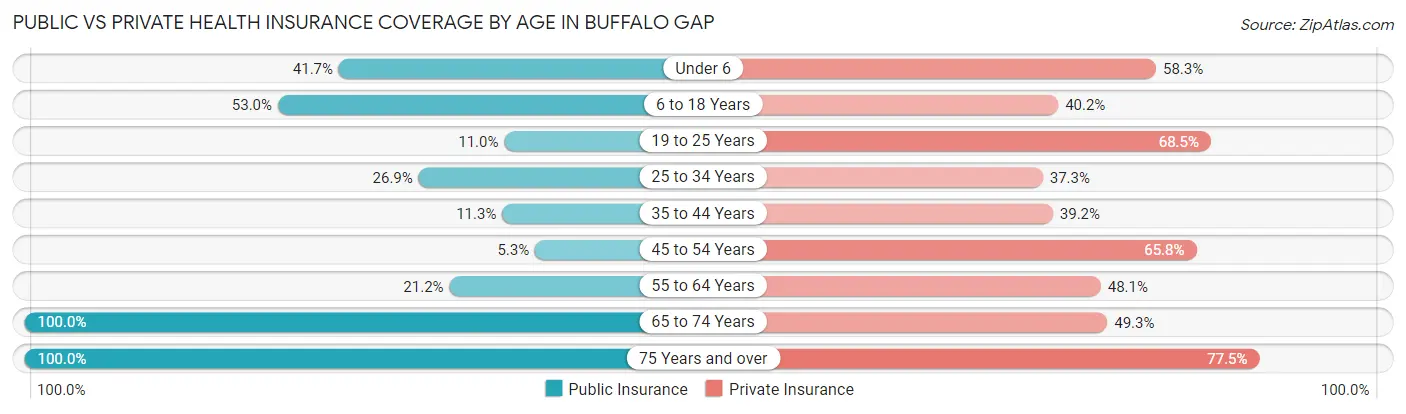
| Age Bracket | Public Insurance | Private Insurance |
| Under 6 | 10 (41.7%) | 14 (58.3%) |
| 6 to 18 Years | 62 (53.0%) | 47 (40.2%) |
| 19 to 25 Years | 8 (11.0%) | 50 (68.5%) |
| 25 to 34 Years | 18 (26.9%) | 25 (37.3%) |
| 35 to 44 Years | 11 (11.3%) | 38 (39.2%) |
| 45 to 54 Years | 2 (5.3%) | 25 (65.8%) |
| 55 to 64 Years | 11 (21.1%) | 25 (48.1%) |
| 65 to 74 Years | 69 (100.0%) | 34 (49.3%) |
| 75 Years and over | 40 (100.0%) | 31 (77.5%) |
| Total | 231 (40.0%) | 289 (50.1%) |
Disability Status by Sex by Age in Buffalo Gap
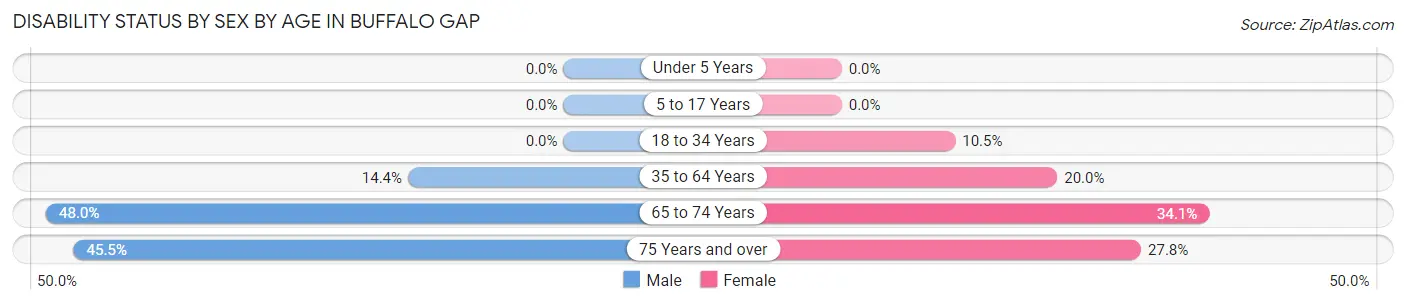
| Age Bracket | Male | Female |
| Under 5 Years | 0 (0.0%) | 0 (0.0%) |
| 5 to 17 Years | 0 (0.0%) | 0 (0.0%) |
| 18 to 34 Years | 0 (0.0%) | 10 (10.5%) |
| 35 to 64 Years | 14 (14.4%) | 18 (20.0%) |
| 65 to 74 Years | 12 (48.0%) | 15 (34.1%) |
| 75 Years and over | 10 (45.5%) | 5 (27.8%) |
Disability Class by Sex by Age in Buffalo Gap
Disability Class: Hearing Difficulty
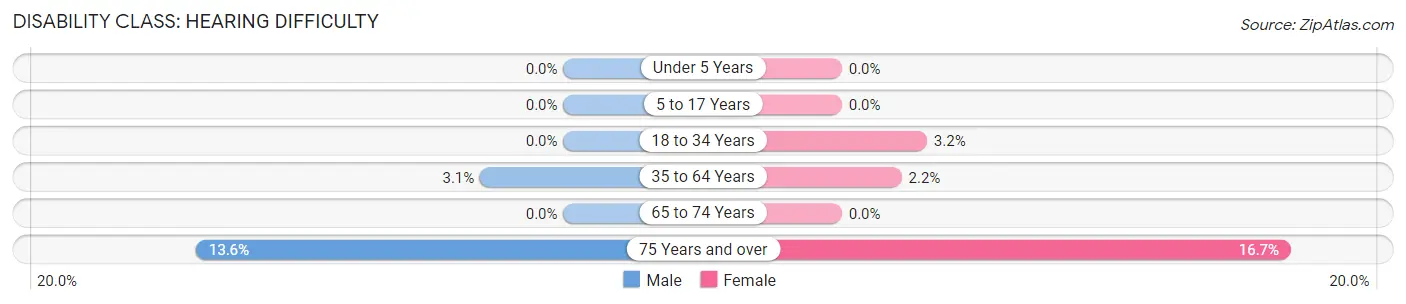
| Age Bracket | Male | Female |
| Under 5 Years | 0 (0.0%) | 0 (0.0%) |
| 5 to 17 Years | 0 (0.0%) | 0 (0.0%) |
| 18 to 34 Years | 0 (0.0%) | 3 (3.2%) |
| 35 to 64 Years | 3 (3.1%) | 2 (2.2%) |
| 65 to 74 Years | 0 (0.0%) | 0 (0.0%) |
| 75 Years and over | 3 (13.6%) | 3 (16.7%) |
Disability Class: Vision Difficulty
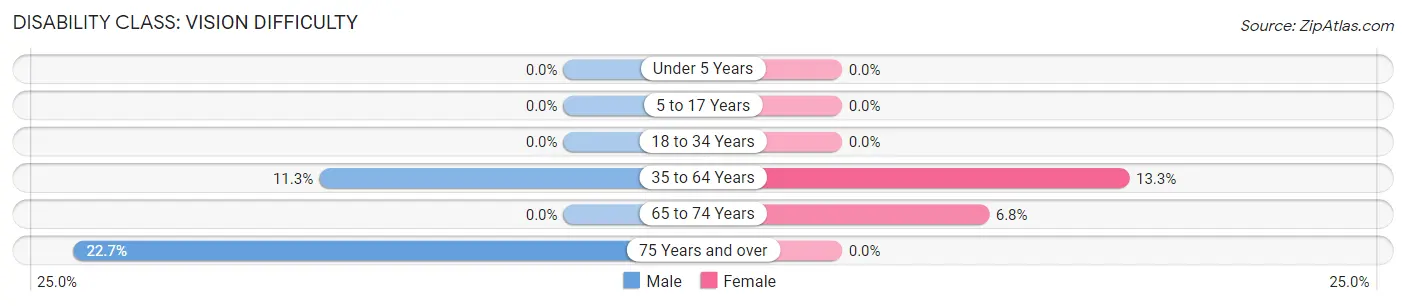
| Age Bracket | Male | Female |
| Under 5 Years | 0 (0.0%) | 0 (0.0%) |
| 5 to 17 Years | 0 (0.0%) | 0 (0.0%) |
| 18 to 34 Years | 0 (0.0%) | 0 (0.0%) |
| 35 to 64 Years | 11 (11.3%) | 12 (13.3%) |
| 65 to 74 Years | 0 (0.0%) | 3 (6.8%) |
| 75 Years and over | 5 (22.7%) | 0 (0.0%) |
Disability Class: Cognitive Difficulty
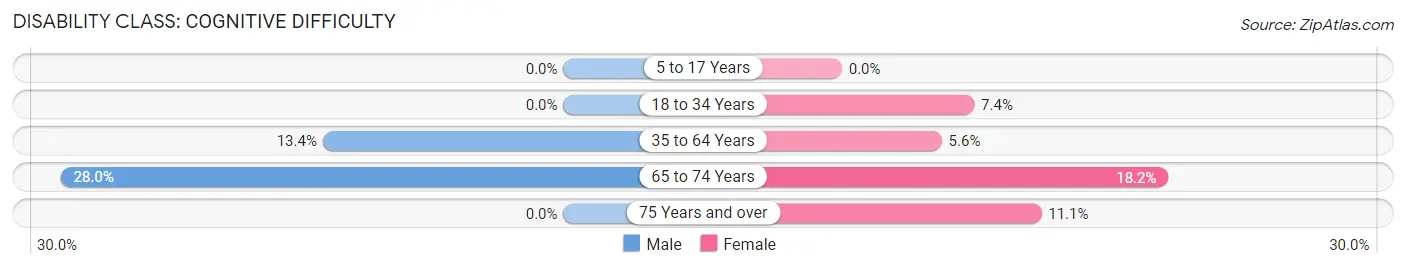
| Age Bracket | Male | Female |
| 5 to 17 Years | 0 (0.0%) | 0 (0.0%) |
| 18 to 34 Years | 0 (0.0%) | 7 (7.4%) |
| 35 to 64 Years | 13 (13.4%) | 5 (5.6%) |
| 65 to 74 Years | 7 (28.0%) | 8 (18.2%) |
| 75 Years and over | 0 (0.0%) | 2 (11.1%) |
Disability Class: Ambulatory Difficulty
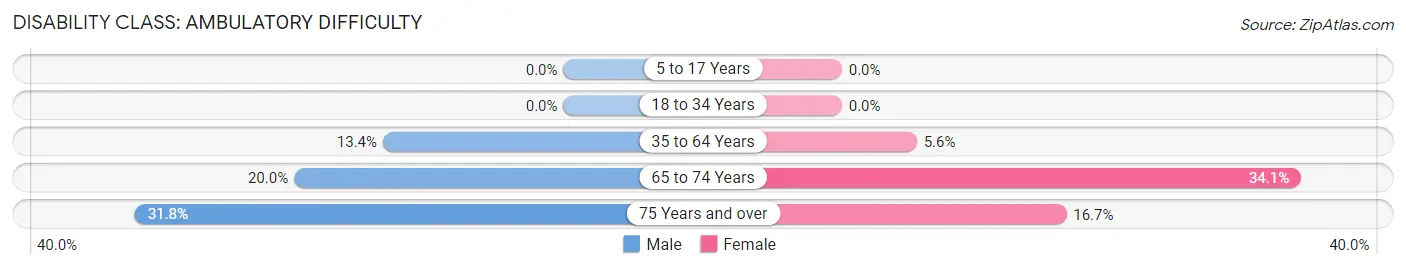
| Age Bracket | Male | Female |
| 5 to 17 Years | 0 (0.0%) | 0 (0.0%) |
| 18 to 34 Years | 0 (0.0%) | 0 (0.0%) |
| 35 to 64 Years | 13 (13.4%) | 5 (5.6%) |
| 65 to 74 Years | 5 (20.0%) | 15 (34.1%) |
| 75 Years and over | 7 (31.8%) | 3 (16.7%) |
Disability Class: Self-Care Difficulty
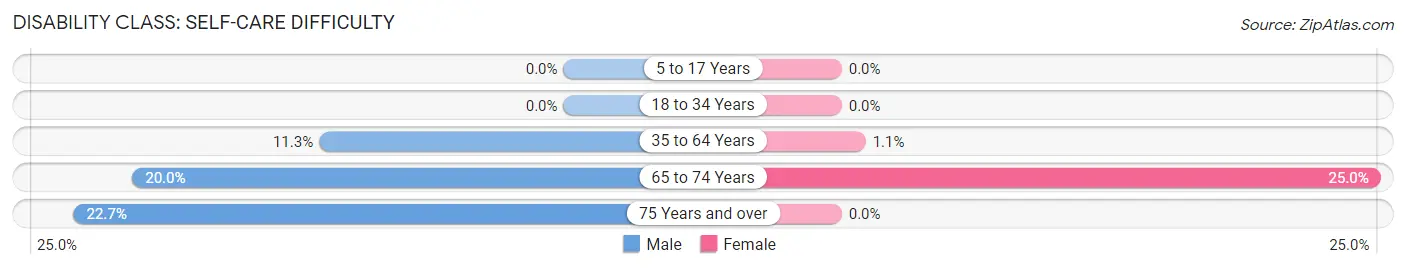
| Age Bracket | Male | Female |
| 5 to 17 Years | 0 (0.0%) | 0 (0.0%) |
| 18 to 34 Years | 0 (0.0%) | 0 (0.0%) |
| 35 to 64 Years | 11 (11.3%) | 1 (1.1%) |
| 65 to 74 Years | 5 (20.0%) | 11 (25.0%) |
| 75 Years and over | 5 (22.7%) | 0 (0.0%) |
Technology Access in Buffalo Gap
Computing Device Access in Buffalo Gap
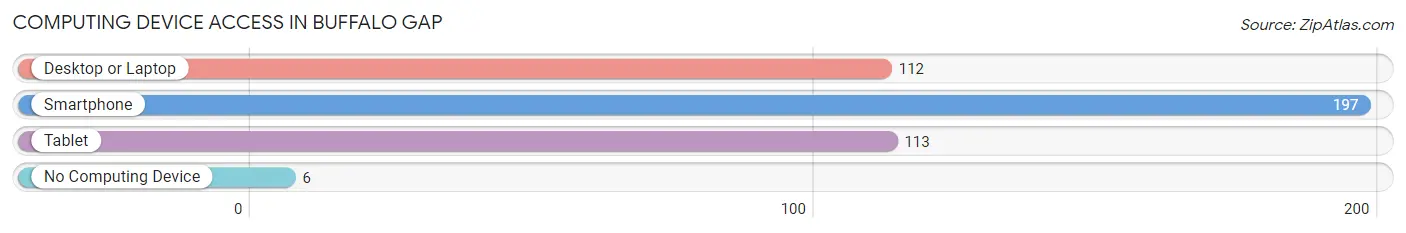
| Device Type | # Households | % Households |
| Desktop or Laptop | 112 | 54.1% |
| Smartphone | 197 | 95.2% |
| Tablet | 113 | 54.6% |
| No Computing Device | 6 | 2.9% |
| Total | 207 | 100.0% |
Internet Access in Buffalo Gap
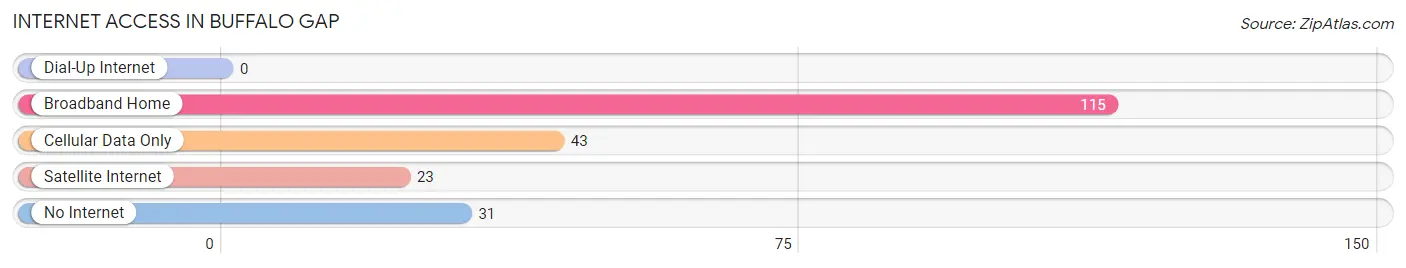
| Internet Type | # Households | % Households |
| Dial-Up Internet | 0 | 0.0% |
| Broadband Home | 115 | 55.6% |
| Cellular Data Only | 43 | 20.8% |
| Satellite Internet | 23 | 11.1% |
| No Internet | 31 | 15.0% |
| Total | 207 | 100.0% |
Buffalo Gap Summary
Buffalo Gap is a small unincorporated community located in Taylor County, Texas. It is situated about 15 miles south of Abilene, the county seat. The town was founded in 1876 and was named after a gap in the hills that was used by buffalo herds to cross the Clear Fork of the Brazos River. The population of Buffalo Gap was estimated to be around 500 in 2020.
History
Buffalo Gap was founded in 1876 by a group of settlers from the nearby town of Abilene. The town was named after a gap in the hills that was used by buffalo herds to cross the Clear Fork of the Brazos River. The town was initially a stop on the Texas and Pacific Railway, and it quickly grew into a thriving community.
In the early 1900s, Buffalo Gap was a popular destination for tourists, who came to enjoy the area’s natural beauty and to hunt and fish. The town was also home to several businesses, including a hotel, a general store, a blacksmith shop, and a livery stable.
In the 1920s, Buffalo Gap began to decline as the railroad moved its operations to Abilene. The town’s population dwindled, and many of the businesses closed. However, the town was able to survive due to its proximity to Abilene and its agricultural industry.
Geography
Buffalo Gap is located in Taylor County, Texas, about 15 miles south of Abilene. The town is situated in the Clear Fork of the Brazos River Valley, and it is surrounded by rolling hills and grasslands. The area is known for its natural beauty, and it is home to several species of wildlife, including deer, wild turkeys, and quail.
The climate in Buffalo Gap is semi-arid, with hot summers and mild winters. The average annual temperature is around 68°F, and the average annual precipitation is around 22 inches.
Economy
The economy of Buffalo Gap is largely based on agriculture. The town is home to several farms and ranches, and the surrounding area is known for its production of cotton, wheat, and other crops.
In addition to agriculture, Buffalo Gap is home to several small businesses, including a grocery store, a hardware store, and a restaurant. The town also has a post office and a volunteer fire department.
Demographics
As of 2020, the population of Buffalo Gap was estimated to be around 500. The town is predominantly white, with a small Hispanic population. The median household income is around $45,000, and the median home value is around $90,000.
Conclusion
Buffalo Gap is a small unincorporated community located in Taylor County, Texas. It was founded in 1876 and was named after a gap in the hills that was used by buffalo herds to cross the Clear Fork of the Brazos River. The town’s economy is largely based on agriculture, and it is home to several small businesses. The population of Buffalo Gap was estimated to be around 500 in 2020.
Common Questions
What is Per Capita Income in Buffalo Gap?
Per Capita income in Buffalo Gap is $29,027.
What is the Median Family Income in Buffalo Gap?
Median Family Income in Buffalo Gap is $85,625.
What is the Median Household income in Buffalo Gap?
Median Household Income in Buffalo Gap is $52,404.
What is Income or Wage Gap in Buffalo Gap?
Income or Wage Gap in Buffalo Gap is 57.8%.
Women in Buffalo Gap earn 42.2 cents for every dollar earned by a man.
What is Inequality or Gini Index in Buffalo Gap?
Inequality or Gini Index in Buffalo Gap is 0.44.
What is the Total Population of Buffalo Gap?
Total Population of Buffalo Gap is 579.
What is the Total Male Population of Buffalo Gap?
Total Male Population of Buffalo Gap is 271.
What is the Total Female Population of Buffalo Gap?
Total Female Population of Buffalo Gap is 308.
What is the Ratio of Males per 100 Females in Buffalo Gap?
There are 87.99 Males per 100 Females in Buffalo Gap.
What is the Ratio of Females per 100 Males in Buffalo Gap?
There are 113.65 Females per 100 Males in Buffalo Gap.
What is the Median Population Age in Buffalo Gap?
Median Population Age in Buffalo Gap is 36.4 Years.
What is the Average Family Size in Buffalo Gap
Average Family Size in Buffalo Gap is 3.5 People.
What is the Average Household Size in Buffalo Gap
Average Household Size in Buffalo Gap is 2.6 People.
How Large is the Labor Force in Buffalo Gap?
There are 245 People in the Labor Forcein in Buffalo Gap.
What is the Percentage of People in the Labor Force in Buffalo Gap?
53.1% of People are in the Labor Force in Buffalo Gap.