Brenham, TX Map & Demographics
Brenham Map
Brenham Overview
$27,592
PER CAPITA INCOME
$73,318
AVG FAMILY INCOME
$52,664
AVG HOUSEHOLD INCOME
17.8%
WAGE / INCOME GAP [ % ]
82.2¢/ $1
WAGE / INCOME GAP [ $ ]
0.47
INEQUALITY / GINI INDEX
17,655
TOTAL POPULATION
8,161
MALE POPULATION
9,494
FEMALE POPULATION
85.96
MALES / 100 FEMALES
116.33
FEMALES / 100 MALES
32.4
MEDIAN AGE
3.2
AVG FAMILY SIZE
2.3
AVG HOUSEHOLD SIZE
7,649
LABOR FORCE [ PEOPLE ]
55.0%
PERCENT IN LABOR FORCE
3.9%
UNEMPLOYMENT RATE
Brenham Zip Codes
Brenham Area Codes
Income in Brenham
Income Overview in Brenham
Per Capita Income in Brenham is $27,592, while median incomes of families and households are $73,318 and $52,664 respectively.
| Characteristic | Number | Measure |
| Per Capita Income | 17,655 | $27,592 |
| Median Family Income | 3,588 | $73,318 |
| Mean Family Income | 3,588 | $92,934 |
| Median Household Income | 6,668 | $52,664 |
| Mean Household Income | 6,668 | $72,795 |
| Income Deficit | 3,588 | $0 |
| Wage / Income Gap (%) | 17,655 | 17.83% |
| Wage / Income Gap ($) | 17,655 | 82.17¢ per $1 |
| Gini / Inequality Index | 17,655 | 0.47 |
Earnings by Sex in Brenham
Average Earnings in Brenham are $31,700, $36,611 for men and $30,084 for women, a difference of 17.8%.
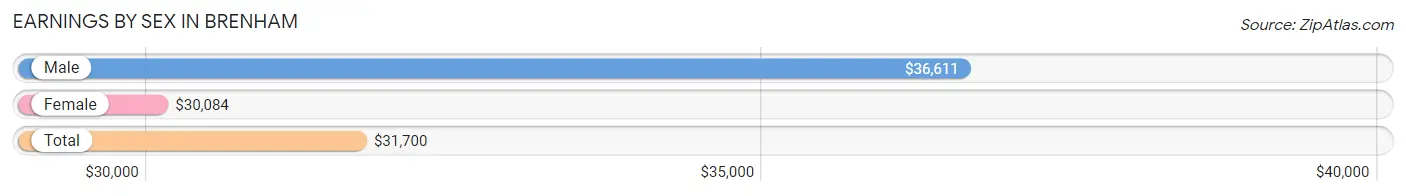
| Sex | Number | Average Earnings |
| Male | 3,890 (46.4%) | $36,611 |
| Female | 4,495 (53.6%) | $30,084 |
| Total | 8,385 (100.0%) | $31,700 |
Earnings by Sex by Income Bracket in Brenham
The most common earnings brackets in Brenham are $100,000+ for men (402 | 10.3%) and $30,000 to $34,999 for women (559 | 12.4%).
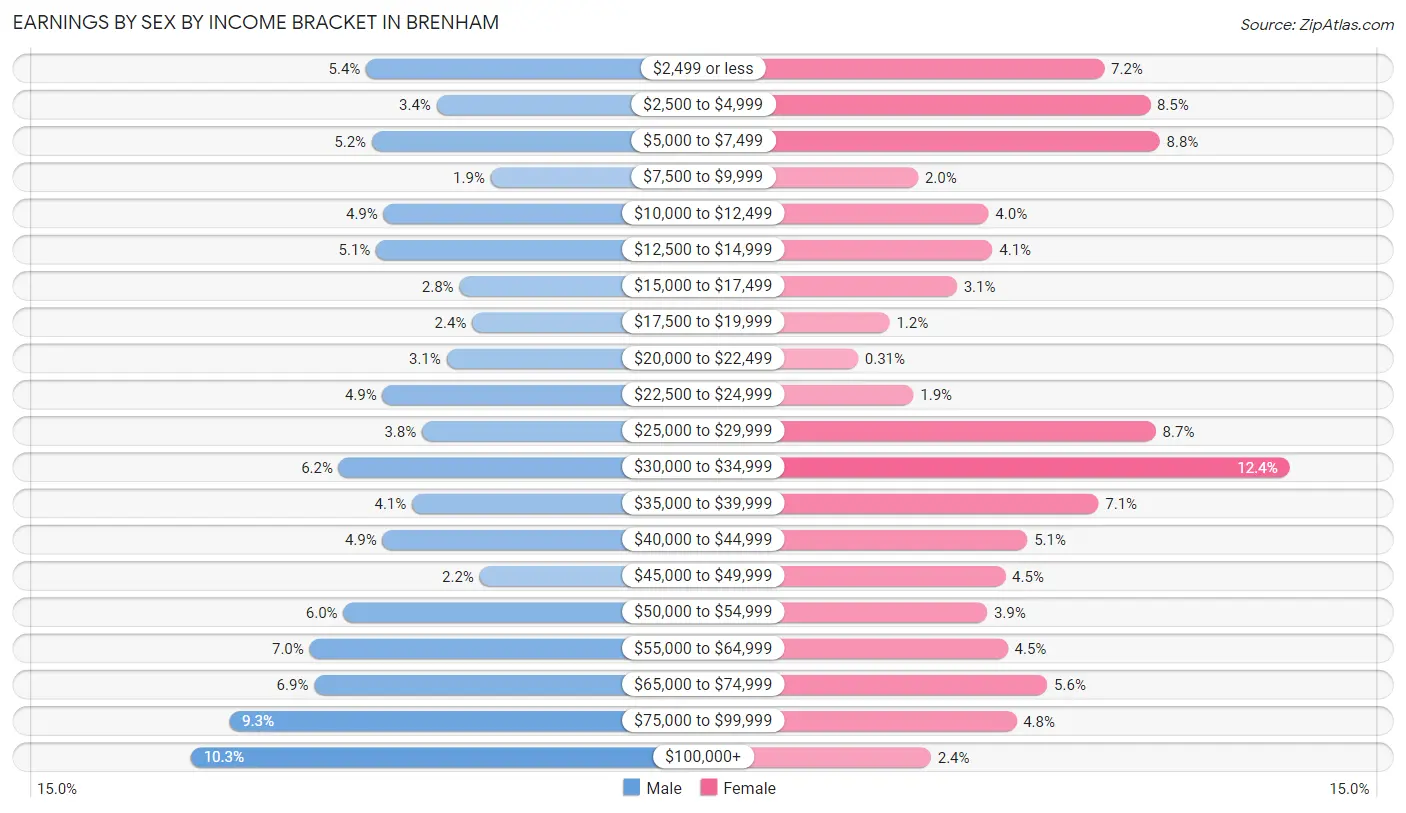
| Income | Male | Female |
| $2,499 or less | 210 (5.4%) | 325 (7.2%) |
| $2,500 to $4,999 | 133 (3.4%) | 383 (8.5%) |
| $5,000 to $7,499 | 204 (5.2%) | 395 (8.8%) |
| $7,500 to $9,999 | 74 (1.9%) | 90 (2.0%) |
| $10,000 to $12,499 | 191 (4.9%) | 179 (4.0%) |
| $12,500 to $14,999 | 199 (5.1%) | 184 (4.1%) |
| $15,000 to $17,499 | 108 (2.8%) | 139 (3.1%) |
| $17,500 to $19,999 | 94 (2.4%) | 54 (1.2%) |
| $20,000 to $22,499 | 122 (3.1%) | 14 (0.3%) |
| $22,500 to $24,999 | 192 (4.9%) | 84 (1.9%) |
| $25,000 to $29,999 | 149 (3.8%) | 390 (8.7%) |
| $30,000 to $34,999 | 240 (6.2%) | 559 (12.4%) |
| $35,000 to $39,999 | 160 (4.1%) | 318 (7.1%) |
| $40,000 to $44,999 | 192 (4.9%) | 228 (5.1%) |
| $45,000 to $49,999 | 86 (2.2%) | 200 (4.4%) |
| $50,000 to $54,999 | 235 (6.0%) | 177 (3.9%) |
| $55,000 to $64,999 | 272 (7.0%) | 203 (4.5%) |
| $65,000 to $74,999 | 267 (6.9%) | 253 (5.6%) |
| $75,000 to $99,999 | 360 (9.2%) | 214 (4.8%) |
| $100,000+ | 402 (10.3%) | 106 (2.4%) |
| Total | 3,890 (100.0%) | 4,495 (100.0%) |
Earnings by Sex by Educational Attainment in Brenham
Average earnings in Brenham are $50,638 for men and $36,186 for women, a difference of 28.5%. Men with an educational attainment of college or associate's degree enjoy the highest average annual earnings of $69,167, while those with high school diploma education earn the least with $34,481. Women with an educational attainment of graduate degree earn the most with the average annual earnings of $65,192, while those with less than high school education have the smallest earnings of $29,394.
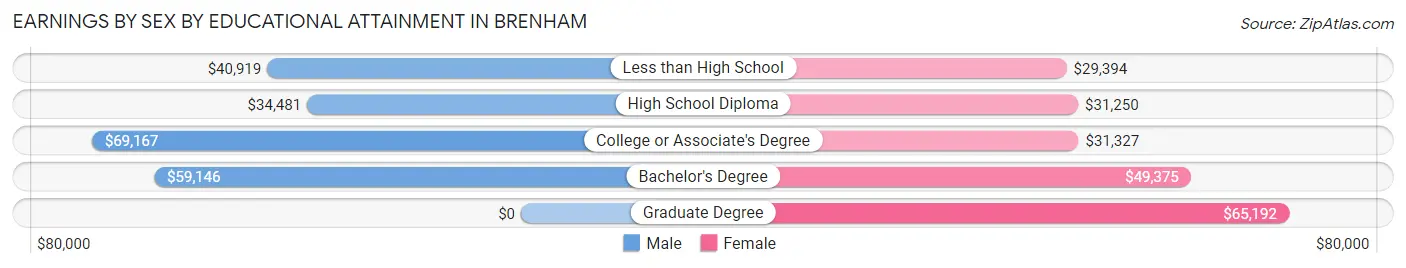
| Educational Attainment | Male Income | Female Income |
| Less than High School | $40,919 | $29,394 |
| High School Diploma | $34,481 | $31,250 |
| College or Associate's Degree | $69,167 | $31,327 |
| Bachelor's Degree | $59,146 | $49,375 |
| Graduate Degree | - | - |
| Total | $50,638 | $36,186 |
Family Income in Brenham
Family Income Brackets in Brenham
According to the Brenham family income data, there are 804 families falling into the $100,000 to $149,999 income range, which is the most common income bracket and makes up 22.4% of all families. Conversely, the less than $10,000 income bracket is the least frequent group with only 151 families (4.2%) belonging to this category.
| Income Bracket | # Families | % Families |
| Less than $10,000 | 151 | 4.2% |
| $10,000 to $14,999 | 151 | 4.2% |
| $15,000 to $24,999 | 298 | 8.3% |
| $25,000 to $34,999 | 154 | 4.3% |
| $35,000 to $49,999 | 380 | 10.6% |
| $50,000 to $74,999 | 696 | 19.4% |
| $75,000 to $99,999 | 466 | 13.0% |
| $100,000 to $149,999 | 804 | 22.4% |
| $150,000 to $199,999 | 215 | 6.0% |
| $200,000+ | 273 | 7.6% |
Family Income by Famaliy Size in Brenham
5-person families (267 | 7.4%) account for the highest median family income in Brenham with $114,375 per family, while 2-person families (1,777 | 49.5%) have the highest median income of $30,482 per family member.
| Income Bracket | # Families | Median Income |
| 2-Person Families | 1,777 (49.5%) | $60,965 |
| 3-Person Families | 672 (18.7%) | $52,273 |
| 4-Person Families | 486 (13.6%) | $78,500 |
| 5-Person Families | 267 (7.4%) | $114,375 |
| 6-Person Families | 378 (10.5%) | $85,260 |
| 7+ Person Families | 8 (0.2%) | $0 |
| Total | 3,588 (100.0%) | $73,318 |
Family Income by Number of Earners in Brenham
The median family income in Brenham is $73,318, with families comprising 2 earners (1,118) having the highest median family income of $103,563, while families with no earners (653) have the lowest median family income of $42,829, accounting for 31.2% and 18.2% of families, respectively.
| Number of Earners | # Families | Median Income |
| No Earners | 653 (18.2%) | $42,829 |
| 1 Earner | 1,251 (34.9%) | $53,028 |
| 2 Earners | 1,118 (31.2%) | $103,563 |
| 3+ Earners | 566 (15.8%) | $87,181 |
| Total | 3,588 (100.0%) | $73,318 |
Household Income in Brenham
Household Income Brackets in Brenham
With 1,274 households falling in the category, the $50,000 to $74,999 income range is the most frequent in Brenham, accounting for 19.1% of all households. In contrast, only 207 households (3.1%) fall into the less than $10,000 income bracket, making it the least populous group.
| Income Bracket | # Households | % Households |
| Less than $10,000 | 207 | 3.1% |
| $10,000 to $14,999 | 807 | 12.1% |
| $15,000 to $24,999 | 653 | 9.8% |
| $25,000 to $34,999 | 707 | 10.6% |
| $35,000 to $49,999 | 727 | 10.9% |
| $50,000 to $74,999 | 1,274 | 19.1% |
| $75,000 to $99,999 | 847 | 12.7% |
| $100,000 to $149,999 | 887 | 13.3% |
| $150,000 to $199,999 | 253 | 3.8% |
| $200,000+ | 307 | 4.6% |
Household Income by Householder Age in Brenham
The median household income in Brenham is $52,664, with the highest median household income of $73,691 found in the 25 to 44 years age bracket for the primary householder. A total of 1,926 households (28.9%) fall into this category. Meanwhile, the 15 to 24 years age bracket for the primary householder has the lowest median household income of $13,454, with 629 households (9.4%) in this group.
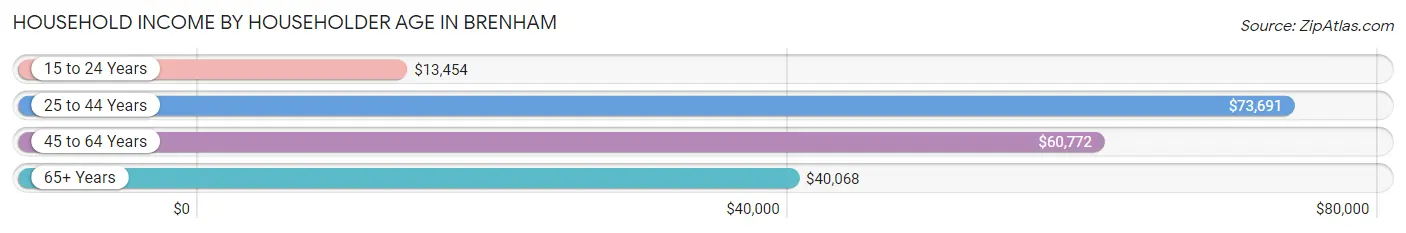
| Income Bracket | # Households | Median Income |
| 15 to 24 Years | 629 (9.4%) | $13,454 |
| 25 to 44 Years | 1,926 (28.9%) | $73,691 |
| 45 to 64 Years | 2,053 (30.8%) | $60,772 |
| 65+ Years | 2,060 (30.9%) | $40,068 |
| Total | 6,668 (100.0%) | $52,664 |
Poverty in Brenham
Income Below Poverty by Sex and Age in Brenham
With 19.4% poverty level for males and 17.1% for females among the residents of Brenham, 15 year old males and 18 to 24 year old females are the most vulnerable to poverty, with 32 males (45.7%) and 474 females (56.6%) in their respective age groups living below the poverty level.
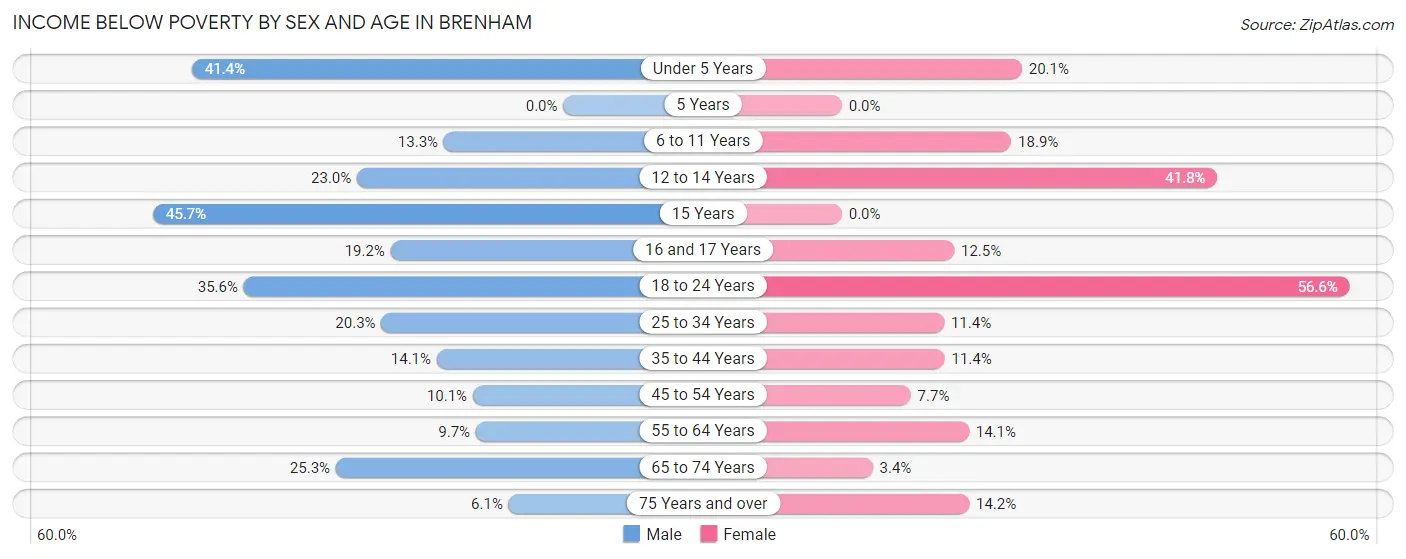
| Age Bracket | Male | Female |
| Under 5 Years | 252 (41.4%) | 88 (20.1%) |
| 5 Years | 0 (0.0%) | 0 (0.0%) |
| 6 to 11 Years | 96 (13.3%) | 182 (18.9%) |
| 12 to 14 Years | 82 (23.0%) | 64 (41.8%) |
| 15 Years | 32 (45.7%) | 0 (0.0%) |
| 16 and 17 Years | 50 (19.2%) | 32 (12.5%) |
| 18 to 24 Years | 310 (35.6%) | 474 (56.6%) |
| 25 to 34 Years | 95 (20.3%) | 132 (11.4%) |
| 35 to 44 Years | 122 (14.1%) | 90 (11.4%) |
| 45 to 54 Years | 71 (10.1%) | 69 (7.7%) |
| 55 to 64 Years | 71 (9.7%) | 153 (14.1%) |
| 65 to 74 Years | 153 (25.3%) | 25 (3.4%) |
| 75 Years and over | 35 (6.1%) | 121 (14.2%) |
| Total | 1,369 (19.4%) | 1,430 (17.1%) |
Income Above Poverty by Sex and Age in Brenham
According to the poverty statistics in Brenham, males aged 5 years and females aged 5 years are the age groups that are most secure financially, with 100.0% of males and 100.0% of females in these age groups living above the poverty line.
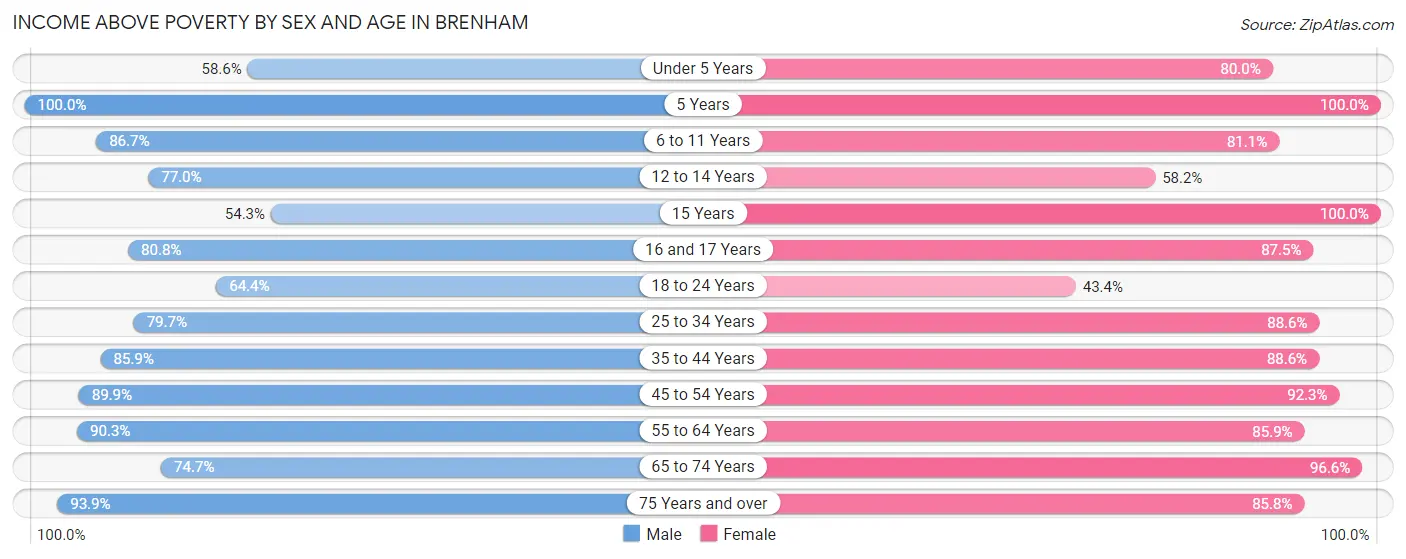
| Age Bracket | Male | Female |
| Under 5 Years | 357 (58.6%) | 351 (79.9%) |
| 5 Years | 207 (100.0%) | 123 (100.0%) |
| 6 to 11 Years | 626 (86.7%) | 783 (81.1%) |
| 12 to 14 Years | 275 (77.0%) | 89 (58.2%) |
| 15 Years | 38 (54.3%) | 86 (100.0%) |
| 16 and 17 Years | 210 (80.8%) | 224 (87.5%) |
| 18 to 24 Years | 561 (64.4%) | 364 (43.4%) |
| 25 to 34 Years | 374 (79.7%) | 1,028 (88.6%) |
| 35 to 44 Years | 744 (85.9%) | 697 (88.6%) |
| 45 to 54 Years | 634 (89.9%) | 831 (92.3%) |
| 55 to 64 Years | 658 (90.3%) | 929 (85.9%) |
| 65 to 74 Years | 451 (74.7%) | 703 (96.6%) |
| 75 Years and over | 541 (93.9%) | 733 (85.8%) |
| Total | 5,676 (80.6%) | 6,941 (82.9%) |
Income Below Poverty Among Married-Couple Families in Brenham
The poverty statistics for married-couple families in Brenham show that 6.9% or 179 of the total 2,612 families live below the poverty line. Families with no children have the highest poverty rate of 8.1%, comprising of 121 families. On the other hand, families with 3 or 4 children have the lowest poverty rate of 0.0%, which includes 0 families.
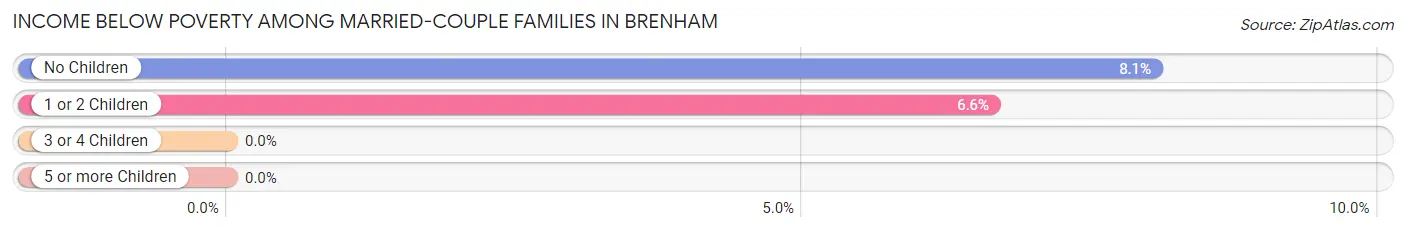
| Children | Above Poverty | Below Poverty |
| No Children | 1,382 (91.9%) | 121 (8.1%) |
| 1 or 2 Children | 816 (93.4%) | 58 (6.6%) |
| 3 or 4 Children | 227 (100.0%) | 0 (0.0%) |
| 5 or more Children | 8 (100.0%) | 0 (0.0%) |
| Total | 2,433 (93.1%) | 179 (6.9%) |
Income Below Poverty Among Single-Parent Households in Brenham
According to the poverty data in Brenham, 19.5% or 51 single-father households and 34.7% or 248 single-mother households are living below the poverty line. Among single-father households, those with no children have the highest poverty rate, with 31 households (23.3%) experiencing poverty. Likewise, among single-mother households, those with 3 or 4 children have the highest poverty rate, with 62 households (100.0%) falling below the poverty line.
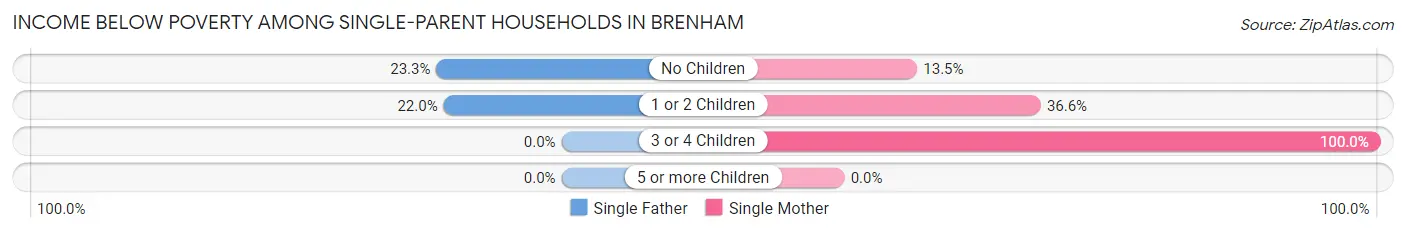
| Children | Single Father | Single Mother |
| No Children | 31 (23.3%) | 31 (13.5%) |
| 1 or 2 Children | 20 (22.0%) | 155 (36.6%) |
| 3 or 4 Children | 0 (0.0%) | 62 (100.0%) |
| 5 or more Children | 0 (0.0%) | 0 (0.0%) |
| Total | 51 (19.5%) | 248 (34.7%) |
Income Below Poverty Among Married-Couple vs Single-Parent Households in Brenham
The poverty data for Brenham shows that 179 of the married-couple family households (6.9%) and 299 of the single-parent households (30.6%) are living below the poverty level. Within the married-couple family households, those with no children have the highest poverty rate, with 121 households (8.1%) falling below the poverty line. Among the single-parent households, those with 3 or 4 children have the highest poverty rate, with 62 household (80.5%) living below poverty.
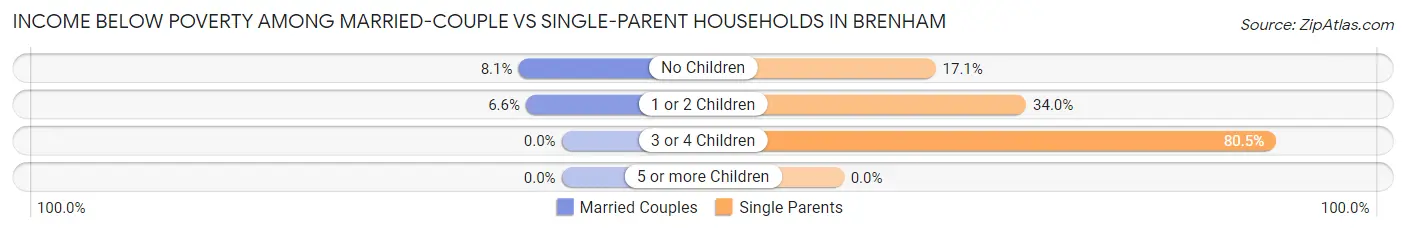
| Children | Married-Couple Families | Single-Parent Households |
| No Children | 121 (8.1%) | 62 (17.1%) |
| 1 or 2 Children | 58 (6.6%) | 175 (34.0%) |
| 3 or 4 Children | 0 (0.0%) | 62 (80.5%) |
| 5 or more Children | 0 (0.0%) | 0 (0.0%) |
| Total | 179 (6.9%) | 299 (30.6%) |
Race in Brenham
The most populous races in Brenham are White / Caucasian (10,410 | 59.0%), Black / African American (4,643 | 26.3%), and Hispanic or Latino (4,261 | 24.1%).
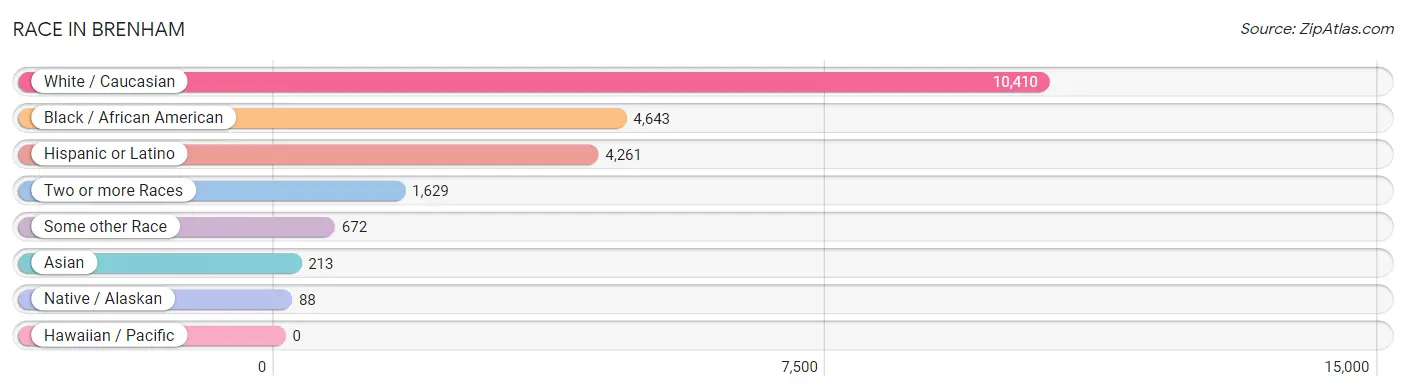
| Race | # Population | % Population |
| Asian | 213 | 1.2% |
| Black / African American | 4,643 | 26.3% |
| Hawaiian / Pacific | 0 | 0.0% |
| Hispanic or Latino | 4,261 | 24.1% |
| Native / Alaskan | 88 | 0.5% |
| White / Caucasian | 10,410 | 59.0% |
| Two or more Races | 1,629 | 9.2% |
| Some other Race | 672 | 3.8% |
| Total | 17,655 | 100.0% |
Ancestry in Brenham
The most populous ancestries reported in Brenham are Mexican (3,923 | 22.2%), German (3,372 | 19.1%), Irish (1,335 | 7.6%), American (720 | 4.1%), and English (583 | 3.3%), together accounting for 56.3% of all Brenham residents.
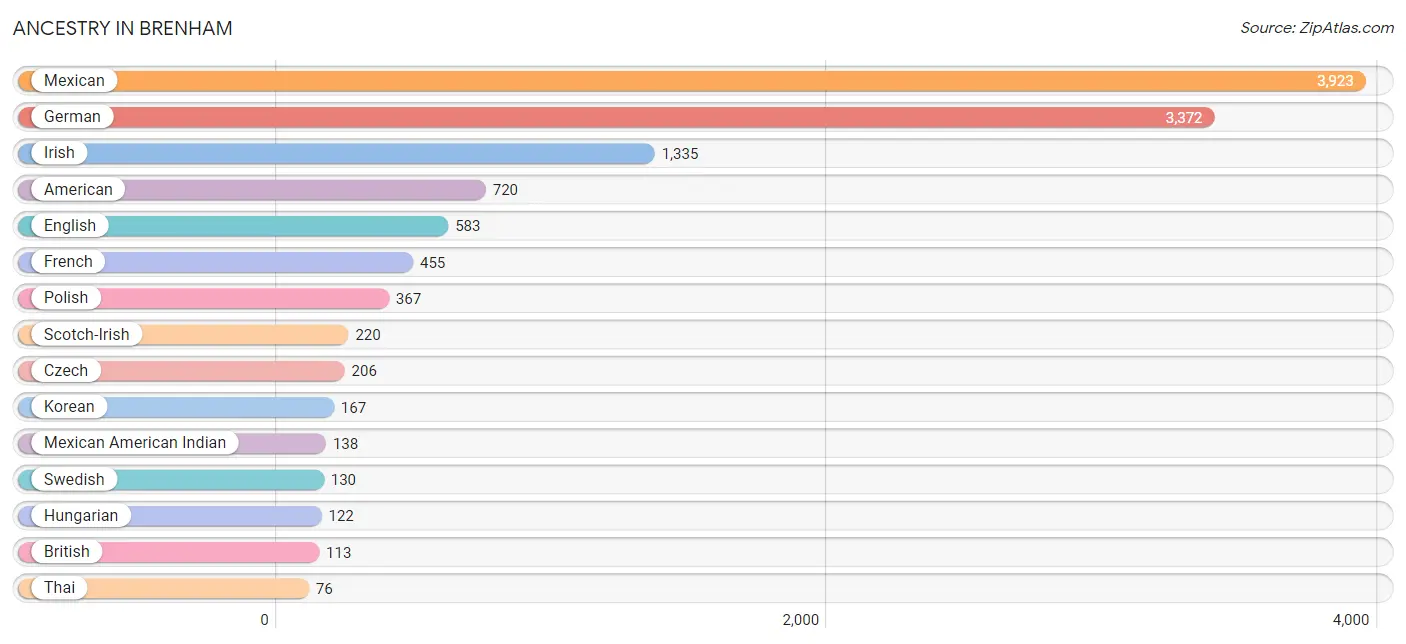
| Ancestry | # Population | % Population |
| African | 16 | 0.1% |
| American | 720 | 4.1% |
| Arab | 28 | 0.2% |
| Argentinean | 58 | 0.3% |
| Belgian | 14 | 0.1% |
| Belizean | 51 | 0.3% |
| Blackfeet | 23 | 0.1% |
| British | 113 | 0.6% |
| Bulgarian | 30 | 0.2% |
| Burmese | 60 | 0.3% |
| Cajun | 20 | 0.1% |
| Canadian | 29 | 0.2% |
| Central American | 48 | 0.3% |
| Cherokee | 15 | 0.1% |
| Chippewa | 3 | 0.0% |
| Choctaw | 5 | 0.0% |
| Czech | 206 | 1.2% |
| Czechoslovakian | 27 | 0.2% |
| Danish | 10 | 0.1% |
| Dutch | 40 | 0.2% |
| Egyptian | 15 | 0.1% |
| English | 583 | 3.3% |
| European | 59 | 0.3% |
| Filipino | 6 | 0.0% |
| French | 455 | 2.6% |
| French Canadian | 15 | 0.1% |
| German | 3,372 | 19.1% |
| Greek | 24 | 0.1% |
| Hungarian | 122 | 0.7% |
| Indian (Asian) | 29 | 0.2% |
| Irish | 1,335 | 7.6% |
| Italian | 55 | 0.3% |
| Korean | 167 | 0.9% |
| Lebanese | 13 | 0.1% |
| Lithuanian | 4 | 0.0% |
| Mexican | 3,923 | 22.2% |
| Mexican American Indian | 138 | 0.8% |
| Nigerian | 2 | 0.0% |
| Norwegian | 44 | 0.3% |
| Polish | 367 | 2.1% |
| Portuguese | 10 | 0.1% |
| Potawatomi | 15 | 0.1% |
| Puerto Rican | 49 | 0.3% |
| Salvadoran | 48 | 0.3% |
| Scotch-Irish | 220 | 1.3% |
| Scottish | 64 | 0.4% |
| South American | 58 | 0.3% |
| Spaniard | 37 | 0.2% |
| Spanish | 51 | 0.3% |
| Subsaharan African | 18 | 0.1% |
| Swedish | 130 | 0.7% |
| Swiss | 22 | 0.1% |
| Thai | 76 | 0.4% |
| Turkish | 28 | 0.2% |
| Ukrainian | 27 | 0.2% |
| Welsh | 31 | 0.2% | View All 56 Rows |
Immigrants in Brenham
The most numerous immigrant groups reported in Brenham came from Latin America (709 | 4.0%), Central America (699 | 4.0%), Mexico (626 | 3.5%), Asia (182 | 1.0%), and India (76 | 0.4%), together accounting for 13.0% of all Brenham residents.
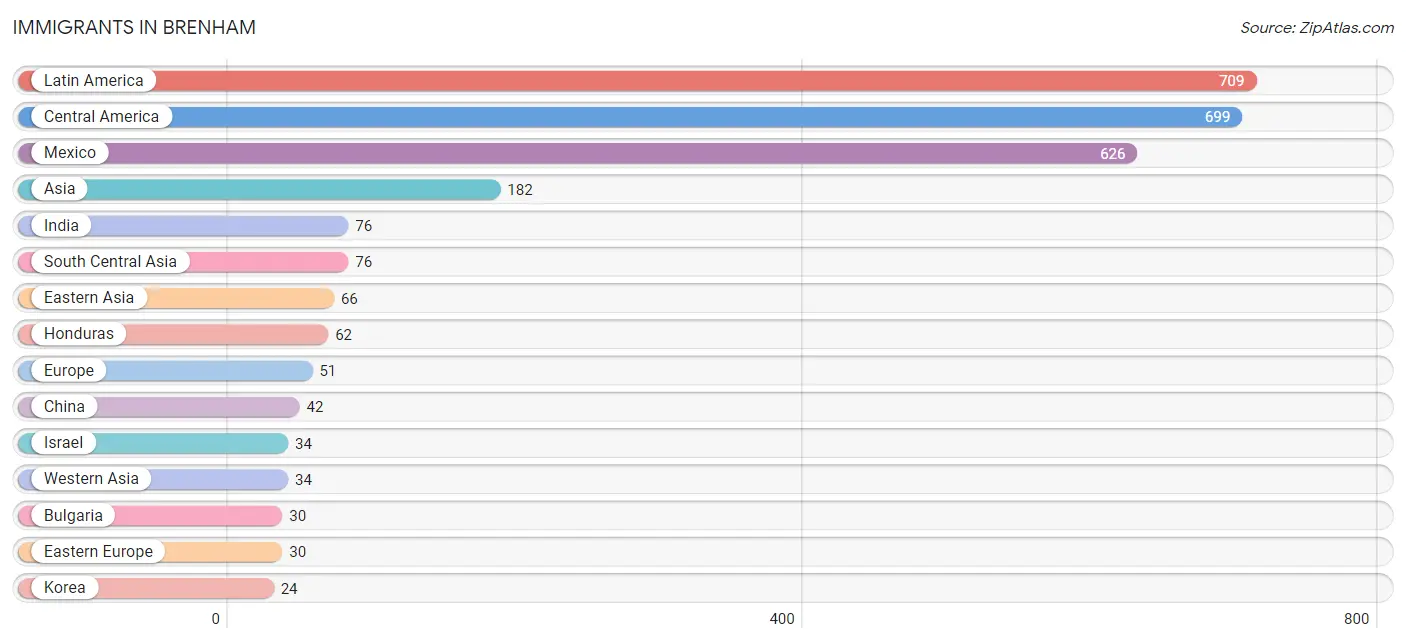
| Immigration Origin | # Population | % Population |
| Asia | 182 | 1.0% |
| Belgium | 14 | 0.1% |
| Brazil | 10 | 0.1% |
| Bulgaria | 30 | 0.2% |
| Canada | 4 | 0.0% |
| Central America | 699 | 4.0% |
| China | 42 | 0.2% |
| Eastern Asia | 66 | 0.4% |
| Eastern Europe | 30 | 0.2% |
| England | 7 | 0.0% |
| Europe | 51 | 0.3% |
| Guatemala | 11 | 0.1% |
| Honduras | 62 | 0.4% |
| India | 76 | 0.4% |
| Israel | 34 | 0.2% |
| Korea | 24 | 0.1% |
| Latin America | 709 | 4.0% |
| Mexico | 626 | 3.5% |
| Northern Europe | 7 | 0.0% |
| Philippines | 6 | 0.0% |
| South America | 10 | 0.1% |
| South Central Asia | 76 | 0.4% |
| South Eastern Asia | 6 | 0.0% |
| Taiwan | 18 | 0.1% |
| Western Asia | 34 | 0.2% |
| Western Europe | 14 | 0.1% | View All 26 Rows |
Sex and Age in Brenham
Sex and Age in Brenham
The most populous age groups in Brenham are 15 to 19 Years (1,078 | 13.2%) for men and 15 to 19 Years (1,084 | 11.4%) for women.
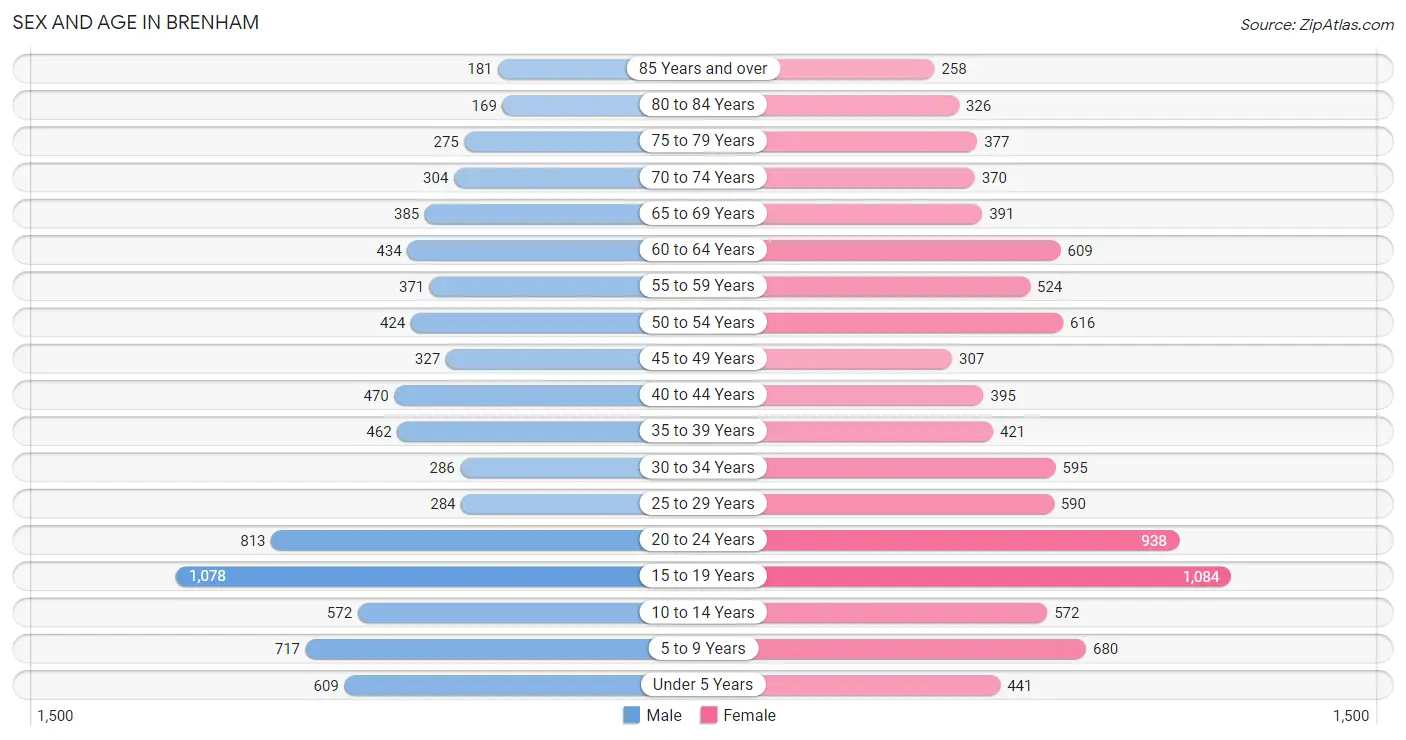
| Age Bracket | Male | Female |
| Under 5 Years | 609 (7.5%) | 441 (4.6%) |
| 5 to 9 Years | 717 (8.8%) | 680 (7.2%) |
| 10 to 14 Years | 572 (7.0%) | 572 (6.0%) |
| 15 to 19 Years | 1,078 (13.2%) | 1,084 (11.4%) |
| 20 to 24 Years | 813 (10.0%) | 938 (9.9%) |
| 25 to 29 Years | 284 (3.5%) | 590 (6.2%) |
| 30 to 34 Years | 286 (3.5%) | 595 (6.3%) |
| 35 to 39 Years | 462 (5.7%) | 421 (4.4%) |
| 40 to 44 Years | 470 (5.8%) | 395 (4.2%) |
| 45 to 49 Years | 327 (4.0%) | 307 (3.2%) |
| 50 to 54 Years | 424 (5.2%) | 616 (6.5%) |
| 55 to 59 Years | 371 (4.5%) | 524 (5.5%) |
| 60 to 64 Years | 434 (5.3%) | 609 (6.4%) |
| 65 to 69 Years | 385 (4.7%) | 391 (4.1%) |
| 70 to 74 Years | 304 (3.7%) | 370 (3.9%) |
| 75 to 79 Years | 275 (3.4%) | 377 (4.0%) |
| 80 to 84 Years | 169 (2.1%) | 326 (3.4%) |
| 85 Years and over | 181 (2.2%) | 258 (2.7%) |
| Total | 8,161 (100.0%) | 9,494 (100.0%) |
Families and Households in Brenham
Median Family Size in Brenham
The median family size in Brenham is 3.25 persons per family, with married-couple families (2,612 | 72.8%) accounting for the largest median family size of 3.28 persons per family. On the other hand, single male/father families (261 | 7.3%) represent the smallest median family size with 2.95 persons per family.
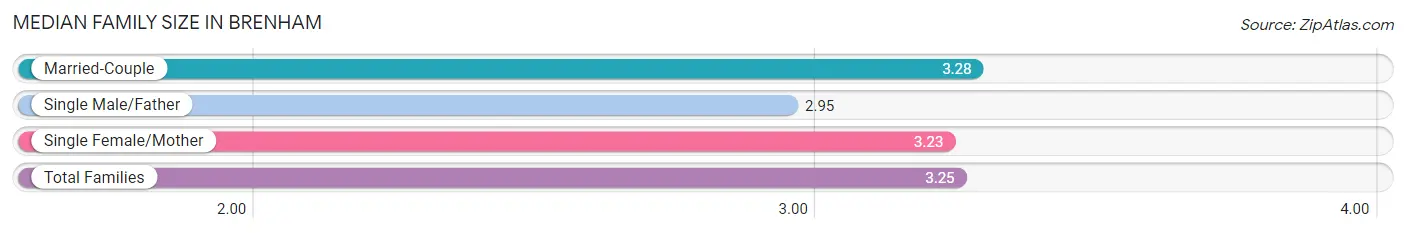
| Family Type | # Families | Family Size |
| Married-Couple | 2,612 (72.8%) | 3.28 |
| Single Male/Father | 261 (7.3%) | 2.95 |
| Single Female/Mother | 715 (19.9%) | 3.23 |
| Total Families | 3,588 (100.0%) | 3.25 |
Median Household Size in Brenham
The median household size in Brenham is 2.29 persons per household, with single female/mother households (715 | 10.7%) accounting for the largest median household size of 3.33 persons per household. non-family households (3,080 | 46.2%) represent the smallest median household size with 1.13 persons per household.
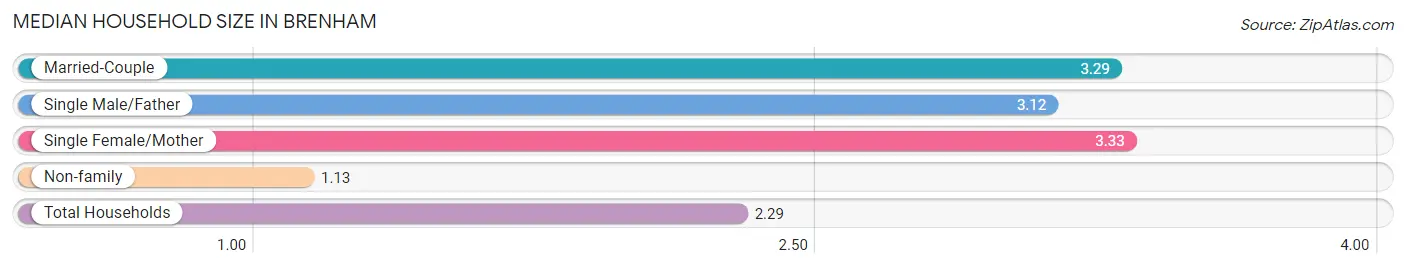
| Household Type | # Households | Household Size |
| Married-Couple | 2,612 (39.2%) | 3.29 |
| Single Male/Father | 261 (3.9%) | 3.12 |
| Single Female/Mother | 715 (10.7%) | 3.33 |
| Non-family | 3,080 (46.2%) | 1.13 |
| Total Households | 6,668 (100.0%) | 2.29 |
Household Size by Marriage Status in Brenham
Out of a total of 6,668 households in Brenham, 3,588 (53.8%) are family households, while 3,080 (46.2%) are nonfamily households. The most numerous type of family households are 2-person households, comprising 1,742, and the most common type of nonfamily households are 1-person households, comprising 2,534.
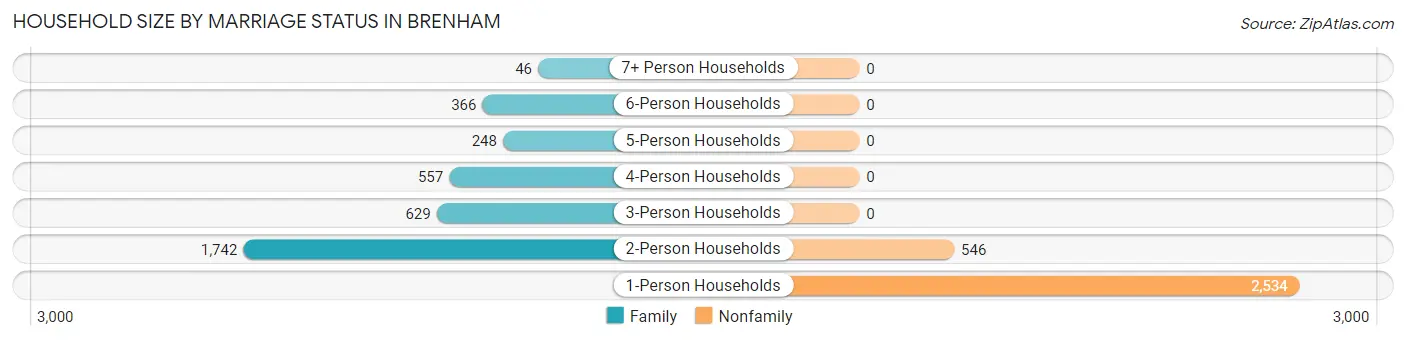
| Household Size | Family Households | Nonfamily Households |
| 1-Person Households | - | 2,534 (38.0%) |
| 2-Person Households | 1,742 (26.1%) | 546 (8.2%) |
| 3-Person Households | 629 (9.4%) | 0 (0.0%) |
| 4-Person Households | 557 (8.4%) | 0 (0.0%) |
| 5-Person Households | 248 (3.7%) | 0 (0.0%) |
| 6-Person Households | 366 (5.5%) | 0 (0.0%) |
| 7+ Person Households | 46 (0.7%) | 0 (0.0%) |
| Total | 3,588 (53.8%) | 3,080 (46.2%) |
Female Fertility in Brenham
Fertility by Age in Brenham
Average fertility rate in Brenham is 50.0 births per 1,000 women. Women in the age bracket of 20 to 34 years have the highest fertility rate with 84.0 births per 1,000 women. Women in the age bracket of 20 to 34 years acount for 78.4% of all women with births.
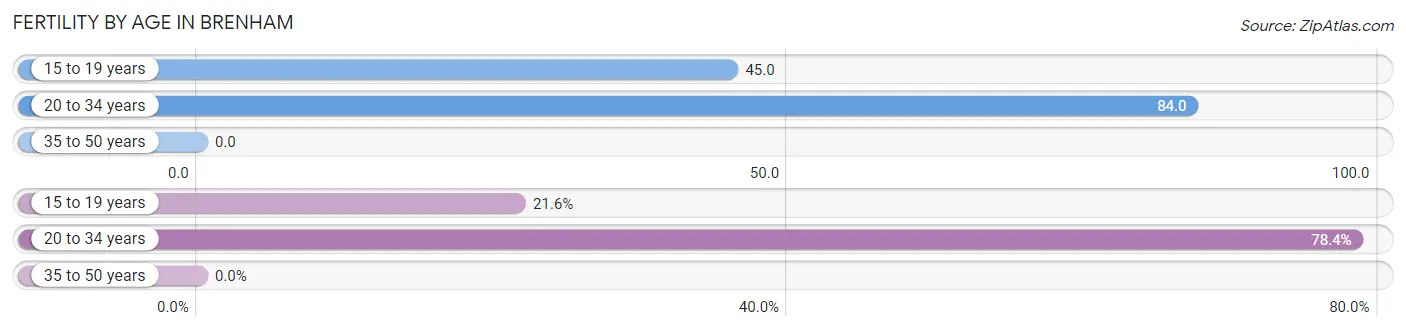
| Age Bracket | Women with Births | Births / 1,000 Women |
| 15 to 19 years | 49 (21.6%) | 45.0 |
| 20 to 34 years | 178 (78.4%) | 84.0 |
| 35 to 50 years | 0 (0.0%) | 0.0 |
| Total | 227 (100.0%) | 50.0 |
Fertility by Age by Marriage Status in Brenham
41.4% of women with births (227) in Brenham are married. The highest percentage of unmarried women with births falls into 15 to 19 years age bracket with 100.0% of them unmarried at the time of birth, while the lowest percentage of unmarried women with births belong to 20 to 34 years age bracket with 47.2% of them unmarried.
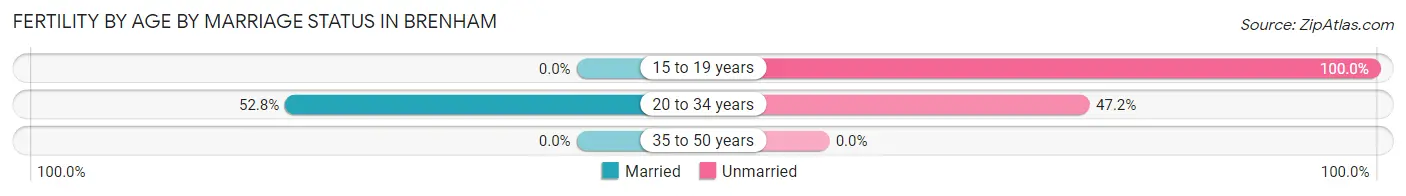
| Age Bracket | Married | Unmarried |
| 15 to 19 years | 0 (0.0%) | 49 (100.0%) |
| 20 to 34 years | 94 (52.8%) | 84 (47.2%) |
| 35 to 50 years | 0 (0.0%) | 0 (0.0%) |
| Total | 94 (41.4%) | 133 (58.6%) |
Fertility by Education in Brenham
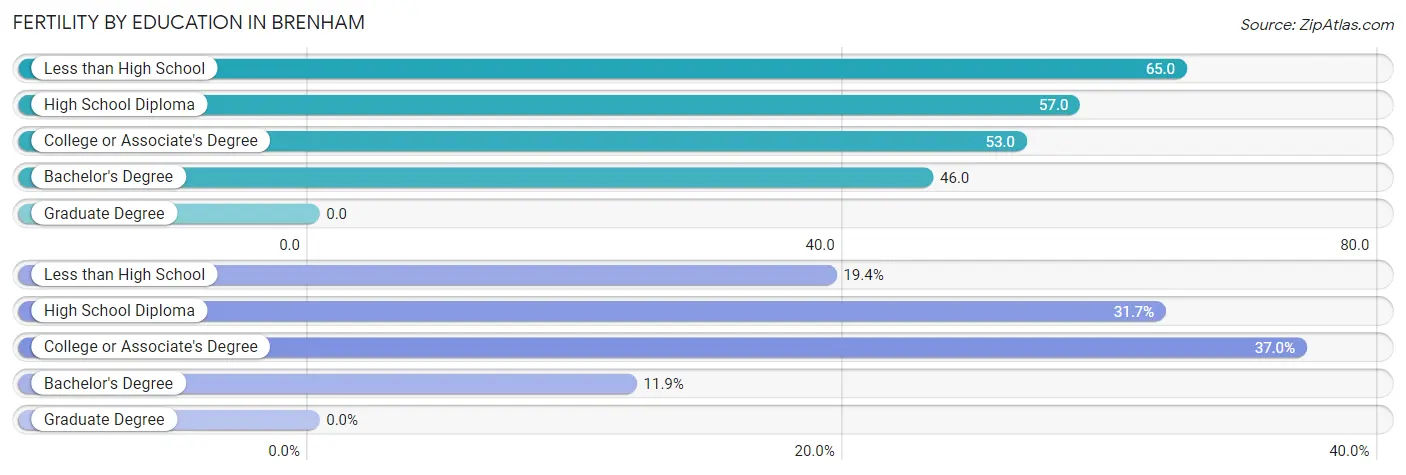
| Educational Attainment | Women with Births | Births / 1,000 Women |
| Less than High School | 44 (19.4%) | 65.0 |
| High School Diploma | 72 (31.7%) | 57.0 |
| College or Associate's Degree | 84 (37.0%) | 53.0 |
| Bachelor's Degree | 27 (11.9%) | 46.0 |
| Graduate Degree | 0 (0.0%) | 0.0 |
| Total | 227 (100.0%) | 50.0 |
Fertility by Education by Marriage Status in Brenham
58.6% of women with births in Brenham are unmarried. Women with the educational attainment of less than high school are most likely to be married with 100.0% of them married at childbirth, while women with the educational attainment of college or associate's degree are least likely to be married with 100.0% of them unmarried at childbirth.
| Educational Attainment | Married | Unmarried |
| Less than High School | 44 (100.0%) | 0 (0.0%) |
| High School Diploma | 23 (31.9%) | 49 (68.1%) |
| College or Associate's Degree | 0 (0.0%) | 84 (100.0%) |
| Bachelor's Degree | 27 (100.0%) | 0 (0.0%) |
| Graduate Degree | 0 (0.0%) | 0 (0.0%) |
| Total | 94 (41.4%) | 133 (58.6%) |
Employment Characteristics in Brenham
Employment by Class of Employer in Brenham
Among the 7,258 employed individuals in Brenham, private company employees (4,676 | 64.4%), local government employees (683 | 9.4%), and state government employees (672 | 9.3%) make up the most common classes of employment.
| Employer Class | # Employees | % Employees |
| Private Company Employees | 4,676 | 64.4% |
| Self-Employed (Incorporated) | 250 | 3.4% |
| Self-Employed (Not Incorporated) | 403 | 5.6% |
| Not-for-profit Organizations | 548 | 7.5% |
| Local Government Employees | 683 | 9.4% |
| State Government Employees | 672 | 9.3% |
| Federal Government Employees | 26 | 0.4% |
| Unpaid Family Workers | 0 | 0.0% |
| Total | 7,258 | 100.0% |
Employment Status by Age in Brenham
According to the labor force statistics for Brenham, out of the total population over 16 years of age (13,908), 55.0% or 7,649 individuals are in the labor force, with 3.9% or 298 of them unemployed. The age group with the highest labor force participation rate is 25 to 29 years, with 89.0% or 778 individuals in the labor force. Within the labor force, the 16 to 19 years age range has the highest percentage of unemployed individuals, with 12.4% or 87 of them being unemployed.
| Age Bracket | In Labor Force | Unemployed |
| 16 to 19 Years | 698 (34.8%) | 87 (12.4%) |
| 20 to 24 Years | 1,149 (65.6%) | 28 (2.4%) |
| 25 to 29 Years | 778 (89.0%) | 0 (0.0%) |
| 30 to 34 Years | 669 (75.9%) | 24 (3.6%) |
| 35 to 44 Years | 1,479 (84.6%) | 75 (5.1%) |
| 45 to 54 Years | 1,302 (77.8%) | 47 (3.6%) |
| 55 to 59 Years | 585 (65.4%) | 25 (4.3%) |
| 60 to 64 Years | 542 (52.0%) | 3 (0.6%) |
| 65 to 74 Years | 373 (25.7%) | 3 (0.8%) |
| 75 Years and over | 81 (5.1%) | 6 (7.4%) |
| Total | 7,649 (55.0%) | 298 (3.9%) |
Employment Status by Educational Attainment in Brenham
According to labor force statistics for Brenham, 75.2% of individuals (5,350) out of the total population between 25 and 64 years of age (7,115) are in the labor force, with 3.3% or 177 of them being unemployed. The group with the highest labor force participation rate are those with the educational attainment of bachelor's degree or higher, with 85.9% or 1,689 individuals in the labor force. Within the labor force, individuals with less than high school education have the highest percentage of unemployment, with 5.0% or 24 of them being unemployed.
| Educational Attainment | In Labor Force | Unemployed |
| Less than High School | 478 (54.0%) | 44 (5.0%) |
| High School Diploma | 1,449 (65.6%) | 104 (4.7%) |
| College / Associate Degree | 1,739 (84.6%) | 86 (4.2%) |
| Bachelor's Degree or higher | 1,689 (85.9%) | 12 (0.6%) |
| Total | 5,350 (75.2%) | 235 (3.3%) |
Employment Occupations by Sex in Brenham
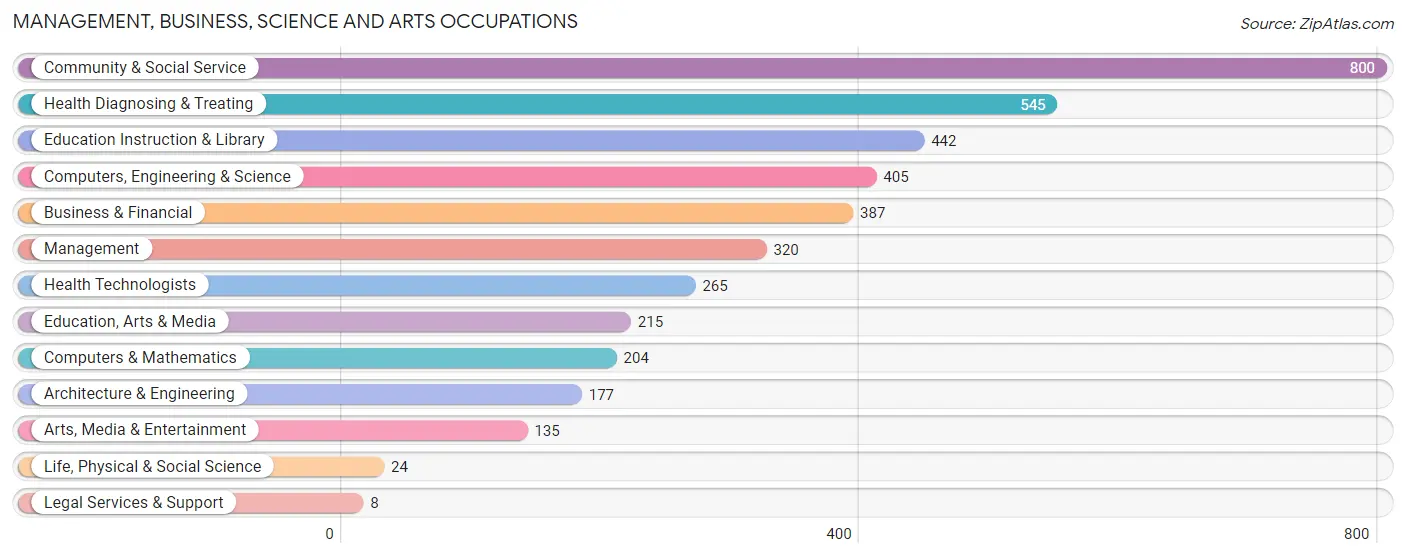
Management, Business, Science and Arts Occupations
The most common Management, Business, Science and Arts occupations in Brenham are Community & Social Service (800 | 10.9%), Health Diagnosing & Treating (545 | 7.4%), Education Instruction & Library (442 | 6.0%), Computers, Engineering & Science (405 | 5.5%), and Business & Financial (387 | 5.3%).
Management, Business, Science and Arts Occupations by Sex
Within the Management, Business, Science and Arts occupations in Brenham, the most male-oriented occupations are Architecture & Engineering (100.0%), Computers & Mathematics (92.6%), and Computers, Engineering & Science (90.4%), while the most female-oriented occupations are Life, Physical & Social Science (100.0%), Legal Services & Support (100.0%), and Business & Financial (95.9%).
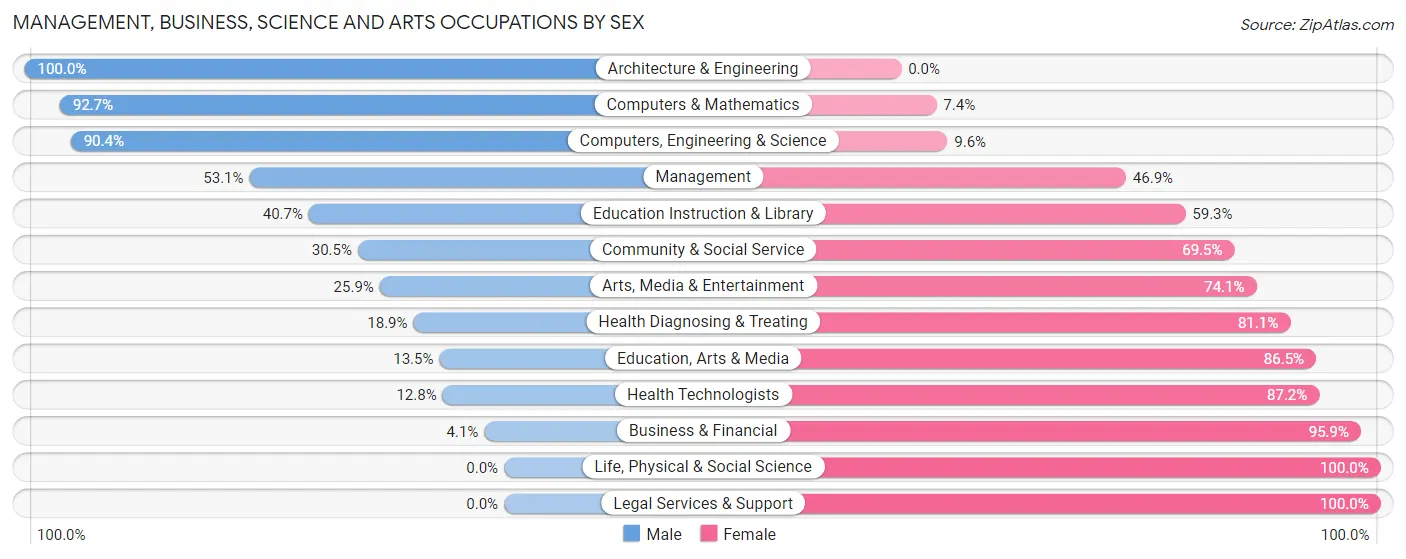
| Occupation | Male | Female |
| Management | 170 (53.1%) | 150 (46.9%) |
| Business & Financial | 16 (4.1%) | 371 (95.9%) |
| Computers, Engineering & Science | 366 (90.4%) | 39 (9.6%) |
| Computers & Mathematics | 189 (92.6%) | 15 (7.3%) |
| Architecture & Engineering | 177 (100.0%) | 0 (0.0%) |
| Life, Physical & Social Science | 0 (0.0%) | 24 (100.0%) |
| Community & Social Service | 244 (30.5%) | 556 (69.5%) |
| Education, Arts & Media | 29 (13.5%) | 186 (86.5%) |
| Legal Services & Support | 0 (0.0%) | 8 (100.0%) |
| Education Instruction & Library | 180 (40.7%) | 262 (59.3%) |
| Arts, Media & Entertainment | 35 (25.9%) | 100 (74.1%) |
| Health Diagnosing & Treating | 103 (18.9%) | 442 (81.1%) |
| Health Technologists | 34 (12.8%) | 231 (87.2%) |
| Total (Category) | 899 (36.6%) | 1,558 (63.4%) |
| Total (Overall) | 3,437 (46.7%) | 3,919 (53.3%) |
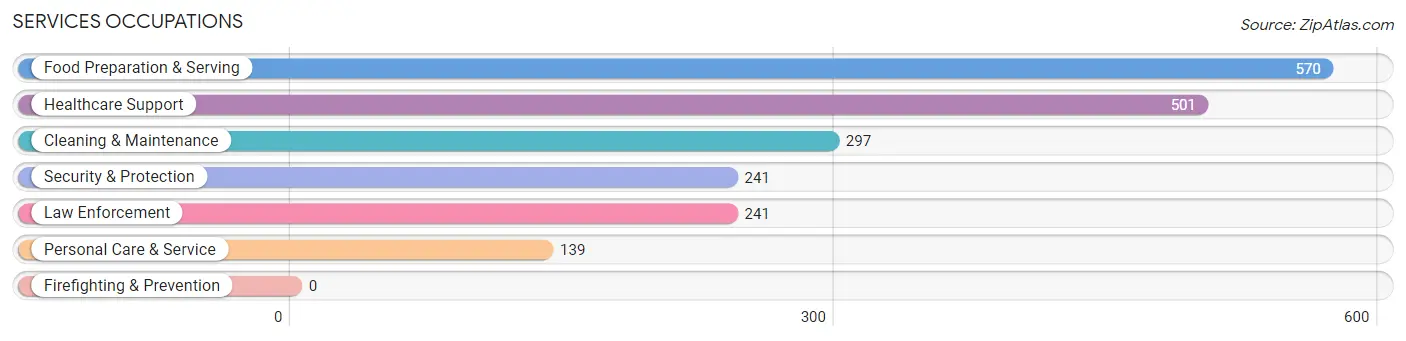
Services Occupations
The most common Services occupations in Brenham are Food Preparation & Serving (570 | 7.7%), Healthcare Support (501 | 6.8%), Cleaning & Maintenance (297 | 4.0%), Security & Protection (241 | 3.3%), and Law Enforcement (241 | 3.3%).
Services Occupations by Sex
Within the Services occupations in Brenham, the most male-oriented occupations are Security & Protection (82.2%), Law Enforcement (82.2%), and Cleaning & Maintenance (59.3%), while the most female-oriented occupations are Healthcare Support (93.2%), Food Preparation & Serving (70.2%), and Personal Care & Service (63.3%).
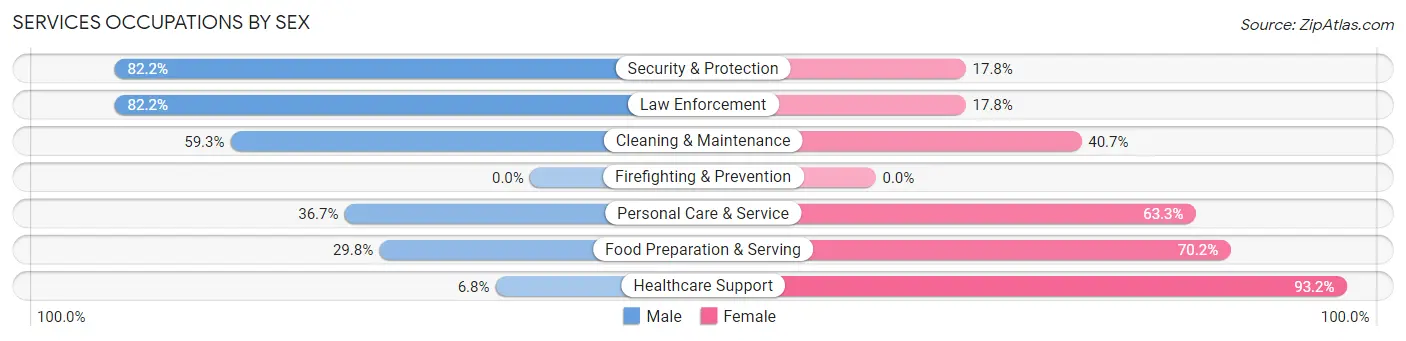
| Occupation | Male | Female |
| Healthcare Support | 34 (6.8%) | 467 (93.2%) |
| Security & Protection | 198 (82.2%) | 43 (17.8%) |
| Firefighting & Prevention | 0 (0.0%) | 0 (0.0%) |
| Law Enforcement | 198 (82.2%) | 43 (17.8%) |
| Food Preparation & Serving | 170 (29.8%) | 400 (70.2%) |
| Cleaning & Maintenance | 176 (59.3%) | 121 (40.7%) |
| Personal Care & Service | 51 (36.7%) | 88 (63.3%) |
| Total (Category) | 629 (36.0%) | 1,119 (64.0%) |
| Total (Overall) | 3,437 (46.7%) | 3,919 (53.3%) |
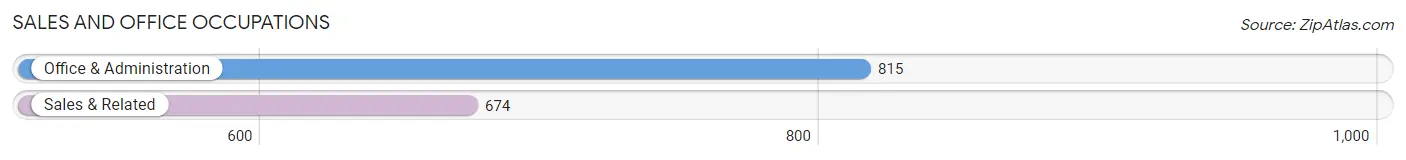
Sales and Office Occupations
The most common Sales and Office occupations in Brenham are Office & Administration (815 | 11.1%), and Sales & Related (674 | 9.2%).
Sales and Office Occupations by Sex
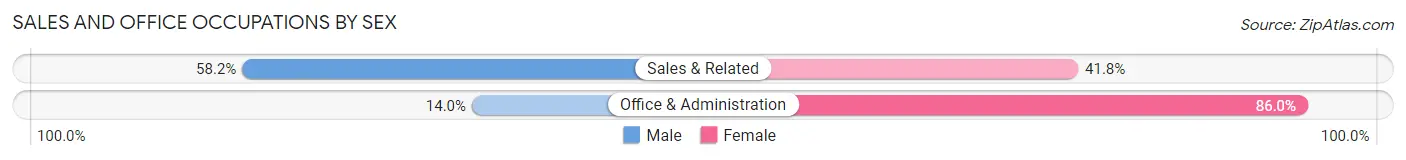
| Occupation | Male | Female |
| Sales & Related | 392 (58.2%) | 282 (41.8%) |
| Office & Administration | 114 (14.0%) | 701 (86.0%) |
| Total (Category) | 506 (34.0%) | 983 (66.0%) |
| Total (Overall) | 3,437 (46.7%) | 3,919 (53.3%) |
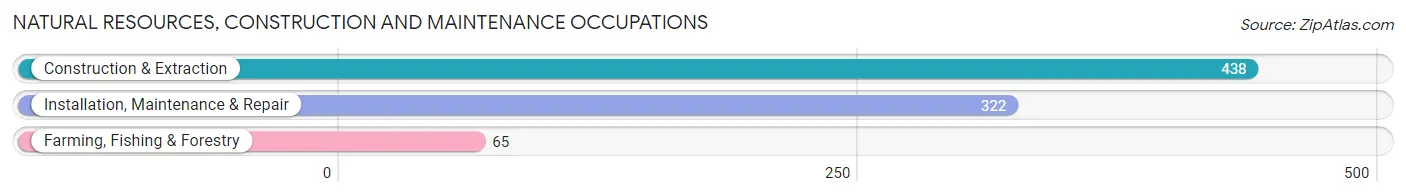
Natural Resources, Construction and Maintenance Occupations
The most common Natural Resources, Construction and Maintenance occupations in Brenham are Construction & Extraction (438 | 5.9%), Installation, Maintenance & Repair (322 | 4.4%), and Farming, Fishing & Forestry (65 | 0.9%).
Natural Resources, Construction and Maintenance Occupations by Sex
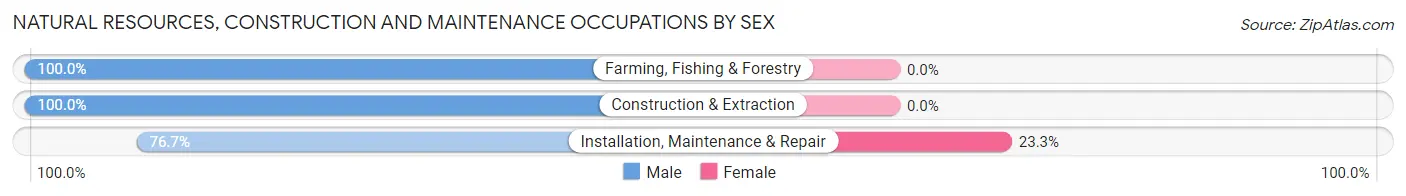
| Occupation | Male | Female |
| Farming, Fishing & Forestry | 65 (100.0%) | 0 (0.0%) |
| Construction & Extraction | 438 (100.0%) | 0 (0.0%) |
| Installation, Maintenance & Repair | 247 (76.7%) | 75 (23.3%) |
| Total (Category) | 750 (90.9%) | 75 (9.1%) |
| Total (Overall) | 3,437 (46.7%) | 3,919 (53.3%) |
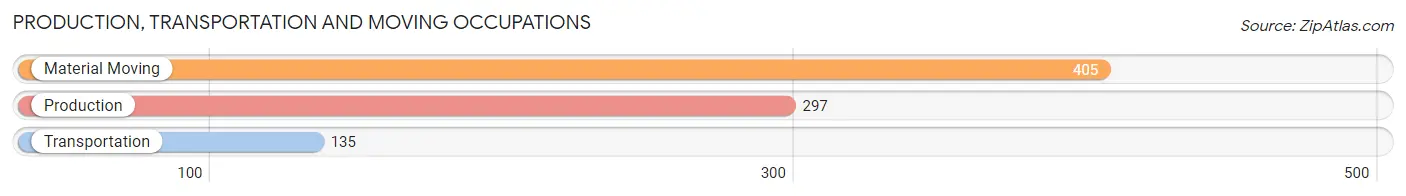
Production, Transportation and Moving Occupations
The most common Production, Transportation and Moving occupations in Brenham are Material Moving (405 | 5.5%), Production (297 | 4.0%), and Transportation (135 | 1.8%).
Production, Transportation and Moving Occupations by Sex
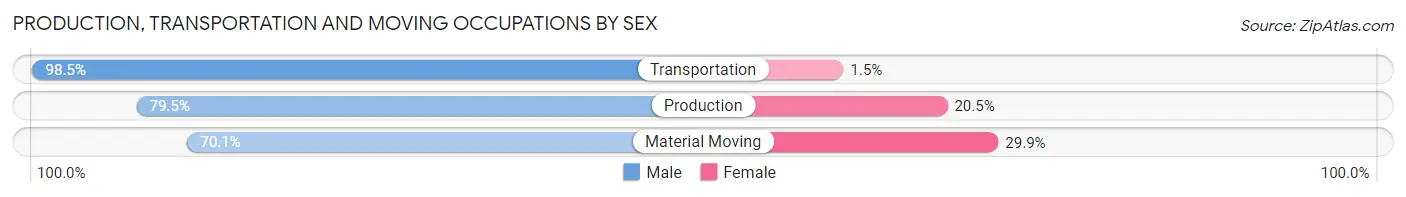
| Occupation | Male | Female |
| Production | 236 (79.5%) | 61 (20.5%) |
| Transportation | 133 (98.5%) | 2 (1.5%) |
| Material Moving | 284 (70.1%) | 121 (29.9%) |
| Total (Category) | 653 (78.0%) | 184 (22.0%) |
| Total (Overall) | 3,437 (46.7%) | 3,919 (53.3%) |
Employment Industries by Sex in Brenham
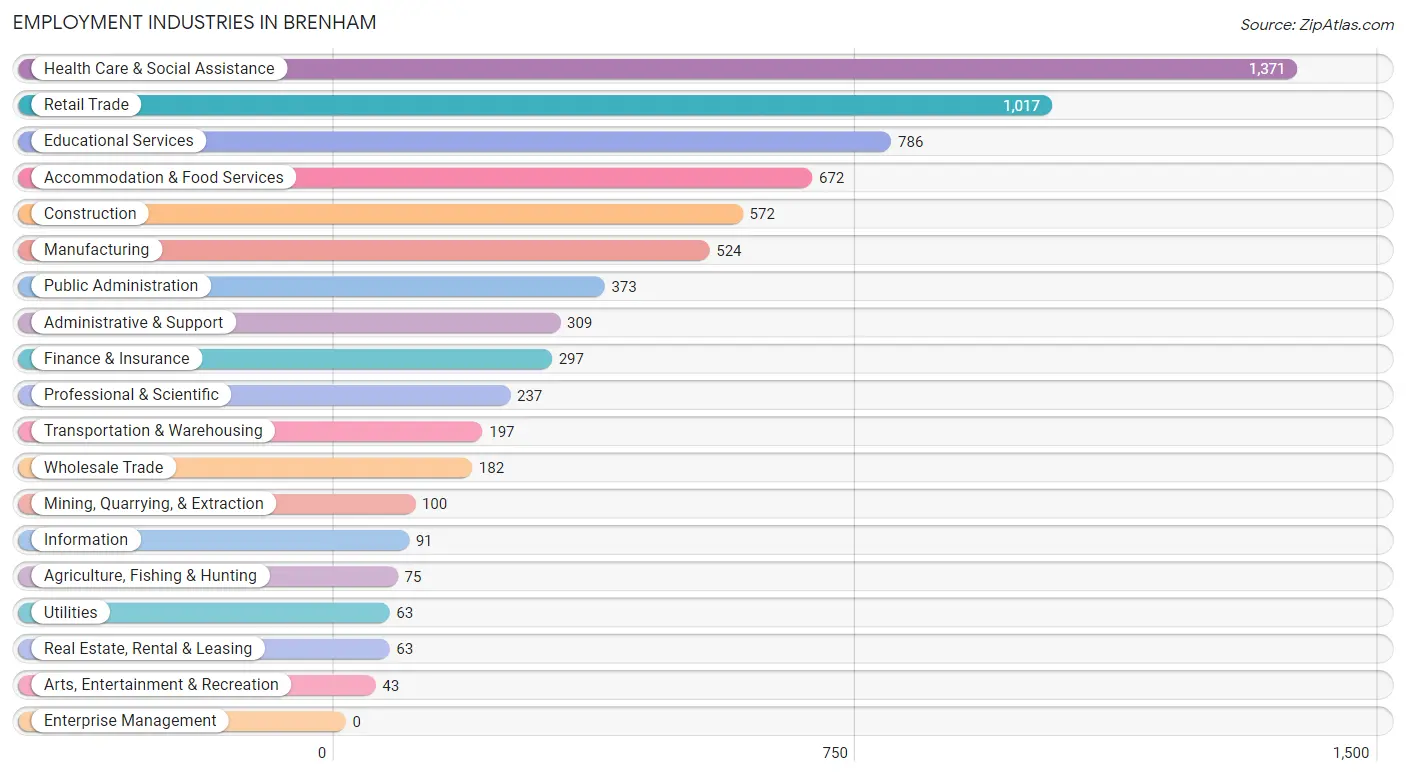
Employment Industries in Brenham
The major employment industries in Brenham include Health Care & Social Assistance (1,371 | 18.6%), Retail Trade (1,017 | 13.8%), Educational Services (786 | 10.7%), Accommodation & Food Services (672 | 9.1%), and Construction (572 | 7.8%).
Employment Industries by Sex in Brenham
The Brenham industries that see more men than women are Agriculture, Fishing & Hunting (100.0%), Mining, Quarrying, & Extraction (100.0%), and Utilities (100.0%), whereas the industries that tend to have a higher number of women are Finance & Insurance (85.9%), Health Care & Social Assistance (82.7%), and Information (80.2%).
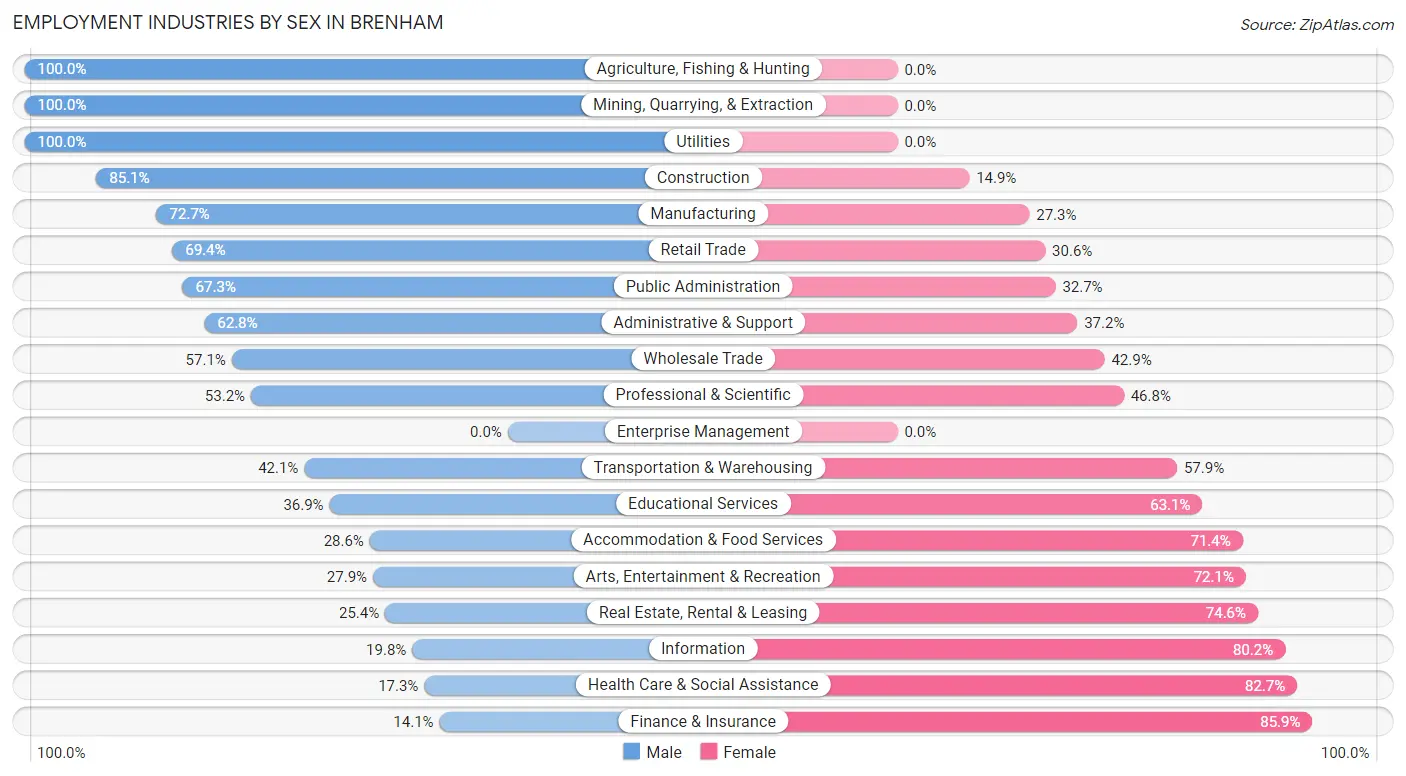
| Industry | Male | Female |
| Agriculture, Fishing & Hunting | 75 (100.0%) | 0 (0.0%) |
| Mining, Quarrying, & Extraction | 100 (100.0%) | 0 (0.0%) |
| Construction | 487 (85.1%) | 85 (14.9%) |
| Manufacturing | 381 (72.7%) | 143 (27.3%) |
| Wholesale Trade | 104 (57.1%) | 78 (42.9%) |
| Retail Trade | 706 (69.4%) | 311 (30.6%) |
| Transportation & Warehousing | 83 (42.1%) | 114 (57.9%) |
| Utilities | 63 (100.0%) | 0 (0.0%) |
| Information | 18 (19.8%) | 73 (80.2%) |
| Finance & Insurance | 42 (14.1%) | 255 (85.9%) |
| Real Estate, Rental & Leasing | 16 (25.4%) | 47 (74.6%) |
| Professional & Scientific | 126 (53.2%) | 111 (46.8%) |
| Enterprise Management | 0 (0.0%) | 0 (0.0%) |
| Administrative & Support | 194 (62.8%) | 115 (37.2%) |
| Educational Services | 290 (36.9%) | 496 (63.1%) |
| Health Care & Social Assistance | 237 (17.3%) | 1,134 (82.7%) |
| Arts, Entertainment & Recreation | 12 (27.9%) | 31 (72.1%) |
| Accommodation & Food Services | 192 (28.6%) | 480 (71.4%) |
| Public Administration | 251 (67.3%) | 122 (32.7%) |
| Total | 3,437 (46.7%) | 3,919 (53.3%) |
Education in Brenham
School Enrollment in Brenham
The most common levels of schooling among the 5,772 students in Brenham are college / undergraduate (1,793 | 31.1%), elementary school (1,201 | 20.8%), and high school (944 | 16.4%).
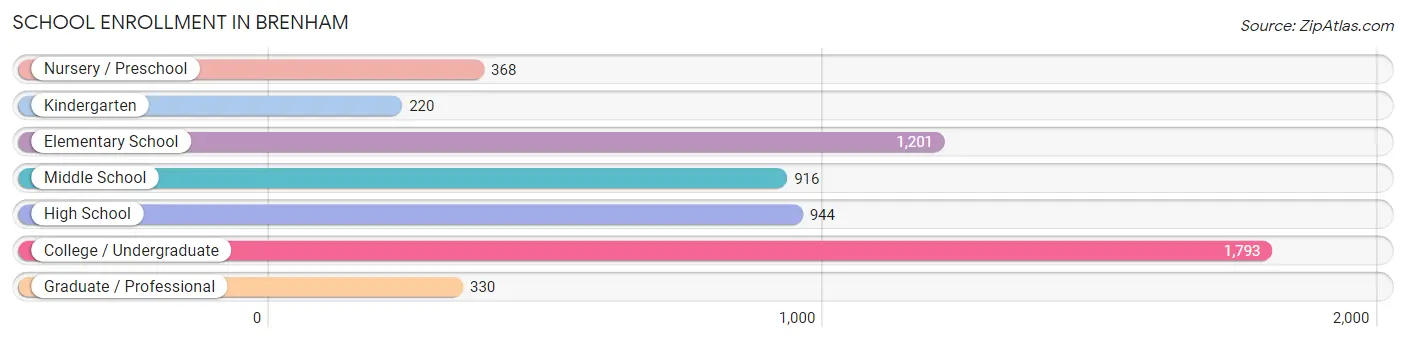
| School Level | # Students | % Students |
| Nursery / Preschool | 368 | 6.4% |
| Kindergarten | 220 | 3.8% |
| Elementary School | 1,201 | 20.8% |
| Middle School | 916 | 15.9% |
| High School | 944 | 16.4% |
| College / Undergraduate | 1,793 | 31.1% |
| Graduate / Professional | 330 | 5.7% |
| Total | 5,772 | 100.0% |
School Enrollment by Age by Funding Source in Brenham
Out of a total of 5,772 students who are enrolled in schools in Brenham, 733 (12.7%) attend a private institution, while the remaining 5,039 (87.3%) are enrolled in public schools. The age group of 5 to 9 year old has the highest likelihood of being enrolled in private schools, with 321 (23.4% in the age bracket) enrolled. Conversely, the age group of 25 to 34 year olds has the lowest likelihood of being enrolled in a private school, with 297 (100.0% in the age bracket) attending a public institution.
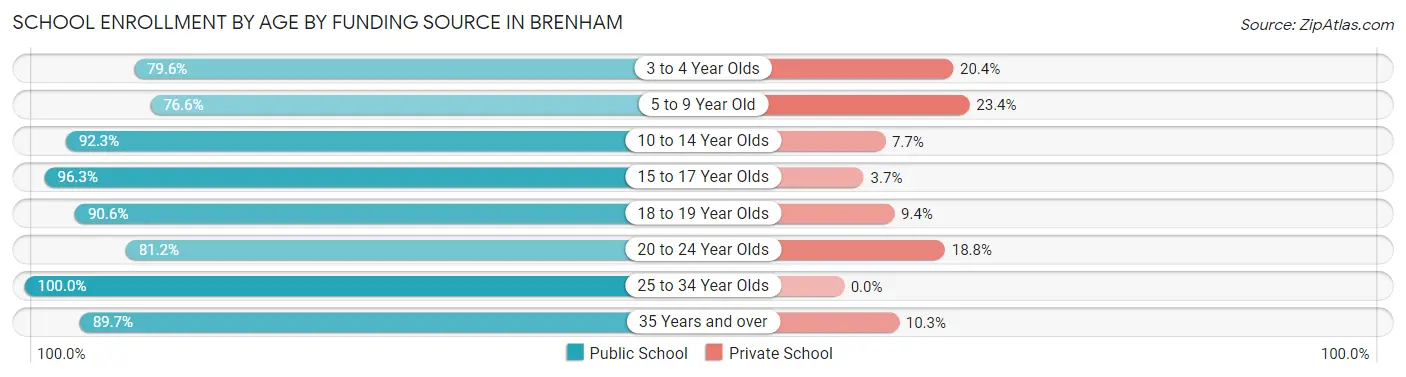
| Age Bracket | Public School | Private School |
| 3 to 4 Year Olds | 172 (79.6%) | 44 (20.4%) |
| 5 to 9 Year Old | 1,050 (76.6%) | 321 (23.4%) |
| 10 to 14 Year Olds | 1,056 (92.3%) | 88 (7.7%) |
| 15 to 17 Year Olds | 673 (96.3%) | 26 (3.7%) |
| 18 to 19 Year Olds | 1,023 (90.6%) | 106 (9.4%) |
| 20 to 24 Year Olds | 530 (81.2%) | 123 (18.8%) |
| 25 to 34 Year Olds | 297 (100.0%) | 0 (0.0%) |
| 35 Years and over | 236 (89.7%) | 27 (10.3%) |
| Total | 5,039 (87.3%) | 733 (12.7%) |
Educational Attainment by Field of Study in Brenham
Business (641 | 20.5%), education (590 | 18.9%), science & technology (391 | 12.5%), arts & humanities (236 | 7.6%), and bio, nature & agricultural (205 | 6.6%) are the most common fields of study among 3,121 individuals in Brenham who have obtained a bachelor's degree or higher.
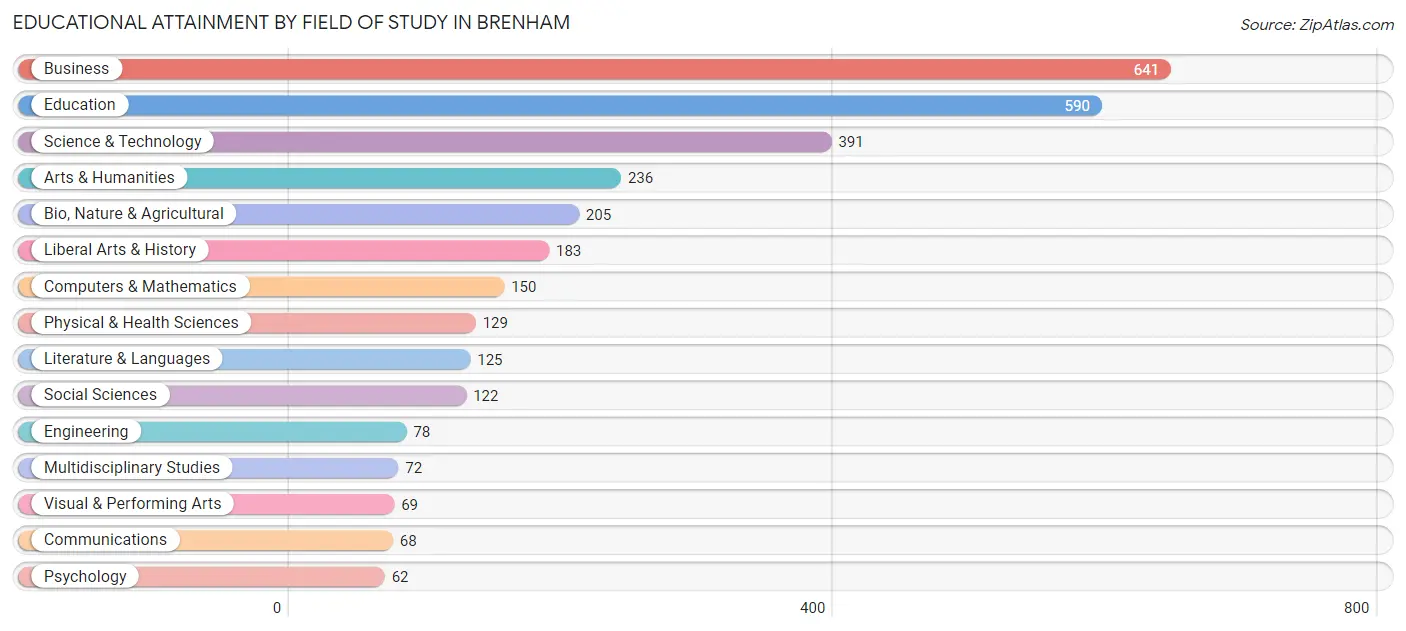
| Field of Study | # Graduates | % Graduates |
| Computers & Mathematics | 150 | 4.8% |
| Bio, Nature & Agricultural | 205 | 6.6% |
| Physical & Health Sciences | 129 | 4.1% |
| Psychology | 62 | 2.0% |
| Social Sciences | 122 | 3.9% |
| Engineering | 78 | 2.5% |
| Multidisciplinary Studies | 72 | 2.3% |
| Science & Technology | 391 | 12.5% |
| Business | 641 | 20.5% |
| Education | 590 | 18.9% |
| Literature & Languages | 125 | 4.0% |
| Liberal Arts & History | 183 | 5.9% |
| Visual & Performing Arts | 69 | 2.2% |
| Communications | 68 | 2.2% |
| Arts & Humanities | 236 | 7.6% |
| Total | 3,121 | 100.0% |
Transportation & Commute in Brenham
Vehicle Availability by Sex in Brenham
The most prevalent vehicle ownership categories in Brenham are males with 2 vehicles (1,041, accounting for 32.3%) and females with 2 vehicles (1,295, making up 27.8%).
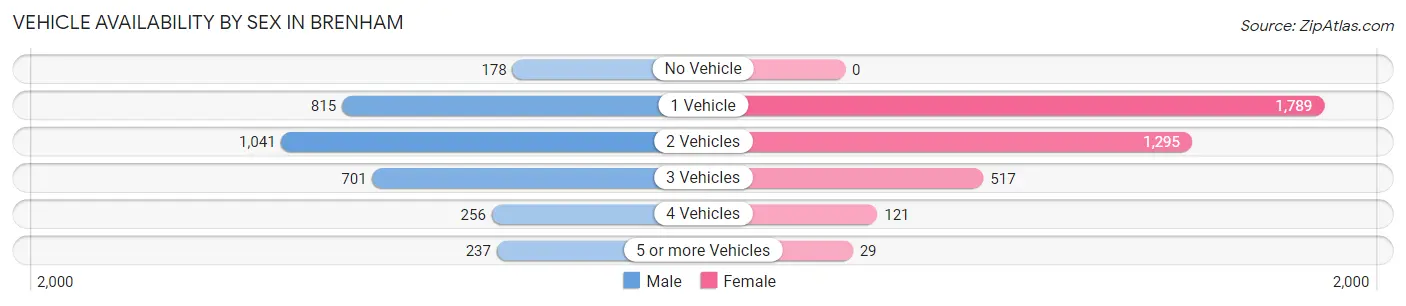
| Vehicles Available | Male | Female |
| No Vehicle | 178 (5.5%) | 0 (0.0%) |
| 1 Vehicle | 815 (25.3%) | 1,789 (47.7%) |
| 2 Vehicles | 1,041 (32.3%) | 1,295 (34.5%) |
| 3 Vehicles | 701 (21.7%) | 517 (13.8%) |
| 4 Vehicles | 256 (7.9%) | 121 (3.2%) |
| 5 or more Vehicles | 237 (7.3%) | 29 (0.8%) |
| Total | 3,228 (100.0%) | 3,751 (100.0%) |
Commute Time in Brenham
The most frequently occuring commute durations in Brenham are 5 to 9 minutes (2,267 commuters, 33.3%), 10 to 14 minutes (1,362 commuters, 20.0%), and 15 to 19 minutes (966 commuters, 14.2%).
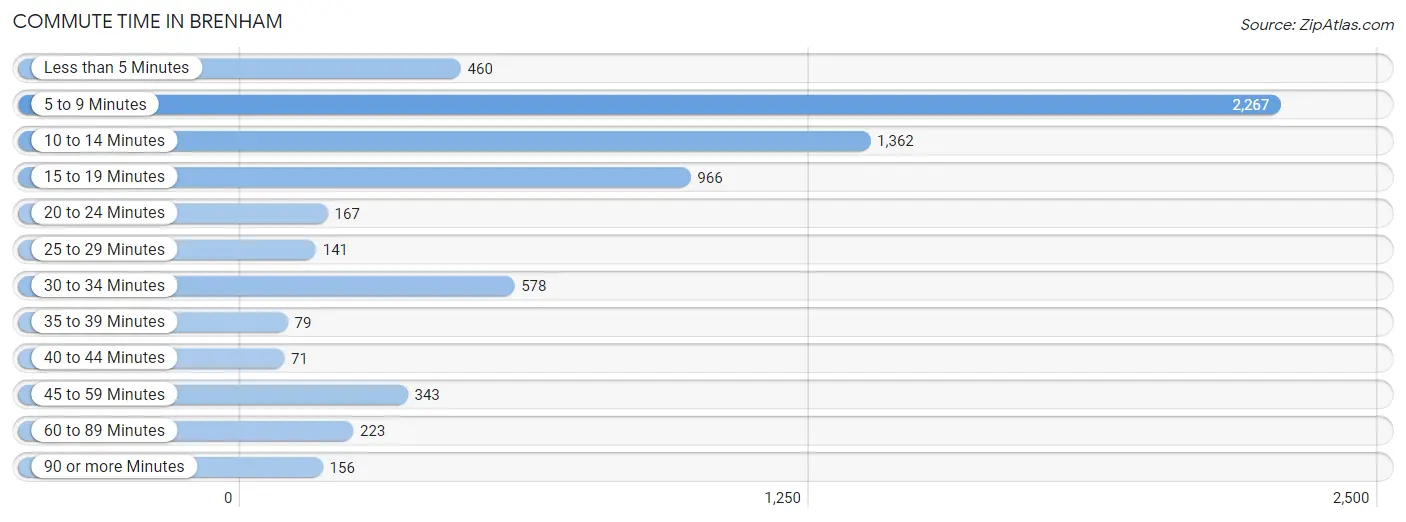
| Commute Time | # Commuters | % Commuters |
| Less than 5 Minutes | 460 | 6.8% |
| 5 to 9 Minutes | 2,267 | 33.3% |
| 10 to 14 Minutes | 1,362 | 20.0% |
| 15 to 19 Minutes | 966 | 14.2% |
| 20 to 24 Minutes | 167 | 2.5% |
| 25 to 29 Minutes | 141 | 2.1% |
| 30 to 34 Minutes | 578 | 8.5% |
| 35 to 39 Minutes | 79 | 1.2% |
| 40 to 44 Minutes | 71 | 1.0% |
| 45 to 59 Minutes | 343 | 5.0% |
| 60 to 89 Minutes | 223 | 3.3% |
| 90 or more Minutes | 156 | 2.3% |
Commute Time by Sex in Brenham
The most common commute times in Brenham are 5 to 9 minutes (950 commuters, 29.2%) for males and 5 to 9 minutes (1,317 commuters, 37.0%) for females.
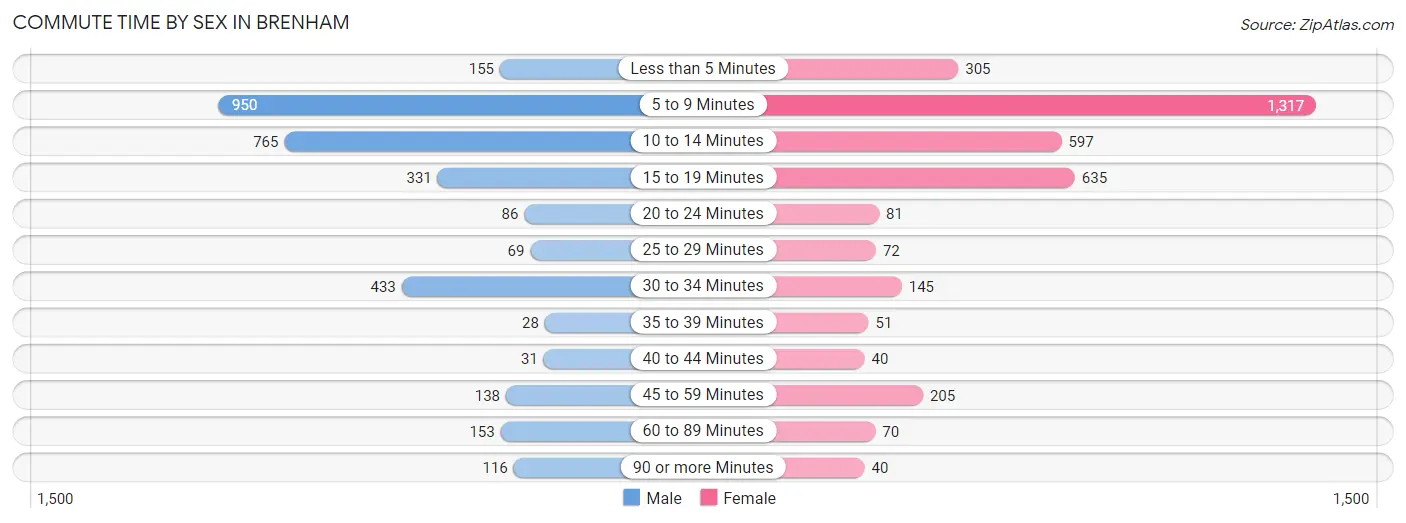
| Commute Time | Male | Female |
| Less than 5 Minutes | 155 (4.8%) | 305 (8.6%) |
| 5 to 9 Minutes | 950 (29.2%) | 1,317 (37.0%) |
| 10 to 14 Minutes | 765 (23.5%) | 597 (16.8%) |
| 15 to 19 Minutes | 331 (10.2%) | 635 (17.8%) |
| 20 to 24 Minutes | 86 (2.6%) | 81 (2.3%) |
| 25 to 29 Minutes | 69 (2.1%) | 72 (2.0%) |
| 30 to 34 Minutes | 433 (13.3%) | 145 (4.1%) |
| 35 to 39 Minutes | 28 (0.9%) | 51 (1.4%) |
| 40 to 44 Minutes | 31 (0.9%) | 40 (1.1%) |
| 45 to 59 Minutes | 138 (4.2%) | 205 (5.8%) |
| 60 to 89 Minutes | 153 (4.7%) | 70 (2.0%) |
| 90 or more Minutes | 116 (3.6%) | 40 (1.1%) |
Time of Departure to Work by Sex in Brenham
The most frequent times of departure to work in Brenham are 7:00 AM to 7:29 AM (776, 23.8%) for males and 7:30 AM to 7:59 AM (990, 27.8%) for females.
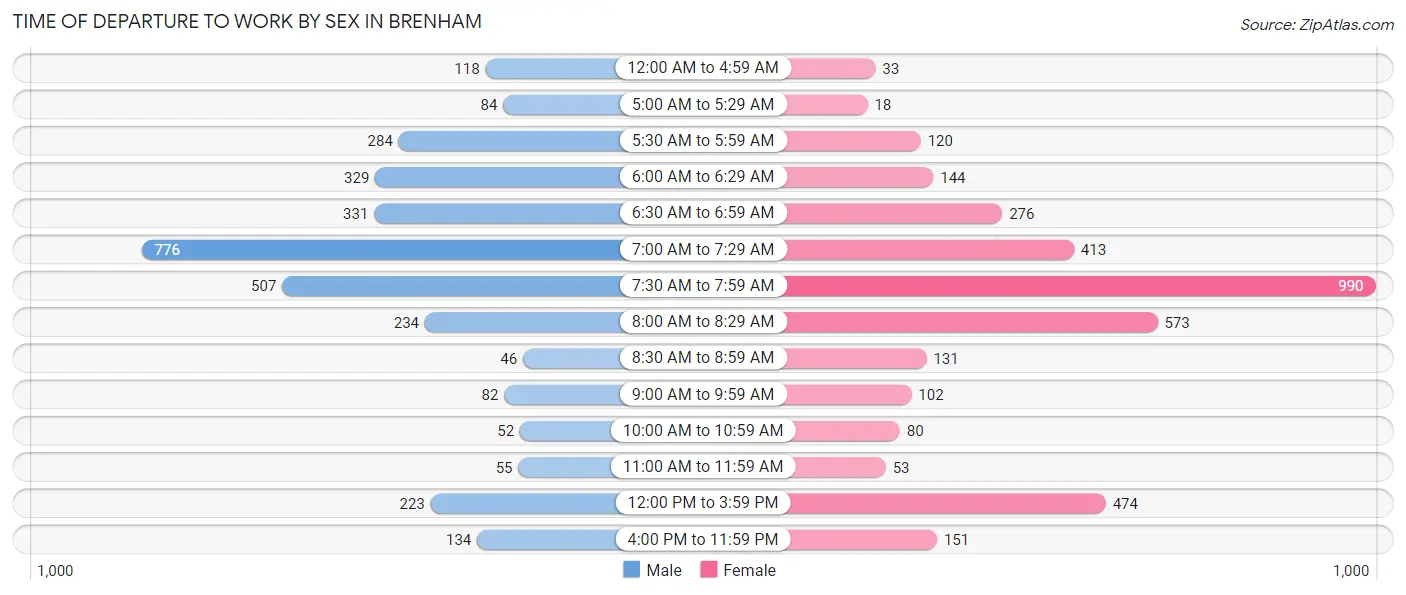
| Time of Departure | Male | Female |
| 12:00 AM to 4:59 AM | 118 (3.6%) | 33 (0.9%) |
| 5:00 AM to 5:29 AM | 84 (2.6%) | 18 (0.5%) |
| 5:30 AM to 5:59 AM | 284 (8.7%) | 120 (3.4%) |
| 6:00 AM to 6:29 AM | 329 (10.1%) | 144 (4.1%) |
| 6:30 AM to 6:59 AM | 331 (10.2%) | 276 (7.8%) |
| 7:00 AM to 7:29 AM | 776 (23.8%) | 413 (11.6%) |
| 7:30 AM to 7:59 AM | 507 (15.6%) | 990 (27.8%) |
| 8:00 AM to 8:29 AM | 234 (7.2%) | 573 (16.1%) |
| 8:30 AM to 8:59 AM | 46 (1.4%) | 131 (3.7%) |
| 9:00 AM to 9:59 AM | 82 (2.5%) | 102 (2.9%) |
| 10:00 AM to 10:59 AM | 52 (1.6%) | 80 (2.2%) |
| 11:00 AM to 11:59 AM | 55 (1.7%) | 53 (1.5%) |
| 12:00 PM to 3:59 PM | 223 (6.9%) | 474 (13.3%) |
| 4:00 PM to 11:59 PM | 134 (4.1%) | 151 (4.2%) |
| Total | 3,255 (100.0%) | 3,558 (100.0%) |
Housing Occupancy in Brenham
Occupancy by Ownership in Brenham
Of the total 6,668 dwellings in Brenham, owner-occupied units account for 3,815 (57.2%), while renter-occupied units make up 2,853 (42.8%).
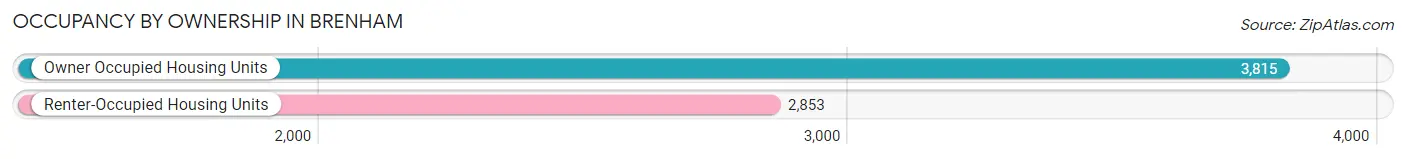
| Occupancy | # Housing Units | % Housing Units |
| Owner Occupied Housing Units | 3,815 | 57.2% |
| Renter-Occupied Housing Units | 2,853 | 42.8% |
| Total Occupied Housing Units | 6,668 | 100.0% |
Occupancy by Household Size in Brenham
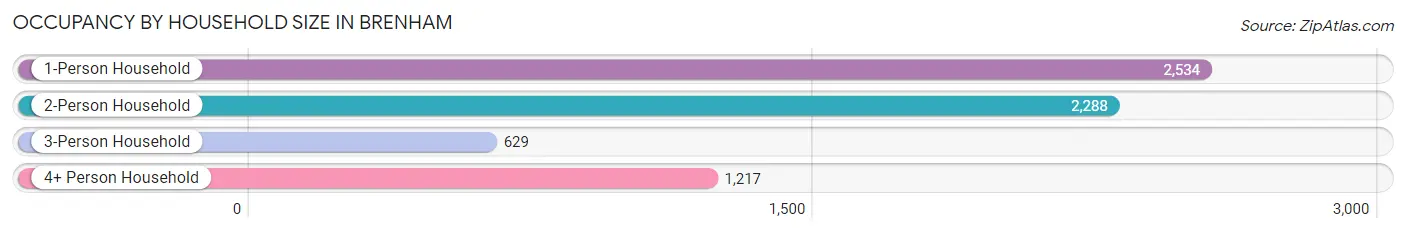
| Household Size | # Housing Units | % Housing Units |
| 1-Person Household | 2,534 | 38.0% |
| 2-Person Household | 2,288 | 34.3% |
| 3-Person Household | 629 | 9.4% |
| 4+ Person Household | 1,217 | 18.2% |
| Total Housing Units | 6,668 | 100.0% |
Occupancy by Ownership by Household Size in Brenham
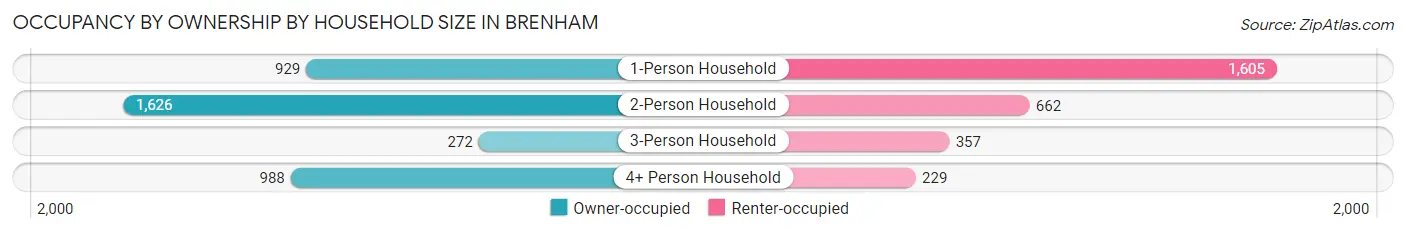
| Household Size | Owner-occupied | Renter-occupied |
| 1-Person Household | 929 (36.7%) | 1,605 (63.3%) |
| 2-Person Household | 1,626 (71.1%) | 662 (28.9%) |
| 3-Person Household | 272 (43.2%) | 357 (56.8%) |
| 4+ Person Household | 988 (81.2%) | 229 (18.8%) |
| Total Housing Units | 3,815 (57.2%) | 2,853 (42.8%) |
Occupancy by Educational Attainment in Brenham
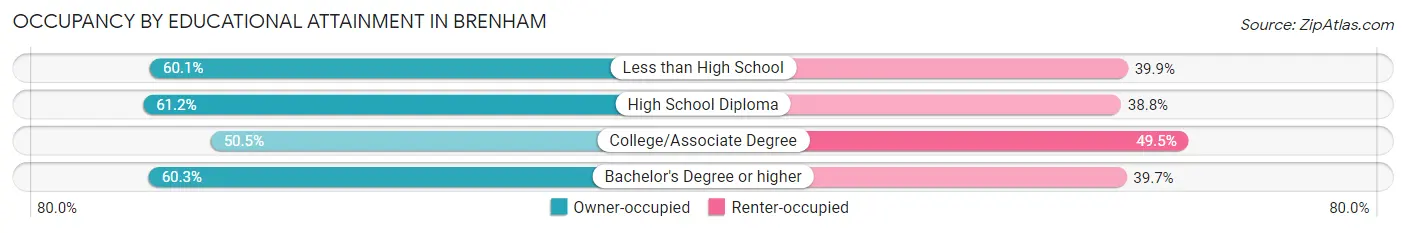
| Household Size | Owner-occupied | Renter-occupied |
| Less than High School | 357 (60.1%) | 237 (39.9%) |
| High School Diploma | 1,092 (61.2%) | 693 (38.8%) |
| College/Associate Degree | 1,132 (50.5%) | 1,111 (49.5%) |
| Bachelor's Degree or higher | 1,234 (60.3%) | 812 (39.7%) |
Occupancy by Age of Householder in Brenham
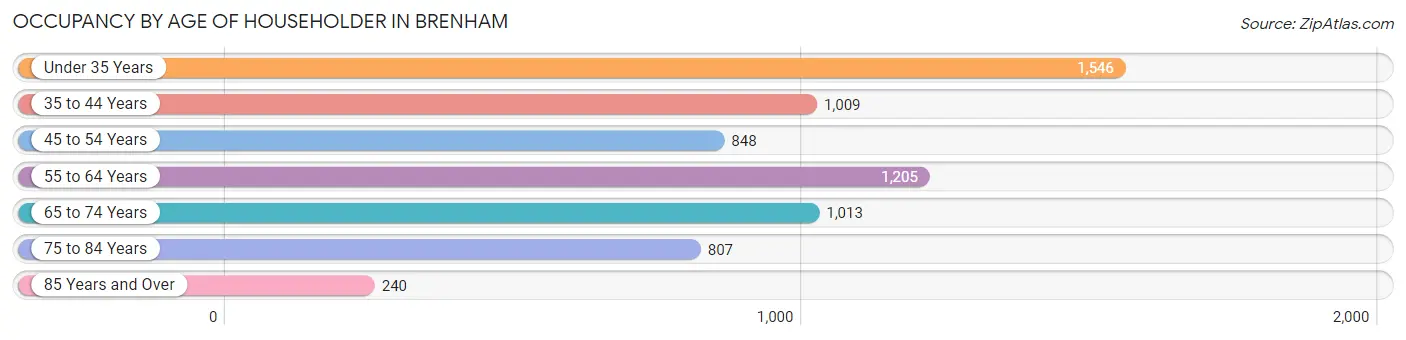
| Age Bracket | # Households | % Households |
| Under 35 Years | 1,546 | 23.2% |
| 35 to 44 Years | 1,009 | 15.1% |
| 45 to 54 Years | 848 | 12.7% |
| 55 to 64 Years | 1,205 | 18.1% |
| 65 to 74 Years | 1,013 | 15.2% |
| 75 to 84 Years | 807 | 12.1% |
| 85 Years and Over | 240 | 3.6% |
| Total | 6,668 | 100.0% |
Housing Finances in Brenham
Median Income by Occupancy in Brenham
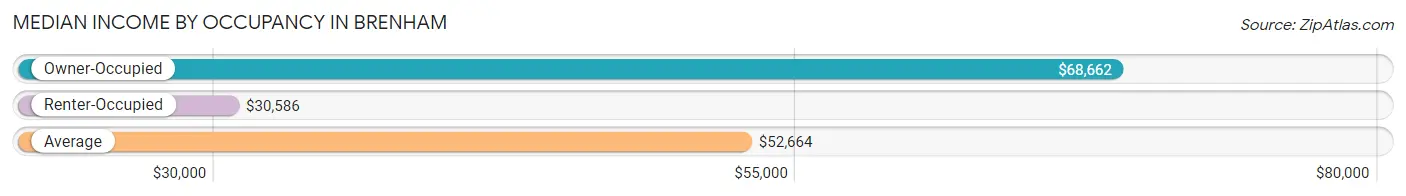
| Occupancy Type | # Households | Median Income |
| Owner-Occupied | 3,815 (57.2%) | $68,662 |
| Renter-Occupied | 2,853 (42.8%) | $30,586 |
| Average | 6,668 (100.0%) | $52,664 |
Occupancy by Householder Income Bracket in Brenham
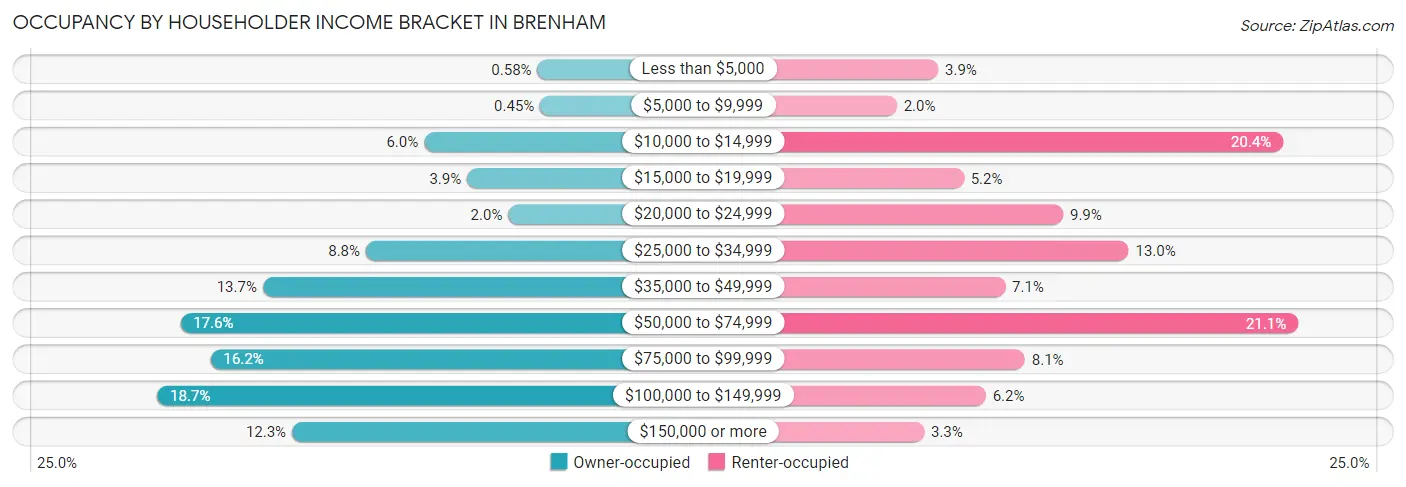
| Income Bracket | Owner-occupied | Renter-occupied |
| Less than $5,000 | 22 (0.6%) | 112 (3.9%) |
| $5,000 to $9,999 | 17 (0.4%) | 56 (2.0%) |
| $10,000 to $14,999 | 228 (6.0%) | 581 (20.4%) |
| $15,000 to $19,999 | 150 (3.9%) | 147 (5.1%) |
| $20,000 to $24,999 | 75 (2.0%) | 282 (9.9%) |
| $25,000 to $34,999 | 334 (8.7%) | 371 (13.0%) |
| $35,000 to $49,999 | 521 (13.7%) | 203 (7.1%) |
| $50,000 to $74,999 | 671 (17.6%) | 601 (21.1%) |
| $75,000 to $99,999 | 616 (16.2%) | 230 (8.1%) |
| $100,000 to $149,999 | 713 (18.7%) | 177 (6.2%) |
| $150,000 or more | 468 (12.3%) | 93 (3.3%) |
| Total | 3,815 (100.0%) | 2,853 (100.0%) |
Monthly Housing Cost Tiers in Brenham
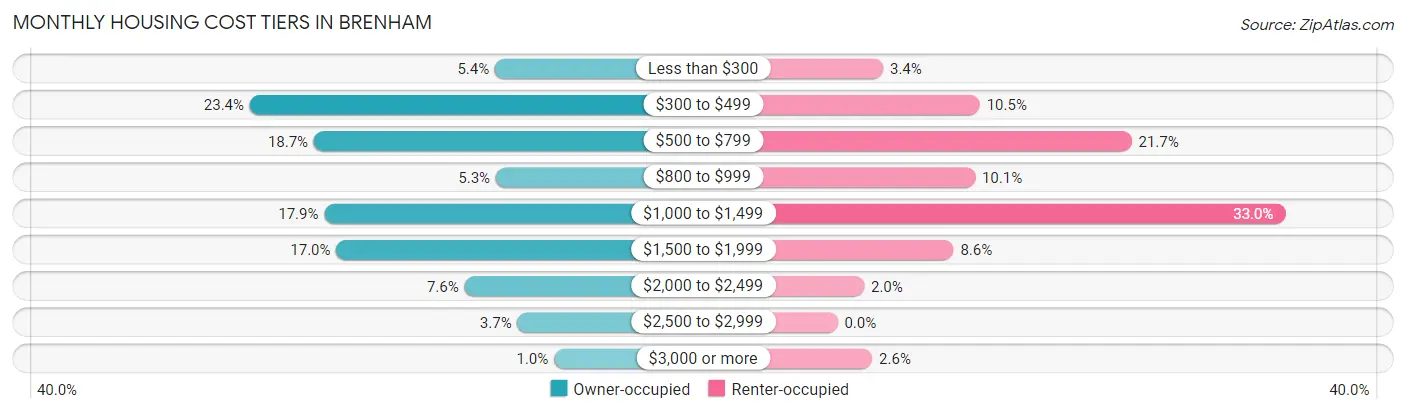
| Monthly Cost | Owner-occupied | Renter-occupied |
| Less than $300 | 204 (5.3%) | 96 (3.4%) |
| $300 to $499 | 893 (23.4%) | 299 (10.5%) |
| $500 to $799 | 713 (18.7%) | 618 (21.7%) |
| $800 to $999 | 202 (5.3%) | 289 (10.1%) |
| $1,000 to $1,499 | 684 (17.9%) | 941 (33.0%) |
| $1,500 to $1,999 | 650 (17.0%) | 244 (8.6%) |
| $2,000 to $2,499 | 290 (7.6%) | 56 (2.0%) |
| $2,500 to $2,999 | 141 (3.7%) | 0 (0.0%) |
| $3,000 or more | 38 (1.0%) | 73 (2.6%) |
| Total | 3,815 (100.0%) | 2,853 (100.0%) |
Physical Housing Characteristics in Brenham
Housing Structures in Brenham
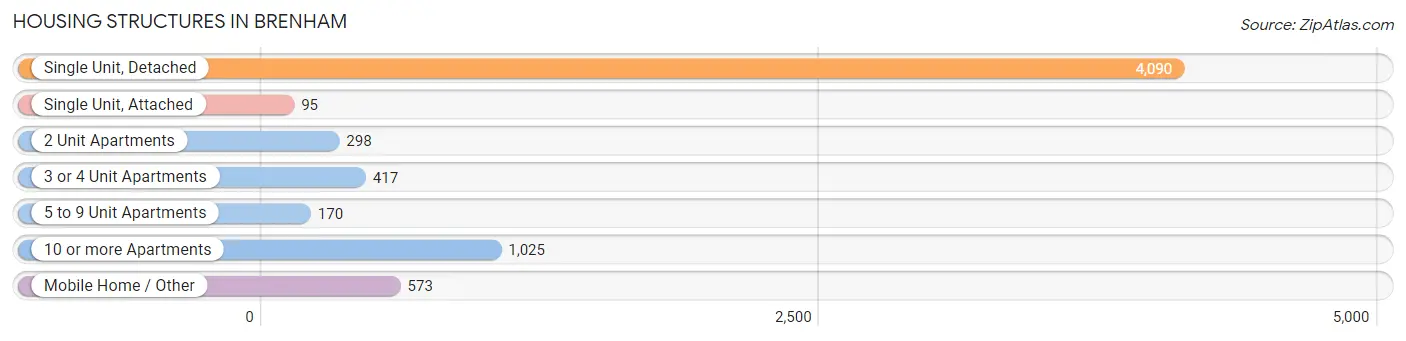
| Structure Type | # Housing Units | % Housing Units |
| Single Unit, Detached | 4,090 | 61.3% |
| Single Unit, Attached | 95 | 1.4% |
| 2 Unit Apartments | 298 | 4.5% |
| 3 or 4 Unit Apartments | 417 | 6.2% |
| 5 to 9 Unit Apartments | 170 | 2.5% |
| 10 or more Apartments | 1,025 | 15.4% |
| Mobile Home / Other | 573 | 8.6% |
| Total | 6,668 | 100.0% |
Housing Structures by Occupancy in Brenham
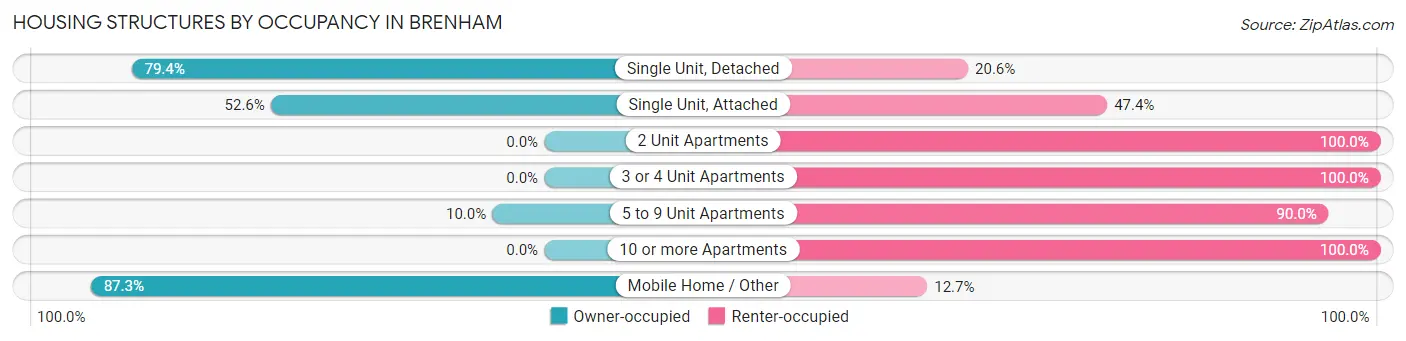
| Structure Type | Owner-occupied | Renter-occupied |
| Single Unit, Detached | 3,248 (79.4%) | 842 (20.6%) |
| Single Unit, Attached | 50 (52.6%) | 45 (47.4%) |
| 2 Unit Apartments | 0 (0.0%) | 298 (100.0%) |
| 3 or 4 Unit Apartments | 0 (0.0%) | 417 (100.0%) |
| 5 to 9 Unit Apartments | 17 (10.0%) | 153 (90.0%) |
| 10 or more Apartments | 0 (0.0%) | 1,025 (100.0%) |
| Mobile Home / Other | 500 (87.3%) | 73 (12.7%) |
| Total | 3,815 (57.2%) | 2,853 (42.8%) |
Housing Structures by Number of Rooms in Brenham
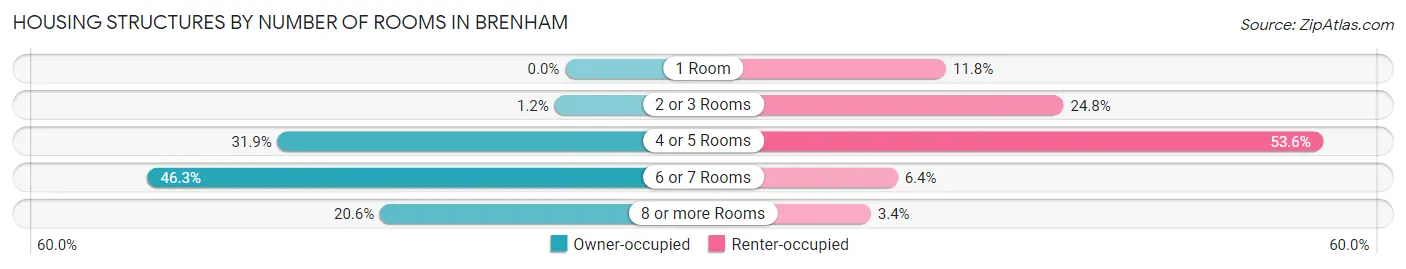
| Number of Rooms | Owner-occupied | Renter-occupied |
| 1 Room | 0 (0.0%) | 336 (11.8%) |
| 2 or 3 Rooms | 45 (1.2%) | 708 (24.8%) |
| 4 or 5 Rooms | 1,218 (31.9%) | 1,528 (53.6%) |
| 6 or 7 Rooms | 1,768 (46.3%) | 183 (6.4%) |
| 8 or more Rooms | 784 (20.5%) | 98 (3.4%) |
| Total | 3,815 (100.0%) | 2,853 (100.0%) |
Housing Structure by Heating Type in Brenham
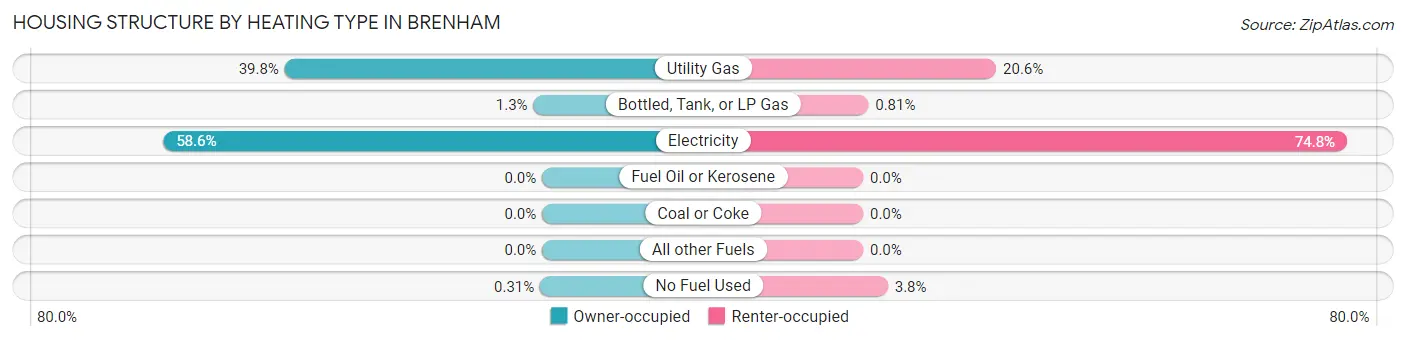
| Heating Type | Owner-occupied | Renter-occupied |
| Utility Gas | 1,518 (39.8%) | 587 (20.6%) |
| Bottled, Tank, or LP Gas | 51 (1.3%) | 23 (0.8%) |
| Electricity | 2,234 (58.6%) | 2,134 (74.8%) |
| Fuel Oil or Kerosene | 0 (0.0%) | 0 (0.0%) |
| Coal or Coke | 0 (0.0%) | 0 (0.0%) |
| All other Fuels | 0 (0.0%) | 0 (0.0%) |
| No Fuel Used | 12 (0.3%) | 109 (3.8%) |
| Total | 3,815 (100.0%) | 2,853 (100.0%) |
Household Vehicle Usage in Brenham
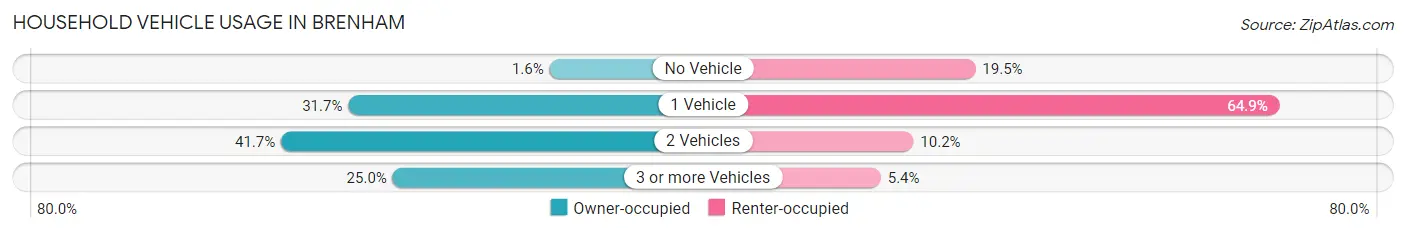
| Vehicles per Household | Owner-occupied | Renter-occupied |
| No Vehicle | 61 (1.6%) | 556 (19.5%) |
| 1 Vehicle | 1,208 (31.7%) | 1,852 (64.9%) |
| 2 Vehicles | 1,591 (41.7%) | 292 (10.2%) |
| 3 or more Vehicles | 955 (25.0%) | 153 (5.4%) |
| Total | 3,815 (100.0%) | 2,853 (100.0%) |
Real Estate & Mortgages in Brenham
Real Estate and Mortgage Overview in Brenham
| Characteristic | Without Mortgage | With Mortgage |
| Housing Units | 1,831 | 1,984 |
| Median Property Value | $172,900 | $211,400 |
| Median Household Income | $49,782 | $407 |
| Monthly Housing Costs | $441 | $38 |
| Real Estate Taxes | $1,734 | $69 |
Property Value by Mortgage Status in Brenham
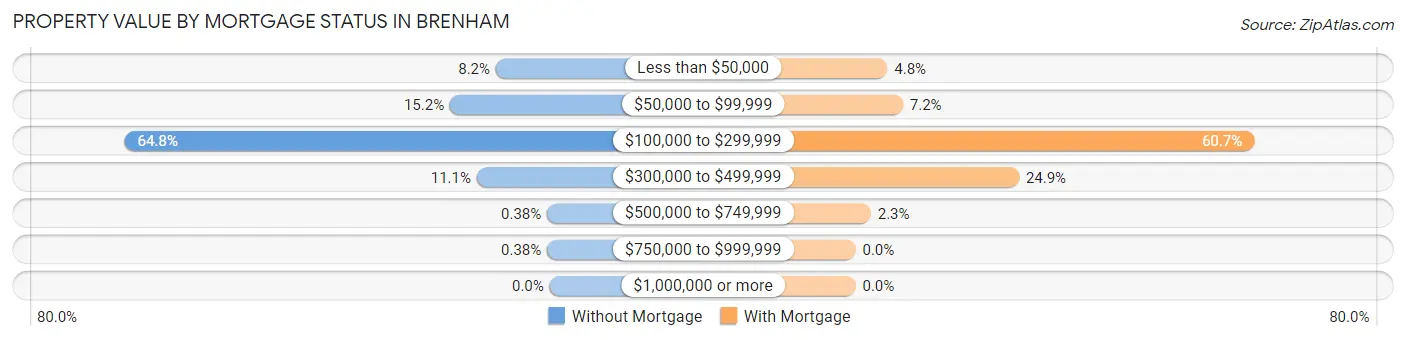
| Property Value | Without Mortgage | With Mortgage |
| Less than $50,000 | 150 (8.2%) | 96 (4.8%) |
| $50,000 to $99,999 | 278 (15.2%) | 143 (7.2%) |
| $100,000 to $299,999 | 1,186 (64.8%) | 1,205 (60.7%) |
| $300,000 to $499,999 | 203 (11.1%) | 494 (24.9%) |
| $500,000 to $749,999 | 7 (0.4%) | 46 (2.3%) |
| $750,000 to $999,999 | 7 (0.4%) | 0 (0.0%) |
| $1,000,000 or more | 0 (0.0%) | 0 (0.0%) |
| Total | 1,831 (100.0%) | 1,984 (100.0%) |
Household Income by Mortgage Status in Brenham
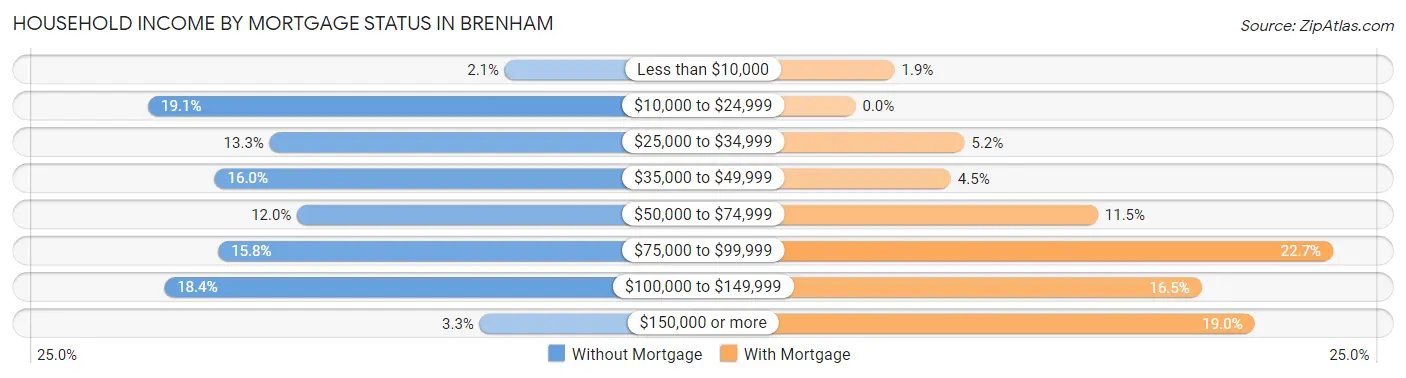
| Household Income | Without Mortgage | With Mortgage |
| Less than $10,000 | 39 (2.1%) | 37 (1.9%) |
| $10,000 to $24,999 | 350 (19.1%) | 0 (0.0%) |
| $25,000 to $34,999 | 244 (13.3%) | 103 (5.2%) |
| $35,000 to $49,999 | 292 (16.0%) | 90 (4.5%) |
| $50,000 to $74,999 | 220 (12.0%) | 229 (11.5%) |
| $75,000 to $99,999 | 289 (15.8%) | 451 (22.7%) |
| $100,000 to $149,999 | 336 (18.3%) | 327 (16.5%) |
| $150,000 or more | 61 (3.3%) | 377 (19.0%) |
| Total | 1,831 (100.0%) | 1,984 (100.0%) |
Property Value to Household Income Ratio in Brenham
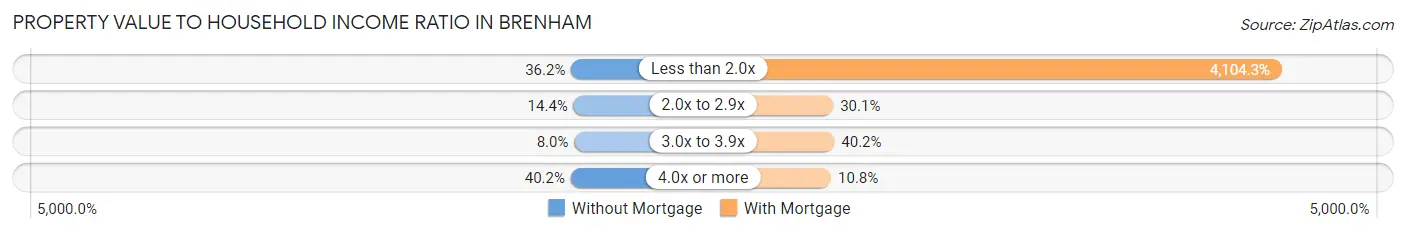
| Value-to-Income Ratio | Without Mortgage | With Mortgage |
| Less than 2.0x | 663 (36.2%) | 81,429 (4,104.3%) |
| 2.0x to 2.9x | 263 (14.4%) | 597 (30.1%) |
| 3.0x to 3.9x | 147 (8.0%) | 797 (40.2%) |
| 4.0x or more | 736 (40.2%) | 214 (10.8%) |
| Total | 1,831 (100.0%) | 1,984 (100.0%) |
Real Estate Taxes by Mortgage Status in Brenham
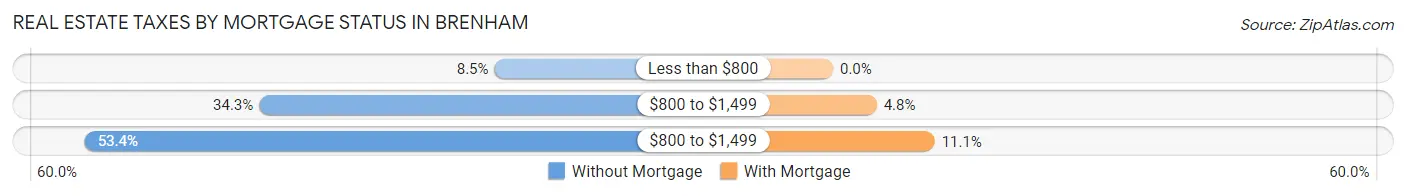
| Property Taxes | Without Mortgage | With Mortgage |
| Less than $800 | 156 (8.5%) | 0 (0.0%) |
| $800 to $1,499 | 628 (34.3%) | 95 (4.8%) |
| $800 to $1,499 | 978 (53.4%) | 221 (11.1%) |
| Total | 1,831 (100.0%) | 1,984 (100.0%) |
Health & Disability in Brenham
Health Insurance Coverage by Age in Brenham
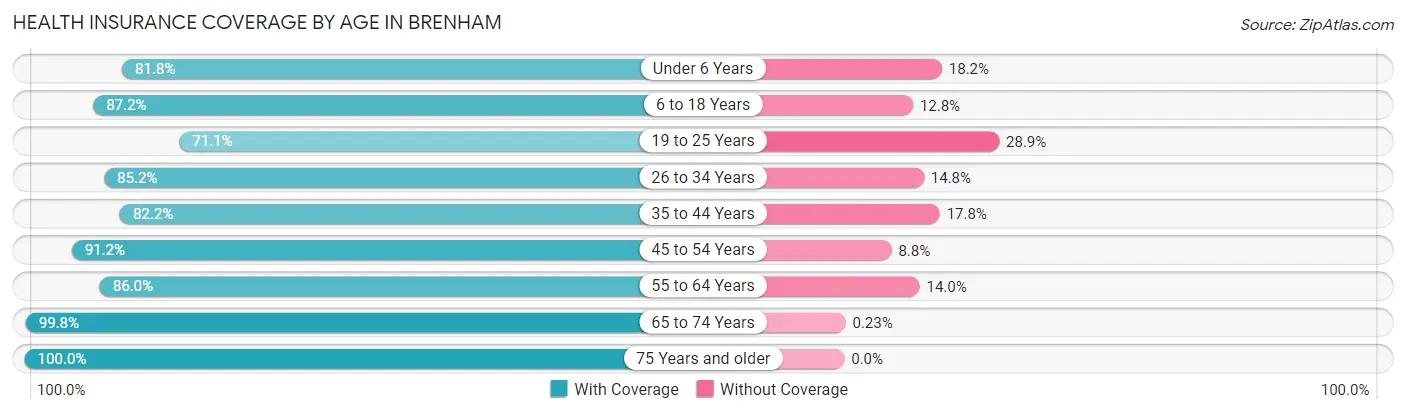
| Age Bracket | With Coverage | Without Coverage |
| Under 6 Years | 1,129 (81.8%) | 251 (18.2%) |
| 6 to 18 Years | 2,889 (87.2%) | 424 (12.8%) |
| 19 to 25 Years | 1,882 (71.1%) | 764 (28.9%) |
| 26 to 34 Years | 1,314 (85.2%) | 229 (14.8%) |
| 35 to 44 Years | 1,363 (82.2%) | 295 (17.8%) |
| 45 to 54 Years | 1,464 (91.2%) | 141 (8.8%) |
| 55 to 64 Years | 1,557 (86.0%) | 254 (14.0%) |
| 65 to 74 Years | 1,329 (99.8%) | 3 (0.2%) |
| 75 Years and older | 1,430 (100.0%) | 0 (0.0%) |
| Total | 14,357 (85.9%) | 2,361 (14.1%) |
Health Insurance Coverage by Citizenship Status in Brenham
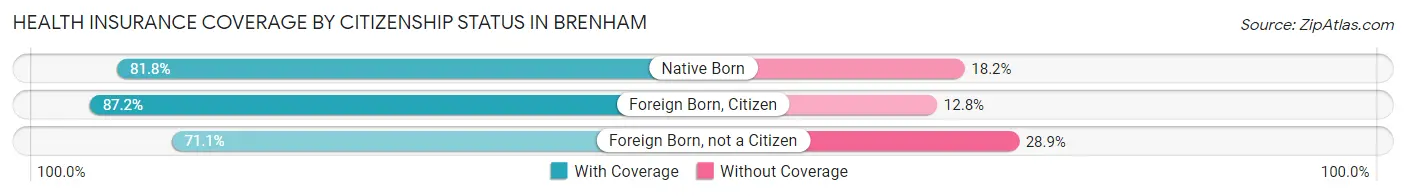
| Citizenship Status | With Coverage | Without Coverage |
| Native Born | 1,129 (81.8%) | 251 (18.2%) |
| Foreign Born, Citizen | 2,889 (87.2%) | 424 (12.8%) |
| Foreign Born, not a Citizen | 1,882 (71.1%) | 764 (28.9%) |
Health Insurance Coverage by Household Income in Brenham
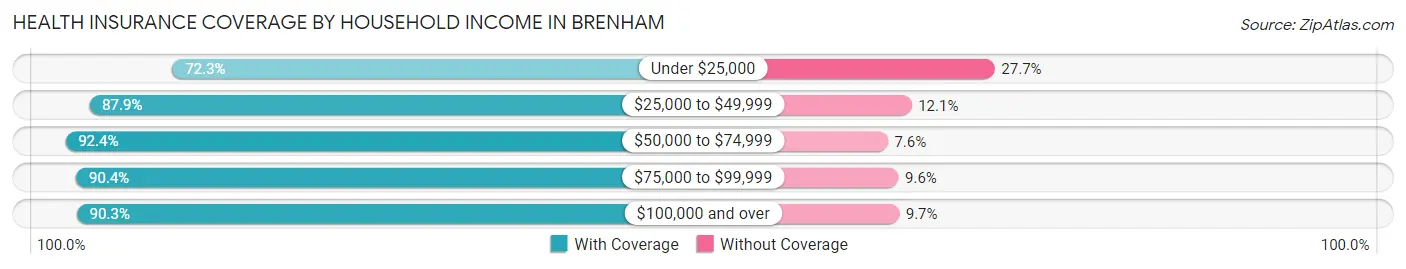
| Household Income | With Coverage | Without Coverage |
| Under $25,000 | 2,226 (72.3%) | 851 (27.7%) |
| $25,000 to $49,999 | 2,120 (87.9%) | 291 (12.1%) |
| $50,000 to $74,999 | 2,487 (92.4%) | 205 (7.6%) |
| $75,000 to $99,999 | 2,001 (90.4%) | 213 (9.6%) |
| $100,000 and over | 4,392 (90.3%) | 474 (9.7%) |
Public vs Private Health Insurance Coverage by Age in Brenham
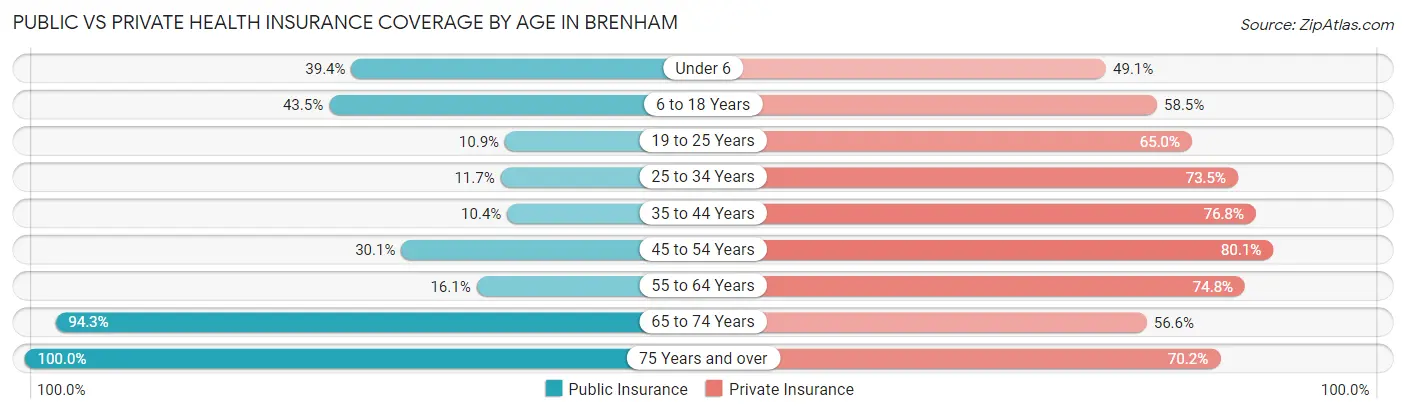
| Age Bracket | Public Insurance | Private Insurance |
| Under 6 | 543 (39.4%) | 677 (49.1%) |
| 6 to 18 Years | 1,441 (43.5%) | 1,939 (58.5%) |
| 19 to 25 Years | 287 (10.8%) | 1,719 (65.0%) |
| 25 to 34 Years | 180 (11.7%) | 1,134 (73.5%) |
| 35 to 44 Years | 173 (10.4%) | 1,274 (76.8%) |
| 45 to 54 Years | 483 (30.1%) | 1,285 (80.1%) |
| 55 to 64 Years | 292 (16.1%) | 1,355 (74.8%) |
| 65 to 74 Years | 1,256 (94.3%) | 754 (56.6%) |
| 75 Years and over | 1,430 (100.0%) | 1,004 (70.2%) |
| Total | 6,085 (36.4%) | 11,141 (66.6%) |
Disability Status by Sex by Age in Brenham
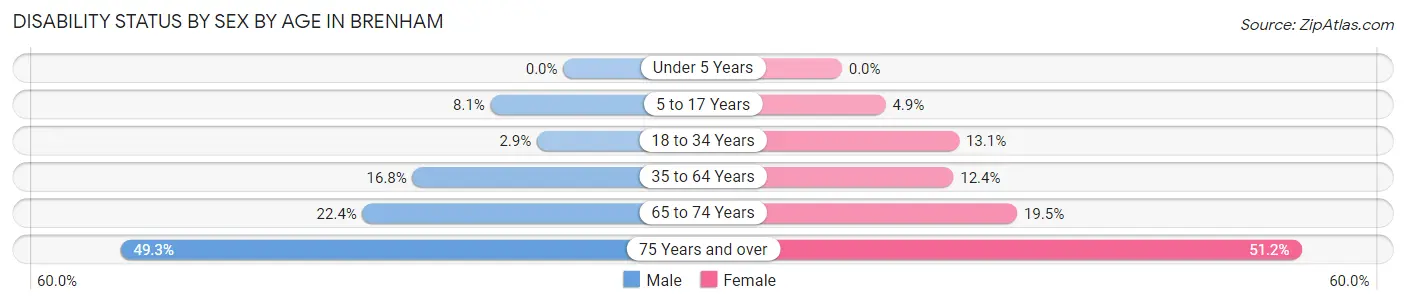
| Age Bracket | Male | Female |
| Under 5 Years | 0 (0.0%) | 0 (0.0%) |
| 5 to 17 Years | 131 (8.1%) | 77 (4.9%) |
| 18 to 34 Years | 55 (2.9%) | 359 (13.1%) |
| 35 to 64 Years | 387 (16.8%) | 344 (12.4%) |
| 65 to 74 Years | 135 (22.4%) | 142 (19.5%) |
| 75 Years and over | 284 (49.3%) | 437 (51.2%) |
Disability Class by Sex by Age in Brenham
Disability Class: Hearing Difficulty
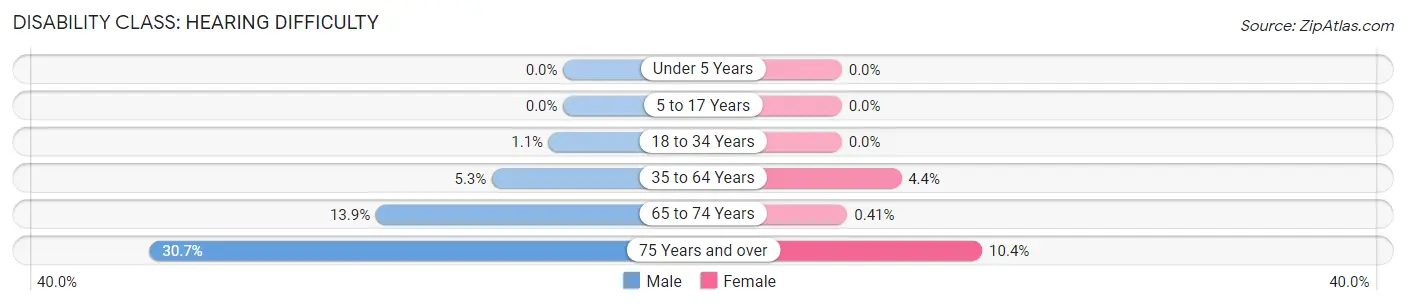
| Age Bracket | Male | Female |
| Under 5 Years | 0 (0.0%) | 0 (0.0%) |
| 5 to 17 Years | 0 (0.0%) | 0 (0.0%) |
| 18 to 34 Years | 20 (1.1%) | 0 (0.0%) |
| 35 to 64 Years | 122 (5.3%) | 122 (4.4%) |
| 65 to 74 Years | 84 (13.9%) | 3 (0.4%) |
| 75 Years and over | 177 (30.7%) | 89 (10.4%) |
Disability Class: Vision Difficulty
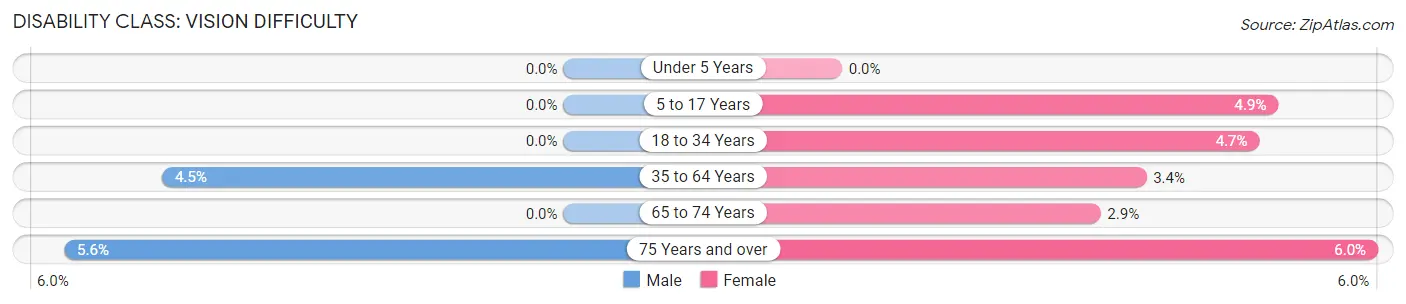
| Age Bracket | Male | Female |
| Under 5 Years | 0 (0.0%) | 0 (0.0%) |
| 5 to 17 Years | 0 (0.0%) | 77 (4.9%) |
| 18 to 34 Years | 0 (0.0%) | 128 (4.6%) |
| 35 to 64 Years | 103 (4.5%) | 94 (3.4%) |
| 65 to 74 Years | 0 (0.0%) | 21 (2.9%) |
| 75 Years and over | 32 (5.6%) | 51 (6.0%) |
Disability Class: Cognitive Difficulty
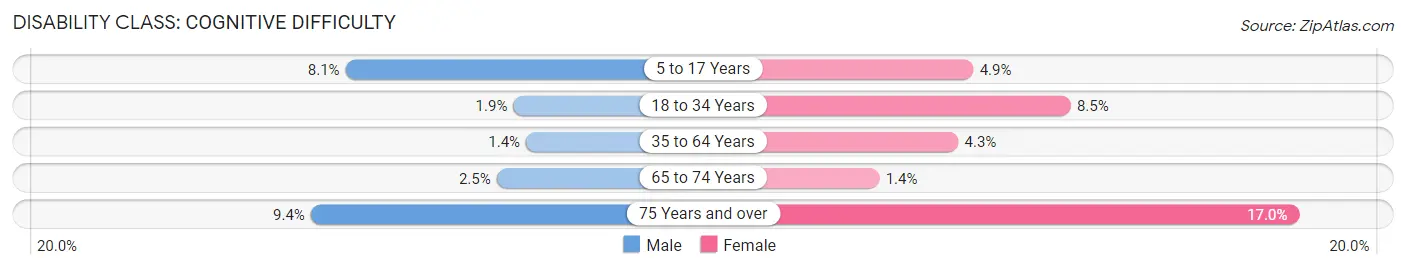
| Age Bracket | Male | Female |
| 5 to 17 Years | 131 (8.1%) | 77 (4.9%) |
| 18 to 34 Years | 35 (1.9%) | 233 (8.5%) |
| 35 to 64 Years | 32 (1.4%) | 119 (4.3%) |
| 65 to 74 Years | 15 (2.5%) | 10 (1.4%) |
| 75 Years and over | 54 (9.4%) | 145 (17.0%) |
Disability Class: Ambulatory Difficulty
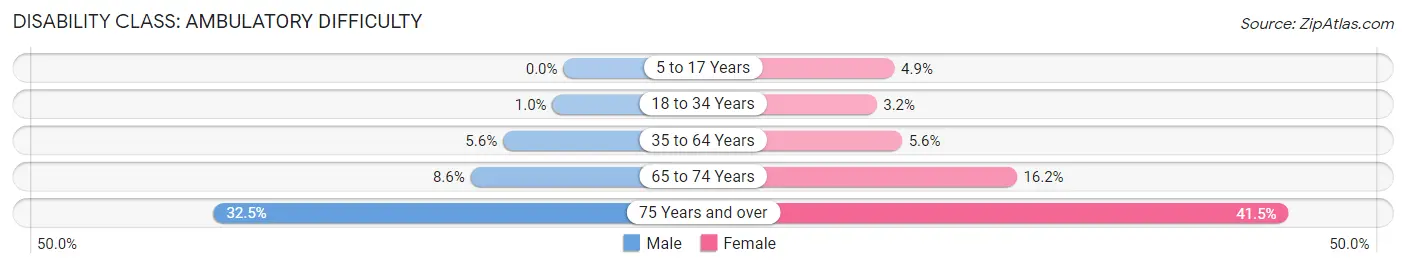
| Age Bracket | Male | Female |
| 5 to 17 Years | 0 (0.0%) | 77 (4.9%) |
| 18 to 34 Years | 19 (1.0%) | 88 (3.2%) |
| 35 to 64 Years | 129 (5.6%) | 154 (5.6%) |
| 65 to 74 Years | 52 (8.6%) | 118 (16.2%) |
| 75 Years and over | 187 (32.5%) | 354 (41.4%) |
Disability Class: Self-Care Difficulty
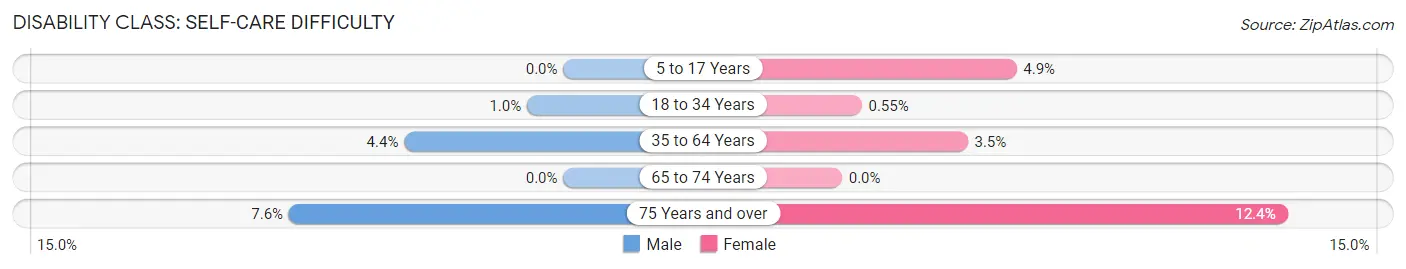
| Age Bracket | Male | Female |
| 5 to 17 Years | 0 (0.0%) | 77 (4.9%) |
| 18 to 34 Years | 19 (1.0%) | 15 (0.5%) |
| 35 to 64 Years | 102 (4.4%) | 97 (3.5%) |
| 65 to 74 Years | 0 (0.0%) | 0 (0.0%) |
| 75 Years and over | 44 (7.6%) | 106 (12.4%) |
Technology Access in Brenham
Computing Device Access in Brenham
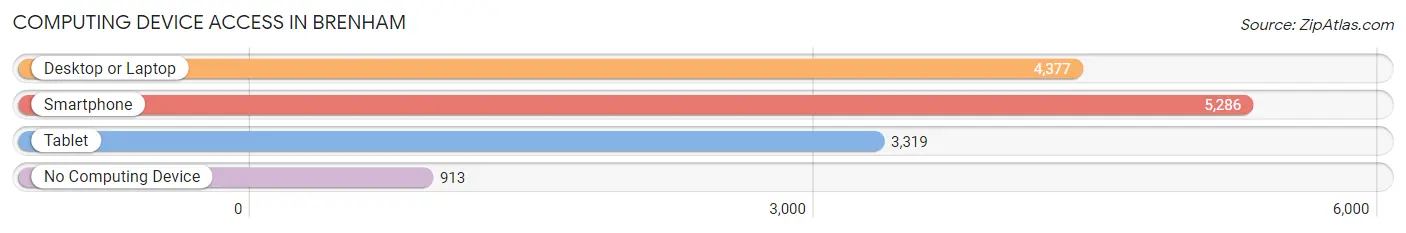
| Device Type | # Households | % Households |
| Desktop or Laptop | 4,377 | 65.6% |
| Smartphone | 5,286 | 79.3% |
| Tablet | 3,319 | 49.8% |
| No Computing Device | 913 | 13.7% |
| Total | 6,668 | 100.0% |
Internet Access in Brenham
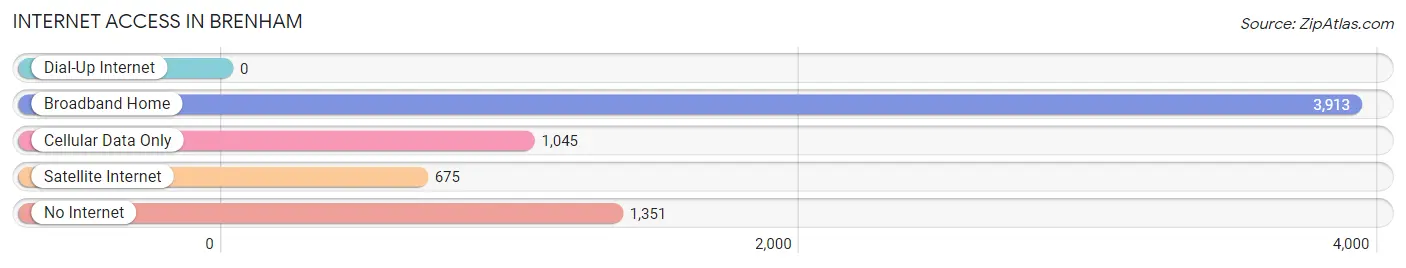
| Internet Type | # Households | % Households |
| Dial-Up Internet | 0 | 0.0% |
| Broadband Home | 3,913 | 58.7% |
| Cellular Data Only | 1,045 | 15.7% |
| Satellite Internet | 675 | 10.1% |
| No Internet | 1,351 | 20.3% |
| Total | 6,668 | 100.0% |
Brenham Summary
Brenham, Texas is a city located in Washington County, Texas, United States. It is the county seat of Washington County and is located about halfway between Houston and Austin. The population of Brenham was 15,716 at the 2010 census, making it the 19th-largest city in the state of Texas.
History
Brenham was founded in 1844 by Dr. Richard Fox Brenham, a physician from Virginia. He named the city after his hometown of Brenham, Virginia. The city was incorporated in 1858 and was the county seat of Washington County.
Brenham was an important center of trade and commerce in the 19th century. It was a major stop on the Chisholm Trail, and was the site of the first cotton gin in Texas. The city was also home to the first cotton mill in Texas, which was built in 1871.
Brenham was also an important center of education in the 19th century. The city was home to the first public school in Texas, which was established in 1848. The city was also home to the first college in Texas, which was established in 1851.
Geography
Brenham is located in the rolling hills of Central Texas, about halfway between Houston and Austin. The city is situated at the intersection of U.S. Highway 290 and State Highway 36. The city is located at the confluence of the Brazos and Little Brazos Rivers.
The climate in Brenham is characterized by hot, humid summers and mild winters. The average annual temperature is 68°F (20°C). The average annual precipitation is 37.5 inches (95 cm).
Economy
Brenham is a major center of commerce and industry in Central Texas. The city is home to several major employers, including Blue Bell Creameries, the largest ice cream manufacturer in the United States. Other major employers in the city include the Brenham Independent School District, the Washington County Hospital, and the Brenham State Supported Living Center.
The city is also home to several major retail outlets, including Walmart, Lowe’s, and Home Depot. The city is also home to several major restaurants, including Whataburger, Sonic Drive-In, and Chili’s.
Demographics
As of the 2010 census, the population of Brenham was 15,716. The racial makeup of the city was 73.3% White, 17.2% African American, 0.7% Native American, 0.7% Asian, 0.1% Pacific Islander, 6.2% from other races, and 2.0% from two or more races. Hispanic or Latino of any race were 16.3% of the population.
The median income for a household in the city was $37,945, and the median income for a family was $45,945. The per capita income for the city was $20,945. About 16.3% of families and 19.3% of the population were below the poverty line, including 25.3% of those under age 18 and 11.3% of those age 65 or over.
Common Questions
What is Per Capita Income in Brenham?
Per Capita income in Brenham is $27,592.
What is the Median Family Income in Brenham?
Median Family Income in Brenham is $73,318.
What is the Median Household income in Brenham?
Median Household Income in Brenham is $52,664.
What is Income or Wage Gap in Brenham?
Income or Wage Gap in Brenham is 17.8%.
Women in Brenham earn 82.2 cents for every dollar earned by a man.
What is Inequality or Gini Index in Brenham?
Inequality or Gini Index in Brenham is 0.47.
What is the Total Population of Brenham?
Total Population of Brenham is 17,655.
What is the Total Male Population of Brenham?
Total Male Population of Brenham is 8,161.
What is the Total Female Population of Brenham?
Total Female Population of Brenham is 9,494.
What is the Ratio of Males per 100 Females in Brenham?
There are 85.96 Males per 100 Females in Brenham.
What is the Ratio of Females per 100 Males in Brenham?
There are 116.33 Females per 100 Males in Brenham.
What is the Median Population Age in Brenham?
Median Population Age in Brenham is 32.4 Years.
What is the Average Family Size in Brenham
Average Family Size in Brenham is 3.2 People.
What is the Average Household Size in Brenham
Average Household Size in Brenham is 2.3 People.
How Large is the Labor Force in Brenham?
There are 7,649 People in the Labor Forcein in Brenham.
What is the Percentage of People in the Labor Force in Brenham?
55.0% of People are in the Labor Force in Brenham.
What is the Unemployment Rate in Brenham?
Unemployment Rate in Brenham is 3.9%.