Breckenridge, TX Map & Demographics
Breckenridge Map
Breckenridge Overview
$23,264
PER CAPITA INCOME
$54,523
AVG FAMILY INCOME
$38,500
AVG HOUSEHOLD INCOME
26.7%
WAGE / INCOME GAP [ % ]
73.3¢/ $1
WAGE / INCOME GAP [ $ ]
0.46
INEQUALITY / GINI INDEX
5,230
TOTAL POPULATION
2,709
MALE POPULATION
2,521
FEMALE POPULATION
107.46
MALES / 100 FEMALES
93.06
FEMALES / 100 MALES
35.1
MEDIAN AGE
3.1
AVG FAMILY SIZE
2.6
AVG HOUSEHOLD SIZE
2,523
LABOR FORCE [ PEOPLE ]
63.9%
PERCENT IN LABOR FORCE
13.1%
UNEMPLOYMENT RATE
Breckenridge Zip Codes
Breckenridge Area Codes
Income in Breckenridge
Income Overview in Breckenridge
Per Capita Income in Breckenridge is $23,264, while median incomes of families and households are $54,523 and $38,500 respectively.
| Characteristic | Number | Measure |
| Per Capita Income | 5,230 | $23,264 |
| Median Family Income | 1,309 | $54,523 |
| Mean Family Income | 1,309 | $70,812 |
| Median Household Income | 1,964 | $38,500 |
| Mean Household Income | 1,964 | $58,456 |
| Income Deficit | 1,309 | $0 |
| Wage / Income Gap (%) | 5,230 | 26.69% |
| Wage / Income Gap ($) | 5,230 | 73.31¢ per $1 |
| Gini / Inequality Index | 5,230 | 0.46 |
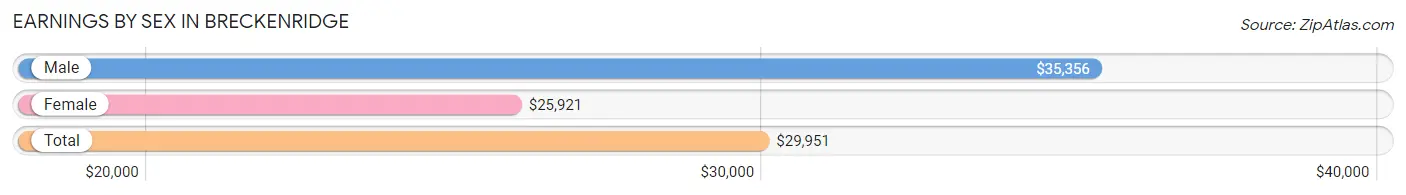
Earnings by Sex in Breckenridge
Average Earnings in Breckenridge are $29,951, $35,356 for men and $25,921 for women, a difference of 26.7%.
| Sex | Number | Average Earnings |
| Male | 1,387 (54.8%) | $35,356 |
| Female | 1,142 (45.2%) | $25,921 |
| Total | 2,529 (100.0%) | $29,951 |
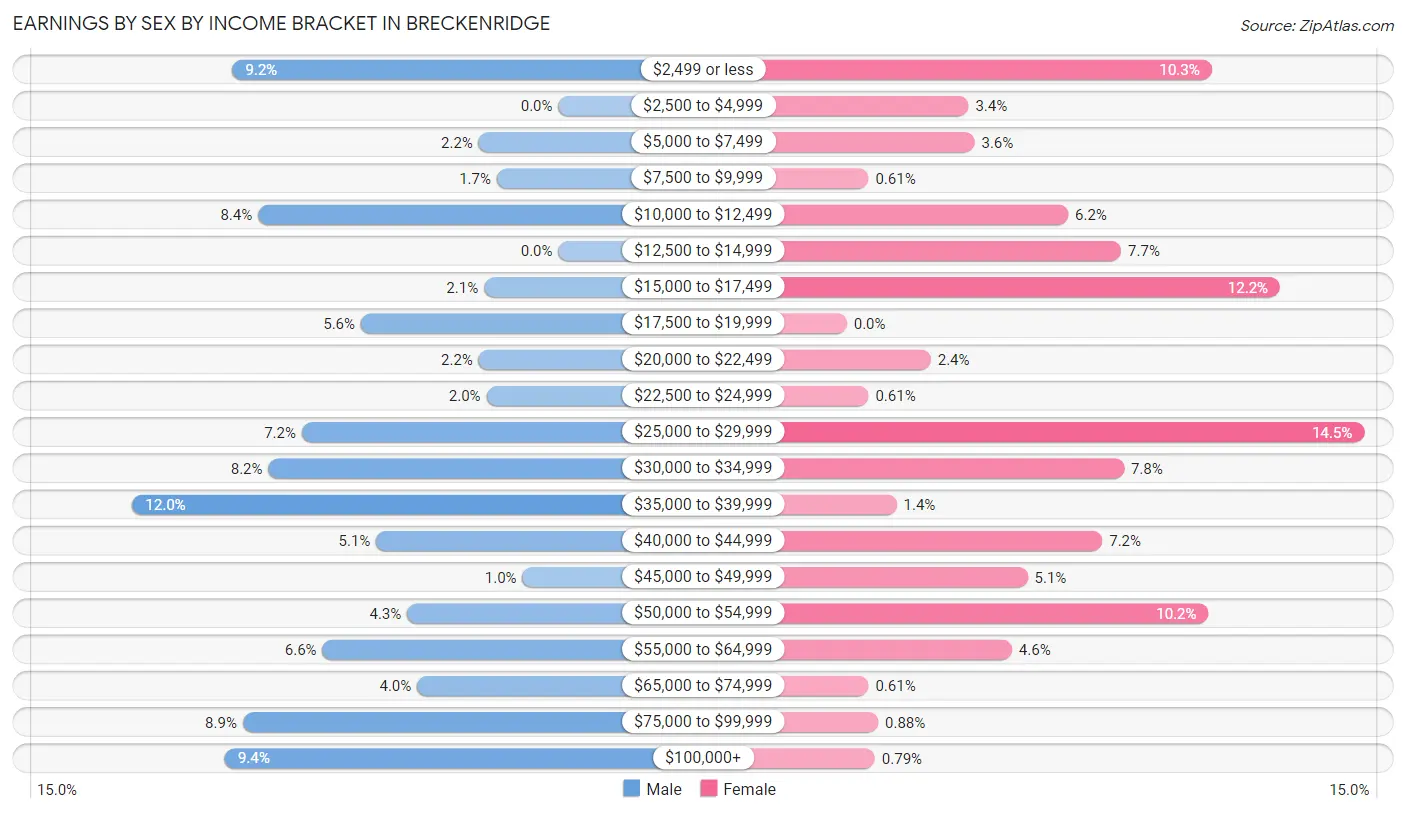
Earnings by Sex by Income Bracket in Breckenridge
The most common earnings brackets in Breckenridge are $35,000 to $39,999 for men (166 | 12.0%) and $25,000 to $29,999 for women (166 | 14.5%).
| Income | Male | Female |
| $2,499 or less | 127 (9.2%) | 117 (10.2%) |
| $2,500 to $4,999 | 0 (0.0%) | 39 (3.4%) |
| $5,000 to $7,499 | 31 (2.2%) | 41 (3.6%) |
| $7,500 to $9,999 | 24 (1.7%) | 7 (0.6%) |
| $10,000 to $12,499 | 117 (8.4%) | 71 (6.2%) |
| $12,500 to $14,999 | 0 (0.0%) | 88 (7.7%) |
| $15,000 to $17,499 | 29 (2.1%) | 139 (12.2%) |
| $17,500 to $19,999 | 77 (5.6%) | 0 (0.0%) |
| $20,000 to $22,499 | 31 (2.2%) | 27 (2.4%) |
| $22,500 to $24,999 | 28 (2.0%) | 7 (0.6%) |
| $25,000 to $29,999 | 100 (7.2%) | 166 (14.5%) |
| $30,000 to $34,999 | 113 (8.2%) | 89 (7.8%) |
| $35,000 to $39,999 | 166 (12.0%) | 16 (1.4%) |
| $40,000 to $44,999 | 71 (5.1%) | 82 (7.2%) |
| $45,000 to $49,999 | 14 (1.0%) | 58 (5.1%) |
| $50,000 to $54,999 | 59 (4.3%) | 116 (10.2%) |
| $55,000 to $64,999 | 92 (6.6%) | 53 (4.6%) |
| $65,000 to $74,999 | 55 (4.0%) | 7 (0.6%) |
| $75,000 to $99,999 | 123 (8.9%) | 10 (0.9%) |
| $100,000+ | 130 (9.4%) | 9 (0.8%) |
| Total | 1,387 (100.0%) | 1,142 (100.0%) |
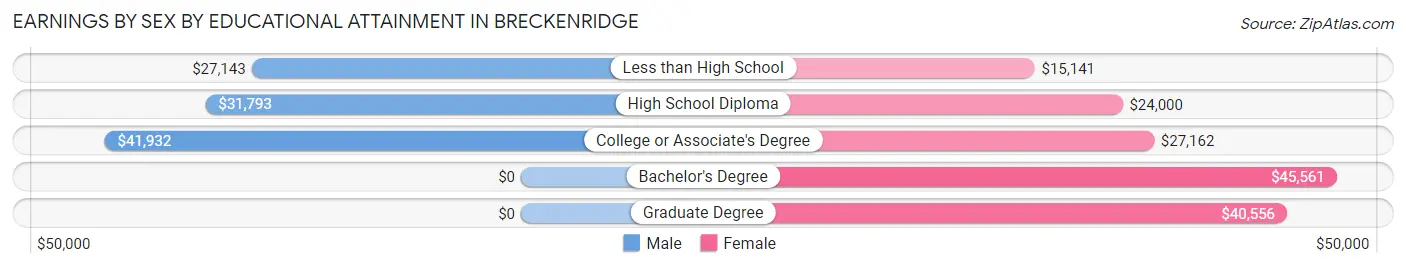
Earnings by Sex by Educational Attainment in Breckenridge
Average earnings in Breckenridge are $36,789 for men and $25,929 for women, a difference of 29.5%. Men with an educational attainment of college or associate's degree enjoy the highest average annual earnings of $41,932, while those with less than high school education earn the least with $27,143. Women with an educational attainment of bachelor's degree earn the most with the average annual earnings of $45,561, while those with less than high school education have the smallest earnings of $15,141.
| Educational Attainment | Male Income | Female Income |
| Less than High School | $27,143 | $15,141 |
| High School Diploma | $31,793 | $24,000 |
| College or Associate's Degree | $41,932 | $27,162 |
| Bachelor's Degree | - | - |
| Graduate Degree | - | - |
| Total | $36,789 | $25,929 |
Family Income in Breckenridge
Family Income Brackets in Breckenridge
According to the Breckenridge family income data, there are 285 families falling into the $50,000 to $74,999 income range, which is the most common income bracket and makes up 21.8% of all families. Conversely, the $200,000+ income bracket is the least frequent group with only 41 families (3.1%) belonging to this category.
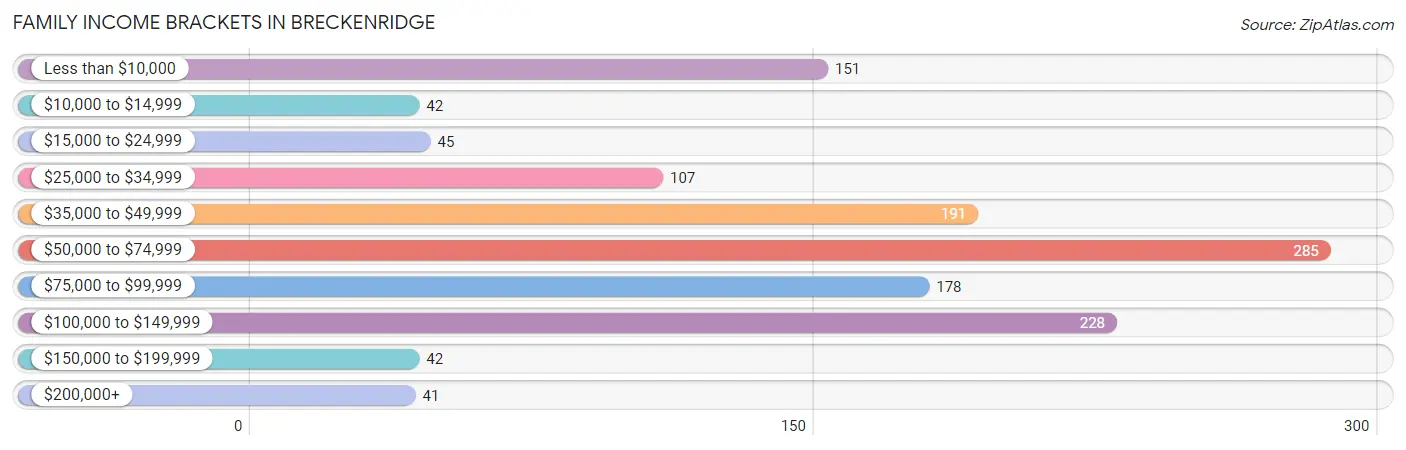
| Income Bracket | # Families | % Families |
| Less than $10,000 | 151 | 11.5% |
| $10,000 to $14,999 | 42 | 3.2% |
| $15,000 to $24,999 | 45 | 3.4% |
| $25,000 to $34,999 | 107 | 8.2% |
| $35,000 to $49,999 | 191 | 14.6% |
| $50,000 to $74,999 | 285 | 21.8% |
| $75,000 to $99,999 | 178 | 13.6% |
| $100,000 to $149,999 | 228 | 17.4% |
| $150,000 to $199,999 | 42 | 3.2% |
| $200,000+ | 41 | 3.1% |
Family Income by Famaliy Size in Breckenridge
6-person families (30 | 2.3%) account for the highest median family income in Breckenridge with $72,917 per family, while 2-person families (596 | 45.5%) have the highest median income of $31,094 per family member.
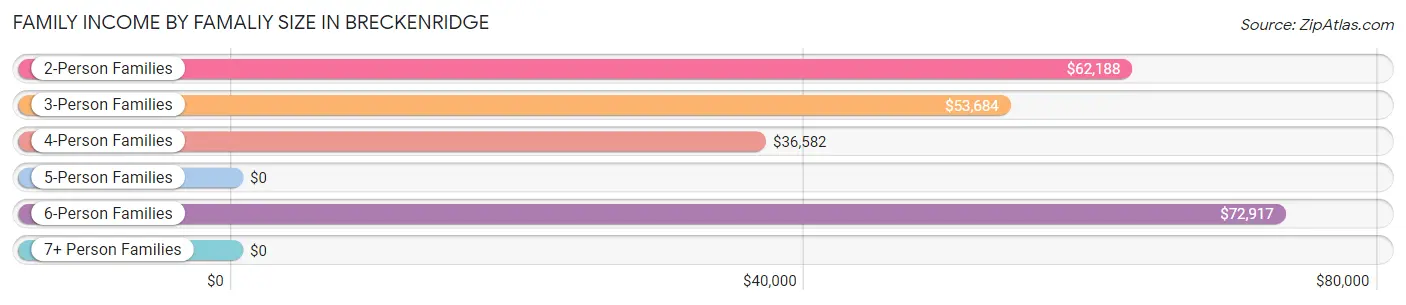
| Income Bracket | # Families | Median Income |
| 2-Person Families | 596 (45.5%) | $62,188 |
| 3-Person Families | 404 (30.9%) | $53,684 |
| 4-Person Families | 227 (17.3%) | $36,582 |
| 5-Person Families | 52 (4.0%) | $0 |
| 6-Person Families | 30 (2.3%) | $72,917 |
| 7+ Person Families | 0 (0.0%) | $0 |
| Total | 1,309 (100.0%) | $54,523 |
Family Income by Number of Earners in Breckenridge
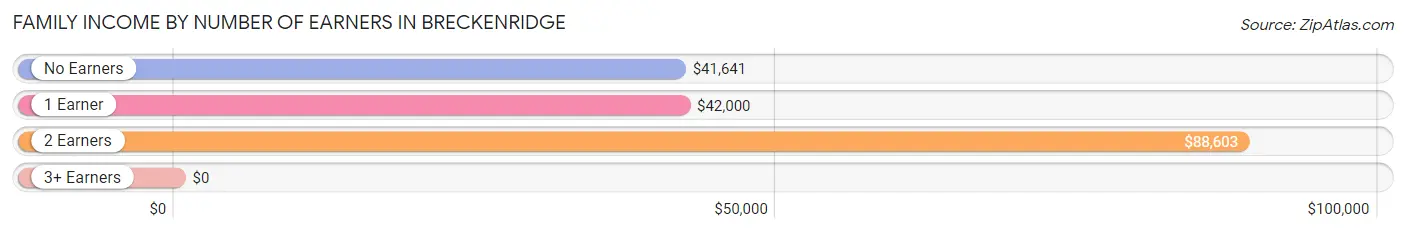
| Number of Earners | # Families | Median Income |
| No Earners | 129 (9.9%) | $41,641 |
| 1 Earner | 690 (52.7%) | $42,000 |
| 2 Earners | 437 (33.4%) | $88,603 |
| 3+ Earners | 53 (4.1%) | $0 |
| Total | 1,309 (100.0%) | $54,523 |
Household Income in Breckenridge
Household Income Brackets in Breckenridge
With 350 households falling in the category, the $15,000 to $24,999 income range is the most frequent in Breckenridge, accounting for 17.8% of all households. In contrast, only 41 households (2.1%) fall into the $150,000 to $199,999 income bracket, making it the least populous group.
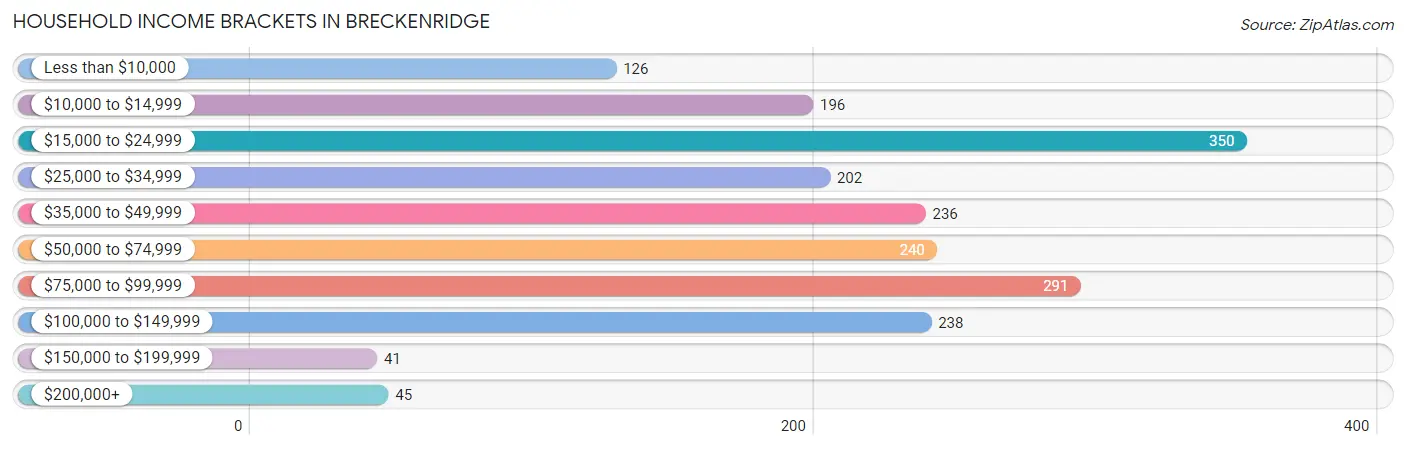
| Income Bracket | # Households | % Households |
| Less than $10,000 | 126 | 6.4% |
| $10,000 to $14,999 | 196 | 10.0% |
| $15,000 to $24,999 | 350 | 17.8% |
| $25,000 to $34,999 | 202 | 10.3% |
| $35,000 to $49,999 | 236 | 12.0% |
| $50,000 to $74,999 | 240 | 12.2% |
| $75,000 to $99,999 | 291 | 14.8% |
| $100,000 to $149,999 | 238 | 12.1% |
| $150,000 to $199,999 | 41 | 2.1% |
| $200,000+ | 45 | 2.3% |
Household Income by Householder Age in Breckenridge
The median household income in Breckenridge is $38,500, with the highest median household income of $74,167 found in the 45 to 64 years age bracket for the primary householder. A total of 482 households (24.5%) fall into this category. Meanwhile, the 15 to 24 years age bracket for the primary householder has the lowest median household income of $0, with 199 households (10.1%) in this group.
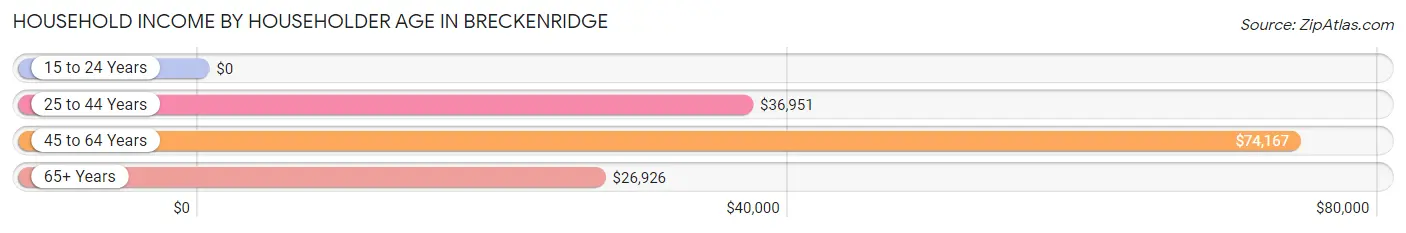
| Income Bracket | # Households | Median Income |
| 15 to 24 Years | 199 (10.1%) | $0 |
| 25 to 44 Years | 718 (36.6%) | $36,951 |
| 45 to 64 Years | 482 (24.5%) | $74,167 |
| 65+ Years | 565 (28.8%) | $26,926 |
| Total | 1,964 (100.0%) | $38,500 |
Poverty in Breckenridge
Income Below Poverty by Sex and Age in Breckenridge
With 12.1% poverty level for males and 30.2% for females among the residents of Breckenridge, 16 and 17 year old males and 12 to 14 year old females are the most vulnerable to poverty, with 45 males (47.9%) and 79 females (100.0%) in their respective age groups living below the poverty level.
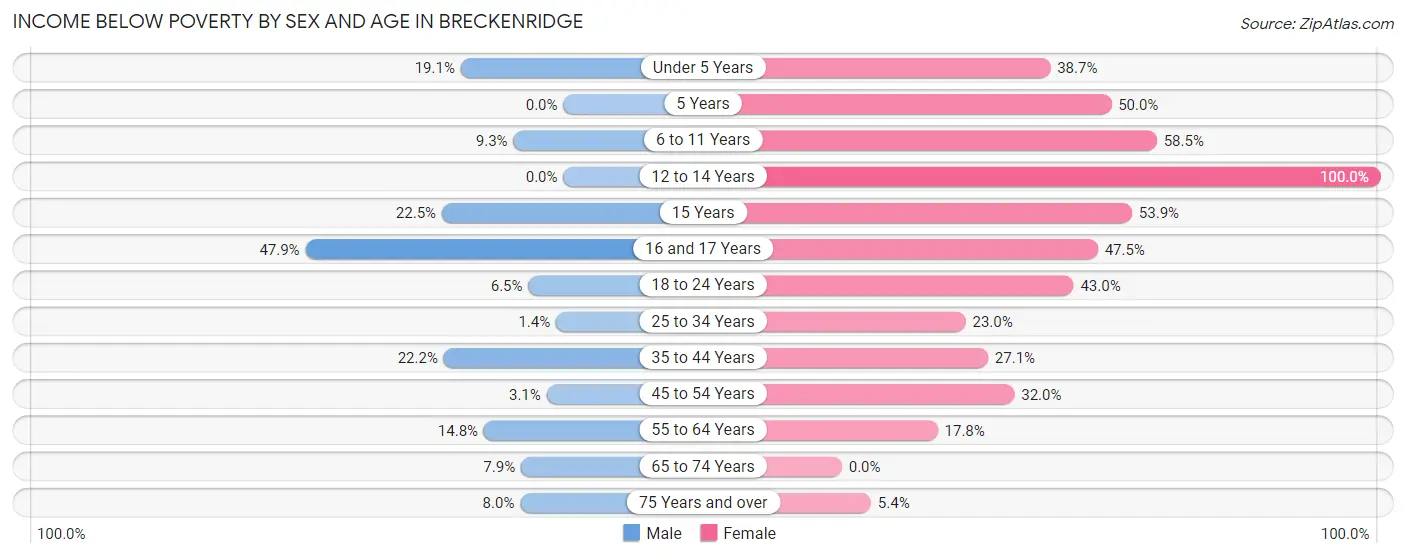
| Age Bracket | Male | Female |
| Under 5 Years | 44 (19.1%) | 77 (38.7%) |
| 5 Years | 0 (0.0%) | 16 (50.0%) |
| 6 to 11 Years | 14 (9.3%) | 152 (58.5%) |
| 12 to 14 Years | 0 (0.0%) | 79 (100.0%) |
| 15 Years | 16 (22.5%) | 7 (53.8%) |
| 16 and 17 Years | 45 (47.9%) | 19 (47.5%) |
| 18 to 24 Years | 24 (6.5%) | 86 (43.0%) |
| 25 to 34 Years | 3 (1.4%) | 85 (23.0%) |
| 35 to 44 Years | 103 (22.2%) | 99 (27.1%) |
| 45 to 54 Years | 7 (3.1%) | 65 (32.0%) |
| 55 to 64 Years | 41 (14.7%) | 56 (17.8%) |
| 65 to 74 Years | 18 (7.9%) | 0 (0.0%) |
| 75 Years and over | 6 (8.0%) | 15 (5.4%) |
| Total | 321 (12.1%) | 756 (30.2%) |
Income Above Poverty by Sex and Age in Breckenridge
According to the poverty statistics in Breckenridge, males aged 5 years and females aged 65 to 74 years are the age groups that are most secure financially, with 100.0% of males and 100.0% of females in these age groups living above the poverty line.
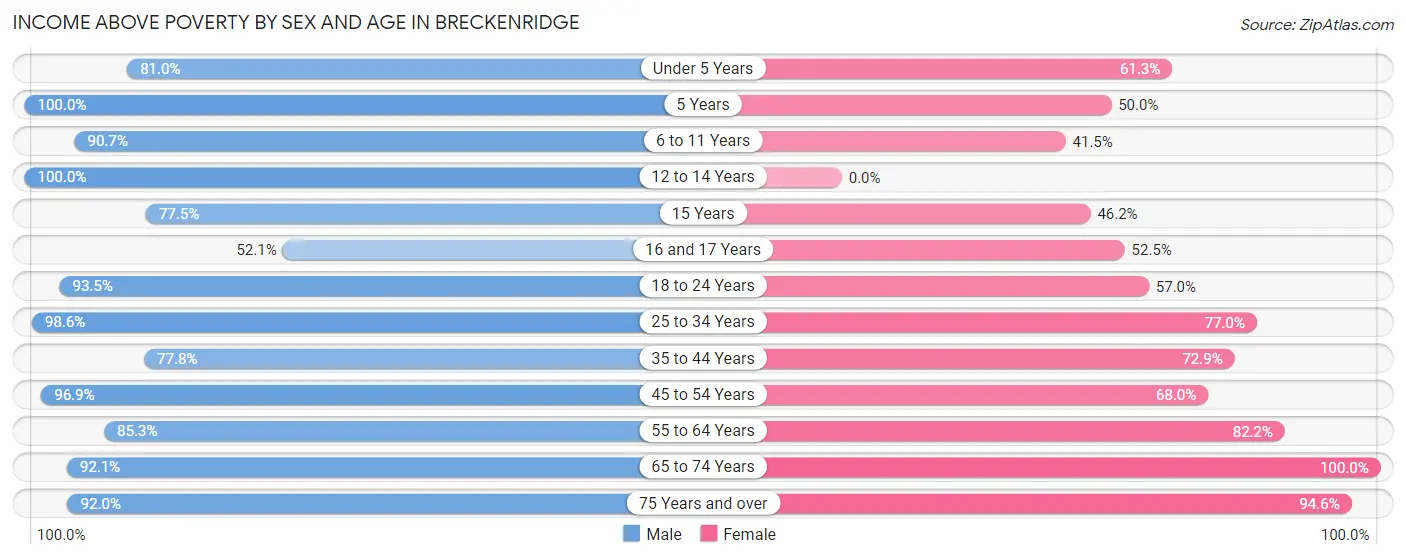
| Age Bracket | Male | Female |
| Under 5 Years | 187 (80.9%) | 122 (61.3%) |
| 5 Years | 89 (100.0%) | 16 (50.0%) |
| 6 to 11 Years | 137 (90.7%) | 108 (41.5%) |
| 12 to 14 Years | 149 (100.0%) | 0 (0.0%) |
| 15 Years | 55 (77.5%) | 6 (46.2%) |
| 16 and 17 Years | 49 (52.1%) | 21 (52.5%) |
| 18 to 24 Years | 346 (93.5%) | 114 (57.0%) |
| 25 to 34 Years | 218 (98.6%) | 285 (77.0%) |
| 35 to 44 Years | 361 (77.8%) | 266 (72.9%) |
| 45 to 54 Years | 219 (96.9%) | 138 (68.0%) |
| 55 to 64 Years | 237 (85.3%) | 259 (82.2%) |
| 65 to 74 Years | 211 (92.1%) | 152 (100.0%) |
| 75 Years and over | 69 (92.0%) | 263 (94.6%) |
| Total | 2,327 (87.9%) | 1,750 (69.8%) |
Income Below Poverty Among Married-Couple Families in Breckenridge
The poverty statistics for married-couple families in Breckenridge show that 1.1% or 9 of the total 789 families live below the poverty line. Families with no children have the highest poverty rate of 2.2%, comprising of 9 families. On the other hand, families with 1 or 2 children have the lowest poverty rate of 0.0%, which includes 0 families.
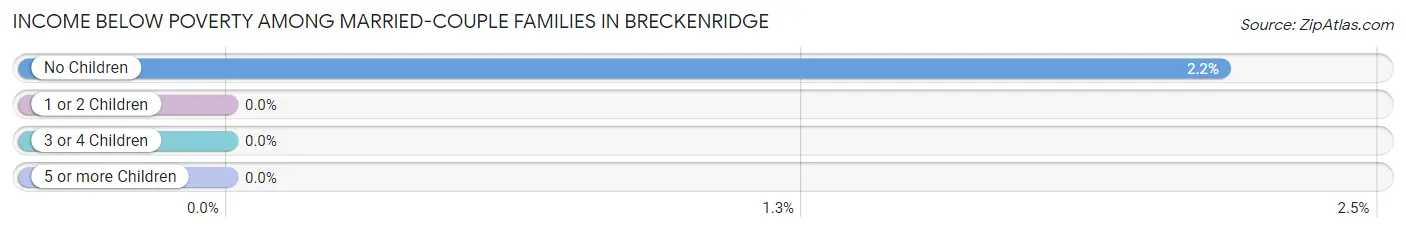
| Children | Above Poverty | Below Poverty |
| No Children | 408 (97.8%) | 9 (2.2%) |
| 1 or 2 Children | 326 (100.0%) | 0 (0.0%) |
| 3 or 4 Children | 46 (100.0%) | 0 (0.0%) |
| 5 or more Children | 0 (0.0%) | 0 (0.0%) |
| Total | 780 (98.9%) | 9 (1.1%) |
Income Below Poverty Among Single-Parent Households in Breckenridge
According to the poverty data in Breckenridge, 5.3% or 6 single-father households and 48.5% or 197 single-mother households are living below the poverty line. Among single-father households, those with no children have the highest poverty rate, with 6 households (7.8%) experiencing poverty. Likewise, among single-mother households, those with 3 or 4 children have the highest poverty rate, with 63 households (100.0%) falling below the poverty line.
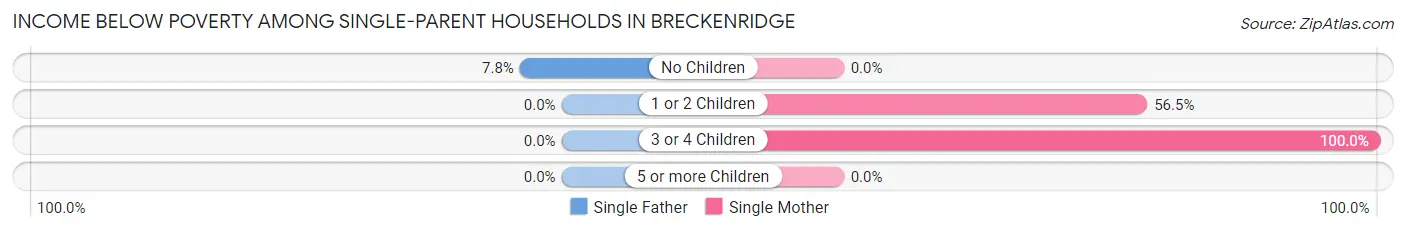
| Children | Single Father | Single Mother |
| No Children | 6 (7.8%) | 0 (0.0%) |
| 1 or 2 Children | 0 (0.0%) | 134 (56.5%) |
| 3 or 4 Children | 0 (0.0%) | 63 (100.0%) |
| 5 or more Children | 0 (0.0%) | 0 (0.0%) |
| Total | 6 (5.3%) | 197 (48.5%) |
Income Below Poverty Among Married-Couple vs Single-Parent Households in Breckenridge
The poverty data for Breckenridge shows that 9 of the married-couple family households (1.1%) and 203 of the single-parent households (39.0%) are living below the poverty level. Within the married-couple family households, those with no children have the highest poverty rate, with 9 households (2.2%) falling below the poverty line. Among the single-parent households, those with 3 or 4 children have the highest poverty rate, with 63 household (100.0%) living below poverty.
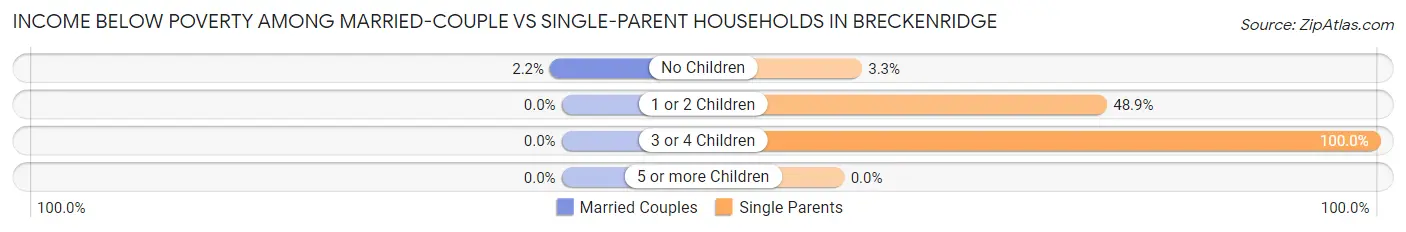
| Children | Married-Couple Families | Single-Parent Households |
| No Children | 9 (2.2%) | 6 (3.3%) |
| 1 or 2 Children | 0 (0.0%) | 134 (48.9%) |
| 3 or 4 Children | 0 (0.0%) | 63 (100.0%) |
| 5 or more Children | 0 (0.0%) | 0 (0.0%) |
| Total | 9 (1.1%) | 203 (39.0%) |
Race in Breckenridge
The most populous races in Breckenridge are White / Caucasian (3,929 | 75.1%), Hispanic or Latino (2,005 | 38.3%), and Two or more Races (666 | 12.7%).
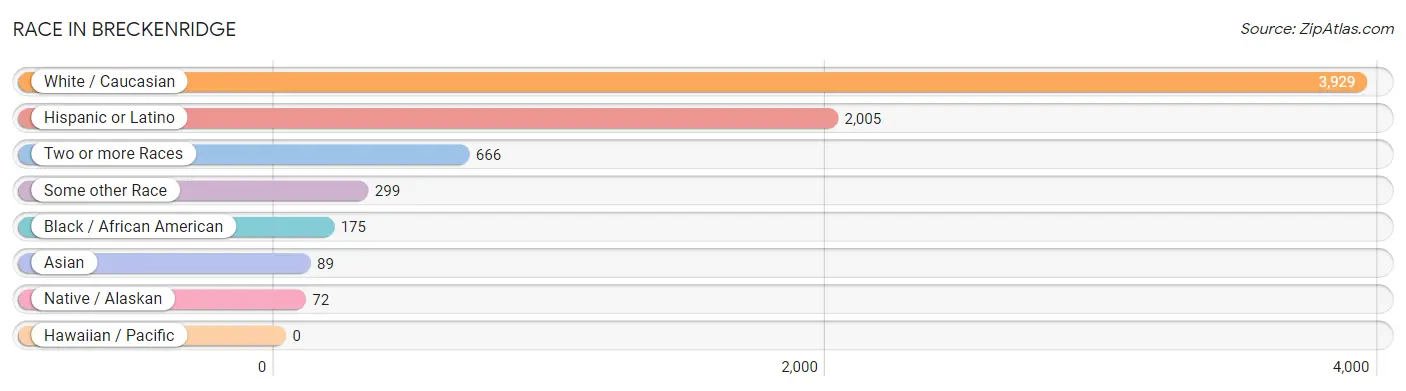
| Race | # Population | % Population |
| Asian | 89 | 1.7% |
| Black / African American | 175 | 3.4% |
| Hawaiian / Pacific | 0 | 0.0% |
| Hispanic or Latino | 2,005 | 38.3% |
| Native / Alaskan | 72 | 1.4% |
| White / Caucasian | 3,929 | 75.1% |
| Two or more Races | 666 | 12.7% |
| Some other Race | 299 | 5.7% |
| Total | 5,230 | 100.0% |
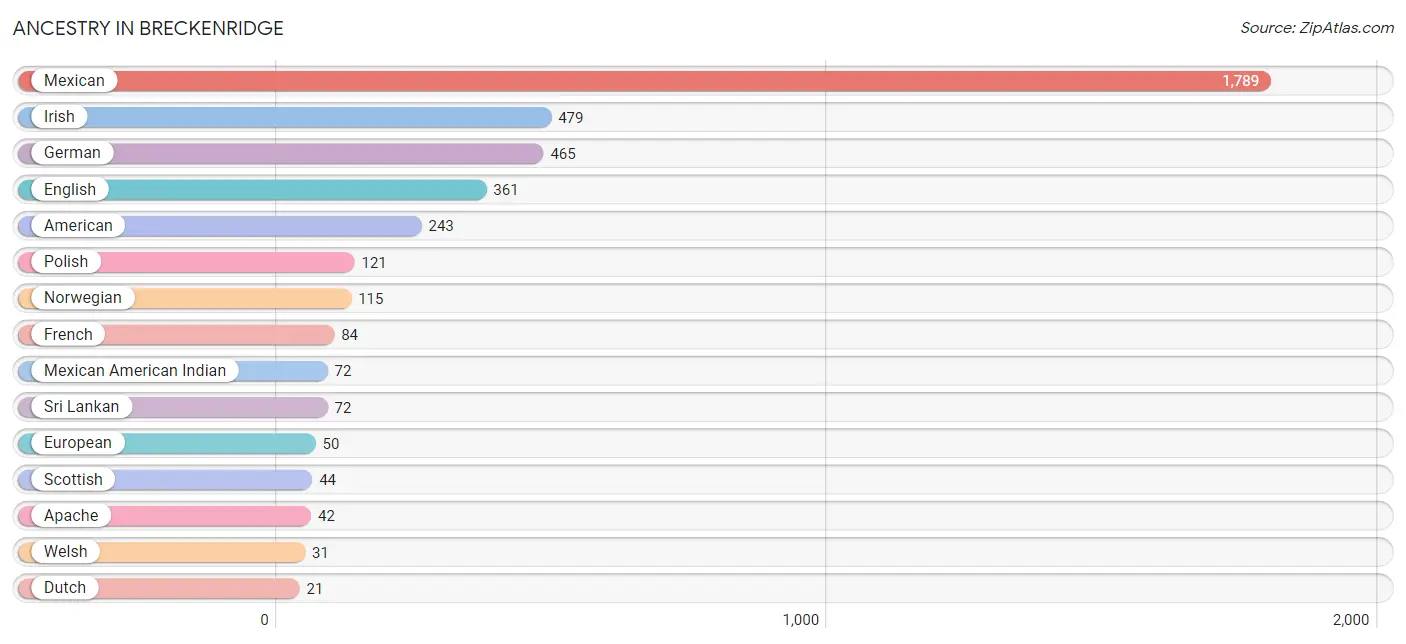
Ancestry in Breckenridge
The most populous ancestries reported in Breckenridge are Mexican (1,789 | 34.2%), Irish (479 | 9.2%), German (465 | 8.9%), English (361 | 6.9%), and American (243 | 4.6%), together accounting for 63.8% of all Breckenridge residents.
| Ancestry | # Population | % Population |
| Albanian | 8 | 0.2% |
| American | 243 | 4.6% |
| Apache | 42 | 0.8% |
| Austrian | 11 | 0.2% |
| Blackfeet | 6 | 0.1% |
| Dutch | 21 | 0.4% |
| English | 361 | 6.9% |
| European | 50 | 1.0% |
| French | 84 | 1.6% |
| German | 465 | 8.9% |
| Hungarian | 18 | 0.3% |
| Irish | 479 | 9.2% |
| Italian | 7 | 0.1% |
| Japanese | 8 | 0.2% |
| Mexican | 1,789 | 34.2% |
| Mexican American Indian | 72 | 1.4% |
| Northern European | 9 | 0.2% |
| Norwegian | 115 | 2.2% |
| Polish | 121 | 2.3% |
| Portuguese | 6 | 0.1% |
| Scotch-Irish | 11 | 0.2% |
| Scottish | 44 | 0.8% |
| Spaniard | 15 | 0.3% |
| Sri Lankan | 72 | 1.4% |
| Swedish | 17 | 0.3% |
| Thai | 9 | 0.2% |
| Welsh | 31 | 0.6% | View All 27 Rows |
Immigrants in Breckenridge
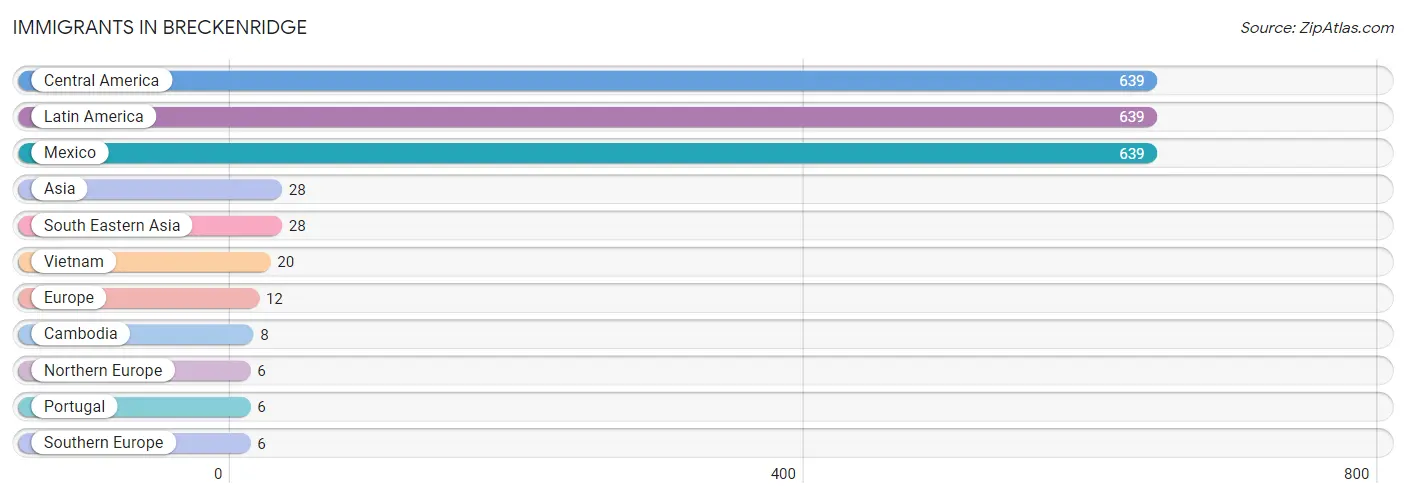
The most numerous immigrant groups reported in Breckenridge came from Central America (639 | 12.2%), Latin America (639 | 12.2%), Mexico (639 | 12.2%), Asia (28 | 0.5%), and South Eastern Asia (28 | 0.5%), together accounting for 37.7% of all Breckenridge residents.
| Immigration Origin | # Population | % Population |
| Asia | 28 | 0.5% |
| Cambodia | 8 | 0.2% |
| Central America | 639 | 12.2% |
| Europe | 12 | 0.2% |
| Latin America | 639 | 12.2% |
| Mexico | 639 | 12.2% |
| Northern Europe | 6 | 0.1% |
| Portugal | 6 | 0.1% |
| South Eastern Asia | 28 | 0.5% |
| Southern Europe | 6 | 0.1% |
| Vietnam | 20 | 0.4% | View All 11 Rows |
Sex and Age in Breckenridge
Sex and Age in Breckenridge
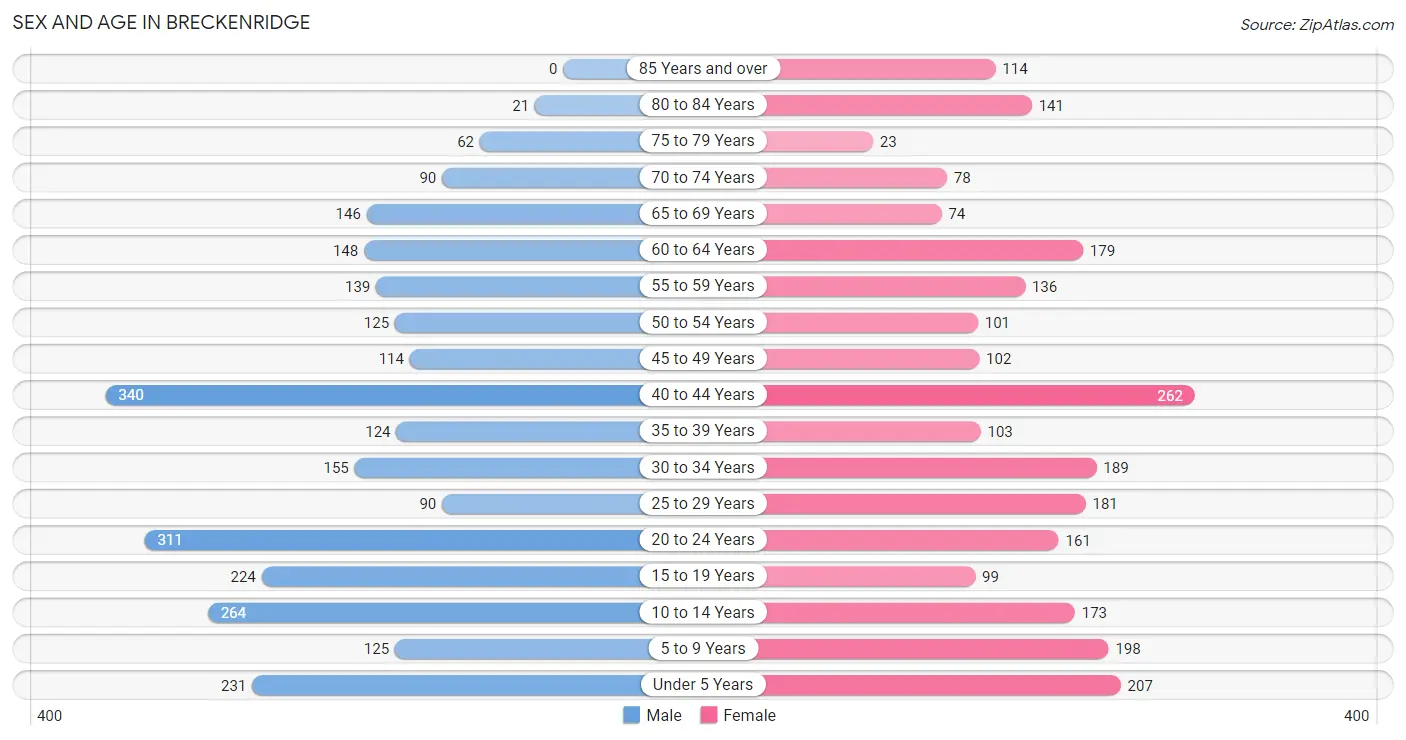
The most populous age groups in Breckenridge are 40 to 44 Years (340 | 12.6%) for men and 40 to 44 Years (262 | 10.4%) for women.
| Age Bracket | Male | Female |
| Under 5 Years | 231 (8.5%) | 207 (8.2%) |
| 5 to 9 Years | 125 (4.6%) | 198 (7.9%) |
| 10 to 14 Years | 264 (9.8%) | 173 (6.9%) |
| 15 to 19 Years | 224 (8.3%) | 99 (3.9%) |
| 20 to 24 Years | 311 (11.5%) | 161 (6.4%) |
| 25 to 29 Years | 90 (3.3%) | 181 (7.2%) |
| 30 to 34 Years | 155 (5.7%) | 189 (7.5%) |
| 35 to 39 Years | 124 (4.6%) | 103 (4.1%) |
| 40 to 44 Years | 340 (12.6%) | 262 (10.4%) |
| 45 to 49 Years | 114 (4.2%) | 102 (4.1%) |
| 50 to 54 Years | 125 (4.6%) | 101 (4.0%) |
| 55 to 59 Years | 139 (5.1%) | 136 (5.4%) |
| 60 to 64 Years | 148 (5.5%) | 179 (7.1%) |
| 65 to 69 Years | 146 (5.4%) | 74 (2.9%) |
| 70 to 74 Years | 90 (3.3%) | 78 (3.1%) |
| 75 to 79 Years | 62 (2.3%) | 23 (0.9%) |
| 80 to 84 Years | 21 (0.8%) | 141 (5.6%) |
| 85 Years and over | 0 (0.0%) | 114 (4.5%) |
| Total | 2,709 (100.0%) | 2,521 (100.0%) |
Families and Households in Breckenridge
Median Family Size in Breckenridge
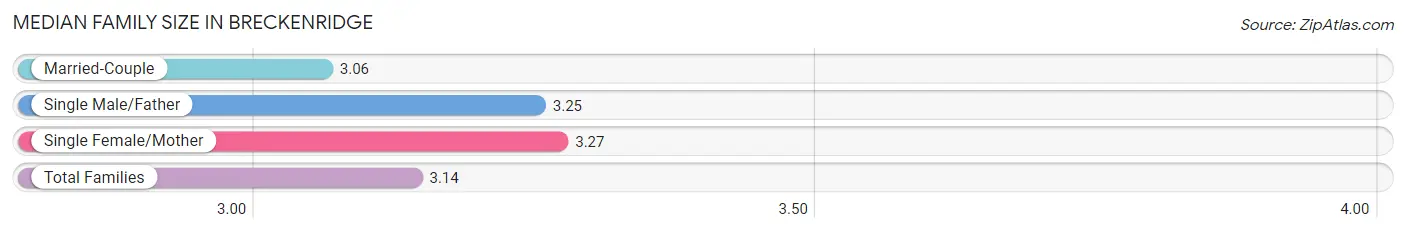
The median family size in Breckenridge is 3.14 persons per family, with single female/mother families (406 | 31.0%) accounting for the largest median family size of 3.27 persons per family. On the other hand, married-couple families (789 | 60.3%) represent the smallest median family size with 3.06 persons per family.
| Family Type | # Families | Family Size |
| Married-Couple | 789 (60.3%) | 3.06 |
| Single Male/Father | 114 (8.7%) | 3.25 |
| Single Female/Mother | 406 (31.0%) | 3.27 |
| Total Families | 1,309 (100.0%) | 3.14 |
Median Household Size in Breckenridge
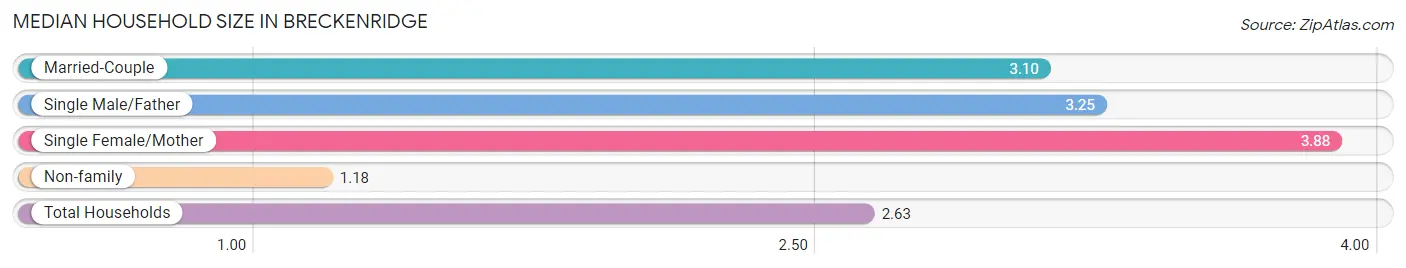
The median household size in Breckenridge is 2.63 persons per household, with single female/mother households (406 | 20.7%) accounting for the largest median household size of 3.88 persons per household. non-family households (655 | 33.4%) represent the smallest median household size with 1.18 persons per household.
| Household Type | # Households | Household Size |
| Married-Couple | 789 (40.2%) | 3.10 |
| Single Male/Father | 114 (5.8%) | 3.25 |
| Single Female/Mother | 406 (20.7%) | 3.88 |
| Non-family | 655 (33.4%) | 1.18 |
| Total Households | 1,964 (100.0%) | 2.63 |
Household Size by Marriage Status in Breckenridge
Out of a total of 1,964 households in Breckenridge, 1,309 (66.6%) are family households, while 655 (33.4%) are nonfamily households. The most numerous type of family households are 2-person households, comprising 520, and the most common type of nonfamily households are 1-person households, comprising 620.
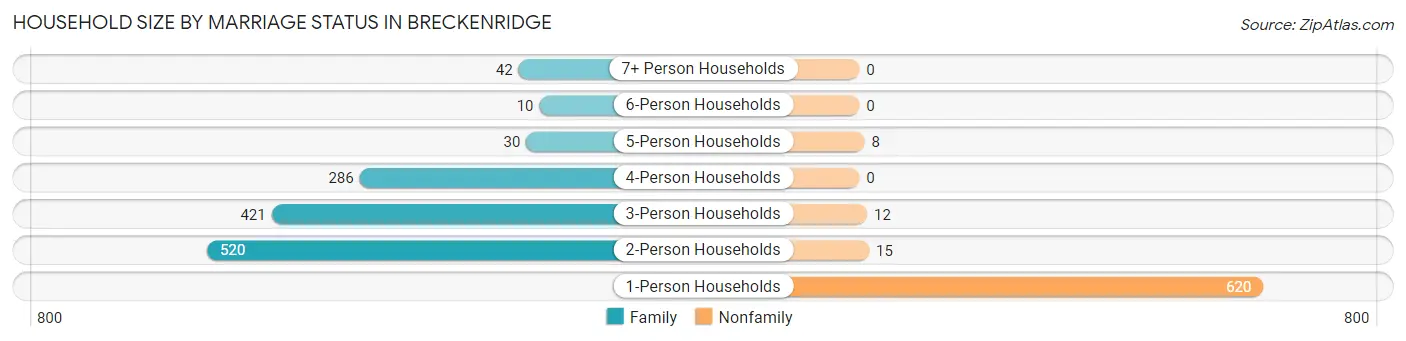
| Household Size | Family Households | Nonfamily Households |
| 1-Person Households | - | 620 (31.6%) |
| 2-Person Households | 520 (26.5%) | 15 (0.8%) |
| 3-Person Households | 421 (21.4%) | 12 (0.6%) |
| 4-Person Households | 286 (14.6%) | 0 (0.0%) |
| 5-Person Households | 30 (1.5%) | 8 (0.4%) |
| 6-Person Households | 10 (0.5%) | 0 (0.0%) |
| 7+ Person Households | 42 (2.1%) | 0 (0.0%) |
| Total | 1,309 (66.6%) | 655 (33.4%) |
Female Fertility in Breckenridge
Fertility by Age in Breckenridge
Average fertility rate in Breckenridge is 16.0 births per 1,000 women. Women in the age bracket of 20 to 34 years have the highest fertility rate with 34.0 births per 1,000 women. Women in the age bracket of 20 to 34 years acount for 100.0% of all women with births.
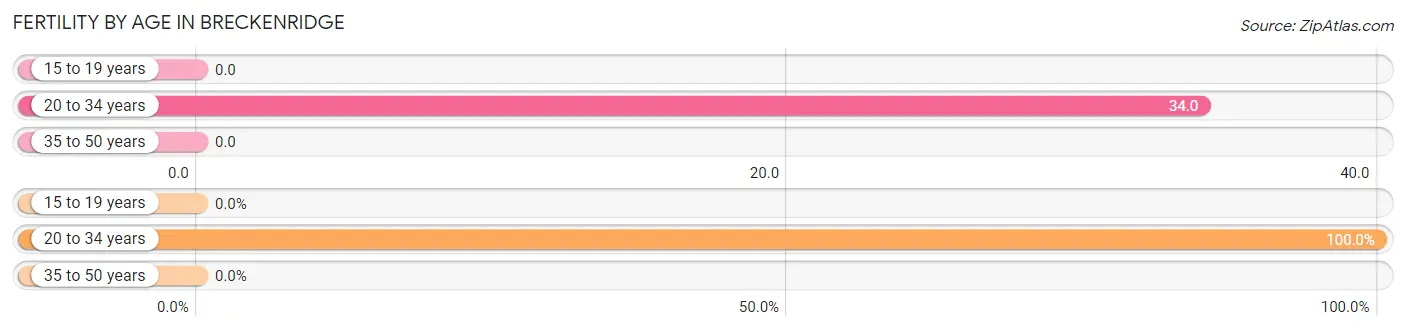
| Age Bracket | Women with Births | Births / 1,000 Women |
| 15 to 19 years | 0 (0.0%) | 0.0 |
| 20 to 34 years | 18 (100.0%) | 34.0 |
| 35 to 50 years | 0 (0.0%) | 0.0 |
| Total | 18 (100.0%) | 16.0 |
Fertility by Age by Marriage Status in Breckenridge
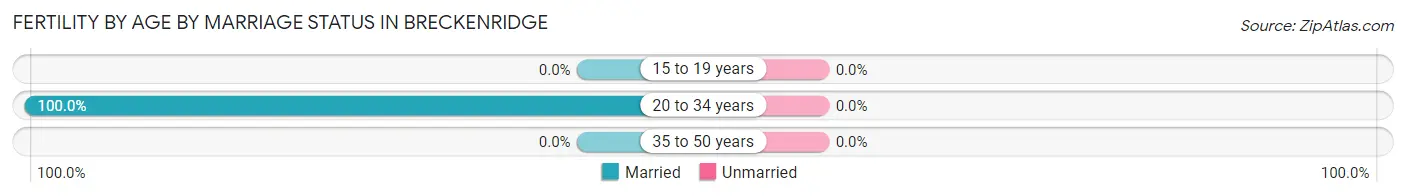
| Age Bracket | Married | Unmarried |
| 15 to 19 years | 0 (0.0%) | 0 (0.0%) |
| 20 to 34 years | 18 (100.0%) | 0 (0.0%) |
| 35 to 50 years | 0 (0.0%) | 0 (0.0%) |
| Total | 18 (100.0%) | 0 (0.0%) |
Fertility by Education in Breckenridge
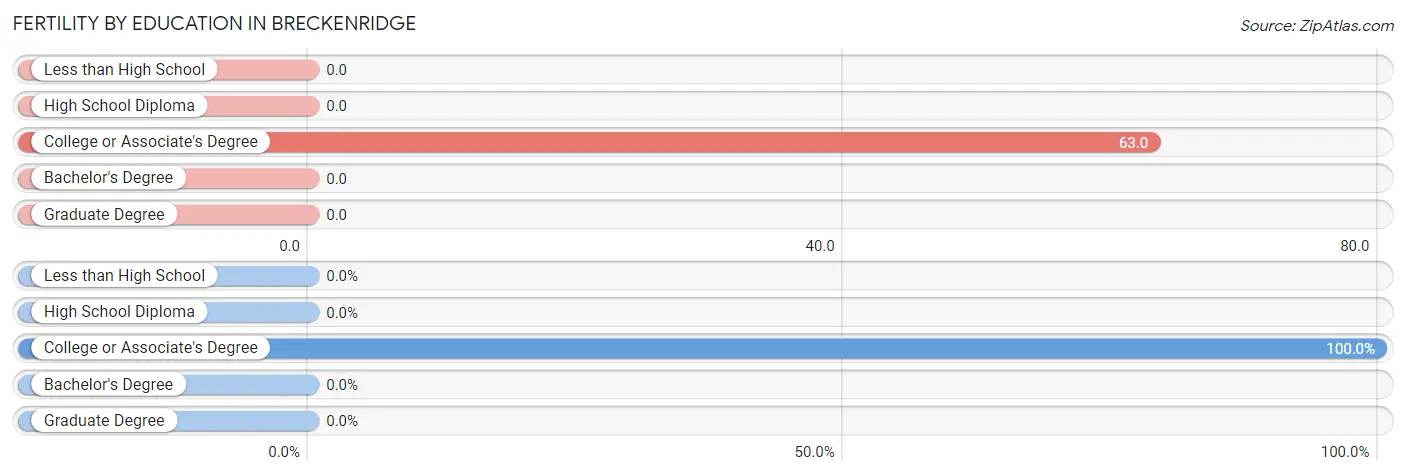
| Educational Attainment | Women with Births | Births / 1,000 Women |
| Less than High School | 0 (0.0%) | 0.0 |
| High School Diploma | 0 (0.0%) | 0.0 |
| College or Associate's Degree | 18 (100.0%) | 63.0 |
| Bachelor's Degree | 0 (0.0%) | 0.0 |
| Graduate Degree | 0 (0.0%) | 0.0 |
| Total | 18 (100.0%) | 16.0 |
Fertility by Education by Marriage Status in Breckenridge
| Educational Attainment | Married | Unmarried |
| Less than High School | 0 (0.0%) | 0 (0.0%) |
| High School Diploma | 0 (0.0%) | 0 (0.0%) |
| College or Associate's Degree | 18 (100.0%) | 0 (0.0%) |
| Bachelor's Degree | 0 (0.0%) | 0 (0.0%) |
| Graduate Degree | 0 (0.0%) | 0 (0.0%) |
| Total | 18 (100.0%) | 0 (0.0%) |
Employment Characteristics in Breckenridge
Employment by Class of Employer in Breckenridge
Among the 2,149 employed individuals in Breckenridge, private company employees (1,244 | 57.9%), state government employees (274 | 12.8%), and local government employees (229 | 10.7%) make up the most common classes of employment.
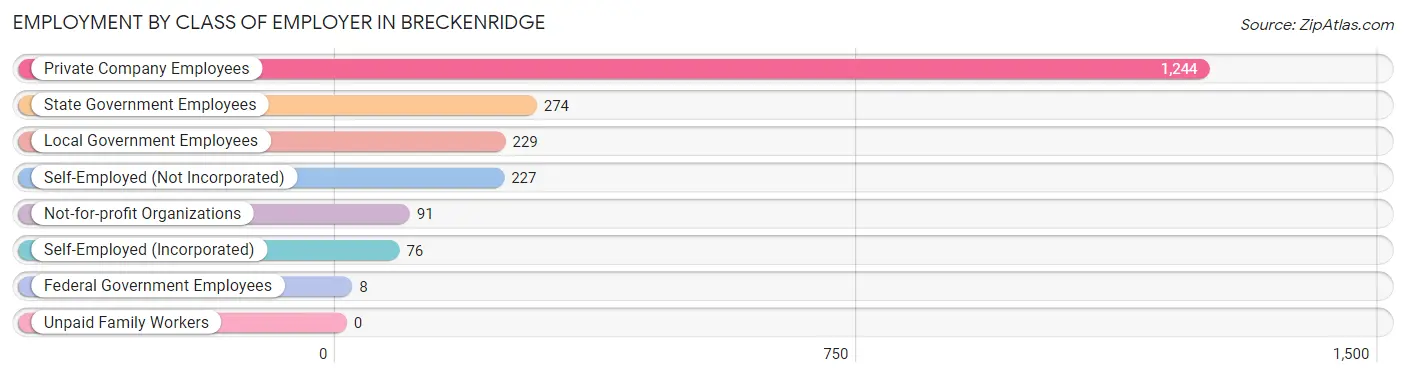
| Employer Class | # Employees | % Employees |
| Private Company Employees | 1,244 | 57.9% |
| Self-Employed (Incorporated) | 76 | 3.5% |
| Self-Employed (Not Incorporated) | 227 | 10.6% |
| Not-for-profit Organizations | 91 | 4.2% |
| Local Government Employees | 229 | 10.7% |
| State Government Employees | 274 | 12.8% |
| Federal Government Employees | 8 | 0.4% |
| Unpaid Family Workers | 0 | 0.0% |
| Total | 2,149 | 100.0% |
Employment Status by Age in Breckenridge
According to the labor force statistics for Breckenridge, out of the total population over 16 years of age (3,948), 63.9% or 2,523 individuals are in the labor force, with 13.1% or 331 of them unemployed. The age group with the highest labor force participation rate is 35 to 44 years, with 94.3% or 782 individuals in the labor force. Within the labor force, the 16 to 19 years age range has the highest percentage of unemployed individuals, with 37.7% or 29 of them being unemployed.
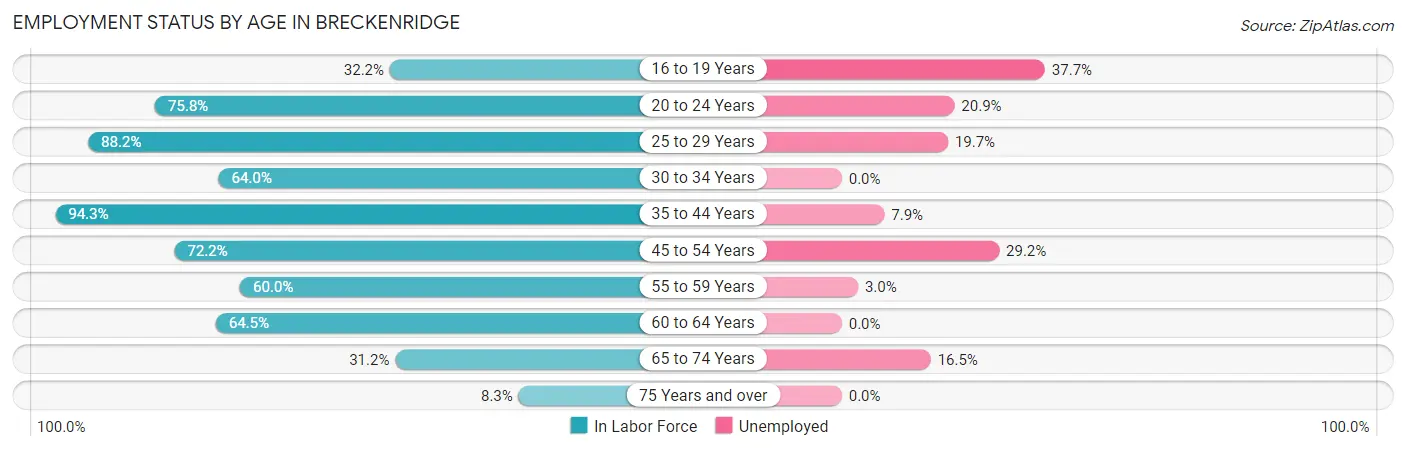
| Age Bracket | In Labor Force | Unemployed |
| 16 to 19 Years | 77 (32.2%) | 29 (37.7%) |
| 20 to 24 Years | 358 (75.8%) | 75 (20.9%) |
| 25 to 29 Years | 239 (88.2%) | 47 (19.7%) |
| 30 to 34 Years | 220 (64.0%) | 0 (0.0%) |
| 35 to 44 Years | 782 (94.3%) | 62 (7.9%) |
| 45 to 54 Years | 319 (72.2%) | 93 (29.2%) |
| 55 to 59 Years | 165 (60.0%) | 5 (3.0%) |
| 60 to 64 Years | 211 (64.5%) | 0 (0.0%) |
| 65 to 74 Years | 121 (31.2%) | 20 (16.5%) |
| 75 Years and over | 30 (8.3%) | 0 (0.0%) |
| Total | 2,523 (63.9%) | 331 (13.1%) |
Employment Status by Educational Attainment in Breckenridge
According to labor force statistics for Breckenridge, 77.8% of individuals (1,936) out of the total population between 25 and 64 years of age (2,488) are in the labor force, with 10.7% or 207 of them being unemployed. The group with the highest labor force participation rate are those with the educational attainment of bachelor's degree or higher, with 89.4% or 338 individuals in the labor force. Within the labor force, individuals with bachelor's degree or higher education have the highest percentage of unemployment, with 25.7% or 87 of them being unemployed.
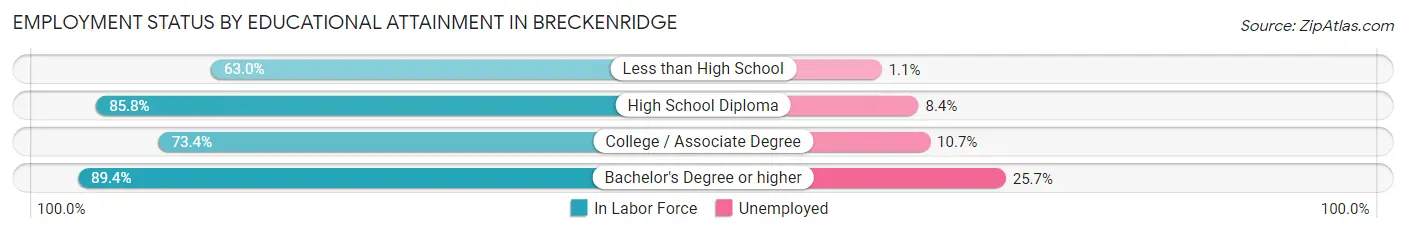
| Educational Attainment | In Labor Force | Unemployed |
| Less than High School | 349 (63.0%) | 6 (1.1%) |
| High School Diploma | 742 (85.8%) | 73 (8.4%) |
| College / Associate Degree | 507 (73.4%) | 74 (10.7%) |
| Bachelor's Degree or higher | 338 (89.4%) | 97 (25.7%) |
| Total | 1,936 (77.8%) | 266 (10.7%) |
Employment Occupations by Sex in Breckenridge
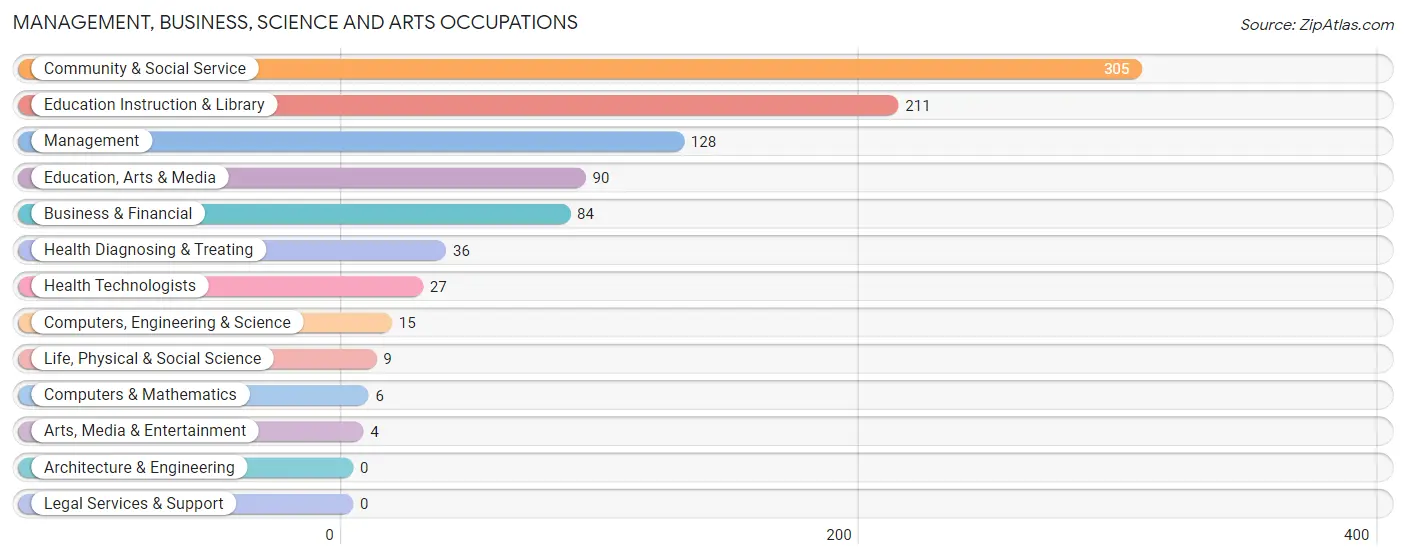
Management, Business, Science and Arts Occupations
The most common Management, Business, Science and Arts occupations in Breckenridge are Community & Social Service (305 | 13.9%), Education Instruction & Library (211 | 9.6%), Management (128 | 5.8%), Education, Arts & Media (90 | 4.1%), and Business & Financial (84 | 3.8%).
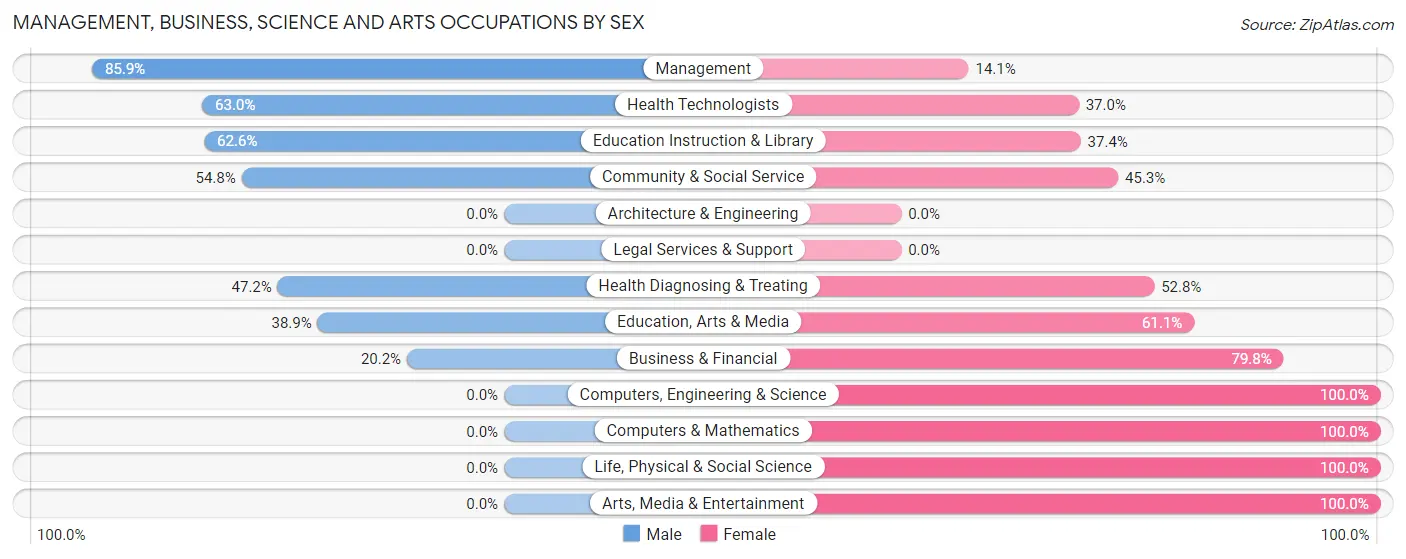
Management, Business, Science and Arts Occupations by Sex
Within the Management, Business, Science and Arts occupations in Breckenridge, the most male-oriented occupations are Management (85.9%), Health Technologists (63.0%), and Education Instruction & Library (62.6%), while the most female-oriented occupations are Computers, Engineering & Science (100.0%), Computers & Mathematics (100.0%), and Life, Physical & Social Science (100.0%).
| Occupation | Male | Female |
| Management | 110 (85.9%) | 18 (14.1%) |
| Business & Financial | 17 (20.2%) | 67 (79.8%) |
| Computers, Engineering & Science | 0 (0.0%) | 15 (100.0%) |
| Computers & Mathematics | 0 (0.0%) | 6 (100.0%) |
| Architecture & Engineering | 0 (0.0%) | 0 (0.0%) |
| Life, Physical & Social Science | 0 (0.0%) | 9 (100.0%) |
| Community & Social Service | 167 (54.7%) | 138 (45.3%) |
| Education, Arts & Media | 35 (38.9%) | 55 (61.1%) |
| Legal Services & Support | 0 (0.0%) | 0 (0.0%) |
| Education Instruction & Library | 132 (62.6%) | 79 (37.4%) |
| Arts, Media & Entertainment | 0 (0.0%) | 4 (100.0%) |
| Health Diagnosing & Treating | 17 (47.2%) | 19 (52.8%) |
| Health Technologists | 17 (63.0%) | 10 (37.0%) |
| Total (Category) | 311 (54.7%) | 257 (45.3%) |
| Total (Overall) | 1,165 (53.2%) | 1,026 (46.8%) |
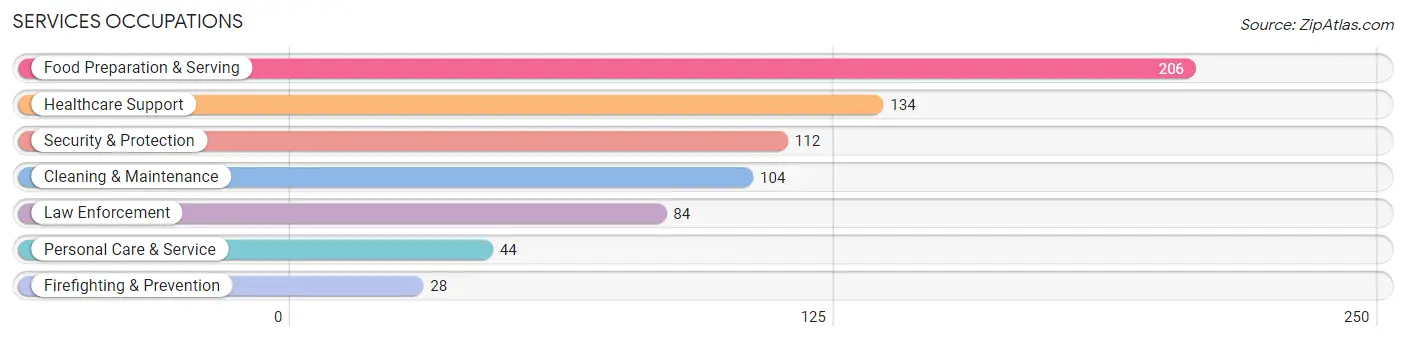
Services Occupations
The most common Services occupations in Breckenridge are Food Preparation & Serving (206 | 9.4%), Healthcare Support (134 | 6.1%), Security & Protection (112 | 5.1%), Cleaning & Maintenance (104 | 4.8%), and Law Enforcement (84 | 3.8%).
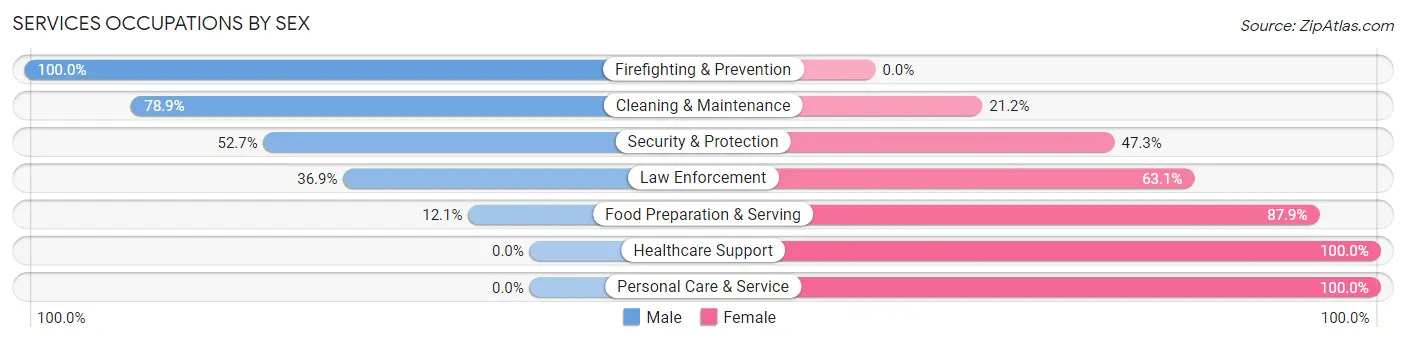
Services Occupations by Sex
Within the Services occupations in Breckenridge, the most male-oriented occupations are Firefighting & Prevention (100.0%), Cleaning & Maintenance (78.8%), and Security & Protection (52.7%), while the most female-oriented occupations are Healthcare Support (100.0%), Personal Care & Service (100.0%), and Food Preparation & Serving (87.9%).
| Occupation | Male | Female |
| Healthcare Support | 0 (0.0%) | 134 (100.0%) |
| Security & Protection | 59 (52.7%) | 53 (47.3%) |
| Firefighting & Prevention | 28 (100.0%) | 0 (0.0%) |
| Law Enforcement | 31 (36.9%) | 53 (63.1%) |
| Food Preparation & Serving | 25 (12.1%) | 181 (87.9%) |
| Cleaning & Maintenance | 82 (78.8%) | 22 (21.1%) |
| Personal Care & Service | 0 (0.0%) | 44 (100.0%) |
| Total (Category) | 166 (27.7%) | 434 (72.3%) |
| Total (Overall) | 1,165 (53.2%) | 1,026 (46.8%) |
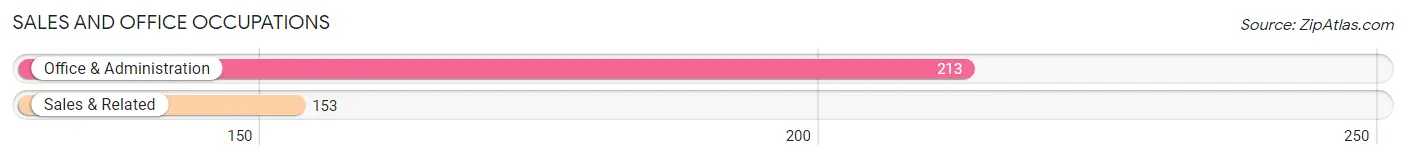
Sales and Office Occupations
The most common Sales and Office occupations in Breckenridge are Office & Administration (213 | 9.7%), and Sales & Related (153 | 7.0%).
Sales and Office Occupations by Sex
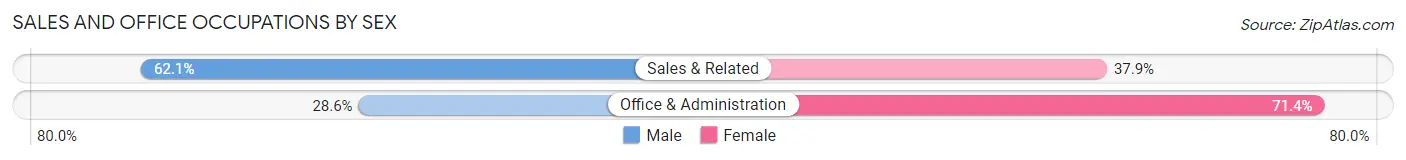
| Occupation | Male | Female |
| Sales & Related | 95 (62.1%) | 58 (37.9%) |
| Office & Administration | 61 (28.6%) | 152 (71.4%) |
| Total (Category) | 156 (42.6%) | 210 (57.4%) |
| Total (Overall) | 1,165 (53.2%) | 1,026 (46.8%) |
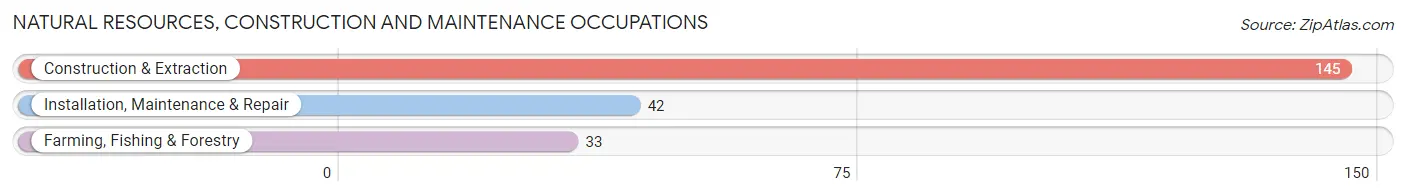
Natural Resources, Construction and Maintenance Occupations
The most common Natural Resources, Construction and Maintenance occupations in Breckenridge are Construction & Extraction (145 | 6.6%), Installation, Maintenance & Repair (42 | 1.9%), and Farming, Fishing & Forestry (33 | 1.5%).
Natural Resources, Construction and Maintenance Occupations by Sex
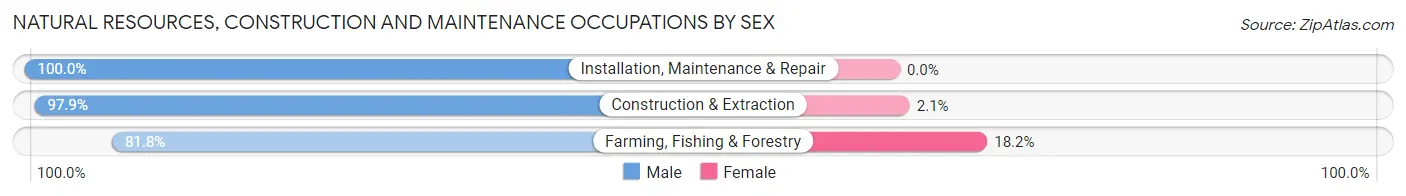
| Occupation | Male | Female |
| Farming, Fishing & Forestry | 27 (81.8%) | 6 (18.2%) |
| Construction & Extraction | 142 (97.9%) | 3 (2.1%) |
| Installation, Maintenance & Repair | 42 (100.0%) | 0 (0.0%) |
| Total (Category) | 211 (95.9%) | 9 (4.1%) |
| Total (Overall) | 1,165 (53.2%) | 1,026 (46.8%) |
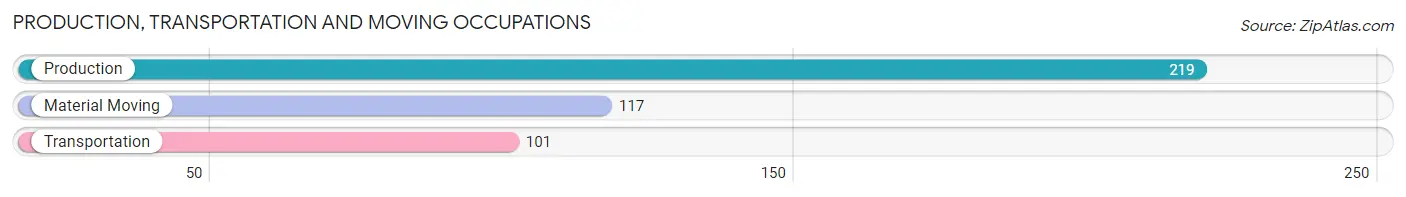
Production, Transportation and Moving Occupations
The most common Production, Transportation and Moving occupations in Breckenridge are Production (219 | 10.0%), Material Moving (117 | 5.3%), and Transportation (101 | 4.6%).
Production, Transportation and Moving Occupations by Sex
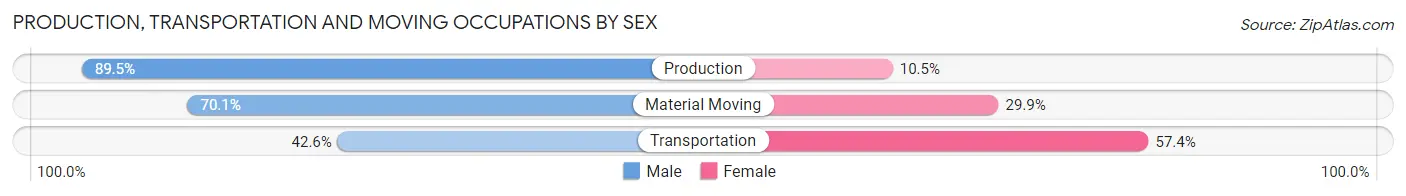
| Occupation | Male | Female |
| Production | 196 (89.5%) | 23 (10.5%) |
| Transportation | 43 (42.6%) | 58 (57.4%) |
| Material Moving | 82 (70.1%) | 35 (29.9%) |
| Total (Category) | 321 (73.5%) | 116 (26.5%) |
| Total (Overall) | 1,165 (53.2%) | 1,026 (46.8%) |
Employment Industries by Sex in Breckenridge
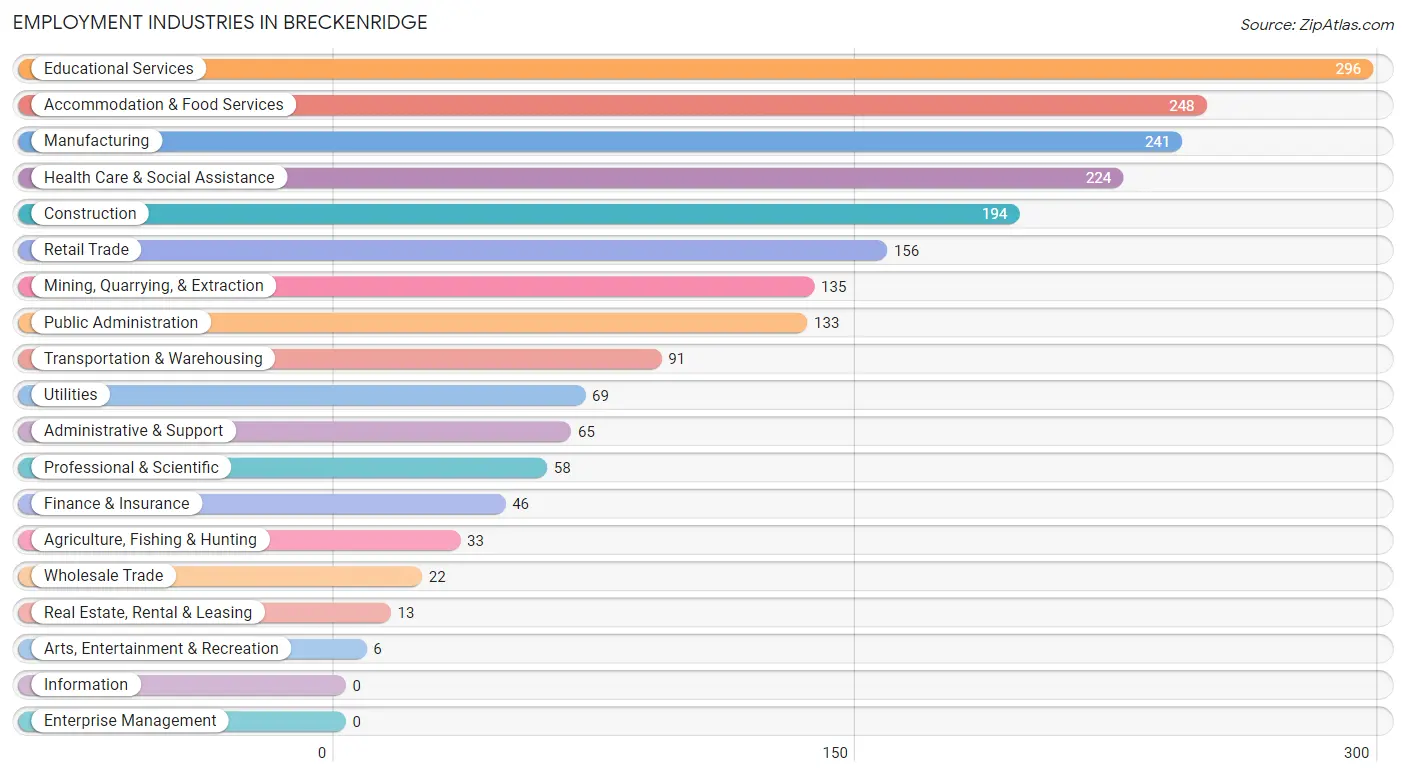
Employment Industries in Breckenridge
The major employment industries in Breckenridge include Educational Services (296 | 13.5%), Accommodation & Food Services (248 | 11.3%), Manufacturing (241 | 11.0%), Health Care & Social Assistance (224 | 10.2%), and Construction (194 | 8.8%).
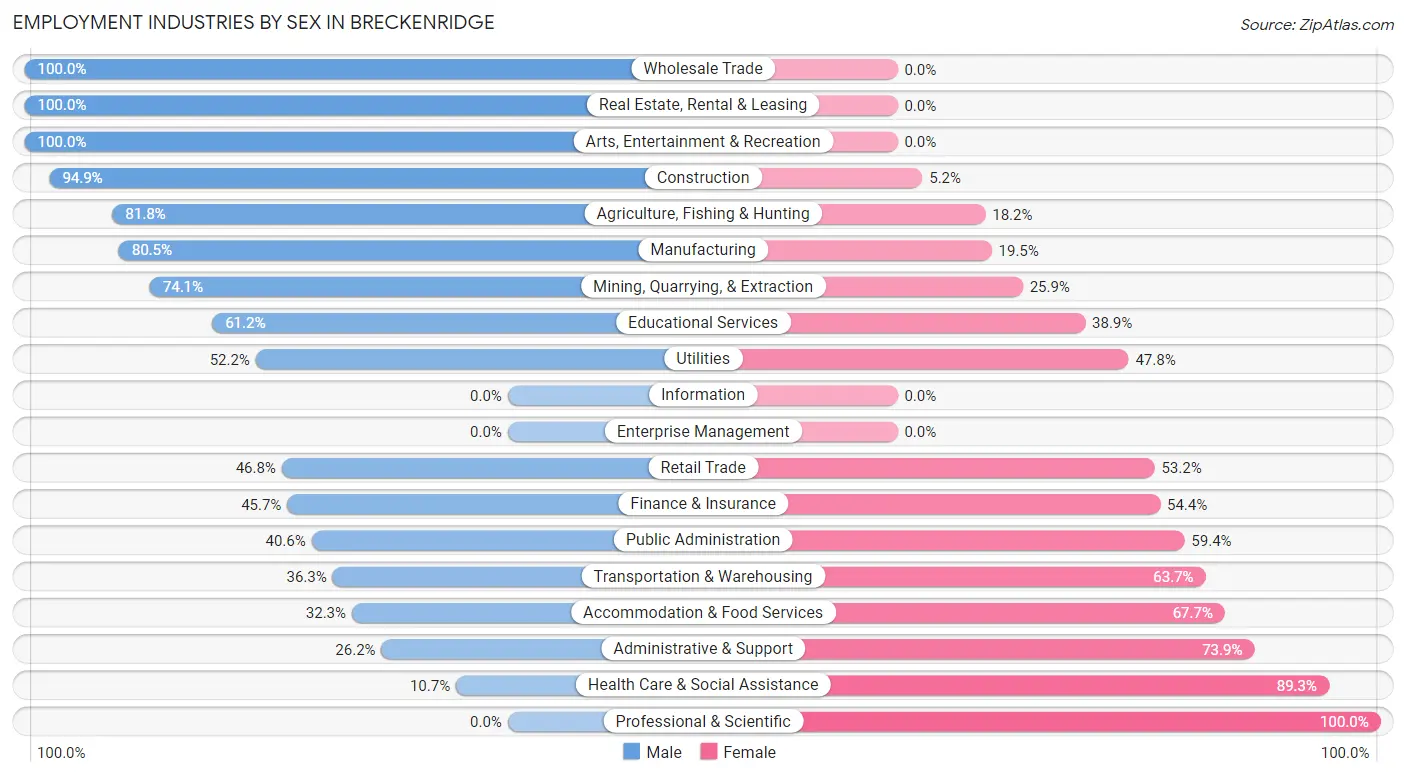
Employment Industries by Sex in Breckenridge
The Breckenridge industries that see more men than women are Wholesale Trade (100.0%), Real Estate, Rental & Leasing (100.0%), and Arts, Entertainment & Recreation (100.0%), whereas the industries that tend to have a higher number of women are Professional & Scientific (100.0%), Health Care & Social Assistance (89.3%), and Administrative & Support (73.9%).
| Industry | Male | Female |
| Agriculture, Fishing & Hunting | 27 (81.8%) | 6 (18.2%) |
| Mining, Quarrying, & Extraction | 100 (74.1%) | 35 (25.9%) |
| Construction | 184 (94.9%) | 10 (5.1%) |
| Manufacturing | 194 (80.5%) | 47 (19.5%) |
| Wholesale Trade | 22 (100.0%) | 0 (0.0%) |
| Retail Trade | 73 (46.8%) | 83 (53.2%) |
| Transportation & Warehousing | 33 (36.3%) | 58 (63.7%) |
| Utilities | 36 (52.2%) | 33 (47.8%) |
| Information | 0 (0.0%) | 0 (0.0%) |
| Finance & Insurance | 21 (45.7%) | 25 (54.3%) |
| Real Estate, Rental & Leasing | 13 (100.0%) | 0 (0.0%) |
| Professional & Scientific | 0 (0.0%) | 58 (100.0%) |
| Enterprise Management | 0 (0.0%) | 0 (0.0%) |
| Administrative & Support | 17 (26.2%) | 48 (73.9%) |
| Educational Services | 181 (61.2%) | 115 (38.9%) |
| Health Care & Social Assistance | 24 (10.7%) | 200 (89.3%) |
| Arts, Entertainment & Recreation | 6 (100.0%) | 0 (0.0%) |
| Accommodation & Food Services | 80 (32.3%) | 168 (67.7%) |
| Public Administration | 54 (40.6%) | 79 (59.4%) |
| Total | 1,165 (53.2%) | 1,026 (46.8%) |
Education in Breckenridge
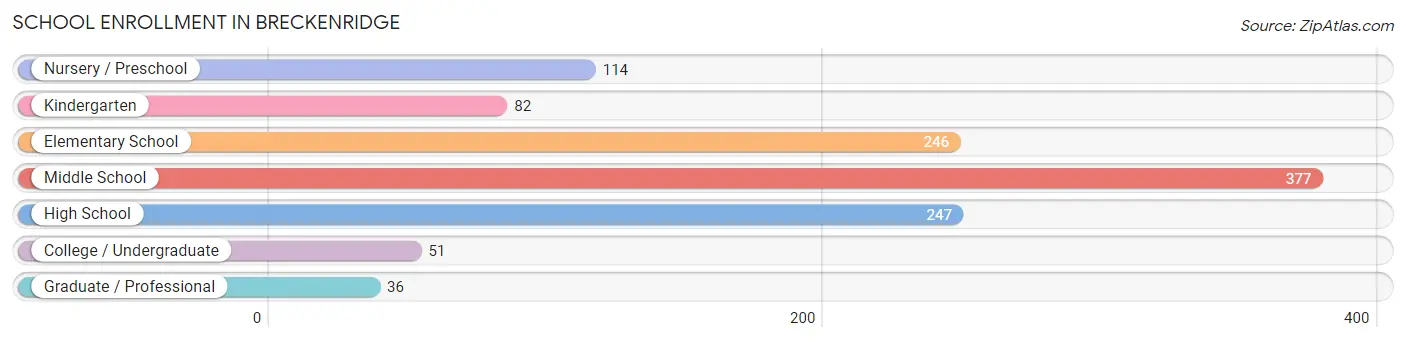
School Enrollment in Breckenridge
The most common levels of schooling among the 1,153 students in Breckenridge are middle school (377 | 32.7%), high school (247 | 21.4%), and elementary school (246 | 21.3%).
| School Level | # Students | % Students |
| Nursery / Preschool | 114 | 9.9% |
| Kindergarten | 82 | 7.1% |
| Elementary School | 246 | 21.3% |
| Middle School | 377 | 32.7% |
| High School | 247 | 21.4% |
| College / Undergraduate | 51 | 4.4% |
| Graduate / Professional | 36 | 3.1% |
| Total | 1,153 | 100.0% |
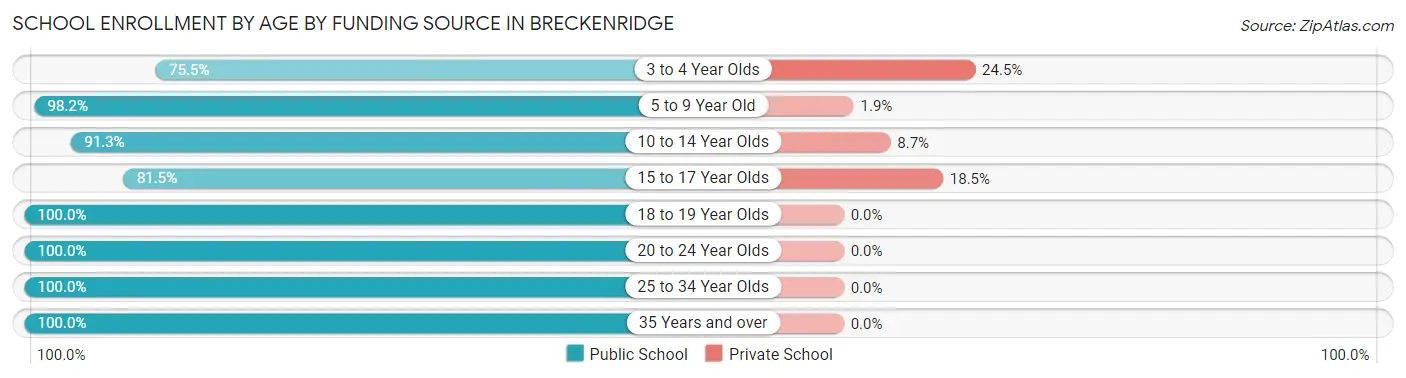
School Enrollment by Age by Funding Source in Breckenridge
Out of a total of 1,153 students who are enrolled in schools in Breckenridge, 106 (9.2%) attend a private institution, while the remaining 1,047 (90.8%) are enrolled in public schools. The age group of 3 to 4 year olds has the highest likelihood of being enrolled in private schools, with 24 (24.5% in the age bracket) enrolled. Conversely, the age group of 18 to 19 year olds has the lowest likelihood of being enrolled in a private school, with 55 (100.0% in the age bracket) attending a public institution.
| Age Bracket | Public School | Private School |
| 3 to 4 Year Olds | 74 (75.5%) | 24 (24.5%) |
| 5 to 9 Year Old | 266 (98.2%) | 5 (1.8%) |
| 10 to 14 Year Olds | 399 (91.3%) | 38 (8.7%) |
| 15 to 17 Year Olds | 172 (81.5%) | 39 (18.5%) |
| 18 to 19 Year Olds | 55 (100.0%) | 0 (0.0%) |
| 20 to 24 Year Olds | 23 (100.0%) | 0 (0.0%) |
| 25 to 34 Year Olds | 9 (100.0%) | 0 (0.0%) |
| 35 Years and over | 49 (100.0%) | 0 (0.0%) |
| Total | 1,047 (90.8%) | 106 (9.2%) |
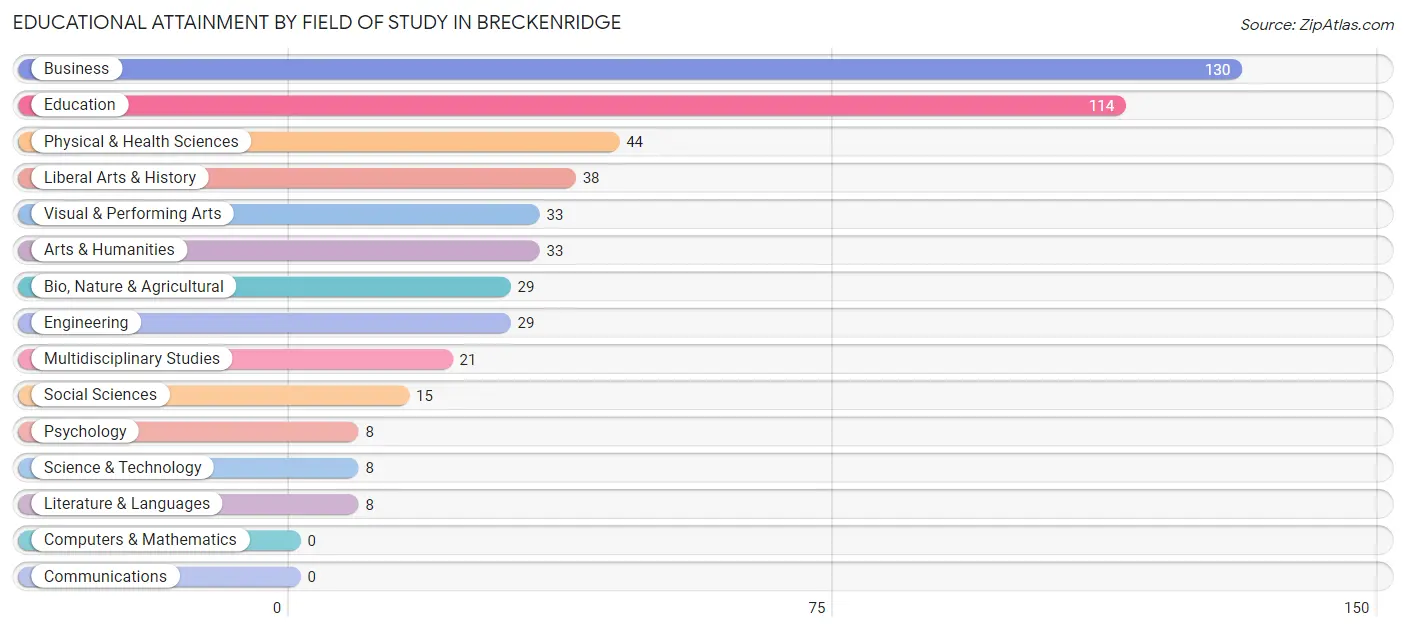
Educational Attainment by Field of Study in Breckenridge
Business (130 | 25.5%), education (114 | 22.4%), physical & health sciences (44 | 8.6%), liberal arts & history (38 | 7.4%), and visual & performing arts (33 | 6.5%) are the most common fields of study among 510 individuals in Breckenridge who have obtained a bachelor's degree or higher.
| Field of Study | # Graduates | % Graduates |
| Computers & Mathematics | 0 | 0.0% |
| Bio, Nature & Agricultural | 29 | 5.7% |
| Physical & Health Sciences | 44 | 8.6% |
| Psychology | 8 | 1.6% |
| Social Sciences | 15 | 2.9% |
| Engineering | 29 | 5.7% |
| Multidisciplinary Studies | 21 | 4.1% |
| Science & Technology | 8 | 1.6% |
| Business | 130 | 25.5% |
| Education | 114 | 22.4% |
| Literature & Languages | 8 | 1.6% |
| Liberal Arts & History | 38 | 7.4% |
| Visual & Performing Arts | 33 | 6.5% |
| Communications | 0 | 0.0% |
| Arts & Humanities | 33 | 6.5% |
| Total | 510 | 100.0% |
Transportation & Commute in Breckenridge
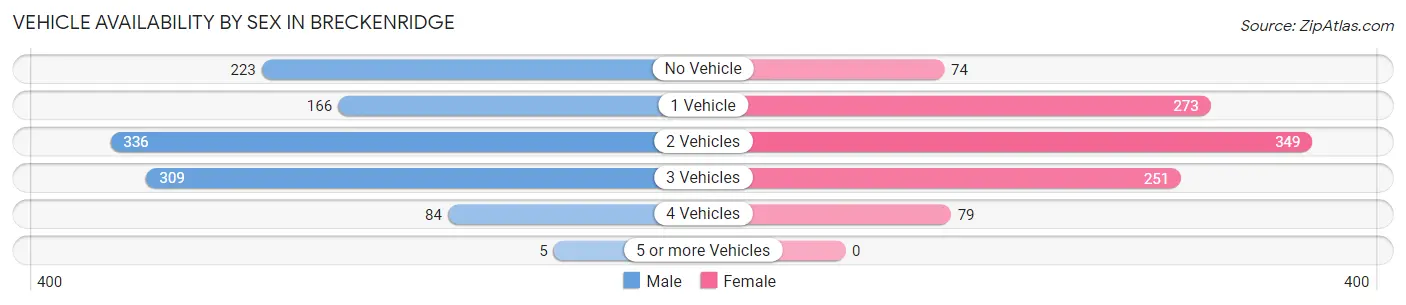
Vehicle Availability by Sex in Breckenridge
The most prevalent vehicle ownership categories in Breckenridge are males with 2 vehicles (336, accounting for 29.9%) and females with 2 vehicles (349, making up 32.8%).
| Vehicles Available | Male | Female |
| No Vehicle | 223 (19.9%) | 74 (7.2%) |
| 1 Vehicle | 166 (14.8%) | 273 (26.6%) |
| 2 Vehicles | 336 (29.9%) | 349 (34.0%) |
| 3 Vehicles | 309 (27.5%) | 251 (24.5%) |
| 4 Vehicles | 84 (7.5%) | 79 (7.7%) |
| 5 or more Vehicles | 5 (0.4%) | 0 (0.0%) |
| Total | 1,123 (100.0%) | 1,026 (100.0%) |
Commute Time in Breckenridge
The most frequently occuring commute durations in Breckenridge are 5 to 9 minutes (700 commuters, 33.9%), 10 to 14 minutes (467 commuters, 22.6%), and less than 5 minutes (273 commuters, 13.2%).
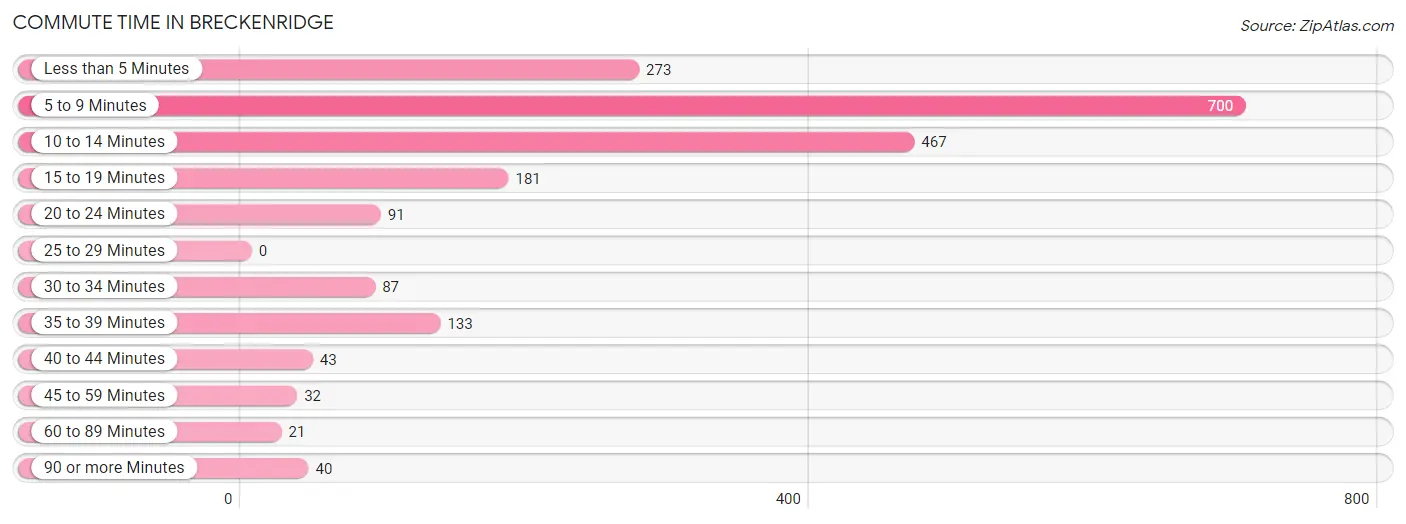
| Commute Time | # Commuters | % Commuters |
| Less than 5 Minutes | 273 | 13.2% |
| 5 to 9 Minutes | 700 | 33.9% |
| 10 to 14 Minutes | 467 | 22.6% |
| 15 to 19 Minutes | 181 | 8.7% |
| 20 to 24 Minutes | 91 | 4.4% |
| 25 to 29 Minutes | 0 | 0.0% |
| 30 to 34 Minutes | 87 | 4.2% |
| 35 to 39 Minutes | 133 | 6.4% |
| 40 to 44 Minutes | 43 | 2.1% |
| 45 to 59 Minutes | 32 | 1.5% |
| 60 to 89 Minutes | 21 | 1.0% |
| 90 or more Minutes | 40 | 1.9% |
Commute Time by Sex in Breckenridge
The most common commute times in Breckenridge are 5 to 9 minutes (321 commuters, 29.4%) for males and 5 to 9 minutes (379 commuters, 38.8%) for females.
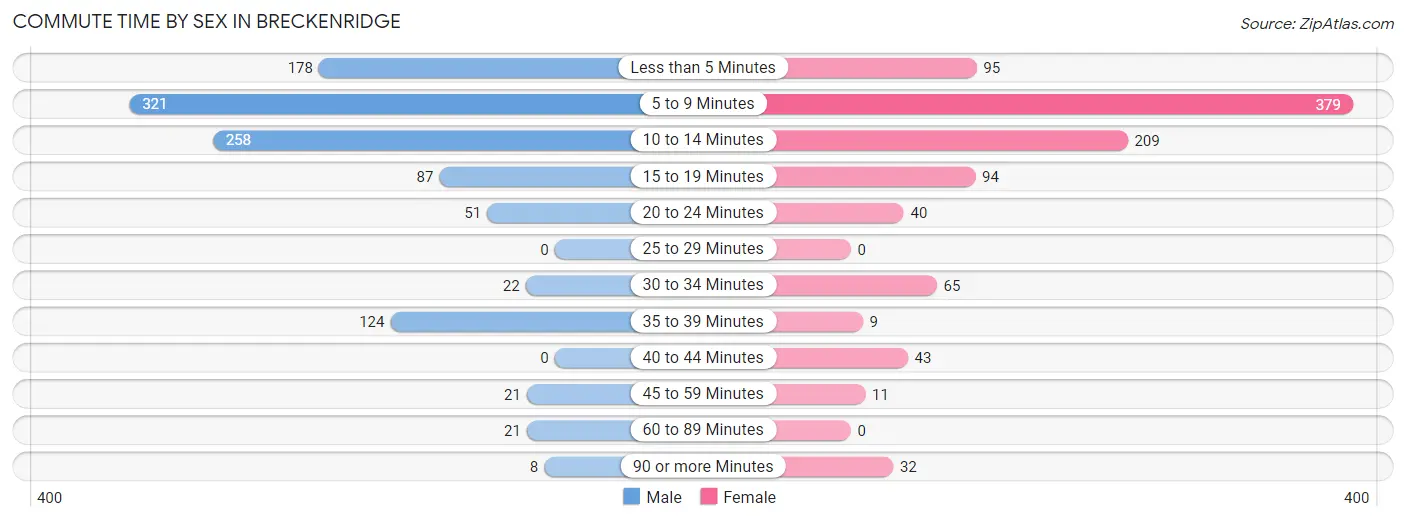
| Commute Time | Male | Female |
| Less than 5 Minutes | 178 (16.3%) | 95 (9.7%) |
| 5 to 9 Minutes | 321 (29.4%) | 379 (38.8%) |
| 10 to 14 Minutes | 258 (23.6%) | 209 (21.4%) |
| 15 to 19 Minutes | 87 (8.0%) | 94 (9.6%) |
| 20 to 24 Minutes | 51 (4.7%) | 40 (4.1%) |
| 25 to 29 Minutes | 0 (0.0%) | 0 (0.0%) |
| 30 to 34 Minutes | 22 (2.0%) | 65 (6.7%) |
| 35 to 39 Minutes | 124 (11.4%) | 9 (0.9%) |
| 40 to 44 Minutes | 0 (0.0%) | 43 (4.4%) |
| 45 to 59 Minutes | 21 (1.9%) | 11 (1.1%) |
| 60 to 89 Minutes | 21 (1.9%) | 0 (0.0%) |
| 90 or more Minutes | 8 (0.7%) | 32 (3.3%) |
Time of Departure to Work by Sex in Breckenridge
The most frequent times of departure to work in Breckenridge are 6:30 AM to 6:59 AM (276, 25.3%) for males and 7:30 AM to 7:59 AM (332, 34.0%) for females.
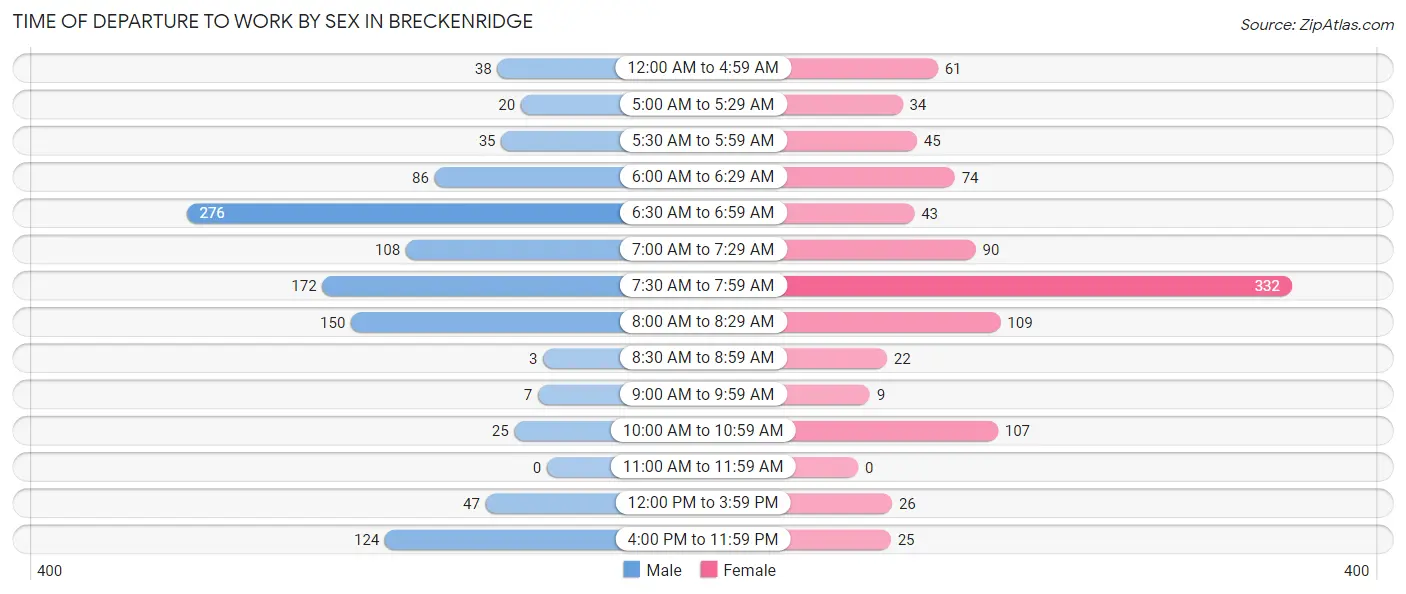
| Time of Departure | Male | Female |
| 12:00 AM to 4:59 AM | 38 (3.5%) | 61 (6.2%) |
| 5:00 AM to 5:29 AM | 20 (1.8%) | 34 (3.5%) |
| 5:30 AM to 5:59 AM | 35 (3.2%) | 45 (4.6%) |
| 6:00 AM to 6:29 AM | 86 (7.9%) | 74 (7.6%) |
| 6:30 AM to 6:59 AM | 276 (25.3%) | 43 (4.4%) |
| 7:00 AM to 7:29 AM | 108 (9.9%) | 90 (9.2%) |
| 7:30 AM to 7:59 AM | 172 (15.8%) | 332 (34.0%) |
| 8:00 AM to 8:29 AM | 150 (13.8%) | 109 (11.2%) |
| 8:30 AM to 8:59 AM | 3 (0.3%) | 22 (2.2%) |
| 9:00 AM to 9:59 AM | 7 (0.6%) | 9 (0.9%) |
| 10:00 AM to 10:59 AM | 25 (2.3%) | 107 (11.0%) |
| 11:00 AM to 11:59 AM | 0 (0.0%) | 0 (0.0%) |
| 12:00 PM to 3:59 PM | 47 (4.3%) | 26 (2.7%) |
| 4:00 PM to 11:59 PM | 124 (11.4%) | 25 (2.6%) |
| Total | 1,091 (100.0%) | 977 (100.0%) |
Housing Occupancy in Breckenridge
Occupancy by Ownership in Breckenridge
Of the total 1,964 dwellings in Breckenridge, owner-occupied units account for 1,333 (67.9%), while renter-occupied units make up 631 (32.1%).
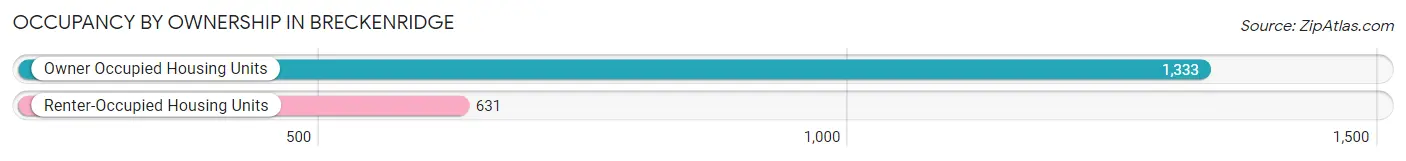
| Occupancy | # Housing Units | % Housing Units |
| Owner Occupied Housing Units | 1,333 | 67.9% |
| Renter-Occupied Housing Units | 631 | 32.1% |
| Total Occupied Housing Units | 1,964 | 100.0% |
Occupancy by Household Size in Breckenridge
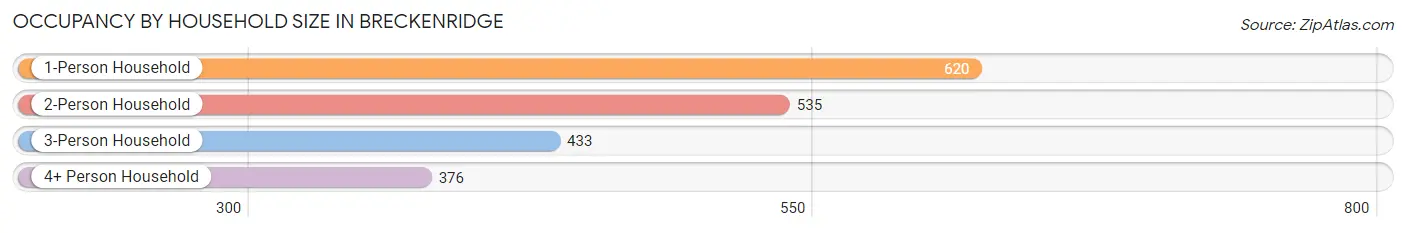
| Household Size | # Housing Units | % Housing Units |
| 1-Person Household | 620 | 31.6% |
| 2-Person Household | 535 | 27.2% |
| 3-Person Household | 433 | 22.1% |
| 4+ Person Household | 376 | 19.1% |
| Total Housing Units | 1,964 | 100.0% |
Occupancy by Ownership by Household Size in Breckenridge
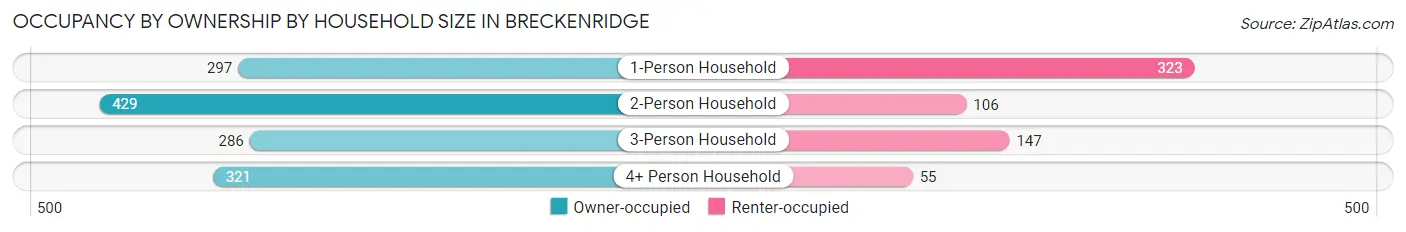
| Household Size | Owner-occupied | Renter-occupied |
| 1-Person Household | 297 (47.9%) | 323 (52.1%) |
| 2-Person Household | 429 (80.2%) | 106 (19.8%) |
| 3-Person Household | 286 (66.0%) | 147 (34.0%) |
| 4+ Person Household | 321 (85.4%) | 55 (14.6%) |
| Total Housing Units | 1,333 (67.9%) | 631 (32.1%) |
Occupancy by Educational Attainment in Breckenridge
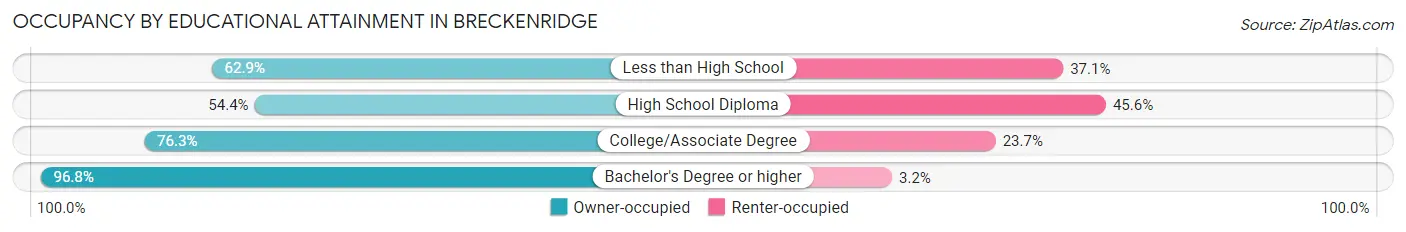
| Household Size | Owner-occupied | Renter-occupied |
| Less than High School | 190 (62.9%) | 112 (37.1%) |
| High School Diploma | 441 (54.4%) | 369 (45.6%) |
| College/Associate Degree | 457 (76.3%) | 142 (23.7%) |
| Bachelor's Degree or higher | 245 (96.8%) | 8 (3.2%) |
Occupancy by Age of Householder in Breckenridge
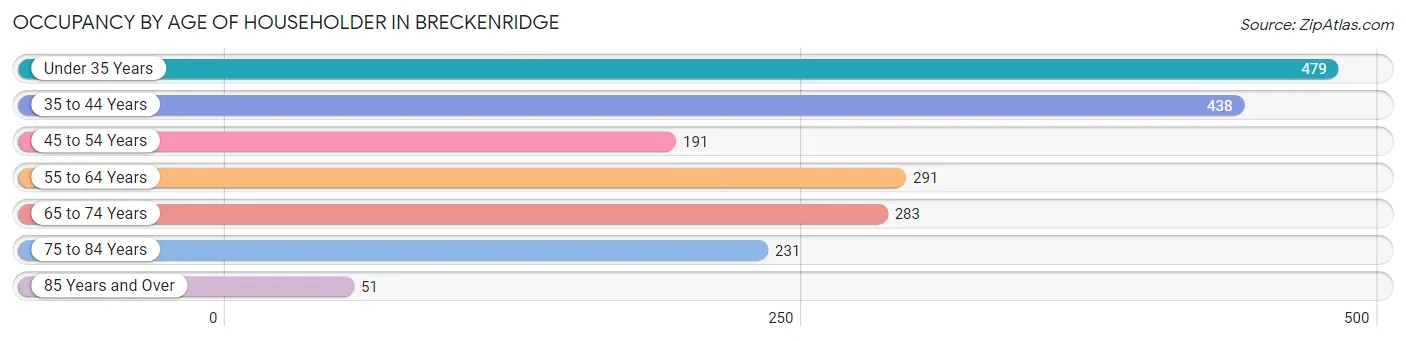
| Age Bracket | # Households | % Households |
| Under 35 Years | 479 | 24.4% |
| 35 to 44 Years | 438 | 22.3% |
| 45 to 54 Years | 191 | 9.7% |
| 55 to 64 Years | 291 | 14.8% |
| 65 to 74 Years | 283 | 14.4% |
| 75 to 84 Years | 231 | 11.8% |
| 85 Years and Over | 51 | 2.6% |
| Total | 1,964 | 100.0% |
Housing Finances in Breckenridge
Median Income by Occupancy in Breckenridge
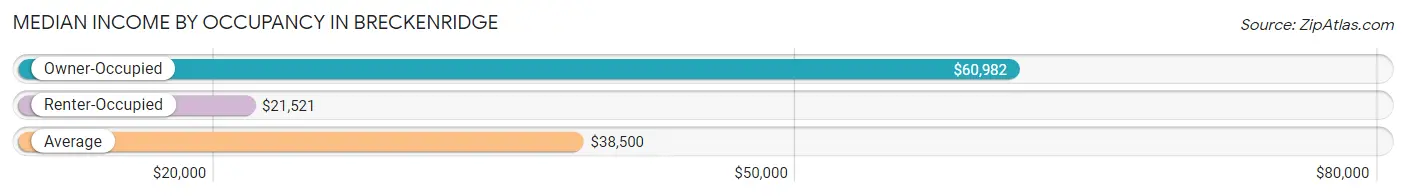
| Occupancy Type | # Households | Median Income |
| Owner-Occupied | 1,333 (67.9%) | $60,982 |
| Renter-Occupied | 631 (32.1%) | $21,521 |
| Average | 1,964 (100.0%) | $38,500 |
Occupancy by Householder Income Bracket in Breckenridge
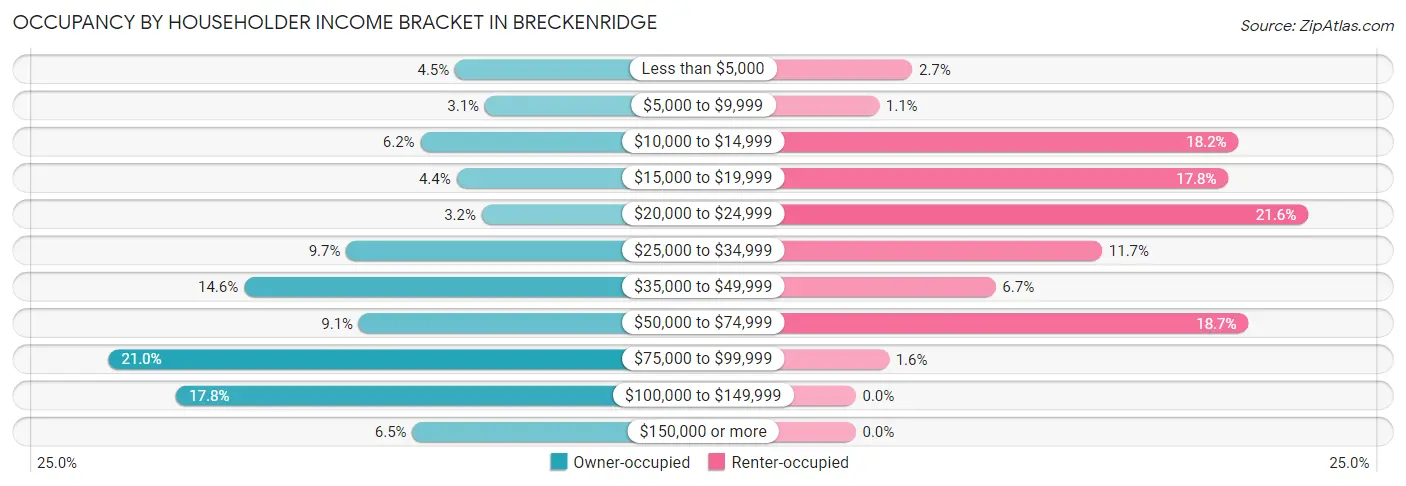
| Income Bracket | Owner-occupied | Renter-occupied |
| Less than $5,000 | 60 (4.5%) | 17 (2.7%) |
| $5,000 to $9,999 | 41 (3.1%) | 7 (1.1%) |
| $10,000 to $14,999 | 82 (6.1%) | 115 (18.2%) |
| $15,000 to $19,999 | 59 (4.4%) | 112 (17.7%) |
| $20,000 to $24,999 | 43 (3.2%) | 136 (21.5%) |
| $25,000 to $34,999 | 129 (9.7%) | 74 (11.7%) |
| $35,000 to $49,999 | 194 (14.5%) | 42 (6.7%) |
| $50,000 to $74,999 | 121 (9.1%) | 118 (18.7%) |
| $75,000 to $99,999 | 280 (21.0%) | 10 (1.6%) |
| $100,000 to $149,999 | 237 (17.8%) | 0 (0.0%) |
| $150,000 or more | 87 (6.5%) | 0 (0.0%) |
| Total | 1,333 (100.0%) | 631 (100.0%) |
Monthly Housing Cost Tiers in Breckenridge
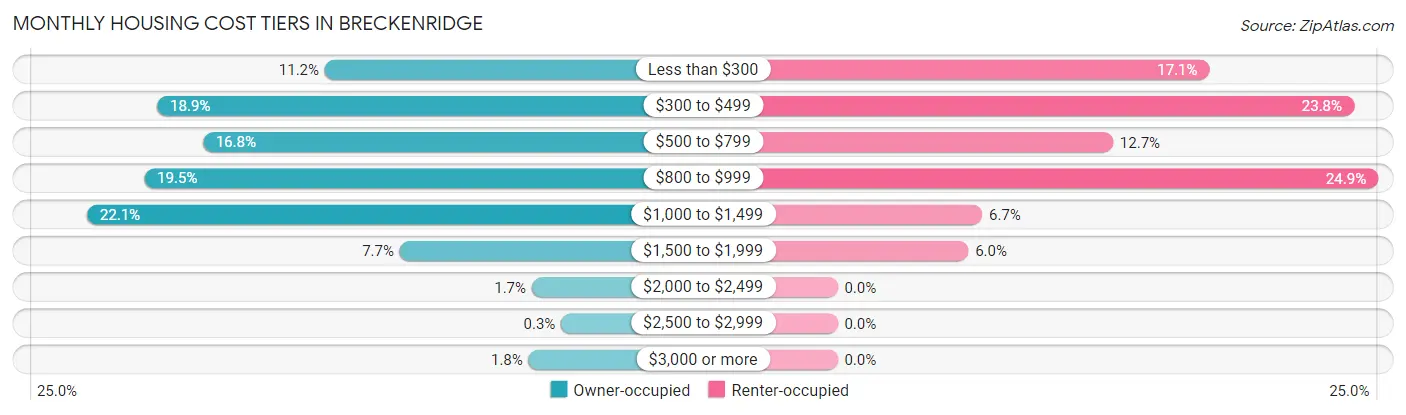
| Monthly Cost | Owner-occupied | Renter-occupied |
| Less than $300 | 149 (11.2%) | 108 (17.1%) |
| $300 to $499 | 252 (18.9%) | 150 (23.8%) |
| $500 to $799 | 224 (16.8%) | 80 (12.7%) |
| $800 to $999 | 260 (19.5%) | 157 (24.9%) |
| $1,000 to $1,499 | 295 (22.1%) | 42 (6.7%) |
| $1,500 to $1,999 | 103 (7.7%) | 38 (6.0%) |
| $2,000 to $2,499 | 22 (1.7%) | 0 (0.0%) |
| $2,500 to $2,999 | 4 (0.3%) | 0 (0.0%) |
| $3,000 or more | 24 (1.8%) | 0 (0.0%) |
| Total | 1,333 (100.0%) | 631 (100.0%) |
Physical Housing Characteristics in Breckenridge
Housing Structures in Breckenridge
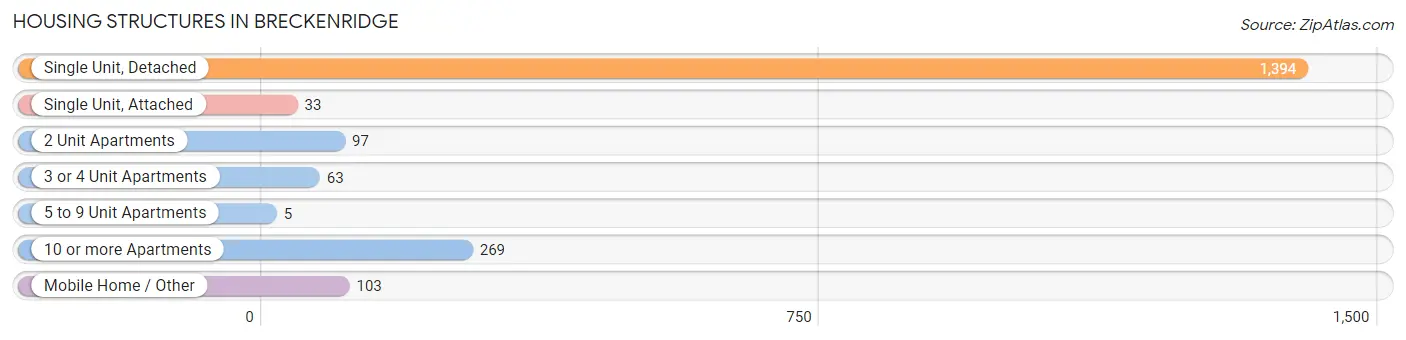
| Structure Type | # Housing Units | % Housing Units |
| Single Unit, Detached | 1,394 | 71.0% |
| Single Unit, Attached | 33 | 1.7% |
| 2 Unit Apartments | 97 | 4.9% |
| 3 or 4 Unit Apartments | 63 | 3.2% |
| 5 to 9 Unit Apartments | 5 | 0.3% |
| 10 or more Apartments | 269 | 13.7% |
| Mobile Home / Other | 103 | 5.2% |
| Total | 1,964 | 100.0% |
Housing Structures by Occupancy in Breckenridge
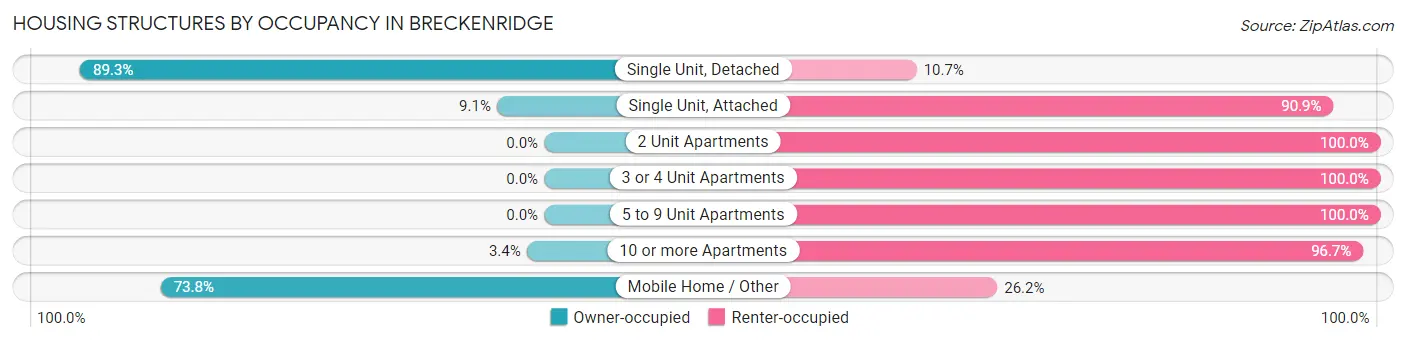
| Structure Type | Owner-occupied | Renter-occupied |
| Single Unit, Detached | 1,245 (89.3%) | 149 (10.7%) |
| Single Unit, Attached | 3 (9.1%) | 30 (90.9%) |
| 2 Unit Apartments | 0 (0.0%) | 97 (100.0%) |
| 3 or 4 Unit Apartments | 0 (0.0%) | 63 (100.0%) |
| 5 to 9 Unit Apartments | 0 (0.0%) | 5 (100.0%) |
| 10 or more Apartments | 9 (3.4%) | 260 (96.7%) |
| Mobile Home / Other | 76 (73.8%) | 27 (26.2%) |
| Total | 1,333 (67.9%) | 631 (32.1%) |
Housing Structures by Number of Rooms in Breckenridge
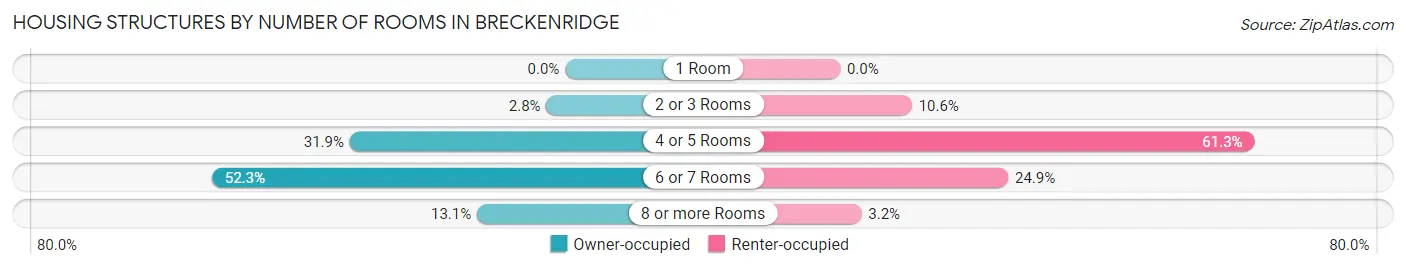
| Number of Rooms | Owner-occupied | Renter-occupied |
| 1 Room | 0 (0.0%) | 0 (0.0%) |
| 2 or 3 Rooms | 37 (2.8%) | 67 (10.6%) |
| 4 or 5 Rooms | 425 (31.9%) | 387 (61.3%) |
| 6 or 7 Rooms | 697 (52.3%) | 157 (24.9%) |
| 8 or more Rooms | 174 (13.1%) | 20 (3.2%) |
| Total | 1,333 (100.0%) | 631 (100.0%) |
Housing Structure by Heating Type in Breckenridge
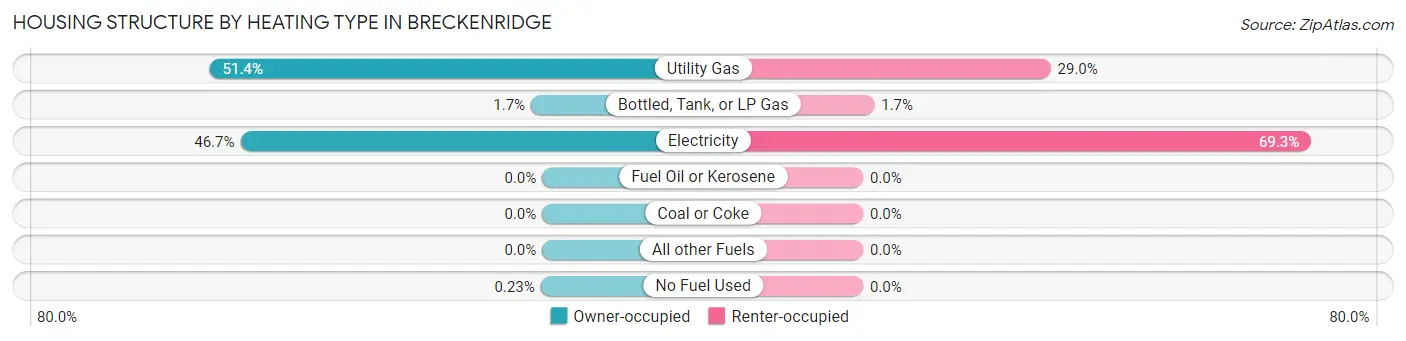
| Heating Type | Owner-occupied | Renter-occupied |
| Utility Gas | 685 (51.4%) | 183 (29.0%) |
| Bottled, Tank, or LP Gas | 23 (1.7%) | 11 (1.7%) |
| Electricity | 622 (46.7%) | 437 (69.3%) |
| Fuel Oil or Kerosene | 0 (0.0%) | 0 (0.0%) |
| Coal or Coke | 0 (0.0%) | 0 (0.0%) |
| All other Fuels | 0 (0.0%) | 0 (0.0%) |
| No Fuel Used | 3 (0.2%) | 0 (0.0%) |
| Total | 1,333 (100.0%) | 631 (100.0%) |
Household Vehicle Usage in Breckenridge
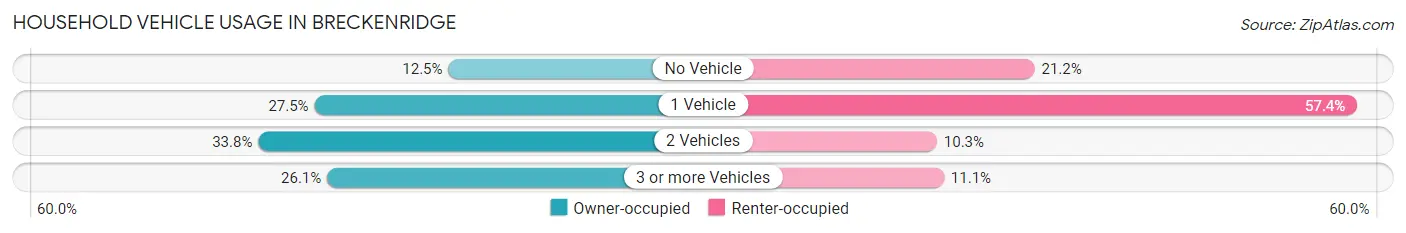
| Vehicles per Household | Owner-occupied | Renter-occupied |
| No Vehicle | 167 (12.5%) | 134 (21.2%) |
| 1 Vehicle | 367 (27.5%) | 362 (57.4%) |
| 2 Vehicles | 451 (33.8%) | 65 (10.3%) |
| 3 or more Vehicles | 348 (26.1%) | 70 (11.1%) |
| Total | 1,333 (100.0%) | 631 (100.0%) |
Real Estate & Mortgages in Breckenridge
Real Estate and Mortgage Overview in Breckenridge
| Characteristic | Without Mortgage | With Mortgage |
| Housing Units | 679 | 654 |
| Median Property Value | $63,600 | $85,100 |
| Median Household Income | $51,734 | $44 |
| Monthly Housing Costs | $453 | $24 |
| Real Estate Taxes | $1,349 | $0 |
Property Value by Mortgage Status in Breckenridge
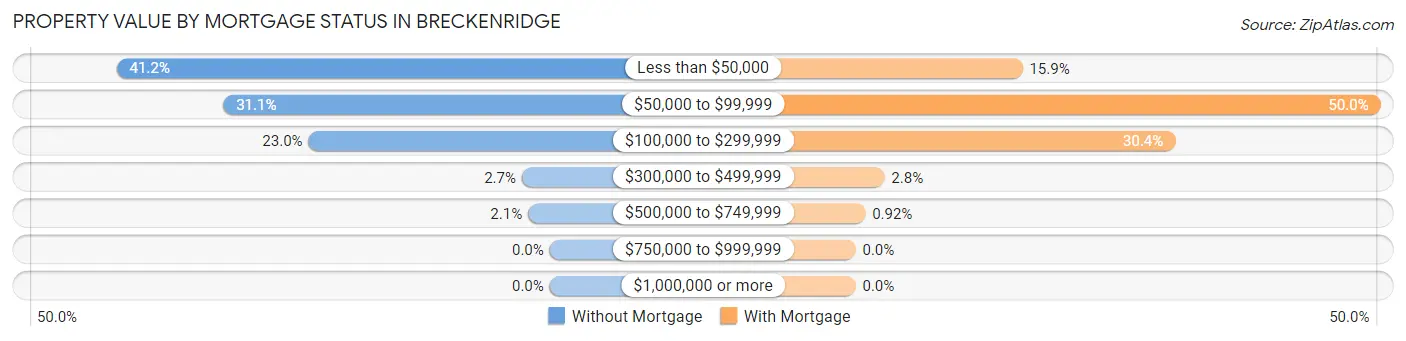
| Property Value | Without Mortgage | With Mortgage |
| Less than $50,000 | 280 (41.2%) | 104 (15.9%) |
| $50,000 to $99,999 | 211 (31.1%) | 327 (50.0%) |
| $100,000 to $299,999 | 156 (23.0%) | 199 (30.4%) |
| $300,000 to $499,999 | 18 (2.6%) | 18 (2.8%) |
| $500,000 to $749,999 | 14 (2.1%) | 6 (0.9%) |
| $750,000 to $999,999 | 0 (0.0%) | 0 (0.0%) |
| $1,000,000 or more | 0 (0.0%) | 0 (0.0%) |
| Total | 679 (100.0%) | 654 (100.0%) |
Household Income by Mortgage Status in Breckenridge
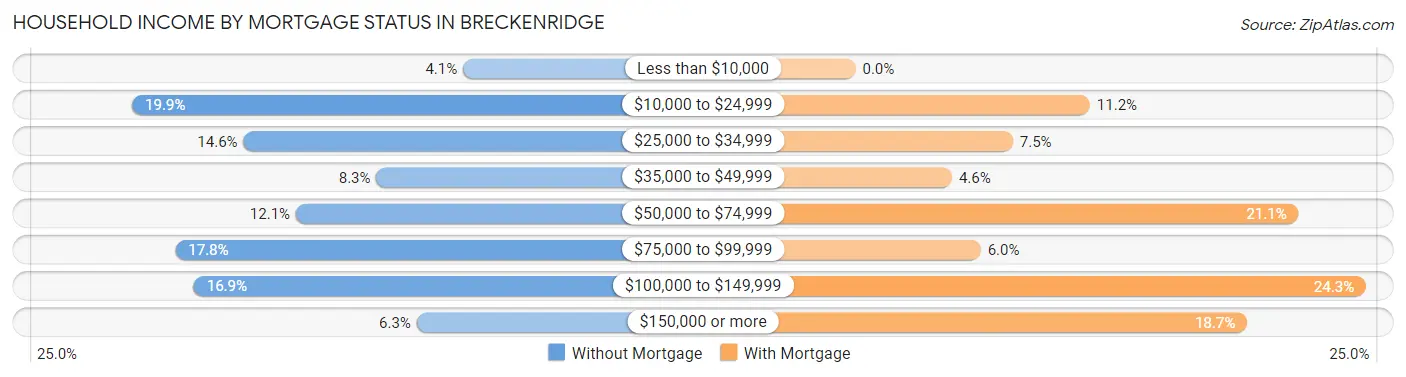
| Household Income | Without Mortgage | With Mortgage |
| Less than $10,000 | 28 (4.1%) | 0 (0.0%) |
| $10,000 to $24,999 | 135 (19.9%) | 73 (11.2%) |
| $25,000 to $34,999 | 99 (14.6%) | 49 (7.5%) |
| $35,000 to $49,999 | 56 (8.3%) | 30 (4.6%) |
| $50,000 to $74,999 | 82 (12.1%) | 138 (21.1%) |
| $75,000 to $99,999 | 121 (17.8%) | 39 (6.0%) |
| $100,000 to $149,999 | 115 (16.9%) | 159 (24.3%) |
| $150,000 or more | 43 (6.3%) | 122 (18.6%) |
| Total | 679 (100.0%) | 654 (100.0%) |
Property Value to Household Income Ratio in Breckenridge
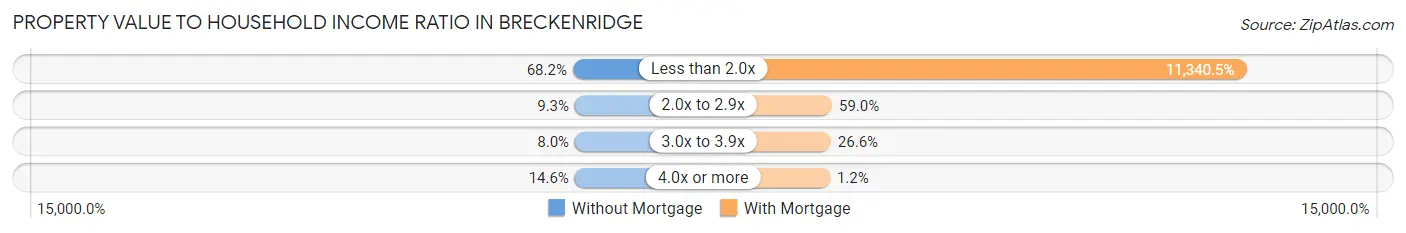
| Value-to-Income Ratio | Without Mortgage | With Mortgage |
| Less than 2.0x | 463 (68.2%) | 74,167 (11,340.5%) |
| 2.0x to 2.9x | 63 (9.3%) | 386 (59.0%) |
| 3.0x to 3.9x | 54 (8.0%) | 174 (26.6%) |
| 4.0x or more | 99 (14.6%) | 8 (1.2%) |
| Total | 679 (100.0%) | 654 (100.0%) |
Real Estate Taxes by Mortgage Status in Breckenridge
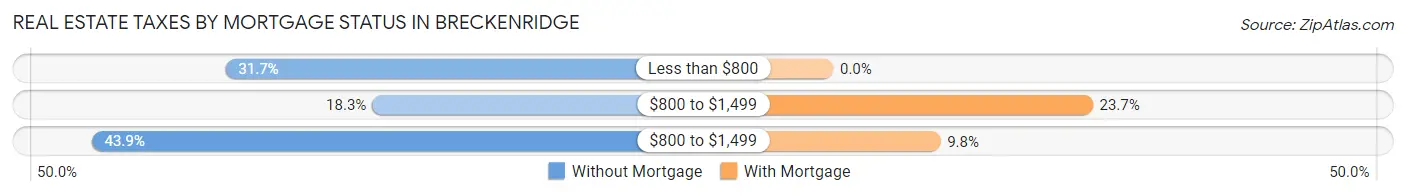
| Property Taxes | Without Mortgage | With Mortgage |
| Less than $800 | 215 (31.7%) | 0 (0.0%) |
| $800 to $1,499 | 124 (18.3%) | 155 (23.7%) |
| $800 to $1,499 | 298 (43.9%) | 64 (9.8%) |
| Total | 679 (100.0%) | 654 (100.0%) |
Health & Disability in Breckenridge
Health Insurance Coverage by Age in Breckenridge
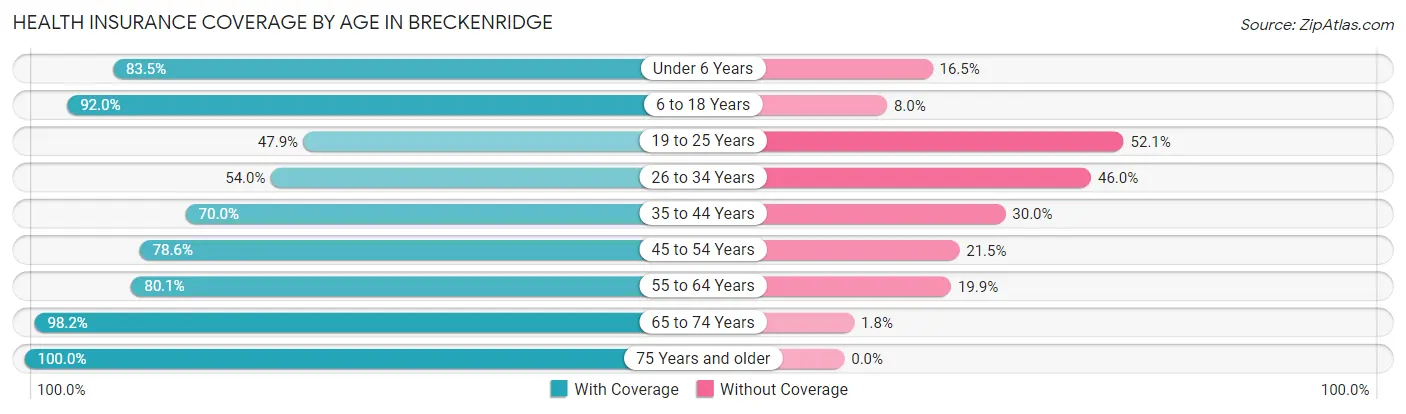
| Age Bracket | With Coverage | Without Coverage |
| Under 6 Years | 467 (83.5%) | 92 (16.5%) |
| 6 to 18 Years | 856 (92.0%) | 74 (8.0%) |
| 19 to 25 Years | 263 (47.9%) | 286 (52.1%) |
| 26 to 34 Years | 291 (54.0%) | 248 (46.0%) |
| 35 to 44 Years | 580 (70.0%) | 249 (30.0%) |
| 45 to 54 Years | 337 (78.5%) | 92 (21.4%) |
| 55 to 64 Years | 475 (80.1%) | 118 (19.9%) |
| 65 to 74 Years | 374 (98.2%) | 7 (1.8%) |
| 75 Years and older | 353 (100.0%) | 0 (0.0%) |
| Total | 3,996 (77.4%) | 1,166 (22.6%) |
Health Insurance Coverage by Citizenship Status in Breckenridge
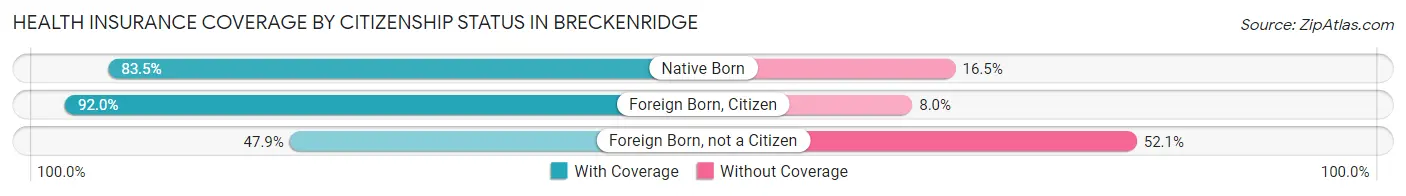
| Citizenship Status | With Coverage | Without Coverage |
| Native Born | 467 (83.5%) | 92 (16.5%) |
| Foreign Born, Citizen | 856 (92.0%) | 74 (8.0%) |
| Foreign Born, not a Citizen | 263 (47.9%) | 286 (52.1%) |
Health Insurance Coverage by Household Income in Breckenridge
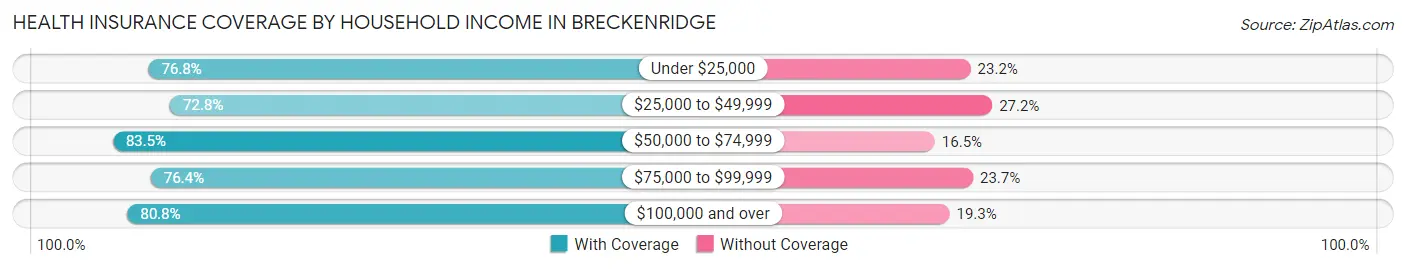
| Household Income | With Coverage | Without Coverage |
| Under $25,000 | 1,052 (76.8%) | 318 (23.2%) |
| $25,000 to $49,999 | 844 (72.8%) | 316 (27.2%) |
| $50,000 to $74,999 | 521 (83.5%) | 103 (16.5%) |
| $75,000 to $99,999 | 736 (76.3%) | 228 (23.6%) |
| $100,000 and over | 843 (80.7%) | 201 (19.3%) |
Public vs Private Health Insurance Coverage by Age in Breckenridge
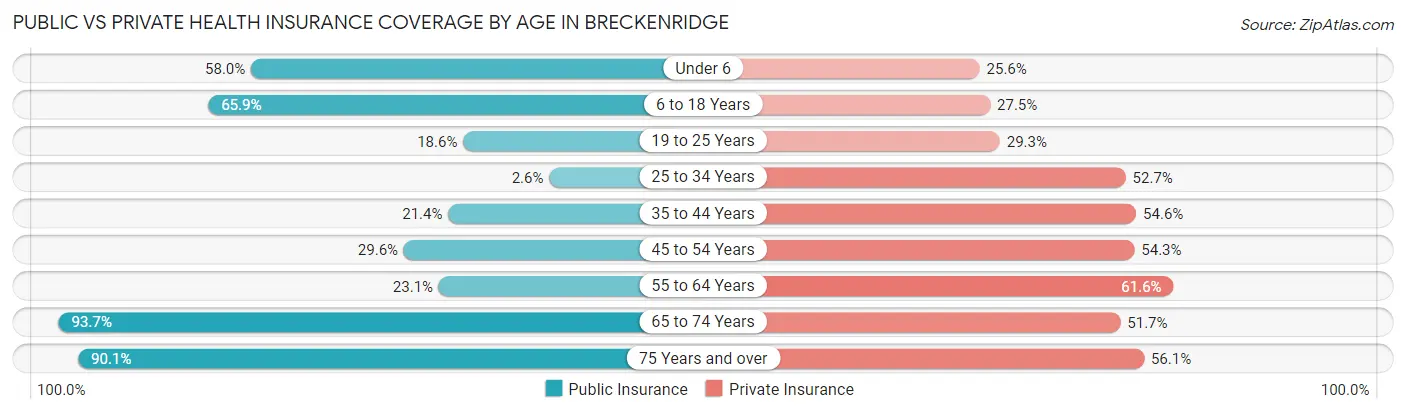
| Age Bracket | Public Insurance | Private Insurance |
| Under 6 | 324 (58.0%) | 143 (25.6%) |
| 6 to 18 Years | 613 (65.9%) | 256 (27.5%) |
| 19 to 25 Years | 102 (18.6%) | 161 (29.3%) |
| 25 to 34 Years | 14 (2.6%) | 284 (52.7%) |
| 35 to 44 Years | 177 (21.3%) | 453 (54.6%) |
| 45 to 54 Years | 127 (29.6%) | 233 (54.3%) |
| 55 to 64 Years | 137 (23.1%) | 365 (61.6%) |
| 65 to 74 Years | 357 (93.7%) | 197 (51.7%) |
| 75 Years and over | 318 (90.1%) | 198 (56.1%) |
| Total | 2,169 (42.0%) | 2,290 (44.4%) |
Disability Status by Sex by Age in Breckenridge
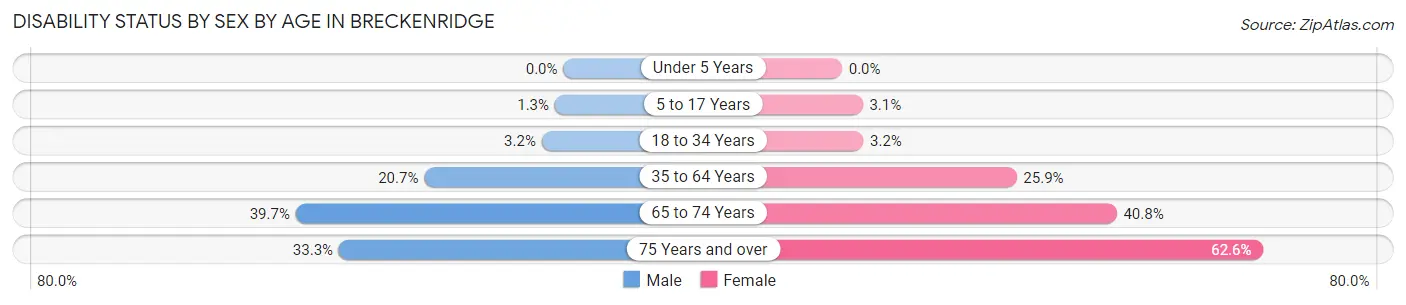
| Age Bracket | Male | Female |
| Under 5 Years | 0 (0.0%) | 0 (0.0%) |
| 5 to 17 Years | 7 (1.3%) | 13 (3.1%) |
| 18 to 34 Years | 19 (3.2%) | 18 (3.2%) |
| 35 to 64 Years | 200 (20.7%) | 229 (25.9%) |
| 65 to 74 Years | 91 (39.7%) | 62 (40.8%) |
| 75 Years and over | 25 (33.3%) | 174 (62.6%) |
Disability Class by Sex by Age in Breckenridge
Disability Class: Hearing Difficulty
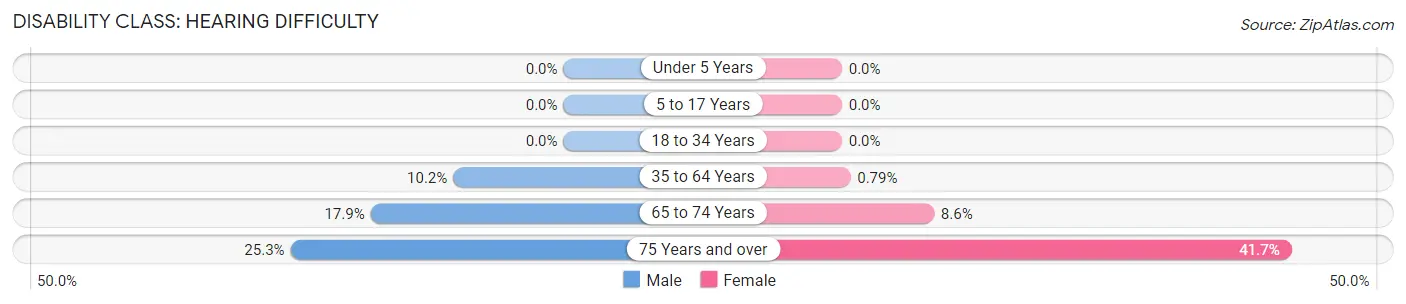
| Age Bracket | Male | Female |
| Under 5 Years | 0 (0.0%) | 0 (0.0%) |
| 5 to 17 Years | 0 (0.0%) | 0 (0.0%) |
| 18 to 34 Years | 0 (0.0%) | 0 (0.0%) |
| 35 to 64 Years | 99 (10.2%) | 7 (0.8%) |
| 65 to 74 Years | 41 (17.9%) | 13 (8.6%) |
| 75 Years and over | 19 (25.3%) | 116 (41.7%) |
Disability Class: Vision Difficulty
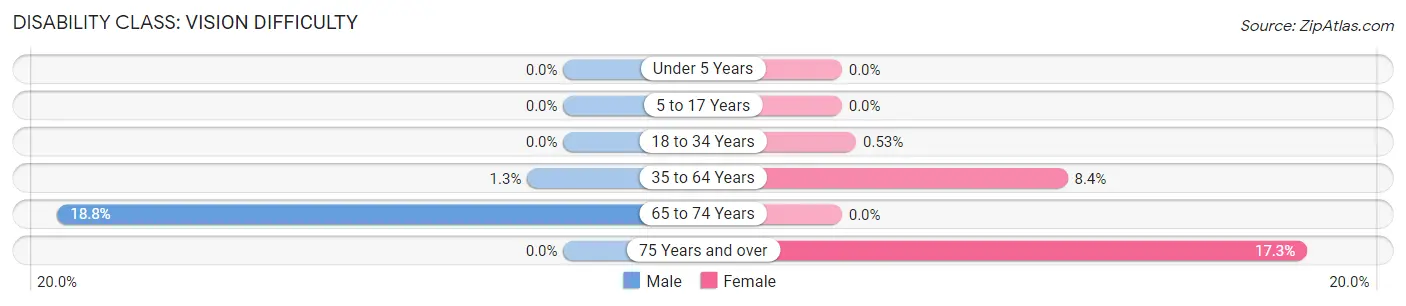
| Age Bracket | Male | Female |
| Under 5 Years | 0 (0.0%) | 0 (0.0%) |
| 5 to 17 Years | 0 (0.0%) | 0 (0.0%) |
| 18 to 34 Years | 0 (0.0%) | 3 (0.5%) |
| 35 to 64 Years | 13 (1.3%) | 74 (8.4%) |
| 65 to 74 Years | 43 (18.8%) | 0 (0.0%) |
| 75 Years and over | 0 (0.0%) | 48 (17.3%) |
Disability Class: Cognitive Difficulty
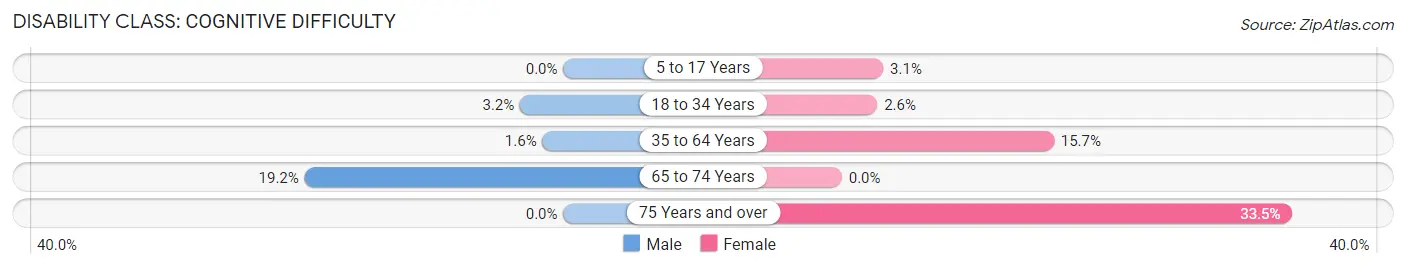
| Age Bracket | Male | Female |
| 5 to 17 Years | 0 (0.0%) | 13 (3.1%) |
| 18 to 34 Years | 19 (3.2%) | 15 (2.6%) |
| 35 to 64 Years | 15 (1.5%) | 139 (15.7%) |
| 65 to 74 Years | 44 (19.2%) | 0 (0.0%) |
| 75 Years and over | 0 (0.0%) | 93 (33.5%) |
Disability Class: Ambulatory Difficulty
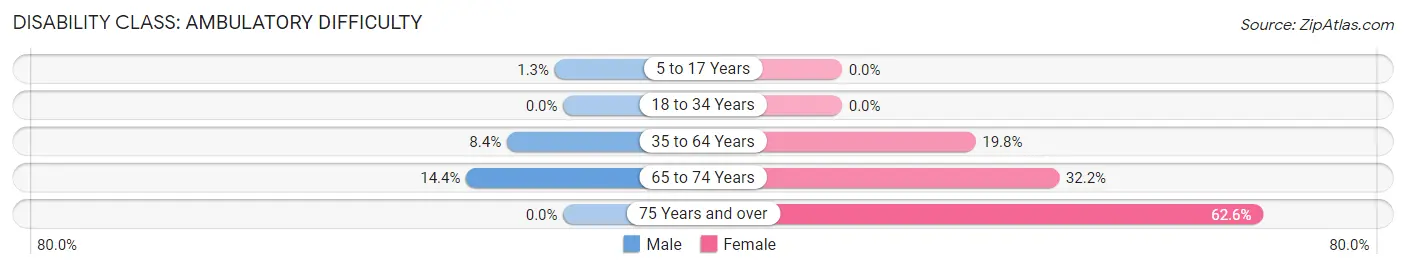
| Age Bracket | Male | Female |
| 5 to 17 Years | 7 (1.3%) | 0 (0.0%) |
| 18 to 34 Years | 0 (0.0%) | 0 (0.0%) |
| 35 to 64 Years | 81 (8.4%) | 175 (19.8%) |
| 65 to 74 Years | 33 (14.4%) | 49 (32.2%) |
| 75 Years and over | 0 (0.0%) | 174 (62.6%) |
Disability Class: Self-Care Difficulty
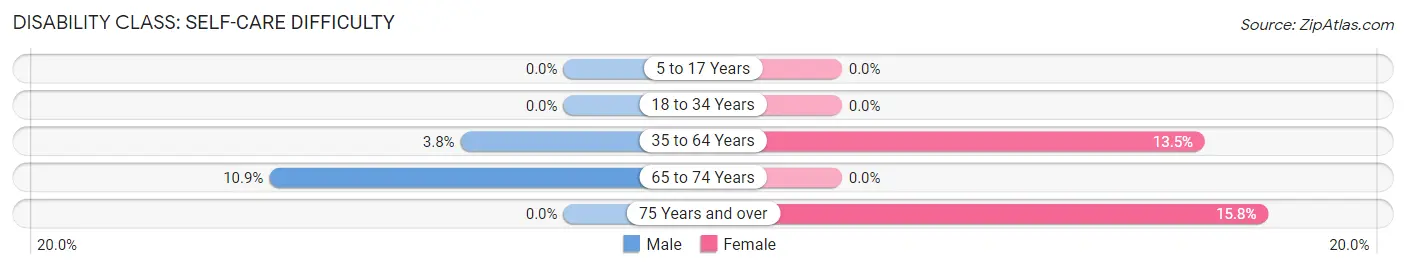
| Age Bracket | Male | Female |
| 5 to 17 Years | 0 (0.0%) | 0 (0.0%) |
| 18 to 34 Years | 0 (0.0%) | 0 (0.0%) |
| 35 to 64 Years | 37 (3.8%) | 119 (13.5%) |
| 65 to 74 Years | 25 (10.9%) | 0 (0.0%) |
| 75 Years and over | 0 (0.0%) | 44 (15.8%) |
Technology Access in Breckenridge
Computing Device Access in Breckenridge
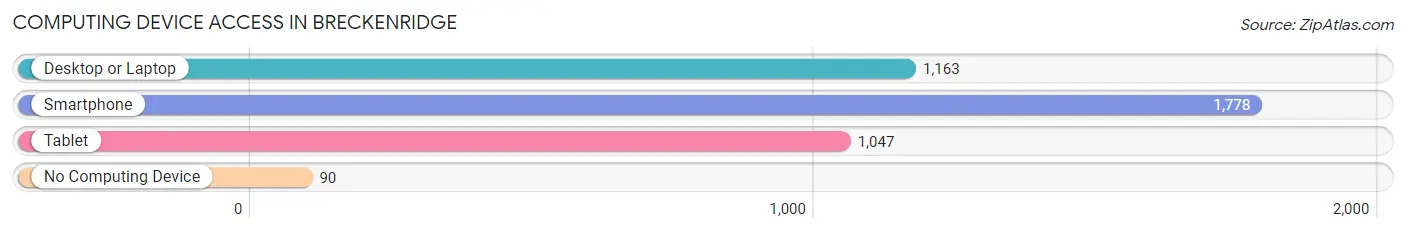
| Device Type | # Households | % Households |
| Desktop or Laptop | 1,163 | 59.2% |
| Smartphone | 1,778 | 90.5% |
| Tablet | 1,047 | 53.3% |
| No Computing Device | 90 | 4.6% |
| Total | 1,964 | 100.0% |
Internet Access in Breckenridge
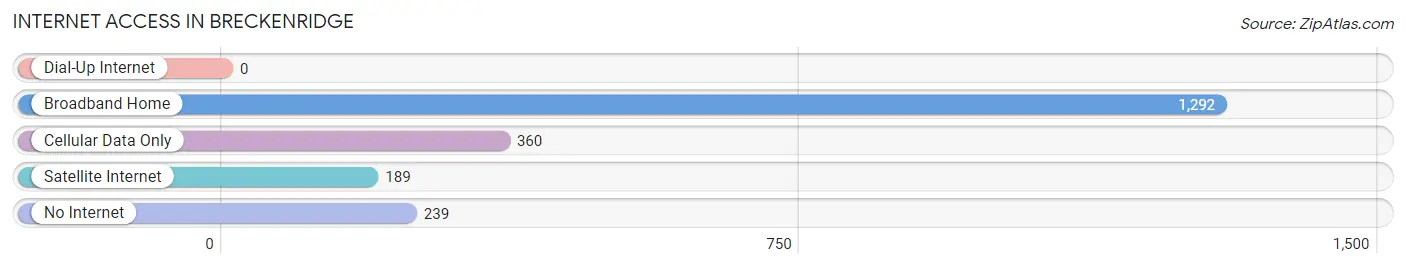
| Internet Type | # Households | % Households |
| Dial-Up Internet | 0 | 0.0% |
| Broadband Home | 1,292 | 65.8% |
| Cellular Data Only | 360 | 18.3% |
| Satellite Internet | 189 | 9.6% |
| No Internet | 239 | 12.2% |
| Total | 1,964 | 100.0% |
Breckenridge Summary
Breckenridge, Texas is a small city located in Stephens County, Texas. It is the county seat of Stephens County and is located about 100 miles west of Fort Worth. The population of Breckenridge was 5,731 at the 2010 census.
History
Breckenridge was founded in 1876 by a group of settlers from Missouri. The town was named after John C. Breckenridge, a former Vice President of the United States. The town was incorporated in 1881 and was the first county seat of Stephens County.
The town was a major stop on the Texas and Pacific Railway, which was completed in 1881. This allowed the town to become a major shipping center for the region. The town also became a major center for the cattle industry, with many ranchers shipping their cattle to the town for sale.
In the early 1900s, the town experienced a major oil boom. This led to the construction of many oil refineries and other related businesses in the area. The oil boom also led to a population boom, with the population of the town increasing from 1,000 in 1910 to over 5,000 by 1930.
Geography
Breckenridge is located in the western part of Stephens County, about 100 miles west of Fort Worth. The town is situated on the Brazos River, which is a major tributary of the Colorado River. The town is surrounded by rolling hills and is located in a semi-arid climate.
The town has a total area of 4.2 square miles, all of which is land. The town is located at an elevation of 1,072 feet above sea level.
Economy
The economy of Breckenridge is largely based on the oil and gas industry. The town is home to several oil refineries and related businesses. The town is also home to several manufacturing companies, including a steel mill and a paper mill.
The town is also home to several retail stores, restaurants, and other businesses. The town is also home to a hospital and several medical clinics.
Demographics
As of the 2010 census, the population of Breckenridge was 5,731. The racial makeup of the town was 79.3% White, 15.2% Hispanic or Latino, 2.2% African American, 0.7% Native American, 0.3% Asian, and 2.5% from other races.
The median household income in Breckenridge was $35,938, and the median family income was $41,944. The per capita income in Breckenridge was $17,845. About 16.2% of the population was below the poverty line.
Conclusion
Breckenridge, Texas is a small city located in Stephens County, Texas. It is the county seat of Stephens County and is located about 100 miles west of Fort Worth. The population of Breckenridge was 5,731 at the 2010 census. The town was founded in 1876 and was a major stop on the Texas and Pacific Railway. The town experienced a major oil boom in the early 1900s, which led to a population boom. The economy of Breckenridge is largely based on the oil and gas industry. The racial makeup of the town was 79.3% White, 15.2% Hispanic or Latino, 2.2% African American, 0.7% Native American, 0.3% Asian, and 2.5% from other races. The median household income in Breckenridge was $35,938, and the median family income was $41,944. About 16.2% of the population was below the poverty line.
Common Questions
What is Per Capita Income in Breckenridge?
Per Capita income in Breckenridge is $23,264.
What is the Median Family Income in Breckenridge?
Median Family Income in Breckenridge is $54,523.
What is the Median Household income in Breckenridge?
Median Household Income in Breckenridge is $38,500.
What is Income or Wage Gap in Breckenridge?
Income or Wage Gap in Breckenridge is 26.7%.
Women in Breckenridge earn 73.3 cents for every dollar earned by a man.
What is Inequality or Gini Index in Breckenridge?
Inequality or Gini Index in Breckenridge is 0.46.
What is the Total Population of Breckenridge?
Total Population of Breckenridge is 5,230.
What is the Total Male Population of Breckenridge?
Total Male Population of Breckenridge is 2,709.
What is the Total Female Population of Breckenridge?
Total Female Population of Breckenridge is 2,521.
What is the Ratio of Males per 100 Females in Breckenridge?
There are 107.46 Males per 100 Females in Breckenridge.
What is the Ratio of Females per 100 Males in Breckenridge?
There are 93.06 Females per 100 Males in Breckenridge.
What is the Median Population Age in Breckenridge?
Median Population Age in Breckenridge is 35.1 Years.
What is the Average Family Size in Breckenridge
Average Family Size in Breckenridge is 3.1 People.
What is the Average Household Size in Breckenridge
Average Household Size in Breckenridge is 2.6 People.
How Large is the Labor Force in Breckenridge?
There are 2,523 People in the Labor Forcein in Breckenridge.
What is the Percentage of People in the Labor Force in Breckenridge?
63.9% of People are in the Labor Force in Breckenridge.
What is the Unemployment Rate in Breckenridge?
Unemployment Rate in Breckenridge is 13.1%.