Brazoria, TX Map & Demographics
Brazoria Map
Brazoria Overview
$29,145
PER CAPITA INCOME
$75,902
AVG FAMILY INCOME
$38,889
AVG HOUSEHOLD INCOME
56.5%
WAGE / INCOME GAP [ % ]
43.5¢/ $1
WAGE / INCOME GAP [ $ ]
0.54
INEQUALITY / GINI INDEX
2,875
TOTAL POPULATION
1,156
MALE POPULATION
1,719
FEMALE POPULATION
67.25
MALES / 100 FEMALES
148.70
FEMALES / 100 MALES
36.1
MEDIAN AGE
2.9
AVG FAMILY SIZE
2.4
AVG HOUSEHOLD SIZE
1,284
LABOR FORCE [ PEOPLE ]
55.9%
PERCENT IN LABOR FORCE
2.8%
UNEMPLOYMENT RATE
Brazoria Zip Codes
Brazoria Area Codes
Income in Brazoria
Income Overview in Brazoria
Per Capita Income in Brazoria is $29,145, while median incomes of families and households are $75,902 and $38,889 respectively.
| Characteristic | Number | Measure |
| Per Capita Income | 2,875 | $29,145 |
| Median Family Income | 806 | $75,902 |
| Mean Family Income | 806 | $77,023 |
| Median Household Income | 1,194 | $38,889 |
| Mean Household Income | 1,194 | $70,081 |
| Income Deficit | 806 | $0 |
| Wage / Income Gap (%) | 2,875 | 56.55% |
| Wage / Income Gap ($) | 2,875 | 43.45¢ per $1 |
| Gini / Inequality Index | 2,875 | 0.54 |
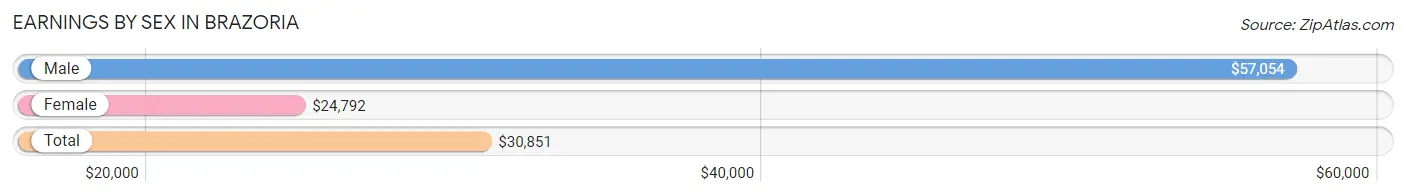
Earnings by Sex in Brazoria
Average Earnings in Brazoria are $30,851, $57,054 for men and $24,792 for women, a difference of 56.6%.
| Sex | Number | Average Earnings |
| Male | 535 (41.3%) | $57,054 |
| Female | 761 (58.7%) | $24,792 |
| Total | 1,296 (100.0%) | $30,851 |
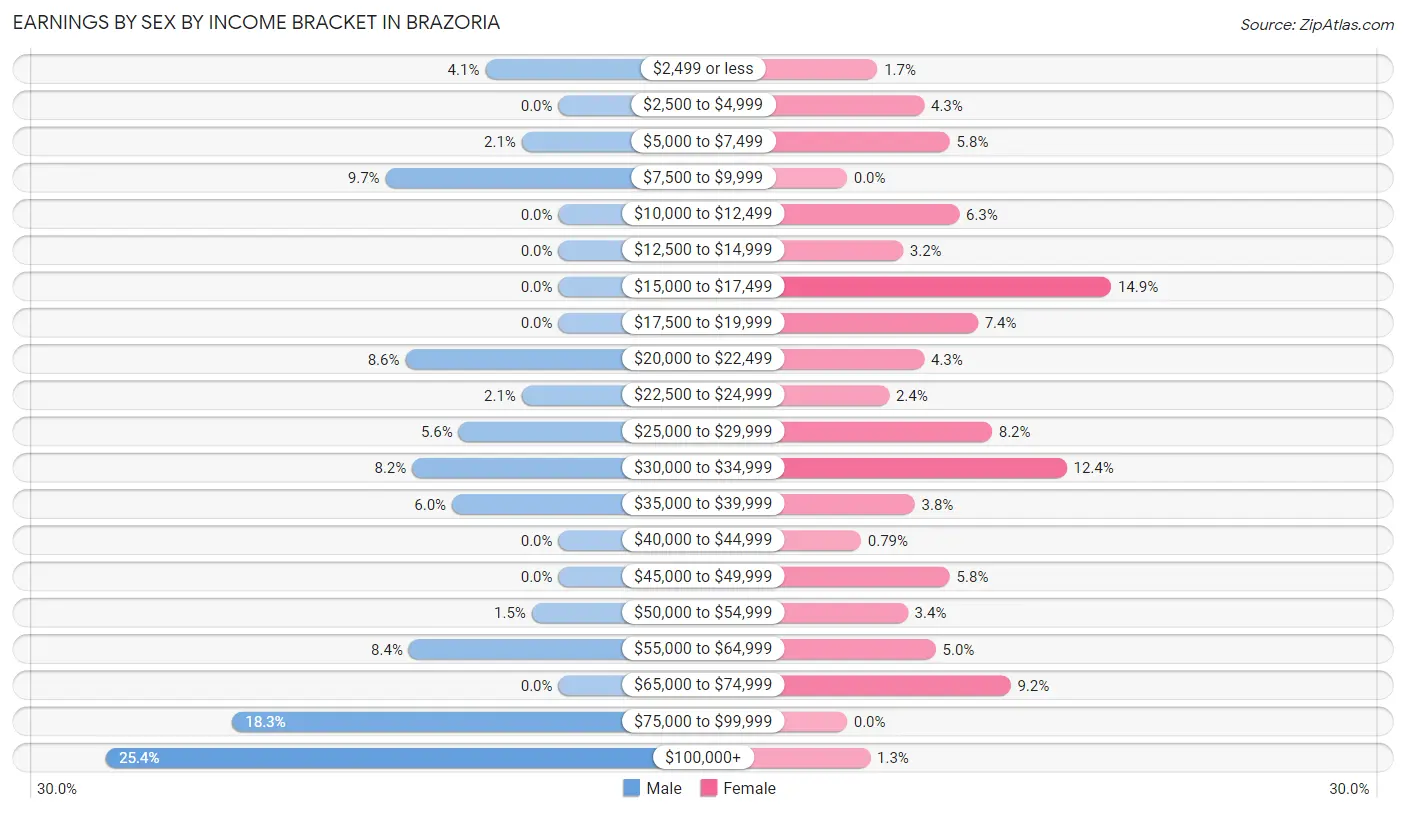
Earnings by Sex by Income Bracket in Brazoria
The most common earnings brackets in Brazoria are $100,000+ for men (136 | 25.4%) and $15,000 to $17,499 for women (113 | 14.8%).
| Income | Male | Female |
| $2,499 or less | 22 (4.1%) | 13 (1.7%) |
| $2,500 to $4,999 | 0 (0.0%) | 33 (4.3%) |
| $5,000 to $7,499 | 11 (2.1%) | 44 (5.8%) |
| $7,500 to $9,999 | 52 (9.7%) | 0 (0.0%) |
| $10,000 to $12,499 | 0 (0.0%) | 48 (6.3%) |
| $12,500 to $14,999 | 0 (0.0%) | 24 (3.2%) |
| $15,000 to $17,499 | 0 (0.0%) | 113 (14.8%) |
| $17,500 to $19,999 | 0 (0.0%) | 56 (7.4%) |
| $20,000 to $22,499 | 46 (8.6%) | 33 (4.3%) |
| $22,500 to $24,999 | 11 (2.1%) | 18 (2.4%) |
| $25,000 to $29,999 | 30 (5.6%) | 62 (8.2%) |
| $30,000 to $34,999 | 44 (8.2%) | 94 (12.3%) |
| $35,000 to $39,999 | 32 (6.0%) | 29 (3.8%) |
| $40,000 to $44,999 | 0 (0.0%) | 6 (0.8%) |
| $45,000 to $49,999 | 0 (0.0%) | 44 (5.8%) |
| $50,000 to $54,999 | 8 (1.5%) | 26 (3.4%) |
| $55,000 to $64,999 | 45 (8.4%) | 38 (5.0%) |
| $65,000 to $74,999 | 0 (0.0%) | 70 (9.2%) |
| $75,000 to $99,999 | 98 (18.3%) | 0 (0.0%) |
| $100,000+ | 136 (25.4%) | 10 (1.3%) |
| Total | 535 (100.0%) | 761 (100.0%) |
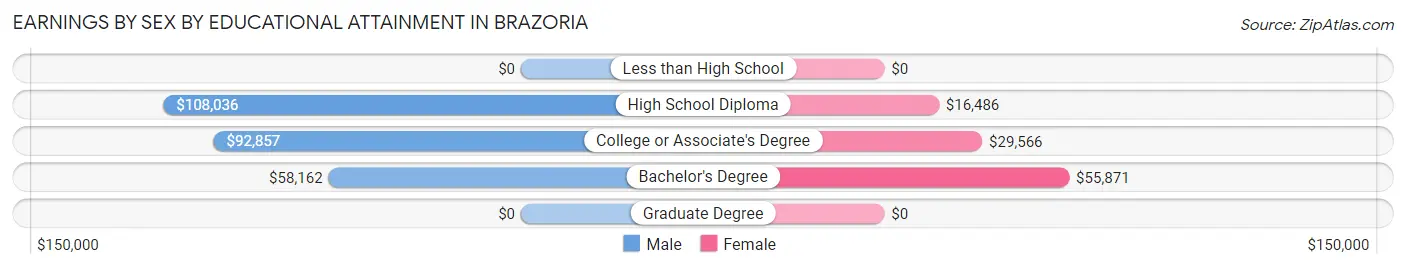
Earnings by Sex by Educational Attainment in Brazoria
Average earnings in Brazoria are $78,942 for men and $29,209 for women, a difference of 63.0%. Men with an educational attainment of high school diploma enjoy the highest average annual earnings of $108,036, while those with bachelor's degree education earn the least with $58,162. Women with an educational attainment of bachelor's degree earn the most with the average annual earnings of $55,871, while those with high school diploma education have the smallest earnings of $16,486.
| Educational Attainment | Male Income | Female Income |
| Less than High School | - | - |
| High School Diploma | $108,036 | $16,486 |
| College or Associate's Degree | $92,857 | $29,566 |
| Bachelor's Degree | $58,162 | $55,871 |
| Graduate Degree | - | - |
| Total | $78,942 | $29,209 |
Family Income in Brazoria
Family Income Brackets in Brazoria
According to the Brazoria family income data, there are 236 families falling into the $75,000 to $99,999 income range, which is the most common income bracket and makes up 29.3% of all families. Conversely, the $15,000 to $24,999 income bracket is the least frequent group with only 23 families (2.9%) belonging to this category.
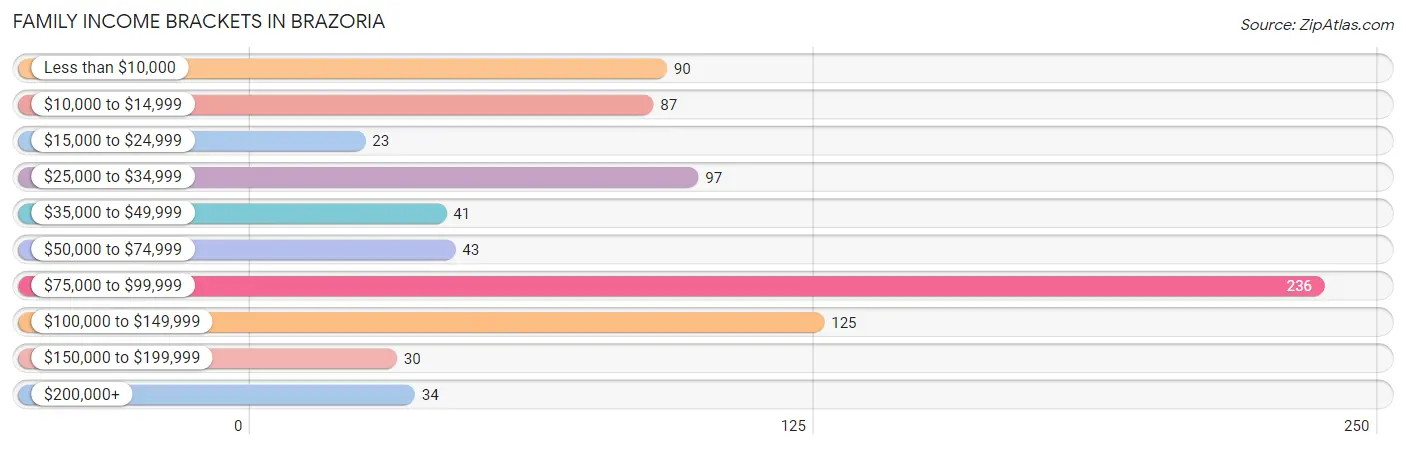
| Income Bracket | # Families | % Families |
| Less than $10,000 | 90 | 11.2% |
| $10,000 to $14,999 | 87 | 10.8% |
| $15,000 to $24,999 | 23 | 2.9% |
| $25,000 to $34,999 | 97 | 12.0% |
| $35,000 to $49,999 | 41 | 5.1% |
| $50,000 to $74,999 | 43 | 5.3% |
| $75,000 to $99,999 | 236 | 29.3% |
| $100,000 to $149,999 | 125 | 15.5% |
| $150,000 to $199,999 | 30 | 3.7% |
| $200,000+ | 34 | 4.2% |
Family Income by Famaliy Size in Brazoria
4-person families (182 | 22.6%) account for the highest median family income in Brazoria with $83,205 per family, while 4-person families (182 | 22.6%) have the highest median income of $20,801 per family member.
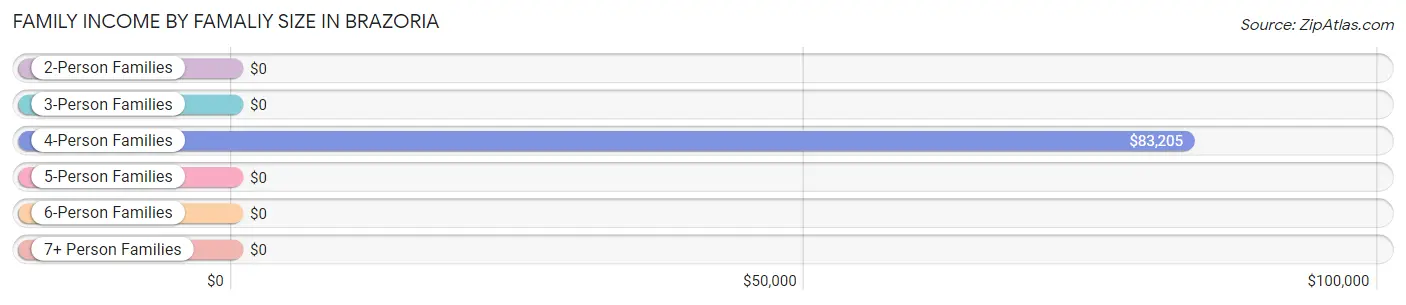
| Income Bracket | # Families | Median Income |
| 2-Person Families | 428 (53.1%) | $0 |
| 3-Person Families | 126 (15.6%) | $0 |
| 4-Person Families | 182 (22.6%) | $83,205 |
| 5-Person Families | 42 (5.2%) | $0 |
| 6-Person Families | 28 (3.5%) | $0 |
| 7+ Person Families | 0 (0.0%) | $0 |
| Total | 806 (100.0%) | $75,902 |
Family Income by Number of Earners in Brazoria
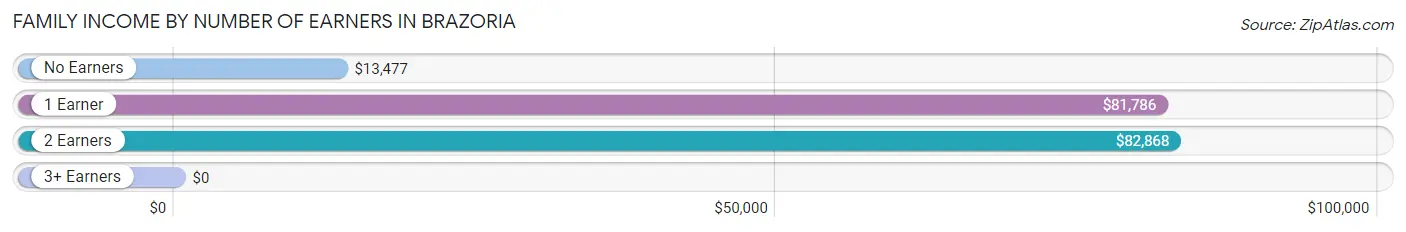
| Number of Earners | # Families | Median Income |
| No Earners | 248 (30.8%) | $13,477 |
| 1 Earner | 222 (27.5%) | $81,786 |
| 2 Earners | 265 (32.9%) | $82,868 |
| 3+ Earners | 71 (8.8%) | $0 |
| Total | 806 (100.0%) | $75,902 |
Household Income in Brazoria
Household Income Brackets in Brazoria
With 264 households falling in the category, the $75,000 to $99,999 income range is the most frequent in Brazoria, accounting for 22.1% of all households. In contrast, only 30 households (2.5%) fall into the $150,000 to $199,999 income bracket, making it the least populous group.
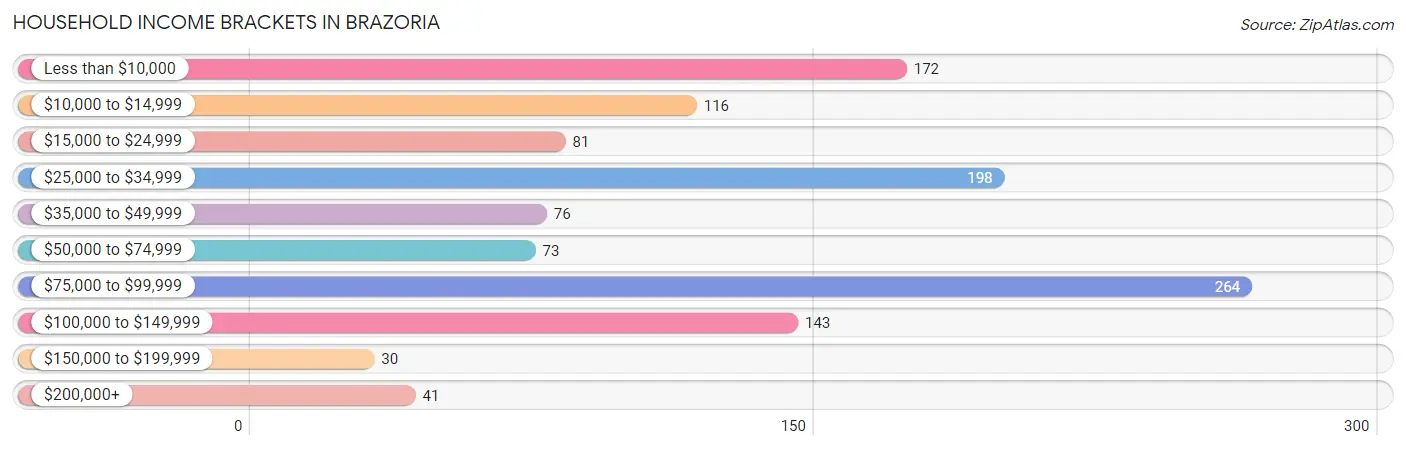
| Income Bracket | # Households | % Households |
| Less than $10,000 | 172 | 14.4% |
| $10,000 to $14,999 | 116 | 9.7% |
| $15,000 to $24,999 | 81 | 6.8% |
| $25,000 to $34,999 | 198 | 16.6% |
| $35,000 to $49,999 | 76 | 6.4% |
| $50,000 to $74,999 | 73 | 6.1% |
| $75,000 to $99,999 | 264 | 22.1% |
| $100,000 to $149,999 | 143 | 12.0% |
| $150,000 to $199,999 | 30 | 2.5% |
| $200,000+ | 41 | 3.4% |
Household Income by Householder Age in Brazoria
The median household income in Brazoria is $38,889, with the highest median household income of $75,184 found in the 25 to 44 years age bracket for the primary householder. A total of 439 households (36.8%) fall into this category. Meanwhile, the 15 to 24 years age bracket for the primary householder has the lowest median household income of $0, with 24 households (2.0%) in this group.
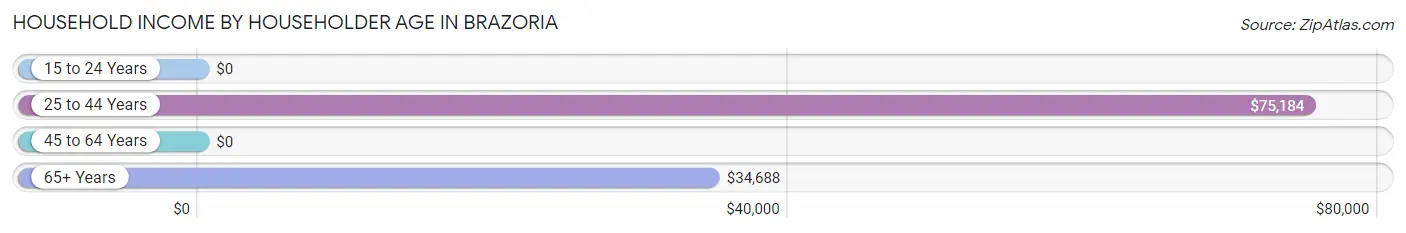
| Income Bracket | # Households | Median Income |
| 15 to 24 Years | 24 (2.0%) | $0 |
| 25 to 44 Years | 439 (36.8%) | $75,184 |
| 45 to 64 Years | 388 (32.5%) | $0 |
| 65+ Years | 343 (28.7%) | $34,688 |
| Total | 1,194 (100.0%) | $38,889 |
Poverty in Brazoria
Income Below Poverty by Sex and Age in Brazoria
With 24.0% poverty level for males and 20.6% for females among the residents of Brazoria, 45 to 54 year old males and 12 to 14 year old females are the most vulnerable to poverty, with 111 males (86.1%) and 29 females (61.7%) in their respective age groups living below the poverty level.
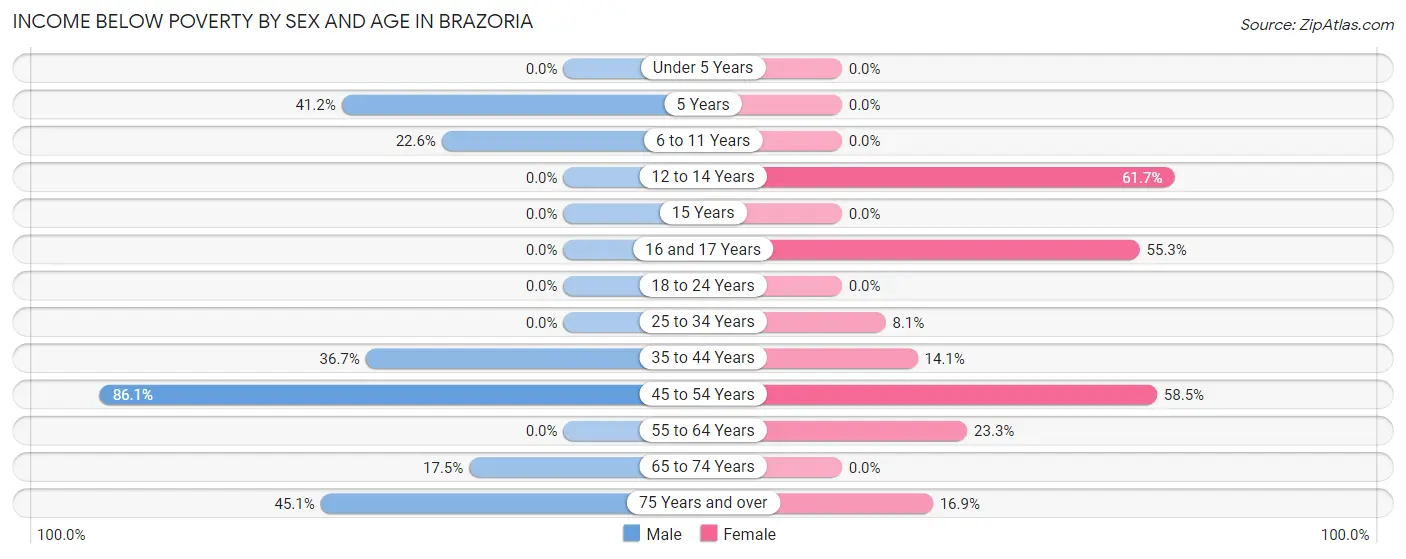
| Age Bracket | Male | Female |
| Under 5 Years | 0 (0.0%) | 0 (0.0%) |
| 5 Years | 28 (41.2%) | 0 (0.0%) |
| 6 to 11 Years | 28 (22.6%) | 0 (0.0%) |
| 12 to 14 Years | 0 (0.0%) | 29 (61.7%) |
| 15 Years | 0 (0.0%) | 0 (0.0%) |
| 16 and 17 Years | 0 (0.0%) | 68 (55.3%) |
| 18 to 24 Years | 0 (0.0%) | 0 (0.0%) |
| 25 to 34 Years | 0 (0.0%) | 25 (8.1%) |
| 35 to 44 Years | 40 (36.7%) | 28 (14.1%) |
| 45 to 54 Years | 111 (86.1%) | 124 (58.5%) |
| 55 to 64 Years | 0 (0.0%) | 64 (23.3%) |
| 65 to 74 Years | 38 (17.5%) | 0 (0.0%) |
| 75 Years and over | 32 (45.1%) | 13 (16.9%) |
| Total | 277 (24.0%) | 351 (20.6%) |
Income Above Poverty by Sex and Age in Brazoria
According to the poverty statistics in Brazoria, males aged under 5 years and females aged under 5 years are the age groups that are most secure financially, with 100.0% of males and 100.0% of females in these age groups living above the poverty line.
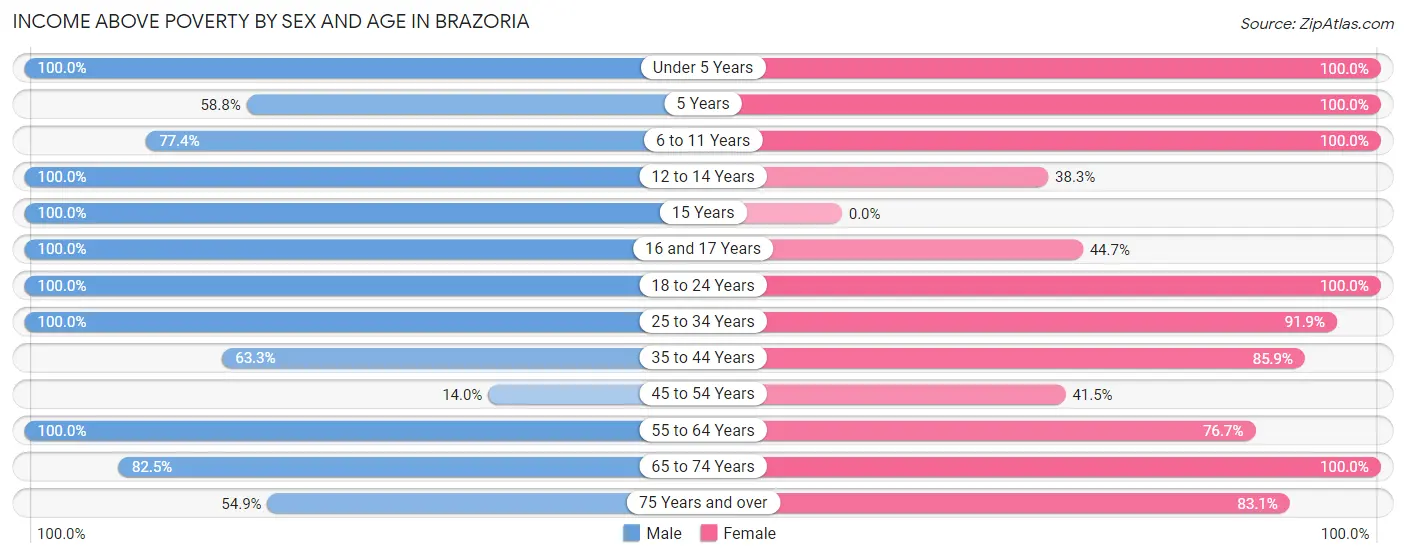
| Age Bracket | Male | Female |
| Under 5 Years | 25 (100.0%) | 169 (100.0%) |
| 5 Years | 40 (58.8%) | 29 (100.0%) |
| 6 to 11 Years | 96 (77.4%) | 64 (100.0%) |
| 12 to 14 Years | 27 (100.0%) | 18 (38.3%) |
| 15 Years | 7 (100.0%) | 0 (0.0%) |
| 16 and 17 Years | 61 (100.0%) | 55 (44.7%) |
| 18 to 24 Years | 33 (100.0%) | 63 (100.0%) |
| 25 to 34 Years | 179 (100.0%) | 283 (91.9%) |
| 35 to 44 Years | 69 (63.3%) | 171 (85.9%) |
| 45 to 54 Years | 18 (14.0%) | 88 (41.5%) |
| 55 to 64 Years | 102 (100.0%) | 211 (76.7%) |
| 65 to 74 Years | 179 (82.5%) | 134 (100.0%) |
| 75 Years and over | 39 (54.9%) | 64 (83.1%) |
| Total | 875 (75.9%) | 1,349 (79.3%) |
Income Below Poverty Among Married-Couple Families in Brazoria
The poverty statistics for married-couple families in Brazoria show that 24.8% or 140 of the total 564 families live below the poverty line. Families with no children have the highest poverty rate of 38.4%, comprising of 140 families. On the other hand, families with 1 or 2 children have the lowest poverty rate of 0.0%, which includes 0 families.
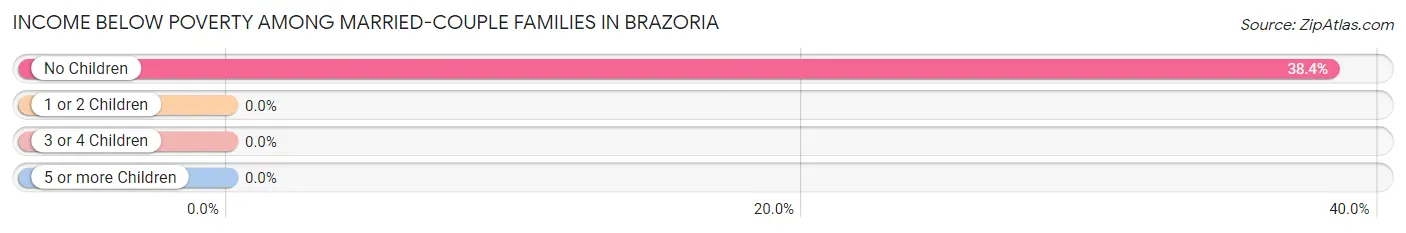
| Children | Above Poverty | Below Poverty |
| No Children | 225 (61.6%) | 140 (38.4%) |
| 1 or 2 Children | 181 (100.0%) | 0 (0.0%) |
| 3 or 4 Children | 18 (100.0%) | 0 (0.0%) |
| 5 or more Children | 0 (0.0%) | 0 (0.0%) |
| Total | 424 (75.2%) | 140 (24.8%) |
Income Below Poverty Among Single-Parent Households in Brazoria
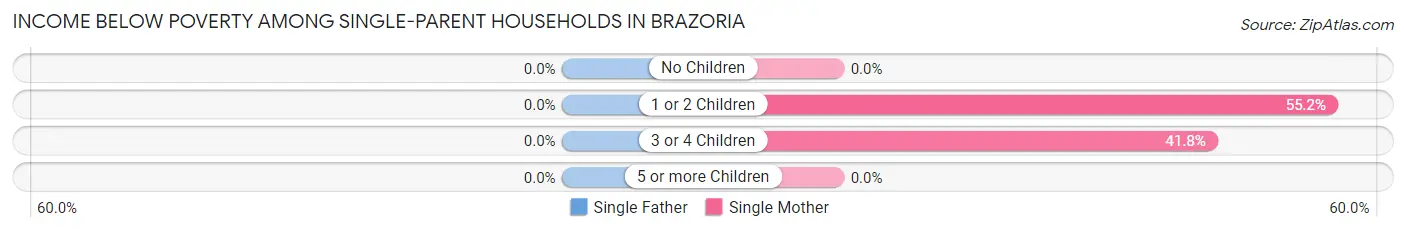
| Children | Single Father | Single Mother |
| No Children | 0 (0.0%) | 0 (0.0%) |
| 1 or 2 Children | 0 (0.0%) | 37 (55.2%) |
| 3 or 4 Children | 0 (0.0%) | 28 (41.8%) |
| 5 or more Children | 0 (0.0%) | 0 (0.0%) |
| Total | 0 (0.0%) | 65 (31.9%) |
Income Below Poverty Among Married-Couple vs Single-Parent Households in Brazoria
The poverty data for Brazoria shows that 140 of the married-couple family households (24.8%) and 65 of the single-parent households (26.9%) are living below the poverty level. Within the married-couple family households, those with no children have the highest poverty rate, with 140 households (38.4%) falling below the poverty line. Among the single-parent households, those with 3 or 4 children have the highest poverty rate, with 28 household (41.8%) living below poverty.
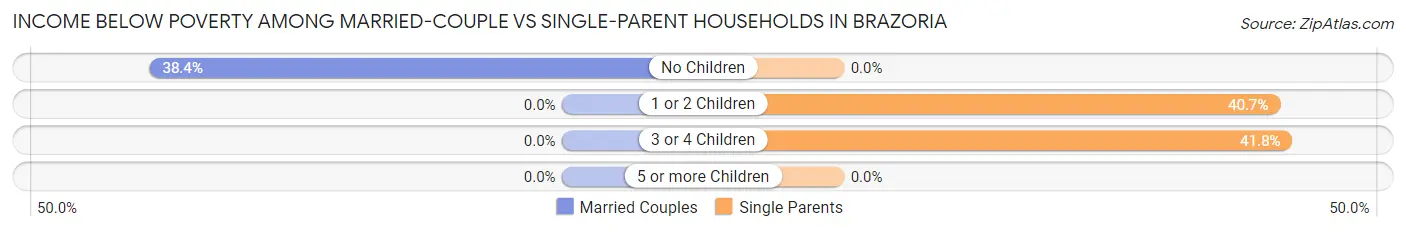
| Children | Married-Couple Families | Single-Parent Households |
| No Children | 140 (38.4%) | 0 (0.0%) |
| 1 or 2 Children | 0 (0.0%) | 37 (40.7%) |
| 3 or 4 Children | 0 (0.0%) | 28 (41.8%) |
| 5 or more Children | 0 (0.0%) | 0 (0.0%) |
| Total | 140 (24.8%) | 65 (26.9%) |
Race in Brazoria
The most populous races in Brazoria are White / Caucasian (2,217 | 77.1%), Hispanic or Latino (715 | 24.9%), and Black / African American (400 | 13.9%).
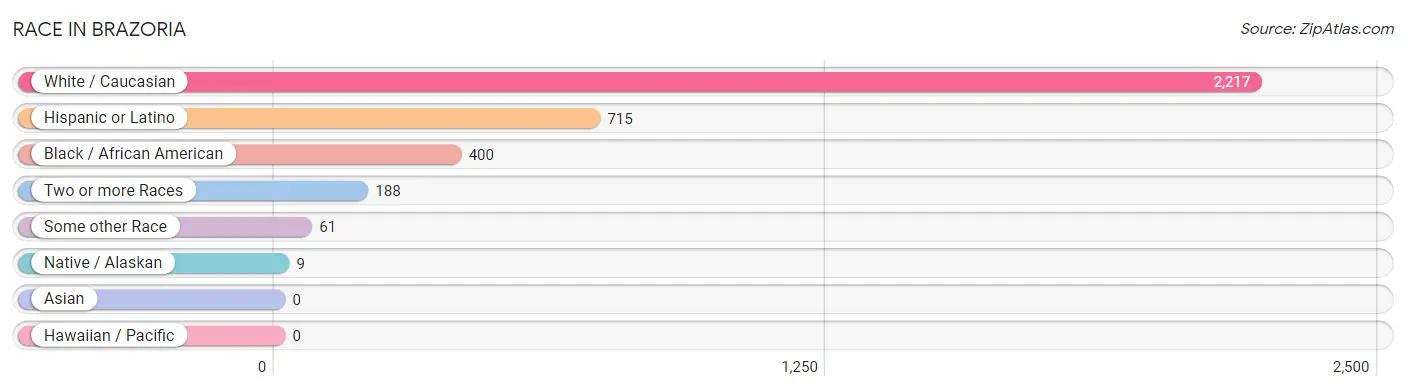
| Race | # Population | % Population |
| Asian | 0 | 0.0% |
| Black / African American | 400 | 13.9% |
| Hawaiian / Pacific | 0 | 0.0% |
| Hispanic or Latino | 715 | 24.9% |
| Native / Alaskan | 9 | 0.3% |
| White / Caucasian | 2,217 | 77.1% |
| Two or more Races | 188 | 6.5% |
| Some other Race | 61 | 2.1% |
| Total | 2,875 | 100.0% |
Ancestry in Brazoria
The most populous ancestries reported in Brazoria are Mexican (675 | 23.5%), American (468 | 16.3%), German (387 | 13.5%), Irish (351 | 12.2%), and English (200 | 7.0%), together accounting for 72.4% of all Brazoria residents.
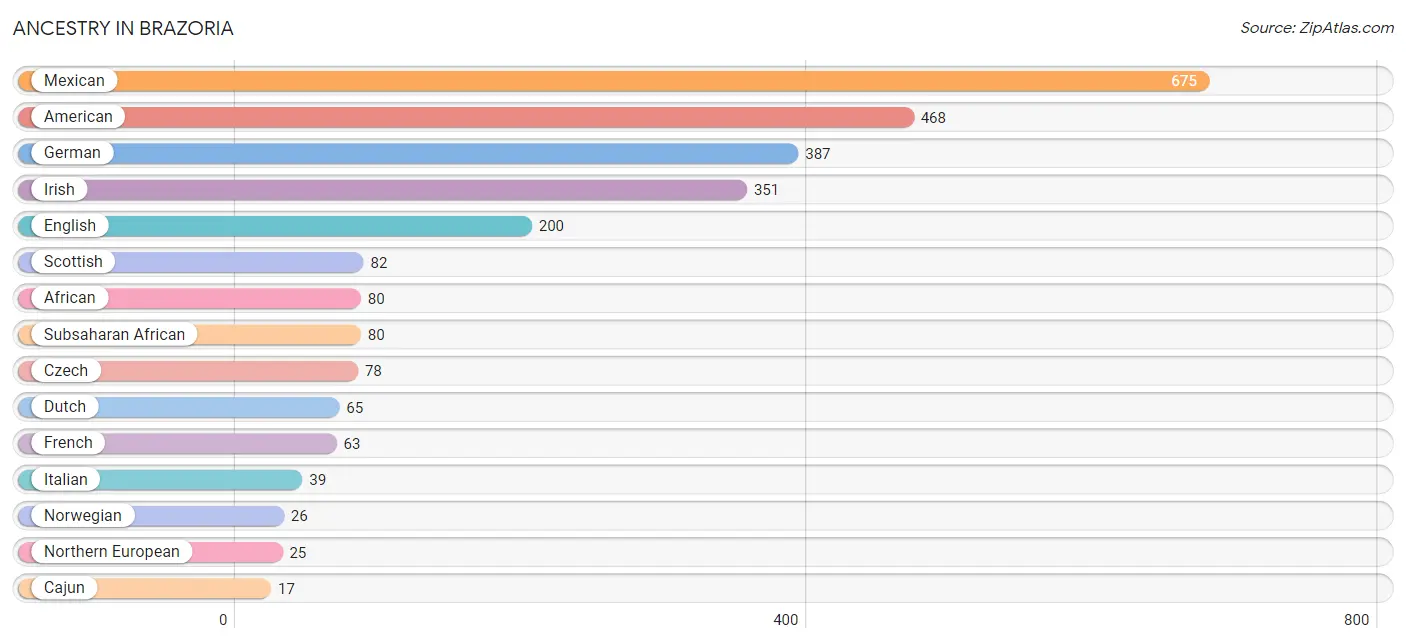
| Ancestry | # Population | % Population |
| African | 80 | 2.8% |
| American | 468 | 16.3% |
| Cajun | 17 | 0.6% |
| Central American | 11 | 0.4% |
| Czech | 78 | 2.7% |
| Dutch | 65 | 2.3% |
| English | 200 | 7.0% |
| European | 9 | 0.3% |
| French | 63 | 2.2% |
| German | 387 | 13.5% |
| Guatemalan | 11 | 0.4% |
| Irish | 351 | 12.2% |
| Italian | 39 | 1.4% |
| Mexican | 675 | 23.5% |
| Navajo | 9 | 0.3% |
| Northern European | 25 | 0.9% |
| Norwegian | 26 | 0.9% |
| Russian | 7 | 0.2% |
| Scottish | 82 | 2.9% |
| Subsaharan African | 80 | 2.8% |
| Swedish | 5 | 0.2% | View All 21 Rows |
Immigrants in Brazoria
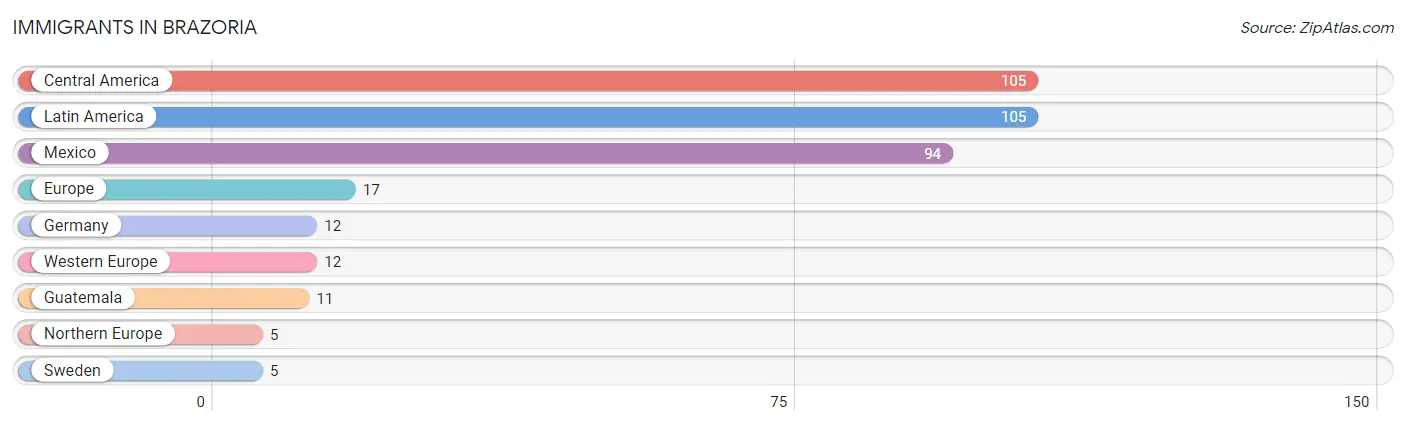
The most numerous immigrant groups reported in Brazoria came from Central America (105 | 3.6%), Latin America (105 | 3.6%), Mexico (94 | 3.3%), Europe (17 | 0.6%), and Germany (12 | 0.4%), together accounting for 11.6% of all Brazoria residents.
| Immigration Origin | # Population | % Population |
| Central America | 105 | 3.6% |
| Europe | 17 | 0.6% |
| Germany | 12 | 0.4% |
| Guatemala | 11 | 0.4% |
| Latin America | 105 | 3.6% |
| Mexico | 94 | 3.3% |
| Northern Europe | 5 | 0.2% |
| Sweden | 5 | 0.2% |
| Western Europe | 12 | 0.4% | View All 9 Rows |
Sex and Age in Brazoria
Sex and Age in Brazoria
The most populous age groups in Brazoria are 5 to 9 Years (134 | 11.6%) for men and 25 to 29 Years (225 | 13.1%) for women.
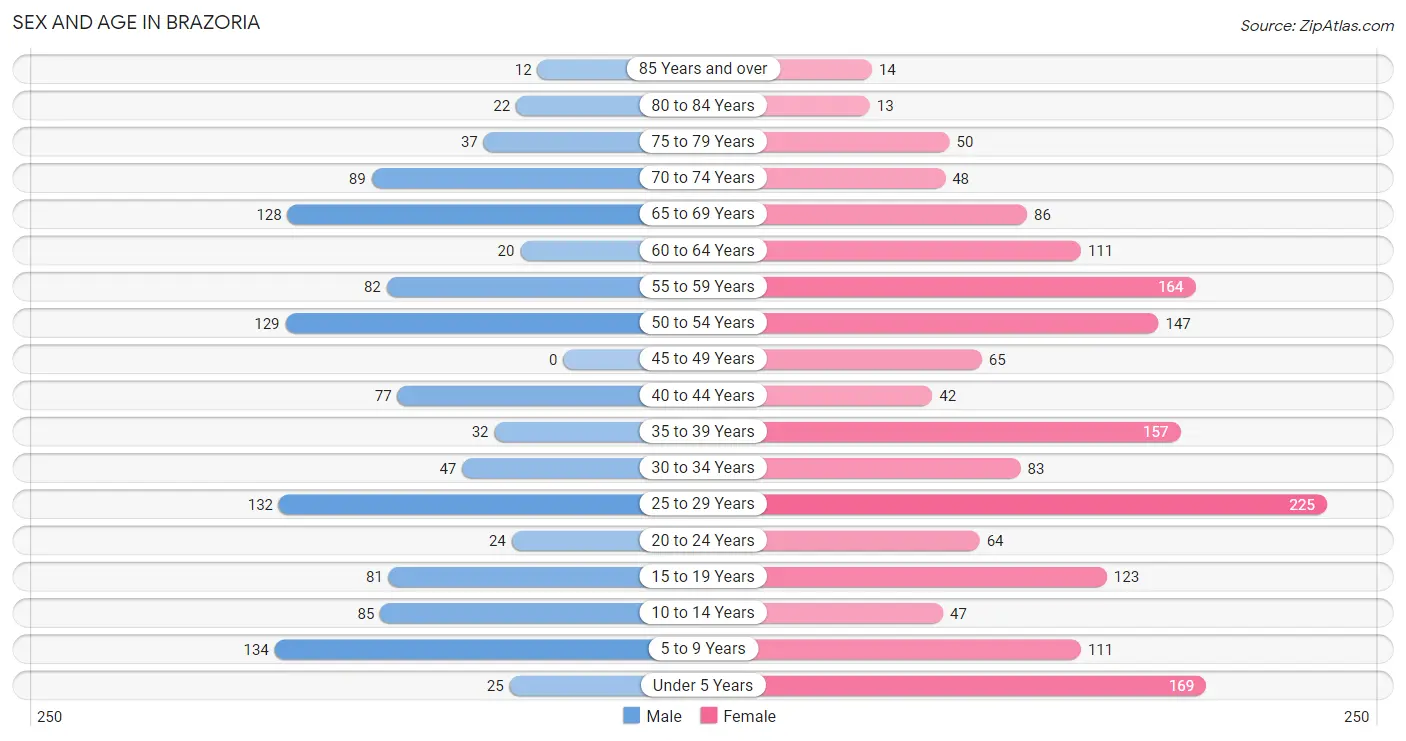
| Age Bracket | Male | Female |
| Under 5 Years | 25 (2.2%) | 169 (9.8%) |
| 5 to 9 Years | 134 (11.6%) | 111 (6.5%) |
| 10 to 14 Years | 85 (7.3%) | 47 (2.7%) |
| 15 to 19 Years | 81 (7.0%) | 123 (7.2%) |
| 20 to 24 Years | 24 (2.1%) | 64 (3.7%) |
| 25 to 29 Years | 132 (11.4%) | 225 (13.1%) |
| 30 to 34 Years | 47 (4.1%) | 83 (4.8%) |
| 35 to 39 Years | 32 (2.8%) | 157 (9.1%) |
| 40 to 44 Years | 77 (6.7%) | 42 (2.4%) |
| 45 to 49 Years | 0 (0.0%) | 65 (3.8%) |
| 50 to 54 Years | 129 (11.2%) | 147 (8.6%) |
| 55 to 59 Years | 82 (7.1%) | 164 (9.5%) |
| 60 to 64 Years | 20 (1.7%) | 111 (6.5%) |
| 65 to 69 Years | 128 (11.1%) | 86 (5.0%) |
| 70 to 74 Years | 89 (7.7%) | 48 (2.8%) |
| 75 to 79 Years | 37 (3.2%) | 50 (2.9%) |
| 80 to 84 Years | 22 (1.9%) | 13 (0.8%) |
| 85 Years and over | 12 (1.0%) | 14 (0.8%) |
| Total | 1,156 (100.0%) | 1,719 (100.0%) |
Families and Households in Brazoria
Median Family Size in Brazoria
The median family size in Brazoria is 2.94 persons per family, with single male/father families (38 | 4.7%) accounting for the largest median family size of 4.87 persons per family. On the other hand, married-couple families (564 | 70.0%) represent the smallest median family size with 2.67 persons per family.
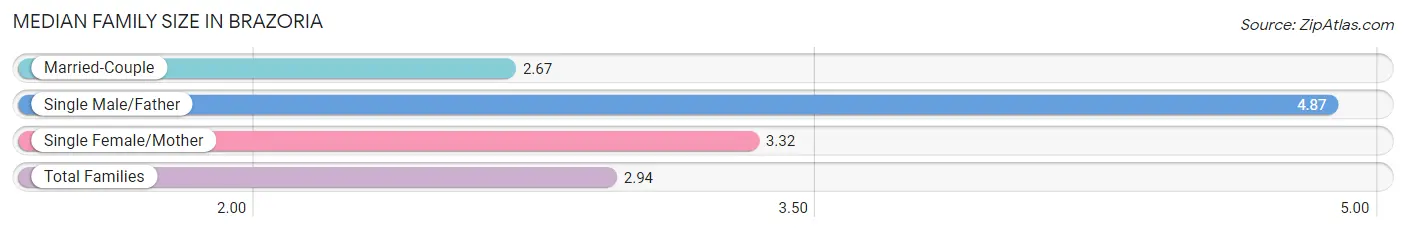
| Family Type | # Families | Family Size |
| Married-Couple | 564 (70.0%) | 2.67 |
| Single Male/Father | 38 (4.7%) | 4.87 |
| Single Female/Mother | 204 (25.3%) | 3.32 |
| Total Families | 806 (100.0%) | 2.94 |
Median Household Size in Brazoria
The median household size in Brazoria is 2.40 persons per household, with single male/father households (38 | 3.2%) accounting for the largest median household size of 4.87 persons per household. non-family households (388 | 32.5%) represent the smallest median household size with 1.15 persons per household.
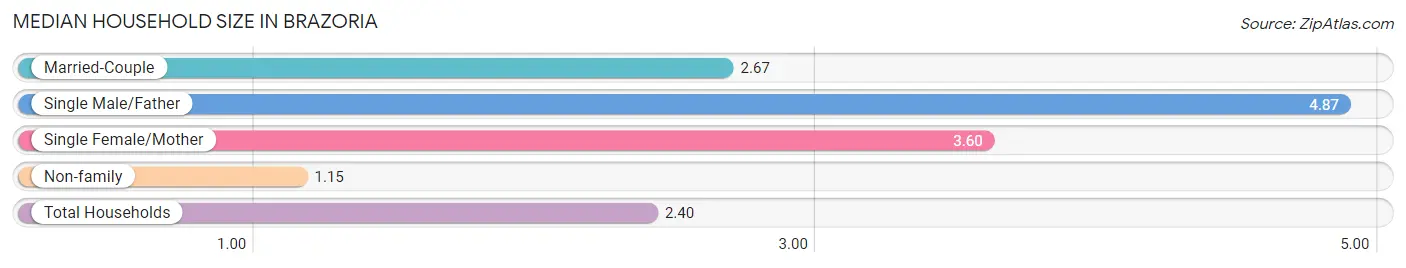
| Household Type | # Households | Household Size |
| Married-Couple | 564 (47.2%) | 2.67 |
| Single Male/Father | 38 (3.2%) | 4.87 |
| Single Female/Mother | 204 (17.1%) | 3.60 |
| Non-family | 388 (32.5%) | 1.15 |
| Total Households | 1,194 (100.0%) | 2.40 |
Household Size by Marriage Status in Brazoria
Out of a total of 1,194 households in Brazoria, 806 (67.5%) are family households, while 388 (32.5%) are nonfamily households. The most numerous type of family households are 2-person households, comprising 377, and the most common type of nonfamily households are 1-person households, comprising 352.
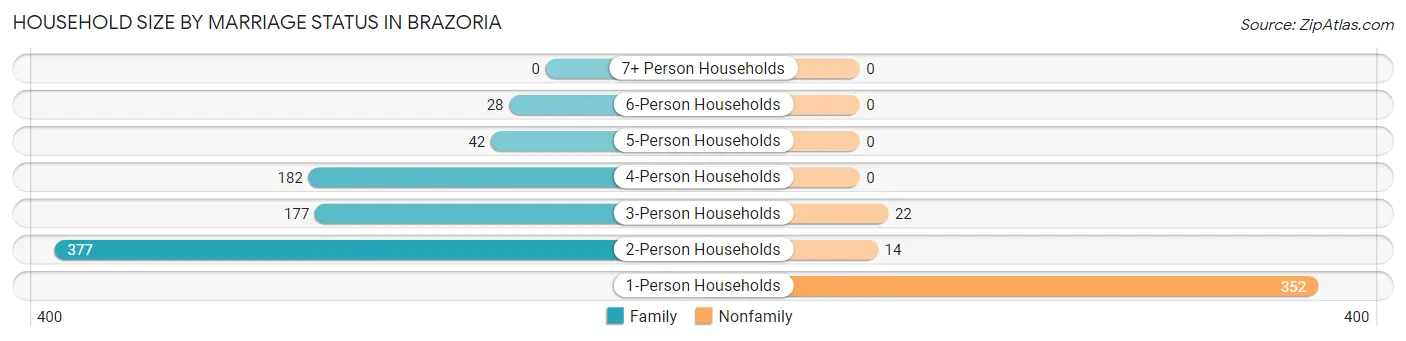
| Household Size | Family Households | Nonfamily Households |
| 1-Person Households | - | 352 (29.5%) |
| 2-Person Households | 377 (31.6%) | 14 (1.2%) |
| 3-Person Households | 177 (14.8%) | 22 (1.8%) |
| 4-Person Households | 182 (15.2%) | 0 (0.0%) |
| 5-Person Households | 42 (3.5%) | 0 (0.0%) |
| 6-Person Households | 28 (2.4%) | 0 (0.0%) |
| 7+ Person Households | 0 (0.0%) | 0 (0.0%) |
| Total | 806 (67.5%) | 388 (32.5%) |
Female Fertility in Brazoria
Fertility by Age in Brazoria
Average fertility rate in Brazoria is 179.0 births per 1,000 women. Women in the age bracket of 20 to 34 years have the highest fertility rate with 331.0 births per 1,000 women. Women in the age bracket of 20 to 34 years acount for 90.4% of all women with births.
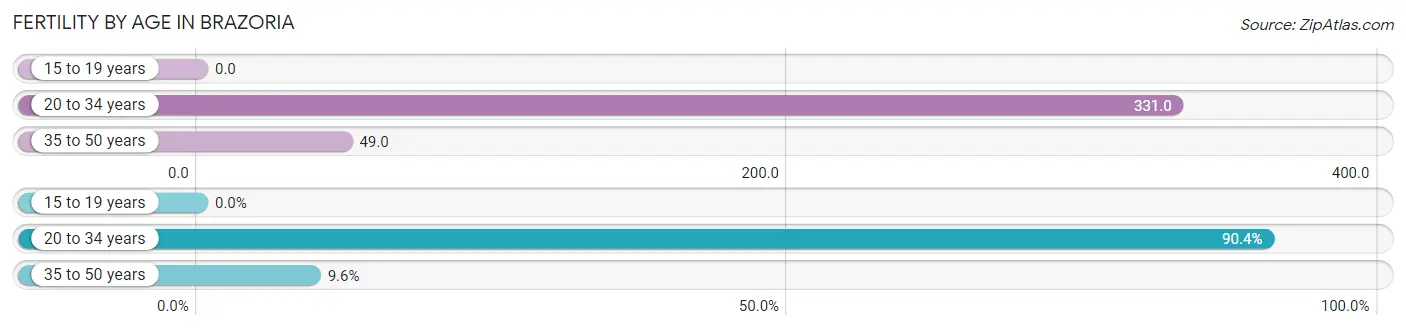
| Age Bracket | Women with Births | Births / 1,000 Women |
| 15 to 19 years | 0 (0.0%) | 0.0 |
| 20 to 34 years | 123 (90.4%) | 331.0 |
| 35 to 50 years | 13 (9.6%) | 49.0 |
| Total | 136 (100.0%) | 179.0 |
Fertility by Age by Marriage Status in Brazoria
88.2% of women with births (136) in Brazoria are married. The highest percentage of unmarried women with births falls into 20 to 34 years age bracket with 13.0% of them unmarried at the time of birth, while the lowest percentage of unmarried women with births belong to 35 to 50 years age bracket with 0.0% of them unmarried.
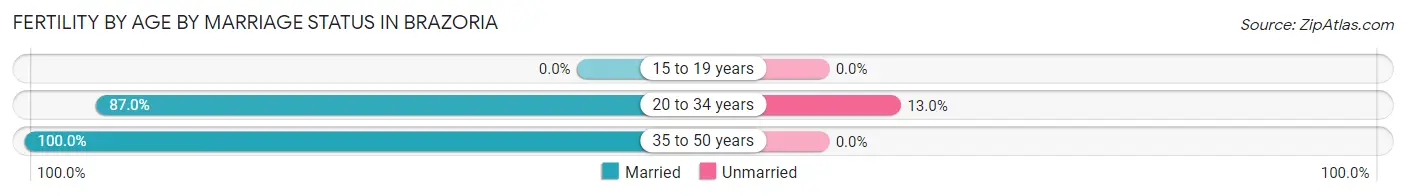
| Age Bracket | Married | Unmarried |
| 15 to 19 years | 0 (0.0%) | 0 (0.0%) |
| 20 to 34 years | 107 (87.0%) | 16 (13.0%) |
| 35 to 50 years | 13 (100.0%) | 0 (0.0%) |
| Total | 120 (88.2%) | 16 (11.8%) |
Fertility by Education in Brazoria
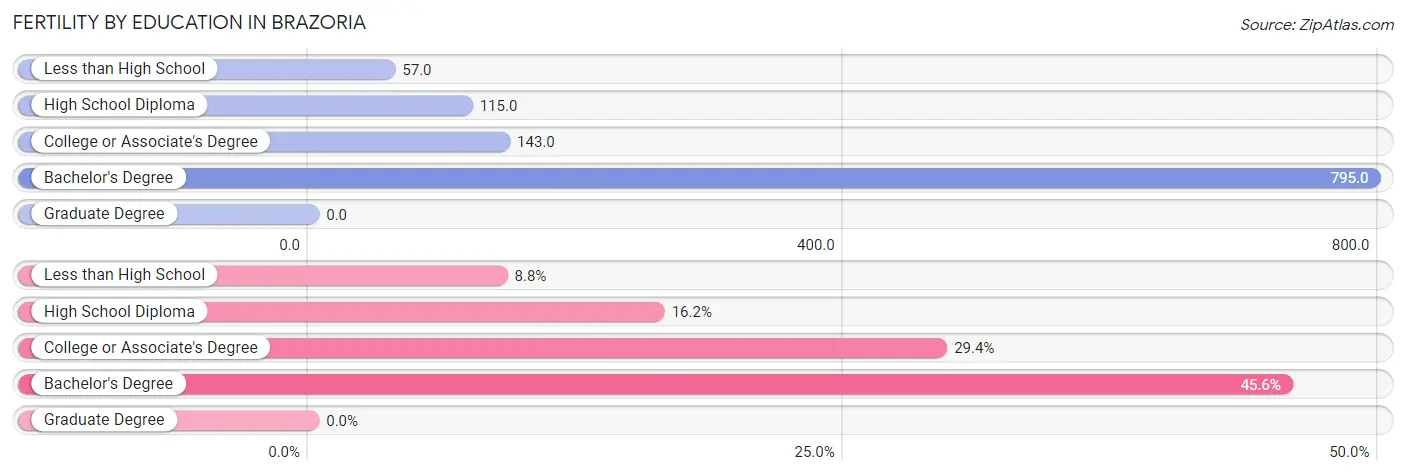
| Educational Attainment | Women with Births | Births / 1,000 Women |
| Less than High School | 12 (8.8%) | 57.0 |
| High School Diploma | 22 (16.2%) | 115.0 |
| College or Associate's Degree | 40 (29.4%) | 143.0 |
| Bachelor's Degree | 62 (45.6%) | 795.0 |
| Graduate Degree | 0 (0.0%) | 0.0 |
| Total | 136 (100.0%) | 179.0 |
Fertility by Education by Marriage Status in Brazoria
11.8% of women with births in Brazoria are unmarried. Women with the educational attainment of less than high school are most likely to be married with 100.0% of them married at childbirth, while women with the educational attainment of college or associate's degree are least likely to be married with 40.0% of them unmarried at childbirth.
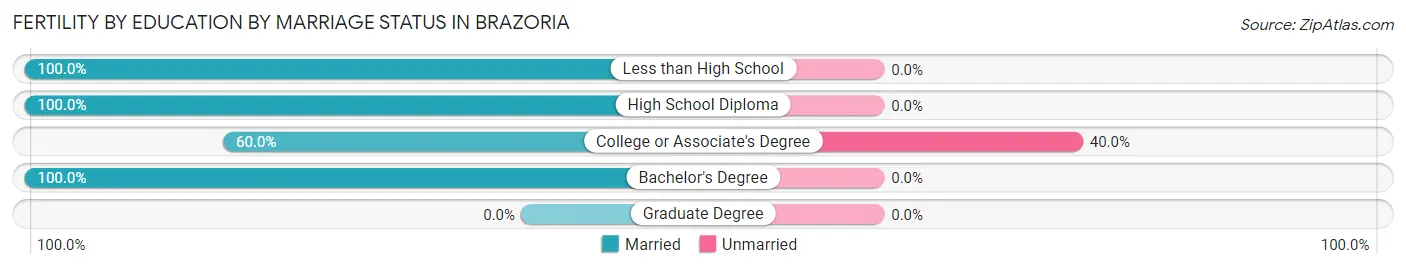
| Educational Attainment | Married | Unmarried |
| Less than High School | 12 (100.0%) | 0 (0.0%) |
| High School Diploma | 22 (100.0%) | 0 (0.0%) |
| College or Associate's Degree | 24 (60.0%) | 16 (40.0%) |
| Bachelor's Degree | 62 (100.0%) | 0 (0.0%) |
| Graduate Degree | 0 (0.0%) | 0 (0.0%) |
| Total | 120 (88.2%) | 16 (11.8%) |
Employment Characteristics in Brazoria
Employment by Class of Employer in Brazoria
Among the 1,232 employed individuals in Brazoria, private company employees (785 | 63.7%), not-for-profit organizations (114 | 9.2%), and state government employees (85 | 6.9%) make up the most common classes of employment.
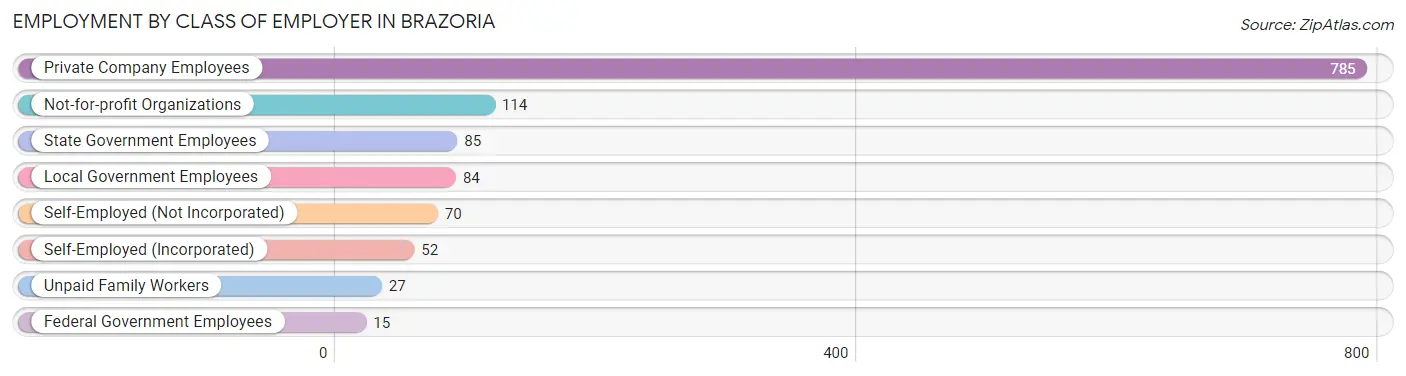
| Employer Class | # Employees | % Employees |
| Private Company Employees | 785 | 63.7% |
| Self-Employed (Incorporated) | 52 | 4.2% |
| Self-Employed (Not Incorporated) | 70 | 5.7% |
| Not-for-profit Organizations | 114 | 9.2% |
| Local Government Employees | 84 | 6.8% |
| State Government Employees | 85 | 6.9% |
| Federal Government Employees | 15 | 1.2% |
| Unpaid Family Workers | 27 | 2.2% |
| Total | 1,232 | 100.0% |
Employment Status by Age in Brazoria
According to the labor force statistics for Brazoria, out of the total population over 16 years of age (2,297), 55.9% or 1,284 individuals are in the labor force, with 2.8% or 36 of them unemployed. The age group with the highest labor force participation rate is 30 to 34 years, with 100.0% or 130 individuals in the labor force. Within the labor force, the 25 to 29 years age range has the highest percentage of unemployed individuals, with 8.4% or 25 of them being unemployed.
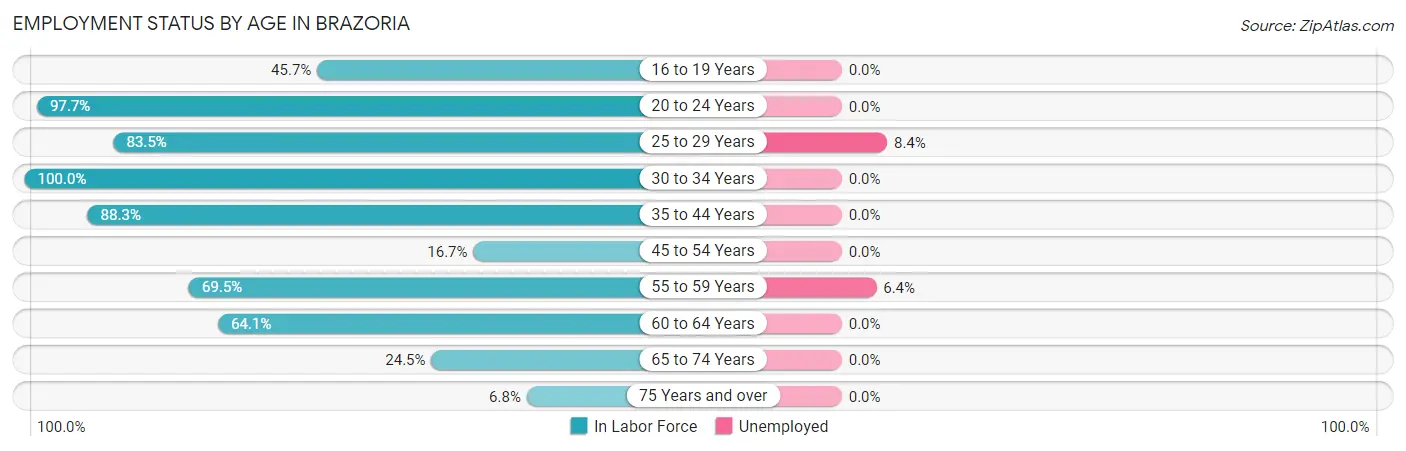
| Age Bracket | In Labor Force | Unemployed |
| 16 to 19 Years | 90 (45.7%) | 0 (0.0%) |
| 20 to 24 Years | 86 (97.7%) | 0 (0.0%) |
| 25 to 29 Years | 298 (83.5%) | 25 (8.4%) |
| 30 to 34 Years | 130 (100.0%) | 0 (0.0%) |
| 35 to 44 Years | 272 (88.3%) | 0 (0.0%) |
| 45 to 54 Years | 57 (16.7%) | 0 (0.0%) |
| 55 to 59 Years | 171 (69.5%) | 11 (6.4%) |
| 60 to 64 Years | 84 (64.1%) | 0 (0.0%) |
| 65 to 74 Years | 86 (24.5%) | 0 (0.0%) |
| 75 Years and over | 10 (6.8%) | 0 (0.0%) |
| Total | 1,284 (55.9%) | 36 (2.8%) |
Employment Status by Educational Attainment in Brazoria
According to labor force statistics for Brazoria, 66.9% of individuals (1,012) out of the total population between 25 and 64 years of age (1,513) are in the labor force, with 3.6% or 36 of them being unemployed. The group with the highest labor force participation rate are those with the educational attainment of bachelor's degree or higher, with 83.0% or 122 individuals in the labor force. Within the labor force, individuals with less than high school education have the highest percentage of unemployment, with 12.7% or 25 of them being unemployed.

| Educational Attainment | In Labor Force | Unemployed |
| Less than High School | 197 (61.2%) | 41 (12.7%) |
| High School Diploma | 243 (48.5%) | 0 (0.0%) |
| College / Associate Degree | 450 (82.9%) | 13 (2.4%) |
| Bachelor's Degree or higher | 122 (83.0%) | 0 (0.0%) |
| Total | 1,012 (66.9%) | 54 (3.6%) |
Employment Occupations by Sex in Brazoria
Management, Business, Science and Arts Occupations
The most common Management, Business, Science and Arts occupations in Brazoria are Community & Social Service (140 | 11.2%), Education Instruction & Library (82 | 6.6%), Computers, Engineering & Science (75 | 6.0%), Management (69 | 5.5%), and Business & Financial (42 | 3.4%).
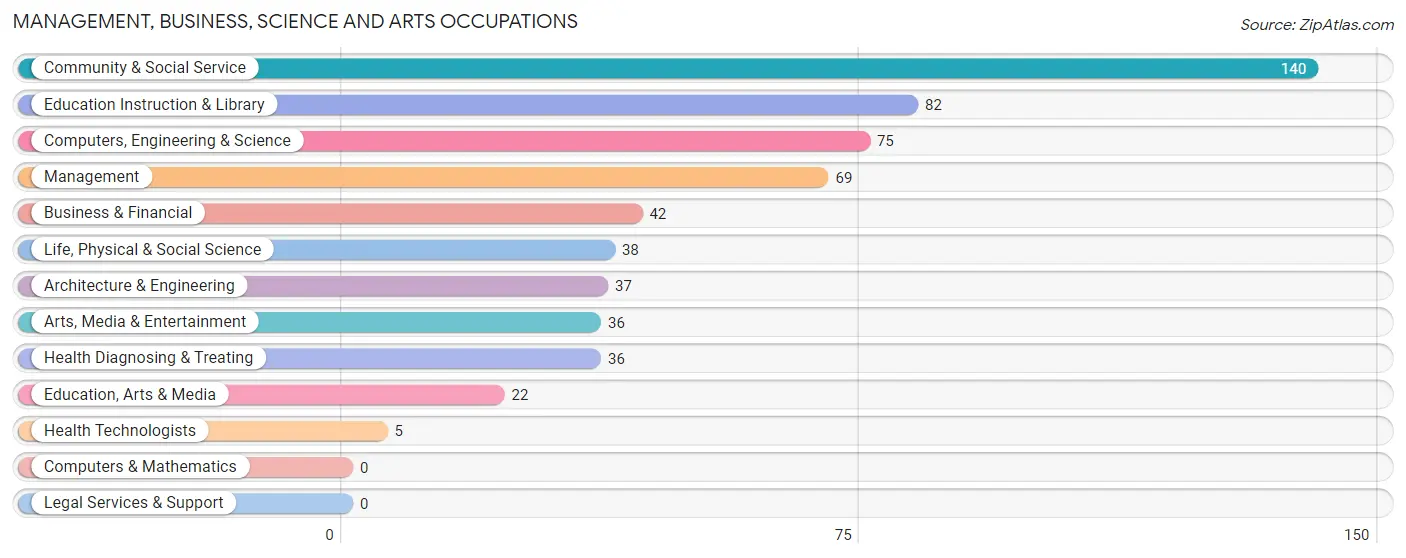
Management, Business, Science and Arts Occupations by Sex
Within the Management, Business, Science and Arts occupations in Brazoria, the most male-oriented occupations are Life, Physical & Social Science (100.0%), Arts, Media & Entertainment (100.0%), and Computers, Engineering & Science (90.7%), while the most female-oriented occupations are Business & Financial (100.0%), Education, Arts & Media (100.0%), and Health Diagnosing & Treating (100.0%).
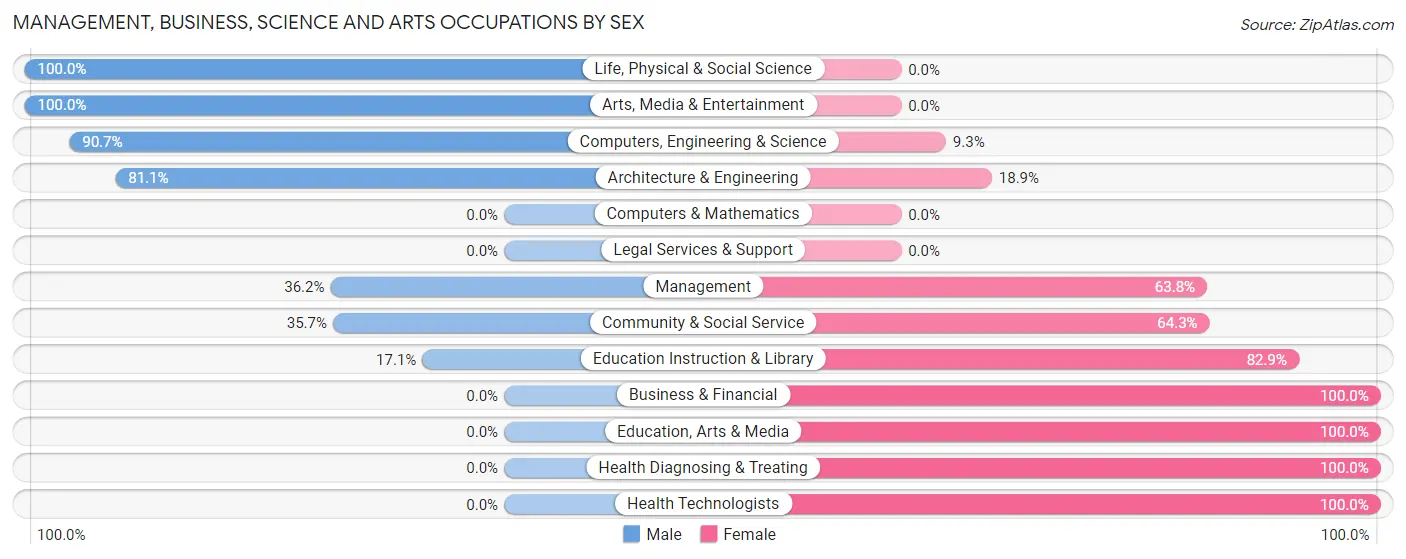
| Occupation | Male | Female |
| Management | 25 (36.2%) | 44 (63.8%) |
| Business & Financial | 0 (0.0%) | 42 (100.0%) |
| Computers, Engineering & Science | 68 (90.7%) | 7 (9.3%) |
| Computers & Mathematics | 0 (0.0%) | 0 (0.0%) |
| Architecture & Engineering | 30 (81.1%) | 7 (18.9%) |
| Life, Physical & Social Science | 38 (100.0%) | 0 (0.0%) |
| Community & Social Service | 50 (35.7%) | 90 (64.3%) |
| Education, Arts & Media | 0 (0.0%) | 22 (100.0%) |
| Legal Services & Support | 0 (0.0%) | 0 (0.0%) |
| Education Instruction & Library | 14 (17.1%) | 68 (82.9%) |
| Arts, Media & Entertainment | 36 (100.0%) | 0 (0.0%) |
| Health Diagnosing & Treating | 0 (0.0%) | 36 (100.0%) |
| Health Technologists | 0 (0.0%) | 5 (100.0%) |
| Total (Category) | 143 (39.5%) | 219 (60.5%) |
| Total (Overall) | 521 (41.7%) | 727 (58.3%) |
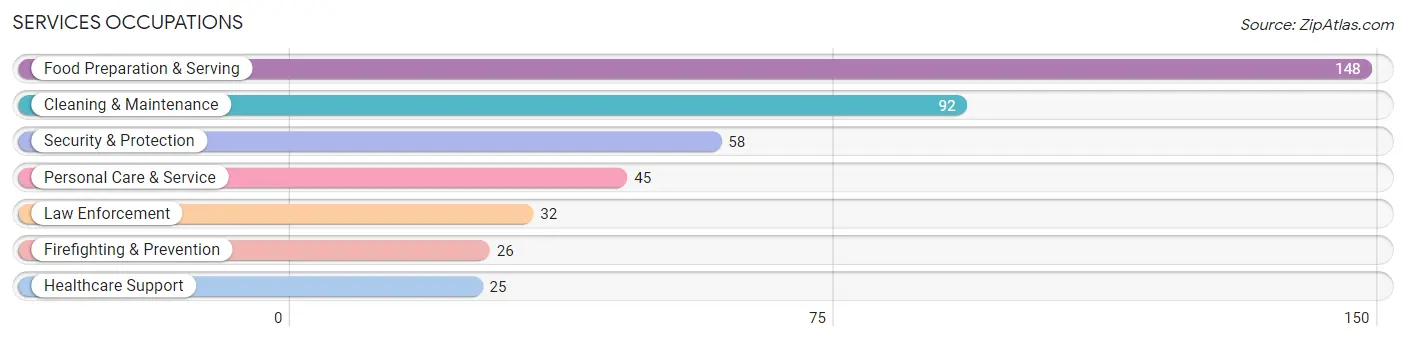
Services Occupations
The most common Services occupations in Brazoria are Food Preparation & Serving (148 | 11.9%), Cleaning & Maintenance (92 | 7.4%), Security & Protection (58 | 4.6%), Personal Care & Service (45 | 3.6%), and Law Enforcement (32 | 2.6%).
Services Occupations by Sex
Within the Services occupations in Brazoria, the most male-oriented occupations are Firefighting & Prevention (100.0%), Security & Protection (82.8%), and Law Enforcement (68.8%), while the most female-oriented occupations are Healthcare Support (100.0%), Personal Care & Service (100.0%), and Food Preparation & Serving (69.6%).
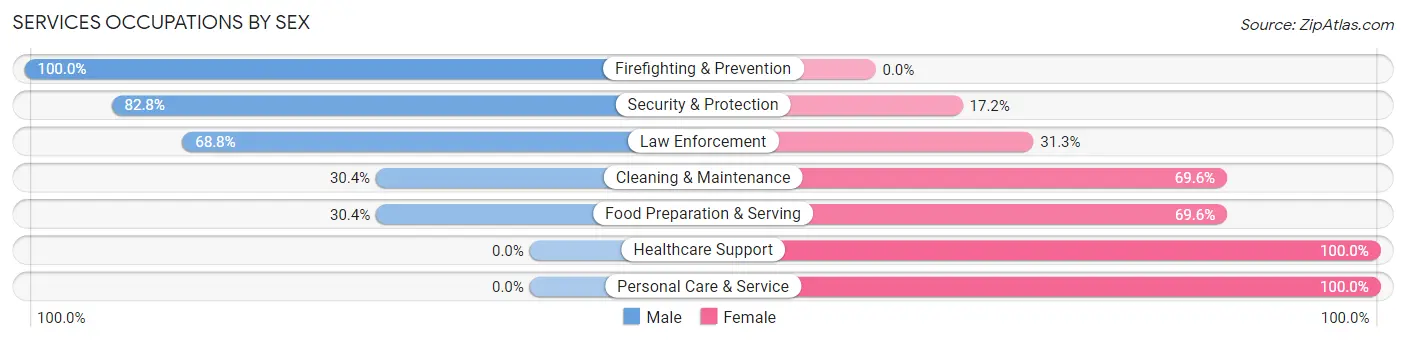
| Occupation | Male | Female |
| Healthcare Support | 0 (0.0%) | 25 (100.0%) |
| Security & Protection | 48 (82.8%) | 10 (17.2%) |
| Firefighting & Prevention | 26 (100.0%) | 0 (0.0%) |
| Law Enforcement | 22 (68.8%) | 10 (31.2%) |
| Food Preparation & Serving | 45 (30.4%) | 103 (69.6%) |
| Cleaning & Maintenance | 28 (30.4%) | 64 (69.6%) |
| Personal Care & Service | 0 (0.0%) | 45 (100.0%) |
| Total (Category) | 121 (32.9%) | 247 (67.1%) |
| Total (Overall) | 521 (41.7%) | 727 (58.3%) |
Sales and Office Occupations
The most common Sales and Office occupations in Brazoria are Office & Administration (119 | 9.5%), and Sales & Related (91 | 7.3%).

Sales and Office Occupations by Sex

| Occupation | Male | Female |
| Sales & Related | 12 (13.2%) | 79 (86.8%) |
| Office & Administration | 15 (12.6%) | 104 (87.4%) |
| Total (Category) | 27 (12.9%) | 183 (87.1%) |
| Total (Overall) | 521 (41.7%) | 727 (58.3%) |
Natural Resources, Construction and Maintenance Occupations
The most common Natural Resources, Construction and Maintenance occupations in Brazoria are Construction & Extraction (47 | 3.8%), and Installation, Maintenance & Repair (25 | 2.0%).

Natural Resources, Construction and Maintenance Occupations by Sex

| Occupation | Male | Female |
| Farming, Fishing & Forestry | 0 (0.0%) | 0 (0.0%) |
| Construction & Extraction | 25 (53.2%) | 22 (46.8%) |
| Installation, Maintenance & Repair | 25 (100.0%) | 0 (0.0%) |
| Total (Category) | 50 (69.4%) | 22 (30.6%) |
| Total (Overall) | 521 (41.7%) | 727 (58.3%) |
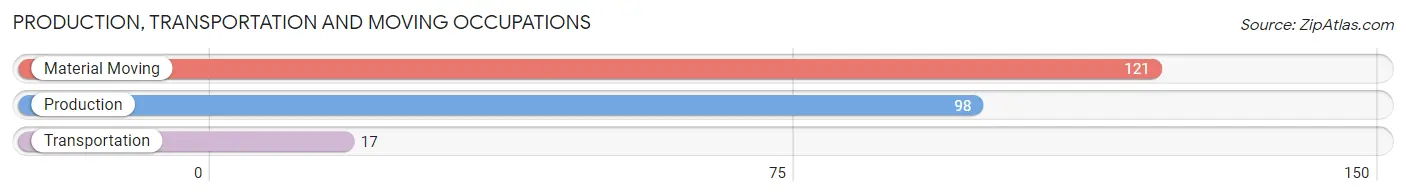
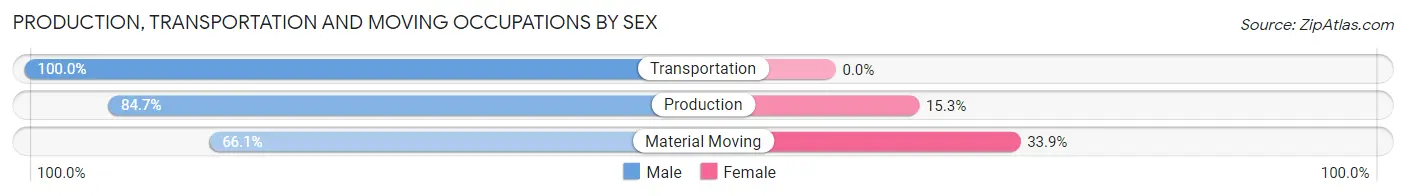
Production, Transportation and Moving Occupations
The most common Production, Transportation and Moving occupations in Brazoria are Material Moving (121 | 9.7%), Production (98 | 7.9%), and Transportation (17 | 1.4%).
Production, Transportation and Moving Occupations by Sex
| Occupation | Male | Female |
| Production | 83 (84.7%) | 15 (15.3%) |
| Transportation | 17 (100.0%) | 0 (0.0%) |
| Material Moving | 80 (66.1%) | 41 (33.9%) |
| Total (Category) | 180 (76.3%) | 56 (23.7%) |
| Total (Overall) | 521 (41.7%) | 727 (58.3%) |
Employment Industries by Sex in Brazoria
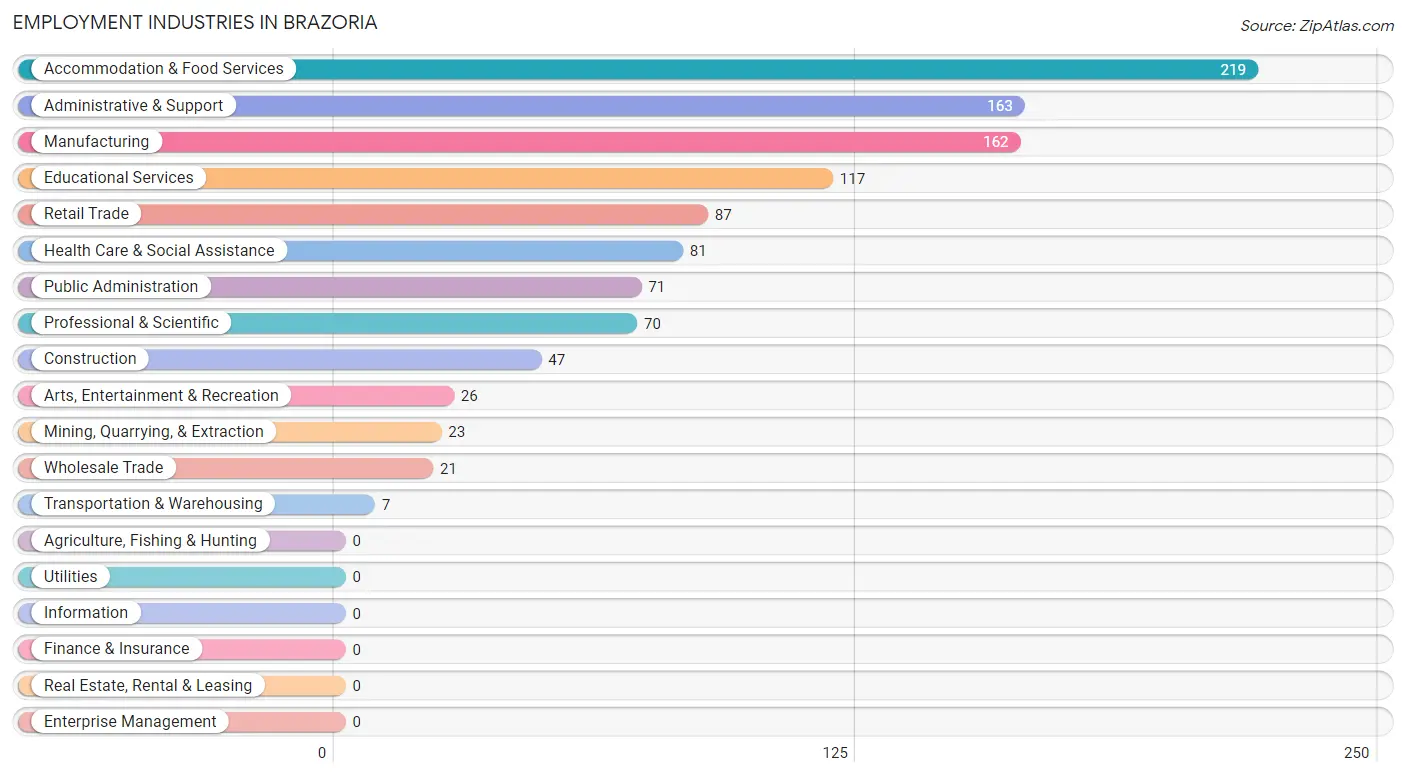
Employment Industries in Brazoria
The major employment industries in Brazoria include Accommodation & Food Services (219 | 17.5%), Administrative & Support (163 | 13.1%), Manufacturing (162 | 13.0%), Educational Services (117 | 9.4%), and Retail Trade (87 | 7.0%).
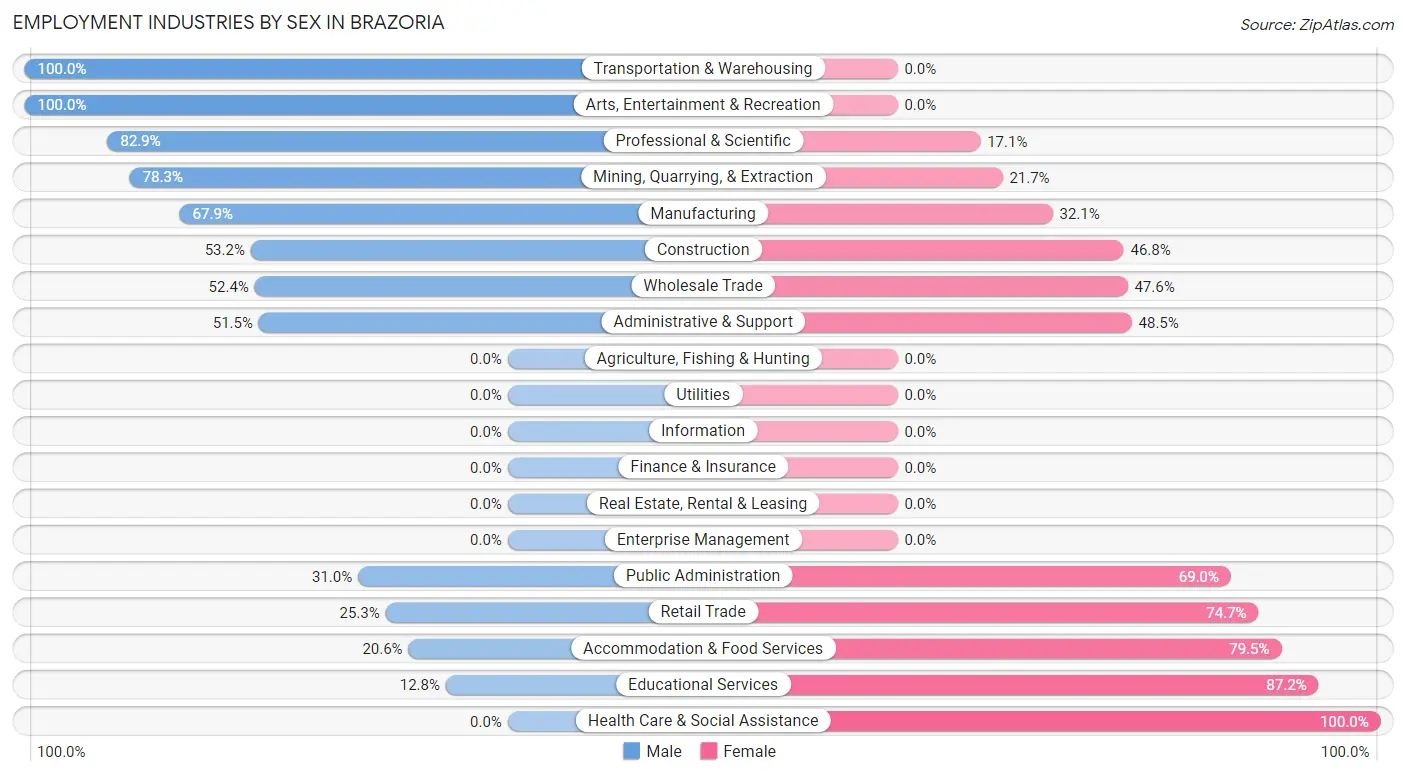
Employment Industries by Sex in Brazoria
The Brazoria industries that see more men than women are Transportation & Warehousing (100.0%), Arts, Entertainment & Recreation (100.0%), and Professional & Scientific (82.9%), whereas the industries that tend to have a higher number of women are Health Care & Social Assistance (100.0%), Educational Services (87.2%), and Accommodation & Food Services (79.4%).
| Industry | Male | Female |
| Agriculture, Fishing & Hunting | 0 (0.0%) | 0 (0.0%) |
| Mining, Quarrying, & Extraction | 18 (78.3%) | 5 (21.7%) |
| Construction | 25 (53.2%) | 22 (46.8%) |
| Manufacturing | 110 (67.9%) | 52 (32.1%) |
| Wholesale Trade | 11 (52.4%) | 10 (47.6%) |
| Retail Trade | 22 (25.3%) | 65 (74.7%) |
| Transportation & Warehousing | 7 (100.0%) | 0 (0.0%) |
| Utilities | 0 (0.0%) | 0 (0.0%) |
| Information | 0 (0.0%) | 0 (0.0%) |
| Finance & Insurance | 0 (0.0%) | 0 (0.0%) |
| Real Estate, Rental & Leasing | 0 (0.0%) | 0 (0.0%) |
| Professional & Scientific | 58 (82.9%) | 12 (17.1%) |
| Enterprise Management | 0 (0.0%) | 0 (0.0%) |
| Administrative & Support | 84 (51.5%) | 79 (48.5%) |
| Educational Services | 15 (12.8%) | 102 (87.2%) |
| Health Care & Social Assistance | 0 (0.0%) | 81 (100.0%) |
| Arts, Entertainment & Recreation | 26 (100.0%) | 0 (0.0%) |
| Accommodation & Food Services | 45 (20.5%) | 174 (79.4%) |
| Public Administration | 22 (31.0%) | 49 (69.0%) |
| Total | 521 (41.7%) | 727 (58.3%) |
Education in Brazoria
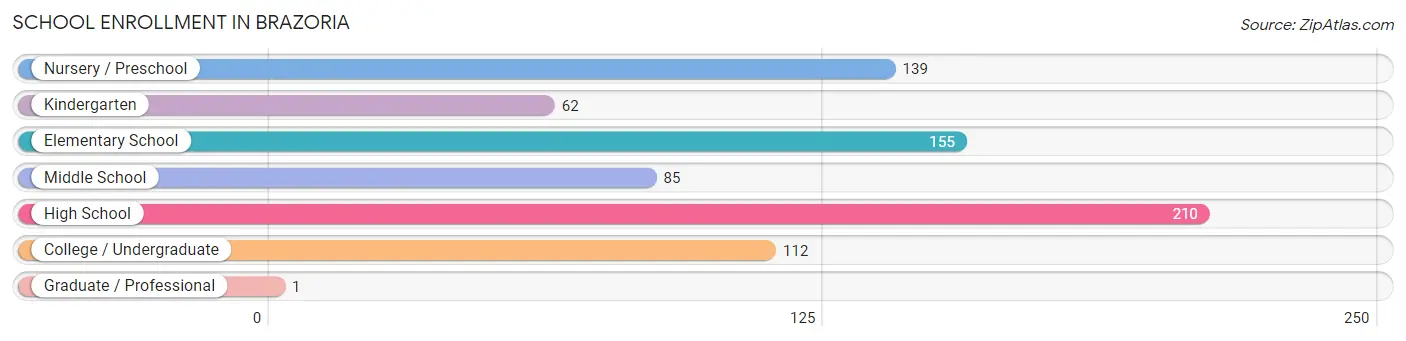
School Enrollment in Brazoria
The most common levels of schooling among the 764 students in Brazoria are high school (210 | 27.5%), elementary school (155 | 20.3%), and nursery / preschool (139 | 18.2%).
| School Level | # Students | % Students |
| Nursery / Preschool | 139 | 18.2% |
| Kindergarten | 62 | 8.1% |
| Elementary School | 155 | 20.3% |
| Middle School | 85 | 11.1% |
| High School | 210 | 27.5% |
| College / Undergraduate | 112 | 14.7% |
| Graduate / Professional | 1 | 0.1% |
| Total | 764 | 100.0% |
School Enrollment by Age by Funding Source in Brazoria
Out of a total of 764 students who are enrolled in schools in Brazoria, 174 (22.8%) attend a private institution, while the remaining 590 (77.2%) are enrolled in public schools. The age group of 18 to 19 year olds has the highest likelihood of being enrolled in private schools, with 1 (100.0% in the age bracket) enrolled. Conversely, the age group of 25 to 34 year olds has the lowest likelihood of being enrolled in a private school, with 44 (100.0% in the age bracket) attending a public institution.
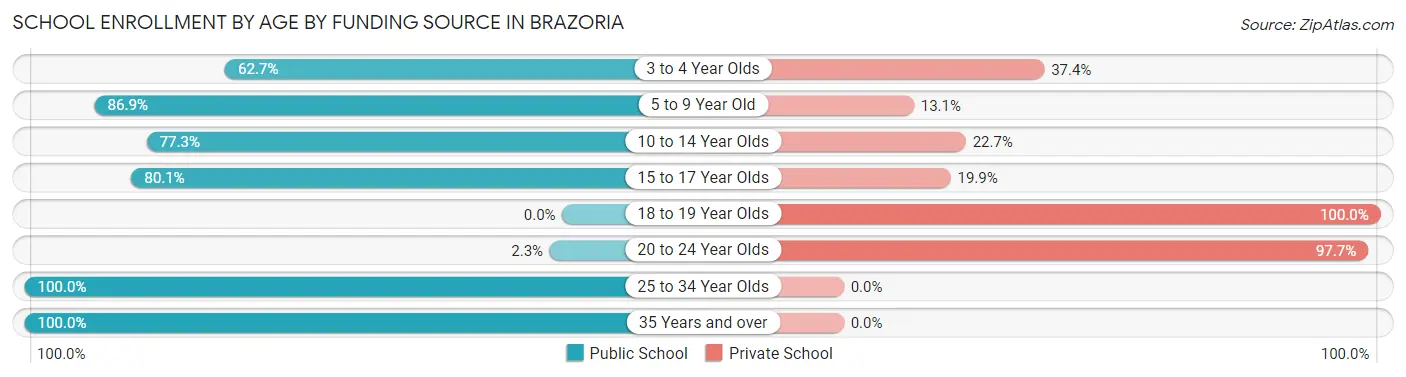
| Age Bracket | Public School | Private School |
| 3 to 4 Year Olds | 52 (62.6%) | 31 (37.3%) |
| 5 to 9 Year Old | 213 (86.9%) | 32 (13.1%) |
| 10 to 14 Year Olds | 102 (77.3%) | 30 (22.7%) |
| 15 to 17 Year Olds | 153 (80.1%) | 38 (19.9%) |
| 18 to 19 Year Olds | 0 (0.0%) | 1 (100.0%) |
| 20 to 24 Year Olds | 1 (2.3%) | 42 (97.7%) |
| 25 to 34 Year Olds | 44 (100.0%) | 0 (0.0%) |
| 35 Years and over | 25 (100.0%) | 0 (0.0%) |
| Total | 590 (77.2%) | 174 (22.8%) |
Educational Attainment by Field of Study in Brazoria
Arts & humanities (46 | 20.6%), psychology (39 | 17.5%), education (35 | 15.7%), engineering (21 | 9.4%), and business (21 | 9.4%) are the most common fields of study among 223 individuals in Brazoria who have obtained a bachelor's degree or higher.
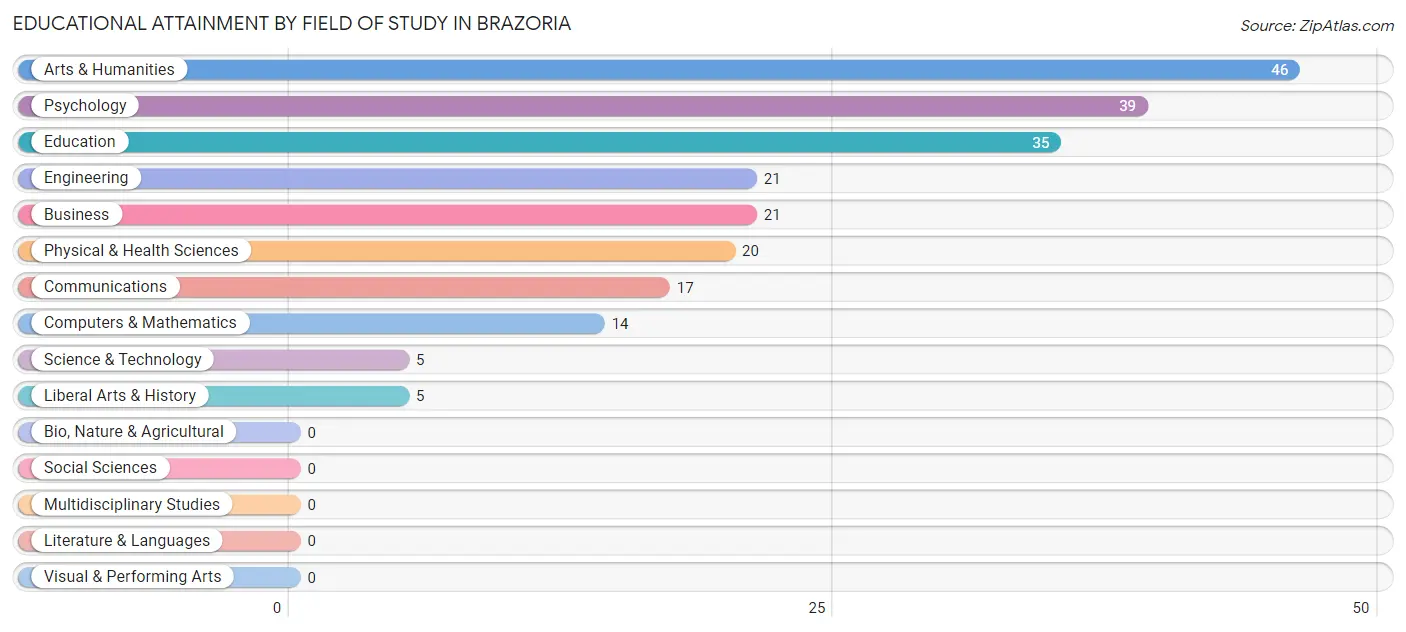
| Field of Study | # Graduates | % Graduates |
| Computers & Mathematics | 14 | 6.3% |
| Bio, Nature & Agricultural | 0 | 0.0% |
| Physical & Health Sciences | 20 | 9.0% |
| Psychology | 39 | 17.5% |
| Social Sciences | 0 | 0.0% |
| Engineering | 21 | 9.4% |
| Multidisciplinary Studies | 0 | 0.0% |
| Science & Technology | 5 | 2.2% |
| Business | 21 | 9.4% |
| Education | 35 | 15.7% |
| Literature & Languages | 0 | 0.0% |
| Liberal Arts & History | 5 | 2.2% |
| Visual & Performing Arts | 0 | 0.0% |
| Communications | 17 | 7.6% |
| Arts & Humanities | 46 | 20.6% |
| Total | 223 | 100.0% |
Transportation & Commute in Brazoria
Vehicle Availability by Sex in Brazoria
The most prevalent vehicle ownership categories in Brazoria are males with 2 vehicles (271, accounting for 52.2%) and females with 2 vehicles (276, making up 38.2%).
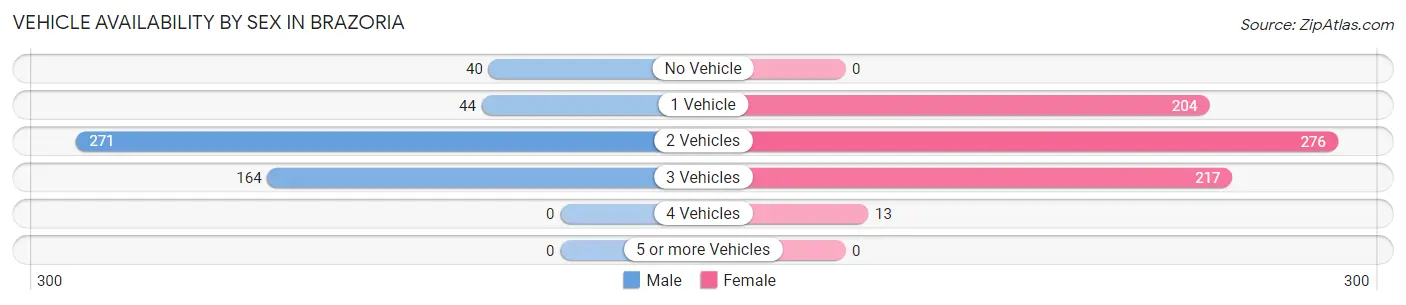
| Vehicles Available | Male | Female |
| No Vehicle | 40 (7.7%) | 0 (0.0%) |
| 1 Vehicle | 44 (8.5%) | 204 (28.7%) |
| 2 Vehicles | 271 (52.2%) | 276 (38.9%) |
| 3 Vehicles | 164 (31.6%) | 217 (30.6%) |
| 4 Vehicles | 0 (0.0%) | 13 (1.8%) |
| 5 or more Vehicles | 0 (0.0%) | 0 (0.0%) |
| Total | 519 (100.0%) | 710 (100.0%) |
Commute Time in Brazoria
The most frequently occuring commute durations in Brazoria are 20 to 24 minutes (249 commuters, 20.9%), 15 to 19 minutes (239 commuters, 20.1%), and 25 to 29 minutes (199 commuters, 16.7%).
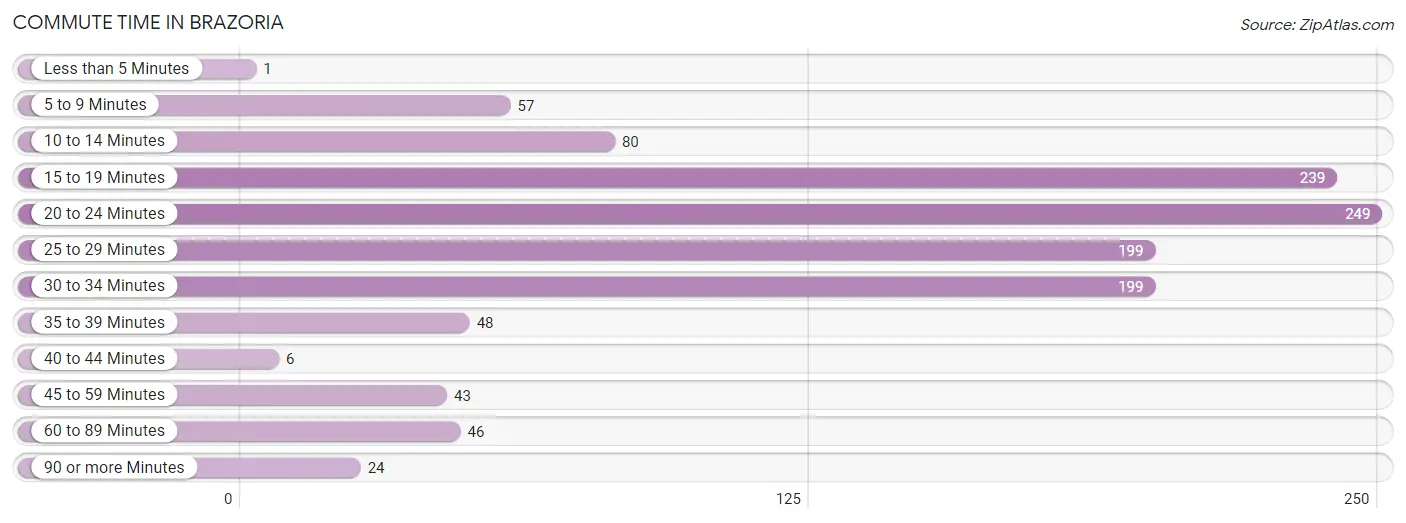
| Commute Time | # Commuters | % Commuters |
| Less than 5 Minutes | 1 | 0.1% |
| 5 to 9 Minutes | 57 | 4.8% |
| 10 to 14 Minutes | 80 | 6.7% |
| 15 to 19 Minutes | 239 | 20.1% |
| 20 to 24 Minutes | 249 | 20.9% |
| 25 to 29 Minutes | 199 | 16.7% |
| 30 to 34 Minutes | 199 | 16.7% |
| 35 to 39 Minutes | 48 | 4.0% |
| 40 to 44 Minutes | 6 | 0.5% |
| 45 to 59 Minutes | 43 | 3.6% |
| 60 to 89 Minutes | 46 | 3.9% |
| 90 or more Minutes | 24 | 2.0% |
Commute Time by Sex in Brazoria
The most common commute times in Brazoria are 20 to 24 minutes (133 commuters, 25.6%) for males and 15 to 19 minutes (239 commuters, 35.6%) for females.
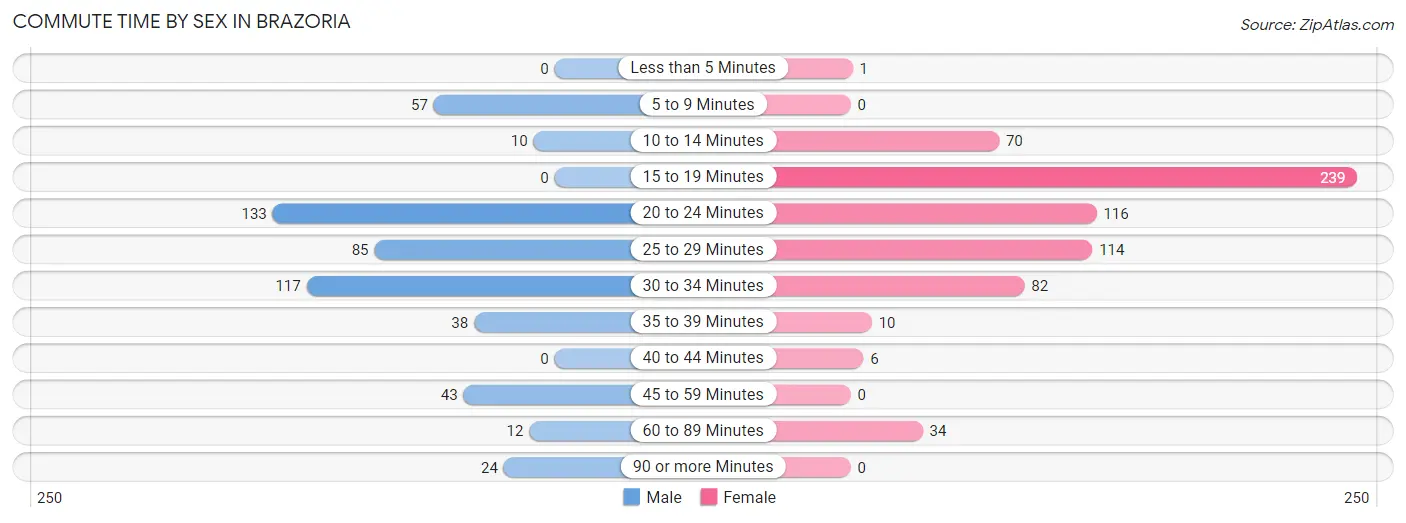
| Commute Time | Male | Female |
| Less than 5 Minutes | 0 (0.0%) | 1 (0.2%) |
| 5 to 9 Minutes | 57 (11.0%) | 0 (0.0%) |
| 10 to 14 Minutes | 10 (1.9%) | 70 (10.4%) |
| 15 to 19 Minutes | 0 (0.0%) | 239 (35.6%) |
| 20 to 24 Minutes | 133 (25.6%) | 116 (17.3%) |
| 25 to 29 Minutes | 85 (16.4%) | 114 (17.0%) |
| 30 to 34 Minutes | 117 (22.5%) | 82 (12.2%) |
| 35 to 39 Minutes | 38 (7.3%) | 10 (1.5%) |
| 40 to 44 Minutes | 0 (0.0%) | 6 (0.9%) |
| 45 to 59 Minutes | 43 (8.3%) | 0 (0.0%) |
| 60 to 89 Minutes | 12 (2.3%) | 34 (5.1%) |
| 90 or more Minutes | 24 (4.6%) | 0 (0.0%) |
Time of Departure to Work by Sex in Brazoria
The most frequent times of departure to work in Brazoria are 12:00 AM to 4:59 AM (122, 23.5%) for males and 5:00 AM to 5:29 AM (121, 18.0%) for females.
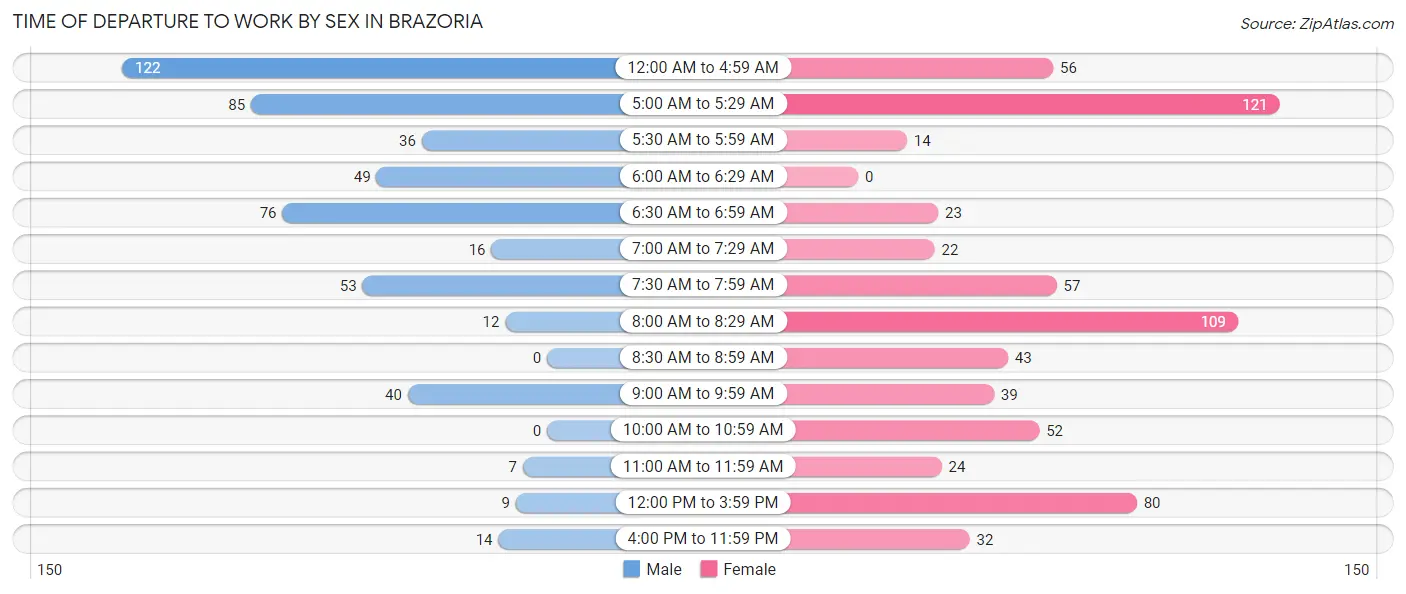
| Time of Departure | Male | Female |
| 12:00 AM to 4:59 AM | 122 (23.5%) | 56 (8.3%) |
| 5:00 AM to 5:29 AM | 85 (16.4%) | 121 (18.0%) |
| 5:30 AM to 5:59 AM | 36 (6.9%) | 14 (2.1%) |
| 6:00 AM to 6:29 AM | 49 (9.4%) | 0 (0.0%) |
| 6:30 AM to 6:59 AM | 76 (14.6%) | 23 (3.4%) |
| 7:00 AM to 7:29 AM | 16 (3.1%) | 22 (3.3%) |
| 7:30 AM to 7:59 AM | 53 (10.2%) | 57 (8.5%) |
| 8:00 AM to 8:29 AM | 12 (2.3%) | 109 (16.2%) |
| 8:30 AM to 8:59 AM | 0 (0.0%) | 43 (6.4%) |
| 9:00 AM to 9:59 AM | 40 (7.7%) | 39 (5.8%) |
| 10:00 AM to 10:59 AM | 0 (0.0%) | 52 (7.7%) |
| 11:00 AM to 11:59 AM | 7 (1.3%) | 24 (3.6%) |
| 12:00 PM to 3:59 PM | 9 (1.7%) | 80 (11.9%) |
| 4:00 PM to 11:59 PM | 14 (2.7%) | 32 (4.8%) |
| Total | 519 (100.0%) | 672 (100.0%) |
Housing Occupancy in Brazoria
Occupancy by Ownership in Brazoria
Of the total 1,194 dwellings in Brazoria, owner-occupied units account for 687 (57.5%), while renter-occupied units make up 507 (42.5%).
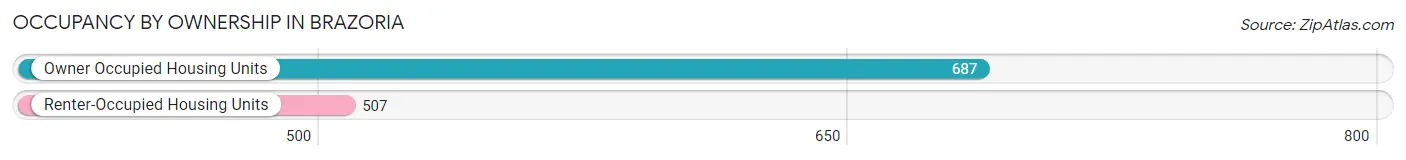
| Occupancy | # Housing Units | % Housing Units |
| Owner Occupied Housing Units | 687 | 57.5% |
| Renter-Occupied Housing Units | 507 | 42.5% |
| Total Occupied Housing Units | 1,194 | 100.0% |
Occupancy by Household Size in Brazoria
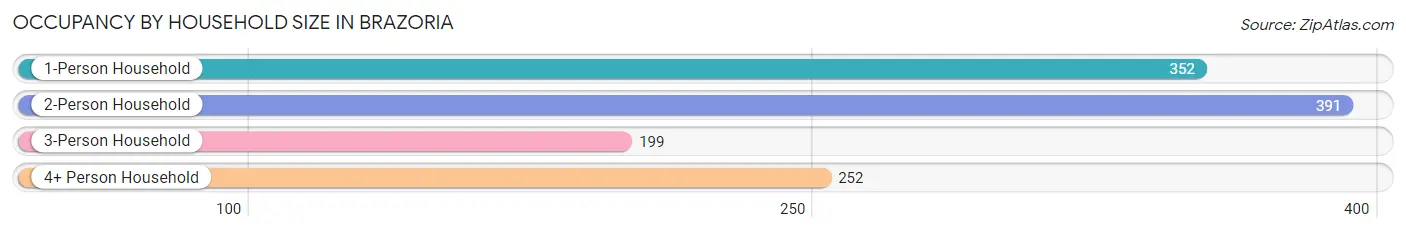
| Household Size | # Housing Units | % Housing Units |
| 1-Person Household | 352 | 29.5% |
| 2-Person Household | 391 | 32.8% |
| 3-Person Household | 199 | 16.7% |
| 4+ Person Household | 252 | 21.1% |
| Total Housing Units | 1,194 | 100.0% |
Occupancy by Ownership by Household Size in Brazoria
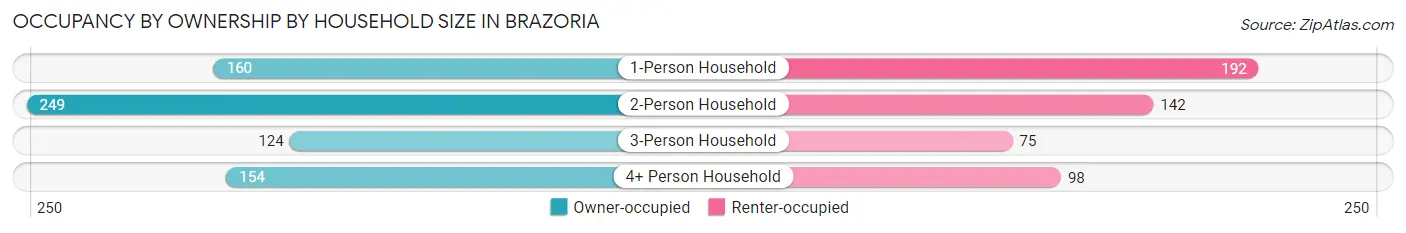
| Household Size | Owner-occupied | Renter-occupied |
| 1-Person Household | 160 (45.5%) | 192 (54.5%) |
| 2-Person Household | 249 (63.7%) | 142 (36.3%) |
| 3-Person Household | 124 (62.3%) | 75 (37.7%) |
| 4+ Person Household | 154 (61.1%) | 98 (38.9%) |
| Total Housing Units | 687 (57.5%) | 507 (42.5%) |
Occupancy by Educational Attainment in Brazoria
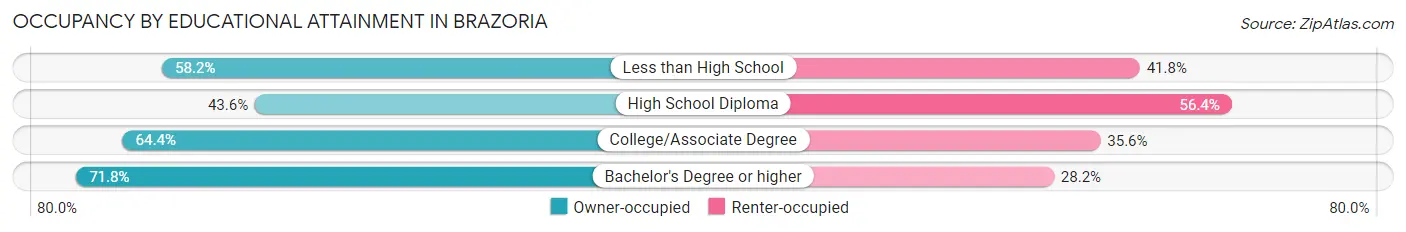
| Household Size | Owner-occupied | Renter-occupied |
| Less than High School | 110 (58.2%) | 79 (41.8%) |
| High School Diploma | 171 (43.6%) | 221 (56.4%) |
| College/Associate Degree | 299 (64.4%) | 165 (35.6%) |
| Bachelor's Degree or higher | 107 (71.8%) | 42 (28.2%) |
Occupancy by Age of Householder in Brazoria
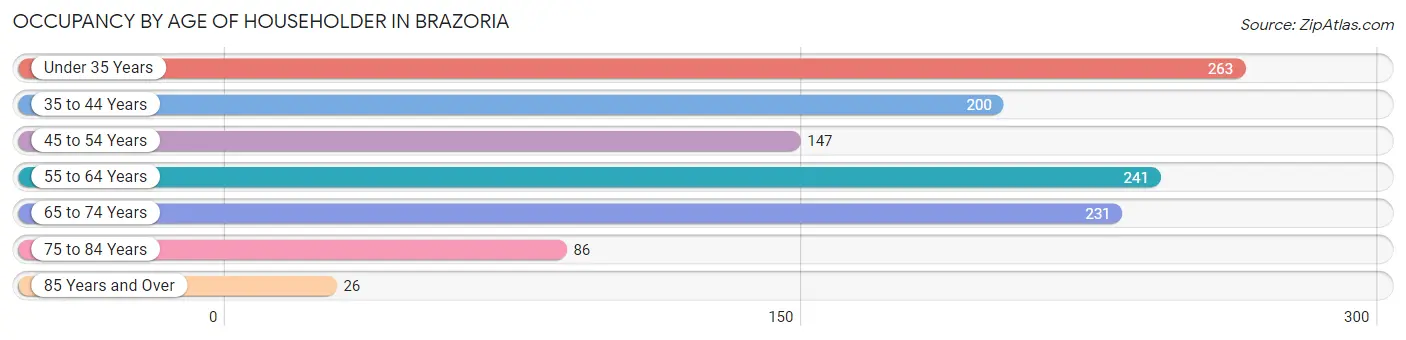
| Age Bracket | # Households | % Households |
| Under 35 Years | 263 | 22.0% |
| 35 to 44 Years | 200 | 16.8% |
| 45 to 54 Years | 147 | 12.3% |
| 55 to 64 Years | 241 | 20.2% |
| 65 to 74 Years | 231 | 19.4% |
| 75 to 84 Years | 86 | 7.2% |
| 85 Years and Over | 26 | 2.2% |
| Total | 1,194 | 100.0% |
Housing Finances in Brazoria
Median Income by Occupancy in Brazoria
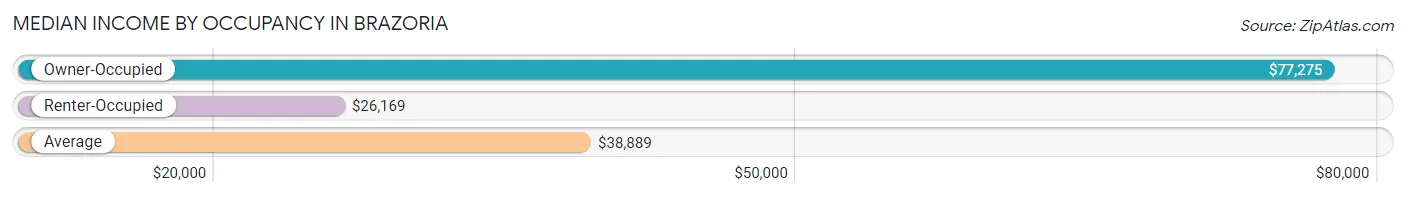
| Occupancy Type | # Households | Median Income |
| Owner-Occupied | 687 (57.5%) | $77,275 |
| Renter-Occupied | 507 (42.5%) | $26,169 |
| Average | 1,194 (100.0%) | $38,889 |
Occupancy by Householder Income Bracket in Brazoria
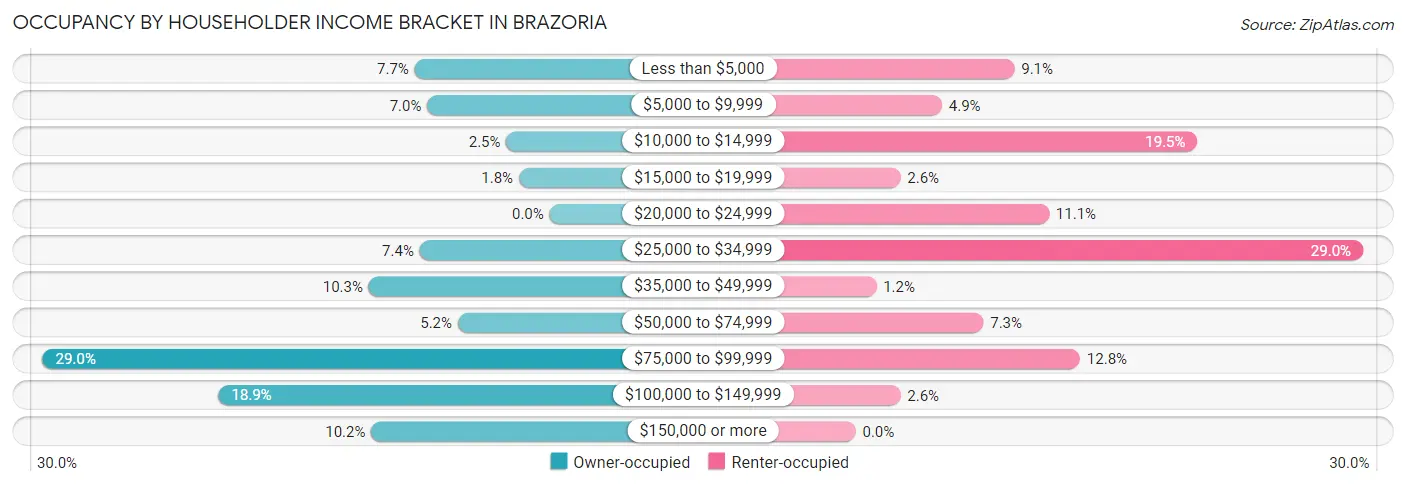
| Income Bracket | Owner-occupied | Renter-occupied |
| Less than $5,000 | 53 (7.7%) | 46 (9.1%) |
| $5,000 to $9,999 | 48 (7.0%) | 25 (4.9%) |
| $10,000 to $14,999 | 17 (2.5%) | 99 (19.5%) |
| $15,000 to $19,999 | 12 (1.8%) | 13 (2.6%) |
| $20,000 to $24,999 | 0 (0.0%) | 56 (11.1%) |
| $25,000 to $34,999 | 51 (7.4%) | 147 (29.0%) |
| $35,000 to $49,999 | 71 (10.3%) | 6 (1.2%) |
| $50,000 to $74,999 | 36 (5.2%) | 37 (7.3%) |
| $75,000 to $99,999 | 199 (29.0%) | 65 (12.8%) |
| $100,000 to $149,999 | 130 (18.9%) | 13 (2.6%) |
| $150,000 or more | 70 (10.2%) | 0 (0.0%) |
| Total | 687 (100.0%) | 507 (100.0%) |
Monthly Housing Cost Tiers in Brazoria
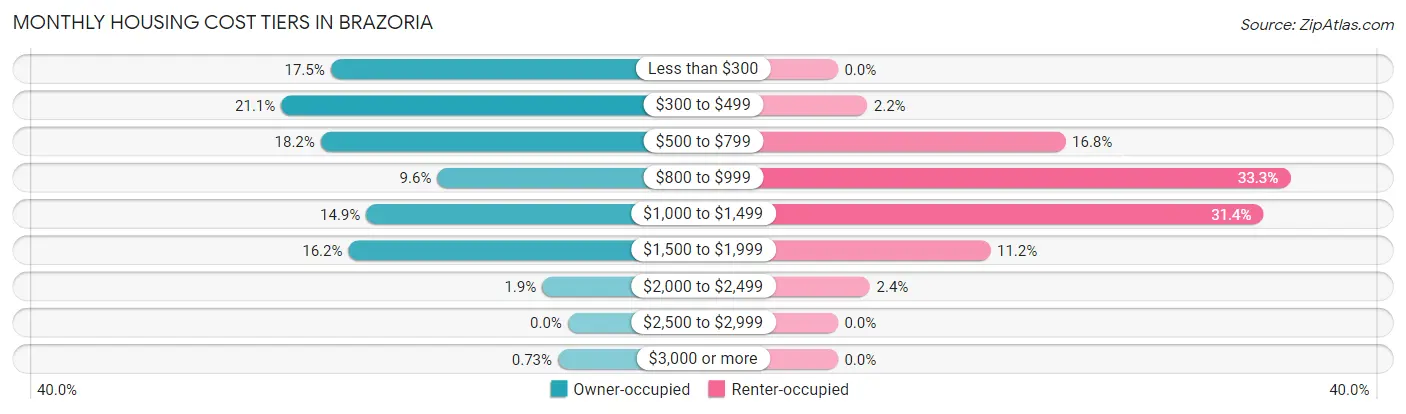
| Monthly Cost | Owner-occupied | Renter-occupied |
| Less than $300 | 120 (17.5%) | 0 (0.0%) |
| $300 to $499 | 145 (21.1%) | 11 (2.2%) |
| $500 to $799 | 125 (18.2%) | 85 (16.8%) |
| $800 to $999 | 66 (9.6%) | 169 (33.3%) |
| $1,000 to $1,499 | 102 (14.8%) | 159 (31.4%) |
| $1,500 to $1,999 | 111 (16.2%) | 57 (11.2%) |
| $2,000 to $2,499 | 13 (1.9%) | 12 (2.4%) |
| $2,500 to $2,999 | 0 (0.0%) | 0 (0.0%) |
| $3,000 or more | 5 (0.7%) | 0 (0.0%) |
| Total | 687 (100.0%) | 507 (100.0%) |
Physical Housing Characteristics in Brazoria
Housing Structures in Brazoria
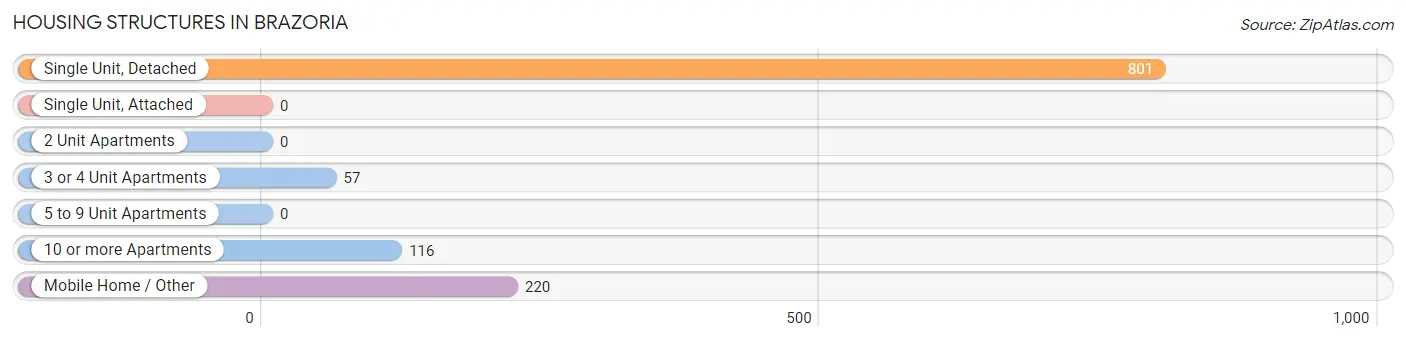
| Structure Type | # Housing Units | % Housing Units |
| Single Unit, Detached | 801 | 67.1% |
| Single Unit, Attached | 0 | 0.0% |
| 2 Unit Apartments | 0 | 0.0% |
| 3 or 4 Unit Apartments | 57 | 4.8% |
| 5 to 9 Unit Apartments | 0 | 0.0% |
| 10 or more Apartments | 116 | 9.7% |
| Mobile Home / Other | 220 | 18.4% |
| Total | 1,194 | 100.0% |
Housing Structures by Occupancy in Brazoria
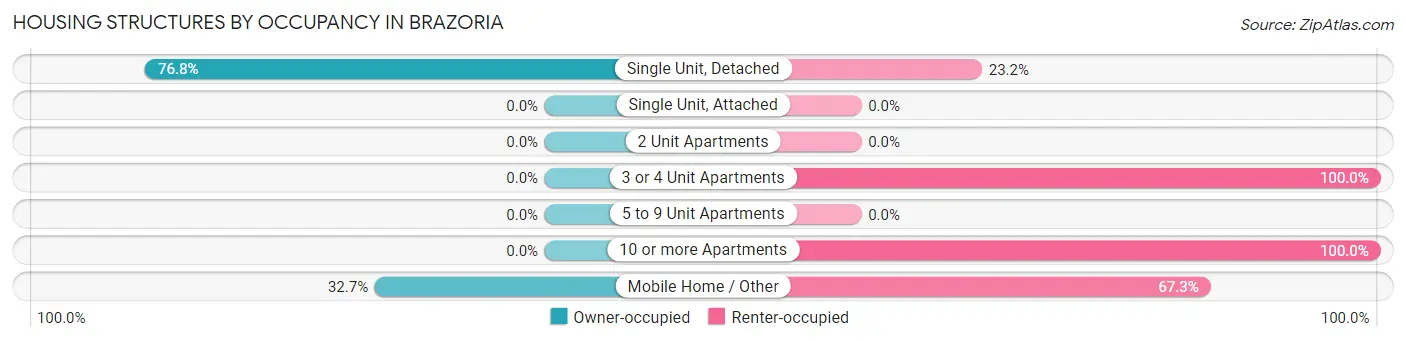
| Structure Type | Owner-occupied | Renter-occupied |
| Single Unit, Detached | 615 (76.8%) | 186 (23.2%) |
| Single Unit, Attached | 0 (0.0%) | 0 (0.0%) |
| 2 Unit Apartments | 0 (0.0%) | 0 (0.0%) |
| 3 or 4 Unit Apartments | 0 (0.0%) | 57 (100.0%) |
| 5 to 9 Unit Apartments | 0 (0.0%) | 0 (0.0%) |
| 10 or more Apartments | 0 (0.0%) | 116 (100.0%) |
| Mobile Home / Other | 72 (32.7%) | 148 (67.3%) |
| Total | 687 (57.5%) | 507 (42.5%) |
Housing Structures by Number of Rooms in Brazoria
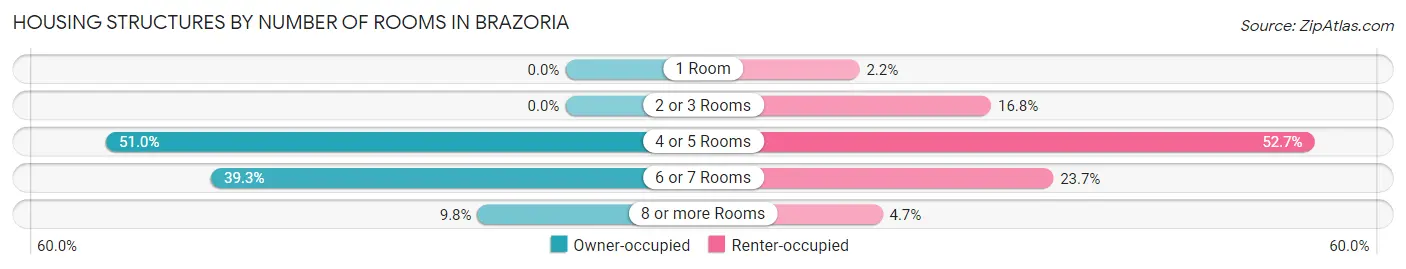
| Number of Rooms | Owner-occupied | Renter-occupied |
| 1 Room | 0 (0.0%) | 11 (2.2%) |
| 2 or 3 Rooms | 0 (0.0%) | 85 (16.8%) |
| 4 or 5 Rooms | 350 (50.9%) | 267 (52.7%) |
| 6 or 7 Rooms | 270 (39.3%) | 120 (23.7%) |
| 8 or more Rooms | 67 (9.8%) | 24 (4.7%) |
| Total | 687 (100.0%) | 507 (100.0%) |
Housing Structure by Heating Type in Brazoria
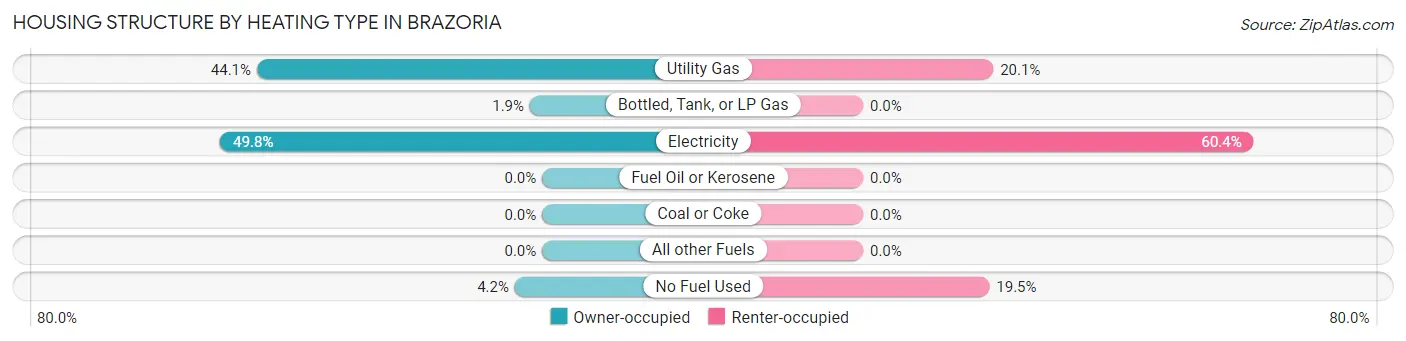
| Heating Type | Owner-occupied | Renter-occupied |
| Utility Gas | 303 (44.1%) | 102 (20.1%) |
| Bottled, Tank, or LP Gas | 13 (1.9%) | 0 (0.0%) |
| Electricity | 342 (49.8%) | 306 (60.4%) |
| Fuel Oil or Kerosene | 0 (0.0%) | 0 (0.0%) |
| Coal or Coke | 0 (0.0%) | 0 (0.0%) |
| All other Fuels | 0 (0.0%) | 0 (0.0%) |
| No Fuel Used | 29 (4.2%) | 99 (19.5%) |
| Total | 687 (100.0%) | 507 (100.0%) |
Household Vehicle Usage in Brazoria
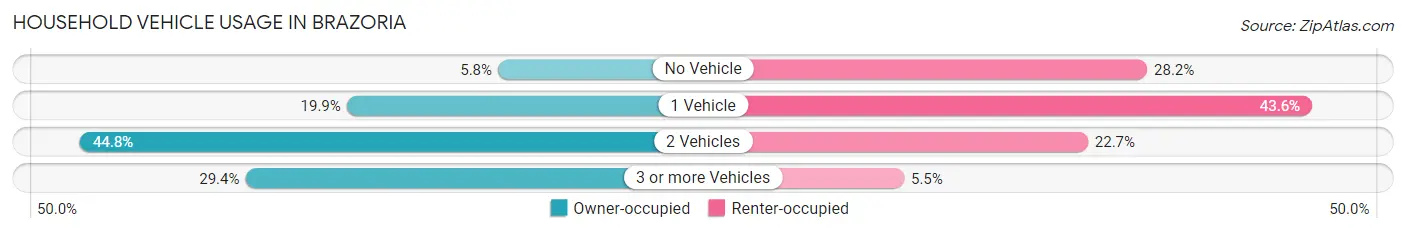
| Vehicles per Household | Owner-occupied | Renter-occupied |
| No Vehicle | 40 (5.8%) | 143 (28.2%) |
| 1 Vehicle | 137 (19.9%) | 221 (43.6%) |
| 2 Vehicles | 308 (44.8%) | 115 (22.7%) |
| 3 or more Vehicles | 202 (29.4%) | 28 (5.5%) |
| Total | 687 (100.0%) | 507 (100.0%) |
Real Estate & Mortgages in Brazoria
Real Estate and Mortgage Overview in Brazoria
| Characteristic | Without Mortgage | With Mortgage |
| Housing Units | 381 | 306 |
| Median Property Value | $153,000 | $157,700 |
| Median Household Income | $38,292 | $46 |
| Monthly Housing Costs | $396 | $5 |
| Real Estate Taxes | $945 | $23 |
Property Value by Mortgage Status in Brazoria
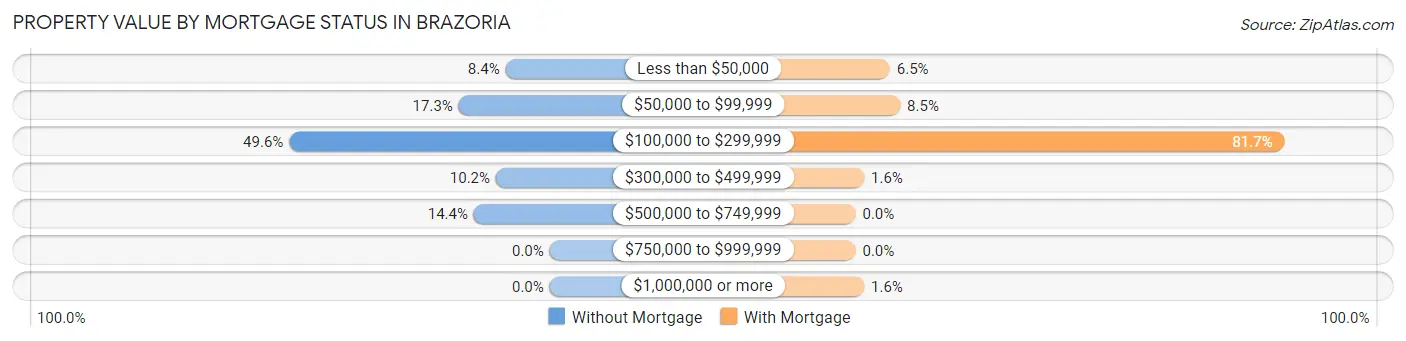
| Property Value | Without Mortgage | With Mortgage |
| Less than $50,000 | 32 (8.4%) | 20 (6.5%) |
| $50,000 to $99,999 | 66 (17.3%) | 26 (8.5%) |
| $100,000 to $299,999 | 189 (49.6%) | 250 (81.7%) |
| $300,000 to $499,999 | 39 (10.2%) | 5 (1.6%) |
| $500,000 to $749,999 | 55 (14.4%) | 0 (0.0%) |
| $750,000 to $999,999 | 0 (0.0%) | 0 (0.0%) |
| $1,000,000 or more | 0 (0.0%) | 5 (1.6%) |
| Total | 381 (100.0%) | 306 (100.0%) |
Household Income by Mortgage Status in Brazoria
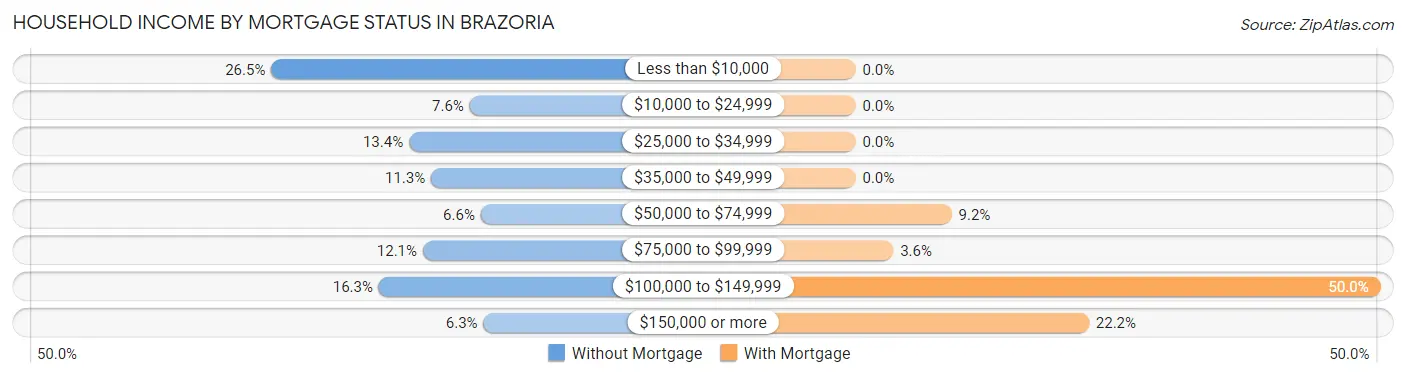
| Household Income | Without Mortgage | With Mortgage |
| Less than $10,000 | 101 (26.5%) | 0 (0.0%) |
| $10,000 to $24,999 | 29 (7.6%) | 0 (0.0%) |
| $25,000 to $34,999 | 51 (13.4%) | 0 (0.0%) |
| $35,000 to $49,999 | 43 (11.3%) | 0 (0.0%) |
| $50,000 to $74,999 | 25 (6.6%) | 28 (9.1%) |
| $75,000 to $99,999 | 46 (12.1%) | 11 (3.6%) |
| $100,000 to $149,999 | 62 (16.3%) | 153 (50.0%) |
| $150,000 or more | 24 (6.3%) | 68 (22.2%) |
| Total | 381 (100.0%) | 306 (100.0%) |
Property Value to Household Income Ratio in Brazoria
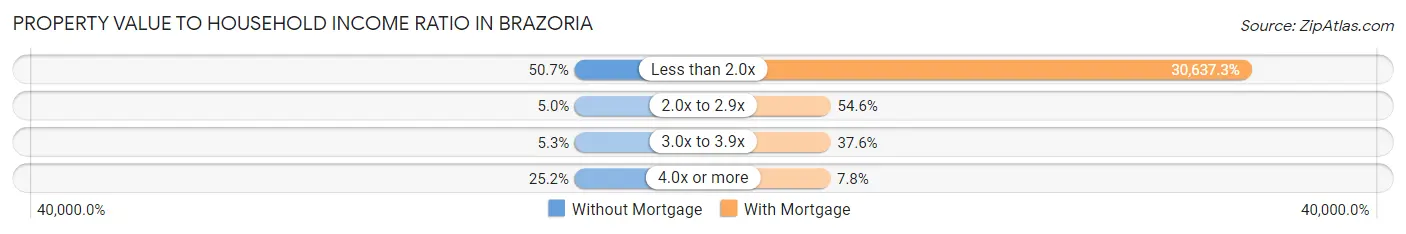
| Value-to-Income Ratio | Without Mortgage | With Mortgage |
| Less than 2.0x | 193 (50.7%) | 93,750 (30,637.3%) |
| 2.0x to 2.9x | 19 (5.0%) | 167 (54.6%) |
| 3.0x to 3.9x | 20 (5.2%) | 115 (37.6%) |
| 4.0x or more | 96 (25.2%) | 24 (7.8%) |
| Total | 381 (100.0%) | 306 (100.0%) |
Real Estate Taxes by Mortgage Status in Brazoria

| Property Taxes | Without Mortgage | With Mortgage |
| Less than $800 | 90 (23.6%) | 0 (0.0%) |
| $800 to $1,499 | 76 (20.0%) | 24 (7.8%) |
| $800 to $1,499 | 111 (29.1%) | 24 (7.8%) |
| Total | 381 (100.0%) | 306 (100.0%) |
Health & Disability in Brazoria
Health Insurance Coverage by Age in Brazoria
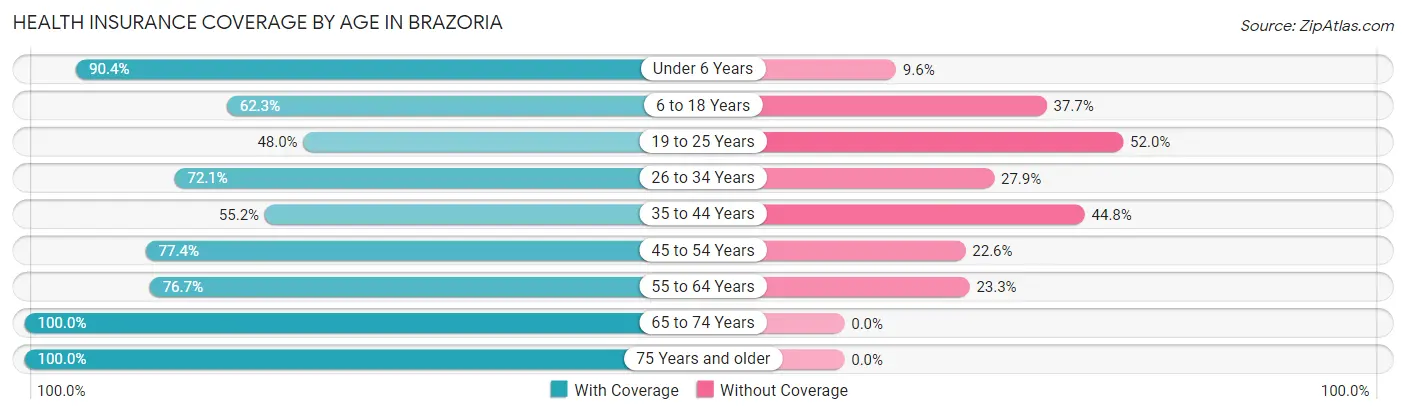
| Age Bracket | With Coverage | Without Coverage |
| Under 6 Years | 263 (90.4%) | 28 (9.6%) |
| 6 to 18 Years | 294 (62.3%) | 178 (37.7%) |
| 19 to 25 Years | 48 (48.0%) | 52 (52.0%) |
| 26 to 34 Years | 351 (72.1%) | 136 (27.9%) |
| 35 to 44 Years | 170 (55.2%) | 138 (44.8%) |
| 45 to 54 Years | 264 (77.4%) | 77 (22.6%) |
| 55 to 64 Years | 289 (76.7%) | 88 (23.3%) |
| 65 to 74 Years | 351 (100.0%) | 0 (0.0%) |
| 75 Years and older | 148 (100.0%) | 0 (0.0%) |
| Total | 2,178 (75.8%) | 697 (24.2%) |
Health Insurance Coverage by Citizenship Status in Brazoria

| Citizenship Status | With Coverage | Without Coverage |
| Native Born | 263 (90.4%) | 28 (9.6%) |
| Foreign Born, Citizen | 294 (62.3%) | 178 (37.7%) |
| Foreign Born, not a Citizen | 48 (48.0%) | 52 (52.0%) |
Health Insurance Coverage by Household Income in Brazoria
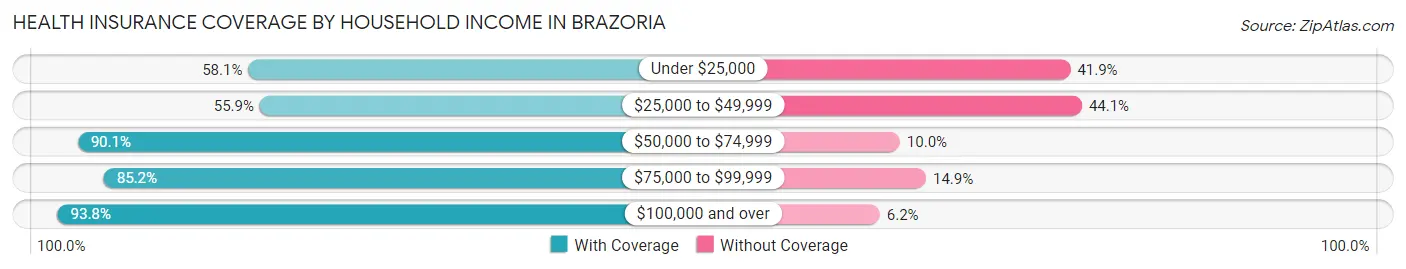
| Household Income | With Coverage | Without Coverage |
| Under $25,000 | 355 (58.1%) | 256 (41.9%) |
| $25,000 to $49,999 | 320 (55.9%) | 252 (44.1%) |
| $50,000 to $74,999 | 172 (90.0%) | 19 (10.0%) |
| $75,000 to $99,999 | 751 (85.2%) | 131 (14.8%) |
| $100,000 and over | 576 (93.8%) | 38 (6.2%) |
Public vs Private Health Insurance Coverage by Age in Brazoria
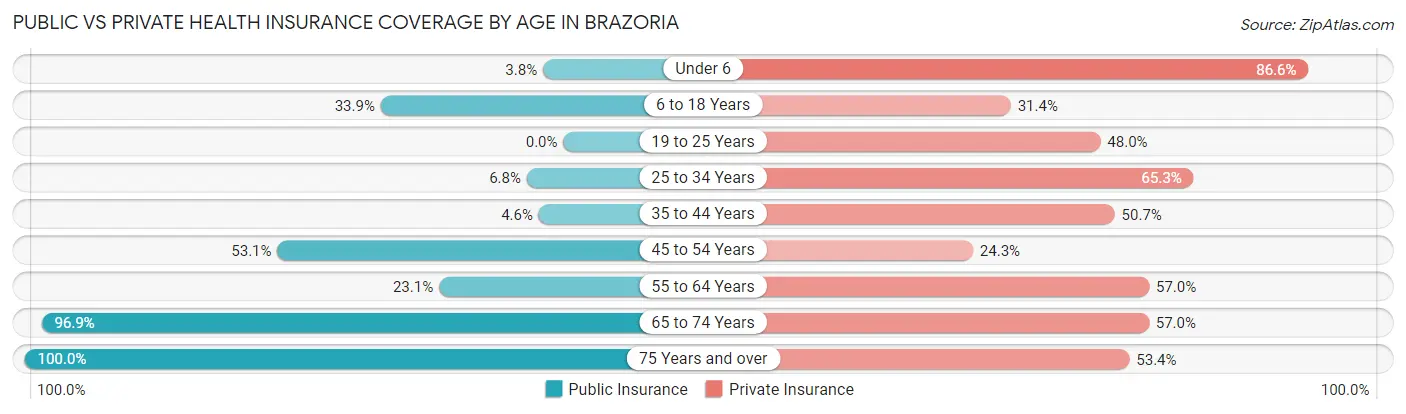
| Age Bracket | Public Insurance | Private Insurance |
| Under 6 | 11 (3.8%) | 252 (86.6%) |
| 6 to 18 Years | 160 (33.9%) | 148 (31.4%) |
| 19 to 25 Years | 0 (0.0%) | 48 (48.0%) |
| 25 to 34 Years | 33 (6.8%) | 318 (65.3%) |
| 35 to 44 Years | 14 (4.5%) | 156 (50.6%) |
| 45 to 54 Years | 181 (53.1%) | 83 (24.3%) |
| 55 to 64 Years | 87 (23.1%) | 215 (57.0%) |
| 65 to 74 Years | 340 (96.9%) | 200 (57.0%) |
| 75 Years and over | 148 (100.0%) | 79 (53.4%) |
| Total | 974 (33.9%) | 1,499 (52.1%) |
Disability Status by Sex by Age in Brazoria
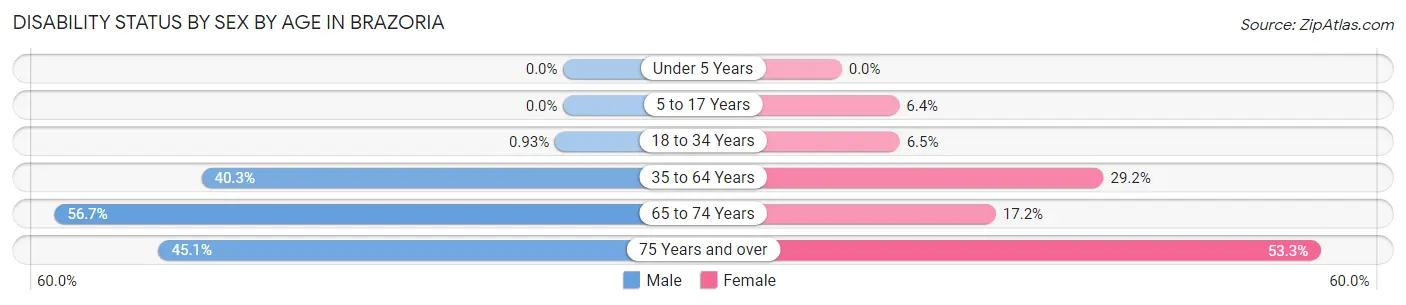
| Age Bracket | Male | Female |
| Under 5 Years | 0 (0.0%) | 0 (0.0%) |
| 5 to 17 Years | 0 (0.0%) | 18 (6.4%) |
| 18 to 34 Years | 2 (0.9%) | 24 (6.5%) |
| 35 to 64 Years | 137 (40.3%) | 200 (29.1%) |
| 65 to 74 Years | 123 (56.7%) | 23 (17.2%) |
| 75 Years and over | 32 (45.1%) | 41 (53.2%) |
Disability Class by Sex by Age in Brazoria
Disability Class: Hearing Difficulty
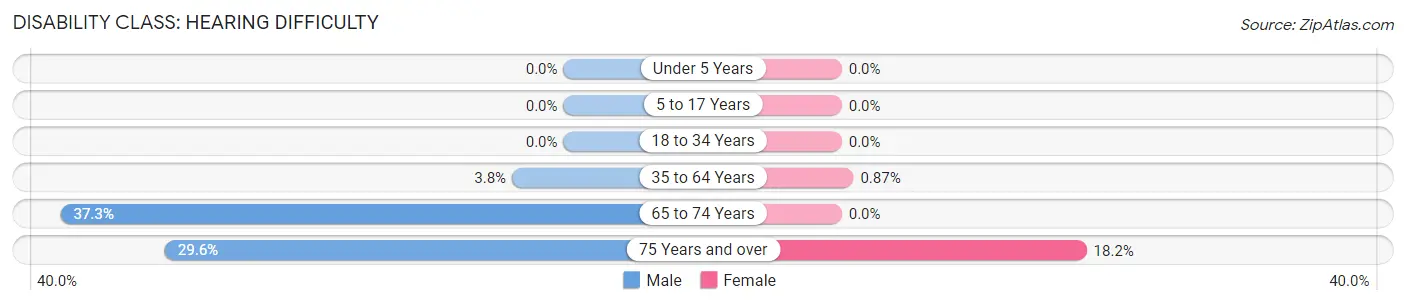
| Age Bracket | Male | Female |
| Under 5 Years | 0 (0.0%) | 0 (0.0%) |
| 5 to 17 Years | 0 (0.0%) | 0 (0.0%) |
| 18 to 34 Years | 0 (0.0%) | 0 (0.0%) |
| 35 to 64 Years | 13 (3.8%) | 6 (0.9%) |
| 65 to 74 Years | 81 (37.3%) | 0 (0.0%) |
| 75 Years and over | 21 (29.6%) | 14 (18.2%) |
Disability Class: Vision Difficulty
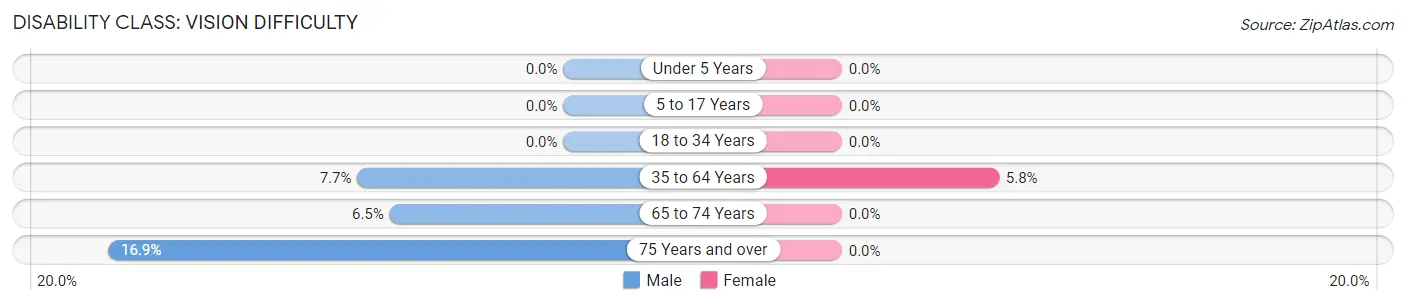
| Age Bracket | Male | Female |
| Under 5 Years | 0 (0.0%) | 0 (0.0%) |
| 5 to 17 Years | 0 (0.0%) | 0 (0.0%) |
| 18 to 34 Years | 0 (0.0%) | 0 (0.0%) |
| 35 to 64 Years | 26 (7.6%) | 40 (5.8%) |
| 65 to 74 Years | 14 (6.5%) | 0 (0.0%) |
| 75 Years and over | 12 (16.9%) | 0 (0.0%) |
Disability Class: Cognitive Difficulty
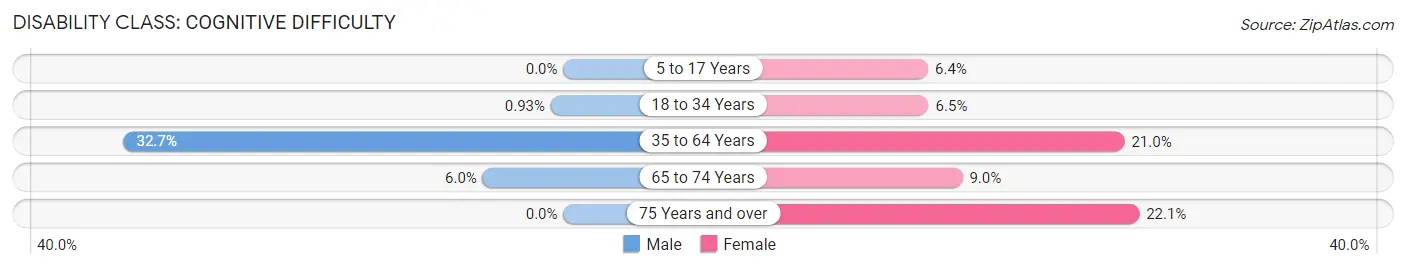
| Age Bracket | Male | Female |
| 5 to 17 Years | 0 (0.0%) | 18 (6.4%) |
| 18 to 34 Years | 2 (0.9%) | 24 (6.5%) |
| 35 to 64 Years | 111 (32.7%) | 144 (21.0%) |
| 65 to 74 Years | 13 (6.0%) | 12 (9.0%) |
| 75 Years and over | 0 (0.0%) | 17 (22.1%) |
Disability Class: Ambulatory Difficulty
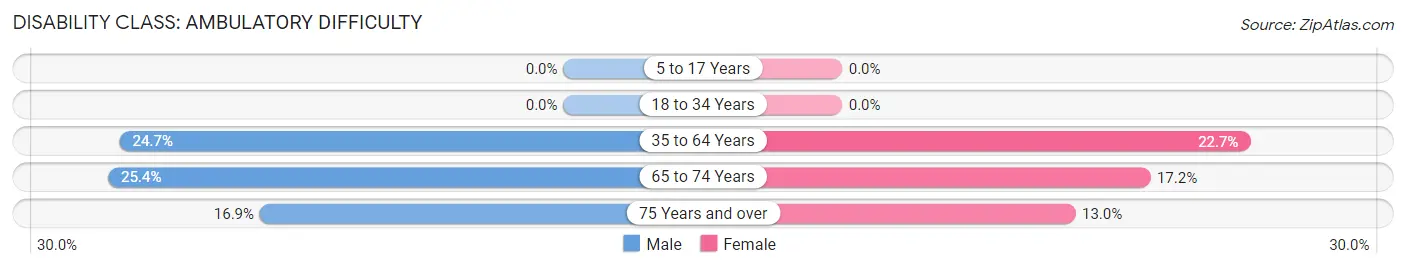
| Age Bracket | Male | Female |
| 5 to 17 Years | 0 (0.0%) | 0 (0.0%) |
| 18 to 34 Years | 0 (0.0%) | 0 (0.0%) |
| 35 to 64 Years | 84 (24.7%) | 156 (22.7%) |
| 65 to 74 Years | 55 (25.4%) | 23 (17.2%) |
| 75 Years and over | 12 (16.9%) | 10 (13.0%) |
Disability Class: Self-Care Difficulty

| Age Bracket | Male | Female |
| 5 to 17 Years | 0 (0.0%) | 0 (0.0%) |
| 18 to 34 Years | 0 (0.0%) | 0 (0.0%) |
| 35 to 64 Years | 71 (20.9%) | 24 (3.5%) |
| 65 to 74 Years | 0 (0.0%) | 0 (0.0%) |
| 75 Years and over | 12 (16.9%) | 0 (0.0%) |
Technology Access in Brazoria
Computing Device Access in Brazoria

| Device Type | # Households | % Households |
| Desktop or Laptop | 737 | 61.7% |
| Smartphone | 852 | 71.4% |
| Tablet | 533 | 44.6% |
| No Computing Device | 305 | 25.5% |
| Total | 1,194 | 100.0% |
Internet Access in Brazoria
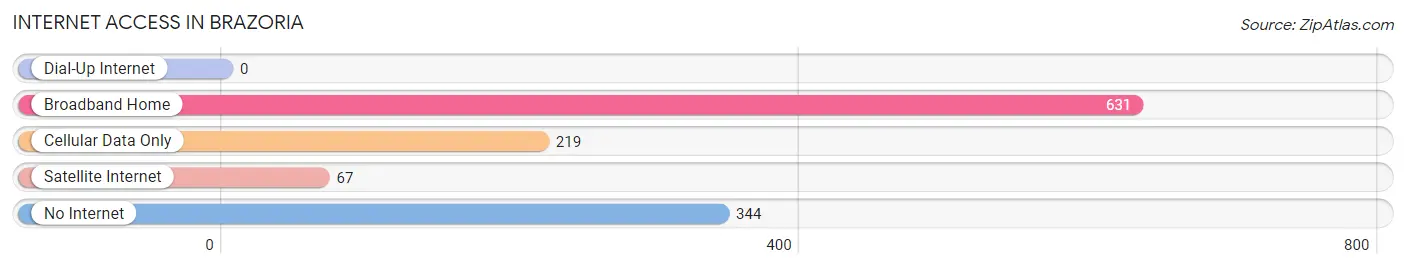
| Internet Type | # Households | % Households |
| Dial-Up Internet | 0 | 0.0% |
| Broadband Home | 631 | 52.8% |
| Cellular Data Only | 219 | 18.3% |
| Satellite Internet | 67 | 5.6% |
| No Internet | 344 | 28.8% |
| Total | 1,194 | 100.0% |
Brazoria Summary
Brazoria is a city located in Brazoria County, Texas, United States. It is situated along the Gulf Coast, about 50 miles south of Houston. The city has a population of approximately 6,000 people and is the county seat of Brazoria County.
History
The area that is now Brazoria was first settled by Europeans in the early 1800s. The first settlers were primarily of English and Irish descent. The area was originally part of the Stephen F. Austin Colony, and was later annexed by the Republic of Texas in 1836.
In 1853, the town of Brazoria was established and named after the Brazos River, which runs through the area. The town was incorporated in 1854 and was the county seat of Brazoria County.
In the late 1800s, Brazoria was a thriving port town, with a population of over 1,000 people. The town was home to several businesses, including a cotton gin, a sawmill, and a brickyard.
In the early 1900s, Brazoria began to experience a decline in population due to the Great Depression and the Dust Bowl. The population dropped to just over 500 people by the 1940s.
In the 1950s, the population began to increase again, and the city experienced a period of growth and development. The city was home to several businesses, including a lumber yard, a feed store, and a grocery store.
Geography
Brazoria is located in southeastern Texas, about 50 miles south of Houston. The city is situated along the Gulf Coast, and is bordered by the Brazos River to the north and the San Bernard River to the south.
The city has a total area of 4.2 square miles, all of which is land. The terrain is mostly flat, with some rolling hills. The climate is humid subtropical, with hot summers and mild winters.
Economy
The economy of Brazoria is largely based on agriculture and oil and gas production. The city is home to several large oil and gas companies, including Chevron, Shell, and ExxonMobil.
Agriculture is also an important part of the local economy. The area is home to several large farms, which produce cotton, corn, soybeans, and other crops.
The city is also home to several manufacturing companies, including a paper mill and a plastics factory.
Demographics
As of the 2010 census, the population of Brazoria was 6,000 people. The racial makeup of the city was 75.3% White, 17.2% Hispanic or Latino, 5.2% African American, and 1.3% Asian.
The median household income in Brazoria was $41,944, and the median family income was $50,944. The per capita income was $20,944.
Conclusion
Brazoria is a city located in Brazoria County, Texas, United States. It is situated along the Gulf Coast, about 50 miles south of Houston. The city has a population of approximately 6,000 people and is the county seat of Brazoria County. The economy of Brazoria is largely based on agriculture and oil and gas production. The city is home to several large oil and gas companies, as well as several large farms. The racial makeup of the city is 75.3% White, 17.2% Hispanic or Latino, 5.2% African American, and 1.3% Asian. The median household income in Brazoria was $41,944, and the median family income was $50,944.
Common Questions
What is Per Capita Income in Brazoria?
Per Capita income in Brazoria is $29,145.
What is the Median Family Income in Brazoria?
Median Family Income in Brazoria is $75,902.
What is the Median Household income in Brazoria?
Median Household Income in Brazoria is $38,889.
What is Income or Wage Gap in Brazoria?
Income or Wage Gap in Brazoria is 56.5%.
Women in Brazoria earn 43.5 cents for every dollar earned by a man.
What is Inequality or Gini Index in Brazoria?
Inequality or Gini Index in Brazoria is 0.54.
What is the Total Population of Brazoria?
Total Population of Brazoria is 2,875.
What is the Total Male Population of Brazoria?
Total Male Population of Brazoria is 1,156.
What is the Total Female Population of Brazoria?
Total Female Population of Brazoria is 1,719.
What is the Ratio of Males per 100 Females in Brazoria?
There are 67.25 Males per 100 Females in Brazoria.
What is the Ratio of Females per 100 Males in Brazoria?
There are 148.70 Females per 100 Males in Brazoria.
What is the Median Population Age in Brazoria?
Median Population Age in Brazoria is 36.1 Years.
What is the Average Family Size in Brazoria
Average Family Size in Brazoria is 2.9 People.
What is the Average Household Size in Brazoria
Average Household Size in Brazoria is 2.4 People.
How Large is the Labor Force in Brazoria?
There are 1,284 People in the Labor Forcein in Brazoria.
What is the Percentage of People in the Labor Force in Brazoria?
55.9% of People are in the Labor Force in Brazoria.
What is the Unemployment Rate in Brazoria?
Unemployment Rate in Brazoria is 2.8%.