Brady, TX Map & Demographics
Brady Map
Brady Overview
$25,839
PER CAPITA INCOME
$63,875
AVG FAMILY INCOME
$50,197
AVG HOUSEHOLD INCOME
26.0%
WAGE / INCOME GAP [ % ]
74.0¢/ $1
WAGE / INCOME GAP [ $ ]
0.42
INEQUALITY / GINI INDEX
5,129
TOTAL POPULATION
2,657
MALE POPULATION
2,472
FEMALE POPULATION
107.48
MALES / 100 FEMALES
93.04
FEMALES / 100 MALES
38.5
MEDIAN AGE
3.0
AVG FAMILY SIZE
2.4
AVG HOUSEHOLD SIZE
2,421
LABOR FORCE [ PEOPLE ]
59.3%
PERCENT IN LABOR FORCE
10.5%
UNEMPLOYMENT RATE
Brady Zip Codes
Brady Area Codes
Income in Brady
Income Overview in Brady
Per Capita Income in Brady is $25,839, while median incomes of families and households are $63,875 and $50,197 respectively.
| Characteristic | Number | Measure |
| Per Capita Income | 5,129 | $25,839 |
| Median Family Income | 1,251 | $63,875 |
| Mean Family Income | 1,251 | $74,213 |
| Median Household Income | 2,107 | $50,197 |
| Mean Household Income | 2,107 | $61,661 |
| Income Deficit | 1,251 | $0 |
| Wage / Income Gap (%) | 5,129 | 26.01% |
| Wage / Income Gap ($) | 5,129 | 73.99¢ per $1 |
| Gini / Inequality Index | 5,129 | 0.42 |
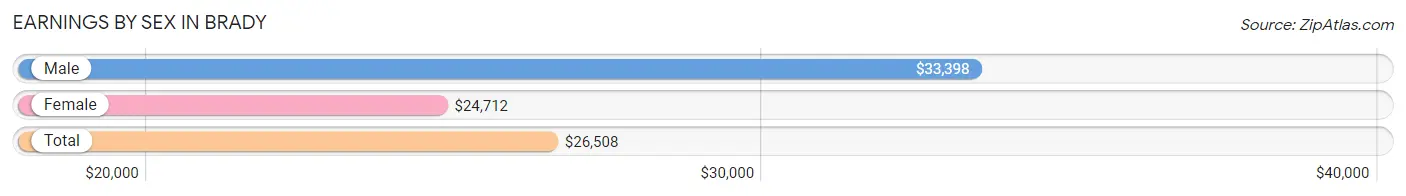
Earnings by Sex in Brady
Average Earnings in Brady are $26,508, $33,398 for men and $24,712 for women, a difference of 26.0%.
| Sex | Number | Average Earnings |
| Male | 1,247 (48.2%) | $33,398 |
| Female | 1,339 (51.8%) | $24,712 |
| Total | 2,586 (100.0%) | $26,508 |
Earnings by Sex by Income Bracket in Brady
The most common earnings brackets in Brady are $65,000 to $74,999 for men (199 | 16.0%) and $25,000 to $29,999 for women (172 | 12.9%).
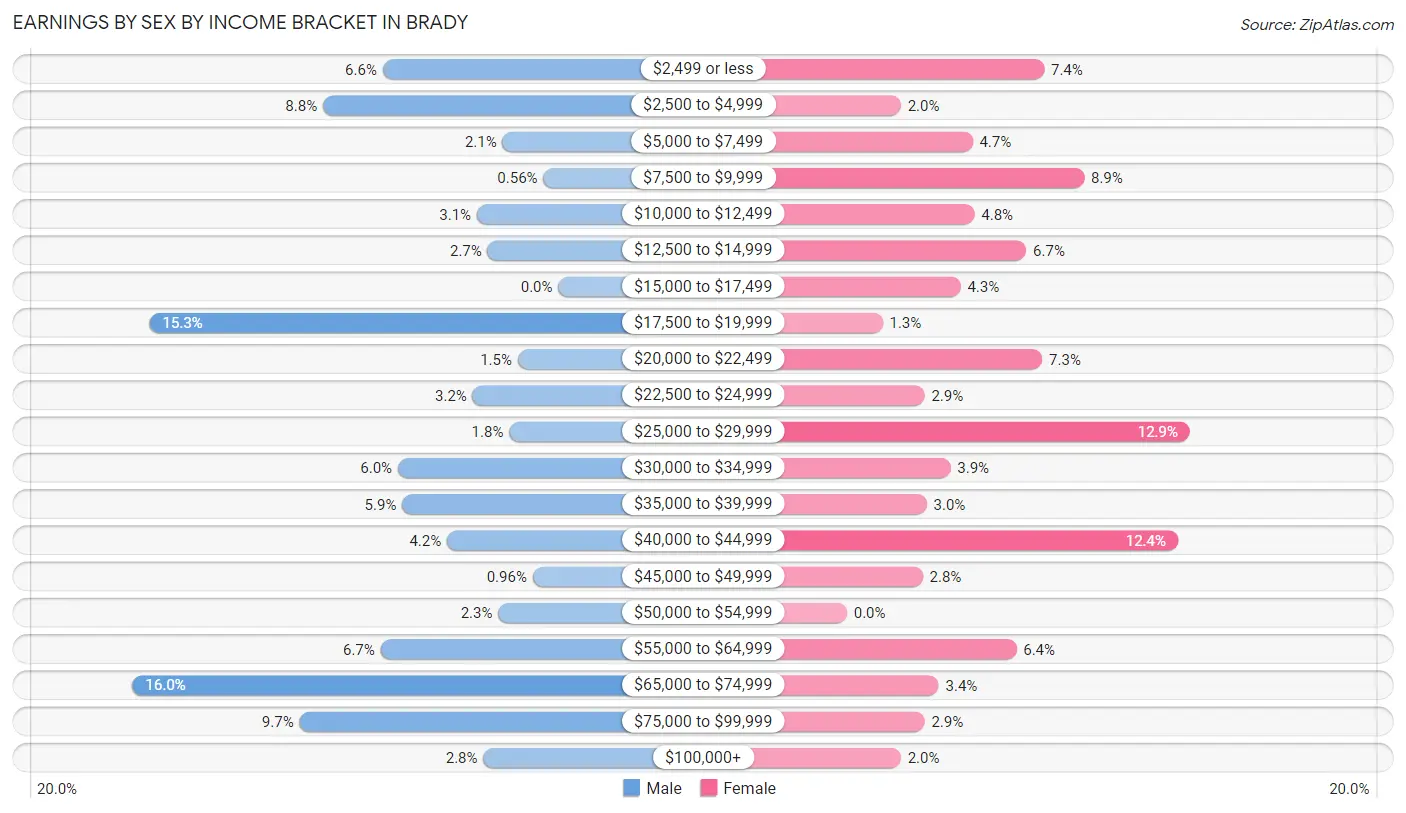
| Income | Male | Female |
| $2,499 or less | 82 (6.6%) | 99 (7.4%) |
| $2,500 to $4,999 | 110 (8.8%) | 27 (2.0%) |
| $5,000 to $7,499 | 26 (2.1%) | 63 (4.7%) |
| $7,500 to $9,999 | 7 (0.6%) | 119 (8.9%) |
| $10,000 to $12,499 | 38 (3.0%) | 64 (4.8%) |
| $12,500 to $14,999 | 33 (2.6%) | 90 (6.7%) |
| $15,000 to $17,499 | 0 (0.0%) | 57 (4.3%) |
| $17,500 to $19,999 | 191 (15.3%) | 18 (1.3%) |
| $20,000 to $22,499 | 19 (1.5%) | 98 (7.3%) |
| $22,500 to $24,999 | 40 (3.2%) | 39 (2.9%) |
| $25,000 to $29,999 | 23 (1.8%) | 172 (12.9%) |
| $30,000 to $34,999 | 75 (6.0%) | 52 (3.9%) |
| $35,000 to $39,999 | 73 (5.9%) | 40 (3.0%) |
| $40,000 to $44,999 | 52 (4.2%) | 166 (12.4%) |
| $45,000 to $49,999 | 12 (1.0%) | 38 (2.8%) |
| $50,000 to $54,999 | 28 (2.2%) | 0 (0.0%) |
| $55,000 to $64,999 | 83 (6.7%) | 85 (6.4%) |
| $65,000 to $74,999 | 199 (16.0%) | 46 (3.4%) |
| $75,000 to $99,999 | 121 (9.7%) | 39 (2.9%) |
| $100,000+ | 35 (2.8%) | 27 (2.0%) |
| Total | 1,247 (100.0%) | 1,339 (100.0%) |
Earnings by Sex by Educational Attainment in Brady
Average earnings in Brady are $42,287 for men and $26,497 for women, a difference of 37.3%. Men with an educational attainment of less than high school enjoy the highest average annual earnings of $67,823, while those with high school diploma education earn the least with $34,559. Women with an educational attainment of college or associate's degree earn the most with the average annual earnings of $40,324, while those with less than high school education have the smallest earnings of $14,780.
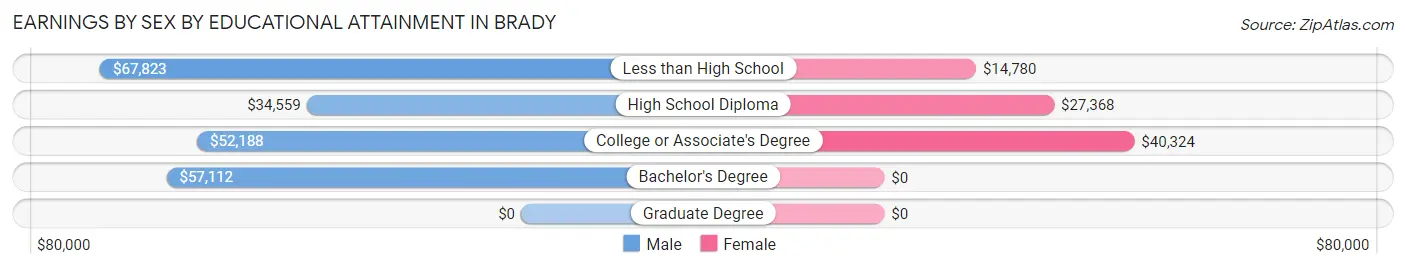
| Educational Attainment | Male Income | Female Income |
| Less than High School | $67,823 | $14,780 |
| High School Diploma | $34,559 | $27,368 |
| College or Associate's Degree | $52,188 | $40,324 |
| Bachelor's Degree | $57,112 | $0 |
| Graduate Degree | - | - |
| Total | $42,287 | $26,497 |
Family Income in Brady
Family Income Brackets in Brady
According to the Brady family income data, there are 270 families falling into the $75,000 to $99,999 income range, which is the most common income bracket and makes up 21.6% of all families.
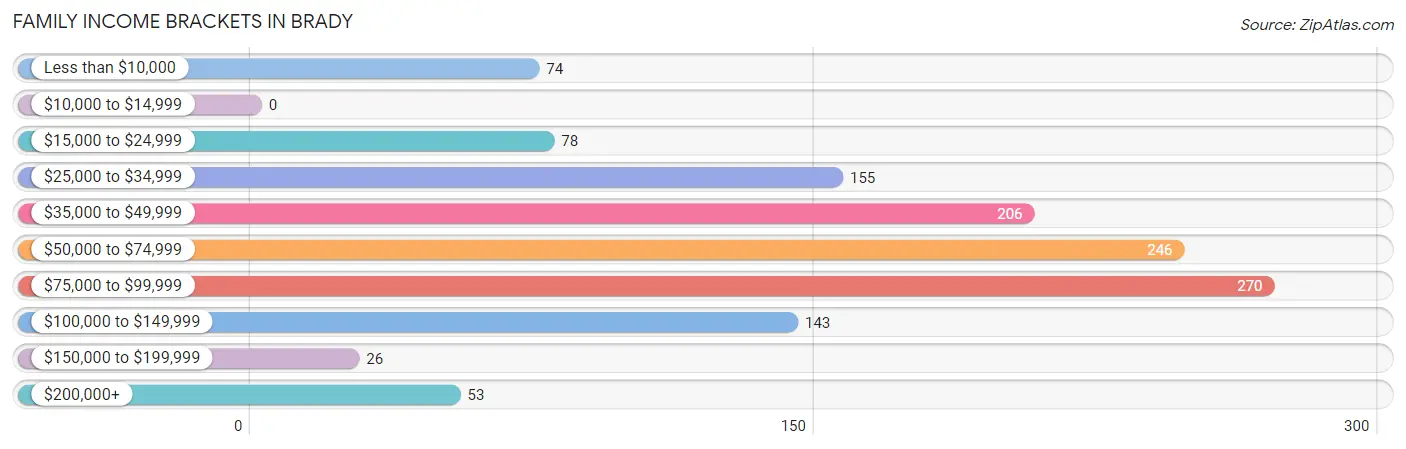
| Income Bracket | # Families | % Families |
| Less than $10,000 | 74 | 5.9% |
| $10,000 to $14,999 | 0 | 0.0% |
| $15,000 to $24,999 | 78 | 6.2% |
| $25,000 to $34,999 | 155 | 12.4% |
| $35,000 to $49,999 | 206 | 16.5% |
| $50,000 to $74,999 | 246 | 19.7% |
| $75,000 to $99,999 | 270 | 21.6% |
| $100,000 to $149,999 | 143 | 11.4% |
| $150,000 to $199,999 | 26 | 2.1% |
| $200,000+ | 53 | 4.2% |
Family Income by Famaliy Size in Brady
4-person families (159 | 12.7%) account for the highest median family income in Brady with $81,362 per family, while 3-person families (254 | 20.3%) have the highest median income of $25,131 per family member.
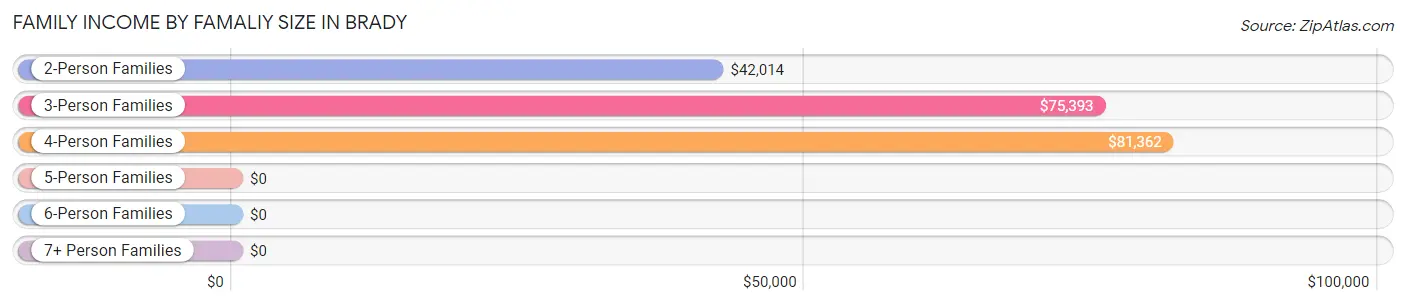
| Income Bracket | # Families | Median Income |
| 2-Person Families | 727 (58.1%) | $42,014 |
| 3-Person Families | 254 (20.3%) | $75,393 |
| 4-Person Families | 159 (12.7%) | $81,362 |
| 5-Person Families | 59 (4.7%) | $0 |
| 6-Person Families | 52 (4.2%) | $0 |
| 7+ Person Families | 0 (0.0%) | $0 |
| Total | 1,251 (100.0%) | $63,875 |
Family Income by Number of Earners in Brady
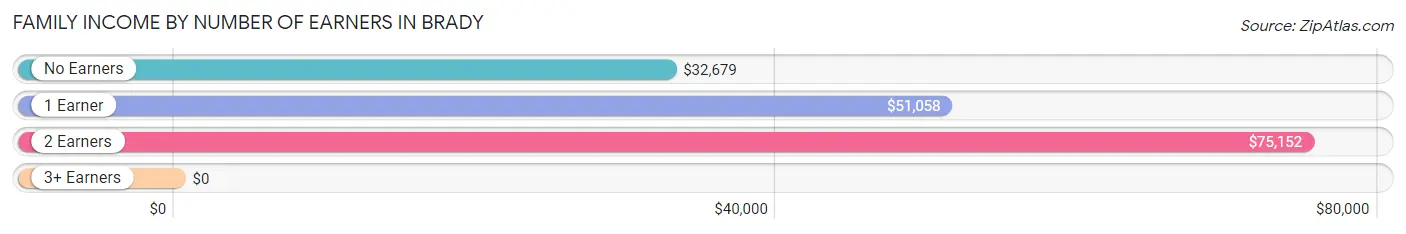
| Number of Earners | # Families | Median Income |
| No Earners | 154 (12.3%) | $32,679 |
| 1 Earner | 478 (38.2%) | $51,058 |
| 2 Earners | 560 (44.8%) | $75,152 |
| 3+ Earners | 59 (4.7%) | $0 |
| Total | 1,251 (100.0%) | $63,875 |
Household Income in Brady
Household Income Brackets in Brady
With 483 households falling in the category, the $50,000 to $74,999 income range is the most frequent in Brady, accounting for 22.9% of all households. In contrast, only 4 households (0.2%) fall into the $10,000 to $14,999 income bracket, making it the least populous group.
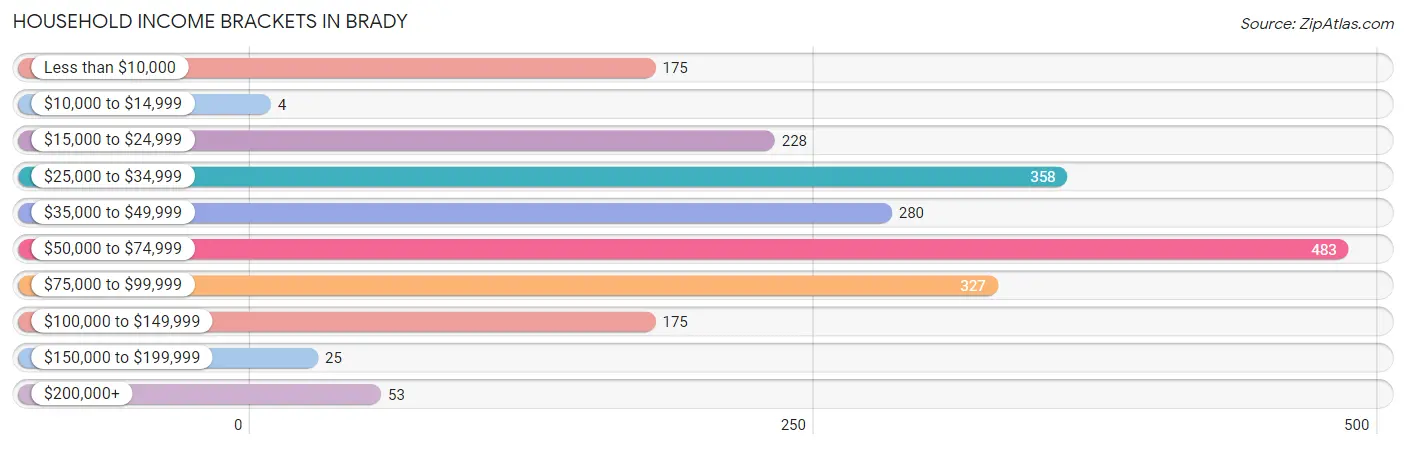
| Income Bracket | # Households | % Households |
| Less than $10,000 | 175 | 8.3% |
| $10,000 to $14,999 | 4 | 0.2% |
| $15,000 to $24,999 | 228 | 10.8% |
| $25,000 to $34,999 | 358 | 17.0% |
| $35,000 to $49,999 | 280 | 13.3% |
| $50,000 to $74,999 | 483 | 22.9% |
| $75,000 to $99,999 | 327 | 15.5% |
| $100,000 to $149,999 | 175 | 8.3% |
| $150,000 to $199,999 | 25 | 1.2% |
| $200,000+ | 53 | 2.5% |
Household Income by Householder Age in Brady
The median household income in Brady is $50,197, with the highest median household income of $65,323 found in the 25 to 44 years age bracket for the primary householder. A total of 524 households (24.9%) fall into this category. Meanwhile, the 65+ years age bracket for the primary householder has the lowest median household income of $33,542, with 706 households (33.5%) in this group.
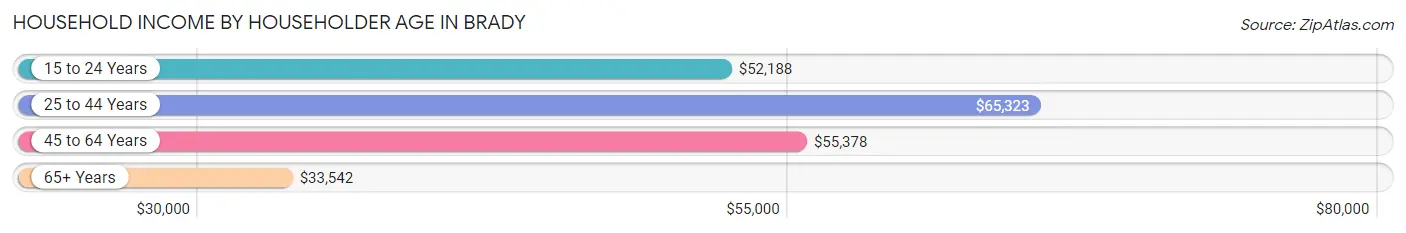
| Income Bracket | # Households | Median Income |
| 15 to 24 Years | 80 (3.8%) | $52,188 |
| 25 to 44 Years | 524 (24.9%) | $65,323 |
| 45 to 64 Years | 797 (37.8%) | $55,378 |
| 65+ Years | 706 (33.5%) | $33,542 |
| Total | 2,107 (100.0%) | $50,197 |
Poverty in Brady
Income Below Poverty by Sex and Age in Brady
With 9.7% poverty level for males and 15.3% for females among the residents of Brady, 25 to 34 year old males and under 5 year old females are the most vulnerable to poverty, with 111 males (34.8%) and 51 females (39.5%) in their respective age groups living below the poverty level.
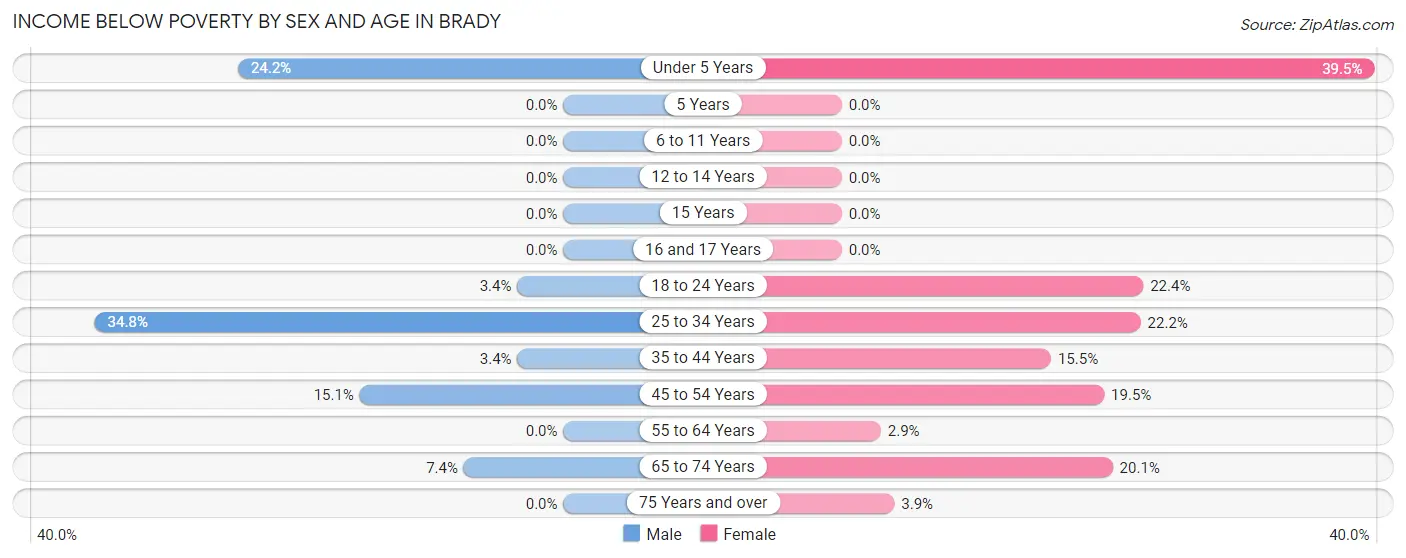
| Age Bracket | Male | Female |
| Under 5 Years | 65 (24.2%) | 51 (39.5%) |
| 5 Years | 0 (0.0%) | 0 (0.0%) |
| 6 to 11 Years | 0 (0.0%) | 0 (0.0%) |
| 12 to 14 Years | 0 (0.0%) | 0 (0.0%) |
| 15 Years | 0 (0.0%) | 0 (0.0%) |
| 16 and 17 Years | 0 (0.0%) | 0 (0.0%) |
| 18 to 24 Years | 9 (3.4%) | 47 (22.4%) |
| 25 to 34 Years | 111 (34.8%) | 69 (22.2%) |
| 35 to 44 Years | 9 (3.4%) | 32 (15.5%) |
| 45 to 54 Years | 39 (15.1%) | 75 (19.5%) |
| 55 to 64 Years | 0 (0.0%) | 8 (2.9%) |
| 65 to 74 Years | 19 (7.4%) | 74 (20.1%) |
| 75 Years and over | 0 (0.0%) | 8 (3.9%) |
| Total | 252 (9.7%) | 364 (15.3%) |
Income Above Poverty by Sex and Age in Brady
According to the poverty statistics in Brady, males aged 5 years and females aged 6 to 11 years are the age groups that are most secure financially, with 100.0% of males and 100.0% of females in these age groups living above the poverty line.
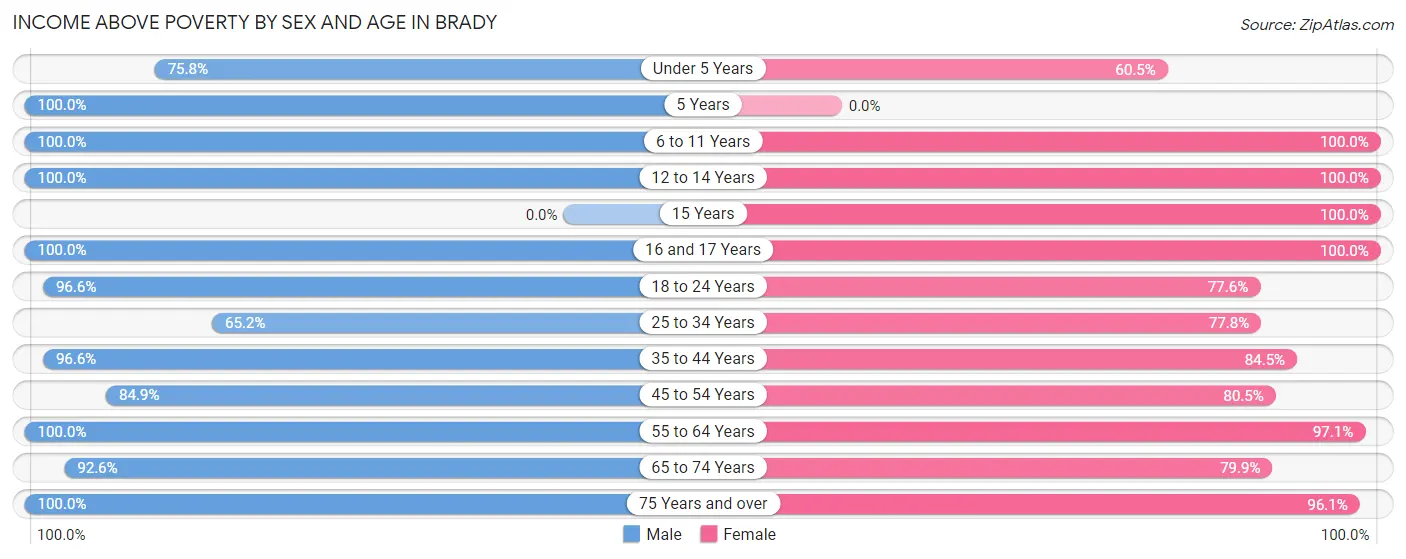
| Age Bracket | Male | Female |
| Under 5 Years | 204 (75.8%) | 78 (60.5%) |
| 5 Years | 57 (100.0%) | 0 (0.0%) |
| 6 to 11 Years | 142 (100.0%) | 173 (100.0%) |
| 12 to 14 Years | 199 (100.0%) | 22 (100.0%) |
| 15 Years | 0 (0.0%) | 18 (100.0%) |
| 16 and 17 Years | 68 (100.0%) | 74 (100.0%) |
| 18 to 24 Years | 254 (96.6%) | 163 (77.6%) |
| 25 to 34 Years | 208 (65.2%) | 242 (77.8%) |
| 35 to 44 Years | 255 (96.6%) | 174 (84.5%) |
| 45 to 54 Years | 219 (84.9%) | 310 (80.5%) |
| 55 to 64 Years | 341 (100.0%) | 268 (97.1%) |
| 65 to 74 Years | 238 (92.6%) | 294 (79.9%) |
| 75 Years and over | 151 (100.0%) | 197 (96.1%) |
| Total | 2,336 (90.3%) | 2,013 (84.7%) |
Income Below Poverty Among Married-Couple Families in Brady
The poverty statistics for married-couple families in Brady show that 3.5% or 27 of the total 766 families live below the poverty line. Families with 1 or 2 children have the highest poverty rate of 11.2%, comprising of 27 families. On the other hand, families with no children have the lowest poverty rate of 0.0%, which includes 0 families.
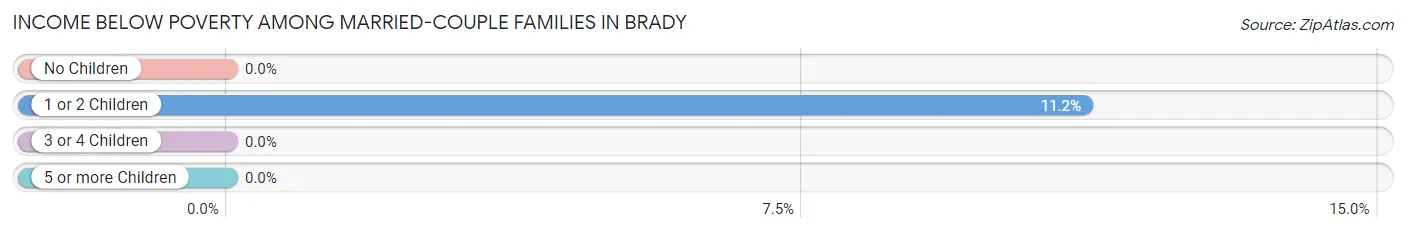
| Children | Above Poverty | Below Poverty |
| No Children | 451 (100.0%) | 0 (0.0%) |
| 1 or 2 Children | 215 (88.8%) | 27 (11.2%) |
| 3 or 4 Children | 73 (100.0%) | 0 (0.0%) |
| 5 or more Children | 0 (0.0%) | 0 (0.0%) |
| Total | 739 (96.5%) | 27 (3.5%) |
Income Below Poverty Among Single-Parent Households in Brady
According to the poverty data in Brady, 42.3% or 74 single-father households and 9.3% or 29 single-mother households are living below the poverty line. Among single-father households, those with 1 or 2 children have the highest poverty rate, with 74 households (87.1%) experiencing poverty. Likewise, among single-mother households, those with 1 or 2 children have the highest poverty rate, with 22 households (12.4%) falling below the poverty line.
| Children | Single Father | Single Mother |
| No Children | 0 (0.0%) | 7 (5.3%) |
| 1 or 2 Children | 74 (87.1%) | 22 (12.4%) |
| 3 or 4 Children | 0 (0.0%) | 0 (0.0%) |
| 5 or more Children | 0 (0.0%) | 0 (0.0%) |
| Total | 74 (42.3%) | 29 (9.3%) |
Income Below Poverty Among Married-Couple vs Single-Parent Households in Brady
The poverty data for Brady shows that 27 of the married-couple family households (3.5%) and 103 of the single-parent households (21.2%) are living below the poverty level. Within the married-couple family households, those with 1 or 2 children have the highest poverty rate, with 27 households (11.2%) falling below the poverty line. Among the single-parent households, those with 1 or 2 children have the highest poverty rate, with 96 household (36.6%) living below poverty.
| Children | Married-Couple Families | Single-Parent Households |
| No Children | 0 (0.0%) | 7 (3.1%) |
| 1 or 2 Children | 27 (11.2%) | 96 (36.6%) |
| 3 or 4 Children | 0 (0.0%) | 0 (0.0%) |
| 5 or more Children | 0 (0.0%) | 0 (0.0%) |
| Total | 27 (3.5%) | 103 (21.2%) |
Race in Brady
The most populous races in Brady are White / Caucasian (3,537 | 69.0%), Hispanic or Latino (2,180 | 42.5%), and Two or more Races (1,174 | 22.9%).
| Race | # Population | % Population |
| Asian | 31 | 0.6% |
| Black / African American | 65 | 1.3% |
| Hawaiian / Pacific | 0 | 0.0% |
| Hispanic or Latino | 2,180 | 42.5% |
| Native / Alaskan | 21 | 0.4% |
| White / Caucasian | 3,537 | 69.0% |
| Two or more Races | 1,174 | 22.9% |
| Some other Race | 301 | 5.9% |
| Total | 5,129 | 100.0% |
Ancestry in Brady
The most populous ancestries reported in Brady are Mexican (1,976 | 38.5%), German (611 | 11.9%), Irish (320 | 6.2%), American (287 | 5.6%), and English (237 | 4.6%), together accounting for 66.9% of all Brady residents.
| Ancestry | # Population | % Population |
| African | 6 | 0.1% |
| American | 287 | 5.6% |
| British | 40 | 0.8% |
| Cherokee | 145 | 2.8% |
| Choctaw | 16 | 0.3% |
| Dutch | 13 | 0.3% |
| Dutch West Indian | 5 | 0.1% |
| English | 237 | 4.6% |
| European | 144 | 2.8% |
| French | 65 | 1.3% |
| German | 611 | 11.9% |
| Indian (Asian) | 8 | 0.2% |
| Irish | 320 | 6.2% |
| Italian | 11 | 0.2% |
| Korean | 22 | 0.4% |
| Mexican | 1,976 | 38.5% |
| Northern European | 10 | 0.2% |
| Norwegian | 145 | 2.8% |
| Polish | 27 | 0.5% |
| Russian | 62 | 1.2% |
| Scotch-Irish | 33 | 0.6% |
| Scottish | 139 | 2.7% |
| Sioux | 32 | 0.6% |
| Subsaharan African | 6 | 0.1% |
| Swedish | 41 | 0.8% |
| Thai | 12 | 0.2% |
| Welsh | 31 | 0.6% | View All 27 Rows |
Immigrants in Brady
The most numerous immigrant groups reported in Brady came from Central America (293 | 5.7%), Latin America (293 | 5.7%), Mexico (236 | 4.6%), El Salvador (57 | 1.1%), and Asia (20 | 0.4%), together accounting for 17.5% of all Brady residents.
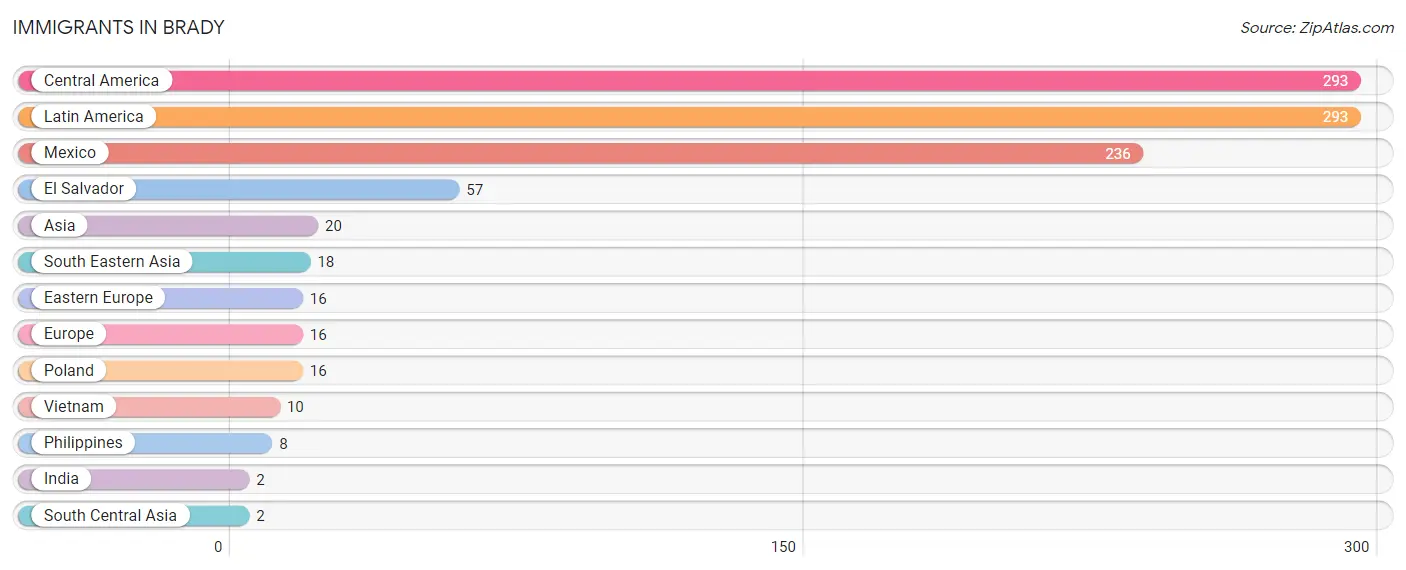
| Immigration Origin | # Population | % Population |
| Asia | 20 | 0.4% |
| Central America | 293 | 5.7% |
| Eastern Europe | 16 | 0.3% |
| El Salvador | 57 | 1.1% |
| Europe | 16 | 0.3% |
| India | 2 | 0.0% |
| Latin America | 293 | 5.7% |
| Mexico | 236 | 4.6% |
| Philippines | 8 | 0.2% |
| Poland | 16 | 0.3% |
| South Central Asia | 2 | 0.0% |
| South Eastern Asia | 18 | 0.4% |
| Vietnam | 10 | 0.2% | View All 13 Rows |
Sex and Age in Brady
Sex and Age in Brady
The most populous age groups in Brady are Under 5 Years (269 | 10.1%) for men and 70 to 74 Years (233 | 9.4%) for women.
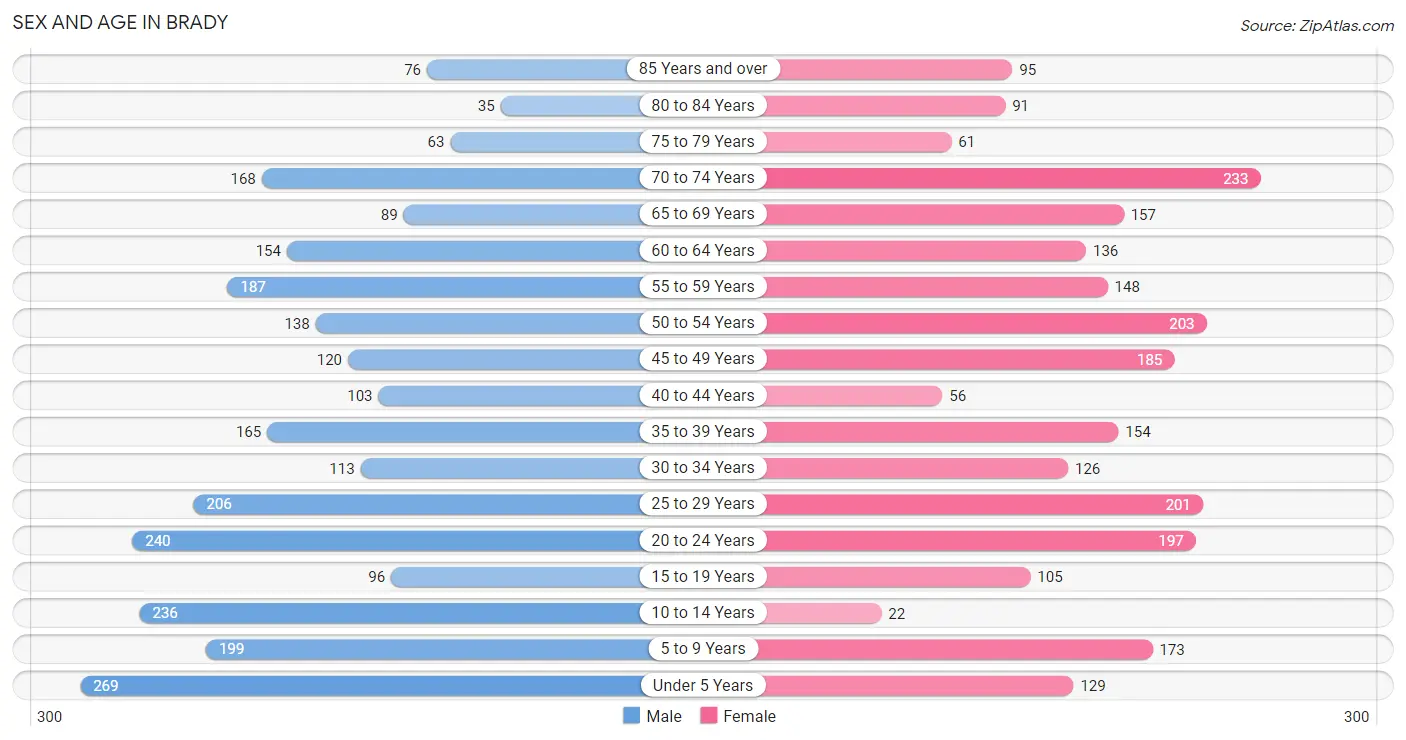
| Age Bracket | Male | Female |
| Under 5 Years | 269 (10.1%) | 129 (5.2%) |
| 5 to 9 Years | 199 (7.5%) | 173 (7.0%) |
| 10 to 14 Years | 236 (8.9%) | 22 (0.9%) |
| 15 to 19 Years | 96 (3.6%) | 105 (4.3%) |
| 20 to 24 Years | 240 (9.0%) | 197 (8.0%) |
| 25 to 29 Years | 206 (7.7%) | 201 (8.1%) |
| 30 to 34 Years | 113 (4.3%) | 126 (5.1%) |
| 35 to 39 Years | 165 (6.2%) | 154 (6.2%) |
| 40 to 44 Years | 103 (3.9%) | 56 (2.3%) |
| 45 to 49 Years | 120 (4.5%) | 185 (7.5%) |
| 50 to 54 Years | 138 (5.2%) | 203 (8.2%) |
| 55 to 59 Years | 187 (7.0%) | 148 (6.0%) |
| 60 to 64 Years | 154 (5.8%) | 136 (5.5%) |
| 65 to 69 Years | 89 (3.4%) | 157 (6.4%) |
| 70 to 74 Years | 168 (6.3%) | 233 (9.4%) |
| 75 to 79 Years | 63 (2.4%) | 61 (2.5%) |
| 80 to 84 Years | 35 (1.3%) | 91 (3.7%) |
| 85 Years and over | 76 (2.9%) | 95 (3.8%) |
| Total | 2,657 (100.0%) | 2,472 (100.0%) |
Families and Households in Brady
Median Family Size in Brady
The median family size in Brady is 3.05 persons per family, with married-couple families (766 | 61.2%) accounting for the largest median family size of 3.26 persons per family. On the other hand, single male/father families (175 | 14.0%) represent the smallest median family size with 1.86 persons per family.
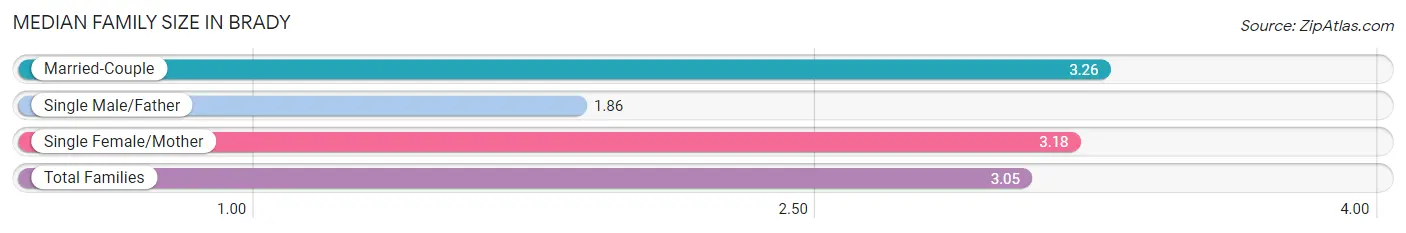
| Family Type | # Families | Family Size |
| Married-Couple | 766 (61.2%) | 3.26 |
| Single Male/Father | 175 (14.0%) | 1.86 |
| Single Female/Mother | 310 (24.8%) | 3.18 |
| Total Families | 1,251 (100.0%) | 3.05 |
Median Household Size in Brady
The median household size in Brady is 2.37 persons per household, with married-couple households (766 | 36.4%) accounting for the largest median household size of 3.37 persons per household. non-family households (856 | 40.6%) represent the smallest median household size with 1.20 persons per household.
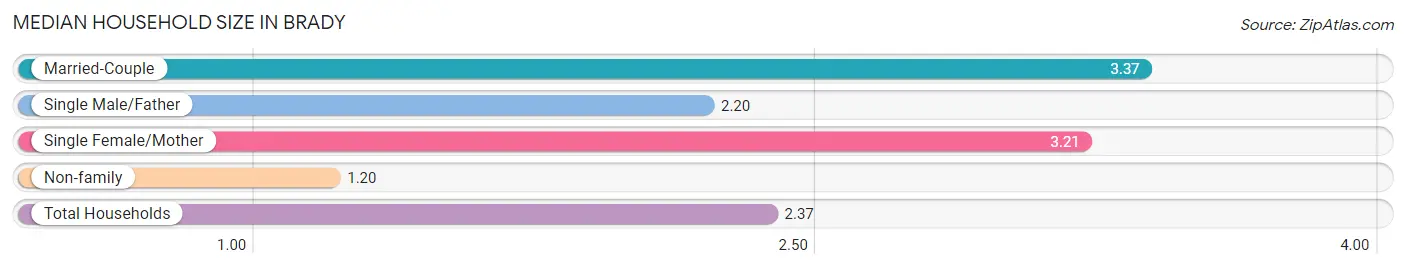
| Household Type | # Households | Household Size |
| Married-Couple | 766 (36.4%) | 3.37 |
| Single Male/Father | 175 (8.3%) | 2.20 |
| Single Female/Mother | 310 (14.7%) | 3.21 |
| Non-family | 856 (40.6%) | 1.20 |
| Total Households | 2,107 (100.0%) | 2.37 |
Household Size by Marriage Status in Brady
Out of a total of 2,107 households in Brady, 1,251 (59.4%) are family households, while 856 (40.6%) are nonfamily households. The most numerous type of family households are 2-person households, comprising 625, and the most common type of nonfamily households are 1-person households, comprising 745.
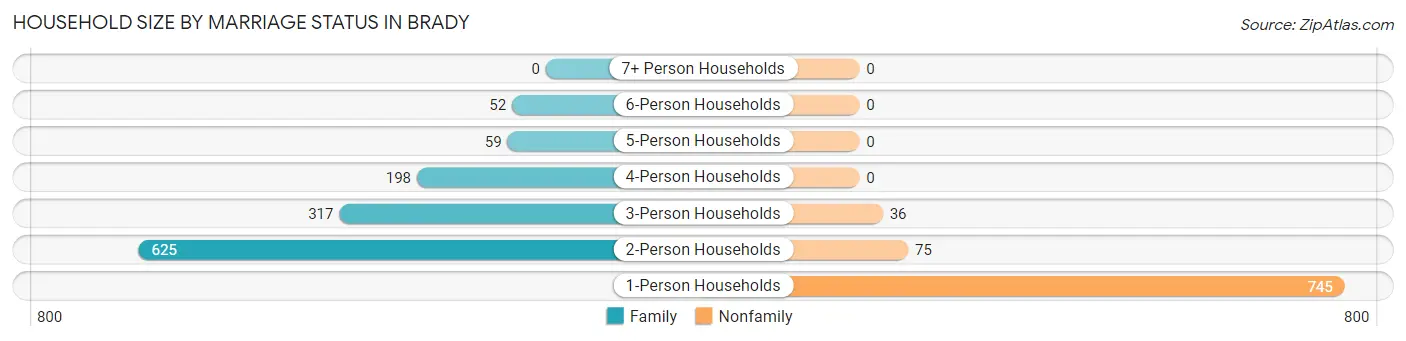
| Household Size | Family Households | Nonfamily Households |
| 1-Person Households | - | 745 (35.4%) |
| 2-Person Households | 625 (29.7%) | 75 (3.6%) |
| 3-Person Households | 317 (15.0%) | 36 (1.7%) |
| 4-Person Households | 198 (9.4%) | 0 (0.0%) |
| 5-Person Households | 59 (2.8%) | 0 (0.0%) |
| 6-Person Households | 52 (2.5%) | 0 (0.0%) |
| 7+ Person Households | 0 (0.0%) | 0 (0.0%) |
| Total | 1,251 (59.4%) | 856 (40.6%) |
Female Fertility in Brady
Fertility by Age in Brady
Average fertility rate in Brady is 64.0 births per 1,000 women. Women in the age bracket of 20 to 34 years have the highest fertility rate with 135.0 births per 1,000 women. Women in the age bracket of 20 to 34 years acount for 100.0% of all women with births.
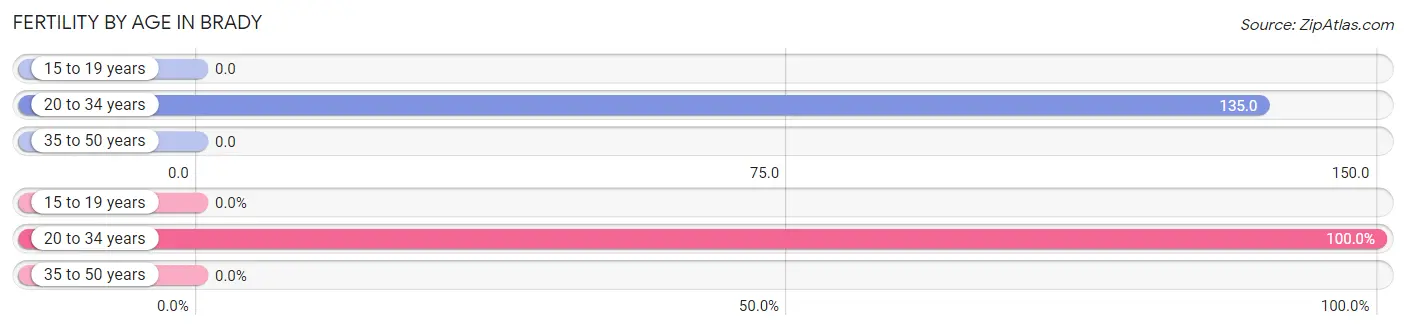
| Age Bracket | Women with Births | Births / 1,000 Women |
| 15 to 19 years | 0 (0.0%) | 0.0 |
| 20 to 34 years | 71 (100.0%) | 135.0 |
| 35 to 50 years | 0 (0.0%) | 0.0 |
| Total | 71 (100.0%) | 64.0 |
Fertility by Age by Marriage Status in Brady
53.5% of women with births (71) in Brady are married. The highest percentage of unmarried women with births falls into 20 to 34 years age bracket with 46.5% of them unmarried at the time of birth, while the lowest percentage of unmarried women with births belong to 20 to 34 years age bracket with 46.5% of them unmarried.
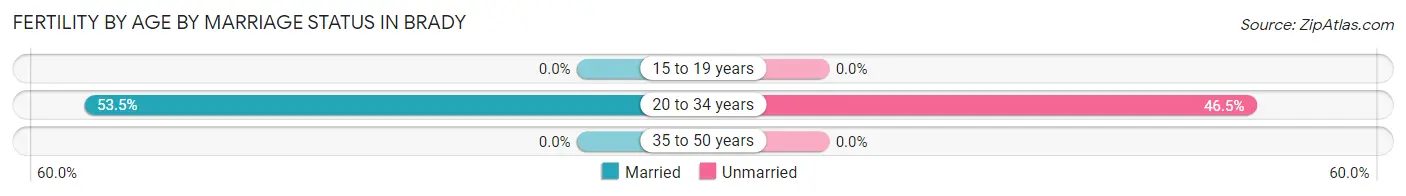
| Age Bracket | Married | Unmarried |
| 15 to 19 years | 0 (0.0%) | 0 (0.0%) |
| 20 to 34 years | 38 (53.5%) | 33 (46.5%) |
| 35 to 50 years | 0 (0.0%) | 0 (0.0%) |
| Total | 38 (53.5%) | 33 (46.5%) |
Fertility by Education in Brady
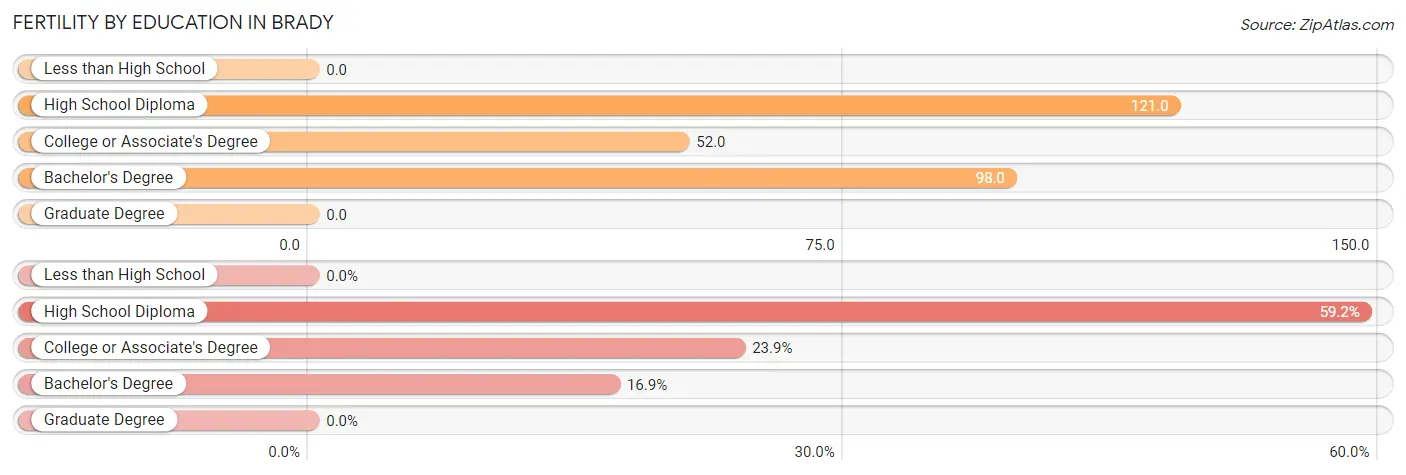
| Educational Attainment | Women with Births | Births / 1,000 Women |
| Less than High School | 0 (0.0%) | 0.0 |
| High School Diploma | 42 (59.2%) | 121.0 |
| College or Associate's Degree | 17 (23.9%) | 52.0 |
| Bachelor's Degree | 12 (16.9%) | 98.0 |
| Graduate Degree | 0 (0.0%) | 0.0 |
| Total | 71 (100.0%) | 64.0 |
Fertility by Education by Marriage Status in Brady
46.5% of women with births in Brady are unmarried. Women with the educational attainment of bachelor's degree are most likely to be married with 100.0% of them married at childbirth, while women with the educational attainment of college or associate's degree are least likely to be married with 94.1% of them unmarried at childbirth.
| Educational Attainment | Married | Unmarried |
| Less than High School | 0 (0.0%) | 0 (0.0%) |
| High School Diploma | 25 (59.5%) | 17 (40.5%) |
| College or Associate's Degree | 1 (5.9%) | 16 (94.1%) |
| Bachelor's Degree | 12 (100.0%) | 0 (0.0%) |
| Graduate Degree | 0 (0.0%) | 0 (0.0%) |
| Total | 38 (53.5%) | 33 (46.5%) |
Employment Characteristics in Brady
Employment by Class of Employer in Brady
Among the 2,081 employed individuals in Brady, private company employees (1,362 | 65.4%), self-employed (not incorporated) (283 | 13.6%), and not-for-profit organizations (155 | 7.4%) make up the most common classes of employment.
| Employer Class | # Employees | % Employees |
| Private Company Employees | 1,362 | 65.4% |
| Self-Employed (Incorporated) | 22 | 1.1% |
| Self-Employed (Not Incorporated) | 283 | 13.6% |
| Not-for-profit Organizations | 155 | 7.4% |
| Local Government Employees | 139 | 6.7% |
| State Government Employees | 53 | 2.5% |
| Federal Government Employees | 67 | 3.2% |
| Unpaid Family Workers | 0 | 0.0% |
| Total | 2,081 | 100.0% |
Employment Status by Age in Brady
According to the labor force statistics for Brady, out of the total population over 16 years of age (4,083), 59.3% or 2,421 individuals are in the labor force, with 10.5% or 254 of them unemployed. The age group with the highest labor force participation rate is 60 to 64 years, with 92.1% or 267 individuals in the labor force. Within the labor force, the 60 to 64 years age range has the highest percentage of unemployed individuals, with 31.8% or 85 of them being unemployed.
| Age Bracket | In Labor Force | Unemployed |
| 16 to 19 Years | 60 (32.8%) | 0 (0.0%) |
| 20 to 24 Years | 352 (80.5%) | 58 (16.5%) |
| 25 to 29 Years | 348 (85.5%) | 65 (18.7%) |
| 30 to 34 Years | 157 (65.7%) | 0 (0.0%) |
| 35 to 44 Years | 410 (85.8%) | 26 (6.3%) |
| 45 to 54 Years | 460 (71.2%) | 20 (4.3%) |
| 55 to 59 Years | 223 (66.6%) | 0 (0.0%) |
| 60 to 64 Years | 267 (92.1%) | 85 (31.8%) |
| 65 to 74 Years | 86 (13.3%) | 0 (0.0%) |
| 75 Years and over | 60 (14.3%) | 0 (0.0%) |
| Total | 2,421 (59.3%) | 254 (10.5%) |
Employment Status by Educational Attainment in Brady
According to labor force statistics for Brady, 77.9% of individuals (1,866) out of the total population between 25 and 64 years of age (2,395) are in the labor force, with 10.5% or 196 of them being unemployed. The group with the highest labor force participation rate are those with the educational attainment of bachelor's degree or higher, with 81.7% or 308 individuals in the labor force. Within the labor force, individuals with less than high school education have the highest percentage of unemployment, with 19.1% or 85 of them being unemployed.
| Educational Attainment | In Labor Force | Unemployed |
| Less than High School | 446 (75.5%) | 113 (19.1%) |
| High School Diploma | 532 (78.7%) | 80 (11.8%) |
| College / Associate Degree | 579 (77.1%) | 29 (3.8%) |
| Bachelor's Degree or higher | 308 (81.7%) | 32 (8.4%) |
| Total | 1,866 (77.9%) | 251 (10.5%) |
Employment Occupations by Sex in Brady
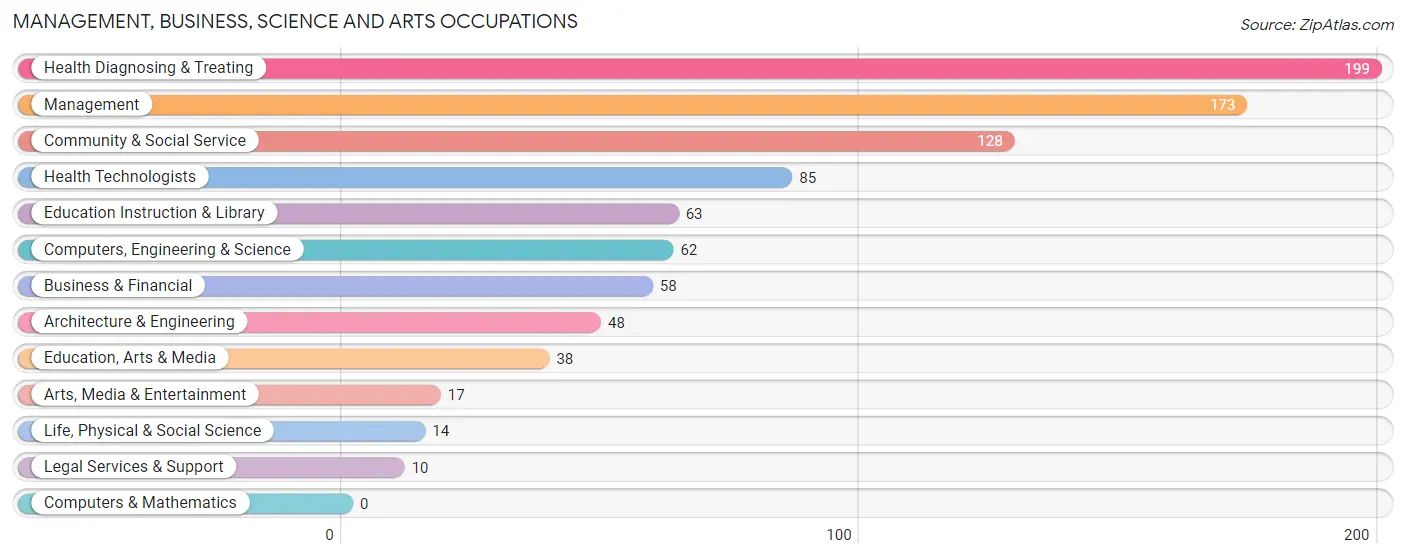
Management, Business, Science and Arts Occupations
The most common Management, Business, Science and Arts occupations in Brady are Health Diagnosing & Treating (199 | 9.2%), Management (173 | 8.0%), Community & Social Service (128 | 5.9%), Health Technologists (85 | 3.9%), and Education Instruction & Library (63 | 2.9%).
Management, Business, Science and Arts Occupations by Sex
Within the Management, Business, Science and Arts occupations in Brady, the most male-oriented occupations are Computers, Engineering & Science (100.0%), Architecture & Engineering (100.0%), and Life, Physical & Social Science (100.0%), while the most female-oriented occupations are Arts, Media & Entertainment (100.0%), Health Diagnosing & Treating (100.0%), and Health Technologists (100.0%).
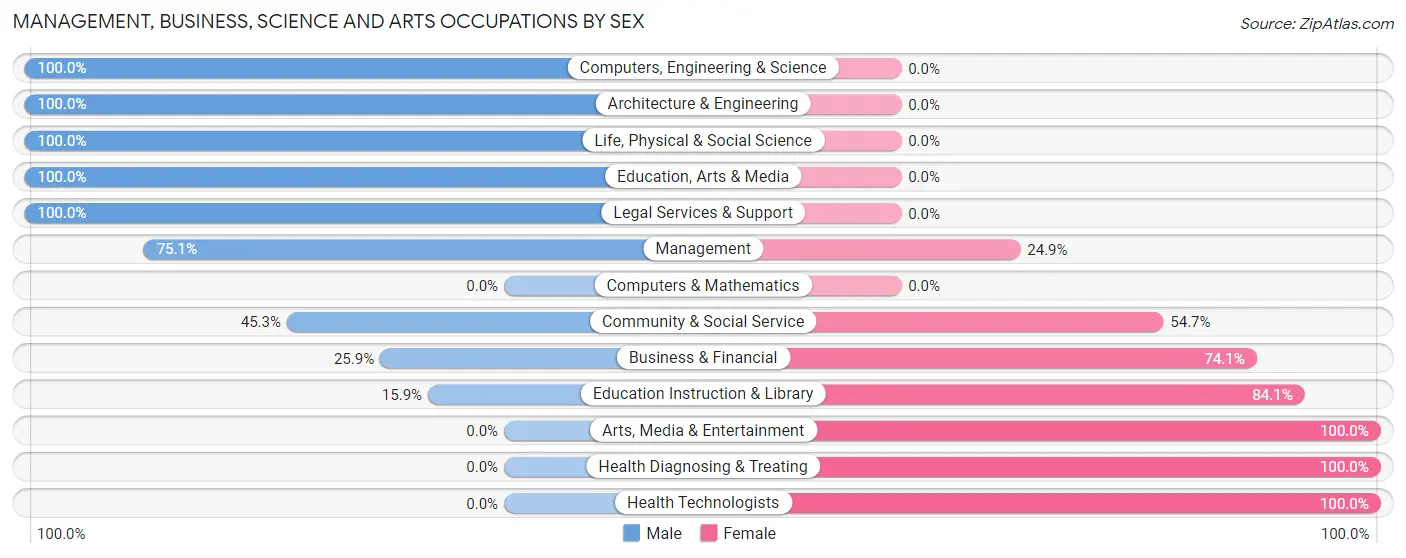
| Occupation | Male | Female |
| Management | 130 (75.1%) | 43 (24.9%) |
| Business & Financial | 15 (25.9%) | 43 (74.1%) |
| Computers, Engineering & Science | 62 (100.0%) | 0 (0.0%) |
| Computers & Mathematics | 0 (0.0%) | 0 (0.0%) |
| Architecture & Engineering | 48 (100.0%) | 0 (0.0%) |
| Life, Physical & Social Science | 14 (100.0%) | 0 (0.0%) |
| Community & Social Service | 58 (45.3%) | 70 (54.7%) |
| Education, Arts & Media | 38 (100.0%) | 0 (0.0%) |
| Legal Services & Support | 10 (100.0%) | 0 (0.0%) |
| Education Instruction & Library | 10 (15.9%) | 53 (84.1%) |
| Arts, Media & Entertainment | 0 (0.0%) | 17 (100.0%) |
| Health Diagnosing & Treating | 0 (0.0%) | 199 (100.0%) |
| Health Technologists | 0 (0.0%) | 85 (100.0%) |
| Total (Category) | 265 (42.7%) | 355 (57.3%) |
| Total (Overall) | 958 (44.2%) | 1,211 (55.8%) |
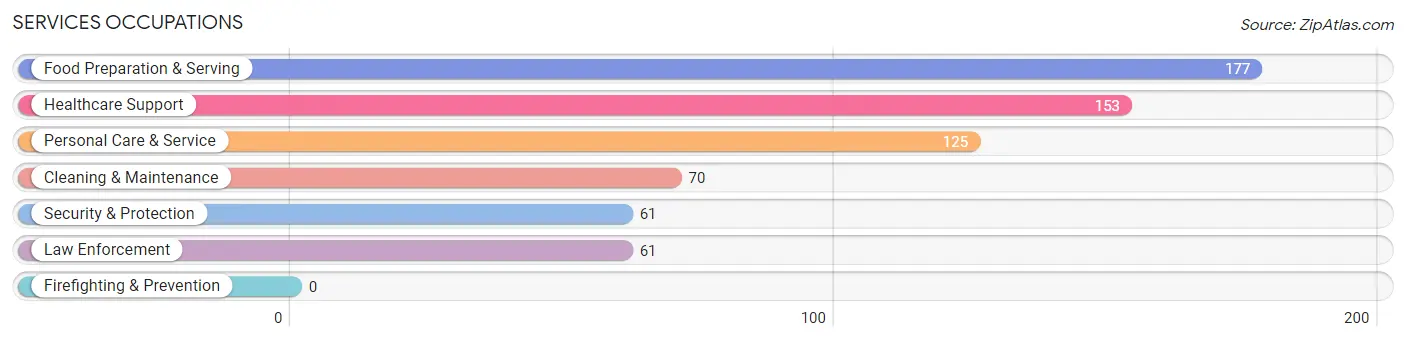
Services Occupations
The most common Services occupations in Brady are Food Preparation & Serving (177 | 8.2%), Healthcare Support (153 | 7.0%), Personal Care & Service (125 | 5.8%), Cleaning & Maintenance (70 | 3.2%), and Security & Protection (61 | 2.8%).
Services Occupations by Sex
Within the Services occupations in Brady, the most male-oriented occupations are Security & Protection (57.4%), Law Enforcement (57.4%), and Cleaning & Maintenance (55.7%), while the most female-oriented occupations are Healthcare Support (87.6%), Food Preparation & Serving (83.6%), and Personal Care & Service (72.8%).
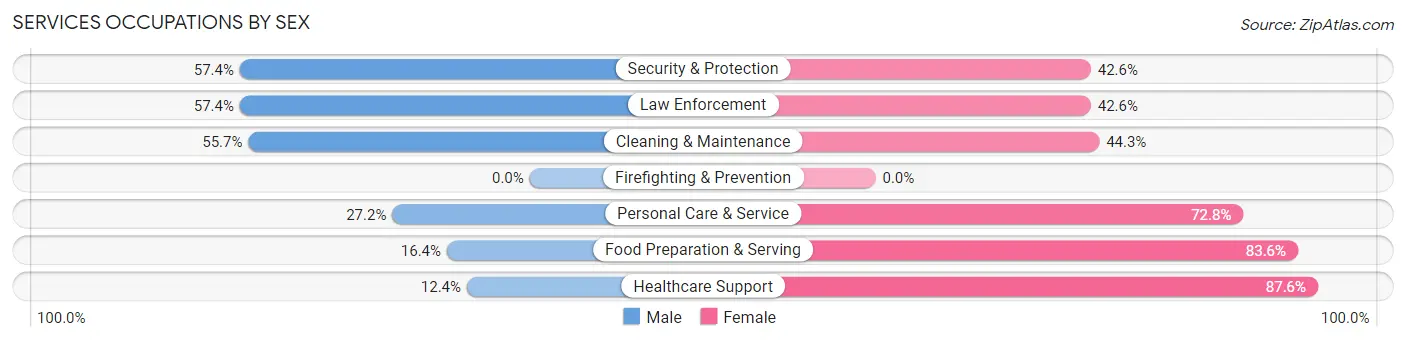
| Occupation | Male | Female |
| Healthcare Support | 19 (12.4%) | 134 (87.6%) |
| Security & Protection | 35 (57.4%) | 26 (42.6%) |
| Firefighting & Prevention | 0 (0.0%) | 0 (0.0%) |
| Law Enforcement | 35 (57.4%) | 26 (42.6%) |
| Food Preparation & Serving | 29 (16.4%) | 148 (83.6%) |
| Cleaning & Maintenance | 39 (55.7%) | 31 (44.3%) |
| Personal Care & Service | 34 (27.2%) | 91 (72.8%) |
| Total (Category) | 156 (26.6%) | 430 (73.4%) |
| Total (Overall) | 958 (44.2%) | 1,211 (55.8%) |
Sales and Office Occupations
The most common Sales and Office occupations in Brady are Office & Administration (202 | 9.3%), and Sales & Related (152 | 7.0%).
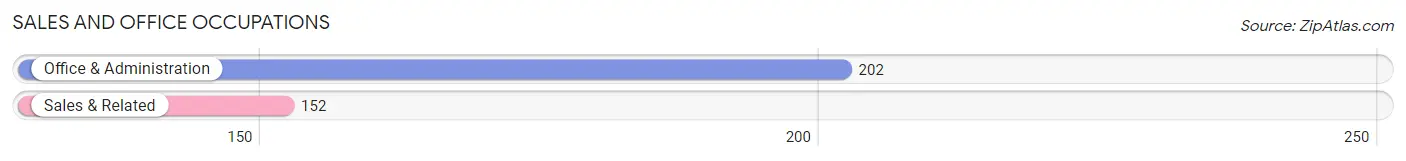
Sales and Office Occupations by Sex
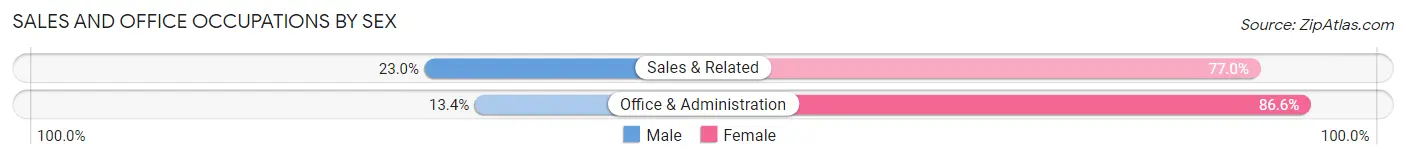
| Occupation | Male | Female |
| Sales & Related | 35 (23.0%) | 117 (77.0%) |
| Office & Administration | 27 (13.4%) | 175 (86.6%) |
| Total (Category) | 62 (17.5%) | 292 (82.5%) |
| Total (Overall) | 958 (44.2%) | 1,211 (55.8%) |
Natural Resources, Construction and Maintenance Occupations
The most common Natural Resources, Construction and Maintenance occupations in Brady are Construction & Extraction (167 | 7.7%), and Installation, Maintenance & Repair (62 | 2.9%).
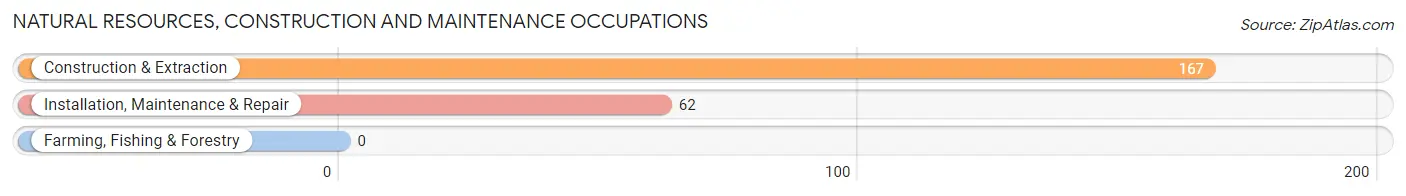
Natural Resources, Construction and Maintenance Occupations by Sex
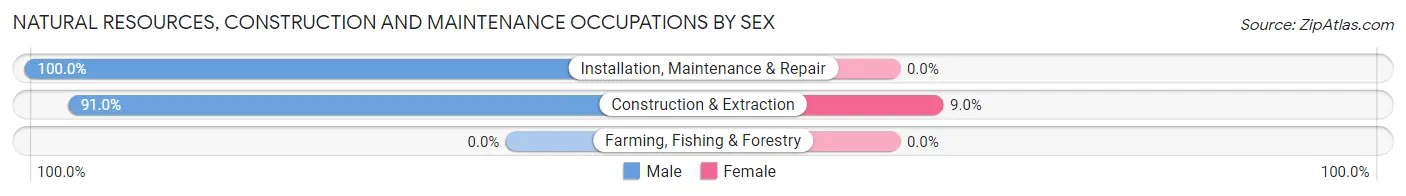
| Occupation | Male | Female |
| Farming, Fishing & Forestry | 0 (0.0%) | 0 (0.0%) |
| Construction & Extraction | 152 (91.0%) | 15 (9.0%) |
| Installation, Maintenance & Repair | 62 (100.0%) | 0 (0.0%) |
| Total (Category) | 214 (93.4%) | 15 (6.6%) |
| Total (Overall) | 958 (44.2%) | 1,211 (55.8%) |
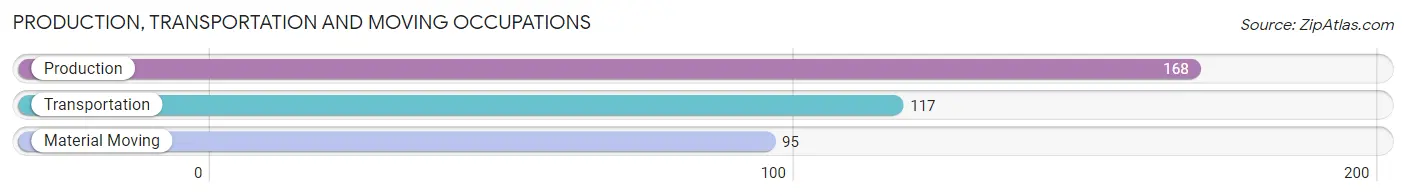
Production, Transportation and Moving Occupations
The most common Production, Transportation and Moving occupations in Brady are Production (168 | 7.7%), Transportation (117 | 5.4%), and Material Moving (95 | 4.4%).
Production, Transportation and Moving Occupations by Sex
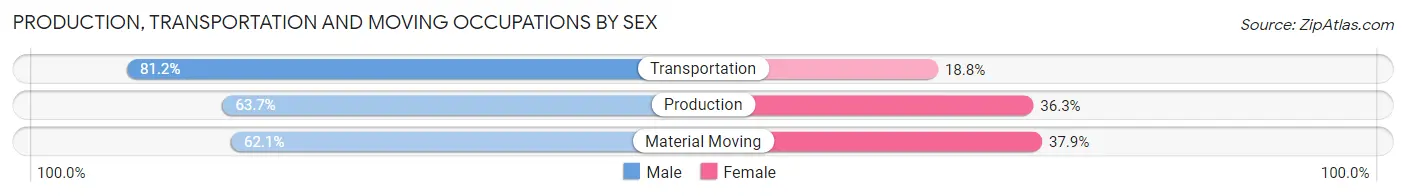
| Occupation | Male | Female |
| Production | 107 (63.7%) | 61 (36.3%) |
| Transportation | 95 (81.2%) | 22 (18.8%) |
| Material Moving | 59 (62.1%) | 36 (37.9%) |
| Total (Category) | 261 (68.7%) | 119 (31.3%) |
| Total (Overall) | 958 (44.2%) | 1,211 (55.8%) |
Employment Industries by Sex in Brady
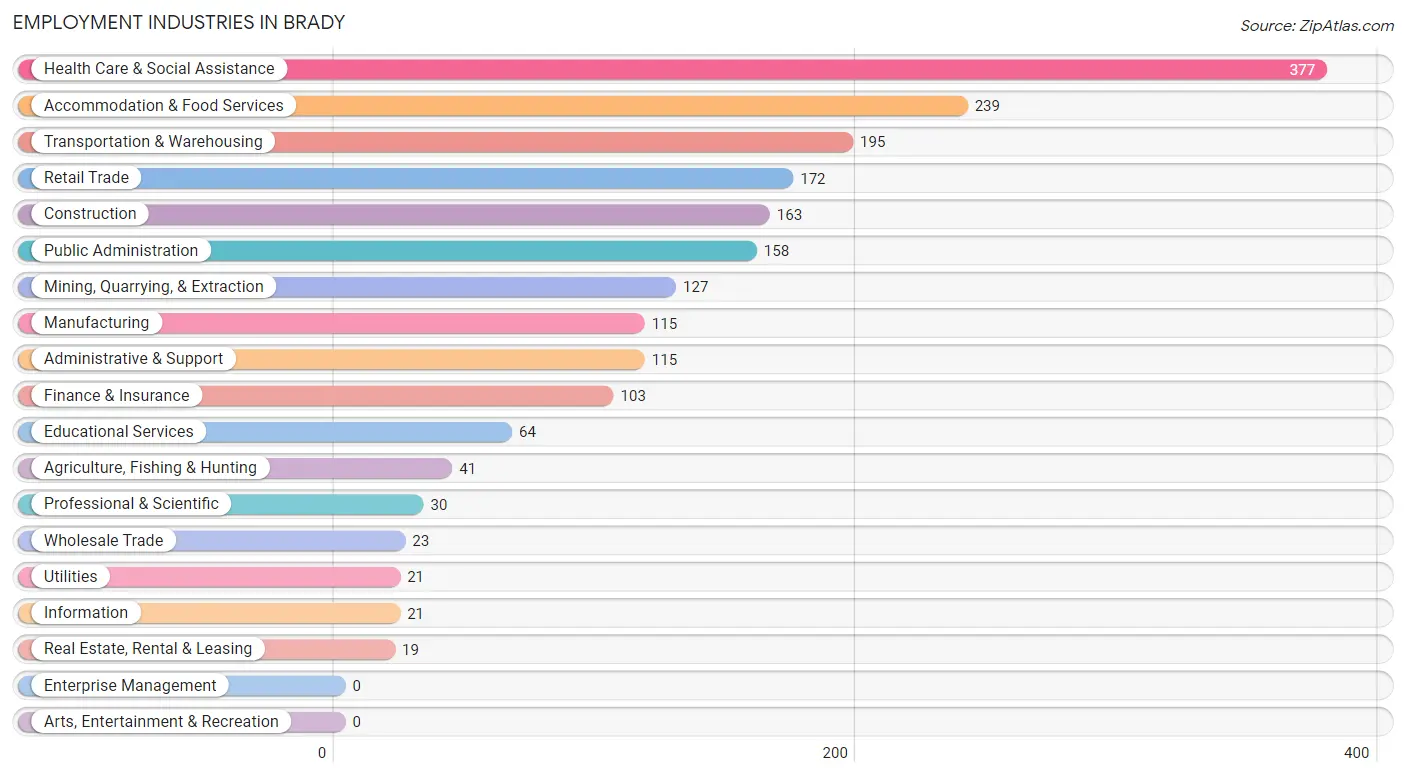
Employment Industries in Brady
The major employment industries in Brady include Health Care & Social Assistance (377 | 17.4%), Accommodation & Food Services (239 | 11.0%), Transportation & Warehousing (195 | 9.0%), Retail Trade (172 | 7.9%), and Construction (163 | 7.5%).
Employment Industries by Sex in Brady
The Brady industries that see more men than women are Agriculture, Fishing & Hunting (100.0%), Construction (100.0%), and Utilities (100.0%), whereas the industries that tend to have a higher number of women are Information (100.0%), Professional & Scientific (100.0%), and Health Care & Social Assistance (91.8%).
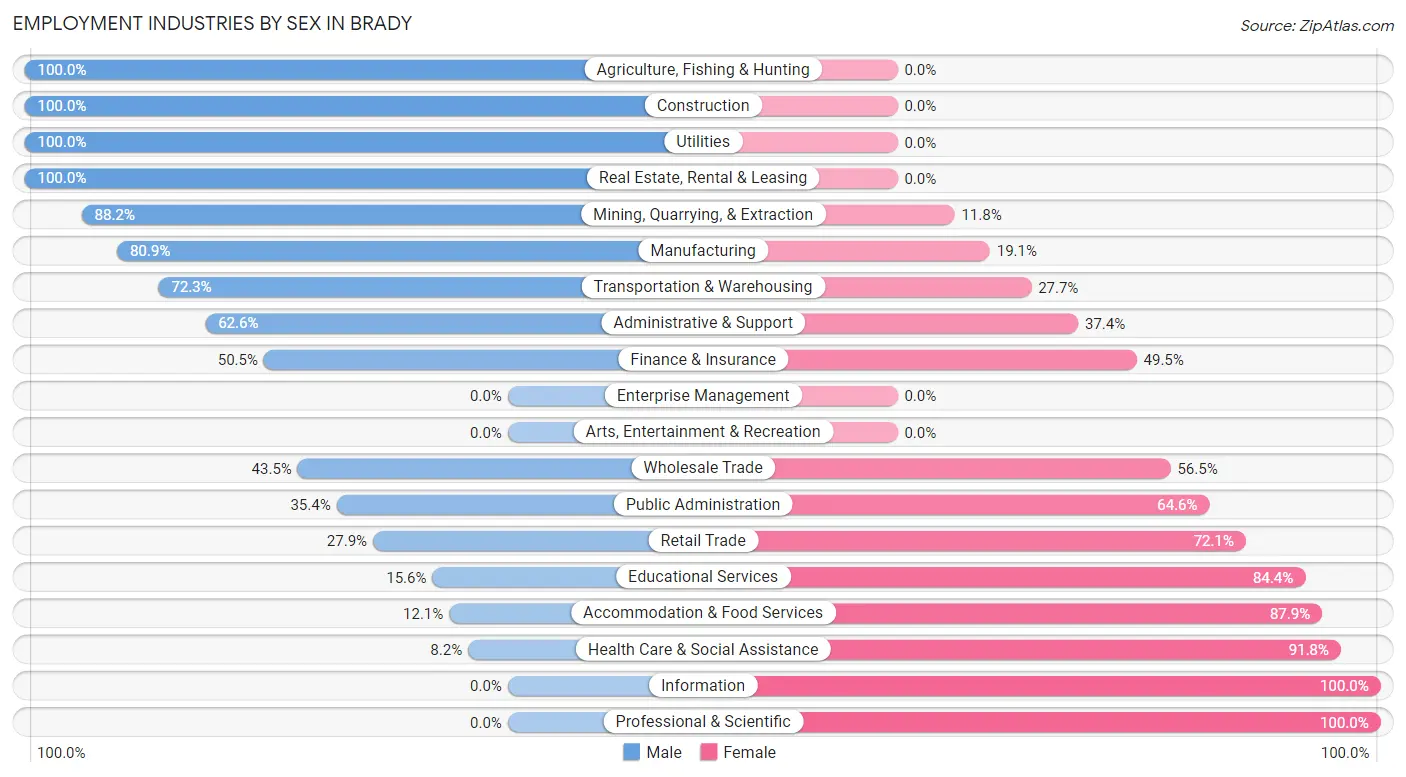
| Industry | Male | Female |
| Agriculture, Fishing & Hunting | 41 (100.0%) | 0 (0.0%) |
| Mining, Quarrying, & Extraction | 112 (88.2%) | 15 (11.8%) |
| Construction | 163 (100.0%) | 0 (0.0%) |
| Manufacturing | 93 (80.9%) | 22 (19.1%) |
| Wholesale Trade | 10 (43.5%) | 13 (56.5%) |
| Retail Trade | 48 (27.9%) | 124 (72.1%) |
| Transportation & Warehousing | 141 (72.3%) | 54 (27.7%) |
| Utilities | 21 (100.0%) | 0 (0.0%) |
| Information | 0 (0.0%) | 21 (100.0%) |
| Finance & Insurance | 52 (50.5%) | 51 (49.5%) |
| Real Estate, Rental & Leasing | 19 (100.0%) | 0 (0.0%) |
| Professional & Scientific | 0 (0.0%) | 30 (100.0%) |
| Enterprise Management | 0 (0.0%) | 0 (0.0%) |
| Administrative & Support | 72 (62.6%) | 43 (37.4%) |
| Educational Services | 10 (15.6%) | 54 (84.4%) |
| Health Care & Social Assistance | 31 (8.2%) | 346 (91.8%) |
| Arts, Entertainment & Recreation | 0 (0.0%) | 0 (0.0%) |
| Accommodation & Food Services | 29 (12.1%) | 210 (87.9%) |
| Public Administration | 56 (35.4%) | 102 (64.6%) |
| Total | 958 (44.2%) | 1,211 (55.8%) |
Education in Brady
School Enrollment in Brady
The most common levels of schooling among the 1,009 students in Brady are elementary school (352 | 34.9%), high school (314 | 31.1%), and college / undergraduate (176 | 17.4%).
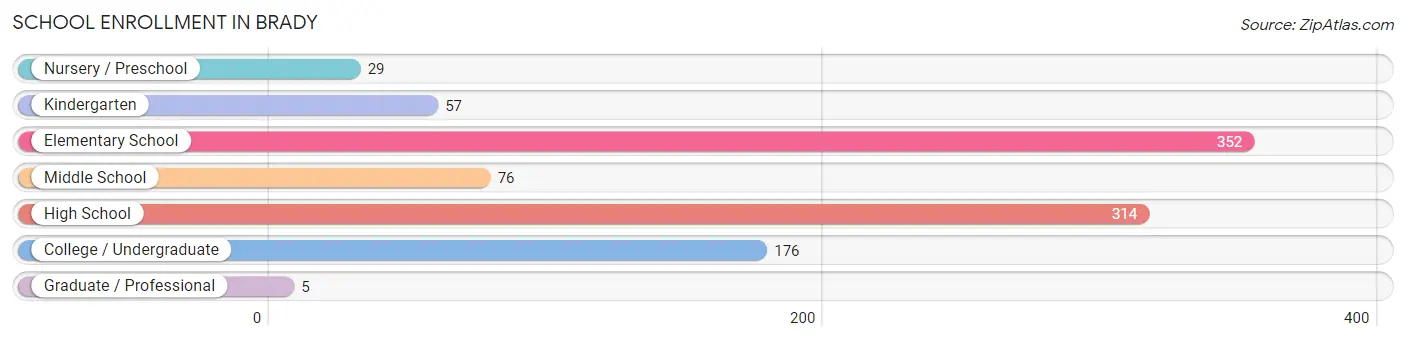
| School Level | # Students | % Students |
| Nursery / Preschool | 29 | 2.9% |
| Kindergarten | 57 | 5.7% |
| Elementary School | 352 | 34.9% |
| Middle School | 76 | 7.5% |
| High School | 314 | 31.1% |
| College / Undergraduate | 176 | 17.4% |
| Graduate / Professional | 5 | 0.5% |
| Total | 1,009 | 100.0% |
School Enrollment by Age by Funding Source in Brady
Out of a total of 1,009 students who are enrolled in schools in Brady, 51 (5.1%) attend a private institution, while the remaining 958 (94.9%) are enrolled in public schools. The age group of 3 to 4 year olds has the highest likelihood of being enrolled in private schools, with 29 (100.0% in the age bracket) enrolled. Conversely, the age group of 5 to 9 year old has the lowest likelihood of being enrolled in a private school, with 372 (100.0% in the age bracket) attending a public institution.
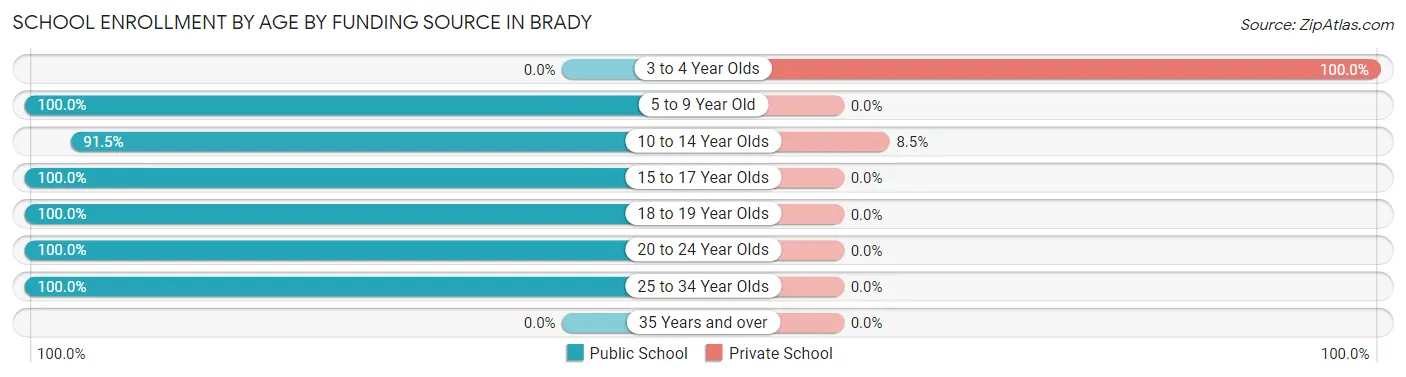
| Age Bracket | Public School | Private School |
| 3 to 4 Year Olds | 0 (0.0%) | 29 (100.0%) |
| 5 to 9 Year Old | 372 (100.0%) | 0 (0.0%) |
| 10 to 14 Year Olds | 236 (91.5%) | 22 (8.5%) |
| 15 to 17 Year Olds | 160 (100.0%) | 0 (0.0%) |
| 18 to 19 Year Olds | 9 (100.0%) | 0 (0.0%) |
| 20 to 24 Year Olds | 68 (100.0%) | 0 (0.0%) |
| 25 to 34 Year Olds | 113 (100.0%) | 0 (0.0%) |
| 35 Years and over | 0 (0.0%) | 0 (0.0%) |
| Total | 958 (94.9%) | 51 (5.1%) |
Educational Attainment by Field of Study in Brady
Business (175 | 31.9%), education (114 | 20.8%), science & technology (67 | 12.2%), physical & health sciences (56 | 10.2%), and visual & performing arts (47 | 8.6%) are the most common fields of study among 548 individuals in Brady who have obtained a bachelor's degree or higher.
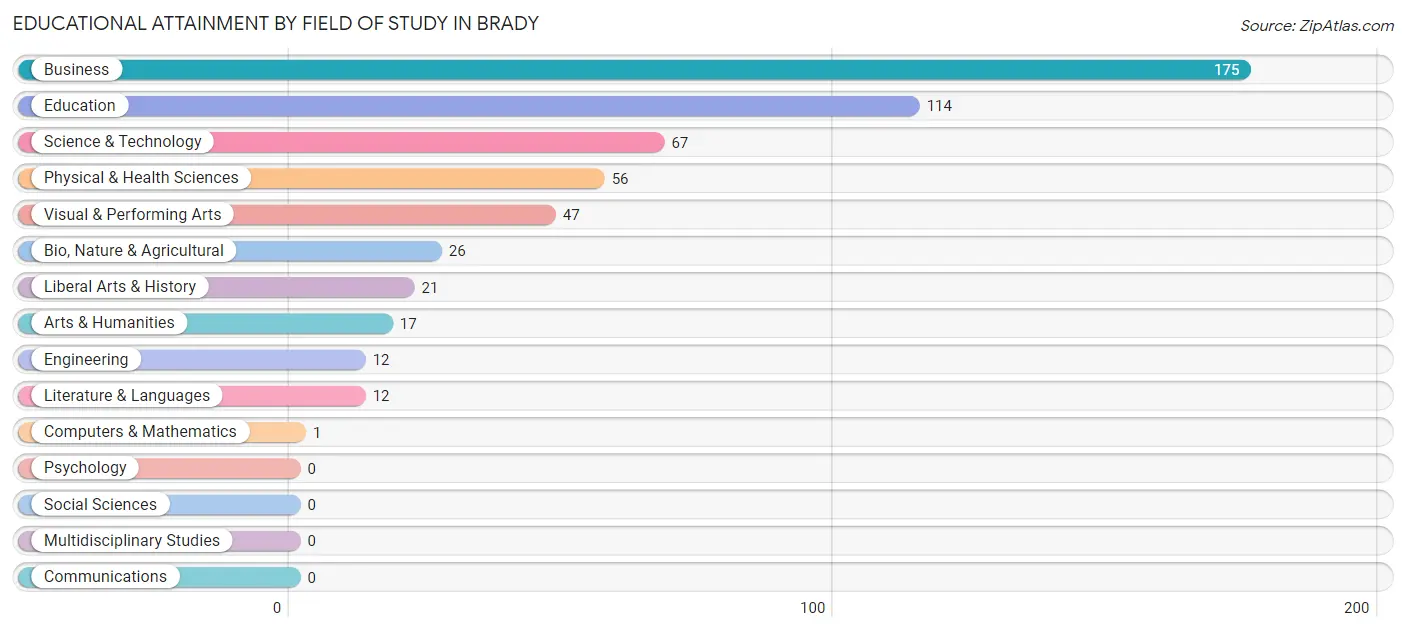
| Field of Study | # Graduates | % Graduates |
| Computers & Mathematics | 1 | 0.2% |
| Bio, Nature & Agricultural | 26 | 4.7% |
| Physical & Health Sciences | 56 | 10.2% |
| Psychology | 0 | 0.0% |
| Social Sciences | 0 | 0.0% |
| Engineering | 12 | 2.2% |
| Multidisciplinary Studies | 0 | 0.0% |
| Science & Technology | 67 | 12.2% |
| Business | 175 | 31.9% |
| Education | 114 | 20.8% |
| Literature & Languages | 12 | 2.2% |
| Liberal Arts & History | 21 | 3.8% |
| Visual & Performing Arts | 47 | 8.6% |
| Communications | 0 | 0.0% |
| Arts & Humanities | 17 | 3.1% |
| Total | 548 | 100.0% |
Transportation & Commute in Brady
Vehicle Availability by Sex in Brady
The most prevalent vehicle ownership categories in Brady are males with 2 vehicles (443, accounting for 49.3%) and females with 2 vehicles (387, making up 37.5%).
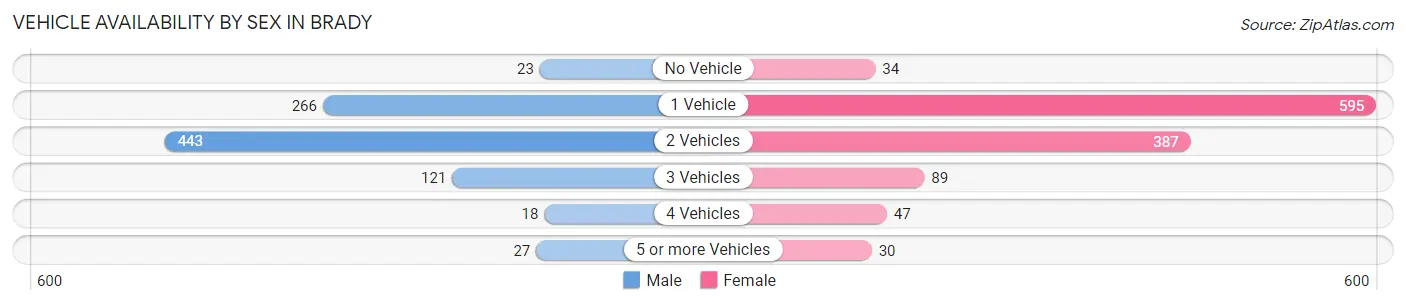
| Vehicles Available | Male | Female |
| No Vehicle | 23 (2.6%) | 34 (2.9%) |
| 1 Vehicle | 266 (29.6%) | 595 (50.3%) |
| 2 Vehicles | 443 (49.3%) | 387 (32.7%) |
| 3 Vehicles | 121 (13.5%) | 89 (7.5%) |
| 4 Vehicles | 18 (2.0%) | 47 (4.0%) |
| 5 or more Vehicles | 27 (3.0%) | 30 (2.5%) |
| Total | 898 (100.0%) | 1,182 (100.0%) |
Commute Time in Brady
The most frequently occuring commute durations in Brady are 5 to 9 minutes (655 commuters, 34.1%), less than 5 minutes (373 commuters, 19.4%), and 10 to 14 minutes (272 commuters, 14.2%).
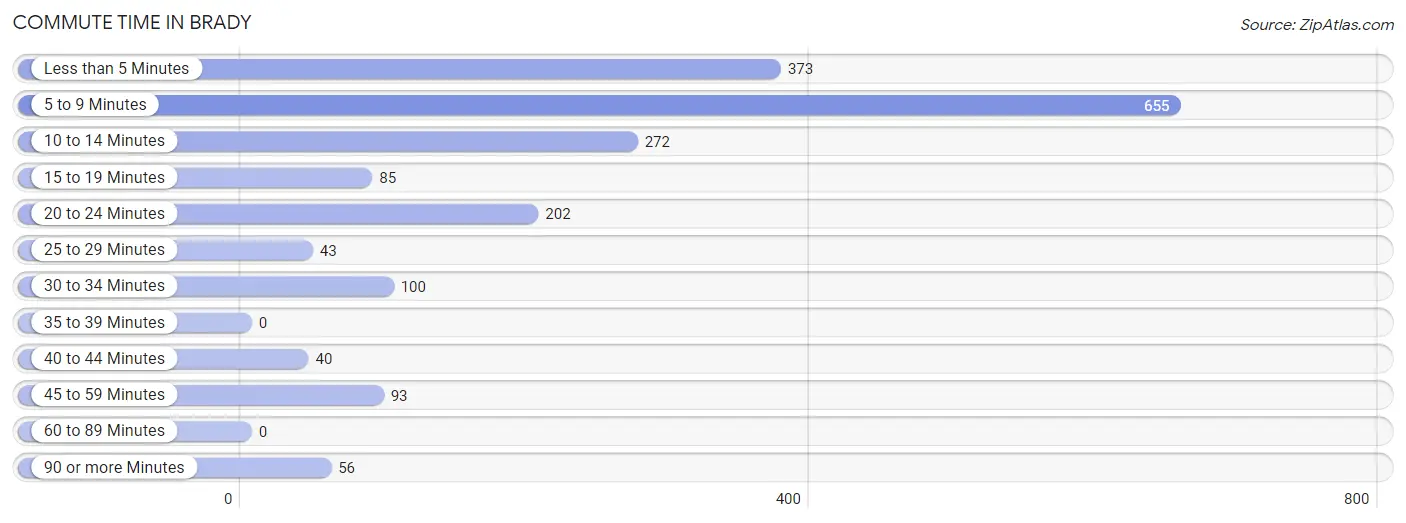
| Commute Time | # Commuters | % Commuters |
| Less than 5 Minutes | 373 | 19.4% |
| 5 to 9 Minutes | 655 | 34.1% |
| 10 to 14 Minutes | 272 | 14.2% |
| 15 to 19 Minutes | 85 | 4.4% |
| 20 to 24 Minutes | 202 | 10.5% |
| 25 to 29 Minutes | 43 | 2.2% |
| 30 to 34 Minutes | 100 | 5.2% |
| 35 to 39 Minutes | 0 | 0.0% |
| 40 to 44 Minutes | 40 | 2.1% |
| 45 to 59 Minutes | 93 | 4.9% |
| 60 to 89 Minutes | 0 | 0.0% |
| 90 or more Minutes | 56 | 2.9% |
Commute Time by Sex in Brady
The most common commute times in Brady are less than 5 minutes (194 commuters, 22.0%) for males and 5 to 9 minutes (481 commuters, 46.4%) for females.
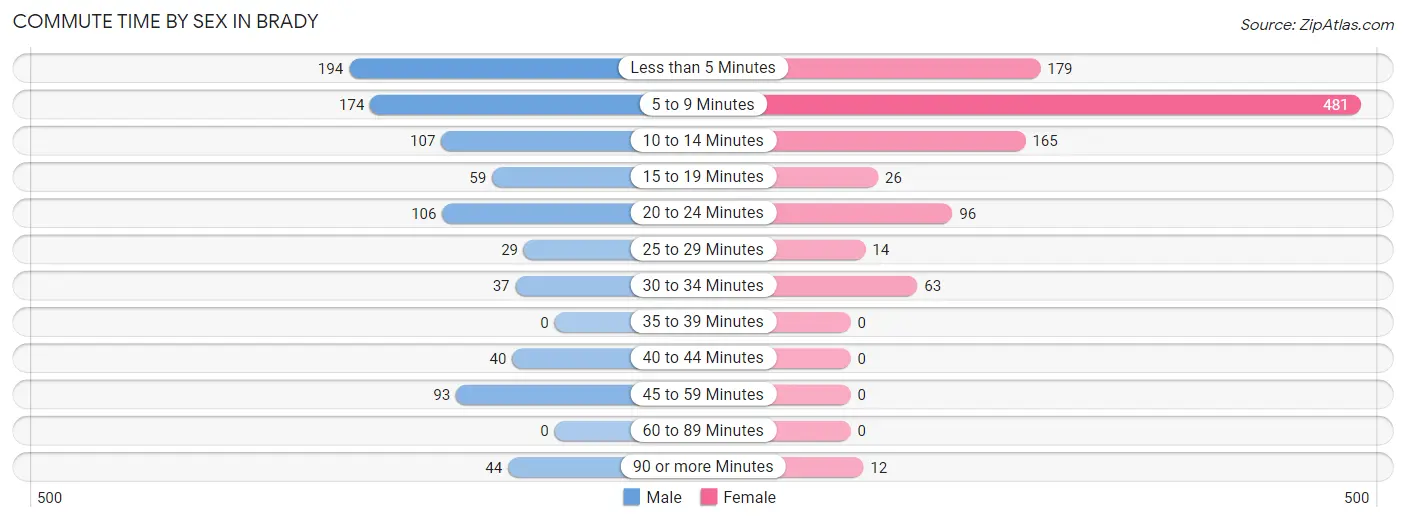
| Commute Time | Male | Female |
| Less than 5 Minutes | 194 (22.0%) | 179 (17.3%) |
| 5 to 9 Minutes | 174 (19.7%) | 481 (46.4%) |
| 10 to 14 Minutes | 107 (12.1%) | 165 (15.9%) |
| 15 to 19 Minutes | 59 (6.7%) | 26 (2.5%) |
| 20 to 24 Minutes | 106 (12.0%) | 96 (9.3%) |
| 25 to 29 Minutes | 29 (3.3%) | 14 (1.3%) |
| 30 to 34 Minutes | 37 (4.2%) | 63 (6.1%) |
| 35 to 39 Minutes | 0 (0.0%) | 0 (0.0%) |
| 40 to 44 Minutes | 40 (4.5%) | 0 (0.0%) |
| 45 to 59 Minutes | 93 (10.5%) | 0 (0.0%) |
| 60 to 89 Minutes | 0 (0.0%) | 0 (0.0%) |
| 90 or more Minutes | 44 (5.0%) | 12 (1.2%) |
Time of Departure to Work by Sex in Brady
The most frequent times of departure to work in Brady are 6:00 AM to 6:29 AM (293, 33.2%) for males and 7:30 AM to 7:59 AM (302, 29.1%) for females.
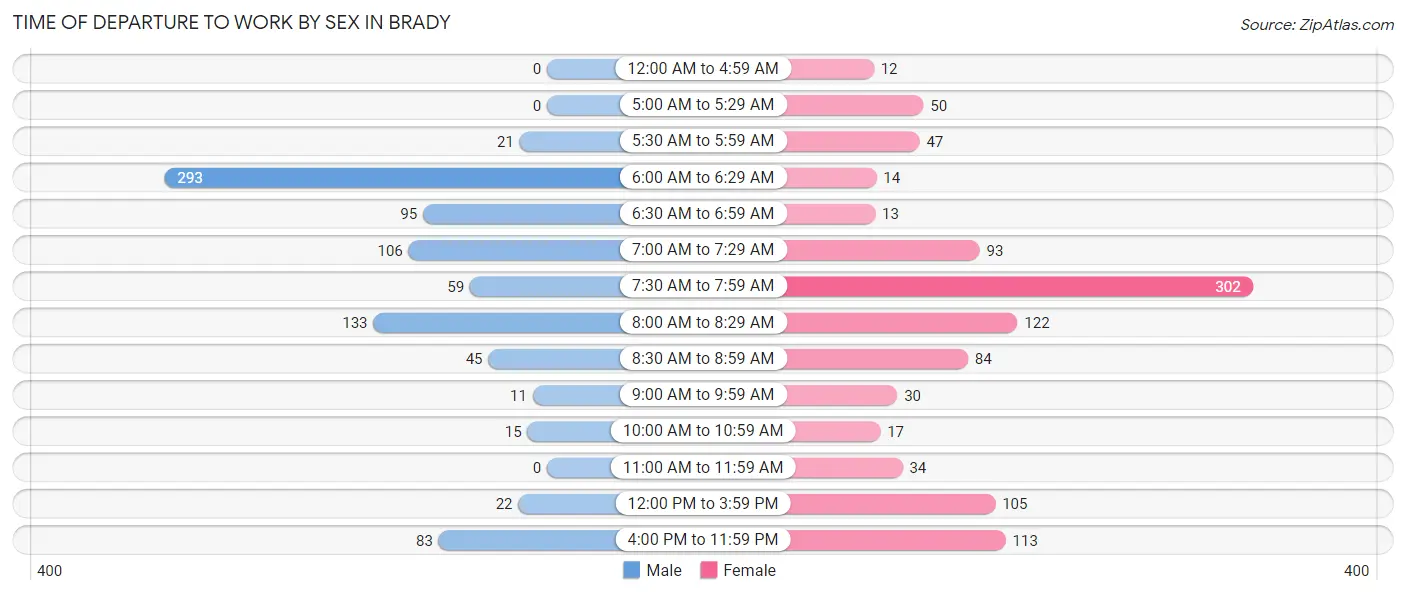
| Time of Departure | Male | Female |
| 12:00 AM to 4:59 AM | 0 (0.0%) | 12 (1.2%) |
| 5:00 AM to 5:29 AM | 0 (0.0%) | 50 (4.8%) |
| 5:30 AM to 5:59 AM | 21 (2.4%) | 47 (4.5%) |
| 6:00 AM to 6:29 AM | 293 (33.2%) | 14 (1.3%) |
| 6:30 AM to 6:59 AM | 95 (10.8%) | 13 (1.3%) |
| 7:00 AM to 7:29 AM | 106 (12.0%) | 93 (9.0%) |
| 7:30 AM to 7:59 AM | 59 (6.7%) | 302 (29.1%) |
| 8:00 AM to 8:29 AM | 133 (15.1%) | 122 (11.8%) |
| 8:30 AM to 8:59 AM | 45 (5.1%) | 84 (8.1%) |
| 9:00 AM to 9:59 AM | 11 (1.3%) | 30 (2.9%) |
| 10:00 AM to 10:59 AM | 15 (1.7%) | 17 (1.6%) |
| 11:00 AM to 11:59 AM | 0 (0.0%) | 34 (3.3%) |
| 12:00 PM to 3:59 PM | 22 (2.5%) | 105 (10.1%) |
| 4:00 PM to 11:59 PM | 83 (9.4%) | 113 (10.9%) |
| Total | 883 (100.0%) | 1,036 (100.0%) |
Housing Occupancy in Brady
Occupancy by Ownership in Brady
Of the total 2,107 dwellings in Brady, owner-occupied units account for 1,321 (62.7%), while renter-occupied units make up 786 (37.3%).
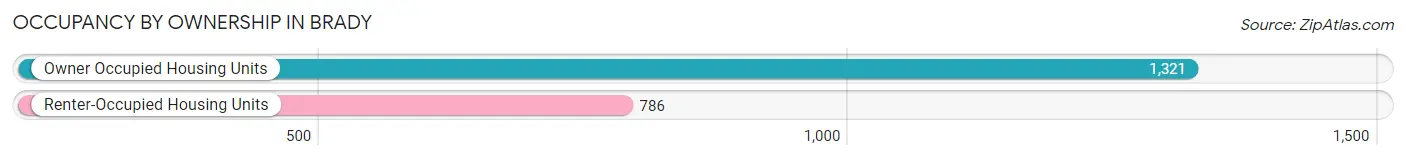
| Occupancy | # Housing Units | % Housing Units |
| Owner Occupied Housing Units | 1,321 | 62.7% |
| Renter-Occupied Housing Units | 786 | 37.3% |
| Total Occupied Housing Units | 2,107 | 100.0% |
Occupancy by Household Size in Brady
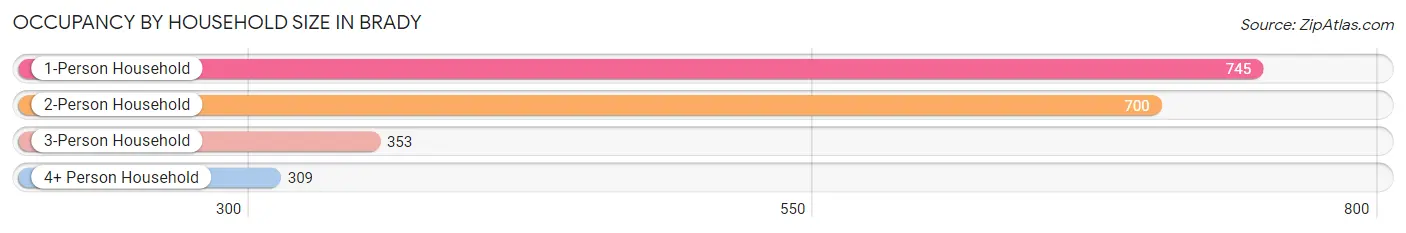
| Household Size | # Housing Units | % Housing Units |
| 1-Person Household | 745 | 35.4% |
| 2-Person Household | 700 | 33.2% |
| 3-Person Household | 353 | 16.8% |
| 4+ Person Household | 309 | 14.7% |
| Total Housing Units | 2,107 | 100.0% |
Occupancy by Ownership by Household Size in Brady
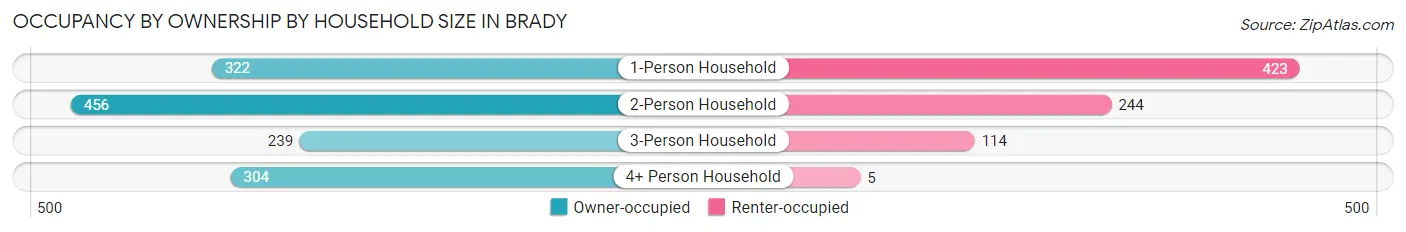
| Household Size | Owner-occupied | Renter-occupied |
| 1-Person Household | 322 (43.2%) | 423 (56.8%) |
| 2-Person Household | 456 (65.1%) | 244 (34.9%) |
| 3-Person Household | 239 (67.7%) | 114 (32.3%) |
| 4+ Person Household | 304 (98.4%) | 5 (1.6%) |
| Total Housing Units | 1,321 (62.7%) | 786 (37.3%) |
Occupancy by Educational Attainment in Brady
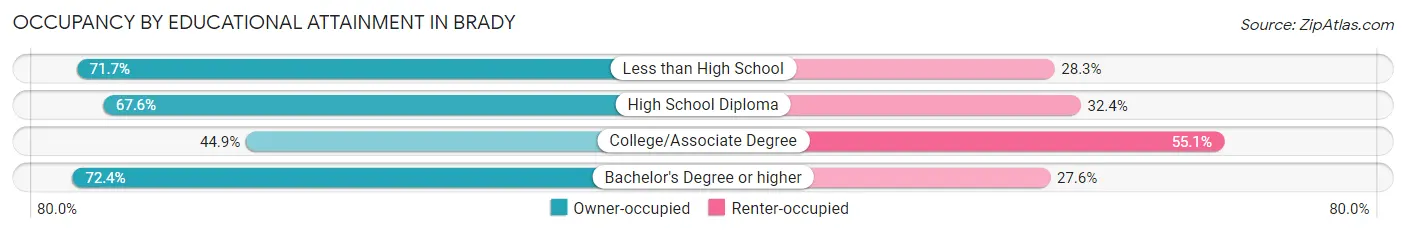
| Household Size | Owner-occupied | Renter-occupied |
| Less than High School | 363 (71.7%) | 143 (28.3%) |
| High School Diploma | 371 (67.6%) | 178 (32.4%) |
| College/Associate Degree | 285 (44.9%) | 350 (55.1%) |
| Bachelor's Degree or higher | 302 (72.4%) | 115 (27.6%) |
Occupancy by Age of Householder in Brady
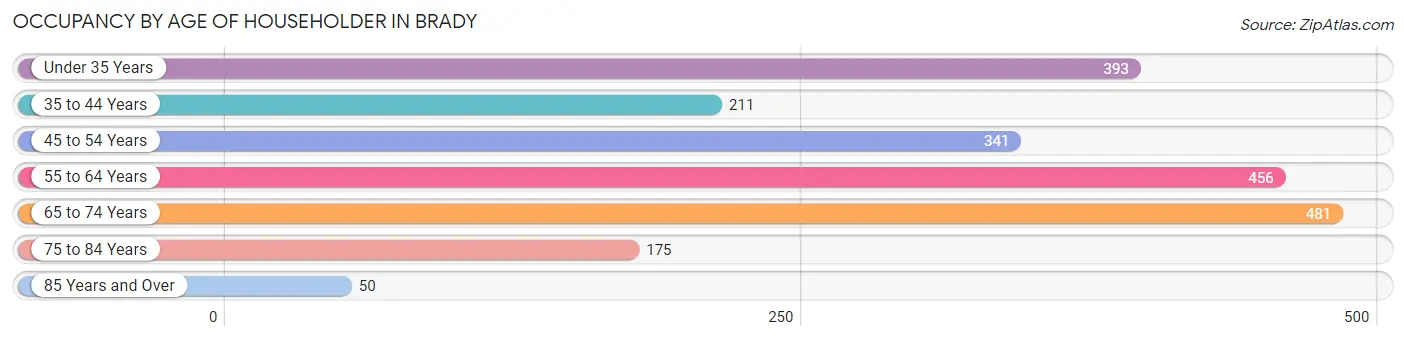
| Age Bracket | # Households | % Households |
| Under 35 Years | 393 | 18.6% |
| 35 to 44 Years | 211 | 10.0% |
| 45 to 54 Years | 341 | 16.2% |
| 55 to 64 Years | 456 | 21.6% |
| 65 to 74 Years | 481 | 22.8% |
| 75 to 84 Years | 175 | 8.3% |
| 85 Years and Over | 50 | 2.4% |
| Total | 2,107 | 100.0% |
Housing Finances in Brady
Median Income by Occupancy in Brady
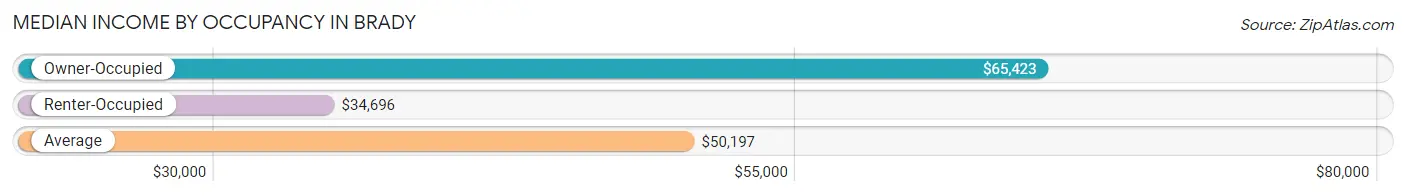
| Occupancy Type | # Households | Median Income |
| Owner-Occupied | 1,321 (62.7%) | $65,423 |
| Renter-Occupied | 786 (37.3%) | $34,696 |
| Average | 2,107 (100.0%) | $50,197 |
Occupancy by Householder Income Bracket in Brady
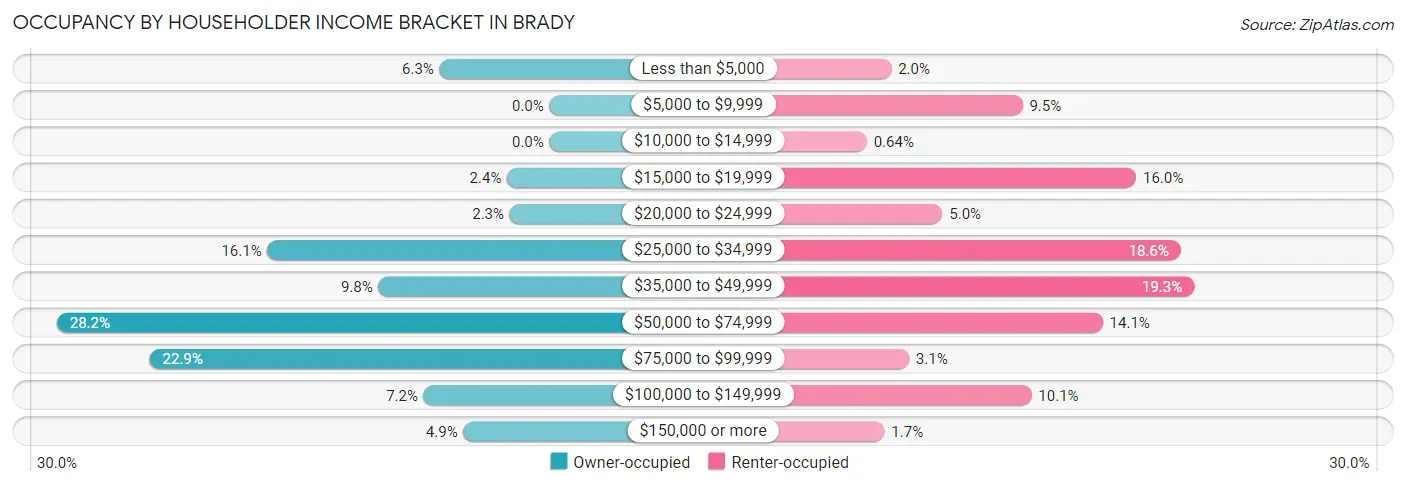
| Income Bracket | Owner-occupied | Renter-occupied |
| Less than $5,000 | 83 (6.3%) | 16 (2.0%) |
| $5,000 to $9,999 | 0 (0.0%) | 75 (9.5%) |
| $10,000 to $14,999 | 0 (0.0%) | 5 (0.6%) |
| $15,000 to $19,999 | 32 (2.4%) | 126 (16.0%) |
| $20,000 to $24,999 | 30 (2.3%) | 39 (5.0%) |
| $25,000 to $34,999 | 213 (16.1%) | 146 (18.6%) |
| $35,000 to $49,999 | 129 (9.8%) | 152 (19.3%) |
| $50,000 to $74,999 | 372 (28.2%) | 111 (14.1%) |
| $75,000 to $99,999 | 302 (22.9%) | 24 (3.0%) |
| $100,000 to $149,999 | 95 (7.2%) | 79 (10.1%) |
| $150,000 or more | 65 (4.9%) | 13 (1.7%) |
| Total | 1,321 (100.0%) | 786 (100.0%) |
Monthly Housing Cost Tiers in Brady
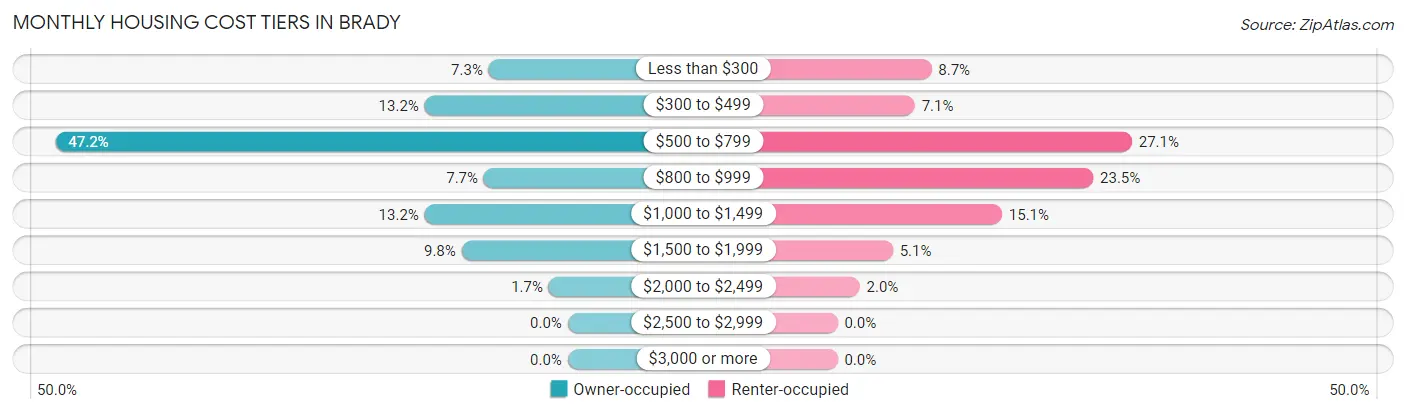
| Monthly Cost | Owner-occupied | Renter-occupied |
| Less than $300 | 96 (7.3%) | 68 (8.6%) |
| $300 to $499 | 174 (13.2%) | 56 (7.1%) |
| $500 to $799 | 623 (47.2%) | 213 (27.1%) |
| $800 to $999 | 102 (7.7%) | 185 (23.5%) |
| $1,000 to $1,499 | 174 (13.2%) | 119 (15.1%) |
| $1,500 to $1,999 | 129 (9.8%) | 40 (5.1%) |
| $2,000 to $2,499 | 23 (1.7%) | 16 (2.0%) |
| $2,500 to $2,999 | 0 (0.0%) | 0 (0.0%) |
| $3,000 or more | 0 (0.0%) | 0 (0.0%) |
| Total | 1,321 (100.0%) | 786 (100.0%) |
Physical Housing Characteristics in Brady
Housing Structures in Brady
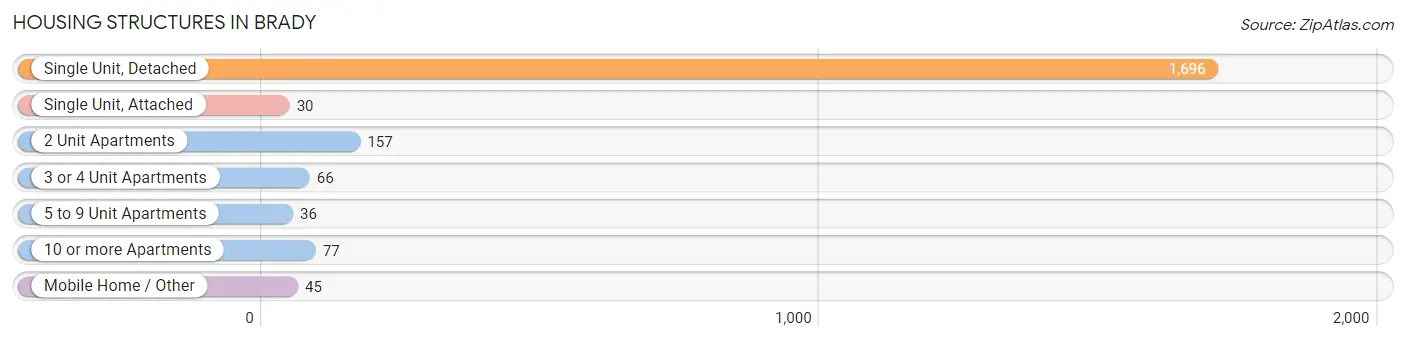
| Structure Type | # Housing Units | % Housing Units |
| Single Unit, Detached | 1,696 | 80.5% |
| Single Unit, Attached | 30 | 1.4% |
| 2 Unit Apartments | 157 | 7.4% |
| 3 or 4 Unit Apartments | 66 | 3.1% |
| 5 to 9 Unit Apartments | 36 | 1.7% |
| 10 or more Apartments | 77 | 3.6% |
| Mobile Home / Other | 45 | 2.1% |
| Total | 2,107 | 100.0% |
Housing Structures by Occupancy in Brady
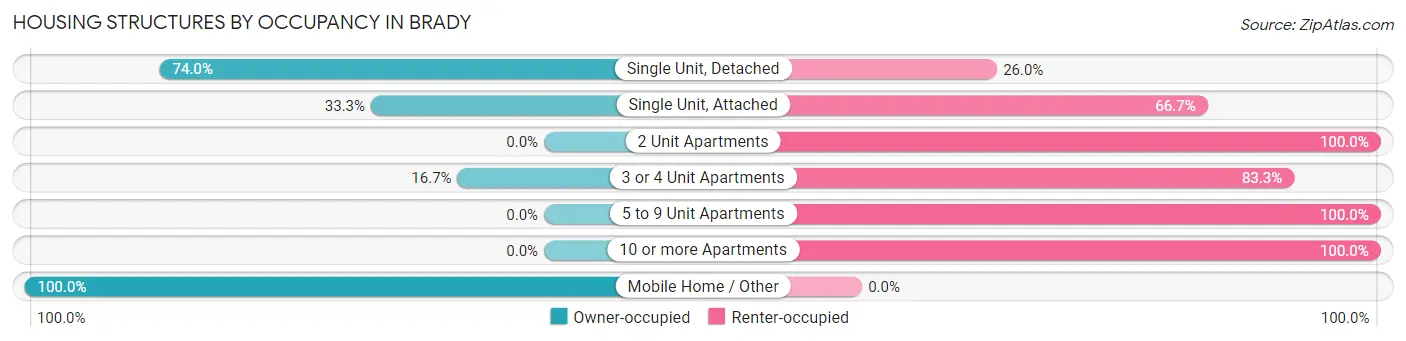
| Structure Type | Owner-occupied | Renter-occupied |
| Single Unit, Detached | 1,255 (74.0%) | 441 (26.0%) |
| Single Unit, Attached | 10 (33.3%) | 20 (66.7%) |
| 2 Unit Apartments | 0 (0.0%) | 157 (100.0%) |
| 3 or 4 Unit Apartments | 11 (16.7%) | 55 (83.3%) |
| 5 to 9 Unit Apartments | 0 (0.0%) | 36 (100.0%) |
| 10 or more Apartments | 0 (0.0%) | 77 (100.0%) |
| Mobile Home / Other | 45 (100.0%) | 0 (0.0%) |
| Total | 1,321 (62.7%) | 786 (37.3%) |
Housing Structures by Number of Rooms in Brady
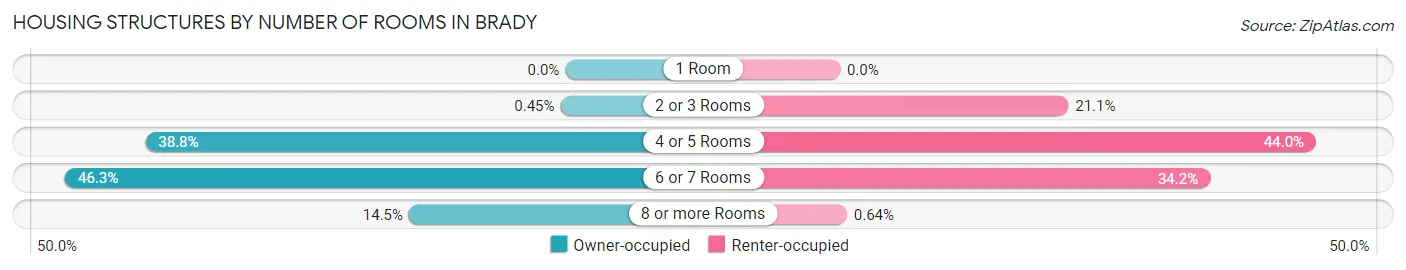
| Number of Rooms | Owner-occupied | Renter-occupied |
| 1 Room | 0 (0.0%) | 0 (0.0%) |
| 2 or 3 Rooms | 6 (0.4%) | 166 (21.1%) |
| 4 or 5 Rooms | 513 (38.8%) | 346 (44.0%) |
| 6 or 7 Rooms | 611 (46.3%) | 269 (34.2%) |
| 8 or more Rooms | 191 (14.5%) | 5 (0.6%) |
| Total | 1,321 (100.0%) | 786 (100.0%) |
Housing Structure by Heating Type in Brady
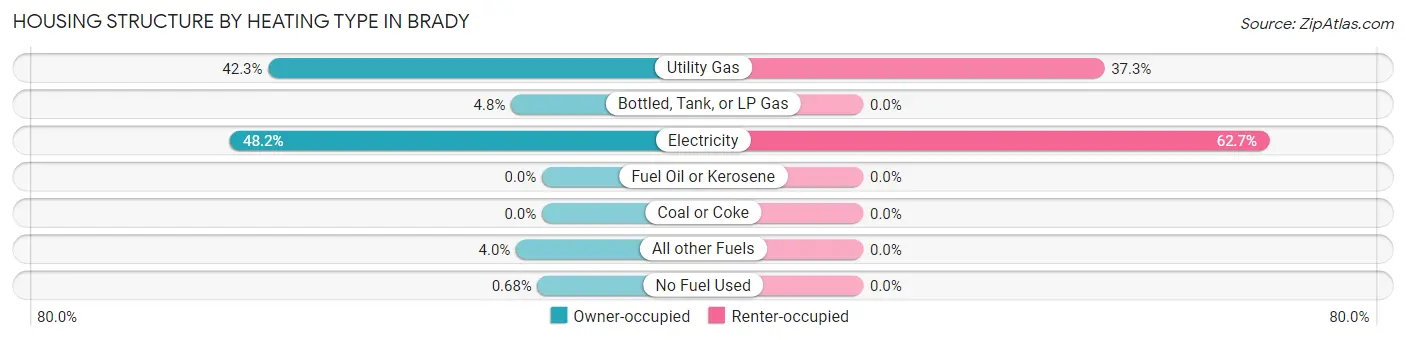
| Heating Type | Owner-occupied | Renter-occupied |
| Utility Gas | 559 (42.3%) | 293 (37.3%) |
| Bottled, Tank, or LP Gas | 63 (4.8%) | 0 (0.0%) |
| Electricity | 637 (48.2%) | 493 (62.7%) |
| Fuel Oil or Kerosene | 0 (0.0%) | 0 (0.0%) |
| Coal or Coke | 0 (0.0%) | 0 (0.0%) |
| All other Fuels | 53 (4.0%) | 0 (0.0%) |
| No Fuel Used | 9 (0.7%) | 0 (0.0%) |
| Total | 1,321 (100.0%) | 786 (100.0%) |
Household Vehicle Usage in Brady
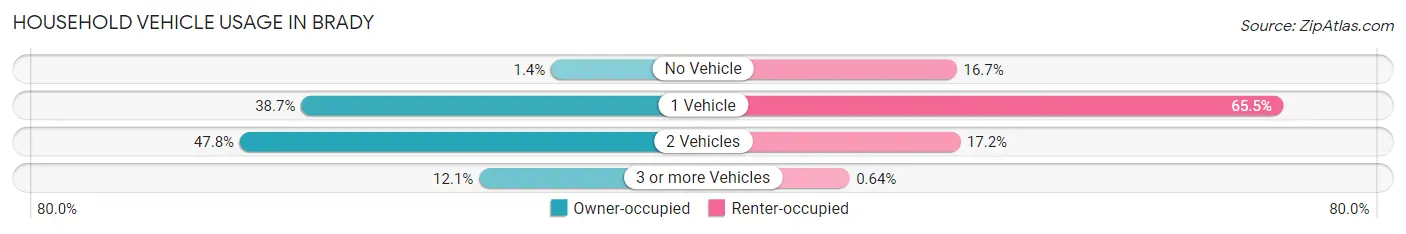
| Vehicles per Household | Owner-occupied | Renter-occupied |
| No Vehicle | 18 (1.4%) | 131 (16.7%) |
| 1 Vehicle | 511 (38.7%) | 515 (65.5%) |
| 2 Vehicles | 632 (47.8%) | 135 (17.2%) |
| 3 or more Vehicles | 160 (12.1%) | 5 (0.6%) |
| Total | 1,321 (100.0%) | 786 (100.0%) |
Real Estate & Mortgages in Brady
Real Estate and Mortgage Overview in Brady
| Characteristic | Without Mortgage | With Mortgage |
| Housing Units | 771 | 550 |
| Median Property Value | $81,900 | $107,900 |
| Median Household Income | $59,837 | $26 |
| Monthly Housing Costs | $570 | $0 |
| Real Estate Taxes | $945 | $17 |
Property Value by Mortgage Status in Brady
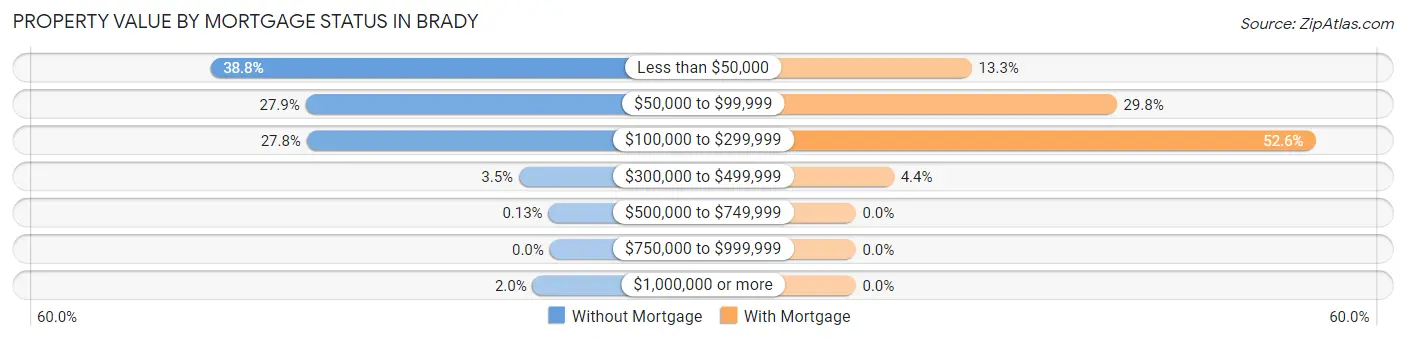
| Property Value | Without Mortgage | With Mortgage |
| Less than $50,000 | 299 (38.8%) | 73 (13.3%) |
| $50,000 to $99,999 | 215 (27.9%) | 164 (29.8%) |
| $100,000 to $299,999 | 214 (27.8%) | 289 (52.5%) |
| $300,000 to $499,999 | 27 (3.5%) | 24 (4.4%) |
| $500,000 to $749,999 | 1 (0.1%) | 0 (0.0%) |
| $750,000 to $999,999 | 0 (0.0%) | 0 (0.0%) |
| $1,000,000 or more | 15 (1.9%) | 0 (0.0%) |
| Total | 771 (100.0%) | 550 (100.0%) |
Household Income by Mortgage Status in Brady
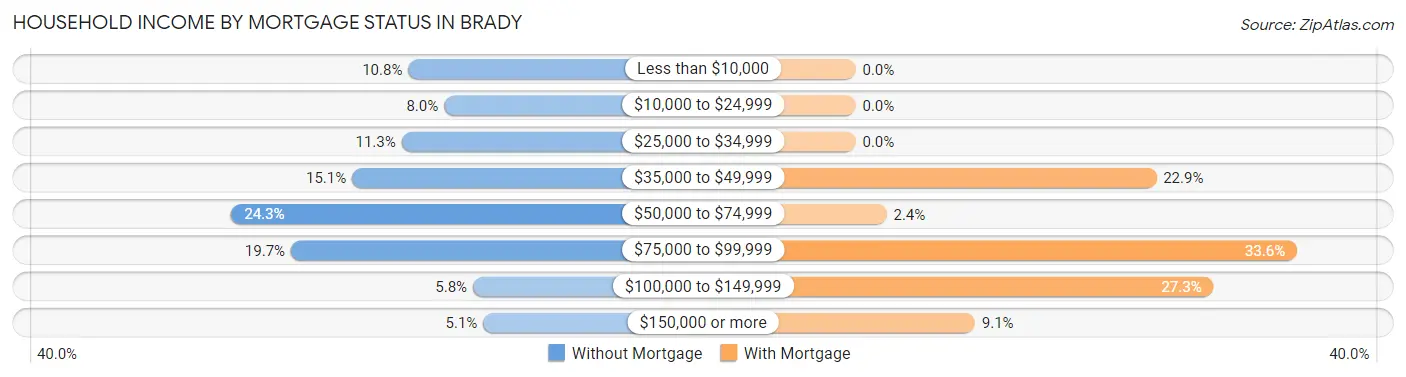
| Household Income | Without Mortgage | With Mortgage |
| Less than $10,000 | 83 (10.8%) | 0 (0.0%) |
| $10,000 to $24,999 | 62 (8.0%) | 0 (0.0%) |
| $25,000 to $34,999 | 87 (11.3%) | 0 (0.0%) |
| $35,000 to $49,999 | 116 (15.0%) | 126 (22.9%) |
| $50,000 to $74,999 | 187 (24.2%) | 13 (2.4%) |
| $75,000 to $99,999 | 152 (19.7%) | 185 (33.6%) |
| $100,000 to $149,999 | 45 (5.8%) | 150 (27.3%) |
| $150,000 or more | 39 (5.1%) | 50 (9.1%) |
| Total | 771 (100.0%) | 550 (100.0%) |
Property Value to Household Income Ratio in Brady
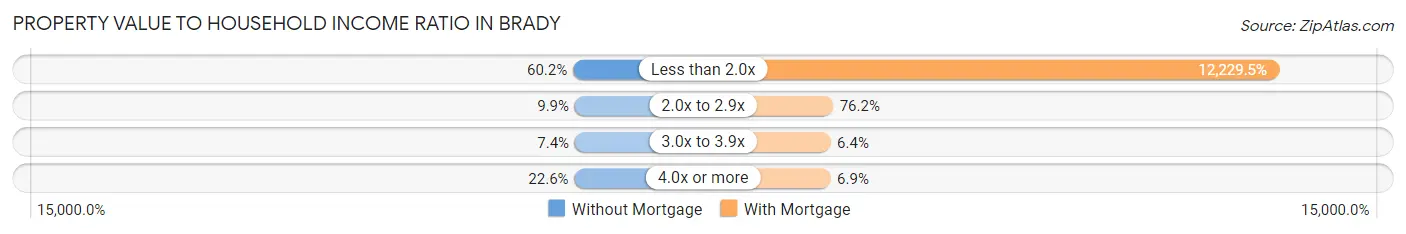
| Value-to-Income Ratio | Without Mortgage | With Mortgage |
| Less than 2.0x | 464 (60.2%) | 67,262 (12,229.4%) |
| 2.0x to 2.9x | 76 (9.9%) | 419 (76.2%) |
| 3.0x to 3.9x | 57 (7.4%) | 35 (6.4%) |
| 4.0x or more | 174 (22.6%) | 38 (6.9%) |
| Total | 771 (100.0%) | 550 (100.0%) |
Real Estate Taxes by Mortgage Status in Brady
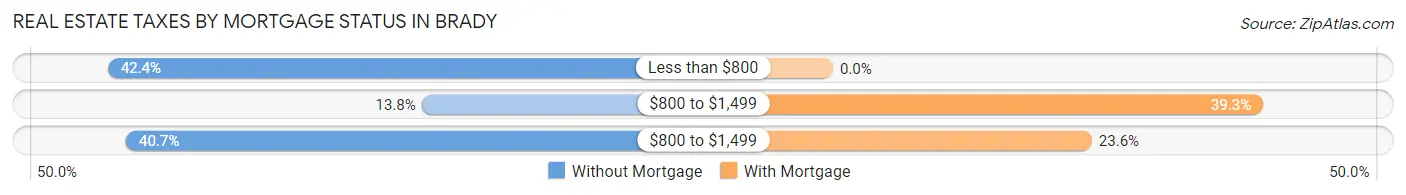
| Property Taxes | Without Mortgage | With Mortgage |
| Less than $800 | 327 (42.4%) | 0 (0.0%) |
| $800 to $1,499 | 106 (13.8%) | 216 (39.3%) |
| $800 to $1,499 | 314 (40.7%) | 130 (23.6%) |
| Total | 771 (100.0%) | 550 (100.0%) |
Health & Disability in Brady
Health Insurance Coverage by Age in Brady
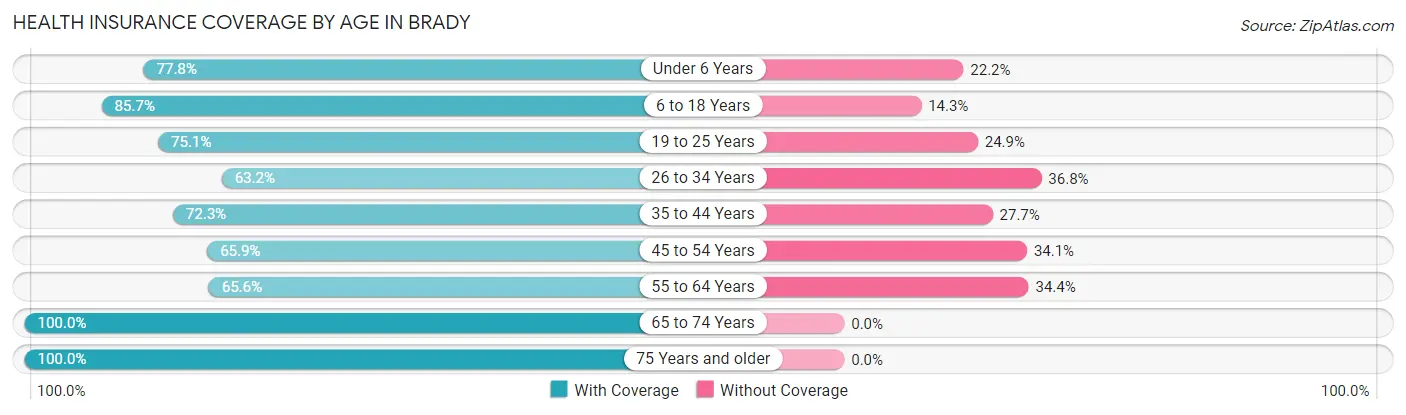
| Age Bracket | With Coverage | Without Coverage |
| Under 6 Years | 354 (77.8%) | 101 (22.2%) |
| 6 to 18 Years | 639 (85.7%) | 107 (14.3%) |
| 19 to 25 Years | 359 (75.1%) | 119 (24.9%) |
| 26 to 34 Years | 387 (63.2%) | 225 (36.8%) |
| 35 to 44 Years | 340 (72.3%) | 130 (27.7%) |
| 45 to 54 Years | 424 (65.9%) | 219 (34.1%) |
| 55 to 64 Years | 405 (65.6%) | 212 (34.4%) |
| 65 to 74 Years | 625 (100.0%) | 0 (0.0%) |
| 75 Years and older | 356 (100.0%) | 0 (0.0%) |
| Total | 3,889 (77.7%) | 1,113 (22.3%) |
Health Insurance Coverage by Citizenship Status in Brady
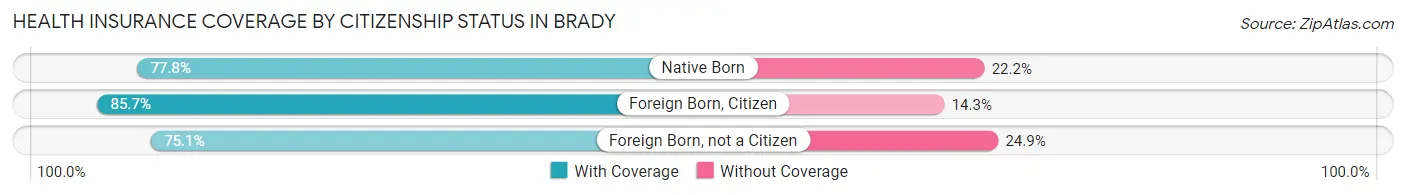
| Citizenship Status | With Coverage | Without Coverage |
| Native Born | 354 (77.8%) | 101 (22.2%) |
| Foreign Born, Citizen | 639 (85.7%) | 107 (14.3%) |
| Foreign Born, not a Citizen | 359 (75.1%) | 119 (24.9%) |
Health Insurance Coverage by Household Income in Brady
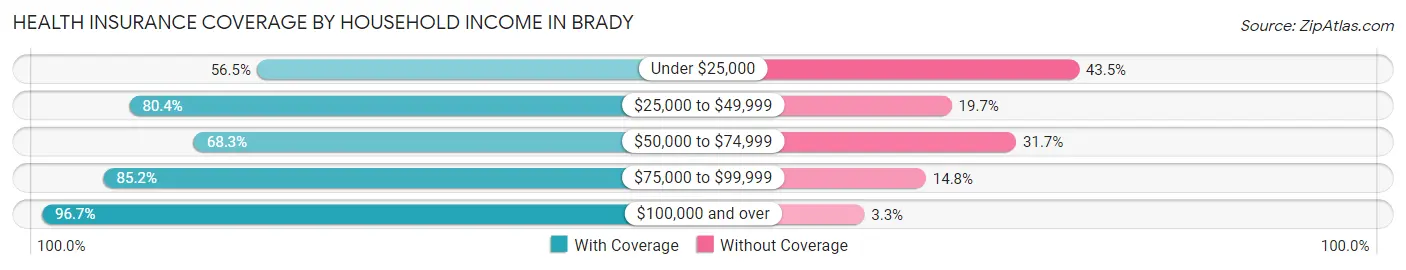
| Household Income | With Coverage | Without Coverage |
| Under $25,000 | 347 (56.5%) | 267 (43.5%) |
| $25,000 to $49,999 | 1,051 (80.3%) | 257 (19.7%) |
| $50,000 to $74,999 | 861 (68.3%) | 400 (31.7%) |
| $75,000 to $99,999 | 943 (85.2%) | 164 (14.8%) |
| $100,000 and over | 677 (96.7%) | 23 (3.3%) |
Public vs Private Health Insurance Coverage by Age in Brady
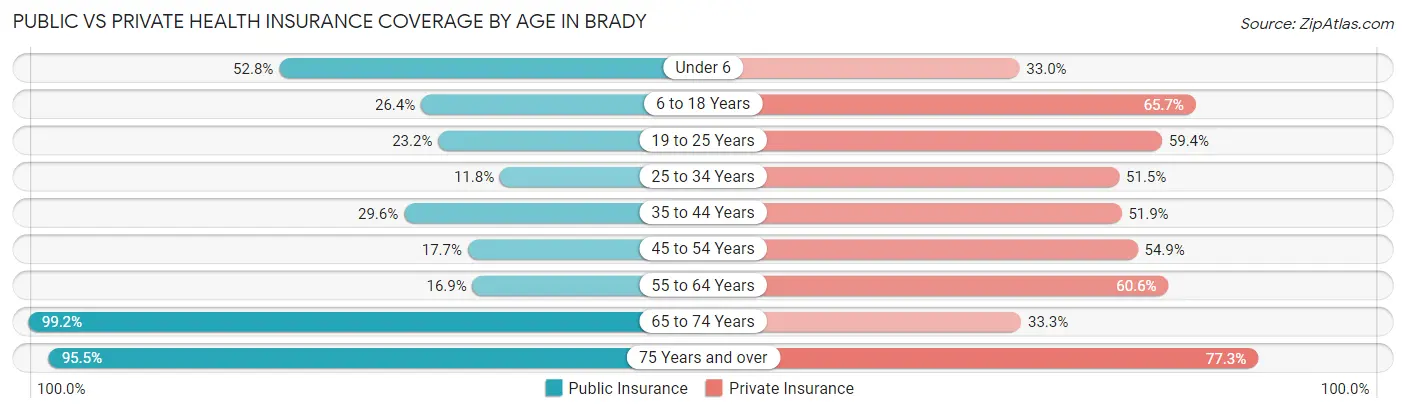
| Age Bracket | Public Insurance | Private Insurance |
| Under 6 | 240 (52.7%) | 150 (33.0%) |
| 6 to 18 Years | 197 (26.4%) | 490 (65.7%) |
| 19 to 25 Years | 111 (23.2%) | 284 (59.4%) |
| 25 to 34 Years | 72 (11.8%) | 315 (51.5%) |
| 35 to 44 Years | 139 (29.6%) | 244 (51.9%) |
| 45 to 54 Years | 114 (17.7%) | 353 (54.9%) |
| 55 to 64 Years | 104 (16.9%) | 374 (60.6%) |
| 65 to 74 Years | 620 (99.2%) | 208 (33.3%) |
| 75 Years and over | 340 (95.5%) | 275 (77.2%) |
| Total | 1,937 (38.7%) | 2,693 (53.8%) |
Disability Status by Sex by Age in Brady
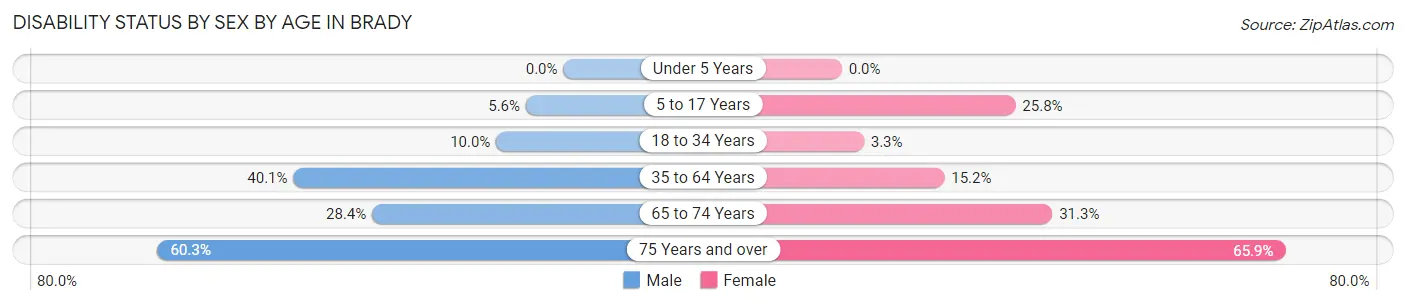
| Age Bracket | Male | Female |
| Under 5 Years | 0 (0.0%) | 0 (0.0%) |
| 5 to 17 Years | 28 (5.6%) | 74 (25.8%) |
| 18 to 34 Years | 58 (10.0%) | 17 (3.3%) |
| 35 to 64 Years | 346 (40.1%) | 132 (15.2%) |
| 65 to 74 Years | 73 (28.4%) | 115 (31.2%) |
| 75 Years and over | 91 (60.3%) | 135 (65.8%) |
Disability Class by Sex by Age in Brady
Disability Class: Hearing Difficulty
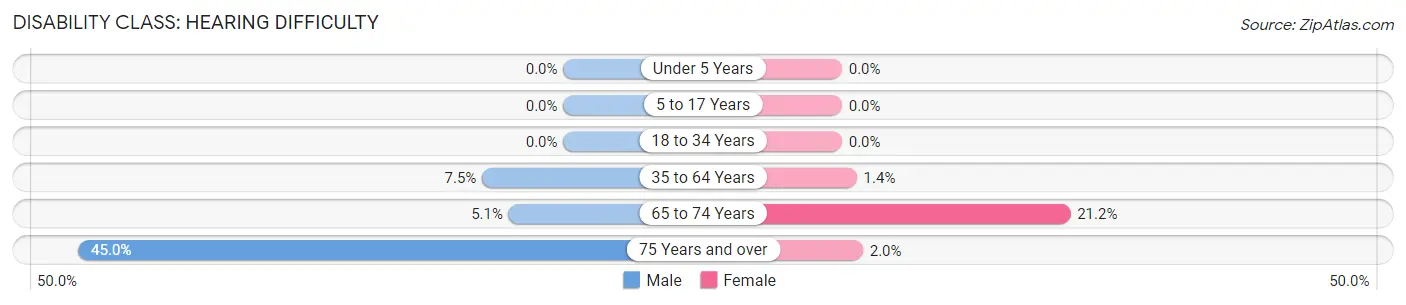
| Age Bracket | Male | Female |
| Under 5 Years | 0 (0.0%) | 0 (0.0%) |
| 5 to 17 Years | 0 (0.0%) | 0 (0.0%) |
| 18 to 34 Years | 0 (0.0%) | 0 (0.0%) |
| 35 to 64 Years | 65 (7.5%) | 12 (1.4%) |
| 65 to 74 Years | 13 (5.1%) | 78 (21.2%) |
| 75 Years and over | 68 (45.0%) | 4 (1.9%) |
Disability Class: Vision Difficulty
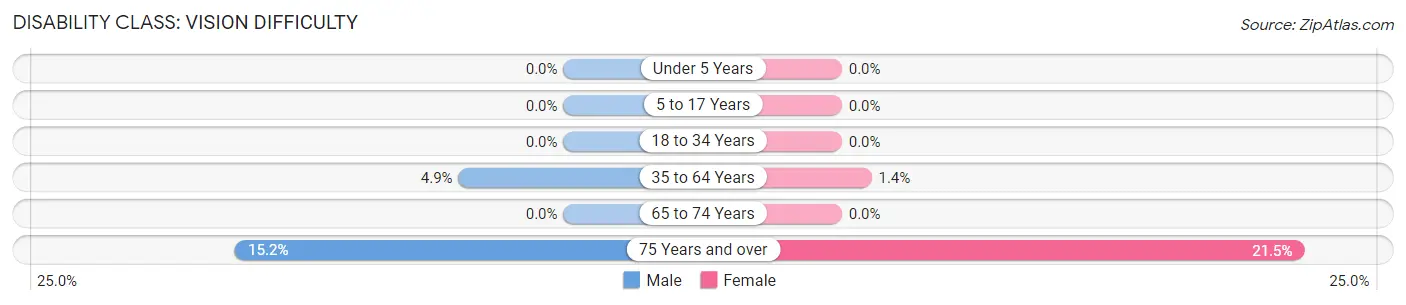
| Age Bracket | Male | Female |
| Under 5 Years | 0 (0.0%) | 0 (0.0%) |
| 5 to 17 Years | 0 (0.0%) | 0 (0.0%) |
| 18 to 34 Years | 0 (0.0%) | 0 (0.0%) |
| 35 to 64 Years | 42 (4.9%) | 12 (1.4%) |
| 65 to 74 Years | 0 (0.0%) | 0 (0.0%) |
| 75 Years and over | 23 (15.2%) | 44 (21.5%) |
Disability Class: Cognitive Difficulty
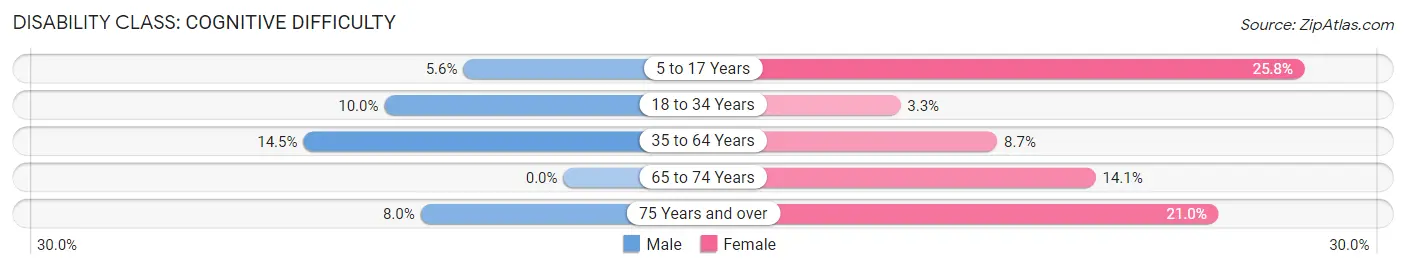
| Age Bracket | Male | Female |
| 5 to 17 Years | 28 (5.6%) | 74 (25.8%) |
| 18 to 34 Years | 58 (10.0%) | 17 (3.3%) |
| 35 to 64 Years | 125 (14.5%) | 75 (8.6%) |
| 65 to 74 Years | 0 (0.0%) | 52 (14.1%) |
| 75 Years and over | 12 (8.0%) | 43 (21.0%) |
Disability Class: Ambulatory Difficulty
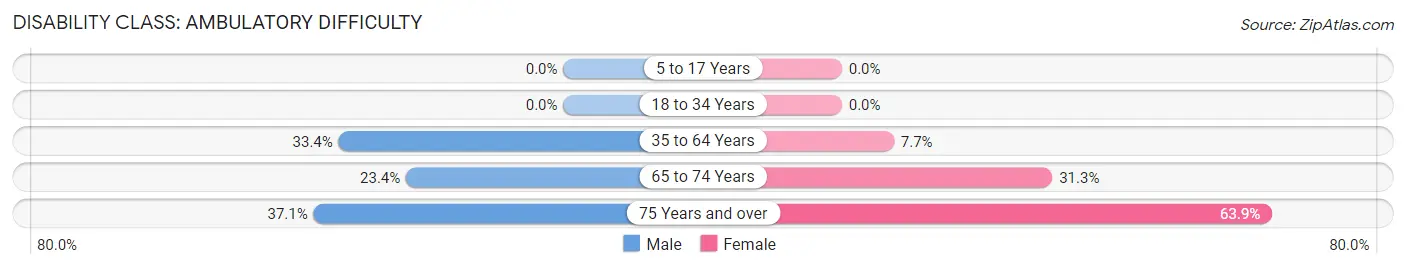
| Age Bracket | Male | Female |
| 5 to 17 Years | 0 (0.0%) | 0 (0.0%) |
| 18 to 34 Years | 0 (0.0%) | 0 (0.0%) |
| 35 to 64 Years | 288 (33.4%) | 67 (7.7%) |
| 65 to 74 Years | 60 (23.4%) | 115 (31.2%) |
| 75 Years and over | 56 (37.1%) | 131 (63.9%) |
Disability Class: Self-Care Difficulty
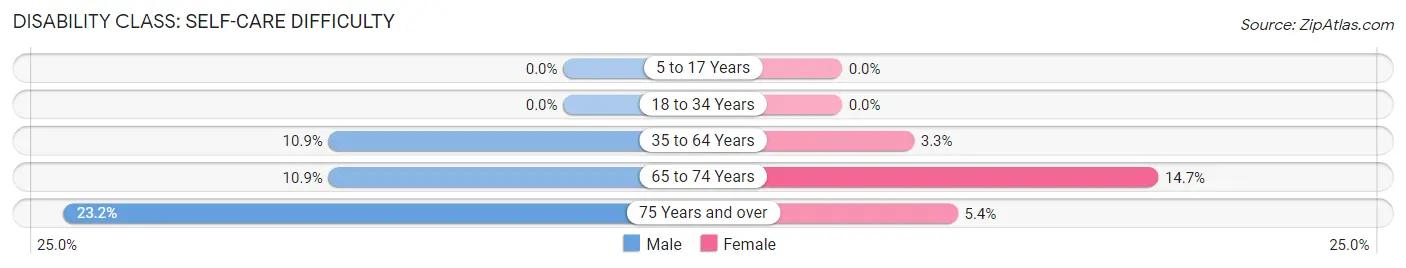
| Age Bracket | Male | Female |
| 5 to 17 Years | 0 (0.0%) | 0 (0.0%) |
| 18 to 34 Years | 0 (0.0%) | 0 (0.0%) |
| 35 to 64 Years | 94 (10.9%) | 29 (3.3%) |
| 65 to 74 Years | 28 (10.9%) | 54 (14.7%) |
| 75 Years and over | 35 (23.2%) | 11 (5.4%) |
Technology Access in Brady
Computing Device Access in Brady
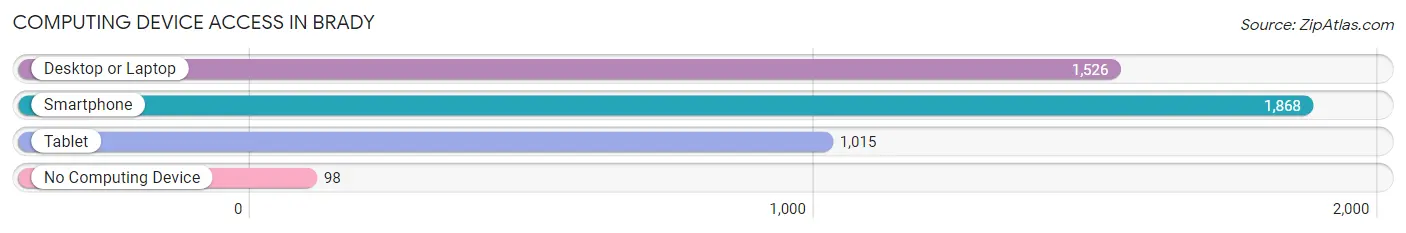
| Device Type | # Households | % Households |
| Desktop or Laptop | 1,526 | 72.4% |
| Smartphone | 1,868 | 88.7% |
| Tablet | 1,015 | 48.2% |
| No Computing Device | 98 | 4.6% |
| Total | 2,107 | 100.0% |
Internet Access in Brady
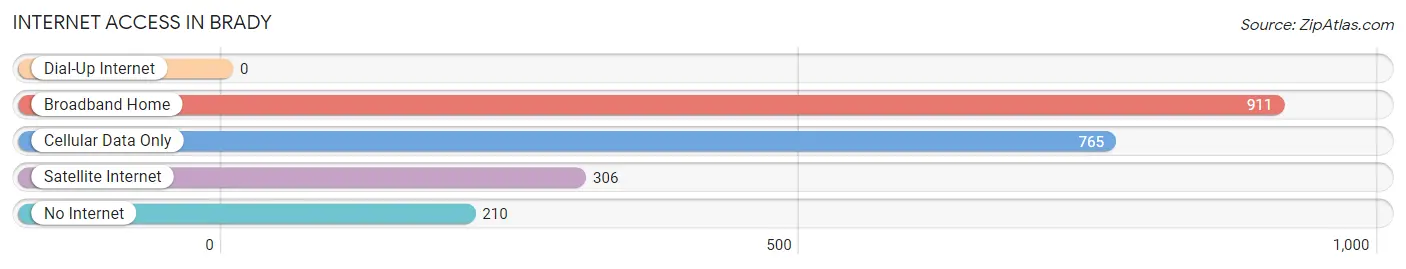
| Internet Type | # Households | % Households |
| Dial-Up Internet | 0 | 0.0% |
| Broadband Home | 911 | 43.2% |
| Cellular Data Only | 765 | 36.3% |
| Satellite Internet | 306 | 14.5% |
| No Internet | 210 | 10.0% |
| Total | 2,107 | 100.0% |
Brady Summary
Brady, Texas is a small city located in McCulloch County in the Central Texas region of the United States. It is the county seat of McCulloch County and is located approximately 120 miles northwest of Austin. The city has a population of 5,528 as of the 2010 census, making it the largest city in McCulloch County.
History
The area that is now Brady was first settled in the late 1850s by ranchers and farmers. The town was originally known as Brady's Switch, named after rancher and storekeeper William A. Brady. In 1876, the town was officially incorporated and the name was changed to Brady.
In the early 1900s, Brady experienced a period of growth and development. The town was connected to the outside world by the San Antonio and Aransas Pass Railway in 1906. This allowed for the transportation of goods and services to and from Brady. The town also experienced a population boom, with the population increasing from 1,000 in 1910 to 3,000 in 1920.
In the 1930s, Brady was hit hard by the Great Depression. The population decreased to 2,000 and many businesses closed. However, the town was able to recover and by 1940 the population had increased to 3,000.
In the 1950s, Brady experienced a period of growth and development. The town was connected to the outside world by the San Antonio and Aransas Pass Railway in 1906. This allowed for the transportation of goods and services to and from Brady. The town also experienced a population boom, with the population increasing from 1,000 in 1910 to 3,000 in 1920.
In the 1960s, Brady experienced a period of growth and development. The town was connected to the outside world by the San Antonio and Aransas Pass Railway in 1906. This allowed for the transportation of goods and services to and from Brady. The town also experienced a population boom, with the population increasing from 1,000 in 1910 to 3,000 in 1920.
In the 1970s, Brady experienced a period of growth and development. The town was connected to the outside world by the San Antonio and Aransas Pass Railway in 1906. This allowed for the transportation of goods and services to and from Brady. The town also experienced a population boom, with the population increasing from 1,000 in 1910 to 3,000 in 1920.
In the 1980s, Brady experienced a period of growth and development. The town was connected to the outside world by the San Antonio and Aransas Pass Railway in 1906. This allowed for the transportation of goods and services to and from Brady. The town also experienced a population boom, with the population increasing from 1,000 in 1910 to 3,000 in 1920.
Geography
Brady is located in Central Texas, approximately 120 miles northwest of Austin. The city is situated in the Hill Country region of Texas, with rolling hills and limestone outcroppings. The city is located at the intersection of U.S. Highway 87 and State Highway 71.
The climate in Brady is semi-arid, with hot summers and mild winters. The average temperature in the summer is around 90 degrees Fahrenheit, while the average temperature in the winter is around 50 degrees Fahrenheit.
Economy
The economy of Brady is largely based on agriculture and tourism. The city is home to several large ranches and farms, which produce a variety of crops and livestock. The city is also home to several tourist attractions, including the McCulloch County Historical Museum, the Brady Lake Park, and the Heart of Texas Country Music Museum.
The city is also home to several manufacturing and industrial businesses, including a cement plant, a plastics plant, and a food processing plant. The city is also home to several retail businesses, including several restaurants, grocery stores, and clothing stores.
Demographics
As of the 2010 census, the population of Brady was 5,528. The racial makeup of the city was 79.3% White, 0.7% African American, 0.4% Native American, 0.2% Asian, 0.1% Pacific Islander, 17.3% from other races, and 2.0% from two or more races. Hispanic or Latino of any race were 33.2% of the population.
The median household income in Brady was $30,938, and the median family income was $36,944. The per capita income in Brady was $17,845. About 18.2% of families and 22.2% of the population were below the poverty line, including 28.3% of those under age 18 and 16.2% of those age 65 or over.
Common Questions
What is Per Capita Income in Brady?
Per Capita income in Brady is $25,839.
What is the Median Family Income in Brady?
Median Family Income in Brady is $63,875.
What is the Median Household income in Brady?
Median Household Income in Brady is $50,197.
What is Income or Wage Gap in Brady?
Income or Wage Gap in Brady is 26.0%.
Women in Brady earn 74.0 cents for every dollar earned by a man.
What is Inequality or Gini Index in Brady?
Inequality or Gini Index in Brady is 0.42.
What is the Total Population of Brady?
Total Population of Brady is 5,129.
What is the Total Male Population of Brady?
Total Male Population of Brady is 2,657.
What is the Total Female Population of Brady?
Total Female Population of Brady is 2,472.
What is the Ratio of Males per 100 Females in Brady?
There are 107.48 Males per 100 Females in Brady.
What is the Ratio of Females per 100 Males in Brady?
There are 93.04 Females per 100 Males in Brady.
What is the Median Population Age in Brady?
Median Population Age in Brady is 38.5 Years.
What is the Average Family Size in Brady
Average Family Size in Brady is 3.0 People.
What is the Average Household Size in Brady
Average Household Size in Brady is 2.4 People.
How Large is the Labor Force in Brady?
There are 2,421 People in the Labor Forcein in Brady.
What is the Percentage of People in the Labor Force in Brady?
59.3% of People are in the Labor Force in Brady.
What is the Unemployment Rate in Brady?
Unemployment Rate in Brady is 10.5%.