Boling, TX Map & Demographics
Boling Map
Boling Overview
$27,143
PER CAPITA INCOME
$43,750
AVG HOUSEHOLD INCOME
0.44
INEQUALITY / GINI INDEX
1,044
TOTAL POPULATION
624
MALE POPULATION
420
FEMALE POPULATION
148.57
MALES / 100 FEMALES
67.31
FEMALES / 100 MALES
32.2
MEDIAN AGE
4.6
AVG FAMILY SIZE
2.8
AVG HOUSEHOLD SIZE
549
LABOR FORCE [ PEOPLE ]
63.9%
PERCENT IN LABOR FORCE
14.6%
UNEMPLOYMENT RATE
Boling Zip Codes
Boling Area Codes
Income in Boling
Income Overview in Boling
| Characteristic | Number | Measure |
| Per Capita Income | 1,044 | $27,143 |
| Median Family Income | 185 | $0 |
| Mean Family Income | 185 | $90,763 |
| Median Household Income | 372 | $43,750 |
| Mean Household Income | 372 | $67,066 |
| Income Deficit | 185 | $0 |
| Wage / Income Gap (%) | 1,044 | 0.00% |
| Wage / Income Gap ($) | 1,044 | 100.00¢ per $1 |
| Gini / Inequality Index | 1,044 | 0.44 |
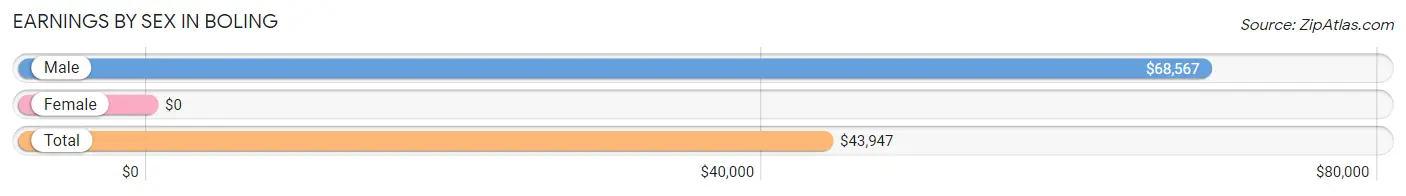
Earnings by Sex in Boling
| Sex | Number | Average Earnings |
| Male | 283 (59.2%) | $68,567 |
| Female | 195 (40.8%) | $0 |
| Total | 478 (100.0%) | $43,947 |
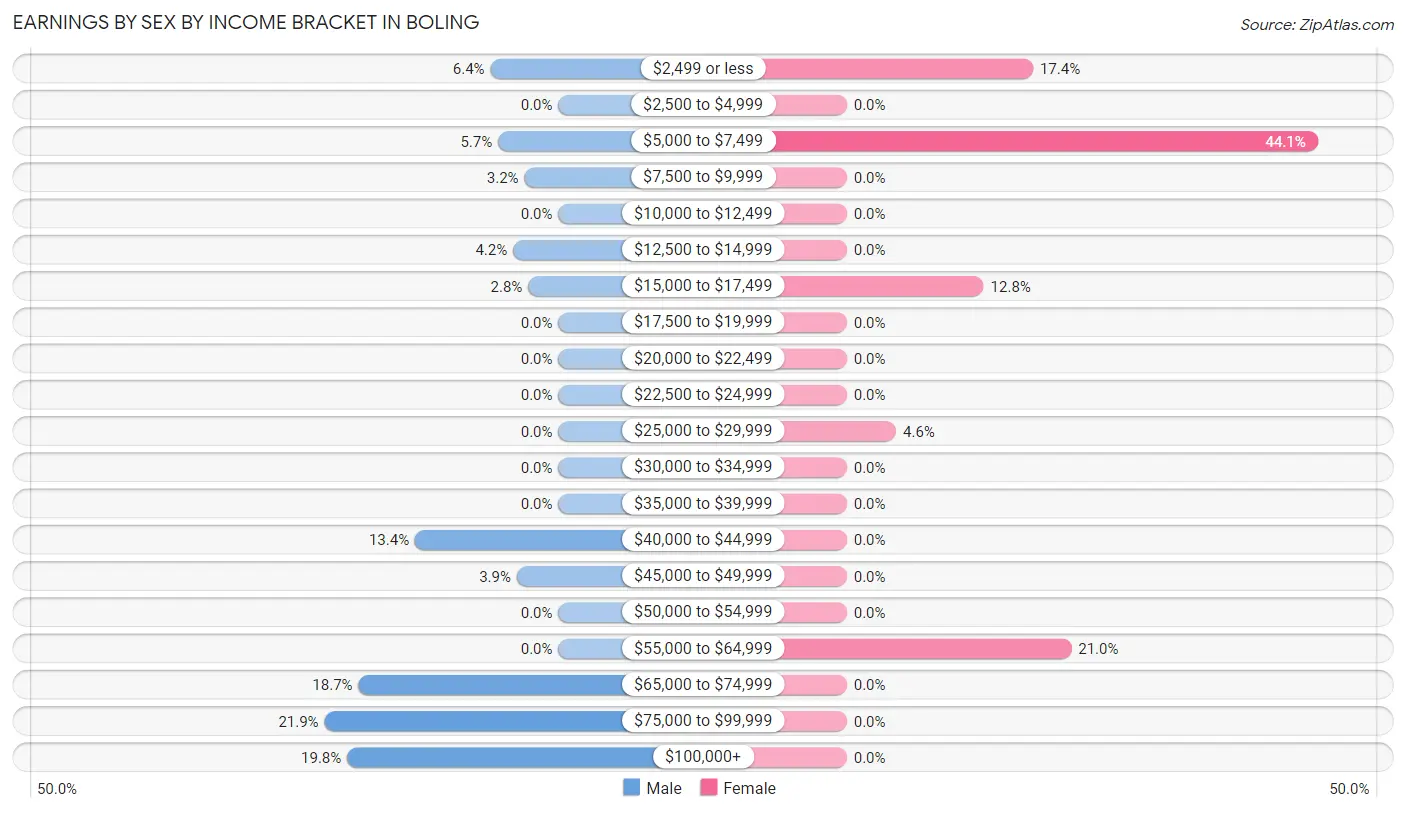
Earnings by Sex by Income Bracket in Boling
The most common earnings brackets in Boling are $75,000 to $99,999 for men (62 | 21.9%) and $5,000 to $7,499 for women (86 | 44.1%).
| Income | Male | Female |
| $2,499 or less | 18 (6.4%) | 34 (17.4%) |
| $2,500 to $4,999 | 0 (0.0%) | 0 (0.0%) |
| $5,000 to $7,499 | 16 (5.7%) | 86 (44.1%) |
| $7,500 to $9,999 | 9 (3.2%) | 0 (0.0%) |
| $10,000 to $12,499 | 0 (0.0%) | 0 (0.0%) |
| $12,500 to $14,999 | 12 (4.2%) | 0 (0.0%) |
| $15,000 to $17,499 | 8 (2.8%) | 25 (12.8%) |
| $17,500 to $19,999 | 0 (0.0%) | 0 (0.0%) |
| $20,000 to $22,499 | 0 (0.0%) | 0 (0.0%) |
| $22,500 to $24,999 | 0 (0.0%) | 0 (0.0%) |
| $25,000 to $29,999 | 0 (0.0%) | 9 (4.6%) |
| $30,000 to $34,999 | 0 (0.0%) | 0 (0.0%) |
| $35,000 to $39,999 | 0 (0.0%) | 0 (0.0%) |
| $40,000 to $44,999 | 38 (13.4%) | 0 (0.0%) |
| $45,000 to $49,999 | 11 (3.9%) | 0 (0.0%) |
| $50,000 to $54,999 | 0 (0.0%) | 0 (0.0%) |
| $55,000 to $64,999 | 0 (0.0%) | 41 (21.0%) |
| $65,000 to $74,999 | 53 (18.7%) | 0 (0.0%) |
| $75,000 to $99,999 | 62 (21.9%) | 0 (0.0%) |
| $100,000+ | 56 (19.8%) | 0 (0.0%) |
| Total | 283 (100.0%) | 195 (100.0%) |
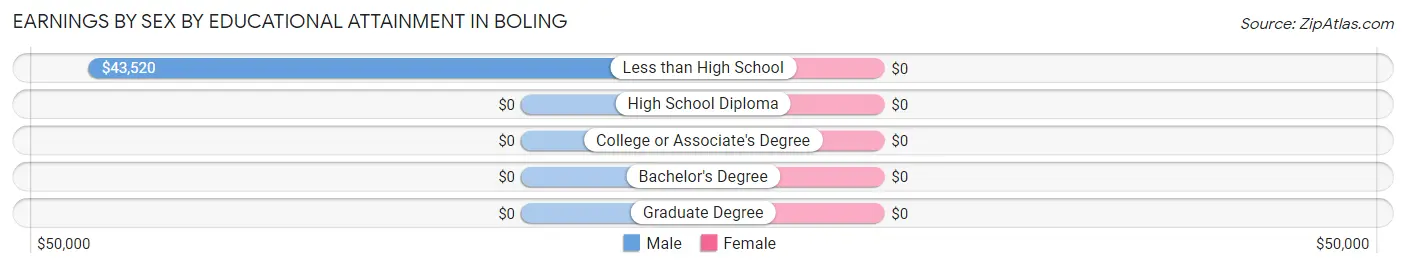
Earnings by Sex by Educational Attainment in Boling
| Educational Attainment | Male Income | Female Income |
| Less than High School | $43,520 | $0 |
| High School Diploma | - | - |
| College or Associate's Degree | - | - |
| Bachelor's Degree | - | - |
| Graduate Degree | - | - |
| Total | $68,567 | $60,701 |
Family Income in Boling
Family Income Brackets in Boling
According to the Boling family income data, there are 81 families falling into the $100,000 to $149,999 income range, which is the most common income bracket and makes up 43.8% of all families.
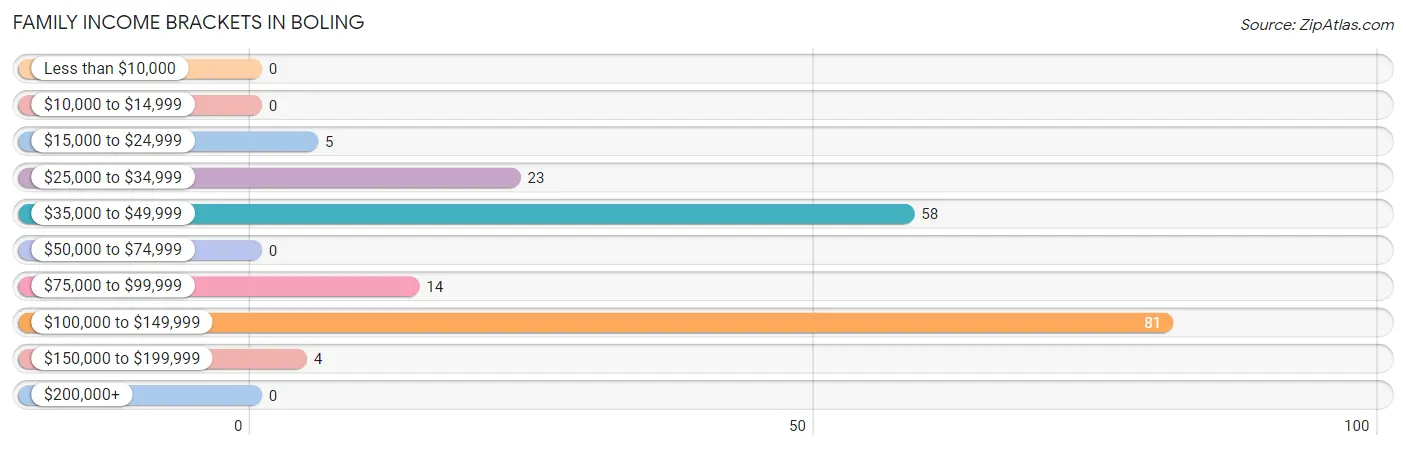
| Income Bracket | # Families | % Families |
| Less than $10,000 | 0 | 0.0% |
| $10,000 to $14,999 | 0 | 0.0% |
| $15,000 to $24,999 | 5 | 2.7% |
| $25,000 to $34,999 | 23 | 12.4% |
| $35,000 to $49,999 | 58 | 31.4% |
| $50,000 to $74,999 | 0 | 0.0% |
| $75,000 to $99,999 | 14 | 7.6% |
| $100,000 to $149,999 | 81 | 43.8% |
| $150,000 to $199,999 | 4 | 2.2% |
| $200,000+ | 0 | 0.0% |
Family Income by Famaliy Size in Boling
| Income Bracket | # Families | Median Income |
| 2-Person Families | 78 (42.2%) | $0 |
| 3-Person Families | 9 (4.9%) | $0 |
| 4-Person Families | 6 (3.2%) | $0 |
| 5-Person Families | 81 (43.8%) | $0 |
| 6-Person Families | 11 (5.9%) | $0 |
| 7+ Person Families | 0 (0.0%) | $0 |
| Total | 185 (100.0%) | $0 |
Family Income by Number of Earners in Boling
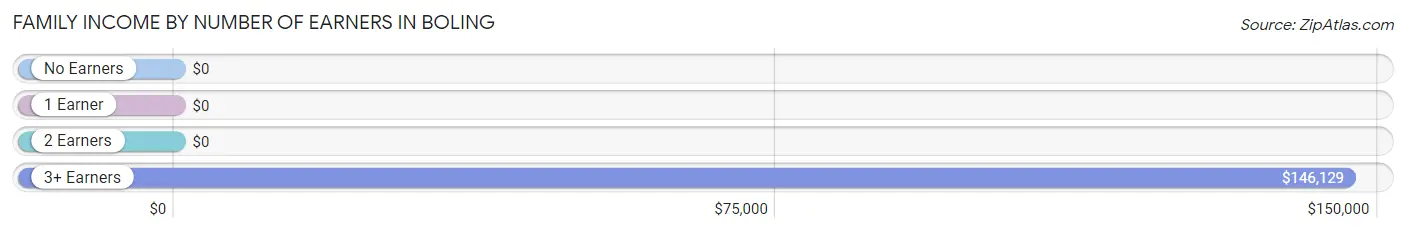
| Number of Earners | # Families | Median Income |
| No Earners | 16 (8.6%) | $0 |
| 1 Earner | 94 (50.8%) | $0 |
| 2 Earners | 23 (12.4%) | $0 |
| 3+ Earners | 52 (28.1%) | $146,129 |
| Total | 185 (100.0%) | $0 |
Household Income in Boling
Household Income Brackets in Boling
With 130 households falling in the category, the $100,000 to $149,999 income range is the most frequent in Boling, accounting for 34.9% of all households.
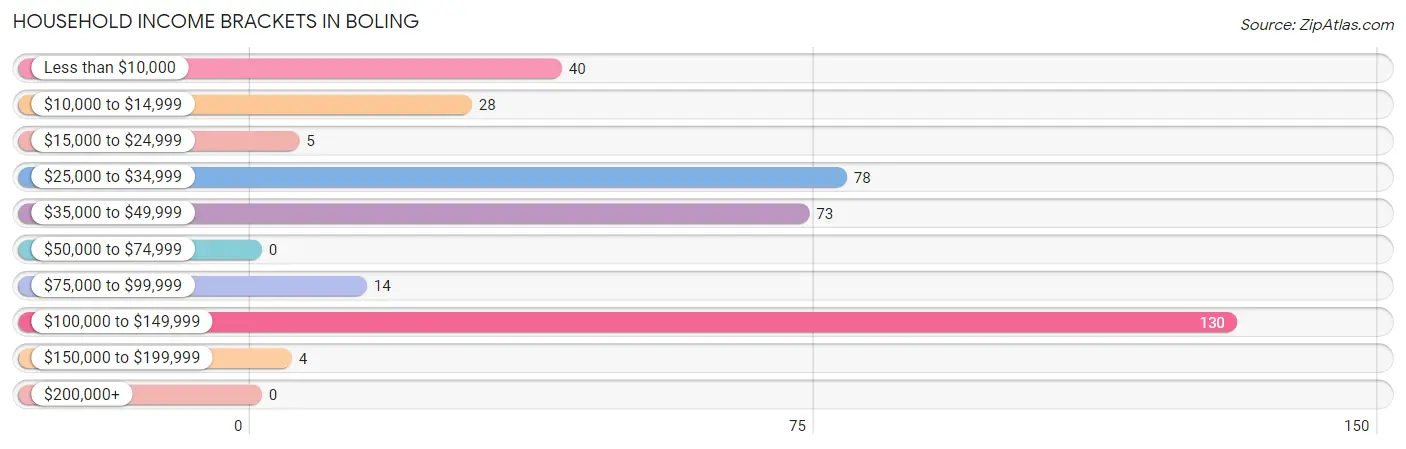
| Income Bracket | # Households | % Households |
| Less than $10,000 | 40 | 10.8% |
| $10,000 to $14,999 | 28 | 7.5% |
| $15,000 to $24,999 | 5 | 1.3% |
| $25,000 to $34,999 | 78 | 21.0% |
| $35,000 to $49,999 | 73 | 19.6% |
| $50,000 to $74,999 | 0 | 0.0% |
| $75,000 to $99,999 | 14 | 3.8% |
| $100,000 to $149,999 | 130 | 34.9% |
| $150,000 to $199,999 | 4 | 1.1% |
| $200,000+ | 0 | 0.0% |
Household Income by Householder Age in Boling
The median household income in Boling is $43,750, with the highest median household income of $138,384 found in the 45 to 64 years age bracket for the primary householder. A total of 133 households (35.7%) fall into this category.
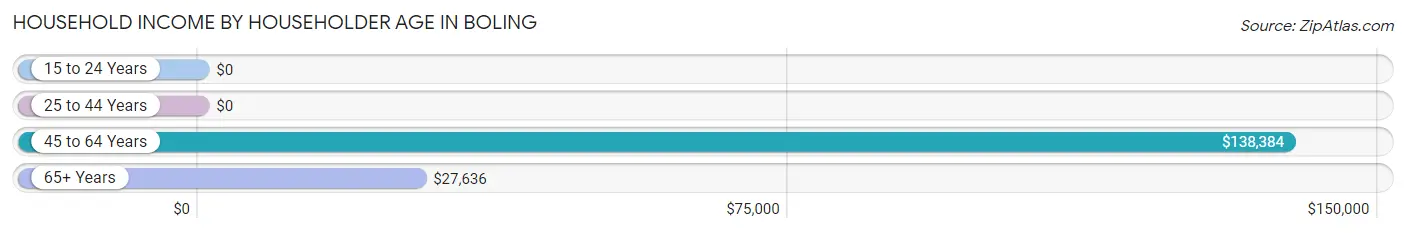
| Income Bracket | # Households | Median Income |
| 15 to 24 Years | 0 (0.0%) | $0 |
| 25 to 44 Years | 104 (28.0%) | $0 |
| 45 to 64 Years | 133 (35.7%) | $138,384 |
| 65+ Years | 135 (36.3%) | $27,636 |
| Total | 372 (100.0%) | $43,750 |
Poverty in Boling
Income Below Poverty by Sex and Age in Boling
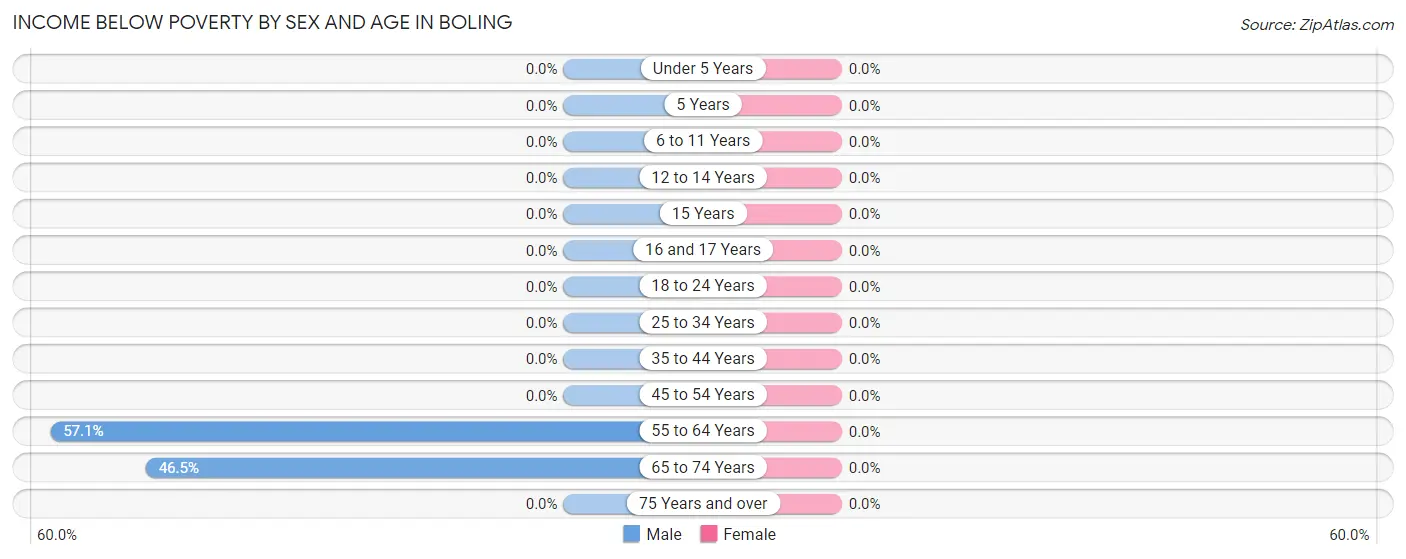
| Age Bracket | Male | Female |
| Under 5 Years | 0 (0.0%) | 0 (0.0%) |
| 5 Years | 0 (0.0%) | 0 (0.0%) |
| 6 to 11 Years | 0 (0.0%) | 0 (0.0%) |
| 12 to 14 Years | 0 (0.0%) | 0 (0.0%) |
| 15 Years | 0 (0.0%) | 0 (0.0%) |
| 16 and 17 Years | 0 (0.0%) | 0 (0.0%) |
| 18 to 24 Years | 0 (0.0%) | 0 (0.0%) |
| 25 to 34 Years | 0 (0.0%) | 0 (0.0%) |
| 35 to 44 Years | 0 (0.0%) | 0 (0.0%) |
| 45 to 54 Years | 0 (0.0%) | 0 (0.0%) |
| 55 to 64 Years | 28 (57.1%) | 0 (0.0%) |
| 65 to 74 Years | 40 (46.5%) | 0 (0.0%) |
| 75 Years and over | 0 (0.0%) | 0 (0.0%) |
| Total | 68 (10.9%) | 0 (0.0%) |
Income Above Poverty by Sex and Age in Boling
According to the poverty statistics in Boling, males aged under 5 years and females aged under 5 years are the age groups that are most secure financially, with 100.0% of males and 100.0% of females in these age groups living above the poverty line.
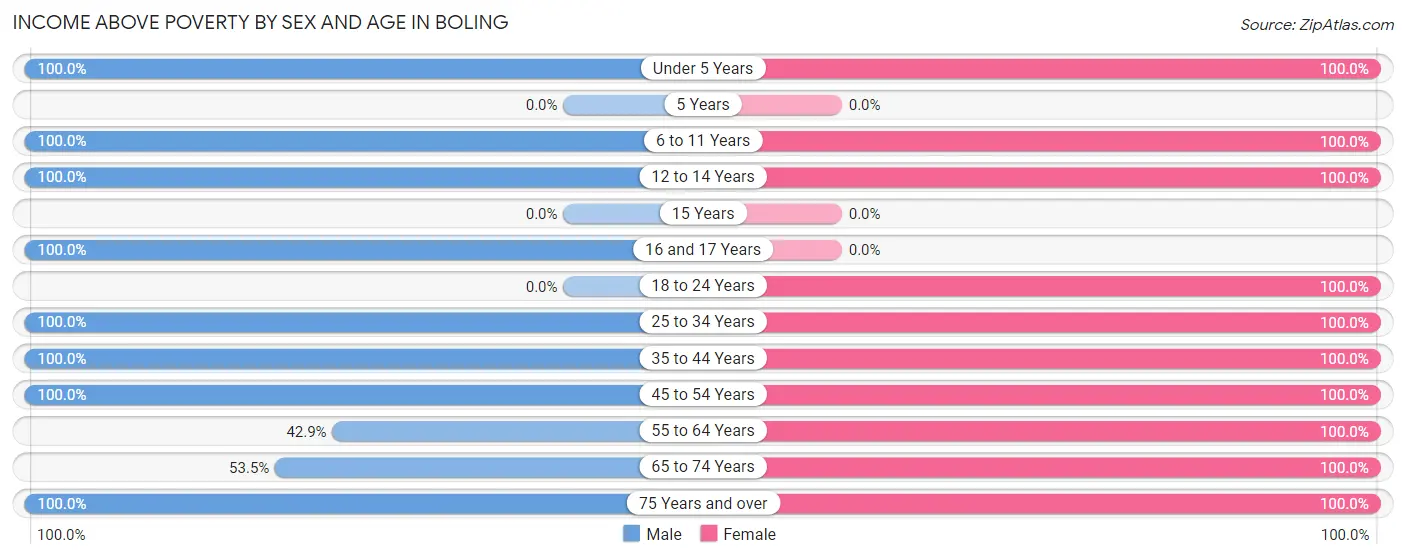
| Age Bracket | Male | Female |
| Under 5 Years | 74 (100.0%) | 23 (100.0%) |
| 5 Years | 0 (0.0%) | 0 (0.0%) |
| 6 to 11 Years | 54 (100.0%) | 16 (100.0%) |
| 12 to 14 Years | 2 (100.0%) | 16 (100.0%) |
| 15 Years | 0 (0.0%) | 0 (0.0%) |
| 16 and 17 Years | 2 (100.0%) | 0 (0.0%) |
| 18 to 24 Years | 0 (0.0%) | 136 (100.0%) |
| 25 to 34 Years | 200 (100.0%) | 50 (100.0%) |
| 35 to 44 Years | 29 (100.0%) | 17 (100.0%) |
| 45 to 54 Years | 104 (100.0%) | 31 (100.0%) |
| 55 to 64 Years | 21 (42.9%) | 86 (100.0%) |
| 65 to 74 Years | 46 (53.5%) | 34 (100.0%) |
| 75 Years and over | 24 (100.0%) | 11 (100.0%) |
| Total | 556 (89.1%) | 420 (100.0%) |
Income Below Poverty Among Married-Couple Families in Boling
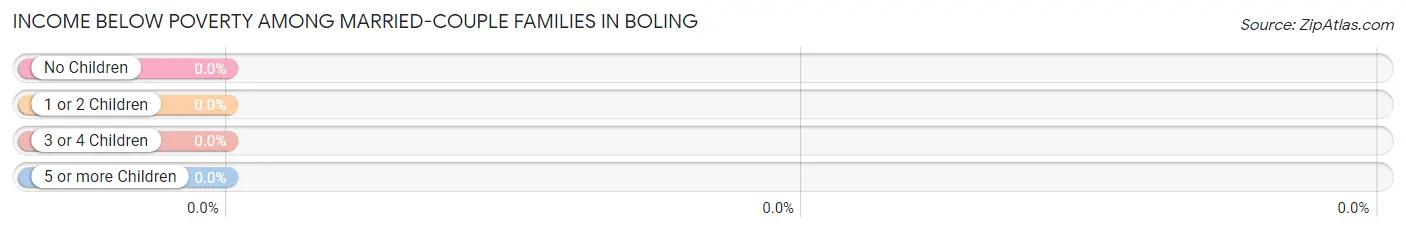
| Children | Above Poverty | Below Poverty |
| No Children | 71 (100.0%) | 0 (0.0%) |
| 1 or 2 Children | 37 (100.0%) | 0 (0.0%) |
| 3 or 4 Children | 49 (100.0%) | 0 (0.0%) |
| 5 or more Children | 0 (0.0%) | 0 (0.0%) |
| Total | 157 (100.0%) | 0 (0.0%) |
Income Below Poverty Among Single-Parent Households in Boling
| Children | Single Father | Single Mother |
| No Children | 0 (0.0%) | 0 (0.0%) |
| 1 or 2 Children | 0 (0.0%) | 0 (0.0%) |
| 3 or 4 Children | 0 (0.0%) | 0 (0.0%) |
| 5 or more Children | 0 (0.0%) | 0 (0.0%) |
| Total | 0 (0.0%) | 0 (0.0%) |
Income Below Poverty Among Married-Couple vs Single-Parent Households in Boling
| Children | Married-Couple Families | Single-Parent Households |
| No Children | 0 (0.0%) | 0 (0.0%) |
| 1 or 2 Children | 0 (0.0%) | 0 (0.0%) |
| 3 or 4 Children | 0 (0.0%) | 0 (0.0%) |
| 5 or more Children | 0 (0.0%) | 0 (0.0%) |
| Total | 0 (0.0%) | 0 (0.0%) |
Race in Boling
The most populous races in Boling are White / Caucasian (908 | 87.0%), Hispanic or Latino (810 | 77.6%), and Two or more Races (110 | 10.5%).
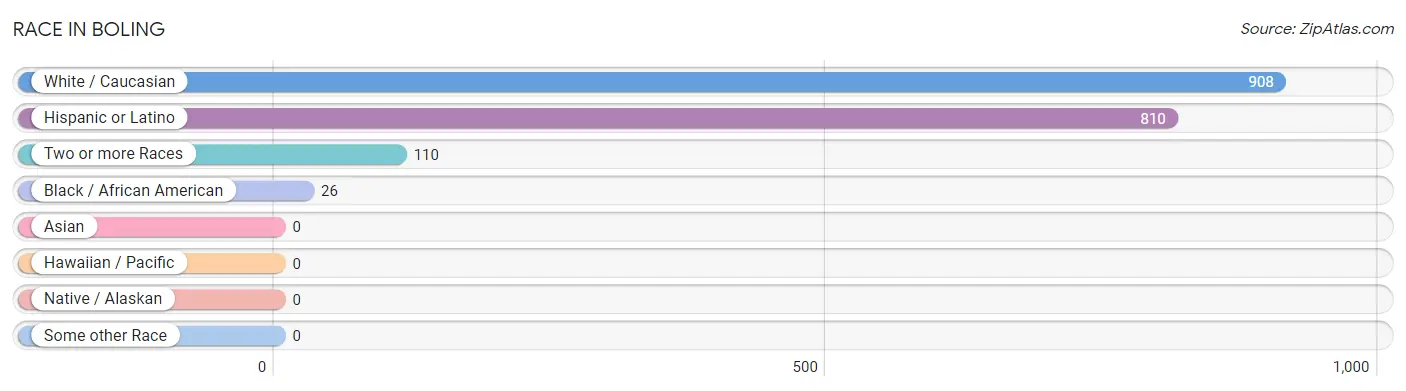
| Race | # Population | % Population |
| Asian | 0 | 0.0% |
| Black / African American | 26 | 2.5% |
| Hawaiian / Pacific | 0 | 0.0% |
| Hispanic or Latino | 810 | 77.6% |
| Native / Alaskan | 0 | 0.0% |
| White / Caucasian | 908 | 87.0% |
| Two or more Races | 110 | 10.5% |
| Some other Race | 0 | 0.0% |
| Total | 1,044 | 100.0% |
Ancestry in Boling
The most populous ancestries reported in Boling are Mexican (782 | 74.9%), Czech (90 | 8.6%), German (66 | 6.3%), English (56 | 5.4%), and Peruvian (28 | 2.7%), together accounting for 97.9% of all Boling residents.
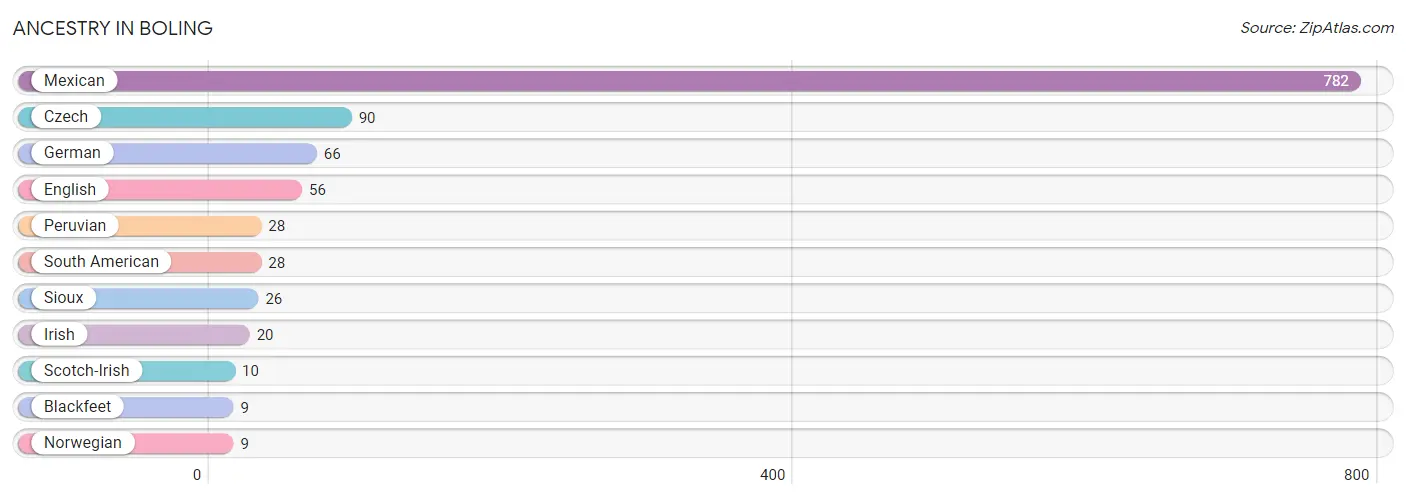
| Ancestry | # Population | % Population |
| Blackfeet | 9 | 0.9% |
| Czech | 90 | 8.6% |
| English | 56 | 5.4% |
| German | 66 | 6.3% |
| Irish | 20 | 1.9% |
| Mexican | 782 | 74.9% |
| Norwegian | 9 | 0.9% |
| Peruvian | 28 | 2.7% |
| Scotch-Irish | 10 | 1.0% |
| Sioux | 26 | 2.5% |
| South American | 28 | 2.7% | View All 11 Rows |
Immigrants in Boling
The most numerous immigrant groups reported in Boling came from Central America (113 | 10.8%), Latin America (113 | 10.8%), and Mexico (113 | 10.8%), together accounting for 32.5% of all Boling residents.
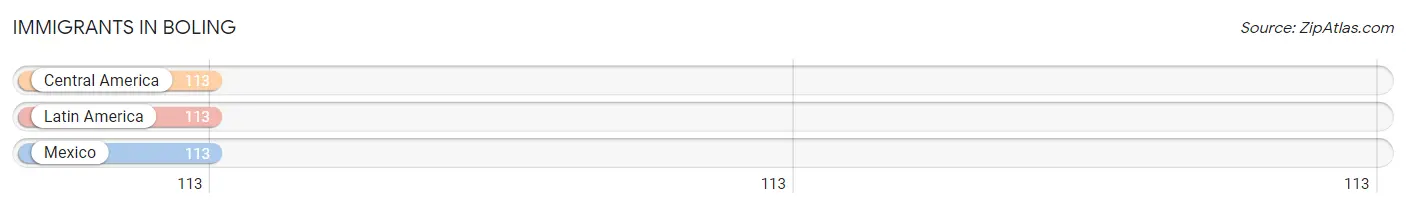
| Immigration Origin | # Population | % Population |
| Central America | 113 | 10.8% |
| Latin America | 113 | 10.8% |
| Mexico | 113 | 10.8% | View All 3 Rows |
Sex and Age in Boling
Sex and Age in Boling
The most populous age groups in Boling are 25 to 29 Years (156 | 25.0%) for men and 20 to 24 Years (111 | 26.4%) for women.
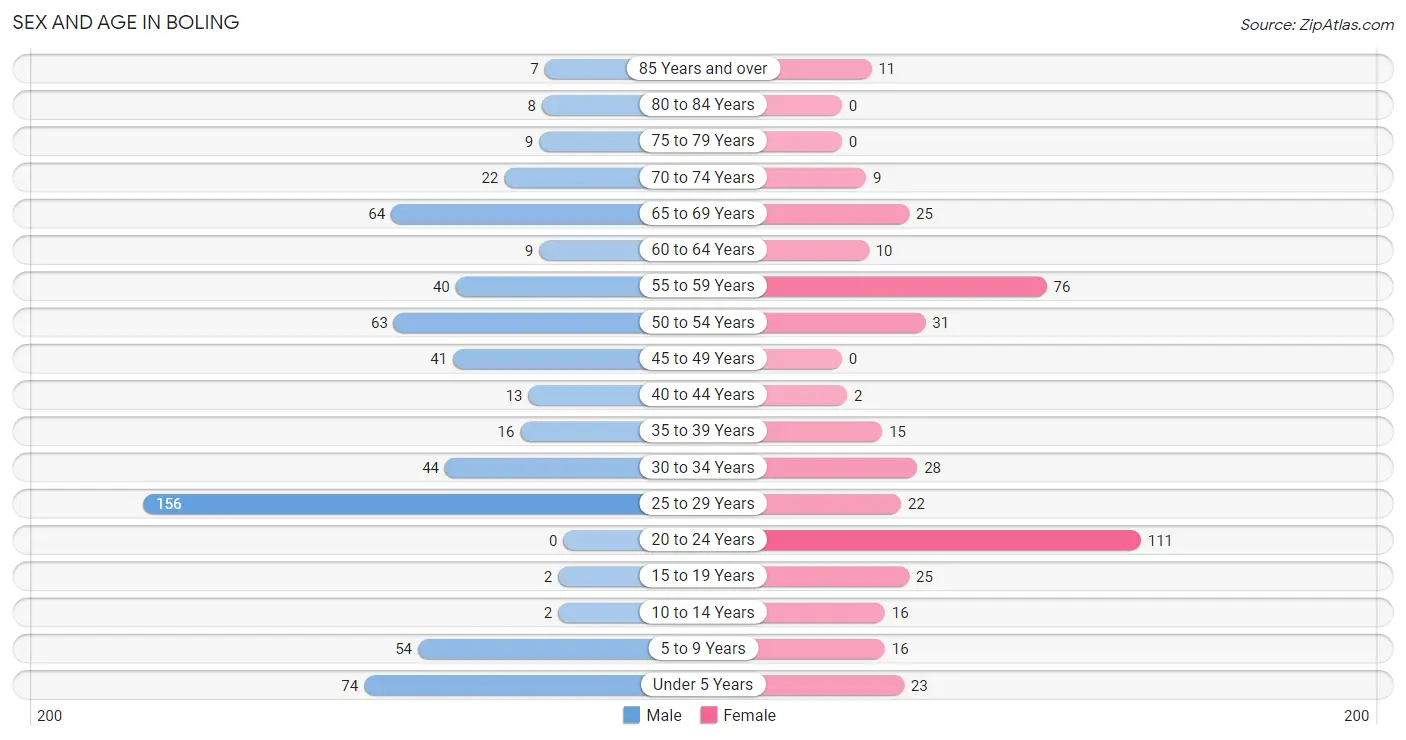
| Age Bracket | Male | Female |
| Under 5 Years | 74 (11.9%) | 23 (5.5%) |
| 5 to 9 Years | 54 (8.6%) | 16 (3.8%) |
| 10 to 14 Years | 2 (0.3%) | 16 (3.8%) |
| 15 to 19 Years | 2 (0.3%) | 25 (5.9%) |
| 20 to 24 Years | 0 (0.0%) | 111 (26.4%) |
| 25 to 29 Years | 156 (25.0%) | 22 (5.2%) |
| 30 to 34 Years | 44 (7.0%) | 28 (6.7%) |
| 35 to 39 Years | 16 (2.6%) | 15 (3.6%) |
| 40 to 44 Years | 13 (2.1%) | 2 (0.5%) |
| 45 to 49 Years | 41 (6.6%) | 0 (0.0%) |
| 50 to 54 Years | 63 (10.1%) | 31 (7.4%) |
| 55 to 59 Years | 40 (6.4%) | 76 (18.1%) |
| 60 to 64 Years | 9 (1.4%) | 10 (2.4%) |
| 65 to 69 Years | 64 (10.3%) | 25 (5.9%) |
| 70 to 74 Years | 22 (3.5%) | 9 (2.1%) |
| 75 to 79 Years | 9 (1.4%) | 0 (0.0%) |
| 80 to 84 Years | 8 (1.3%) | 0 (0.0%) |
| 85 Years and over | 7 (1.1%) | 11 (2.6%) |
| Total | 624 (100.0%) | 420 (100.0%) |
Families and Households in Boling
Median Family Size in Boling
The median family size in Boling is 4.63 persons per family, with married-couple families (157 | 84.9%) accounting for the largest median family size of 5.02 persons per family. On the other hand, single female/mother families (16 | 8.6%) represent the smallest median family size with 2.00 persons per family.
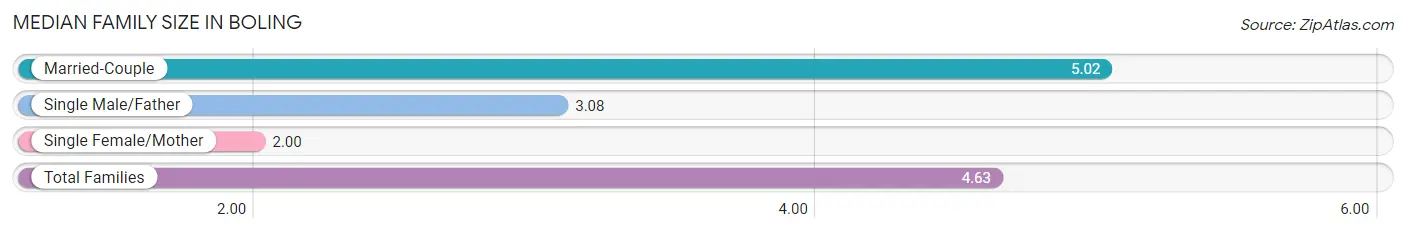
| Family Type | # Families | Family Size |
| Married-Couple | 157 (84.9%) | 5.02 |
| Single Male/Father | 12 (6.5%) | 3.08 |
| Single Female/Mother | 16 (8.6%) | 2.00 |
| Total Families | 185 (100.0%) | 4.63 |
Median Household Size in Boling
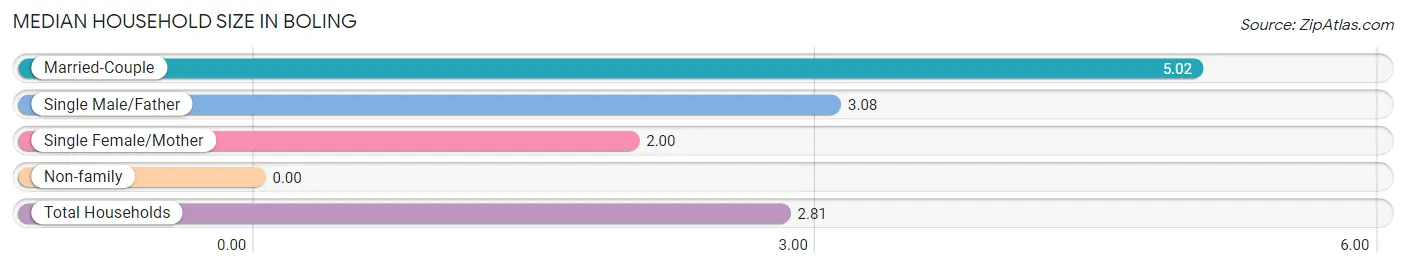
| Household Type | # Households | Household Size |
| Married-Couple | 157 (42.2%) | 5.02 |
| Single Male/Father | 12 (3.2%) | 3.08 |
| Single Female/Mother | 16 (4.3%) | 2.00 |
| Non-family | 187 (50.3%) | - |
| Total Households | 372 (100.0%) | 2.81 |
Household Size by Marriage Status in Boling
Out of a total of 372 households in Boling, 185 (49.7%) are family households, while 187 (50.3%) are nonfamily households. The most numerous type of family households are 5-person households, comprising 81, and the most common type of nonfamily households are 1-person households, comprising 187.
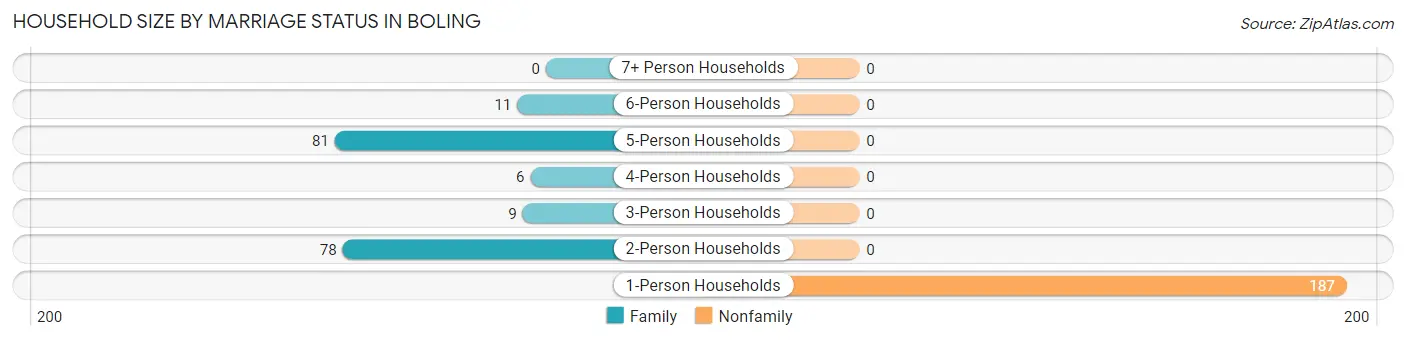
| Household Size | Family Households | Nonfamily Households |
| 1-Person Households | - | 187 (50.3%) |
| 2-Person Households | 78 (21.0%) | 0 (0.0%) |
| 3-Person Households | 9 (2.4%) | 0 (0.0%) |
| 4-Person Households | 6 (1.6%) | 0 (0.0%) |
| 5-Person Households | 81 (21.8%) | 0 (0.0%) |
| 6-Person Households | 11 (3.0%) | 0 (0.0%) |
| 7+ Person Households | 0 (0.0%) | 0 (0.0%) |
| Total | 185 (49.7%) | 187 (50.3%) |
Female Fertility in Boling
Fertility by Age in Boling
Average fertility rate in Boling is 158.0 births per 1,000 women. Women in the age bracket of 20 to 34 years have the highest fertility rate with 199.0 births per 1,000 women. Women in the age bracket of 20 to 34 years acount for 100.0% of all women with births.
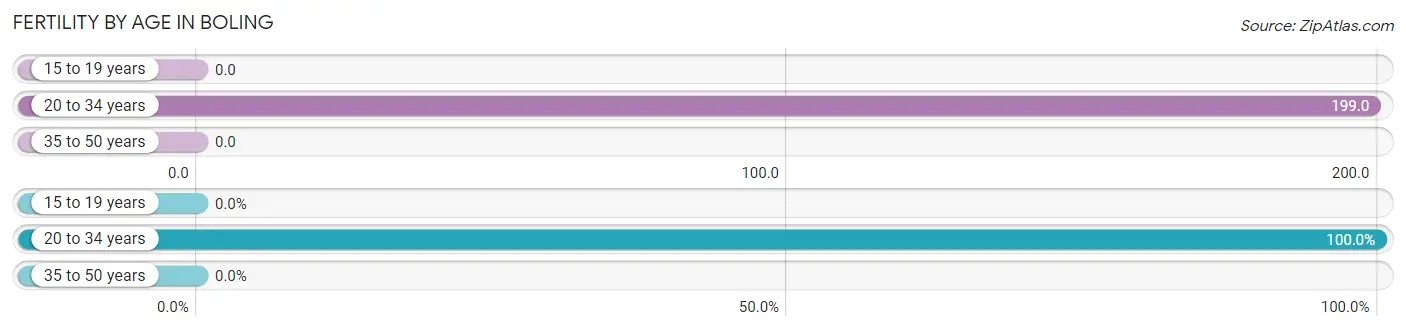
| Age Bracket | Women with Births | Births / 1,000 Women |
| 15 to 19 years | 0 (0.0%) | 0.0 |
| 20 to 34 years | 32 (100.0%) | 199.0 |
| 35 to 50 years | 0 (0.0%) | 0.0 |
| Total | 32 (100.0%) | 158.0 |
Fertility by Age by Marriage Status in Boling
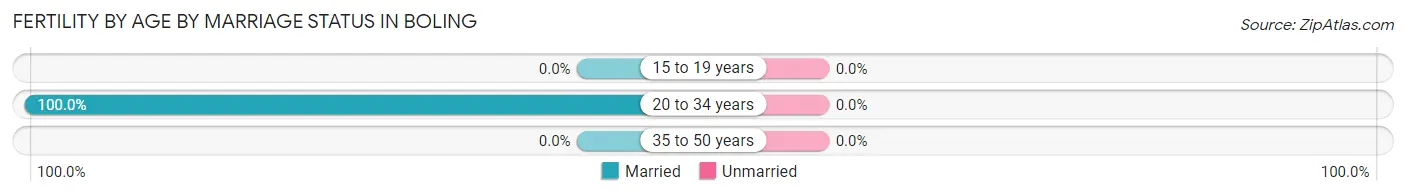
| Age Bracket | Married | Unmarried |
| 15 to 19 years | 0 (0.0%) | 0 (0.0%) |
| 20 to 34 years | 32 (100.0%) | 0 (0.0%) |
| 35 to 50 years | 0 (0.0%) | 0 (0.0%) |
| Total | 32 (100.0%) | 0 (0.0%) |
Fertility by Education in Boling
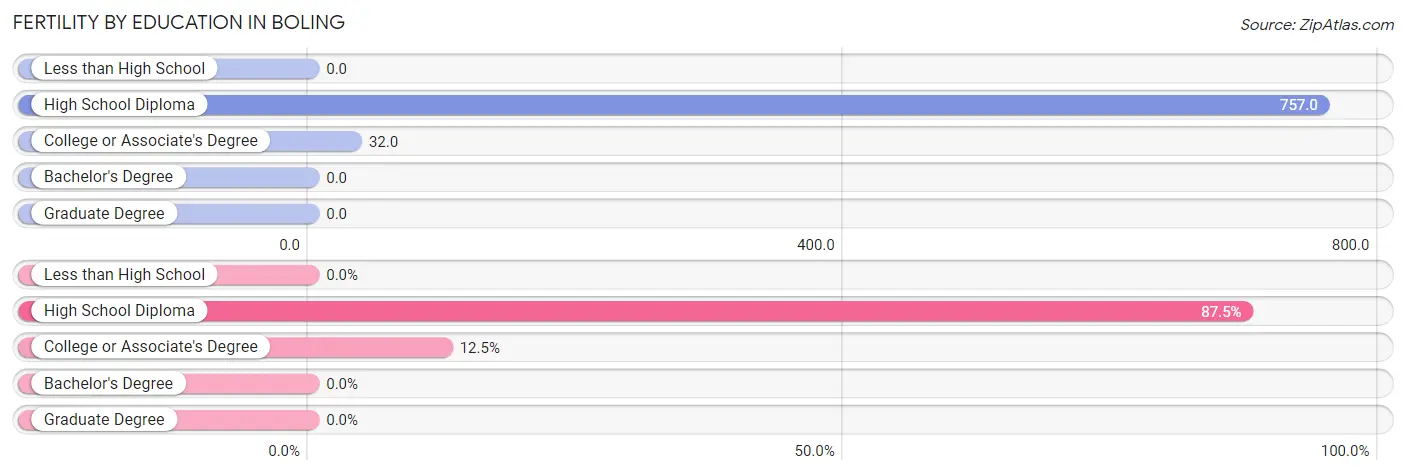
| Educational Attainment | Women with Births | Births / 1,000 Women |
| Less than High School | 0 (0.0%) | 0.0 |
| High School Diploma | 28 (87.5%) | 757.0 |
| College or Associate's Degree | 4 (12.5%) | 32.0 |
| Bachelor's Degree | 0 (0.0%) | 0.0 |
| Graduate Degree | 0 (0.0%) | 0.0 |
| Total | 32 (100.0%) | 158.0 |
Fertility by Education by Marriage Status in Boling
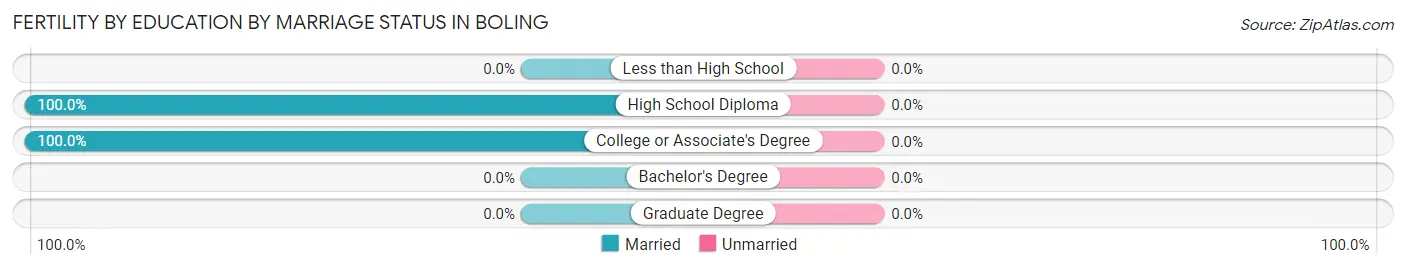
| Educational Attainment | Married | Unmarried |
| Less than High School | 0 (0.0%) | 0 (0.0%) |
| High School Diploma | 28 (100.0%) | 0 (0.0%) |
| College or Associate's Degree | 4 (100.0%) | 0 (0.0%) |
| Bachelor's Degree | 0 (0.0%) | 0 (0.0%) |
| Graduate Degree | 0 (0.0%) | 0 (0.0%) |
| Total | 32 (100.0%) | 0 (0.0%) |
Employment Characteristics in Boling
Employment by Class of Employer in Boling
Among the 469 employed individuals in Boling, private company employees (381 | 81.2%), federal government employees (51 | 10.9%), and local government employees (19 | 4.1%) make up the most common classes of employment.
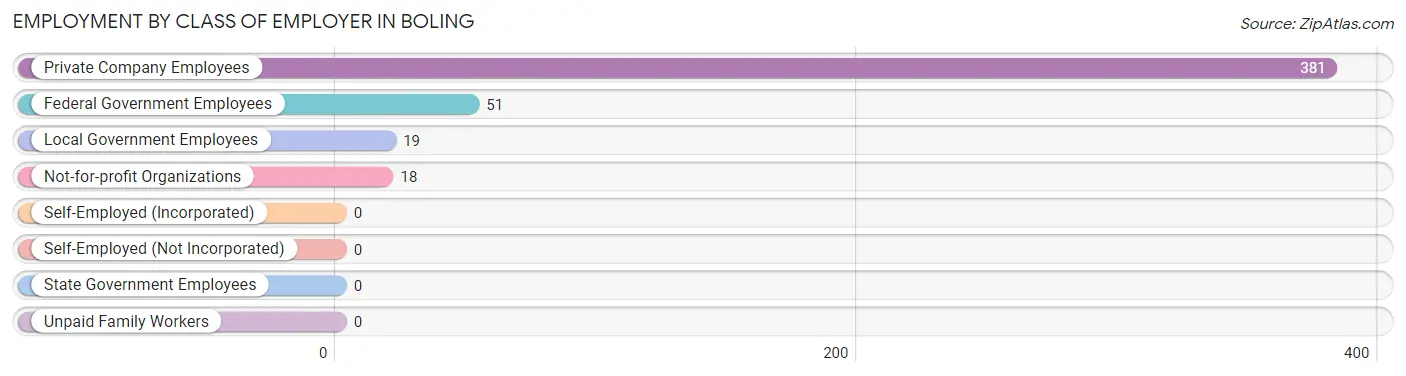
| Employer Class | # Employees | % Employees |
| Private Company Employees | 381 | 81.2% |
| Self-Employed (Incorporated) | 0 | 0.0% |
| Self-Employed (Not Incorporated) | 0 | 0.0% |
| Not-for-profit Organizations | 18 | 3.8% |
| Local Government Employees | 19 | 4.1% |
| State Government Employees | 0 | 0.0% |
| Federal Government Employees | 51 | 10.9% |
| Unpaid Family Workers | 0 | 0.0% |
| Total | 469 | 100.0% |
Employment Status by Age in Boling
According to the labor force statistics for Boling, out of the total population over 16 years of age (859), 63.9% or 549 individuals are in the labor force, with 14.6% or 80 of them unemployed. The age group with the highest labor force participation rate is 20 to 24 years, with 100.0% or 111 individuals in the labor force. Within the labor force, the 25 to 29 years age range has the highest percentage of unemployed individuals, with 55.2% or 80 of them being unemployed.
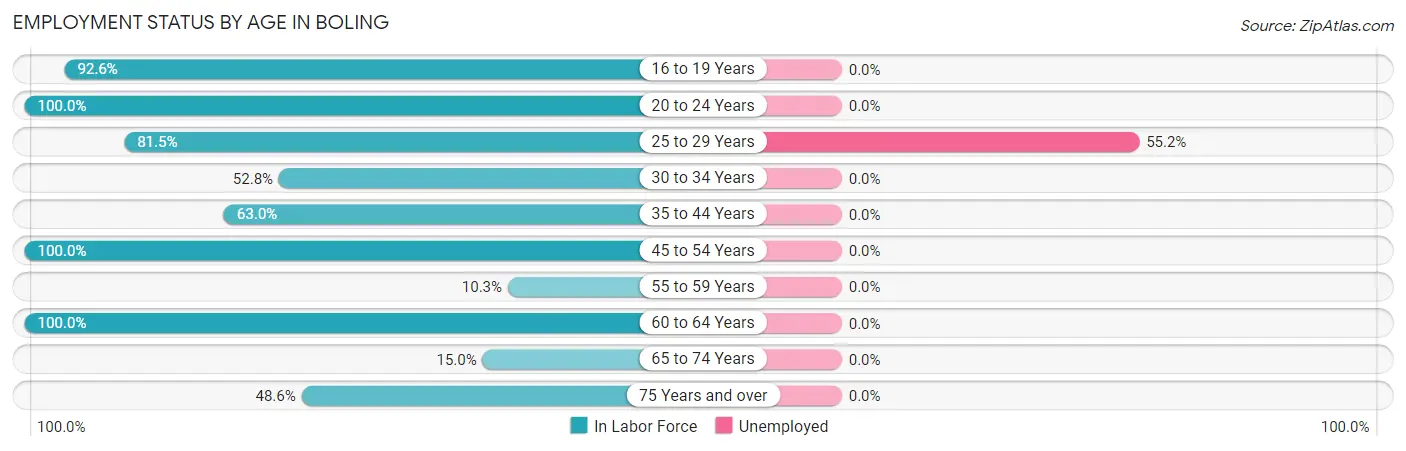
| Age Bracket | In Labor Force | Unemployed |
| 16 to 19 Years | 25 (92.6%) | 0 (0.0%) |
| 20 to 24 Years | 111 (100.0%) | 0 (0.0%) |
| 25 to 29 Years | 145 (81.5%) | 80 (55.2%) |
| 30 to 34 Years | 38 (52.8%) | 0 (0.0%) |
| 35 to 44 Years | 29 (63.0%) | 0 (0.0%) |
| 45 to 54 Years | 135 (100.0%) | 0 (0.0%) |
| 55 to 59 Years | 12 (10.3%) | 0 (0.0%) |
| 60 to 64 Years | 19 (100.0%) | 0 (0.0%) |
| 65 to 74 Years | 18 (15.0%) | 0 (0.0%) |
| 75 Years and over | 17 (48.6%) | 0 (0.0%) |
| Total | 549 (63.9%) | 80 (14.6%) |
Employment Status by Educational Attainment in Boling
According to labor force statistics for Boling, 66.8% of individuals (378) out of the total population between 25 and 64 years of age (566) are in the labor force, with 21.2% or 80 of them being unemployed. The group with the highest labor force participation rate are those with the educational attainment of bachelor's degree or higher, with 78.0% or 181 individuals in the labor force. Within the labor force, individuals with bachelor's degree or higher education have the highest percentage of unemployment, with 44.2% or 80 of them being unemployed.
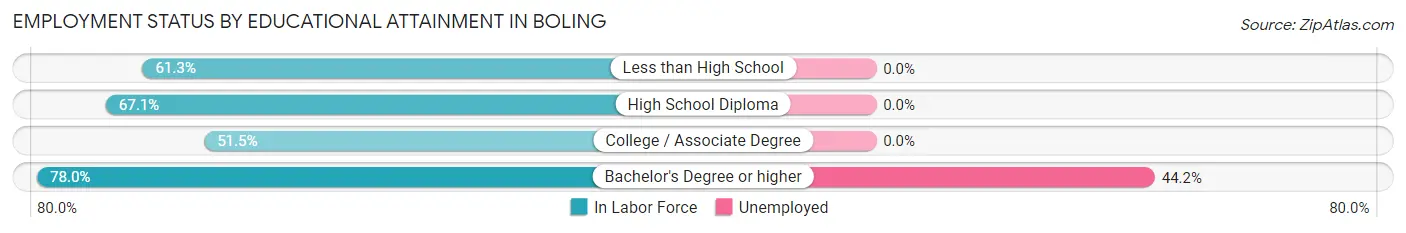
| Educational Attainment | In Labor Force | Unemployed |
| Less than High School | 73 (61.3%) | 0 (0.0%) |
| High School Diploma | 57 (67.1%) | 0 (0.0%) |
| College / Associate Degree | 67 (51.5%) | 0 (0.0%) |
| Bachelor's Degree or higher | 181 (78.0%) | 103 (44.2%) |
| Total | 378 (66.8%) | 120 (21.2%) |
Employment Occupations by Sex in Boling
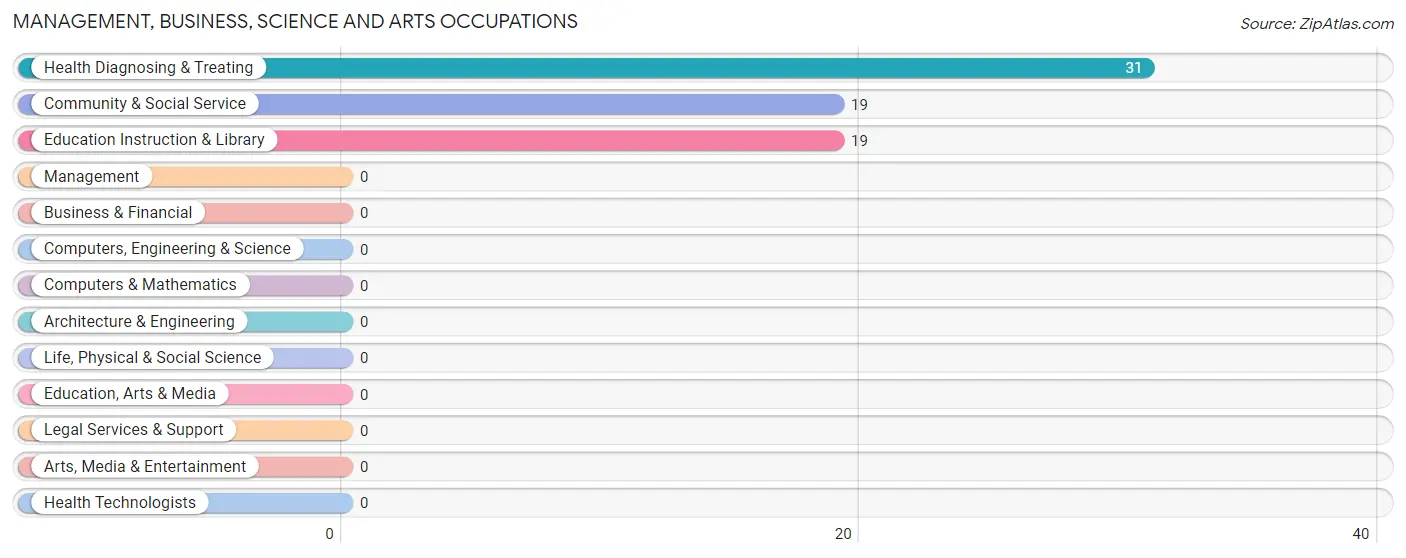
Management, Business, Science and Arts Occupations
The most common Management, Business, Science and Arts occupations in Boling are Health Diagnosing & Treating (31 | 6.6%), Community & Social Service (19 | 4.1%), and Education Instruction & Library (19 | 4.1%).
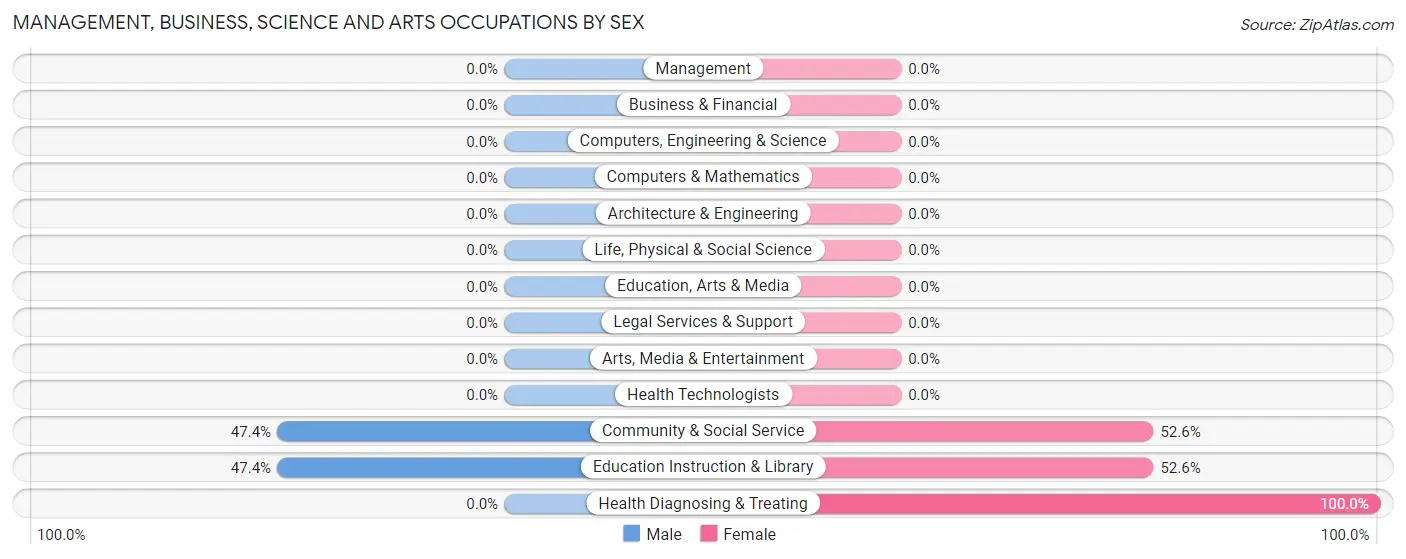
Management, Business, Science and Arts Occupations by Sex
Within the Management, Business, Science and Arts occupations in Boling, the most male-oriented occupations are Community & Social Service (47.4%), and Education Instruction & Library (47.4%), while the most female-oriented occupations are Health Diagnosing & Treating (100.0%), Community & Social Service (52.6%), and Education Instruction & Library (52.6%).
| Occupation | Male | Female |
| Management | 0 (0.0%) | 0 (0.0%) |
| Business & Financial | 0 (0.0%) | 0 (0.0%) |
| Computers, Engineering & Science | 0 (0.0%) | 0 (0.0%) |
| Computers & Mathematics | 0 (0.0%) | 0 (0.0%) |
| Architecture & Engineering | 0 (0.0%) | 0 (0.0%) |
| Life, Physical & Social Science | 0 (0.0%) | 0 (0.0%) |
| Community & Social Service | 9 (47.4%) | 10 (52.6%) |
| Education, Arts & Media | 0 (0.0%) | 0 (0.0%) |
| Legal Services & Support | 0 (0.0%) | 0 (0.0%) |
| Education Instruction & Library | 9 (47.4%) | 10 (52.6%) |
| Arts, Media & Entertainment | 0 (0.0%) | 0 (0.0%) |
| Health Diagnosing & Treating | 0 (0.0%) | 31 (100.0%) |
| Health Technologists | 0 (0.0%) | 0 (0.0%) |
| Total (Category) | 9 (18.0%) | 41 (82.0%) |
| Total (Overall) | 283 (60.3%) | 186 (39.7%) |
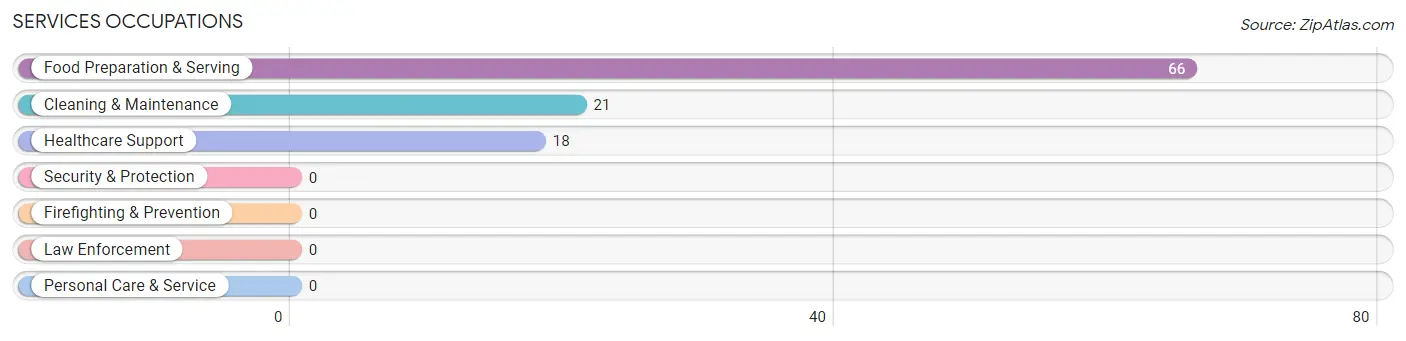
Services Occupations
The most common Services occupations in Boling are Food Preparation & Serving (66 | 14.1%), Cleaning & Maintenance (21 | 4.5%), and Healthcare Support (18 | 3.8%).
Services Occupations by Sex
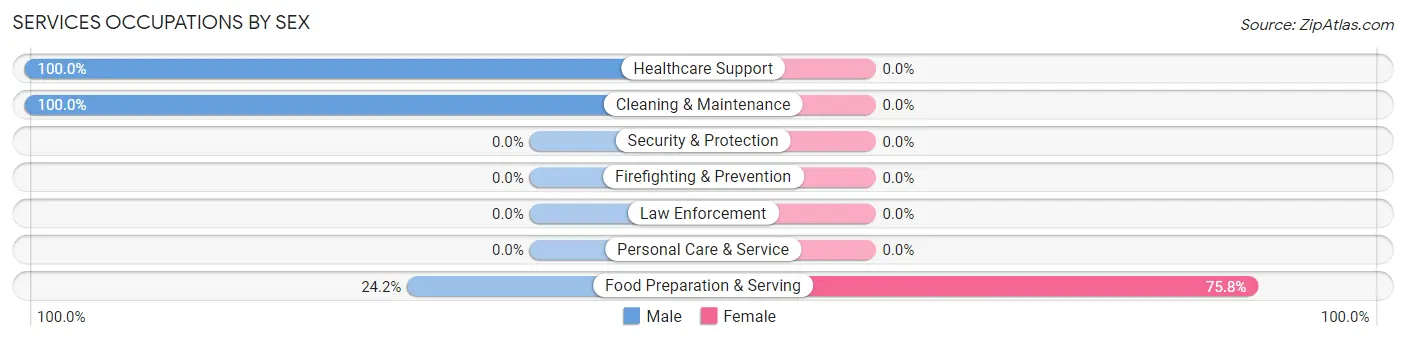
| Occupation | Male | Female |
| Healthcare Support | 18 (100.0%) | 0 (0.0%) |
| Security & Protection | 0 (0.0%) | 0 (0.0%) |
| Firefighting & Prevention | 0 (0.0%) | 0 (0.0%) |
| Law Enforcement | 0 (0.0%) | 0 (0.0%) |
| Food Preparation & Serving | 16 (24.2%) | 50 (75.8%) |
| Cleaning & Maintenance | 21 (100.0%) | 0 (0.0%) |
| Personal Care & Service | 0 (0.0%) | 0 (0.0%) |
| Total (Category) | 55 (52.4%) | 50 (47.6%) |
| Total (Overall) | 283 (60.3%) | 186 (39.7%) |
Sales and Office Occupations
The most common Sales and Office occupations in Boling are Sales & Related (86 | 18.3%), and Office & Administration (51 | 10.9%).
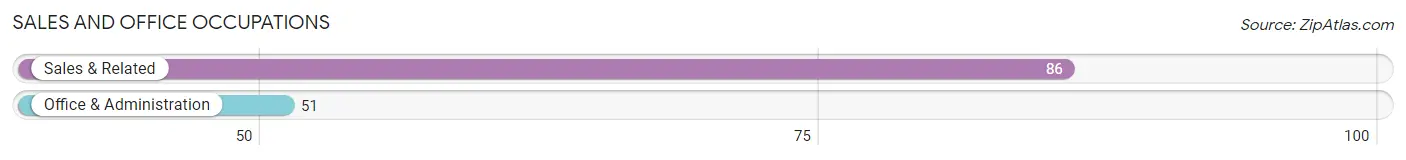
Sales and Office Occupations by Sex
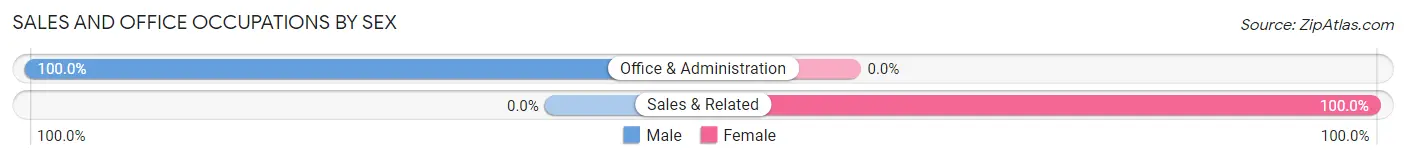
| Occupation | Male | Female |
| Sales & Related | 0 (0.0%) | 86 (100.0%) |
| Office & Administration | 51 (100.0%) | 0 (0.0%) |
| Total (Category) | 51 (37.2%) | 86 (62.8%) |
| Total (Overall) | 283 (60.3%) | 186 (39.7%) |
Natural Resources, Construction and Maintenance Occupations
The most common Natural Resources, Construction and Maintenance occupations in Boling are Farming, Fishing & Forestry (38 | 8.1%), and Installation, Maintenance & Repair (7 | 1.5%).
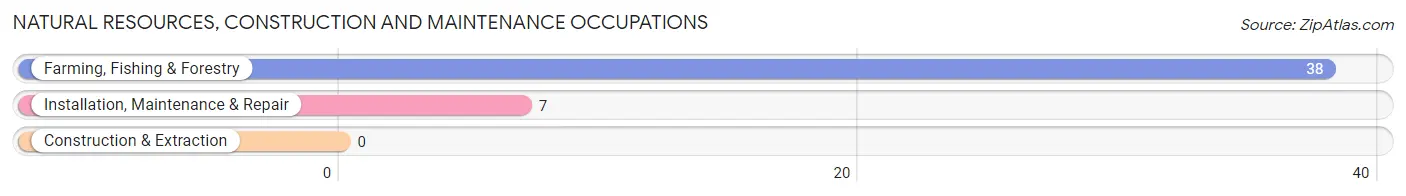
Natural Resources, Construction and Maintenance Occupations by Sex
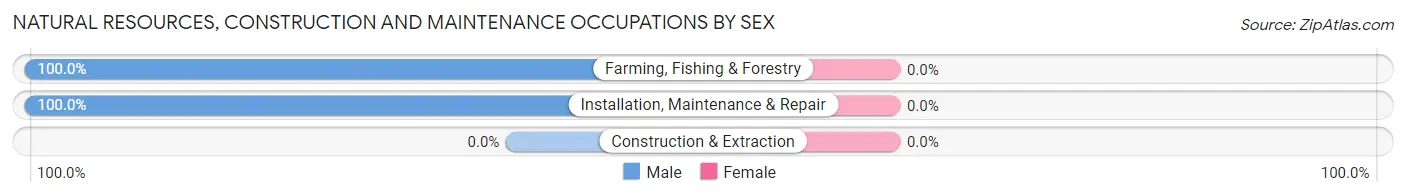
| Occupation | Male | Female |
| Farming, Fishing & Forestry | 38 (100.0%) | 0 (0.0%) |
| Construction & Extraction | 0 (0.0%) | 0 (0.0%) |
| Installation, Maintenance & Repair | 7 (100.0%) | 0 (0.0%) |
| Total (Category) | 45 (100.0%) | 0 (0.0%) |
| Total (Overall) | 283 (60.3%) | 186 (39.7%) |
Production, Transportation and Moving Occupations
The most common Production, Transportation and Moving occupations in Boling are Production (72 | 15.3%), and Transportation (60 | 12.8%).
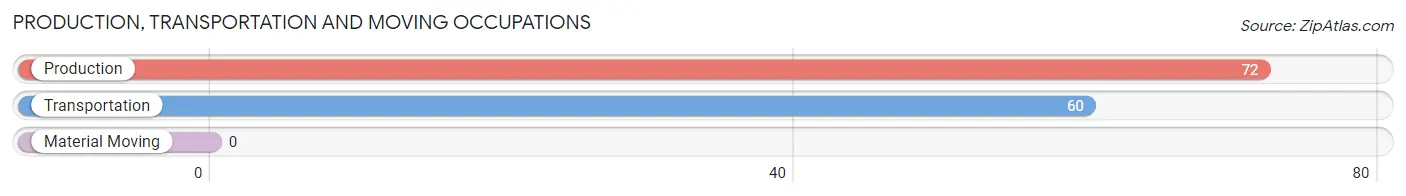
Production, Transportation and Moving Occupations by Sex
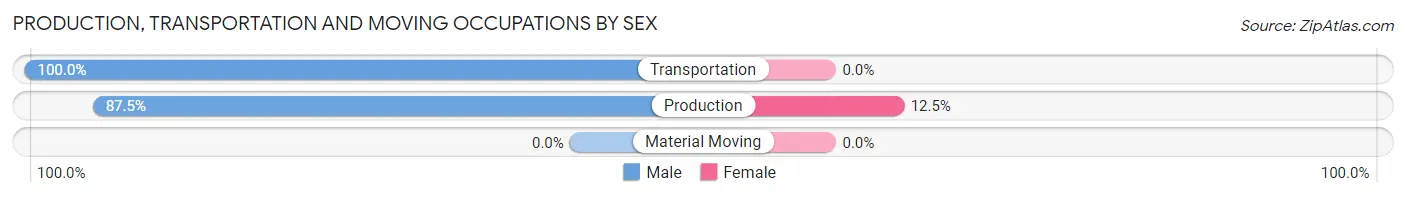
| Occupation | Male | Female |
| Production | 63 (87.5%) | 9 (12.5%) |
| Transportation | 60 (100.0%) | 0 (0.0%) |
| Material Moving | 0 (0.0%) | 0 (0.0%) |
| Total (Category) | 123 (93.2%) | 9 (6.8%) |
| Total (Overall) | 283 (60.3%) | 186 (39.7%) |
Employment Industries by Sex in Boling
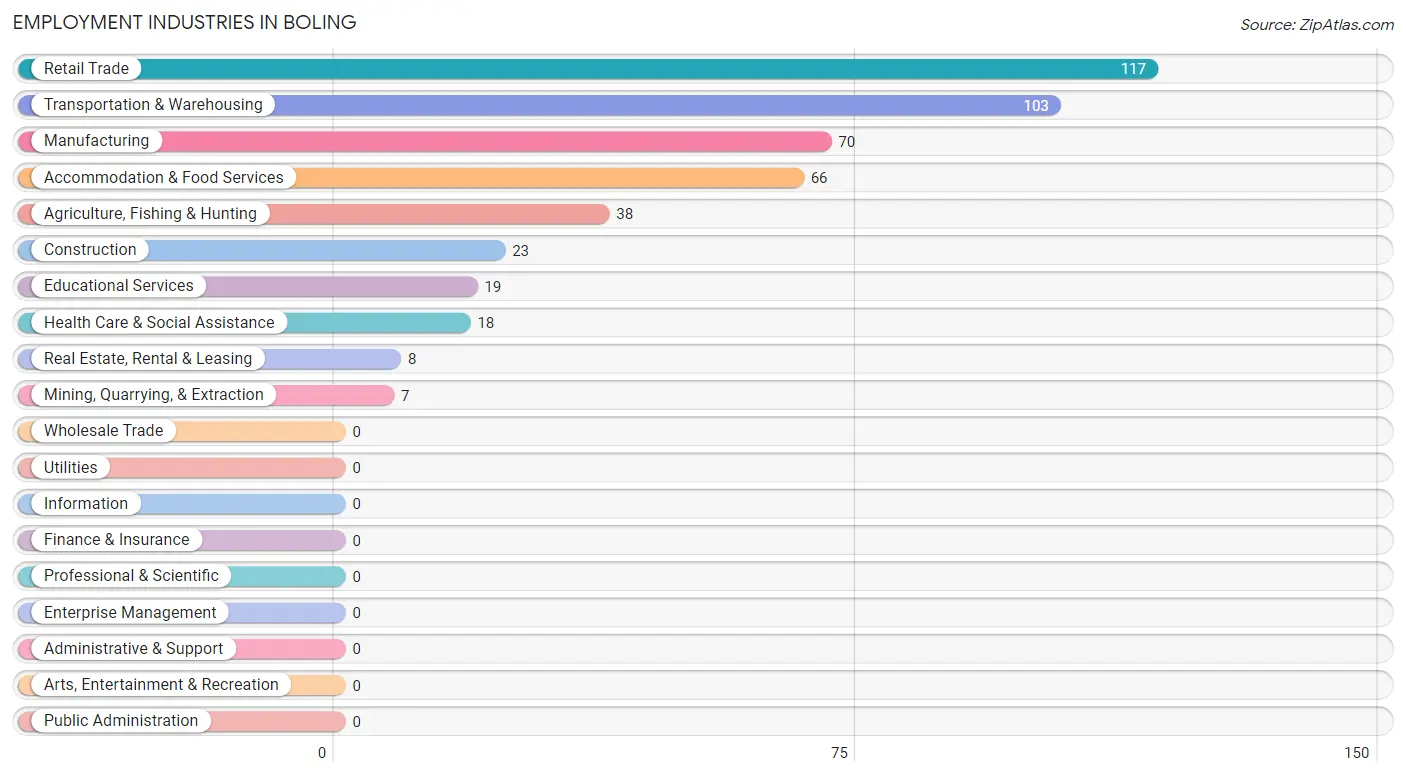
Employment Industries in Boling
The major employment industries in Boling include Retail Trade (117 | 24.9%), Transportation & Warehousing (103 | 22.0%), Manufacturing (70 | 14.9%), Accommodation & Food Services (66 | 14.1%), and Agriculture, Fishing & Hunting (38 | 8.1%).
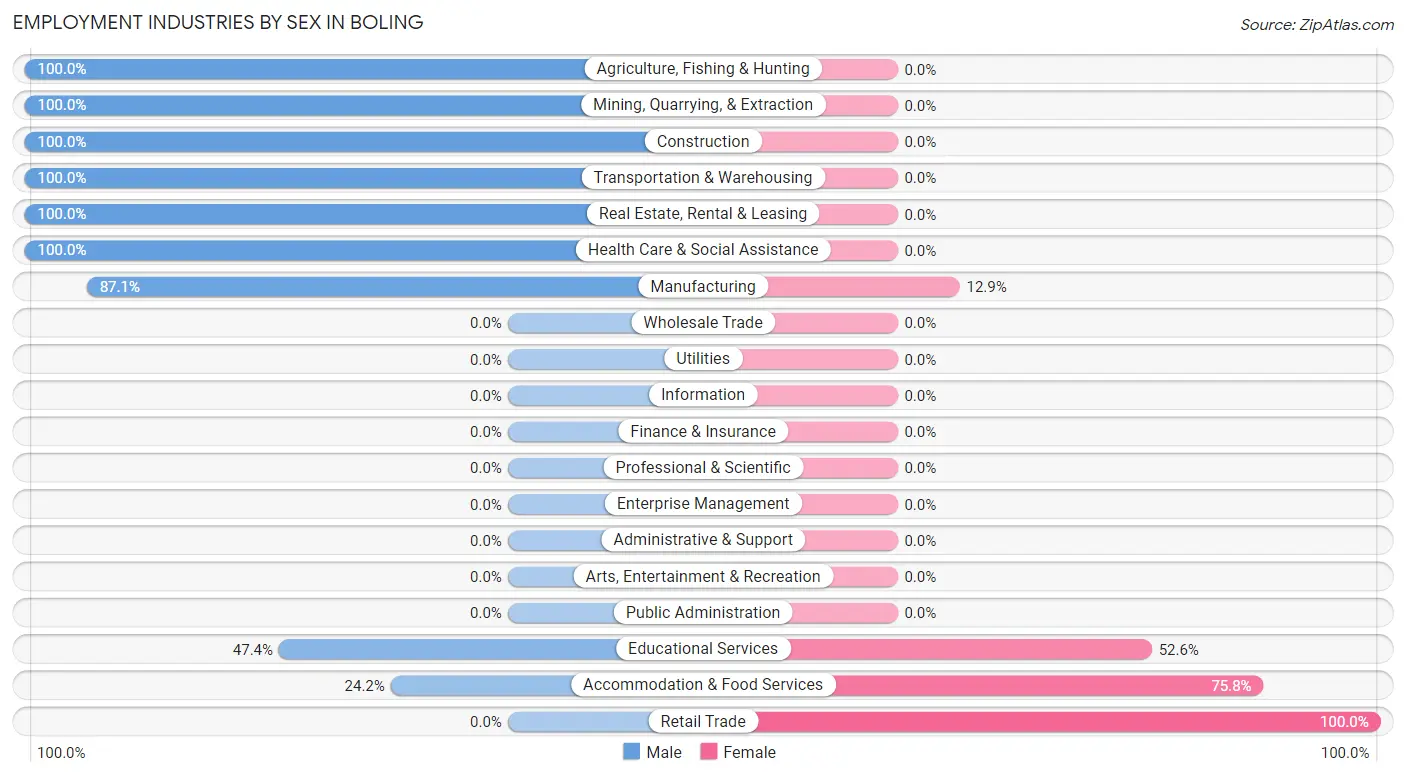
Employment Industries by Sex in Boling
The Boling industries that see more men than women are Agriculture, Fishing & Hunting (100.0%), Mining, Quarrying, & Extraction (100.0%), and Construction (100.0%), whereas the industries that tend to have a higher number of women are Retail Trade (100.0%), Accommodation & Food Services (75.8%), and Educational Services (52.6%).
| Industry | Male | Female |
| Agriculture, Fishing & Hunting | 38 (100.0%) | 0 (0.0%) |
| Mining, Quarrying, & Extraction | 7 (100.0%) | 0 (0.0%) |
| Construction | 23 (100.0%) | 0 (0.0%) |
| Manufacturing | 61 (87.1%) | 9 (12.9%) |
| Wholesale Trade | 0 (0.0%) | 0 (0.0%) |
| Retail Trade | 0 (0.0%) | 117 (100.0%) |
| Transportation & Warehousing | 103 (100.0%) | 0 (0.0%) |
| Utilities | 0 (0.0%) | 0 (0.0%) |
| Information | 0 (0.0%) | 0 (0.0%) |
| Finance & Insurance | 0 (0.0%) | 0 (0.0%) |
| Real Estate, Rental & Leasing | 8 (100.0%) | 0 (0.0%) |
| Professional & Scientific | 0 (0.0%) | 0 (0.0%) |
| Enterprise Management | 0 (0.0%) | 0 (0.0%) |
| Administrative & Support | 0 (0.0%) | 0 (0.0%) |
| Educational Services | 9 (47.4%) | 10 (52.6%) |
| Health Care & Social Assistance | 18 (100.0%) | 0 (0.0%) |
| Arts, Entertainment & Recreation | 0 (0.0%) | 0 (0.0%) |
| Accommodation & Food Services | 16 (24.2%) | 50 (75.8%) |
| Public Administration | 0 (0.0%) | 0 (0.0%) |
| Total | 283 (60.3%) | 186 (39.7%) |
Education in Boling
School Enrollment in Boling
The most common levels of schooling among the 240 students in Boling are college / undergraduate (120 | 50.0%), elementary school (70 | 29.2%), and high school (27 | 11.3%).
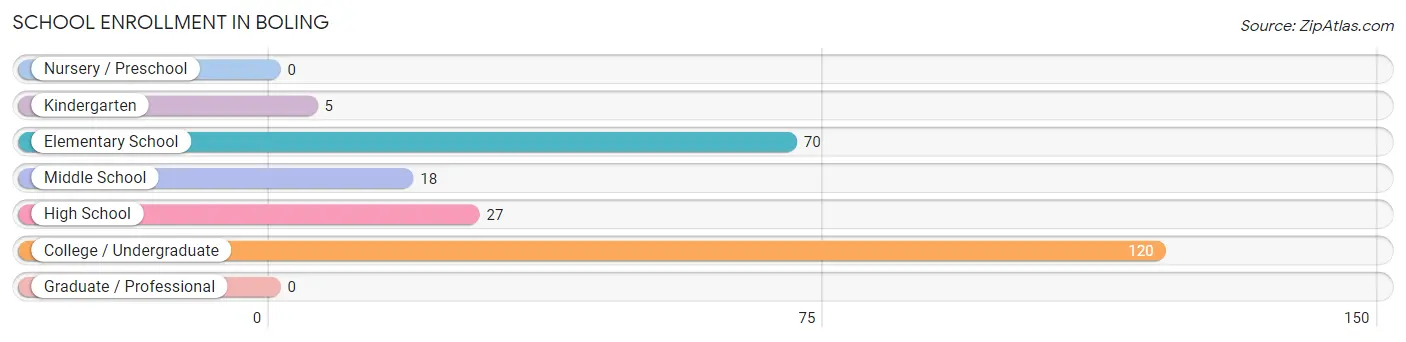
| School Level | # Students | % Students |
| Nursery / Preschool | 0 | 0.0% |
| Kindergarten | 5 | 2.1% |
| Elementary School | 70 | 29.2% |
| Middle School | 18 | 7.5% |
| High School | 27 | 11.3% |
| College / Undergraduate | 120 | 50.0% |
| Graduate / Professional | 0 | 0.0% |
| Total | 240 | 100.0% |
School Enrollment by Age by Funding Source in Boling
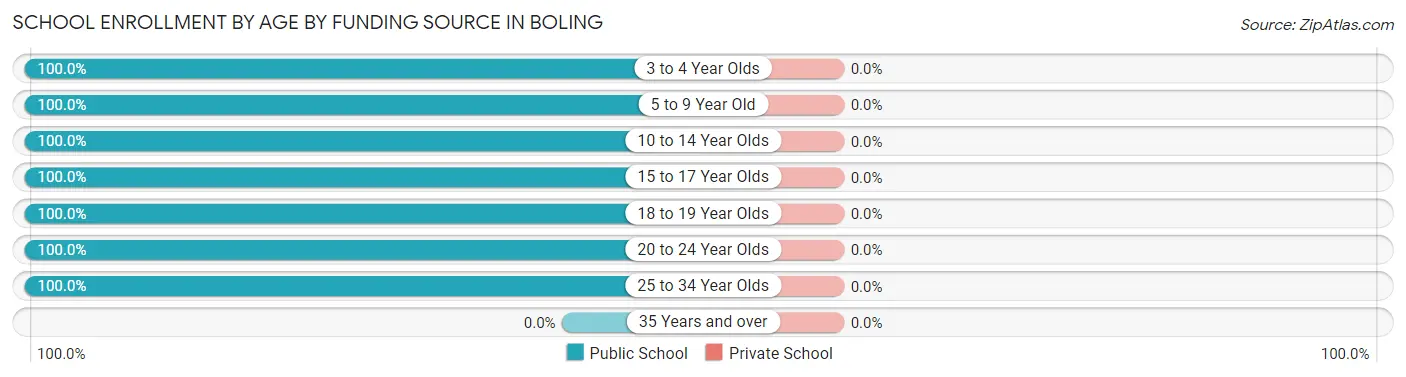
| Age Bracket | Public School | Private School |
| 3 to 4 Year Olds | 5 (100.0%) | 0 (0.0%) |
| 5 to 9 Year Old | 70 (100.0%) | 0 (0.0%) |
| 10 to 14 Year Olds | 18 (100.0%) | 0 (0.0%) |
| 15 to 17 Year Olds | 2 (100.0%) | 0 (0.0%) |
| 18 to 19 Year Olds | 25 (100.0%) | 0 (0.0%) |
| 20 to 24 Year Olds | 111 (100.0%) | 0 (0.0%) |
| 25 to 34 Year Olds | 9 (100.0%) | 0 (0.0%) |
| 35 Years and over | 0 (0.0%) | 0 (0.0%) |
| Total | 240 (100.0%) | 0 (0.0%) |
Educational Attainment by Field of Study in Boling
Arts & humanities (131 | 50.6%), computers & mathematics (51 | 19.7%), education (50 | 19.3%), social sciences (10 | 3.9%), and communications (10 | 3.9%) are the most common fields of study among 259 individuals in Boling who have obtained a bachelor's degree or higher.
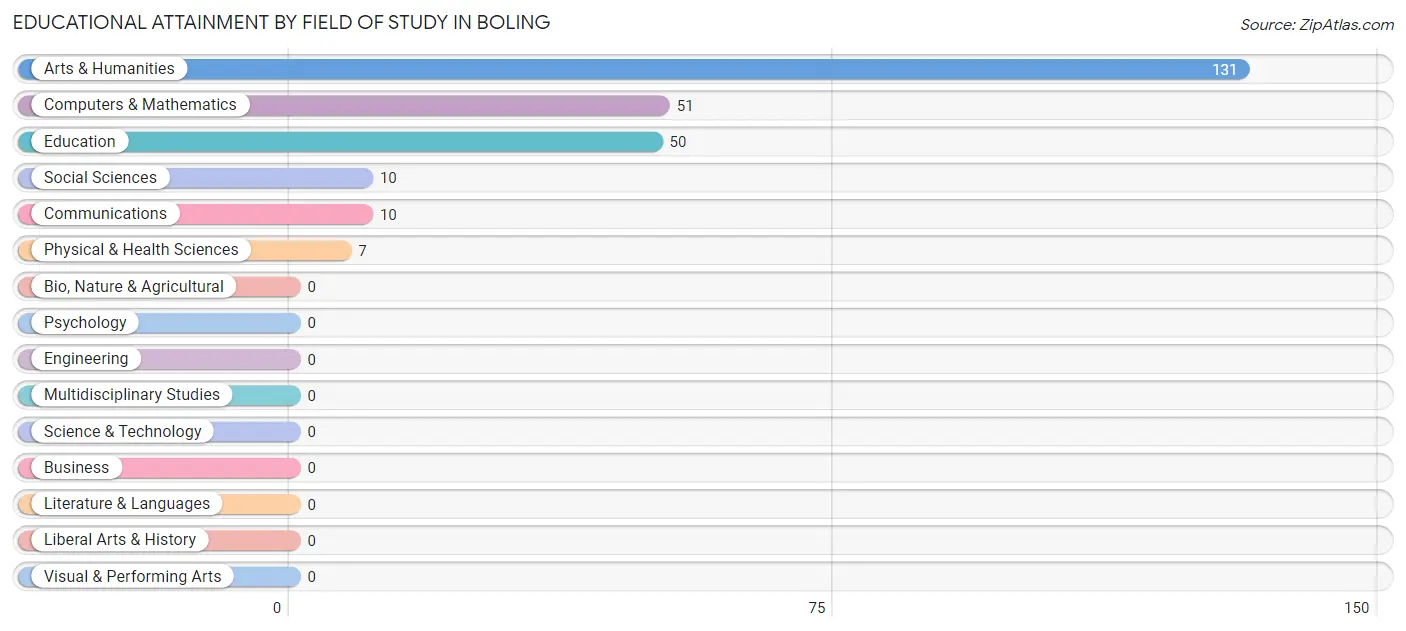
| Field of Study | # Graduates | % Graduates |
| Computers & Mathematics | 51 | 19.7% |
| Bio, Nature & Agricultural | 0 | 0.0% |
| Physical & Health Sciences | 7 | 2.7% |
| Psychology | 0 | 0.0% |
| Social Sciences | 10 | 3.9% |
| Engineering | 0 | 0.0% |
| Multidisciplinary Studies | 0 | 0.0% |
| Science & Technology | 0 | 0.0% |
| Business | 0 | 0.0% |
| Education | 50 | 19.3% |
| Literature & Languages | 0 | 0.0% |
| Liberal Arts & History | 0 | 0.0% |
| Visual & Performing Arts | 0 | 0.0% |
| Communications | 10 | 3.9% |
| Arts & Humanities | 131 | 50.6% |
| Total | 259 | 100.0% |
Transportation & Commute in Boling
Vehicle Availability by Sex in Boling
The most prevalent vehicle ownership categories in Boling are males with 2 vehicles (178, accounting for 62.9%) and females with 2 vehicles (50, making up 95.7%).
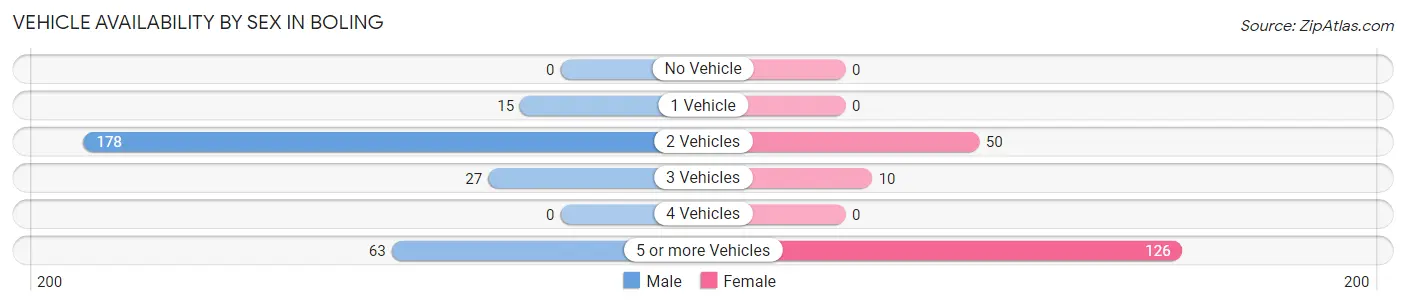
| Vehicles Available | Male | Female |
| No Vehicle | 0 (0.0%) | 0 (0.0%) |
| 1 Vehicle | 15 (5.3%) | 0 (0.0%) |
| 2 Vehicles | 178 (62.9%) | 50 (26.9%) |
| 3 Vehicles | 27 (9.5%) | 10 (5.4%) |
| 4 Vehicles | 0 (0.0%) | 0 (0.0%) |
| 5 or more Vehicles | 63 (22.3%) | 126 (67.7%) |
| Total | 283 (100.0%) | 186 (100.0%) |
Commute Time in Boling
The most frequently occuring commute durations in Boling are 60 to 89 minutes (86 commuters, 18.3%), 30 to 34 minutes (61 commuters, 13.0%), and 15 to 19 minutes (53 commuters, 11.3%).
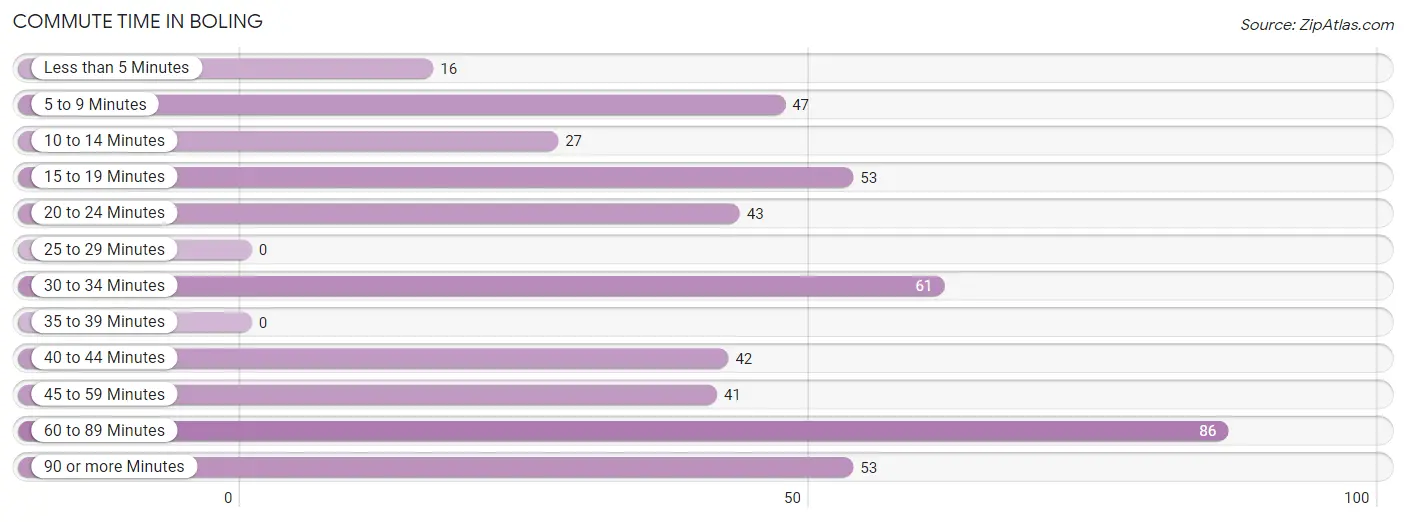
| Commute Time | # Commuters | % Commuters |
| Less than 5 Minutes | 16 | 3.4% |
| 5 to 9 Minutes | 47 | 10.0% |
| 10 to 14 Minutes | 27 | 5.8% |
| 15 to 19 Minutes | 53 | 11.3% |
| 20 to 24 Minutes | 43 | 9.2% |
| 25 to 29 Minutes | 0 | 0.0% |
| 30 to 34 Minutes | 61 | 13.0% |
| 35 to 39 Minutes | 0 | 0.0% |
| 40 to 44 Minutes | 42 | 9.0% |
| 45 to 59 Minutes | 41 | 8.7% |
| 60 to 89 Minutes | 86 | 18.3% |
| 90 or more Minutes | 53 | 11.3% |
Commute Time by Sex in Boling
The most common commute times in Boling are 30 to 34 minutes (61 commuters, 21.5%) for males and 60 to 89 minutes (86 commuters, 46.2%) for females.
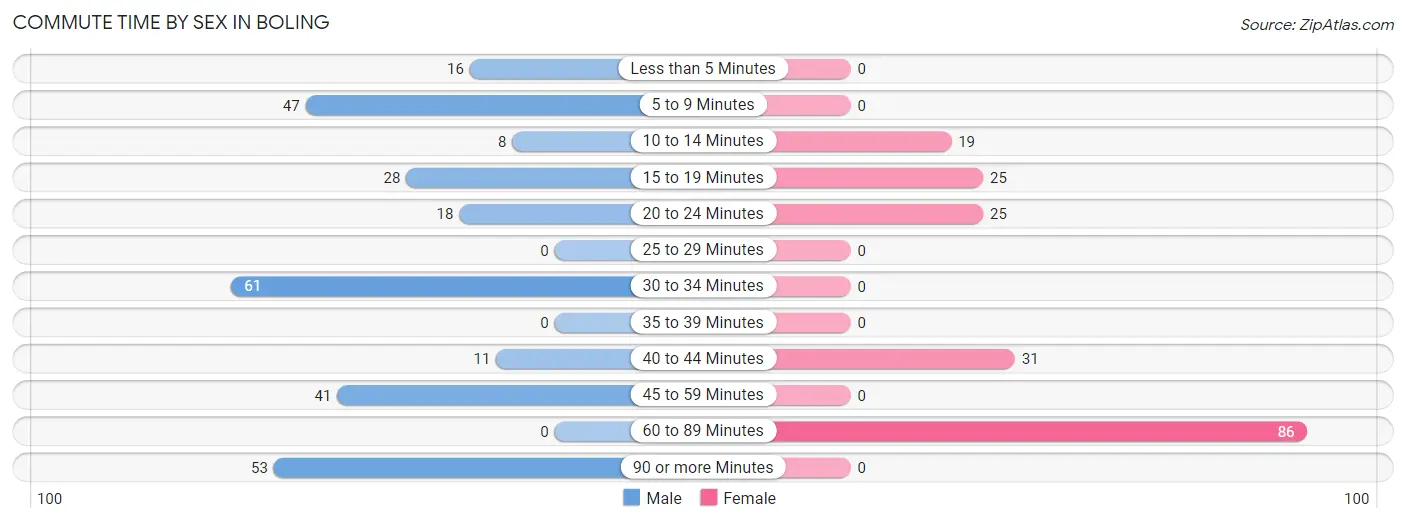
| Commute Time | Male | Female |
| Less than 5 Minutes | 16 (5.7%) | 0 (0.0%) |
| 5 to 9 Minutes | 47 (16.6%) | 0 (0.0%) |
| 10 to 14 Minutes | 8 (2.8%) | 19 (10.2%) |
| 15 to 19 Minutes | 28 (9.9%) | 25 (13.4%) |
| 20 to 24 Minutes | 18 (6.4%) | 25 (13.4%) |
| 25 to 29 Minutes | 0 (0.0%) | 0 (0.0%) |
| 30 to 34 Minutes | 61 (21.5%) | 0 (0.0%) |
| 35 to 39 Minutes | 0 (0.0%) | 0 (0.0%) |
| 40 to 44 Minutes | 11 (3.9%) | 31 (16.7%) |
| 45 to 59 Minutes | 41 (14.5%) | 0 (0.0%) |
| 60 to 89 Minutes | 0 (0.0%) | 86 (46.2%) |
| 90 or more Minutes | 53 (18.7%) | 0 (0.0%) |
Time of Departure to Work by Sex in Boling
The most frequent times of departure to work in Boling are 12:00 AM to 4:59 AM (117, 41.3%) for males and 9:00 AM to 9:59 AM (86, 46.2%) for females.
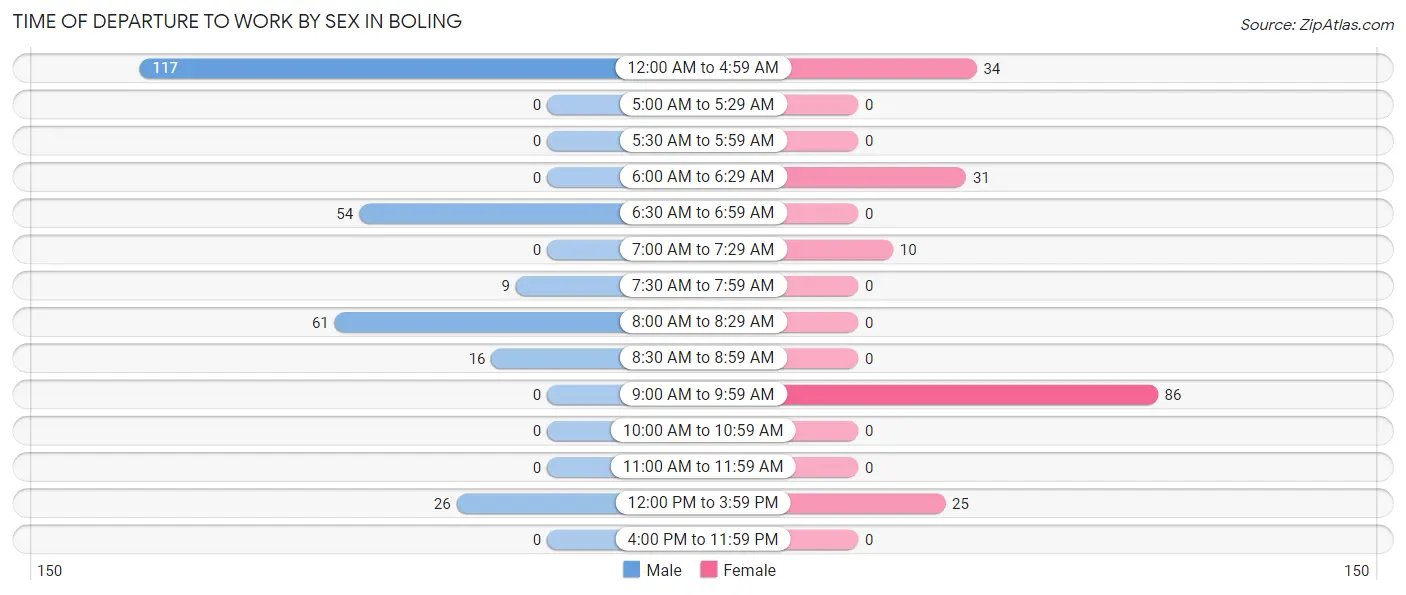
| Time of Departure | Male | Female |
| 12:00 AM to 4:59 AM | 117 (41.3%) | 34 (18.3%) |
| 5:00 AM to 5:29 AM | 0 (0.0%) | 0 (0.0%) |
| 5:30 AM to 5:59 AM | 0 (0.0%) | 0 (0.0%) |
| 6:00 AM to 6:29 AM | 0 (0.0%) | 31 (16.7%) |
| 6:30 AM to 6:59 AM | 54 (19.1%) | 0 (0.0%) |
| 7:00 AM to 7:29 AM | 0 (0.0%) | 10 (5.4%) |
| 7:30 AM to 7:59 AM | 9 (3.2%) | 0 (0.0%) |
| 8:00 AM to 8:29 AM | 61 (21.5%) | 0 (0.0%) |
| 8:30 AM to 8:59 AM | 16 (5.7%) | 0 (0.0%) |
| 9:00 AM to 9:59 AM | 0 (0.0%) | 86 (46.2%) |
| 10:00 AM to 10:59 AM | 0 (0.0%) | 0 (0.0%) |
| 11:00 AM to 11:59 AM | 0 (0.0%) | 0 (0.0%) |
| 12:00 PM to 3:59 PM | 26 (9.2%) | 25 (13.4%) |
| 4:00 PM to 11:59 PM | 0 (0.0%) | 0 (0.0%) |
| Total | 283 (100.0%) | 186 (100.0%) |
Housing Occupancy in Boling
Occupancy by Ownership in Boling
Of the total 372 dwellings in Boling, owner-occupied units account for 233 (62.6%), while renter-occupied units make up 139 (37.4%).
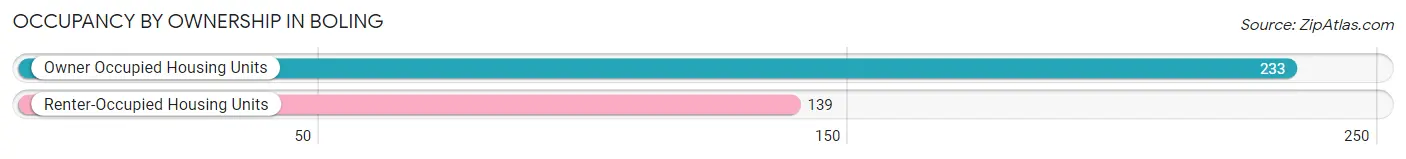
| Occupancy | # Housing Units | % Housing Units |
| Owner Occupied Housing Units | 233 | 62.6% |
| Renter-Occupied Housing Units | 139 | 37.4% |
| Total Occupied Housing Units | 372 | 100.0% |
Occupancy by Household Size in Boling
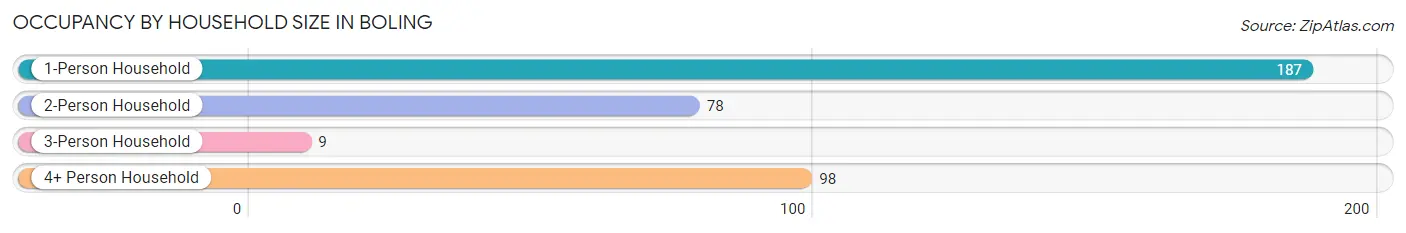
| Household Size | # Housing Units | % Housing Units |
| 1-Person Household | 187 | 50.3% |
| 2-Person Household | 78 | 21.0% |
| 3-Person Household | 9 | 2.4% |
| 4+ Person Household | 98 | 26.3% |
| Total Housing Units | 372 | 100.0% |
Occupancy by Ownership by Household Size in Boling
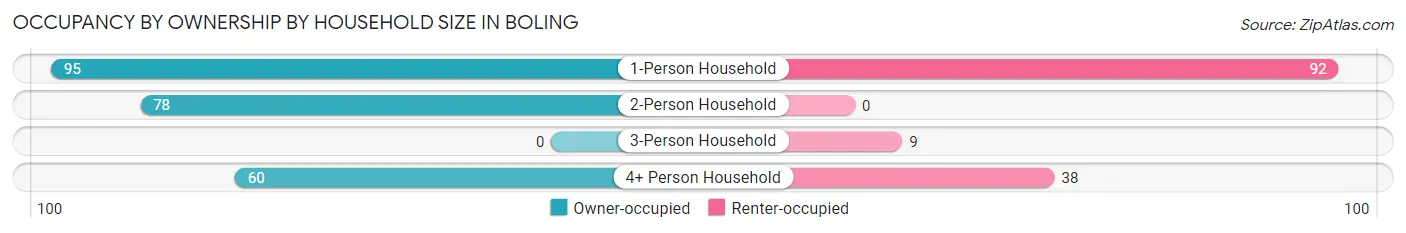
| Household Size | Owner-occupied | Renter-occupied |
| 1-Person Household | 95 (50.8%) | 92 (49.2%) |
| 2-Person Household | 78 (100.0%) | 0 (0.0%) |
| 3-Person Household | 0 (0.0%) | 9 (100.0%) |
| 4+ Person Household | 60 (61.2%) | 38 (38.8%) |
| Total Housing Units | 233 (62.6%) | 139 (37.4%) |
Occupancy by Educational Attainment in Boling
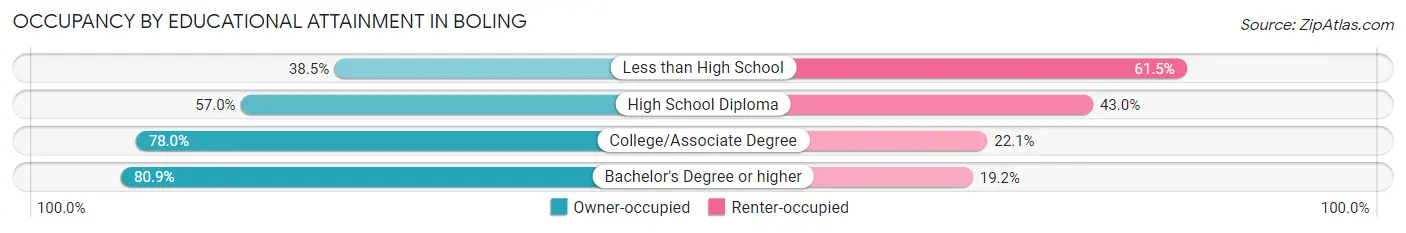
| Household Size | Owner-occupied | Renter-occupied |
| Less than High School | 35 (38.5%) | 56 (61.5%) |
| High School Diploma | 61 (57.0%) | 46 (43.0%) |
| College/Associate Degree | 99 (77.9%) | 28 (22.1%) |
| Bachelor's Degree or higher | 38 (80.8%) | 9 (19.2%) |
Occupancy by Age of Householder in Boling
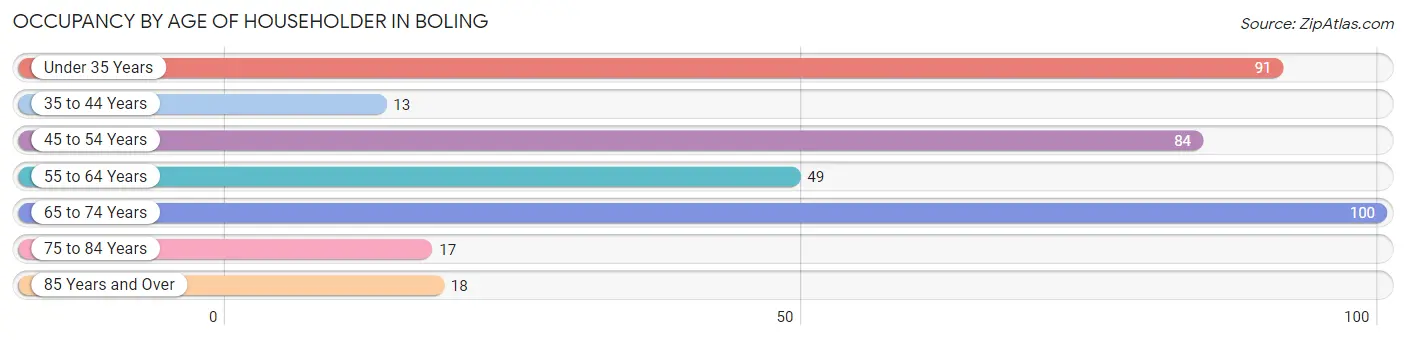
| Age Bracket | # Households | % Households |
| Under 35 Years | 91 | 24.5% |
| 35 to 44 Years | 13 | 3.5% |
| 45 to 54 Years | 84 | 22.6% |
| 55 to 64 Years | 49 | 13.2% |
| 65 to 74 Years | 100 | 26.9% |
| 75 to 84 Years | 17 | 4.6% |
| 85 Years and Over | 18 | 4.8% |
| Total | 372 | 100.0% |
Housing Finances in Boling
Median Income by Occupancy in Boling
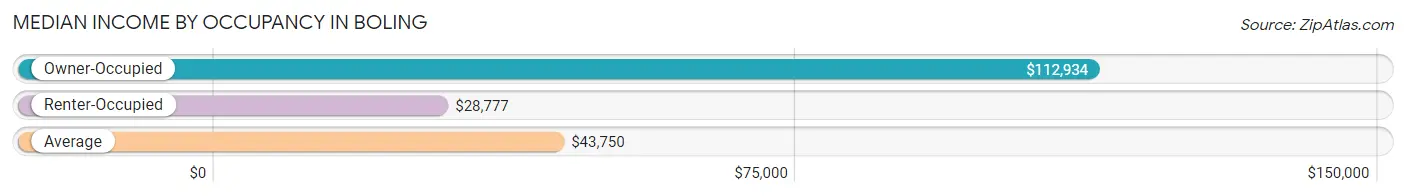
| Occupancy Type | # Households | Median Income |
| Owner-Occupied | 233 (62.6%) | $112,934 |
| Renter-Occupied | 139 (37.4%) | $28,777 |
| Average | 372 (100.0%) | $43,750 |
Occupancy by Householder Income Bracket in Boling
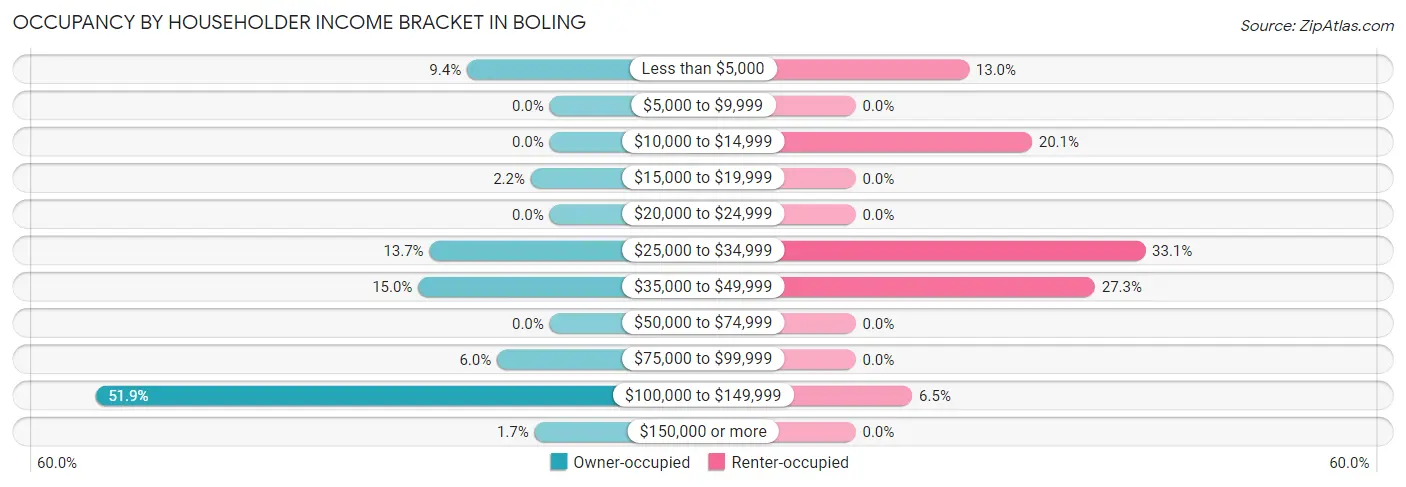
| Income Bracket | Owner-occupied | Renter-occupied |
| Less than $5,000 | 22 (9.4%) | 18 (13.0%) |
| $5,000 to $9,999 | 0 (0.0%) | 0 (0.0%) |
| $10,000 to $14,999 | 0 (0.0%) | 28 (20.1%) |
| $15,000 to $19,999 | 5 (2.1%) | 0 (0.0%) |
| $20,000 to $24,999 | 0 (0.0%) | 0 (0.0%) |
| $25,000 to $34,999 | 32 (13.7%) | 46 (33.1%) |
| $35,000 to $49,999 | 35 (15.0%) | 38 (27.3%) |
| $50,000 to $74,999 | 0 (0.0%) | 0 (0.0%) |
| $75,000 to $99,999 | 14 (6.0%) | 0 (0.0%) |
| $100,000 to $149,999 | 121 (51.9%) | 9 (6.5%) |
| $150,000 or more | 4 (1.7%) | 0 (0.0%) |
| Total | 233 (100.0%) | 139 (100.0%) |
Monthly Housing Cost Tiers in Boling
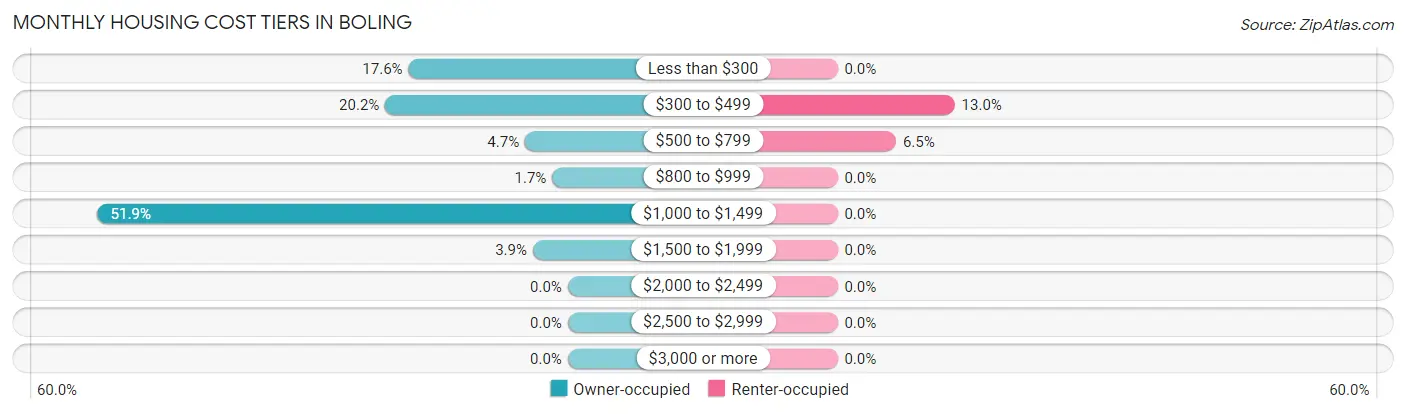
| Monthly Cost | Owner-occupied | Renter-occupied |
| Less than $300 | 41 (17.6%) | 0 (0.0%) |
| $300 to $499 | 47 (20.2%) | 18 (13.0%) |
| $500 to $799 | 11 (4.7%) | 9 (6.5%) |
| $800 to $999 | 4 (1.7%) | 0 (0.0%) |
| $1,000 to $1,499 | 121 (51.9%) | 0 (0.0%) |
| $1,500 to $1,999 | 9 (3.9%) | 0 (0.0%) |
| $2,000 to $2,499 | 0 (0.0%) | 0 (0.0%) |
| $2,500 to $2,999 | 0 (0.0%) | 0 (0.0%) |
| $3,000 or more | 0 (0.0%) | 0 (0.0%) |
| Total | 233 (100.0%) | 139 (100.0%) |
Physical Housing Characteristics in Boling
Housing Structures in Boling
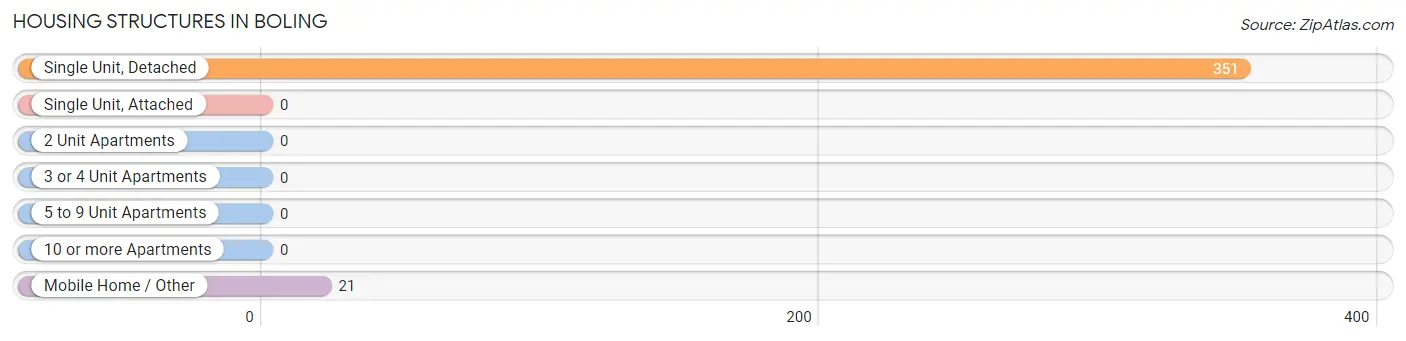
| Structure Type | # Housing Units | % Housing Units |
| Single Unit, Detached | 351 | 94.4% |
| Single Unit, Attached | 0 | 0.0% |
| 2 Unit Apartments | 0 | 0.0% |
| 3 or 4 Unit Apartments | 0 | 0.0% |
| 5 to 9 Unit Apartments | 0 | 0.0% |
| 10 or more Apartments | 0 | 0.0% |
| Mobile Home / Other | 21 | 5.7% |
| Total | 372 | 100.0% |
Housing Structures by Occupancy in Boling
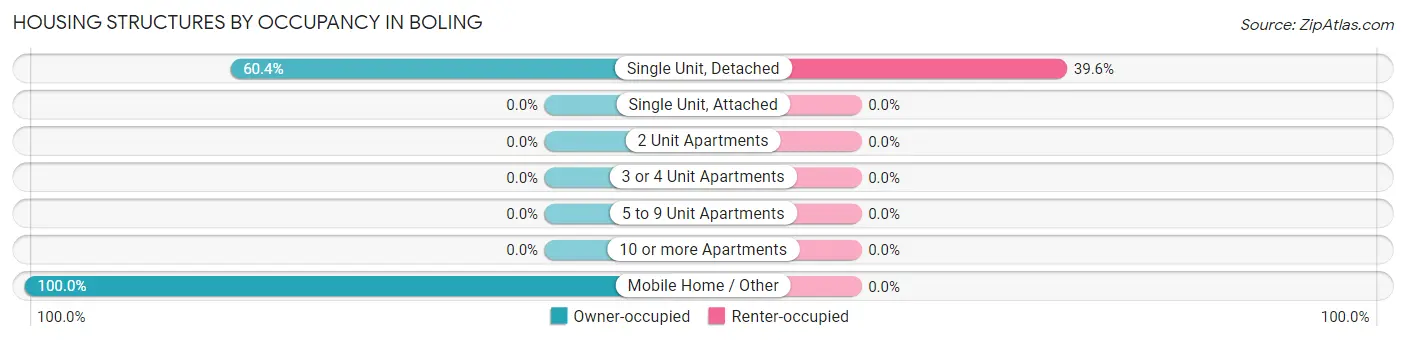
| Structure Type | Owner-occupied | Renter-occupied |
| Single Unit, Detached | 212 (60.4%) | 139 (39.6%) |
| Single Unit, Attached | 0 (0.0%) | 0 (0.0%) |
| 2 Unit Apartments | 0 (0.0%) | 0 (0.0%) |
| 3 or 4 Unit Apartments | 0 (0.0%) | 0 (0.0%) |
| 5 to 9 Unit Apartments | 0 (0.0%) | 0 (0.0%) |
| 10 or more Apartments | 0 (0.0%) | 0 (0.0%) |
| Mobile Home / Other | 21 (100.0%) | 0 (0.0%) |
| Total | 233 (62.6%) | 139 (37.4%) |
Housing Structures by Number of Rooms in Boling
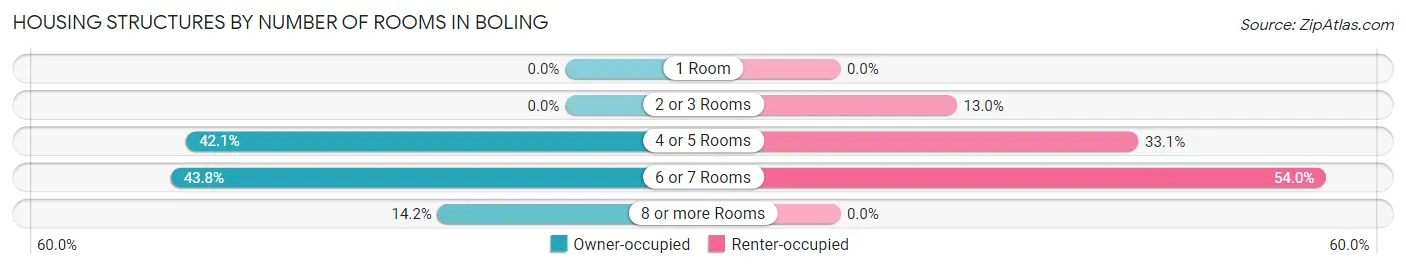
| Number of Rooms | Owner-occupied | Renter-occupied |
| 1 Room | 0 (0.0%) | 0 (0.0%) |
| 2 or 3 Rooms | 0 (0.0%) | 18 (13.0%) |
| 4 or 5 Rooms | 98 (42.1%) | 46 (33.1%) |
| 6 or 7 Rooms | 102 (43.8%) | 75 (54.0%) |
| 8 or more Rooms | 33 (14.2%) | 0 (0.0%) |
| Total | 233 (100.0%) | 139 (100.0%) |
Housing Structure by Heating Type in Boling
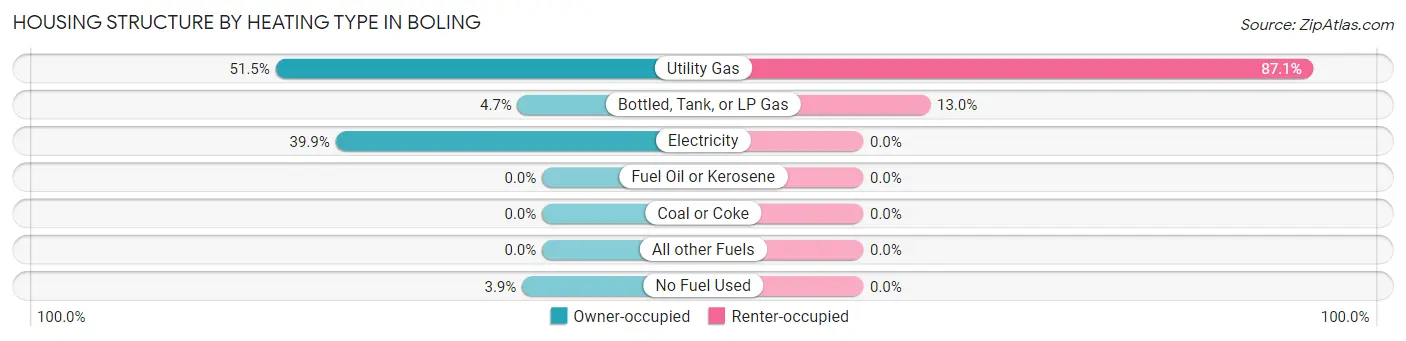
| Heating Type | Owner-occupied | Renter-occupied |
| Utility Gas | 120 (51.5%) | 121 (87.1%) |
| Bottled, Tank, or LP Gas | 11 (4.7%) | 18 (13.0%) |
| Electricity | 93 (39.9%) | 0 (0.0%) |
| Fuel Oil or Kerosene | 0 (0.0%) | 0 (0.0%) |
| Coal or Coke | 0 (0.0%) | 0 (0.0%) |
| All other Fuels | 0 (0.0%) | 0 (0.0%) |
| No Fuel Used | 9 (3.9%) | 0 (0.0%) |
| Total | 233 (100.0%) | 139 (100.0%) |
Household Vehicle Usage in Boling
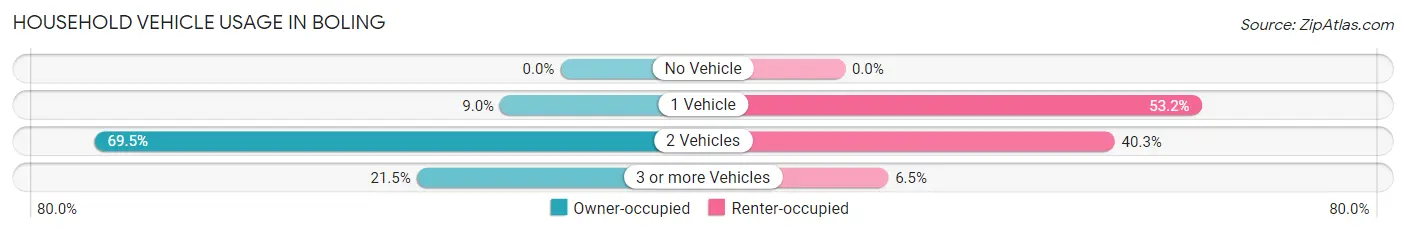
| Vehicles per Household | Owner-occupied | Renter-occupied |
| No Vehicle | 0 (0.0%) | 0 (0.0%) |
| 1 Vehicle | 21 (9.0%) | 74 (53.2%) |
| 2 Vehicles | 162 (69.5%) | 56 (40.3%) |
| 3 or more Vehicles | 50 (21.5%) | 9 (6.5%) |
| Total | 233 (100.0%) | 139 (100.0%) |
Real Estate & Mortgages in Boling
Real Estate and Mortgage Overview in Boling
| Characteristic | Without Mortgage | With Mortgage |
| Housing Units | 91 | 142 |
| Median Property Value | $121,100 | $155,100 |
| Median Household Income | $41,172 | $0 |
| Monthly Housing Costs | $413 | $0 |
| Real Estate Taxes | $1,493 | $0 |
Property Value by Mortgage Status in Boling
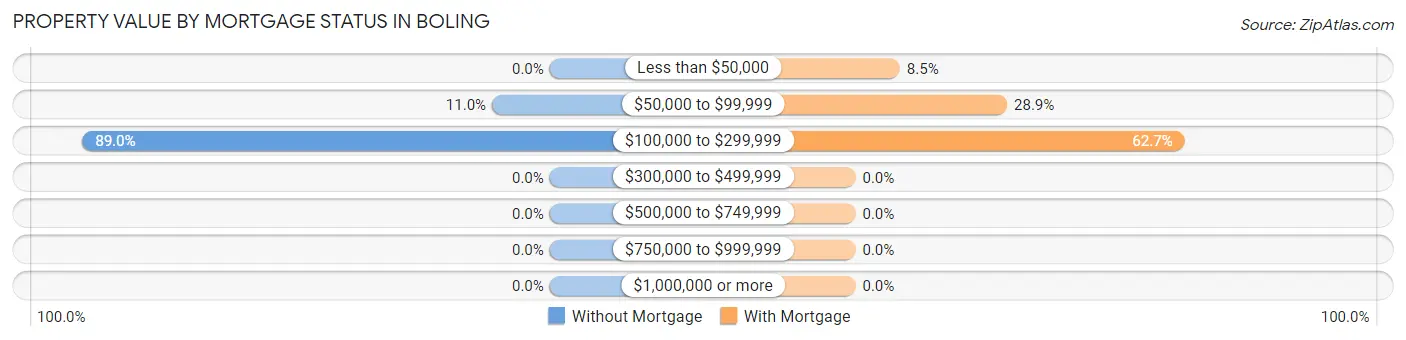
| Property Value | Without Mortgage | With Mortgage |
| Less than $50,000 | 0 (0.0%) | 12 (8.5%) |
| $50,000 to $99,999 | 10 (11.0%) | 41 (28.9%) |
| $100,000 to $299,999 | 81 (89.0%) | 89 (62.7%) |
| $300,000 to $499,999 | 0 (0.0%) | 0 (0.0%) |
| $500,000 to $749,999 | 0 (0.0%) | 0 (0.0%) |
| $750,000 to $999,999 | 0 (0.0%) | 0 (0.0%) |
| $1,000,000 or more | 0 (0.0%) | 0 (0.0%) |
| Total | 91 (100.0%) | 142 (100.0%) |
Household Income by Mortgage Status in Boling
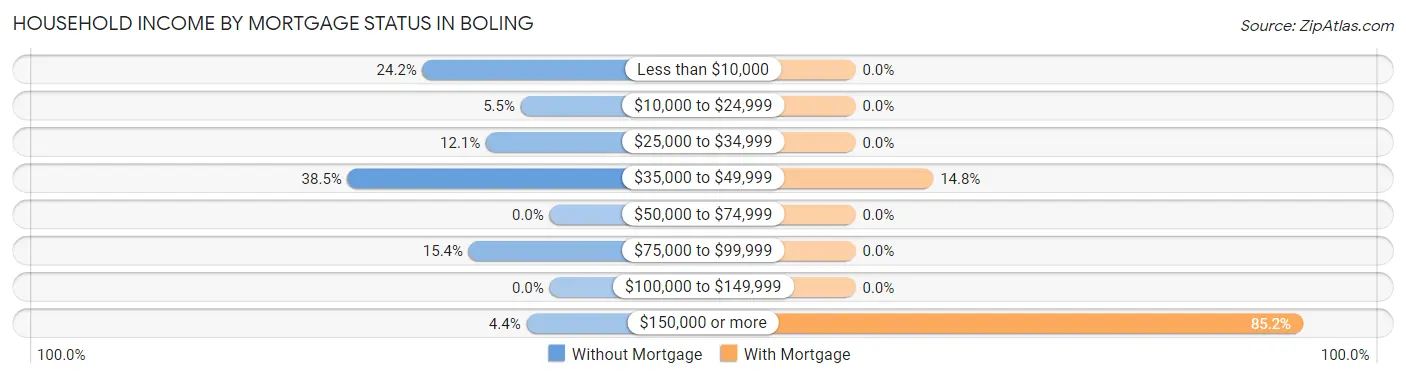
| Household Income | Without Mortgage | With Mortgage |
| Less than $10,000 | 22 (24.2%) | 0 (0.0%) |
| $10,000 to $24,999 | 5 (5.5%) | 0 (0.0%) |
| $25,000 to $34,999 | 11 (12.1%) | 0 (0.0%) |
| $35,000 to $49,999 | 35 (38.5%) | 21 (14.8%) |
| $50,000 to $74,999 | 0 (0.0%) | 0 (0.0%) |
| $75,000 to $99,999 | 14 (15.4%) | 0 (0.0%) |
| $100,000 to $149,999 | 0 (0.0%) | 0 (0.0%) |
| $150,000 or more | 4 (4.4%) | 121 (85.2%) |
| Total | 91 (100.0%) | 142 (100.0%) |
Property Value to Household Income Ratio in Boling
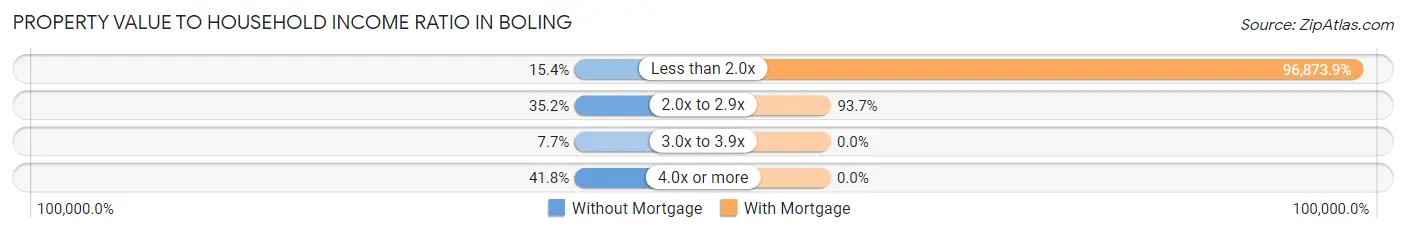
| Value-to-Income Ratio | Without Mortgage | With Mortgage |
| Less than 2.0x | 14 (15.4%) | 137,561 (96,873.9%) |
| 2.0x to 2.9x | 32 (35.2%) | 133 (93.7%) |
| 3.0x to 3.9x | 7 (7.7%) | 0 (0.0%) |
| 4.0x or more | 38 (41.8%) | 0 (0.0%) |
| Total | 91 (100.0%) | 142 (100.0%) |
Real Estate Taxes by Mortgage Status in Boling
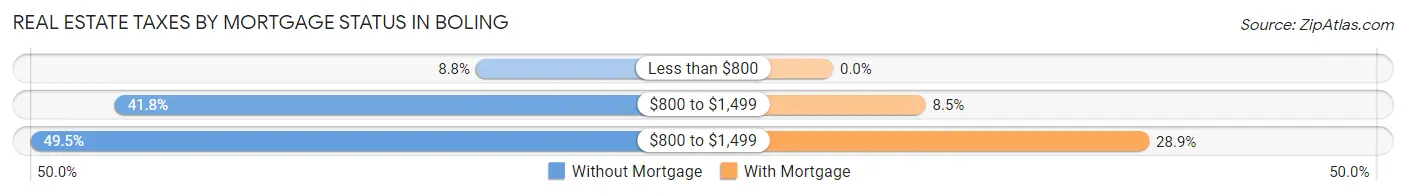
| Property Taxes | Without Mortgage | With Mortgage |
| Less than $800 | 8 (8.8%) | 0 (0.0%) |
| $800 to $1,499 | 38 (41.8%) | 12 (8.5%) |
| $800 to $1,499 | 45 (49.4%) | 41 (28.9%) |
| Total | 91 (100.0%) | 142 (100.0%) |
Health & Disability in Boling
Health Insurance Coverage by Age in Boling

| Age Bracket | With Coverage | Without Coverage |
| Under 6 Years | 97 (100.0%) | 0 (0.0%) |
| 6 to 18 Years | 115 (100.0%) | 0 (0.0%) |
| 19 to 25 Years | 169 (67.9%) | 80 (32.1%) |
| 26 to 34 Years | 11 (9.8%) | 101 (90.2%) |
| 35 to 44 Years | 31 (67.4%) | 15 (32.6%) |
| 45 to 54 Years | 135 (100.0%) | 0 (0.0%) |
| 55 to 64 Years | 110 (81.5%) | 25 (18.5%) |
| 65 to 74 Years | 120 (100.0%) | 0 (0.0%) |
| 75 Years and older | 35 (100.0%) | 0 (0.0%) |
| Total | 823 (78.8%) | 221 (21.2%) |
Health Insurance Coverage by Citizenship Status in Boling
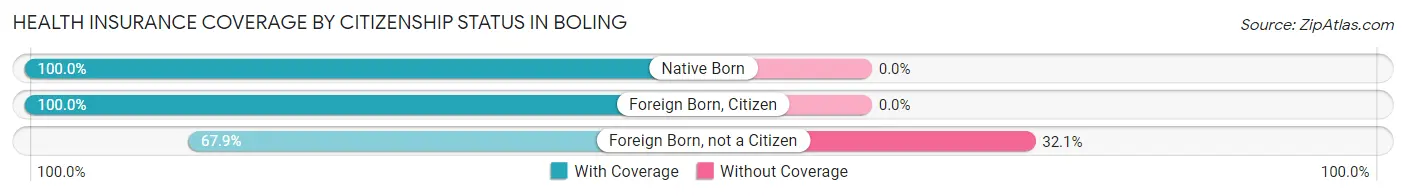
| Citizenship Status | With Coverage | Without Coverage |
| Native Born | 97 (100.0%) | 0 (0.0%) |
| Foreign Born, Citizen | 115 (100.0%) | 0 (0.0%) |
| Foreign Born, not a Citizen | 169 (67.9%) | 80 (32.1%) |
Health Insurance Coverage by Household Income in Boling
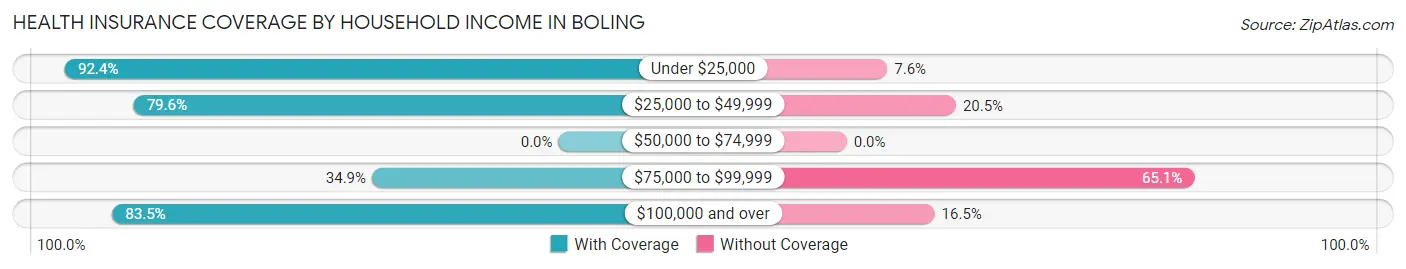
| Household Income | With Coverage | Without Coverage |
| Under $25,000 | 73 (92.4%) | 6 (7.6%) |
| $25,000 to $49,999 | 315 (79.5%) | 81 (20.4%) |
| $50,000 to $74,999 | 0 (0.0%) | 0 (0.0%) |
| $75,000 to $99,999 | 29 (34.9%) | 54 (65.1%) |
| $100,000 and over | 406 (83.5%) | 80 (16.5%) |
Public vs Private Health Insurance Coverage by Age in Boling
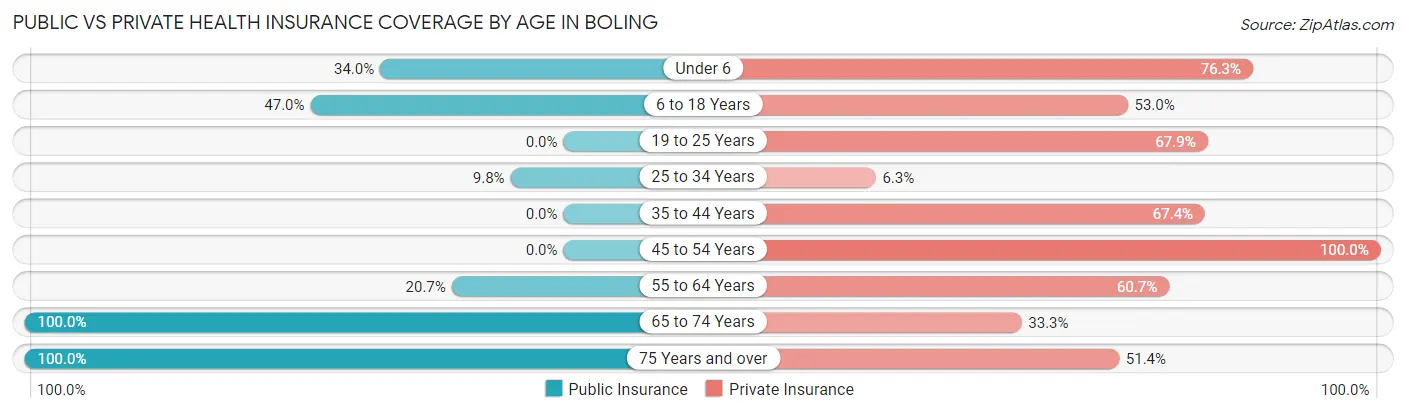
| Age Bracket | Public Insurance | Private Insurance |
| Under 6 | 33 (34.0%) | 74 (76.3%) |
| 6 to 18 Years | 54 (47.0%) | 61 (53.0%) |
| 19 to 25 Years | 0 (0.0%) | 169 (67.9%) |
| 25 to 34 Years | 11 (9.8%) | 7 (6.2%) |
| 35 to 44 Years | 0 (0.0%) | 31 (67.4%) |
| 45 to 54 Years | 0 (0.0%) | 135 (100.0%) |
| 55 to 64 Years | 28 (20.7%) | 82 (60.7%) |
| 65 to 74 Years | 120 (100.0%) | 40 (33.3%) |
| 75 Years and over | 35 (100.0%) | 18 (51.4%) |
| Total | 281 (26.9%) | 617 (59.1%) |
Disability Status by Sex by Age in Boling
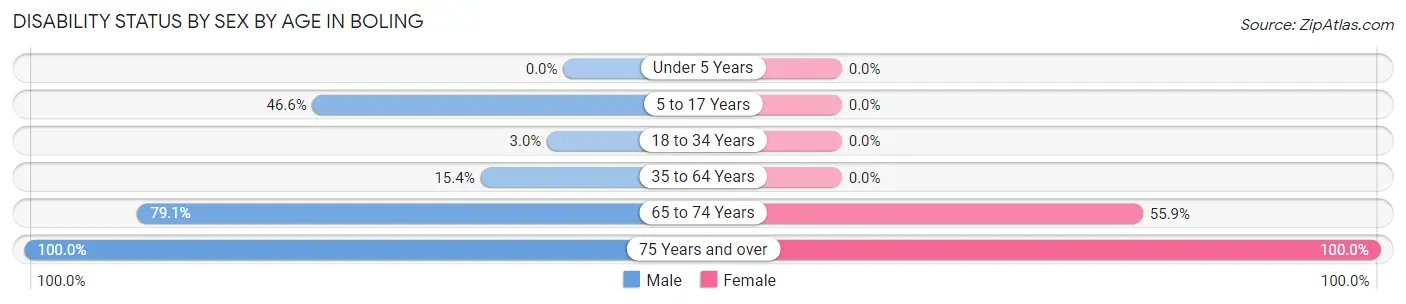
| Age Bracket | Male | Female |
| Under 5 Years | 0 (0.0%) | 0 (0.0%) |
| 5 to 17 Years | 27 (46.6%) | 0 (0.0%) |
| 18 to 34 Years | 6 (3.0%) | 0 (0.0%) |
| 35 to 64 Years | 28 (15.4%) | 0 (0.0%) |
| 65 to 74 Years | 68 (79.1%) | 19 (55.9%) |
| 75 Years and over | 24 (100.0%) | 11 (100.0%) |
Disability Class by Sex by Age in Boling
Disability Class: Hearing Difficulty
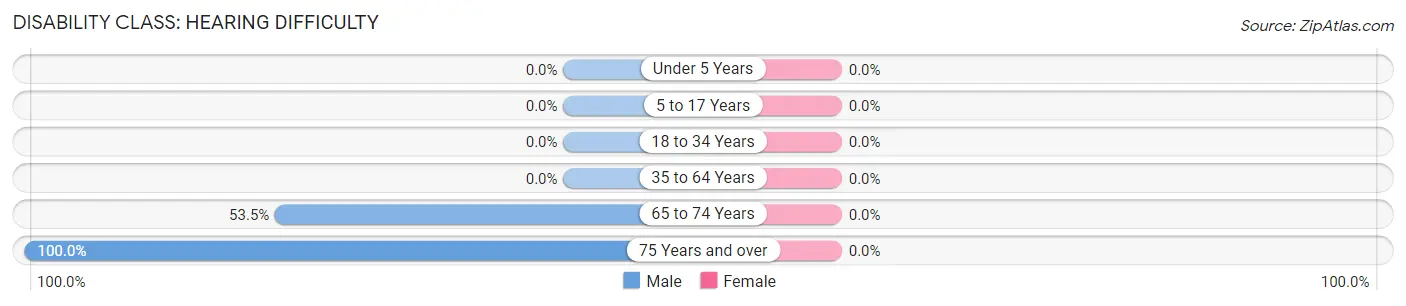
| Age Bracket | Male | Female |
| Under 5 Years | 0 (0.0%) | 0 (0.0%) |
| 5 to 17 Years | 0 (0.0%) | 0 (0.0%) |
| 18 to 34 Years | 0 (0.0%) | 0 (0.0%) |
| 35 to 64 Years | 0 (0.0%) | 0 (0.0%) |
| 65 to 74 Years | 46 (53.5%) | 0 (0.0%) |
| 75 Years and over | 24 (100.0%) | 0 (0.0%) |
Disability Class: Vision Difficulty
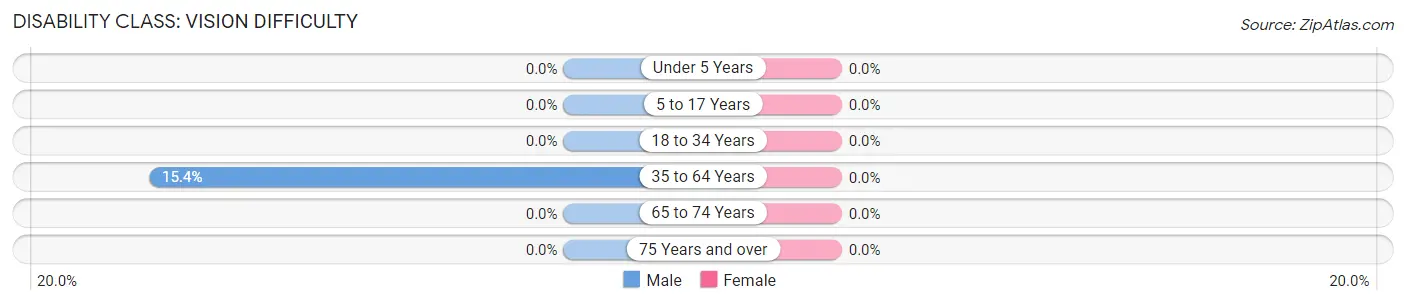
| Age Bracket | Male | Female |
| Under 5 Years | 0 (0.0%) | 0 (0.0%) |
| 5 to 17 Years | 0 (0.0%) | 0 (0.0%) |
| 18 to 34 Years | 0 (0.0%) | 0 (0.0%) |
| 35 to 64 Years | 28 (15.4%) | 0 (0.0%) |
| 65 to 74 Years | 0 (0.0%) | 0 (0.0%) |
| 75 Years and over | 0 (0.0%) | 0 (0.0%) |
Disability Class: Cognitive Difficulty
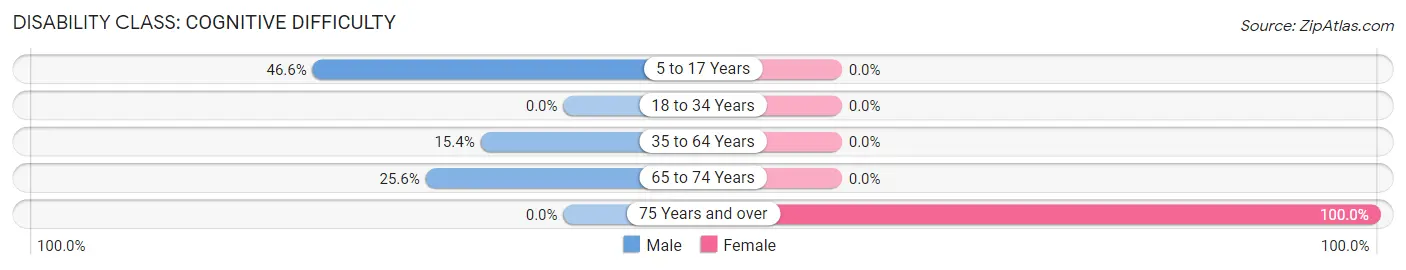
| Age Bracket | Male | Female |
| 5 to 17 Years | 27 (46.6%) | 0 (0.0%) |
| 18 to 34 Years | 0 (0.0%) | 0 (0.0%) |
| 35 to 64 Years | 28 (15.4%) | 0 (0.0%) |
| 65 to 74 Years | 22 (25.6%) | 0 (0.0%) |
| 75 Years and over | 0 (0.0%) | 11 (100.0%) |
Disability Class: Ambulatory Difficulty
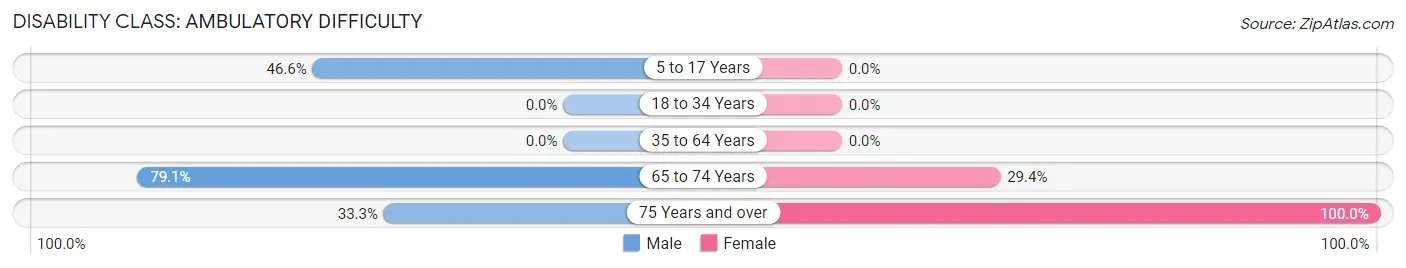
| Age Bracket | Male | Female |
| 5 to 17 Years | 27 (46.6%) | 0 (0.0%) |
| 18 to 34 Years | 0 (0.0%) | 0 (0.0%) |
| 35 to 64 Years | 0 (0.0%) | 0 (0.0%) |
| 65 to 74 Years | 68 (79.1%) | 10 (29.4%) |
| 75 Years and over | 8 (33.3%) | 11 (100.0%) |
Disability Class: Self-Care Difficulty
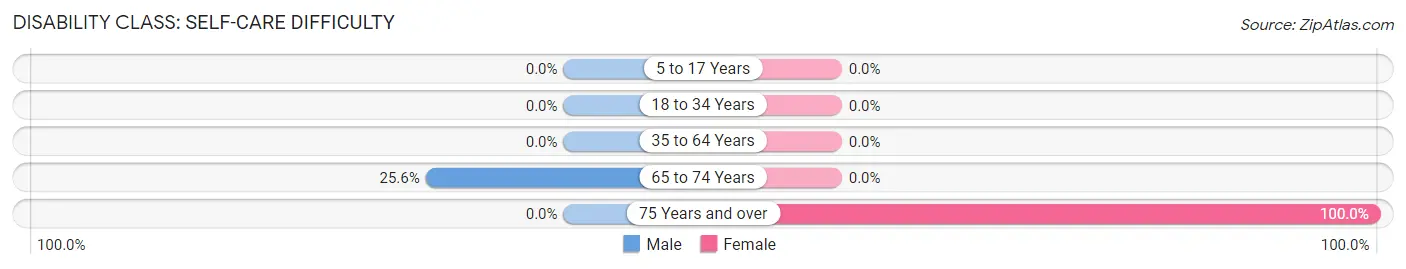
| Age Bracket | Male | Female |
| 5 to 17 Years | 0 (0.0%) | 0 (0.0%) |
| 18 to 34 Years | 0 (0.0%) | 0 (0.0%) |
| 35 to 64 Years | 0 (0.0%) | 0 (0.0%) |
| 65 to 74 Years | 22 (25.6%) | 0 (0.0%) |
| 75 Years and over | 0 (0.0%) | 11 (100.0%) |
Technology Access in Boling
Computing Device Access in Boling
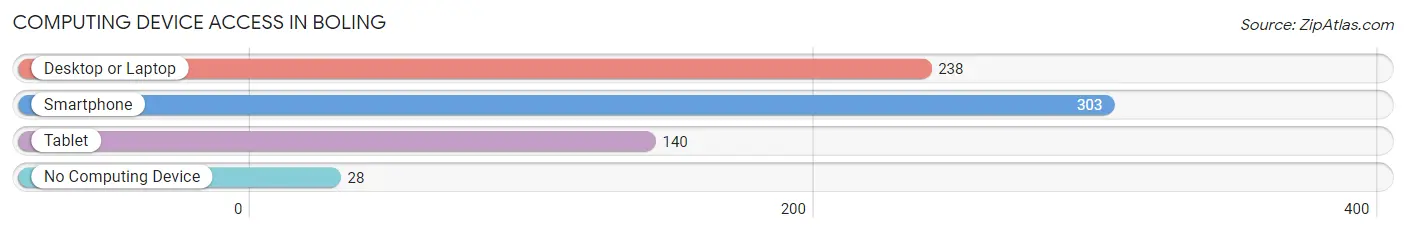
| Device Type | # Households | % Households |
| Desktop or Laptop | 238 | 64.0% |
| Smartphone | 303 | 81.5% |
| Tablet | 140 | 37.6% |
| No Computing Device | 28 | 7.5% |
| Total | 372 | 100.0% |
Internet Access in Boling
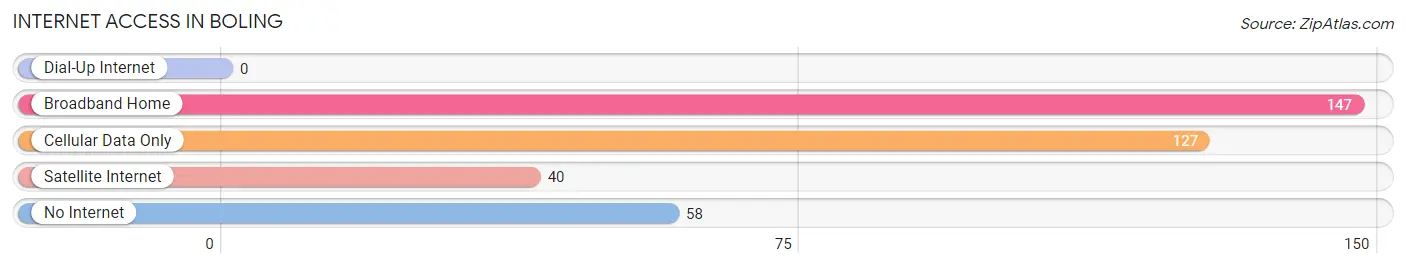
| Internet Type | # Households | % Households |
| Dial-Up Internet | 0 | 0.0% |
| Broadband Home | 147 | 39.5% |
| Cellular Data Only | 127 | 34.1% |
| Satellite Internet | 40 | 10.7% |
| No Internet | 58 | 15.6% |
| Total | 372 | 100.0% |
Boling Summary
Boling is a small town located in Wharton County, Texas, United States. The population was 1,093 at the 2010 census. It is part of the Houston–The Woodlands–Sugar Land metropolitan area.
History
Boling was founded in 1894 by the Boling family, who had moved to the area from Alabama. The town was named after the family, and the first post office was established in 1895. The town grew slowly, and by the 1930s it had a population of around 200.
In the 1940s, the town began to grow rapidly due to the discovery of oil in the area. The population increased to over 1,000 by the 1950s, and the town was incorporated in 1956.
Geography
Boling is located at the intersection of State Highway 35 and Farm to Market Road 442, about 25 miles south of Wharton and 40 miles southwest of Houston. The town is situated on the banks of the San Bernard River, and is surrounded by rolling hills and farmland.
The climate in Boling is hot and humid in the summer, and mild in the winter. The average annual temperature is around 70°F, and the average annual precipitation is around 40 inches.
Economy
The economy of Boling is largely based on agriculture and oil production. The town is home to several large farms, and the surrounding area is known for its production of cotton, corn, and soybeans.
The oil industry is also an important part of the local economy. There are several oil wells in the area, and the town is home to several oil-related businesses.
Demographics
As of the 2010 census, the population of Boling was 1,093. The racial makeup of the town was 79.3% White, 16.2% Hispanic or Latino, 1.2% African American, 0.7% Native American, 0.3% Asian, and 2.5% from other races.
The median household income in Boling was $37,917, and the median family income was $45,625. The per capita income was $17,845. About 17.3% of the population was below the poverty line.
Conclusion
Boling is a small town located in Wharton County, Texas. It was founded in 1894 by the Boling family, and the town has grown steadily since then. The economy of Boling is largely based on agriculture and oil production, and the town has a population of 1,093 as of the 2010 census. Boling is a diverse community, with a mix of races and ethnicities, and a median household income of $37,917.
Common Questions
What is Per Capita Income in Boling?
Per Capita income in Boling is $27,143.
What is the Median Household income in Boling?
Median Household Income in Boling is $43,750.
What is Inequality or Gini Index in Boling?
Inequality or Gini Index in Boling is 0.44.
What is the Total Population of Boling?
Total Population of Boling is 1,044.
What is the Total Male Population of Boling?
Total Male Population of Boling is 624.
What is the Total Female Population of Boling?
Total Female Population of Boling is 420.
What is the Ratio of Males per 100 Females in Boling?
There are 148.57 Males per 100 Females in Boling.
What is the Ratio of Females per 100 Males in Boling?
There are 67.31 Females per 100 Males in Boling.
What is the Median Population Age in Boling?
Median Population Age in Boling is 32.2 Years.
What is the Average Family Size in Boling
Average Family Size in Boling is 4.6 People.
What is the Average Household Size in Boling
Average Household Size in Boling is 2.8 People.
How Large is the Labor Force in Boling?
There are 549 People in the Labor Forcein in Boling.
What is the Percentage of People in the Labor Force in Boling?
63.9% of People are in the Labor Force in Boling.
What is the Unemployment Rate in Boling?
Unemployment Rate in Boling is 14.6%.