Blue Ridge, TX Map & Demographics
Blue Ridge Map
Blue Ridge Overview
$29,110
PER CAPITA INCOME
$82,083
AVG FAMILY INCOME
$75,167
AVG HOUSEHOLD INCOME
7.9%
WAGE / INCOME GAP [ % ]
92.1¢/ $1
WAGE / INCOME GAP [ $ ]
0.37
INEQUALITY / GINI INDEX
982
TOTAL POPULATION
521
MALE POPULATION
461
FEMALE POPULATION
113.02
MALES / 100 FEMALES
88.48
FEMALES / 100 MALES
34.1
MEDIAN AGE
3.4
AVG FAMILY SIZE
3.1
AVG HOUSEHOLD SIZE
524
LABOR FORCE [ PEOPLE ]
72.5%
PERCENT IN LABOR FORCE
3.1%
UNEMPLOYMENT RATE
Blue Ridge Zip Codes
Income in Blue Ridge
Income Overview in Blue Ridge
Per Capita Income in Blue Ridge is $29,110, while median incomes of families and households are $82,083 and $75,167 respectively.
| Characteristic | Number | Measure |
| Per Capita Income | 982 | $29,110 |
| Median Family Income | 249 | $82,083 |
| Mean Family Income | 249 | $91,771 |
| Median Household Income | 314 | $75,167 |
| Mean Household Income | 314 | $89,863 |
| Income Deficit | 249 | $0 |
| Wage / Income Gap (%) | 982 | 7.91% |
| Wage / Income Gap ($) | 982 | 92.09¢ per $1 |
| Gini / Inequality Index | 982 | 0.37 |
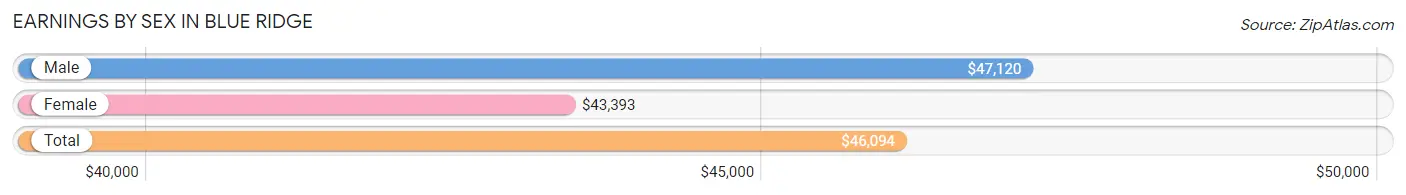
Earnings by Sex in Blue Ridge
Average Earnings in Blue Ridge are $46,094, $47,120 for men and $43,393 for women, a difference of 7.9%.
| Sex | Number | Average Earnings |
| Male | 315 (58.9%) | $47,120 |
| Female | 220 (41.1%) | $43,393 |
| Total | 535 (100.0%) | $46,094 |
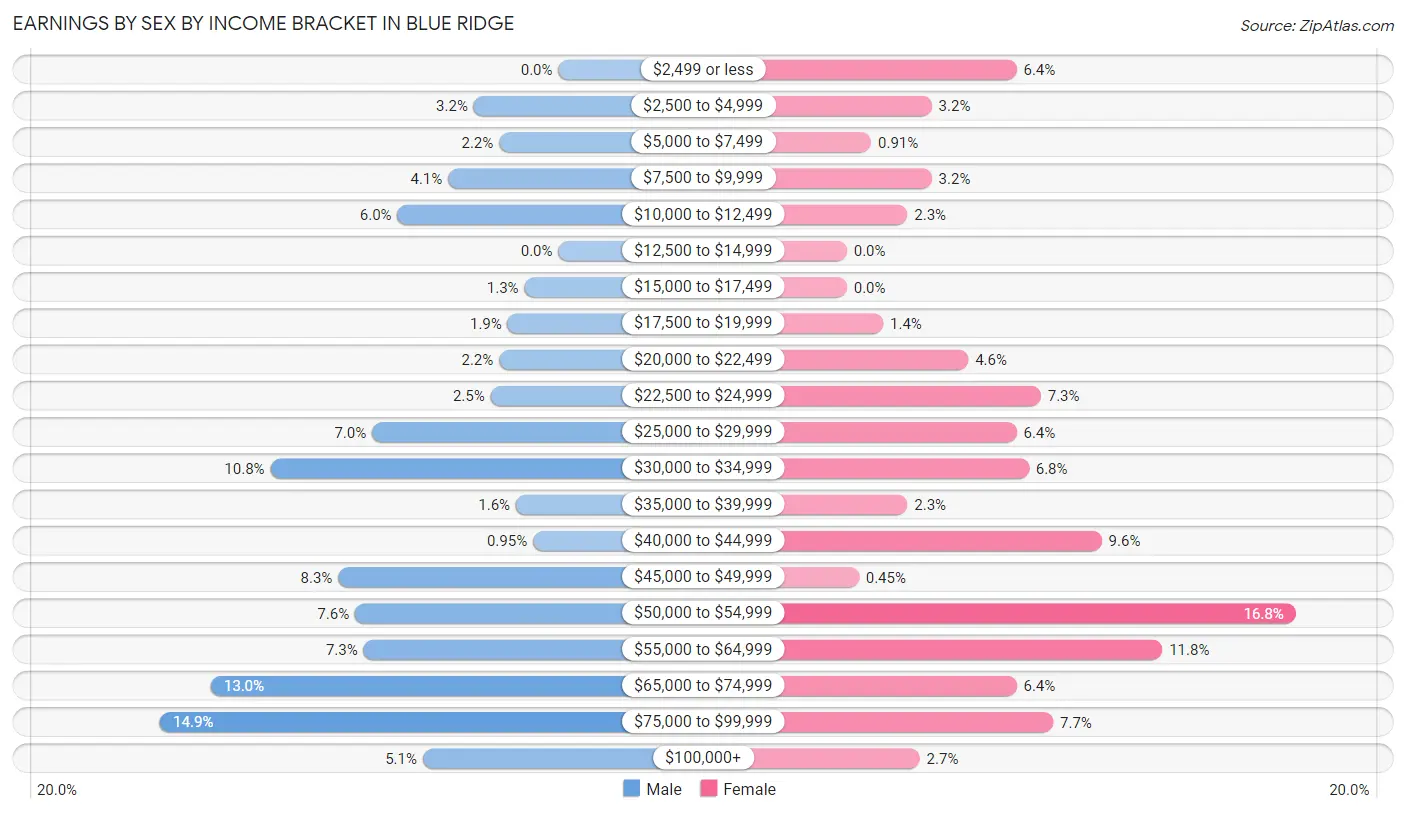
Earnings by Sex by Income Bracket in Blue Ridge
The most common earnings brackets in Blue Ridge are $75,000 to $99,999 for men (47 | 14.9%) and $50,000 to $54,999 for women (37 | 16.8%).
| Income | Male | Female |
| $2,499 or less | 0 (0.0%) | 14 (6.4%) |
| $2,500 to $4,999 | 10 (3.2%) | 7 (3.2%) |
| $5,000 to $7,499 | 7 (2.2%) | 2 (0.9%) |
| $7,500 to $9,999 | 13 (4.1%) | 7 (3.2%) |
| $10,000 to $12,499 | 19 (6.0%) | 5 (2.3%) |
| $12,500 to $14,999 | 0 (0.0%) | 0 (0.0%) |
| $15,000 to $17,499 | 4 (1.3%) | 0 (0.0%) |
| $17,500 to $19,999 | 6 (1.9%) | 3 (1.4%) |
| $20,000 to $22,499 | 7 (2.2%) | 10 (4.5%) |
| $22,500 to $24,999 | 8 (2.5%) | 16 (7.3%) |
| $25,000 to $29,999 | 22 (7.0%) | 14 (6.4%) |
| $30,000 to $34,999 | 34 (10.8%) | 15 (6.8%) |
| $35,000 to $39,999 | 5 (1.6%) | 5 (2.3%) |
| $40,000 to $44,999 | 3 (0.9%) | 21 (9.6%) |
| $45,000 to $49,999 | 26 (8.3%) | 1 (0.4%) |
| $50,000 to $54,999 | 24 (7.6%) | 37 (16.8%) |
| $55,000 to $64,999 | 23 (7.3%) | 26 (11.8%) |
| $65,000 to $74,999 | 41 (13.0%) | 14 (6.4%) |
| $75,000 to $99,999 | 47 (14.9%) | 17 (7.7%) |
| $100,000+ | 16 (5.1%) | 6 (2.7%) |
| Total | 315 (100.0%) | 220 (100.0%) |
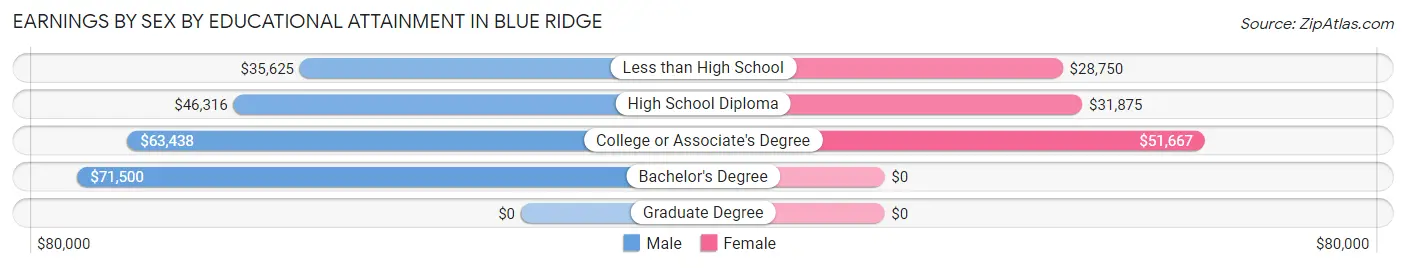
Earnings by Sex by Educational Attainment in Blue Ridge
Average earnings in Blue Ridge are $53,015 for men and $50,774 for women, a difference of 4.2%. Men with an educational attainment of bachelor's degree enjoy the highest average annual earnings of $71,500, while those with less than high school education earn the least with $35,625. Women with an educational attainment of college or associate's degree earn the most with the average annual earnings of $51,667, while those with less than high school education have the smallest earnings of $28,750.
| Educational Attainment | Male Income | Female Income |
| Less than High School | $35,625 | $28,750 |
| High School Diploma | $46,316 | $31,875 |
| College or Associate's Degree | $63,438 | $51,667 |
| Bachelor's Degree | $71,500 | $0 |
| Graduate Degree | - | - |
| Total | $53,015 | $50,774 |
Family Income in Blue Ridge
Family Income Brackets in Blue Ridge
According to the Blue Ridge family income data, there are 68 families falling into the $100,000 to $149,999 income range, which is the most common income bracket and makes up 27.3% of all families.
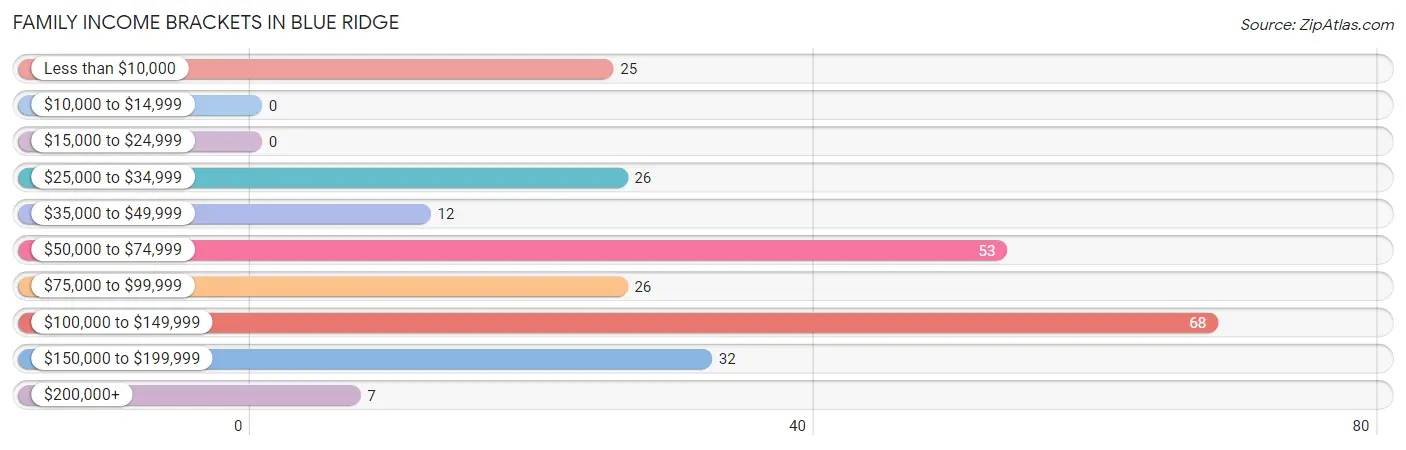
| Income Bracket | # Families | % Families |
| Less than $10,000 | 25 | 10.0% |
| $10,000 to $14,999 | 0 | 0.0% |
| $15,000 to $24,999 | 0 | 0.0% |
| $25,000 to $34,999 | 26 | 10.4% |
| $35,000 to $49,999 | 12 | 4.8% |
| $50,000 to $74,999 | 53 | 21.3% |
| $75,000 to $99,999 | 26 | 10.4% |
| $100,000 to $149,999 | 68 | 27.3% |
| $150,000 to $199,999 | 32 | 12.9% |
| $200,000+ | 7 | 2.8% |
Family Income by Famaliy Size in Blue Ridge
4-person families (38 | 15.3%) account for the highest median family income in Blue Ridge with $148,750 per family, while 4-person families (38 | 15.3%) have the highest median income of $37,188 per family member.
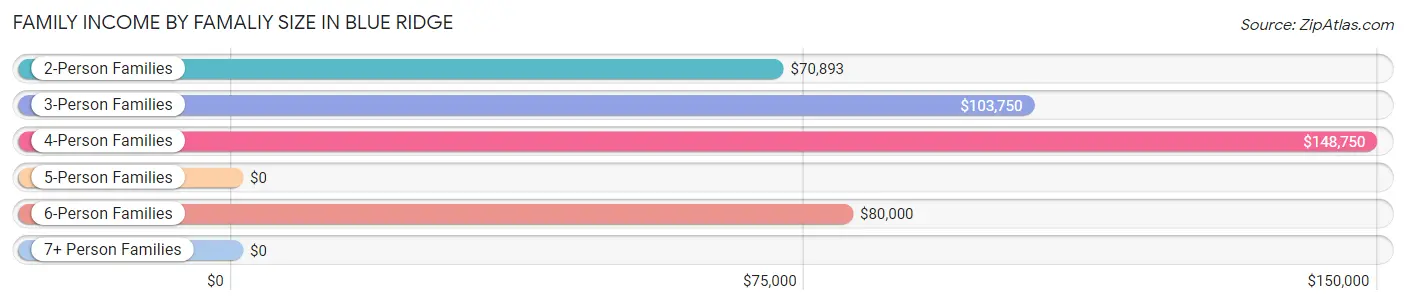
| Income Bracket | # Families | Median Income |
| 2-Person Families | 89 (35.7%) | $70,893 |
| 3-Person Families | 72 (28.9%) | $103,750 |
| 4-Person Families | 38 (15.3%) | $148,750 |
| 5-Person Families | 25 (10.0%) | $0 |
| 6-Person Families | 22 (8.8%) | $80,000 |
| 7+ Person Families | 3 (1.2%) | $0 |
| Total | 249 (100.0%) | $82,083 |
Family Income by Number of Earners in Blue Ridge
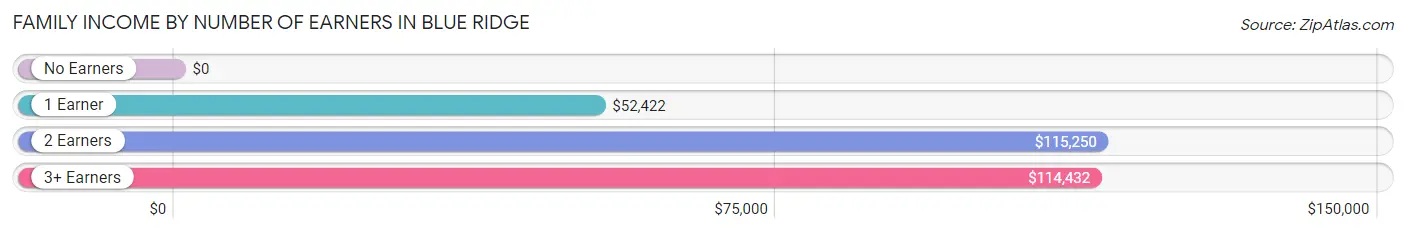
| Number of Earners | # Families | Median Income |
| No Earners | 32 (12.9%) | $0 |
| 1 Earner | 73 (29.3%) | $52,422 |
| 2 Earners | 93 (37.3%) | $115,250 |
| 3+ Earners | 51 (20.5%) | $114,432 |
| Total | 249 (100.0%) | $82,083 |
Household Income in Blue Ridge
Household Income Brackets in Blue Ridge
With 84 households falling in the category, the $100,000 to $149,999 income range is the most frequent in Blue Ridge, accounting for 26.8% of all households. In contrast, only 2 households (0.6%) fall into the $10,000 to $14,999 income bracket, making it the least populous group.
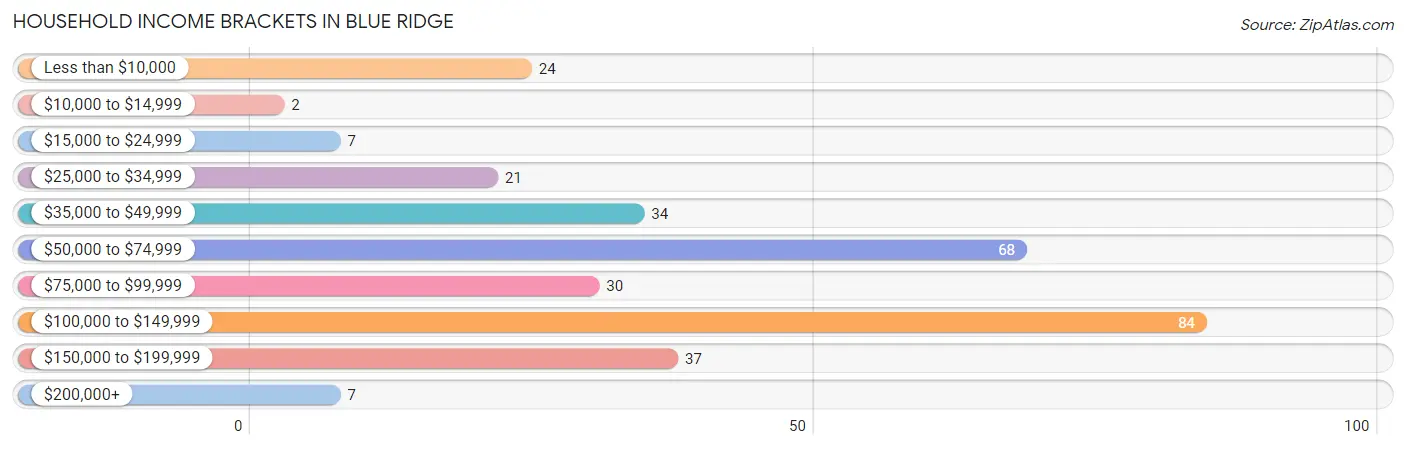
| Income Bracket | # Households | % Households |
| Less than $10,000 | 24 | 7.6% |
| $10,000 to $14,999 | 2 | 0.6% |
| $15,000 to $24,999 | 7 | 2.2% |
| $25,000 to $34,999 | 21 | 6.7% |
| $35,000 to $49,999 | 34 | 10.8% |
| $50,000 to $74,999 | 68 | 21.7% |
| $75,000 to $99,999 | 30 | 9.6% |
| $100,000 to $149,999 | 84 | 26.8% |
| $150,000 to $199,999 | 37 | 11.8% |
| $200,000+ | 7 | 2.2% |
Household Income by Householder Age in Blue Ridge
The median household income in Blue Ridge is $75,167, with the highest median household income of $101,875 found in the 15 to 24 years age bracket for the primary householder. A total of 7 households (2.2%) fall into this category. Meanwhile, the 65+ years age bracket for the primary householder has the lowest median household income of $40,938, with 27 households (8.6%) in this group.
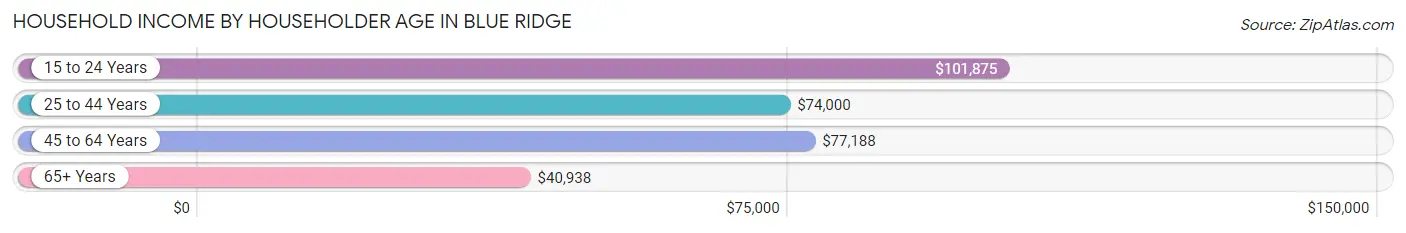
| Income Bracket | # Households | Median Income |
| 15 to 24 Years | 7 (2.2%) | $101,875 |
| 25 to 44 Years | 134 (42.7%) | $74,000 |
| 45 to 64 Years | 146 (46.5%) | $77,188 |
| 65+ Years | 27 (8.6%) | $40,938 |
| Total | 314 (100.0%) | $75,167 |
Poverty in Blue Ridge
Income Below Poverty by Sex and Age in Blue Ridge
With 23.6% poverty level for males and 18.2% for females among the residents of Blue Ridge, 16 and 17 year old males and 5 year old females are the most vulnerable to poverty, with 2 males (100.0%) and 7 females (100.0%) in their respective age groups living below the poverty level.
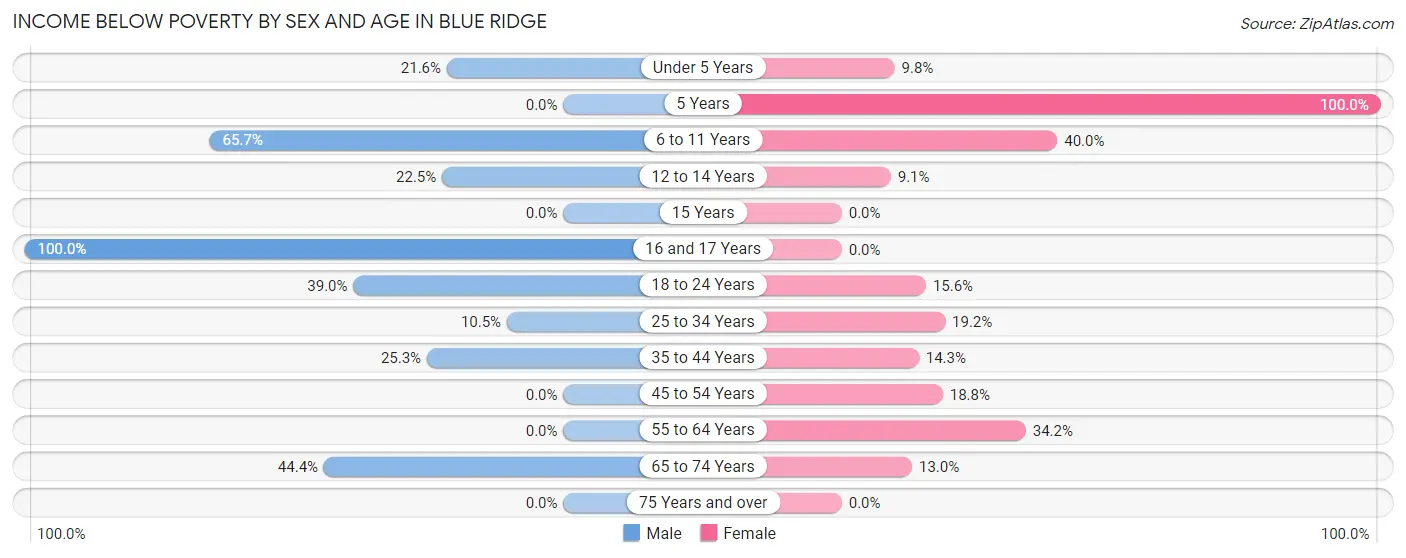
| Age Bracket | Male | Female |
| Under 5 Years | 8 (21.6%) | 5 (9.8%) |
| 5 Years | 0 (0.0%) | 7 (100.0%) |
| 6 to 11 Years | 44 (65.7%) | 6 (40.0%) |
| 12 to 14 Years | 9 (22.5%) | 2 (9.1%) |
| 15 Years | 0 (0.0%) | 0 (0.0%) |
| 16 and 17 Years | 2 (100.0%) | 0 (0.0%) |
| 18 to 24 Years | 23 (39.0%) | 5 (15.6%) |
| 25 to 34 Years | 9 (10.5%) | 14 (19.2%) |
| 35 to 44 Years | 20 (25.3%) | 10 (14.3%) |
| 45 to 54 Years | 0 (0.0%) | 15 (18.8%) |
| 55 to 64 Years | 0 (0.0%) | 14 (34.2%) |
| 65 to 74 Years | 8 (44.4%) | 6 (13.0%) |
| 75 Years and over | 0 (0.0%) | 0 (0.0%) |
| Total | 123 (23.6%) | 84 (18.2%) |
Income Above Poverty by Sex and Age in Blue Ridge
According to the poverty statistics in Blue Ridge, males aged 5 years and females aged 15 years are the age groups that are most secure financially, with 100.0% of males and 100.0% of females in these age groups living above the poverty line.
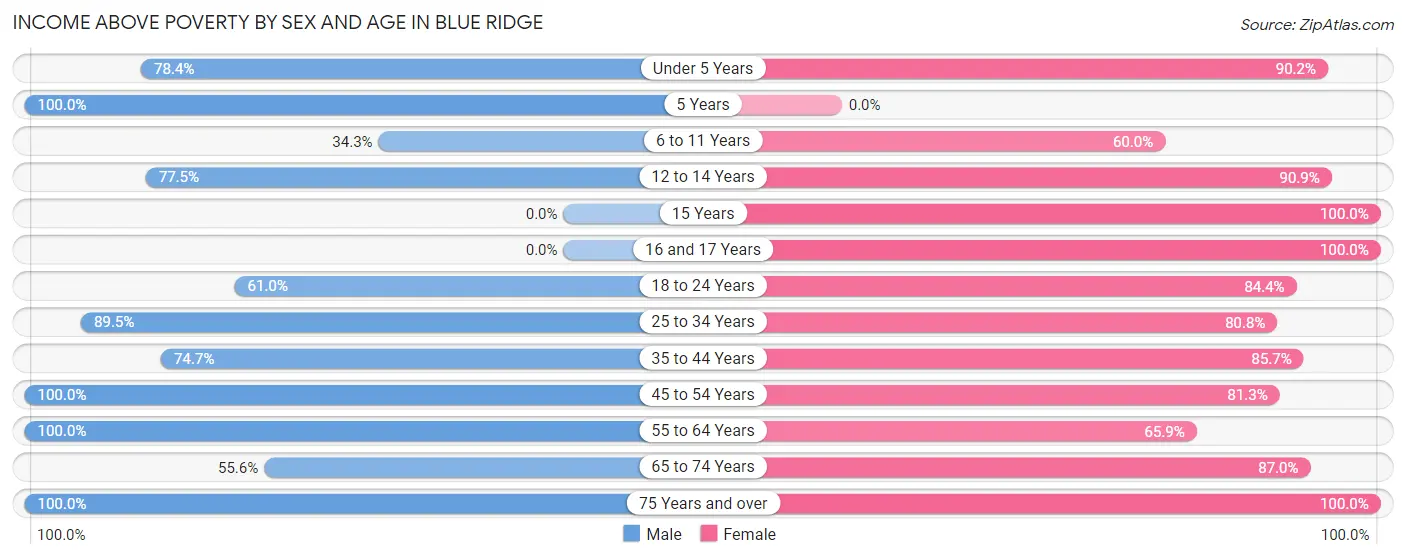
| Age Bracket | Male | Female |
| Under 5 Years | 29 (78.4%) | 46 (90.2%) |
| 5 Years | 6 (100.0%) | 0 (0.0%) |
| 6 to 11 Years | 23 (34.3%) | 9 (60.0%) |
| 12 to 14 Years | 31 (77.5%) | 20 (90.9%) |
| 15 Years | 0 (0.0%) | 14 (100.0%) |
| 16 and 17 Years | 0 (0.0%) | 8 (100.0%) |
| 18 to 24 Years | 36 (61.0%) | 27 (84.4%) |
| 25 to 34 Years | 77 (89.5%) | 59 (80.8%) |
| 35 to 44 Years | 59 (74.7%) | 60 (85.7%) |
| 45 to 54 Years | 62 (100.0%) | 65 (81.2%) |
| 55 to 64 Years | 61 (100.0%) | 27 (65.8%) |
| 65 to 74 Years | 10 (55.6%) | 40 (87.0%) |
| 75 Years and over | 4 (100.0%) | 2 (100.0%) |
| Total | 398 (76.4%) | 377 (81.8%) |
Income Below Poverty Among Married-Couple Families in Blue Ridge
The poverty statistics for married-couple families in Blue Ridge show that 5.0% or 8 of the total 159 families live below the poverty line. Families with 3 or 4 children have the highest poverty rate of 19.1%, comprising of 4 families. On the other hand, families with no children have the lowest poverty rate of 0.0%, which includes 0 families.
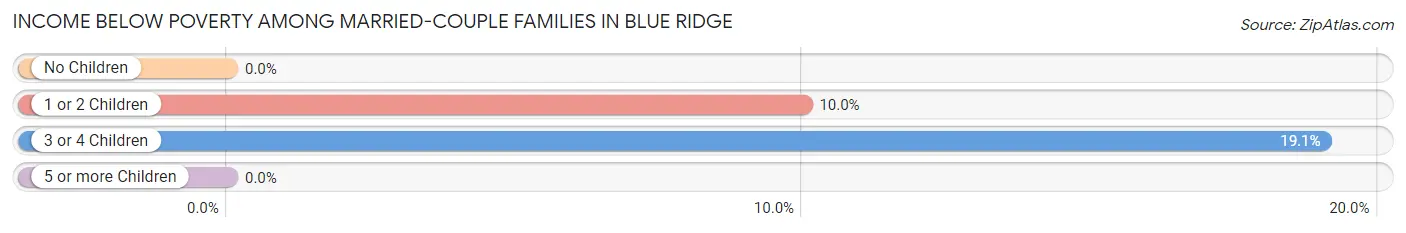
| Children | Above Poverty | Below Poverty |
| No Children | 98 (100.0%) | 0 (0.0%) |
| 1 or 2 Children | 36 (90.0%) | 4 (10.0%) |
| 3 or 4 Children | 17 (80.9%) | 4 (19.1%) |
| 5 or more Children | 0 (0.0%) | 0 (0.0%) |
| Total | 151 (95.0%) | 8 (5.0%) |
Income Below Poverty Among Single-Parent Households in Blue Ridge
According to the poverty data in Blue Ridge, 40.0% or 14 single-father households and 36.4% or 20 single-mother households are living below the poverty line. Among single-father households, those with 3 or 4 children have the highest poverty rate, with 9 households (81.8%) experiencing poverty. Likewise, among single-mother households, those with no children have the highest poverty rate, with 15 households (88.2%) falling below the poverty line.
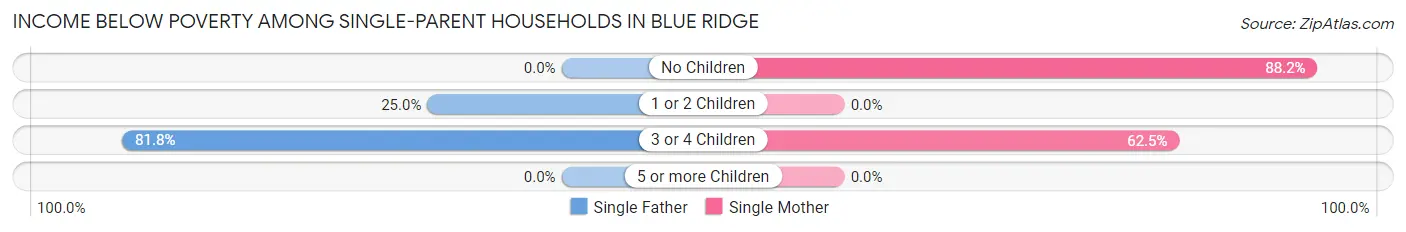
| Children | Single Father | Single Mother |
| No Children | 0 (0.0%) | 15 (88.2%) |
| 1 or 2 Children | 5 (25.0%) | 0 (0.0%) |
| 3 or 4 Children | 9 (81.8%) | 5 (62.5%) |
| 5 or more Children | 0 (0.0%) | 0 (0.0%) |
| Total | 14 (40.0%) | 20 (36.4%) |
Income Below Poverty Among Married-Couple vs Single-Parent Households in Blue Ridge
The poverty data for Blue Ridge shows that 8 of the married-couple family households (5.0%) and 34 of the single-parent households (37.8%) are living below the poverty level. Within the married-couple family households, those with 3 or 4 children have the highest poverty rate, with 4 households (19.1%) falling below the poverty line. Among the single-parent households, those with 3 or 4 children have the highest poverty rate, with 14 household (73.7%) living below poverty.
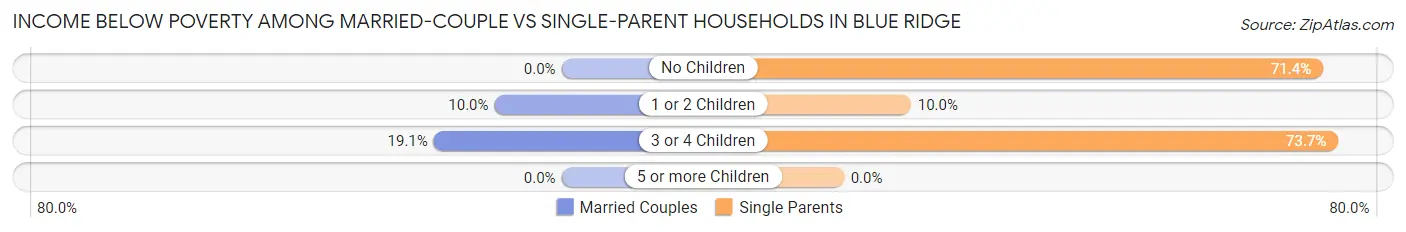
| Children | Married-Couple Families | Single-Parent Households |
| No Children | 0 (0.0%) | 15 (71.4%) |
| 1 or 2 Children | 4 (10.0%) | 5 (10.0%) |
| 3 or 4 Children | 4 (19.1%) | 14 (73.7%) |
| 5 or more Children | 0 (0.0%) | 0 (0.0%) |
| Total | 8 (5.0%) | 34 (37.8%) |
Race in Blue Ridge
The most populous races in Blue Ridge are White / Caucasian (734 | 74.8%), Hispanic or Latino (309 | 31.5%), and Two or more Races (124 | 12.6%).
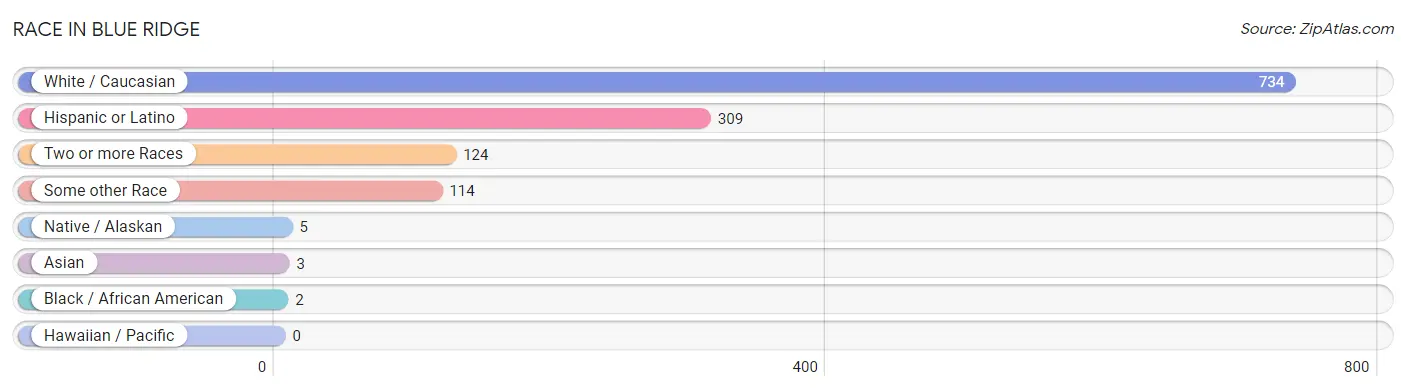
| Race | # Population | % Population |
| Asian | 3 | 0.3% |
| Black / African American | 2 | 0.2% |
| Hawaiian / Pacific | 0 | 0.0% |
| Hispanic or Latino | 309 | 31.5% |
| Native / Alaskan | 5 | 0.5% |
| White / Caucasian | 734 | 74.8% |
| Two or more Races | 124 | 12.6% |
| Some other Race | 114 | 11.6% |
| Total | 982 | 100.0% |
Ancestry in Blue Ridge
The most populous ancestries reported in Blue Ridge are Mexican (273 | 27.8%), American (216 | 22.0%), German (79 | 8.0%), Irish (75 | 7.6%), and English (58 | 5.9%), together accounting for 71.4% of all Blue Ridge residents.
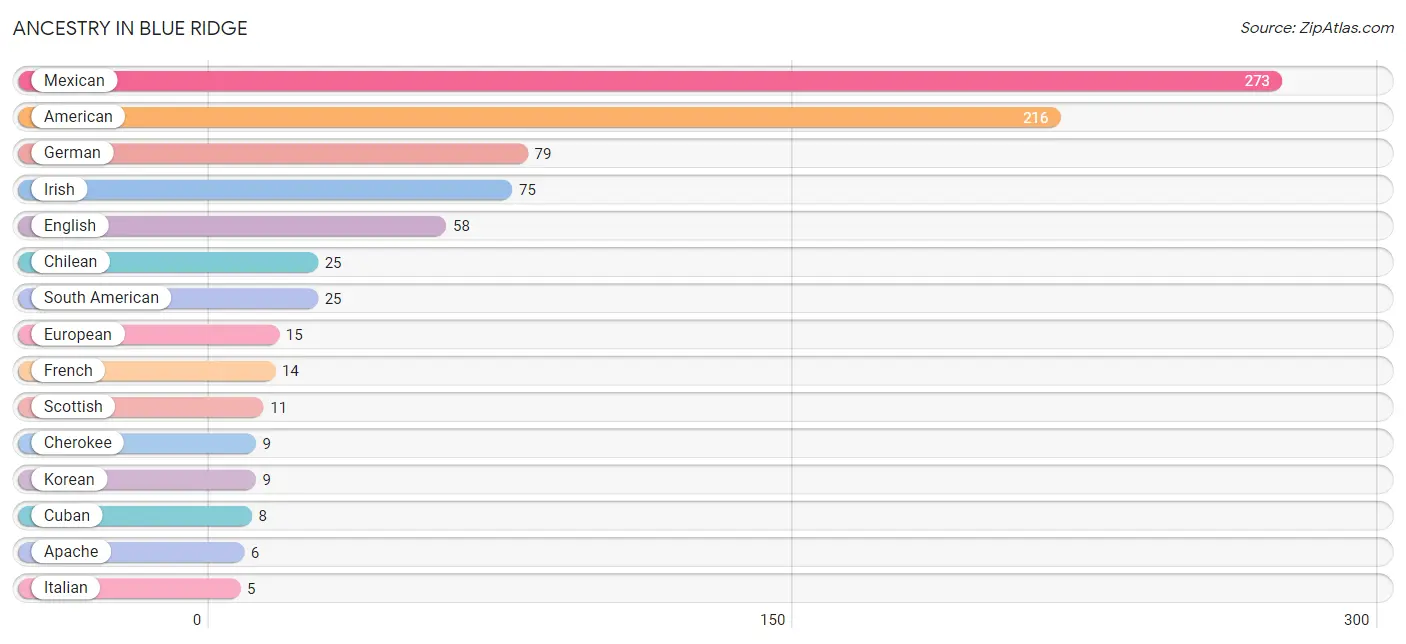
| Ancestry | # Population | % Population |
| American | 216 | 22.0% |
| Apache | 6 | 0.6% |
| Belgian | 1 | 0.1% |
| Central American | 3 | 0.3% |
| Cherokee | 9 | 0.9% |
| Chickasaw | 4 | 0.4% |
| Chilean | 25 | 2.5% |
| Choctaw | 4 | 0.4% |
| Cuban | 8 | 0.8% |
| English | 58 | 5.9% |
| European | 15 | 1.5% |
| French | 14 | 1.4% |
| German | 79 | 8.0% |
| Greek | 2 | 0.2% |
| Irish | 75 | 7.6% |
| Italian | 5 | 0.5% |
| Korean | 9 | 0.9% |
| Mexican | 273 | 27.8% |
| Salvadoran | 3 | 0.3% |
| Scotch-Irish | 2 | 0.2% |
| Scottish | 11 | 1.1% |
| South American | 25 | 2.5% | View All 22 Rows |
Immigrants in Blue Ridge
The most numerous immigrant groups reported in Blue Ridge came from Latin America (88 | 9.0%), Central America (67 | 6.8%), Mexico (62 | 6.3%), South America (21 | 2.1%), and Chile (19 | 1.9%), together accounting for 26.2% of all Blue Ridge residents.
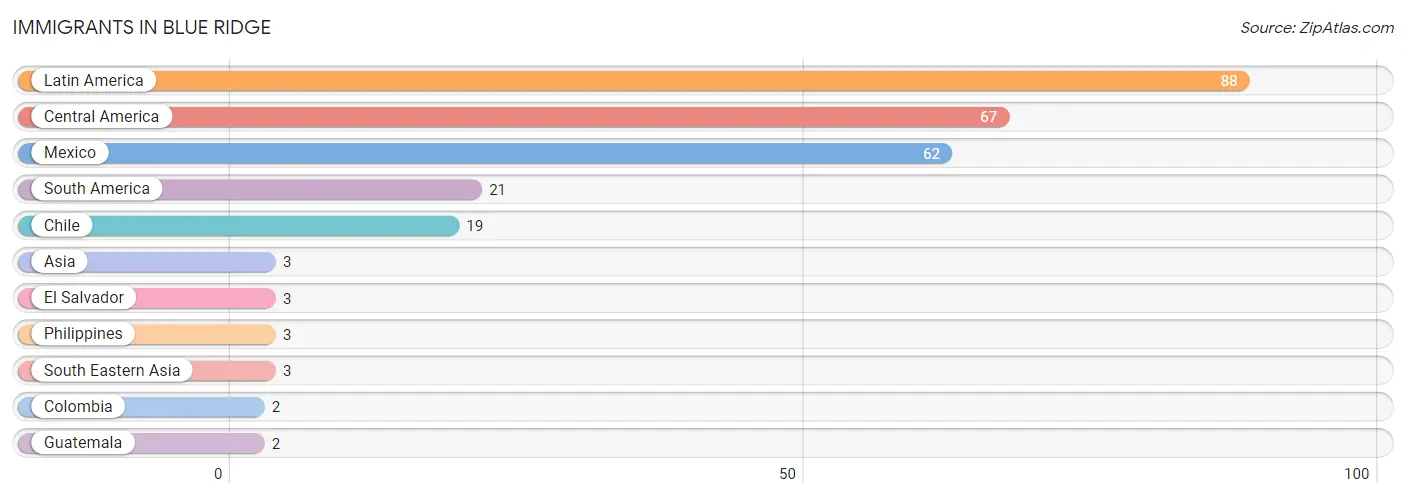
| Immigration Origin | # Population | % Population |
| Asia | 3 | 0.3% |
| Central America | 67 | 6.8% |
| Chile | 19 | 1.9% |
| Colombia | 2 | 0.2% |
| El Salvador | 3 | 0.3% |
| Guatemala | 2 | 0.2% |
| Latin America | 88 | 9.0% |
| Mexico | 62 | 6.3% |
| Philippines | 3 | 0.3% |
| South America | 21 | 2.1% |
| South Eastern Asia | 3 | 0.3% | View All 11 Rows |
Sex and Age in Blue Ridge
Sex and Age in Blue Ridge
The most populous age groups in Blue Ridge are 10 to 14 Years (59 | 11.3%) for men and Under 5 Years (51 | 11.1%) for women.
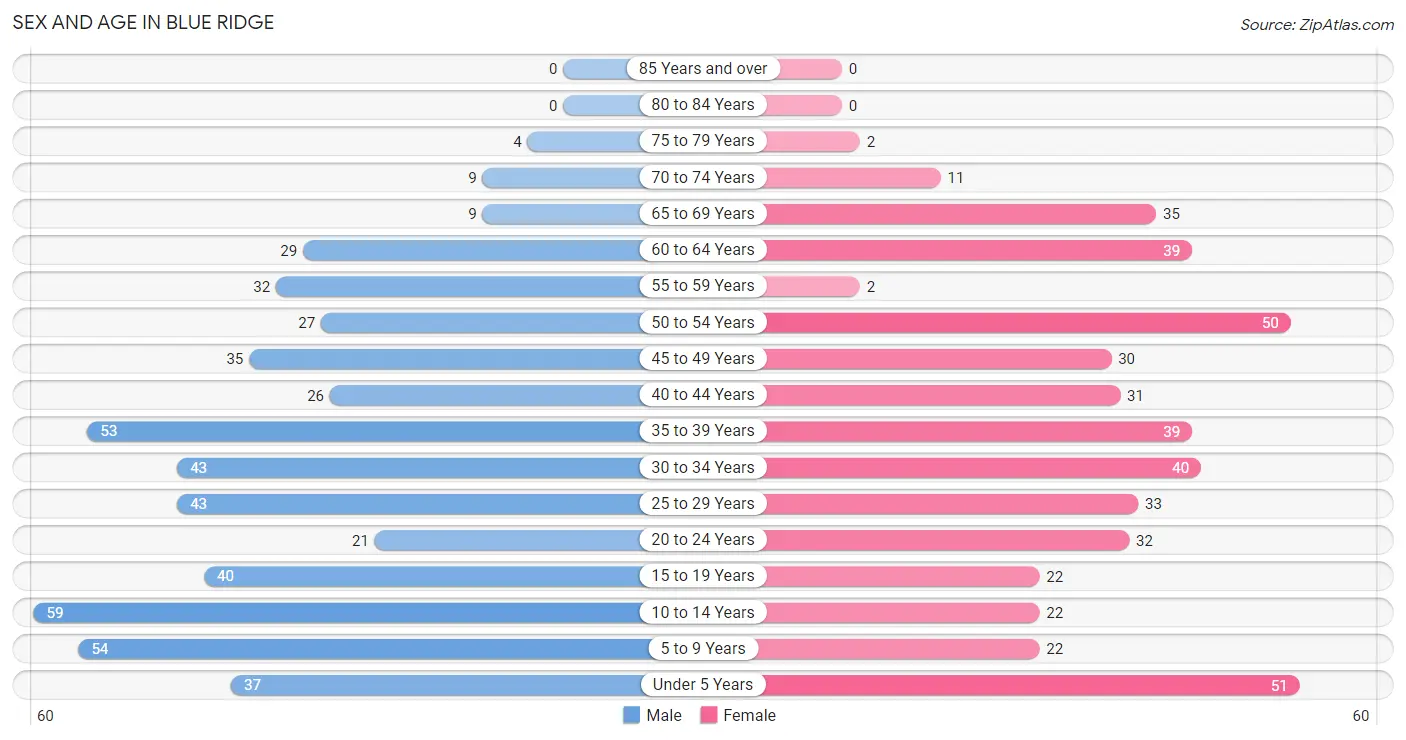
| Age Bracket | Male | Female |
| Under 5 Years | 37 (7.1%) | 51 (11.1%) |
| 5 to 9 Years | 54 (10.4%) | 22 (4.8%) |
| 10 to 14 Years | 59 (11.3%) | 22 (4.8%) |
| 15 to 19 Years | 40 (7.7%) | 22 (4.8%) |
| 20 to 24 Years | 21 (4.0%) | 32 (6.9%) |
| 25 to 29 Years | 43 (8.3%) | 33 (7.2%) |
| 30 to 34 Years | 43 (8.3%) | 40 (8.7%) |
| 35 to 39 Years | 53 (10.2%) | 39 (8.5%) |
| 40 to 44 Years | 26 (5.0%) | 31 (6.7%) |
| 45 to 49 Years | 35 (6.7%) | 30 (6.5%) |
| 50 to 54 Years | 27 (5.2%) | 50 (10.8%) |
| 55 to 59 Years | 32 (6.1%) | 2 (0.4%) |
| 60 to 64 Years | 29 (5.6%) | 39 (8.5%) |
| 65 to 69 Years | 9 (1.7%) | 35 (7.6%) |
| 70 to 74 Years | 9 (1.7%) | 11 (2.4%) |
| 75 to 79 Years | 4 (0.8%) | 2 (0.4%) |
| 80 to 84 Years | 0 (0.0%) | 0 (0.0%) |
| 85 Years and over | 0 (0.0%) | 0 (0.0%) |
| Total | 521 (100.0%) | 461 (100.0%) |
Families and Households in Blue Ridge
Median Family Size in Blue Ridge
The median family size in Blue Ridge is 3.36 persons per family, with single male/father families (35 | 14.1%) accounting for the largest median family size of 3.89 persons per family. On the other hand, married-couple families (159 | 63.9%) represent the smallest median family size with 3.26 persons per family.
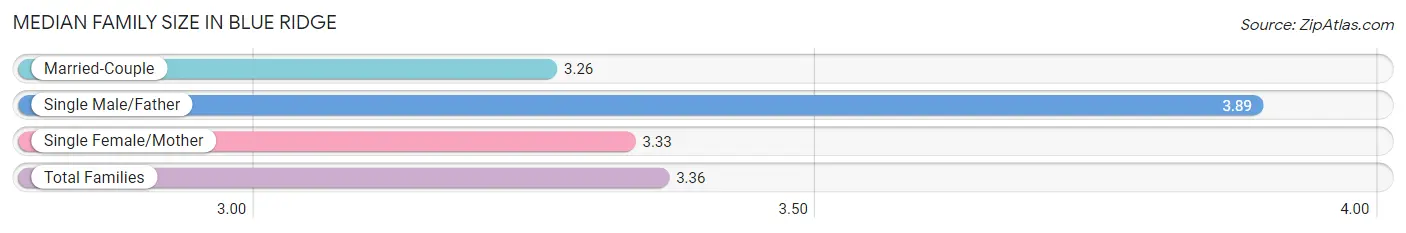
| Family Type | # Families | Family Size |
| Married-Couple | 159 (63.9%) | 3.26 |
| Single Male/Father | 35 (14.1%) | 3.89 |
| Single Female/Mother | 55 (22.1%) | 3.33 |
| Total Families | 249 (100.0%) | 3.36 |
Median Household Size in Blue Ridge
The median household size in Blue Ridge is 3.13 persons per household, with single male/father households (35 | 11.2%) accounting for the largest median household size of 4.69 persons per household. non-family households (65 | 20.7%) represent the smallest median household size with 1.15 persons per household.
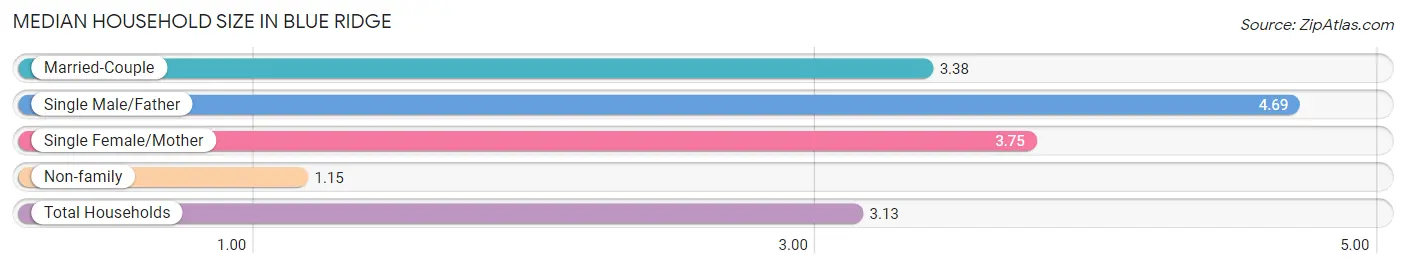
| Household Type | # Households | Household Size |
| Married-Couple | 159 (50.6%) | 3.38 |
| Single Male/Father | 35 (11.2%) | 4.69 |
| Single Female/Mother | 55 (17.5%) | 3.75 |
| Non-family | 65 (20.7%) | 1.15 |
| Total Households | 314 (100.0%) | 3.13 |
Household Size by Marriage Status in Blue Ridge
Out of a total of 314 households in Blue Ridge, 249 (79.3%) are family households, while 65 (20.7%) are nonfamily households. The most numerous type of family households are 2-person households, comprising 87, and the most common type of nonfamily households are 1-person households, comprising 56.
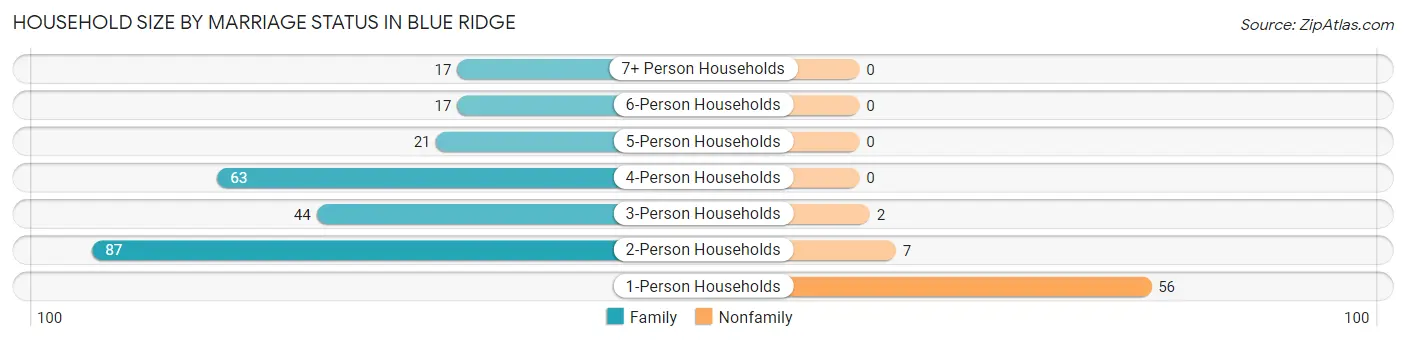
| Household Size | Family Households | Nonfamily Households |
| 1-Person Households | - | 56 (17.8%) |
| 2-Person Households | 87 (27.7%) | 7 (2.2%) |
| 3-Person Households | 44 (14.0%) | 2 (0.6%) |
| 4-Person Households | 63 (20.1%) | 0 (0.0%) |
| 5-Person Households | 21 (6.7%) | 0 (0.0%) |
| 6-Person Households | 17 (5.4%) | 0 (0.0%) |
| 7+ Person Households | 17 (5.4%) | 0 (0.0%) |
| Total | 249 (79.3%) | 65 (20.7%) |
Female Fertility in Blue Ridge
Fertility by Age in Blue Ridge
Average fertility rate in Blue Ridge is 111.0 births per 1,000 women. Women in the age bracket of 20 to 34 years have the highest fertility rate with 190.0 births per 1,000 women. Women in the age bracket of 20 to 34 years acount for 74.1% of all women with births.
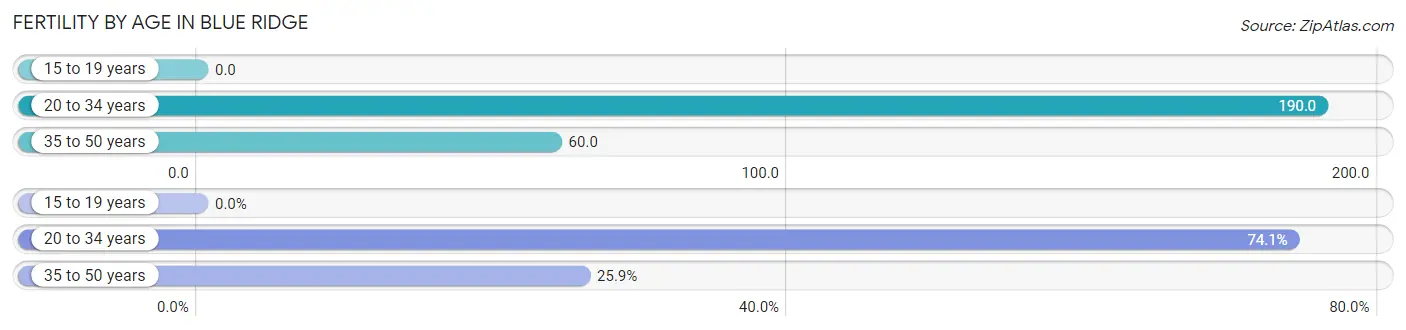
| Age Bracket | Women with Births | Births / 1,000 Women |
| 15 to 19 years | 0 (0.0%) | 0.0 |
| 20 to 34 years | 20 (74.1%) | 190.0 |
| 35 to 50 years | 7 (25.9%) | 60.0 |
| Total | 27 (100.0%) | 111.0 |
Fertility by Age by Marriage Status in Blue Ridge
55.6% of women with births (27) in Blue Ridge are married. The highest percentage of unmarried women with births falls into 35 to 50 years age bracket with 100.0% of them unmarried at the time of birth, while the lowest percentage of unmarried women with births belong to 20 to 34 years age bracket with 25.0% of them unmarried.
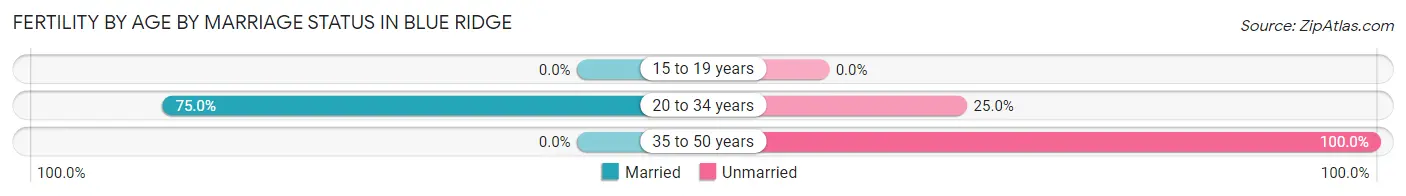
| Age Bracket | Married | Unmarried |
| 15 to 19 years | 0 (0.0%) | 0 (0.0%) |
| 20 to 34 years | 15 (75.0%) | 5 (25.0%) |
| 35 to 50 years | 0 (0.0%) | 7 (100.0%) |
| Total | 15 (55.6%) | 12 (44.4%) |
Fertility by Education in Blue Ridge
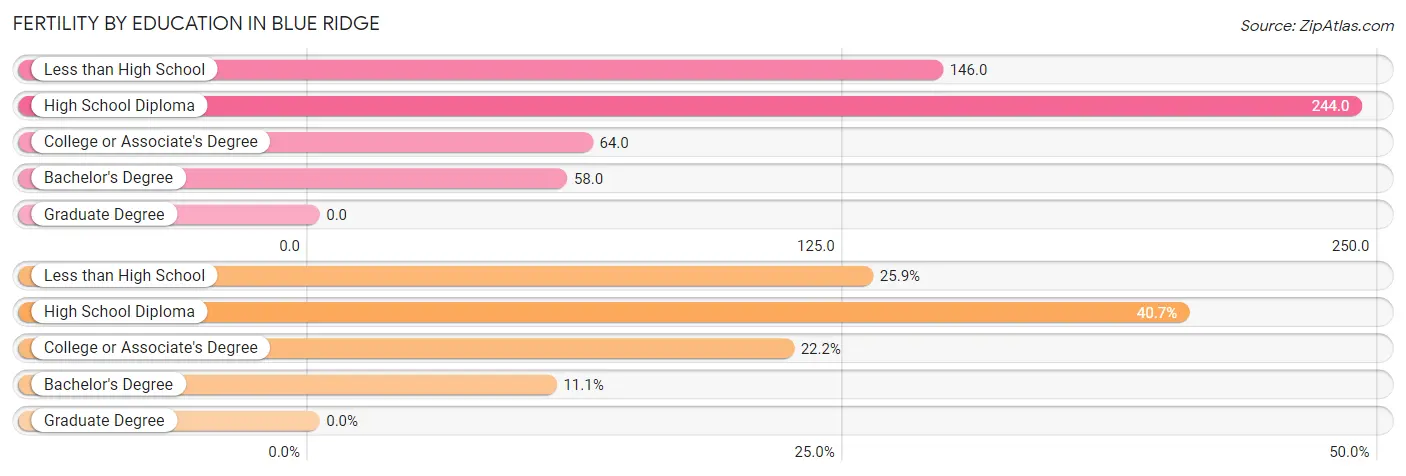
| Educational Attainment | Women with Births | Births / 1,000 Women |
| Less than High School | 7 (25.9%) | 146.0 |
| High School Diploma | 11 (40.7%) | 244.0 |
| College or Associate's Degree | 6 (22.2%) | 64.0 |
| Bachelor's Degree | 3 (11.1%) | 58.0 |
| Graduate Degree | 0 (0.0%) | 0.0 |
| Total | 27 (100.0%) | 111.0 |
Fertility by Education by Marriage Status in Blue Ridge
44.4% of women with births in Blue Ridge are unmarried. Women with the educational attainment of college or associate's degree are most likely to be married with 100.0% of them married at childbirth, while women with the educational attainment of less than high school are least likely to be married with 100.0% of them unmarried at childbirth.
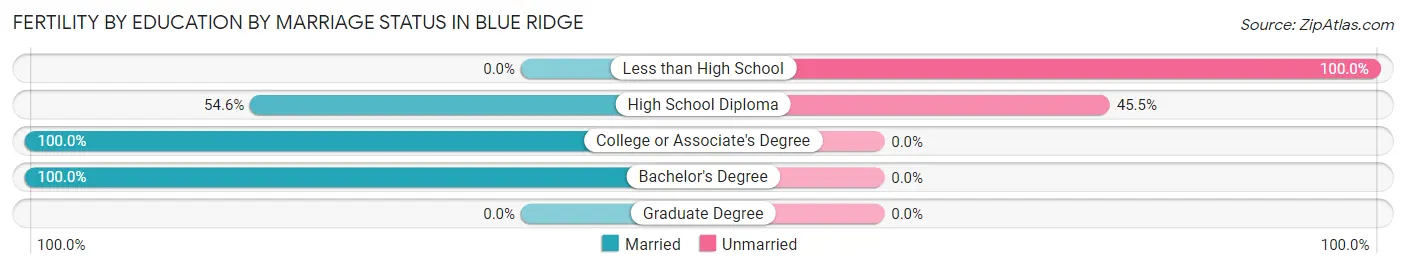
| Educational Attainment | Married | Unmarried |
| Less than High School | 0 (0.0%) | 7 (100.0%) |
| High School Diploma | 6 (54.5%) | 5 (45.5%) |
| College or Associate's Degree | 6 (100.0%) | 0 (0.0%) |
| Bachelor's Degree | 3 (100.0%) | 0 (0.0%) |
| Graduate Degree | 0 (0.0%) | 0 (0.0%) |
| Total | 15 (55.6%) | 12 (44.4%) |
Employment Characteristics in Blue Ridge
Employment by Class of Employer in Blue Ridge
Among the 502 employed individuals in Blue Ridge, private company employees (393 | 78.3%), local government employees (39 | 7.8%), and self-employed (not incorporated) (25 | 5.0%) make up the most common classes of employment.
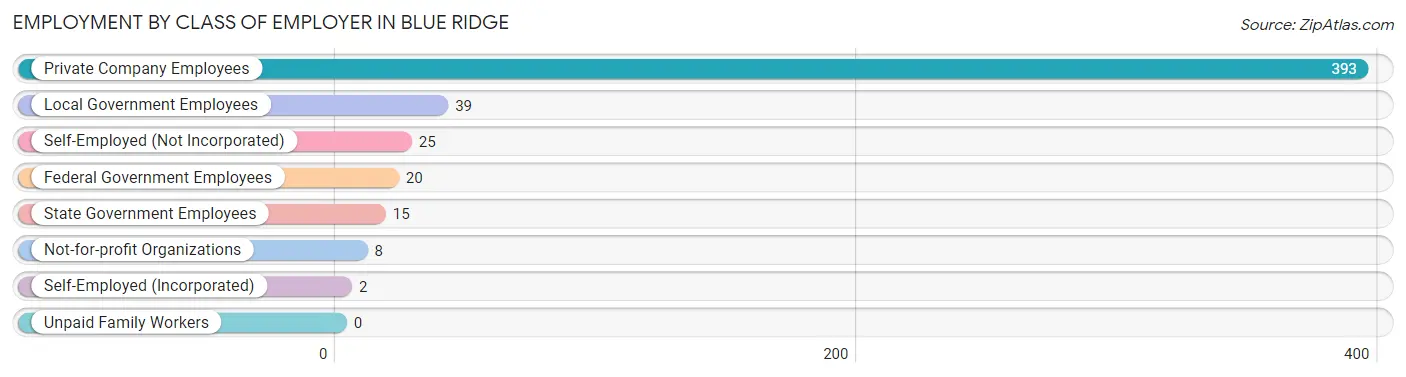
| Employer Class | # Employees | % Employees |
| Private Company Employees | 393 | 78.3% |
| Self-Employed (Incorporated) | 2 | 0.4% |
| Self-Employed (Not Incorporated) | 25 | 5.0% |
| Not-for-profit Organizations | 8 | 1.6% |
| Local Government Employees | 39 | 7.8% |
| State Government Employees | 15 | 3.0% |
| Federal Government Employees | 20 | 4.0% |
| Unpaid Family Workers | 0 | 0.0% |
| Total | 502 | 100.0% |
Employment Status by Age in Blue Ridge
According to the labor force statistics for Blue Ridge, out of the total population over 16 years of age (723), 72.5% or 524 individuals are in the labor force, with 3.1% or 16 of them unemployed. The age group with the highest labor force participation rate is 30 to 34 years, with 100.0% or 83 individuals in the labor force. Within the labor force, the 60 to 64 years age range has the highest percentage of unemployed individuals, with 13.5% or 7 of them being unemployed.
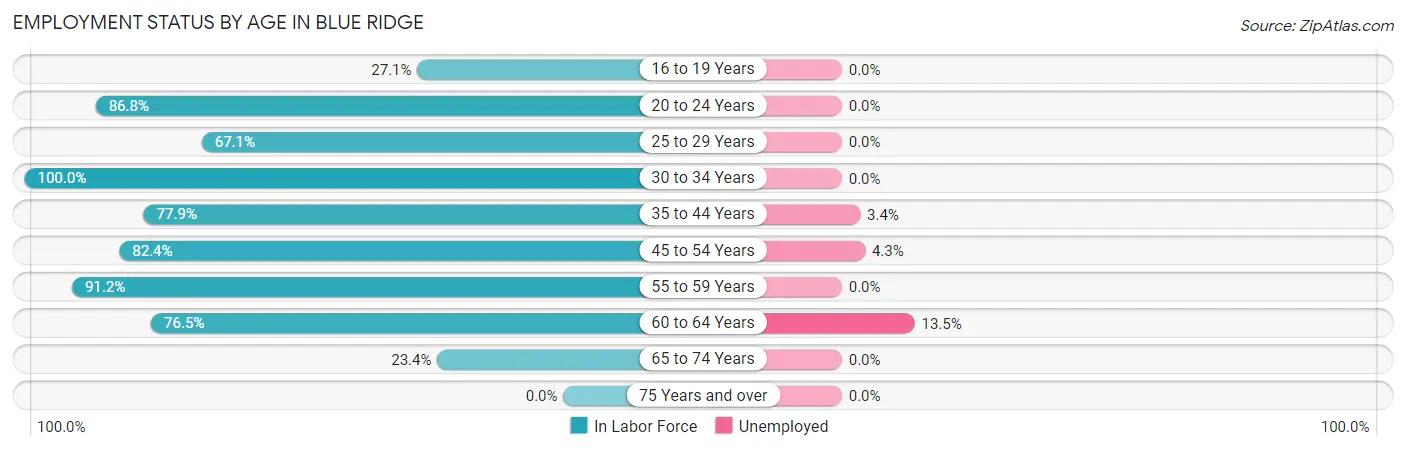
| Age Bracket | In Labor Force | Unemployed |
| 16 to 19 Years | 13 (27.1%) | 0 (0.0%) |
| 20 to 24 Years | 46 (86.8%) | 0 (0.0%) |
| 25 to 29 Years | 51 (67.1%) | 0 (0.0%) |
| 30 to 34 Years | 83 (100.0%) | 0 (0.0%) |
| 35 to 44 Years | 116 (77.9%) | 4 (3.4%) |
| 45 to 54 Years | 117 (82.4%) | 5 (4.3%) |
| 55 to 59 Years | 31 (91.2%) | 0 (0.0%) |
| 60 to 64 Years | 52 (76.5%) | 7 (13.5%) |
| 65 to 74 Years | 15 (23.4%) | 0 (0.0%) |
| 75 Years and over | 0 (0.0%) | 0 (0.0%) |
| Total | 524 (72.5%) | 16 (3.1%) |
Employment Status by Educational Attainment in Blue Ridge
According to labor force statistics for Blue Ridge, 81.5% of individuals (450) out of the total population between 25 and 64 years of age (552) are in the labor force, with 3.6% or 16 of them being unemployed. The group with the highest labor force participation rate are those with the educational attainment of college / associate degree, with 90.5% or 171 individuals in the labor force. Within the labor force, individuals with college / associate degree education have the highest percentage of unemployment, with 6.4% or 11 of them being unemployed.
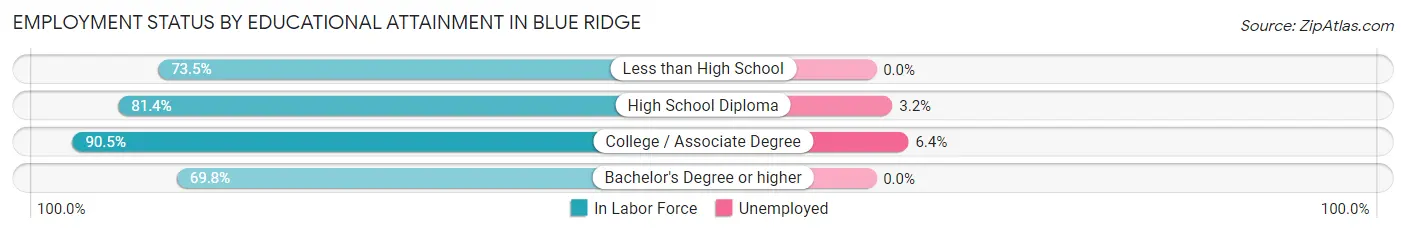
| Educational Attainment | In Labor Force | Unemployed |
| Less than High School | 61 (73.5%) | 0 (0.0%) |
| High School Diploma | 158 (81.4%) | 6 (3.2%) |
| College / Associate Degree | 171 (90.5%) | 12 (6.4%) |
| Bachelor's Degree or higher | 60 (69.8%) | 0 (0.0%) |
| Total | 450 (81.5%) | 20 (3.6%) |
Employment Occupations by Sex in Blue Ridge
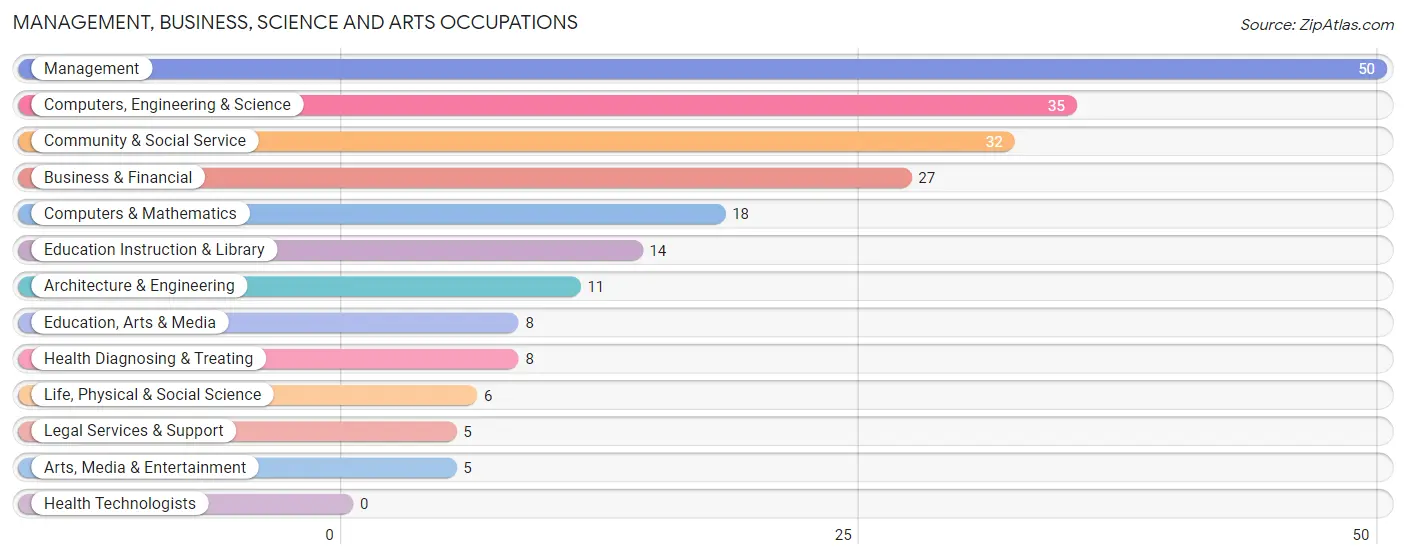
Management, Business, Science and Arts Occupations
The most common Management, Business, Science and Arts occupations in Blue Ridge are Management (50 | 9.8%), Computers, Engineering & Science (35 | 6.9%), Community & Social Service (32 | 6.3%), Business & Financial (27 | 5.3%), and Computers & Mathematics (18 | 3.5%).
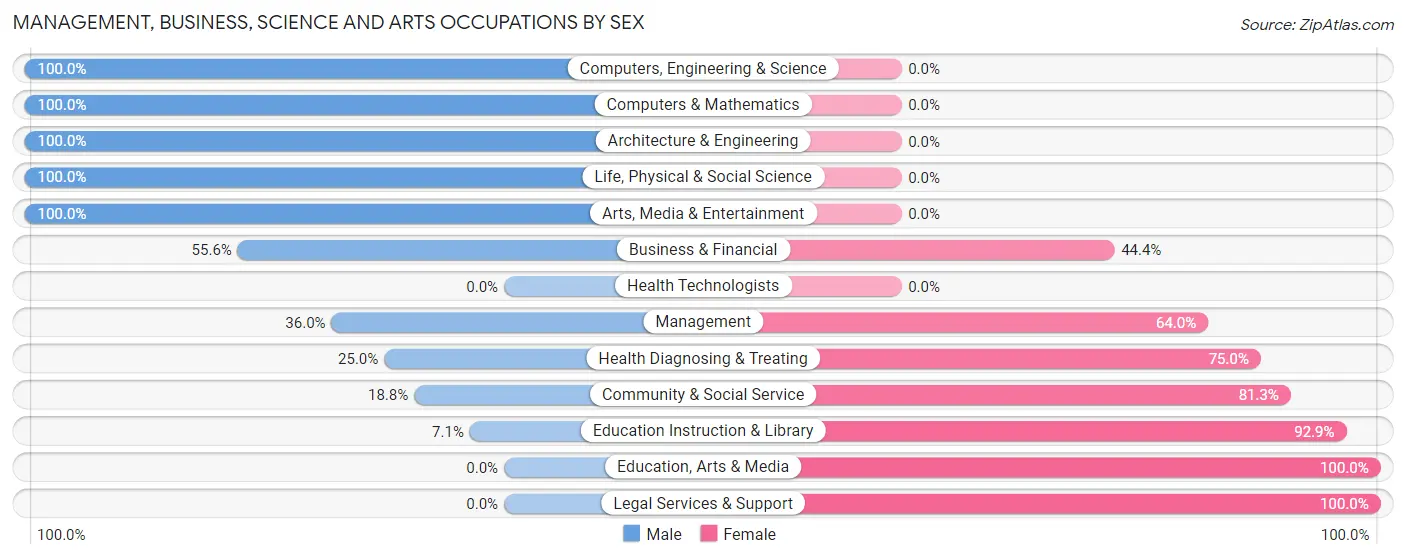
Management, Business, Science and Arts Occupations by Sex
Within the Management, Business, Science and Arts occupations in Blue Ridge, the most male-oriented occupations are Computers, Engineering & Science (100.0%), Computers & Mathematics (100.0%), and Architecture & Engineering (100.0%), while the most female-oriented occupations are Education, Arts & Media (100.0%), Legal Services & Support (100.0%), and Education Instruction & Library (92.9%).
| Occupation | Male | Female |
| Management | 18 (36.0%) | 32 (64.0%) |
| Business & Financial | 15 (55.6%) | 12 (44.4%) |
| Computers, Engineering & Science | 35 (100.0%) | 0 (0.0%) |
| Computers & Mathematics | 18 (100.0%) | 0 (0.0%) |
| Architecture & Engineering | 11 (100.0%) | 0 (0.0%) |
| Life, Physical & Social Science | 6 (100.0%) | 0 (0.0%) |
| Community & Social Service | 6 (18.8%) | 26 (81.2%) |
| Education, Arts & Media | 0 (0.0%) | 8 (100.0%) |
| Legal Services & Support | 0 (0.0%) | 5 (100.0%) |
| Education Instruction & Library | 1 (7.1%) | 13 (92.9%) |
| Arts, Media & Entertainment | 5 (100.0%) | 0 (0.0%) |
| Health Diagnosing & Treating | 2 (25.0%) | 6 (75.0%) |
| Health Technologists | 0 (0.0%) | 0 (0.0%) |
| Total (Category) | 76 (50.0%) | 76 (50.0%) |
| Total (Overall) | 304 (59.8%) | 204 (40.2%) |
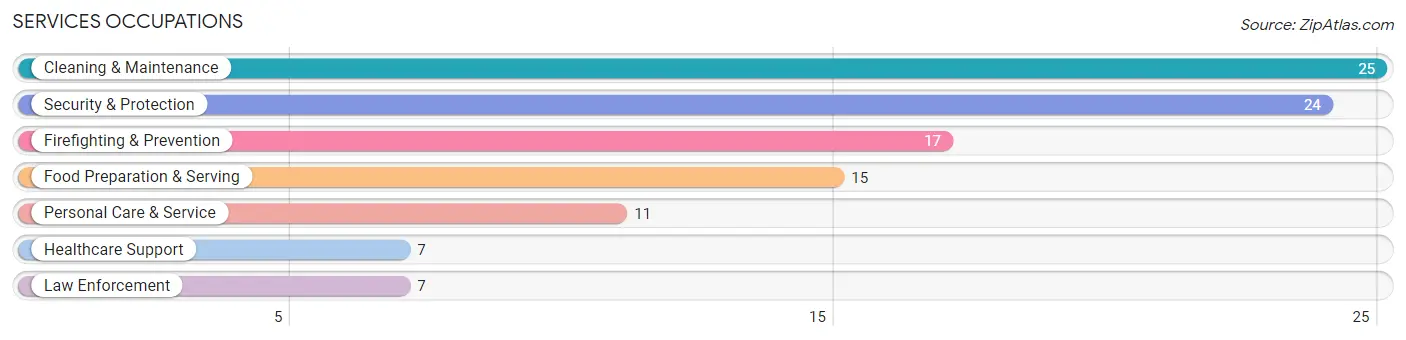
Services Occupations
The most common Services occupations in Blue Ridge are Cleaning & Maintenance (25 | 4.9%), Security & Protection (24 | 4.7%), Firefighting & Prevention (17 | 3.4%), Food Preparation & Serving (15 | 2.9%), and Personal Care & Service (11 | 2.2%).
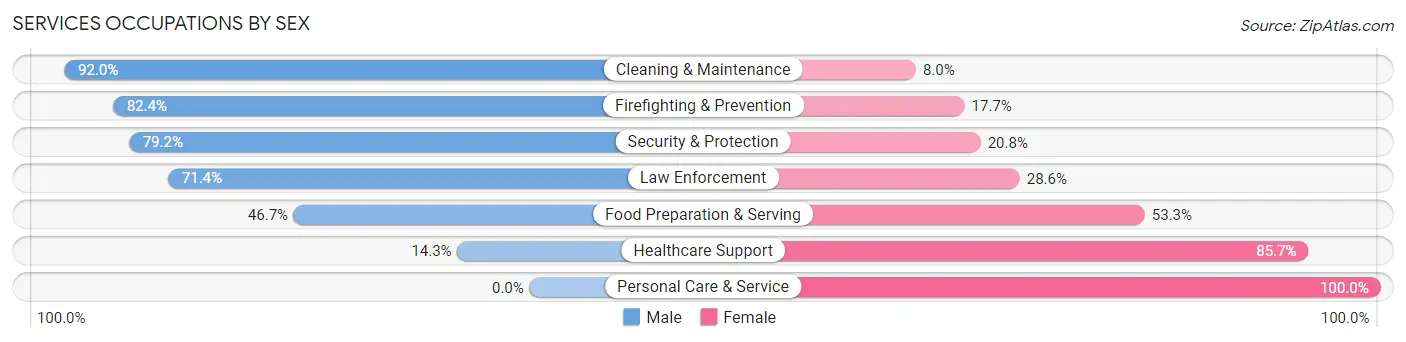
Services Occupations by Sex
Within the Services occupations in Blue Ridge, the most male-oriented occupations are Cleaning & Maintenance (92.0%), Firefighting & Prevention (82.4%), and Security & Protection (79.2%), while the most female-oriented occupations are Personal Care & Service (100.0%), Healthcare Support (85.7%), and Food Preparation & Serving (53.3%).
| Occupation | Male | Female |
| Healthcare Support | 1 (14.3%) | 6 (85.7%) |
| Security & Protection | 19 (79.2%) | 5 (20.8%) |
| Firefighting & Prevention | 14 (82.4%) | 3 (17.6%) |
| Law Enforcement | 5 (71.4%) | 2 (28.6%) |
| Food Preparation & Serving | 7 (46.7%) | 8 (53.3%) |
| Cleaning & Maintenance | 23 (92.0%) | 2 (8.0%) |
| Personal Care & Service | 0 (0.0%) | 11 (100.0%) |
| Total (Category) | 50 (61.0%) | 32 (39.0%) |
| Total (Overall) | 304 (59.8%) | 204 (40.2%) |
Sales and Office Occupations
The most common Sales and Office occupations in Blue Ridge are Sales & Related (58 | 11.4%), and Office & Administration (56 | 11.0%).

Sales and Office Occupations by Sex
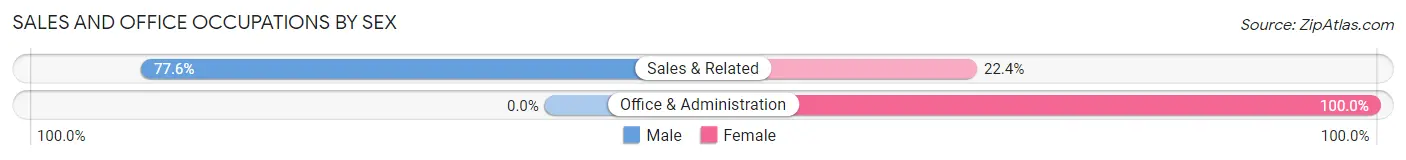
| Occupation | Male | Female |
| Sales & Related | 45 (77.6%) | 13 (22.4%) |
| Office & Administration | 0 (0.0%) | 56 (100.0%) |
| Total (Category) | 45 (39.5%) | 69 (60.5%) |
| Total (Overall) | 304 (59.8%) | 204 (40.2%) |
Natural Resources, Construction and Maintenance Occupations
The most common Natural Resources, Construction and Maintenance occupations in Blue Ridge are Installation, Maintenance & Repair (33 | 6.5%), and Construction & Extraction (25 | 4.9%).

Natural Resources, Construction and Maintenance Occupations by Sex
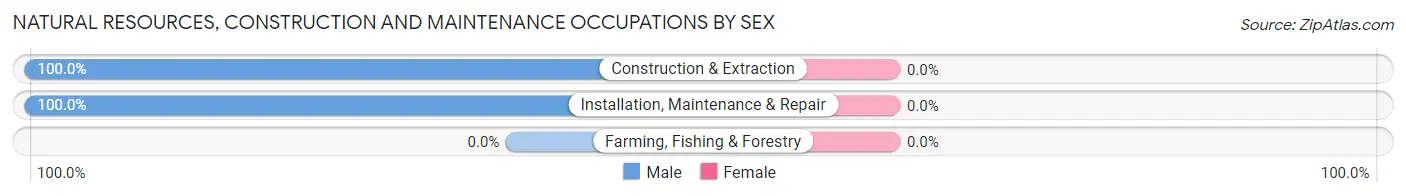
| Occupation | Male | Female |
| Farming, Fishing & Forestry | 0 (0.0%) | 0 (0.0%) |
| Construction & Extraction | 25 (100.0%) | 0 (0.0%) |
| Installation, Maintenance & Repair | 33 (100.0%) | 0 (0.0%) |
| Total (Category) | 58 (100.0%) | 0 (0.0%) |
| Total (Overall) | 304 (59.8%) | 204 (40.2%) |
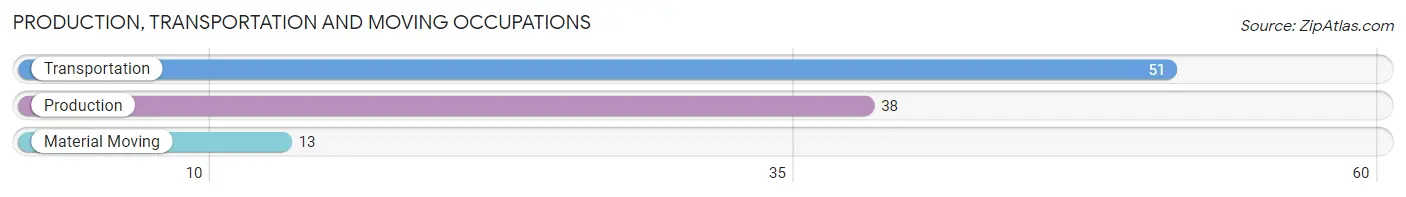
Production, Transportation and Moving Occupations
The most common Production, Transportation and Moving occupations in Blue Ridge are Transportation (51 | 10.0%), Production (38 | 7.5%), and Material Moving (13 | 2.6%).
Production, Transportation and Moving Occupations by Sex
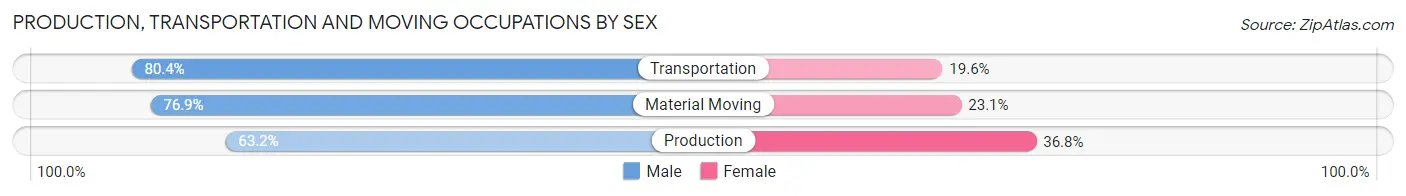
| Occupation | Male | Female |
| Production | 24 (63.2%) | 14 (36.8%) |
| Transportation | 41 (80.4%) | 10 (19.6%) |
| Material Moving | 10 (76.9%) | 3 (23.1%) |
| Total (Category) | 75 (73.5%) | 27 (26.5%) |
| Total (Overall) | 304 (59.8%) | 204 (40.2%) |
Employment Industries by Sex in Blue Ridge
Employment Industries in Blue Ridge
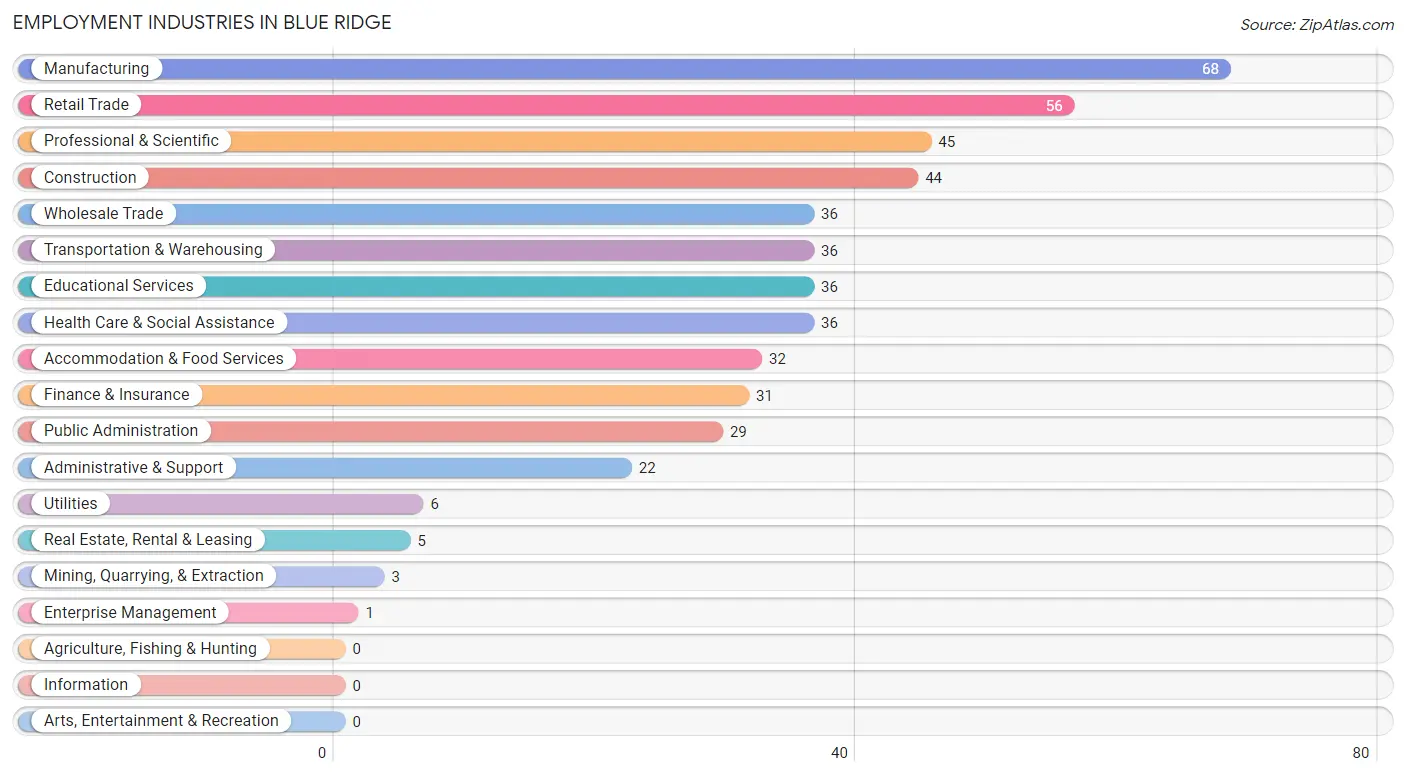
The major employment industries in Blue Ridge include Manufacturing (68 | 13.4%), Retail Trade (56 | 11.0%), Professional & Scientific (45 | 8.9%), Construction (44 | 8.7%), and Wholesale Trade (36 | 7.1%).
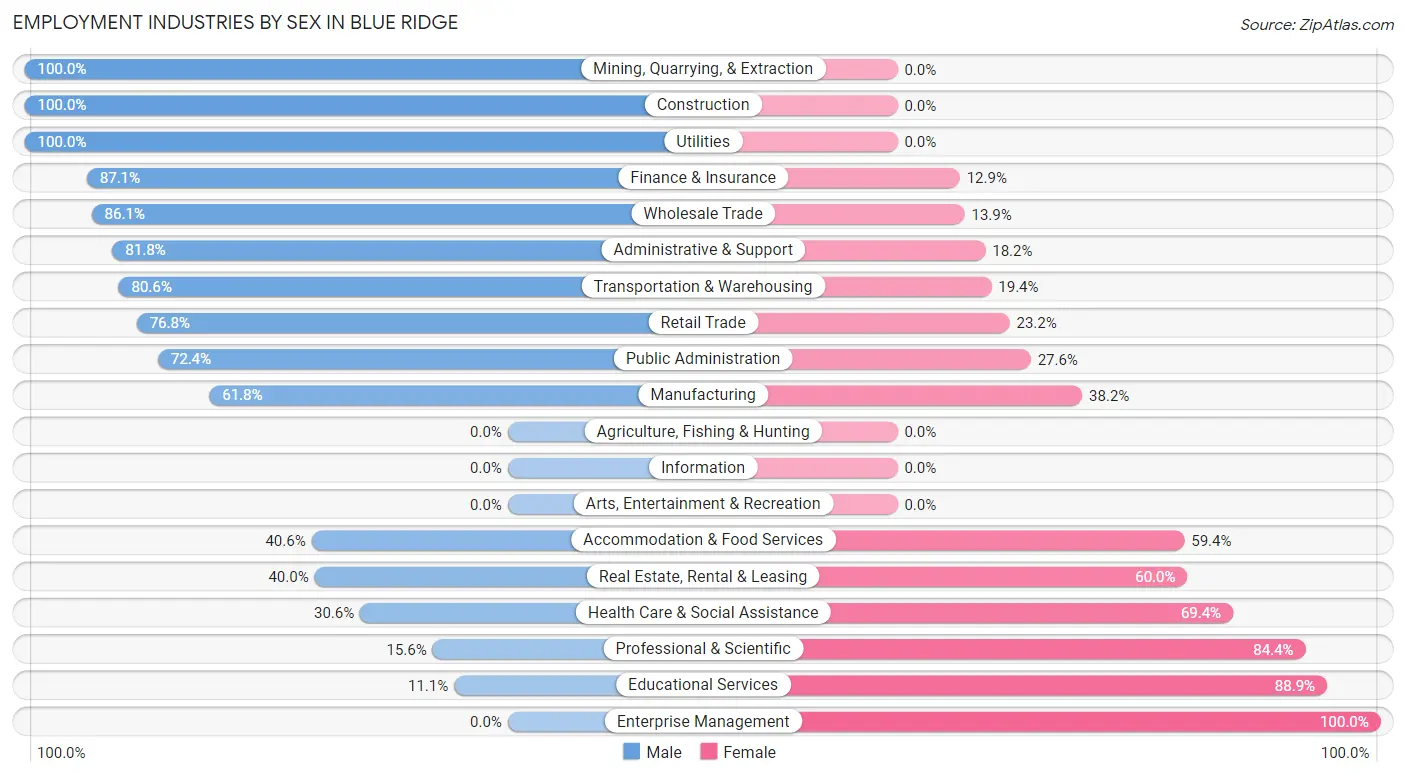
Employment Industries by Sex in Blue Ridge
The Blue Ridge industries that see more men than women are Mining, Quarrying, & Extraction (100.0%), Construction (100.0%), and Utilities (100.0%), whereas the industries that tend to have a higher number of women are Enterprise Management (100.0%), Educational Services (88.9%), and Professional & Scientific (84.4%).
| Industry | Male | Female |
| Agriculture, Fishing & Hunting | 0 (0.0%) | 0 (0.0%) |
| Mining, Quarrying, & Extraction | 3 (100.0%) | 0 (0.0%) |
| Construction | 44 (100.0%) | 0 (0.0%) |
| Manufacturing | 42 (61.8%) | 26 (38.2%) |
| Wholesale Trade | 31 (86.1%) | 5 (13.9%) |
| Retail Trade | 43 (76.8%) | 13 (23.2%) |
| Transportation & Warehousing | 29 (80.6%) | 7 (19.4%) |
| Utilities | 6 (100.0%) | 0 (0.0%) |
| Information | 0 (0.0%) | 0 (0.0%) |
| Finance & Insurance | 27 (87.1%) | 4 (12.9%) |
| Real Estate, Rental & Leasing | 2 (40.0%) | 3 (60.0%) |
| Professional & Scientific | 7 (15.6%) | 38 (84.4%) |
| Enterprise Management | 0 (0.0%) | 1 (100.0%) |
| Administrative & Support | 18 (81.8%) | 4 (18.2%) |
| Educational Services | 4 (11.1%) | 32 (88.9%) |
| Health Care & Social Assistance | 11 (30.6%) | 25 (69.4%) |
| Arts, Entertainment & Recreation | 0 (0.0%) | 0 (0.0%) |
| Accommodation & Food Services | 13 (40.6%) | 19 (59.4%) |
| Public Administration | 21 (72.4%) | 8 (27.6%) |
| Total | 304 (59.8%) | 204 (40.2%) |
Education in Blue Ridge
School Enrollment in Blue Ridge
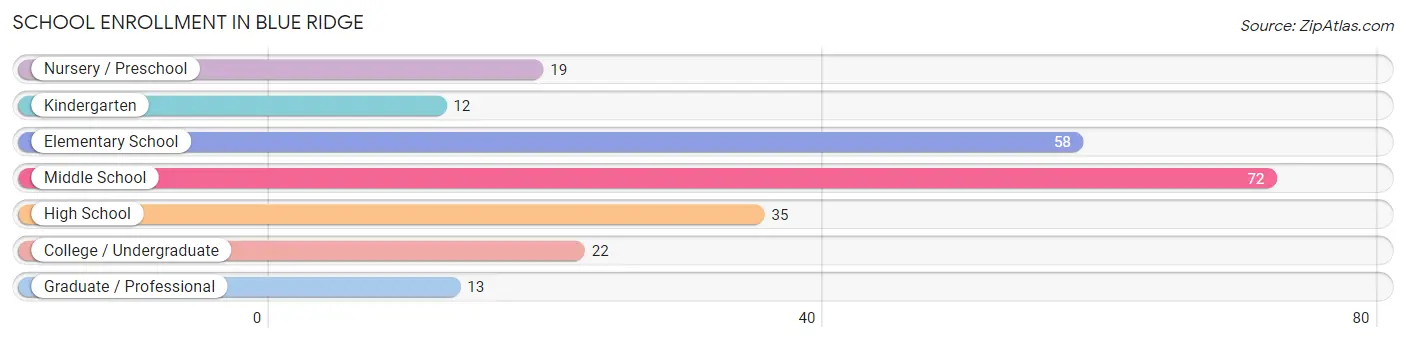
The most common levels of schooling among the 231 students in Blue Ridge are middle school (72 | 31.2%), elementary school (58 | 25.1%), and high school (35 | 15.1%).
| School Level | # Students | % Students |
| Nursery / Preschool | 19 | 8.2% |
| Kindergarten | 12 | 5.2% |
| Elementary School | 58 | 25.1% |
| Middle School | 72 | 31.2% |
| High School | 35 | 15.1% |
| College / Undergraduate | 22 | 9.5% |
| Graduate / Professional | 13 | 5.6% |
| Total | 231 | 100.0% |
School Enrollment by Age by Funding Source in Blue Ridge
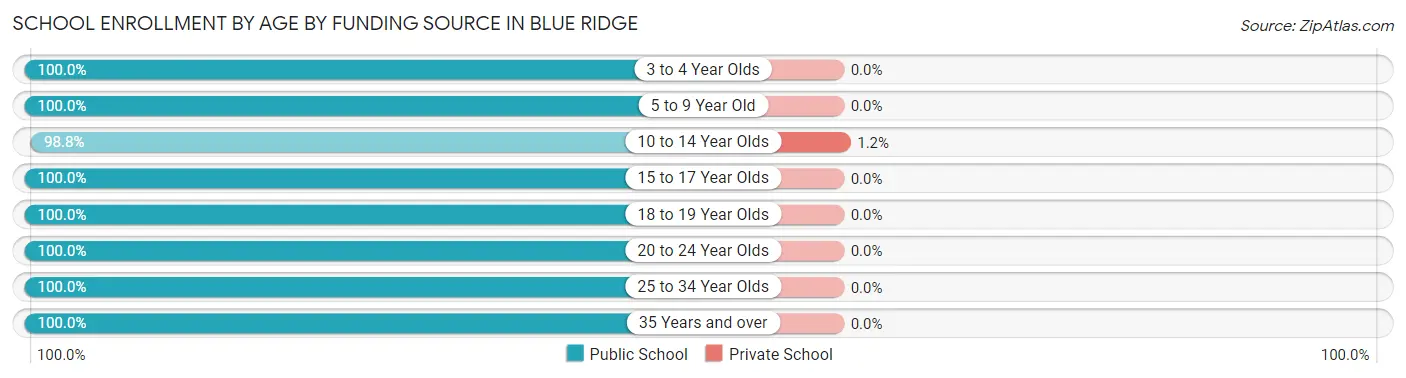
Out of a total of 231 students who are enrolled in schools in Blue Ridge, 1 (0.4%) attend a private institution, while the remaining 230 (99.6%) are enrolled in public schools. The age group of 10 to 14 year olds has the highest likelihood of being enrolled in private schools, with 1 (1.2% in the age bracket) enrolled. Conversely, the age group of 3 to 4 year olds has the lowest likelihood of being enrolled in a private school, with 12 (100.0% in the age bracket) attending a public institution.
| Age Bracket | Public School | Private School |
| 3 to 4 Year Olds | 12 (100.0%) | 0 (0.0%) |
| 5 to 9 Year Old | 75 (100.0%) | 0 (0.0%) |
| 10 to 14 Year Olds | 80 (98.8%) | 1 (1.2%) |
| 15 to 17 Year Olds | 21 (100.0%) | 0 (0.0%) |
| 18 to 19 Year Olds | 7 (100.0%) | 0 (0.0%) |
| 20 to 24 Year Olds | 18 (100.0%) | 0 (0.0%) |
| 25 to 34 Year Olds | 14 (100.0%) | 0 (0.0%) |
| 35 Years and over | 3 (100.0%) | 0 (0.0%) |
| Total | 230 (99.6%) | 1 (0.4%) |
Educational Attainment by Field of Study in Blue Ridge
Business (34 | 36.2%), arts & humanities (21 | 22.3%), science & technology (14 | 14.9%), education (10 | 10.6%), and social sciences (5 | 5.3%) are the most common fields of study among 94 individuals in Blue Ridge who have obtained a bachelor's degree or higher.
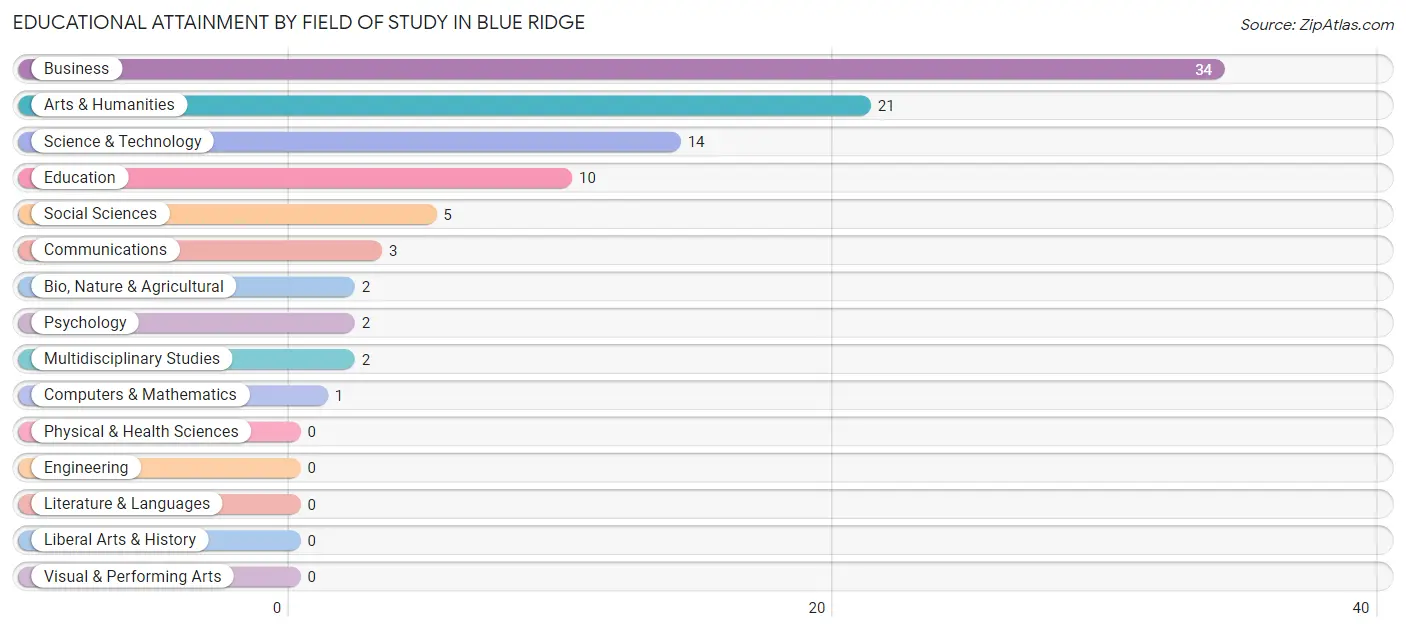
| Field of Study | # Graduates | % Graduates |
| Computers & Mathematics | 1 | 1.1% |
| Bio, Nature & Agricultural | 2 | 2.1% |
| Physical & Health Sciences | 0 | 0.0% |
| Psychology | 2 | 2.1% |
| Social Sciences | 5 | 5.3% |
| Engineering | 0 | 0.0% |
| Multidisciplinary Studies | 2 | 2.1% |
| Science & Technology | 14 | 14.9% |
| Business | 34 | 36.2% |
| Education | 10 | 10.6% |
| Literature & Languages | 0 | 0.0% |
| Liberal Arts & History | 0 | 0.0% |
| Visual & Performing Arts | 0 | 0.0% |
| Communications | 3 | 3.2% |
| Arts & Humanities | 21 | 22.3% |
| Total | 94 | 100.0% |
Transportation & Commute in Blue Ridge
Vehicle Availability by Sex in Blue Ridge
The most prevalent vehicle ownership categories in Blue Ridge are males with 2 vehicles (97, accounting for 32.6%) and females with 2 vehicles (59, making up 47.5%).
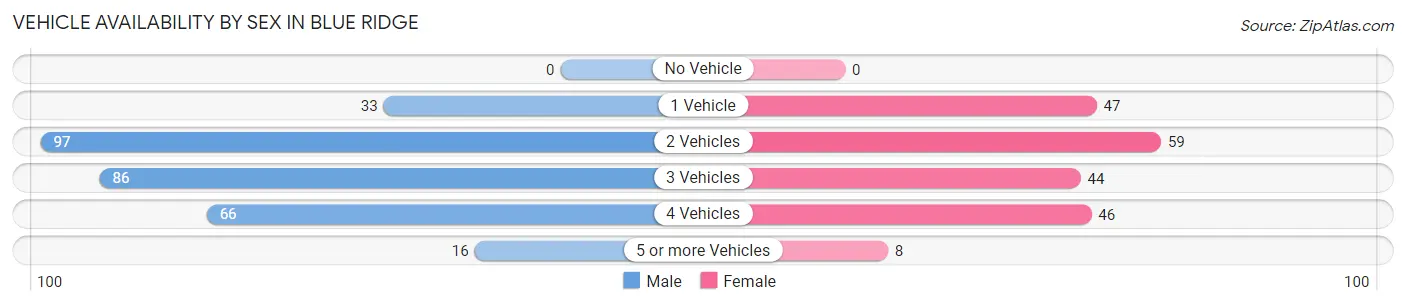
| Vehicles Available | Male | Female |
| No Vehicle | 0 (0.0%) | 0 (0.0%) |
| 1 Vehicle | 33 (11.1%) | 47 (23.0%) |
| 2 Vehicles | 97 (32.6%) | 59 (28.9%) |
| 3 Vehicles | 86 (28.9%) | 44 (21.6%) |
| 4 Vehicles | 66 (22.2%) | 46 (22.6%) |
| 5 or more Vehicles | 16 (5.4%) | 8 (3.9%) |
| Total | 298 (100.0%) | 204 (100.0%) |
Commute Time in Blue Ridge
The most frequently occuring commute durations in Blue Ridge are 20 to 24 minutes (81 commuters, 17.7%), 30 to 34 minutes (81 commuters, 17.7%), and 45 to 59 minutes (62 commuters, 13.5%).
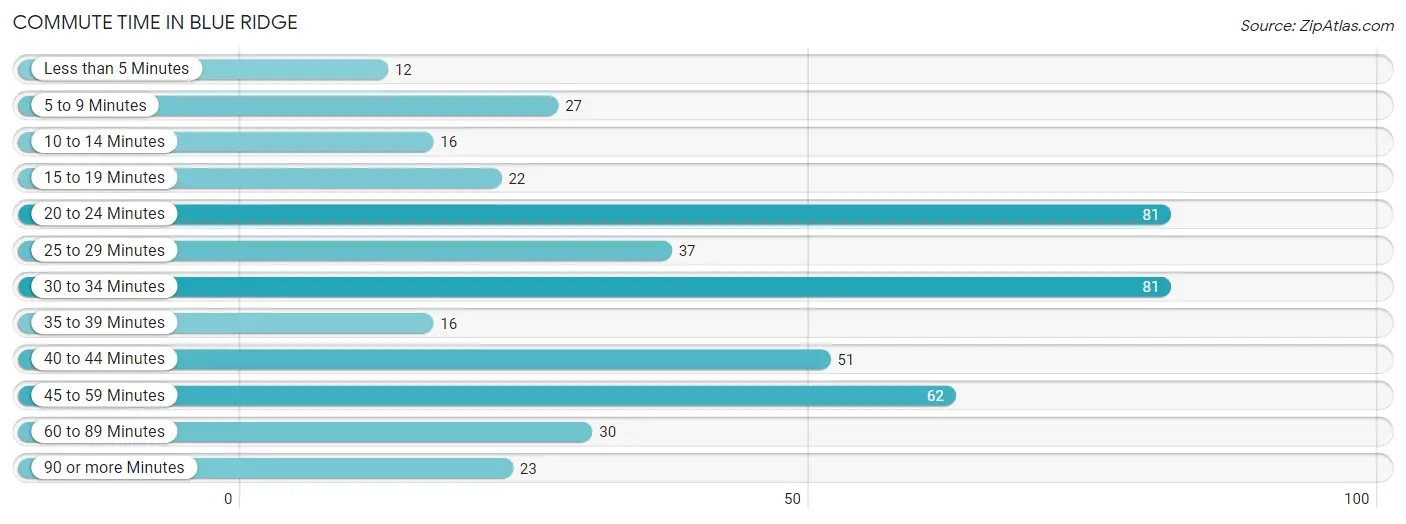
| Commute Time | # Commuters | % Commuters |
| Less than 5 Minutes | 12 | 2.6% |
| 5 to 9 Minutes | 27 | 5.9% |
| 10 to 14 Minutes | 16 | 3.5% |
| 15 to 19 Minutes | 22 | 4.8% |
| 20 to 24 Minutes | 81 | 17.7% |
| 25 to 29 Minutes | 37 | 8.1% |
| 30 to 34 Minutes | 81 | 17.7% |
| 35 to 39 Minutes | 16 | 3.5% |
| 40 to 44 Minutes | 51 | 11.1% |
| 45 to 59 Minutes | 62 | 13.5% |
| 60 to 89 Minutes | 30 | 6.6% |
| 90 or more Minutes | 23 | 5.0% |
Commute Time by Sex in Blue Ridge
The most common commute times in Blue Ridge are 30 to 34 minutes (57 commuters, 20.4%) for males and 20 to 24 minutes (29 commuters, 16.2%) for females.
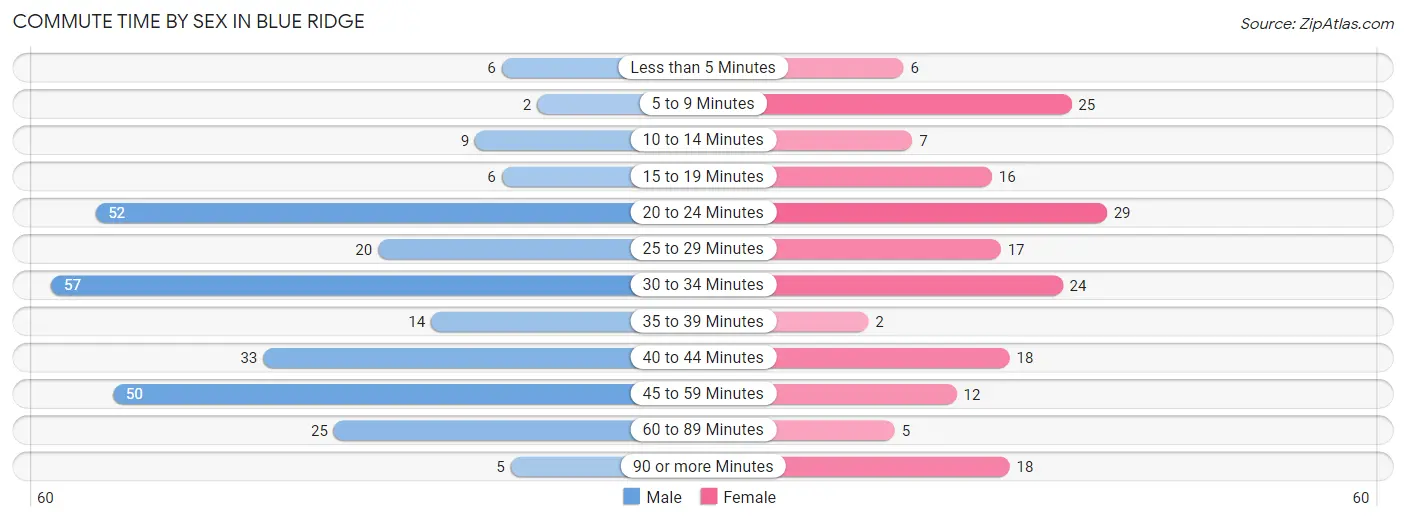
| Commute Time | Male | Female |
| Less than 5 Minutes | 6 (2.1%) | 6 (3.4%) |
| 5 to 9 Minutes | 2 (0.7%) | 25 (14.0%) |
| 10 to 14 Minutes | 9 (3.2%) | 7 (3.9%) |
| 15 to 19 Minutes | 6 (2.1%) | 16 (8.9%) |
| 20 to 24 Minutes | 52 (18.6%) | 29 (16.2%) |
| 25 to 29 Minutes | 20 (7.2%) | 17 (9.5%) |
| 30 to 34 Minutes | 57 (20.4%) | 24 (13.4%) |
| 35 to 39 Minutes | 14 (5.0%) | 2 (1.1%) |
| 40 to 44 Minutes | 33 (11.8%) | 18 (10.1%) |
| 45 to 59 Minutes | 50 (17.9%) | 12 (6.7%) |
| 60 to 89 Minutes | 25 (9.0%) | 5 (2.8%) |
| 90 or more Minutes | 5 (1.8%) | 18 (10.1%) |
Time of Departure to Work by Sex in Blue Ridge
The most frequent times of departure to work in Blue Ridge are 6:30 AM to 6:59 AM (76, 27.2%) for males and 7:00 AM to 7:29 AM (51, 28.5%) for females.
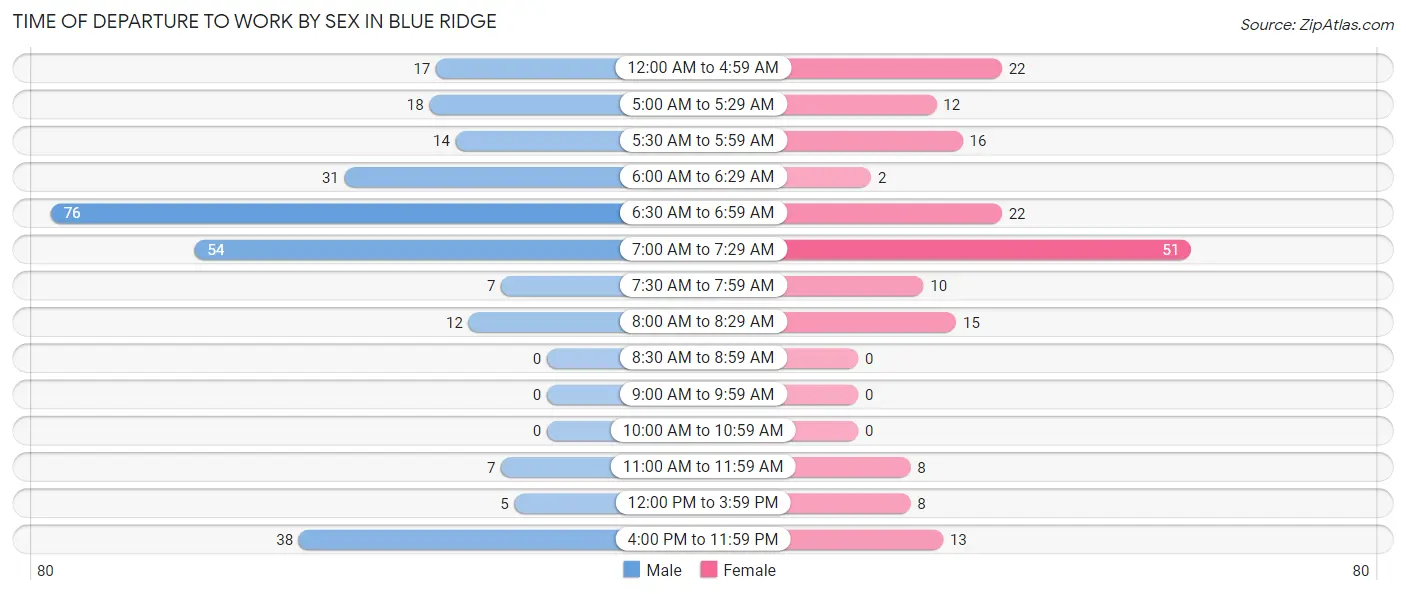
| Time of Departure | Male | Female |
| 12:00 AM to 4:59 AM | 17 (6.1%) | 22 (12.3%) |
| 5:00 AM to 5:29 AM | 18 (6.5%) | 12 (6.7%) |
| 5:30 AM to 5:59 AM | 14 (5.0%) | 16 (8.9%) |
| 6:00 AM to 6:29 AM | 31 (11.1%) | 2 (1.1%) |
| 6:30 AM to 6:59 AM | 76 (27.2%) | 22 (12.3%) |
| 7:00 AM to 7:29 AM | 54 (19.4%) | 51 (28.5%) |
| 7:30 AM to 7:59 AM | 7 (2.5%) | 10 (5.6%) |
| 8:00 AM to 8:29 AM | 12 (4.3%) | 15 (8.4%) |
| 8:30 AM to 8:59 AM | 0 (0.0%) | 0 (0.0%) |
| 9:00 AM to 9:59 AM | 0 (0.0%) | 0 (0.0%) |
| 10:00 AM to 10:59 AM | 0 (0.0%) | 0 (0.0%) |
| 11:00 AM to 11:59 AM | 7 (2.5%) | 8 (4.5%) |
| 12:00 PM to 3:59 PM | 5 (1.8%) | 8 (4.5%) |
| 4:00 PM to 11:59 PM | 38 (13.6%) | 13 (7.3%) |
| Total | 279 (100.0%) | 179 (100.0%) |
Housing Occupancy in Blue Ridge
Occupancy by Ownership in Blue Ridge
Of the total 314 dwellings in Blue Ridge, owner-occupied units account for 248 (79.0%), while renter-occupied units make up 66 (21.0%).
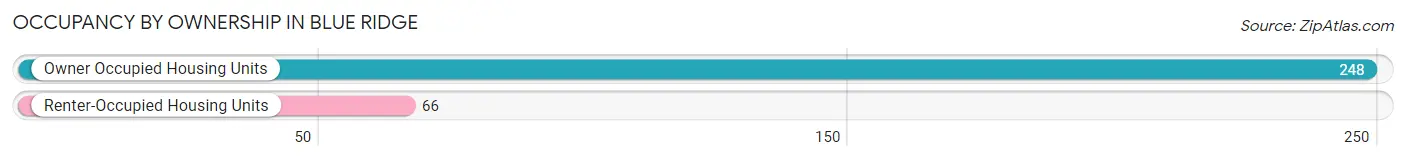
| Occupancy | # Housing Units | % Housing Units |
| Owner Occupied Housing Units | 248 | 79.0% |
| Renter-Occupied Housing Units | 66 | 21.0% |
| Total Occupied Housing Units | 314 | 100.0% |
Occupancy by Household Size in Blue Ridge
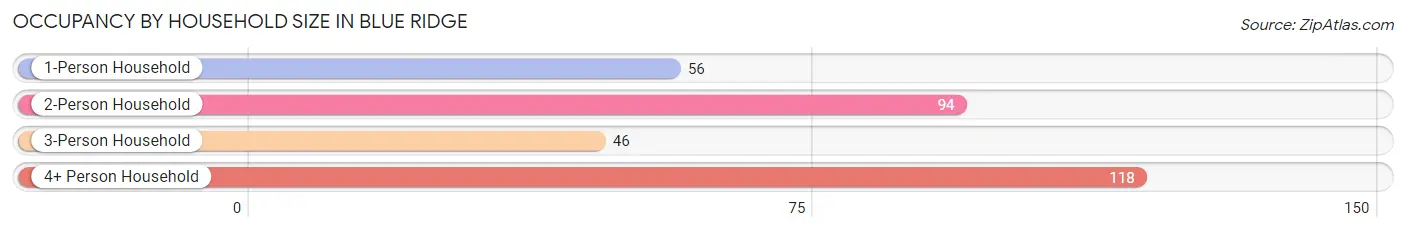
| Household Size | # Housing Units | % Housing Units |
| 1-Person Household | 56 | 17.8% |
| 2-Person Household | 94 | 29.9% |
| 3-Person Household | 46 | 14.6% |
| 4+ Person Household | 118 | 37.6% |
| Total Housing Units | 314 | 100.0% |
Occupancy by Ownership by Household Size in Blue Ridge
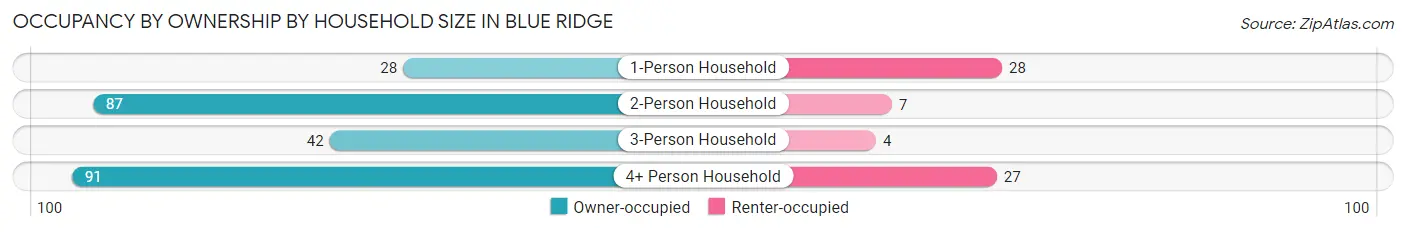
| Household Size | Owner-occupied | Renter-occupied |
| 1-Person Household | 28 (50.0%) | 28 (50.0%) |
| 2-Person Household | 87 (92.5%) | 7 (7.4%) |
| 3-Person Household | 42 (91.3%) | 4 (8.7%) |
| 4+ Person Household | 91 (77.1%) | 27 (22.9%) |
| Total Housing Units | 248 (79.0%) | 66 (21.0%) |
Occupancy by Educational Attainment in Blue Ridge
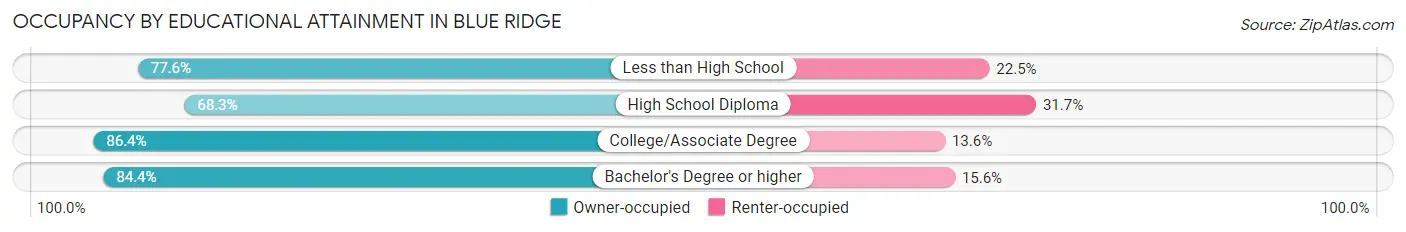
| Household Size | Owner-occupied | Renter-occupied |
| Less than High School | 38 (77.5%) | 11 (22.5%) |
| High School Diploma | 69 (68.3%) | 32 (31.7%) |
| College/Associate Degree | 114 (86.4%) | 18 (13.6%) |
| Bachelor's Degree or higher | 27 (84.4%) | 5 (15.6%) |
Occupancy by Age of Householder in Blue Ridge
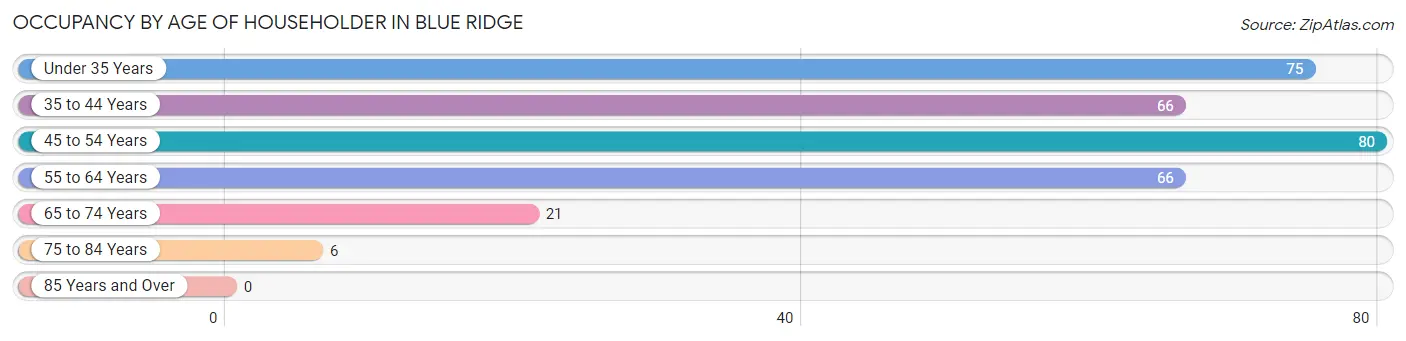
| Age Bracket | # Households | % Households |
| Under 35 Years | 75 | 23.9% |
| 35 to 44 Years | 66 | 21.0% |
| 45 to 54 Years | 80 | 25.5% |
| 55 to 64 Years | 66 | 21.0% |
| 65 to 74 Years | 21 | 6.7% |
| 75 to 84 Years | 6 | 1.9% |
| 85 Years and Over | 0 | 0.0% |
| Total | 314 | 100.0% |
Housing Finances in Blue Ridge
Median Income by Occupancy in Blue Ridge
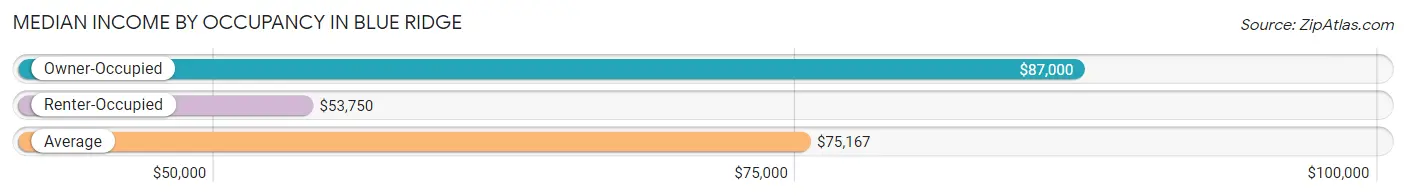
| Occupancy Type | # Households | Median Income |
| Owner-Occupied | 248 (79.0%) | $87,000 |
| Renter-Occupied | 66 (21.0%) | $53,750 |
| Average | 314 (100.0%) | $75,167 |
Occupancy by Householder Income Bracket in Blue Ridge
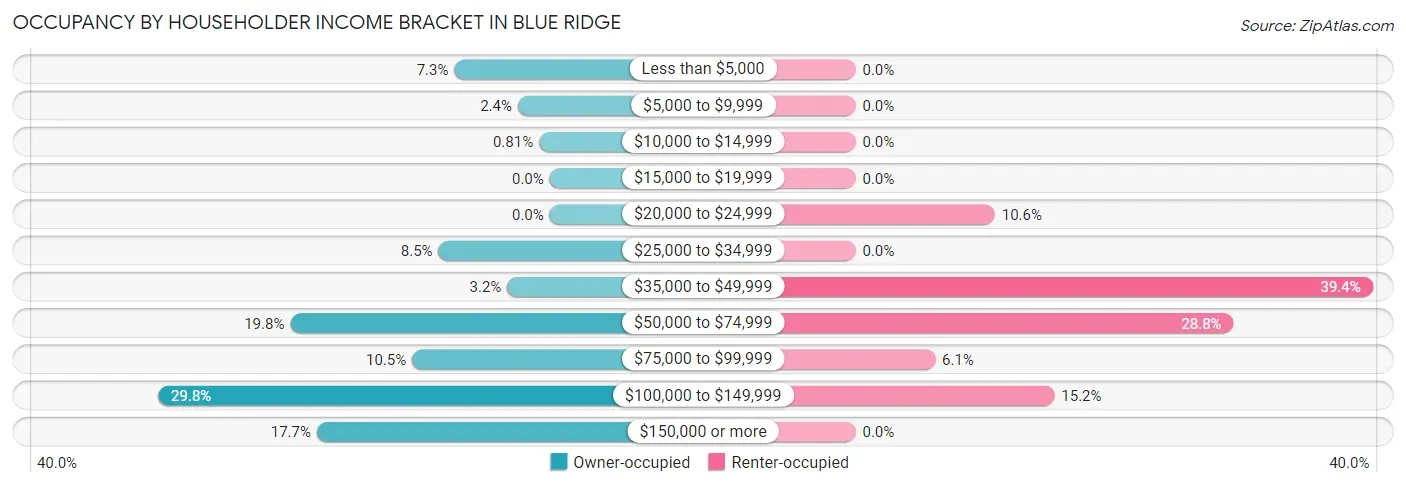
| Income Bracket | Owner-occupied | Renter-occupied |
| Less than $5,000 | 18 (7.3%) | 0 (0.0%) |
| $5,000 to $9,999 | 6 (2.4%) | 0 (0.0%) |
| $10,000 to $14,999 | 2 (0.8%) | 0 (0.0%) |
| $15,000 to $19,999 | 0 (0.0%) | 0 (0.0%) |
| $20,000 to $24,999 | 0 (0.0%) | 7 (10.6%) |
| $25,000 to $34,999 | 21 (8.5%) | 0 (0.0%) |
| $35,000 to $49,999 | 8 (3.2%) | 26 (39.4%) |
| $50,000 to $74,999 | 49 (19.8%) | 19 (28.8%) |
| $75,000 to $99,999 | 26 (10.5%) | 4 (6.1%) |
| $100,000 to $149,999 | 74 (29.8%) | 10 (15.1%) |
| $150,000 or more | 44 (17.7%) | 0 (0.0%) |
| Total | 248 (100.0%) | 66 (100.0%) |
Monthly Housing Cost Tiers in Blue Ridge
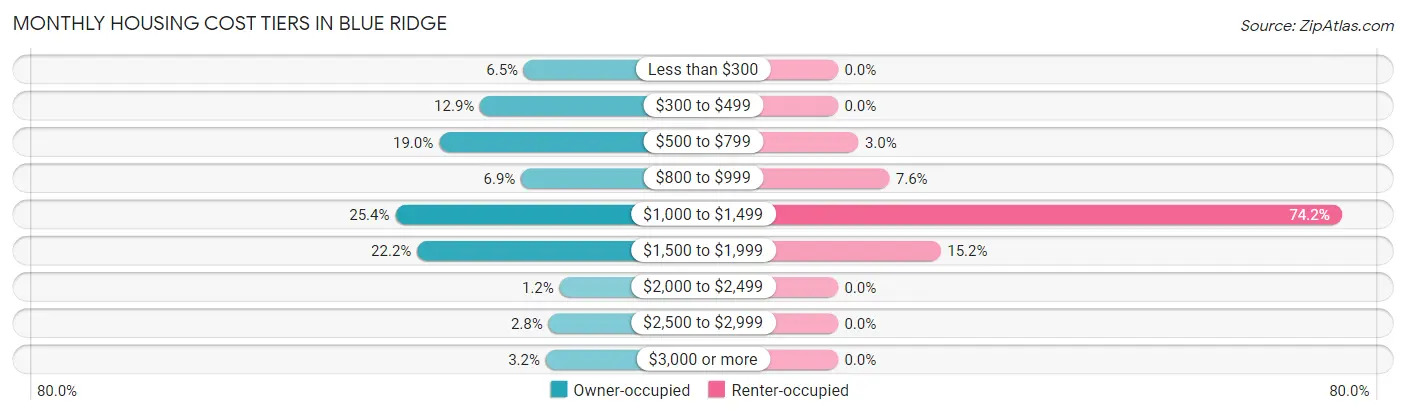
| Monthly Cost | Owner-occupied | Renter-occupied |
| Less than $300 | 16 (6.5%) | 0 (0.0%) |
| $300 to $499 | 32 (12.9%) | 0 (0.0%) |
| $500 to $799 | 47 (19.0%) | 2 (3.0%) |
| $800 to $999 | 17 (6.9%) | 5 (7.6%) |
| $1,000 to $1,499 | 63 (25.4%) | 49 (74.2%) |
| $1,500 to $1,999 | 55 (22.2%) | 10 (15.1%) |
| $2,000 to $2,499 | 3 (1.2%) | 0 (0.0%) |
| $2,500 to $2,999 | 7 (2.8%) | 0 (0.0%) |
| $3,000 or more | 8 (3.2%) | 0 (0.0%) |
| Total | 248 (100.0%) | 66 (100.0%) |
Physical Housing Characteristics in Blue Ridge
Housing Structures in Blue Ridge
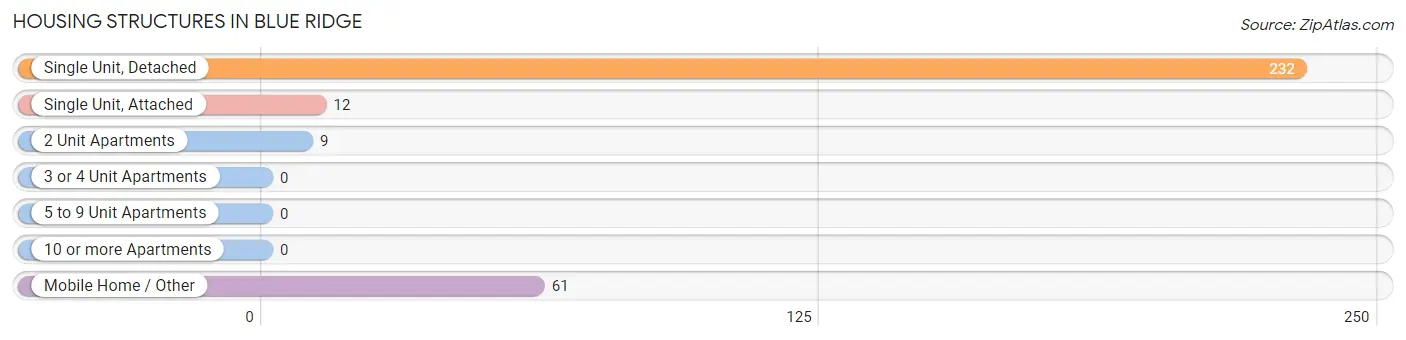
| Structure Type | # Housing Units | % Housing Units |
| Single Unit, Detached | 232 | 73.9% |
| Single Unit, Attached | 12 | 3.8% |
| 2 Unit Apartments | 9 | 2.9% |
| 3 or 4 Unit Apartments | 0 | 0.0% |
| 5 to 9 Unit Apartments | 0 | 0.0% |
| 10 or more Apartments | 0 | 0.0% |
| Mobile Home / Other | 61 | 19.4% |
| Total | 314 | 100.0% |
Housing Structures by Occupancy in Blue Ridge
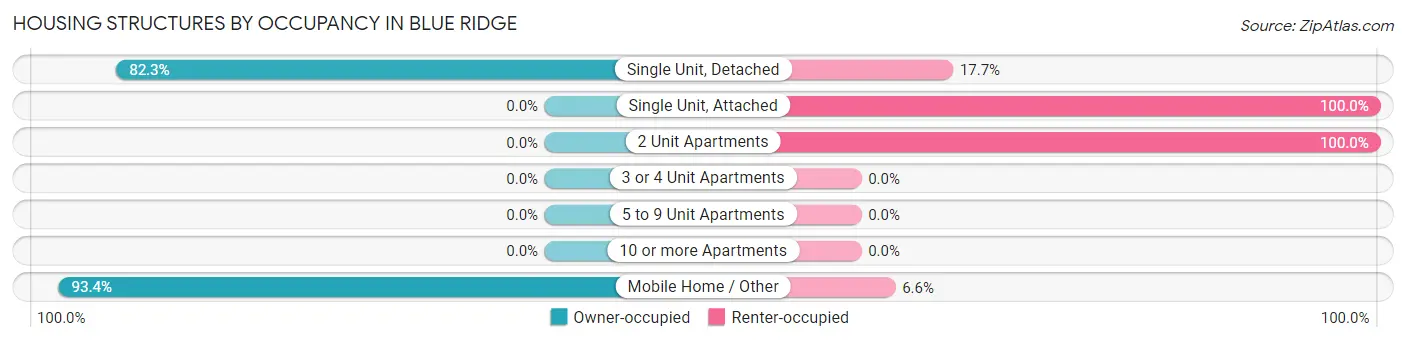
| Structure Type | Owner-occupied | Renter-occupied |
| Single Unit, Detached | 191 (82.3%) | 41 (17.7%) |
| Single Unit, Attached | 0 (0.0%) | 12 (100.0%) |
| 2 Unit Apartments | 0 (0.0%) | 9 (100.0%) |
| 3 or 4 Unit Apartments | 0 (0.0%) | 0 (0.0%) |
| 5 to 9 Unit Apartments | 0 (0.0%) | 0 (0.0%) |
| 10 or more Apartments | 0 (0.0%) | 0 (0.0%) |
| Mobile Home / Other | 57 (93.4%) | 4 (6.6%) |
| Total | 248 (79.0%) | 66 (21.0%) |
Housing Structures by Number of Rooms in Blue Ridge
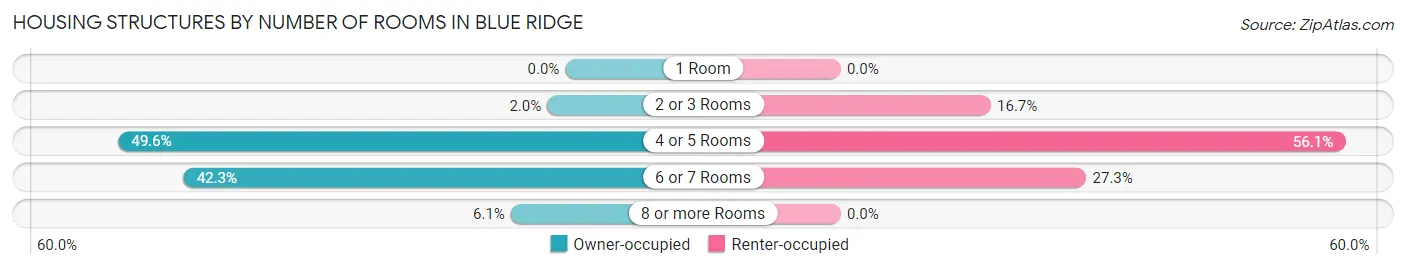
| Number of Rooms | Owner-occupied | Renter-occupied |
| 1 Room | 0 (0.0%) | 0 (0.0%) |
| 2 or 3 Rooms | 5 (2.0%) | 11 (16.7%) |
| 4 or 5 Rooms | 123 (49.6%) | 37 (56.1%) |
| 6 or 7 Rooms | 105 (42.3%) | 18 (27.3%) |
| 8 or more Rooms | 15 (6.0%) | 0 (0.0%) |
| Total | 248 (100.0%) | 66 (100.0%) |
Housing Structure by Heating Type in Blue Ridge
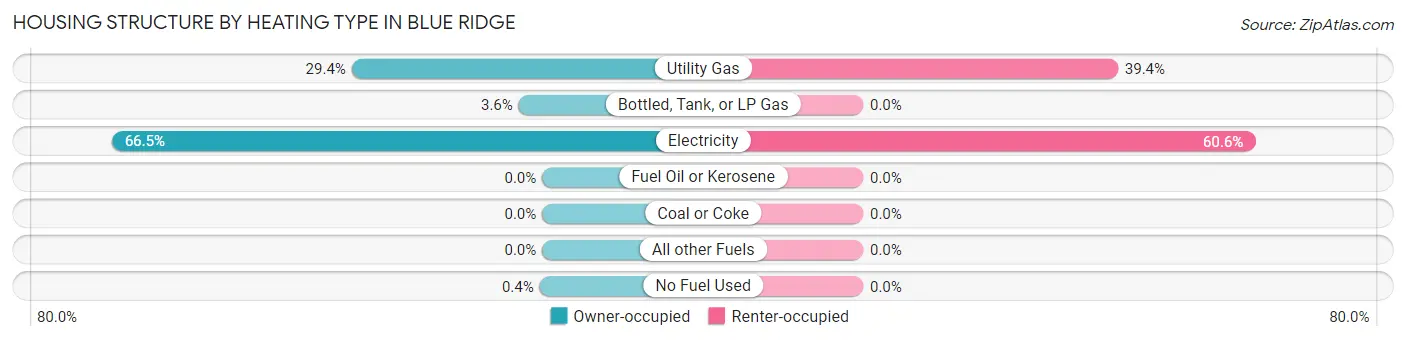
| Heating Type | Owner-occupied | Renter-occupied |
| Utility Gas | 73 (29.4%) | 26 (39.4%) |
| Bottled, Tank, or LP Gas | 9 (3.6%) | 0 (0.0%) |
| Electricity | 165 (66.5%) | 40 (60.6%) |
| Fuel Oil or Kerosene | 0 (0.0%) | 0 (0.0%) |
| Coal or Coke | 0 (0.0%) | 0 (0.0%) |
| All other Fuels | 0 (0.0%) | 0 (0.0%) |
| No Fuel Used | 1 (0.4%) | 0 (0.0%) |
| Total | 248 (100.0%) | 66 (100.0%) |
Household Vehicle Usage in Blue Ridge
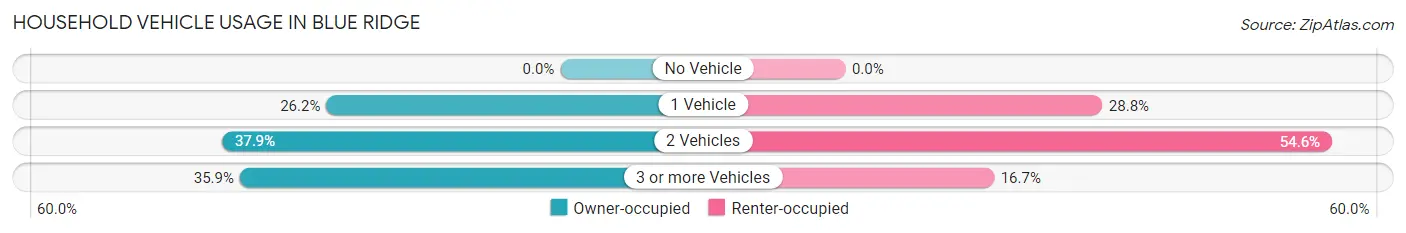
| Vehicles per Household | Owner-occupied | Renter-occupied |
| No Vehicle | 0 (0.0%) | 0 (0.0%) |
| 1 Vehicle | 65 (26.2%) | 19 (28.8%) |
| 2 Vehicles | 94 (37.9%) | 36 (54.5%) |
| 3 or more Vehicles | 89 (35.9%) | 11 (16.7%) |
| Total | 248 (100.0%) | 66 (100.0%) |
Real Estate & Mortgages in Blue Ridge
Real Estate and Mortgage Overview in Blue Ridge
| Characteristic | Without Mortgage | With Mortgage |
| Housing Units | 100 | 148 |
| Median Property Value | $108,300 | $210,900 |
| Median Household Income | $52,188 | $36 |
| Monthly Housing Costs | $517 | $8 |
| Real Estate Taxes | $1,786 | $6 |
Property Value by Mortgage Status in Blue Ridge
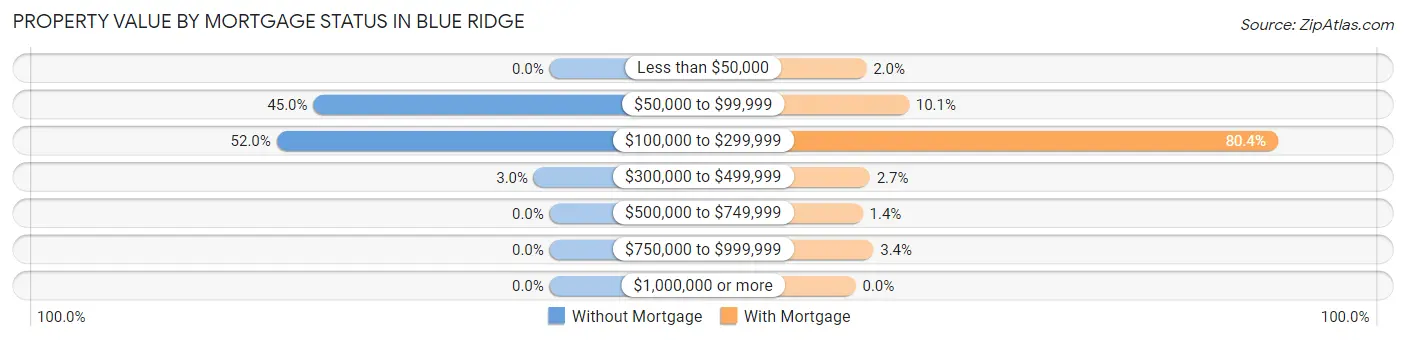
| Property Value | Without Mortgage | With Mortgage |
| Less than $50,000 | 0 (0.0%) | 3 (2.0%) |
| $50,000 to $99,999 | 45 (45.0%) | 15 (10.1%) |
| $100,000 to $299,999 | 52 (52.0%) | 119 (80.4%) |
| $300,000 to $499,999 | 3 (3.0%) | 4 (2.7%) |
| $500,000 to $749,999 | 0 (0.0%) | 2 (1.3%) |
| $750,000 to $999,999 | 0 (0.0%) | 5 (3.4%) |
| $1,000,000 or more | 0 (0.0%) | 0 (0.0%) |
| Total | 100 (100.0%) | 148 (100.0%) |
Household Income by Mortgage Status in Blue Ridge
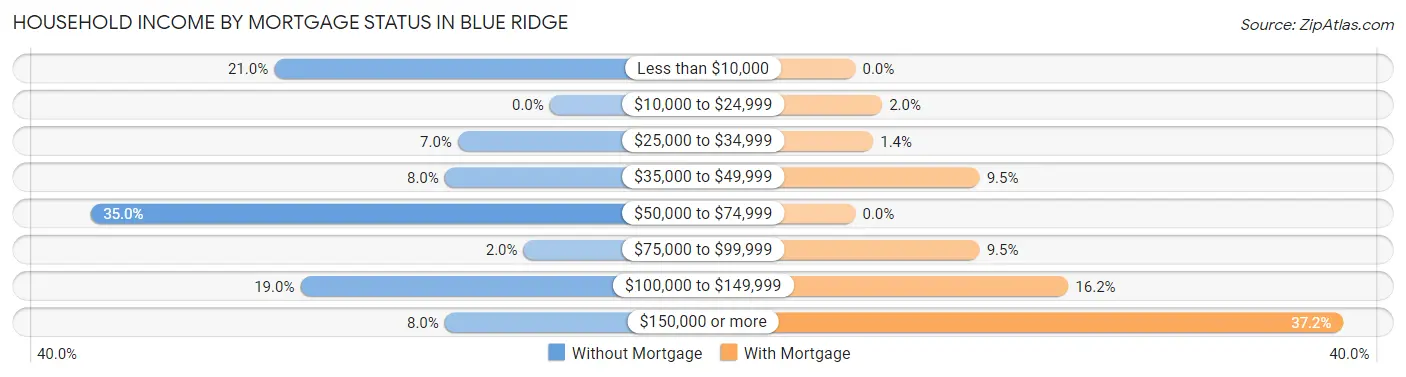
| Household Income | Without Mortgage | With Mortgage |
| Less than $10,000 | 21 (21.0%) | 0 (0.0%) |
| $10,000 to $24,999 | 0 (0.0%) | 3 (2.0%) |
| $25,000 to $34,999 | 7 (7.0%) | 2 (1.3%) |
| $35,000 to $49,999 | 8 (8.0%) | 14 (9.5%) |
| $50,000 to $74,999 | 35 (35.0%) | 0 (0.0%) |
| $75,000 to $99,999 | 2 (2.0%) | 14 (9.5%) |
| $100,000 to $149,999 | 19 (19.0%) | 24 (16.2%) |
| $150,000 or more | 8 (8.0%) | 55 (37.2%) |
| Total | 100 (100.0%) | 148 (100.0%) |
Property Value to Household Income Ratio in Blue Ridge
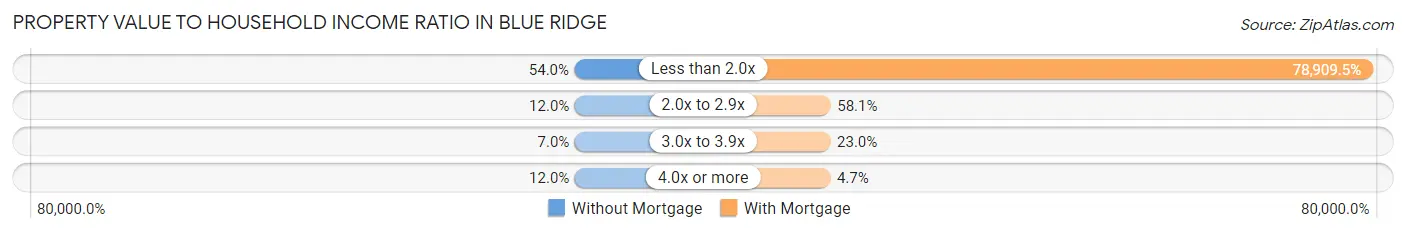
| Value-to-Income Ratio | Without Mortgage | With Mortgage |
| Less than 2.0x | 54 (54.0%) | 116,786 (78,909.5%) |
| 2.0x to 2.9x | 12 (12.0%) | 86 (58.1%) |
| 3.0x to 3.9x | 7 (7.0%) | 34 (23.0%) |
| 4.0x or more | 12 (12.0%) | 7 (4.7%) |
| Total | 100 (100.0%) | 148 (100.0%) |
Real Estate Taxes by Mortgage Status in Blue Ridge
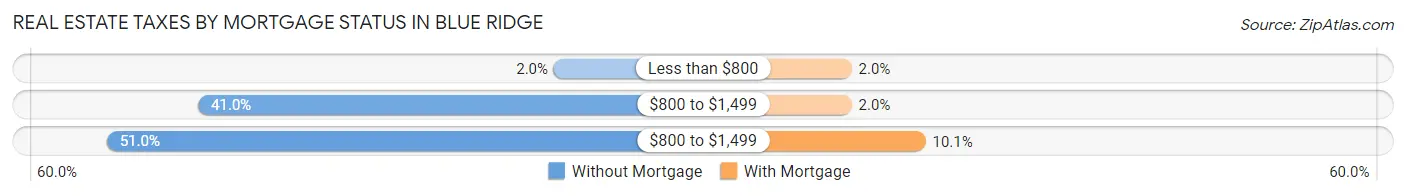
| Property Taxes | Without Mortgage | With Mortgage |
| Less than $800 | 2 (2.0%) | 3 (2.0%) |
| $800 to $1,499 | 41 (41.0%) | 3 (2.0%) |
| $800 to $1,499 | 51 (51.0%) | 15 (10.1%) |
| Total | 100 (100.0%) | 148 (100.0%) |
Health & Disability in Blue Ridge
Health Insurance Coverage by Age in Blue Ridge
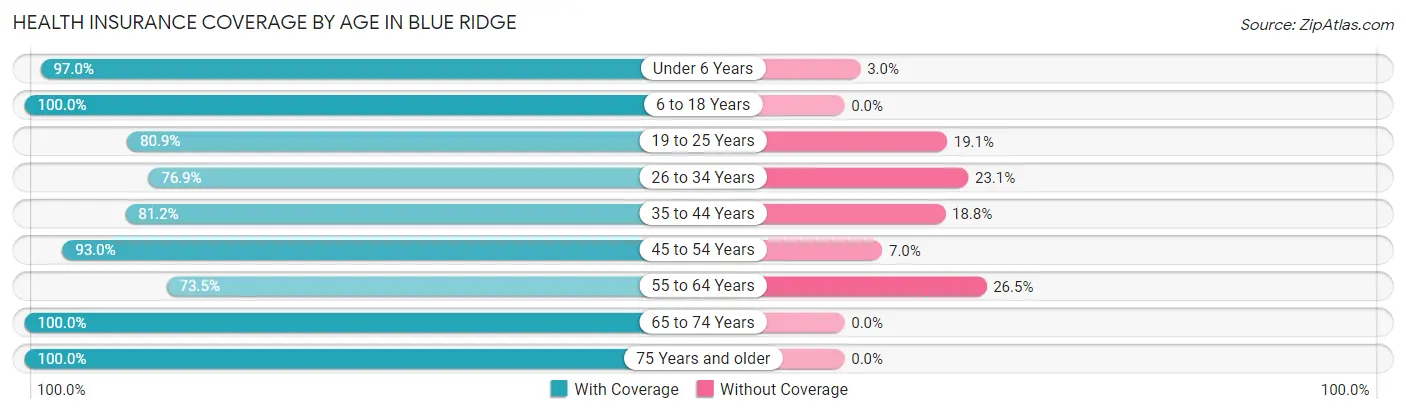
| Age Bracket | With Coverage | Without Coverage |
| Under 6 Years | 98 (97.0%) | 3 (3.0%) |
| 6 to 18 Years | 194 (100.0%) | 0 (0.0%) |
| 19 to 25 Years | 55 (80.9%) | 13 (19.1%) |
| 26 to 34 Years | 120 (76.9%) | 36 (23.1%) |
| 35 to 44 Years | 121 (81.2%) | 28 (18.8%) |
| 45 to 54 Years | 132 (93.0%) | 10 (7.0%) |
| 55 to 64 Years | 75 (73.5%) | 27 (26.5%) |
| 65 to 74 Years | 64 (100.0%) | 0 (0.0%) |
| 75 Years and older | 6 (100.0%) | 0 (0.0%) |
| Total | 865 (88.1%) | 117 (11.9%) |
Health Insurance Coverage by Citizenship Status in Blue Ridge
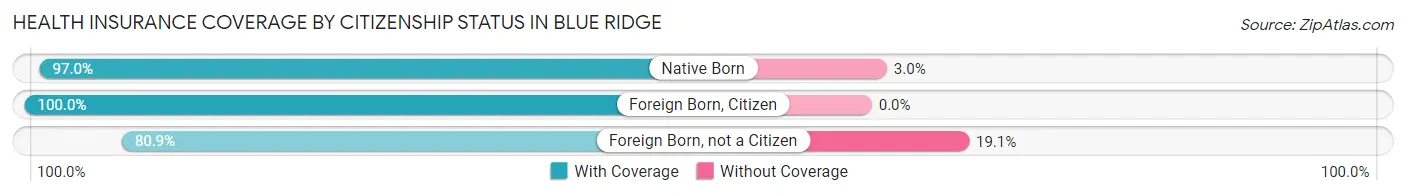
| Citizenship Status | With Coverage | Without Coverage |
| Native Born | 98 (97.0%) | 3 (3.0%) |
| Foreign Born, Citizen | 194 (100.0%) | 0 (0.0%) |
| Foreign Born, not a Citizen | 55 (80.9%) | 13 (19.1%) |
Health Insurance Coverage by Household Income in Blue Ridge
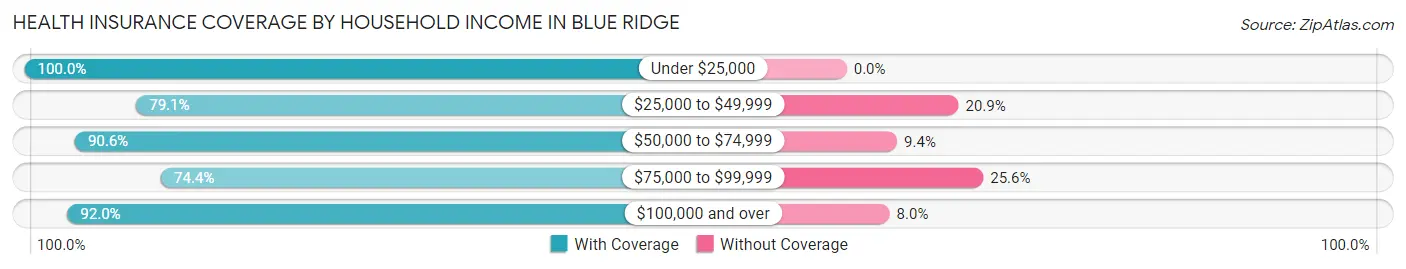
| Household Income | With Coverage | Without Coverage |
| Under $25,000 | 52 (100.0%) | 0 (0.0%) |
| $25,000 to $49,999 | 151 (79.1%) | 40 (20.9%) |
| $50,000 to $74,999 | 163 (90.6%) | 17 (9.4%) |
| $75,000 to $99,999 | 64 (74.4%) | 22 (25.6%) |
| $100,000 and over | 435 (92.0%) | 38 (8.0%) |
Public vs Private Health Insurance Coverage by Age in Blue Ridge
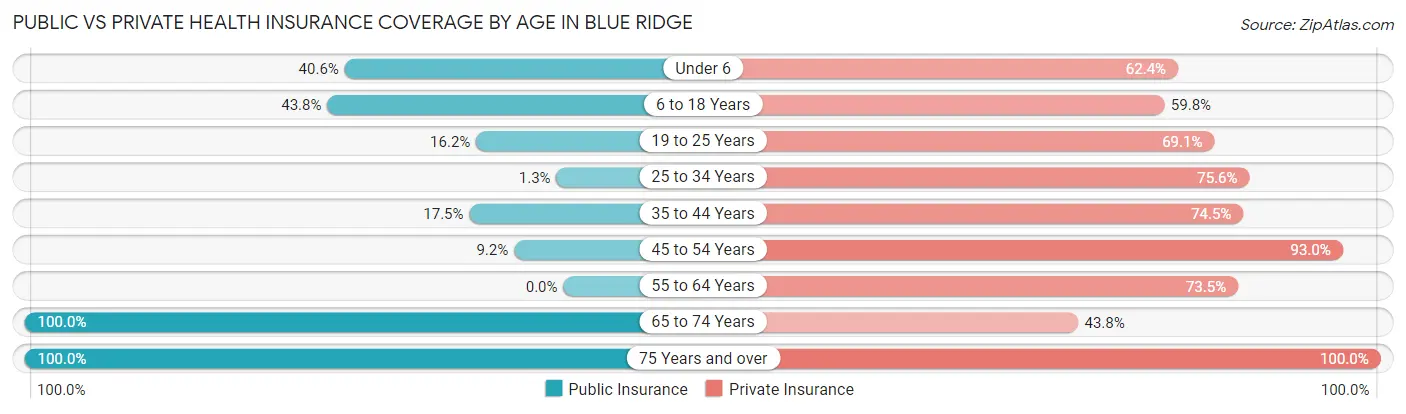
| Age Bracket | Public Insurance | Private Insurance |
| Under 6 | 41 (40.6%) | 63 (62.4%) |
| 6 to 18 Years | 85 (43.8%) | 116 (59.8%) |
| 19 to 25 Years | 11 (16.2%) | 47 (69.1%) |
| 25 to 34 Years | 2 (1.3%) | 118 (75.6%) |
| 35 to 44 Years | 26 (17.4%) | 111 (74.5%) |
| 45 to 54 Years | 13 (9.1%) | 132 (93.0%) |
| 55 to 64 Years | 0 (0.0%) | 75 (73.5%) |
| 65 to 74 Years | 64 (100.0%) | 28 (43.8%) |
| 75 Years and over | 6 (100.0%) | 6 (100.0%) |
| Total | 248 (25.3%) | 696 (70.9%) |
Disability Status by Sex by Age in Blue Ridge
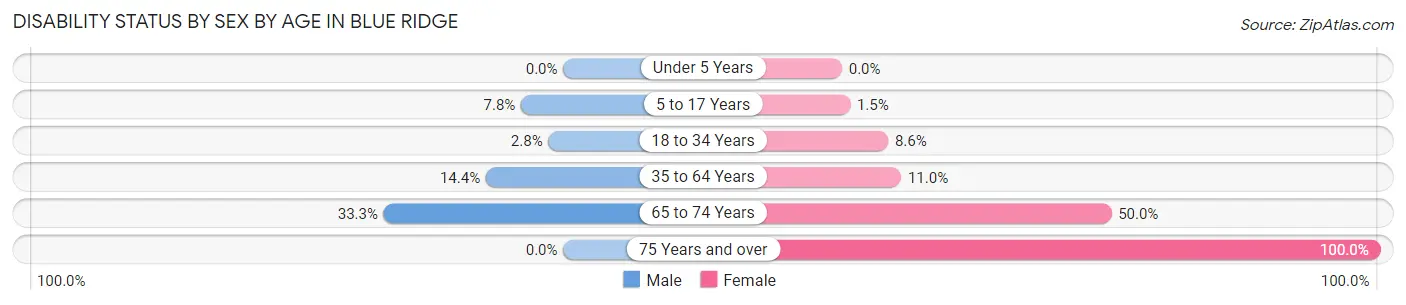
| Age Bracket | Male | Female |
| Under 5 Years | 0 (0.0%) | 0 (0.0%) |
| 5 to 17 Years | 9 (7.8%) | 1 (1.5%) |
| 18 to 34 Years | 4 (2.8%) | 9 (8.6%) |
| 35 to 64 Years | 29 (14.4%) | 21 (11.0%) |
| 65 to 74 Years | 6 (33.3%) | 23 (50.0%) |
| 75 Years and over | 0 (0.0%) | 2 (100.0%) |
Disability Class by Sex by Age in Blue Ridge
Disability Class: Hearing Difficulty
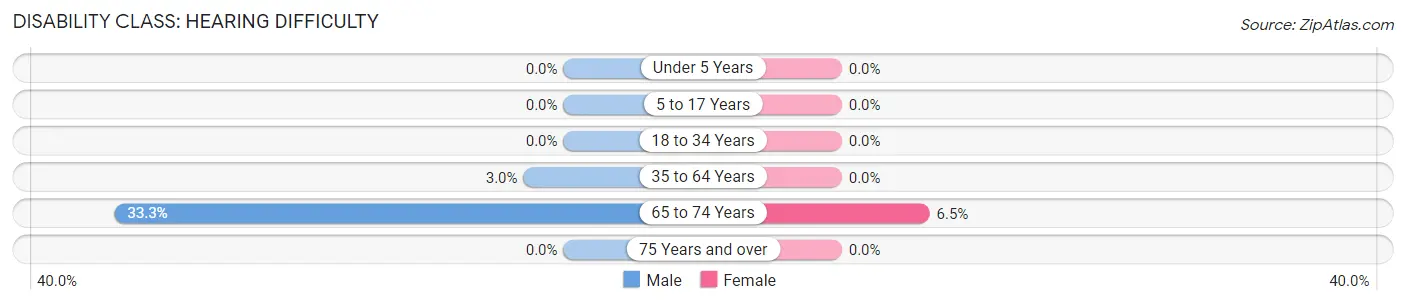
| Age Bracket | Male | Female |
| Under 5 Years | 0 (0.0%) | 0 (0.0%) |
| 5 to 17 Years | 0 (0.0%) | 0 (0.0%) |
| 18 to 34 Years | 0 (0.0%) | 0 (0.0%) |
| 35 to 64 Years | 6 (3.0%) | 0 (0.0%) |
| 65 to 74 Years | 6 (33.3%) | 3 (6.5%) |
| 75 Years and over | 0 (0.0%) | 0 (0.0%) |
Disability Class: Vision Difficulty
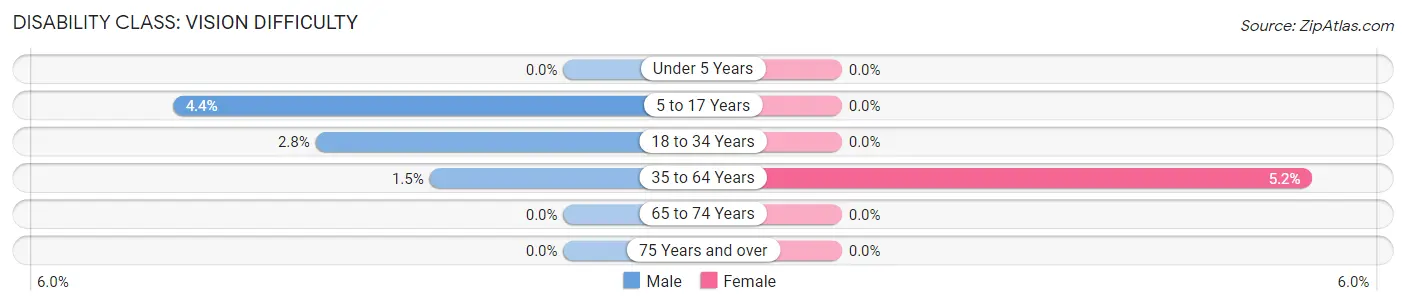
| Age Bracket | Male | Female |
| Under 5 Years | 0 (0.0%) | 0 (0.0%) |
| 5 to 17 Years | 5 (4.3%) | 0 (0.0%) |
| 18 to 34 Years | 4 (2.8%) | 0 (0.0%) |
| 35 to 64 Years | 3 (1.5%) | 10 (5.2%) |
| 65 to 74 Years | 0 (0.0%) | 0 (0.0%) |
| 75 Years and over | 0 (0.0%) | 0 (0.0%) |
Disability Class: Cognitive Difficulty
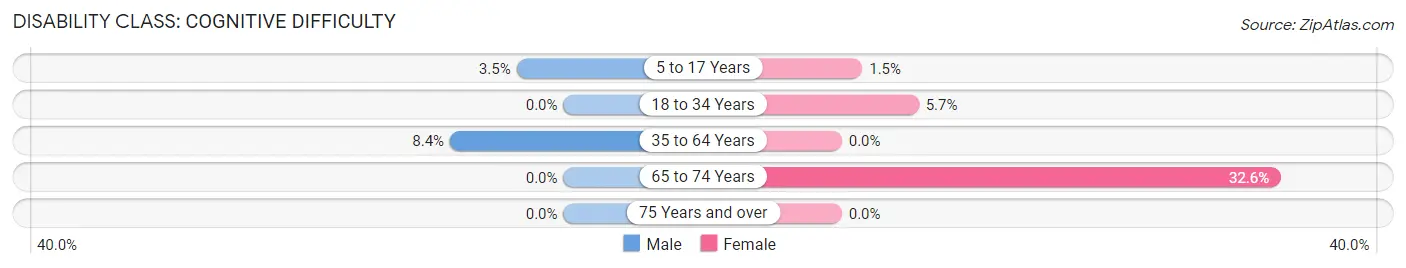
| Age Bracket | Male | Female |
| 5 to 17 Years | 4 (3.5%) | 1 (1.5%) |
| 18 to 34 Years | 0 (0.0%) | 6 (5.7%) |
| 35 to 64 Years | 17 (8.4%) | 0 (0.0%) |
| 65 to 74 Years | 0 (0.0%) | 15 (32.6%) |
| 75 Years and over | 0 (0.0%) | 0 (0.0%) |
Disability Class: Ambulatory Difficulty
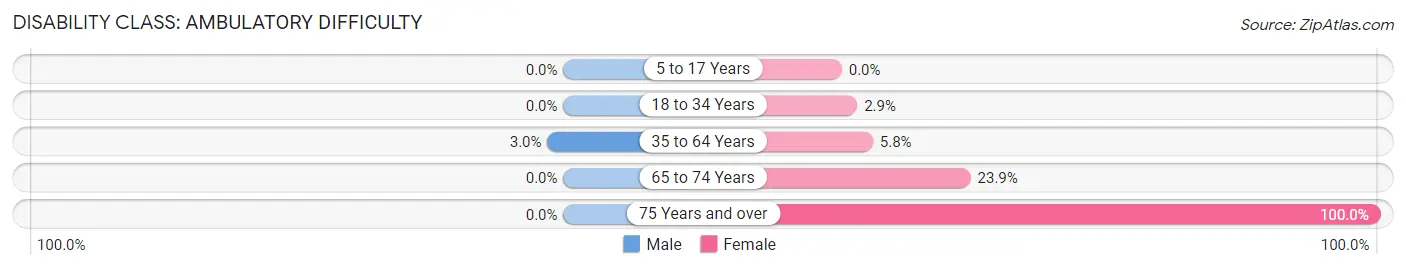
| Age Bracket | Male | Female |
| 5 to 17 Years | 0 (0.0%) | 0 (0.0%) |
| 18 to 34 Years | 0 (0.0%) | 3 (2.9%) |
| 35 to 64 Years | 6 (3.0%) | 11 (5.8%) |
| 65 to 74 Years | 0 (0.0%) | 11 (23.9%) |
| 75 Years and over | 0 (0.0%) | 2 (100.0%) |
Disability Class: Self-Care Difficulty
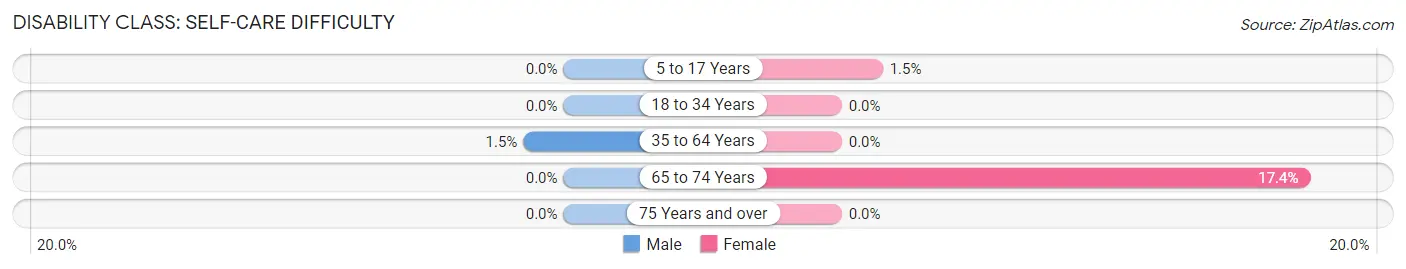
| Age Bracket | Male | Female |
| 5 to 17 Years | 0 (0.0%) | 1 (1.5%) |
| 18 to 34 Years | 0 (0.0%) | 0 (0.0%) |
| 35 to 64 Years | 3 (1.5%) | 0 (0.0%) |
| 65 to 74 Years | 0 (0.0%) | 8 (17.4%) |
| 75 Years and over | 0 (0.0%) | 0 (0.0%) |
Technology Access in Blue Ridge
Computing Device Access in Blue Ridge
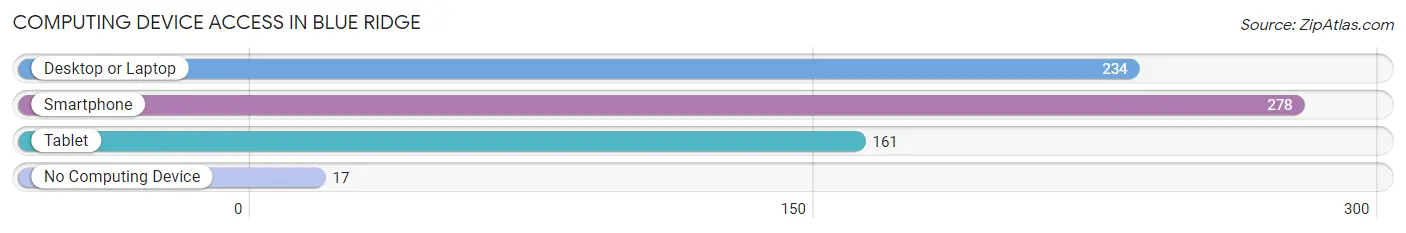
| Device Type | # Households | % Households |
| Desktop or Laptop | 234 | 74.5% |
| Smartphone | 278 | 88.5% |
| Tablet | 161 | 51.3% |
| No Computing Device | 17 | 5.4% |
| Total | 314 | 100.0% |
Internet Access in Blue Ridge
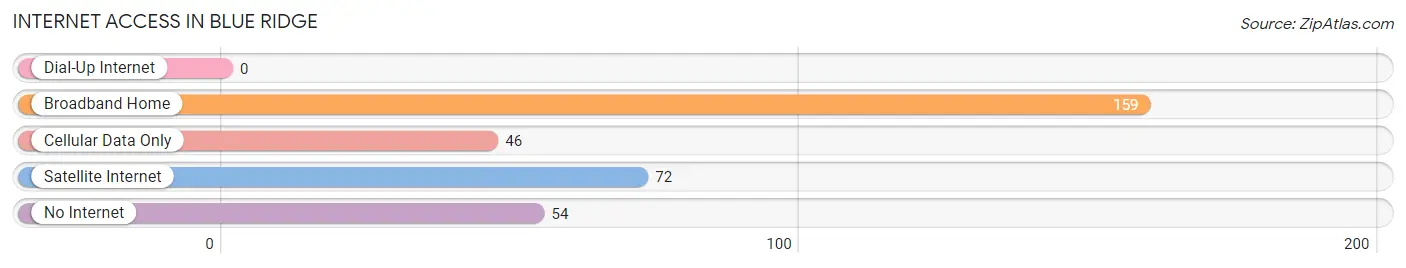
| Internet Type | # Households | % Households |
| Dial-Up Internet | 0 | 0.0% |
| Broadband Home | 159 | 50.6% |
| Cellular Data Only | 46 | 14.6% |
| Satellite Internet | 72 | 22.9% |
| No Internet | 54 | 17.2% |
| Total | 314 | 100.0% |
Blue Ridge Summary
Introduction
Blue Ridge is a small town located in Collin County, Texas. It is situated about 40 miles northeast of Dallas and is part of the Dallas-Fort Worth metropolitan area. The town has a population of about 1,500 people and is known for its rural charm and small-town atmosphere. The town was founded in 1873 and has a rich history that includes a variety of industries, including farming, ranching, and oil production.
Geography
Blue Ridge is located in the northeast corner of Collin County, Texas. It is situated about 40 miles northeast of Dallas and is part of the Dallas-Fort Worth metropolitan area. The town is located on the edge of the Blackland Prairie, a region of rolling hills and grasslands. The town is bordered by the cities of McKinney, Princeton, and Anna. The town is situated on the banks of the Trinity River, which provides a source of recreation for the town’s residents.
The town has a total area of 1.2 square miles, all of which is land. The town has a humid subtropical climate, with hot summers and mild winters. The average temperature in the summer is around 90 degrees Fahrenheit, while the average temperature in the winter is around 50 degrees Fahrenheit.
Economy
Blue Ridge’s economy is largely based on agriculture and ranching. The town is home to several farms and ranches, which produce a variety of crops, including corn, wheat, and hay. The town is also home to several oil and gas production companies, which provide jobs for many of the town’s residents.
The town is also home to several small businesses, including restaurants, retail stores, and service providers. The town is also home to a variety of manufacturing companies, which produce a variety of products, including furniture, clothing, and electronics.
Demographics
As of the 2010 census, the town had a population of 1,500 people. The population is predominantly white, with about 75% of the population identifying as white. The town also has a small Hispanic population, with about 10% of the population identifying as Hispanic. The town also has a small African American population, with about 5% of the population identifying as African American.
The median household income in the town is about $50,000, which is slightly lower than the national average. The median home value in the town is about $150,000, which is slightly higher than the national average.
Conclusion
Blue Ridge is a small town located in Collin County, Texas. It is situated about 40 miles northeast of Dallas and is part of the Dallas-Fort Worth metropolitan area. The town has a population of about 1,500 people and is known for its rural charm and small-town atmosphere. The town’s economy is largely based on agriculture and ranching, with several farms and ranches located in the area. The town also has a small Hispanic and African American population, with about 10% and 5% of the population identifying as Hispanic and African American, respectively. The median household income in the town is about $50,000, which is slightly lower than the national average. The median home value in the town is about $150,000, which is slightly higher than the national average.
Common Questions
What is Per Capita Income in Blue Ridge?
Per Capita income in Blue Ridge is $29,110.
What is the Median Family Income in Blue Ridge?
Median Family Income in Blue Ridge is $82,083.
What is the Median Household income in Blue Ridge?
Median Household Income in Blue Ridge is $75,167.
What is Income or Wage Gap in Blue Ridge?
Income or Wage Gap in Blue Ridge is 7.9%.
Women in Blue Ridge earn 92.1 cents for every dollar earned by a man.
What is Inequality or Gini Index in Blue Ridge?
Inequality or Gini Index in Blue Ridge is 0.37.
What is the Total Population of Blue Ridge?
Total Population of Blue Ridge is 982.
What is the Total Male Population of Blue Ridge?
Total Male Population of Blue Ridge is 521.
What is the Total Female Population of Blue Ridge?
Total Female Population of Blue Ridge is 461.
What is the Ratio of Males per 100 Females in Blue Ridge?
There are 113.02 Males per 100 Females in Blue Ridge.
What is the Ratio of Females per 100 Males in Blue Ridge?
There are 88.48 Females per 100 Males in Blue Ridge.
What is the Median Population Age in Blue Ridge?
Median Population Age in Blue Ridge is 34.1 Years.
What is the Average Family Size in Blue Ridge
Average Family Size in Blue Ridge is 3.4 People.
What is the Average Household Size in Blue Ridge
Average Household Size in Blue Ridge is 3.1 People.
How Large is the Labor Force in Blue Ridge?
There are 524 People in the Labor Forcein in Blue Ridge.
What is the Percentage of People in the Labor Force in Blue Ridge?
72.5% of People are in the Labor Force in Blue Ridge.
What is the Unemployment Rate in Blue Ridge?
Unemployment Rate in Blue Ridge is 3.1%.