Blue Mound, TX Map & Demographics
Blue Mound Map
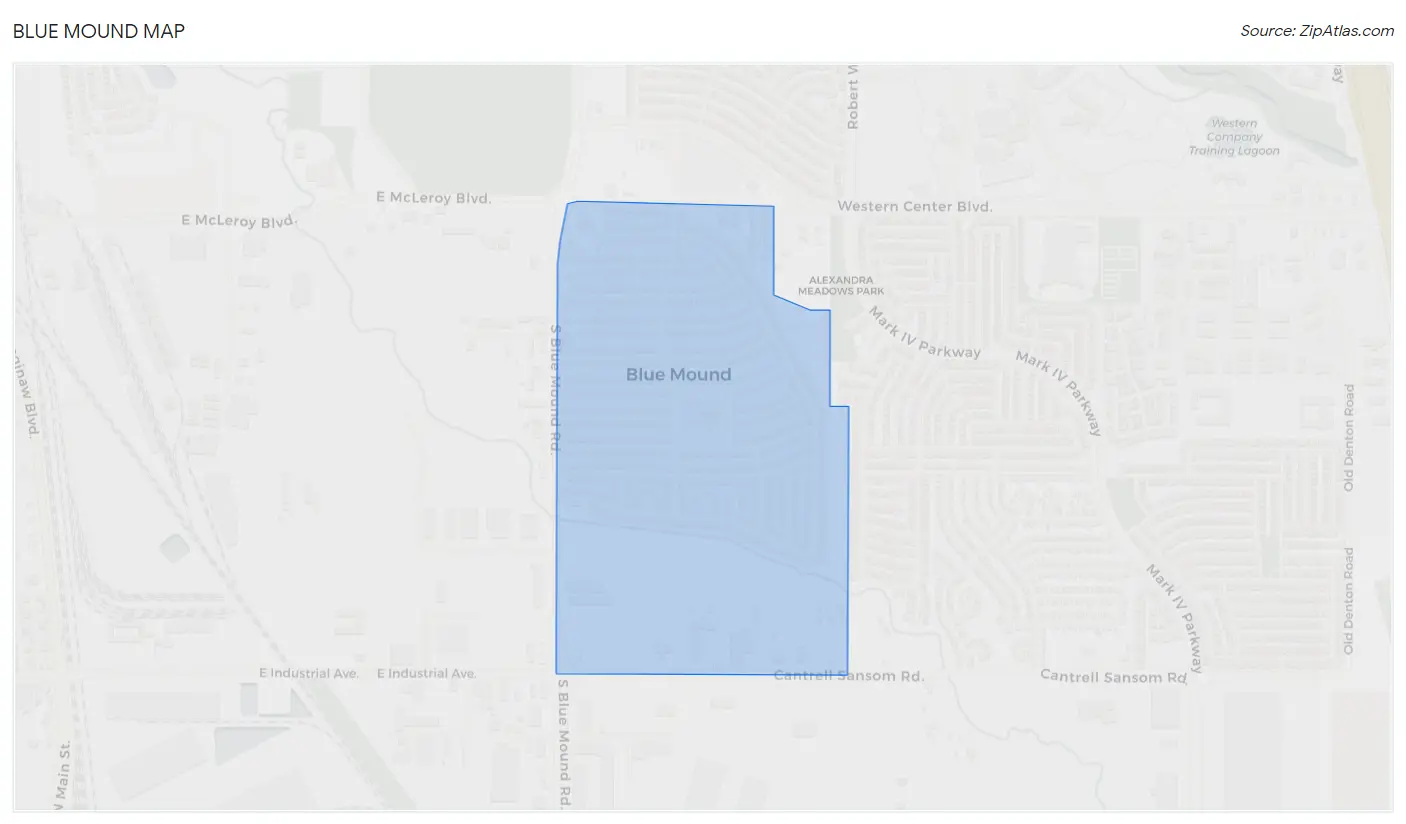
Blue Mound Overview
$29,221
PER CAPITA INCOME
$72,131
AVG FAMILY INCOME
$68,500
AVG HOUSEHOLD INCOME
37.0%
WAGE / INCOME GAP [ % ]
63.0¢/ $1
WAGE / INCOME GAP [ $ ]
$9,900
FAMILY INCOME DEFICIT
0.35
INEQUALITY / GINI INDEX
2,622
TOTAL POPULATION
1,408
MALE POPULATION
1,214
FEMALE POPULATION
115.98
MALES / 100 FEMALES
86.22
FEMALES / 100 MALES
37.6
MEDIAN AGE
3.4
AVG FAMILY SIZE
3.0
AVG HOUSEHOLD SIZE
1,337
LABOR FORCE [ PEOPLE ]
66.3%
PERCENT IN LABOR FORCE
4.0%
UNEMPLOYMENT RATE
Income in Blue Mound
Income Overview in Blue Mound
Per Capita Income in Blue Mound is $29,221, while median incomes of families and households are $72,131 and $68,500 respectively.
| Characteristic | Number | Measure |
| Per Capita Income | 2,622 | $29,221 |
| Median Family Income | 689 | $72,131 |
| Mean Family Income | 689 | $89,145 |
| Median Household Income | 880 | $68,500 |
| Mean Household Income | 880 | $83,117 |
| Income Deficit | 689 | $9,900 |
| Wage / Income Gap (%) | 2,622 | 37.01% |
| Wage / Income Gap ($) | 2,622 | 62.99¢ per $1 |
| Gini / Inequality Index | 2,622 | 0.35 |
Earnings by Sex in Blue Mound
Average Earnings in Blue Mound are $41,308, $48,583 for men and $30,603 for women, a difference of 37.0%.
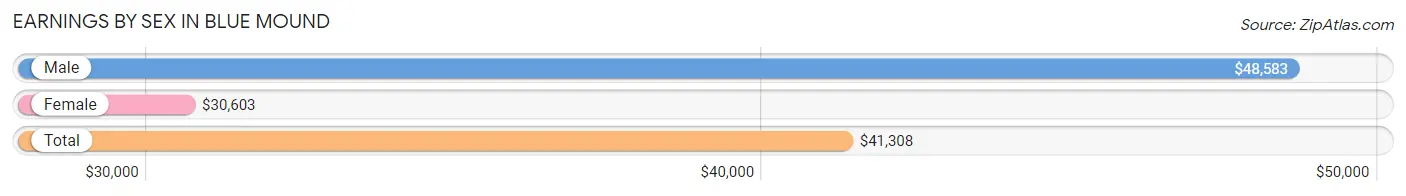
| Sex | Number | Average Earnings |
| Male | 819 (58.8%) | $48,583 |
| Female | 574 (41.2%) | $30,603 |
| Total | 1,393 (100.0%) | $41,308 |
Earnings by Sex by Income Bracket in Blue Mound
The most common earnings brackets in Blue Mound are $65,000 to $74,999 for men (135 | 16.5%) and $75,000 to $99,999 for women (64 | 11.2%).
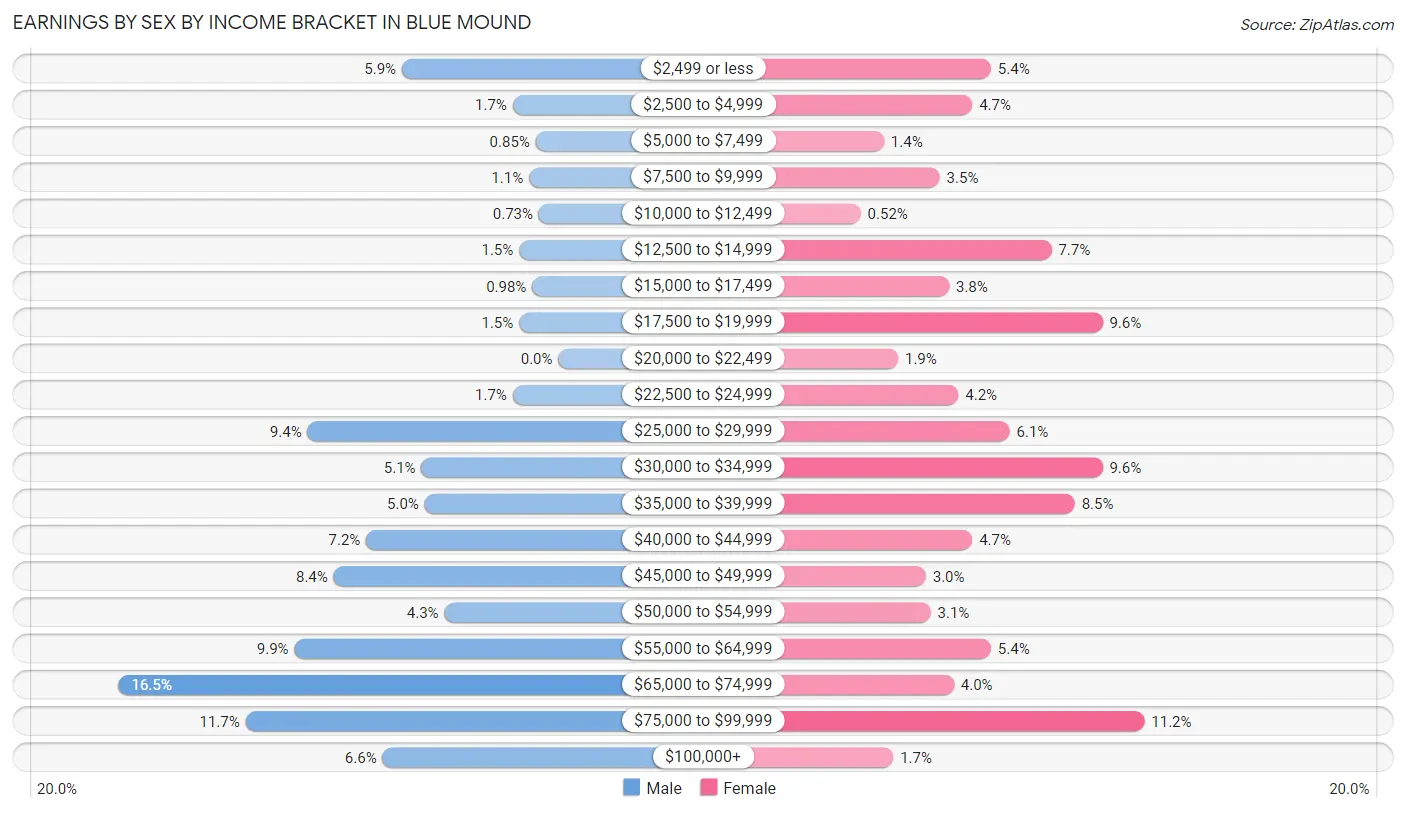
| Income | Male | Female |
| $2,499 or less | 48 (5.9%) | 31 (5.4%) |
| $2,500 to $4,999 | 14 (1.7%) | 27 (4.7%) |
| $5,000 to $7,499 | 7 (0.9%) | 8 (1.4%) |
| $7,500 to $9,999 | 9 (1.1%) | 20 (3.5%) |
| $10,000 to $12,499 | 6 (0.7%) | 3 (0.5%) |
| $12,500 to $14,999 | 12 (1.5%) | 44 (7.7%) |
| $15,000 to $17,499 | 8 (1.0%) | 22 (3.8%) |
| $17,500 to $19,999 | 12 (1.5%) | 55 (9.6%) |
| $20,000 to $22,499 | 0 (0.0%) | 11 (1.9%) |
| $22,500 to $24,999 | 14 (1.7%) | 24 (4.2%) |
| $25,000 to $29,999 | 77 (9.4%) | 35 (6.1%) |
| $30,000 to $34,999 | 42 (5.1%) | 55 (9.6%) |
| $35,000 to $39,999 | 41 (5.0%) | 49 (8.5%) |
| $40,000 to $44,999 | 59 (7.2%) | 27 (4.7%) |
| $45,000 to $49,999 | 69 (8.4%) | 17 (3.0%) |
| $50,000 to $54,999 | 35 (4.3%) | 18 (3.1%) |
| $55,000 to $64,999 | 81 (9.9%) | 31 (5.4%) |
| $65,000 to $74,999 | 135 (16.5%) | 23 (4.0%) |
| $75,000 to $99,999 | 96 (11.7%) | 64 (11.2%) |
| $100,000+ | 54 (6.6%) | 10 (1.7%) |
| Total | 819 (100.0%) | 574 (100.0%) |
Earnings by Sex by Educational Attainment in Blue Mound
Average earnings in Blue Mound are $54,524 for men and $32,596 for women, a difference of 40.2%. Men with an educational attainment of bachelor's degree enjoy the highest average annual earnings of $71,375, while those with high school diploma education earn the least with $42,935. Women with an educational attainment of graduate degree earn the most with the average annual earnings of $91,500, while those with less than high school education have the smallest earnings of $23,750.
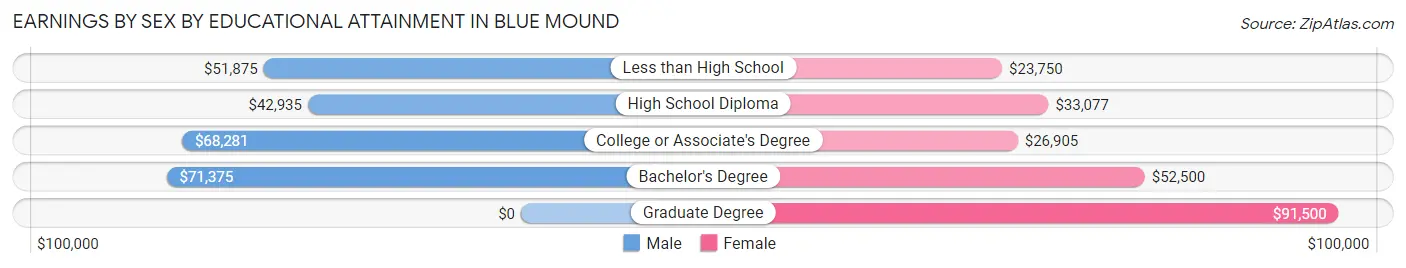
| Educational Attainment | Male Income | Female Income |
| Less than High School | $51,875 | $23,750 |
| High School Diploma | $42,935 | $33,077 |
| College or Associate's Degree | $68,281 | $26,905 |
| Bachelor's Degree | $71,375 | $52,500 |
| Graduate Degree | - | - |
| Total | $54,524 | $32,596 |
Family Income in Blue Mound
Family Income Brackets in Blue Mound
According to the Blue Mound family income data, there are 236 families falling into the $50,000 to $74,999 income range, which is the most common income bracket and makes up 34.3% of all families. Conversely, the less than $10,000 income bracket is the least frequent group with only 3 families (0.4%) belonging to this category.
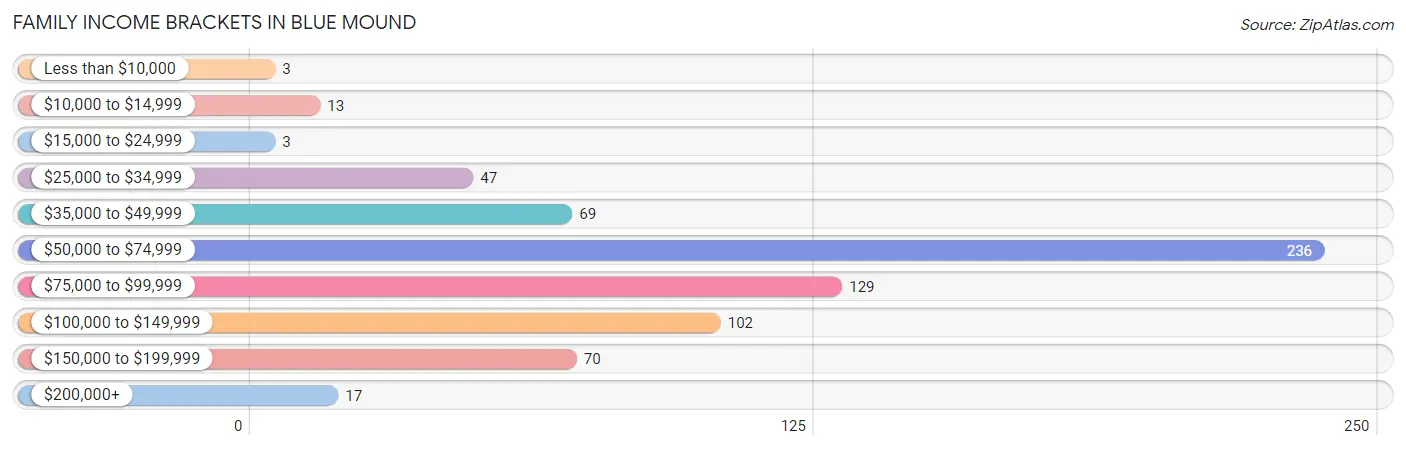
| Income Bracket | # Families | % Families |
| Less than $10,000 | 3 | 0.4% |
| $10,000 to $14,999 | 13 | 1.9% |
| $15,000 to $24,999 | 3 | 0.4% |
| $25,000 to $34,999 | 47 | 6.8% |
| $35,000 to $49,999 | 69 | 10.0% |
| $50,000 to $74,999 | 236 | 34.3% |
| $75,000 to $99,999 | 129 | 18.7% |
| $100,000 to $149,999 | 102 | 14.8% |
| $150,000 to $199,999 | 70 | 10.2% |
| $200,000+ | 17 | 2.5% |
Family Income by Famaliy Size in Blue Mound
5-person families (58 | 8.4%) account for the highest median family income in Blue Mound with $88,958 per family, while 2-person families (264 | 38.3%) have the highest median income of $35,521 per family member.
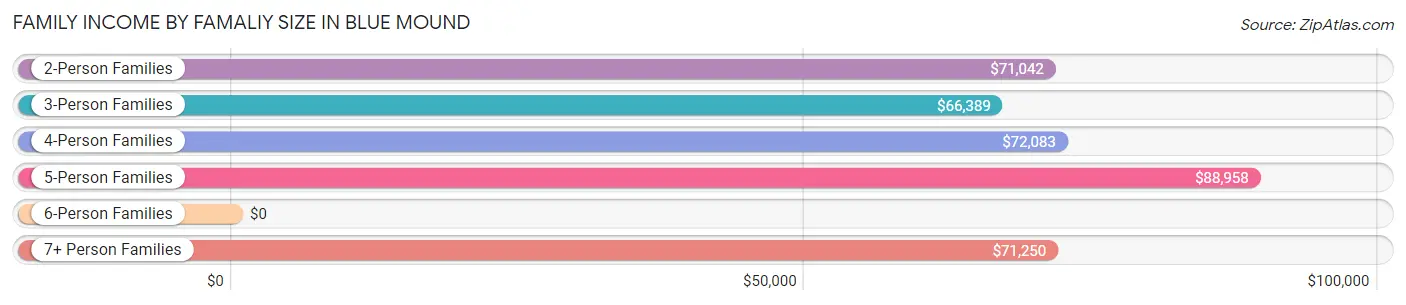
| Income Bracket | # Families | Median Income |
| 2-Person Families | 264 (38.3%) | $71,042 |
| 3-Person Families | 192 (27.9%) | $66,389 |
| 4-Person Families | 155 (22.5%) | $72,083 |
| 5-Person Families | 58 (8.4%) | $88,958 |
| 6-Person Families | 0 (0.0%) | $0 |
| 7+ Person Families | 20 (2.9%) | $71,250 |
| Total | 689 (100.0%) | $72,131 |
Family Income by Number of Earners in Blue Mound
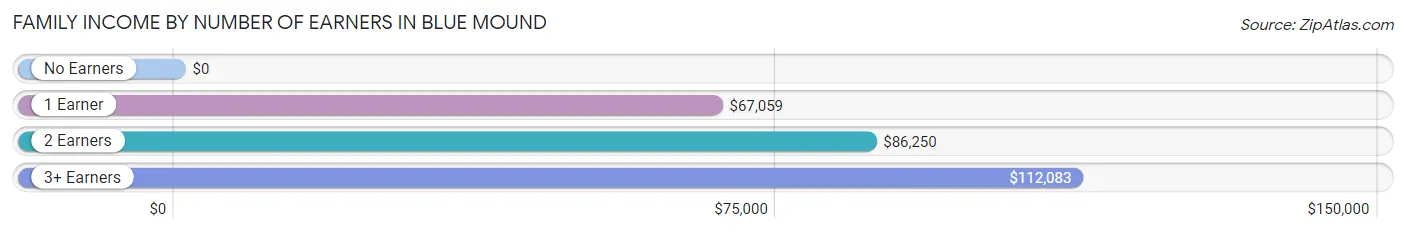
| Number of Earners | # Families | Median Income |
| No Earners | 66 (9.6%) | $0 |
| 1 Earner | 252 (36.6%) | $67,059 |
| 2 Earners | 268 (38.9%) | $86,250 |
| 3+ Earners | 103 (14.9%) | $112,083 |
| Total | 689 (100.0%) | $72,131 |
Household Income in Blue Mound
Household Income Brackets in Blue Mound
With 259 households falling in the category, the $50,000 to $74,999 income range is the most frequent in Blue Mound, accounting for 29.4% of all households. In contrast, only 20 households (2.3%) fall into the $10,000 to $14,999 income bracket, making it the least populous group.
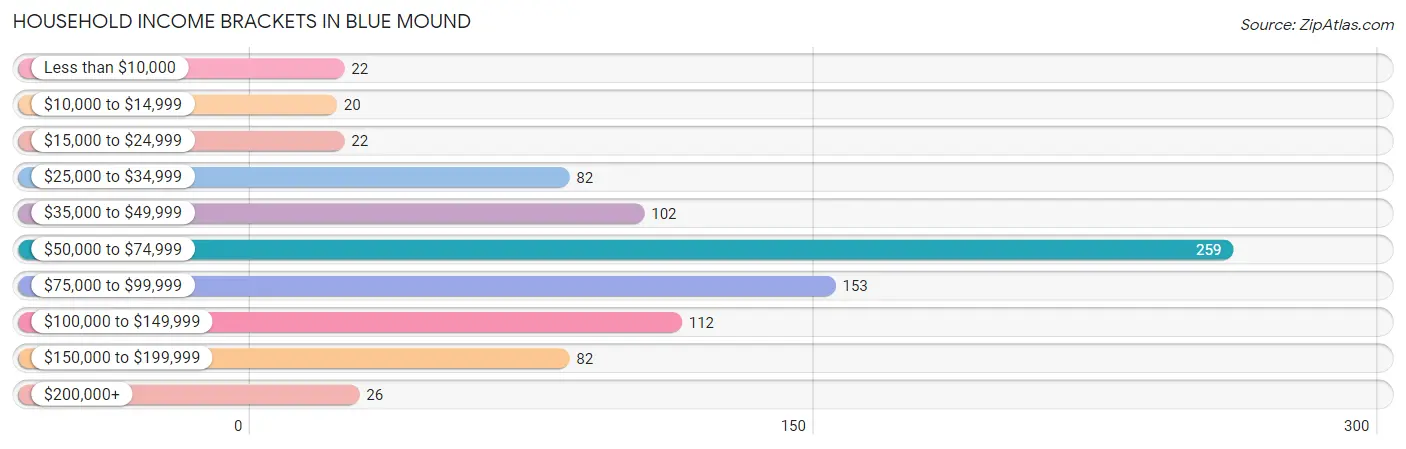
| Income Bracket | # Households | % Households |
| Less than $10,000 | 22 | 2.5% |
| $10,000 to $14,999 | 20 | 2.3% |
| $15,000 to $24,999 | 22 | 2.5% |
| $25,000 to $34,999 | 82 | 9.3% |
| $35,000 to $49,999 | 102 | 11.6% |
| $50,000 to $74,999 | 259 | 29.4% |
| $75,000 to $99,999 | 153 | 17.4% |
| $100,000 to $149,999 | 112 | 12.7% |
| $150,000 to $199,999 | 82 | 9.3% |
| $200,000+ | 26 | 3.0% |
Household Income by Householder Age in Blue Mound
The median household income in Blue Mound is $68,500, with the highest median household income of $78,750 found in the 45 to 64 years age bracket for the primary householder. A total of 424 households (48.2%) fall into this category. Meanwhile, the 15 to 24 years age bracket for the primary householder has the lowest median household income of $0, with 9 households (1.0%) in this group.
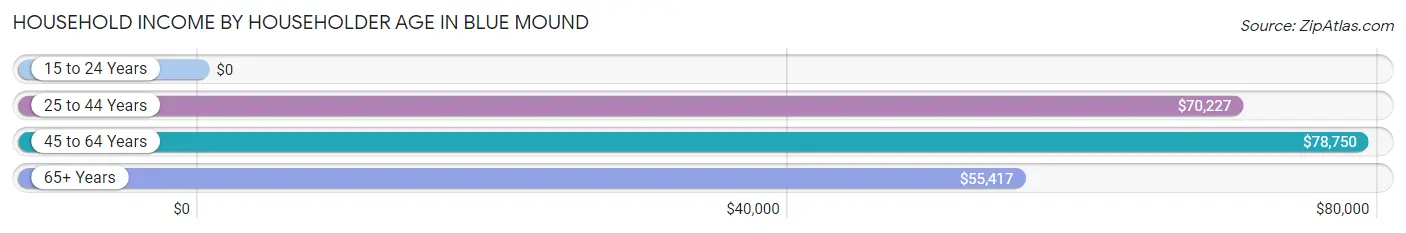
| Income Bracket | # Households | Median Income |
| 15 to 24 Years | 9 (1.0%) | $0 |
| 25 to 44 Years | 314 (35.7%) | $70,227 |
| 45 to 64 Years | 424 (48.2%) | $78,750 |
| 65+ Years | 133 (15.1%) | $55,417 |
| Total | 880 (100.0%) | $68,500 |
Poverty in Blue Mound
Income Below Poverty by Sex and Age in Blue Mound
With 2.6% poverty level for males and 5.5% for females among the residents of Blue Mound, 75 year old and over males and 16 and 17 year old females are the most vulnerable to poverty, with 2 males (20.0%) and 5 females (23.8%) in their respective age groups living below the poverty level.
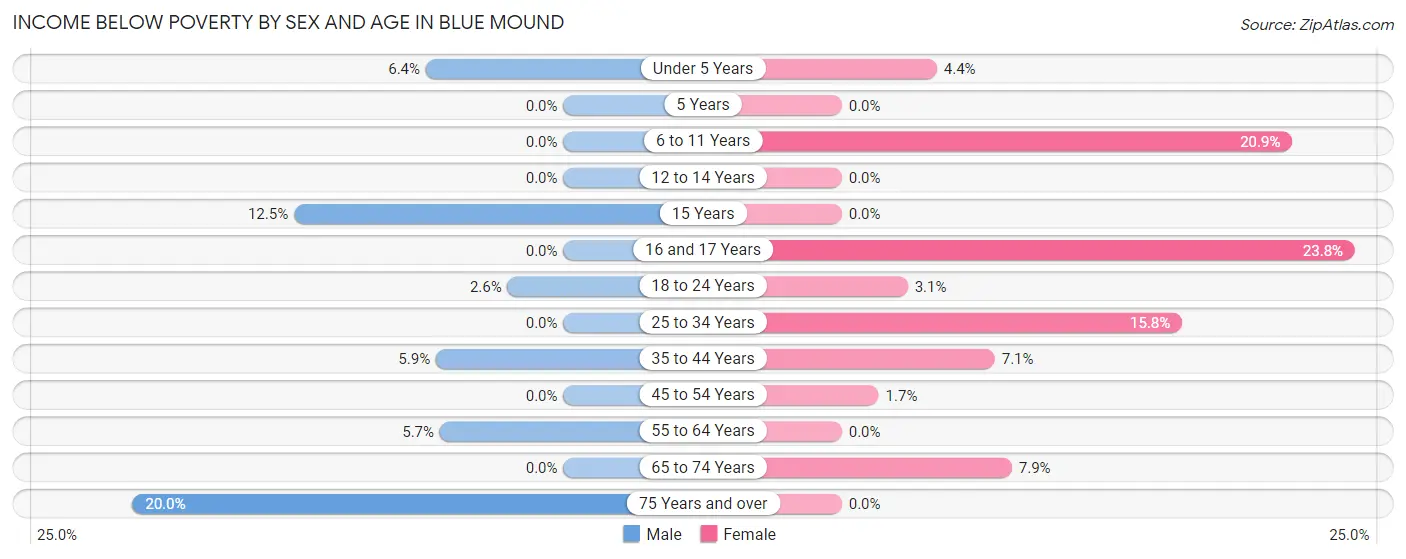
| Age Bracket | Male | Female |
| Under 5 Years | 3 (6.4%) | 3 (4.4%) |
| 5 Years | 0 (0.0%) | 0 (0.0%) |
| 6 to 11 Years | 0 (0.0%) | 14 (20.9%) |
| 12 to 14 Years | 0 (0.0%) | 0 (0.0%) |
| 15 Years | 3 (12.5%) | 0 (0.0%) |
| 16 and 17 Years | 0 (0.0%) | 5 (23.8%) |
| 18 to 24 Years | 3 (2.6%) | 3 (3.1%) |
| 25 to 34 Years | 0 (0.0%) | 21 (15.8%) |
| 35 to 44 Years | 12 (5.9%) | 12 (7.1%) |
| 45 to 54 Years | 0 (0.0%) | 3 (1.7%) |
| 55 to 64 Years | 13 (5.7%) | 0 (0.0%) |
| 65 to 74 Years | 0 (0.0%) | 6 (7.9%) |
| 75 Years and over | 2 (20.0%) | 0 (0.0%) |
| Total | 36 (2.6%) | 67 (5.5%) |
Income Above Poverty by Sex and Age in Blue Mound
According to the poverty statistics in Blue Mound, males aged 5 years and females aged 5 years are the age groups that are most secure financially, with 100.0% of males and 100.0% of females in these age groups living above the poverty line.
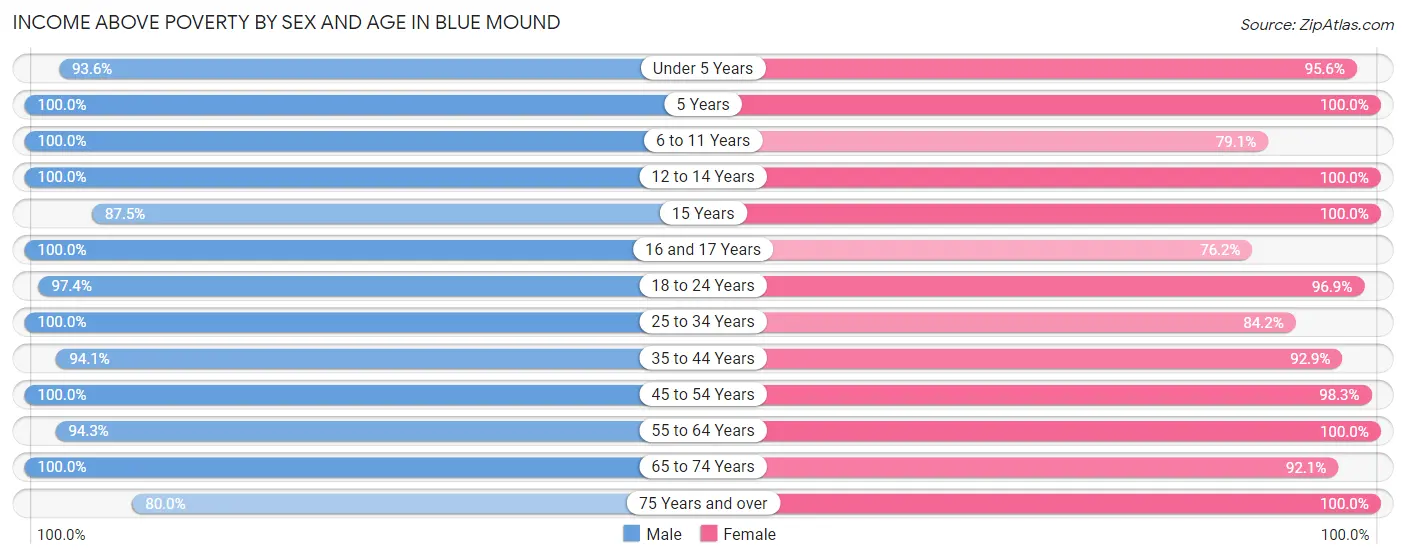
| Age Bracket | Male | Female |
| Under 5 Years | 44 (93.6%) | 65 (95.6%) |
| 5 Years | 27 (100.0%) | 4 (100.0%) |
| 6 to 11 Years | 168 (100.0%) | 53 (79.1%) |
| 12 to 14 Years | 76 (100.0%) | 86 (100.0%) |
| 15 Years | 21 (87.5%) | 35 (100.0%) |
| 16 and 17 Years | 75 (100.0%) | 16 (76.2%) |
| 18 to 24 Years | 113 (97.4%) | 95 (96.9%) |
| 25 to 34 Years | 158 (100.0%) | 112 (84.2%) |
| 35 to 44 Years | 191 (94.1%) | 157 (92.9%) |
| 45 to 54 Years | 199 (100.0%) | 172 (98.3%) |
| 55 to 64 Years | 214 (94.3%) | 228 (100.0%) |
| 65 to 74 Years | 75 (100.0%) | 70 (92.1%) |
| 75 Years and over | 8 (80.0%) | 54 (100.0%) |
| Total | 1,369 (97.4%) | 1,147 (94.5%) |
Income Below Poverty Among Married-Couple Families in Blue Mound
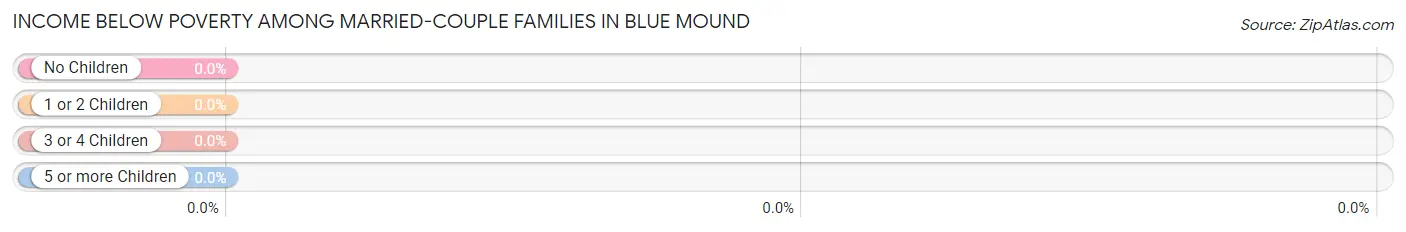
| Children | Above Poverty | Below Poverty |
| No Children | 304 (100.0%) | 0 (0.0%) |
| 1 or 2 Children | 222 (100.0%) | 0 (0.0%) |
| 3 or 4 Children | 26 (100.0%) | 0 (0.0%) |
| 5 or more Children | 14 (100.0%) | 0 (0.0%) |
| Total | 566 (100.0%) | 0 (0.0%) |
Income Below Poverty Among Single-Parent Households in Blue Mound
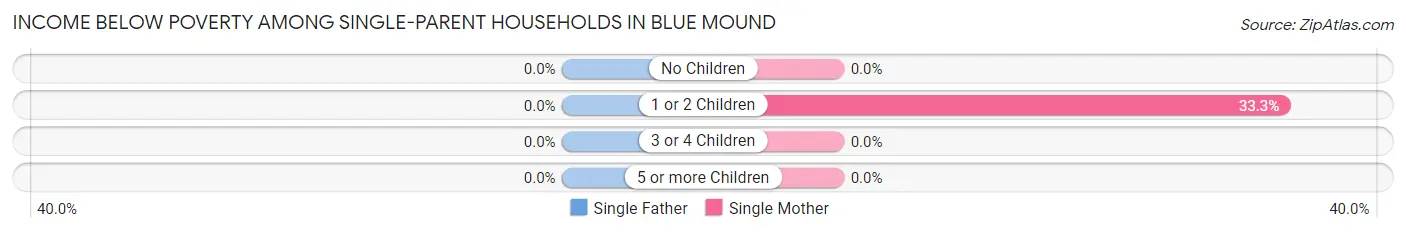
| Children | Single Father | Single Mother |
| No Children | 0 (0.0%) | 0 (0.0%) |
| 1 or 2 Children | 0 (0.0%) | 16 (33.3%) |
| 3 or 4 Children | 0 (0.0%) | 0 (0.0%) |
| 5 or more Children | 0 (0.0%) | 0 (0.0%) |
| Total | 0 (0.0%) | 16 (20.8%) |
Income Below Poverty Among Married-Couple vs Single-Parent Households in Blue Mound
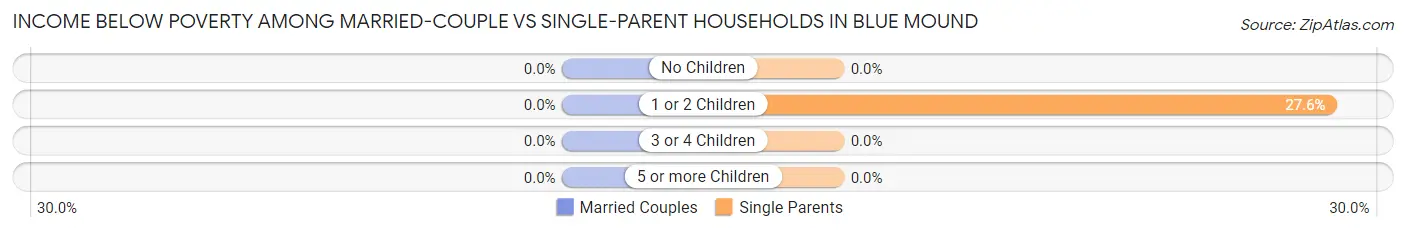
| Children | Married-Couple Families | Single-Parent Households |
| No Children | 0 (0.0%) | 0 (0.0%) |
| 1 or 2 Children | 0 (0.0%) | 16 (27.6%) |
| 3 or 4 Children | 0 (0.0%) | 0 (0.0%) |
| 5 or more Children | 0 (0.0%) | 0 (0.0%) |
| Total | 0 (0.0%) | 16 (13.0%) |
Race in Blue Mound
The most populous races in Blue Mound are White / Caucasian (1,610 | 61.4%), Hispanic or Latino (1,408 | 53.7%), and Some other Race (598 | 22.8%).
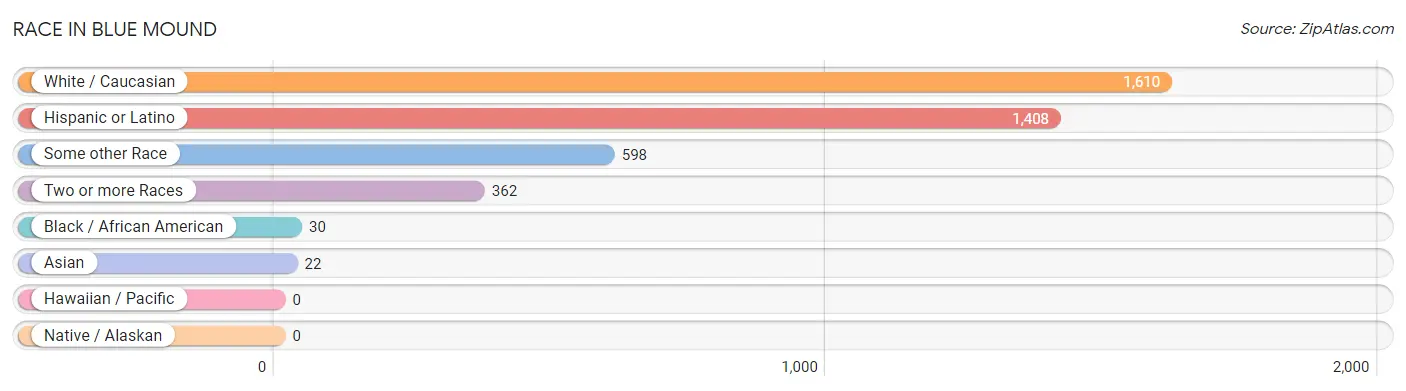
| Race | # Population | % Population |
| Asian | 22 | 0.8% |
| Black / African American | 30 | 1.1% |
| Hawaiian / Pacific | 0 | 0.0% |
| Hispanic or Latino | 1,408 | 53.7% |
| Native / Alaskan | 0 | 0.0% |
| White / Caucasian | 1,610 | 61.4% |
| Two or more Races | 362 | 13.8% |
| Some other Race | 598 | 22.8% |
| Total | 2,622 | 100.0% |
Ancestry in Blue Mound
The most populous ancestries reported in Blue Mound are Mexican (1,307 | 49.8%), American (99 | 3.8%), Irish (96 | 3.7%), German (94 | 3.6%), and English (78 | 3.0%), together accounting for 63.8% of all Blue Mound residents.
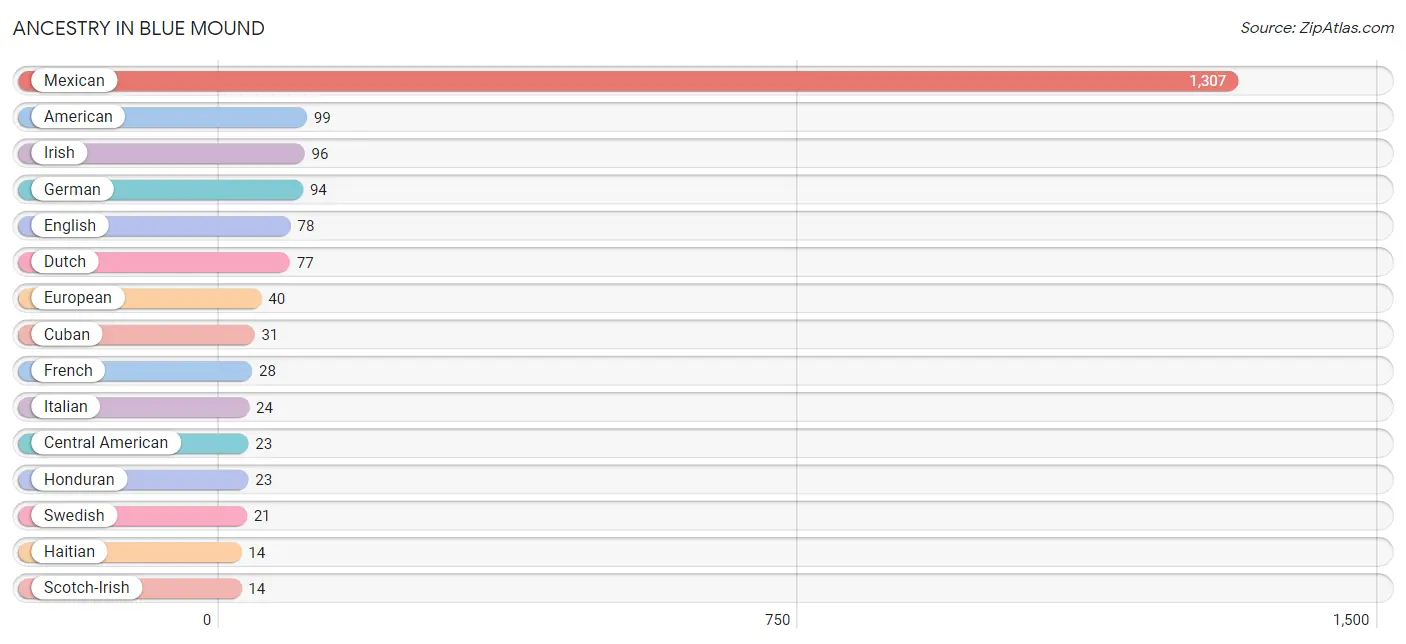
| Ancestry | # Population | % Population |
| African | 3 | 0.1% |
| American | 99 | 3.8% |
| Arab | 5 | 0.2% |
| Burmese | 1 | 0.0% |
| Canadian | 2 | 0.1% |
| Central American | 23 | 0.9% |
| Cuban | 31 | 1.2% |
| Dutch | 77 | 2.9% |
| Egyptian | 5 | 0.2% |
| English | 78 | 3.0% |
| European | 40 | 1.5% |
| French | 28 | 1.1% |
| German | 94 | 3.6% |
| Greek | 4 | 0.2% |
| Haitian | 14 | 0.5% |
| Honduran | 23 | 0.9% |
| Irish | 96 | 3.7% |
| Italian | 24 | 0.9% |
| Mexican | 1,307 | 49.8% |
| Pakistani | 12 | 0.5% |
| Polish | 11 | 0.4% |
| Puerto Rican | 13 | 0.5% |
| Scotch-Irish | 14 | 0.5% |
| Scottish | 10 | 0.4% |
| Spaniard | 4 | 0.2% |
| Sri Lankan | 10 | 0.4% |
| Subsaharan African | 3 | 0.1% |
| Swedish | 21 | 0.8% |
| Welsh | 2 | 0.1% | View All 29 Rows |
Immigrants in Blue Mound
The most numerous immigrant groups reported in Blue Mound came from Central America (481 | 18.3%), Latin America (481 | 18.3%), Mexico (447 | 17.1%), Honduras (34 | 1.3%), and Asia (10 | 0.4%), together accounting for 55.4% of all Blue Mound residents.
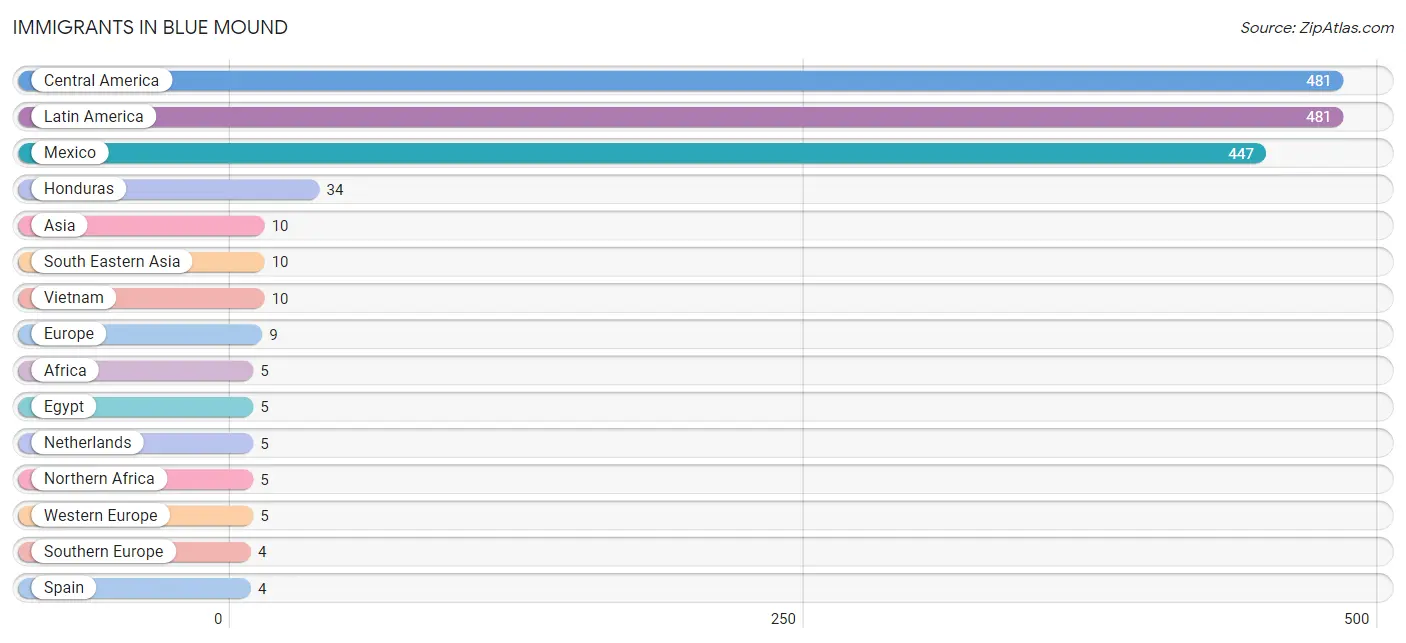
| Immigration Origin | # Population | % Population |
| Africa | 5 | 0.2% |
| Asia | 10 | 0.4% |
| Canada | 2 | 0.1% |
| Central America | 481 | 18.3% |
| Egypt | 5 | 0.2% |
| Europe | 9 | 0.3% |
| Honduras | 34 | 1.3% |
| Latin America | 481 | 18.3% |
| Mexico | 447 | 17.1% |
| Netherlands | 5 | 0.2% |
| Northern Africa | 5 | 0.2% |
| South Eastern Asia | 10 | 0.4% |
| Southern Europe | 4 | 0.2% |
| Spain | 4 | 0.2% |
| Vietnam | 10 | 0.4% |
| Western Europe | 5 | 0.2% | View All 16 Rows |
Sex and Age in Blue Mound
Sex and Age in Blue Mound
The most populous age groups in Blue Mound are 10 to 14 Years (145 | 10.3%) for men and 55 to 59 Years (151 | 12.4%) for women.
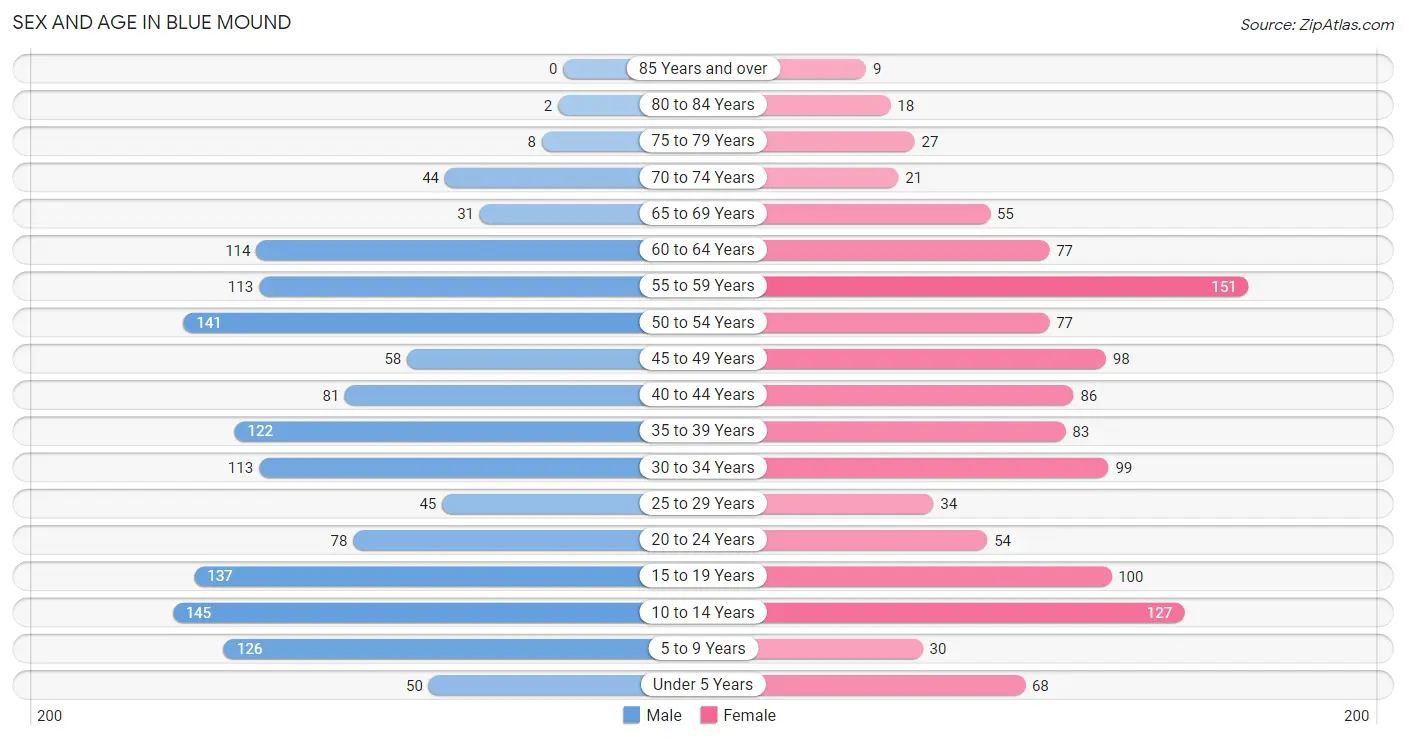
| Age Bracket | Male | Female |
| Under 5 Years | 50 (3.5%) | 68 (5.6%) |
| 5 to 9 Years | 126 (8.9%) | 30 (2.5%) |
| 10 to 14 Years | 145 (10.3%) | 127 (10.5%) |
| 15 to 19 Years | 137 (9.7%) | 100 (8.2%) |
| 20 to 24 Years | 78 (5.5%) | 54 (4.4%) |
| 25 to 29 Years | 45 (3.2%) | 34 (2.8%) |
| 30 to 34 Years | 113 (8.0%) | 99 (8.2%) |
| 35 to 39 Years | 122 (8.7%) | 83 (6.8%) |
| 40 to 44 Years | 81 (5.8%) | 86 (7.1%) |
| 45 to 49 Years | 58 (4.1%) | 98 (8.1%) |
| 50 to 54 Years | 141 (10.0%) | 77 (6.3%) |
| 55 to 59 Years | 113 (8.0%) | 151 (12.4%) |
| 60 to 64 Years | 114 (8.1%) | 77 (6.3%) |
| 65 to 69 Years | 31 (2.2%) | 55 (4.5%) |
| 70 to 74 Years | 44 (3.1%) | 21 (1.7%) |
| 75 to 79 Years | 8 (0.6%) | 27 (2.2%) |
| 80 to 84 Years | 2 (0.1%) | 18 (1.5%) |
| 85 Years and over | 0 (0.0%) | 9 (0.7%) |
| Total | 1,408 (100.0%) | 1,214 (100.0%) |
Families and Households in Blue Mound
Median Family Size in Blue Mound
The median family size in Blue Mound is 3.36 persons per family, with married-couple families (566 | 82.2%) accounting for the largest median family size of 3.4 persons per family. On the other hand, single male/father families (46 | 6.7%) represent the smallest median family size with 3.13 persons per family.
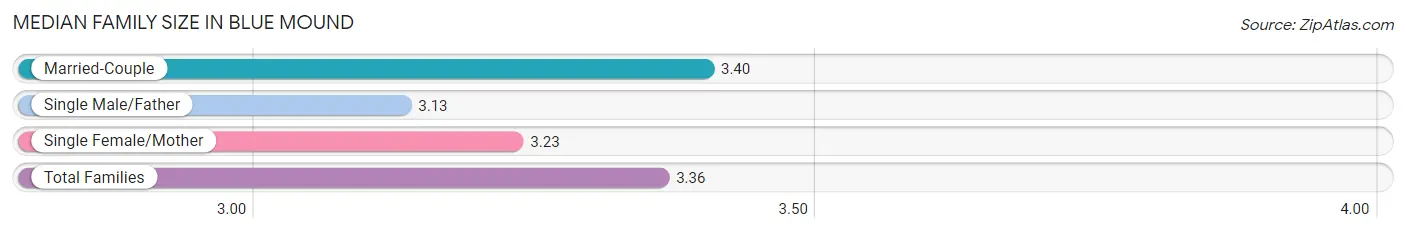
| Family Type | # Families | Family Size |
| Married-Couple | 566 (82.2%) | 3.40 |
| Single Male/Father | 46 (6.7%) | 3.13 |
| Single Female/Mother | 77 (11.2%) | 3.23 |
| Total Families | 689 (100.0%) | 3.36 |
Median Household Size in Blue Mound
The median household size in Blue Mound is 2.98 persons per household, with married-couple households (566 | 64.3%) accounting for the largest median household size of 3.47 persons per household. non-family households (191 | 21.7%) represent the smallest median household size with 1.26 persons per household.
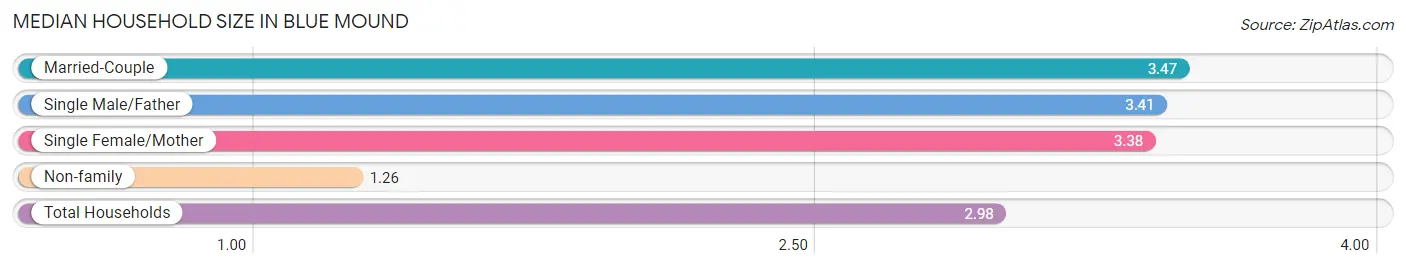
| Household Type | # Households | Household Size |
| Married-Couple | 566 (64.3%) | 3.47 |
| Single Male/Father | 46 (5.2%) | 3.41 |
| Single Female/Mother | 77 (8.7%) | 3.38 |
| Non-family | 191 (21.7%) | 1.26 |
| Total Households | 880 (100.0%) | 2.98 |
Household Size by Marriage Status in Blue Mound
Out of a total of 880 households in Blue Mound, 689 (78.3%) are family households, while 191 (21.7%) are nonfamily households. The most numerous type of family households are 2-person households, comprising 254, and the most common type of nonfamily households are 1-person households, comprising 158.
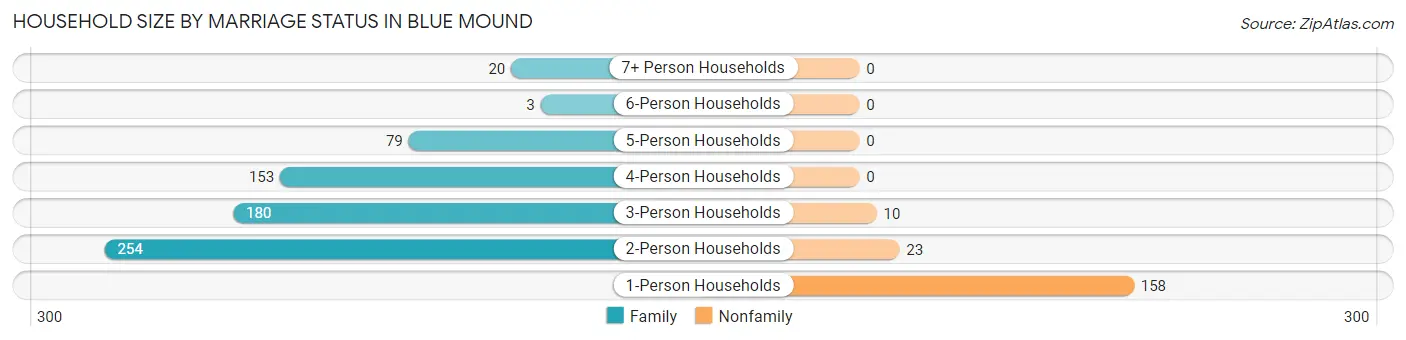
| Household Size | Family Households | Nonfamily Households |
| 1-Person Households | - | 158 (17.9%) |
| 2-Person Households | 254 (28.9%) | 23 (2.6%) |
| 3-Person Households | 180 (20.4%) | 10 (1.1%) |
| 4-Person Households | 153 (17.4%) | 0 (0.0%) |
| 5-Person Households | 79 (9.0%) | 0 (0.0%) |
| 6-Person Households | 3 (0.3%) | 0 (0.0%) |
| 7+ Person Households | 20 (2.3%) | 0 (0.0%) |
| Total | 689 (78.3%) | 191 (21.7%) |
Female Fertility in Blue Mound
Fertility by Age in Blue Mound
Average fertility rate in Blue Mound is 36.0 births per 1,000 women. Women in the age bracket of 20 to 34 years have the highest fertility rate with 86.0 births per 1,000 women. Women in the age bracket of 20 to 34 years acount for 76.2% of all women with births.
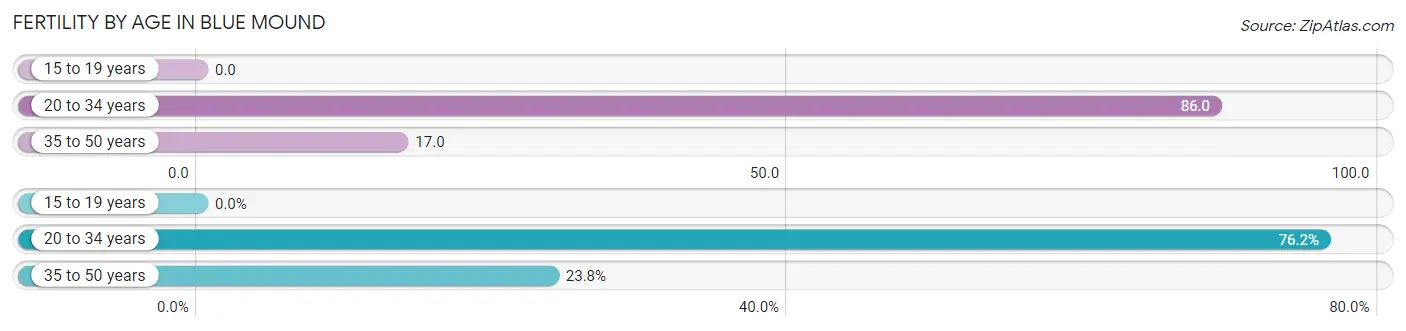
| Age Bracket | Women with Births | Births / 1,000 Women |
| 15 to 19 years | 0 (0.0%) | 0.0 |
| 20 to 34 years | 16 (76.2%) | 86.0 |
| 35 to 50 years | 5 (23.8%) | 17.0 |
| Total | 21 (100.0%) | 36.0 |
Fertility by Age by Marriage Status in Blue Mound
52.4% of women with births (21) in Blue Mound are married. The highest percentage of unmarried women with births falls into 20 to 34 years age bracket with 62.5% of them unmarried at the time of birth, while the lowest percentage of unmarried women with births belong to 35 to 50 years age bracket with 0.0% of them unmarried.
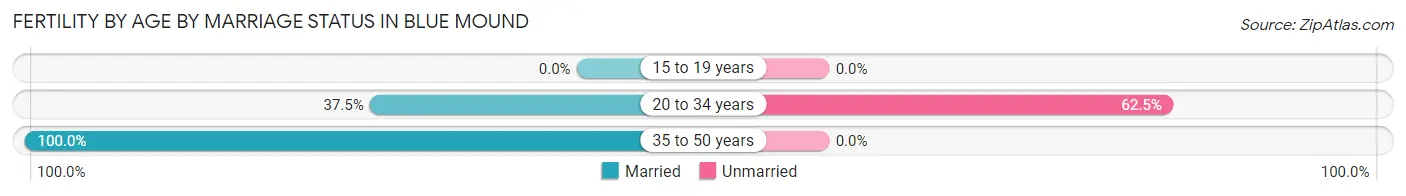
| Age Bracket | Married | Unmarried |
| 15 to 19 years | 0 (0.0%) | 0 (0.0%) |
| 20 to 34 years | 6 (37.5%) | 10 (62.5%) |
| 35 to 50 years | 5 (100.0%) | 0 (0.0%) |
| Total | 11 (52.4%) | 10 (47.6%) |
Fertility by Education in Blue Mound
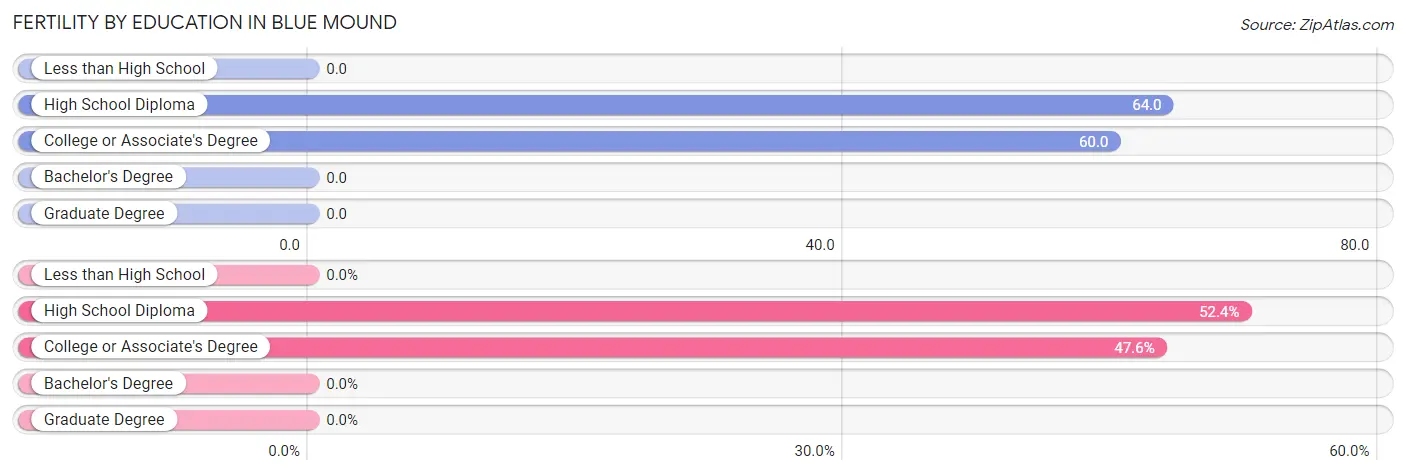
| Educational Attainment | Women with Births | Births / 1,000 Women |
| Less than High School | 0 (0.0%) | 0.0 |
| High School Diploma | 11 (52.4%) | 64.0 |
| College or Associate's Degree | 10 (47.6%) | 60.0 |
| Bachelor's Degree | 0 (0.0%) | 0.0 |
| Graduate Degree | 0 (0.0%) | 0.0 |
| Total | 21 (100.0%) | 36.0 |
Fertility by Education by Marriage Status in Blue Mound
47.6% of women with births in Blue Mound are unmarried. Women with the educational attainment of high school diploma are most likely to be married with 72.7% of them married at childbirth, while women with the educational attainment of college or associate's degree are least likely to be married with 70.0% of them unmarried at childbirth.
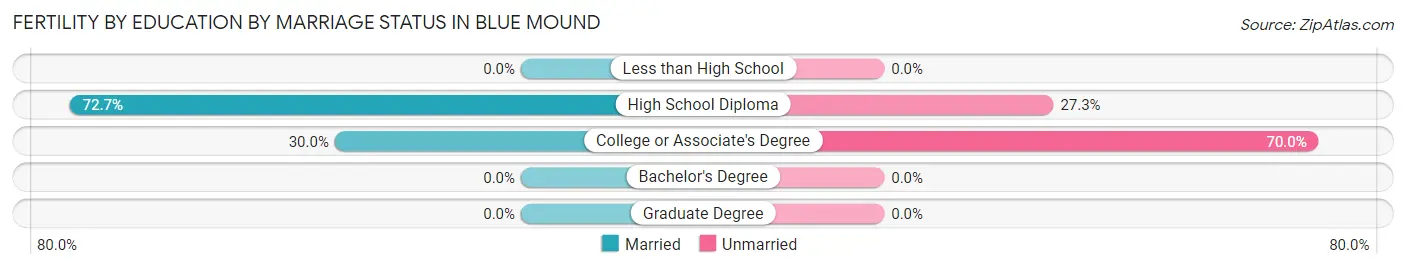
| Educational Attainment | Married | Unmarried |
| Less than High School | 0 (0.0%) | 0 (0.0%) |
| High School Diploma | 8 (72.7%) | 3 (27.3%) |
| College or Associate's Degree | 3 (30.0%) | 7 (70.0%) |
| Bachelor's Degree | 0 (0.0%) | 0 (0.0%) |
| Graduate Degree | 0 (0.0%) | 0 (0.0%) |
| Total | 11 (52.4%) | 10 (47.6%) |
Employment Characteristics in Blue Mound
Employment by Class of Employer in Blue Mound
Among the 1,284 employed individuals in Blue Mound, private company employees (916 | 71.3%), self-employed (not incorporated) (147 | 11.5%), and local government employees (84 | 6.5%) make up the most common classes of employment.
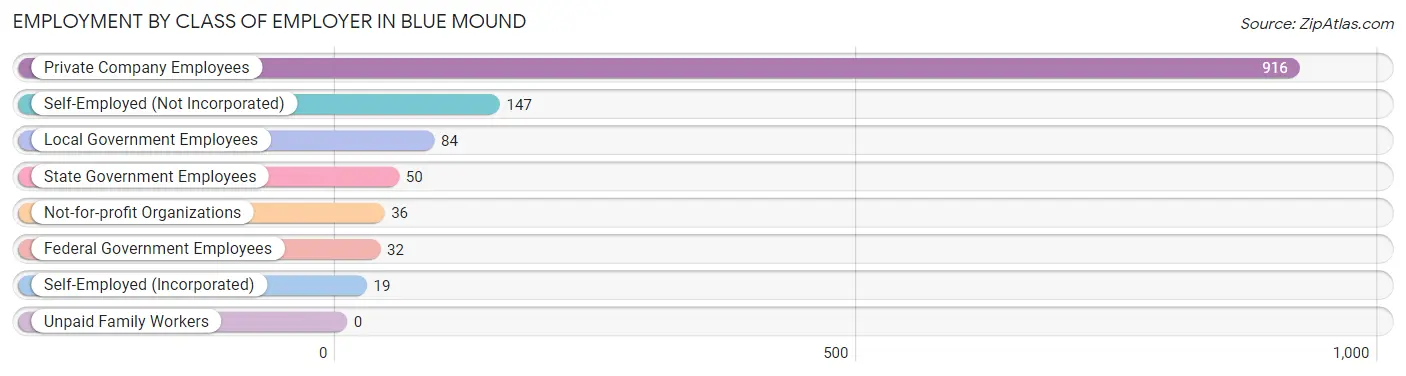
| Employer Class | # Employees | % Employees |
| Private Company Employees | 916 | 71.3% |
| Self-Employed (Incorporated) | 19 | 1.5% |
| Self-Employed (Not Incorporated) | 147 | 11.5% |
| Not-for-profit Organizations | 36 | 2.8% |
| Local Government Employees | 84 | 6.5% |
| State Government Employees | 50 | 3.9% |
| Federal Government Employees | 32 | 2.5% |
| Unpaid Family Workers | 0 | 0.0% |
| Total | 1,284 | 100.0% |
Employment Status by Age in Blue Mound
According to the labor force statistics for Blue Mound, out of the total population over 16 years of age (2,017), 66.3% or 1,337 individuals are in the labor force, with 4.0% or 53 of them unemployed. The age group with the highest labor force participation rate is 45 to 54 years, with 86.9% or 325 individuals in the labor force. Within the labor force, the 30 to 34 years age range has the highest percentage of unemployed individuals, with 16.9% or 31 of them being unemployed.
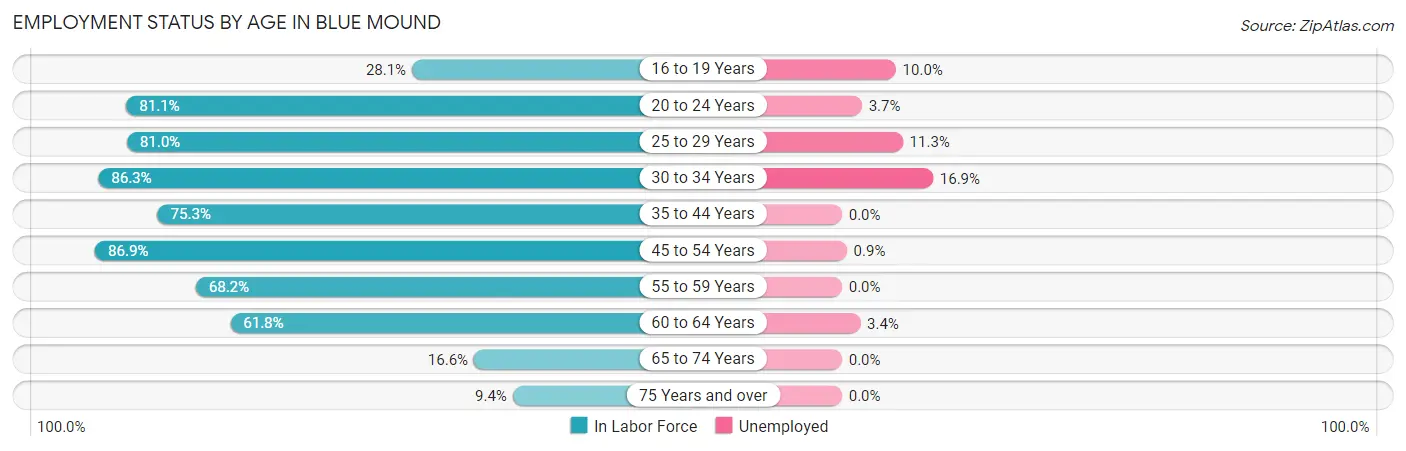
| Age Bracket | In Labor Force | Unemployed |
| 16 to 19 Years | 50 (28.1%) | 5 (10.0%) |
| 20 to 24 Years | 107 (81.1%) | 4 (3.7%) |
| 25 to 29 Years | 64 (81.0%) | 7 (11.3%) |
| 30 to 34 Years | 183 (86.3%) | 31 (16.9%) |
| 35 to 44 Years | 280 (75.3%) | 0 (0.0%) |
| 45 to 54 Years | 325 (86.9%) | 3 (0.9%) |
| 55 to 59 Years | 180 (68.2%) | 0 (0.0%) |
| 60 to 64 Years | 118 (61.8%) | 4 (3.4%) |
| 65 to 74 Years | 25 (16.6%) | 0 (0.0%) |
| 75 Years and over | 6 (9.4%) | 0 (0.0%) |
| Total | 1,337 (66.3%) | 53 (4.0%) |
Employment Status by Educational Attainment in Blue Mound
According to labor force statistics for Blue Mound, 77.1% of individuals (1,150) out of the total population between 25 and 64 years of age (1,492) are in the labor force, with 3.9% or 45 of them being unemployed. The group with the highest labor force participation rate are those with the educational attainment of bachelor's degree or higher, with 90.0% or 117 individuals in the labor force. Within the labor force, individuals with high school diploma education have the highest percentage of unemployment, with 8.5% or 35 of them being unemployed.
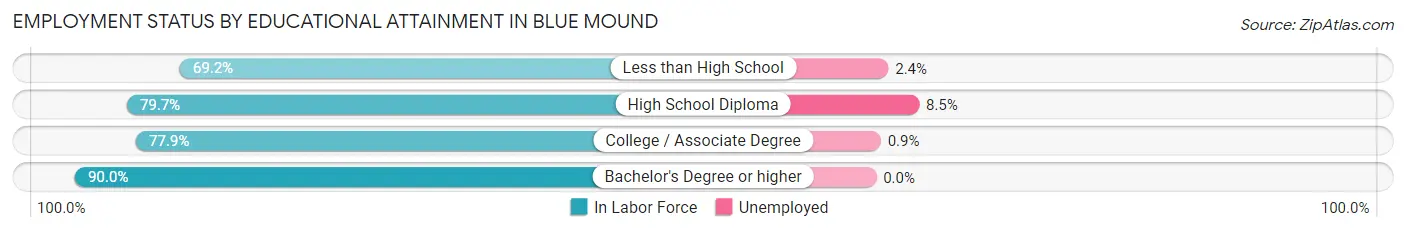
| Educational Attainment | In Labor Force | Unemployed |
| Less than High School | 296 (69.2%) | 10 (2.4%) |
| High School Diploma | 412 (79.7%) | 44 (8.5%) |
| College / Associate Degree | 325 (77.9%) | 4 (0.9%) |
| Bachelor's Degree or higher | 117 (90.0%) | 0 (0.0%) |
| Total | 1,150 (77.1%) | 58 (3.9%) |
Employment Occupations by Sex in Blue Mound
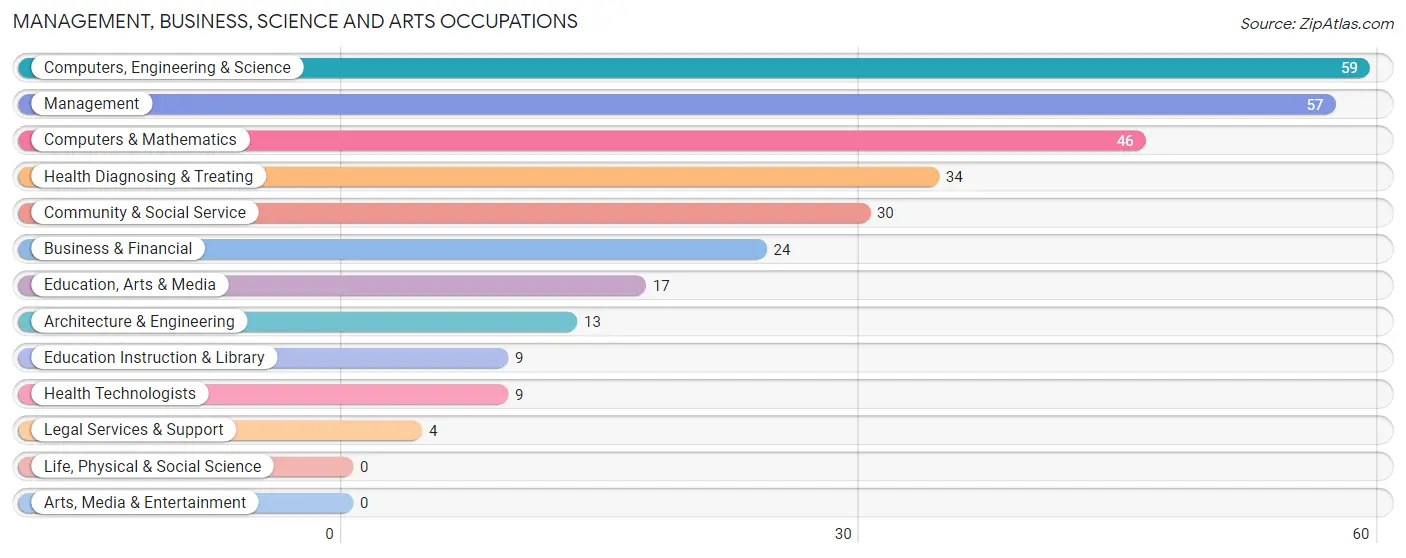
Management, Business, Science and Arts Occupations
The most common Management, Business, Science and Arts occupations in Blue Mound are Computers, Engineering & Science (59 | 4.6%), Management (57 | 4.4%), Computers & Mathematics (46 | 3.6%), Health Diagnosing & Treating (34 | 2.6%), and Community & Social Service (30 | 2.3%).
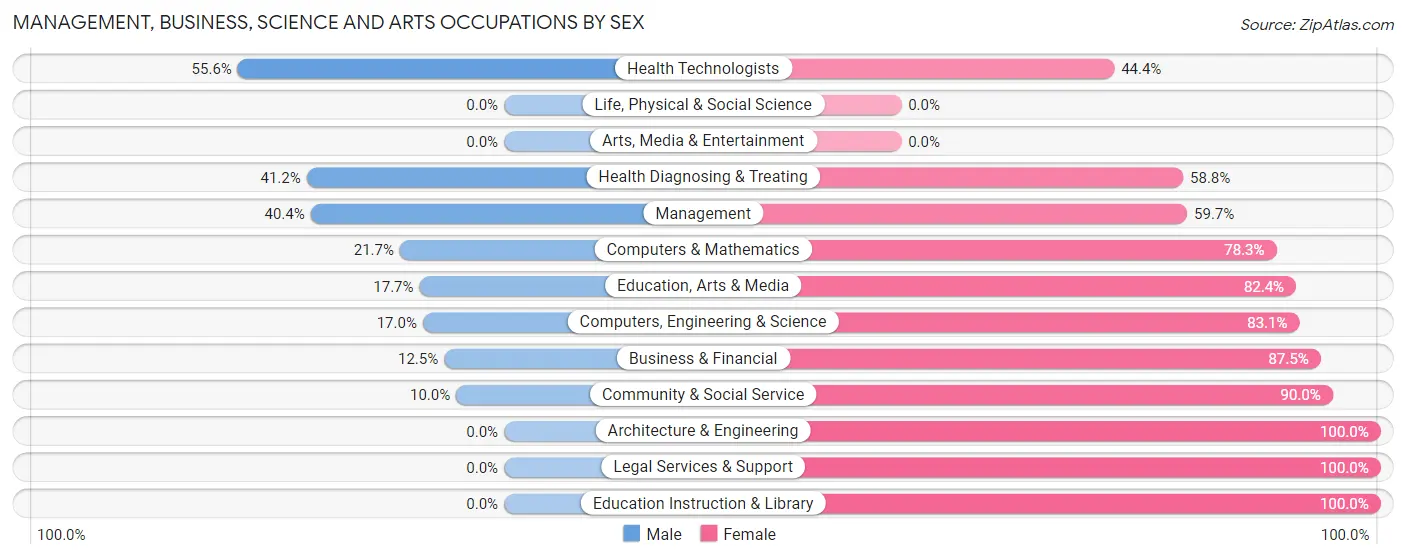
Management, Business, Science and Arts Occupations by Sex
Within the Management, Business, Science and Arts occupations in Blue Mound, the most male-oriented occupations are Health Technologists (55.6%), Health Diagnosing & Treating (41.2%), and Management (40.4%), while the most female-oriented occupations are Architecture & Engineering (100.0%), Legal Services & Support (100.0%), and Education Instruction & Library (100.0%).
| Occupation | Male | Female |
| Management | 23 (40.4%) | 34 (59.7%) |
| Business & Financial | 3 (12.5%) | 21 (87.5%) |
| Computers, Engineering & Science | 10 (17.0%) | 49 (83.1%) |
| Computers & Mathematics | 10 (21.7%) | 36 (78.3%) |
| Architecture & Engineering | 0 (0.0%) | 13 (100.0%) |
| Life, Physical & Social Science | 0 (0.0%) | 0 (0.0%) |
| Community & Social Service | 3 (10.0%) | 27 (90.0%) |
| Education, Arts & Media | 3 (17.6%) | 14 (82.4%) |
| Legal Services & Support | 0 (0.0%) | 4 (100.0%) |
| Education Instruction & Library | 0 (0.0%) | 9 (100.0%) |
| Arts, Media & Entertainment | 0 (0.0%) | 0 (0.0%) |
| Health Diagnosing & Treating | 14 (41.2%) | 20 (58.8%) |
| Health Technologists | 5 (55.6%) | 4 (44.4%) |
| Total (Category) | 53 (26.0%) | 151 (74.0%) |
| Total (Overall) | 772 (60.2%) | 510 (39.8%) |
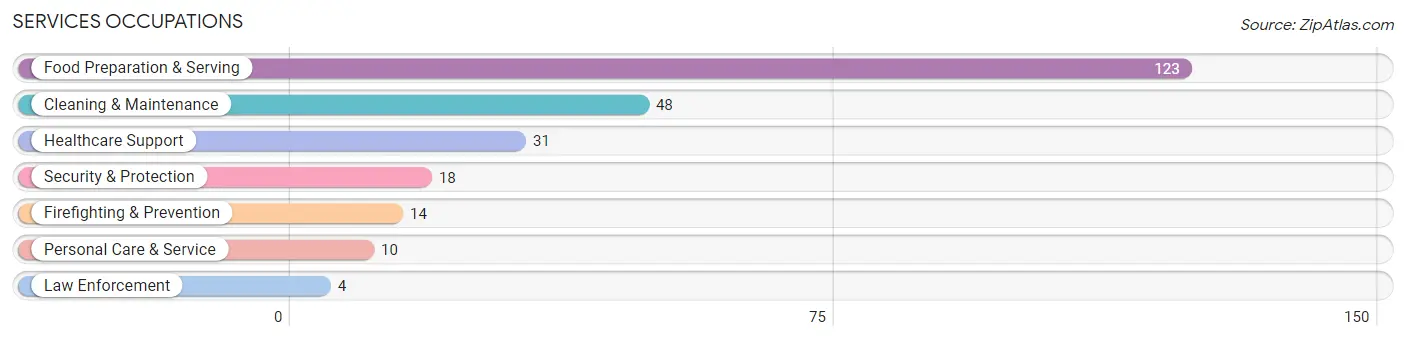
Services Occupations
The most common Services occupations in Blue Mound are Food Preparation & Serving (123 | 9.6%), Cleaning & Maintenance (48 | 3.7%), Healthcare Support (31 | 2.4%), Security & Protection (18 | 1.4%), and Firefighting & Prevention (14 | 1.1%).
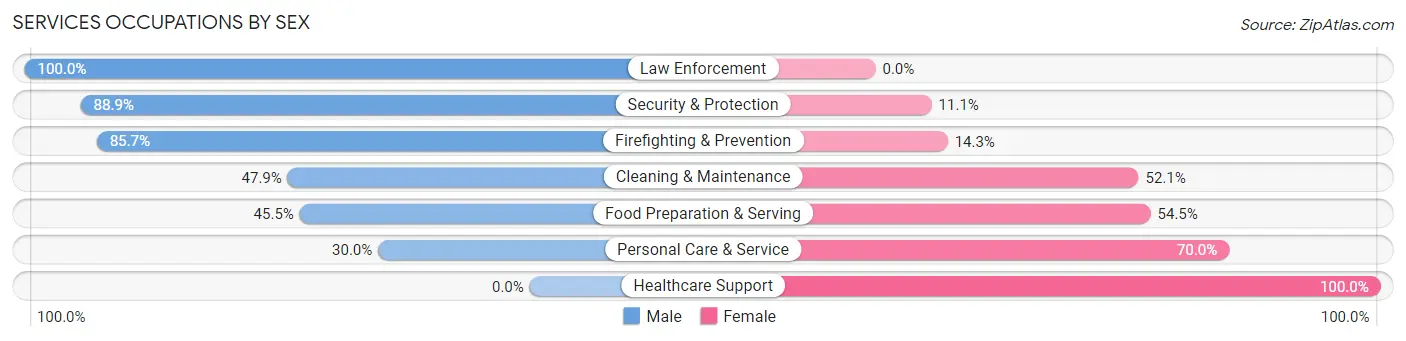
Services Occupations by Sex
Within the Services occupations in Blue Mound, the most male-oriented occupations are Law Enforcement (100.0%), Security & Protection (88.9%), and Firefighting & Prevention (85.7%), while the most female-oriented occupations are Healthcare Support (100.0%), Personal Care & Service (70.0%), and Food Preparation & Serving (54.5%).
| Occupation | Male | Female |
| Healthcare Support | 0 (0.0%) | 31 (100.0%) |
| Security & Protection | 16 (88.9%) | 2 (11.1%) |
| Firefighting & Prevention | 12 (85.7%) | 2 (14.3%) |
| Law Enforcement | 4 (100.0%) | 0 (0.0%) |
| Food Preparation & Serving | 56 (45.5%) | 67 (54.5%) |
| Cleaning & Maintenance | 23 (47.9%) | 25 (52.1%) |
| Personal Care & Service | 3 (30.0%) | 7 (70.0%) |
| Total (Category) | 98 (42.6%) | 132 (57.4%) |
| Total (Overall) | 772 (60.2%) | 510 (39.8%) |
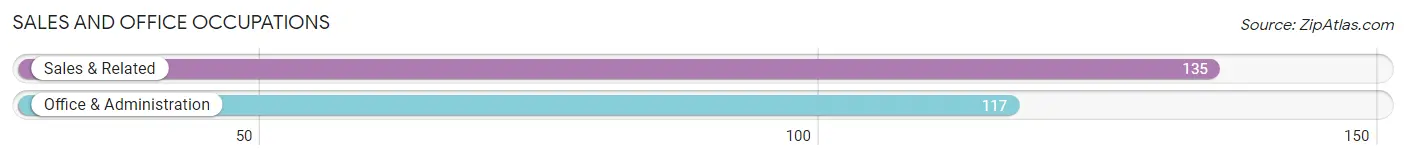
Sales and Office Occupations
The most common Sales and Office occupations in Blue Mound are Sales & Related (135 | 10.5%), and Office & Administration (117 | 9.1%).
Sales and Office Occupations by Sex
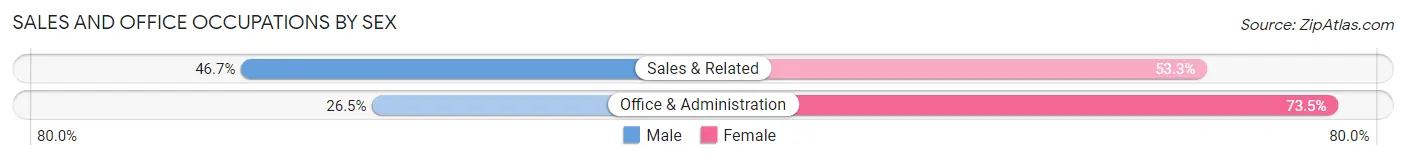
| Occupation | Male | Female |
| Sales & Related | 63 (46.7%) | 72 (53.3%) |
| Office & Administration | 31 (26.5%) | 86 (73.5%) |
| Total (Category) | 94 (37.3%) | 158 (62.7%) |
| Total (Overall) | 772 (60.2%) | 510 (39.8%) |
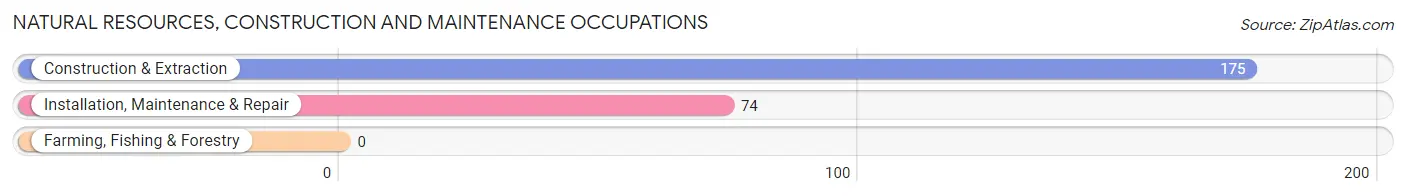
Natural Resources, Construction and Maintenance Occupations
The most common Natural Resources, Construction and Maintenance occupations in Blue Mound are Construction & Extraction (175 | 13.7%), and Installation, Maintenance & Repair (74 | 5.8%).
Natural Resources, Construction and Maintenance Occupations by Sex
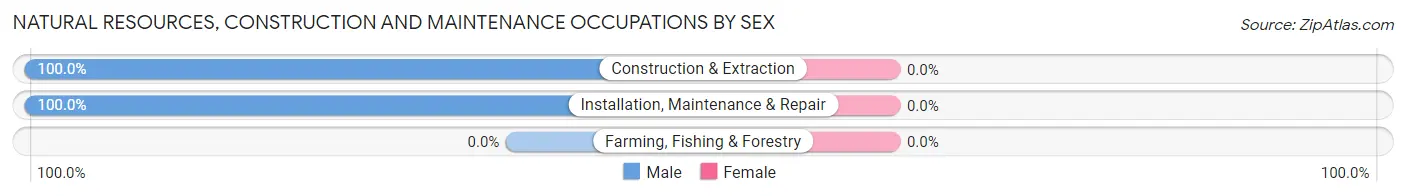
| Occupation | Male | Female |
| Farming, Fishing & Forestry | 0 (0.0%) | 0 (0.0%) |
| Construction & Extraction | 175 (100.0%) | 0 (0.0%) |
| Installation, Maintenance & Repair | 74 (100.0%) | 0 (0.0%) |
| Total (Category) | 249 (100.0%) | 0 (0.0%) |
| Total (Overall) | 772 (60.2%) | 510 (39.8%) |
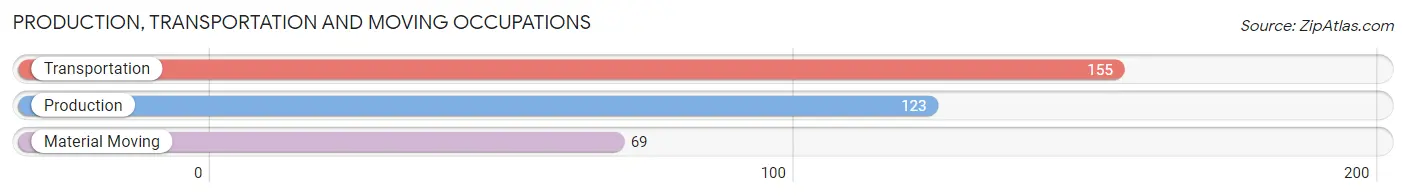
Production, Transportation and Moving Occupations
The most common Production, Transportation and Moving occupations in Blue Mound are Transportation (155 | 12.1%), Production (123 | 9.6%), and Material Moving (69 | 5.4%).
Production, Transportation and Moving Occupations by Sex
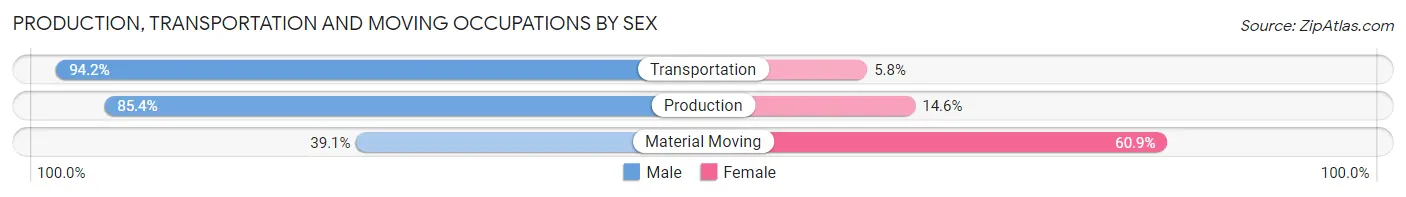
| Occupation | Male | Female |
| Production | 105 (85.4%) | 18 (14.6%) |
| Transportation | 146 (94.2%) | 9 (5.8%) |
| Material Moving | 27 (39.1%) | 42 (60.9%) |
| Total (Category) | 278 (80.1%) | 69 (19.9%) |
| Total (Overall) | 772 (60.2%) | 510 (39.8%) |
Employment Industries by Sex in Blue Mound
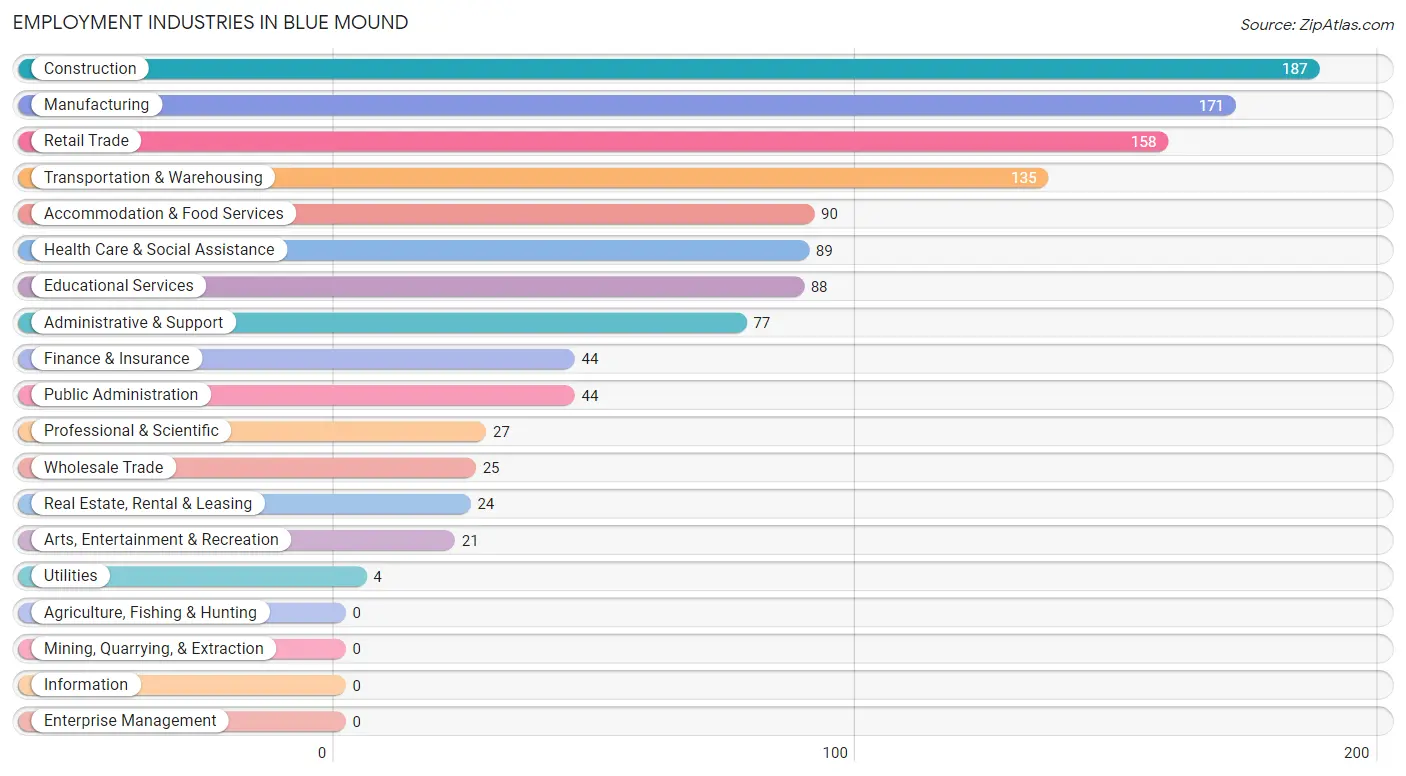
Employment Industries in Blue Mound
The major employment industries in Blue Mound include Construction (187 | 14.6%), Manufacturing (171 | 13.3%), Retail Trade (158 | 12.3%), Transportation & Warehousing (135 | 10.5%), and Accommodation & Food Services (90 | 7.0%).
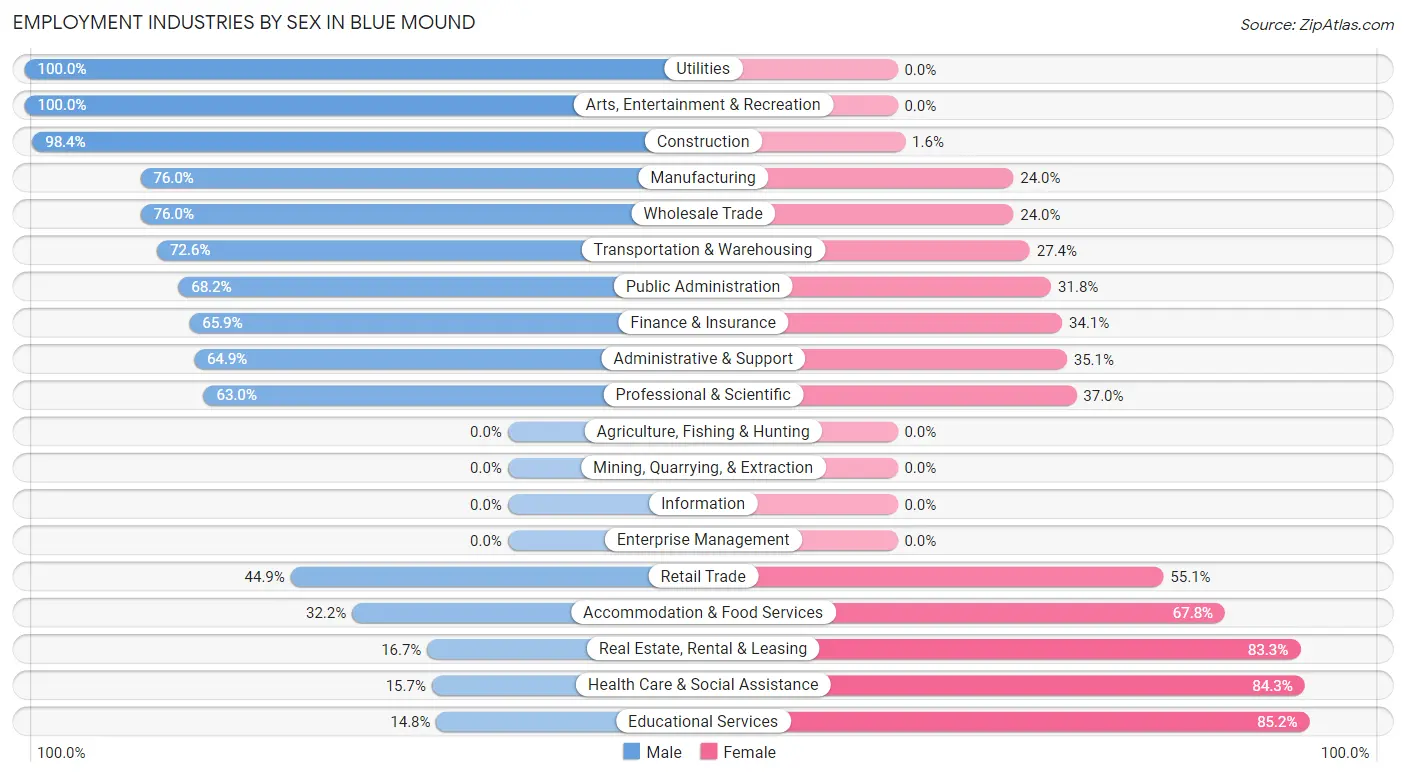
Employment Industries by Sex in Blue Mound
The Blue Mound industries that see more men than women are Utilities (100.0%), Arts, Entertainment & Recreation (100.0%), and Construction (98.4%), whereas the industries that tend to have a higher number of women are Educational Services (85.2%), Health Care & Social Assistance (84.3%), and Real Estate, Rental & Leasing (83.3%).
| Industry | Male | Female |
| Agriculture, Fishing & Hunting | 0 (0.0%) | 0 (0.0%) |
| Mining, Quarrying, & Extraction | 0 (0.0%) | 0 (0.0%) |
| Construction | 184 (98.4%) | 3 (1.6%) |
| Manufacturing | 130 (76.0%) | 41 (24.0%) |
| Wholesale Trade | 19 (76.0%) | 6 (24.0%) |
| Retail Trade | 71 (44.9%) | 87 (55.1%) |
| Transportation & Warehousing | 98 (72.6%) | 37 (27.4%) |
| Utilities | 4 (100.0%) | 0 (0.0%) |
| Information | 0 (0.0%) | 0 (0.0%) |
| Finance & Insurance | 29 (65.9%) | 15 (34.1%) |
| Real Estate, Rental & Leasing | 4 (16.7%) | 20 (83.3%) |
| Professional & Scientific | 17 (63.0%) | 10 (37.0%) |
| Enterprise Management | 0 (0.0%) | 0 (0.0%) |
| Administrative & Support | 50 (64.9%) | 27 (35.1%) |
| Educational Services | 13 (14.8%) | 75 (85.2%) |
| Health Care & Social Assistance | 14 (15.7%) | 75 (84.3%) |
| Arts, Entertainment & Recreation | 21 (100.0%) | 0 (0.0%) |
| Accommodation & Food Services | 29 (32.2%) | 61 (67.8%) |
| Public Administration | 30 (68.2%) | 14 (31.8%) |
| Total | 772 (60.2%) | 510 (39.8%) |
Education in Blue Mound
School Enrollment in Blue Mound
The most common levels of schooling among the 733 students in Blue Mound are high school (243 | 33.2%), middle school (224 | 30.6%), and elementary school (145 | 19.8%).
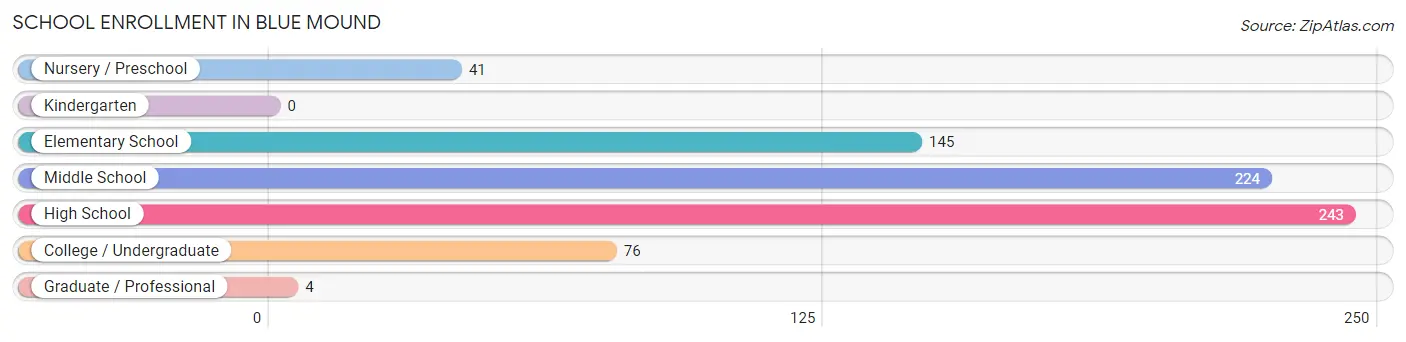
| School Level | # Students | % Students |
| Nursery / Preschool | 41 | 5.6% |
| Kindergarten | 0 | 0.0% |
| Elementary School | 145 | 19.8% |
| Middle School | 224 | 30.6% |
| High School | 243 | 33.2% |
| College / Undergraduate | 76 | 10.4% |
| Graduate / Professional | 4 | 0.5% |
| Total | 733 | 100.0% |
School Enrollment by Age by Funding Source in Blue Mound
Out of a total of 733 students who are enrolled in schools in Blue Mound, 93 (12.7%) attend a private institution, while the remaining 640 (87.3%) are enrolled in public schools. The age group of 25 to 34 year olds has the highest likelihood of being enrolled in private schools, with 4 (50.0% in the age bracket) enrolled. Conversely, the age group of 3 to 4 year olds has the lowest likelihood of being enrolled in a private school, with 25 (100.0% in the age bracket) attending a public institution.
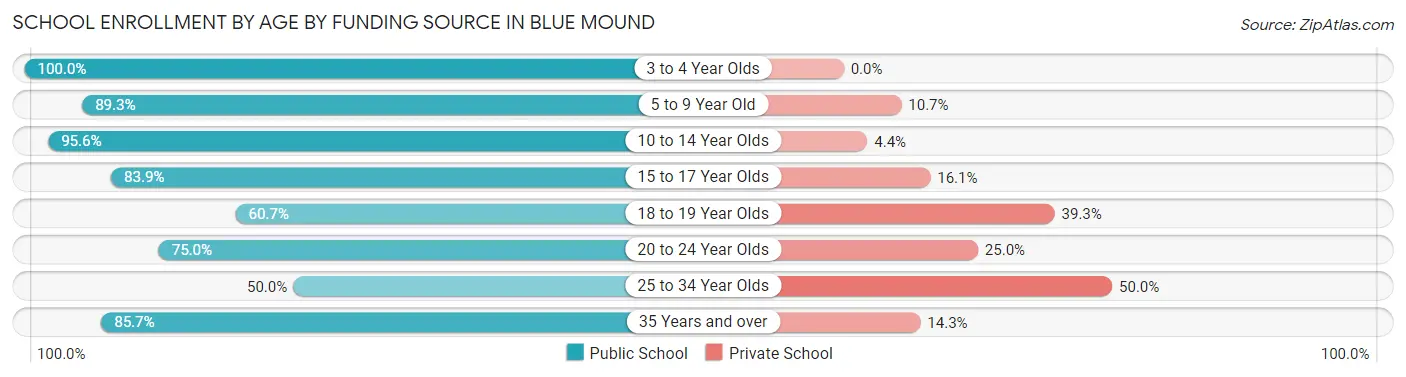
| Age Bracket | Public School | Private School |
| 3 to 4 Year Olds | 25 (100.0%) | 0 (0.0%) |
| 5 to 9 Year Old | 133 (89.3%) | 16 (10.7%) |
| 10 to 14 Year Olds | 260 (95.6%) | 12 (4.4%) |
| 15 to 17 Year Olds | 130 (83.9%) | 25 (16.1%) |
| 18 to 19 Year Olds | 34 (60.7%) | 22 (39.3%) |
| 20 to 24 Year Olds | 30 (75.0%) | 10 (25.0%) |
| 25 to 34 Year Olds | 4 (50.0%) | 4 (50.0%) |
| 35 Years and over | 24 (85.7%) | 4 (14.3%) |
| Total | 640 (87.3%) | 93 (12.7%) |
Educational Attainment by Field of Study in Blue Mound
Business (65 | 45.8%), liberal arts & history (16 | 11.3%), multidisciplinary studies (15 | 10.6%), arts & humanities (9 | 6.3%), and social sciences (7 | 4.9%) are the most common fields of study among 142 individuals in Blue Mound who have obtained a bachelor's degree or higher.
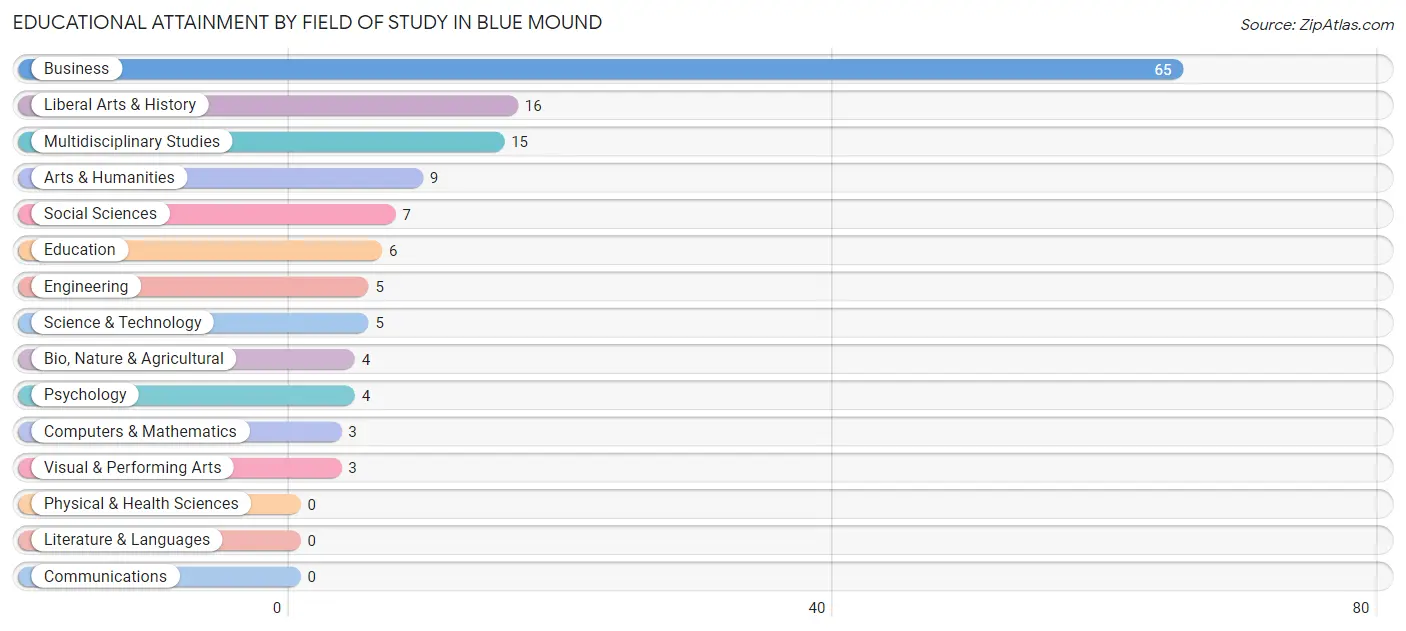
| Field of Study | # Graduates | % Graduates |
| Computers & Mathematics | 3 | 2.1% |
| Bio, Nature & Agricultural | 4 | 2.8% |
| Physical & Health Sciences | 0 | 0.0% |
| Psychology | 4 | 2.8% |
| Social Sciences | 7 | 4.9% |
| Engineering | 5 | 3.5% |
| Multidisciplinary Studies | 15 | 10.6% |
| Science & Technology | 5 | 3.5% |
| Business | 65 | 45.8% |
| Education | 6 | 4.2% |
| Literature & Languages | 0 | 0.0% |
| Liberal Arts & History | 16 | 11.3% |
| Visual & Performing Arts | 3 | 2.1% |
| Communications | 0 | 0.0% |
| Arts & Humanities | 9 | 6.3% |
| Total | 142 | 100.0% |
Transportation & Commute in Blue Mound
Vehicle Availability by Sex in Blue Mound
The most prevalent vehicle ownership categories in Blue Mound are males with 2 vehicles (413, accounting for 53.4%) and females with 2 vehicles (337, making up 81.0%).
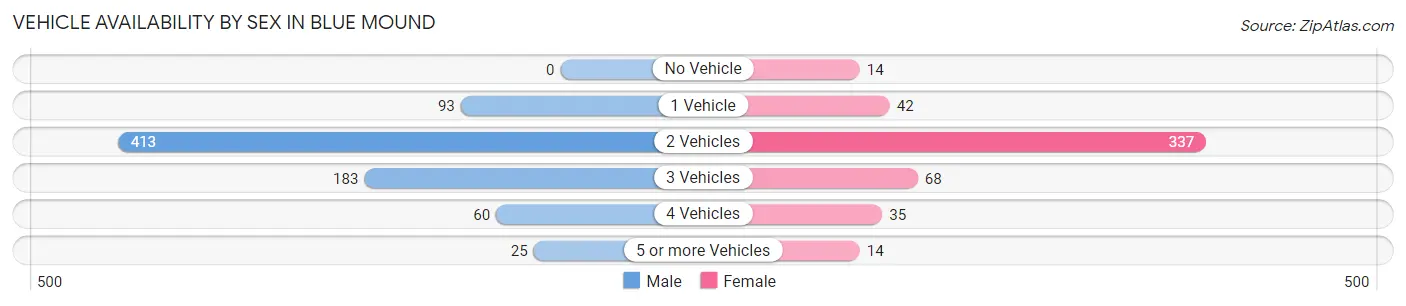
| Vehicles Available | Male | Female |
| No Vehicle | 0 (0.0%) | 14 (2.8%) |
| 1 Vehicle | 93 (12.0%) | 42 (8.2%) |
| 2 Vehicles | 413 (53.4%) | 337 (66.1%) |
| 3 Vehicles | 183 (23.6%) | 68 (13.3%) |
| 4 Vehicles | 60 (7.7%) | 35 (6.9%) |
| 5 or more Vehicles | 25 (3.2%) | 14 (2.8%) |
| Total | 774 (100.0%) | 510 (100.0%) |
Commute Time in Blue Mound
The most frequently occuring commute durations in Blue Mound are 20 to 24 minutes (284 commuters, 23.8%), 30 to 34 minutes (195 commuters, 16.3%), and 15 to 19 minutes (165 commuters, 13.8%).
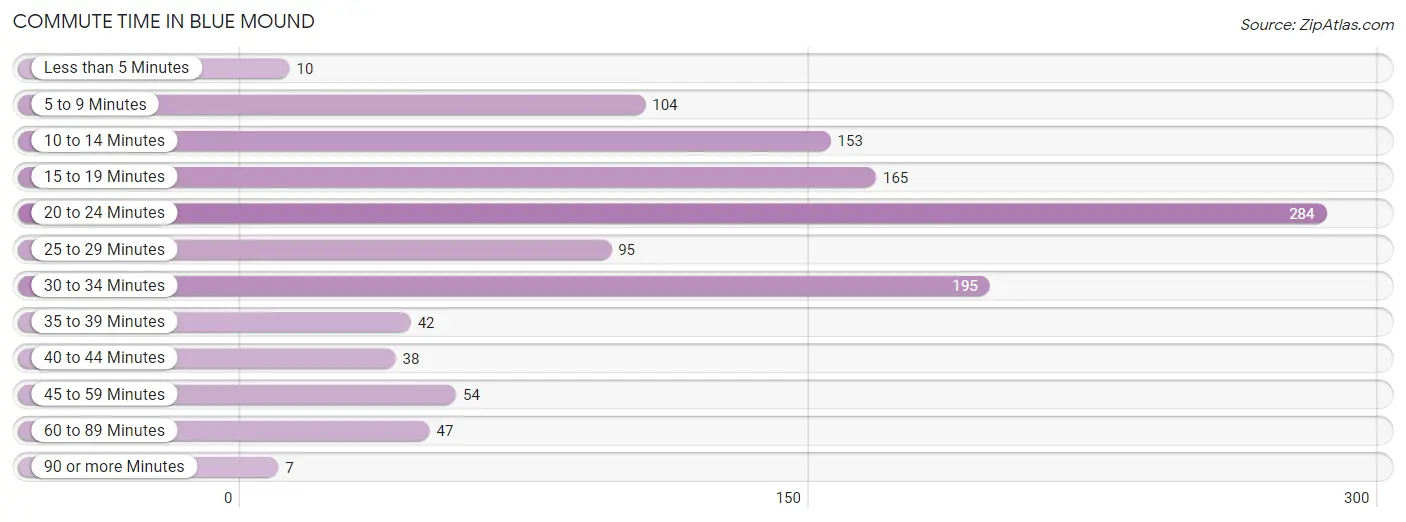
| Commute Time | # Commuters | % Commuters |
| Less than 5 Minutes | 10 | 0.8% |
| 5 to 9 Minutes | 104 | 8.7% |
| 10 to 14 Minutes | 153 | 12.8% |
| 15 to 19 Minutes | 165 | 13.8% |
| 20 to 24 Minutes | 284 | 23.8% |
| 25 to 29 Minutes | 95 | 8.0% |
| 30 to 34 Minutes | 195 | 16.3% |
| 35 to 39 Minutes | 42 | 3.5% |
| 40 to 44 Minutes | 38 | 3.2% |
| 45 to 59 Minutes | 54 | 4.5% |
| 60 to 89 Minutes | 47 | 3.9% |
| 90 or more Minutes | 7 | 0.6% |
Commute Time by Sex in Blue Mound
The most common commute times in Blue Mound are 20 to 24 minutes (168 commuters, 23.1%) for males and 20 to 24 minutes (116 commuters, 24.9%) for females.
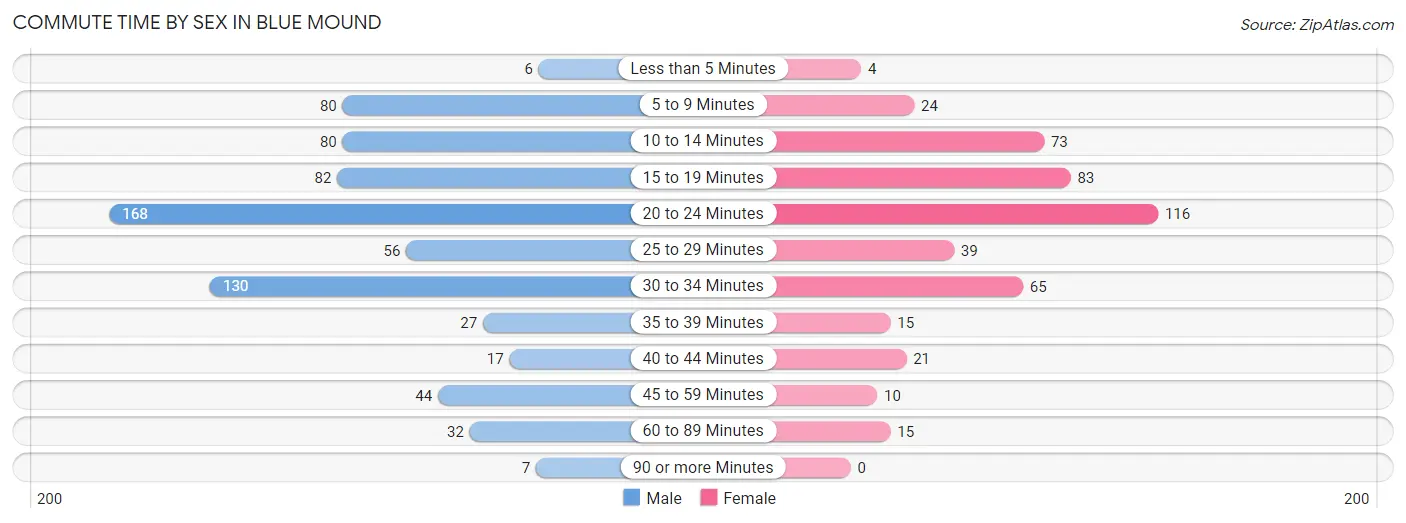
| Commute Time | Male | Female |
| Less than 5 Minutes | 6 (0.8%) | 4 (0.9%) |
| 5 to 9 Minutes | 80 (11.0%) | 24 (5.2%) |
| 10 to 14 Minutes | 80 (11.0%) | 73 (15.7%) |
| 15 to 19 Minutes | 82 (11.3%) | 83 (17.8%) |
| 20 to 24 Minutes | 168 (23.1%) | 116 (24.9%) |
| 25 to 29 Minutes | 56 (7.7%) | 39 (8.4%) |
| 30 to 34 Minutes | 130 (17.8%) | 65 (14.0%) |
| 35 to 39 Minutes | 27 (3.7%) | 15 (3.2%) |
| 40 to 44 Minutes | 17 (2.3%) | 21 (4.5%) |
| 45 to 59 Minutes | 44 (6.0%) | 10 (2.1%) |
| 60 to 89 Minutes | 32 (4.4%) | 15 (3.2%) |
| 90 or more Minutes | 7 (1.0%) | 0 (0.0%) |
Time of Departure to Work by Sex in Blue Mound
The most frequent times of departure to work in Blue Mound are 7:00 AM to 7:29 AM (140, 19.2%) for males and 7:00 AM to 7:29 AM (96, 20.6%) for females.
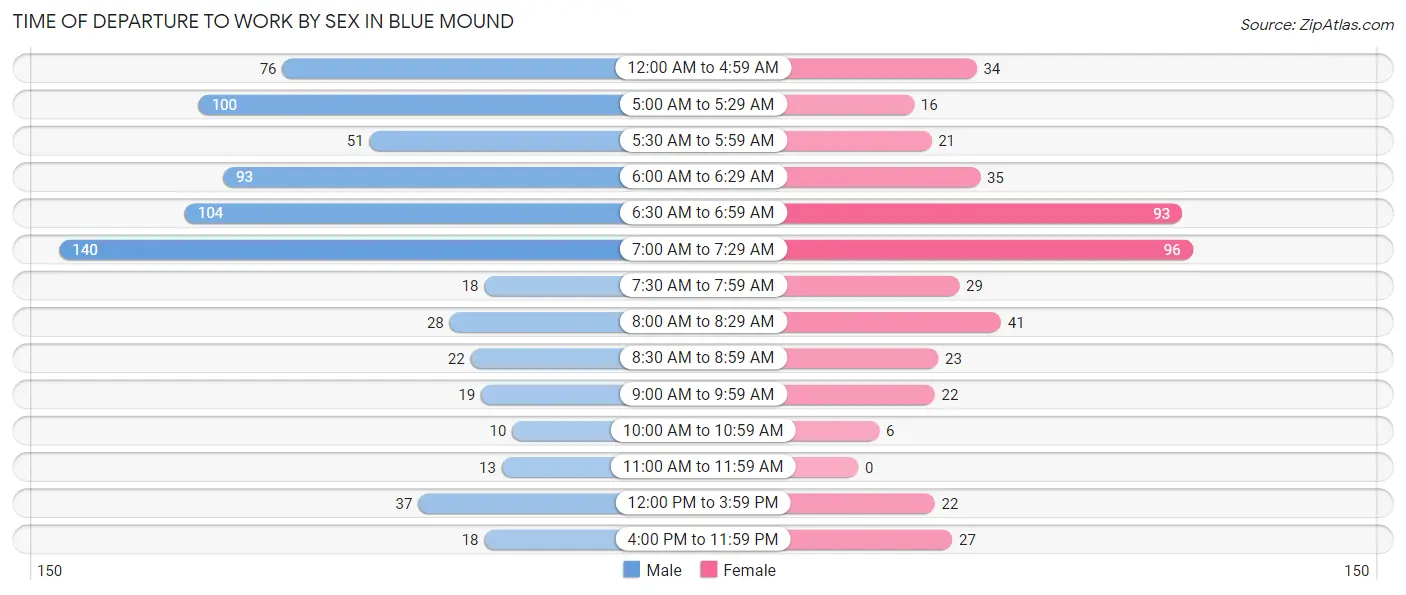
| Time of Departure | Male | Female |
| 12:00 AM to 4:59 AM | 76 (10.4%) | 34 (7.3%) |
| 5:00 AM to 5:29 AM | 100 (13.7%) | 16 (3.4%) |
| 5:30 AM to 5:59 AM | 51 (7.0%) | 21 (4.5%) |
| 6:00 AM to 6:29 AM | 93 (12.8%) | 35 (7.5%) |
| 6:30 AM to 6:59 AM | 104 (14.3%) | 93 (20.0%) |
| 7:00 AM to 7:29 AM | 140 (19.2%) | 96 (20.6%) |
| 7:30 AM to 7:59 AM | 18 (2.5%) | 29 (6.2%) |
| 8:00 AM to 8:29 AM | 28 (3.8%) | 41 (8.8%) |
| 8:30 AM to 8:59 AM | 22 (3.0%) | 23 (5.0%) |
| 9:00 AM to 9:59 AM | 19 (2.6%) | 22 (4.7%) |
| 10:00 AM to 10:59 AM | 10 (1.4%) | 6 (1.3%) |
| 11:00 AM to 11:59 AM | 13 (1.8%) | 0 (0.0%) |
| 12:00 PM to 3:59 PM | 37 (5.1%) | 22 (4.7%) |
| 4:00 PM to 11:59 PM | 18 (2.5%) | 27 (5.8%) |
| Total | 729 (100.0%) | 465 (100.0%) |
Housing Occupancy in Blue Mound
Occupancy by Ownership in Blue Mound
Of the total 880 dwellings in Blue Mound, owner-occupied units account for 718 (81.6%), while renter-occupied units make up 162 (18.4%).
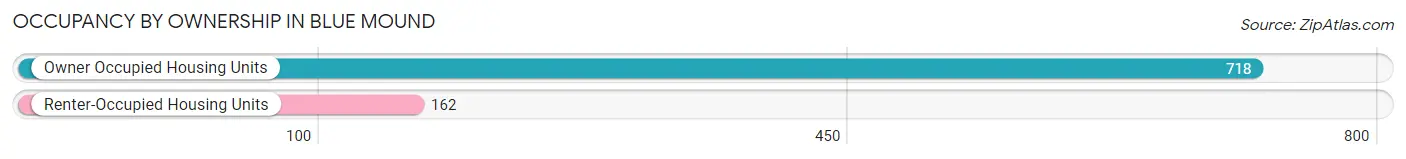
| Occupancy | # Housing Units | % Housing Units |
| Owner Occupied Housing Units | 718 | 81.6% |
| Renter-Occupied Housing Units | 162 | 18.4% |
| Total Occupied Housing Units | 880 | 100.0% |
Occupancy by Household Size in Blue Mound
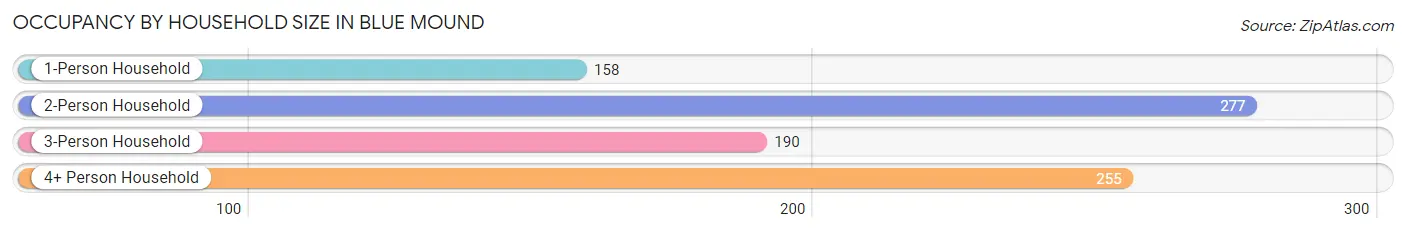
| Household Size | # Housing Units | % Housing Units |
| 1-Person Household | 158 | 17.9% |
| 2-Person Household | 277 | 31.5% |
| 3-Person Household | 190 | 21.6% |
| 4+ Person Household | 255 | 29.0% |
| Total Housing Units | 880 | 100.0% |
Occupancy by Ownership by Household Size in Blue Mound
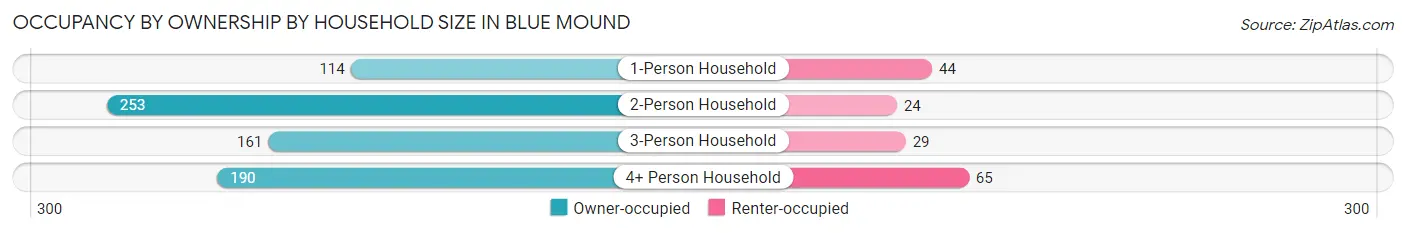
| Household Size | Owner-occupied | Renter-occupied |
| 1-Person Household | 114 (72.2%) | 44 (27.9%) |
| 2-Person Household | 253 (91.3%) | 24 (8.7%) |
| 3-Person Household | 161 (84.7%) | 29 (15.3%) |
| 4+ Person Household | 190 (74.5%) | 65 (25.5%) |
| Total Housing Units | 718 (81.6%) | 162 (18.4%) |
Occupancy by Educational Attainment in Blue Mound
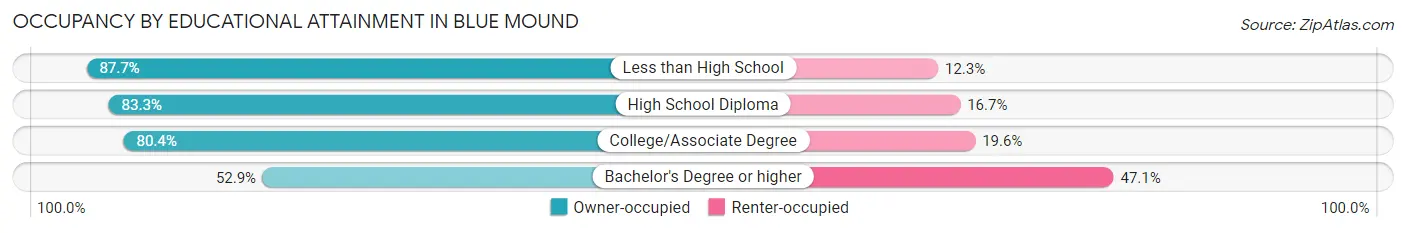
| Household Size | Owner-occupied | Renter-occupied |
| Less than High School | 193 (87.7%) | 27 (12.3%) |
| High School Diploma | 240 (83.3%) | 48 (16.7%) |
| College/Associate Degree | 258 (80.4%) | 63 (19.6%) |
| Bachelor's Degree or higher | 27 (52.9%) | 24 (47.1%) |
Occupancy by Age of Householder in Blue Mound
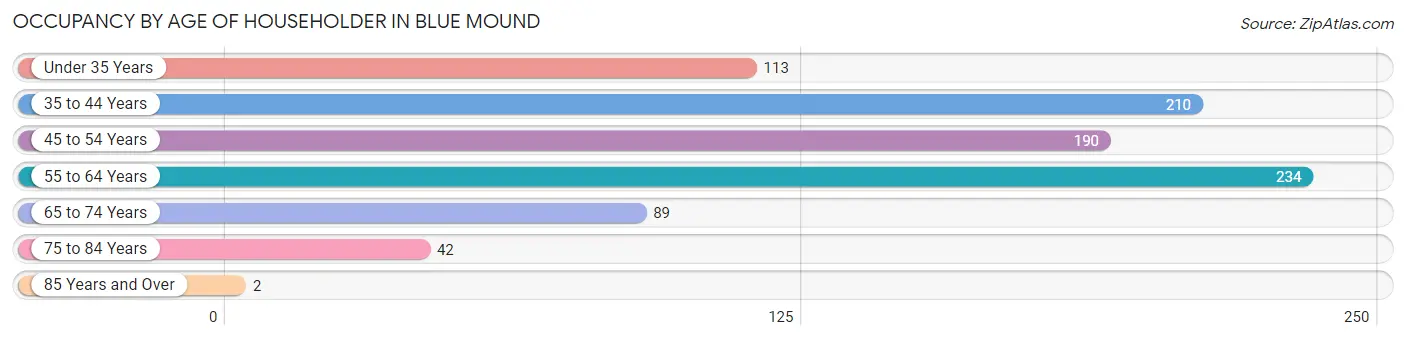
| Age Bracket | # Households | % Households |
| Under 35 Years | 113 | 12.8% |
| 35 to 44 Years | 210 | 23.9% |
| 45 to 54 Years | 190 | 21.6% |
| 55 to 64 Years | 234 | 26.6% |
| 65 to 74 Years | 89 | 10.1% |
| 75 to 84 Years | 42 | 4.8% |
| 85 Years and Over | 2 | 0.2% |
| Total | 880 | 100.0% |
Housing Finances in Blue Mound
Median Income by Occupancy in Blue Mound
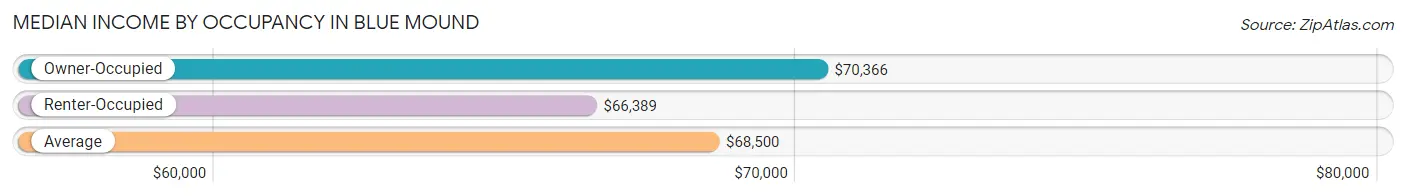
| Occupancy Type | # Households | Median Income |
| Owner-Occupied | 718 (81.6%) | $70,366 |
| Renter-Occupied | 162 (18.4%) | $66,389 |
| Average | 880 (100.0%) | $68,500 |
Occupancy by Householder Income Bracket in Blue Mound
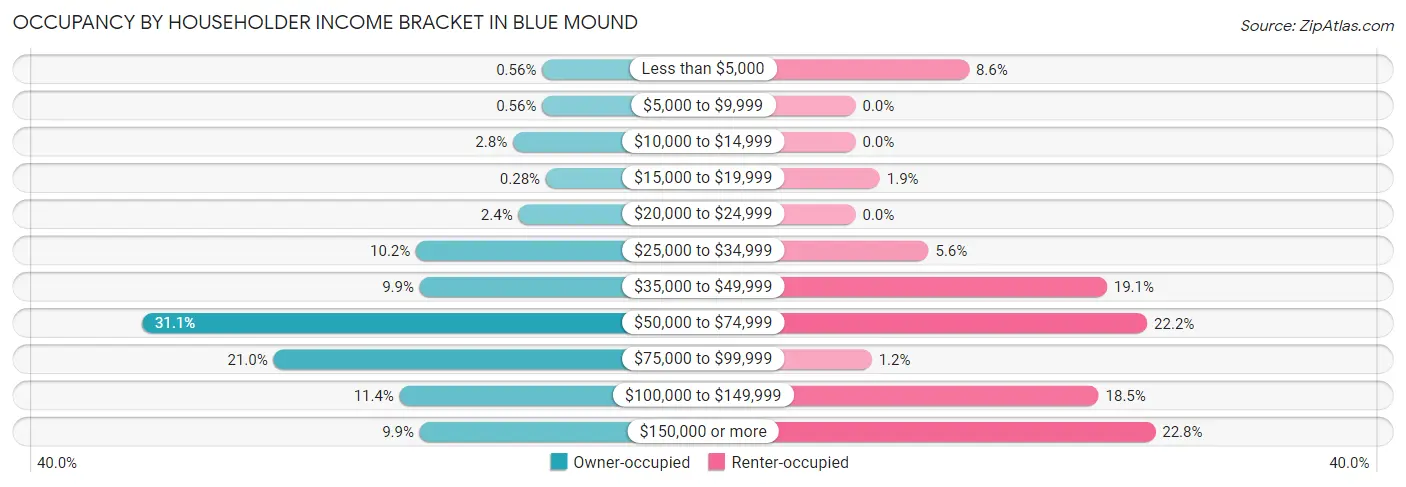
| Income Bracket | Owner-occupied | Renter-occupied |
| Less than $5,000 | 4 (0.6%) | 14 (8.6%) |
| $5,000 to $9,999 | 4 (0.6%) | 0 (0.0%) |
| $10,000 to $14,999 | 20 (2.8%) | 0 (0.0%) |
| $15,000 to $19,999 | 2 (0.3%) | 3 (1.8%) |
| $20,000 to $24,999 | 17 (2.4%) | 0 (0.0%) |
| $25,000 to $34,999 | 73 (10.2%) | 9 (5.6%) |
| $35,000 to $49,999 | 71 (9.9%) | 31 (19.1%) |
| $50,000 to $74,999 | 223 (31.1%) | 36 (22.2%) |
| $75,000 to $99,999 | 151 (21.0%) | 2 (1.2%) |
| $100,000 to $149,999 | 82 (11.4%) | 30 (18.5%) |
| $150,000 or more | 71 (9.9%) | 37 (22.8%) |
| Total | 718 (100.0%) | 162 (100.0%) |
Monthly Housing Cost Tiers in Blue Mound
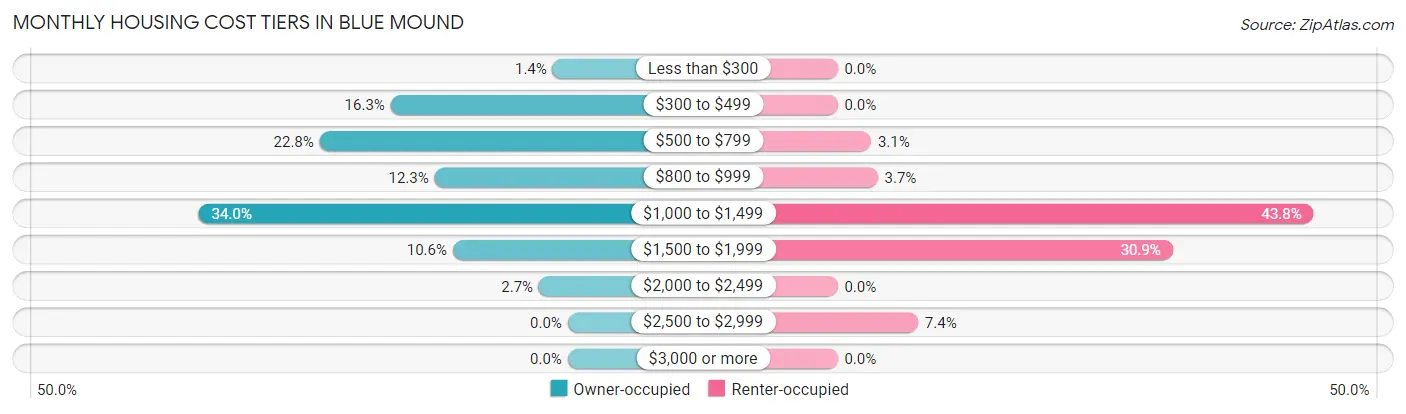
| Monthly Cost | Owner-occupied | Renter-occupied |
| Less than $300 | 10 (1.4%) | 0 (0.0%) |
| $300 to $499 | 117 (16.3%) | 0 (0.0%) |
| $500 to $799 | 164 (22.8%) | 5 (3.1%) |
| $800 to $999 | 88 (12.3%) | 6 (3.7%) |
| $1,000 to $1,499 | 244 (34.0%) | 71 (43.8%) |
| $1,500 to $1,999 | 76 (10.6%) | 50 (30.9%) |
| $2,000 to $2,499 | 19 (2.6%) | 0 (0.0%) |
| $2,500 to $2,999 | 0 (0.0%) | 12 (7.4%) |
| $3,000 or more | 0 (0.0%) | 0 (0.0%) |
| Total | 718 (100.0%) | 162 (100.0%) |
Physical Housing Characteristics in Blue Mound
Housing Structures in Blue Mound
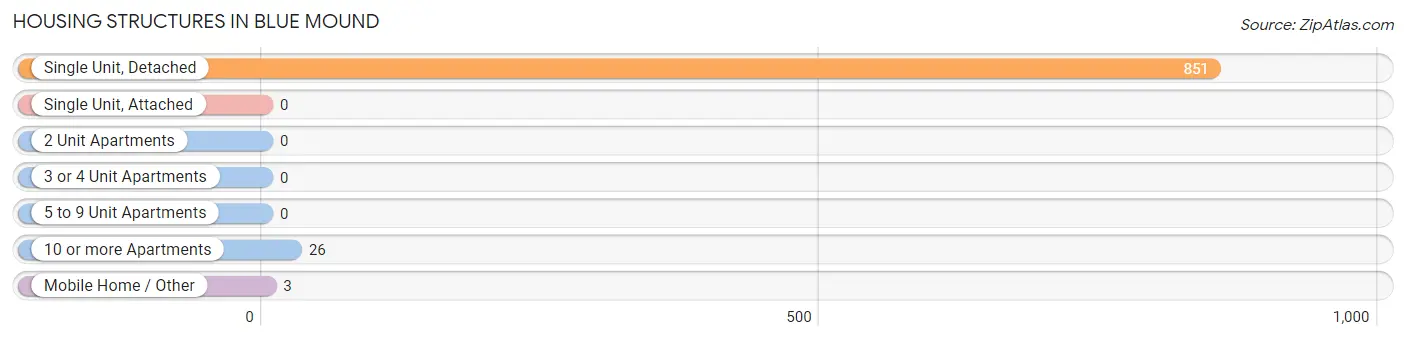
| Structure Type | # Housing Units | % Housing Units |
| Single Unit, Detached | 851 | 96.7% |
| Single Unit, Attached | 0 | 0.0% |
| 2 Unit Apartments | 0 | 0.0% |
| 3 or 4 Unit Apartments | 0 | 0.0% |
| 5 to 9 Unit Apartments | 0 | 0.0% |
| 10 or more Apartments | 26 | 2.9% |
| Mobile Home / Other | 3 | 0.3% |
| Total | 880 | 100.0% |
Housing Structures by Occupancy in Blue Mound
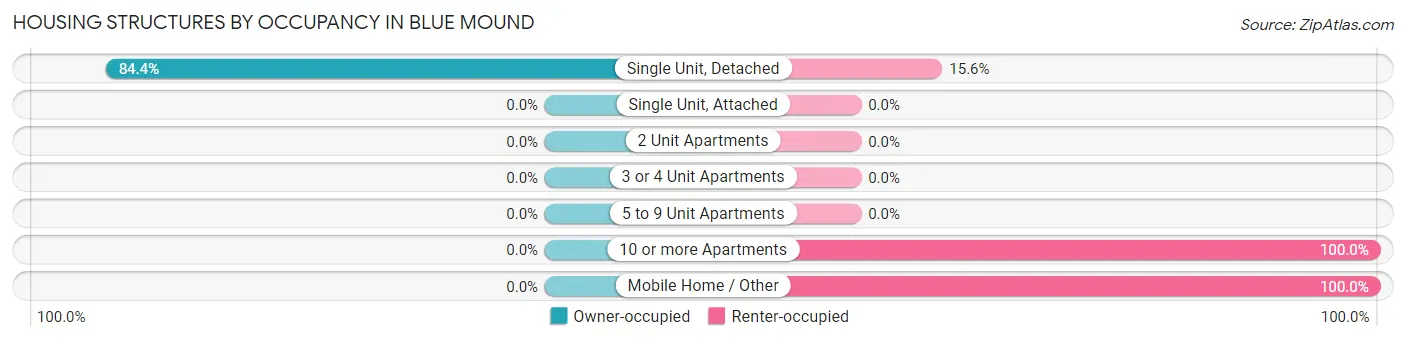
| Structure Type | Owner-occupied | Renter-occupied |
| Single Unit, Detached | 718 (84.4%) | 133 (15.6%) |
| Single Unit, Attached | 0 (0.0%) | 0 (0.0%) |
| 2 Unit Apartments | 0 (0.0%) | 0 (0.0%) |
| 3 or 4 Unit Apartments | 0 (0.0%) | 0 (0.0%) |
| 5 to 9 Unit Apartments | 0 (0.0%) | 0 (0.0%) |
| 10 or more Apartments | 0 (0.0%) | 26 (100.0%) |
| Mobile Home / Other | 0 (0.0%) | 3 (100.0%) |
| Total | 718 (81.6%) | 162 (18.4%) |
Housing Structures by Number of Rooms in Blue Mound
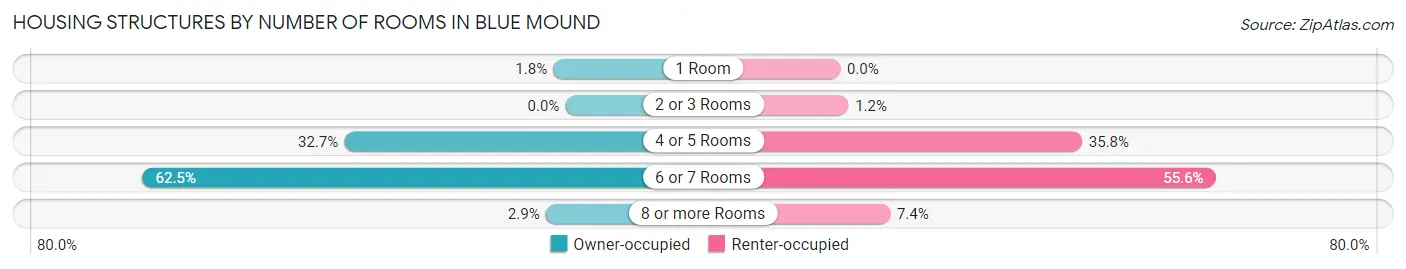
| Number of Rooms | Owner-occupied | Renter-occupied |
| 1 Room | 13 (1.8%) | 0 (0.0%) |
| 2 or 3 Rooms | 0 (0.0%) | 2 (1.2%) |
| 4 or 5 Rooms | 235 (32.7%) | 58 (35.8%) |
| 6 or 7 Rooms | 449 (62.5%) | 90 (55.6%) |
| 8 or more Rooms | 21 (2.9%) | 12 (7.4%) |
| Total | 718 (100.0%) | 162 (100.0%) |
Housing Structure by Heating Type in Blue Mound
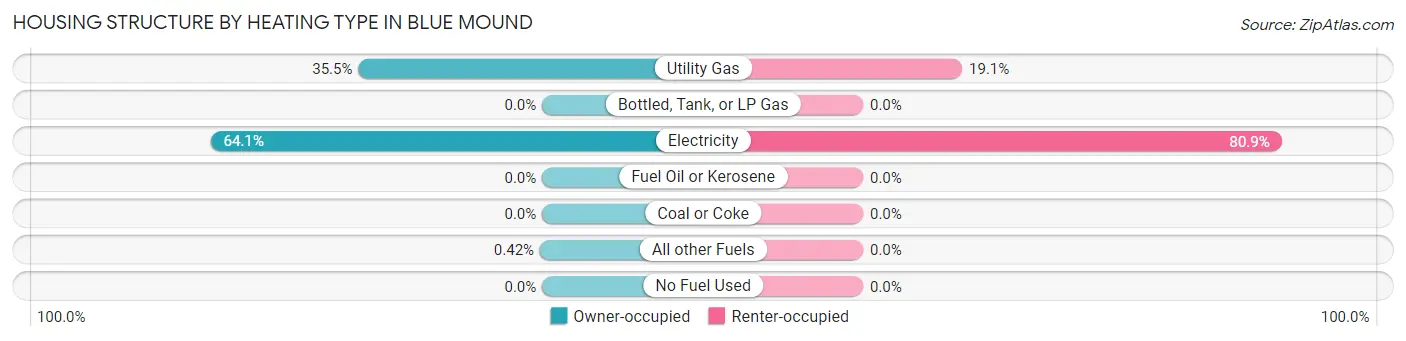
| Heating Type | Owner-occupied | Renter-occupied |
| Utility Gas | 255 (35.5%) | 31 (19.1%) |
| Bottled, Tank, or LP Gas | 0 (0.0%) | 0 (0.0%) |
| Electricity | 460 (64.1%) | 131 (80.9%) |
| Fuel Oil or Kerosene | 0 (0.0%) | 0 (0.0%) |
| Coal or Coke | 0 (0.0%) | 0 (0.0%) |
| All other Fuels | 3 (0.4%) | 0 (0.0%) |
| No Fuel Used | 0 (0.0%) | 0 (0.0%) |
| Total | 718 (100.0%) | 162 (100.0%) |
Household Vehicle Usage in Blue Mound
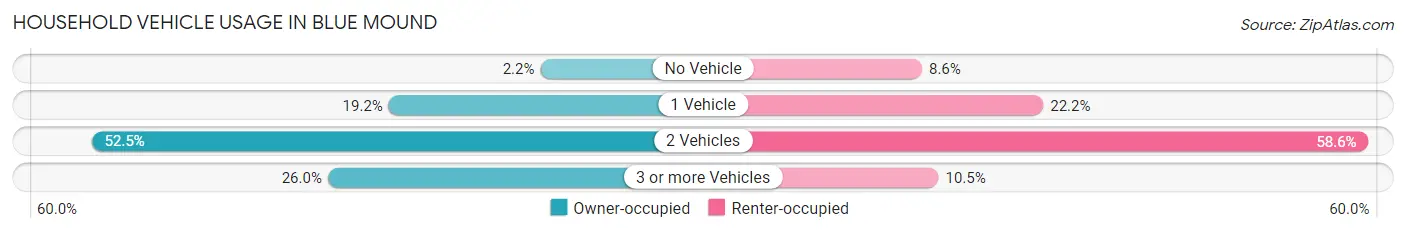
| Vehicles per Household | Owner-occupied | Renter-occupied |
| No Vehicle | 16 (2.2%) | 14 (8.6%) |
| 1 Vehicle | 138 (19.2%) | 36 (22.2%) |
| 2 Vehicles | 377 (52.5%) | 95 (58.6%) |
| 3 or more Vehicles | 187 (26.0%) | 17 (10.5%) |
| Total | 718 (100.0%) | 162 (100.0%) |
Real Estate & Mortgages in Blue Mound
Real Estate and Mortgage Overview in Blue Mound
| Characteristic | Without Mortgage | With Mortgage |
| Housing Units | 358 | 360 |
| Median Property Value | $158,200 | $162,800 |
| Median Household Income | $59,896 | $36 |
| Monthly Housing Costs | $576 | $0 |
| Real Estate Taxes | $2,575 | $7 |
Property Value by Mortgage Status in Blue Mound
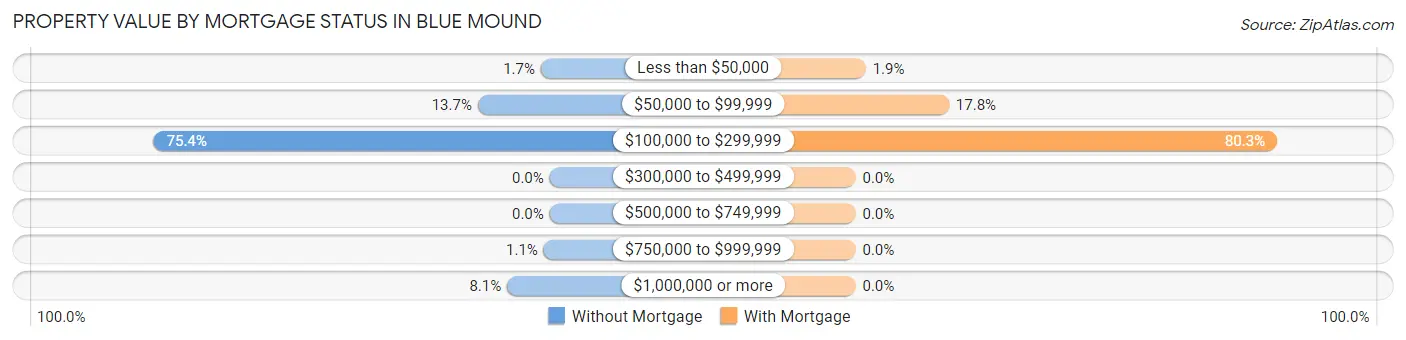
| Property Value | Without Mortgage | With Mortgage |
| Less than $50,000 | 6 (1.7%) | 7 (1.9%) |
| $50,000 to $99,999 | 49 (13.7%) | 64 (17.8%) |
| $100,000 to $299,999 | 270 (75.4%) | 289 (80.3%) |
| $300,000 to $499,999 | 0 (0.0%) | 0 (0.0%) |
| $500,000 to $749,999 | 0 (0.0%) | 0 (0.0%) |
| $750,000 to $999,999 | 4 (1.1%) | 0 (0.0%) |
| $1,000,000 or more | 29 (8.1%) | 0 (0.0%) |
| Total | 358 (100.0%) | 360 (100.0%) |
Household Income by Mortgage Status in Blue Mound
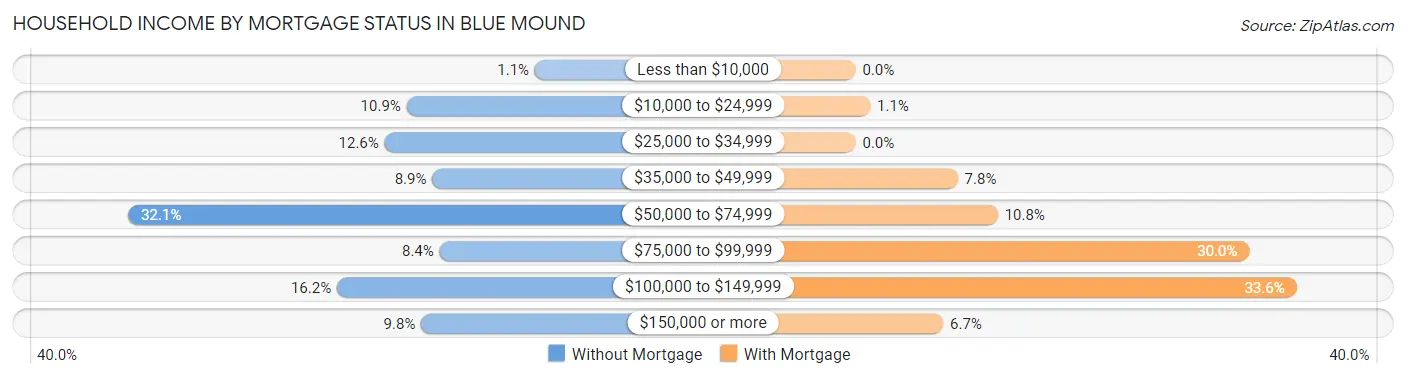
| Household Income | Without Mortgage | With Mortgage |
| Less than $10,000 | 4 (1.1%) | 0 (0.0%) |
| $10,000 to $24,999 | 39 (10.9%) | 4 (1.1%) |
| $25,000 to $34,999 | 45 (12.6%) | 0 (0.0%) |
| $35,000 to $49,999 | 32 (8.9%) | 28 (7.8%) |
| $50,000 to $74,999 | 115 (32.1%) | 39 (10.8%) |
| $75,000 to $99,999 | 30 (8.4%) | 108 (30.0%) |
| $100,000 to $149,999 | 58 (16.2%) | 121 (33.6%) |
| $150,000 or more | 35 (9.8%) | 24 (6.7%) |
| Total | 358 (100.0%) | 360 (100.0%) |
Property Value to Household Income Ratio in Blue Mound
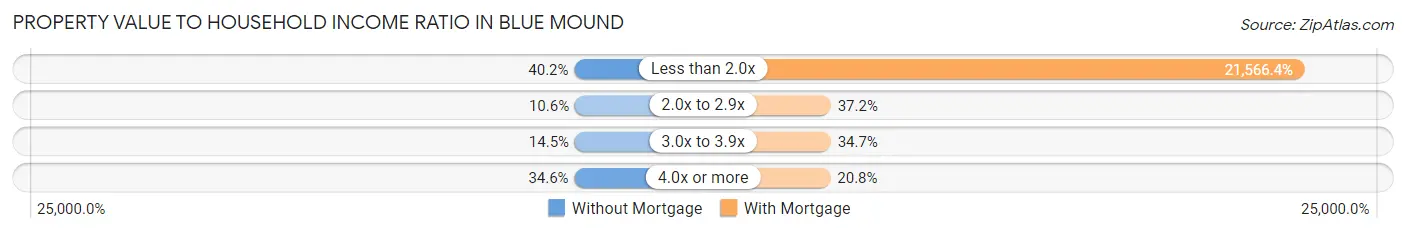
| Value-to-Income Ratio | Without Mortgage | With Mortgage |
| Less than 2.0x | 144 (40.2%) | 77,639 (21,566.4%) |
| 2.0x to 2.9x | 38 (10.6%) | 134 (37.2%) |
| 3.0x to 3.9x | 52 (14.5%) | 125 (34.7%) |
| 4.0x or more | 124 (34.6%) | 75 (20.8%) |
| Total | 358 (100.0%) | 360 (100.0%) |
Real Estate Taxes by Mortgage Status in Blue Mound
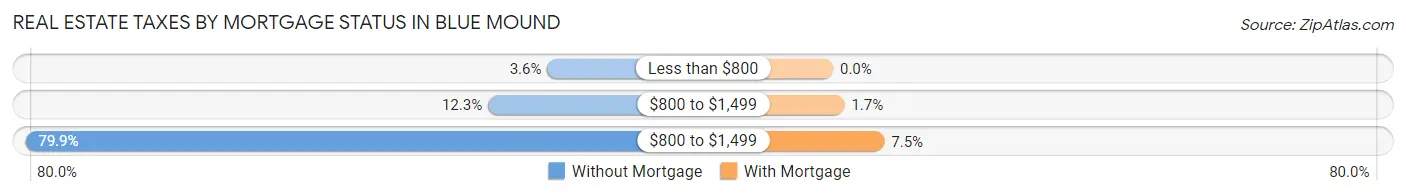
| Property Taxes | Without Mortgage | With Mortgage |
| Less than $800 | 13 (3.6%) | 0 (0.0%) |
| $800 to $1,499 | 44 (12.3%) | 6 (1.7%) |
| $800 to $1,499 | 286 (79.9%) | 27 (7.5%) |
| Total | 358 (100.0%) | 360 (100.0%) |
Health & Disability in Blue Mound
Health Insurance Coverage by Age in Blue Mound
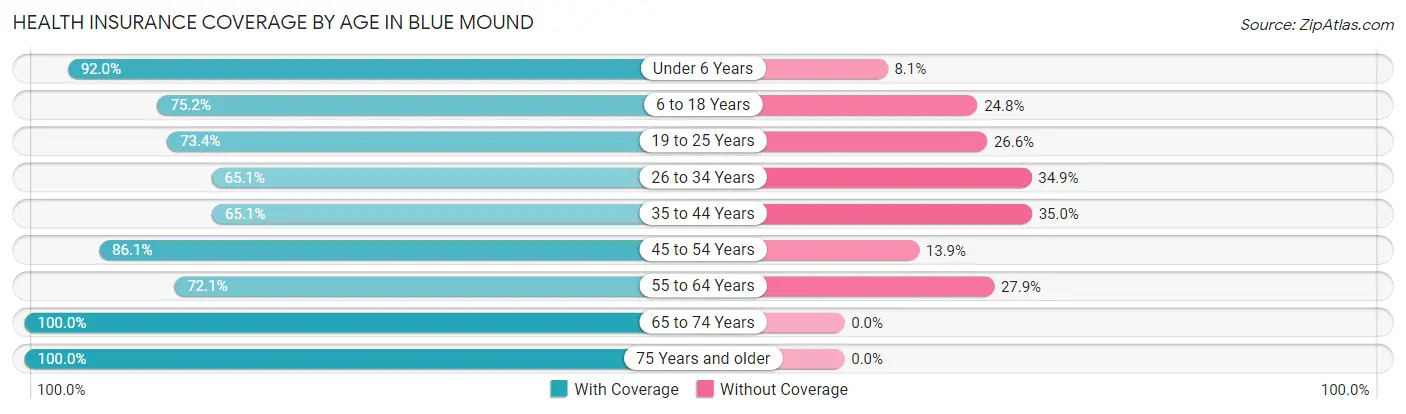
| Age Bracket | With Coverage | Without Coverage |
| Under 6 Years | 137 (91.9%) | 12 (8.1%) |
| 6 to 18 Years | 458 (75.2%) | 151 (24.8%) |
| 19 to 25 Years | 138 (73.4%) | 50 (26.6%) |
| 26 to 34 Years | 168 (65.1%) | 90 (34.9%) |
| 35 to 44 Years | 242 (65.0%) | 130 (34.9%) |
| 45 to 54 Years | 322 (86.1%) | 52 (13.9%) |
| 55 to 64 Years | 328 (72.1%) | 127 (27.9%) |
| 65 to 74 Years | 151 (100.0%) | 0 (0.0%) |
| 75 Years and older | 64 (100.0%) | 0 (0.0%) |
| Total | 2,008 (76.6%) | 612 (23.4%) |
Health Insurance Coverage by Citizenship Status in Blue Mound
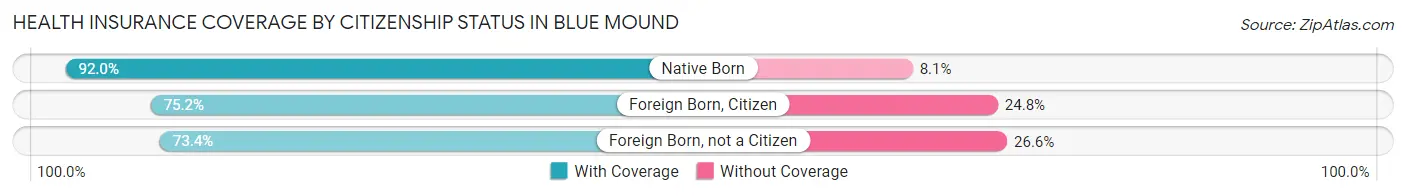
| Citizenship Status | With Coverage | Without Coverage |
| Native Born | 137 (91.9%) | 12 (8.1%) |
| Foreign Born, Citizen | 458 (75.2%) | 151 (24.8%) |
| Foreign Born, not a Citizen | 138 (73.4%) | 50 (26.6%) |
Health Insurance Coverage by Household Income in Blue Mound
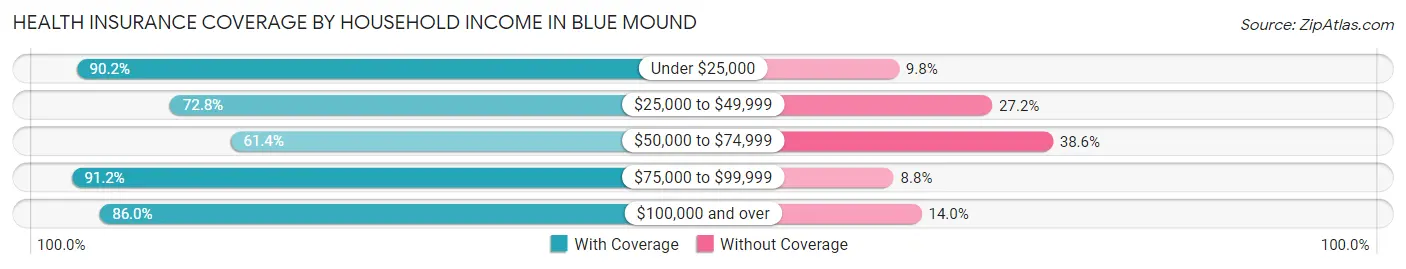
| Household Income | With Coverage | Without Coverage |
| Under $25,000 | 74 (90.2%) | 8 (9.8%) |
| $25,000 to $49,999 | 318 (72.8%) | 119 (27.2%) |
| $50,000 to $74,999 | 533 (61.4%) | 335 (38.6%) |
| $75,000 to $99,999 | 395 (91.2%) | 38 (8.8%) |
| $100,000 and over | 688 (86.0%) | 112 (14.0%) |
Public vs Private Health Insurance Coverage by Age in Blue Mound
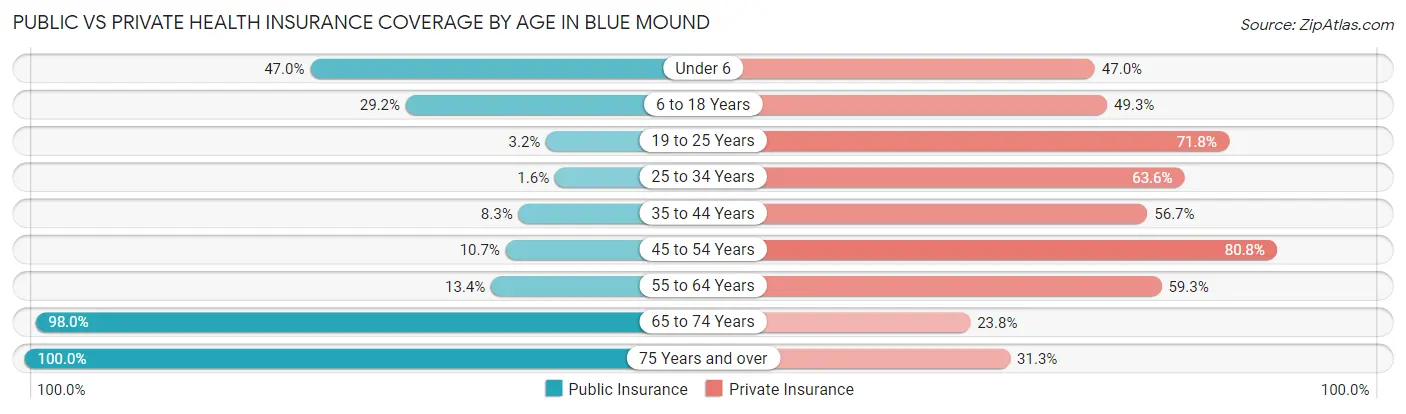
| Age Bracket | Public Insurance | Private Insurance |
| Under 6 | 70 (47.0%) | 70 (47.0%) |
| 6 to 18 Years | 178 (29.2%) | 300 (49.3%) |
| 19 to 25 Years | 6 (3.2%) | 135 (71.8%) |
| 25 to 34 Years | 4 (1.5%) | 164 (63.6%) |
| 35 to 44 Years | 31 (8.3%) | 211 (56.7%) |
| 45 to 54 Years | 40 (10.7%) | 302 (80.7%) |
| 55 to 64 Years | 61 (13.4%) | 270 (59.3%) |
| 65 to 74 Years | 148 (98.0%) | 36 (23.8%) |
| 75 Years and over | 64 (100.0%) | 20 (31.2%) |
| Total | 602 (23.0%) | 1,508 (57.6%) |
Disability Status by Sex by Age in Blue Mound
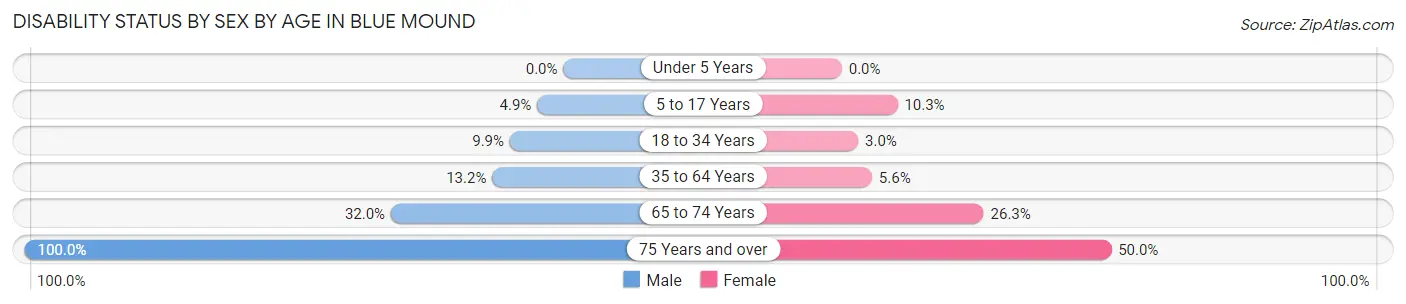
| Age Bracket | Male | Female |
| Under 5 Years | 0 (0.0%) | 0 (0.0%) |
| 5 to 17 Years | 18 (4.9%) | 22 (10.3%) |
| 18 to 34 Years | 27 (9.9%) | 7 (3.0%) |
| 35 to 64 Years | 83 (13.2%) | 32 (5.6%) |
| 65 to 74 Years | 24 (32.0%) | 20 (26.3%) |
| 75 Years and over | 10 (100.0%) | 27 (50.0%) |
Disability Class by Sex by Age in Blue Mound
Disability Class: Hearing Difficulty
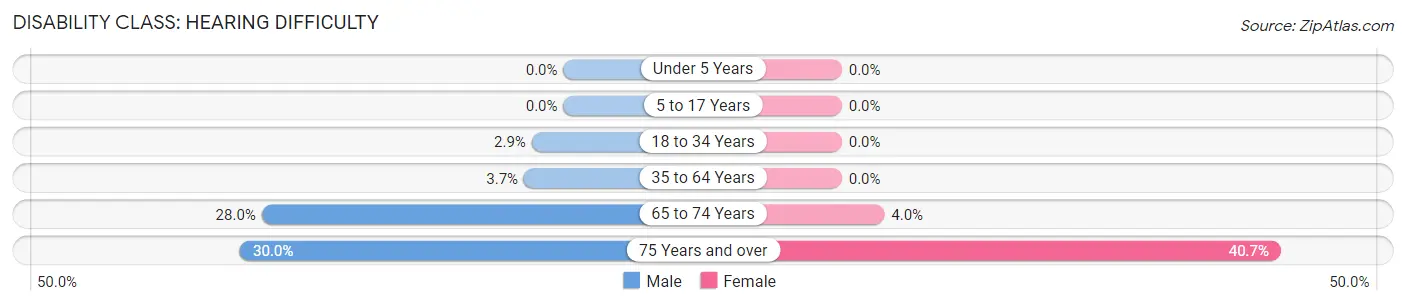
| Age Bracket | Male | Female |
| Under 5 Years | 0 (0.0%) | 0 (0.0%) |
| 5 to 17 Years | 0 (0.0%) | 0 (0.0%) |
| 18 to 34 Years | 8 (2.9%) | 0 (0.0%) |
| 35 to 64 Years | 23 (3.7%) | 0 (0.0%) |
| 65 to 74 Years | 21 (28.0%) | 3 (4.0%) |
| 75 Years and over | 3 (30.0%) | 22 (40.7%) |
Disability Class: Vision Difficulty
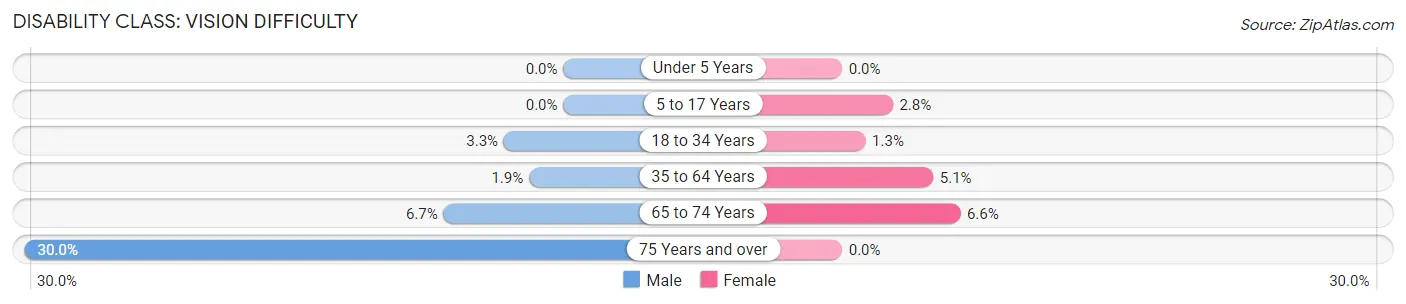
| Age Bracket | Male | Female |
| Under 5 Years | 0 (0.0%) | 0 (0.0%) |
| 5 to 17 Years | 0 (0.0%) | 6 (2.8%) |
| 18 to 34 Years | 9 (3.3%) | 3 (1.3%) |
| 35 to 64 Years | 12 (1.9%) | 29 (5.1%) |
| 65 to 74 Years | 5 (6.7%) | 5 (6.6%) |
| 75 Years and over | 3 (30.0%) | 0 (0.0%) |
Disability Class: Cognitive Difficulty
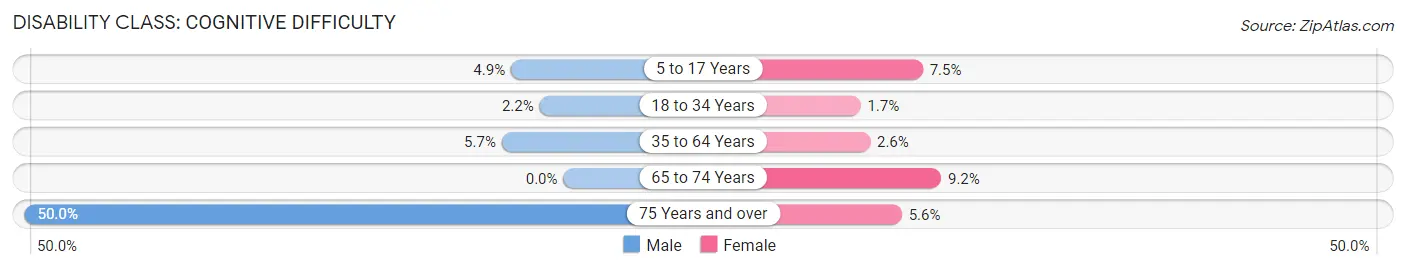
| Age Bracket | Male | Female |
| 5 to 17 Years | 18 (4.9%) | 16 (7.5%) |
| 18 to 34 Years | 6 (2.2%) | 4 (1.7%) |
| 35 to 64 Years | 36 (5.7%) | 15 (2.6%) |
| 65 to 74 Years | 0 (0.0%) | 7 (9.2%) |
| 75 Years and over | 5 (50.0%) | 3 (5.6%) |
Disability Class: Ambulatory Difficulty
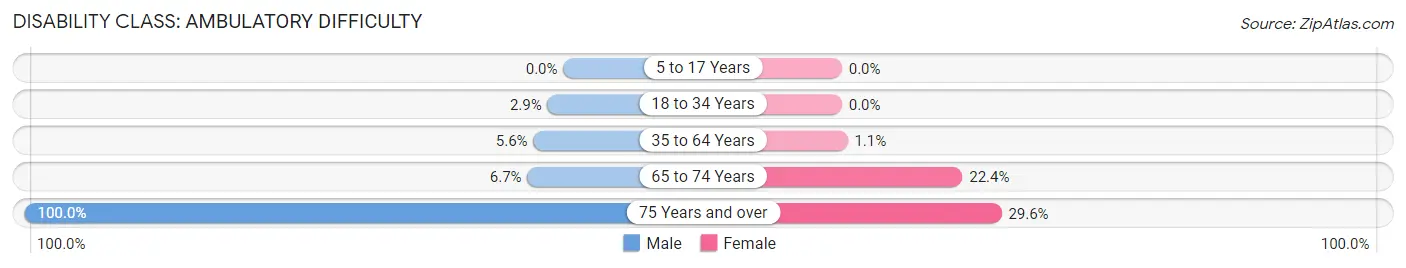
| Age Bracket | Male | Female |
| 5 to 17 Years | 0 (0.0%) | 0 (0.0%) |
| 18 to 34 Years | 8 (2.9%) | 0 (0.0%) |
| 35 to 64 Years | 35 (5.6%) | 6 (1.1%) |
| 65 to 74 Years | 5 (6.7%) | 17 (22.4%) |
| 75 Years and over | 10 (100.0%) | 16 (29.6%) |
Disability Class: Self-Care Difficulty
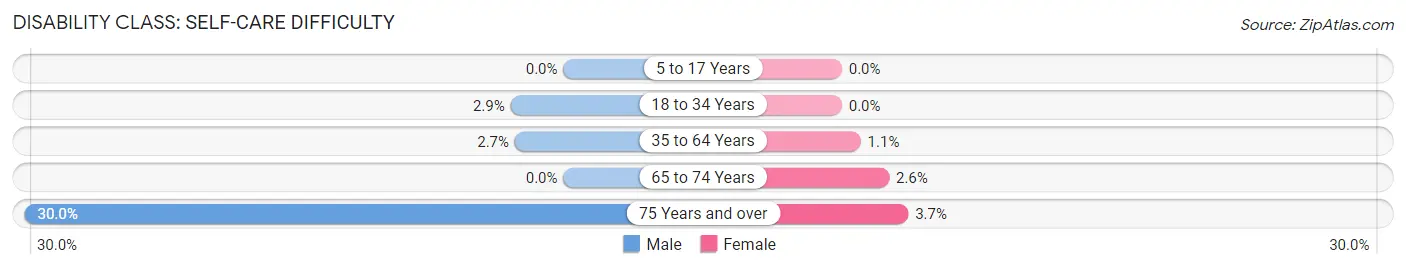
| Age Bracket | Male | Female |
| 5 to 17 Years | 0 (0.0%) | 0 (0.0%) |
| 18 to 34 Years | 8 (2.9%) | 0 (0.0%) |
| 35 to 64 Years | 17 (2.7%) | 6 (1.1%) |
| 65 to 74 Years | 0 (0.0%) | 2 (2.6%) |
| 75 Years and over | 3 (30.0%) | 2 (3.7%) |
Technology Access in Blue Mound
Computing Device Access in Blue Mound
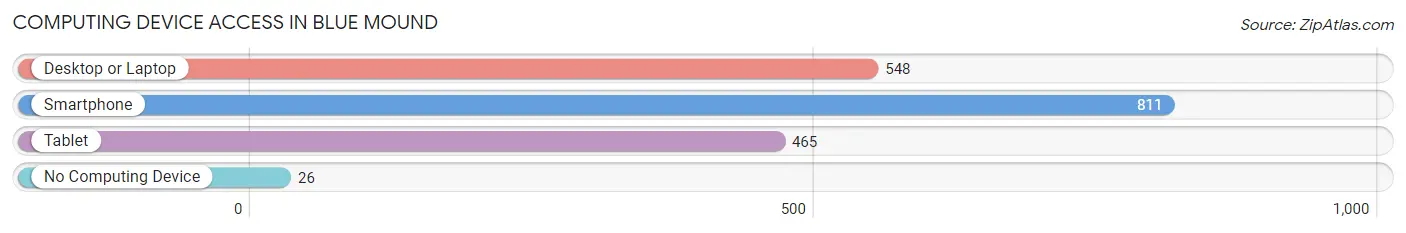
| Device Type | # Households | % Households |
| Desktop or Laptop | 548 | 62.3% |
| Smartphone | 811 | 92.2% |
| Tablet | 465 | 52.8% |
| No Computing Device | 26 | 2.9% |
| Total | 880 | 100.0% |
Internet Access in Blue Mound
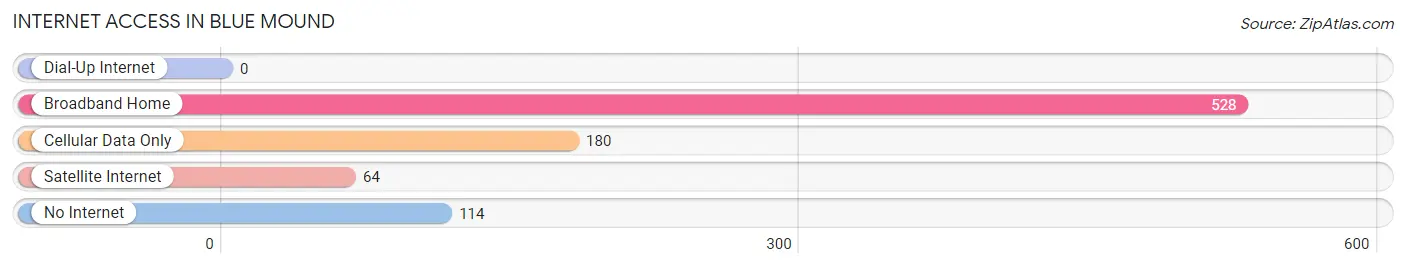
| Internet Type | # Households | % Households |
| Dial-Up Internet | 0 | 0.0% |
| Broadband Home | 528 | 60.0% |
| Cellular Data Only | 180 | 20.4% |
| Satellite Internet | 64 | 7.3% |
| No Internet | 114 | 13.0% |
| Total | 880 | 100.0% |
Blue Mound Summary
Blue Mound, Texas is a small town located in Tarrant County, Texas. It is situated in the northwest corner of the county, just south of the city of Fort Worth. The town was founded in 1881 and has a population of approximately 1,500 people.
Geography
Blue Mound is located in the northwest corner of Tarrant County, Texas. It is situated on the western edge of the Fort Worth metropolitan area. The town is bordered by the cities of Fort Worth, Haslet, and Saginaw. The town is located on the western edge of the Blackland Prairie, a region of Texas known for its rich soil and agricultural production. The town is situated on a hill, giving it its name. The elevation of the town is 830 feet above sea level.
The town is served by two major highways, Interstate 35W and U.S. Highway 287. The town is also served by the Fort Worth International Airport, which is located approximately 20 miles away.
Climate
Blue Mound has a humid subtropical climate, with hot summers and mild winters. The average high temperature in the summer is around 95 degrees Fahrenheit, while the average low temperature in the winter is around 40 degrees Fahrenheit. The town receives an average of 37 inches of precipitation per year.
Demographics
As of the 2010 census, the population of Blue Mound was 1,521. The racial makeup of the town was 94.3% White, 1.2% African American, 0.3% Native American, 0.7% Asian, 0.1% Pacific Islander, 1.7% from other races, and 1.9% from two or more races. Hispanic or Latino of any race were 4.2% of the population.
Economy
The economy of Blue Mound is largely based on agriculture. The town is home to several farms, which produce a variety of crops, including corn, wheat, and hay. The town is also home to several small businesses, including a grocery store, a hardware store, and a restaurant.
The town is also home to several manufacturing companies, including a plastics manufacturer and a metal fabrication company. The town is also home to a number of oil and gas companies, which are involved in the exploration and production of oil and gas in the area.
Education
Blue Mound is served by the Northwest Independent School District. The town is home to one elementary school, one middle school, and one high school. The town is also home to a branch of Tarrant County College, which offers a variety of courses and programs.
Conclusion
Blue Mound, Texas is a small town located in Tarrant County, Texas. It is situated in the northwest corner of the county, just south of the city of Fort Worth. The town was founded in 1881 and has a population of approximately 1,500 people. The town is largely agricultural, with several farms producing a variety of crops. The town is also home to several small businesses, manufacturing companies, and oil and gas companies. The town is served by the Northwest Independent School District, which includes one elementary school, one middle school, and one high school.
Common Questions
What is Per Capita Income in Blue Mound?
Per Capita income in Blue Mound is $29,221.
What is the Median Family Income in Blue Mound?
Median Family Income in Blue Mound is $72,131.
What is the Median Household income in Blue Mound?
Median Household Income in Blue Mound is $68,500.
What is Income or Wage Gap in Blue Mound?
Income or Wage Gap in Blue Mound is 37.0%.
Women in Blue Mound earn 63.0 cents for every dollar earned by a man.
What is Family Income Deficit in Blue Mound?
Family Income Deficit in Blue Mound is $9,900.
Families that are below poverty line in Blue Mound earn $9,900 less on average than the poverty threshold level.
What is Inequality or Gini Index in Blue Mound?
Inequality or Gini Index in Blue Mound is 0.35.
What is the Total Population of Blue Mound?
Total Population of Blue Mound is 2,622.
What is the Total Male Population of Blue Mound?
Total Male Population of Blue Mound is 1,408.
What is the Total Female Population of Blue Mound?
Total Female Population of Blue Mound is 1,214.
What is the Ratio of Males per 100 Females in Blue Mound?
There are 115.98 Males per 100 Females in Blue Mound.
What is the Ratio of Females per 100 Males in Blue Mound?
There are 86.22 Females per 100 Males in Blue Mound.
What is the Median Population Age in Blue Mound?
Median Population Age in Blue Mound is 37.6 Years.
What is the Average Family Size in Blue Mound
Average Family Size in Blue Mound is 3.4 People.
What is the Average Household Size in Blue Mound
Average Household Size in Blue Mound is 3.0 People.
How Large is the Labor Force in Blue Mound?
There are 1,337 People in the Labor Forcein in Blue Mound.
What is the Percentage of People in the Labor Force in Blue Mound?
66.3% of People are in the Labor Force in Blue Mound.
What is the Unemployment Rate in Blue Mound?
Unemployment Rate in Blue Mound is 4.0%.