Blooming Grove, TX Map & Demographics
Blooming Grove Map
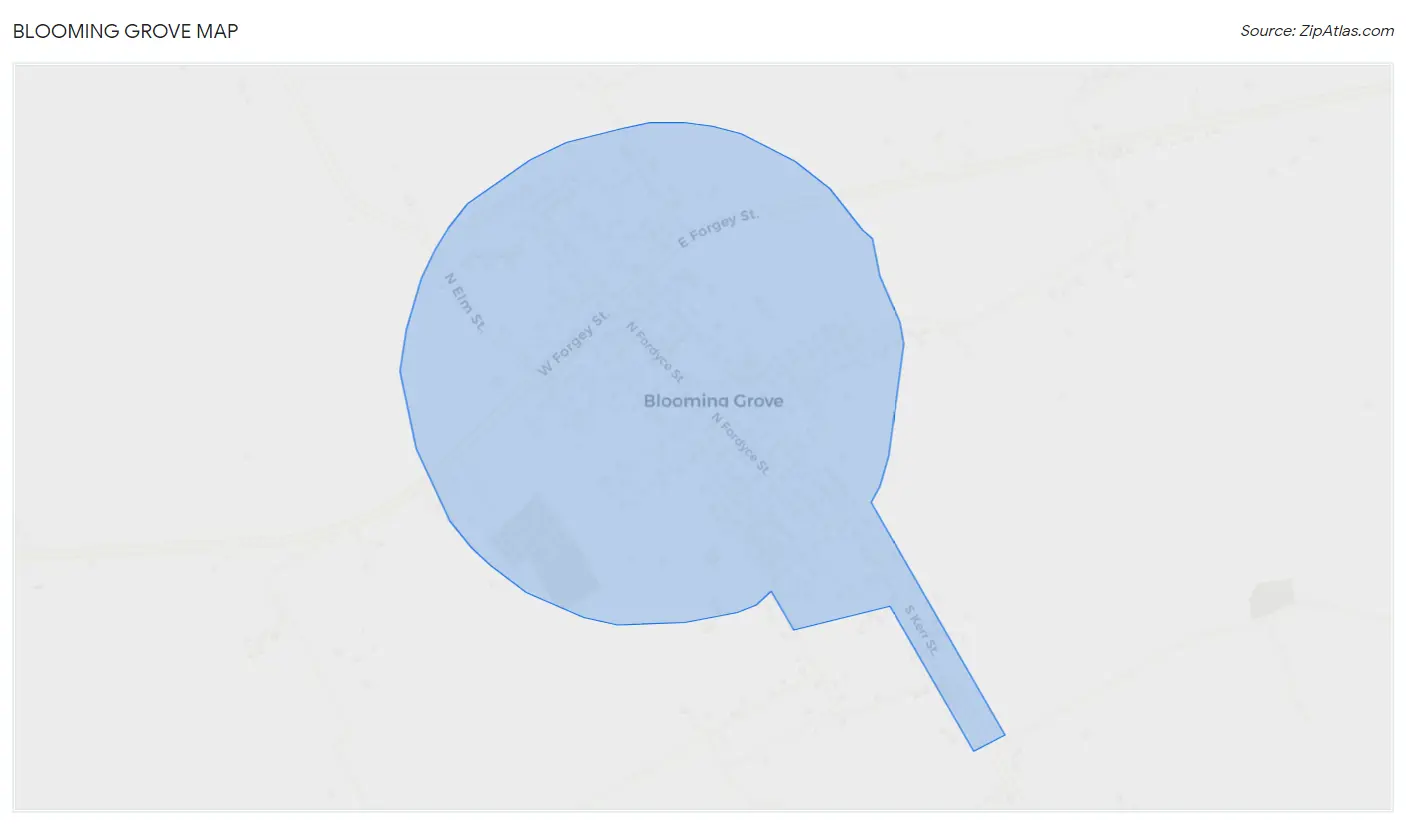
Blooming Grove Overview
$38,145
PER CAPITA INCOME
$86,250
AVG FAMILY INCOME
$68,125
AVG HOUSEHOLD INCOME
57.5%
WAGE / INCOME GAP [ % ]
42.5¢/ $1
WAGE / INCOME GAP [ $ ]
0.52
INEQUALITY / GINI INDEX
764
TOTAL POPULATION
355
MALE POPULATION
409
FEMALE POPULATION
86.80
MALES / 100 FEMALES
115.21
FEMALES / 100 MALES
35.0
MEDIAN AGE
3.0
AVG FAMILY SIZE
2.5
AVG HOUSEHOLD SIZE
360
LABOR FORCE [ PEOPLE ]
60.7%
PERCENT IN LABOR FORCE
4.2%
UNEMPLOYMENT RATE
Blooming Grove Zip Codes
Blooming Grove Area Codes
Income in Blooming Grove
Income Overview in Blooming Grove
Per Capita Income in Blooming Grove is $38,145, while median incomes of families and households are $86,250 and $68,125 respectively.
| Characteristic | Number | Measure |
| Per Capita Income | 764 | $38,145 |
| Median Family Income | 216 | $86,250 |
| Mean Family Income | 216 | $113,819 |
| Median Household Income | 303 | $68,125 |
| Mean Household Income | 303 | $94,652 |
| Income Deficit | 216 | $0 |
| Wage / Income Gap (%) | 764 | 57.49% |
| Wage / Income Gap ($) | 764 | 42.51¢ per $1 |
| Gini / Inequality Index | 764 | 0.52 |
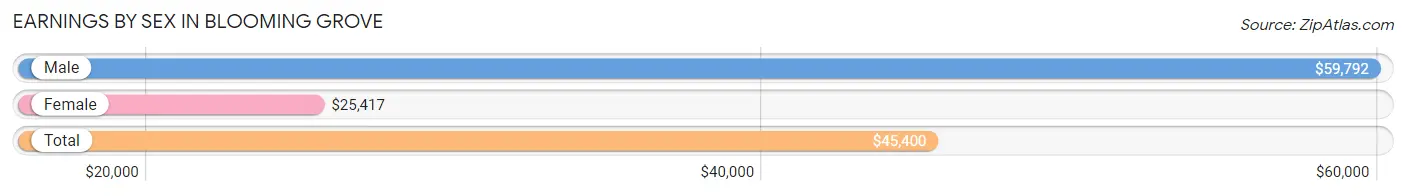
Earnings by Sex in Blooming Grove
Average Earnings in Blooming Grove are $45,400, $59,792 for men and $25,417 for women, a difference of 57.5%.
| Sex | Number | Average Earnings |
| Male | 205 (55.1%) | $59,792 |
| Female | 167 (44.9%) | $25,417 |
| Total | 372 (100.0%) | $45,400 |
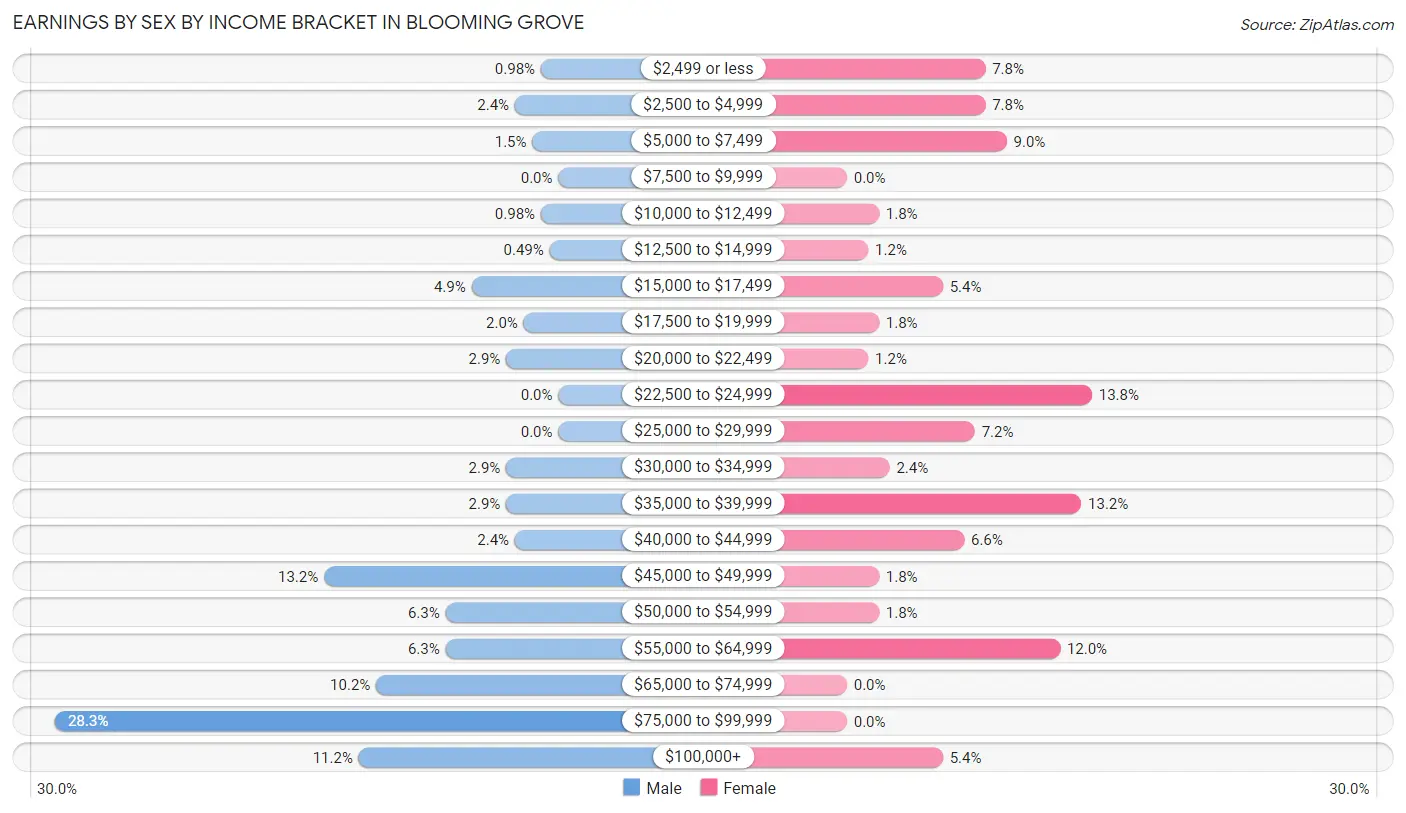
Earnings by Sex by Income Bracket in Blooming Grove
The most common earnings brackets in Blooming Grove are $75,000 to $99,999 for men (58 | 28.3%) and $22,500 to $24,999 for women (23 | 13.8%).
| Income | Male | Female |
| $2,499 or less | 2 (1.0%) | 13 (7.8%) |
| $2,500 to $4,999 | 5 (2.4%) | 13 (7.8%) |
| $5,000 to $7,499 | 3 (1.5%) | 15 (9.0%) |
| $7,500 to $9,999 | 0 (0.0%) | 0 (0.0%) |
| $10,000 to $12,499 | 2 (1.0%) | 3 (1.8%) |
| $12,500 to $14,999 | 1 (0.5%) | 2 (1.2%) |
| $15,000 to $17,499 | 10 (4.9%) | 9 (5.4%) |
| $17,500 to $19,999 | 4 (1.9%) | 3 (1.8%) |
| $20,000 to $22,499 | 6 (2.9%) | 2 (1.2%) |
| $22,500 to $24,999 | 0 (0.0%) | 23 (13.8%) |
| $25,000 to $29,999 | 0 (0.0%) | 12 (7.2%) |
| $30,000 to $34,999 | 6 (2.9%) | 4 (2.4%) |
| $35,000 to $39,999 | 6 (2.9%) | 22 (13.2%) |
| $40,000 to $44,999 | 5 (2.4%) | 11 (6.6%) |
| $45,000 to $49,999 | 27 (13.2%) | 3 (1.8%) |
| $50,000 to $54,999 | 13 (6.3%) | 3 (1.8%) |
| $55,000 to $64,999 | 13 (6.3%) | 20 (12.0%) |
| $65,000 to $74,999 | 21 (10.2%) | 0 (0.0%) |
| $75,000 to $99,999 | 58 (28.3%) | 0 (0.0%) |
| $100,000+ | 23 (11.2%) | 9 (5.4%) |
| Total | 205 (100.0%) | 167 (100.0%) |
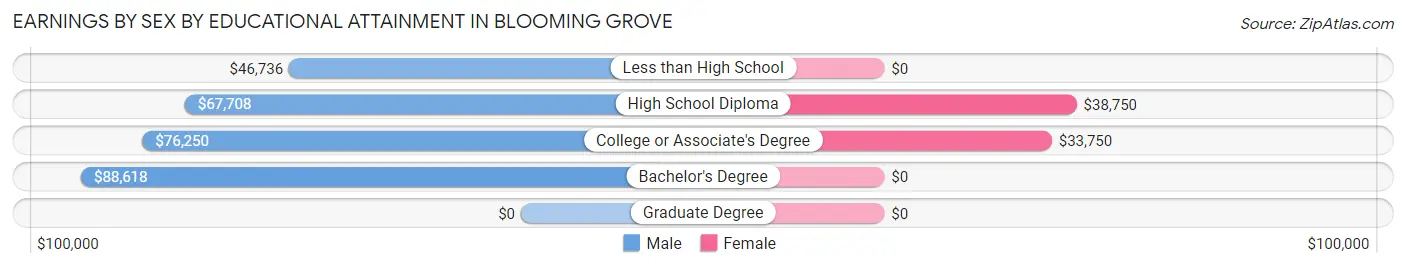
Earnings by Sex by Educational Attainment in Blooming Grove
Average earnings in Blooming Grove are $69,688 for men and $28,889 for women, a difference of 58.6%. Men with an educational attainment of bachelor's degree enjoy the highest average annual earnings of $88,618, while those with less than high school education earn the least with $46,736. Women with an educational attainment of high school diploma earn the most with the average annual earnings of $38,750, while those with college or associate's degree education have the smallest earnings of $33,750.
| Educational Attainment | Male Income | Female Income |
| Less than High School | $46,736 | $0 |
| High School Diploma | $67,708 | $38,750 |
| College or Associate's Degree | $76,250 | $33,750 |
| Bachelor's Degree | $88,618 | $0 |
| Graduate Degree | - | - |
| Total | $69,688 | $28,889 |
Family Income in Blooming Grove
Family Income Brackets in Blooming Grove
According to the Blooming Grove family income data, there are 56 families falling into the $100,000 to $149,999 income range, which is the most common income bracket and makes up 25.9% of all families.
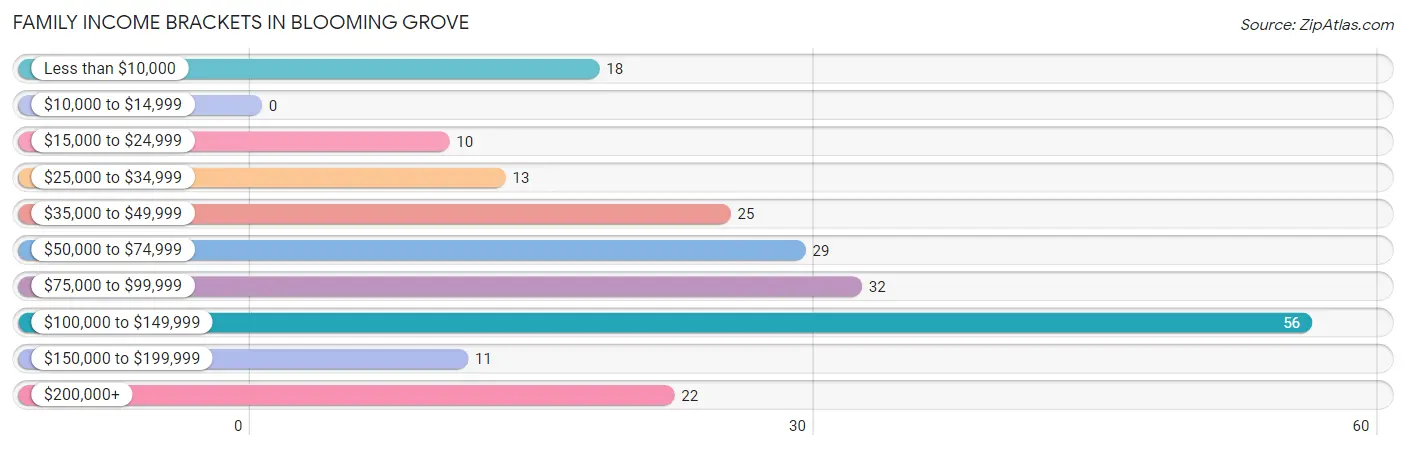
| Income Bracket | # Families | % Families |
| Less than $10,000 | 18 | 8.3% |
| $10,000 to $14,999 | 0 | 0.0% |
| $15,000 to $24,999 | 10 | 4.6% |
| $25,000 to $34,999 | 13 | 6.0% |
| $35,000 to $49,999 | 25 | 11.6% |
| $50,000 to $74,999 | 29 | 13.4% |
| $75,000 to $99,999 | 32 | 14.8% |
| $100,000 to $149,999 | 56 | 25.9% |
| $150,000 to $199,999 | 11 | 5.1% |
| $200,000+ | 22 | 10.2% |
Family Income by Famaliy Size in Blooming Grove
4-person families (13 | 6.0%) account for the highest median family income in Blooming Grove with $135,417 per family, while 3-person families (78 | 36.1%) have the highest median income of $37,675 per family member.
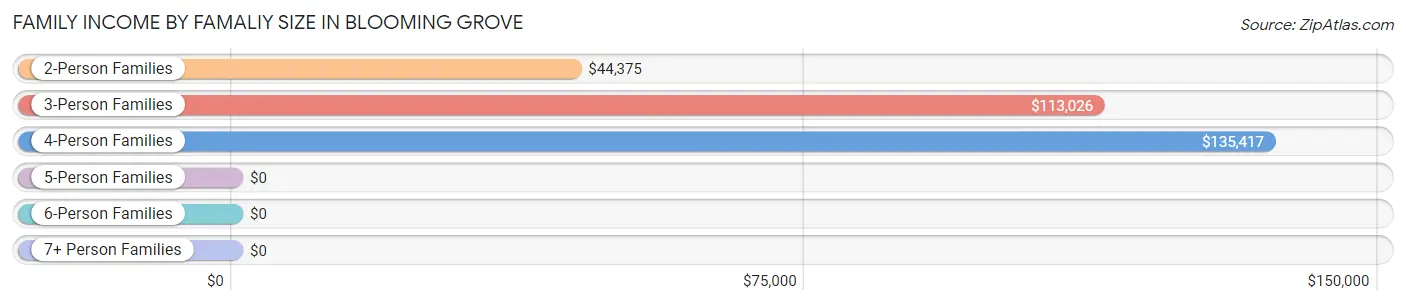
| Income Bracket | # Families | Median Income |
| 2-Person Families | 105 (48.6%) | $44,375 |
| 3-Person Families | 78 (36.1%) | $113,026 |
| 4-Person Families | 13 (6.0%) | $135,417 |
| 5-Person Families | 13 (6.0%) | $0 |
| 6-Person Families | 0 (0.0%) | $0 |
| 7+ Person Families | 7 (3.2%) | $0 |
| Total | 216 (100.0%) | $86,250 |
Family Income by Number of Earners in Blooming Grove
The median family income in Blooming Grove is $86,250, with families comprising 3+ earners (17) having the highest median family income of $145,139, while families with no earners (43) have the lowest median family income of $30,417, accounting for 7.9% and 19.9% of families, respectively.
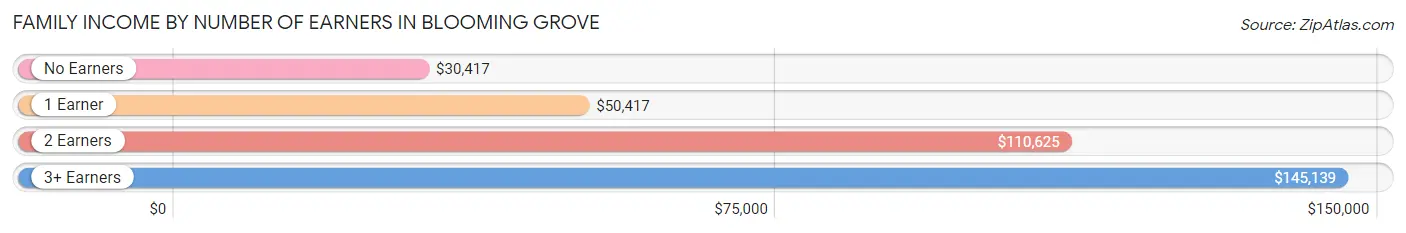
| Number of Earners | # Families | Median Income |
| No Earners | 43 (19.9%) | $30,417 |
| 1 Earner | 61 (28.2%) | $50,417 |
| 2 Earners | 95 (44.0%) | $110,625 |
| 3+ Earners | 17 (7.9%) | $145,139 |
| Total | 216 (100.0%) | $86,250 |
Household Income in Blooming Grove
Household Income Brackets in Blooming Grove
With 58 households falling in the category, the $100,000 to $149,999 income range is the most frequent in Blooming Grove, accounting for 19.1% of all households. In contrast, only 14 households (4.6%) fall into the $15,000 to $24,999 income bracket, making it the least populous group.
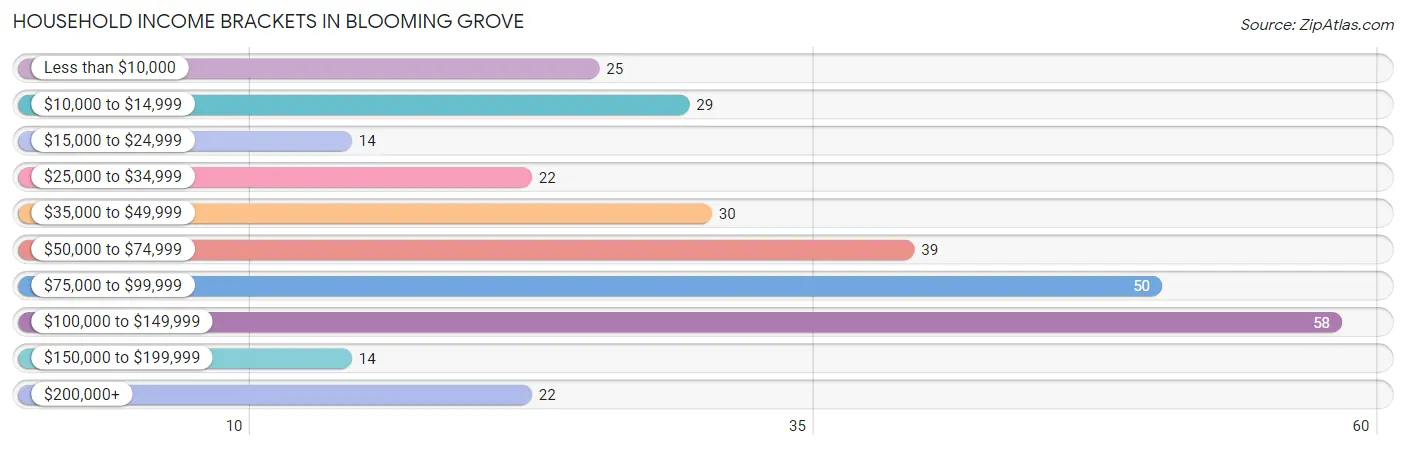
| Income Bracket | # Households | % Households |
| Less than $10,000 | 25 | 8.3% |
| $10,000 to $14,999 | 29 | 9.6% |
| $15,000 to $24,999 | 14 | 4.6% |
| $25,000 to $34,999 | 22 | 7.3% |
| $35,000 to $49,999 | 30 | 9.9% |
| $50,000 to $74,999 | 39 | 12.9% |
| $75,000 to $99,999 | 50 | 16.5% |
| $100,000 to $149,999 | 58 | 19.1% |
| $150,000 to $199,999 | 14 | 4.6% |
| $200,000+ | 22 | 7.3% |
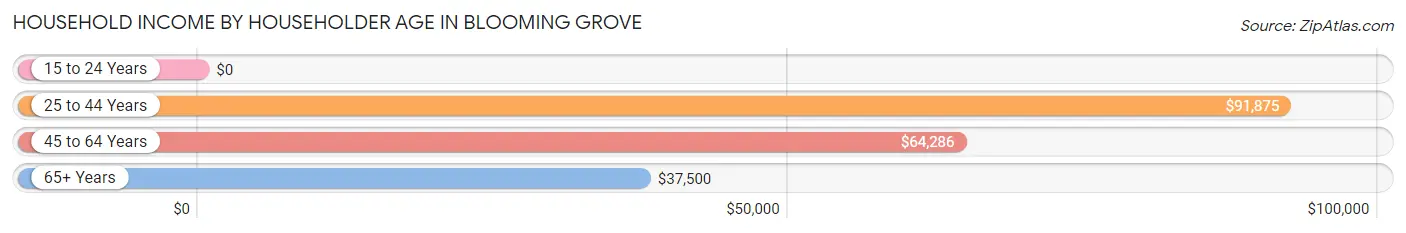
Household Income by Householder Age in Blooming Grove
The median household income in Blooming Grove is $68,125, with the highest median household income of $91,875 found in the 25 to 44 years age bracket for the primary householder. A total of 87 households (28.7%) fall into this category. Meanwhile, the 15 to 24 years age bracket for the primary householder has the lowest median household income of $0, with 2 households (0.7%) in this group.
| Income Bracket | # Households | Median Income |
| 15 to 24 Years | 2 (0.7%) | $0 |
| 25 to 44 Years | 87 (28.7%) | $91,875 |
| 45 to 64 Years | 138 (45.5%) | $64,286 |
| 65+ Years | 76 (25.1%) | $37,500 |
| Total | 303 (100.0%) | $68,125 |
Poverty in Blooming Grove
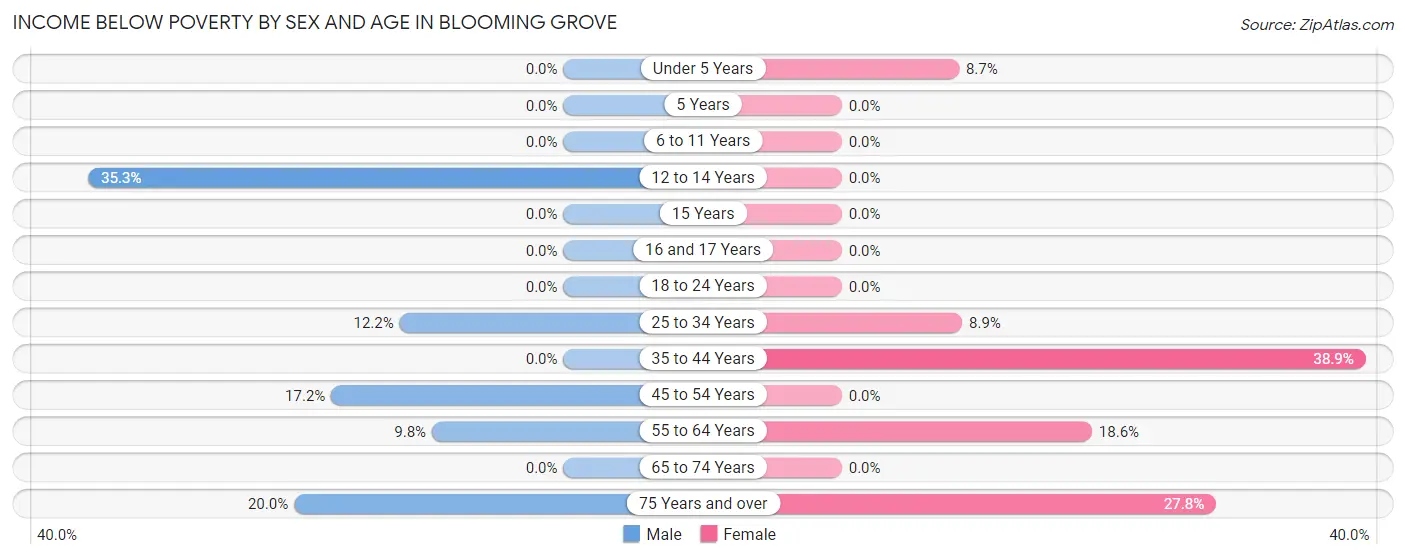
Income Below Poverty by Sex and Age in Blooming Grove
With 8.7% poverty level for males and 11.3% for females among the residents of Blooming Grove, 12 to 14 year old males and 35 to 44 year old females are the most vulnerable to poverty, with 6 males (35.3%) and 14 females (38.9%) in their respective age groups living below the poverty level.
| Age Bracket | Male | Female |
| Under 5 Years | 0 (0.0%) | 4 (8.7%) |
| 5 Years | 0 (0.0%) | 0 (0.0%) |
| 6 to 11 Years | 0 (0.0%) | 0 (0.0%) |
| 12 to 14 Years | 6 (35.3%) | 0 (0.0%) |
| 15 Years | 0 (0.0%) | 0 (0.0%) |
| 16 and 17 Years | 0 (0.0%) | 0 (0.0%) |
| 18 to 24 Years | 0 (0.0%) | 0 (0.0%) |
| 25 to 34 Years | 9 (12.2%) | 5 (8.9%) |
| 35 to 44 Years | 0 (0.0%) | 14 (38.9%) |
| 45 to 54 Years | 10 (17.2%) | 0 (0.0%) |
| 55 to 64 Years | 4 (9.8%) | 13 (18.6%) |
| 65 to 74 Years | 0 (0.0%) | 0 (0.0%) |
| 75 Years and over | 2 (20.0%) | 10 (27.8%) |
| Total | 31 (8.7%) | 46 (11.3%) |
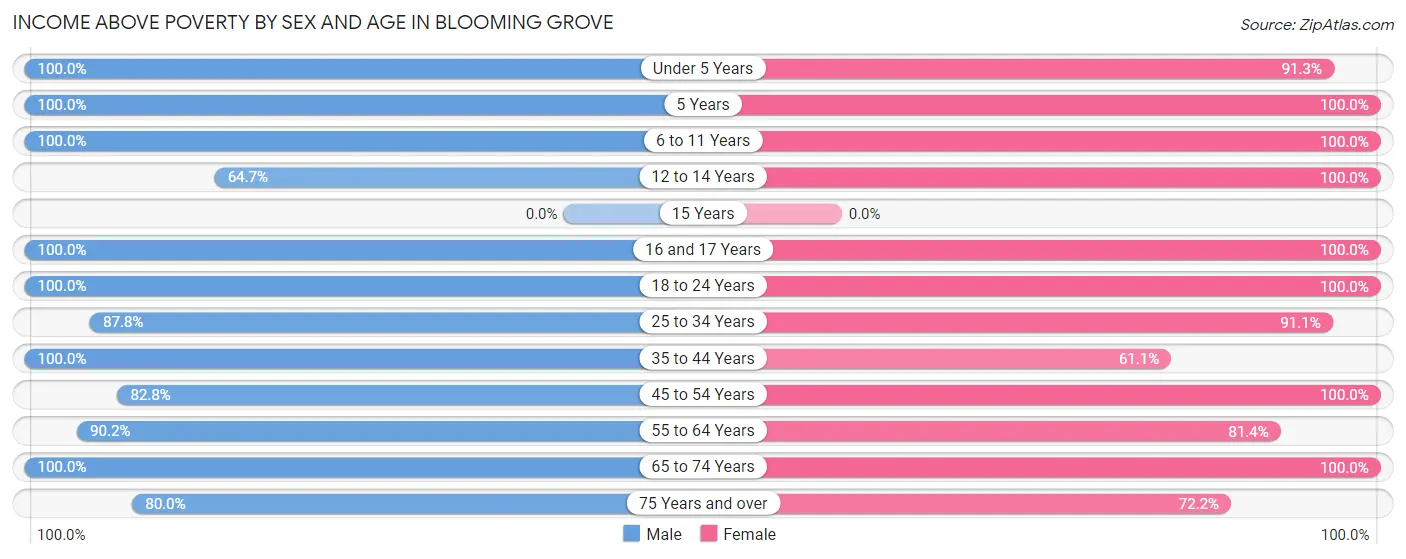
Income Above Poverty by Sex and Age in Blooming Grove
According to the poverty statistics in Blooming Grove, males aged under 5 years and females aged 5 years are the age groups that are most secure financially, with 100.0% of males and 100.0% of females in these age groups living above the poverty line.
| Age Bracket | Male | Female |
| Under 5 Years | 32 (100.0%) | 42 (91.3%) |
| 5 Years | 3 (100.0%) | 3 (100.0%) |
| 6 to 11 Years | 7 (100.0%) | 49 (100.0%) |
| 12 to 14 Years | 11 (64.7%) | 12 (100.0%) |
| 15 Years | 0 (0.0%) | 0 (0.0%) |
| 16 and 17 Years | 4 (100.0%) | 2 (100.0%) |
| 18 to 24 Years | 56 (100.0%) | 19 (100.0%) |
| 25 to 34 Years | 65 (87.8%) | 51 (91.1%) |
| 35 to 44 Years | 21 (100.0%) | 22 (61.1%) |
| 45 to 54 Years | 48 (82.8%) | 52 (100.0%) |
| 55 to 64 Years | 37 (90.2%) | 57 (81.4%) |
| 65 to 74 Years | 32 (100.0%) | 26 (100.0%) |
| 75 Years and over | 8 (80.0%) | 26 (72.2%) |
| Total | 324 (91.3%) | 361 (88.7%) |
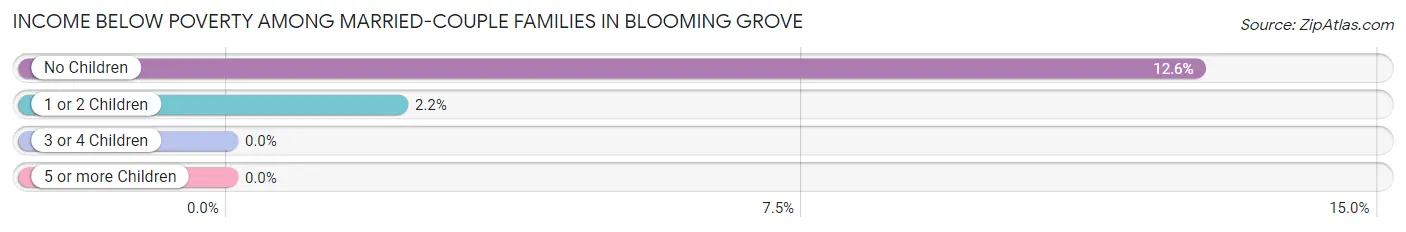
Income Below Poverty Among Married-Couple Families in Blooming Grove
The poverty statistics for married-couple families in Blooming Grove show that 8.4% or 13 of the total 155 families live below the poverty line. Families with no children have the highest poverty rate of 12.6%, comprising of 12 families. On the other hand, families with 3 or 4 children have the lowest poverty rate of 0.0%, which includes 0 families.
| Children | Above Poverty | Below Poverty |
| No Children | 83 (87.4%) | 12 (12.6%) |
| 1 or 2 Children | 44 (97.8%) | 1 (2.2%) |
| 3 or 4 Children | 15 (100.0%) | 0 (0.0%) |
| 5 or more Children | 0 (0.0%) | 0 (0.0%) |
| Total | 142 (91.6%) | 13 (8.4%) |
Income Below Poverty Among Single-Parent Households in Blooming Grove
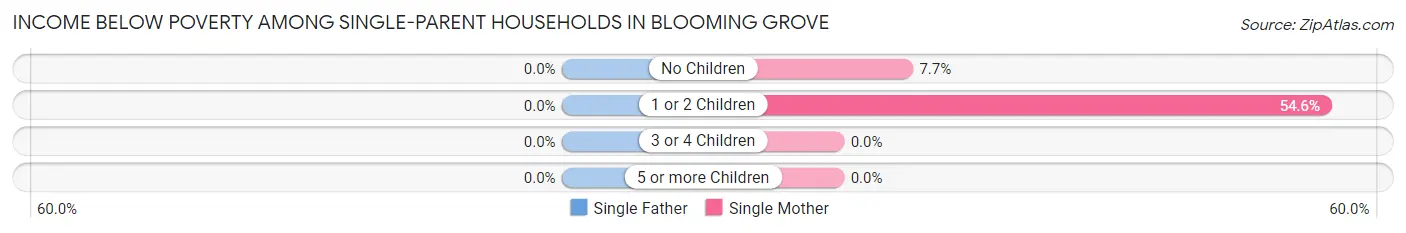
| Children | Single Father | Single Mother |
| No Children | 0 (0.0%) | 3 (7.7%) |
| 1 or 2 Children | 0 (0.0%) | 6 (54.5%) |
| 3 or 4 Children | 0 (0.0%) | 0 (0.0%) |
| 5 or more Children | 0 (0.0%) | 0 (0.0%) |
| Total | 0 (0.0%) | 9 (15.8%) |
Income Below Poverty Among Married-Couple vs Single-Parent Households in Blooming Grove
The poverty data for Blooming Grove shows that 13 of the married-couple family households (8.4%) and 9 of the single-parent households (14.7%) are living below the poverty level. Within the married-couple family households, those with no children have the highest poverty rate, with 12 households (12.6%) falling below the poverty line. Among the single-parent households, those with 1 or 2 children have the highest poverty rate, with 6 household (54.5%) living below poverty.
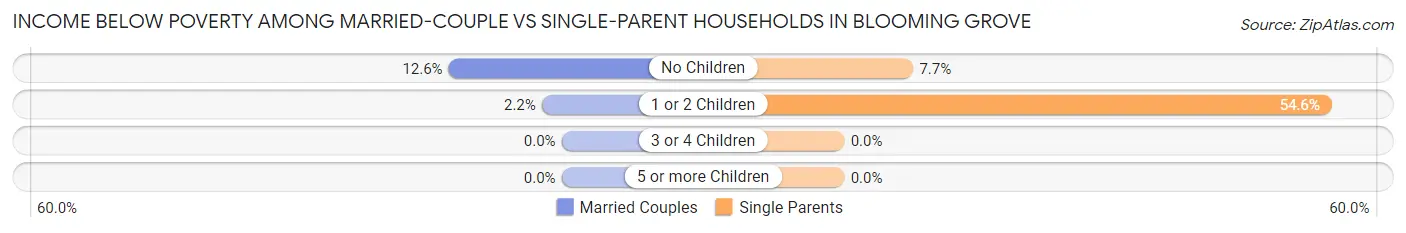
| Children | Married-Couple Families | Single-Parent Households |
| No Children | 12 (12.6%) | 3 (7.7%) |
| 1 or 2 Children | 1 (2.2%) | 6 (54.5%) |
| 3 or 4 Children | 0 (0.0%) | 0 (0.0%) |
| 5 or more Children | 0 (0.0%) | 0 (0.0%) |
| Total | 13 (8.4%) | 9 (14.7%) |
Race in Blooming Grove
The most populous races in Blooming Grove are White / Caucasian (699 | 91.5%), Hispanic or Latino (73 | 9.6%), and Two or more Races (53 | 6.9%).
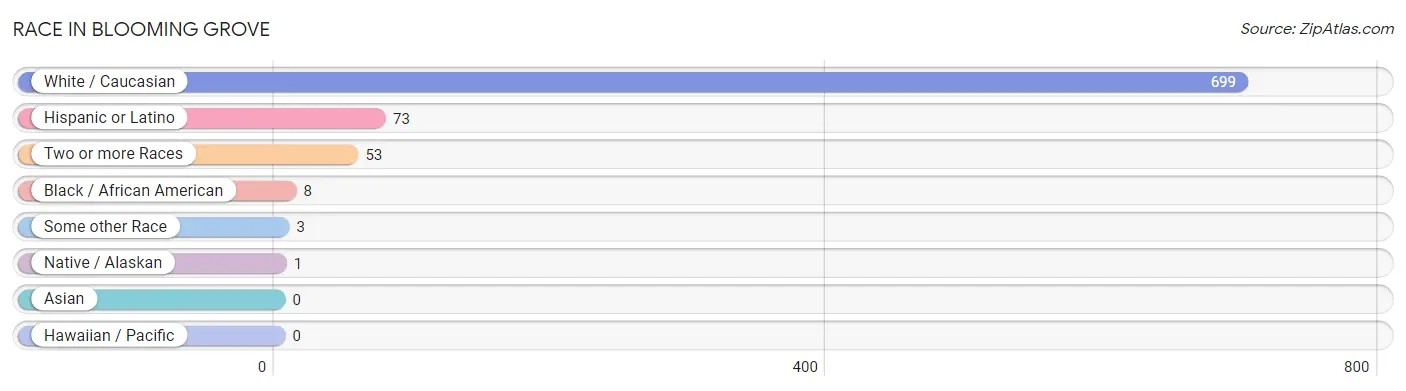
| Race | # Population | % Population |
| Asian | 0 | 0.0% |
| Black / African American | 8 | 1.1% |
| Hawaiian / Pacific | 0 | 0.0% |
| Hispanic or Latino | 73 | 9.6% |
| Native / Alaskan | 1 | 0.1% |
| White / Caucasian | 699 | 91.5% |
| Two or more Races | 53 | 6.9% |
| Some other Race | 3 | 0.4% |
| Total | 764 | 100.0% |
Ancestry in Blooming Grove
The most populous ancestries reported in Blooming Grove are American (90 | 11.8%), Mexican (73 | 9.6%), Irish (66 | 8.6%), German (51 | 6.7%), and Scottish (50 | 6.5%), together accounting for 43.2% of all Blooming Grove residents.
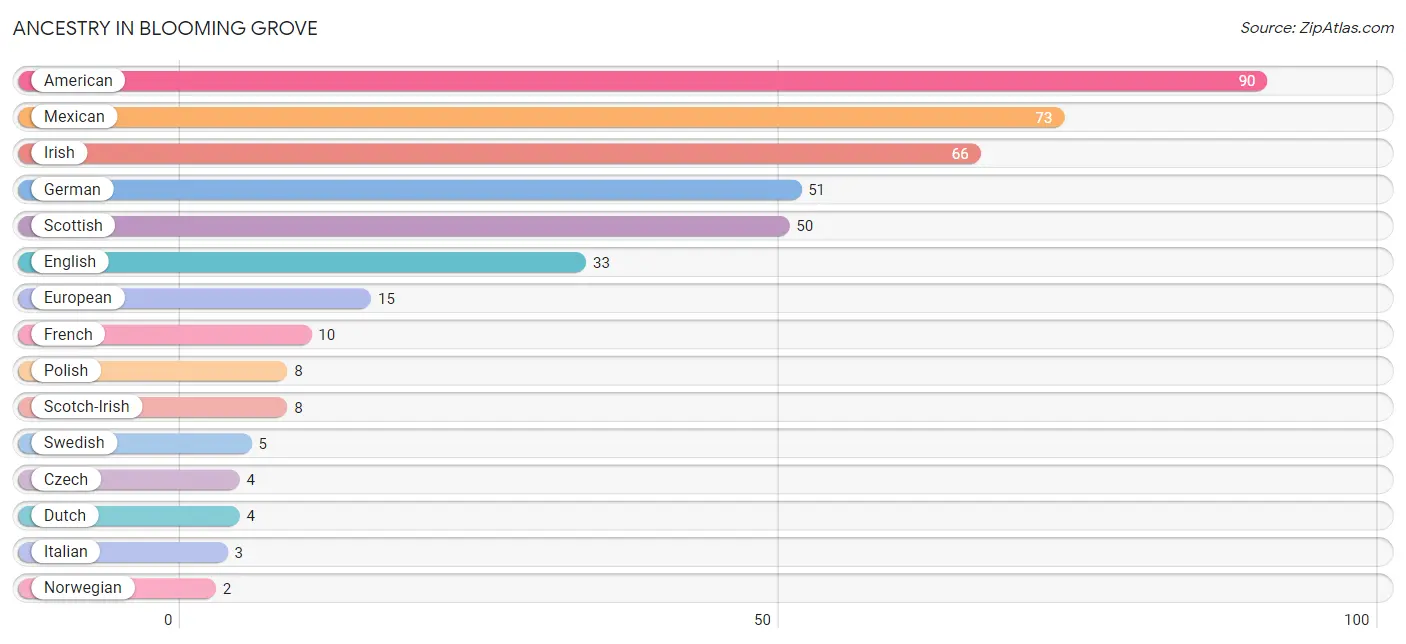
| Ancestry | # Population | % Population |
| American | 90 | 11.8% |
| Cherokee | 1 | 0.1% |
| Czech | 4 | 0.5% |
| Dutch | 4 | 0.5% |
| English | 33 | 4.3% |
| European | 15 | 2.0% |
| French | 10 | 1.3% |
| German | 51 | 6.7% |
| Irish | 66 | 8.6% |
| Italian | 3 | 0.4% |
| Mexican | 73 | 9.6% |
| Norwegian | 2 | 0.3% |
| Polish | 8 | 1.1% |
| Scotch-Irish | 8 | 1.1% |
| Scottish | 50 | 6.5% |
| Swedish | 5 | 0.6% | View All 16 Rows |
Immigrants in Blooming Grove
The most numerous immigrant groups reported in Blooming Grove came from Europe (8 | 1.1%), Germany (7 | 0.9%), Western Europe (7 | 0.9%), Central America (3 | 0.4%), and Latin America (3 | 0.4%), together accounting for 3.7% of all Blooming Grove residents.
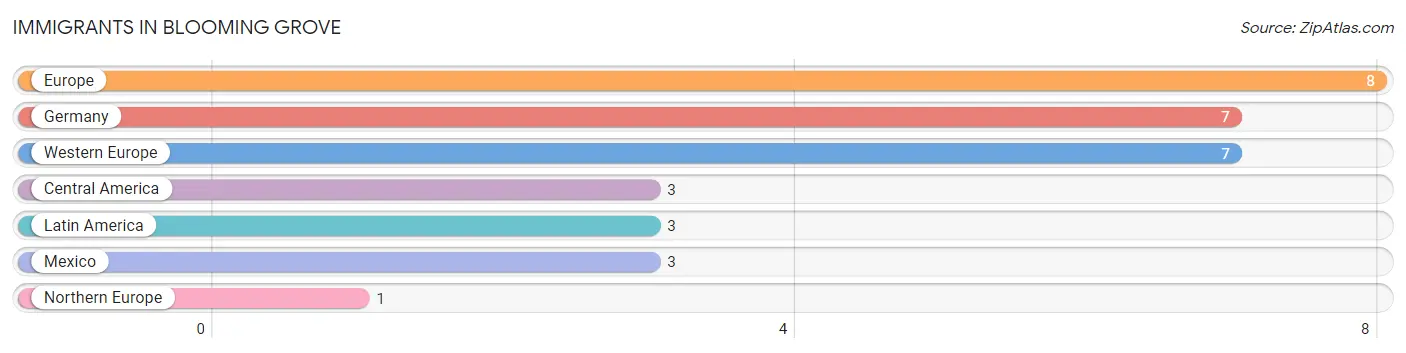
| Immigration Origin | # Population | % Population |
| Central America | 3 | 0.4% |
| Europe | 8 | 1.1% |
| Germany | 7 | 0.9% |
| Latin America | 3 | 0.4% |
| Mexico | 3 | 0.4% |
| Northern Europe | 1 | 0.1% |
| Western Europe | 7 | 0.9% | View All 7 Rows |
Sex and Age in Blooming Grove
Sex and Age in Blooming Grove
The most populous age groups in Blooming Grove are 25 to 29 Years (66 | 18.6%) for men and Under 5 Years (48 | 11.7%) for women.
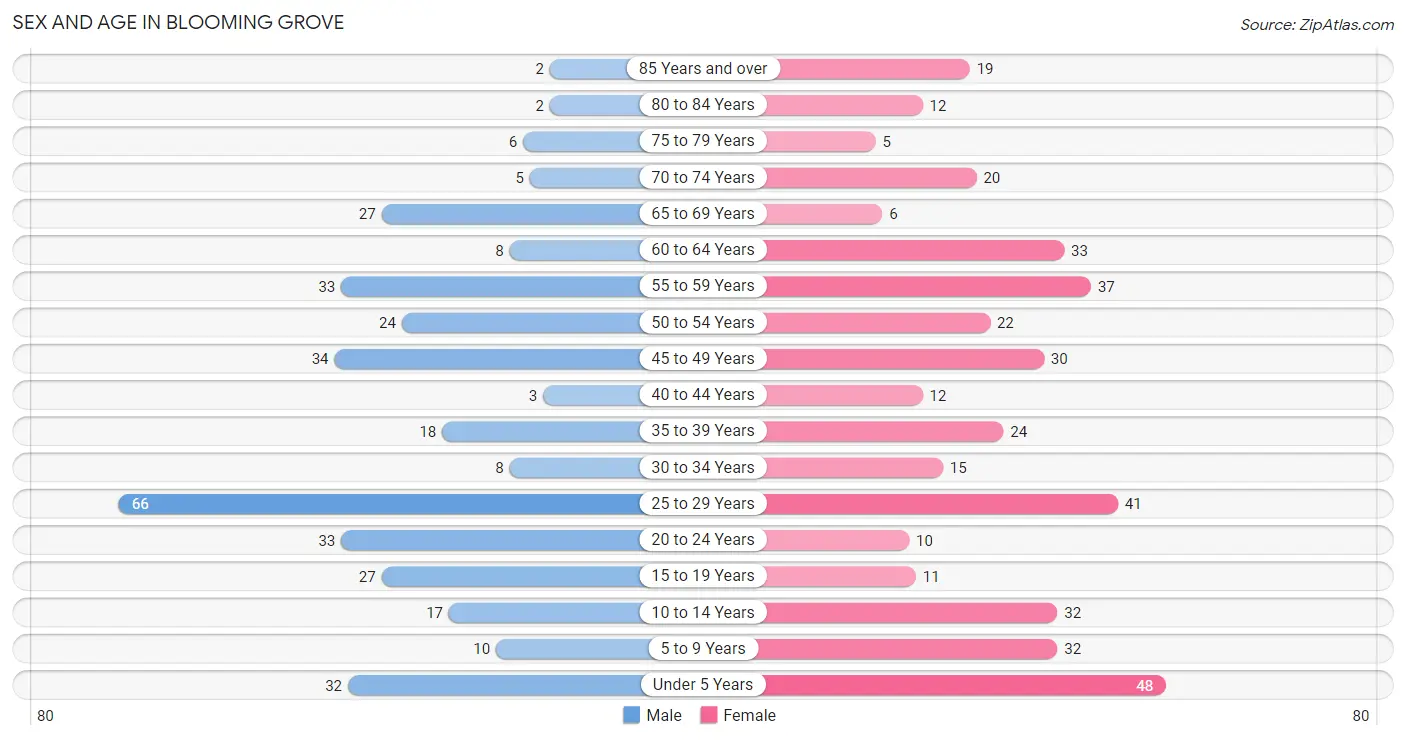
| Age Bracket | Male | Female |
| Under 5 Years | 32 (9.0%) | 48 (11.7%) |
| 5 to 9 Years | 10 (2.8%) | 32 (7.8%) |
| 10 to 14 Years | 17 (4.8%) | 32 (7.8%) |
| 15 to 19 Years | 27 (7.6%) | 11 (2.7%) |
| 20 to 24 Years | 33 (9.3%) | 10 (2.4%) |
| 25 to 29 Years | 66 (18.6%) | 41 (10.0%) |
| 30 to 34 Years | 8 (2.2%) | 15 (3.7%) |
| 35 to 39 Years | 18 (5.1%) | 24 (5.9%) |
| 40 to 44 Years | 3 (0.9%) | 12 (2.9%) |
| 45 to 49 Years | 34 (9.6%) | 30 (7.3%) |
| 50 to 54 Years | 24 (6.8%) | 22 (5.4%) |
| 55 to 59 Years | 33 (9.3%) | 37 (9.0%) |
| 60 to 64 Years | 8 (2.2%) | 33 (8.1%) |
| 65 to 69 Years | 27 (7.6%) | 6 (1.5%) |
| 70 to 74 Years | 5 (1.4%) | 20 (4.9%) |
| 75 to 79 Years | 6 (1.7%) | 5 (1.2%) |
| 80 to 84 Years | 2 (0.6%) | 12 (2.9%) |
| 85 Years and over | 2 (0.6%) | 19 (4.6%) |
| Total | 355 (100.0%) | 409 (100.0%) |
Families and Households in Blooming Grove
Median Family Size in Blooming Grove
The median family size in Blooming Grove is 3.04 persons per family, with single female/mother families (57 | 26.4%) accounting for the largest median family size of 3.72 persons per family. On the other hand, married-couple families (155 | 71.8%) represent the smallest median family size with 2.79 persons per family.
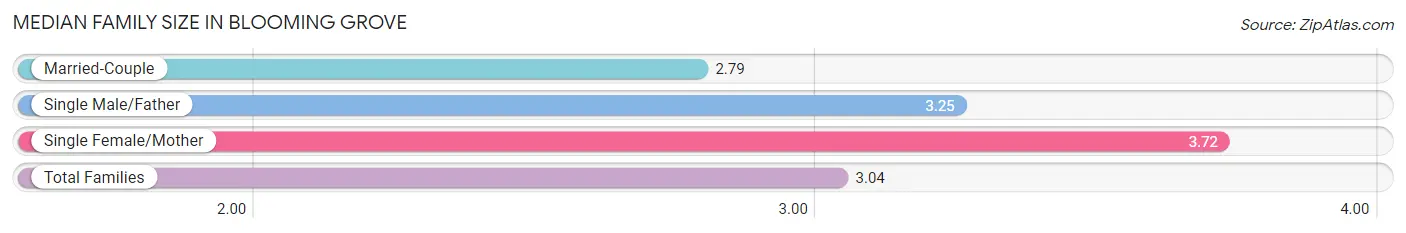
| Family Type | # Families | Family Size |
| Married-Couple | 155 (71.8%) | 2.79 |
| Single Male/Father | 4 (1.8%) | 3.25 |
| Single Female/Mother | 57 (26.4%) | 3.72 |
| Total Families | 216 (100.0%) | 3.04 |
Median Household Size in Blooming Grove
The median household size in Blooming Grove is 2.52 persons per household, with single male/father households (4 | 1.3%) accounting for the largest median household size of 4 persons per household. non-family households (87 | 28.7%) represent the smallest median household size with 1.10 persons per household.
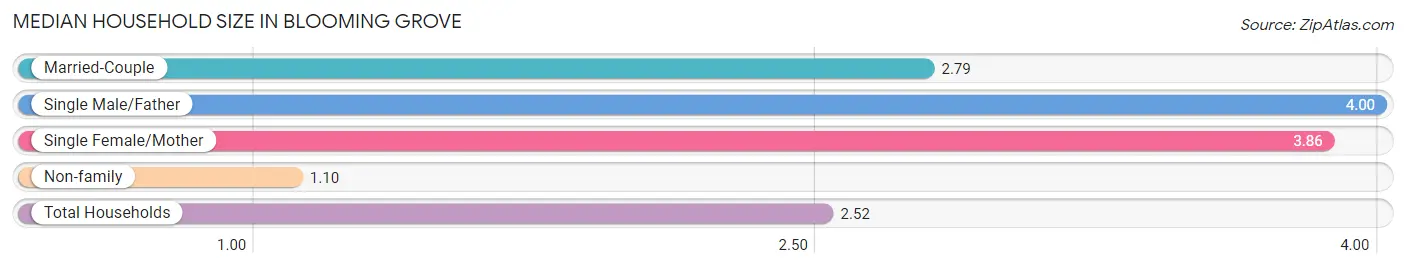
| Household Type | # Households | Household Size |
| Married-Couple | 155 (51.2%) | 2.79 |
| Single Male/Father | 4 (1.3%) | 4.00 |
| Single Female/Mother | 57 (18.8%) | 3.86 |
| Non-family | 87 (28.7%) | 1.10 |
| Total Households | 303 (100.0%) | 2.52 |
Household Size by Marriage Status in Blooming Grove
Out of a total of 303 households in Blooming Grove, 216 (71.3%) are family households, while 87 (28.7%) are nonfamily households. The most numerous type of family households are 2-person households, comprising 101, and the most common type of nonfamily households are 1-person households, comprising 81.
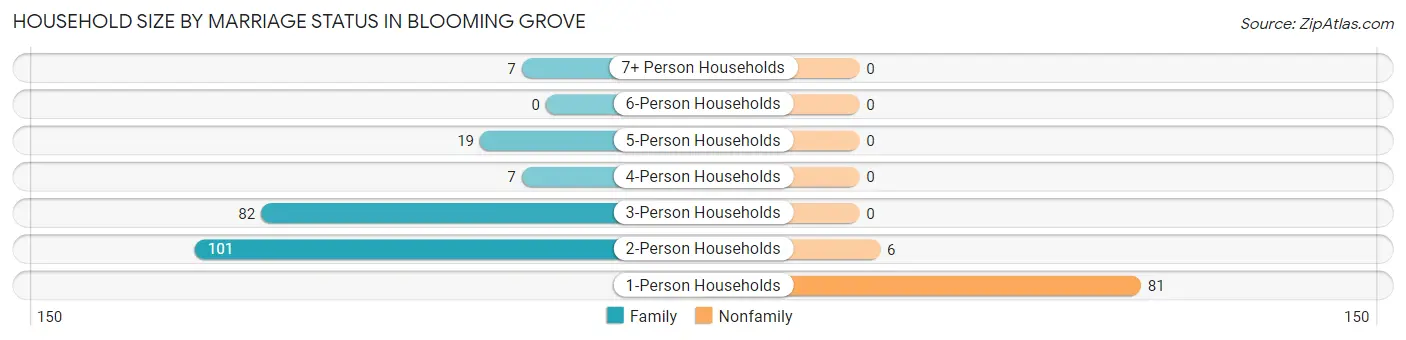
| Household Size | Family Households | Nonfamily Households |
| 1-Person Households | - | 81 (26.7%) |
| 2-Person Households | 101 (33.3%) | 6 (2.0%) |
| 3-Person Households | 82 (27.1%) | 0 (0.0%) |
| 4-Person Households | 7 (2.3%) | 0 (0.0%) |
| 5-Person Households | 19 (6.3%) | 0 (0.0%) |
| 6-Person Households | 0 (0.0%) | 0 (0.0%) |
| 7+ Person Households | 7 (2.3%) | 0 (0.0%) |
| Total | 216 (71.3%) | 87 (28.7%) |
Female Fertility in Blooming Grove
Fertility by Age in Blooming Grove
Average fertility rate in Blooming Grove is 35.0 births per 1,000 women. Women in the age bracket of 20 to 34 years have the highest fertility rate with 76.0 births per 1,000 women. Women in the age bracket of 20 to 34 years acount for 100.0% of all women with births.
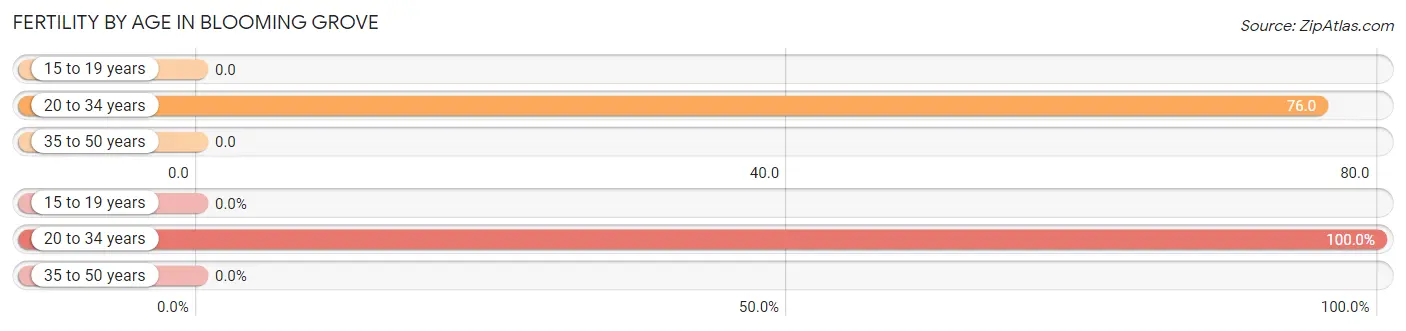
| Age Bracket | Women with Births | Births / 1,000 Women |
| 15 to 19 years | 0 (0.0%) | 0.0 |
| 20 to 34 years | 5 (100.0%) | 76.0 |
| 35 to 50 years | 0 (0.0%) | 0.0 |
| Total | 5 (100.0%) | 35.0 |
Fertility by Age by Marriage Status in Blooming Grove
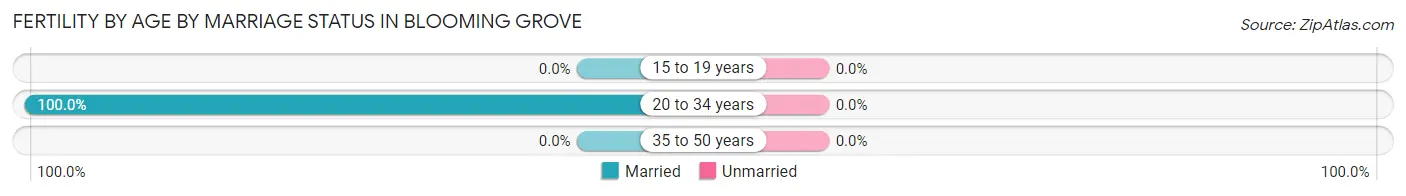
| Age Bracket | Married | Unmarried |
| 15 to 19 years | 0 (0.0%) | 0 (0.0%) |
| 20 to 34 years | 5 (100.0%) | 0 (0.0%) |
| 35 to 50 years | 0 (0.0%) | 0 (0.0%) |
| Total | 5 (100.0%) | 0 (0.0%) |
Fertility by Education in Blooming Grove
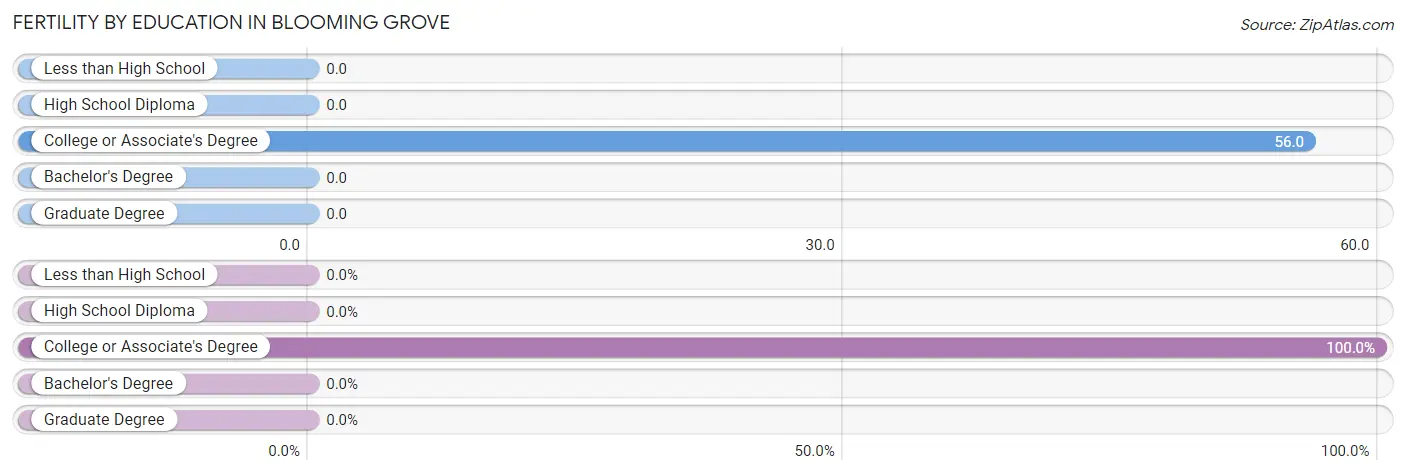
| Educational Attainment | Women with Births | Births / 1,000 Women |
| Less than High School | 0 (0.0%) | 0.0 |
| High School Diploma | 0 (0.0%) | 0.0 |
| College or Associate's Degree | 5 (100.0%) | 56.0 |
| Bachelor's Degree | 0 (0.0%) | 0.0 |
| Graduate Degree | 0 (0.0%) | 0.0 |
| Total | 5 (100.0%) | 35.0 |
Fertility by Education by Marriage Status in Blooming Grove
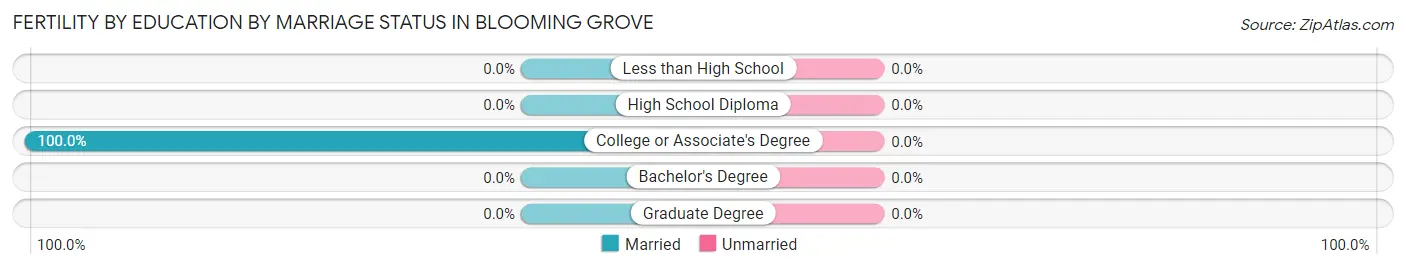
| Educational Attainment | Married | Unmarried |
| Less than High School | 0 (0.0%) | 0 (0.0%) |
| High School Diploma | 0 (0.0%) | 0 (0.0%) |
| College or Associate's Degree | 5 (100.0%) | 0 (0.0%) |
| Bachelor's Degree | 0 (0.0%) | 0 (0.0%) |
| Graduate Degree | 0 (0.0%) | 0 (0.0%) |
| Total | 5 (100.0%) | 0 (0.0%) |
Employment Characteristics in Blooming Grove
Employment by Class of Employer in Blooming Grove
Among the 345 employed individuals in Blooming Grove, private company employees (251 | 72.8%), local government employees (35 | 10.1%), and self-employed (not incorporated) (31 | 9.0%) make up the most common classes of employment.
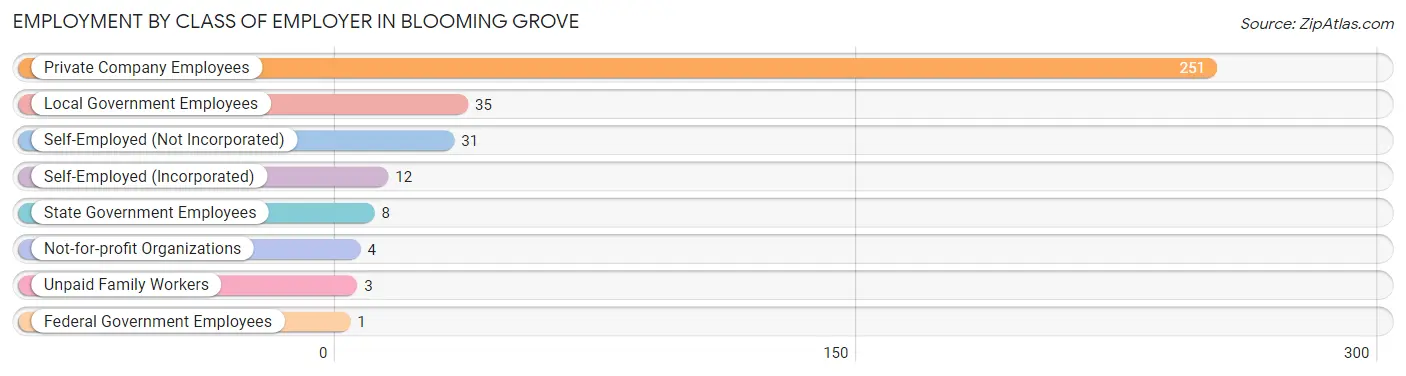
| Employer Class | # Employees | % Employees |
| Private Company Employees | 251 | 72.8% |
| Self-Employed (Incorporated) | 12 | 3.5% |
| Self-Employed (Not Incorporated) | 31 | 9.0% |
| Not-for-profit Organizations | 4 | 1.2% |
| Local Government Employees | 35 | 10.1% |
| State Government Employees | 8 | 2.3% |
| Federal Government Employees | 1 | 0.3% |
| Unpaid Family Workers | 3 | 0.9% |
| Total | 345 | 100.0% |
Employment Status by Age in Blooming Grove
According to the labor force statistics for Blooming Grove, out of the total population over 16 years of age (593), 60.7% or 360 individuals are in the labor force, with 4.2% or 15 of them unemployed. The age group with the highest labor force participation rate is 25 to 29 years, with 96.3% or 103 individuals in the labor force. Within the labor force, the 35 to 44 years age range has the highest percentage of unemployed individuals, with 19.0% or 8 of them being unemployed.
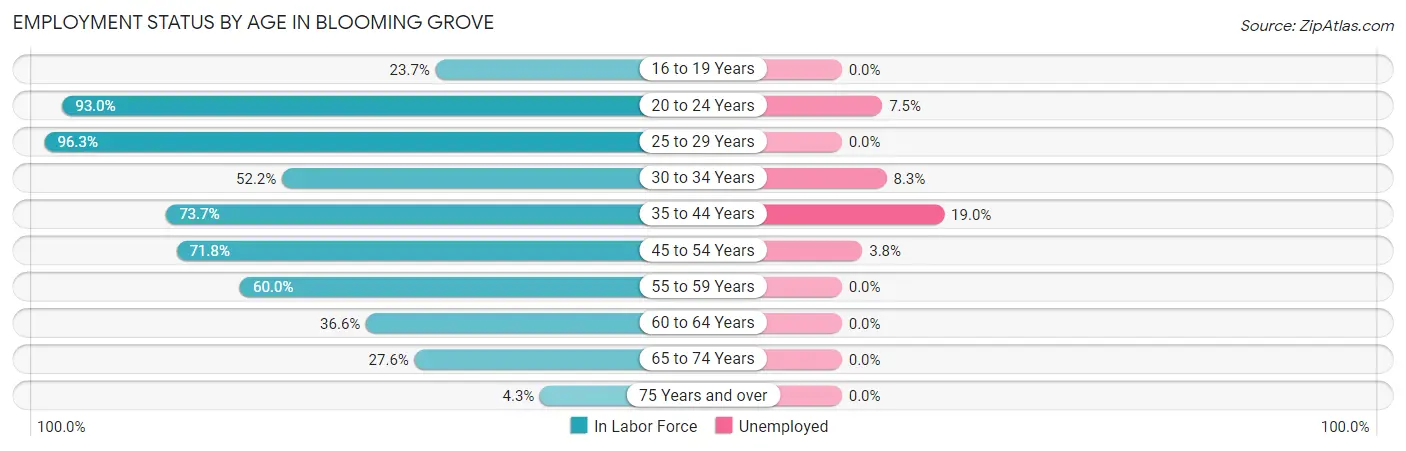
| Age Bracket | In Labor Force | Unemployed |
| 16 to 19 Years | 9 (23.7%) | 0 (0.0%) |
| 20 to 24 Years | 40 (93.0%) | 3 (7.5%) |
| 25 to 29 Years | 103 (96.3%) | 0 (0.0%) |
| 30 to 34 Years | 12 (52.2%) | 1 (8.3%) |
| 35 to 44 Years | 42 (73.7%) | 8 (19.0%) |
| 45 to 54 Years | 79 (71.8%) | 3 (3.8%) |
| 55 to 59 Years | 42 (60.0%) | 0 (0.0%) |
| 60 to 64 Years | 15 (36.6%) | 0 (0.0%) |
| 65 to 74 Years | 16 (27.6%) | 0 (0.0%) |
| 75 Years and over | 2 (4.3%) | 0 (0.0%) |
| Total | 360 (60.7%) | 15 (4.2%) |
Employment Status by Educational Attainment in Blooming Grove
According to labor force statistics for Blooming Grove, 71.8% of individuals (293) out of the total population between 25 and 64 years of age (408) are in the labor force, with 4.1% or 12 of them being unemployed. The group with the highest labor force participation rate are those with the educational attainment of bachelor's degree or higher, with 90.7% or 39 individuals in the labor force. Within the labor force, individuals with high school diploma education have the highest percentage of unemployment, with 14.1% or 9 of them being unemployed.
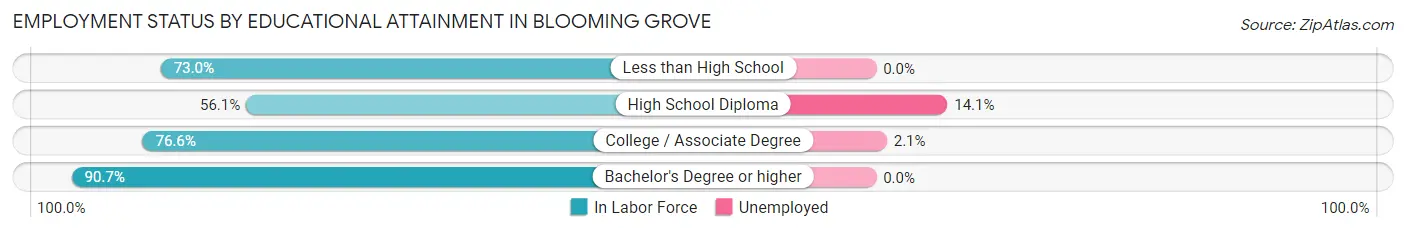
| Educational Attainment | In Labor Force | Unemployed |
| Less than High School | 46 (73.0%) | 0 (0.0%) |
| High School Diploma | 64 (56.1%) | 16 (14.1%) |
| College / Associate Degree | 144 (76.6%) | 4 (2.1%) |
| Bachelor's Degree or higher | 39 (90.7%) | 0 (0.0%) |
| Total | 293 (71.8%) | 17 (4.1%) |
Employment Occupations by Sex in Blooming Grove
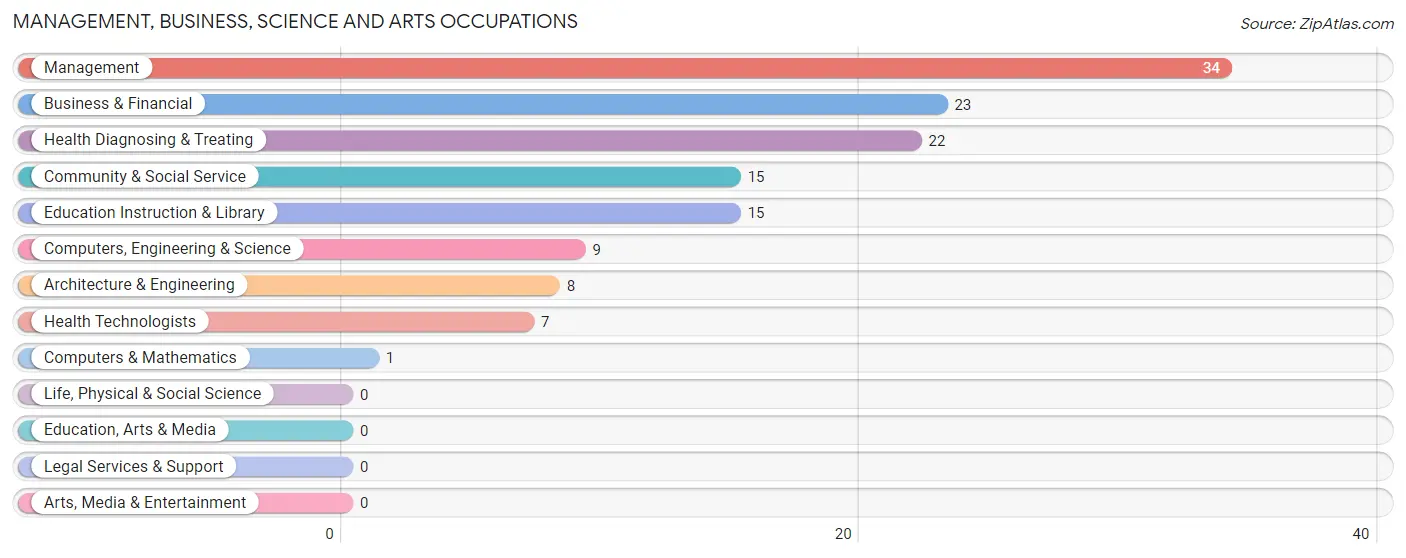
Management, Business, Science and Arts Occupations
The most common Management, Business, Science and Arts occupations in Blooming Grove are Management (34 | 9.9%), Business & Financial (23 | 6.7%), Health Diagnosing & Treating (22 | 6.4%), Community & Social Service (15 | 4.3%), and Education Instruction & Library (15 | 4.3%).
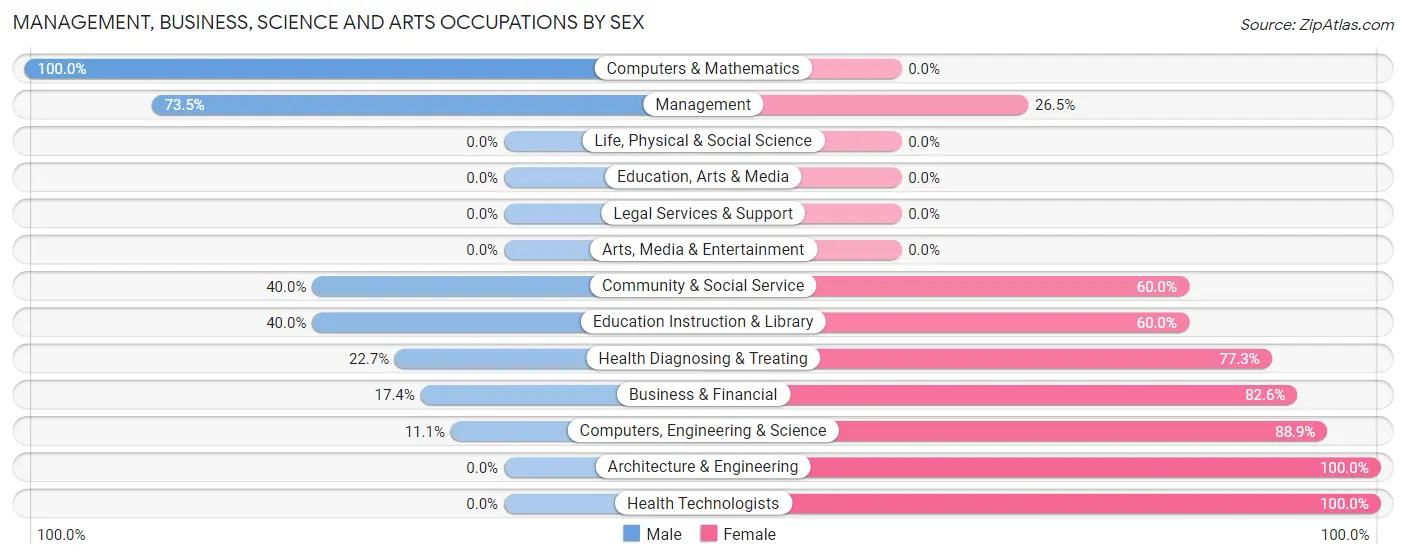
Management, Business, Science and Arts Occupations by Sex
Within the Management, Business, Science and Arts occupations in Blooming Grove, the most male-oriented occupations are Computers & Mathematics (100.0%), Management (73.5%), and Community & Social Service (40.0%), while the most female-oriented occupations are Architecture & Engineering (100.0%), Health Technologists (100.0%), and Computers, Engineering & Science (88.9%).
| Occupation | Male | Female |
| Management | 25 (73.5%) | 9 (26.5%) |
| Business & Financial | 4 (17.4%) | 19 (82.6%) |
| Computers, Engineering & Science | 1 (11.1%) | 8 (88.9%) |
| Computers & Mathematics | 1 (100.0%) | 0 (0.0%) |
| Architecture & Engineering | 0 (0.0%) | 8 (100.0%) |
| Life, Physical & Social Science | 0 (0.0%) | 0 (0.0%) |
| Community & Social Service | 6 (40.0%) | 9 (60.0%) |
| Education, Arts & Media | 0 (0.0%) | 0 (0.0%) |
| Legal Services & Support | 0 (0.0%) | 0 (0.0%) |
| Education Instruction & Library | 6 (40.0%) | 9 (60.0%) |
| Arts, Media & Entertainment | 0 (0.0%) | 0 (0.0%) |
| Health Diagnosing & Treating | 5 (22.7%) | 17 (77.3%) |
| Health Technologists | 0 (0.0%) | 7 (100.0%) |
| Total (Category) | 41 (39.8%) | 62 (60.2%) |
| Total (Overall) | 188 (54.5%) | 157 (45.5%) |
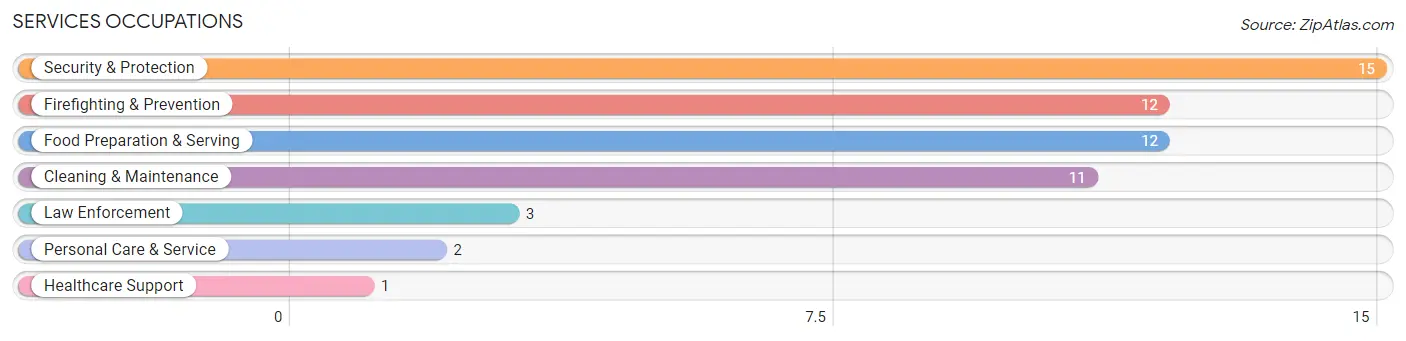
Services Occupations
The most common Services occupations in Blooming Grove are Security & Protection (15 | 4.3%), Firefighting & Prevention (12 | 3.5%), Food Preparation & Serving (12 | 3.5%), Cleaning & Maintenance (11 | 3.2%), and Law Enforcement (3 | 0.9%).
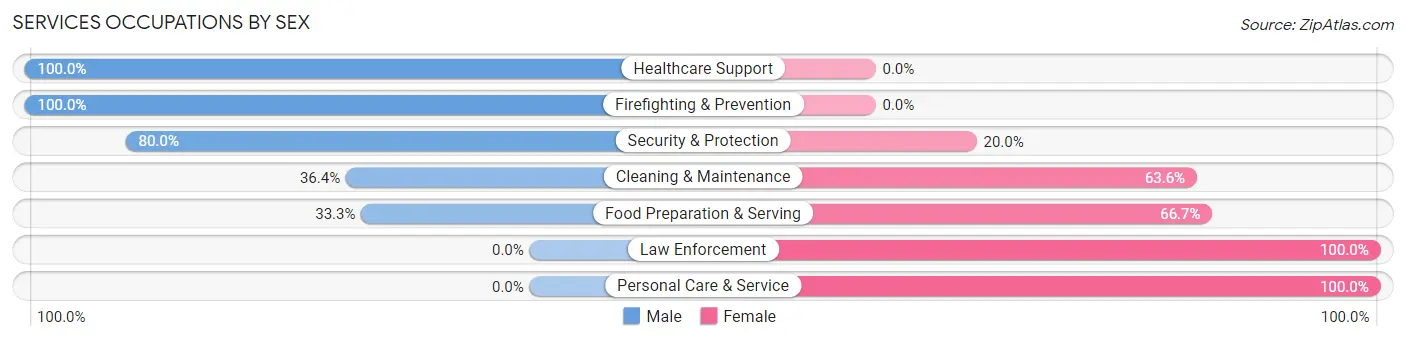
Services Occupations by Sex
Within the Services occupations in Blooming Grove, the most male-oriented occupations are Healthcare Support (100.0%), Firefighting & Prevention (100.0%), and Security & Protection (80.0%), while the most female-oriented occupations are Law Enforcement (100.0%), Personal Care & Service (100.0%), and Food Preparation & Serving (66.7%).
| Occupation | Male | Female |
| Healthcare Support | 1 (100.0%) | 0 (0.0%) |
| Security & Protection | 12 (80.0%) | 3 (20.0%) |
| Firefighting & Prevention | 12 (100.0%) | 0 (0.0%) |
| Law Enforcement | 0 (0.0%) | 3 (100.0%) |
| Food Preparation & Serving | 4 (33.3%) | 8 (66.7%) |
| Cleaning & Maintenance | 4 (36.4%) | 7 (63.6%) |
| Personal Care & Service | 0 (0.0%) | 2 (100.0%) |
| Total (Category) | 21 (51.2%) | 20 (48.8%) |
| Total (Overall) | 188 (54.5%) | 157 (45.5%) |
Sales and Office Occupations
The most common Sales and Office occupations in Blooming Grove are Sales & Related (49 | 14.2%), and Office & Administration (45 | 13.0%).
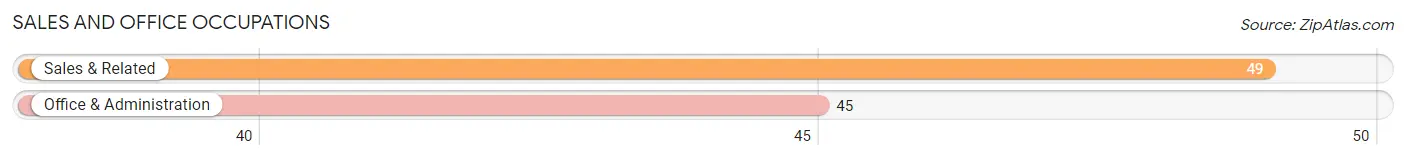
Sales and Office Occupations by Sex
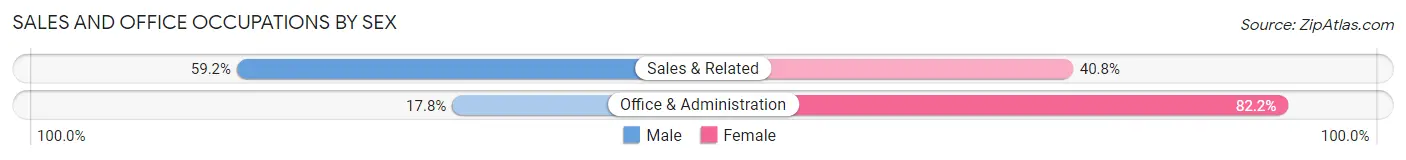
| Occupation | Male | Female |
| Sales & Related | 29 (59.2%) | 20 (40.8%) |
| Office & Administration | 8 (17.8%) | 37 (82.2%) |
| Total (Category) | 37 (39.4%) | 57 (60.6%) |
| Total (Overall) | 188 (54.5%) | 157 (45.5%) |
Natural Resources, Construction and Maintenance Occupations
The most common Natural Resources, Construction and Maintenance occupations in Blooming Grove are Construction & Extraction (34 | 9.9%), and Installation, Maintenance & Repair (15 | 4.3%).
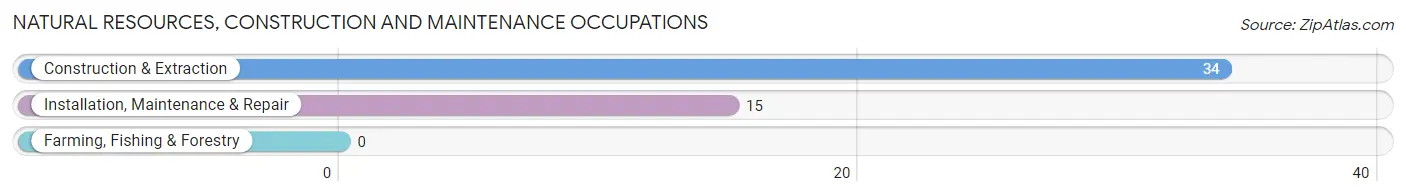
Natural Resources, Construction and Maintenance Occupations by Sex
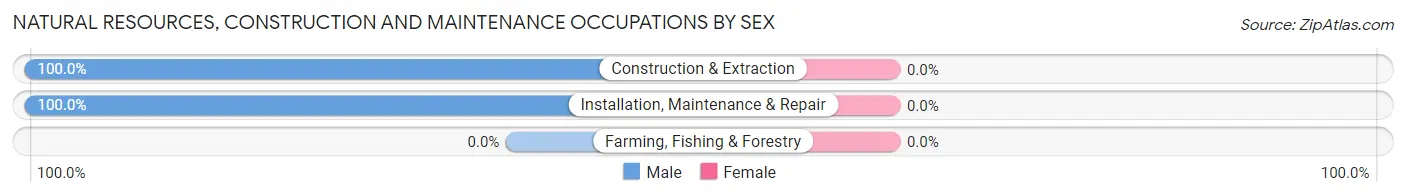
| Occupation | Male | Female |
| Farming, Fishing & Forestry | 0 (0.0%) | 0 (0.0%) |
| Construction & Extraction | 34 (100.0%) | 0 (0.0%) |
| Installation, Maintenance & Repair | 15 (100.0%) | 0 (0.0%) |
| Total (Category) | 49 (100.0%) | 0 (0.0%) |
| Total (Overall) | 188 (54.5%) | 157 (45.5%) |
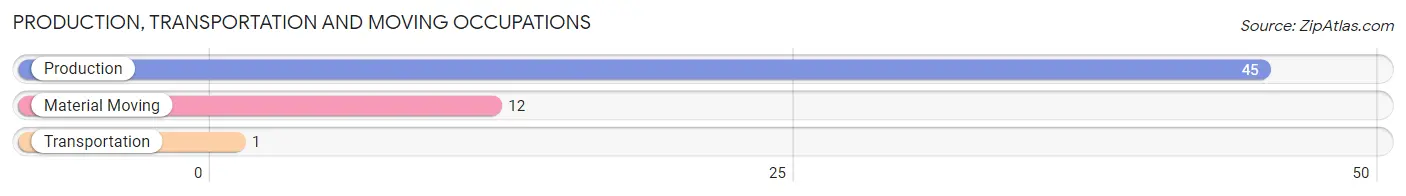
Production, Transportation and Moving Occupations
The most common Production, Transportation and Moving occupations in Blooming Grove are Production (45 | 13.0%), Material Moving (12 | 3.5%), and Transportation (1 | 0.3%).
Production, Transportation and Moving Occupations by Sex
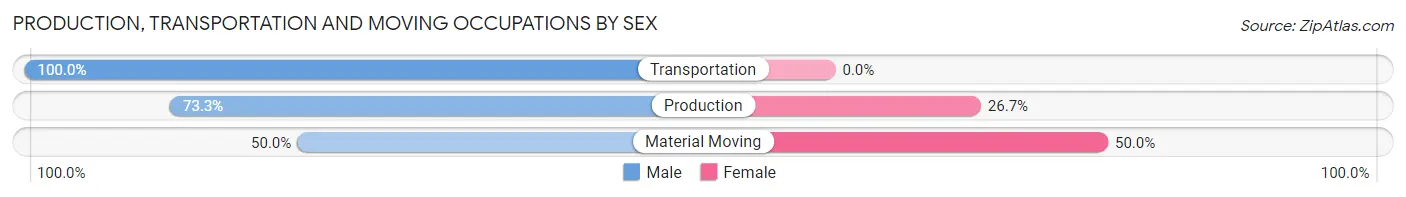
| Occupation | Male | Female |
| Production | 33 (73.3%) | 12 (26.7%) |
| Transportation | 1 (100.0%) | 0 (0.0%) |
| Material Moving | 6 (50.0%) | 6 (50.0%) |
| Total (Category) | 40 (69.0%) | 18 (31.0%) |
| Total (Overall) | 188 (54.5%) | 157 (45.5%) |
Employment Industries by Sex in Blooming Grove
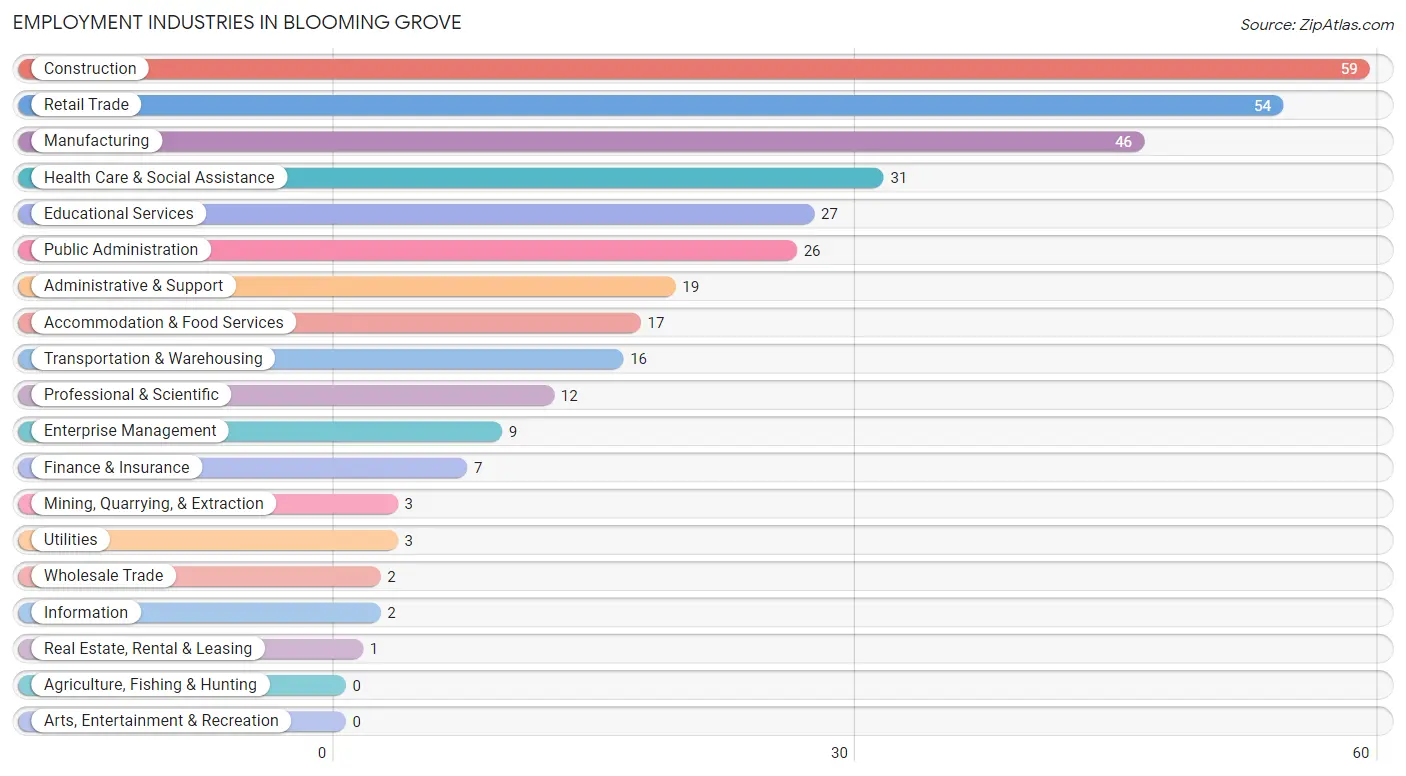
Employment Industries in Blooming Grove
The major employment industries in Blooming Grove include Construction (59 | 17.1%), Retail Trade (54 | 15.7%), Manufacturing (46 | 13.3%), Health Care & Social Assistance (31 | 9.0%), and Educational Services (27 | 7.8%).
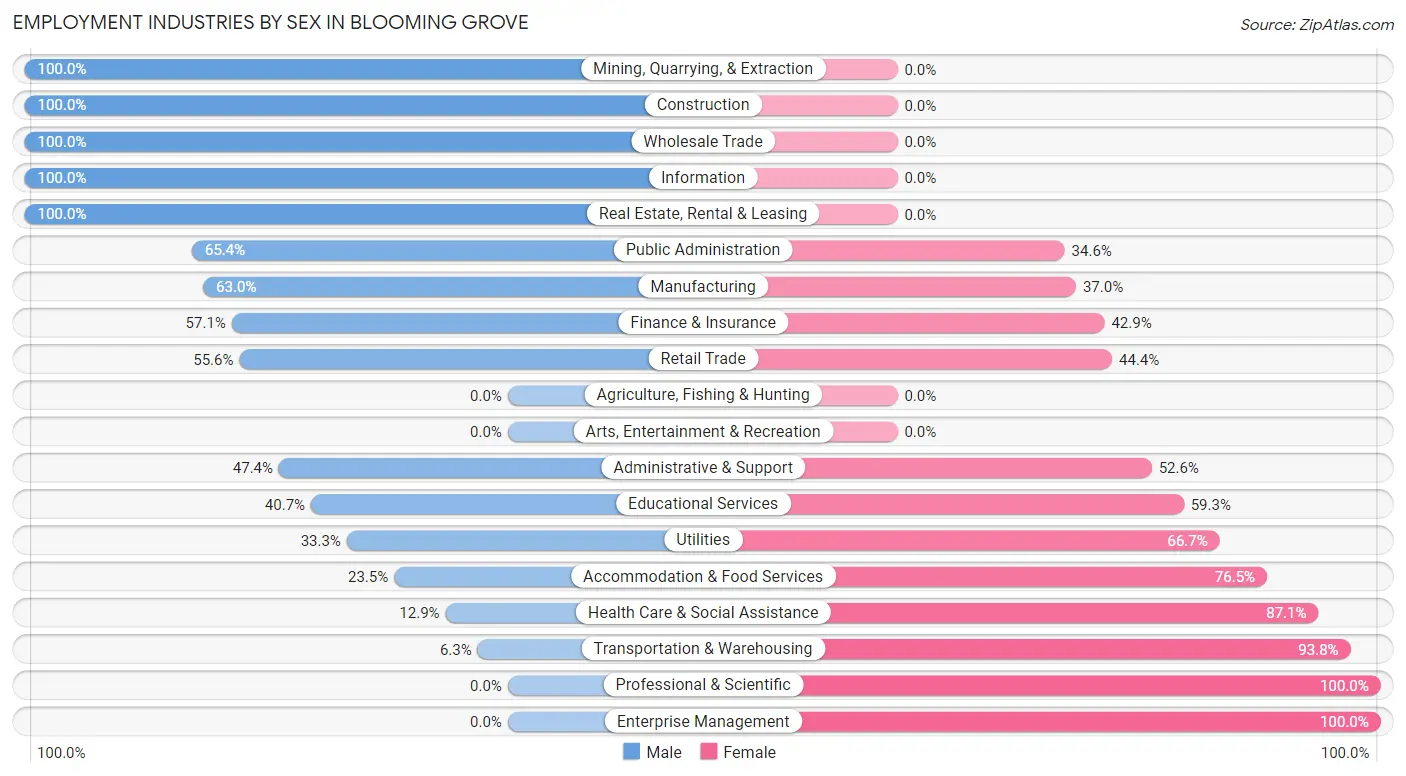
Employment Industries by Sex in Blooming Grove
The Blooming Grove industries that see more men than women are Mining, Quarrying, & Extraction (100.0%), Construction (100.0%), and Wholesale Trade (100.0%), whereas the industries that tend to have a higher number of women are Professional & Scientific (100.0%), Enterprise Management (100.0%), and Transportation & Warehousing (93.8%).
| Industry | Male | Female |
| Agriculture, Fishing & Hunting | 0 (0.0%) | 0 (0.0%) |
| Mining, Quarrying, & Extraction | 3 (100.0%) | 0 (0.0%) |
| Construction | 59 (100.0%) | 0 (0.0%) |
| Manufacturing | 29 (63.0%) | 17 (37.0%) |
| Wholesale Trade | 2 (100.0%) | 0 (0.0%) |
| Retail Trade | 30 (55.6%) | 24 (44.4%) |
| Transportation & Warehousing | 1 (6.2%) | 15 (93.8%) |
| Utilities | 1 (33.3%) | 2 (66.7%) |
| Information | 2 (100.0%) | 0 (0.0%) |
| Finance & Insurance | 4 (57.1%) | 3 (42.9%) |
| Real Estate, Rental & Leasing | 1 (100.0%) | 0 (0.0%) |
| Professional & Scientific | 0 (0.0%) | 12 (100.0%) |
| Enterprise Management | 0 (0.0%) | 9 (100.0%) |
| Administrative & Support | 9 (47.4%) | 10 (52.6%) |
| Educational Services | 11 (40.7%) | 16 (59.3%) |
| Health Care & Social Assistance | 4 (12.9%) | 27 (87.1%) |
| Arts, Entertainment & Recreation | 0 (0.0%) | 0 (0.0%) |
| Accommodation & Food Services | 4 (23.5%) | 13 (76.5%) |
| Public Administration | 17 (65.4%) | 9 (34.6%) |
| Total | 188 (54.5%) | 157 (45.5%) |
Education in Blooming Grove
School Enrollment in Blooming Grove
The most common levels of schooling among the 201 students in Blooming Grove are nursery / preschool (56 | 27.9%), middle school (49 | 24.4%), and high school (38 | 18.9%).
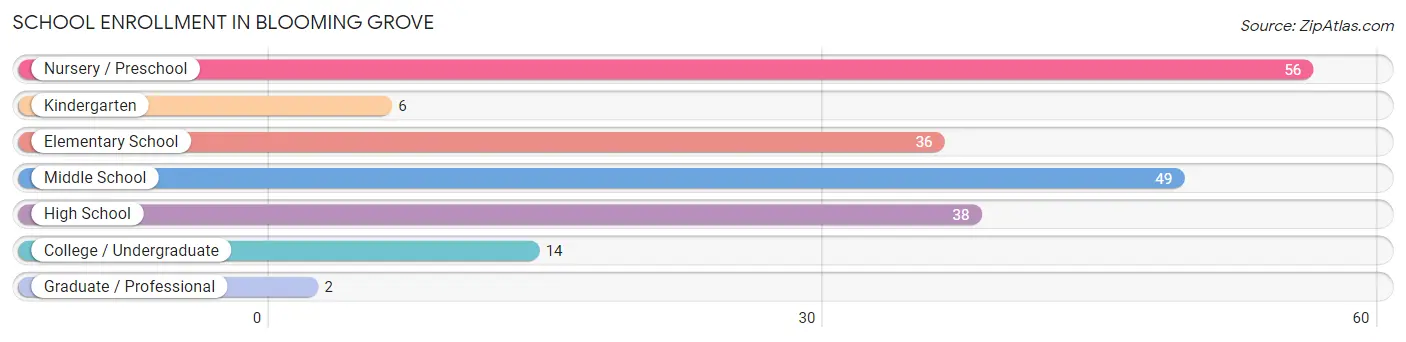
| School Level | # Students | % Students |
| Nursery / Preschool | 56 | 27.9% |
| Kindergarten | 6 | 3.0% |
| Elementary School | 36 | 17.9% |
| Middle School | 49 | 24.4% |
| High School | 38 | 18.9% |
| College / Undergraduate | 14 | 7.0% |
| Graduate / Professional | 2 | 1.0% |
| Total | 201 | 100.0% |
School Enrollment by Age by Funding Source in Blooming Grove
Out of a total of 201 students who are enrolled in schools in Blooming Grove, 8 (4.0%) attend a private institution, while the remaining 193 (96.0%) are enrolled in public schools. The age group of 15 to 17 year olds has the highest likelihood of being enrolled in private schools, with 2 (33.3% in the age bracket) enrolled. Conversely, the age group of 10 to 14 year olds has the lowest likelihood of being enrolled in a private school, with 49 (100.0% in the age bracket) attending a public institution.
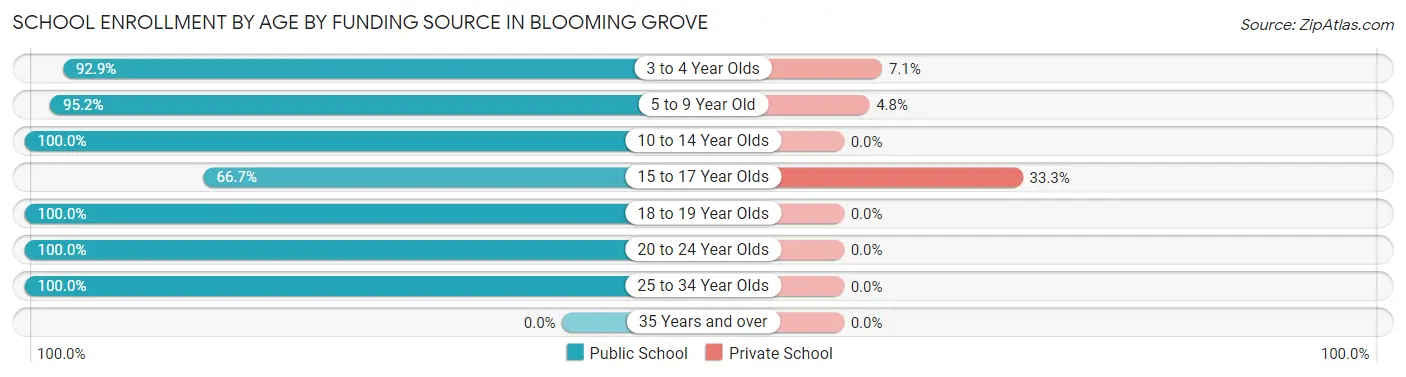
| Age Bracket | Public School | Private School |
| 3 to 4 Year Olds | 52 (92.9%) | 4 (7.1%) |
| 5 to 9 Year Old | 40 (95.2%) | 2 (4.8%) |
| 10 to 14 Year Olds | 49 (100.0%) | 0 (0.0%) |
| 15 to 17 Year Olds | 4 (66.7%) | 2 (33.3%) |
| 18 to 19 Year Olds | 32 (100.0%) | 0 (0.0%) |
| 20 to 24 Year Olds | 13 (100.0%) | 0 (0.0%) |
| 25 to 34 Year Olds | 3 (100.0%) | 0 (0.0%) |
| 35 Years and over | 0 (0.0%) | 0 (0.0%) |
| Total | 193 (96.0%) | 8 (4.0%) |
Educational Attainment by Field of Study in Blooming Grove
Engineering (21 | 35.0%), education (11 | 18.3%), business (7 | 11.7%), science & technology (6 | 10.0%), and arts & humanities (6 | 10.0%) are the most common fields of study among 60 individuals in Blooming Grove who have obtained a bachelor's degree or higher.
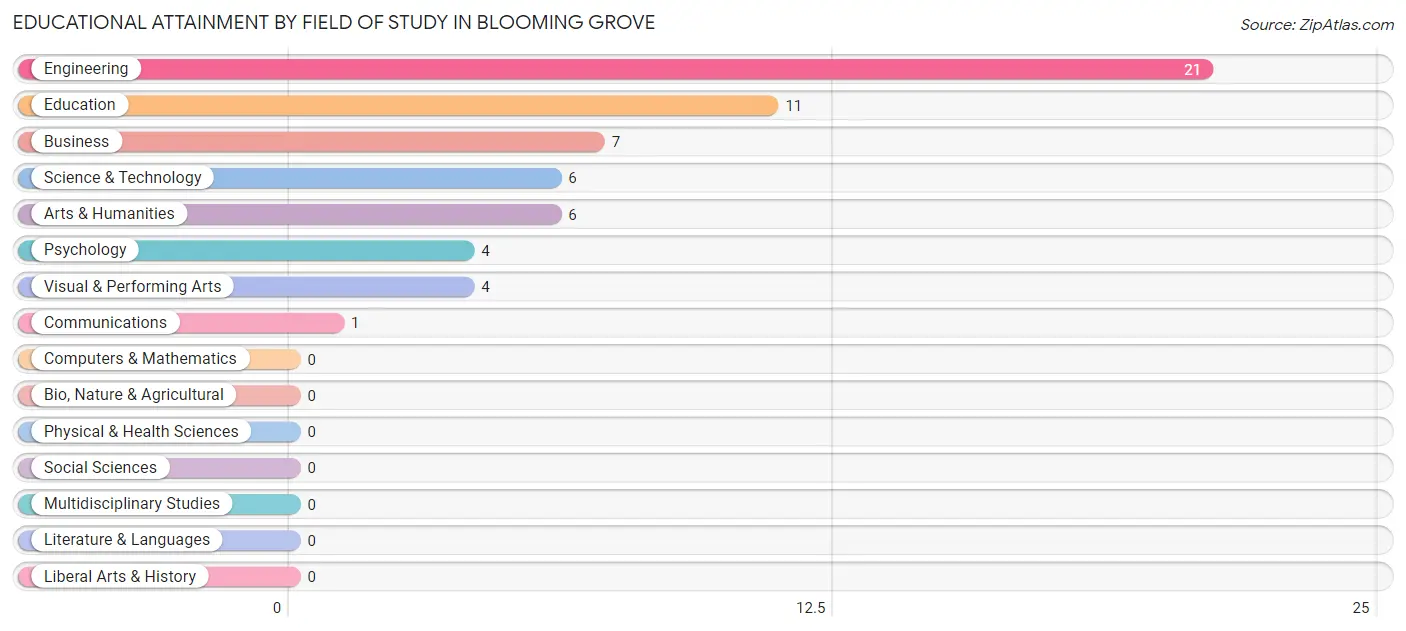
| Field of Study | # Graduates | % Graduates |
| Computers & Mathematics | 0 | 0.0% |
| Bio, Nature & Agricultural | 0 | 0.0% |
| Physical & Health Sciences | 0 | 0.0% |
| Psychology | 4 | 6.7% |
| Social Sciences | 0 | 0.0% |
| Engineering | 21 | 35.0% |
| Multidisciplinary Studies | 0 | 0.0% |
| Science & Technology | 6 | 10.0% |
| Business | 7 | 11.7% |
| Education | 11 | 18.3% |
| Literature & Languages | 0 | 0.0% |
| Liberal Arts & History | 0 | 0.0% |
| Visual & Performing Arts | 4 | 6.7% |
| Communications | 1 | 1.7% |
| Arts & Humanities | 6 | 10.0% |
| Total | 60 | 100.0% |
Transportation & Commute in Blooming Grove
Vehicle Availability by Sex in Blooming Grove
The most prevalent vehicle ownership categories in Blooming Grove are males with 2 vehicles (94, accounting for 50.0%) and females with 2 vehicles (87, making up 59.9%).
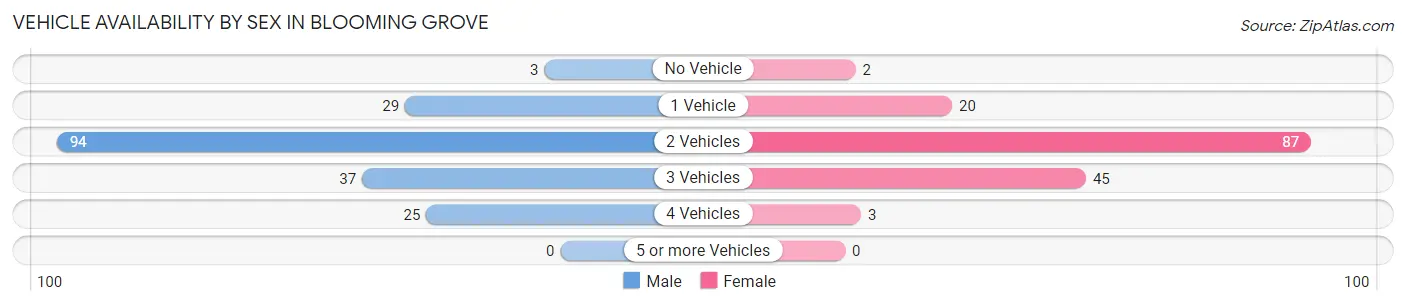
| Vehicles Available | Male | Female |
| No Vehicle | 3 (1.6%) | 2 (1.3%) |
| 1 Vehicle | 29 (15.4%) | 20 (12.7%) |
| 2 Vehicles | 94 (50.0%) | 87 (55.4%) |
| 3 Vehicles | 37 (19.7%) | 45 (28.7%) |
| 4 Vehicles | 25 (13.3%) | 3 (1.9%) |
| 5 or more Vehicles | 0 (0.0%) | 0 (0.0%) |
| Total | 188 (100.0%) | 157 (100.0%) |
Commute Time in Blooming Grove
The most frequently occuring commute durations in Blooming Grove are 60 to 89 minutes (62 commuters, 21.4%), 30 to 34 minutes (55 commuters, 19.0%), and 5 to 9 minutes (45 commuters, 15.6%).
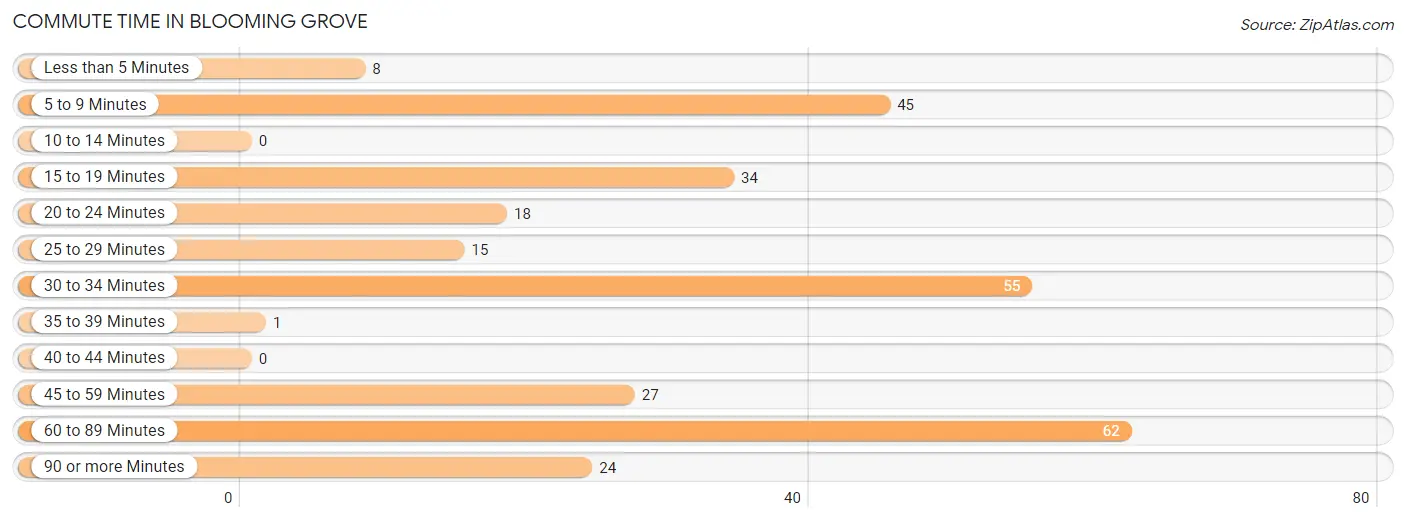
| Commute Time | # Commuters | % Commuters |
| Less than 5 Minutes | 8 | 2.8% |
| 5 to 9 Minutes | 45 | 15.6% |
| 10 to 14 Minutes | 0 | 0.0% |
| 15 to 19 Minutes | 34 | 11.8% |
| 20 to 24 Minutes | 18 | 6.2% |
| 25 to 29 Minutes | 15 | 5.2% |
| 30 to 34 Minutes | 55 | 19.0% |
| 35 to 39 Minutes | 1 | 0.4% |
| 40 to 44 Minutes | 0 | 0.0% |
| 45 to 59 Minutes | 27 | 9.3% |
| 60 to 89 Minutes | 62 | 21.4% |
| 90 or more Minutes | 24 | 8.3% |
Commute Time by Sex in Blooming Grove
The most common commute times in Blooming Grove are 30 to 34 minutes (42 commuters, 25.9%) for males and 60 to 89 minutes (31 commuters, 24.4%) for females.
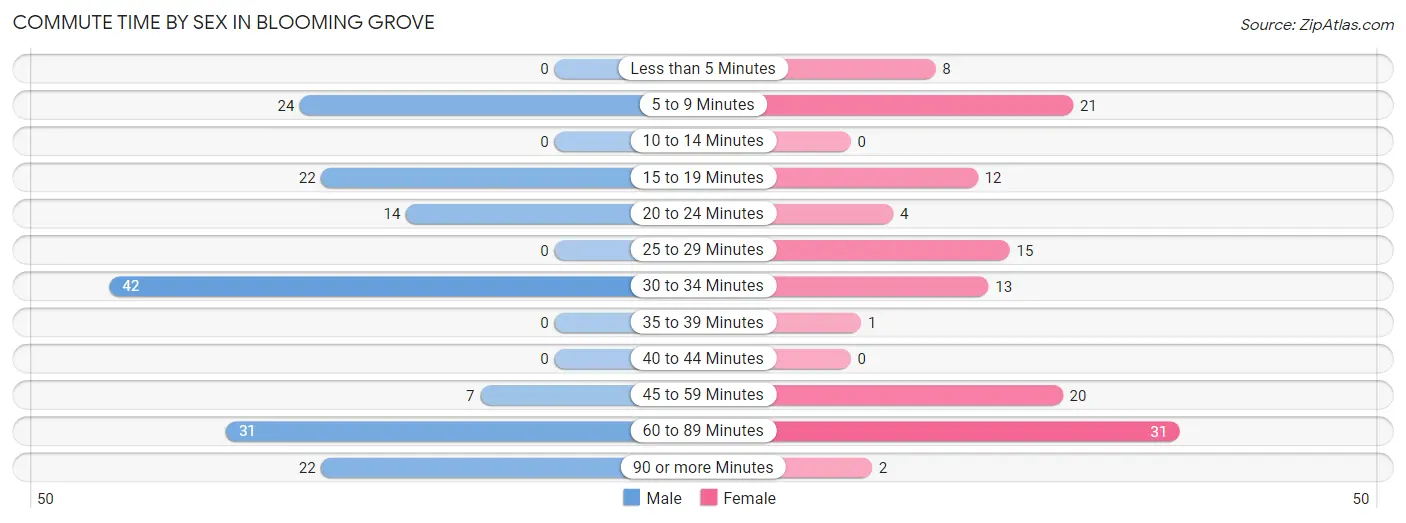
| Commute Time | Male | Female |
| Less than 5 Minutes | 0 (0.0%) | 8 (6.3%) |
| 5 to 9 Minutes | 24 (14.8%) | 21 (16.5%) |
| 10 to 14 Minutes | 0 (0.0%) | 0 (0.0%) |
| 15 to 19 Minutes | 22 (13.6%) | 12 (9.5%) |
| 20 to 24 Minutes | 14 (8.6%) | 4 (3.2%) |
| 25 to 29 Minutes | 0 (0.0%) | 15 (11.8%) |
| 30 to 34 Minutes | 42 (25.9%) | 13 (10.2%) |
| 35 to 39 Minutes | 0 (0.0%) | 1 (0.8%) |
| 40 to 44 Minutes | 0 (0.0%) | 0 (0.0%) |
| 45 to 59 Minutes | 7 (4.3%) | 20 (15.8%) |
| 60 to 89 Minutes | 31 (19.1%) | 31 (24.4%) |
| 90 or more Minutes | 22 (13.6%) | 2 (1.6%) |
Time of Departure to Work by Sex in Blooming Grove
The most frequent times of departure to work in Blooming Grove are 6:00 AM to 6:29 AM (53, 32.7%) for males and 7:30 AM to 7:59 AM (34, 26.8%) for females.
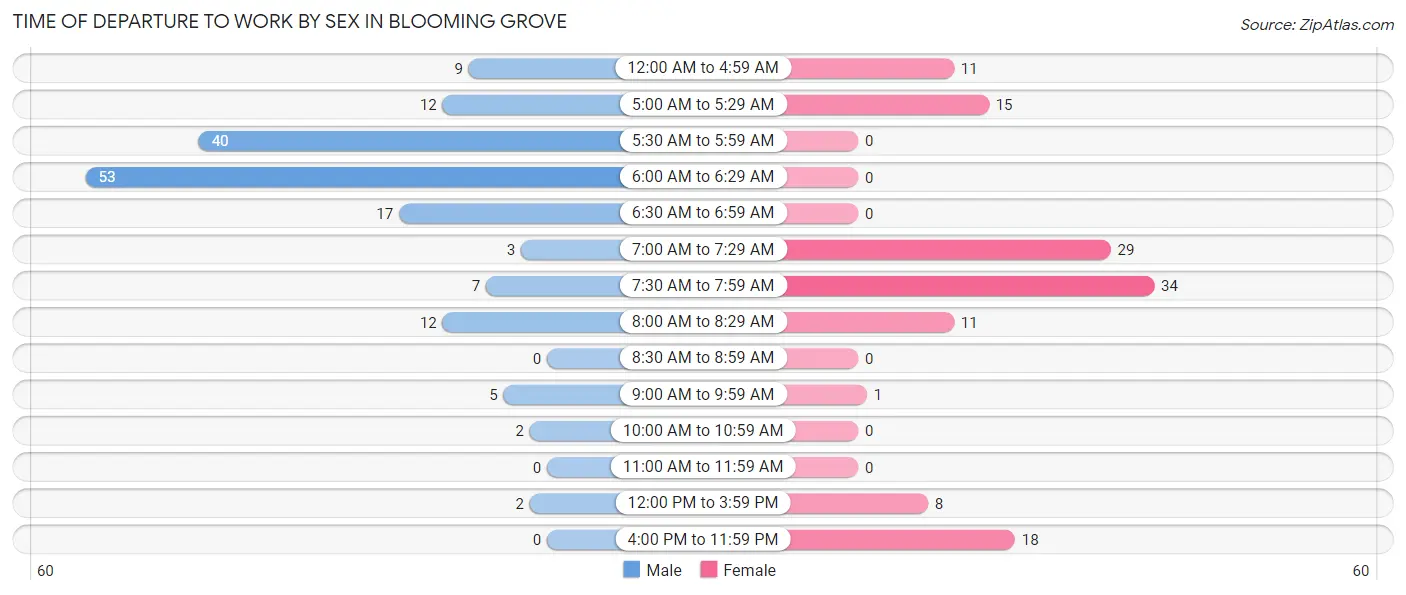
| Time of Departure | Male | Female |
| 12:00 AM to 4:59 AM | 9 (5.6%) | 11 (8.7%) |
| 5:00 AM to 5:29 AM | 12 (7.4%) | 15 (11.8%) |
| 5:30 AM to 5:59 AM | 40 (24.7%) | 0 (0.0%) |
| 6:00 AM to 6:29 AM | 53 (32.7%) | 0 (0.0%) |
| 6:30 AM to 6:59 AM | 17 (10.5%) | 0 (0.0%) |
| 7:00 AM to 7:29 AM | 3 (1.8%) | 29 (22.8%) |
| 7:30 AM to 7:59 AM | 7 (4.3%) | 34 (26.8%) |
| 8:00 AM to 8:29 AM | 12 (7.4%) | 11 (8.7%) |
| 8:30 AM to 8:59 AM | 0 (0.0%) | 0 (0.0%) |
| 9:00 AM to 9:59 AM | 5 (3.1%) | 1 (0.8%) |
| 10:00 AM to 10:59 AM | 2 (1.2%) | 0 (0.0%) |
| 11:00 AM to 11:59 AM | 0 (0.0%) | 0 (0.0%) |
| 12:00 PM to 3:59 PM | 2 (1.2%) | 8 (6.3%) |
| 4:00 PM to 11:59 PM | 0 (0.0%) | 18 (14.2%) |
| Total | 162 (100.0%) | 127 (100.0%) |
Housing Occupancy in Blooming Grove
Occupancy by Ownership in Blooming Grove
Of the total 303 dwellings in Blooming Grove, owner-occupied units account for 225 (74.3%), while renter-occupied units make up 78 (25.7%).
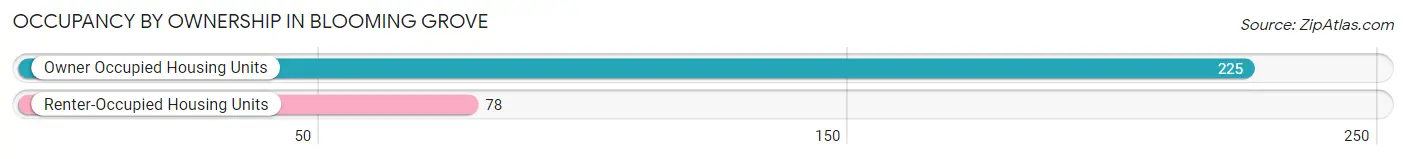
| Occupancy | # Housing Units | % Housing Units |
| Owner Occupied Housing Units | 225 | 74.3% |
| Renter-Occupied Housing Units | 78 | 25.7% |
| Total Occupied Housing Units | 303 | 100.0% |
Occupancy by Household Size in Blooming Grove
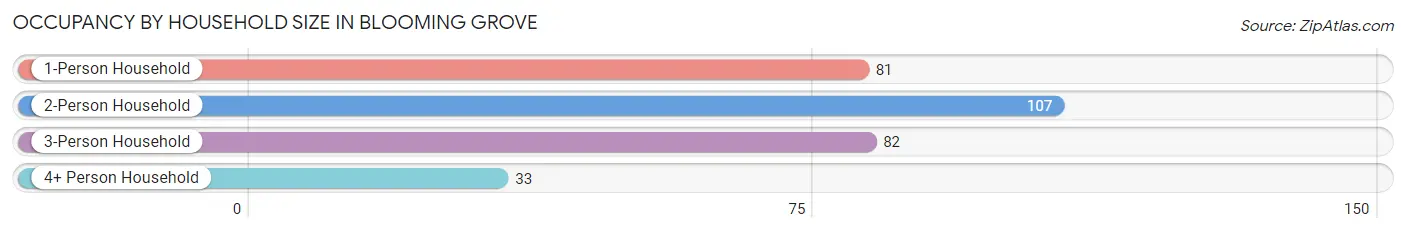
| Household Size | # Housing Units | % Housing Units |
| 1-Person Household | 81 | 26.7% |
| 2-Person Household | 107 | 35.3% |
| 3-Person Household | 82 | 27.1% |
| 4+ Person Household | 33 | 10.9% |
| Total Housing Units | 303 | 100.0% |
Occupancy by Ownership by Household Size in Blooming Grove
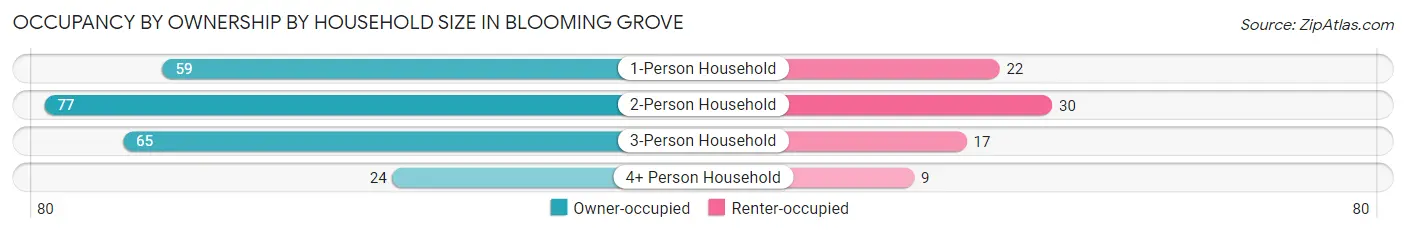
| Household Size | Owner-occupied | Renter-occupied |
| 1-Person Household | 59 (72.8%) | 22 (27.2%) |
| 2-Person Household | 77 (72.0%) | 30 (28.0%) |
| 3-Person Household | 65 (79.3%) | 17 (20.7%) |
| 4+ Person Household | 24 (72.7%) | 9 (27.3%) |
| Total Housing Units | 225 (74.3%) | 78 (25.7%) |
Occupancy by Educational Attainment in Blooming Grove
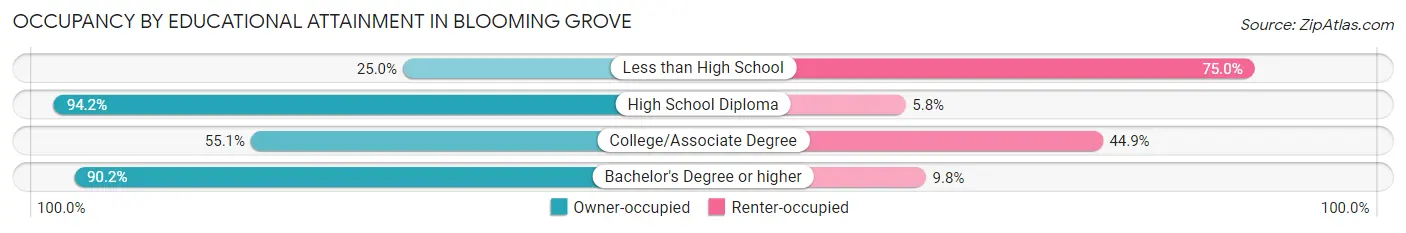
| Household Size | Owner-occupied | Renter-occupied |
| Less than High School | 6 (25.0%) | 18 (75.0%) |
| High School Diploma | 114 (94.2%) | 7 (5.8%) |
| College/Associate Degree | 59 (55.1%) | 48 (44.9%) |
| Bachelor's Degree or higher | 46 (90.2%) | 5 (9.8%) |
Occupancy by Age of Householder in Blooming Grove
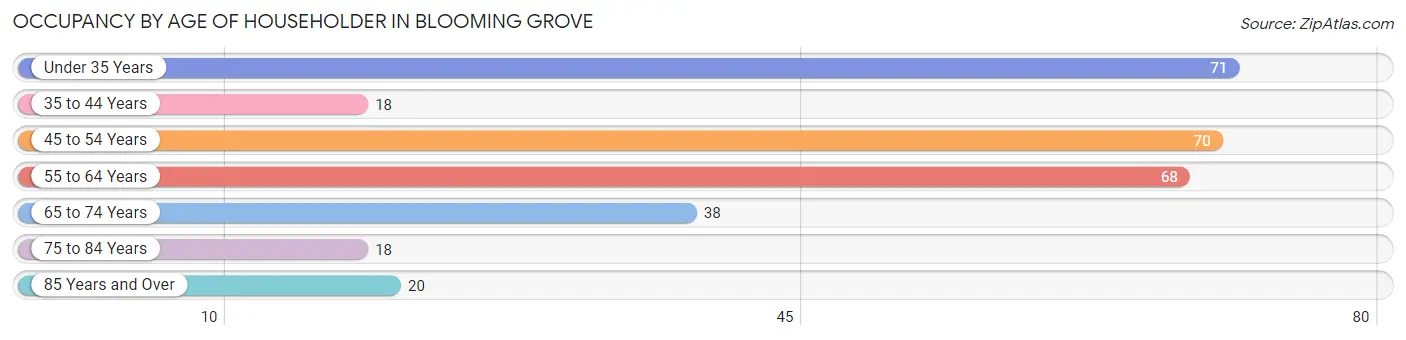
| Age Bracket | # Households | % Households |
| Under 35 Years | 71 | 23.4% |
| 35 to 44 Years | 18 | 5.9% |
| 45 to 54 Years | 70 | 23.1% |
| 55 to 64 Years | 68 | 22.4% |
| 65 to 74 Years | 38 | 12.5% |
| 75 to 84 Years | 18 | 5.9% |
| 85 Years and Over | 20 | 6.6% |
| Total | 303 | 100.0% |
Housing Finances in Blooming Grove
Median Income by Occupancy in Blooming Grove
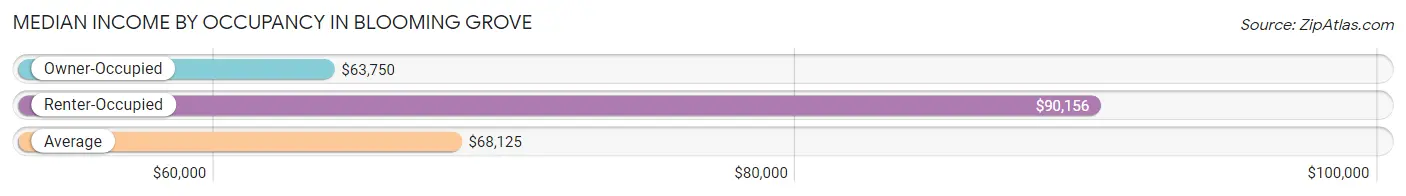
| Occupancy Type | # Households | Median Income |
| Owner-Occupied | 225 (74.3%) | $63,750 |
| Renter-Occupied | 78 (25.7%) | $90,156 |
| Average | 303 (100.0%) | $68,125 |
Occupancy by Householder Income Bracket in Blooming Grove
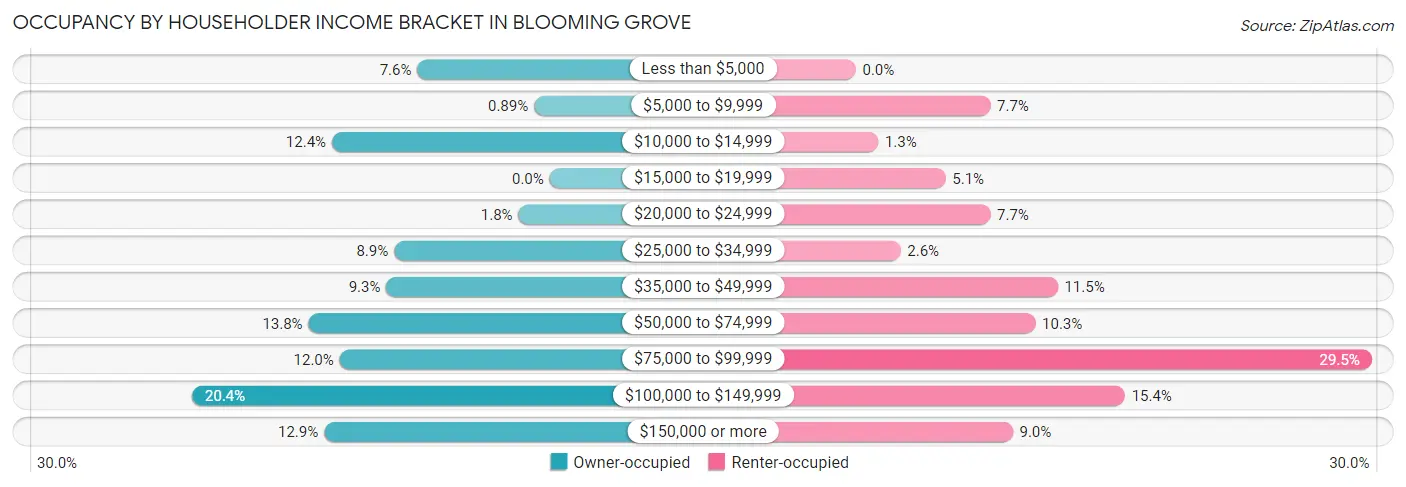
| Income Bracket | Owner-occupied | Renter-occupied |
| Less than $5,000 | 17 (7.6%) | 0 (0.0%) |
| $5,000 to $9,999 | 2 (0.9%) | 6 (7.7%) |
| $10,000 to $14,999 | 28 (12.4%) | 1 (1.3%) |
| $15,000 to $19,999 | 0 (0.0%) | 4 (5.1%) |
| $20,000 to $24,999 | 4 (1.8%) | 6 (7.7%) |
| $25,000 to $34,999 | 20 (8.9%) | 2 (2.6%) |
| $35,000 to $49,999 | 21 (9.3%) | 9 (11.5%) |
| $50,000 to $74,999 | 31 (13.8%) | 8 (10.3%) |
| $75,000 to $99,999 | 27 (12.0%) | 23 (29.5%) |
| $100,000 to $149,999 | 46 (20.4%) | 12 (15.4%) |
| $150,000 or more | 29 (12.9%) | 7 (9.0%) |
| Total | 225 (100.0%) | 78 (100.0%) |
Monthly Housing Cost Tiers in Blooming Grove
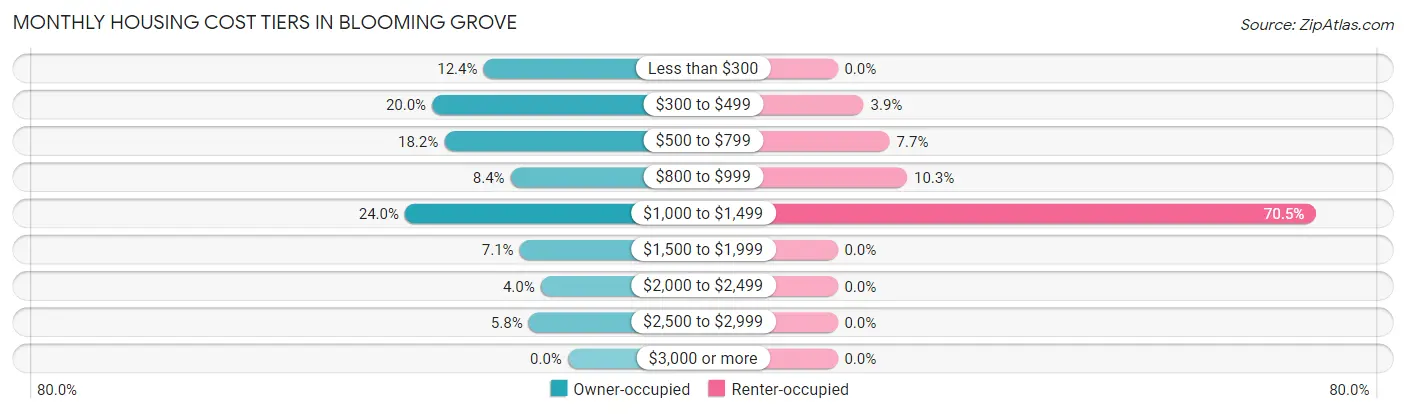
| Monthly Cost | Owner-occupied | Renter-occupied |
| Less than $300 | 28 (12.4%) | 0 (0.0%) |
| $300 to $499 | 45 (20.0%) | 3 (3.8%) |
| $500 to $799 | 41 (18.2%) | 6 (7.7%) |
| $800 to $999 | 19 (8.4%) | 8 (10.3%) |
| $1,000 to $1,499 | 54 (24.0%) | 55 (70.5%) |
| $1,500 to $1,999 | 16 (7.1%) | 0 (0.0%) |
| $2,000 to $2,499 | 9 (4.0%) | 0 (0.0%) |
| $2,500 to $2,999 | 13 (5.8%) | 0 (0.0%) |
| $3,000 or more | 0 (0.0%) | 0 (0.0%) |
| Total | 225 (100.0%) | 78 (100.0%) |
Physical Housing Characteristics in Blooming Grove
Housing Structures in Blooming Grove
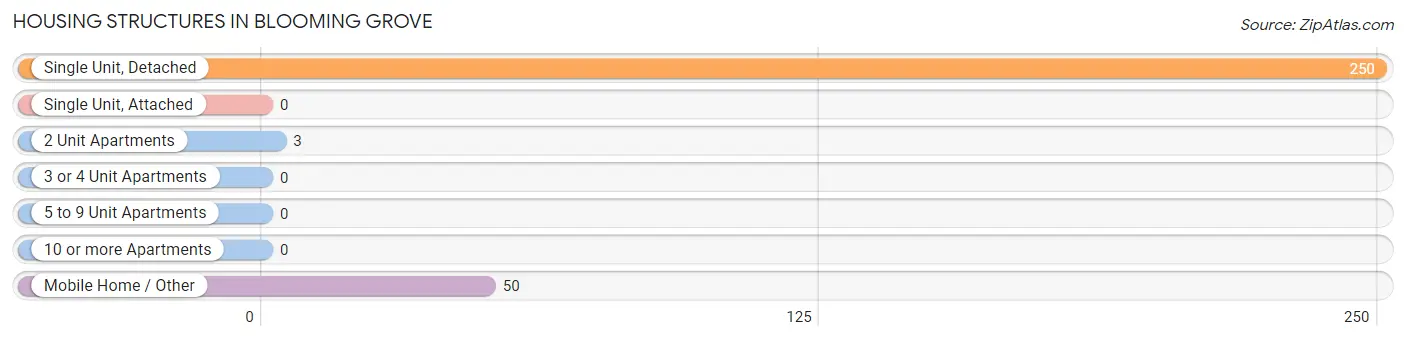
| Structure Type | # Housing Units | % Housing Units |
| Single Unit, Detached | 250 | 82.5% |
| Single Unit, Attached | 0 | 0.0% |
| 2 Unit Apartments | 3 | 1.0% |
| 3 or 4 Unit Apartments | 0 | 0.0% |
| 5 to 9 Unit Apartments | 0 | 0.0% |
| 10 or more Apartments | 0 | 0.0% |
| Mobile Home / Other | 50 | 16.5% |
| Total | 303 | 100.0% |
Housing Structures by Occupancy in Blooming Grove
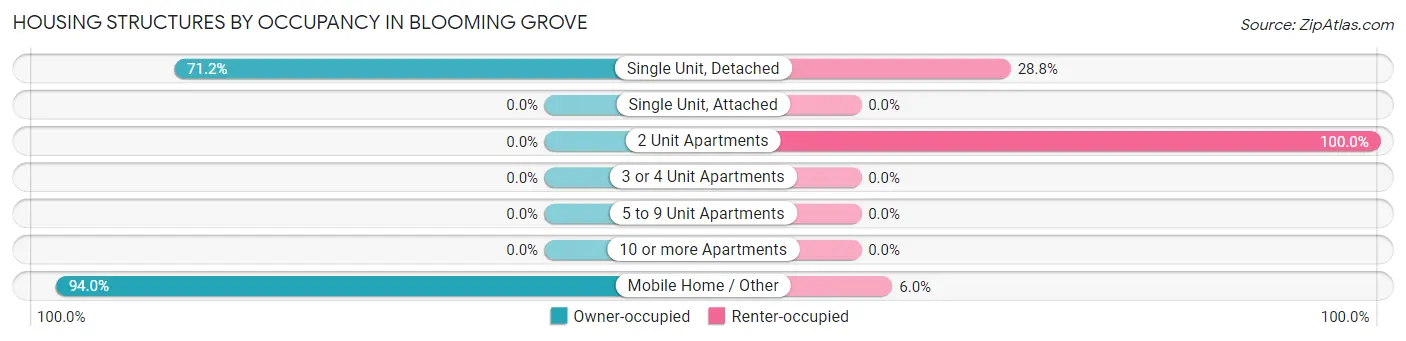
| Structure Type | Owner-occupied | Renter-occupied |
| Single Unit, Detached | 178 (71.2%) | 72 (28.8%) |
| Single Unit, Attached | 0 (0.0%) | 0 (0.0%) |
| 2 Unit Apartments | 0 (0.0%) | 3 (100.0%) |
| 3 or 4 Unit Apartments | 0 (0.0%) | 0 (0.0%) |
| 5 to 9 Unit Apartments | 0 (0.0%) | 0 (0.0%) |
| 10 or more Apartments | 0 (0.0%) | 0 (0.0%) |
| Mobile Home / Other | 47 (94.0%) | 3 (6.0%) |
| Total | 225 (74.3%) | 78 (25.7%) |
Housing Structures by Number of Rooms in Blooming Grove
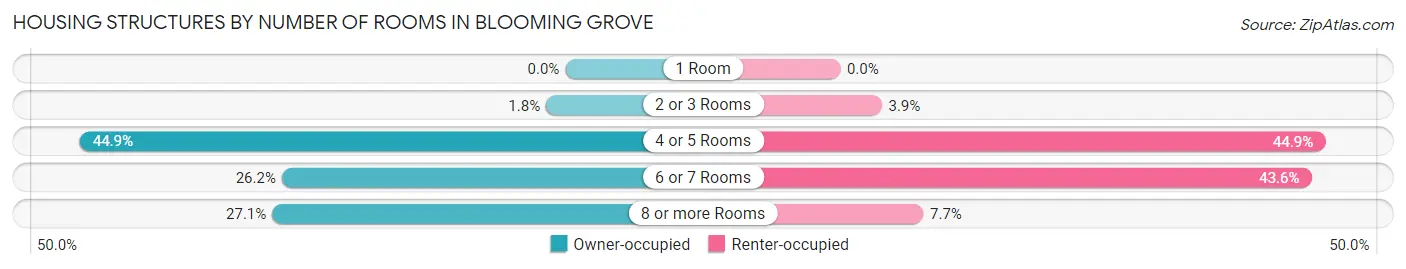
| Number of Rooms | Owner-occupied | Renter-occupied |
| 1 Room | 0 (0.0%) | 0 (0.0%) |
| 2 or 3 Rooms | 4 (1.8%) | 3 (3.8%) |
| 4 or 5 Rooms | 101 (44.9%) | 35 (44.9%) |
| 6 or 7 Rooms | 59 (26.2%) | 34 (43.6%) |
| 8 or more Rooms | 61 (27.1%) | 6 (7.7%) |
| Total | 225 (100.0%) | 78 (100.0%) |
Housing Structure by Heating Type in Blooming Grove
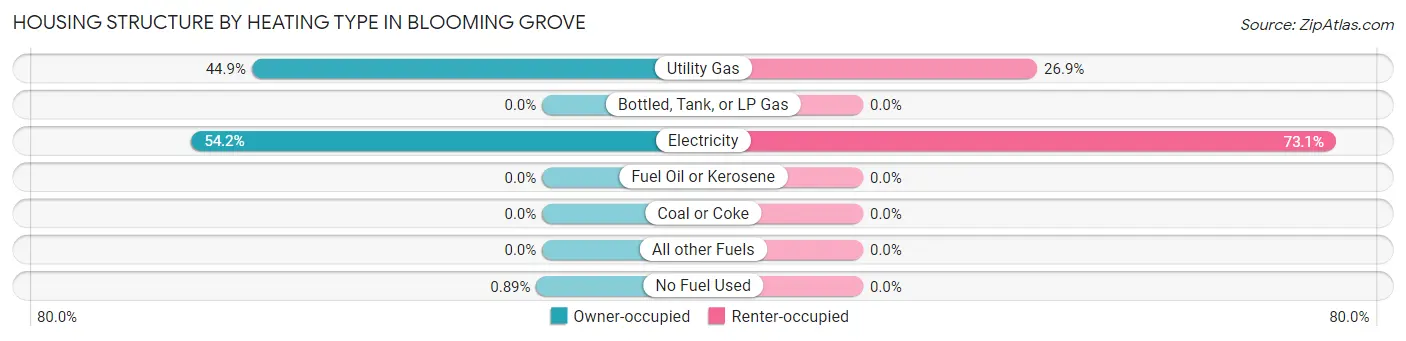
| Heating Type | Owner-occupied | Renter-occupied |
| Utility Gas | 101 (44.9%) | 21 (26.9%) |
| Bottled, Tank, or LP Gas | 0 (0.0%) | 0 (0.0%) |
| Electricity | 122 (54.2%) | 57 (73.1%) |
| Fuel Oil or Kerosene | 0 (0.0%) | 0 (0.0%) |
| Coal or Coke | 0 (0.0%) | 0 (0.0%) |
| All other Fuels | 0 (0.0%) | 0 (0.0%) |
| No Fuel Used | 2 (0.9%) | 0 (0.0%) |
| Total | 225 (100.0%) | 78 (100.0%) |
Household Vehicle Usage in Blooming Grove
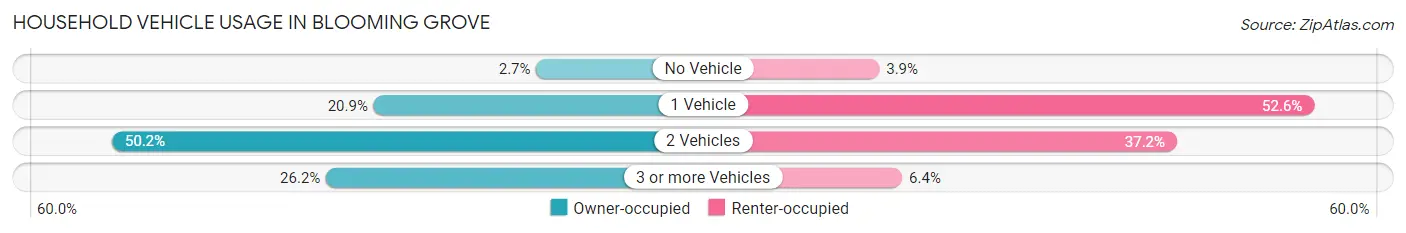
| Vehicles per Household | Owner-occupied | Renter-occupied |
| No Vehicle | 6 (2.7%) | 3 (3.8%) |
| 1 Vehicle | 47 (20.9%) | 41 (52.6%) |
| 2 Vehicles | 113 (50.2%) | 29 (37.2%) |
| 3 or more Vehicles | 59 (26.2%) | 5 (6.4%) |
| Total | 225 (100.0%) | 78 (100.0%) |
Real Estate & Mortgages in Blooming Grove
Real Estate and Mortgage Overview in Blooming Grove
| Characteristic | Without Mortgage | With Mortgage |
| Housing Units | 118 | 107 |
| Median Property Value | $74,100 | $149,600 |
| Median Household Income | $27,292 | $22 |
| Monthly Housing Costs | $390 | $0 |
| Real Estate Taxes | $1,105 | $2 |
Property Value by Mortgage Status in Blooming Grove
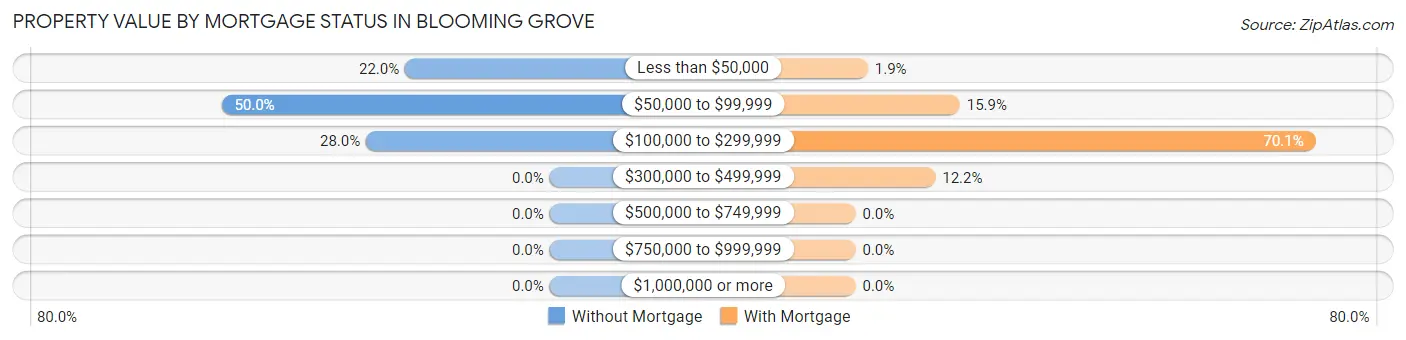
| Property Value | Without Mortgage | With Mortgage |
| Less than $50,000 | 26 (22.0%) | 2 (1.9%) |
| $50,000 to $99,999 | 59 (50.0%) | 17 (15.9%) |
| $100,000 to $299,999 | 33 (28.0%) | 75 (70.1%) |
| $300,000 to $499,999 | 0 (0.0%) | 13 (12.1%) |
| $500,000 to $749,999 | 0 (0.0%) | 0 (0.0%) |
| $750,000 to $999,999 | 0 (0.0%) | 0 (0.0%) |
| $1,000,000 or more | 0 (0.0%) | 0 (0.0%) |
| Total | 118 (100.0%) | 107 (100.0%) |
Household Income by Mortgage Status in Blooming Grove
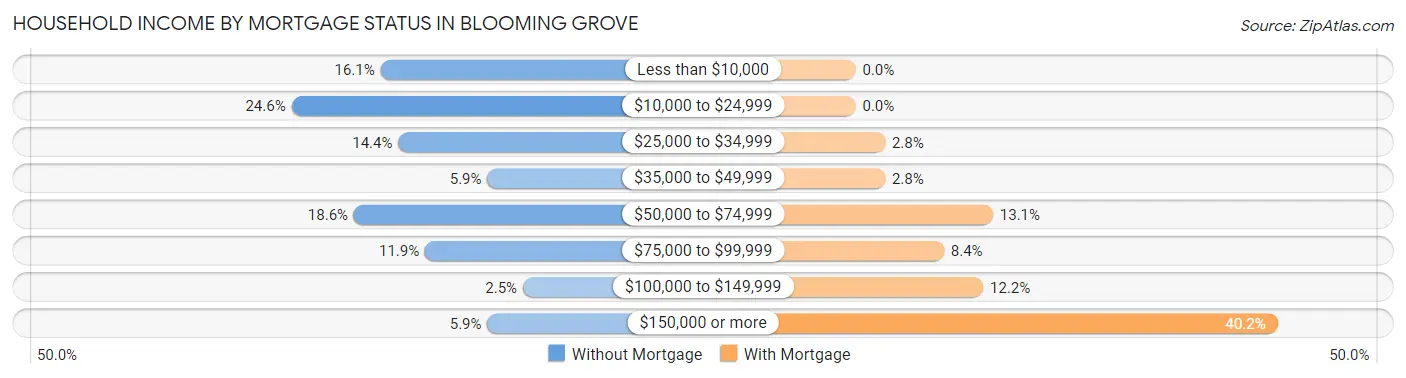
| Household Income | Without Mortgage | With Mortgage |
| Less than $10,000 | 19 (16.1%) | 0 (0.0%) |
| $10,000 to $24,999 | 29 (24.6%) | 0 (0.0%) |
| $25,000 to $34,999 | 17 (14.4%) | 3 (2.8%) |
| $35,000 to $49,999 | 7 (5.9%) | 3 (2.8%) |
| $50,000 to $74,999 | 22 (18.6%) | 14 (13.1%) |
| $75,000 to $99,999 | 14 (11.9%) | 9 (8.4%) |
| $100,000 to $149,999 | 3 (2.5%) | 13 (12.1%) |
| $150,000 or more | 7 (5.9%) | 43 (40.2%) |
| Total | 118 (100.0%) | 107 (100.0%) |
Property Value to Household Income Ratio in Blooming Grove
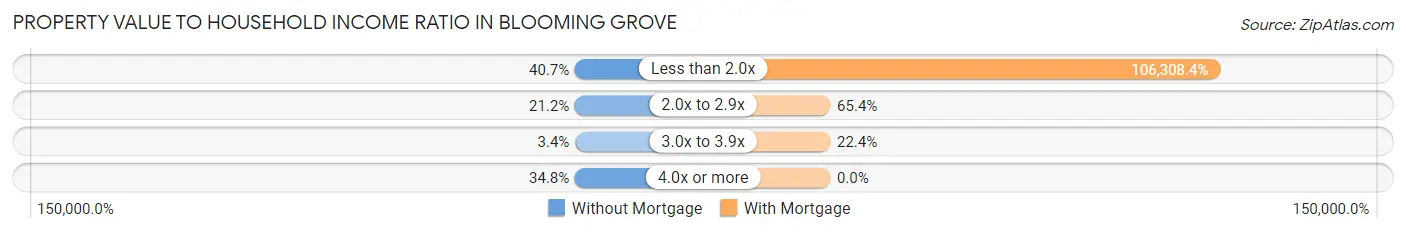
| Value-to-Income Ratio | Without Mortgage | With Mortgage |
| Less than 2.0x | 48 (40.7%) | 113,750 (106,308.4%) |
| 2.0x to 2.9x | 25 (21.2%) | 70 (65.4%) |
| 3.0x to 3.9x | 4 (3.4%) | 24 (22.4%) |
| 4.0x or more | 41 (34.7%) | 0 (0.0%) |
| Total | 118 (100.0%) | 107 (100.0%) |
Real Estate Taxes by Mortgage Status in Blooming Grove
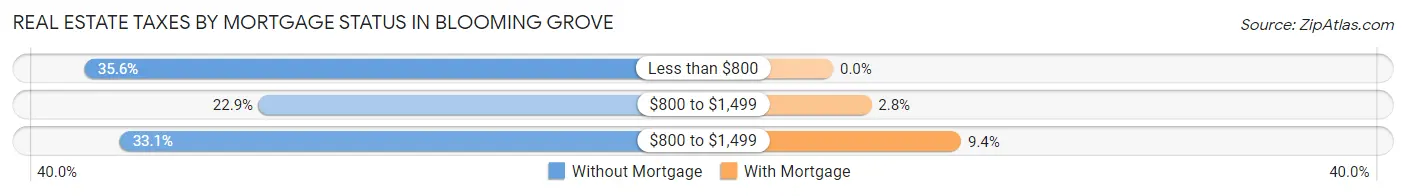
| Property Taxes | Without Mortgage | With Mortgage |
| Less than $800 | 42 (35.6%) | 0 (0.0%) |
| $800 to $1,499 | 27 (22.9%) | 3 (2.8%) |
| $800 to $1,499 | 39 (33.1%) | 10 (9.3%) |
| Total | 118 (100.0%) | 107 (100.0%) |
Health & Disability in Blooming Grove
Health Insurance Coverage by Age in Blooming Grove
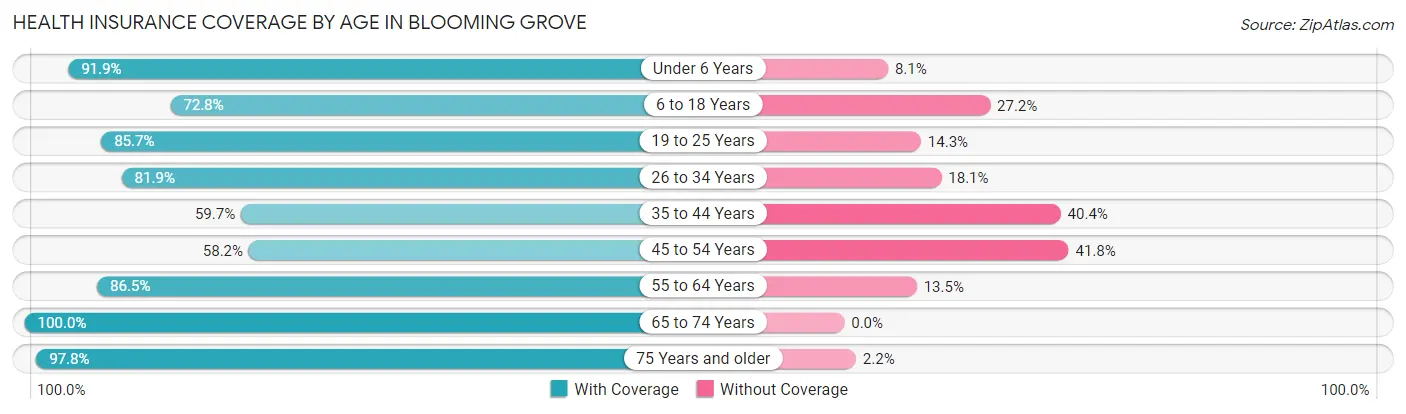
| Age Bracket | With Coverage | Without Coverage |
| Under 6 Years | 79 (91.9%) | 7 (8.1%) |
| 6 to 18 Years | 83 (72.8%) | 31 (27.2%) |
| 19 to 25 Years | 66 (85.7%) | 11 (14.3%) |
| 26 to 34 Years | 86 (81.9%) | 19 (18.1%) |
| 35 to 44 Years | 34 (59.7%) | 23 (40.4%) |
| 45 to 54 Years | 64 (58.2%) | 46 (41.8%) |
| 55 to 64 Years | 96 (86.5%) | 15 (13.5%) |
| 65 to 74 Years | 58 (100.0%) | 0 (0.0%) |
| 75 Years and older | 45 (97.8%) | 1 (2.2%) |
| Total | 611 (80.0%) | 153 (20.0%) |
Health Insurance Coverage by Citizenship Status in Blooming Grove
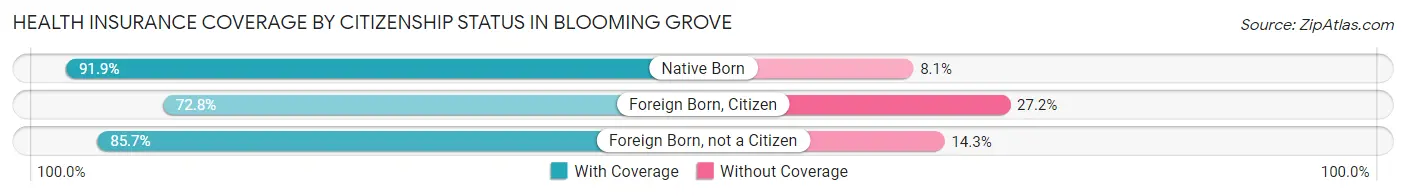
| Citizenship Status | With Coverage | Without Coverage |
| Native Born | 79 (91.9%) | 7 (8.1%) |
| Foreign Born, Citizen | 83 (72.8%) | 31 (27.2%) |
| Foreign Born, not a Citizen | 66 (85.7%) | 11 (14.3%) |
Health Insurance Coverage by Household Income in Blooming Grove
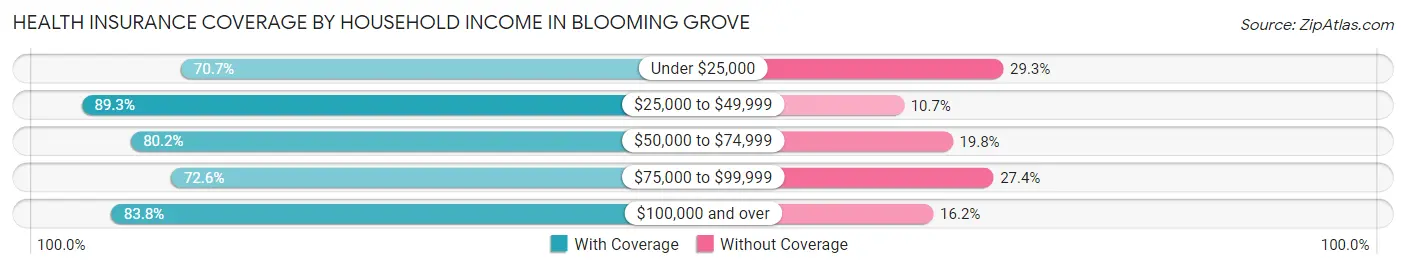
| Household Income | With Coverage | Without Coverage |
| Under $25,000 | 70 (70.7%) | 29 (29.3%) |
| $25,000 to $49,999 | 109 (89.3%) | 13 (10.7%) |
| $50,000 to $74,999 | 77 (80.2%) | 19 (19.8%) |
| $75,000 to $99,999 | 127 (72.6%) | 48 (27.4%) |
| $100,000 and over | 228 (83.8%) | 44 (16.2%) |
Public vs Private Health Insurance Coverage by Age in Blooming Grove
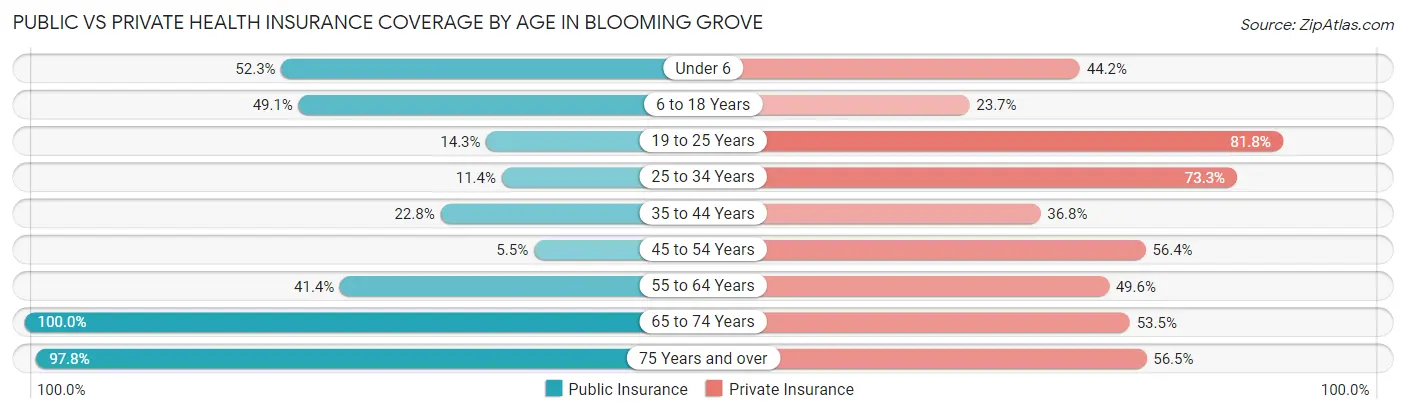
| Age Bracket | Public Insurance | Private Insurance |
| Under 6 | 45 (52.3%) | 38 (44.2%) |
| 6 to 18 Years | 56 (49.1%) | 27 (23.7%) |
| 19 to 25 Years | 11 (14.3%) | 63 (81.8%) |
| 25 to 34 Years | 12 (11.4%) | 77 (73.3%) |
| 35 to 44 Years | 13 (22.8%) | 21 (36.8%) |
| 45 to 54 Years | 6 (5.4%) | 62 (56.4%) |
| 55 to 64 Years | 46 (41.4%) | 55 (49.5%) |
| 65 to 74 Years | 58 (100.0%) | 31 (53.4%) |
| 75 Years and over | 45 (97.8%) | 26 (56.5%) |
| Total | 292 (38.2%) | 400 (52.4%) |
Disability Status by Sex by Age in Blooming Grove
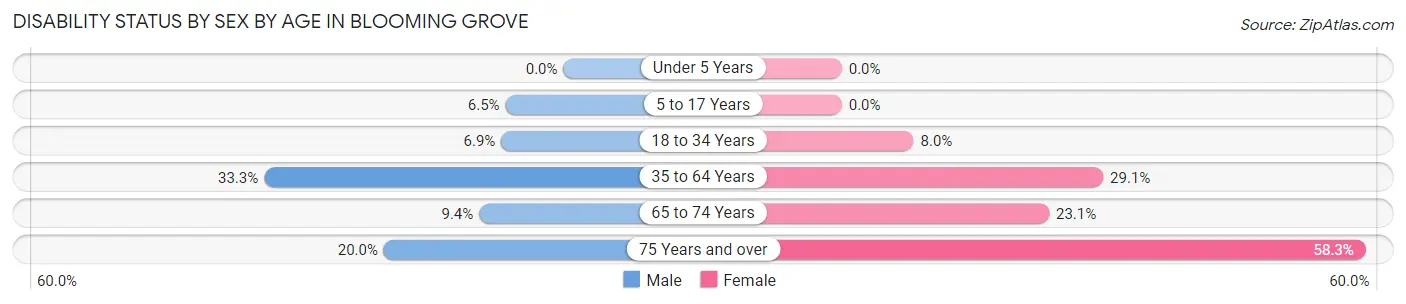
| Age Bracket | Male | Female |
| Under 5 Years | 0 (0.0%) | 0 (0.0%) |
| 5 to 17 Years | 2 (6.5%) | 0 (0.0%) |
| 18 to 34 Years | 9 (6.9%) | 6 (8.0%) |
| 35 to 64 Years | 40 (33.3%) | 46 (29.1%) |
| 65 to 74 Years | 3 (9.4%) | 6 (23.1%) |
| 75 Years and over | 2 (20.0%) | 21 (58.3%) |
Disability Class by Sex by Age in Blooming Grove
Disability Class: Hearing Difficulty
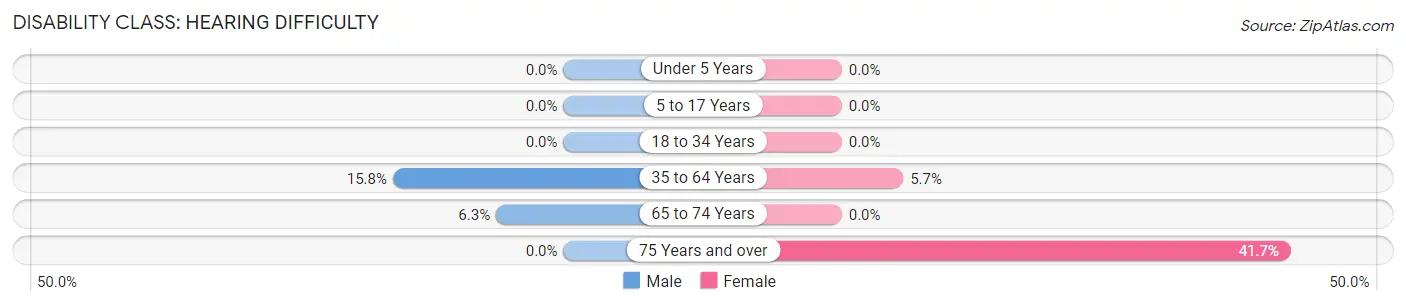
| Age Bracket | Male | Female |
| Under 5 Years | 0 (0.0%) | 0 (0.0%) |
| 5 to 17 Years | 0 (0.0%) | 0 (0.0%) |
| 18 to 34 Years | 0 (0.0%) | 0 (0.0%) |
| 35 to 64 Years | 19 (15.8%) | 9 (5.7%) |
| 65 to 74 Years | 2 (6.2%) | 0 (0.0%) |
| 75 Years and over | 0 (0.0%) | 15 (41.7%) |
Disability Class: Vision Difficulty
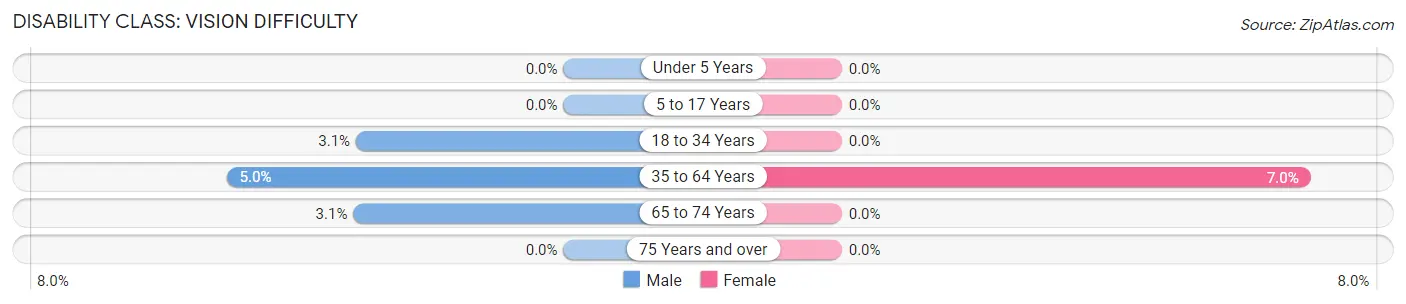
| Age Bracket | Male | Female |
| Under 5 Years | 0 (0.0%) | 0 (0.0%) |
| 5 to 17 Years | 0 (0.0%) | 0 (0.0%) |
| 18 to 34 Years | 4 (3.1%) | 0 (0.0%) |
| 35 to 64 Years | 6 (5.0%) | 11 (7.0%) |
| 65 to 74 Years | 1 (3.1%) | 0 (0.0%) |
| 75 Years and over | 0 (0.0%) | 0 (0.0%) |
Disability Class: Cognitive Difficulty
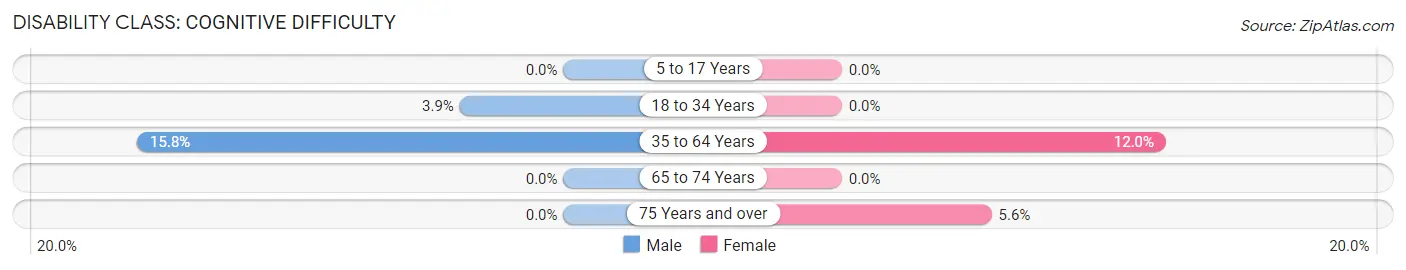
| Age Bracket | Male | Female |
| 5 to 17 Years | 0 (0.0%) | 0 (0.0%) |
| 18 to 34 Years | 5 (3.8%) | 0 (0.0%) |
| 35 to 64 Years | 19 (15.8%) | 19 (12.0%) |
| 65 to 74 Years | 0 (0.0%) | 0 (0.0%) |
| 75 Years and over | 0 (0.0%) | 2 (5.6%) |
Disability Class: Ambulatory Difficulty
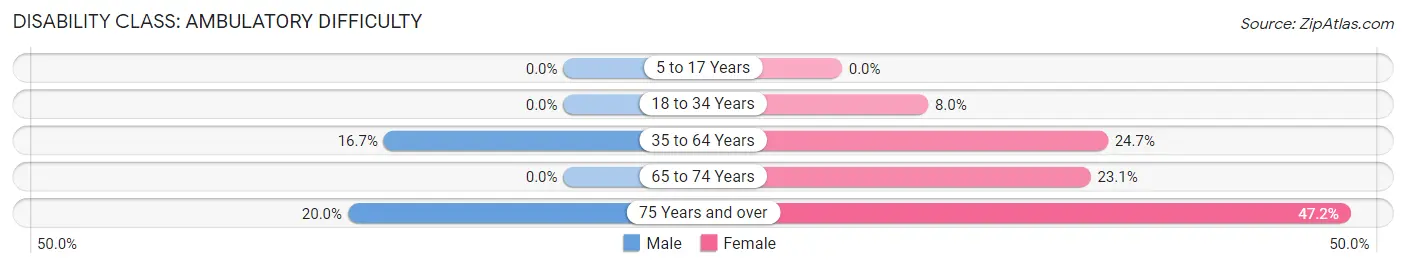
| Age Bracket | Male | Female |
| 5 to 17 Years | 0 (0.0%) | 0 (0.0%) |
| 18 to 34 Years | 0 (0.0%) | 6 (8.0%) |
| 35 to 64 Years | 20 (16.7%) | 39 (24.7%) |
| 65 to 74 Years | 0 (0.0%) | 6 (23.1%) |
| 75 Years and over | 2 (20.0%) | 17 (47.2%) |
Disability Class: Self-Care Difficulty
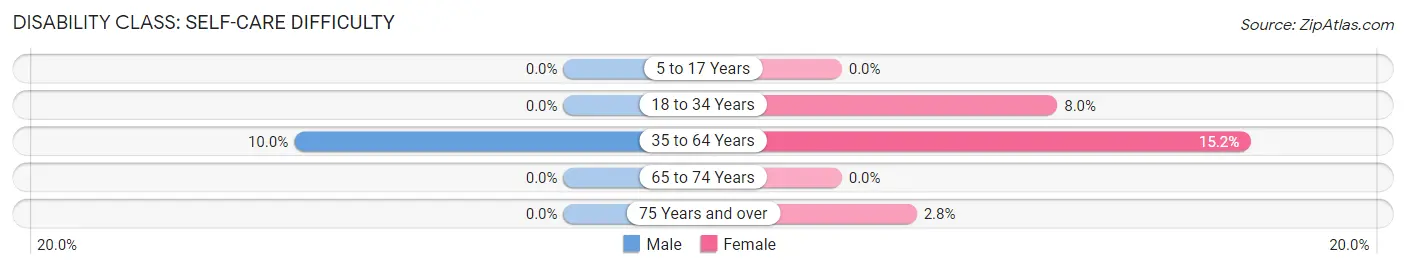
| Age Bracket | Male | Female |
| 5 to 17 Years | 0 (0.0%) | 0 (0.0%) |
| 18 to 34 Years | 0 (0.0%) | 6 (8.0%) |
| 35 to 64 Years | 12 (10.0%) | 24 (15.2%) |
| 65 to 74 Years | 0 (0.0%) | 0 (0.0%) |
| 75 Years and over | 0 (0.0%) | 1 (2.8%) |
Technology Access in Blooming Grove
Computing Device Access in Blooming Grove
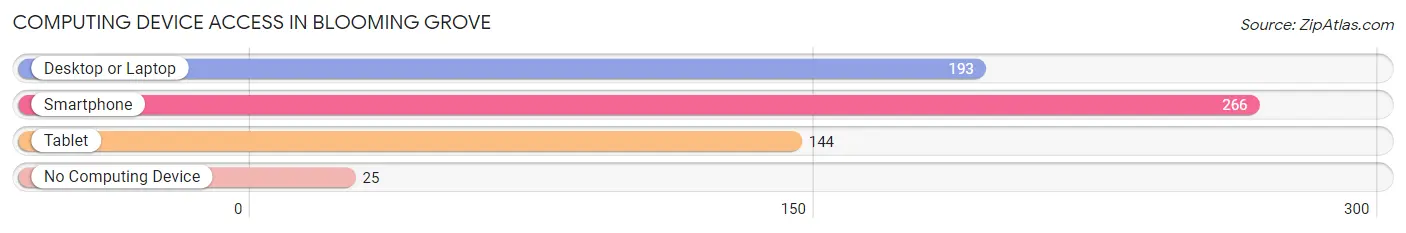
| Device Type | # Households | % Households |
| Desktop or Laptop | 193 | 63.7% |
| Smartphone | 266 | 87.8% |
| Tablet | 144 | 47.5% |
| No Computing Device | 25 | 8.3% |
| Total | 303 | 100.0% |
Internet Access in Blooming Grove
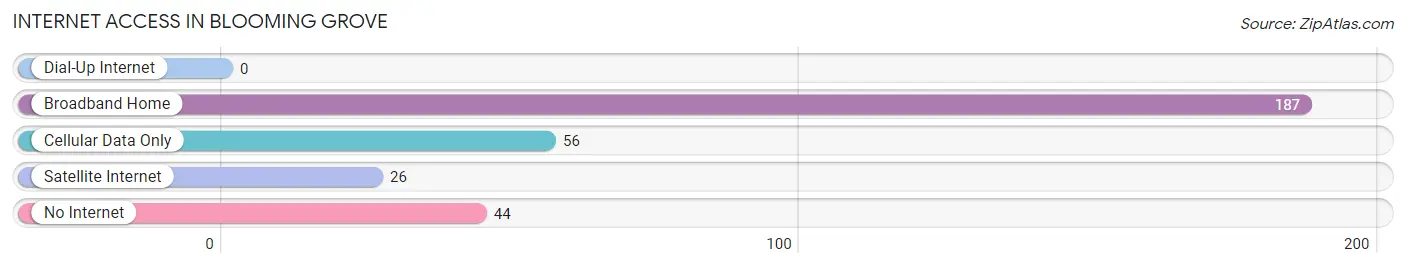
| Internet Type | # Households | % Households |
| Dial-Up Internet | 0 | 0.0% |
| Broadband Home | 187 | 61.7% |
| Cellular Data Only | 56 | 18.5% |
| Satellite Internet | 26 | 8.6% |
| No Internet | 44 | 14.5% |
| Total | 303 | 100.0% |
Blooming Grove Summary
Blooming Grove is a small town located in Navarro County, Texas, United States. The town is situated about halfway between Dallas and Waco, and is part of the Corsicana Micropolitan Statistical Area. As of the 2010 census, the population of Blooming Grove was 1,061.
History
The area that is now Blooming Grove was first settled in the 1840s by a group of German immigrants. The town was originally known as “Germantown”, but was later renamed Blooming Grove in 1873. The name was chosen to reflect the abundance of wildflowers that grew in the area.
In 1881, the town was officially incorporated, and the first post office was established. The town quickly grew, and by the early 1900s, it had become a thriving agricultural center. The town was home to several cotton gins, a gristmill, and a number of other businesses.
Geography
Blooming Grove is located in Navarro County, Texas, at the intersection of State Highway 22 and Farm to Market Road 744. The town is situated about halfway between Dallas and Waco, and is part of the Corsicana Micropolitan Statistical Area.
The town has a total area of 1.2 square miles, all of which is land. The terrain is mostly flat, with some rolling hills. The town is located in the Blackland Prairie region of Texas, and is known for its fertile soil and abundant wildlife.
Economy
The economy of Blooming Grove is largely based on agriculture. The town is home to several cotton gins, a gristmill, and a number of other businesses. The town is also home to a number of small businesses, including restaurants, retail stores, and service providers.
Demographics
As of the 2010 census, the population of Blooming Grove was 1,061. The racial makeup of the town was 79.2% White, 16.2% African American, 0.7% Native American, 0.3% Asian, 0.1% Pacific Islander, and 3.5% from other races. Hispanic or Latino of any race were 5.2% of the population.
The median income for a household in the town was $31,250, and the median income for a family was $37,500. The per capita income for the town was $15,945. About 17.2% of families and 20.2% of the population were below the poverty line, including 28.3% of those under age 18 and 11.3% of those age 65 or over.
Common Questions
What is Per Capita Income in Blooming Grove?
Per Capita income in Blooming Grove is $38,145.
What is the Median Family Income in Blooming Grove?
Median Family Income in Blooming Grove is $86,250.
What is the Median Household income in Blooming Grove?
Median Household Income in Blooming Grove is $68,125.
What is Income or Wage Gap in Blooming Grove?
Income or Wage Gap in Blooming Grove is 57.5%.
Women in Blooming Grove earn 42.5 cents for every dollar earned by a man.
What is Inequality or Gini Index in Blooming Grove?
Inequality or Gini Index in Blooming Grove is 0.52.
What is the Total Population of Blooming Grove?
Total Population of Blooming Grove is 764.
What is the Total Male Population of Blooming Grove?
Total Male Population of Blooming Grove is 355.
What is the Total Female Population of Blooming Grove?
Total Female Population of Blooming Grove is 409.
What is the Ratio of Males per 100 Females in Blooming Grove?
There are 86.80 Males per 100 Females in Blooming Grove.
What is the Ratio of Females per 100 Males in Blooming Grove?
There are 115.21 Females per 100 Males in Blooming Grove.
What is the Median Population Age in Blooming Grove?
Median Population Age in Blooming Grove is 35.0 Years.
What is the Average Family Size in Blooming Grove
Average Family Size in Blooming Grove is 3.0 People.
What is the Average Household Size in Blooming Grove
Average Household Size in Blooming Grove is 2.5 People.
How Large is the Labor Force in Blooming Grove?
There are 360 People in the Labor Forcein in Blooming Grove.
What is the Percentage of People in the Labor Force in Blooming Grove?
60.7% of People are in the Labor Force in Blooming Grove.
What is the Unemployment Rate in Blooming Grove?
Unemployment Rate in Blooming Grove is 4.2%.