Blackwell, TX Map & Demographics
Blackwell Map
Blackwell Overview
$42,471
PER CAPITA INCOME
$46,071
AVG HOUSEHOLD INCOME
25.5%
WAGE / INCOME GAP [ % ]
74.5¢/ $1
WAGE / INCOME GAP [ $ ]
0.43
INEQUALITY / GINI INDEX
199
TOTAL POPULATION
126
MALE POPULATION
73
FEMALE POPULATION
172.60
MALES / 100 FEMALES
57.94
FEMALES / 100 MALES
52.1
MEDIAN AGE
2.7
AVG FAMILY SIZE
1.9
AVG HOUSEHOLD SIZE
102
LABOR FORCE [ PEOPLE ]
65.8%
PERCENT IN LABOR FORCE
Blackwell Zip Codes
Blackwell Area Codes
Income in Blackwell
Income Overview in Blackwell
| Characteristic | Number | Measure |
| Per Capita Income | 199 | $42,471 |
| Median Family Income | 57 | $0 |
| Mean Family Income | 57 | $89,579 |
| Median Household Income | 102 | $46,071 |
| Mean Household Income | 102 | $71,962 |
| Income Deficit | 57 | $0 |
| Wage / Income Gap (%) | 199 | 25.45% |
| Wage / Income Gap ($) | 199 | 74.55¢ per $1 |
| Gini / Inequality Index | 199 | 0.43 |
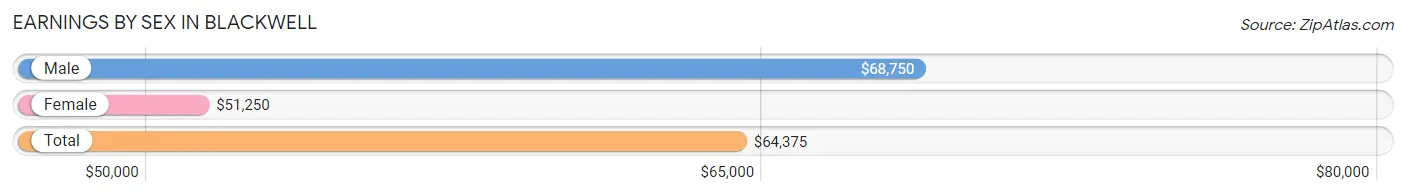
Earnings by Sex in Blackwell
Average Earnings in Blackwell are $64,375, $68,750 for men and $51,250 for women, a difference of 25.5%.
| Sex | Number | Average Earnings |
| Male | 79 (76.7%) | $68,750 |
| Female | 24 (23.3%) | $51,250 |
| Total | 103 (100.0%) | $64,375 |
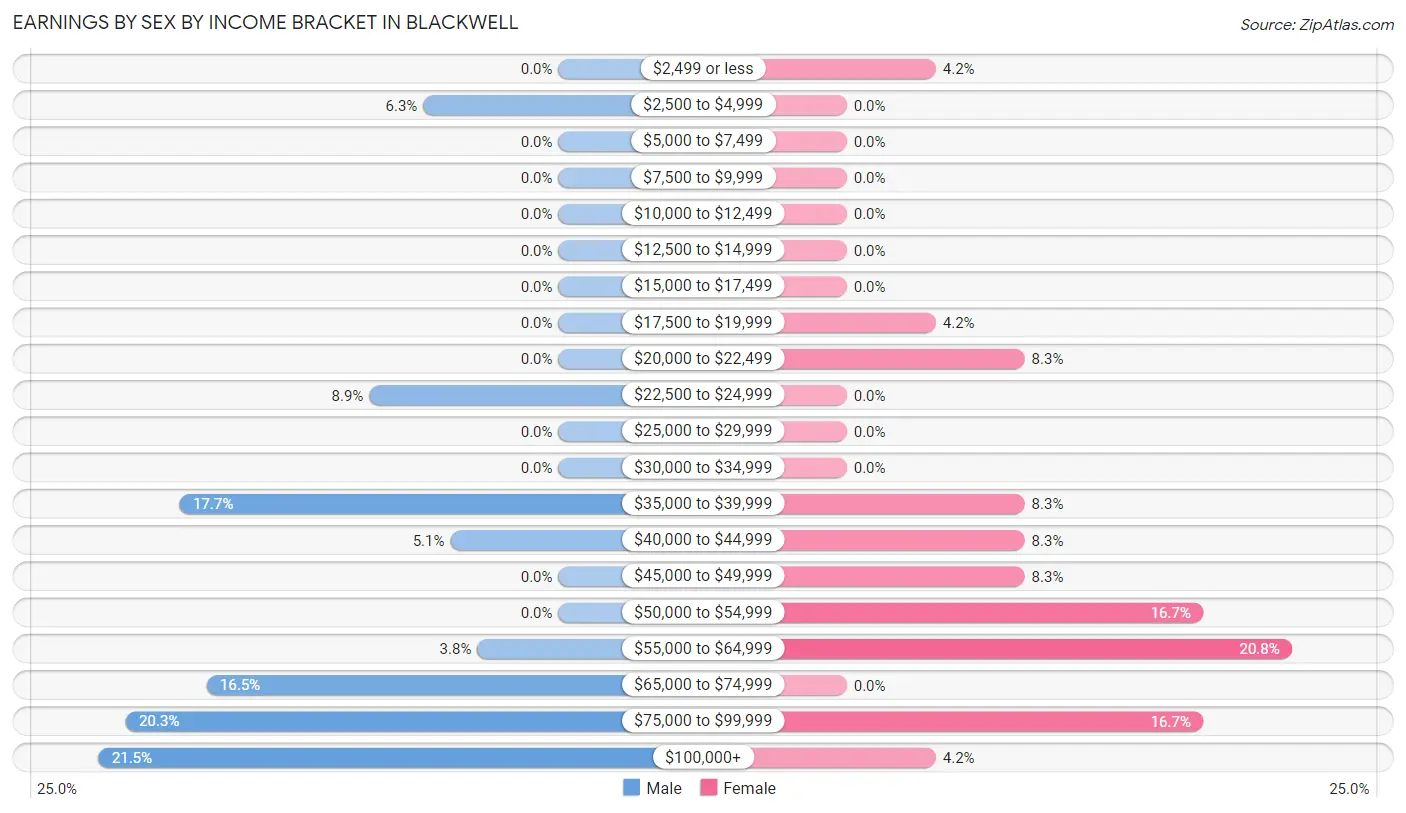
Earnings by Sex by Income Bracket in Blackwell
The most common earnings brackets in Blackwell are $100,000+ for men (17 | 21.5%) and $55,000 to $64,999 for women (5 | 20.8%).
| Income | Male | Female |
| $2,499 or less | 0 (0.0%) | 1 (4.2%) |
| $2,500 to $4,999 | 5 (6.3%) | 0 (0.0%) |
| $5,000 to $7,499 | 0 (0.0%) | 0 (0.0%) |
| $7,500 to $9,999 | 0 (0.0%) | 0 (0.0%) |
| $10,000 to $12,499 | 0 (0.0%) | 0 (0.0%) |
| $12,500 to $14,999 | 0 (0.0%) | 0 (0.0%) |
| $15,000 to $17,499 | 0 (0.0%) | 0 (0.0%) |
| $17,500 to $19,999 | 0 (0.0%) | 1 (4.2%) |
| $20,000 to $22,499 | 0 (0.0%) | 2 (8.3%) |
| $22,500 to $24,999 | 7 (8.9%) | 0 (0.0%) |
| $25,000 to $29,999 | 0 (0.0%) | 0 (0.0%) |
| $30,000 to $34,999 | 0 (0.0%) | 0 (0.0%) |
| $35,000 to $39,999 | 14 (17.7%) | 2 (8.3%) |
| $40,000 to $44,999 | 4 (5.1%) | 2 (8.3%) |
| $45,000 to $49,999 | 0 (0.0%) | 2 (8.3%) |
| $50,000 to $54,999 | 0 (0.0%) | 4 (16.7%) |
| $55,000 to $64,999 | 3 (3.8%) | 5 (20.8%) |
| $65,000 to $74,999 | 13 (16.5%) | 0 (0.0%) |
| $75,000 to $99,999 | 16 (20.3%) | 4 (16.7%) |
| $100,000+ | 17 (21.5%) | 1 (4.2%) |
| Total | 79 (100.0%) | 24 (100.0%) |
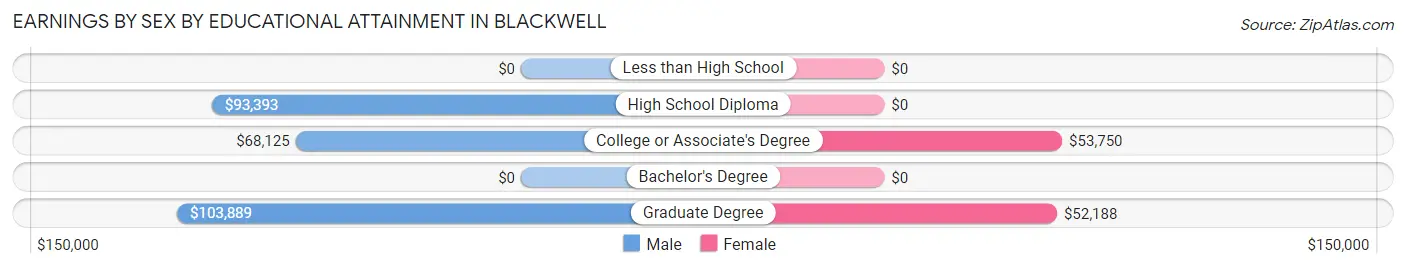
Earnings by Sex by Educational Attainment in Blackwell
Average earnings in Blackwell are $68,750 for men and $51,250 for women, a difference of 25.5%. Men with an educational attainment of graduate degree enjoy the highest average annual earnings of $103,889, while those with college or associate's degree education earn the least with $68,125. Women with an educational attainment of college or associate's degree earn the most with the average annual earnings of $53,750, while those with graduate degree education have the smallest earnings of $52,188.
| Educational Attainment | Male Income | Female Income |
| Less than High School | - | - |
| High School Diploma | $93,393 | $0 |
| College or Associate's Degree | $68,125 | $53,750 |
| Bachelor's Degree | - | - |
| Graduate Degree | $103,889 | $52,188 |
| Total | $68,750 | $51,250 |
Family Income in Blackwell
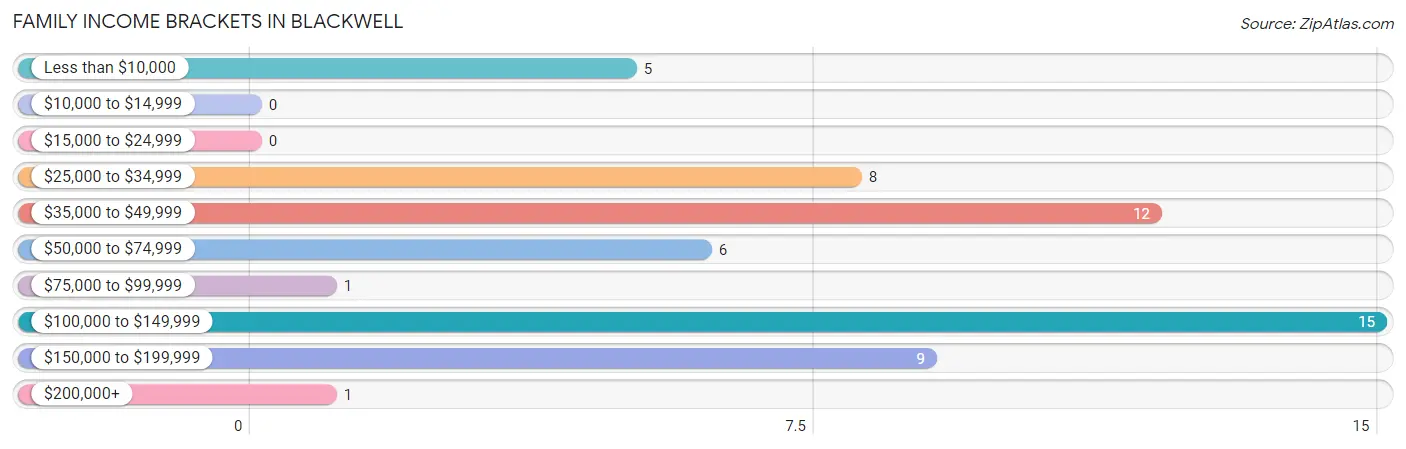
Family Income Brackets in Blackwell
According to the Blackwell family income data, there are 15 families falling into the $100,000 to $149,999 income range, which is the most common income bracket and makes up 26.3% of all families.
| Income Bracket | # Families | % Families |
| Less than $10,000 | 5 | 8.8% |
| $10,000 to $14,999 | 0 | 0.0% |
| $15,000 to $24,999 | 0 | 0.0% |
| $25,000 to $34,999 | 8 | 14.0% |
| $35,000 to $49,999 | 12 | 21.1% |
| $50,000 to $74,999 | 6 | 10.5% |
| $75,000 to $99,999 | 1 | 1.8% |
| $100,000 to $149,999 | 15 | 26.3% |
| $150,000 to $199,999 | 9 | 15.8% |
| $200,000+ | 1 | 1.8% |
Family Income by Famaliy Size in Blackwell
| Income Bracket | # Families | Median Income |
| 2-Person Families | 36 (63.2%) | $0 |
| 3-Person Families | 15 (26.3%) | $0 |
| 4-Person Families | 6 (10.5%) | $0 |
| 5-Person Families | 0 (0.0%) | $0 |
| 6-Person Families | 0 (0.0%) | $0 |
| 7+ Person Families | 0 (0.0%) | $0 |
| Total | 57 (100.0%) | $0 |
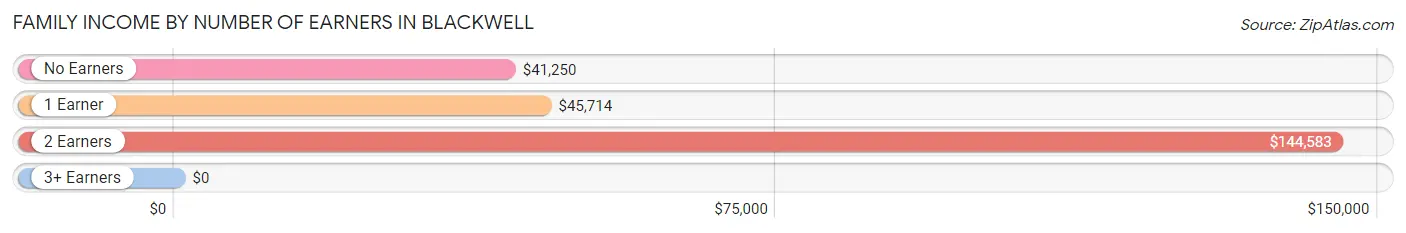
Family Income by Number of Earners in Blackwell
| Number of Earners | # Families | Median Income |
| No Earners | 16 (28.1%) | $41,250 |
| 1 Earner | 20 (35.1%) | $45,714 |
| 2 Earners | 21 (36.8%) | $144,583 |
| 3+ Earners | 0 (0.0%) | $0 |
| Total | 57 (100.0%) | $0 |
Household Income in Blackwell
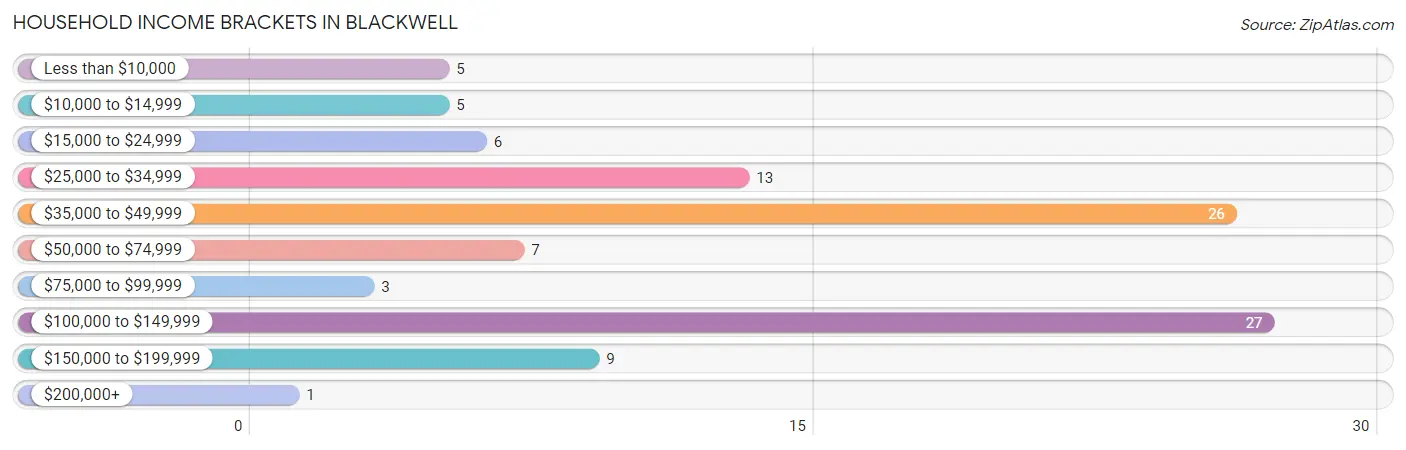
Household Income Brackets in Blackwell
With 27 households falling in the category, the $100,000 to $149,999 income range is the most frequent in Blackwell, accounting for 26.5% of all households. In contrast, only 1 households (1.0%) fall into the $200,000+ income bracket, making it the least populous group.
| Income Bracket | # Households | % Households |
| Less than $10,000 | 5 | 4.9% |
| $10,000 to $14,999 | 5 | 4.9% |
| $15,000 to $24,999 | 6 | 5.9% |
| $25,000 to $34,999 | 13 | 12.7% |
| $35,000 to $49,999 | 26 | 25.5% |
| $50,000 to $74,999 | 7 | 6.9% |
| $75,000 to $99,999 | 3 | 2.9% |
| $100,000 to $149,999 | 27 | 26.5% |
| $150,000 to $199,999 | 9 | 8.8% |
| $200,000+ | 1 | 1.0% |
Household Income by Householder Age in Blackwell
| Income Bracket | # Households | Median Income |
| 15 to 24 Years | 0 (0.0%) | $0 |
| 25 to 44 Years | 21 (20.6%) | $0 |
| 45 to 64 Years | 36 (35.3%) | $0 |
| 65+ Years | 45 (44.1%) | $0 |
| Total | 102 (100.0%) | $46,071 |
Poverty in Blackwell
Income Below Poverty by Sex and Age in Blackwell
With 4.0% poverty level for males and 21.9% for females among the residents of Blackwell, 35 to 44 year old males and 6 to 11 year old females are the most vulnerable to poverty, with 5 males (35.7%) and 11 females (100.0%) in their respective age groups living below the poverty level.
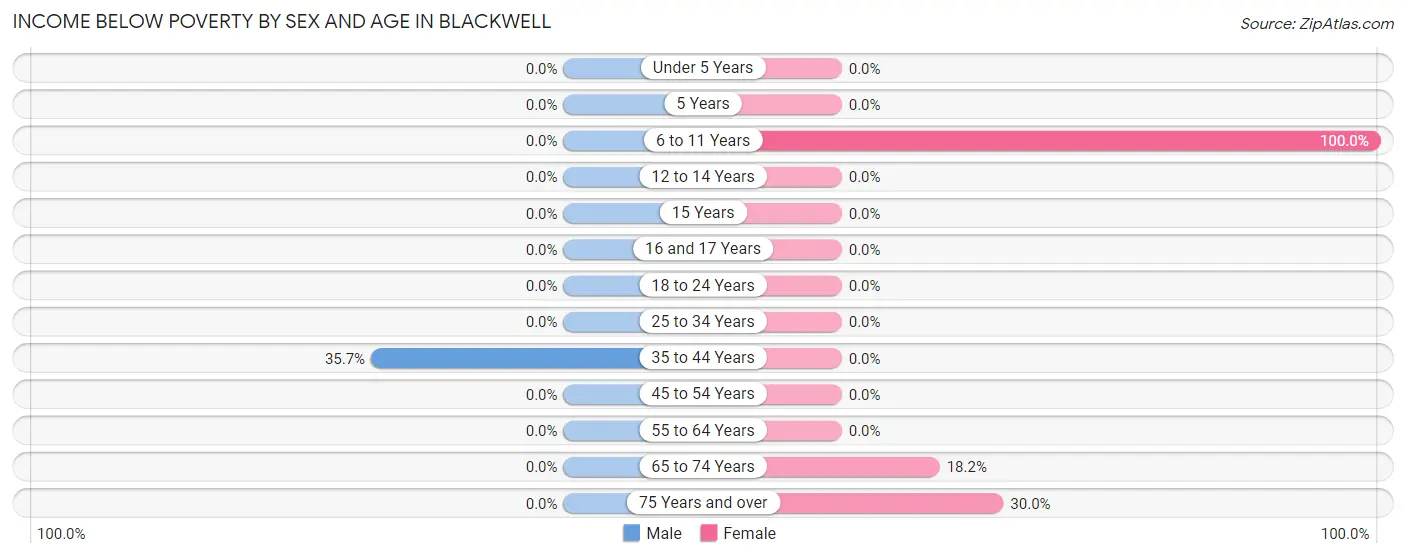
| Age Bracket | Male | Female |
| Under 5 Years | 0 (0.0%) | 0 (0.0%) |
| 5 Years | 0 (0.0%) | 0 (0.0%) |
| 6 to 11 Years | 0 (0.0%) | 11 (100.0%) |
| 12 to 14 Years | 0 (0.0%) | 0 (0.0%) |
| 15 Years | 0 (0.0%) | 0 (0.0%) |
| 16 and 17 Years | 0 (0.0%) | 0 (0.0%) |
| 18 to 24 Years | 0 (0.0%) | 0 (0.0%) |
| 25 to 34 Years | 0 (0.0%) | 0 (0.0%) |
| 35 to 44 Years | 5 (35.7%) | 0 (0.0%) |
| 45 to 54 Years | 0 (0.0%) | 0 (0.0%) |
| 55 to 64 Years | 0 (0.0%) | 0 (0.0%) |
| 65 to 74 Years | 0 (0.0%) | 2 (18.2%) |
| 75 Years and over | 0 (0.0%) | 3 (30.0%) |
| Total | 5 (4.0%) | 16 (21.9%) |
Income Above Poverty by Sex and Age in Blackwell
According to the poverty statistics in Blackwell, males aged under 5 years and females aged under 5 years are the age groups that are most secure financially, with 100.0% of males and 100.0% of females in these age groups living above the poverty line.
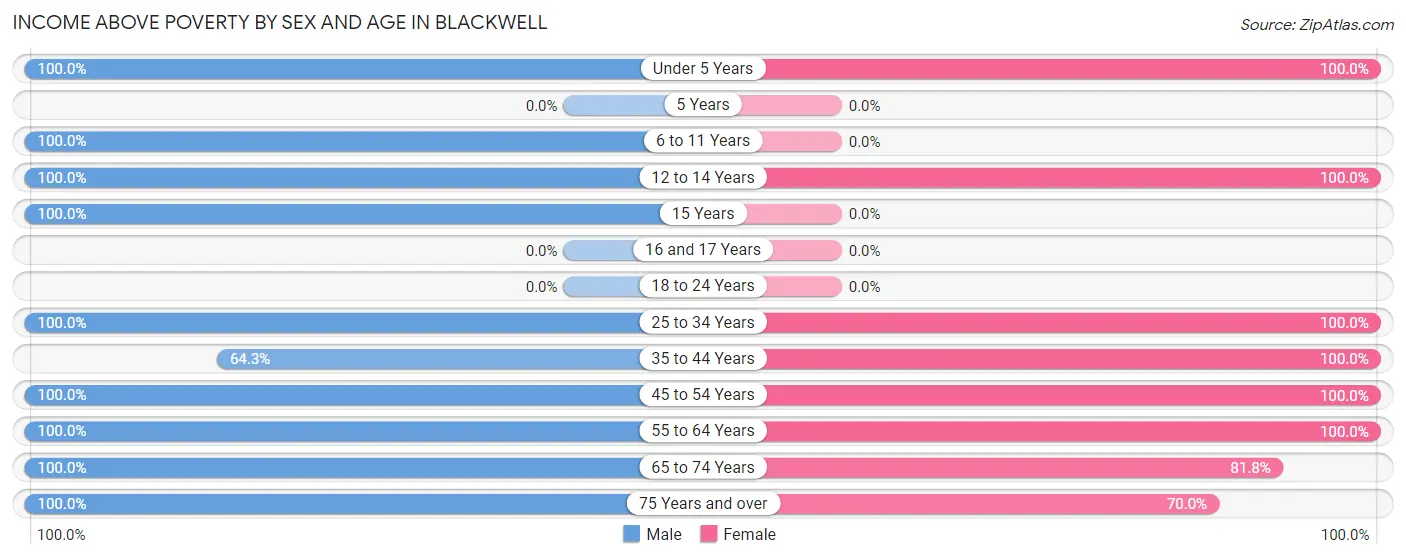
| Age Bracket | Male | Female |
| Under 5 Years | 7 (100.0%) | 3 (100.0%) |
| 5 Years | 0 (0.0%) | 0 (0.0%) |
| 6 to 11 Years | 11 (100.0%) | 0 (0.0%) |
| 12 to 14 Years | 1 (100.0%) | 7 (100.0%) |
| 15 Years | 4 (100.0%) | 0 (0.0%) |
| 16 and 17 Years | 0 (0.0%) | 0 (0.0%) |
| 18 to 24 Years | 0 (0.0%) | 0 (0.0%) |
| 25 to 34 Years | 18 (100.0%) | 7 (100.0%) |
| 35 to 44 Years | 9 (64.3%) | 2 (100.0%) |
| 45 to 54 Years | 18 (100.0%) | 10 (100.0%) |
| 55 to 64 Years | 16 (100.0%) | 12 (100.0%) |
| 65 to 74 Years | 24 (100.0%) | 9 (81.8%) |
| 75 Years and over | 13 (100.0%) | 7 (70.0%) |
| Total | 121 (96.0%) | 57 (78.1%) |
Income Below Poverty Among Married-Couple Families in Blackwell
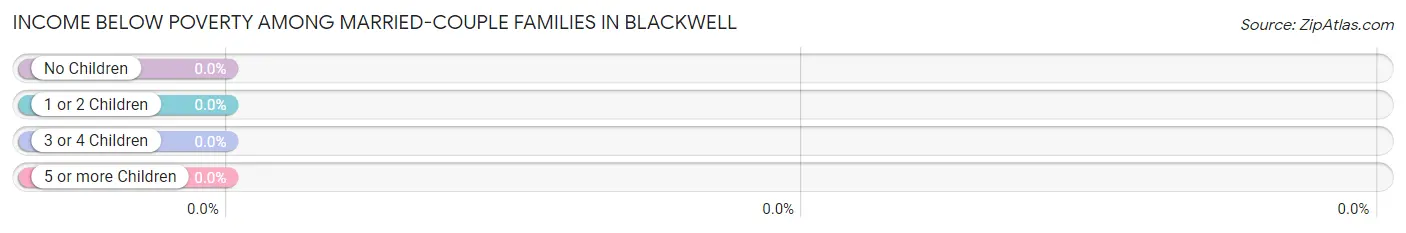
| Children | Above Poverty | Below Poverty |
| No Children | 31 (100.0%) | 0 (0.0%) |
| 1 or 2 Children | 8 (100.0%) | 0 (0.0%) |
| 3 or 4 Children | 0 (0.0%) | 0 (0.0%) |
| 5 or more Children | 0 (0.0%) | 0 (0.0%) |
| Total | 39 (100.0%) | 0 (0.0%) |
Income Below Poverty Among Single-Parent Households in Blackwell
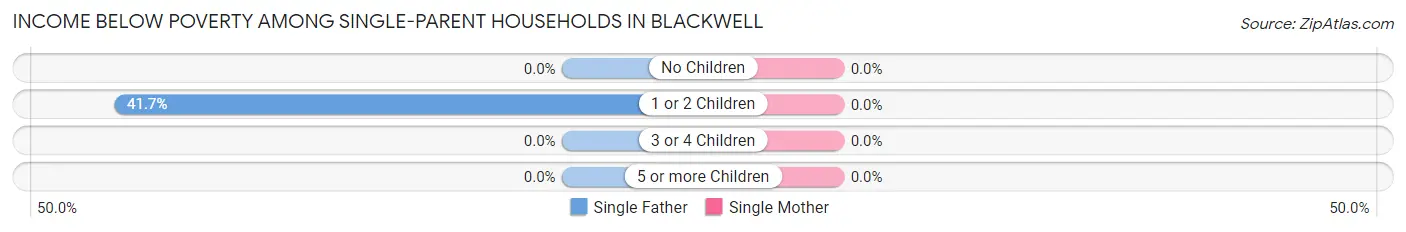
| Children | Single Father | Single Mother |
| No Children | 0 (0.0%) | 0 (0.0%) |
| 1 or 2 Children | 5 (41.7%) | 0 (0.0%) |
| 3 or 4 Children | 0 (0.0%) | 0 (0.0%) |
| 5 or more Children | 0 (0.0%) | 0 (0.0%) |
| Total | 5 (41.7%) | 0 (0.0%) |
Income Below Poverty Among Married-Couple vs Single-Parent Households in Blackwell
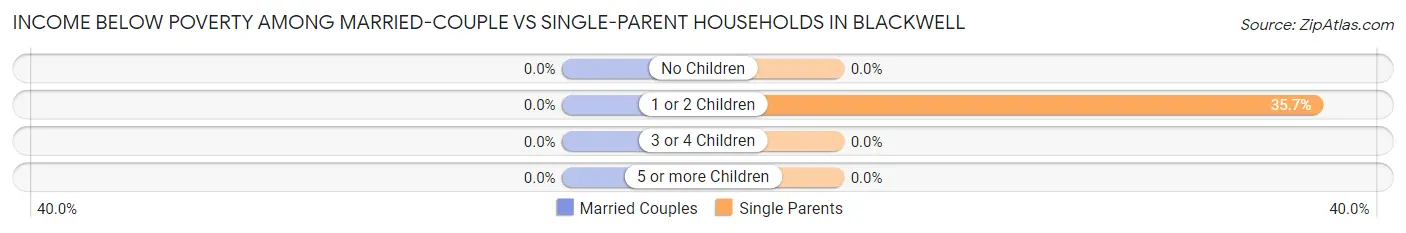
| Children | Married-Couple Families | Single-Parent Households |
| No Children | 0 (0.0%) | 0 (0.0%) |
| 1 or 2 Children | 0 (0.0%) | 5 (35.7%) |
| 3 or 4 Children | 0 (0.0%) | 0 (0.0%) |
| 5 or more Children | 0 (0.0%) | 0 (0.0%) |
| Total | 0 (0.0%) | 5 (27.8%) |
Race in Blackwell
The most populous races in Blackwell are White / Caucasian (184 | 92.5%), Hispanic or Latino (26 | 13.1%), and Some other Race (14 | 7.0%).
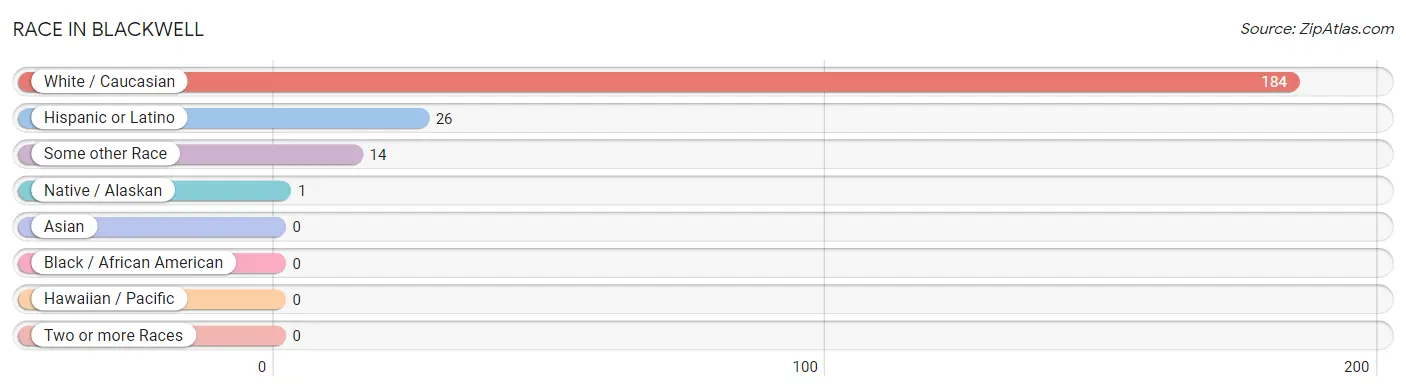
| Race | # Population | % Population |
| Asian | 0 | 0.0% |
| Black / African American | 0 | 0.0% |
| Hawaiian / Pacific | 0 | 0.0% |
| Hispanic or Latino | 26 | 13.1% |
| Native / Alaskan | 1 | 0.5% |
| White / Caucasian | 184 | 92.5% |
| Two or more Races | 0 | 0.0% |
| Some other Race | 14 | 7.0% |
| Total | 199 | 100.0% |
Ancestry in Blackwell
The most populous ancestries reported in Blackwell are German (59 | 29.6%), Irish (18 | 9.0%), American (16 | 8.0%), Mexican (12 | 6.0%), and English (10 | 5.0%), together accounting for 57.8% of all Blackwell residents.
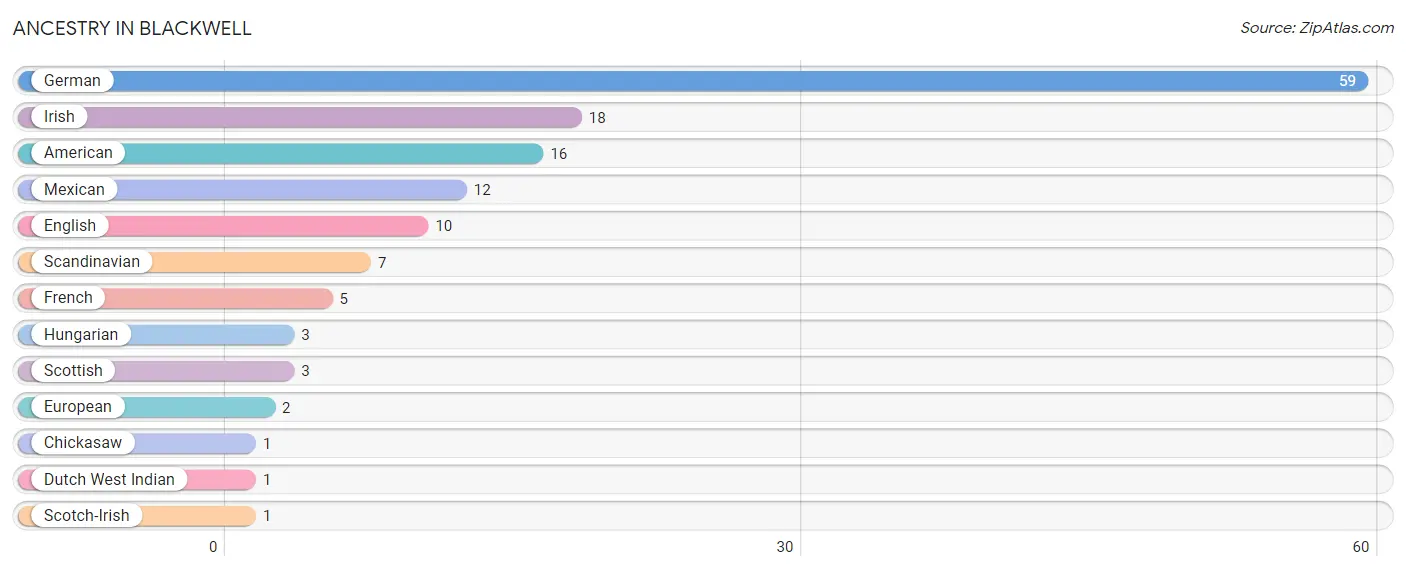
| Ancestry | # Population | % Population |
| American | 16 | 8.0% |
| Chickasaw | 1 | 0.5% |
| Dutch West Indian | 1 | 0.5% |
| English | 10 | 5.0% |
| European | 2 | 1.0% |
| French | 5 | 2.5% |
| German | 59 | 29.6% |
| Hungarian | 3 | 1.5% |
| Irish | 18 | 9.0% |
| Mexican | 12 | 6.0% |
| Scandinavian | 7 | 3.5% |
| Scotch-Irish | 1 | 0.5% |
| Scottish | 3 | 1.5% | View All 13 Rows |
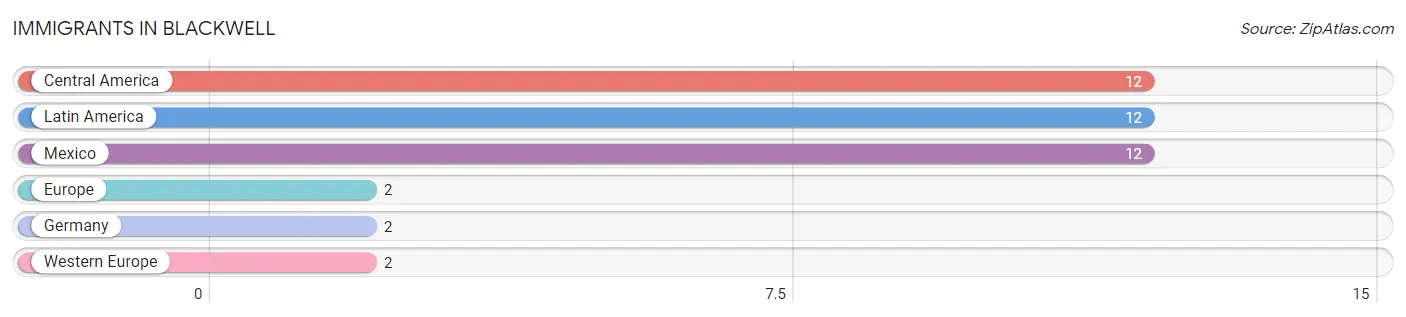
Immigrants in Blackwell
The most numerous immigrant groups reported in Blackwell came from Central America (12 | 6.0%), Latin America (12 | 6.0%), Mexico (12 | 6.0%), Europe (2 | 1.0%), and Germany (2 | 1.0%), together accounting for 20.1% of all Blackwell residents.
| Immigration Origin | # Population | % Population |
| Central America | 12 | 6.0% |
| Europe | 2 | 1.0% |
| Germany | 2 | 1.0% |
| Latin America | 12 | 6.0% |
| Mexico | 12 | 6.0% |
| Western Europe | 2 | 1.0% | View All 6 Rows |
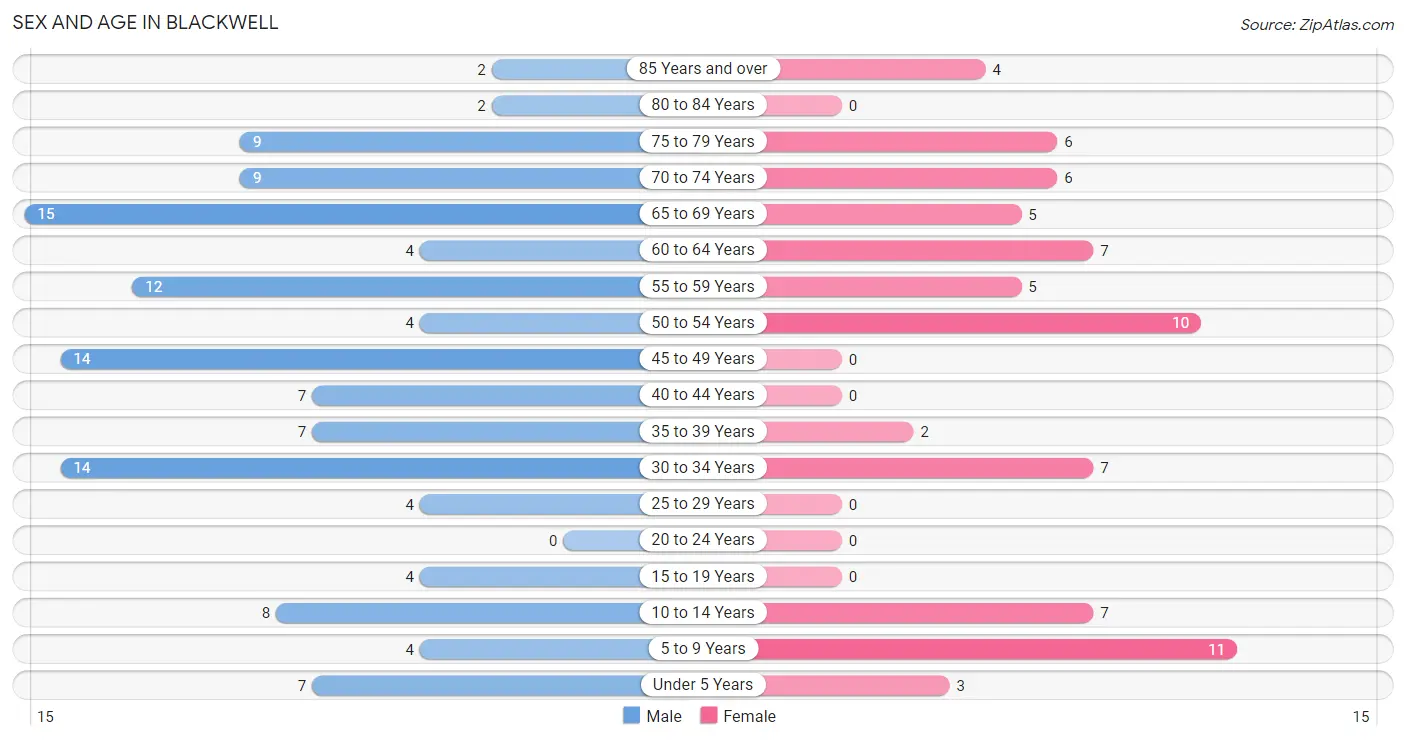
Sex and Age in Blackwell
Sex and Age in Blackwell
The most populous age groups in Blackwell are 65 to 69 Years (15 | 11.9%) for men and 5 to 9 Years (11 | 15.1%) for women.
| Age Bracket | Male | Female |
| Under 5 Years | 7 (5.6%) | 3 (4.1%) |
| 5 to 9 Years | 4 (3.2%) | 11 (15.1%) |
| 10 to 14 Years | 8 (6.4%) | 7 (9.6%) |
| 15 to 19 Years | 4 (3.2%) | 0 (0.0%) |
| 20 to 24 Years | 0 (0.0%) | 0 (0.0%) |
| 25 to 29 Years | 4 (3.2%) | 0 (0.0%) |
| 30 to 34 Years | 14 (11.1%) | 7 (9.6%) |
| 35 to 39 Years | 7 (5.6%) | 2 (2.7%) |
| 40 to 44 Years | 7 (5.6%) | 0 (0.0%) |
| 45 to 49 Years | 14 (11.1%) | 0 (0.0%) |
| 50 to 54 Years | 4 (3.2%) | 10 (13.7%) |
| 55 to 59 Years | 12 (9.5%) | 5 (6.9%) |
| 60 to 64 Years | 4 (3.2%) | 7 (9.6%) |
| 65 to 69 Years | 15 (11.9%) | 5 (6.9%) |
| 70 to 74 Years | 9 (7.1%) | 6 (8.2%) |
| 75 to 79 Years | 9 (7.1%) | 6 (8.2%) |
| 80 to 84 Years | 2 (1.6%) | 0 (0.0%) |
| 85 Years and over | 2 (1.6%) | 4 (5.5%) |
| Total | 126 (100.0%) | 73 (100.0%) |
Families and Households in Blackwell
Median Family Size in Blackwell
The median family size in Blackwell is 2.70 persons per family, with single male/father families (12 | 21.0%) accounting for the largest median family size of 3.08 persons per family. On the other hand, single female/mother families (6 | 10.5%) represent the smallest median family size with 1.67 persons per family.
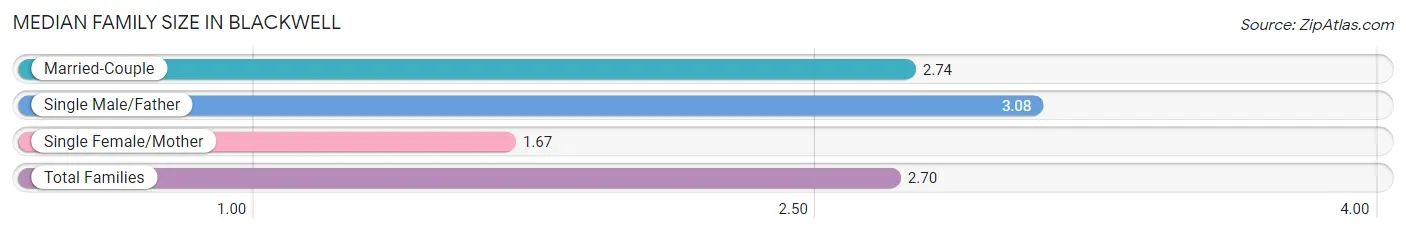
| Family Type | # Families | Family Size |
| Married-Couple | 39 (68.4%) | 2.74 |
| Single Male/Father | 12 (21.0%) | 3.08 |
| Single Female/Mother | 6 (10.5%) | 1.67 |
| Total Families | 57 (100.0%) | 2.70 |
Median Household Size in Blackwell
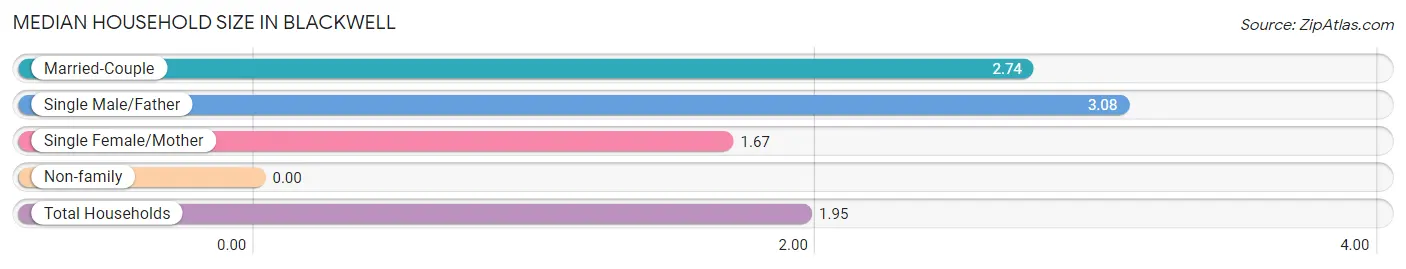
| Household Type | # Households | Household Size |
| Married-Couple | 39 (38.2%) | 2.74 |
| Single Male/Father | 12 (11.8%) | 3.08 |
| Single Female/Mother | 6 (5.9%) | 1.67 |
| Non-family | 45 (44.1%) | - |
| Total Households | 102 (100.0%) | 1.95 |
Household Size by Marriage Status in Blackwell
Out of a total of 102 households in Blackwell, 57 (55.9%) are family households, while 45 (44.1%) are nonfamily households. The most numerous type of family households are 2-person households, comprising 36, and the most common type of nonfamily households are 1-person households, comprising 45.
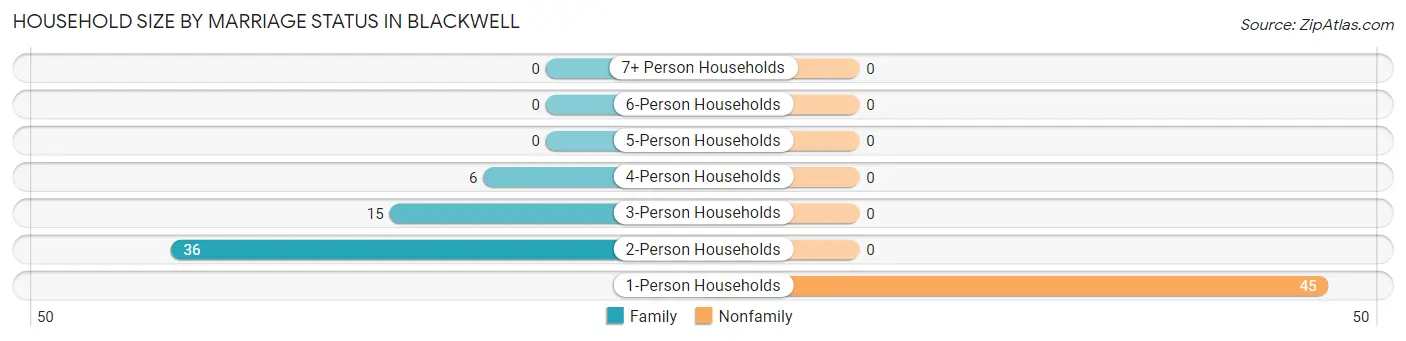
| Household Size | Family Households | Nonfamily Households |
| 1-Person Households | - | 45 (44.1%) |
| 2-Person Households | 36 (35.3%) | 0 (0.0%) |
| 3-Person Households | 15 (14.7%) | 0 (0.0%) |
| 4-Person Households | 6 (5.9%) | 0 (0.0%) |
| 5-Person Households | 0 (0.0%) | 0 (0.0%) |
| 6-Person Households | 0 (0.0%) | 0 (0.0%) |
| 7+ Person Households | 0 (0.0%) | 0 (0.0%) |
| Total | 57 (55.9%) | 45 (44.1%) |
Female Fertility in Blackwell
Fertility by Age in Blackwell
| Age Bracket | Women with Births | Births / 1,000 Women |
| 15 to 19 years | 0 (0.0%) | 0.0 |
| 20 to 34 years | 0 (0.0%) | 0.0 |
| 35 to 50 years | 0 (0.0%) | 0.0 |
| Total | 0 (0.0%) | 0.0 |
Fertility by Age by Marriage Status in Blackwell
| Age Bracket | Married | Unmarried |
| 15 to 19 years | 0 (0.0%) | 0 (0.0%) |
| 20 to 34 years | 0 (0.0%) | 0 (0.0%) |
| 35 to 50 years | 0 (0.0%) | 0 (0.0%) |
| Total | 0 (0.0%) | 0 (0.0%) |
Fertility by Education in Blackwell
| Educational Attainment | Women with Births | Births / 1,000 Women |
| Less than High School | 0 (0.0%) | 0.0 |
| High School Diploma | 0 (0.0%) | 0.0 |
| College or Associate's Degree | 0 (0.0%) | 0.0 |
| Bachelor's Degree | 0 (0.0%) | 0.0 |
| Graduate Degree | 0 (0.0%) | 0.0 |
| Total | 0 (0.0%) | 0.0 |
Fertility by Education by Marriage Status in Blackwell
| Educational Attainment | Married | Unmarried |
| Less than High School | 0 (0.0%) | 0 (0.0%) |
| High School Diploma | 0 (0.0%) | 0 (0.0%) |
| College or Associate's Degree | 0 (0.0%) | 0 (0.0%) |
| Bachelor's Degree | 0 (0.0%) | 0 (0.0%) |
| Graduate Degree | 0 (0.0%) | 0 (0.0%) |
| Total | 0 (0.0%) | 0 (0.0%) |
Employment Characteristics in Blackwell
Employment by Class of Employer in Blackwell
Among the 97 employed individuals in Blackwell, private company employees (67 | 69.1%), local government employees (19 | 19.6%), and federal government employees (4 | 4.1%) make up the most common classes of employment.
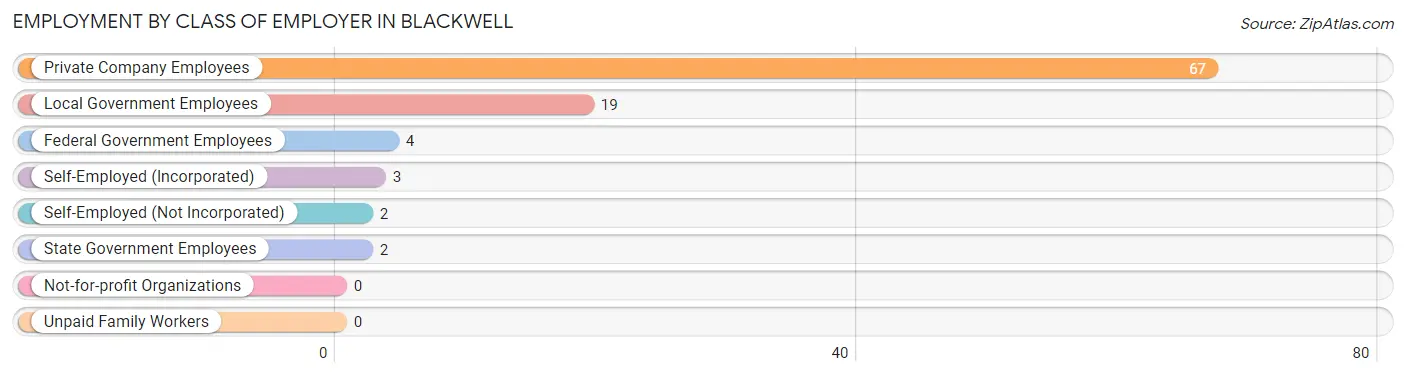
| Employer Class | # Employees | % Employees |
| Private Company Employees | 67 | 69.1% |
| Self-Employed (Incorporated) | 3 | 3.1% |
| Self-Employed (Not Incorporated) | 2 | 2.1% |
| Not-for-profit Organizations | 0 | 0.0% |
| Local Government Employees | 19 | 19.6% |
| State Government Employees | 2 | 2.1% |
| Federal Government Employees | 4 | 4.1% |
| Unpaid Family Workers | 0 | 0.0% |
| Total | 97 | 100.0% |
Employment Status by Age in Blackwell
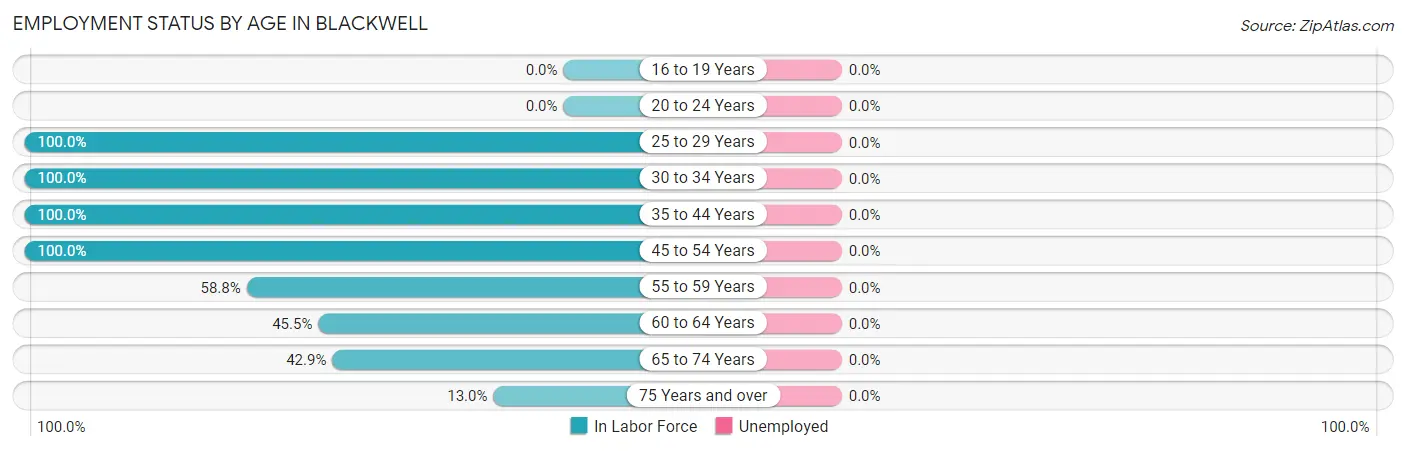
| Age Bracket | In Labor Force | Unemployed |
| 16 to 19 Years | 0 (0.0%) | 0 (0.0%) |
| 20 to 24 Years | 0 (0.0%) | 0 (0.0%) |
| 25 to 29 Years | 4 (100.0%) | 0 (0.0%) |
| 30 to 34 Years | 21 (100.0%) | 0 (0.0%) |
| 35 to 44 Years | 16 (100.0%) | 0 (0.0%) |
| 45 to 54 Years | 28 (100.0%) | 0 (0.0%) |
| 55 to 59 Years | 10 (58.8%) | 0 (0.0%) |
| 60 to 64 Years | 5 (45.5%) | 0 (0.0%) |
| 65 to 74 Years | 15 (42.9%) | 0 (0.0%) |
| 75 Years and over | 3 (13.0%) | 0 (0.0%) |
| Total | 102 (65.8%) | 0 (0.0%) |
Employment Status by Educational Attainment in Blackwell
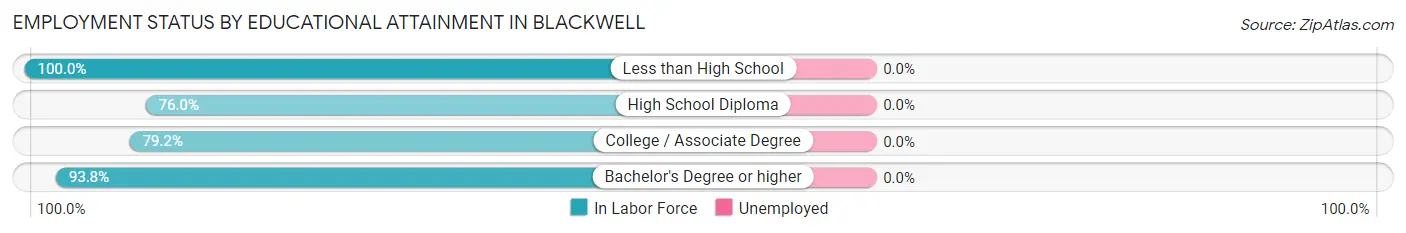
| Educational Attainment | In Labor Force | Unemployed |
| Less than High School | 16 (100.0%) | 0 (0.0%) |
| High School Diploma | 19 (76.0%) | 0 (0.0%) |
| College / Associate Degree | 19 (79.2%) | 0 (0.0%) |
| Bachelor's Degree or higher | 30 (93.8%) | 0 (0.0%) |
| Total | 84 (86.6%) | 0 (0.0%) |
Employment Occupations by Sex in Blackwell
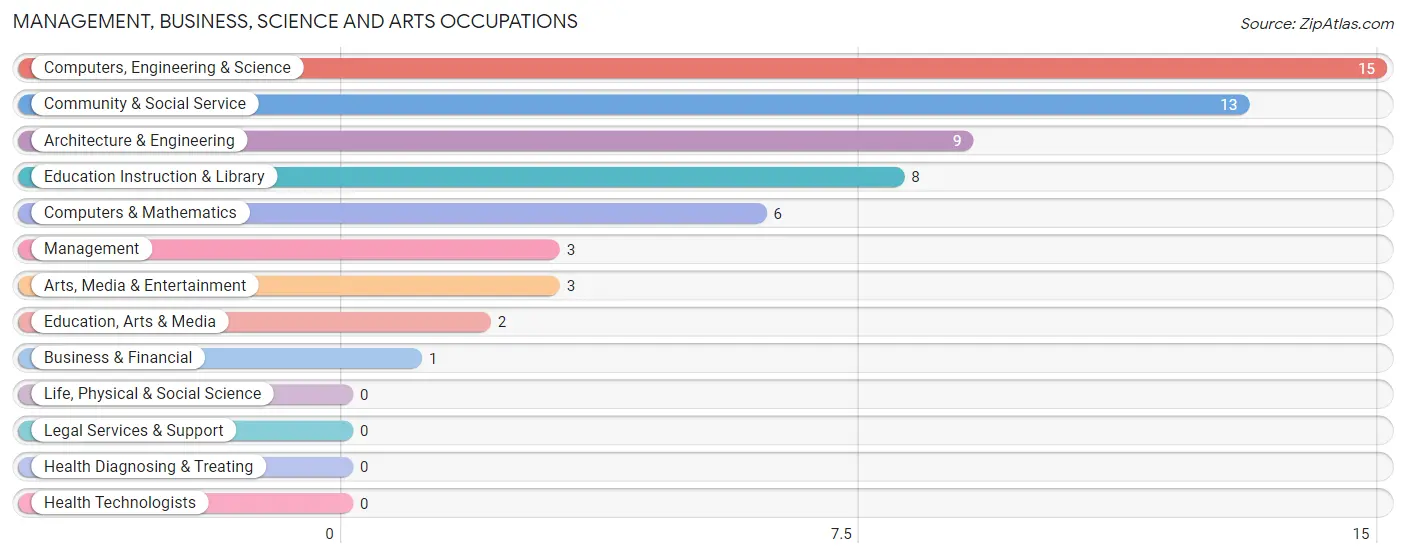
Management, Business, Science and Arts Occupations
The most common Management, Business, Science and Arts occupations in Blackwell are Computers, Engineering & Science (15 | 14.7%), Community & Social Service (13 | 12.8%), Architecture & Engineering (9 | 8.8%), Education Instruction & Library (8 | 7.8%), and Computers & Mathematics (6 | 5.9%).
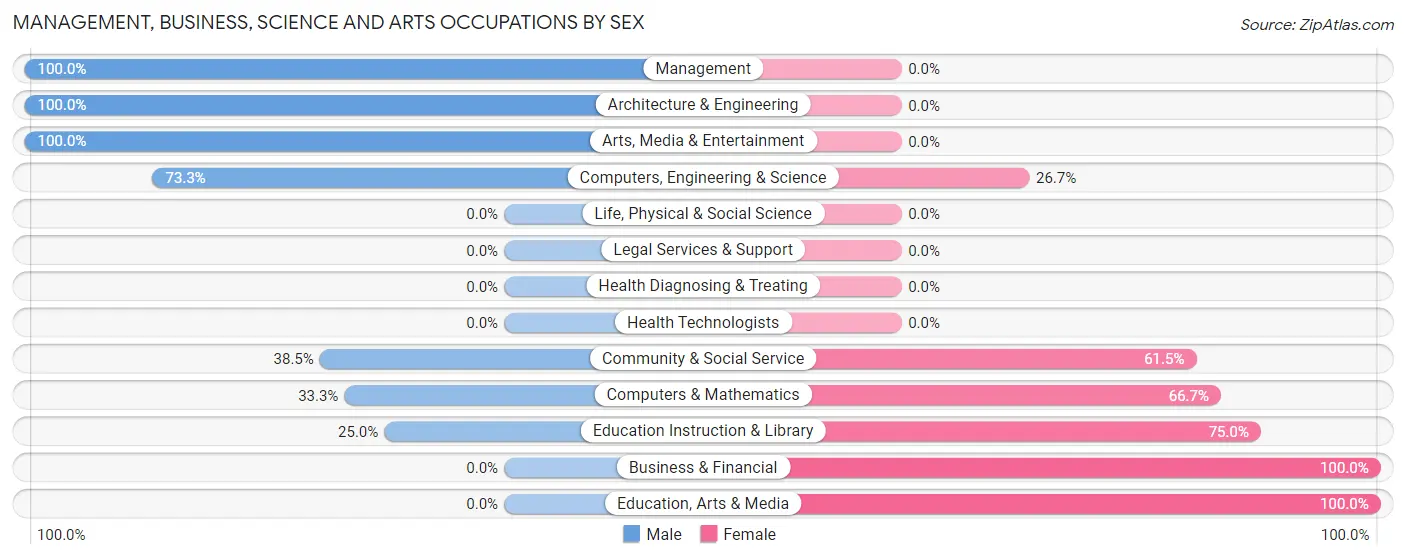
Management, Business, Science and Arts Occupations by Sex
Within the Management, Business, Science and Arts occupations in Blackwell, the most male-oriented occupations are Management (100.0%), Architecture & Engineering (100.0%), and Arts, Media & Entertainment (100.0%), while the most female-oriented occupations are Business & Financial (100.0%), Education, Arts & Media (100.0%), and Education Instruction & Library (75.0%).
| Occupation | Male | Female |
| Management | 3 (100.0%) | 0 (0.0%) |
| Business & Financial | 0 (0.0%) | 1 (100.0%) |
| Computers, Engineering & Science | 11 (73.3%) | 4 (26.7%) |
| Computers & Mathematics | 2 (33.3%) | 4 (66.7%) |
| Architecture & Engineering | 9 (100.0%) | 0 (0.0%) |
| Life, Physical & Social Science | 0 (0.0%) | 0 (0.0%) |
| Community & Social Service | 5 (38.5%) | 8 (61.5%) |
| Education, Arts & Media | 0 (0.0%) | 2 (100.0%) |
| Legal Services & Support | 0 (0.0%) | 0 (0.0%) |
| Education Instruction & Library | 2 (25.0%) | 6 (75.0%) |
| Arts, Media & Entertainment | 3 (100.0%) | 0 (0.0%) |
| Health Diagnosing & Treating | 0 (0.0%) | 0 (0.0%) |
| Health Technologists | 0 (0.0%) | 0 (0.0%) |
| Total (Category) | 19 (59.4%) | 13 (40.6%) |
| Total (Overall) | 79 (77.4%) | 23 (22.6%) |
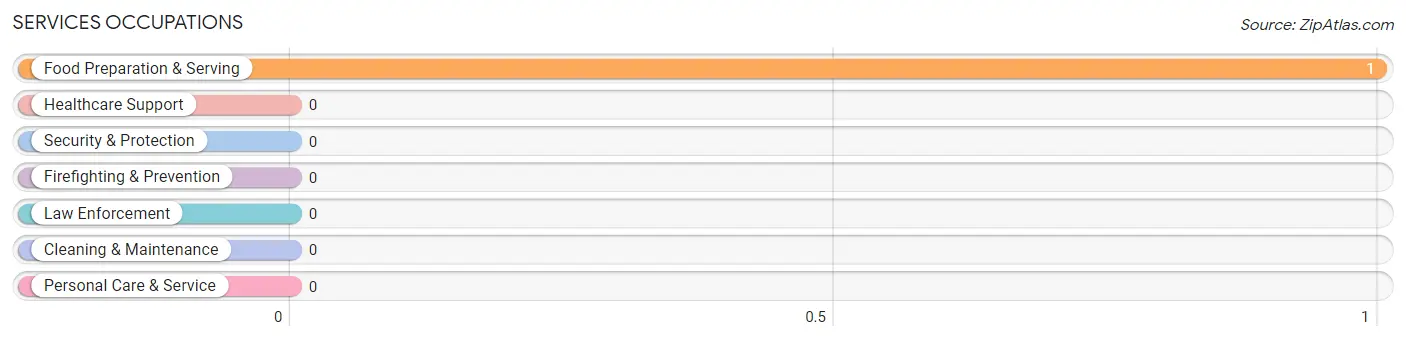
Services Occupations
The most common Services occupations in Blackwell are , and Food Preparation & Serving (1 | 1.0%).
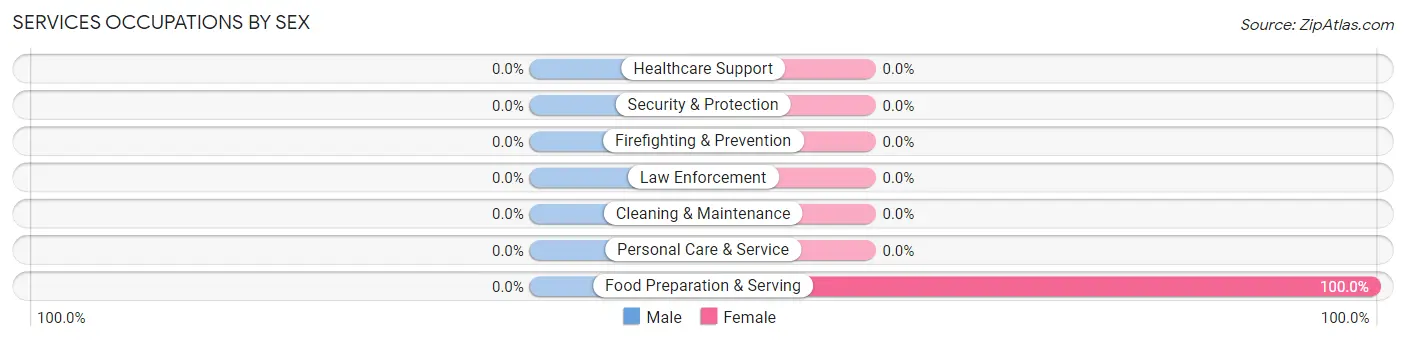
Services Occupations by Sex
| Occupation | Male | Female |
| Healthcare Support | 0 (0.0%) | 0 (0.0%) |
| Security & Protection | 0 (0.0%) | 0 (0.0%) |
| Firefighting & Prevention | 0 (0.0%) | 0 (0.0%) |
| Law Enforcement | 0 (0.0%) | 0 (0.0%) |
| Food Preparation & Serving | 0 (0.0%) | 1 (100.0%) |
| Cleaning & Maintenance | 0 (0.0%) | 0 (0.0%) |
| Personal Care & Service | 0 (0.0%) | 0 (0.0%) |
| Total (Category) | 0 (0.0%) | 1 (100.0%) |
| Total (Overall) | 79 (77.4%) | 23 (22.6%) |
Sales and Office Occupations
The most common Sales and Office occupations in Blackwell are Office & Administration (14 | 13.7%), and Sales & Related (6 | 5.9%).
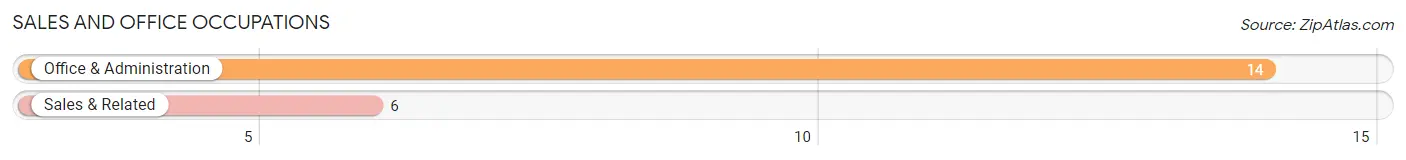
Sales and Office Occupations by Sex
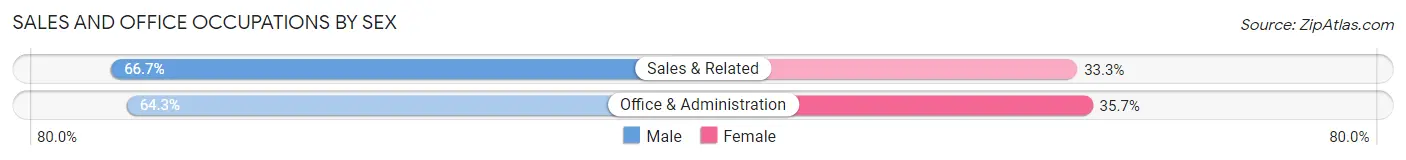
| Occupation | Male | Female |
| Sales & Related | 4 (66.7%) | 2 (33.3%) |
| Office & Administration | 9 (64.3%) | 5 (35.7%) |
| Total (Category) | 13 (65.0%) | 7 (35.0%) |
| Total (Overall) | 79 (77.4%) | 23 (22.6%) |
Natural Resources, Construction and Maintenance Occupations
The most common Natural Resources, Construction and Maintenance occupations in Blackwell are , and Construction & Extraction (6 | 5.9%).
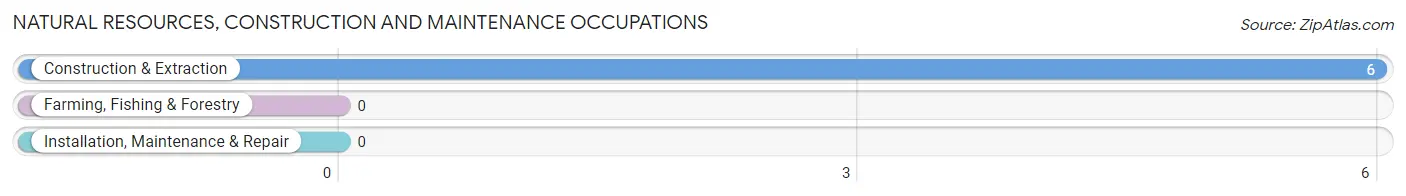
Natural Resources, Construction and Maintenance Occupations by Sex
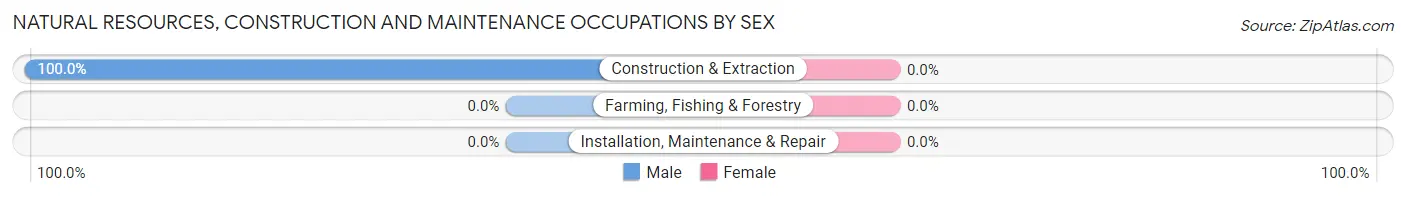
| Occupation | Male | Female |
| Farming, Fishing & Forestry | 0 (0.0%) | 0 (0.0%) |
| Construction & Extraction | 6 (100.0%) | 0 (0.0%) |
| Installation, Maintenance & Repair | 0 (0.0%) | 0 (0.0%) |
| Total (Category) | 6 (100.0%) | 0 (0.0%) |
| Total (Overall) | 79 (77.4%) | 23 (22.6%) |
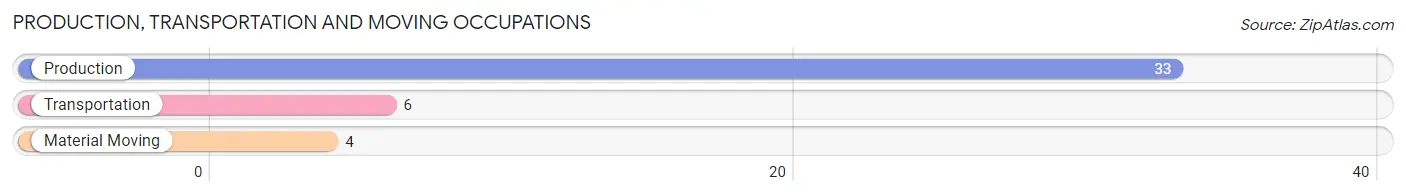
Production, Transportation and Moving Occupations
The most common Production, Transportation and Moving occupations in Blackwell are Production (33 | 32.4%), Transportation (6 | 5.9%), and Material Moving (4 | 3.9%).
Production, Transportation and Moving Occupations by Sex
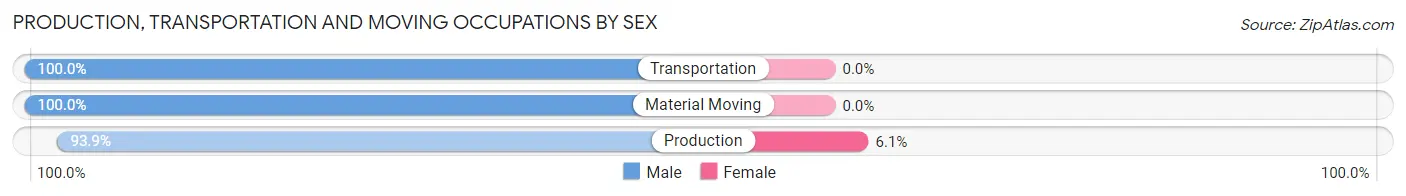
| Occupation | Male | Female |
| Production | 31 (93.9%) | 2 (6.1%) |
| Transportation | 6 (100.0%) | 0 (0.0%) |
| Material Moving | 4 (100.0%) | 0 (0.0%) |
| Total (Category) | 41 (95.4%) | 2 (4.6%) |
| Total (Overall) | 79 (77.4%) | 23 (22.6%) |
Employment Industries by Sex in Blackwell
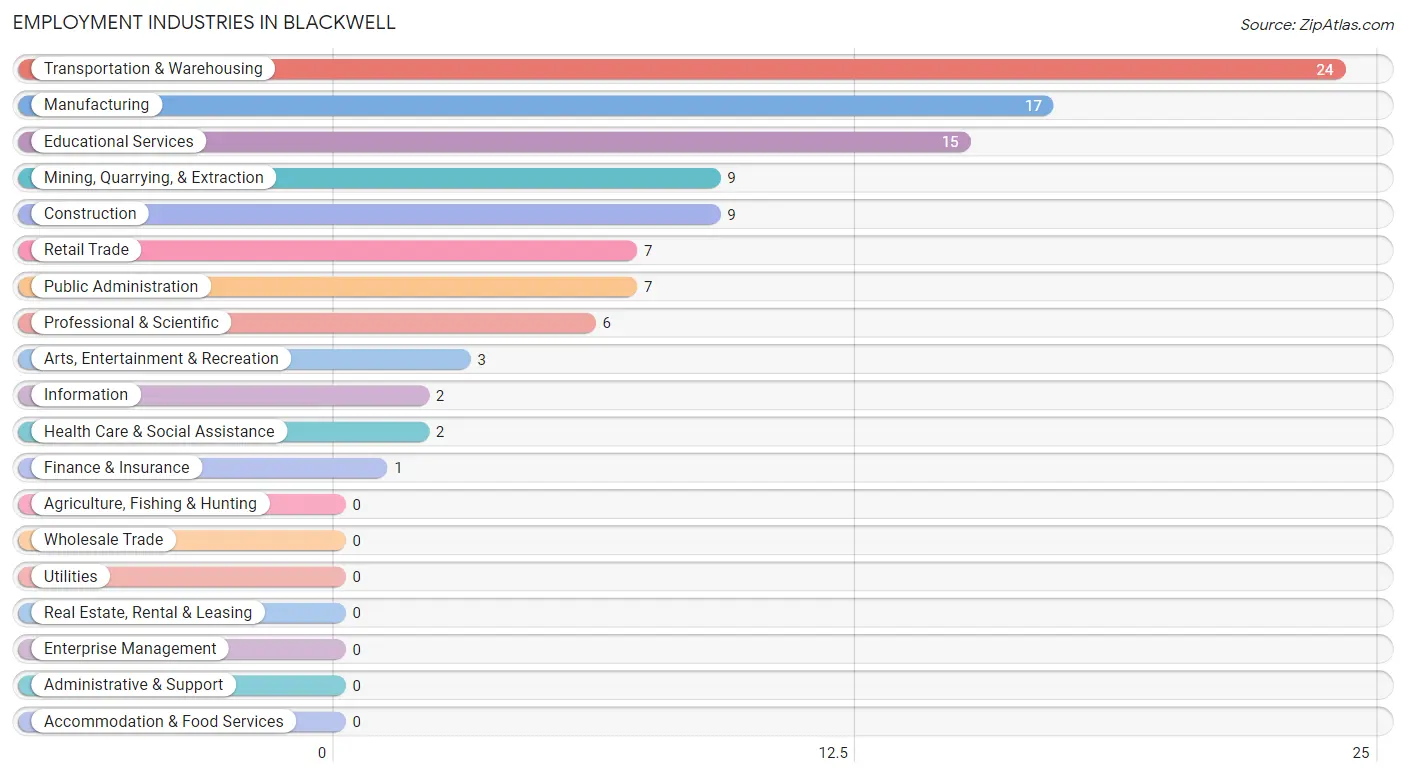
Employment Industries in Blackwell
The major employment industries in Blackwell include Transportation & Warehousing (24 | 23.5%), Manufacturing (17 | 16.7%), Educational Services (15 | 14.7%), Mining, Quarrying, & Extraction (9 | 8.8%), and Construction (9 | 8.8%).
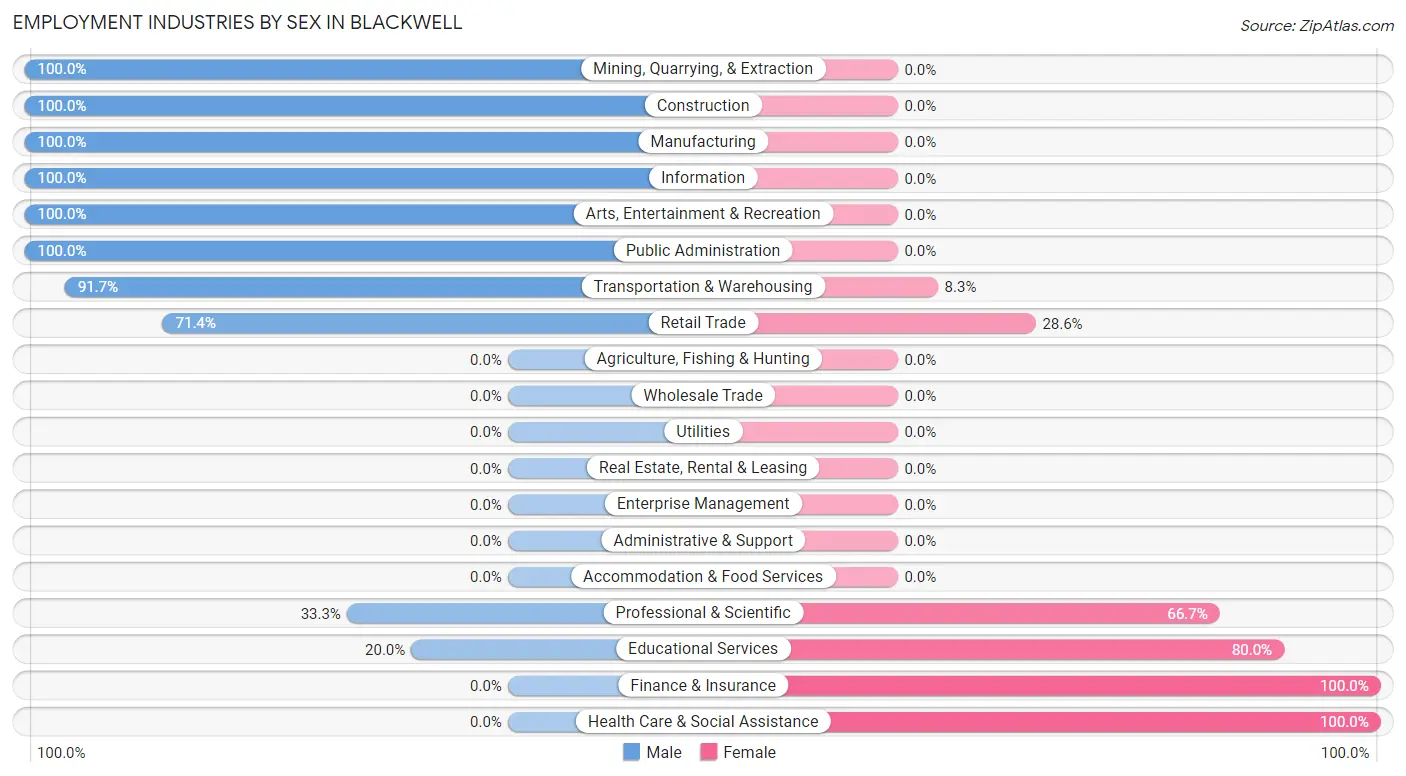
Employment Industries by Sex in Blackwell
The Blackwell industries that see more men than women are Mining, Quarrying, & Extraction (100.0%), Construction (100.0%), and Manufacturing (100.0%), whereas the industries that tend to have a higher number of women are Finance & Insurance (100.0%), Health Care & Social Assistance (100.0%), and Educational Services (80.0%).
| Industry | Male | Female |
| Agriculture, Fishing & Hunting | 0 (0.0%) | 0 (0.0%) |
| Mining, Quarrying, & Extraction | 9 (100.0%) | 0 (0.0%) |
| Construction | 9 (100.0%) | 0 (0.0%) |
| Manufacturing | 17 (100.0%) | 0 (0.0%) |
| Wholesale Trade | 0 (0.0%) | 0 (0.0%) |
| Retail Trade | 5 (71.4%) | 2 (28.6%) |
| Transportation & Warehousing | 22 (91.7%) | 2 (8.3%) |
| Utilities | 0 (0.0%) | 0 (0.0%) |
| Information | 2 (100.0%) | 0 (0.0%) |
| Finance & Insurance | 0 (0.0%) | 1 (100.0%) |
| Real Estate, Rental & Leasing | 0 (0.0%) | 0 (0.0%) |
| Professional & Scientific | 2 (33.3%) | 4 (66.7%) |
| Enterprise Management | 0 (0.0%) | 0 (0.0%) |
| Administrative & Support | 0 (0.0%) | 0 (0.0%) |
| Educational Services | 3 (20.0%) | 12 (80.0%) |
| Health Care & Social Assistance | 0 (0.0%) | 2 (100.0%) |
| Arts, Entertainment & Recreation | 3 (100.0%) | 0 (0.0%) |
| Accommodation & Food Services | 0 (0.0%) | 0 (0.0%) |
| Public Administration | 7 (100.0%) | 0 (0.0%) |
| Total | 79 (77.4%) | 23 (22.6%) |
Education in Blackwell
School Enrollment in Blackwell
The most common levels of schooling among the 42 students in Blackwell are elementary school (15 | 35.7%), middle school (14 | 33.3%), and high school (5 | 11.9%).
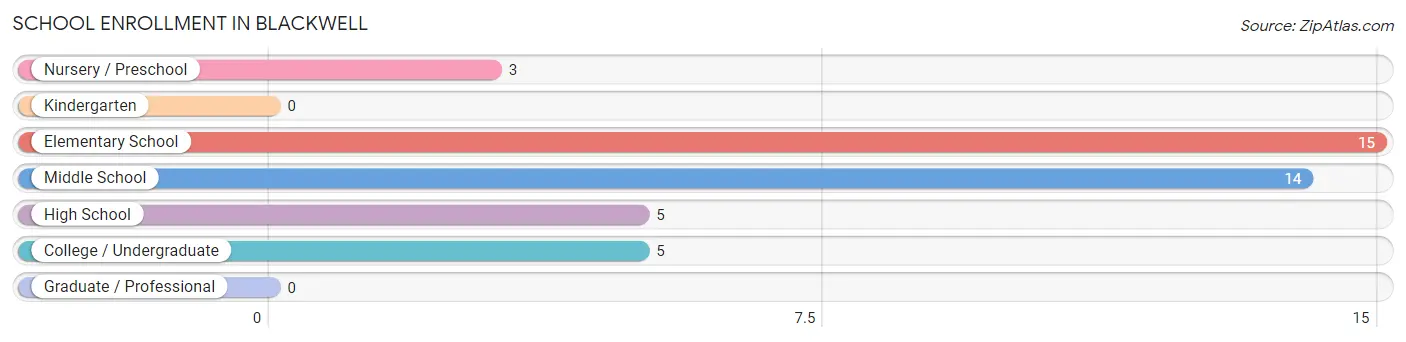
| School Level | # Students | % Students |
| Nursery / Preschool | 3 | 7.1% |
| Kindergarten | 0 | 0.0% |
| Elementary School | 15 | 35.7% |
| Middle School | 14 | 33.3% |
| High School | 5 | 11.9% |
| College / Undergraduate | 5 | 11.9% |
| Graduate / Professional | 0 | 0.0% |
| Total | 42 | 100.0% |
School Enrollment by Age by Funding Source in Blackwell
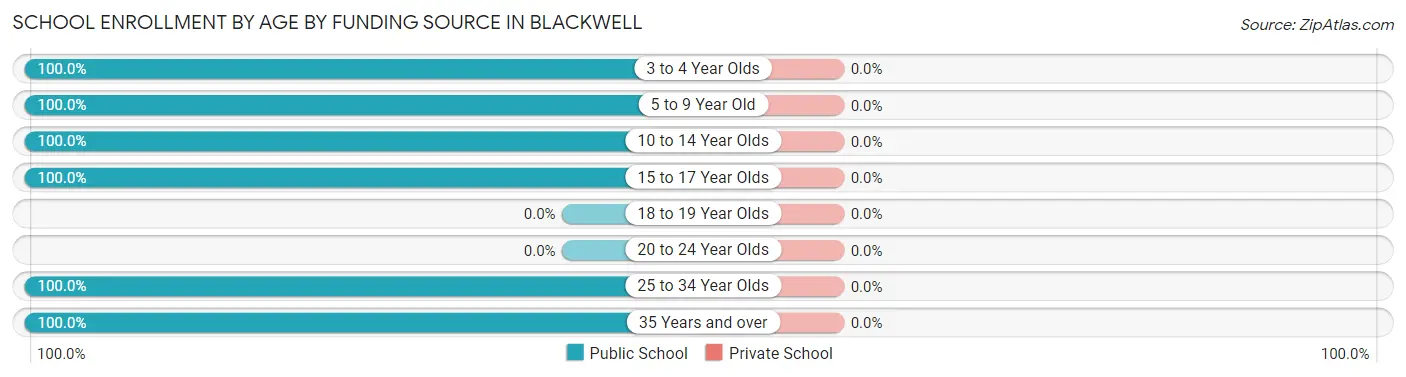
| Age Bracket | Public School | Private School |
| 3 to 4 Year Olds | 3 (100.0%) | 0 (0.0%) |
| 5 to 9 Year Old | 15 (100.0%) | 0 (0.0%) |
| 10 to 14 Year Olds | 15 (100.0%) | 0 (0.0%) |
| 15 to 17 Year Olds | 4 (100.0%) | 0 (0.0%) |
| 18 to 19 Year Olds | 0 (0.0%) | 0 (0.0%) |
| 20 to 24 Year Olds | 0 (0.0%) | 0 (0.0%) |
| 25 to 34 Year Olds | 4 (100.0%) | 0 (0.0%) |
| 35 Years and over | 1 (100.0%) | 0 (0.0%) |
| Total | 42 (100.0%) | 0 (0.0%) |
Educational Attainment by Field of Study in Blackwell
Education (14 | 30.4%), engineering (11 | 23.9%), business (10 | 21.7%), bio, nature & agricultural (5 | 10.9%), and psychology (2 | 4.3%) are the most common fields of study among 46 individuals in Blackwell who have obtained a bachelor's degree or higher.
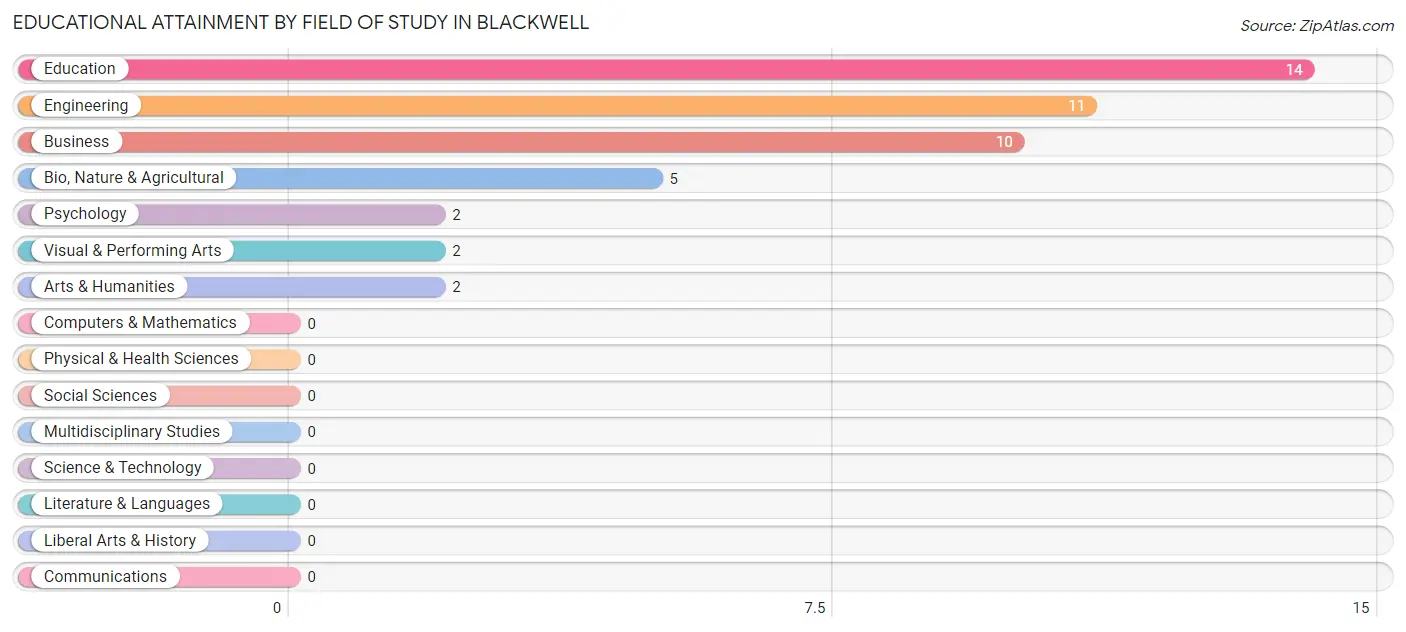
| Field of Study | # Graduates | % Graduates |
| Computers & Mathematics | 0 | 0.0% |
| Bio, Nature & Agricultural | 5 | 10.9% |
| Physical & Health Sciences | 0 | 0.0% |
| Psychology | 2 | 4.3% |
| Social Sciences | 0 | 0.0% |
| Engineering | 11 | 23.9% |
| Multidisciplinary Studies | 0 | 0.0% |
| Science & Technology | 0 | 0.0% |
| Business | 10 | 21.7% |
| Education | 14 | 30.4% |
| Literature & Languages | 0 | 0.0% |
| Liberal Arts & History | 0 | 0.0% |
| Visual & Performing Arts | 2 | 4.3% |
| Communications | 0 | 0.0% |
| Arts & Humanities | 2 | 4.3% |
| Total | 46 | 100.0% |
Transportation & Commute in Blackwell
Vehicle Availability by Sex in Blackwell
The most prevalent vehicle ownership categories in Blackwell are males with 2 vehicles (31, accounting for 41.9%) and females with 2 vehicles (14, making up 134.8%).
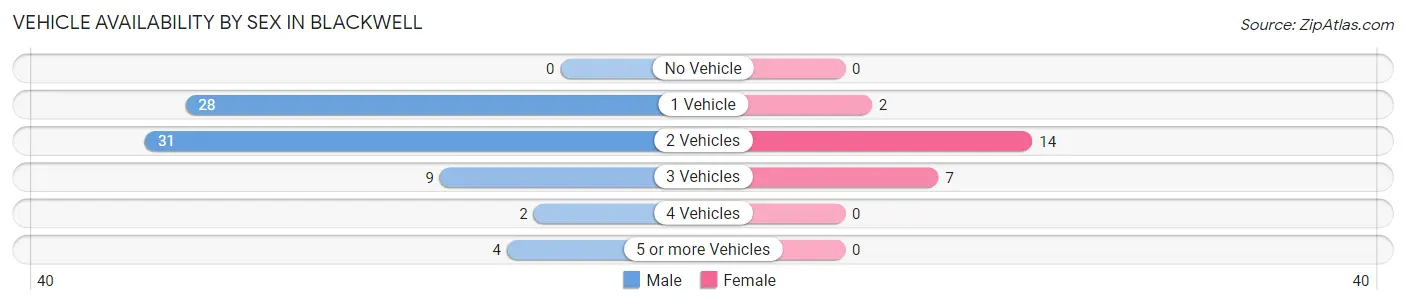
| Vehicles Available | Male | Female |
| No Vehicle | 0 (0.0%) | 0 (0.0%) |
| 1 Vehicle | 28 (37.8%) | 2 (8.7%) |
| 2 Vehicles | 31 (41.9%) | 14 (60.9%) |
| 3 Vehicles | 9 (12.2%) | 7 (30.4%) |
| 4 Vehicles | 2 (2.7%) | 0 (0.0%) |
| 5 or more Vehicles | 4 (5.4%) | 0 (0.0%) |
| Total | 74 (100.0%) | 23 (100.0%) |
Commute Time in Blackwell
The most frequently occuring commute durations in Blackwell are 60 to 89 minutes (18 commuters, 22.0%), 90 or more minutes (15 commuters, 18.3%), and 30 to 34 minutes (13 commuters, 15.9%).
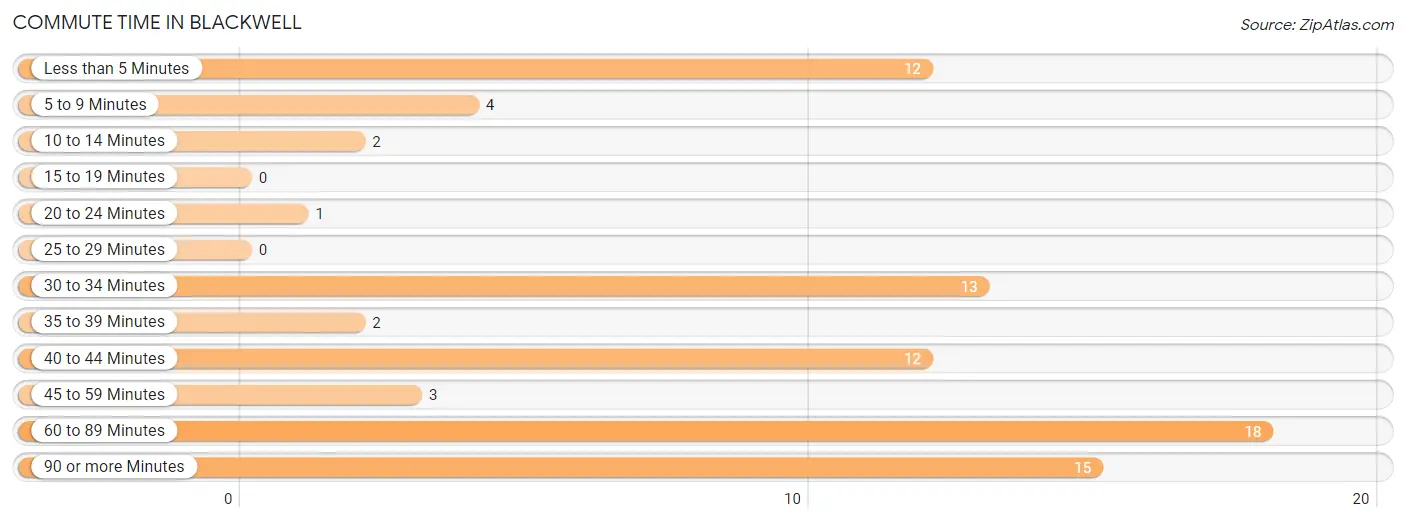
| Commute Time | # Commuters | % Commuters |
| Less than 5 Minutes | 12 | 14.6% |
| 5 to 9 Minutes | 4 | 4.9% |
| 10 to 14 Minutes | 2 | 2.4% |
| 15 to 19 Minutes | 0 | 0.0% |
| 20 to 24 Minutes | 1 | 1.2% |
| 25 to 29 Minutes | 0 | 0.0% |
| 30 to 34 Minutes | 13 | 15.9% |
| 35 to 39 Minutes | 2 | 2.4% |
| 40 to 44 Minutes | 12 | 14.6% |
| 45 to 59 Minutes | 3 | 3.7% |
| 60 to 89 Minutes | 18 | 22.0% |
| 90 or more Minutes | 15 | 18.3% |
Commute Time by Sex in Blackwell
The most common commute times in Blackwell are 60 to 89 minutes (16 commuters, 25.4%) for males and 30 to 34 minutes (8 commuters, 42.1%) for females.
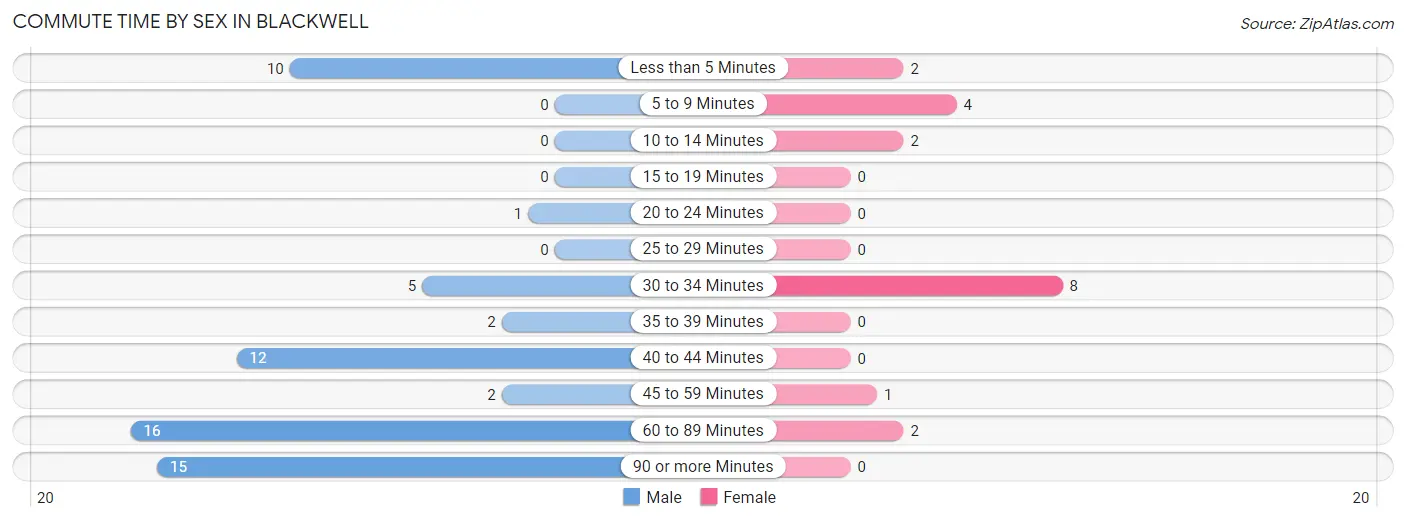
| Commute Time | Male | Female |
| Less than 5 Minutes | 10 (15.9%) | 2 (10.5%) |
| 5 to 9 Minutes | 0 (0.0%) | 4 (21.0%) |
| 10 to 14 Minutes | 0 (0.0%) | 2 (10.5%) |
| 15 to 19 Minutes | 0 (0.0%) | 0 (0.0%) |
| 20 to 24 Minutes | 1 (1.6%) | 0 (0.0%) |
| 25 to 29 Minutes | 0 (0.0%) | 0 (0.0%) |
| 30 to 34 Minutes | 5 (7.9%) | 8 (42.1%) |
| 35 to 39 Minutes | 2 (3.2%) | 0 (0.0%) |
| 40 to 44 Minutes | 12 (19.1%) | 0 (0.0%) |
| 45 to 59 Minutes | 2 (3.2%) | 1 (5.3%) |
| 60 to 89 Minutes | 16 (25.4%) | 2 (10.5%) |
| 90 or more Minutes | 15 (23.8%) | 0 (0.0%) |
Time of Departure to Work by Sex in Blackwell
The most frequent times of departure to work in Blackwell are 5:00 AM to 5:29 AM (23, 36.5%) for males and 7:30 AM to 7:59 AM (7, 36.8%) for females.
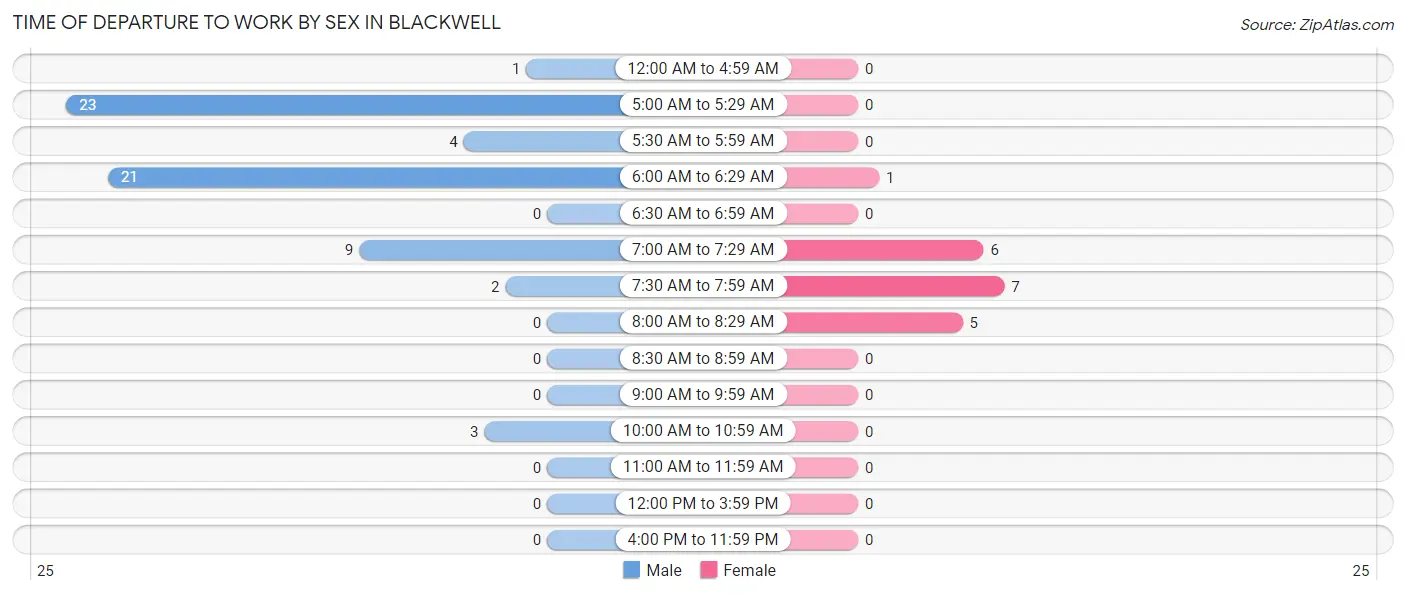
| Time of Departure | Male | Female |
| 12:00 AM to 4:59 AM | 1 (1.6%) | 0 (0.0%) |
| 5:00 AM to 5:29 AM | 23 (36.5%) | 0 (0.0%) |
| 5:30 AM to 5:59 AM | 4 (6.4%) | 0 (0.0%) |
| 6:00 AM to 6:29 AM | 21 (33.3%) | 1 (5.3%) |
| 6:30 AM to 6:59 AM | 0 (0.0%) | 0 (0.0%) |
| 7:00 AM to 7:29 AM | 9 (14.3%) | 6 (31.6%) |
| 7:30 AM to 7:59 AM | 2 (3.2%) | 7 (36.8%) |
| 8:00 AM to 8:29 AM | 0 (0.0%) | 5 (26.3%) |
| 8:30 AM to 8:59 AM | 0 (0.0%) | 0 (0.0%) |
| 9:00 AM to 9:59 AM | 0 (0.0%) | 0 (0.0%) |
| 10:00 AM to 10:59 AM | 3 (4.8%) | 0 (0.0%) |
| 11:00 AM to 11:59 AM | 0 (0.0%) | 0 (0.0%) |
| 12:00 PM to 3:59 PM | 0 (0.0%) | 0 (0.0%) |
| 4:00 PM to 11:59 PM | 0 (0.0%) | 0 (0.0%) |
| Total | 63 (100.0%) | 19 (100.0%) |
Housing Occupancy in Blackwell
Occupancy by Ownership in Blackwell
Of the total 102 dwellings in Blackwell, owner-occupied units account for 67 (65.7%), while renter-occupied units make up 35 (34.3%).
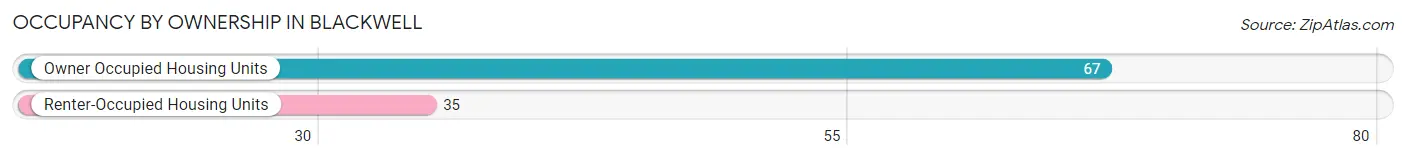
| Occupancy | # Housing Units | % Housing Units |
| Owner Occupied Housing Units | 67 | 65.7% |
| Renter-Occupied Housing Units | 35 | 34.3% |
| Total Occupied Housing Units | 102 | 100.0% |
Occupancy by Household Size in Blackwell
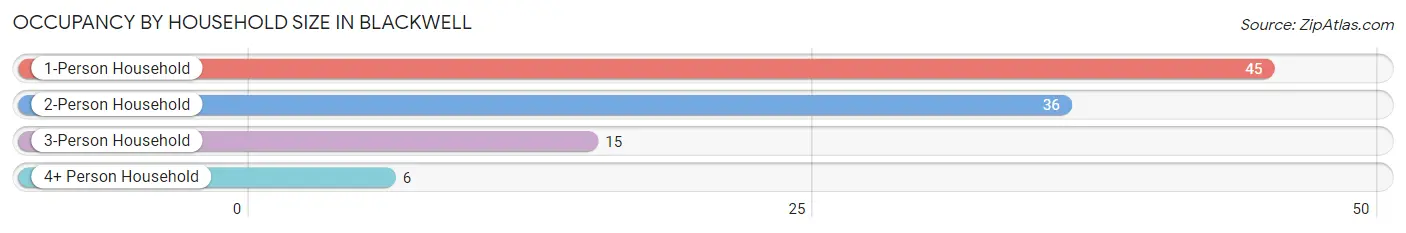
| Household Size | # Housing Units | % Housing Units |
| 1-Person Household | 45 | 44.1% |
| 2-Person Household | 36 | 35.3% |
| 3-Person Household | 15 | 14.7% |
| 4+ Person Household | 6 | 5.9% |
| Total Housing Units | 102 | 100.0% |
Occupancy by Ownership by Household Size in Blackwell
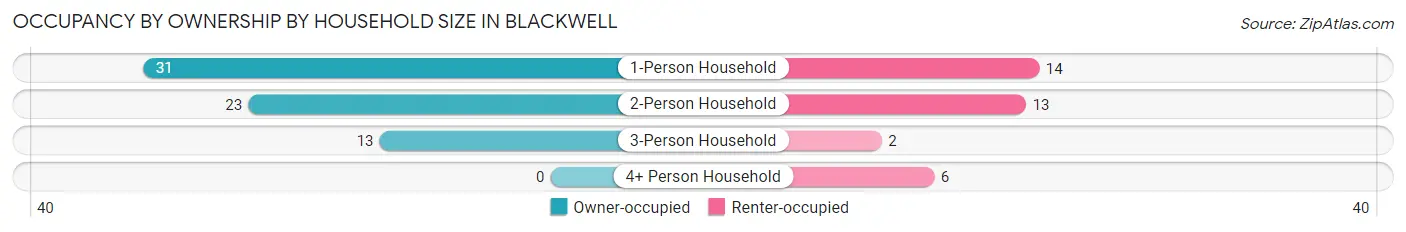
| Household Size | Owner-occupied | Renter-occupied |
| 1-Person Household | 31 (68.9%) | 14 (31.1%) |
| 2-Person Household | 23 (63.9%) | 13 (36.1%) |
| 3-Person Household | 13 (86.7%) | 2 (13.3%) |
| 4+ Person Household | 0 (0.0%) | 6 (100.0%) |
| Total Housing Units | 67 (65.7%) | 35 (34.3%) |
Occupancy by Educational Attainment in Blackwell
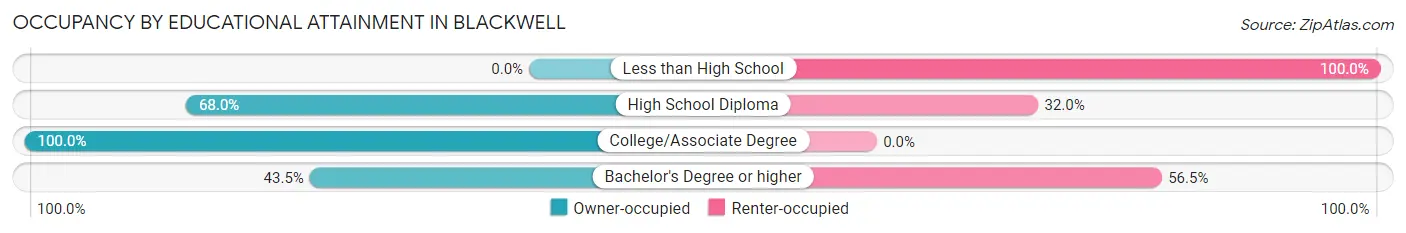
| Household Size | Owner-occupied | Renter-occupied |
| Less than High School | 0 (0.0%) | 14 (100.0%) |
| High School Diploma | 17 (68.0%) | 8 (32.0%) |
| College/Associate Degree | 40 (100.0%) | 0 (0.0%) |
| Bachelor's Degree or higher | 10 (43.5%) | 13 (56.5%) |
Occupancy by Age of Householder in Blackwell
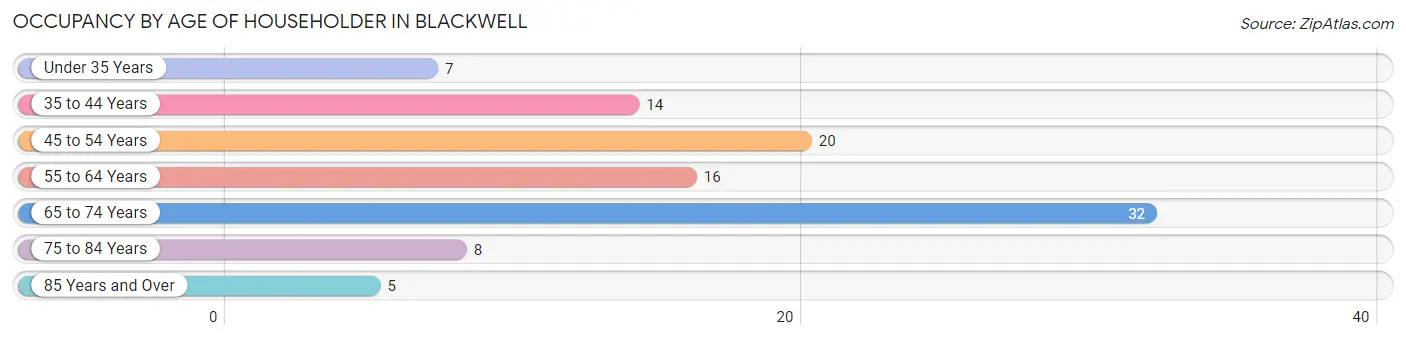
| Age Bracket | # Households | % Households |
| Under 35 Years | 7 | 6.9% |
| 35 to 44 Years | 14 | 13.7% |
| 45 to 54 Years | 20 | 19.6% |
| 55 to 64 Years | 16 | 15.7% |
| 65 to 74 Years | 32 | 31.4% |
| 75 to 84 Years | 8 | 7.8% |
| 85 Years and Over | 5 | 4.9% |
| Total | 102 | 100.0% |
Housing Finances in Blackwell
Median Income by Occupancy in Blackwell
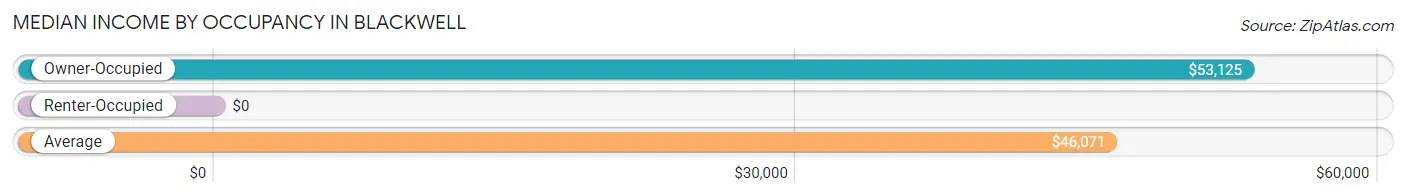
| Occupancy Type | # Households | Median Income |
| Owner-Occupied | 67 (65.7%) | $53,125 |
| Renter-Occupied | 35 (34.3%) | $0 |
| Average | 102 (100.0%) | $46,071 |
Occupancy by Householder Income Bracket in Blackwell
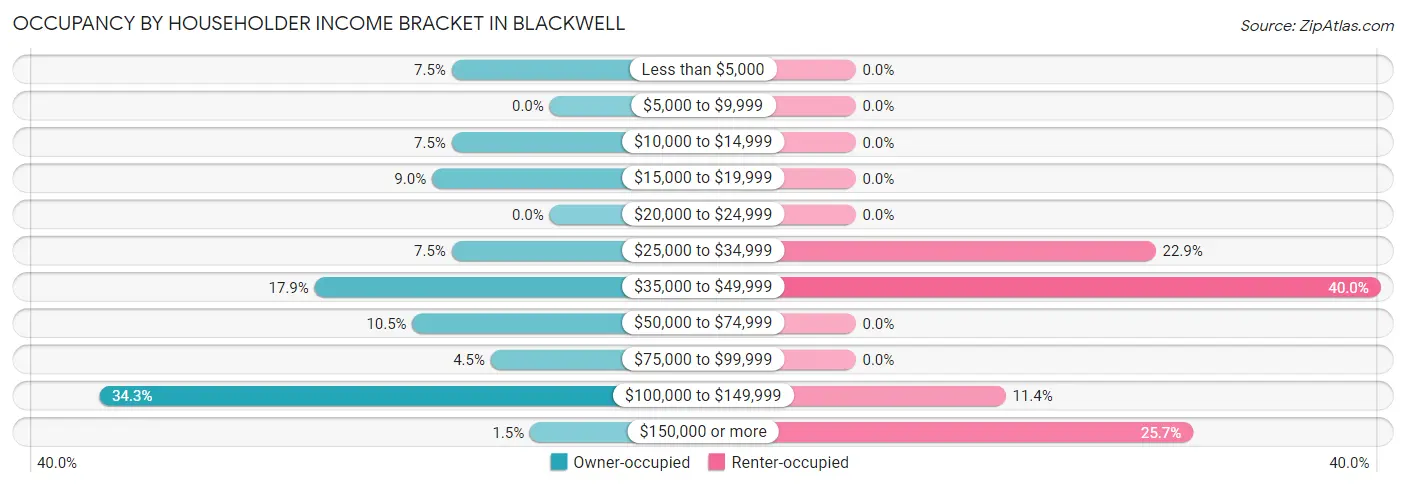
| Income Bracket | Owner-occupied | Renter-occupied |
| Less than $5,000 | 5 (7.5%) | 0 (0.0%) |
| $5,000 to $9,999 | 0 (0.0%) | 0 (0.0%) |
| $10,000 to $14,999 | 5 (7.5%) | 0 (0.0%) |
| $15,000 to $19,999 | 6 (9.0%) | 0 (0.0%) |
| $20,000 to $24,999 | 0 (0.0%) | 0 (0.0%) |
| $25,000 to $34,999 | 5 (7.5%) | 8 (22.9%) |
| $35,000 to $49,999 | 12 (17.9%) | 14 (40.0%) |
| $50,000 to $74,999 | 7 (10.4%) | 0 (0.0%) |
| $75,000 to $99,999 | 3 (4.5%) | 0 (0.0%) |
| $100,000 to $149,999 | 23 (34.3%) | 4 (11.4%) |
| $150,000 or more | 1 (1.5%) | 9 (25.7%) |
| Total | 67 (100.0%) | 35 (100.0%) |
Monthly Housing Cost Tiers in Blackwell
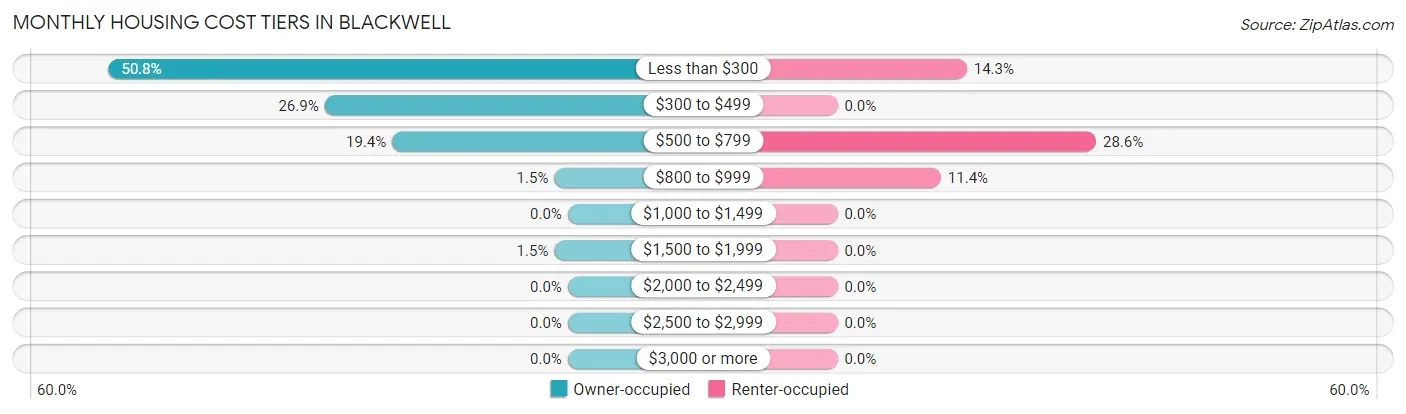
| Monthly Cost | Owner-occupied | Renter-occupied |
| Less than $300 | 34 (50.7%) | 5 (14.3%) |
| $300 to $499 | 18 (26.9%) | 0 (0.0%) |
| $500 to $799 | 13 (19.4%) | 10 (28.6%) |
| $800 to $999 | 1 (1.5%) | 4 (11.4%) |
| $1,000 to $1,499 | 0 (0.0%) | 0 (0.0%) |
| $1,500 to $1,999 | 1 (1.5%) | 0 (0.0%) |
| $2,000 to $2,499 | 0 (0.0%) | 0 (0.0%) |
| $2,500 to $2,999 | 0 (0.0%) | 0 (0.0%) |
| $3,000 or more | 0 (0.0%) | 0 (0.0%) |
| Total | 67 (100.0%) | 35 (100.0%) |
Physical Housing Characteristics in Blackwell
Housing Structures in Blackwell
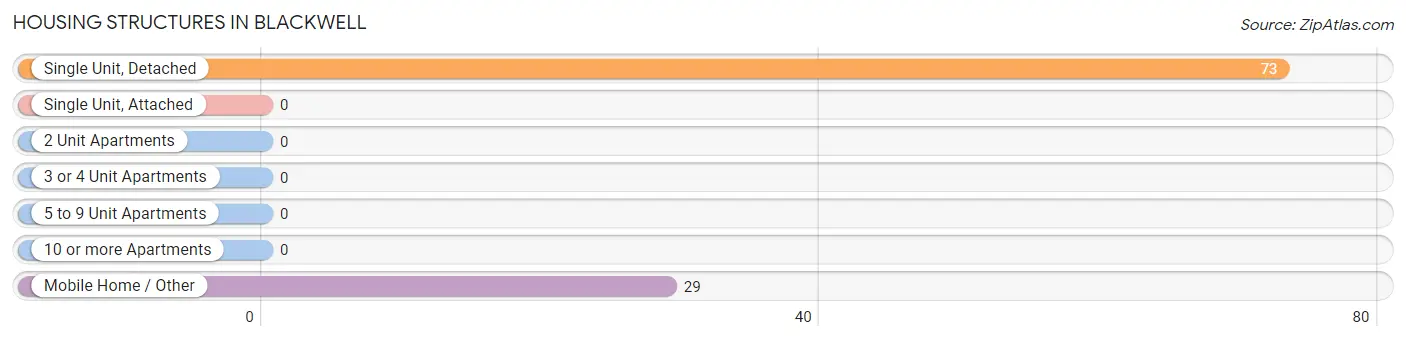
| Structure Type | # Housing Units | % Housing Units |
| Single Unit, Detached | 73 | 71.6% |
| Single Unit, Attached | 0 | 0.0% |
| 2 Unit Apartments | 0 | 0.0% |
| 3 or 4 Unit Apartments | 0 | 0.0% |
| 5 to 9 Unit Apartments | 0 | 0.0% |
| 10 or more Apartments | 0 | 0.0% |
| Mobile Home / Other | 29 | 28.4% |
| Total | 102 | 100.0% |
Housing Structures by Occupancy in Blackwell
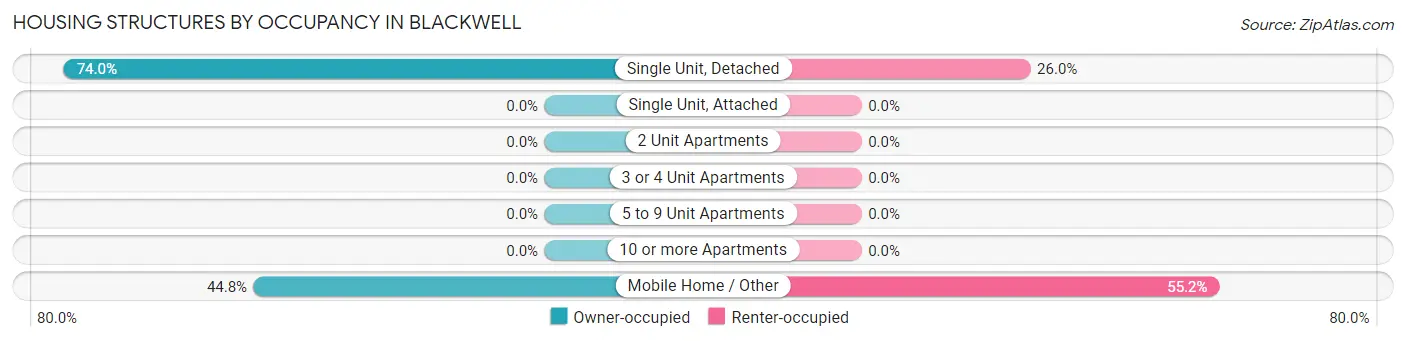
| Structure Type | Owner-occupied | Renter-occupied |
| Single Unit, Detached | 54 (74.0%) | 19 (26.0%) |
| Single Unit, Attached | 0 (0.0%) | 0 (0.0%) |
| 2 Unit Apartments | 0 (0.0%) | 0 (0.0%) |
| 3 or 4 Unit Apartments | 0 (0.0%) | 0 (0.0%) |
| 5 to 9 Unit Apartments | 0 (0.0%) | 0 (0.0%) |
| 10 or more Apartments | 0 (0.0%) | 0 (0.0%) |
| Mobile Home / Other | 13 (44.8%) | 16 (55.2%) |
| Total | 67 (65.7%) | 35 (34.3%) |
Housing Structures by Number of Rooms in Blackwell
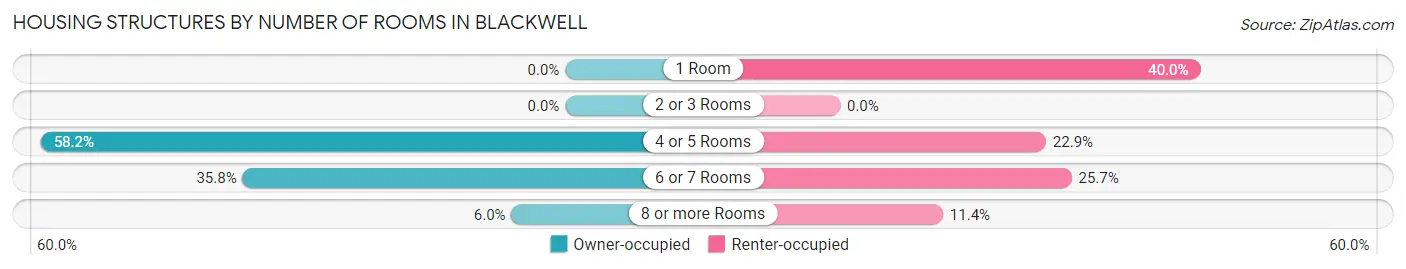
| Number of Rooms | Owner-occupied | Renter-occupied |
| 1 Room | 0 (0.0%) | 14 (40.0%) |
| 2 or 3 Rooms | 0 (0.0%) | 0 (0.0%) |
| 4 or 5 Rooms | 39 (58.2%) | 8 (22.9%) |
| 6 or 7 Rooms | 24 (35.8%) | 9 (25.7%) |
| 8 or more Rooms | 4 (6.0%) | 4 (11.4%) |
| Total | 67 (100.0%) | 35 (100.0%) |
Housing Structure by Heating Type in Blackwell
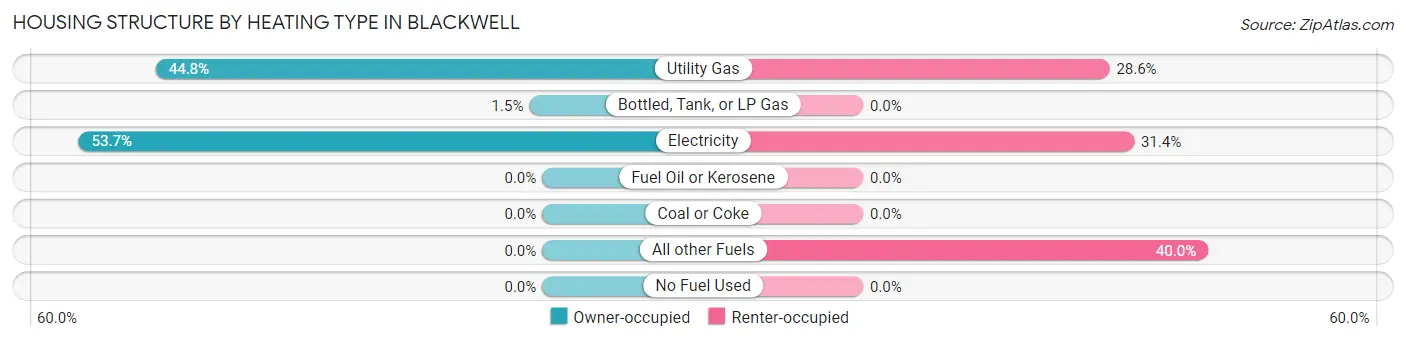
| Heating Type | Owner-occupied | Renter-occupied |
| Utility Gas | 30 (44.8%) | 10 (28.6%) |
| Bottled, Tank, or LP Gas | 1 (1.5%) | 0 (0.0%) |
| Electricity | 36 (53.7%) | 11 (31.4%) |
| Fuel Oil or Kerosene | 0 (0.0%) | 0 (0.0%) |
| Coal or Coke | 0 (0.0%) | 0 (0.0%) |
| All other Fuels | 0 (0.0%) | 14 (40.0%) |
| No Fuel Used | 0 (0.0%) | 0 (0.0%) |
| Total | 67 (100.0%) | 35 (100.0%) |
Household Vehicle Usage in Blackwell
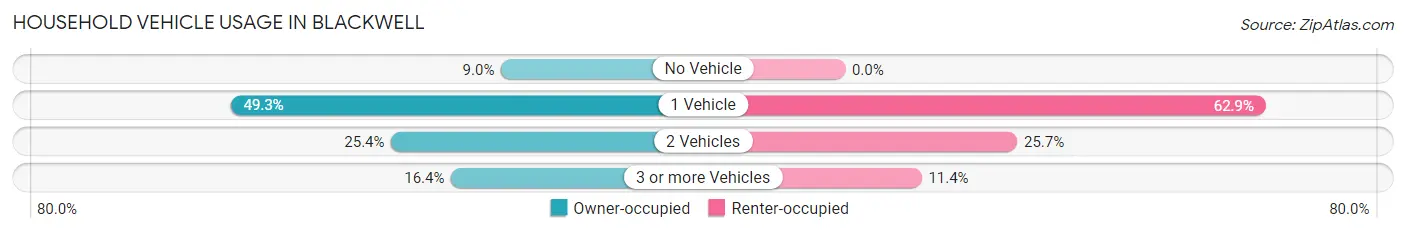
| Vehicles per Household | Owner-occupied | Renter-occupied |
| No Vehicle | 6 (9.0%) | 0 (0.0%) |
| 1 Vehicle | 33 (49.2%) | 22 (62.9%) |
| 2 Vehicles | 17 (25.4%) | 9 (25.7%) |
| 3 or more Vehicles | 11 (16.4%) | 4 (11.4%) |
| Total | 67 (100.0%) | 35 (100.0%) |
Real Estate & Mortgages in Blackwell
Real Estate and Mortgage Overview in Blackwell
| Characteristic | Without Mortgage | With Mortgage |
| Housing Units | 60 | 7 |
| Median Property Value | $47,000 | $0 |
| Median Household Income | $58,000 | $1 |
| Monthly Housing Costs | $283 | $0 |
| Real Estate Taxes | $271 | $6 |
Property Value by Mortgage Status in Blackwell
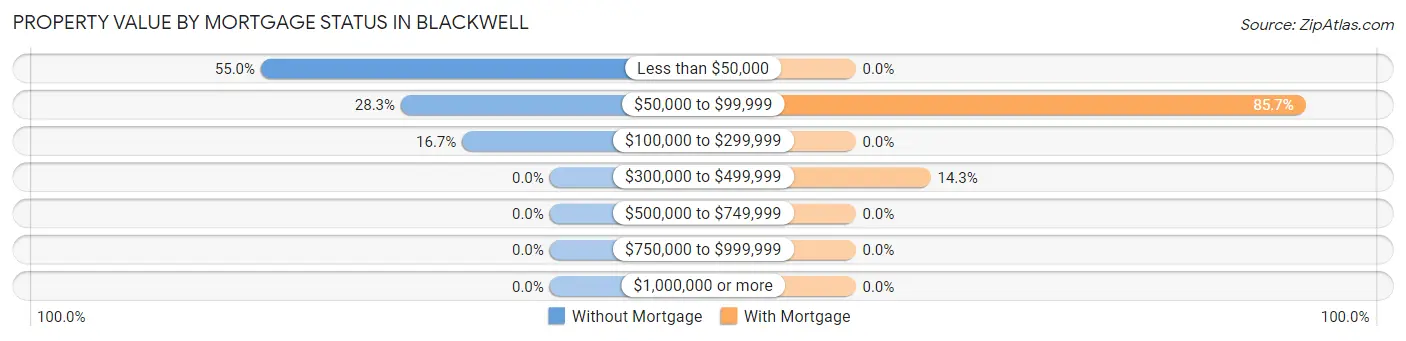
| Property Value | Without Mortgage | With Mortgage |
| Less than $50,000 | 33 (55.0%) | 0 (0.0%) |
| $50,000 to $99,999 | 17 (28.3%) | 6 (85.7%) |
| $100,000 to $299,999 | 10 (16.7%) | 0 (0.0%) |
| $300,000 to $499,999 | 0 (0.0%) | 1 (14.3%) |
| $500,000 to $749,999 | 0 (0.0%) | 0 (0.0%) |
| $750,000 to $999,999 | 0 (0.0%) | 0 (0.0%) |
| $1,000,000 or more | 0 (0.0%) | 0 (0.0%) |
| Total | 60 (100.0%) | 7 (100.0%) |
Household Income by Mortgage Status in Blackwell
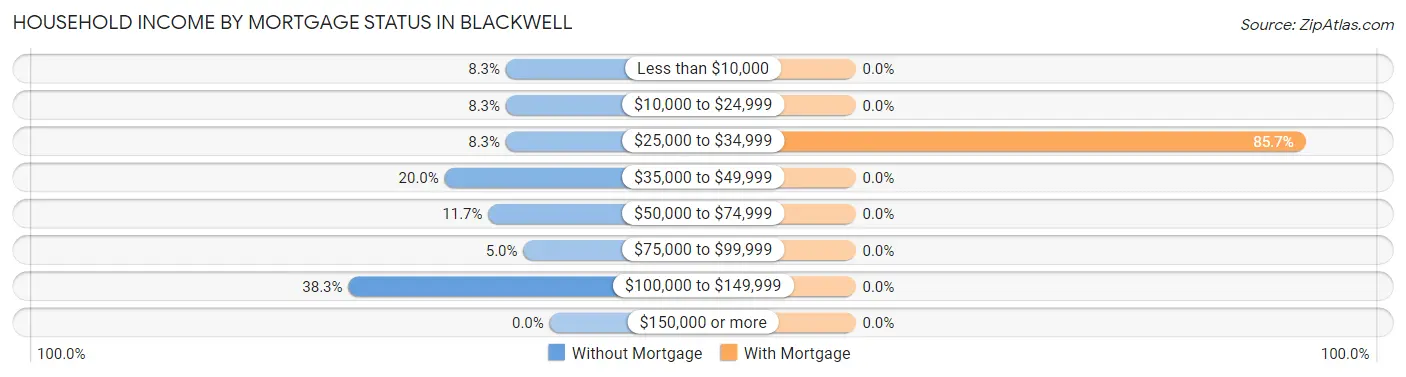
| Household Income | Without Mortgage | With Mortgage |
| Less than $10,000 | 5 (8.3%) | 0 (0.0%) |
| $10,000 to $24,999 | 5 (8.3%) | 0 (0.0%) |
| $25,000 to $34,999 | 5 (8.3%) | 6 (85.7%) |
| $35,000 to $49,999 | 12 (20.0%) | 0 (0.0%) |
| $50,000 to $74,999 | 7 (11.7%) | 0 (0.0%) |
| $75,000 to $99,999 | 3 (5.0%) | 0 (0.0%) |
| $100,000 to $149,999 | 23 (38.3%) | 0 (0.0%) |
| $150,000 or more | 0 (0.0%) | 0 (0.0%) |
| Total | 60 (100.0%) | 7 (100.0%) |
Property Value to Household Income Ratio in Blackwell
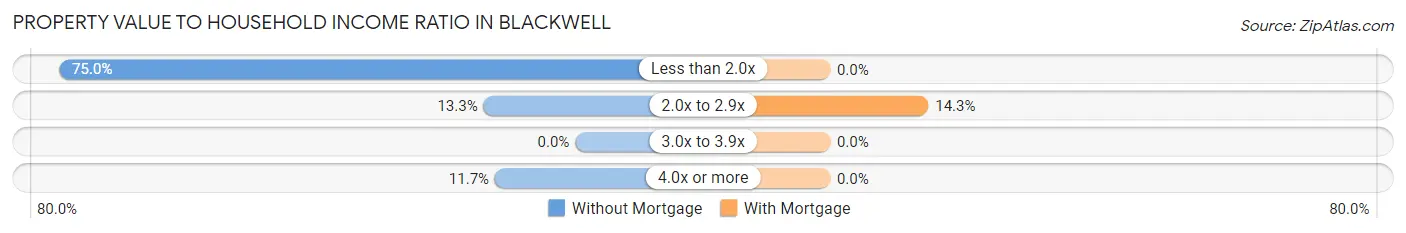
| Value-to-Income Ratio | Without Mortgage | With Mortgage |
| Less than 2.0x | 45 (75.0%) | 0 (0.0%) |
| 2.0x to 2.9x | 8 (13.3%) | 1 (14.3%) |
| 3.0x to 3.9x | 0 (0.0%) | 0 (0.0%) |
| 4.0x or more | 7 (11.7%) | 0 (0.0%) |
| Total | 60 (100.0%) | 7 (100.0%) |
Real Estate Taxes by Mortgage Status in Blackwell
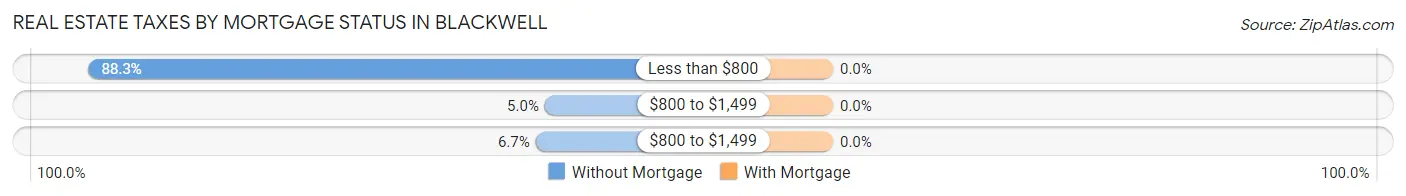
| Property Taxes | Without Mortgage | With Mortgage |
| Less than $800 | 53 (88.3%) | 0 (0.0%) |
| $800 to $1,499 | 3 (5.0%) | 0 (0.0%) |
| $800 to $1,499 | 4 (6.7%) | 0 (0.0%) |
| Total | 60 (100.0%) | 7 (100.0%) |
Health & Disability in Blackwell
Health Insurance Coverage by Age in Blackwell
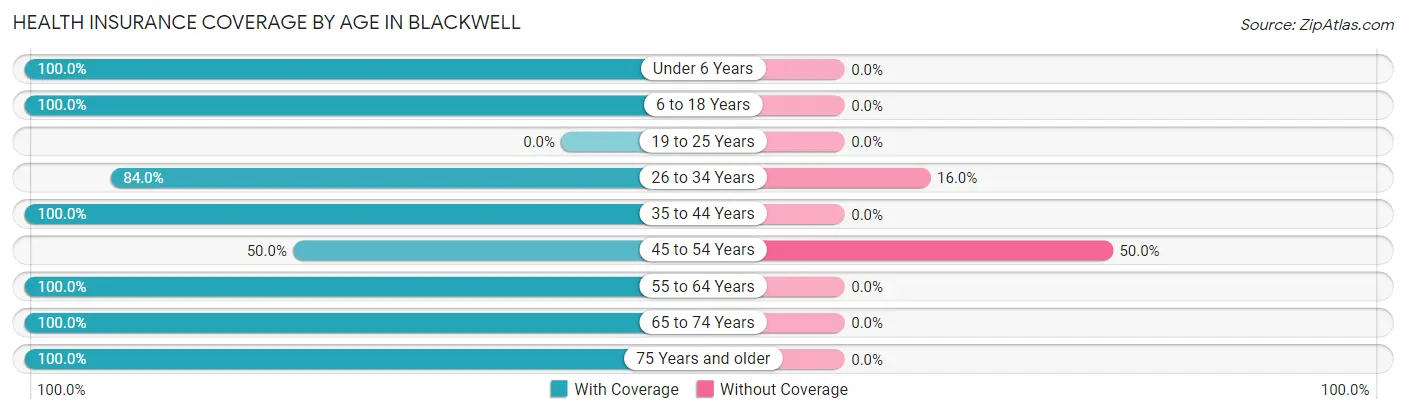
| Age Bracket | With Coverage | Without Coverage |
| Under 6 Years | 10 (100.0%) | 0 (0.0%) |
| 6 to 18 Years | 34 (100.0%) | 0 (0.0%) |
| 19 to 25 Years | 0 (0.0%) | 0 (0.0%) |
| 26 to 34 Years | 21 (84.0%) | 4 (16.0%) |
| 35 to 44 Years | 16 (100.0%) | 0 (0.0%) |
| 45 to 54 Years | 14 (50.0%) | 14 (50.0%) |
| 55 to 64 Years | 28 (100.0%) | 0 (0.0%) |
| 65 to 74 Years | 35 (100.0%) | 0 (0.0%) |
| 75 Years and older | 23 (100.0%) | 0 (0.0%) |
| Total | 181 (90.9%) | 18 (9.0%) |
Health Insurance Coverage by Citizenship Status in Blackwell
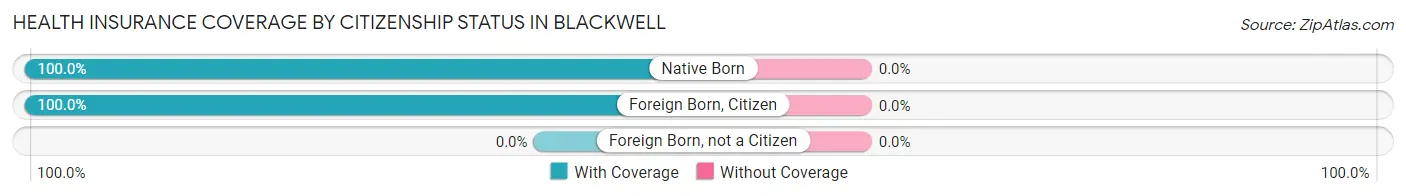
| Citizenship Status | With Coverage | Without Coverage |
| Native Born | 10 (100.0%) | 0 (0.0%) |
| Foreign Born, Citizen | 34 (100.0%) | 0 (0.0%) |
| Foreign Born, not a Citizen | 0 (0.0%) | 0 (0.0%) |
Health Insurance Coverage by Household Income in Blackwell
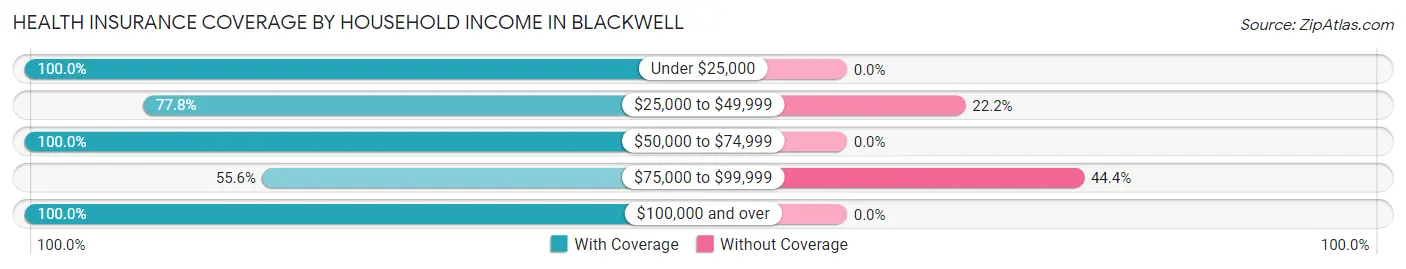
| Household Income | With Coverage | Without Coverage |
| Under $25,000 | 27 (100.0%) | 0 (0.0%) |
| $25,000 to $49,999 | 49 (77.8%) | 14 (22.2%) |
| $50,000 to $74,999 | 11 (100.0%) | 0 (0.0%) |
| $75,000 to $99,999 | 5 (55.6%) | 4 (44.4%) |
| $100,000 and over | 89 (100.0%) | 0 (0.0%) |
Public vs Private Health Insurance Coverage by Age in Blackwell
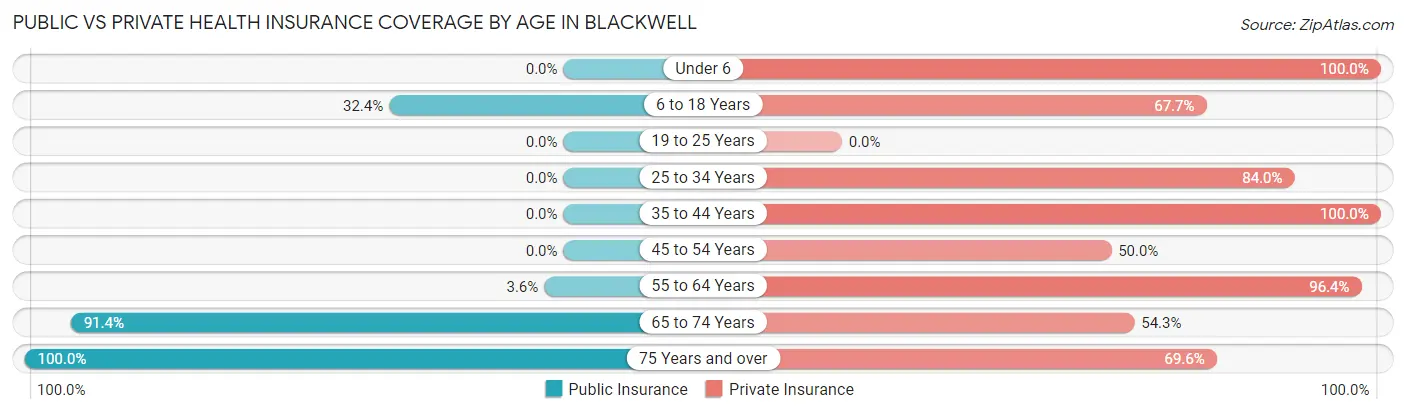
| Age Bracket | Public Insurance | Private Insurance |
| Under 6 | 0 (0.0%) | 10 (100.0%) |
| 6 to 18 Years | 11 (32.4%) | 23 (67.6%) |
| 19 to 25 Years | 0 (0.0%) | 0 (0.0%) |
| 25 to 34 Years | 0 (0.0%) | 21 (84.0%) |
| 35 to 44 Years | 0 (0.0%) | 16 (100.0%) |
| 45 to 54 Years | 0 (0.0%) | 14 (50.0%) |
| 55 to 64 Years | 1 (3.6%) | 27 (96.4%) |
| 65 to 74 Years | 32 (91.4%) | 19 (54.3%) |
| 75 Years and over | 23 (100.0%) | 16 (69.6%) |
| Total | 67 (33.7%) | 146 (73.4%) |
Disability Status by Sex by Age in Blackwell
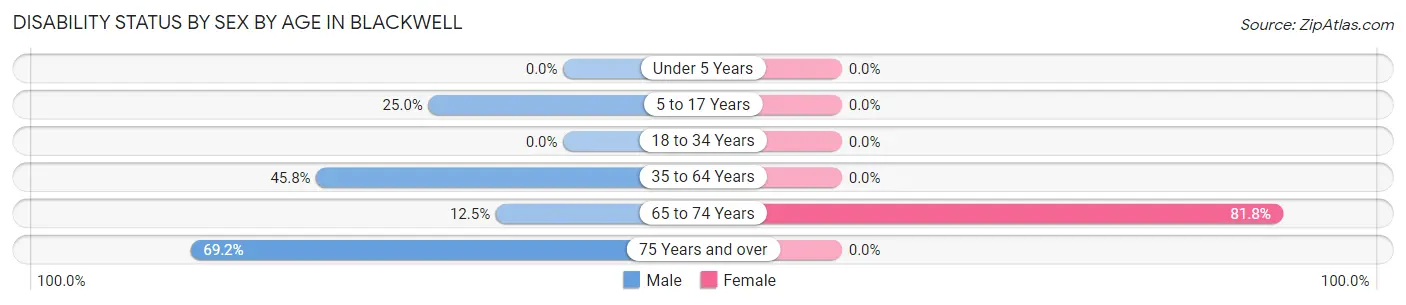
| Age Bracket | Male | Female |
| Under 5 Years | 0 (0.0%) | 0 (0.0%) |
| 5 to 17 Years | 4 (25.0%) | 0 (0.0%) |
| 18 to 34 Years | 0 (0.0%) | 0 (0.0%) |
| 35 to 64 Years | 22 (45.8%) | 0 (0.0%) |
| 65 to 74 Years | 3 (12.5%) | 9 (81.8%) |
| 75 Years and over | 9 (69.2%) | 0 (0.0%) |
Disability Class by Sex by Age in Blackwell
Disability Class: Hearing Difficulty
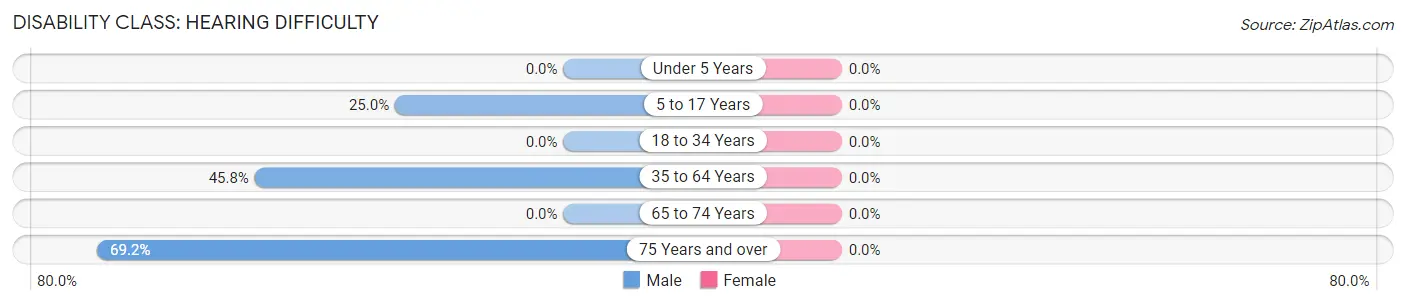
| Age Bracket | Male | Female |
| Under 5 Years | 0 (0.0%) | 0 (0.0%) |
| 5 to 17 Years | 4 (25.0%) | 0 (0.0%) |
| 18 to 34 Years | 0 (0.0%) | 0 (0.0%) |
| 35 to 64 Years | 22 (45.8%) | 0 (0.0%) |
| 65 to 74 Years | 0 (0.0%) | 0 (0.0%) |
| 75 Years and over | 9 (69.2%) | 0 (0.0%) |
Disability Class: Vision Difficulty
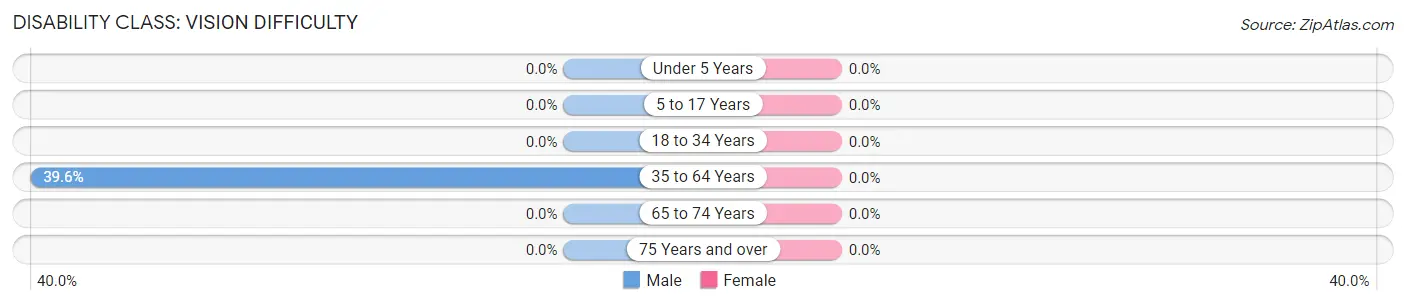
| Age Bracket | Male | Female |
| Under 5 Years | 0 (0.0%) | 0 (0.0%) |
| 5 to 17 Years | 0 (0.0%) | 0 (0.0%) |
| 18 to 34 Years | 0 (0.0%) | 0 (0.0%) |
| 35 to 64 Years | 19 (39.6%) | 0 (0.0%) |
| 65 to 74 Years | 0 (0.0%) | 0 (0.0%) |
| 75 Years and over | 0 (0.0%) | 0 (0.0%) |
Disability Class: Cognitive Difficulty
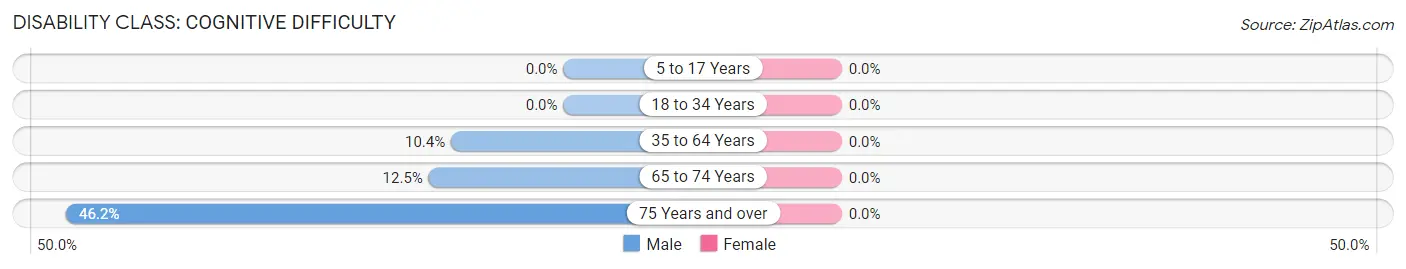
| Age Bracket | Male | Female |
| 5 to 17 Years | 0 (0.0%) | 0 (0.0%) |
| 18 to 34 Years | 0 (0.0%) | 0 (0.0%) |
| 35 to 64 Years | 5 (10.4%) | 0 (0.0%) |
| 65 to 74 Years | 3 (12.5%) | 0 (0.0%) |
| 75 Years and over | 6 (46.2%) | 0 (0.0%) |
Disability Class: Ambulatory Difficulty
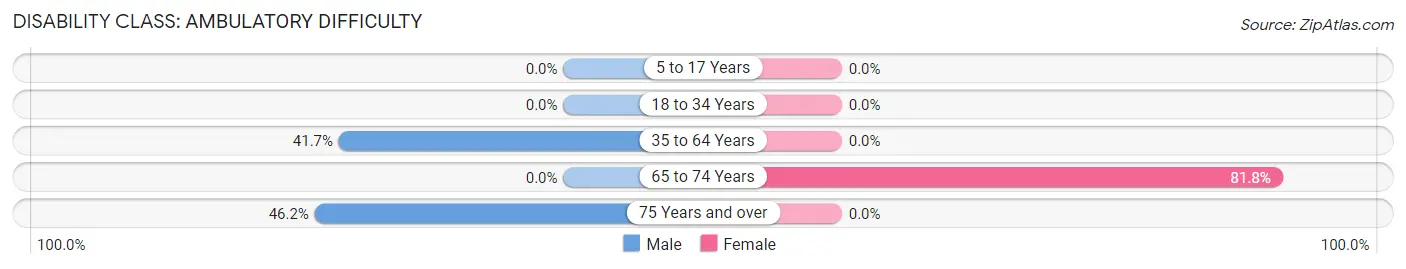
| Age Bracket | Male | Female |
| 5 to 17 Years | 0 (0.0%) | 0 (0.0%) |
| 18 to 34 Years | 0 (0.0%) | 0 (0.0%) |
| 35 to 64 Years | 20 (41.7%) | 0 (0.0%) |
| 65 to 74 Years | 0 (0.0%) | 9 (81.8%) |
| 75 Years and over | 6 (46.2%) | 0 (0.0%) |
Disability Class: Self-Care Difficulty
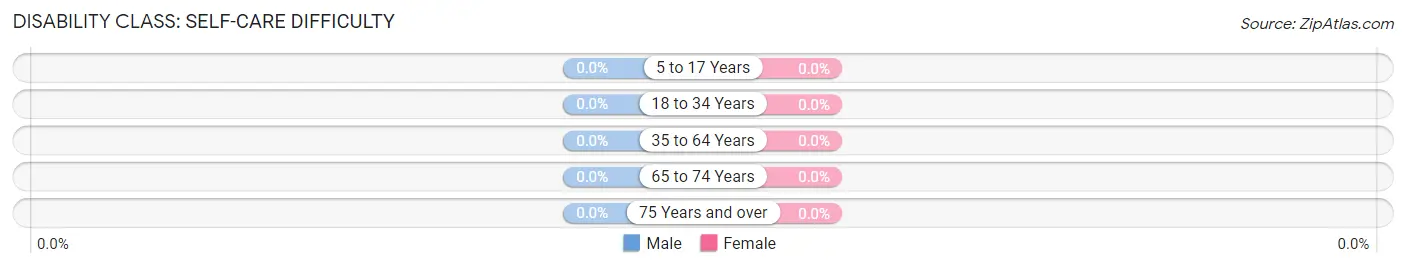
| Age Bracket | Male | Female |
| 5 to 17 Years | 0 (0.0%) | 0 (0.0%) |
| 18 to 34 Years | 0 (0.0%) | 0 (0.0%) |
| 35 to 64 Years | 0 (0.0%) | 0 (0.0%) |
| 65 to 74 Years | 0 (0.0%) | 0 (0.0%) |
| 75 Years and over | 0 (0.0%) | 0 (0.0%) |
Technology Access in Blackwell
Computing Device Access in Blackwell
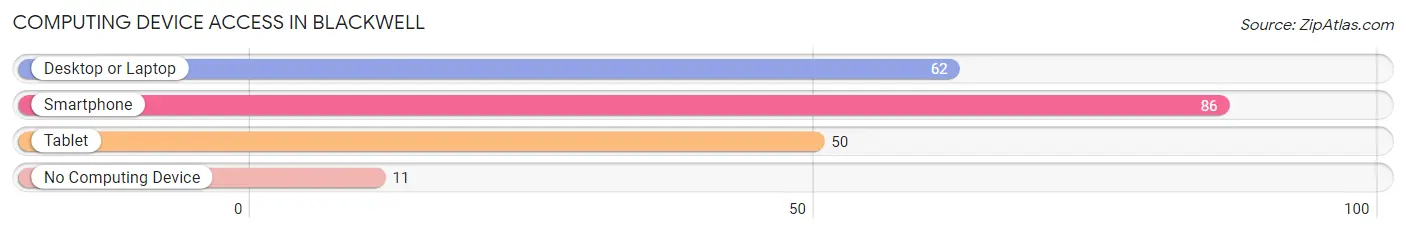
| Device Type | # Households | % Households |
| Desktop or Laptop | 62 | 60.8% |
| Smartphone | 86 | 84.3% |
| Tablet | 50 | 49.0% |
| No Computing Device | 11 | 10.8% |
| Total | 102 | 100.0% |
Internet Access in Blackwell
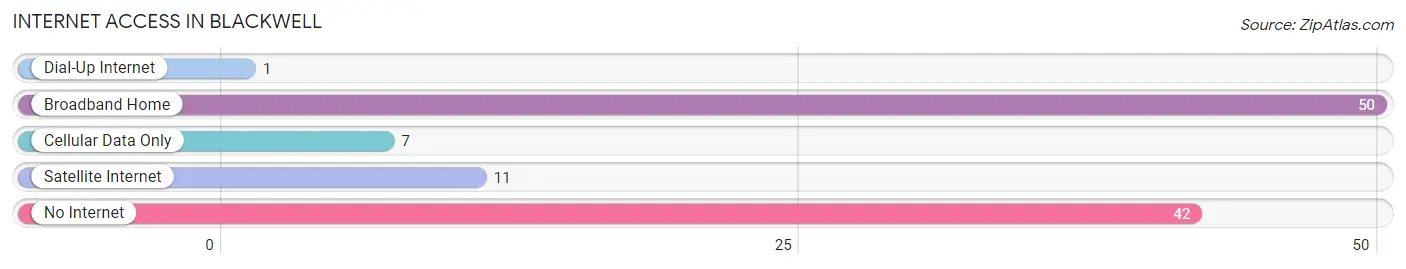
| Internet Type | # Households | % Households |
| Dial-Up Internet | 1 | 1.0% |
| Broadband Home | 50 | 49.0% |
| Cellular Data Only | 7 | 6.9% |
| Satellite Internet | 11 | 10.8% |
| No Internet | 42 | 41.2% |
| Total | 102 | 100.0% |
Blackwell Summary
Blackwell is a small town located in the state of Texas, in the United States. It is situated in the county of Taylor, and is part of the Abilene Metropolitan Statistical Area. The town has a population of around 1,000 people, and is located about 20 miles south of Abilene.
History
Blackwell was founded in 1881 by a group of settlers from the nearby town of Buffalo Gap. The town was named after a local rancher, William Blackwell, who owned a large amount of land in the area. The town was originally a farming community, and the main crops grown were cotton, corn, and wheat.
In the early 1900s, the town began to grow and develop. The first school was built in 1906, and the first post office was established in 1907. The town also had a bank, a hotel, and several stores.
In the 1920s, the town began to decline due to the Great Depression. Many of the businesses closed, and the population decreased. However, the town was able to survive and eventually began to grow again.
In the 1950s, the town began to experience a resurgence. The population increased, and new businesses opened. The town also began to attract tourists, as it was located near several popular attractions, such as the Abilene Zoo and the Abilene State Park.
Geography
Blackwell is located in the northern part of Taylor County, in the state of Texas. It is situated about 20 miles south of Abilene, and is part of the Abilene Metropolitan Statistical Area. The town is located in a flat, open area, and is surrounded by farmland. The climate is generally hot and dry, with temperatures ranging from the mid-80s in the summer to the mid-30s in the winter.
Economy
The economy of Blackwell is largely based on agriculture. The main crops grown in the area are cotton, corn, and wheat. The town also has several small businesses, such as restaurants, stores, and a bank.
Demographics
As of the 2010 census, the population of Blackwell was 1,000 people. The racial makeup of the town was 95.2% White, 0.7% African American, 0.7% Native American, 0.7% Asian, and 2.7% from other races. The median household income was $37,500, and the median age was 37.
Conclusion
Blackwell is a small town located in the state of Texas, in the United States. It has a population of around 1,000 people, and is part of the Abilene Metropolitan Statistical Area. The town was founded in 1881, and has a long history of farming and ranching. The economy of Blackwell is largely based on agriculture, and the town also has several small businesses. The population of Blackwell is mostly White, with a small percentage of African American, Native American, and Asian residents.
Common Questions
What is Per Capita Income in Blackwell?
Per Capita income in Blackwell is $42,471.
What is the Median Household income in Blackwell?
Median Household Income in Blackwell is $46,071.
What is Income or Wage Gap in Blackwell?
Income or Wage Gap in Blackwell is 25.5%.
Women in Blackwell earn 74.5 cents for every dollar earned by a man.
What is Inequality or Gini Index in Blackwell?
Inequality or Gini Index in Blackwell is 0.43.
What is the Total Population of Blackwell?
Total Population of Blackwell is 199.
What is the Total Male Population of Blackwell?
Total Male Population of Blackwell is 126.
What is the Total Female Population of Blackwell?
Total Female Population of Blackwell is 73.
What is the Ratio of Males per 100 Females in Blackwell?
There are 172.60 Males per 100 Females in Blackwell.
What is the Ratio of Females per 100 Males in Blackwell?
There are 57.94 Females per 100 Males in Blackwell.
What is the Median Population Age in Blackwell?
Median Population Age in Blackwell is 52.1 Years.
What is the Average Family Size in Blackwell
Average Family Size in Blackwell is 2.7 People.
What is the Average Household Size in Blackwell
Average Household Size in Blackwell is 1.9 People.
How Large is the Labor Force in Blackwell?
There are 102 People in the Labor Forcein in Blackwell.
What is the Percentage of People in the Labor Force in Blackwell?
65.8% of People are in the Labor Force in Blackwell.