Zip Codes with the Highest Percentage of Population Employed in Production in Beeville, TX
RELATED REPORTS & OPTIONS
Production
Beeville
Compare Zip Codes
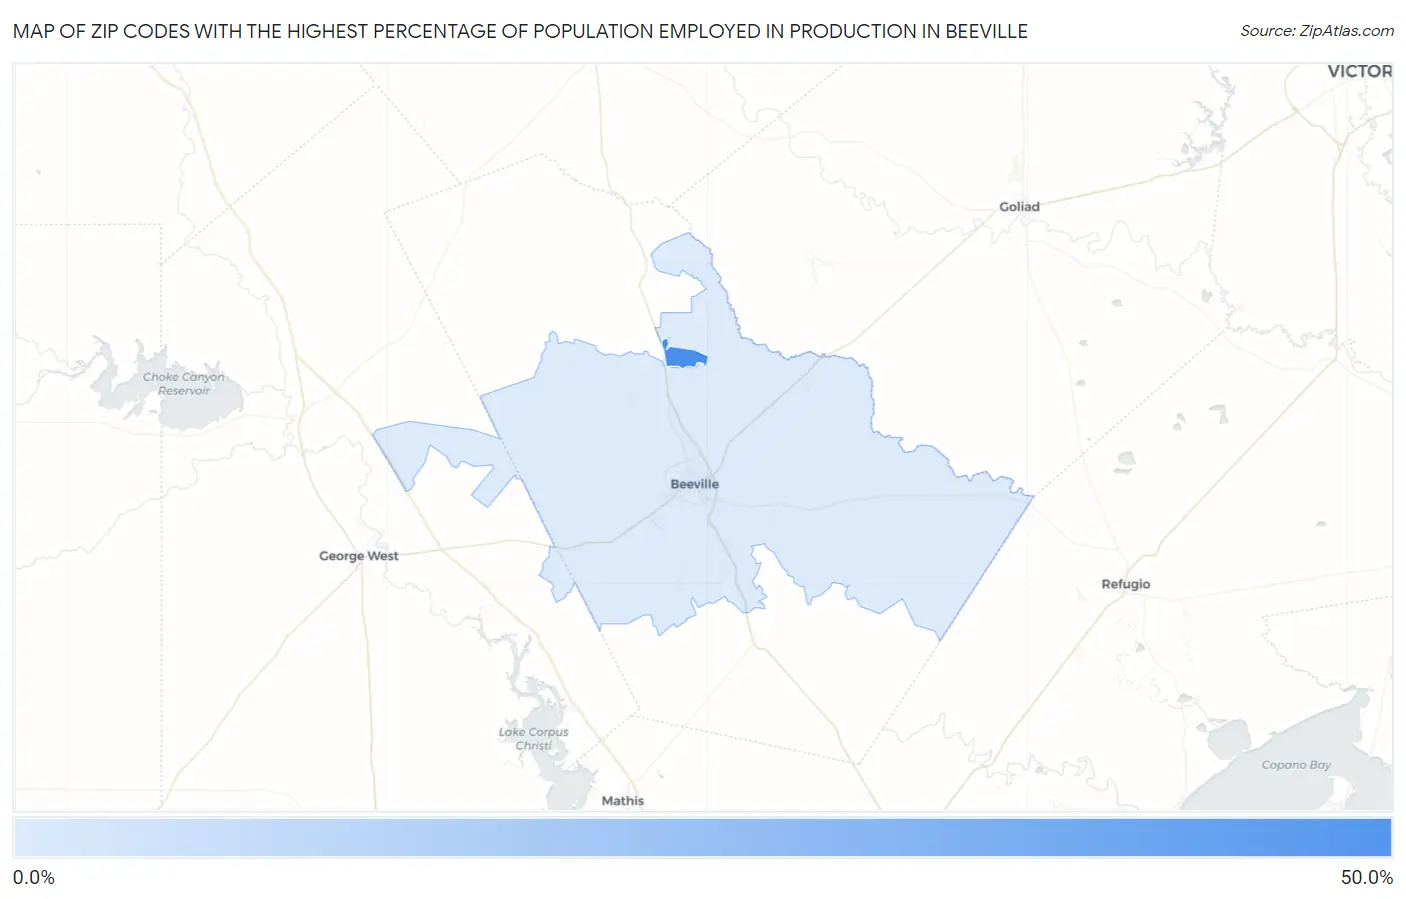
Map of Zip Codes with the Highest Percentage of Population Employed in Production in Beeville
7.4%
48.8%
Zip Codes with the Highest Percentage of Population Employed in Production in Beeville, TX
| Zip Code | % Employed | vs State | vs National | |
| 1. | 78104 | 48.8% | 4.9%(+43.9)#9 | 5.5%(+43.3)#141 |
| 2. | 78102 | 7.4% | 4.9%(+2.50)#519 | 5.5%(+1.91)#12,237 |
1
Common Questions
What are the Top Zip Codes with the Highest Percentage of Population Employed in Production in Beeville, TX?
Top Zip Codes with the Highest Percentage of Population Employed in Production in Beeville, TX are:
What zip code has the Highest Percentage of Population Employed in Production in Beeville, TX?
78104 has the Highest Percentage of Population Employed in Production in Beeville, TX with 48.8%.
What is the Percentage of Population Employed in Production in Beeville, TX?
Percentage of Population Employed in Production in Beeville is 7.6%.
What is the Percentage of Population Employed in Production in Texas?
Percentage of Population Employed in Production in Texas is 4.9%.
What is the Percentage of Population Employed in Production in the United States?
Percentage of Population Employed in Production in the United States is 5.5%.