Ballinger, TX Map & Demographics
Ballinger Map
Ballinger Overview
$25,263
PER CAPITA INCOME
$58,309
AVG FAMILY INCOME
$54,583
AVG HOUSEHOLD INCOME
11.0%
WAGE / INCOME GAP [ % ]
89.0¢/ $1
WAGE / INCOME GAP [ $ ]
0.38
INEQUALITY / GINI INDEX
3,587
TOTAL POPULATION
1,903
MALE POPULATION
1,684
FEMALE POPULATION
113.00
MALES / 100 FEMALES
88.49
FEMALES / 100 MALES
40.7
MEDIAN AGE
3.1
AVG FAMILY SIZE
2.5
AVG HOUSEHOLD SIZE
1,569
LABOR FORCE [ PEOPLE ]
57.4%
PERCENT IN LABOR FORCE
6.1%
UNEMPLOYMENT RATE
Ballinger Zip Codes
Ballinger Area Codes
Income in Ballinger
Income Overview in Ballinger
Per Capita Income in Ballinger is $25,263, while median incomes of families and households are $58,309 and $54,583 respectively.
| Characteristic | Number | Measure |
| Per Capita Income | 3,587 | $25,263 |
| Median Family Income | 841 | $58,309 |
| Mean Family Income | 841 | $76,723 |
| Median Household Income | 1,373 | $54,583 |
| Mean Household Income | 1,373 | $65,374 |
| Income Deficit | 841 | $0 |
| Wage / Income Gap (%) | 3,587 | 11.00% |
| Wage / Income Gap ($) | 3,587 | 89.00¢ per $1 |
| Gini / Inequality Index | 3,587 | 0.38 |
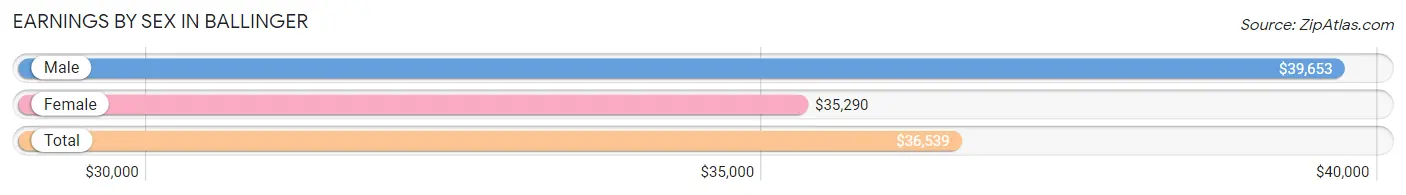
Earnings by Sex in Ballinger
Average Earnings in Ballinger are $36,539, $39,653 for men and $35,290 for women, a difference of 11.0%.
| Sex | Number | Average Earnings |
| Male | 1,000 (60.5%) | $39,653 |
| Female | 653 (39.5%) | $35,290 |
| Total | 1,653 (100.0%) | $36,539 |
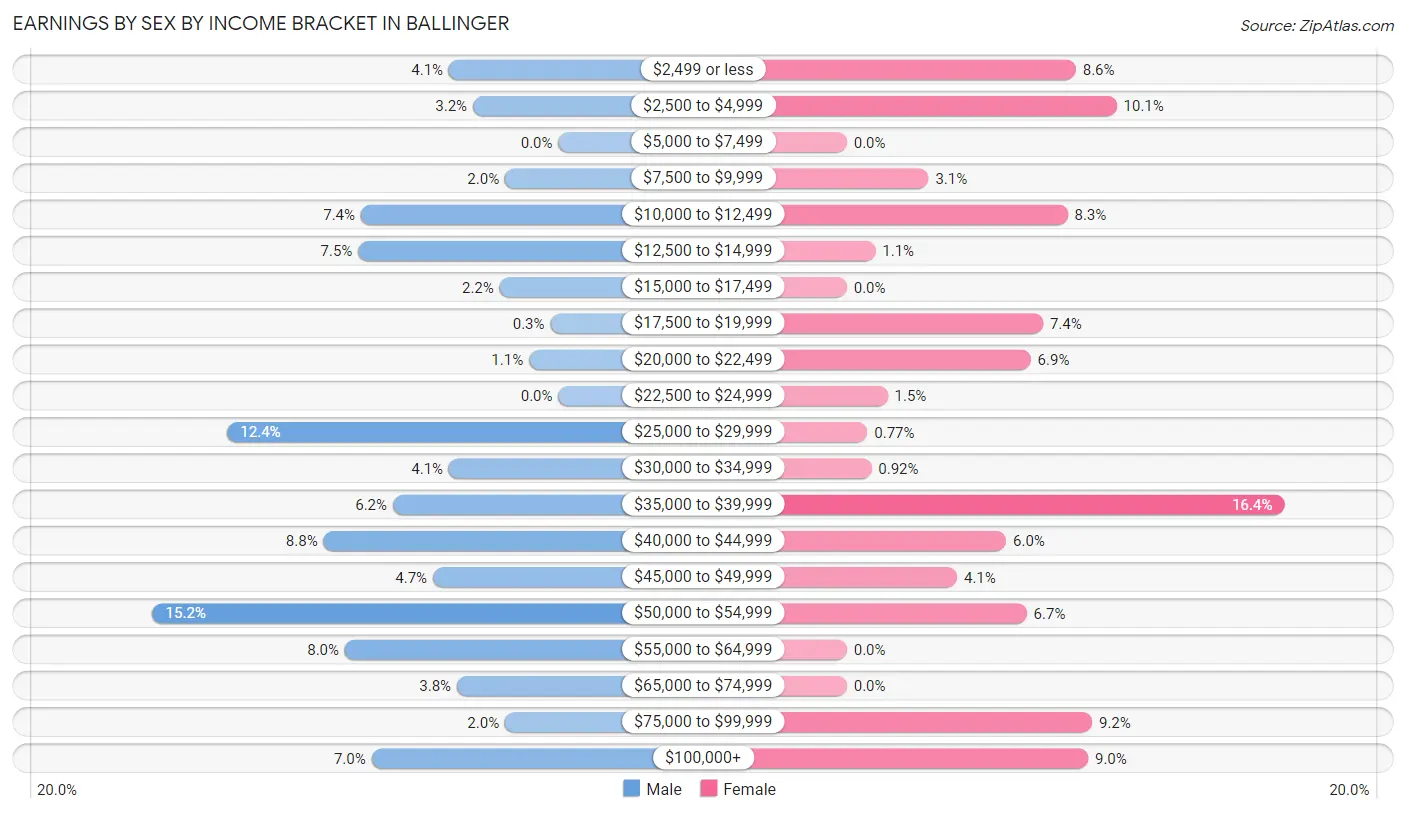
Earnings by Sex by Income Bracket in Ballinger
The most common earnings brackets in Ballinger are $50,000 to $54,999 for men (152 | 15.2%) and $35,000 to $39,999 for women (107 | 16.4%).
| Income | Male | Female |
| $2,499 or less | 41 (4.1%) | 56 (8.6%) |
| $2,500 to $4,999 | 32 (3.2%) | 66 (10.1%) |
| $5,000 to $7,499 | 0 (0.0%) | 0 (0.0%) |
| $7,500 to $9,999 | 20 (2.0%) | 20 (3.1%) |
| $10,000 to $12,499 | 74 (7.4%) | 54 (8.3%) |
| $12,500 to $14,999 | 75 (7.5%) | 7 (1.1%) |
| $15,000 to $17,499 | 22 (2.2%) | 0 (0.0%) |
| $17,500 to $19,999 | 3 (0.3%) | 48 (7.3%) |
| $20,000 to $22,499 | 11 (1.1%) | 45 (6.9%) |
| $22,500 to $24,999 | 0 (0.0%) | 10 (1.5%) |
| $25,000 to $29,999 | 124 (12.4%) | 5 (0.8%) |
| $30,000 to $34,999 | 41 (4.1%) | 6 (0.9%) |
| $35,000 to $39,999 | 62 (6.2%) | 107 (16.4%) |
| $40,000 to $44,999 | 88 (8.8%) | 39 (6.0%) |
| $45,000 to $49,999 | 47 (4.7%) | 27 (4.1%) |
| $50,000 to $54,999 | 152 (15.2%) | 44 (6.7%) |
| $55,000 to $64,999 | 80 (8.0%) | 0 (0.0%) |
| $65,000 to $74,999 | 38 (3.8%) | 0 (0.0%) |
| $75,000 to $99,999 | 20 (2.0%) | 60 (9.2%) |
| $100,000+ | 70 (7.0%) | 59 (9.0%) |
| Total | 1,000 (100.0%) | 653 (100.0%) |
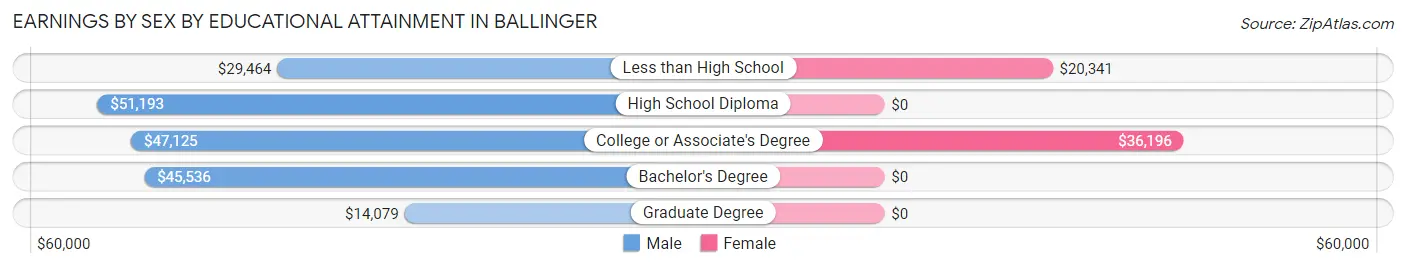
Earnings by Sex by Educational Attainment in Ballinger
Average earnings in Ballinger are $41,524 for men and $35,442 for women, a difference of 14.6%. Men with an educational attainment of high school diploma enjoy the highest average annual earnings of $51,193, while those with graduate degree education earn the least with $14,079. Women with an educational attainment of college or associate's degree earn the most with the average annual earnings of $36,196, while those with less than high school education have the smallest earnings of $20,341.
| Educational Attainment | Male Income | Female Income |
| Less than High School | $29,464 | $20,341 |
| High School Diploma | $51,193 | $0 |
| College or Associate's Degree | $47,125 | $36,196 |
| Bachelor's Degree | $45,536 | $0 |
| Graduate Degree | $14,079 | $0 |
| Total | $41,524 | $35,442 |
Family Income in Ballinger
Family Income Brackets in Ballinger
According to the Ballinger family income data, there are 249 families falling into the $50,000 to $74,999 income range, which is the most common income bracket and makes up 29.6% of all families.
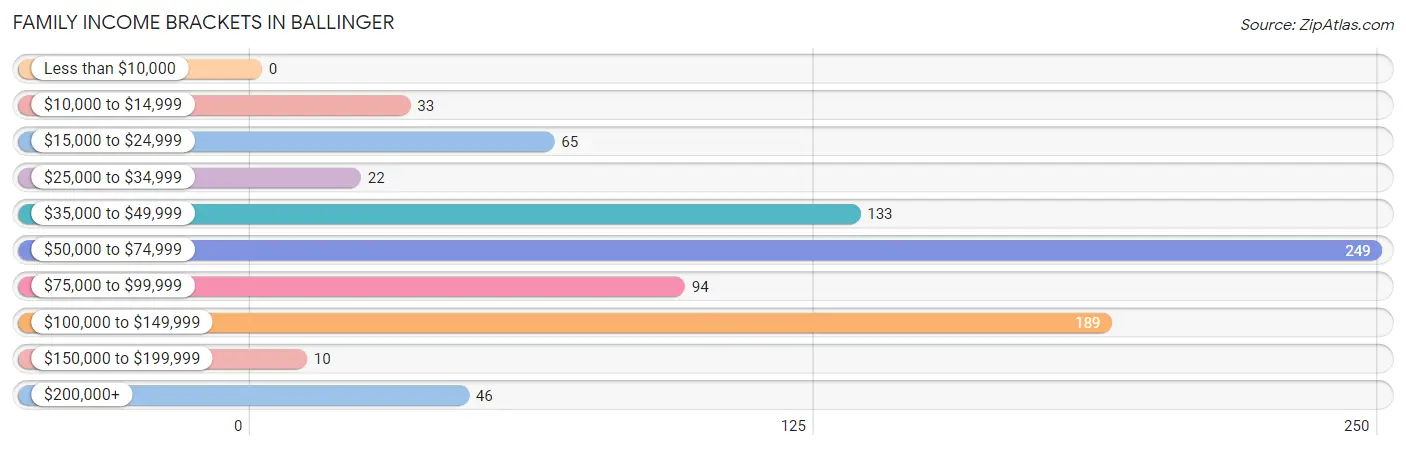
| Income Bracket | # Families | % Families |
| Less than $10,000 | 0 | 0.0% |
| $10,000 to $14,999 | 33 | 3.9% |
| $15,000 to $24,999 | 65 | 7.7% |
| $25,000 to $34,999 | 22 | 2.6% |
| $35,000 to $49,999 | 133 | 15.8% |
| $50,000 to $74,999 | 249 | 29.6% |
| $75,000 to $99,999 | 94 | 11.2% |
| $100,000 to $149,999 | 189 | 22.5% |
| $150,000 to $199,999 | 10 | 1.2% |
| $200,000+ | 46 | 5.5% |
Family Income by Famaliy Size in Ballinger
5-person families (89 | 10.6%) account for the highest median family income in Ballinger with $103,090 per family, while 2-person families (449 | 53.4%) have the highest median income of $27,203 per family member.
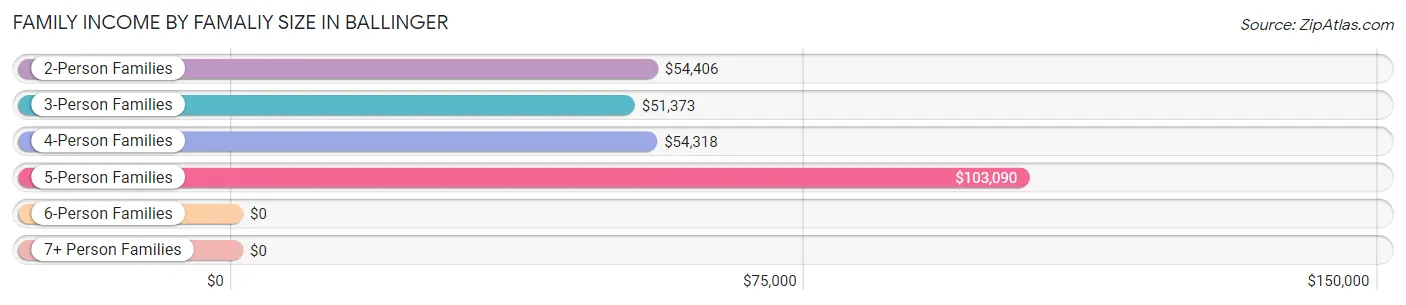
| Income Bracket | # Families | Median Income |
| 2-Person Families | 449 (53.4%) | $54,406 |
| 3-Person Families | 157 (18.7%) | $51,373 |
| 4-Person Families | 92 (10.9%) | $54,318 |
| 5-Person Families | 89 (10.6%) | $103,090 |
| 6-Person Families | 8 (0.9%) | $0 |
| 7+ Person Families | 46 (5.5%) | $0 |
| Total | 841 (100.0%) | $58,309 |
Family Income by Number of Earners in Ballinger
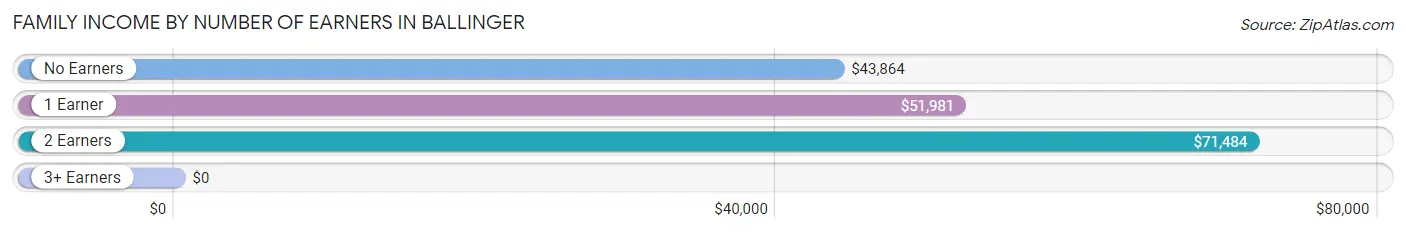
| Number of Earners | # Families | Median Income |
| No Earners | 90 (10.7%) | $43,864 |
| 1 Earner | 389 (46.3%) | $51,981 |
| 2 Earners | 275 (32.7%) | $71,484 |
| 3+ Earners | 87 (10.3%) | $0 |
| Total | 841 (100.0%) | $58,309 |
Household Income in Ballinger
Household Income Brackets in Ballinger
With 373 households falling in the category, the $50,000 to $74,999 income range is the most frequent in Ballinger, accounting for 27.2% of all households. In contrast, only 16 households (1.2%) fall into the $150,000 to $199,999 income bracket, making it the least populous group.
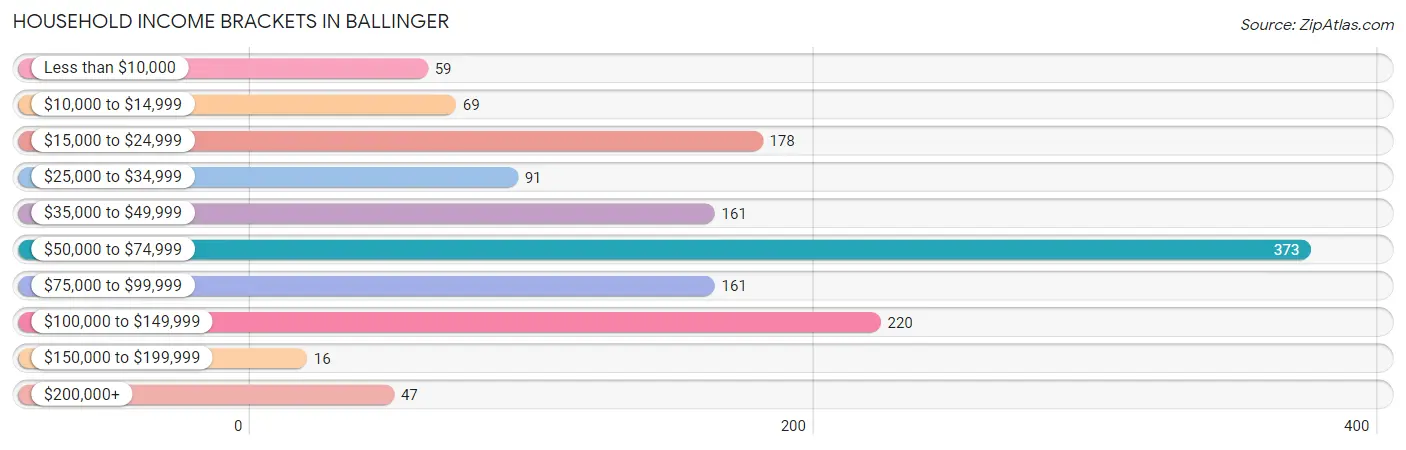
| Income Bracket | # Households | % Households |
| Less than $10,000 | 59 | 4.3% |
| $10,000 to $14,999 | 69 | 5.0% |
| $15,000 to $24,999 | 178 | 13.0% |
| $25,000 to $34,999 | 91 | 6.6% |
| $35,000 to $49,999 | 161 | 11.7% |
| $50,000 to $74,999 | 373 | 27.2% |
| $75,000 to $99,999 | 161 | 11.7% |
| $100,000 to $149,999 | 220 | 16.0% |
| $150,000 to $199,999 | 16 | 1.2% |
| $200,000+ | 47 | 3.4% |
Household Income by Householder Age in Ballinger
The median household income in Ballinger is $54,583, with the highest median household income of $76,477 found in the 45 to 64 years age bracket for the primary householder. A total of 578 households (42.1%) fall into this category. Meanwhile, the 15 to 24 years age bracket for the primary householder has the lowest median household income of $0, with 47 households (3.4%) in this group.
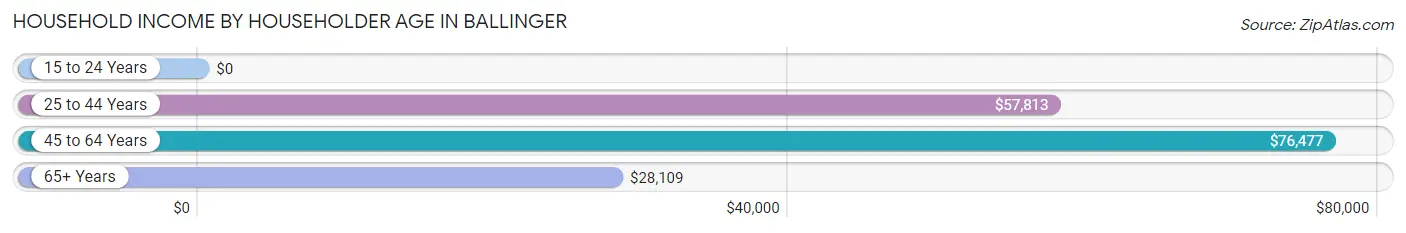
| Income Bracket | # Households | Median Income |
| 15 to 24 Years | 47 (3.4%) | $0 |
| 25 to 44 Years | 341 (24.8%) | $57,813 |
| 45 to 64 Years | 578 (42.1%) | $76,477 |
| 65+ Years | 407 (29.6%) | $28,109 |
| Total | 1,373 (100.0%) | $54,583 |
Poverty in Ballinger
Income Below Poverty by Sex and Age in Ballinger
With 9.1% poverty level for males and 15.5% for females among the residents of Ballinger, 16 and 17 year old males and 15 year old females are the most vulnerable to poverty, with 15 males (36.6%) and 6 females (42.9%) in their respective age groups living below the poverty level.
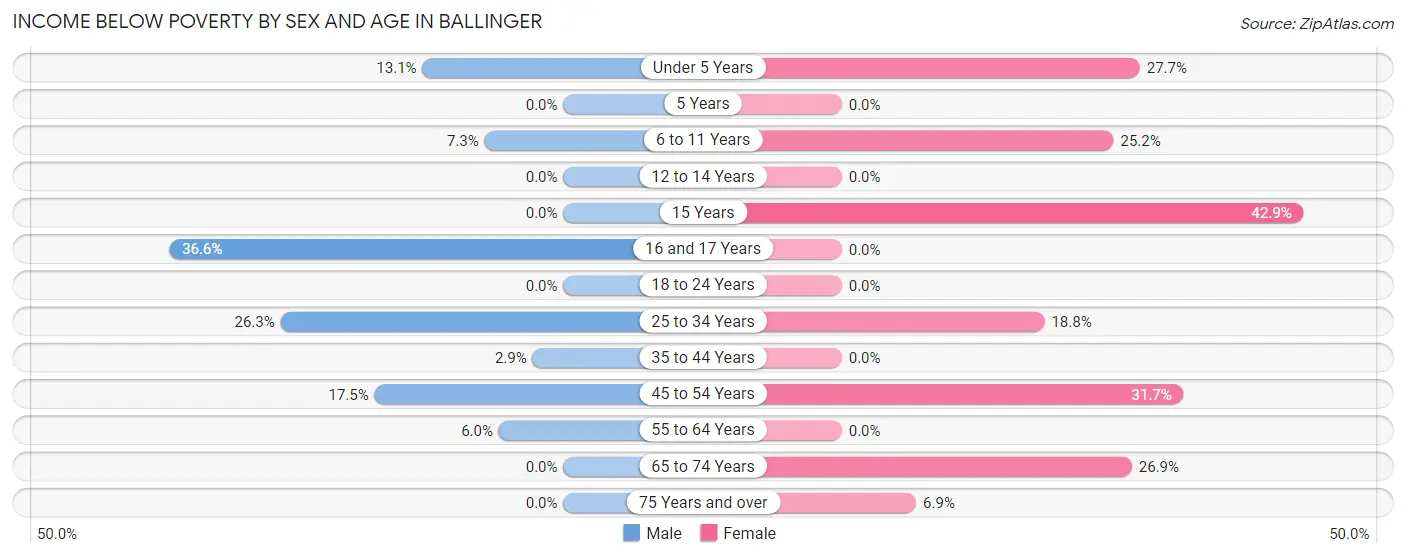
| Age Bracket | Male | Female |
| Under 5 Years | 17 (13.1%) | 13 (27.7%) |
| 5 Years | 0 (0.0%) | 0 (0.0%) |
| 6 to 11 Years | 22 (7.3%) | 29 (25.2%) |
| 12 to 14 Years | 0 (0.0%) | 0 (0.0%) |
| 15 Years | 0 (0.0%) | 6 (42.9%) |
| 16 and 17 Years | 15 (36.6%) | 0 (0.0%) |
| 18 to 24 Years | 0 (0.0%) | 0 (0.0%) |
| 25 to 34 Years | 42 (26.3%) | 41 (18.8%) |
| 35 to 44 Years | 6 (2.9%) | 0 (0.0%) |
| 45 to 54 Years | 48 (17.5%) | 85 (31.7%) |
| 55 to 64 Years | 13 (6.0%) | 0 (0.0%) |
| 65 to 74 Years | 0 (0.0%) | 63 (26.9%) |
| 75 Years and over | 0 (0.0%) | 8 (6.9%) |
| Total | 163 (9.1%) | 245 (15.5%) |
Income Above Poverty by Sex and Age in Ballinger
According to the poverty statistics in Ballinger, males aged 5 years and females aged 5 years are the age groups that are most secure financially, with 100.0% of males and 100.0% of females in these age groups living above the poverty line.
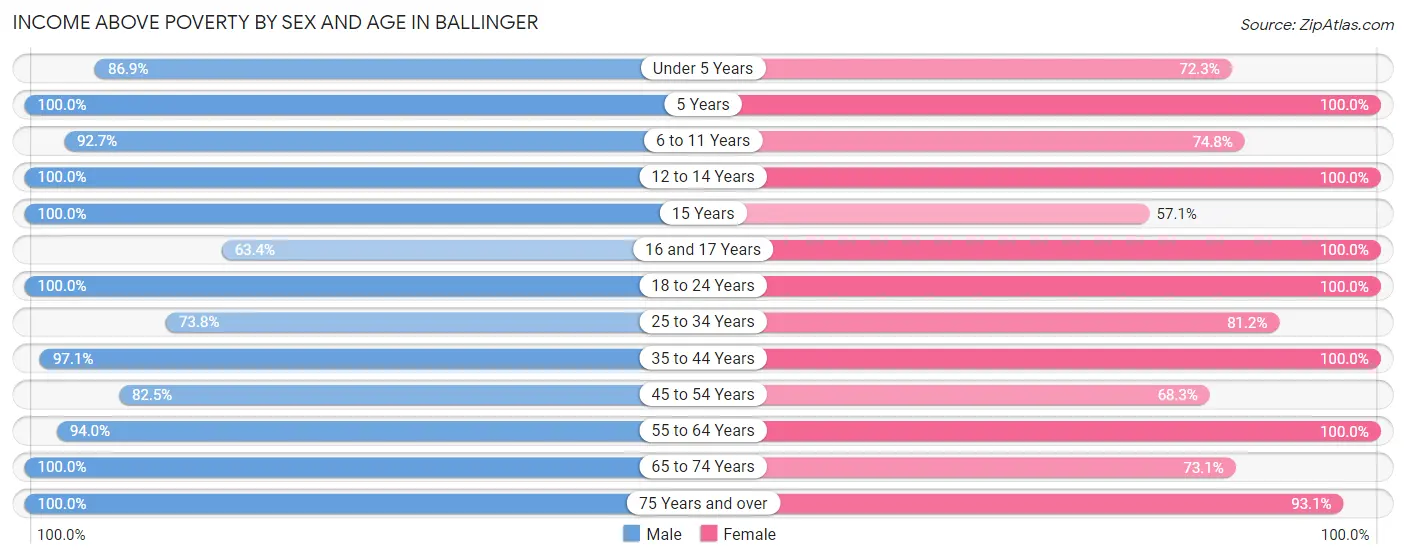
| Age Bracket | Male | Female |
| Under 5 Years | 113 (86.9%) | 34 (72.3%) |
| 5 Years | 15 (100.0%) | 73 (100.0%) |
| 6 to 11 Years | 279 (92.7%) | 86 (74.8%) |
| 12 to 14 Years | 29 (100.0%) | 64 (100.0%) |
| 15 Years | 21 (100.0%) | 8 (57.1%) |
| 16 and 17 Years | 26 (63.4%) | 16 (100.0%) |
| 18 to 24 Years | 152 (100.0%) | 55 (100.0%) |
| 25 to 34 Years | 118 (73.8%) | 177 (81.2%) |
| 35 to 44 Years | 204 (97.1%) | 149 (100.0%) |
| 45 to 54 Years | 226 (82.5%) | 183 (68.3%) |
| 55 to 64 Years | 204 (94.0%) | 210 (100.0%) |
| 65 to 74 Years | 154 (100.0%) | 171 (73.1%) |
| 75 Years and over | 91 (100.0%) | 108 (93.1%) |
| Total | 1,632 (90.9%) | 1,334 (84.5%) |
Income Below Poverty Among Married-Couple Families in Ballinger
The poverty statistics for married-couple families in Ballinger show that 6.3% or 36 of the total 569 families live below the poverty line. Families with 1 or 2 children have the highest poverty rate of 8.6%, comprising of 10 families. On the other hand, families with 3 or 4 children have the lowest poverty rate of 0.0%, which includes 0 families.
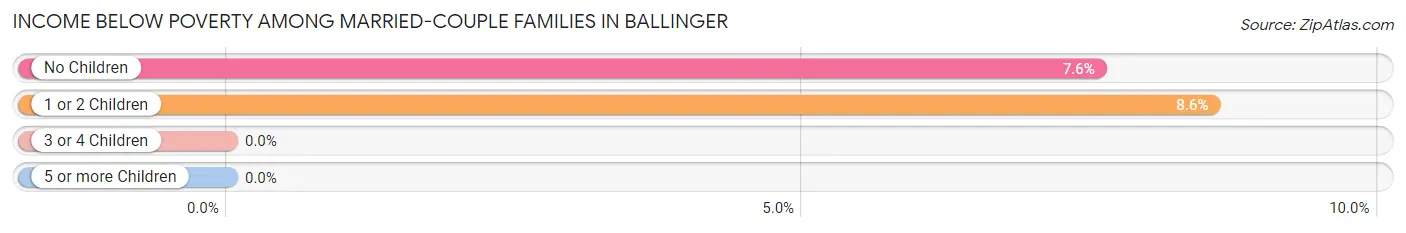
| Children | Above Poverty | Below Poverty |
| No Children | 318 (92.4%) | 26 (7.6%) |
| 1 or 2 Children | 107 (91.4%) | 10 (8.6%) |
| 3 or 4 Children | 108 (100.0%) | 0 (0.0%) |
| 5 or more Children | 0 (0.0%) | 0 (0.0%) |
| Total | 533 (93.7%) | 36 (6.3%) |
Income Below Poverty Among Single-Parent Households in Ballinger
According to the poverty data in Ballinger, 6.9% or 6 single-father households and 31.9% or 59 single-mother households are living below the poverty line. Among single-father households, those with 3 or 4 children have the highest poverty rate, with 6 households (100.0%) experiencing poverty. Likewise, among single-mother households, those with 1 or 2 children have the highest poverty rate, with 59 households (49.2%) falling below the poverty line.
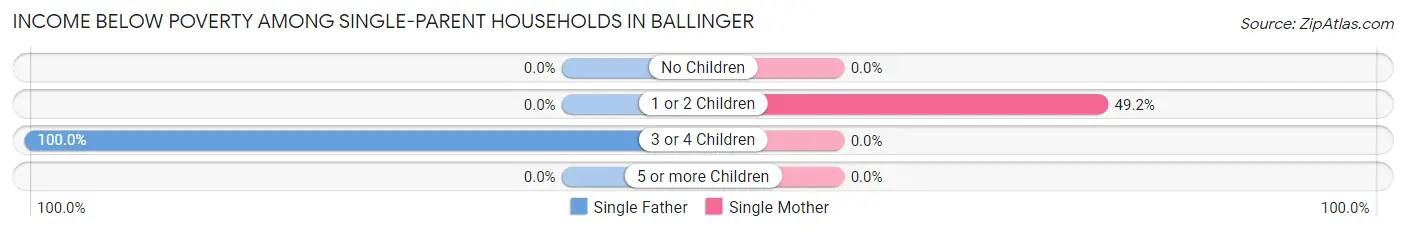
| Children | Single Father | Single Mother |
| No Children | 0 (0.0%) | 0 (0.0%) |
| 1 or 2 Children | 0 (0.0%) | 59 (49.2%) |
| 3 or 4 Children | 6 (100.0%) | 0 (0.0%) |
| 5 or more Children | 0 (0.0%) | 0 (0.0%) |
| Total | 6 (6.9%) | 59 (31.9%) |
Income Below Poverty Among Married-Couple vs Single-Parent Households in Ballinger
The poverty data for Ballinger shows that 36 of the married-couple family households (6.3%) and 65 of the single-parent households (23.9%) are living below the poverty level. Within the married-couple family households, those with 1 or 2 children have the highest poverty rate, with 10 households (8.6%) falling below the poverty line. Among the single-parent households, those with 3 or 4 children have the highest poverty rate, with 6 household (33.3%) living below poverty.
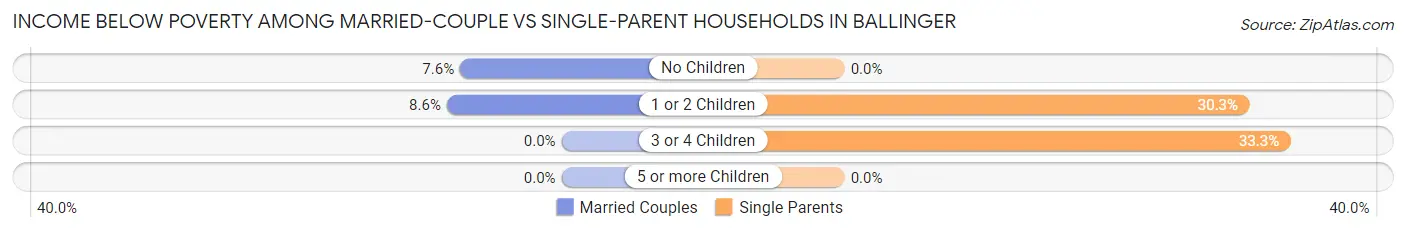
| Children | Married-Couple Families | Single-Parent Households |
| No Children | 26 (7.6%) | 0 (0.0%) |
| 1 or 2 Children | 10 (8.6%) | 59 (30.3%) |
| 3 or 4 Children | 0 (0.0%) | 6 (33.3%) |
| 5 or more Children | 0 (0.0%) | 0 (0.0%) |
| Total | 36 (6.3%) | 65 (23.9%) |
Race in Ballinger
The most populous races in Ballinger are White / Caucasian (2,847 | 79.4%), Hispanic or Latino (1,085 | 30.2%), and Two or more Races (389 | 10.8%).
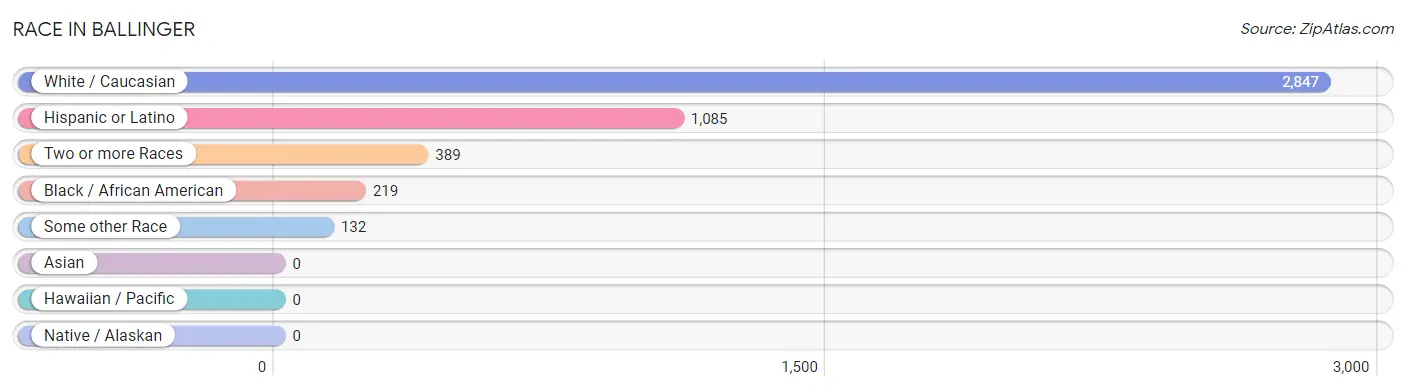
| Race | # Population | % Population |
| Asian | 0 | 0.0% |
| Black / African American | 219 | 6.1% |
| Hawaiian / Pacific | 0 | 0.0% |
| Hispanic or Latino | 1,085 | 30.2% |
| Native / Alaskan | 0 | 0.0% |
| White / Caucasian | 2,847 | 79.4% |
| Two or more Races | 389 | 10.8% |
| Some other Race | 132 | 3.7% |
| Total | 3,587 | 100.0% |
Ancestry in Ballinger
The most populous ancestries reported in Ballinger are Mexican (1,002 | 27.9%), German (702 | 19.6%), Irish (370 | 10.3%), English (239 | 6.7%), and French (142 | 4.0%), together accounting for 68.4% of all Ballinger residents.
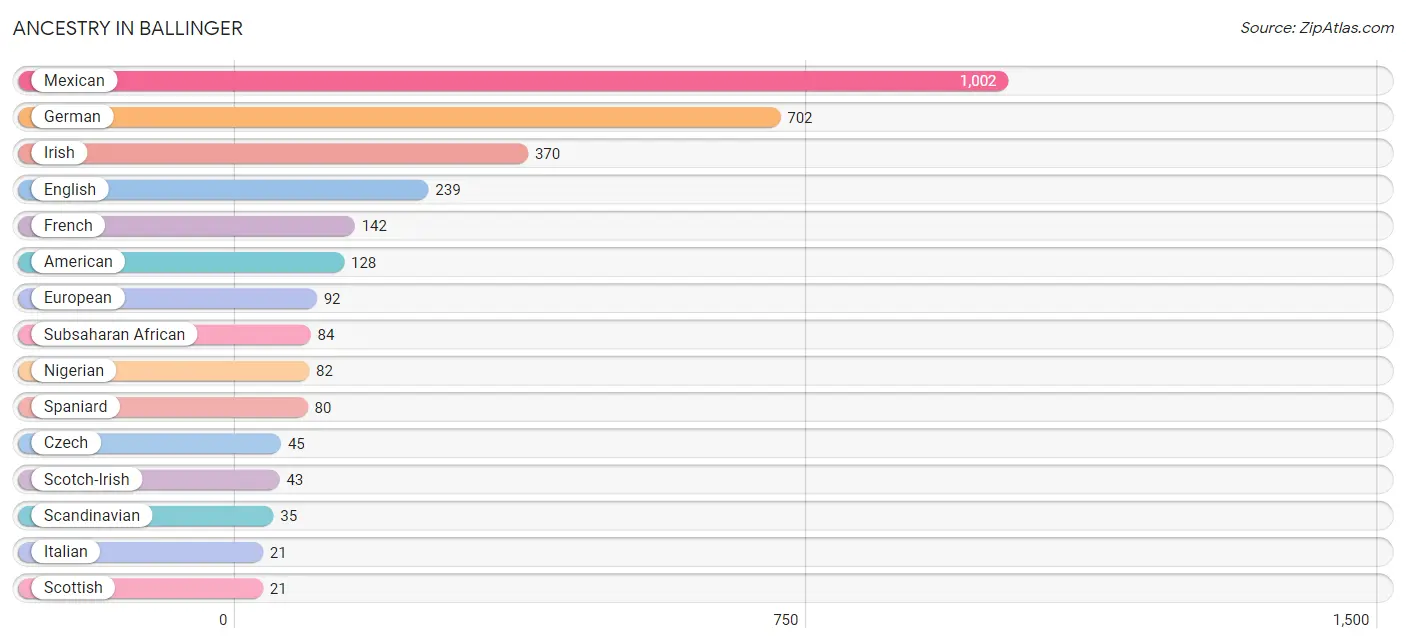
| Ancestry | # Population | % Population |
| African | 2 | 0.1% |
| American | 128 | 3.6% |
| Blackfeet | 3 | 0.1% |
| Cheyenne | 8 | 0.2% |
| Chickasaw | 6 | 0.2% |
| Czech | 45 | 1.3% |
| Dutch | 5 | 0.1% |
| English | 239 | 6.7% |
| European | 92 | 2.6% |
| French | 142 | 4.0% |
| German | 702 | 19.6% |
| Irish | 370 | 10.3% |
| Italian | 21 | 0.6% |
| Mexican | 1,002 | 27.9% |
| Nigerian | 82 | 2.3% |
| Polish | 12 | 0.3% |
| Scandinavian | 35 | 1.0% |
| Scotch-Irish | 43 | 1.2% |
| Scottish | 21 | 0.6% |
| Spaniard | 80 | 2.2% |
| Subsaharan African | 84 | 2.3% |
| Swedish | 12 | 0.3% |
| Welsh | 9 | 0.3% | View All 23 Rows |
Immigrants in Ballinger
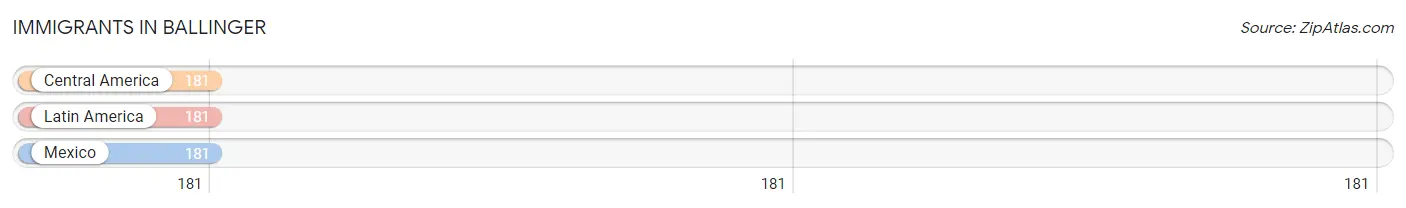
The most numerous immigrant groups reported in Ballinger came from Central America (181 | 5.1%), Latin America (181 | 5.1%), and Mexico (181 | 5.1%), together accounting for 15.2% of all Ballinger residents.
| Immigration Origin | # Population | % Population |
| Central America | 181 | 5.1% |
| Latin America | 181 | 5.1% |
| Mexico | 181 | 5.1% | View All 3 Rows |
Sex and Age in Ballinger
Sex and Age in Ballinger
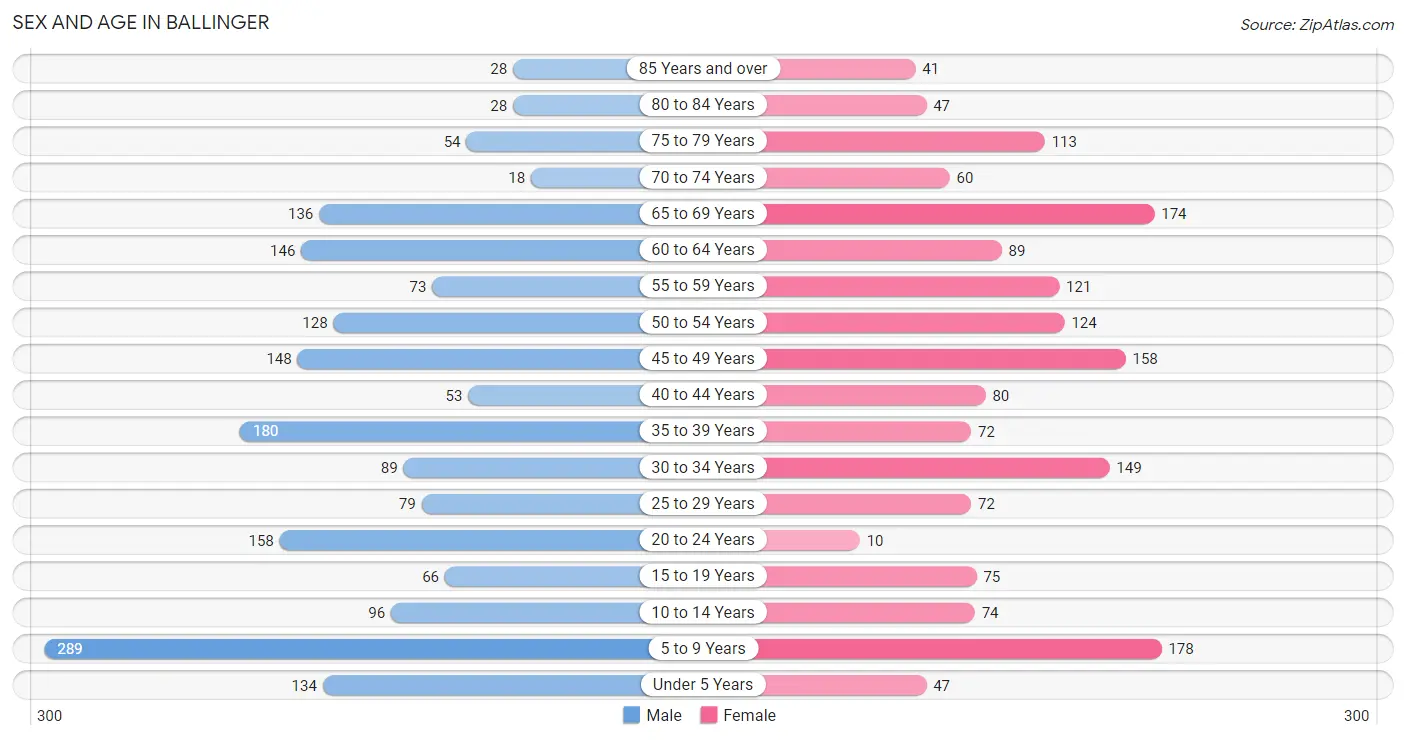
The most populous age groups in Ballinger are 5 to 9 Years (289 | 15.2%) for men and 5 to 9 Years (178 | 10.6%) for women.
| Age Bracket | Male | Female |
| Under 5 Years | 134 (7.0%) | 47 (2.8%) |
| 5 to 9 Years | 289 (15.2%) | 178 (10.6%) |
| 10 to 14 Years | 96 (5.0%) | 74 (4.4%) |
| 15 to 19 Years | 66 (3.5%) | 75 (4.4%) |
| 20 to 24 Years | 158 (8.3%) | 10 (0.6%) |
| 25 to 29 Years | 79 (4.2%) | 72 (4.3%) |
| 30 to 34 Years | 89 (4.7%) | 149 (8.8%) |
| 35 to 39 Years | 180 (9.5%) | 72 (4.3%) |
| 40 to 44 Years | 53 (2.8%) | 80 (4.8%) |
| 45 to 49 Years | 148 (7.8%) | 158 (9.4%) |
| 50 to 54 Years | 128 (6.7%) | 124 (7.4%) |
| 55 to 59 Years | 73 (3.8%) | 121 (7.2%) |
| 60 to 64 Years | 146 (7.7%) | 89 (5.3%) |
| 65 to 69 Years | 136 (7.1%) | 174 (10.3%) |
| 70 to 74 Years | 18 (0.9%) | 60 (3.6%) |
| 75 to 79 Years | 54 (2.8%) | 113 (6.7%) |
| 80 to 84 Years | 28 (1.5%) | 47 (2.8%) |
| 85 Years and over | 28 (1.5%) | 41 (2.4%) |
| Total | 1,903 (100.0%) | 1,684 (100.0%) |
Families and Households in Ballinger
Median Family Size in Ballinger
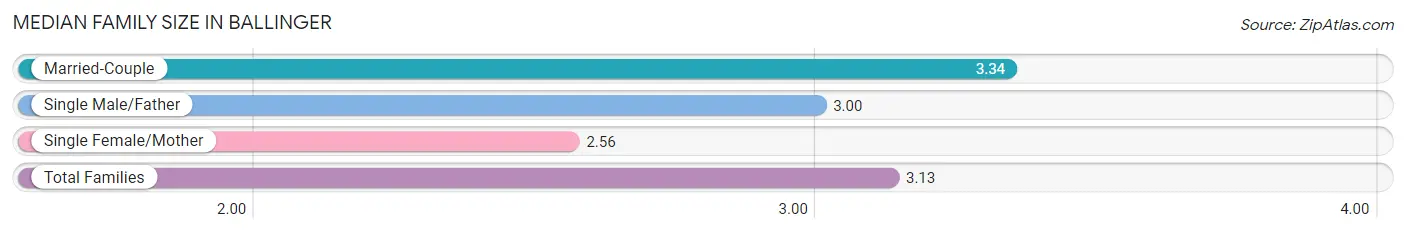
The median family size in Ballinger is 3.13 persons per family, with married-couple families (569 | 67.7%) accounting for the largest median family size of 3.34 persons per family. On the other hand, single female/mother families (185 | 22.0%) represent the smallest median family size with 2.56 persons per family.
| Family Type | # Families | Family Size |
| Married-Couple | 569 (67.7%) | 3.34 |
| Single Male/Father | 87 (10.3%) | 3.00 |
| Single Female/Mother | 185 (22.0%) | 2.56 |
| Total Families | 841 (100.0%) | 3.13 |
Median Household Size in Ballinger
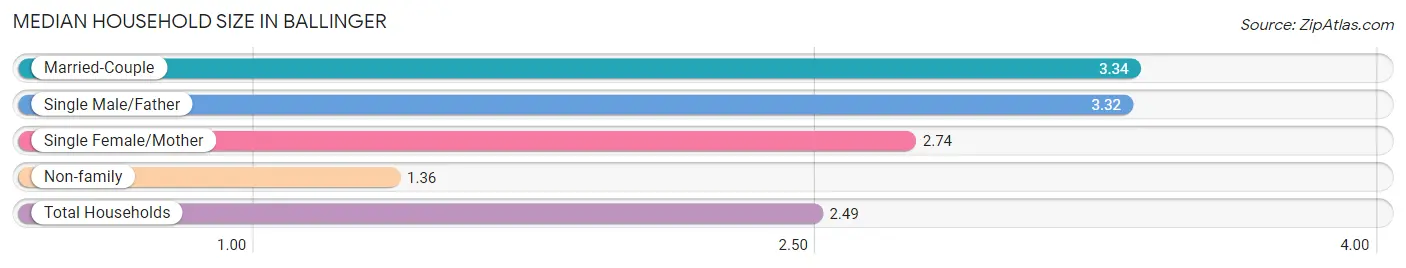
The median household size in Ballinger is 2.49 persons per household, with married-couple households (569 | 41.4%) accounting for the largest median household size of 3.34 persons per household. non-family households (532 | 38.8%) represent the smallest median household size with 1.36 persons per household.
| Household Type | # Households | Household Size |
| Married-Couple | 569 (41.4%) | 3.34 |
| Single Male/Father | 87 (6.3%) | 3.32 |
| Single Female/Mother | 185 (13.5%) | 2.74 |
| Non-family | 532 (38.8%) | 1.36 |
| Total Households | 1,373 (100.0%) | 2.49 |
Household Size by Marriage Status in Ballinger
Out of a total of 1,373 households in Ballinger, 841 (61.3%) are family households, while 532 (38.8%) are nonfamily households. The most numerous type of family households are 2-person households, comprising 442, and the most common type of nonfamily households are 1-person households, comprising 394.
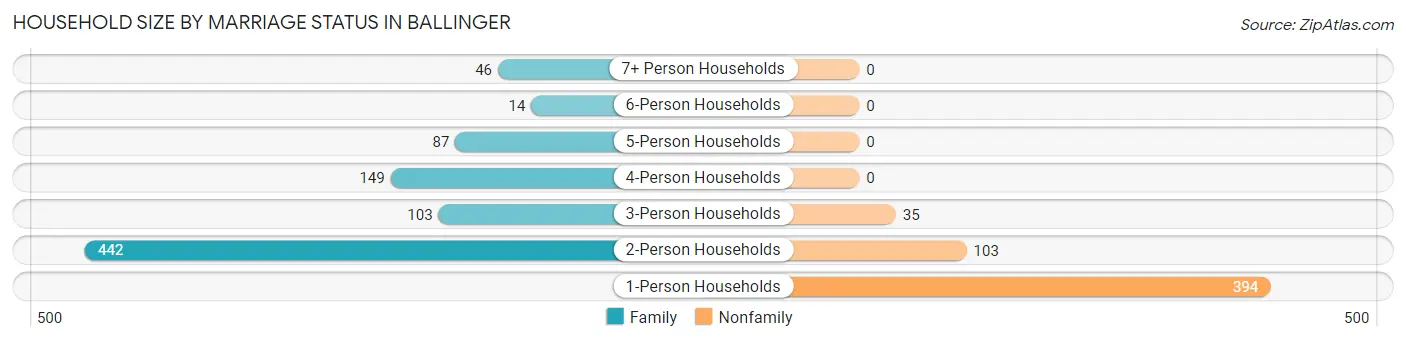
| Household Size | Family Households | Nonfamily Households |
| 1-Person Households | - | 394 (28.7%) |
| 2-Person Households | 442 (32.2%) | 103 (7.5%) |
| 3-Person Households | 103 (7.5%) | 35 (2.5%) |
| 4-Person Households | 149 (10.8%) | 0 (0.0%) |
| 5-Person Households | 87 (6.3%) | 0 (0.0%) |
| 6-Person Households | 14 (1.0%) | 0 (0.0%) |
| 7+ Person Households | 46 (3.4%) | 0 (0.0%) |
| Total | 841 (61.3%) | 532 (38.8%) |
Female Fertility in Ballinger
Fertility by Age in Ballinger
Average fertility rate in Ballinger is 33.0 births per 1,000 women. Women in the age bracket of 20 to 34 years have the highest fertility rate with 91.0 births per 1,000 women. Women in the age bracket of 20 to 34 years acount for 100.0% of all women with births.
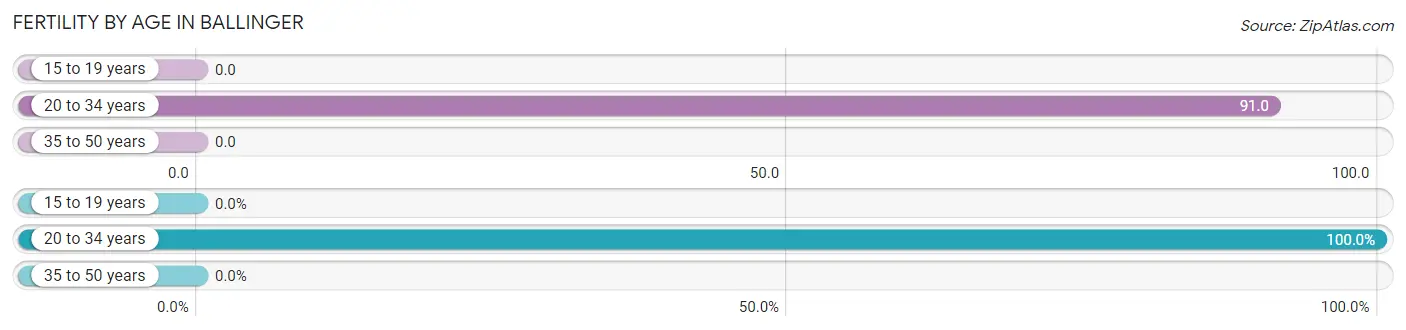
| Age Bracket | Women with Births | Births / 1,000 Women |
| 15 to 19 years | 0 (0.0%) | 0.0 |
| 20 to 34 years | 21 (100.0%) | 91.0 |
| 35 to 50 years | 0 (0.0%) | 0.0 |
| Total | 21 (100.0%) | 33.0 |
Fertility by Age by Marriage Status in Ballinger
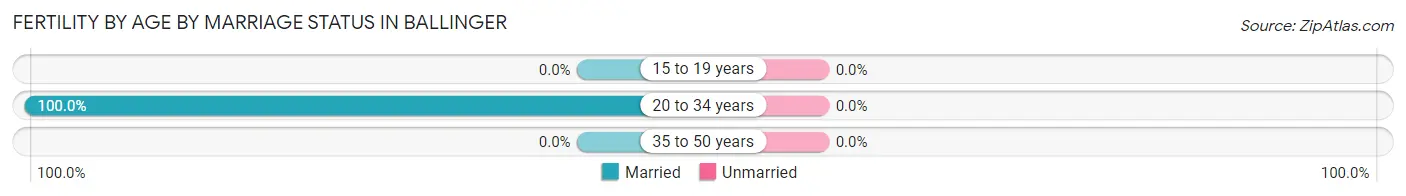
| Age Bracket | Married | Unmarried |
| 15 to 19 years | 0 (0.0%) | 0 (0.0%) |
| 20 to 34 years | 21 (100.0%) | 0 (0.0%) |
| 35 to 50 years | 0 (0.0%) | 0 (0.0%) |
| Total | 21 (100.0%) | 0 (0.0%) |
Fertility by Education in Ballinger
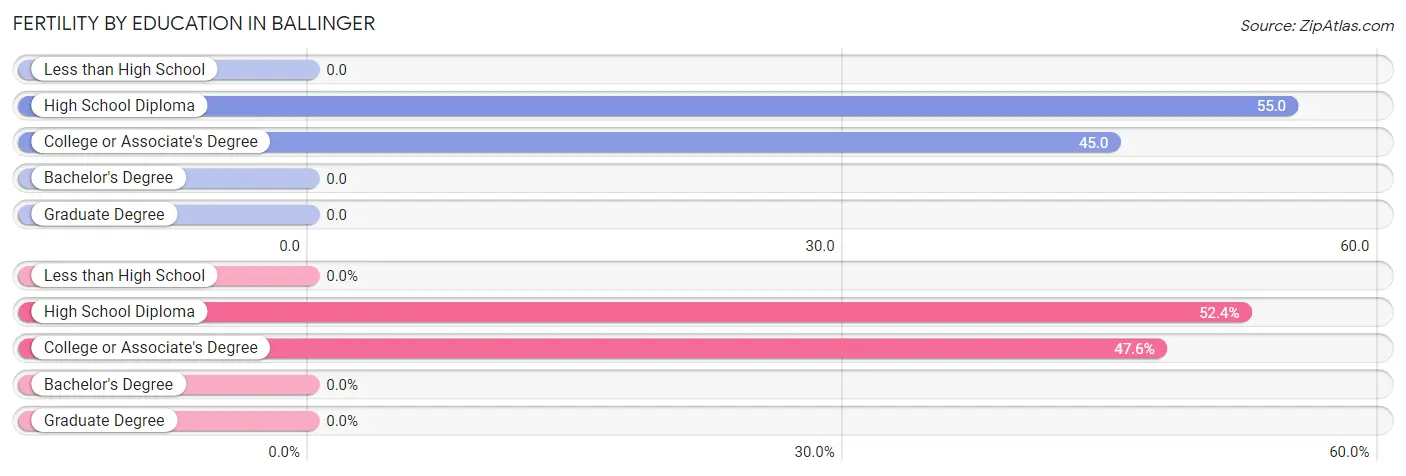
| Educational Attainment | Women with Births | Births / 1,000 Women |
| Less than High School | 0 (0.0%) | 0.0 |
| High School Diploma | 11 (52.4%) | 55.0 |
| College or Associate's Degree | 10 (47.6%) | 45.0 |
| Bachelor's Degree | 0 (0.0%) | 0.0 |
| Graduate Degree | 0 (0.0%) | 0.0 |
| Total | 21 (100.0%) | 33.0 |
Fertility by Education by Marriage Status in Ballinger
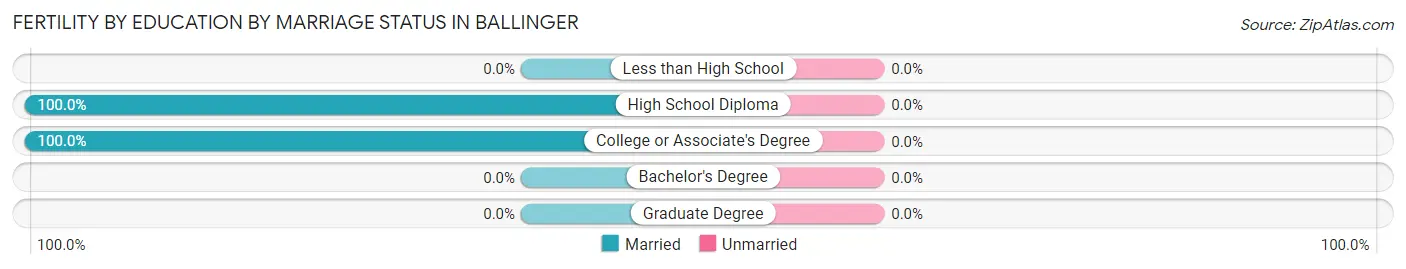
| Educational Attainment | Married | Unmarried |
| Less than High School | 0 (0.0%) | 0 (0.0%) |
| High School Diploma | 11 (100.0%) | 0 (0.0%) |
| College or Associate's Degree | 10 (100.0%) | 0 (0.0%) |
| Bachelor's Degree | 0 (0.0%) | 0 (0.0%) |
| Graduate Degree | 0 (0.0%) | 0 (0.0%) |
| Total | 21 (100.0%) | 0 (0.0%) |
Employment Characteristics in Ballinger
Employment by Class of Employer in Ballinger
Among the 1,473 employed individuals in Ballinger, private company employees (1,035 | 70.3%), local government employees (234 | 15.9%), and state government employees (137 | 9.3%) make up the most common classes of employment.
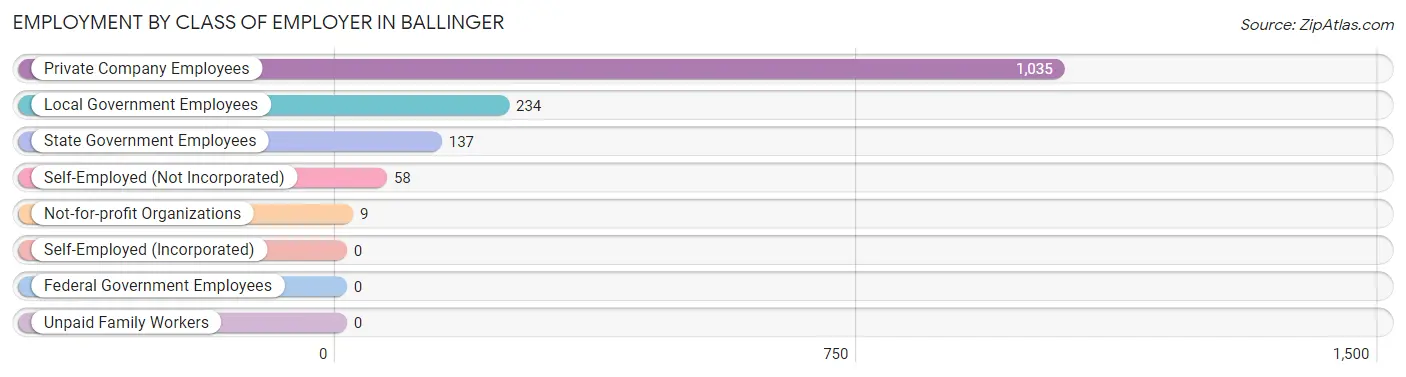
| Employer Class | # Employees | % Employees |
| Private Company Employees | 1,035 | 70.3% |
| Self-Employed (Incorporated) | 0 | 0.0% |
| Self-Employed (Not Incorporated) | 58 | 3.9% |
| Not-for-profit Organizations | 9 | 0.6% |
| Local Government Employees | 234 | 15.9% |
| State Government Employees | 137 | 9.3% |
| Federal Government Employees | 0 | 0.0% |
| Unpaid Family Workers | 0 | 0.0% |
| Total | 1,473 | 100.0% |
Employment Status by Age in Ballinger
According to the labor force statistics for Ballinger, out of the total population over 16 years of age (2,734), 57.4% or 1,569 individuals are in the labor force, with 6.1% or 96 of them unemployed. The age group with the highest labor force participation rate is 20 to 24 years, with 96.4% or 162 individuals in the labor force. Within the labor force, the 20 to 24 years age range has the highest percentage of unemployed individuals, with 17.9% or 29 of them being unemployed.
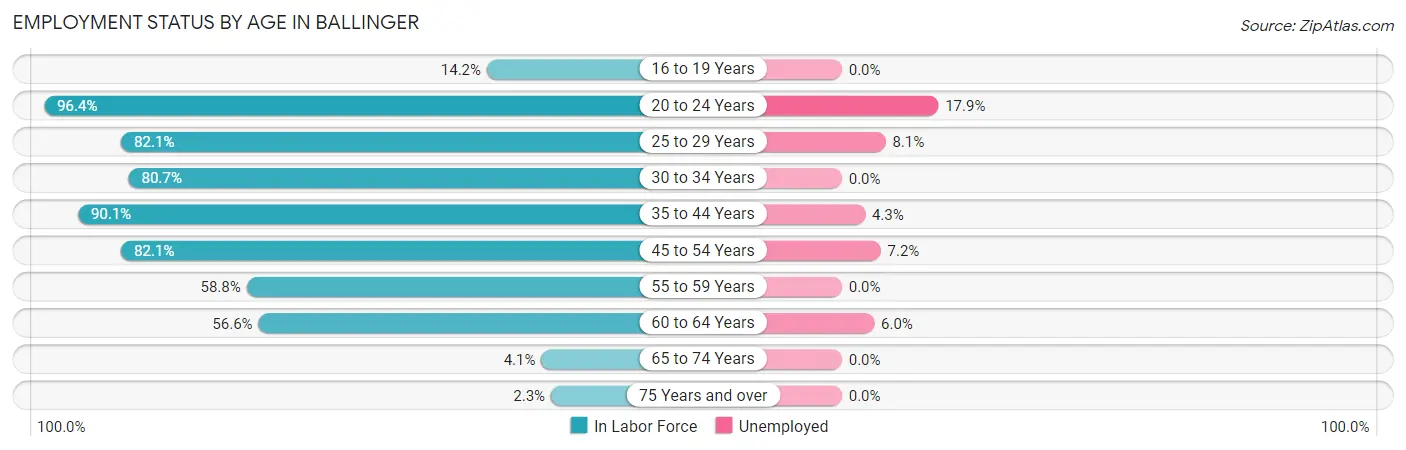
| Age Bracket | In Labor Force | Unemployed |
| 16 to 19 Years | 15 (14.2%) | 0 (0.0%) |
| 20 to 24 Years | 162 (96.4%) | 29 (17.9%) |
| 25 to 29 Years | 124 (82.1%) | 10 (8.1%) |
| 30 to 34 Years | 192 (80.7%) | 0 (0.0%) |
| 35 to 44 Years | 347 (90.1%) | 15 (4.3%) |
| 45 to 54 Years | 458 (82.1%) | 33 (7.2%) |
| 55 to 59 Years | 114 (58.8%) | 0 (0.0%) |
| 60 to 64 Years | 133 (56.6%) | 8 (6.0%) |
| 65 to 74 Years | 16 (4.1%) | 0 (0.0%) |
| 75 Years and over | 7 (2.3%) | 0 (0.0%) |
| Total | 1,569 (57.4%) | 96 (6.1%) |
Employment Status by Educational Attainment in Ballinger
According to labor force statistics for Ballinger, 77.7% of individuals (1,368) out of the total population between 25 and 64 years of age (1,761) are in the labor force, with 4.8% or 66 of them being unemployed. The group with the highest labor force participation rate are those with the educational attainment of bachelor's degree or higher, with 91.5% or 325 individuals in the labor force. Within the labor force, individuals with high school diploma education have the highest percentage of unemployment, with 13.9% or 56 of them being unemployed.
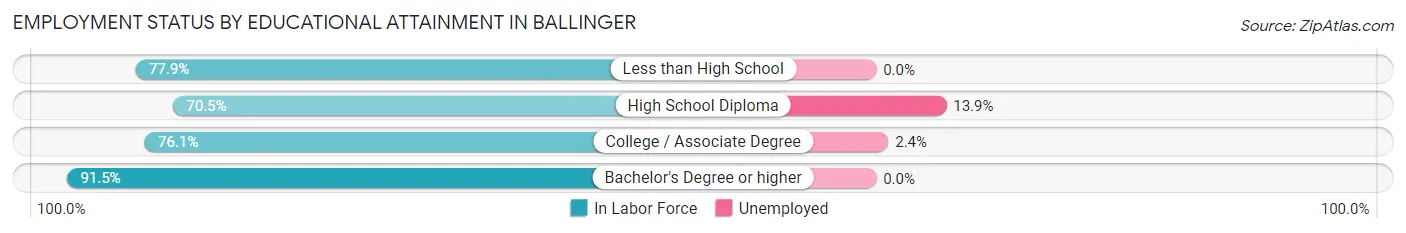
| Educational Attainment | In Labor Force | Unemployed |
| Less than High School | 222 (77.9%) | 0 (0.0%) |
| High School Diploma | 404 (70.5%) | 80 (13.9%) |
| College / Associate Degree | 417 (76.1%) | 13 (2.4%) |
| Bachelor's Degree or higher | 325 (91.5%) | 0 (0.0%) |
| Total | 1,368 (77.7%) | 85 (4.8%) |
Employment Occupations by Sex in Ballinger
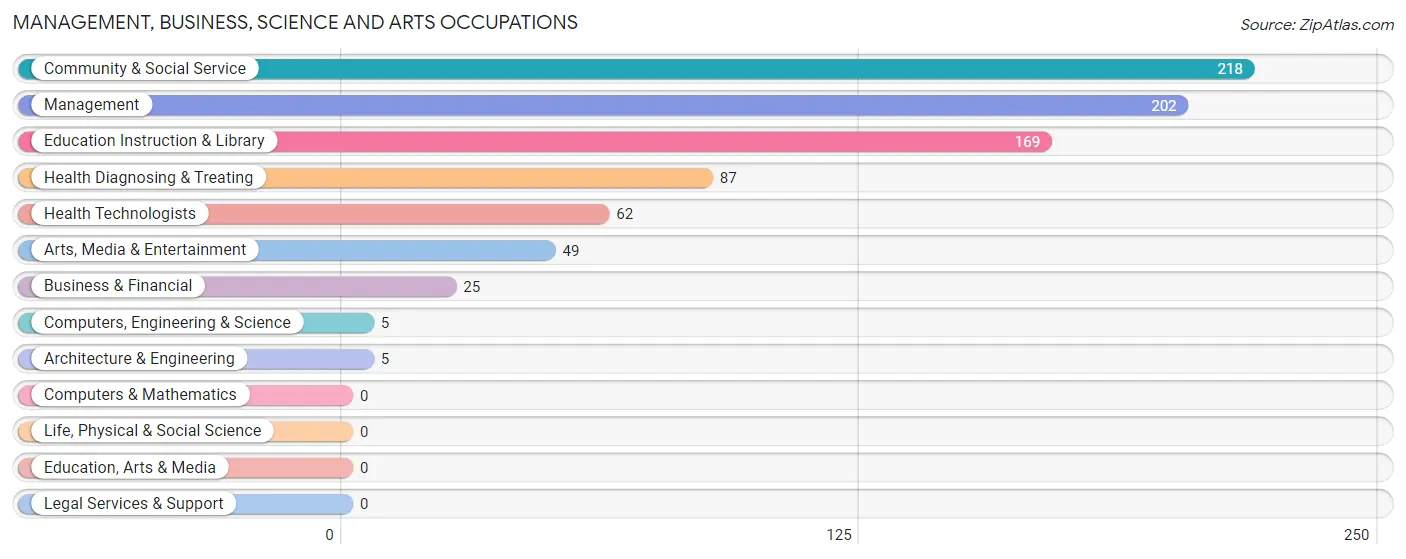
Management, Business, Science and Arts Occupations
The most common Management, Business, Science and Arts occupations in Ballinger are Community & Social Service (218 | 14.8%), Management (202 | 13.7%), Education Instruction & Library (169 | 11.5%), Health Diagnosing & Treating (87 | 5.9%), and Health Technologists (62 | 4.2%).
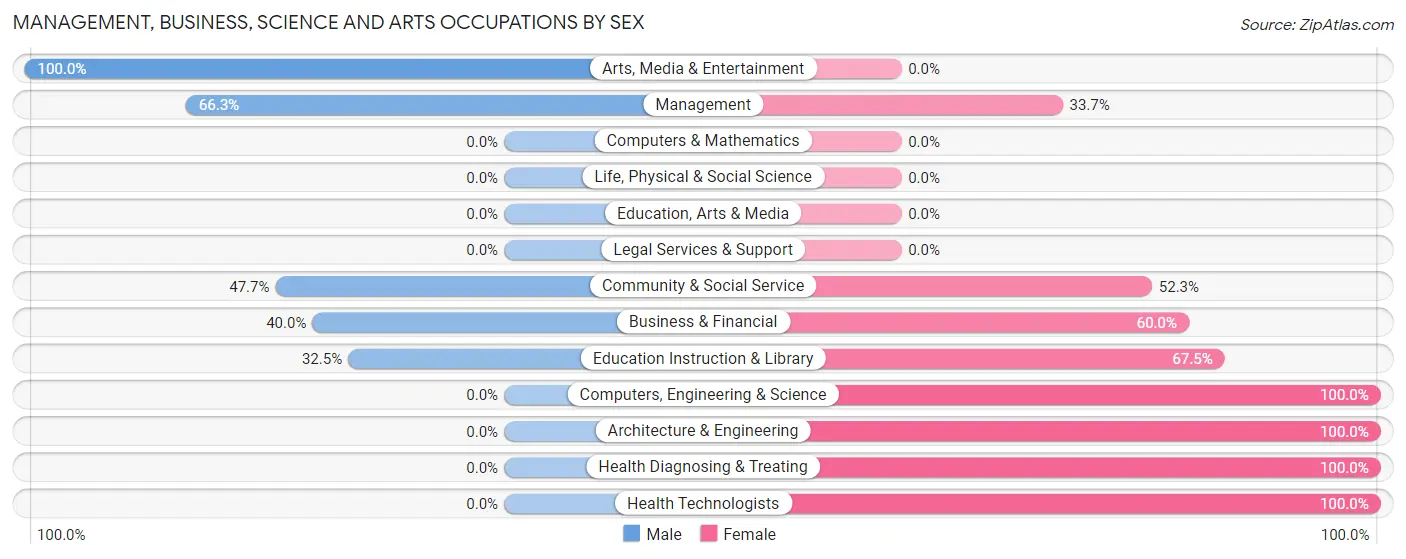
Management, Business, Science and Arts Occupations by Sex
Within the Management, Business, Science and Arts occupations in Ballinger, the most male-oriented occupations are Arts, Media & Entertainment (100.0%), Management (66.3%), and Community & Social Service (47.7%), while the most female-oriented occupations are Computers, Engineering & Science (100.0%), Architecture & Engineering (100.0%), and Health Diagnosing & Treating (100.0%).
| Occupation | Male | Female |
| Management | 134 (66.3%) | 68 (33.7%) |
| Business & Financial | 10 (40.0%) | 15 (60.0%) |
| Computers, Engineering & Science | 0 (0.0%) | 5 (100.0%) |
| Computers & Mathematics | 0 (0.0%) | 0 (0.0%) |
| Architecture & Engineering | 0 (0.0%) | 5 (100.0%) |
| Life, Physical & Social Science | 0 (0.0%) | 0 (0.0%) |
| Community & Social Service | 104 (47.7%) | 114 (52.3%) |
| Education, Arts & Media | 0 (0.0%) | 0 (0.0%) |
| Legal Services & Support | 0 (0.0%) | 0 (0.0%) |
| Education Instruction & Library | 55 (32.5%) | 114 (67.5%) |
| Arts, Media & Entertainment | 49 (100.0%) | 0 (0.0%) |
| Health Diagnosing & Treating | 0 (0.0%) | 87 (100.0%) |
| Health Technologists | 0 (0.0%) | 62 (100.0%) |
| Total (Category) | 248 (46.2%) | 289 (53.8%) |
| Total (Overall) | 914 (62.1%) | 559 (38.0%) |
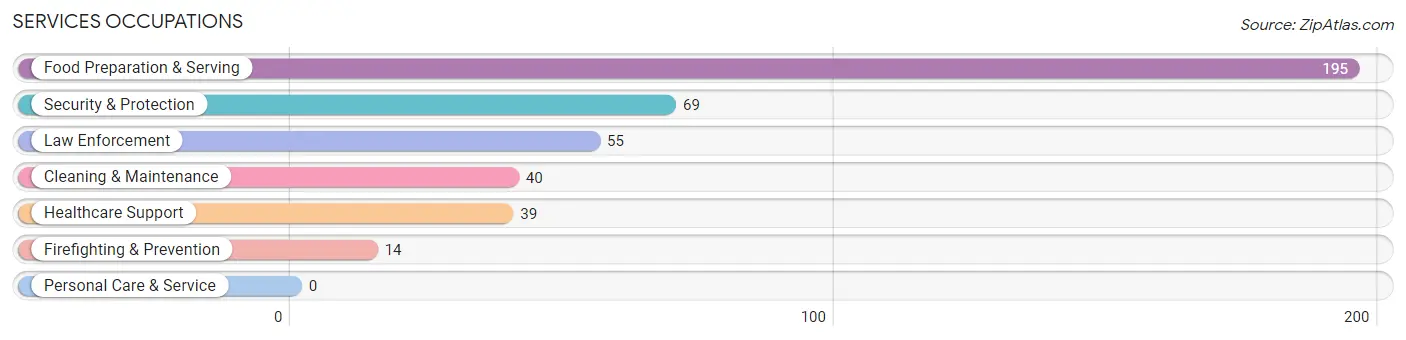
Services Occupations
The most common Services occupations in Ballinger are Food Preparation & Serving (195 | 13.2%), Security & Protection (69 | 4.7%), Law Enforcement (55 | 3.7%), Cleaning & Maintenance (40 | 2.7%), and Healthcare Support (39 | 2.6%).
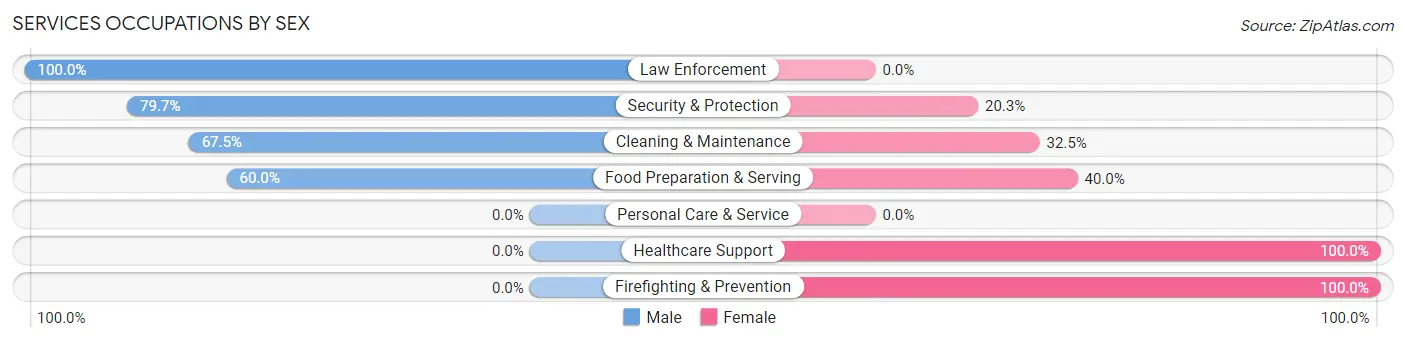
Services Occupations by Sex
Within the Services occupations in Ballinger, the most male-oriented occupations are Law Enforcement (100.0%), Security & Protection (79.7%), and Cleaning & Maintenance (67.5%), while the most female-oriented occupations are Healthcare Support (100.0%), Firefighting & Prevention (100.0%), and Food Preparation & Serving (40.0%).
| Occupation | Male | Female |
| Healthcare Support | 0 (0.0%) | 39 (100.0%) |
| Security & Protection | 55 (79.7%) | 14 (20.3%) |
| Firefighting & Prevention | 0 (0.0%) | 14 (100.0%) |
| Law Enforcement | 55 (100.0%) | 0 (0.0%) |
| Food Preparation & Serving | 117 (60.0%) | 78 (40.0%) |
| Cleaning & Maintenance | 27 (67.5%) | 13 (32.5%) |
| Personal Care & Service | 0 (0.0%) | 0 (0.0%) |
| Total (Category) | 199 (58.0%) | 144 (42.0%) |
| Total (Overall) | 914 (62.1%) | 559 (38.0%) |
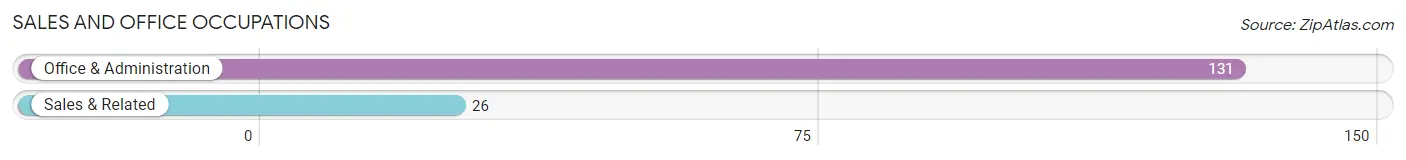
Sales and Office Occupations
The most common Sales and Office occupations in Ballinger are Office & Administration (131 | 8.9%), and Sales & Related (26 | 1.8%).
Sales and Office Occupations by Sex
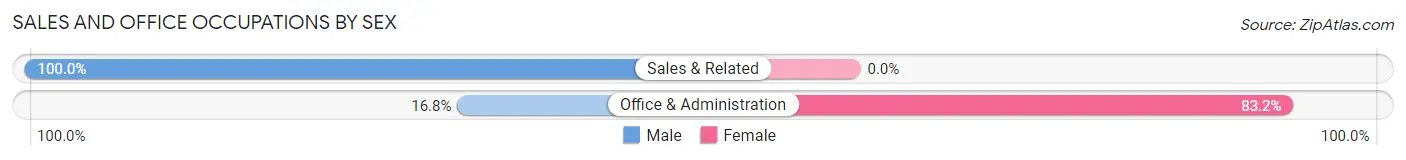
| Occupation | Male | Female |
| Sales & Related | 26 (100.0%) | 0 (0.0%) |
| Office & Administration | 22 (16.8%) | 109 (83.2%) |
| Total (Category) | 48 (30.6%) | 109 (69.4%) |
| Total (Overall) | 914 (62.1%) | 559 (38.0%) |
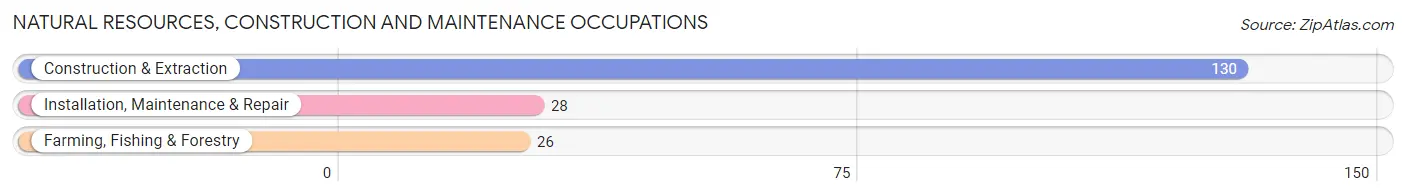
Natural Resources, Construction and Maintenance Occupations
The most common Natural Resources, Construction and Maintenance occupations in Ballinger are Construction & Extraction (130 | 8.8%), Installation, Maintenance & Repair (28 | 1.9%), and Farming, Fishing & Forestry (26 | 1.8%).
Natural Resources, Construction and Maintenance Occupations by Sex
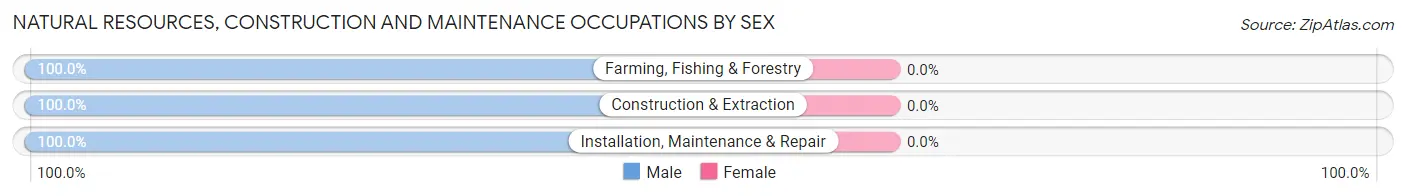
| Occupation | Male | Female |
| Farming, Fishing & Forestry | 26 (100.0%) | 0 (0.0%) |
| Construction & Extraction | 130 (100.0%) | 0 (0.0%) |
| Installation, Maintenance & Repair | 28 (100.0%) | 0 (0.0%) |
| Total (Category) | 184 (100.0%) | 0 (0.0%) |
| Total (Overall) | 914 (62.1%) | 559 (38.0%) |
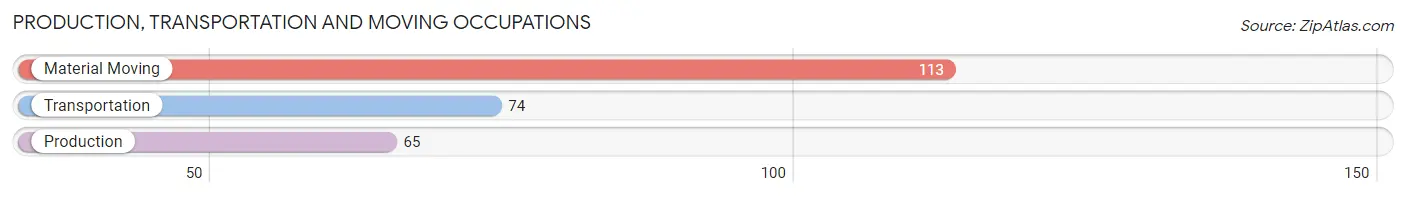
Production, Transportation and Moving Occupations
The most common Production, Transportation and Moving occupations in Ballinger are Material Moving (113 | 7.7%), Transportation (74 | 5.0%), and Production (65 | 4.4%).
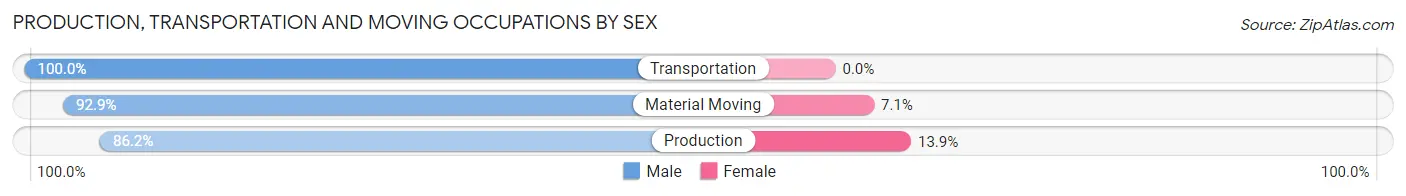
Production, Transportation and Moving Occupations by Sex
| Occupation | Male | Female |
| Production | 56 (86.2%) | 9 (13.9%) |
| Transportation | 74 (100.0%) | 0 (0.0%) |
| Material Moving | 105 (92.9%) | 8 (7.1%) |
| Total (Category) | 235 (93.2%) | 17 (6.8%) |
| Total (Overall) | 914 (62.1%) | 559 (38.0%) |
Employment Industries by Sex in Ballinger
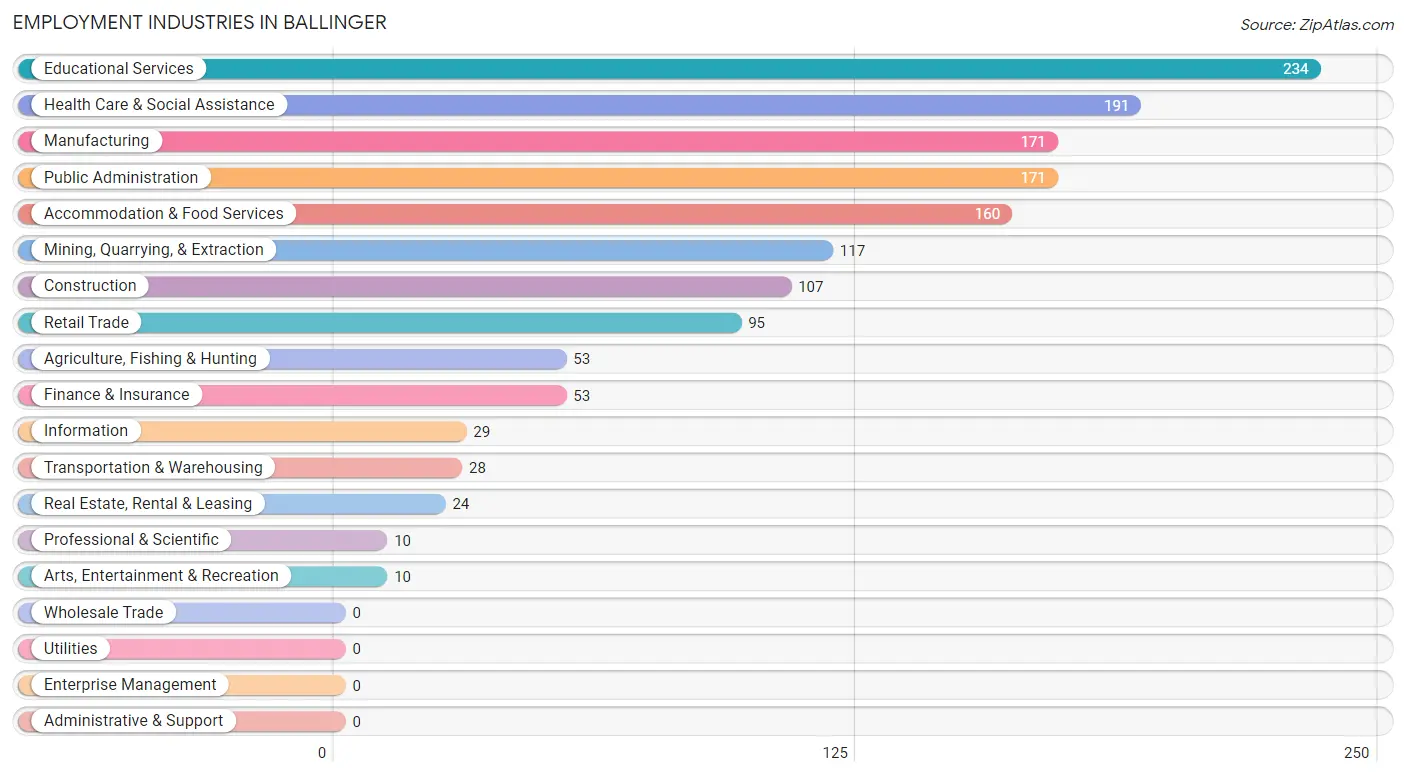
Employment Industries in Ballinger
The major employment industries in Ballinger include Educational Services (234 | 15.9%), Health Care & Social Assistance (191 | 13.0%), Manufacturing (171 | 11.6%), Public Administration (171 | 11.6%), and Accommodation & Food Services (160 | 10.9%).
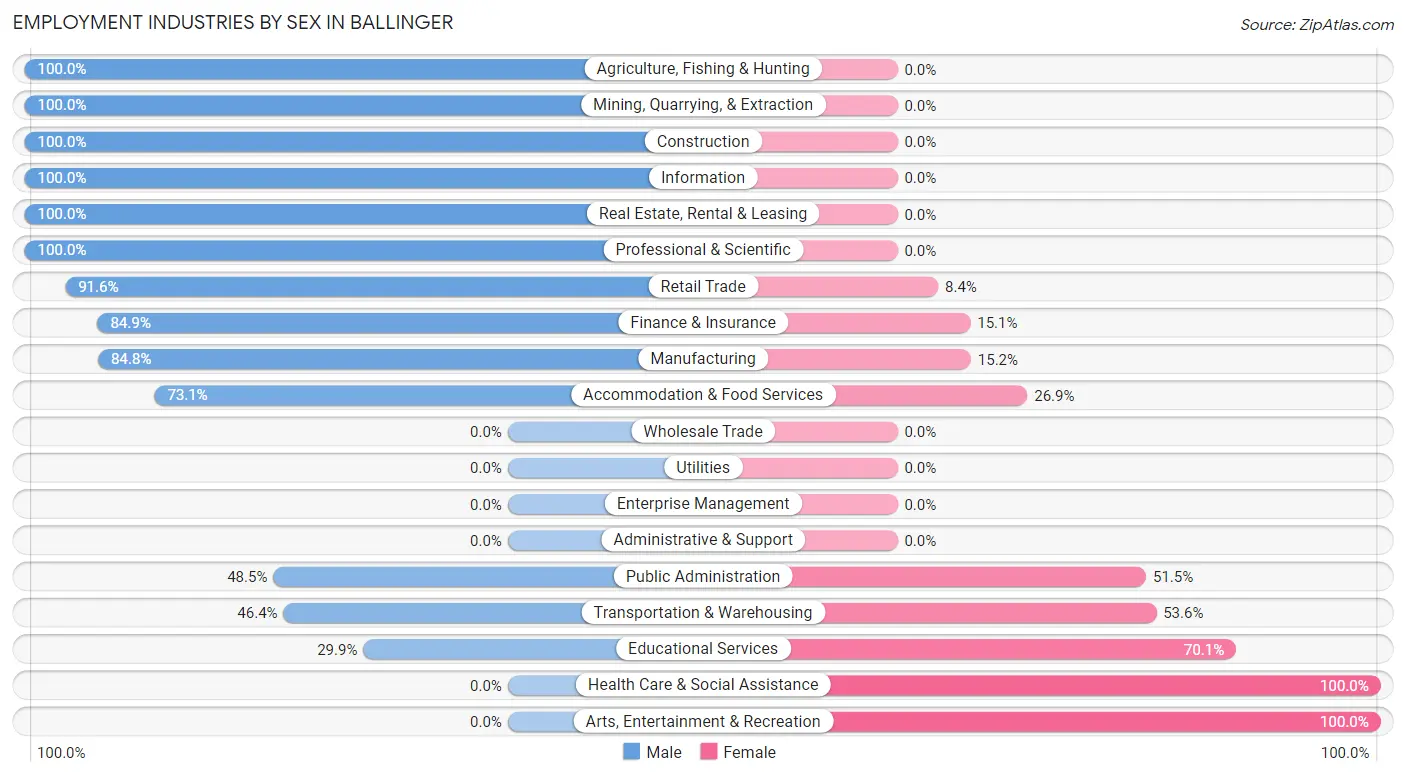
Employment Industries by Sex in Ballinger
The Ballinger industries that see more men than women are Agriculture, Fishing & Hunting (100.0%), Mining, Quarrying, & Extraction (100.0%), and Construction (100.0%), whereas the industries that tend to have a higher number of women are Health Care & Social Assistance (100.0%), Arts, Entertainment & Recreation (100.0%), and Educational Services (70.1%).
| Industry | Male | Female |
| Agriculture, Fishing & Hunting | 53 (100.0%) | 0 (0.0%) |
| Mining, Quarrying, & Extraction | 117 (100.0%) | 0 (0.0%) |
| Construction | 107 (100.0%) | 0 (0.0%) |
| Manufacturing | 145 (84.8%) | 26 (15.2%) |
| Wholesale Trade | 0 (0.0%) | 0 (0.0%) |
| Retail Trade | 87 (91.6%) | 8 (8.4%) |
| Transportation & Warehousing | 13 (46.4%) | 15 (53.6%) |
| Utilities | 0 (0.0%) | 0 (0.0%) |
| Information | 29 (100.0%) | 0 (0.0%) |
| Finance & Insurance | 45 (84.9%) | 8 (15.1%) |
| Real Estate, Rental & Leasing | 24 (100.0%) | 0 (0.0%) |
| Professional & Scientific | 10 (100.0%) | 0 (0.0%) |
| Enterprise Management | 0 (0.0%) | 0 (0.0%) |
| Administrative & Support | 0 (0.0%) | 0 (0.0%) |
| Educational Services | 70 (29.9%) | 164 (70.1%) |
| Health Care & Social Assistance | 0 (0.0%) | 191 (100.0%) |
| Arts, Entertainment & Recreation | 0 (0.0%) | 10 (100.0%) |
| Accommodation & Food Services | 117 (73.1%) | 43 (26.9%) |
| Public Administration | 83 (48.5%) | 88 (51.5%) |
| Total | 914 (62.1%) | 559 (38.0%) |
Education in Ballinger
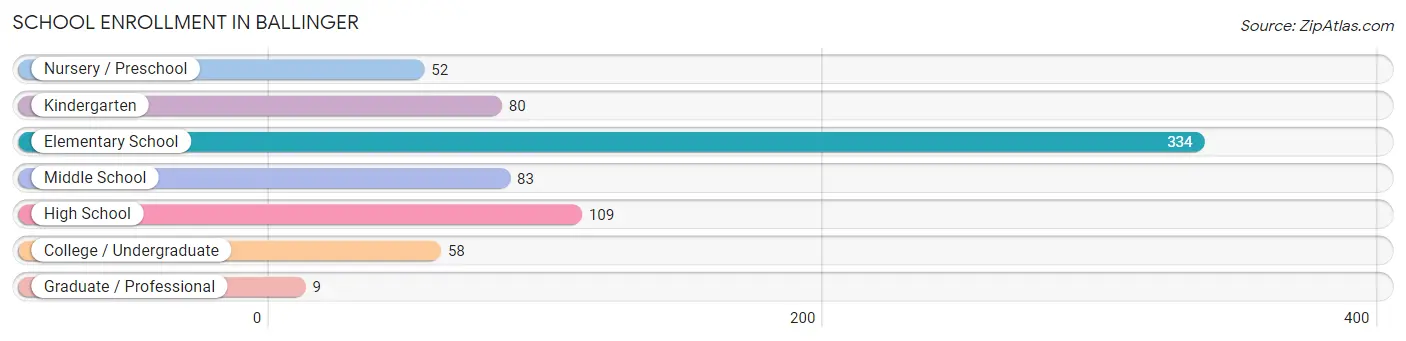
School Enrollment in Ballinger
The most common levels of schooling among the 725 students in Ballinger are elementary school (334 | 46.1%), high school (109 | 15.0%), and middle school (83 | 11.5%).
| School Level | # Students | % Students |
| Nursery / Preschool | 52 | 7.2% |
| Kindergarten | 80 | 11.0% |
| Elementary School | 334 | 46.1% |
| Middle School | 83 | 11.5% |
| High School | 109 | 15.0% |
| College / Undergraduate | 58 | 8.0% |
| Graduate / Professional | 9 | 1.2% |
| Total | 725 | 100.0% |
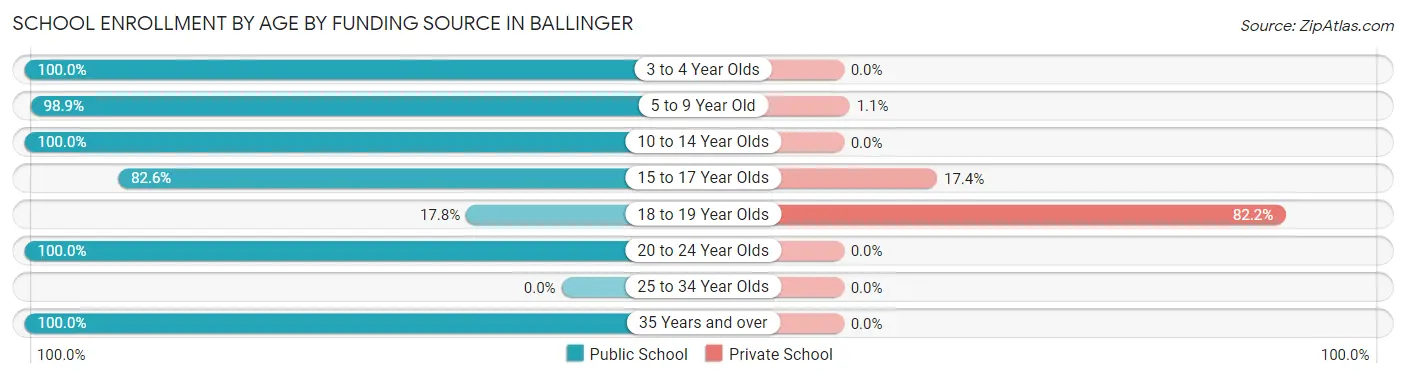
School Enrollment by Age by Funding Source in Ballinger
Out of a total of 725 students who are enrolled in schools in Ballinger, 58 (8.0%) attend a private institution, while the remaining 667 (92.0%) are enrolled in public schools. The age group of 18 to 19 year olds has the highest likelihood of being enrolled in private schools, with 37 (82.2% in the age bracket) enrolled. Conversely, the age group of 3 to 4 year olds has the lowest likelihood of being enrolled in a private school, with 6 (100.0% in the age bracket) attending a public institution.
| Age Bracket | Public School | Private School |
| 3 to 4 Year Olds | 6 (100.0%) | 0 (0.0%) |
| 5 to 9 Year Old | 439 (98.9%) | 5 (1.1%) |
| 10 to 14 Year Olds | 108 (100.0%) | 0 (0.0%) |
| 15 to 17 Year Olds | 76 (82.6%) | 16 (17.4%) |
| 18 to 19 Year Olds | 8 (17.8%) | 37 (82.2%) |
| 20 to 24 Year Olds | 11 (100.0%) | 0 (0.0%) |
| 25 to 34 Year Olds | 0 (0.0%) | 0 (0.0%) |
| 35 Years and over | 19 (100.0%) | 0 (0.0%) |
| Total | 667 (92.0%) | 58 (8.0%) |
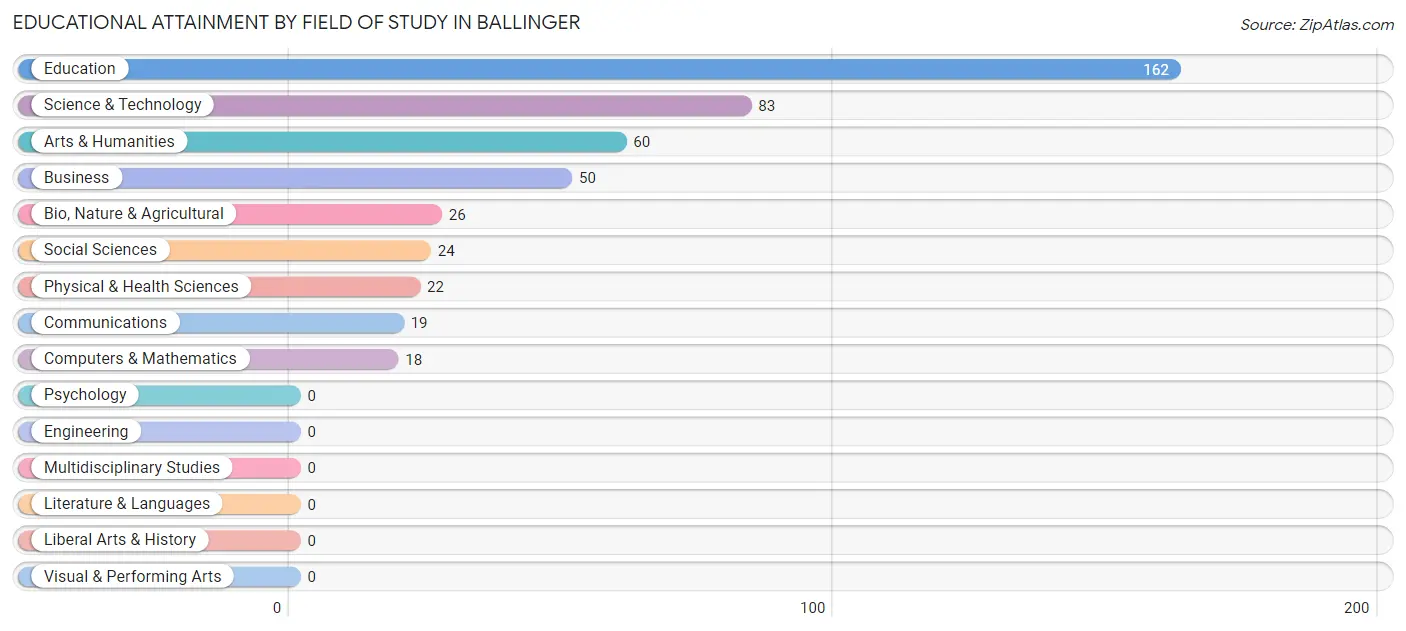
Educational Attainment by Field of Study in Ballinger
Education (162 | 34.9%), science & technology (83 | 17.9%), arts & humanities (60 | 12.9%), business (50 | 10.8%), and bio, nature & agricultural (26 | 5.6%) are the most common fields of study among 464 individuals in Ballinger who have obtained a bachelor's degree or higher.
| Field of Study | # Graduates | % Graduates |
| Computers & Mathematics | 18 | 3.9% |
| Bio, Nature & Agricultural | 26 | 5.6% |
| Physical & Health Sciences | 22 | 4.7% |
| Psychology | 0 | 0.0% |
| Social Sciences | 24 | 5.2% |
| Engineering | 0 | 0.0% |
| Multidisciplinary Studies | 0 | 0.0% |
| Science & Technology | 83 | 17.9% |
| Business | 50 | 10.8% |
| Education | 162 | 34.9% |
| Literature & Languages | 0 | 0.0% |
| Liberal Arts & History | 0 | 0.0% |
| Visual & Performing Arts | 0 | 0.0% |
| Communications | 19 | 4.1% |
| Arts & Humanities | 60 | 12.9% |
| Total | 464 | 100.0% |
Transportation & Commute in Ballinger
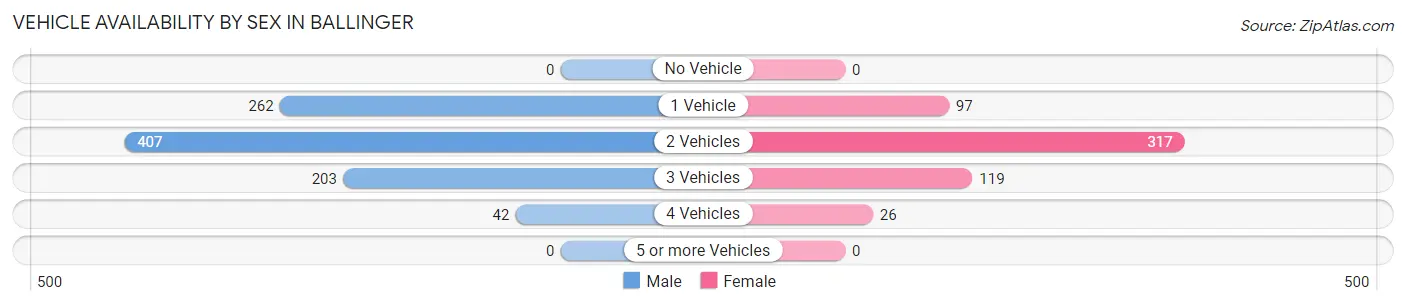
Vehicle Availability by Sex in Ballinger
The most prevalent vehicle ownership categories in Ballinger are males with 2 vehicles (407, accounting for 44.5%) and females with 2 vehicles (317, making up 72.8%).
| Vehicles Available | Male | Female |
| No Vehicle | 0 (0.0%) | 0 (0.0%) |
| 1 Vehicle | 262 (28.7%) | 97 (17.3%) |
| 2 Vehicles | 407 (44.5%) | 317 (56.7%) |
| 3 Vehicles | 203 (22.2%) | 119 (21.3%) |
| 4 Vehicles | 42 (4.6%) | 26 (4.6%) |
| 5 or more Vehicles | 0 (0.0%) | 0 (0.0%) |
| Total | 914 (100.0%) | 559 (100.0%) |
Commute Time in Ballinger
The most frequently occuring commute durations in Ballinger are 5 to 9 minutes (403 commuters, 27.7%), 10 to 14 minutes (185 commuters, 12.7%), and 15 to 19 minutes (163 commuters, 11.2%).
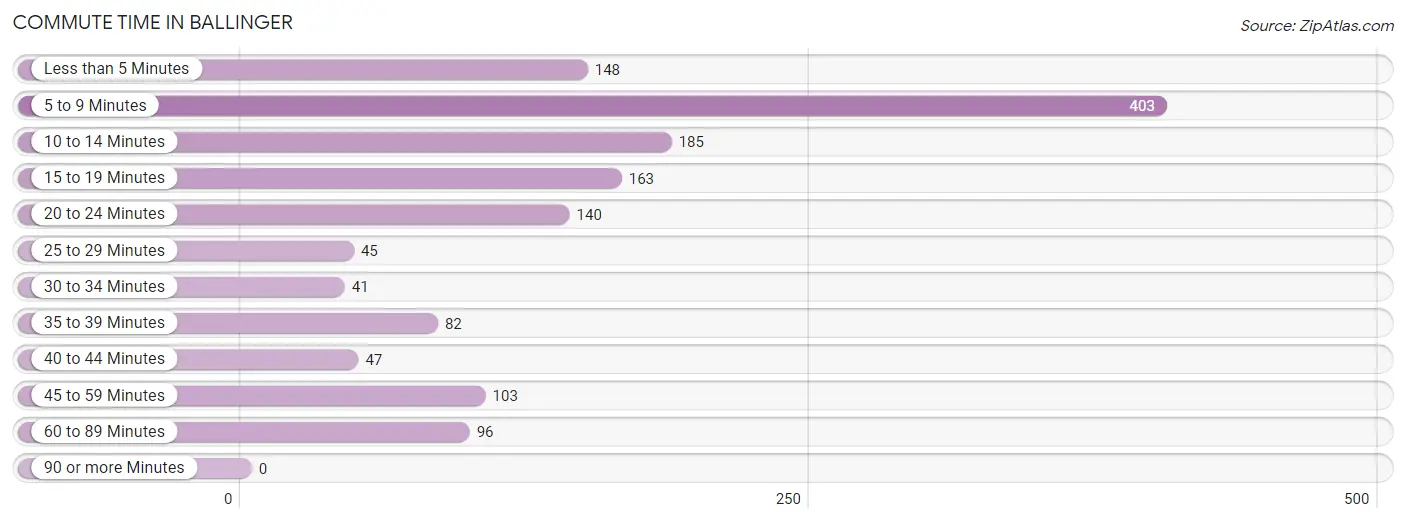
| Commute Time | # Commuters | % Commuters |
| Less than 5 Minutes | 148 | 10.2% |
| 5 to 9 Minutes | 403 | 27.7% |
| 10 to 14 Minutes | 185 | 12.7% |
| 15 to 19 Minutes | 163 | 11.2% |
| 20 to 24 Minutes | 140 | 9.6% |
| 25 to 29 Minutes | 45 | 3.1% |
| 30 to 34 Minutes | 41 | 2.8% |
| 35 to 39 Minutes | 82 | 5.6% |
| 40 to 44 Minutes | 47 | 3.2% |
| 45 to 59 Minutes | 103 | 7.1% |
| 60 to 89 Minutes | 96 | 6.6% |
| 90 or more Minutes | 0 | 0.0% |
Commute Time by Sex in Ballinger
The most common commute times in Ballinger are 5 to 9 minutes (337 commuters, 36.9%) for males and 15 to 19 minutes (96 commuters, 17.8%) for females.
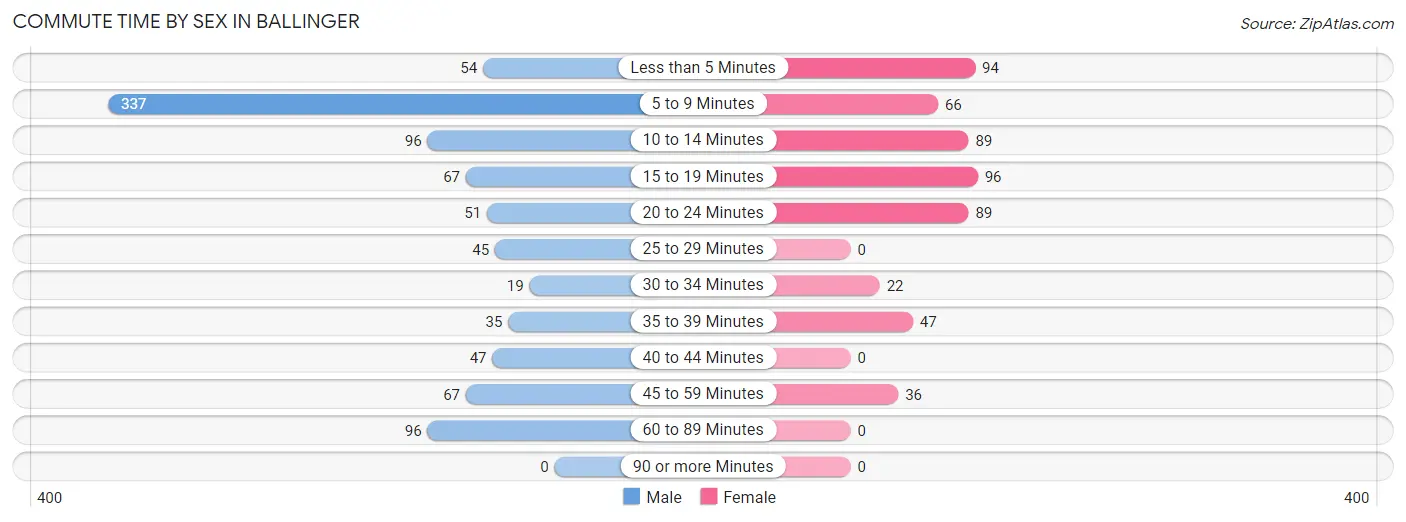
| Commute Time | Male | Female |
| Less than 5 Minutes | 54 (5.9%) | 94 (17.4%) |
| 5 to 9 Minutes | 337 (36.9%) | 66 (12.2%) |
| 10 to 14 Minutes | 96 (10.5%) | 89 (16.5%) |
| 15 to 19 Minutes | 67 (7.3%) | 96 (17.8%) |
| 20 to 24 Minutes | 51 (5.6%) | 89 (16.5%) |
| 25 to 29 Minutes | 45 (4.9%) | 0 (0.0%) |
| 30 to 34 Minutes | 19 (2.1%) | 22 (4.1%) |
| 35 to 39 Minutes | 35 (3.8%) | 47 (8.7%) |
| 40 to 44 Minutes | 47 (5.1%) | 0 (0.0%) |
| 45 to 59 Minutes | 67 (7.3%) | 36 (6.7%) |
| 60 to 89 Minutes | 96 (10.5%) | 0 (0.0%) |
| 90 or more Minutes | 0 (0.0%) | 0 (0.0%) |
Time of Departure to Work by Sex in Ballinger
The most frequent times of departure to work in Ballinger are 7:00 AM to 7:29 AM (134, 14.7%) for males and 7:00 AM to 7:29 AM (174, 32.3%) for females.
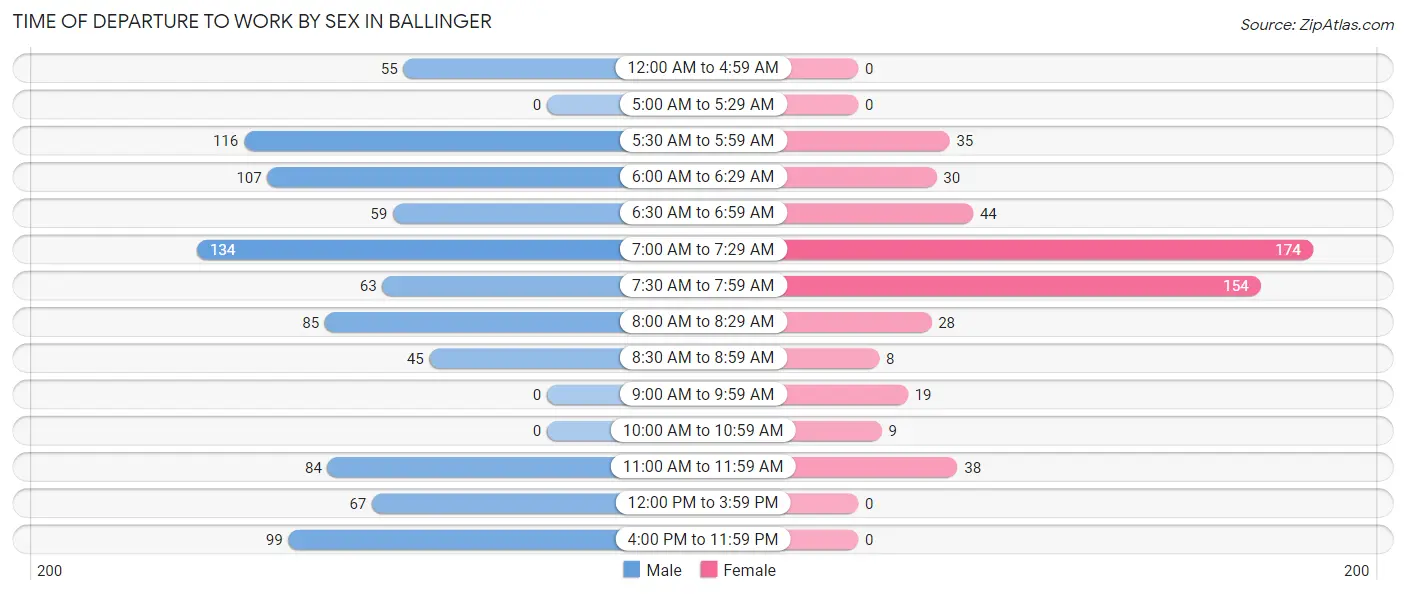
| Time of Departure | Male | Female |
| 12:00 AM to 4:59 AM | 55 (6.0%) | 0 (0.0%) |
| 5:00 AM to 5:29 AM | 0 (0.0%) | 0 (0.0%) |
| 5:30 AM to 5:59 AM | 116 (12.7%) | 35 (6.5%) |
| 6:00 AM to 6:29 AM | 107 (11.7%) | 30 (5.6%) |
| 6:30 AM to 6:59 AM | 59 (6.5%) | 44 (8.2%) |
| 7:00 AM to 7:29 AM | 134 (14.7%) | 174 (32.3%) |
| 7:30 AM to 7:59 AM | 63 (6.9%) | 154 (28.6%) |
| 8:00 AM to 8:29 AM | 85 (9.3%) | 28 (5.2%) |
| 8:30 AM to 8:59 AM | 45 (4.9%) | 8 (1.5%) |
| 9:00 AM to 9:59 AM | 0 (0.0%) | 19 (3.5%) |
| 10:00 AM to 10:59 AM | 0 (0.0%) | 9 (1.7%) |
| 11:00 AM to 11:59 AM | 84 (9.2%) | 38 (7.0%) |
| 12:00 PM to 3:59 PM | 67 (7.3%) | 0 (0.0%) |
| 4:00 PM to 11:59 PM | 99 (10.8%) | 0 (0.0%) |
| Total | 914 (100.0%) | 539 (100.0%) |
Housing Occupancy in Ballinger
Occupancy by Ownership in Ballinger
Of the total 1,373 dwellings in Ballinger, owner-occupied units account for 938 (68.3%), while renter-occupied units make up 435 (31.7%).
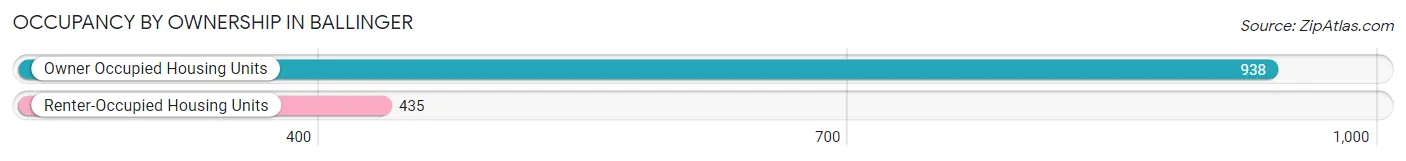
| Occupancy | # Housing Units | % Housing Units |
| Owner Occupied Housing Units | 938 | 68.3% |
| Renter-Occupied Housing Units | 435 | 31.7% |
| Total Occupied Housing Units | 1,373 | 100.0% |
Occupancy by Household Size in Ballinger
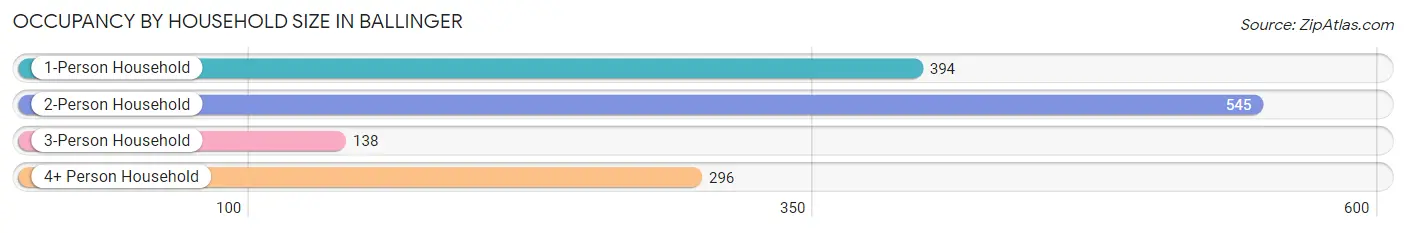
| Household Size | # Housing Units | % Housing Units |
| 1-Person Household | 394 | 28.7% |
| 2-Person Household | 545 | 39.7% |
| 3-Person Household | 138 | 10.1% |
| 4+ Person Household | 296 | 21.6% |
| Total Housing Units | 1,373 | 100.0% |
Occupancy by Ownership by Household Size in Ballinger
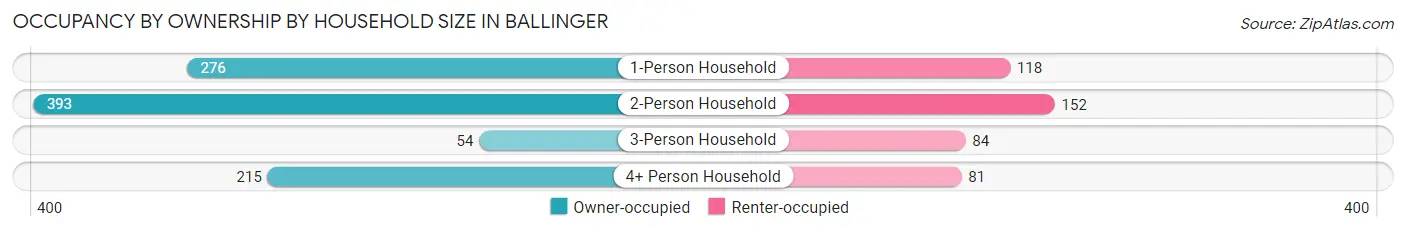
| Household Size | Owner-occupied | Renter-occupied |
| 1-Person Household | 276 (70.1%) | 118 (29.9%) |
| 2-Person Household | 393 (72.1%) | 152 (27.9%) |
| 3-Person Household | 54 (39.1%) | 84 (60.9%) |
| 4+ Person Household | 215 (72.6%) | 81 (27.4%) |
| Total Housing Units | 938 (68.3%) | 435 (31.7%) |
Occupancy by Educational Attainment in Ballinger
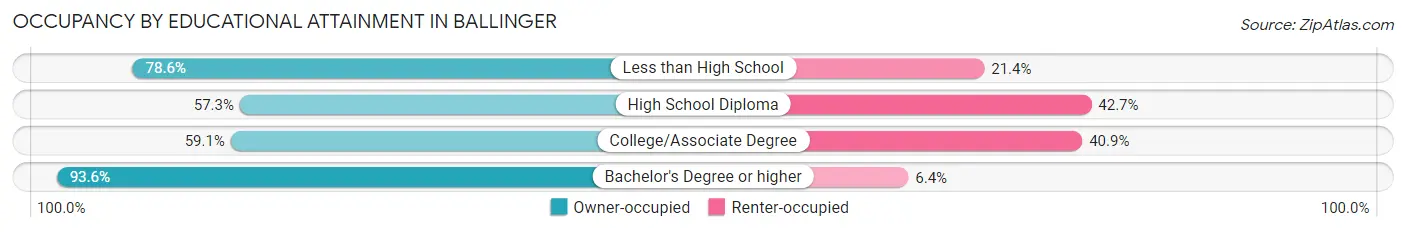
| Household Size | Owner-occupied | Renter-occupied |
| Less than High School | 88 (78.6%) | 24 (21.4%) |
| High School Diploma | 293 (57.3%) | 218 (42.7%) |
| College/Associate Degree | 249 (59.1%) | 172 (40.9%) |
| Bachelor's Degree or higher | 308 (93.6%) | 21 (6.4%) |
Occupancy by Age of Householder in Ballinger
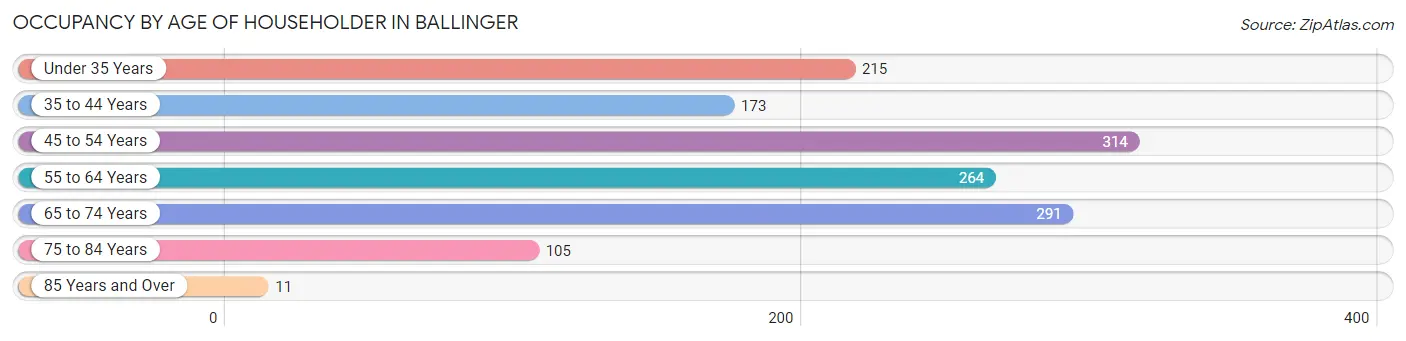
| Age Bracket | # Households | % Households |
| Under 35 Years | 215 | 15.7% |
| 35 to 44 Years | 173 | 12.6% |
| 45 to 54 Years | 314 | 22.9% |
| 55 to 64 Years | 264 | 19.2% |
| 65 to 74 Years | 291 | 21.2% |
| 75 to 84 Years | 105 | 7.6% |
| 85 Years and Over | 11 | 0.8% |
| Total | 1,373 | 100.0% |
Housing Finances in Ballinger
Median Income by Occupancy in Ballinger
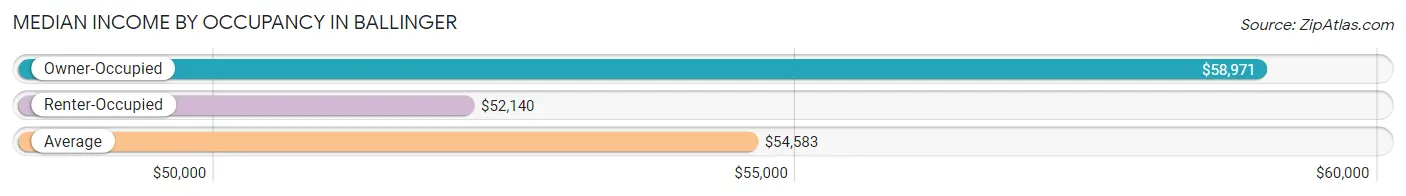
| Occupancy Type | # Households | Median Income |
| Owner-Occupied | 938 (68.3%) | $58,971 |
| Renter-Occupied | 435 (31.7%) | $52,140 |
| Average | 1,373 (100.0%) | $54,583 |
Occupancy by Householder Income Bracket in Ballinger
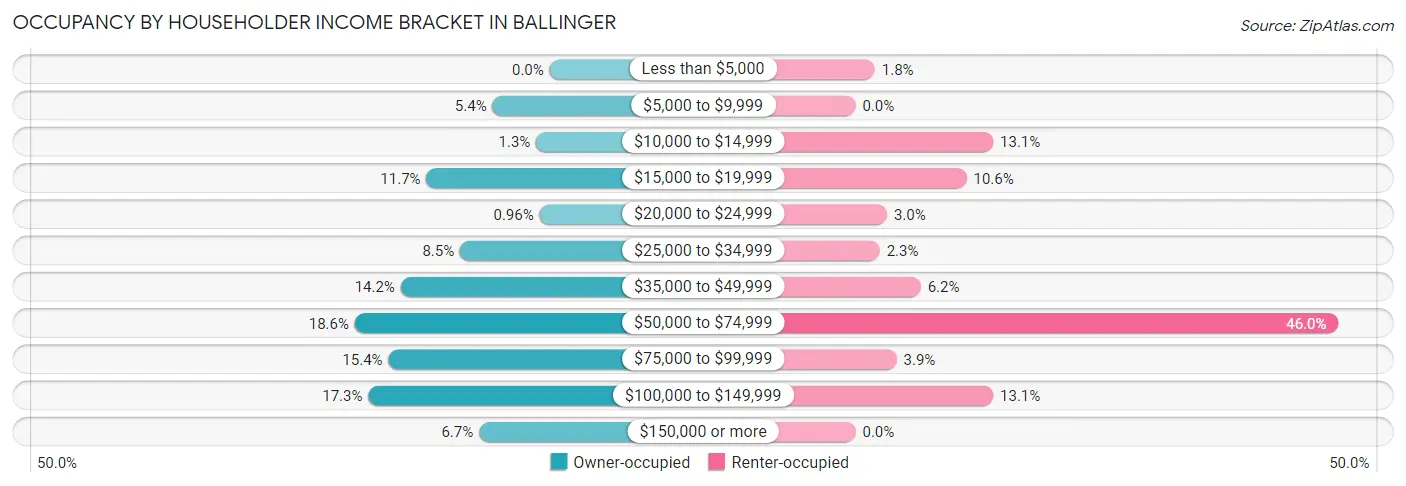
| Income Bracket | Owner-occupied | Renter-occupied |
| Less than $5,000 | 0 (0.0%) | 8 (1.8%) |
| $5,000 to $9,999 | 51 (5.4%) | 0 (0.0%) |
| $10,000 to $14,999 | 12 (1.3%) | 57 (13.1%) |
| $15,000 to $19,999 | 110 (11.7%) | 46 (10.6%) |
| $20,000 to $24,999 | 9 (1.0%) | 13 (3.0%) |
| $25,000 to $34,999 | 80 (8.5%) | 10 (2.3%) |
| $35,000 to $49,999 | 133 (14.2%) | 27 (6.2%) |
| $50,000 to $74,999 | 174 (18.5%) | 200 (46.0%) |
| $75,000 to $99,999 | 144 (15.3%) | 17 (3.9%) |
| $100,000 to $149,999 | 162 (17.3%) | 57 (13.1%) |
| $150,000 or more | 63 (6.7%) | 0 (0.0%) |
| Total | 938 (100.0%) | 435 (100.0%) |
Monthly Housing Cost Tiers in Ballinger
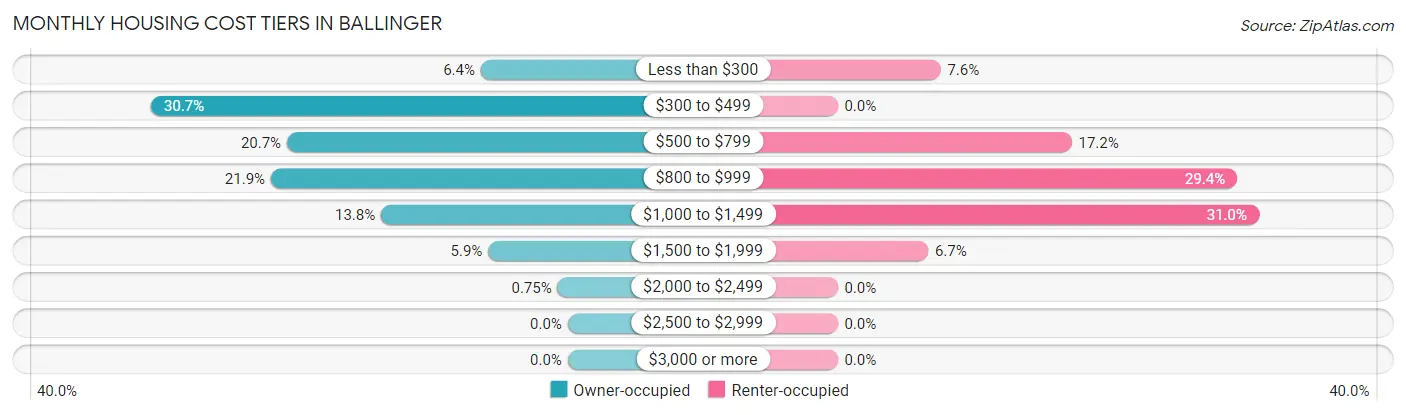
| Monthly Cost | Owner-occupied | Renter-occupied |
| Less than $300 | 60 (6.4%) | 33 (7.6%) |
| $300 to $499 | 288 (30.7%) | 0 (0.0%) |
| $500 to $799 | 194 (20.7%) | 75 (17.2%) |
| $800 to $999 | 205 (21.9%) | 128 (29.4%) |
| $1,000 to $1,499 | 129 (13.8%) | 135 (31.0%) |
| $1,500 to $1,999 | 55 (5.9%) | 29 (6.7%) |
| $2,000 to $2,499 | 7 (0.7%) | 0 (0.0%) |
| $2,500 to $2,999 | 0 (0.0%) | 0 (0.0%) |
| $3,000 or more | 0 (0.0%) | 0 (0.0%) |
| Total | 938 (100.0%) | 435 (100.0%) |
Physical Housing Characteristics in Ballinger
Housing Structures in Ballinger
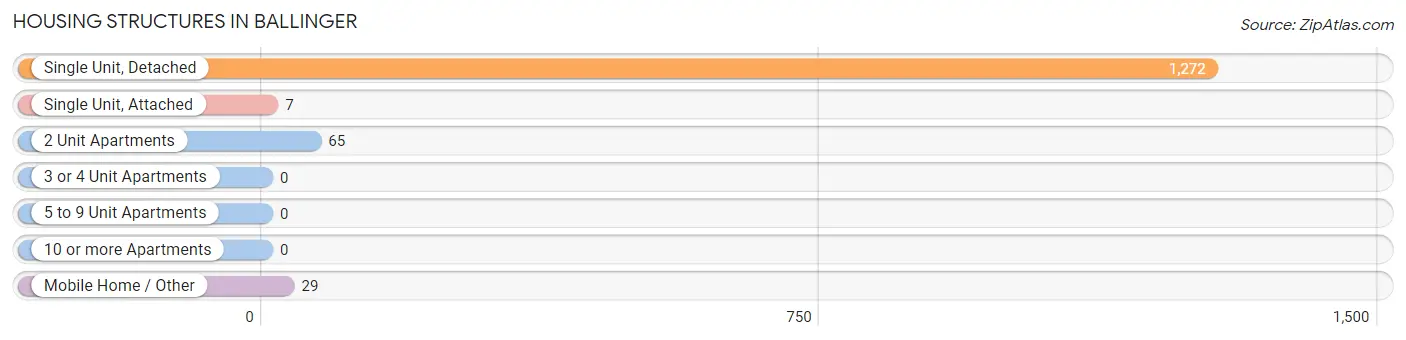
| Structure Type | # Housing Units | % Housing Units |
| Single Unit, Detached | 1,272 | 92.6% |
| Single Unit, Attached | 7 | 0.5% |
| 2 Unit Apartments | 65 | 4.7% |
| 3 or 4 Unit Apartments | 0 | 0.0% |
| 5 to 9 Unit Apartments | 0 | 0.0% |
| 10 or more Apartments | 0 | 0.0% |
| Mobile Home / Other | 29 | 2.1% |
| Total | 1,373 | 100.0% |
Housing Structures by Occupancy in Ballinger
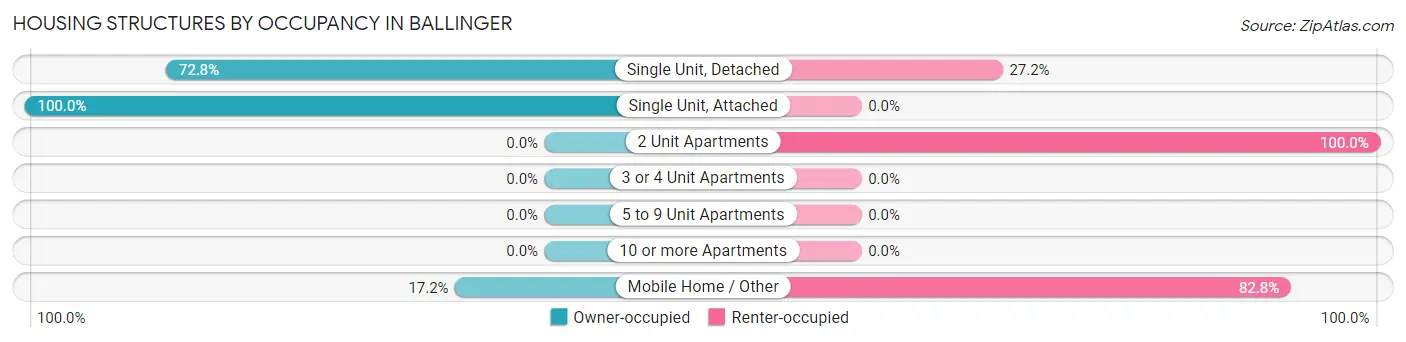
| Structure Type | Owner-occupied | Renter-occupied |
| Single Unit, Detached | 926 (72.8%) | 346 (27.2%) |
| Single Unit, Attached | 7 (100.0%) | 0 (0.0%) |
| 2 Unit Apartments | 0 (0.0%) | 65 (100.0%) |
| 3 or 4 Unit Apartments | 0 (0.0%) | 0 (0.0%) |
| 5 to 9 Unit Apartments | 0 (0.0%) | 0 (0.0%) |
| 10 or more Apartments | 0 (0.0%) | 0 (0.0%) |
| Mobile Home / Other | 5 (17.2%) | 24 (82.8%) |
| Total | 938 (68.3%) | 435 (31.7%) |
Housing Structures by Number of Rooms in Ballinger
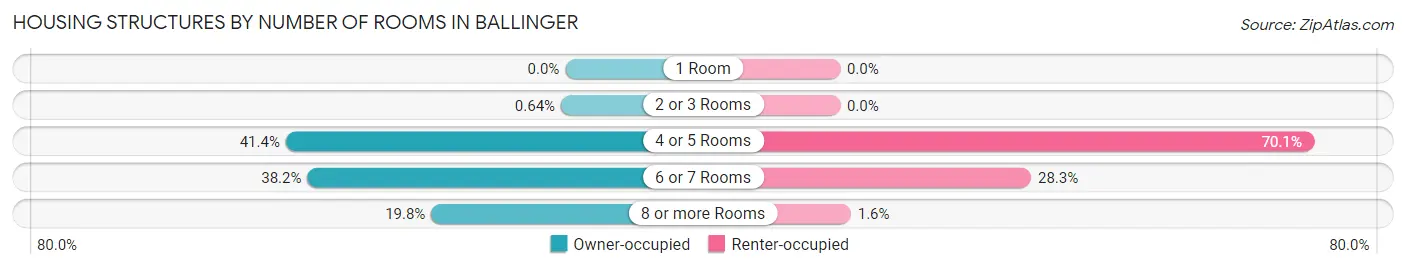
| Number of Rooms | Owner-occupied | Renter-occupied |
| 1 Room | 0 (0.0%) | 0 (0.0%) |
| 2 or 3 Rooms | 6 (0.6%) | 0 (0.0%) |
| 4 or 5 Rooms | 388 (41.4%) | 305 (70.1%) |
| 6 or 7 Rooms | 358 (38.2%) | 123 (28.3%) |
| 8 or more Rooms | 186 (19.8%) | 7 (1.6%) |
| Total | 938 (100.0%) | 435 (100.0%) |
Housing Structure by Heating Type in Ballinger
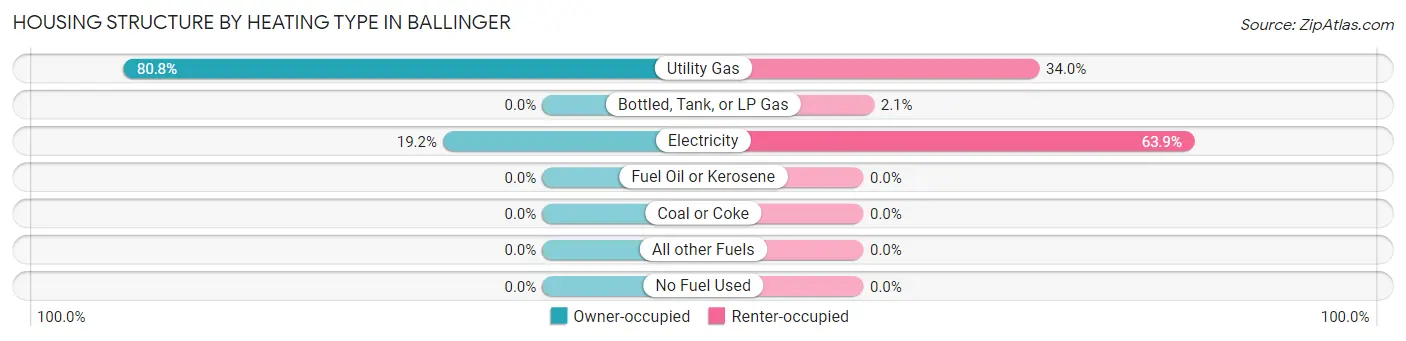
| Heating Type | Owner-occupied | Renter-occupied |
| Utility Gas | 758 (80.8%) | 148 (34.0%) |
| Bottled, Tank, or LP Gas | 0 (0.0%) | 9 (2.1%) |
| Electricity | 180 (19.2%) | 278 (63.9%) |
| Fuel Oil or Kerosene | 0 (0.0%) | 0 (0.0%) |
| Coal or Coke | 0 (0.0%) | 0 (0.0%) |
| All other Fuels | 0 (0.0%) | 0 (0.0%) |
| No Fuel Used | 0 (0.0%) | 0 (0.0%) |
| Total | 938 (100.0%) | 435 (100.0%) |
Household Vehicle Usage in Ballinger
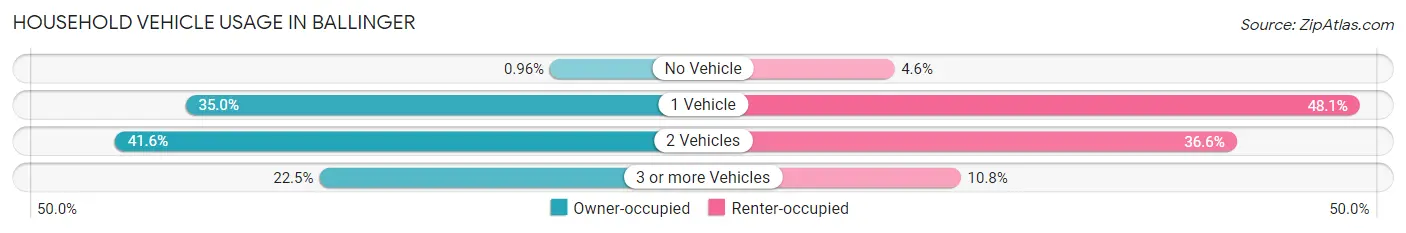
| Vehicles per Household | Owner-occupied | Renter-occupied |
| No Vehicle | 9 (1.0%) | 20 (4.6%) |
| 1 Vehicle | 328 (35.0%) | 209 (48.0%) |
| 2 Vehicles | 390 (41.6%) | 159 (36.5%) |
| 3 or more Vehicles | 211 (22.5%) | 47 (10.8%) |
| Total | 938 (100.0%) | 435 (100.0%) |
Real Estate & Mortgages in Ballinger
Real Estate and Mortgage Overview in Ballinger
| Characteristic | Without Mortgage | With Mortgage |
| Housing Units | 580 | 358 |
| Median Property Value | $69,400 | $114,600 |
| Median Household Income | $42,457 | $48 |
| Monthly Housing Costs | $457 | $0 |
| Real Estate Taxes | $1,167 | $9 |
Property Value by Mortgage Status in Ballinger
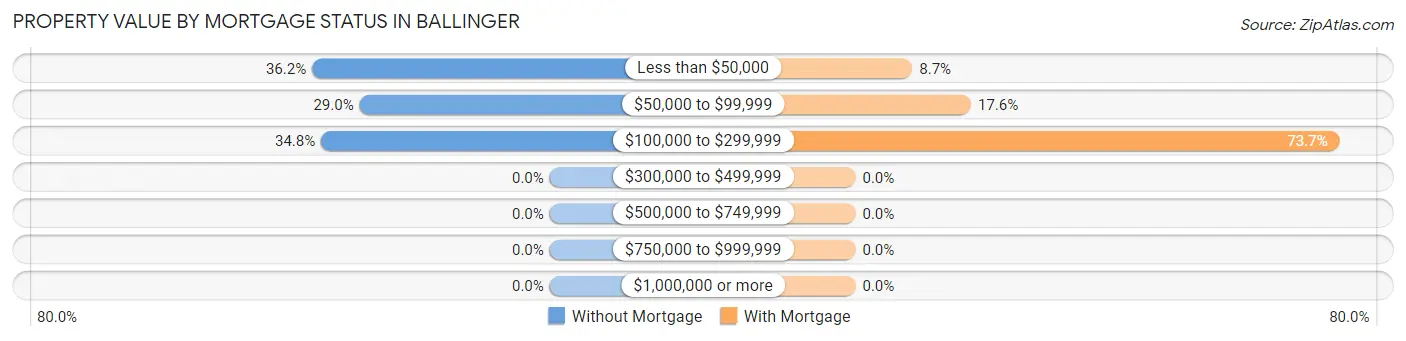
| Property Value | Without Mortgage | With Mortgage |
| Less than $50,000 | 210 (36.2%) | 31 (8.7%) |
| $50,000 to $99,999 | 168 (29.0%) | 63 (17.6%) |
| $100,000 to $299,999 | 202 (34.8%) | 264 (73.7%) |
| $300,000 to $499,999 | 0 (0.0%) | 0 (0.0%) |
| $500,000 to $749,999 | 0 (0.0%) | 0 (0.0%) |
| $750,000 to $999,999 | 0 (0.0%) | 0 (0.0%) |
| $1,000,000 or more | 0 (0.0%) | 0 (0.0%) |
| Total | 580 (100.0%) | 358 (100.0%) |
Household Income by Mortgage Status in Ballinger
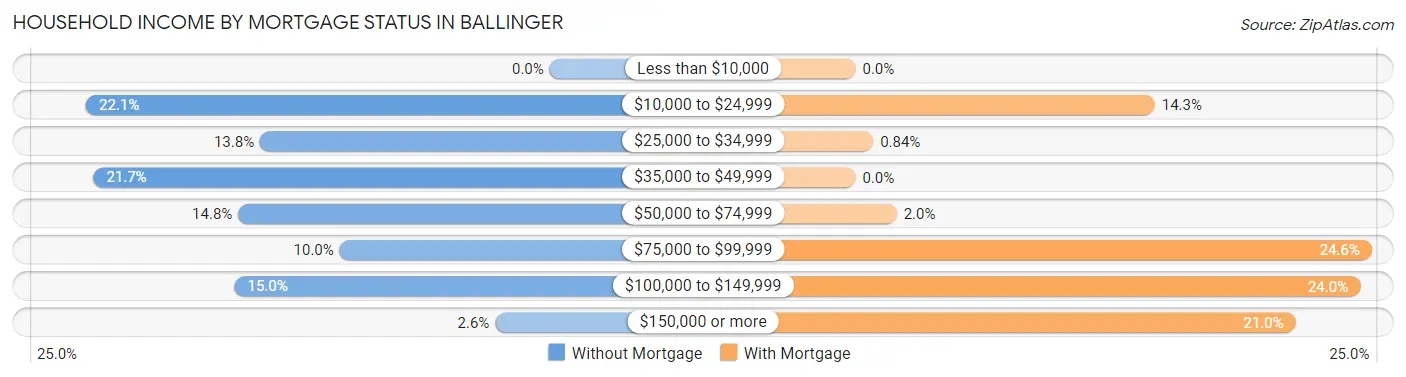
| Household Income | Without Mortgage | With Mortgage |
| Less than $10,000 | 0 (0.0%) | 0 (0.0%) |
| $10,000 to $24,999 | 128 (22.1%) | 51 (14.2%) |
| $25,000 to $34,999 | 80 (13.8%) | 3 (0.8%) |
| $35,000 to $49,999 | 126 (21.7%) | 0 (0.0%) |
| $50,000 to $74,999 | 86 (14.8%) | 7 (2.0%) |
| $75,000 to $99,999 | 58 (10.0%) | 88 (24.6%) |
| $100,000 to $149,999 | 87 (15.0%) | 86 (24.0%) |
| $150,000 or more | 15 (2.6%) | 75 (20.9%) |
| Total | 580 (100.0%) | 358 (100.0%) |
Property Value to Household Income Ratio in Ballinger
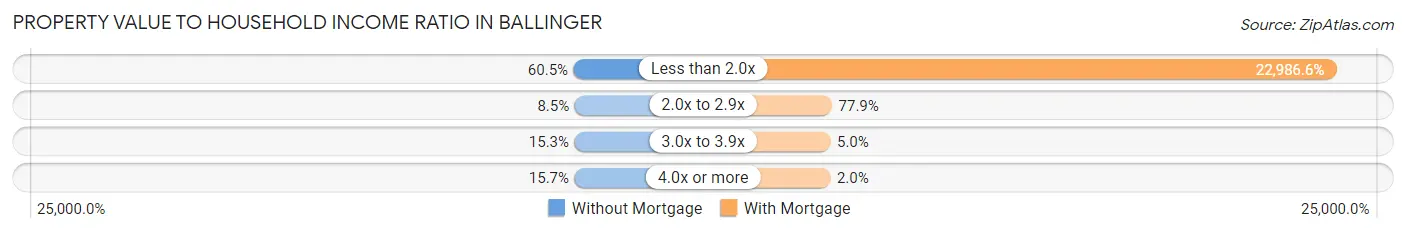
| Value-to-Income Ratio | Without Mortgage | With Mortgage |
| Less than 2.0x | 351 (60.5%) | 82,292 (22,986.6%) |
| 2.0x to 2.9x | 49 (8.5%) | 279 (77.9%) |
| 3.0x to 3.9x | 89 (15.3%) | 18 (5.0%) |
| 4.0x or more | 91 (15.7%) | 7 (2.0%) |
| Total | 580 (100.0%) | 358 (100.0%) |
Real Estate Taxes by Mortgage Status in Ballinger
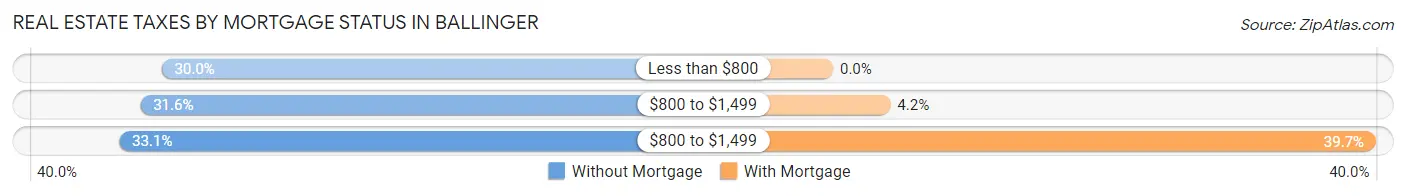
| Property Taxes | Without Mortgage | With Mortgage |
| Less than $800 | 174 (30.0%) | 0 (0.0%) |
| $800 to $1,499 | 183 (31.6%) | 15 (4.2%) |
| $800 to $1,499 | 192 (33.1%) | 142 (39.7%) |
| Total | 580 (100.0%) | 358 (100.0%) |
Health & Disability in Ballinger
Health Insurance Coverage by Age in Ballinger
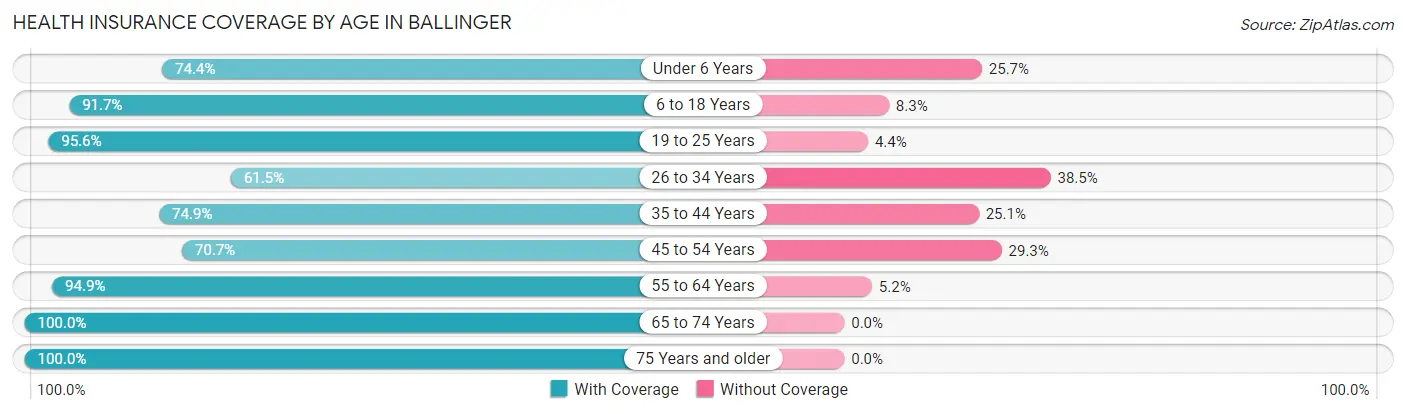
| Age Bracket | With Coverage | Without Coverage |
| Under 6 Years | 200 (74.4%) | 69 (25.7%) |
| 6 to 18 Years | 595 (91.7%) | 54 (8.3%) |
| 19 to 25 Years | 216 (95.6%) | 10 (4.4%) |
| 26 to 34 Years | 216 (61.5%) | 135 (38.5%) |
| 35 to 44 Years | 269 (74.9%) | 90 (25.1%) |
| 45 to 54 Years | 383 (70.7%) | 159 (29.3%) |
| 55 to 64 Years | 405 (94.9%) | 22 (5.1%) |
| 65 to 74 Years | 388 (100.0%) | 0 (0.0%) |
| 75 Years and older | 207 (100.0%) | 0 (0.0%) |
| Total | 2,879 (84.2%) | 539 (15.8%) |
Health Insurance Coverage by Citizenship Status in Ballinger
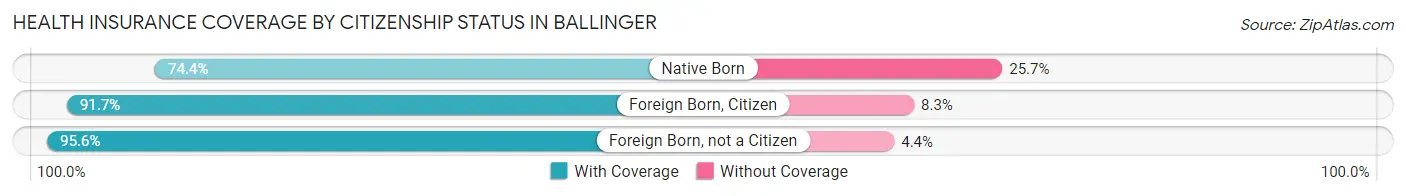
| Citizenship Status | With Coverage | Without Coverage |
| Native Born | 200 (74.4%) | 69 (25.7%) |
| Foreign Born, Citizen | 595 (91.7%) | 54 (8.3%) |
| Foreign Born, not a Citizen | 216 (95.6%) | 10 (4.4%) |
Health Insurance Coverage by Household Income in Ballinger
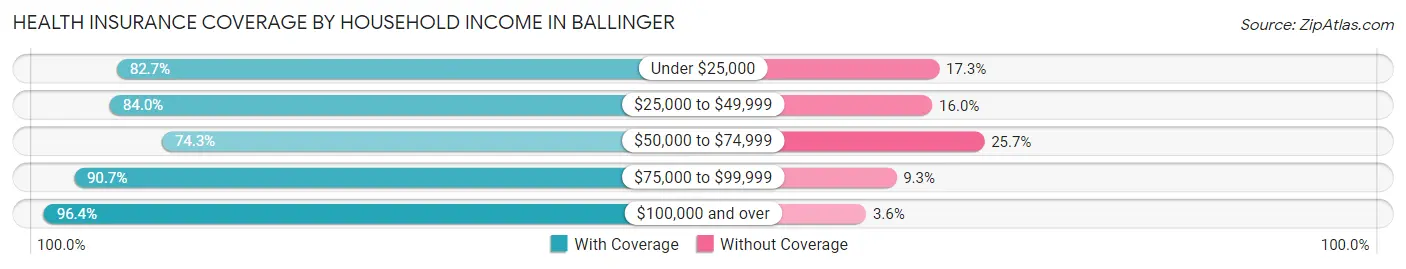
| Household Income | With Coverage | Without Coverage |
| Under $25,000 | 335 (82.7%) | 70 (17.3%) |
| $25,000 to $49,999 | 541 (84.0%) | 103 (16.0%) |
| $50,000 to $74,999 | 880 (74.3%) | 305 (25.7%) |
| $75,000 to $99,999 | 294 (90.7%) | 30 (9.3%) |
| $100,000 and over | 829 (96.4%) | 31 (3.6%) |
Public vs Private Health Insurance Coverage by Age in Ballinger
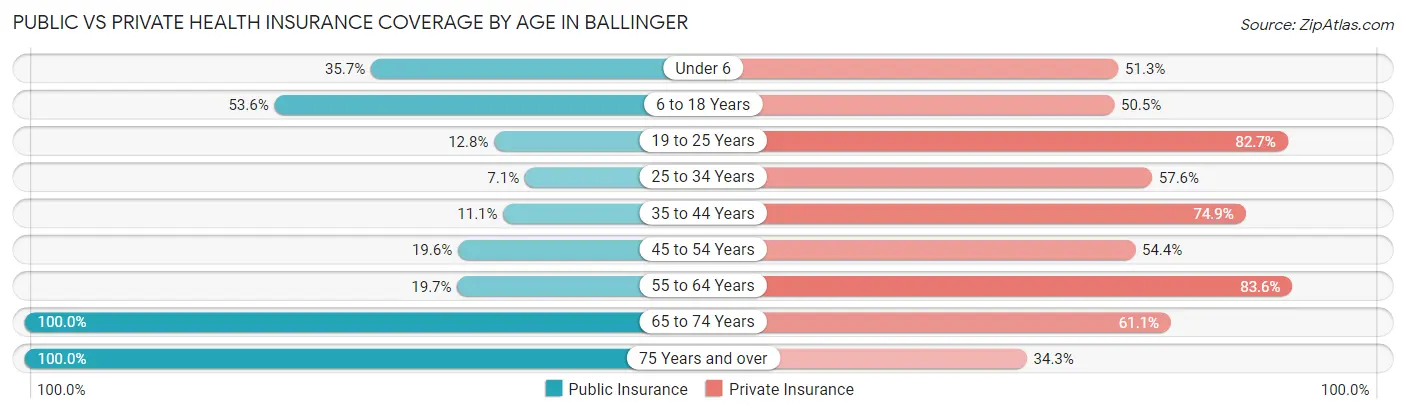
| Age Bracket | Public Insurance | Private Insurance |
| Under 6 | 96 (35.7%) | 138 (51.3%) |
| 6 to 18 Years | 348 (53.6%) | 328 (50.5%) |
| 19 to 25 Years | 29 (12.8%) | 187 (82.7%) |
| 25 to 34 Years | 25 (7.1%) | 202 (57.6%) |
| 35 to 44 Years | 40 (11.1%) | 269 (74.9%) |
| 45 to 54 Years | 106 (19.6%) | 295 (54.4%) |
| 55 to 64 Years | 84 (19.7%) | 357 (83.6%) |
| 65 to 74 Years | 388 (100.0%) | 237 (61.1%) |
| 75 Years and over | 207 (100.0%) | 71 (34.3%) |
| Total | 1,323 (38.7%) | 2,084 (61.0%) |
Disability Status by Sex by Age in Ballinger
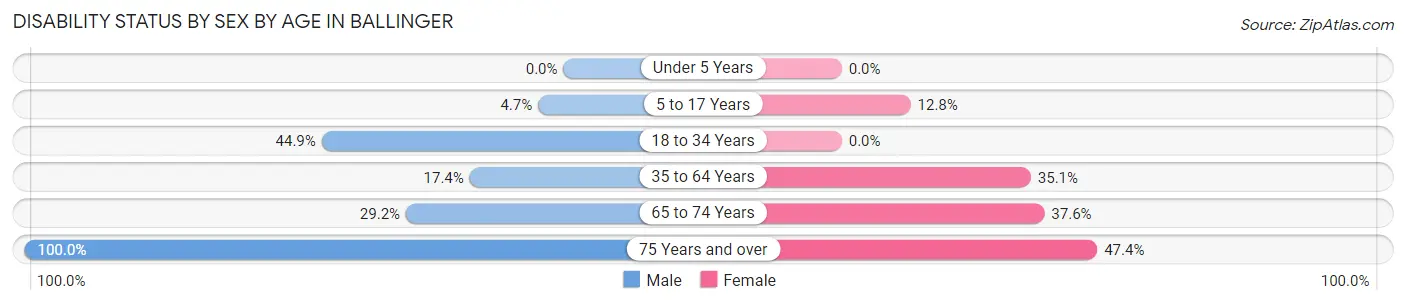
| Age Bracket | Male | Female |
| Under 5 Years | 0 (0.0%) | 0 (0.0%) |
| 5 to 17 Years | 21 (4.7%) | 36 (12.8%) |
| 18 to 34 Years | 140 (44.9%) | 0 (0.0%) |
| 35 to 64 Years | 122 (17.4%) | 220 (35.1%) |
| 65 to 74 Years | 45 (29.2%) | 88 (37.6%) |
| 75 Years and over | 91 (100.0%) | 55 (47.4%) |
Disability Class by Sex by Age in Ballinger
Disability Class: Hearing Difficulty
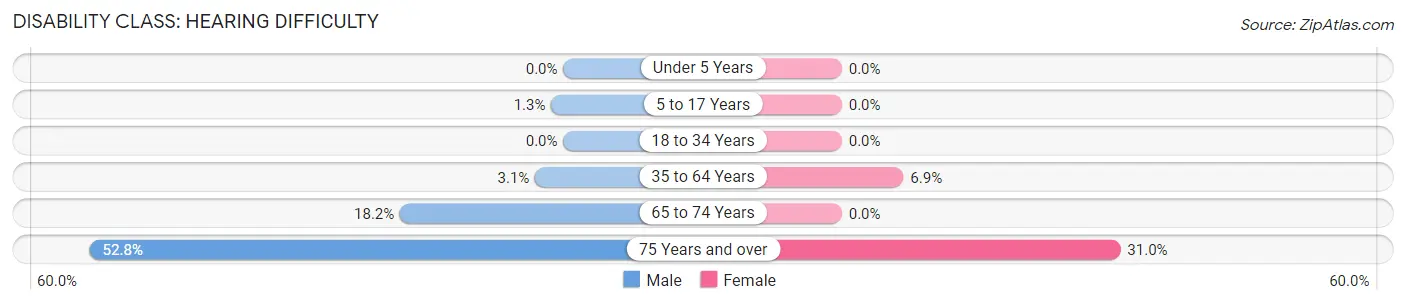
| Age Bracket | Male | Female |
| Under 5 Years | 0 (0.0%) | 0 (0.0%) |
| 5 to 17 Years | 6 (1.3%) | 0 (0.0%) |
| 18 to 34 Years | 0 (0.0%) | 0 (0.0%) |
| 35 to 64 Years | 22 (3.1%) | 43 (6.9%) |
| 65 to 74 Years | 28 (18.2%) | 0 (0.0%) |
| 75 Years and over | 48 (52.7%) | 36 (31.0%) |
Disability Class: Vision Difficulty
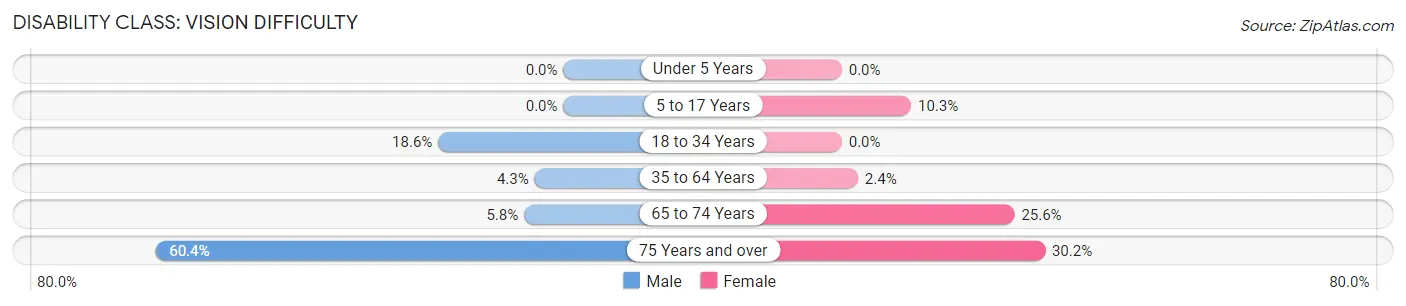
| Age Bracket | Male | Female |
| Under 5 Years | 0 (0.0%) | 0 (0.0%) |
| 5 to 17 Years | 0 (0.0%) | 29 (10.3%) |
| 18 to 34 Years | 58 (18.6%) | 0 (0.0%) |
| 35 to 64 Years | 30 (4.3%) | 15 (2.4%) |
| 65 to 74 Years | 9 (5.8%) | 60 (25.6%) |
| 75 Years and over | 55 (60.4%) | 35 (30.2%) |
Disability Class: Cognitive Difficulty
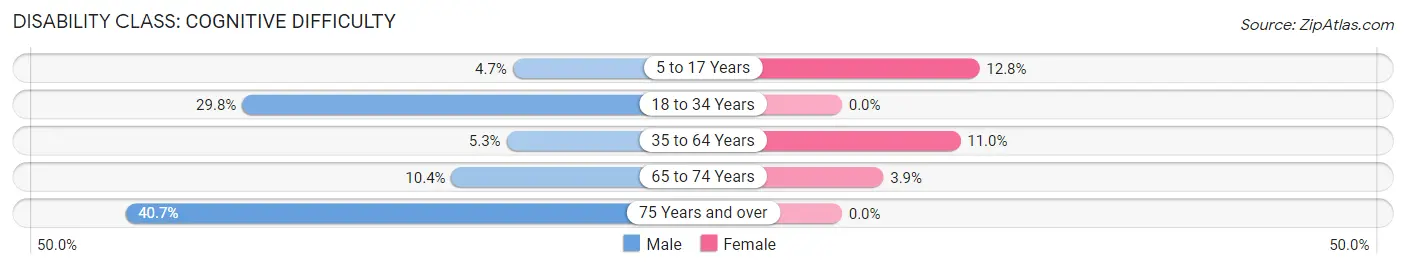
| Age Bracket | Male | Female |
| 5 to 17 Years | 21 (4.7%) | 36 (12.8%) |
| 18 to 34 Years | 93 (29.8%) | 0 (0.0%) |
| 35 to 64 Years | 37 (5.3%) | 69 (11.0%) |
| 65 to 74 Years | 16 (10.4%) | 9 (3.8%) |
| 75 Years and over | 37 (40.7%) | 0 (0.0%) |
Disability Class: Ambulatory Difficulty
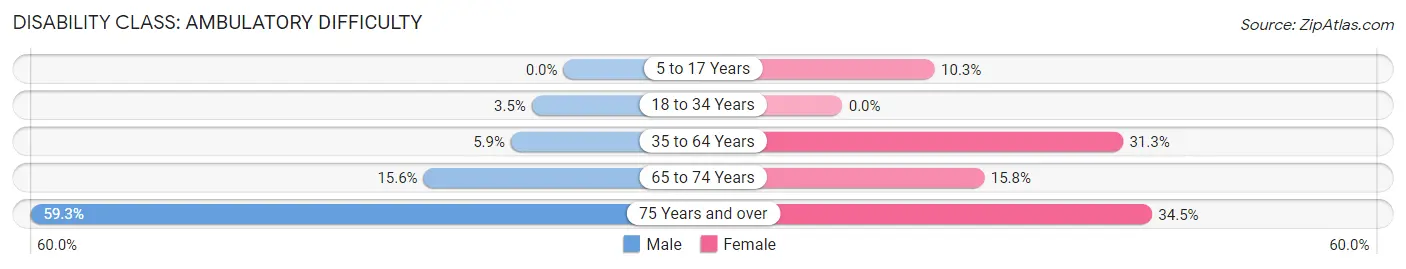
| Age Bracket | Male | Female |
| 5 to 17 Years | 0 (0.0%) | 29 (10.3%) |
| 18 to 34 Years | 11 (3.5%) | 0 (0.0%) |
| 35 to 64 Years | 41 (5.9%) | 196 (31.3%) |
| 65 to 74 Years | 24 (15.6%) | 37 (15.8%) |
| 75 Years and over | 54 (59.3%) | 40 (34.5%) |
Disability Class: Self-Care Difficulty
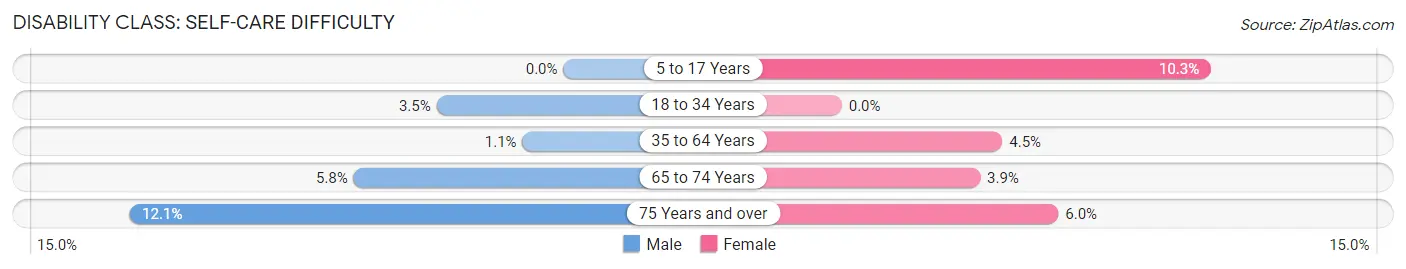
| Age Bracket | Male | Female |
| 5 to 17 Years | 0 (0.0%) | 29 (10.3%) |
| 18 to 34 Years | 11 (3.5%) | 0 (0.0%) |
| 35 to 64 Years | 8 (1.1%) | 28 (4.5%) |
| 65 to 74 Years | 9 (5.8%) | 9 (3.8%) |
| 75 Years and over | 11 (12.1%) | 7 (6.0%) |
Technology Access in Ballinger
Computing Device Access in Ballinger
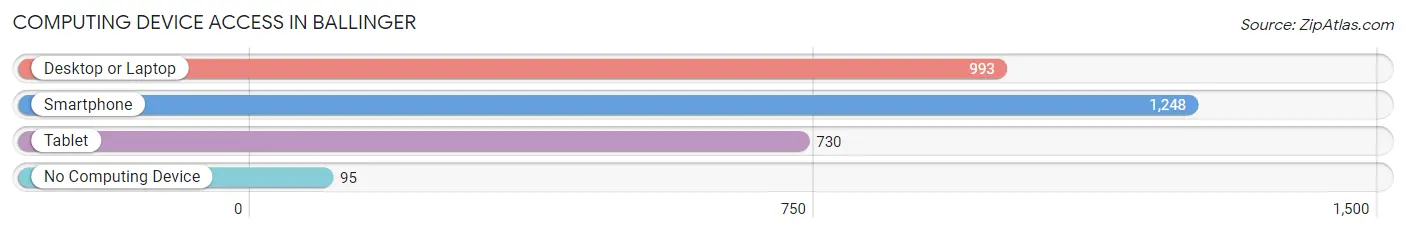
| Device Type | # Households | % Households |
| Desktop or Laptop | 993 | 72.3% |
| Smartphone | 1,248 | 90.9% |
| Tablet | 730 | 53.2% |
| No Computing Device | 95 | 6.9% |
| Total | 1,373 | 100.0% |
Internet Access in Ballinger
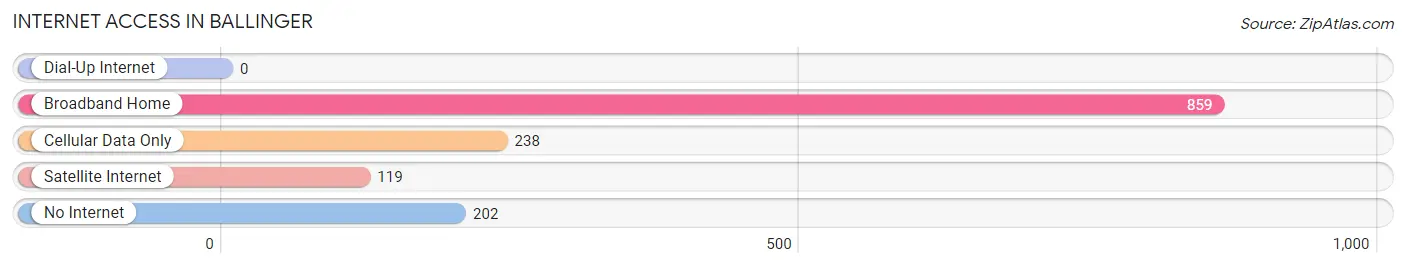
| Internet Type | # Households | % Households |
| Dial-Up Internet | 0 | 0.0% |
| Broadband Home | 859 | 62.6% |
| Cellular Data Only | 238 | 17.3% |
| Satellite Internet | 119 | 8.7% |
| No Internet | 202 | 14.7% |
| Total | 1,373 | 100.0% |
Ballinger Summary
Ballinger, Texas is a small city located in Runnels County in the state of Texas. It is situated on the banks of the Colorado River and is the county seat of Runnels County. The city has a population of approximately 3,500 people and is part of the San Angelo Metropolitan Statistical Area.
History
The area that is now Ballinger was first settled in the late 1800s by ranchers and farmers. The town was originally called Santa Anna, but was later changed to Ballinger in honor of a local rancher, George Ballinger. The town was officially incorporated in 1891 and was named the county seat of Runnels County in 1892.
The town grew rapidly in the early 1900s, and by 1910, it had a population of 1,500. The town was a major center for cotton production and was home to several cotton gins. The town also had a number of businesses, including a bank, a hotel, a newspaper, and a movie theater.
In the 1920s, the town experienced a period of growth and prosperity. The population increased to over 2,000 and the town had a number of new businesses, including a hospital, a library, and a school.
The Great Depression hit Ballinger hard, and the population declined to 1,500 by 1940. The town experienced a period of stagnation until the 1950s, when the economy began to improve. The population increased to 2,500 by 1960 and the town experienced a period of growth and prosperity.
Geography
Ballinger is located in Runnels County in the state of Texas. It is situated on the banks of the Colorado River and is approximately 100 miles northwest of San Antonio. The city has a total area of 2.3 square miles, all of which is land.
The climate in Ballinger is hot and humid in the summer and mild in the winter. The average temperature in the summer is around 90 degrees Fahrenheit, and the average temperature in the winter is around 50 degrees Fahrenheit.
Economy
The economy of Ballinger is largely based on agriculture and oil and gas production. The town is home to several cotton gins and is a major center for cotton production. The town also has a number of businesses, including a bank, a hotel, a newspaper, and a movie theater.
The town is also home to a number of manufacturing companies, including a furniture factory, a plastics factory, and a metal fabrication plant. The town is also home to a number of oil and gas production companies.
Demographics
As of the 2010 census, the population of Ballinger was 3,541. The racial makeup of the town was 79.3% White, 0.7% African American, 0.3% Native American, 0.2% Asian, 0.1% Pacific Islander, 17.7% from other races, and 1.9% from two or more races. Hispanic or Latino of any race were 33.2% of the population.
The median income for a household in Ballinger was $31,250, and the median income for a family was $37,500. The per capita income for the town was $17,845. About 18.2% of families and 22.2% of the population were below the poverty line, including 28.3% of those under age 18 and 15.2% of those age 65 or over.
Common Questions
What is Per Capita Income in Ballinger?
Per Capita income in Ballinger is $25,263.
What is the Median Family Income in Ballinger?
Median Family Income in Ballinger is $58,309.
What is the Median Household income in Ballinger?
Median Household Income in Ballinger is $54,583.
What is Income or Wage Gap in Ballinger?
Income or Wage Gap in Ballinger is 11.0%.
Women in Ballinger earn 89.0 cents for every dollar earned by a man.
What is Inequality or Gini Index in Ballinger?
Inequality or Gini Index in Ballinger is 0.38.
What is the Total Population of Ballinger?
Total Population of Ballinger is 3,587.
What is the Total Male Population of Ballinger?
Total Male Population of Ballinger is 1,903.
What is the Total Female Population of Ballinger?
Total Female Population of Ballinger is 1,684.
What is the Ratio of Males per 100 Females in Ballinger?
There are 113.00 Males per 100 Females in Ballinger.
What is the Ratio of Females per 100 Males in Ballinger?
There are 88.49 Females per 100 Males in Ballinger.
What is the Median Population Age in Ballinger?
Median Population Age in Ballinger is 40.7 Years.
What is the Average Family Size in Ballinger
Average Family Size in Ballinger is 3.1 People.
What is the Average Household Size in Ballinger
Average Household Size in Ballinger is 2.5 People.
How Large is the Labor Force in Ballinger?
There are 1,569 People in the Labor Forcein in Ballinger.
What is the Percentage of People in the Labor Force in Ballinger?
57.4% of People are in the Labor Force in Ballinger.
What is the Unemployment Rate in Ballinger?
Unemployment Rate in Ballinger is 6.1%.