Baird, TX Map & Demographics
Baird Map
Baird Overview
$27,022
PER CAPITA INCOME
$66,250
AVG FAMILY INCOME
$49,402
AVG HOUSEHOLD INCOME
69.3%
WAGE / INCOME GAP [ % ]
30.7¢/ $1
WAGE / INCOME GAP [ $ ]
0.41
INEQUALITY / GINI INDEX
1,735
TOTAL POPULATION
823
MALE POPULATION
912
FEMALE POPULATION
90.24
MALES / 100 FEMALES
110.81
FEMALES / 100 MALES
45.6
MEDIAN AGE
3.4
AVG FAMILY SIZE
2.6
AVG HOUSEHOLD SIZE
859
LABOR FORCE [ PEOPLE ]
61.6%
PERCENT IN LABOR FORCE
6.9%
UNEMPLOYMENT RATE
Baird Zip Codes
Baird Area Codes
Income in Baird
Income Overview in Baird
Per Capita Income in Baird is $27,022, while median incomes of families and households are $66,250 and $49,402 respectively.
| Characteristic | Number | Measure |
| Per Capita Income | 1,735 | $27,022 |
| Median Family Income | 407 | $66,250 |
| Mean Family Income | 407 | $78,189 |
| Median Household Income | 639 | $49,402 |
| Mean Household Income | 639 | $63,310 |
| Income Deficit | 407 | $0 |
| Wage / Income Gap (%) | 1,735 | 69.30% |
| Wage / Income Gap ($) | 1,735 | 30.70¢ per $1 |
| Gini / Inequality Index | 1,735 | 0.41 |
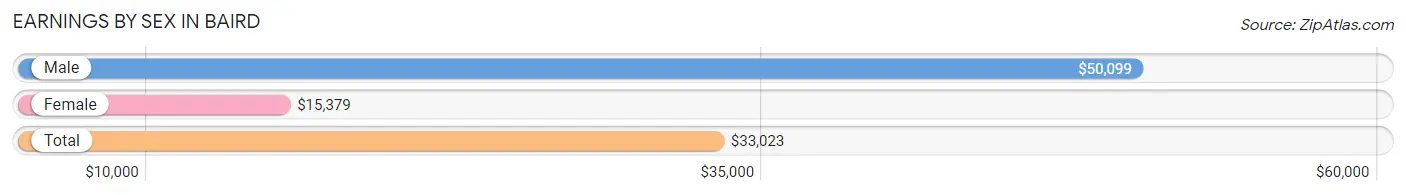
Earnings by Sex in Baird
Average Earnings in Baird are $33,023, $50,099 for men and $15,379 for women, a difference of 69.3%.
| Sex | Number | Average Earnings |
| Male | 435 (49.7%) | $50,099 |
| Female | 440 (50.3%) | $15,379 |
| Total | 875 (100.0%) | $33,023 |
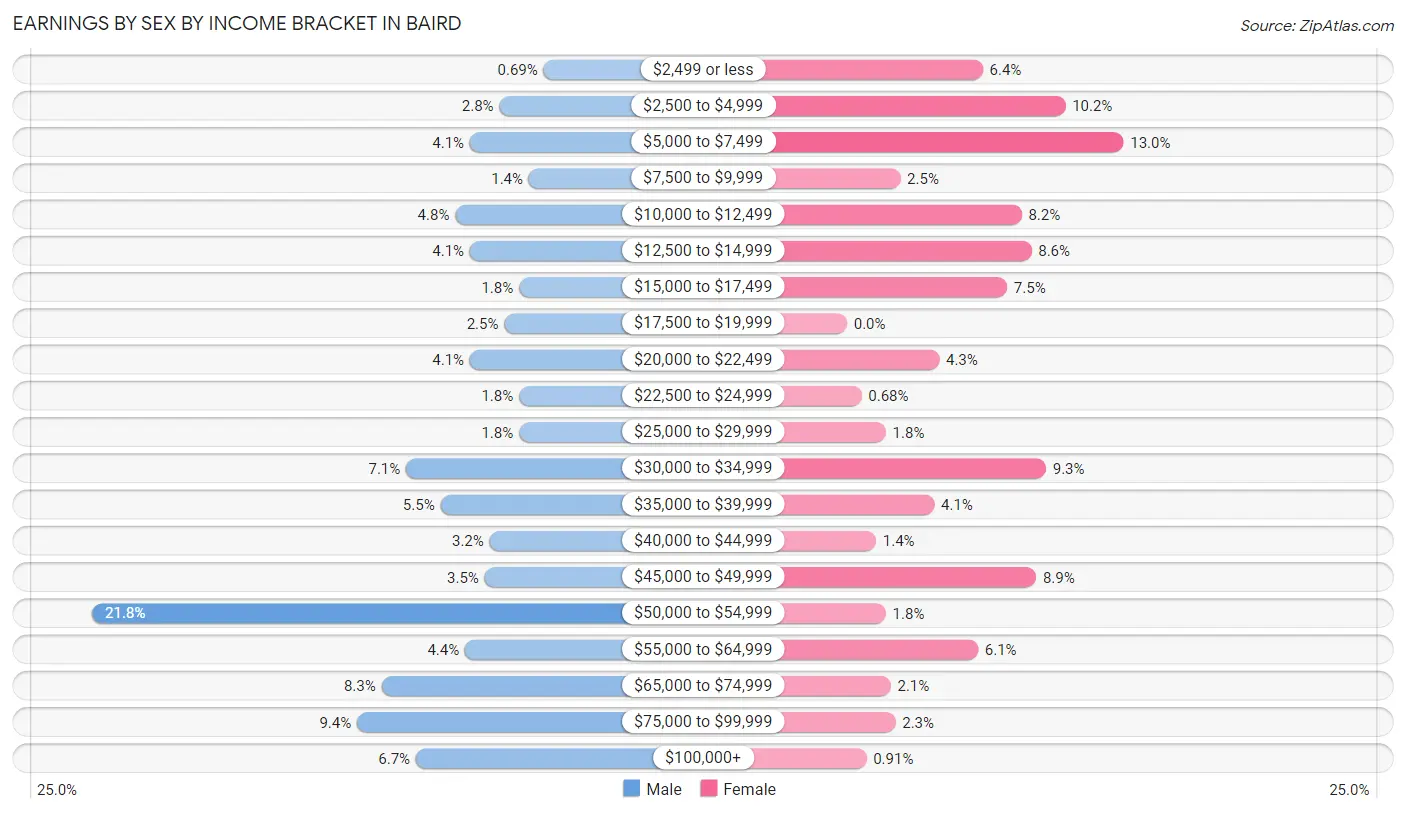
Earnings by Sex by Income Bracket in Baird
The most common earnings brackets in Baird are $50,000 to $54,999 for men (95 | 21.8%) and $5,000 to $7,499 for women (57 | 13.0%).
| Income | Male | Female |
| $2,499 or less | 3 (0.7%) | 28 (6.4%) |
| $2,500 to $4,999 | 12 (2.8%) | 45 (10.2%) |
| $5,000 to $7,499 | 18 (4.1%) | 57 (13.0%) |
| $7,500 to $9,999 | 6 (1.4%) | 11 (2.5%) |
| $10,000 to $12,499 | 21 (4.8%) | 36 (8.2%) |
| $12,500 to $14,999 | 18 (4.1%) | 38 (8.6%) |
| $15,000 to $17,499 | 8 (1.8%) | 33 (7.5%) |
| $17,500 to $19,999 | 11 (2.5%) | 0 (0.0%) |
| $20,000 to $22,499 | 18 (4.1%) | 19 (4.3%) |
| $22,500 to $24,999 | 8 (1.8%) | 3 (0.7%) |
| $25,000 to $29,999 | 8 (1.8%) | 8 (1.8%) |
| $30,000 to $34,999 | 31 (7.1%) | 41 (9.3%) |
| $35,000 to $39,999 | 24 (5.5%) | 18 (4.1%) |
| $40,000 to $44,999 | 14 (3.2%) | 6 (1.4%) |
| $45,000 to $49,999 | 15 (3.5%) | 39 (8.9%) |
| $50,000 to $54,999 | 95 (21.8%) | 8 (1.8%) |
| $55,000 to $64,999 | 19 (4.4%) | 27 (6.1%) |
| $65,000 to $74,999 | 36 (8.3%) | 9 (2.1%) |
| $75,000 to $99,999 | 41 (9.4%) | 10 (2.3%) |
| $100,000+ | 29 (6.7%) | 4 (0.9%) |
| Total | 435 (100.0%) | 440 (100.0%) |
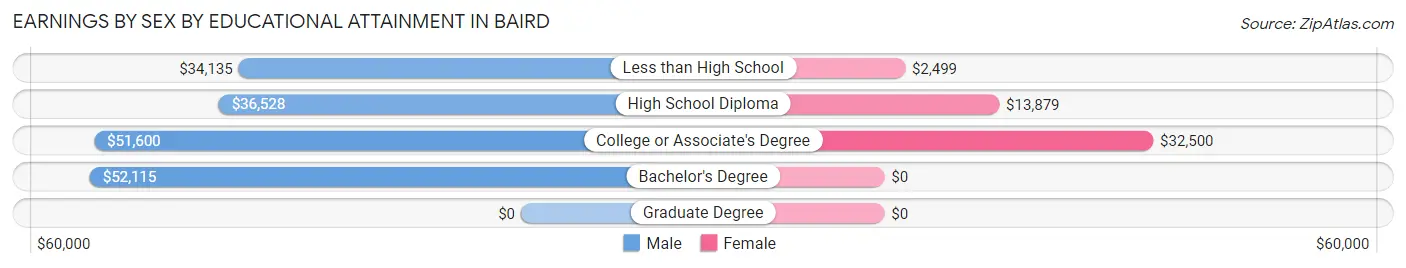
Earnings by Sex by Educational Attainment in Baird
Average earnings in Baird are $50,377 for men and $17,008 for women, a difference of 66.2%. Men with an educational attainment of bachelor's degree enjoy the highest average annual earnings of $52,115, while those with less than high school education earn the least with $34,135. Women with an educational attainment of college or associate's degree earn the most with the average annual earnings of $32,500, while those with less than high school education have the smallest earnings of $2,499.
| Educational Attainment | Male Income | Female Income |
| Less than High School | $34,135 | $2,499 |
| High School Diploma | $36,528 | $13,879 |
| College or Associate's Degree | $51,600 | $32,500 |
| Bachelor's Degree | $52,115 | $0 |
| Graduate Degree | - | - |
| Total | $50,377 | $17,008 |
Family Income in Baird
Family Income Brackets in Baird
According to the Baird family income data, there are 85 families falling into the $100,000 to $149,999 income range, which is the most common income bracket and makes up 20.9% of all families. Conversely, the $10,000 to $14,999 income bracket is the least frequent group with only 5 families (1.2%) belonging to this category.
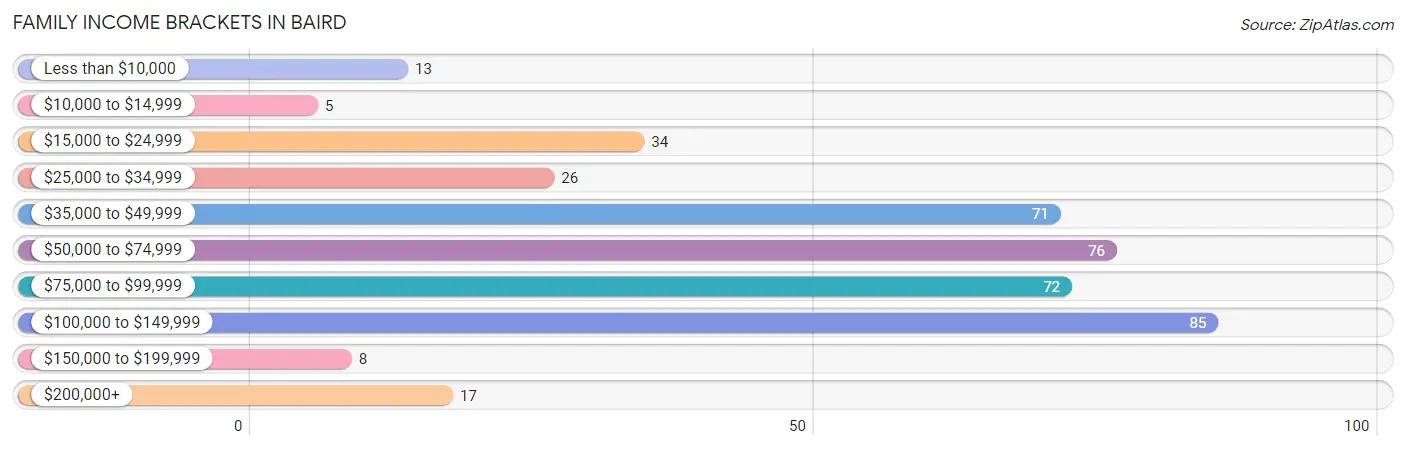
| Income Bracket | # Families | % Families |
| Less than $10,000 | 13 | 3.2% |
| $10,000 to $14,999 | 5 | 1.2% |
| $15,000 to $24,999 | 34 | 8.4% |
| $25,000 to $34,999 | 26 | 6.4% |
| $35,000 to $49,999 | 71 | 17.4% |
| $50,000 to $74,999 | 76 | 18.7% |
| $75,000 to $99,999 | 72 | 17.7% |
| $100,000 to $149,999 | 85 | 20.9% |
| $150,000 to $199,999 | 8 | 2.0% |
| $200,000+ | 17 | 4.2% |
Family Income by Famaliy Size in Baird
4-person families (65 | 16.0%) account for the highest median family income in Baird with $105,625 per family, while 2-person families (217 | 53.3%) have the highest median income of $37,110 per family member.
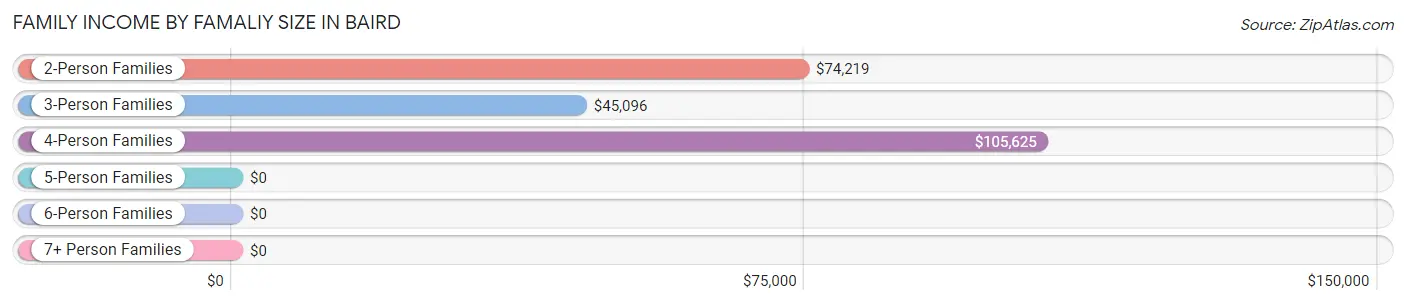
| Income Bracket | # Families | Median Income |
| 2-Person Families | 217 (53.3%) | $74,219 |
| 3-Person Families | 95 (23.3%) | $45,096 |
| 4-Person Families | 65 (16.0%) | $105,625 |
| 5-Person Families | 9 (2.2%) | $0 |
| 6-Person Families | 8 (2.0%) | $0 |
| 7+ Person Families | 13 (3.2%) | $0 |
| Total | 407 (100.0%) | $66,250 |
Family Income by Number of Earners in Baird
The median family income in Baird is $66,250, with families comprising 3+ earners (32) having the highest median family income of $143,000, while families with 1 earner (132) have the lowest median family income of $42,206, accounting for 7.9% and 32.4% of families, respectively.
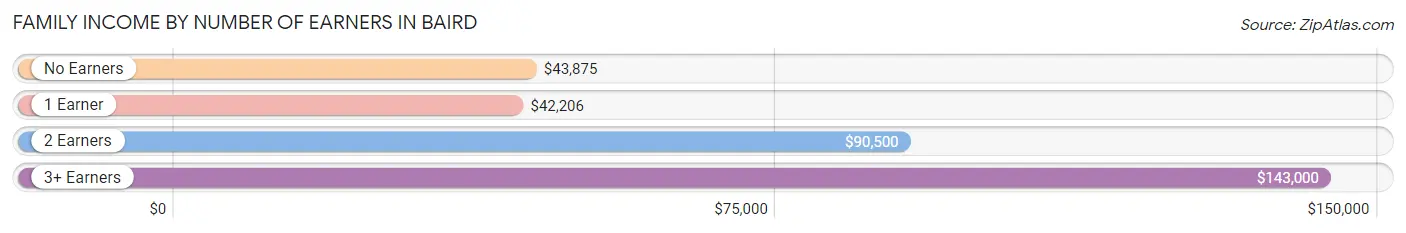
| Number of Earners | # Families | Median Income |
| No Earners | 55 (13.5%) | $43,875 |
| 1 Earner | 132 (32.4%) | $42,206 |
| 2 Earners | 188 (46.2%) | $90,500 |
| 3+ Earners | 32 (7.9%) | $143,000 |
| Total | 407 (100.0%) | $66,250 |
Household Income in Baird
Household Income Brackets in Baird
With 112 households falling in the category, the $35,000 to $49,999 income range is the most frequent in Baird, accounting for 17.5% of all households. In contrast, only 8 households (1.3%) fall into the $150,000 to $199,999 income bracket, making it the least populous group.
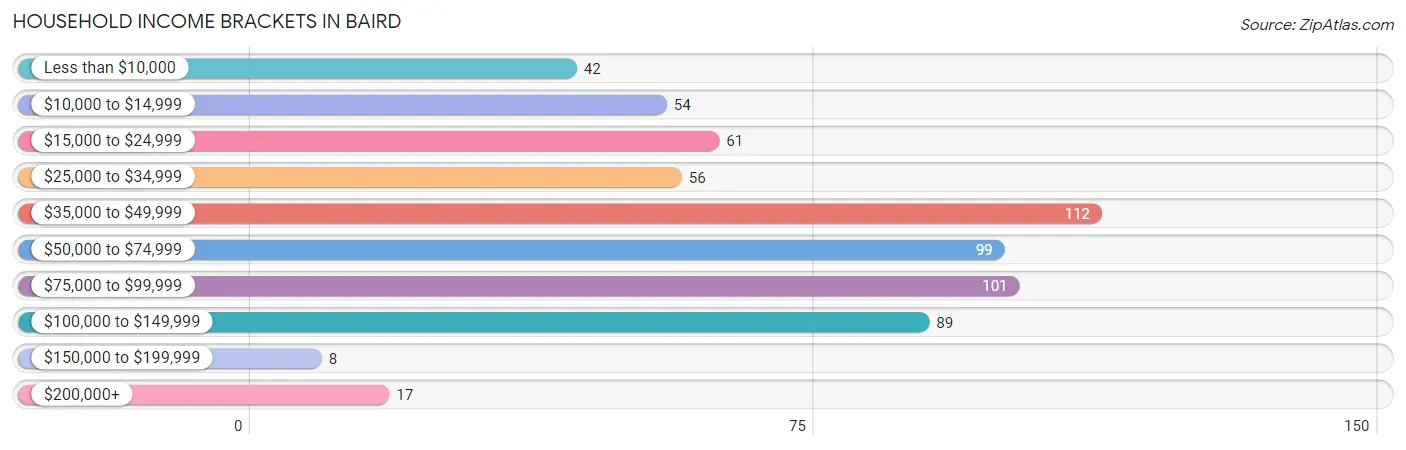
| Income Bracket | # Households | % Households |
| Less than $10,000 | 42 | 6.6% |
| $10,000 to $14,999 | 54 | 8.5% |
| $15,000 to $24,999 | 61 | 9.5% |
| $25,000 to $34,999 | 56 | 8.8% |
| $35,000 to $49,999 | 112 | 17.5% |
| $50,000 to $74,999 | 99 | 15.5% |
| $75,000 to $99,999 | 101 | 15.8% |
| $100,000 to $149,999 | 89 | 13.9% |
| $150,000 to $199,999 | 8 | 1.3% |
| $200,000+ | 17 | 2.7% |
Household Income by Householder Age in Baird
The median household income in Baird is $49,402, with the highest median household income of $83,125 found in the 45 to 64 years age bracket for the primary householder. A total of 198 households (31.0%) fall into this category. Meanwhile, the 15 to 24 years age bracket for the primary householder has the lowest median household income of $0, with 8 households (1.3%) in this group.
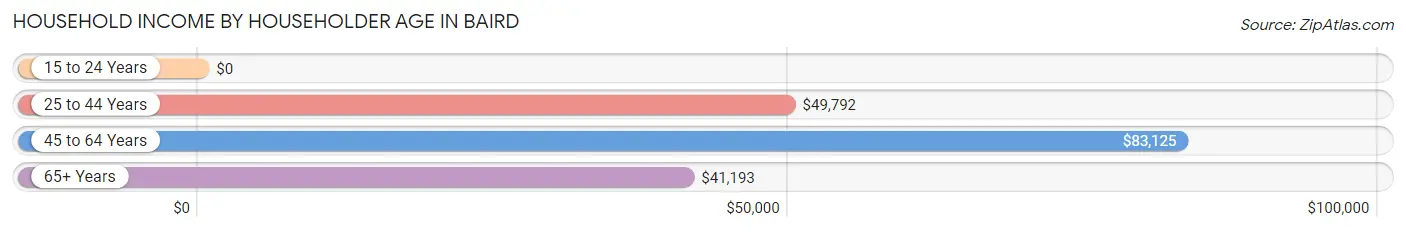
| Income Bracket | # Households | Median Income |
| 15 to 24 Years | 8 (1.3%) | $0 |
| 25 to 44 Years | 182 (28.5%) | $49,792 |
| 45 to 64 Years | 198 (31.0%) | $83,125 |
| 65+ Years | 251 (39.3%) | $41,193 |
| Total | 639 (100.0%) | $49,402 |
Poverty in Baird
Income Below Poverty by Sex and Age in Baird
With 9.2% poverty level for males and 15.1% for females among the residents of Baird, 35 to 44 year old males and 16 and 17 year old females are the most vulnerable to poverty, with 30 males (38.0%) and 3 females (100.0%) in their respective age groups living below the poverty level.
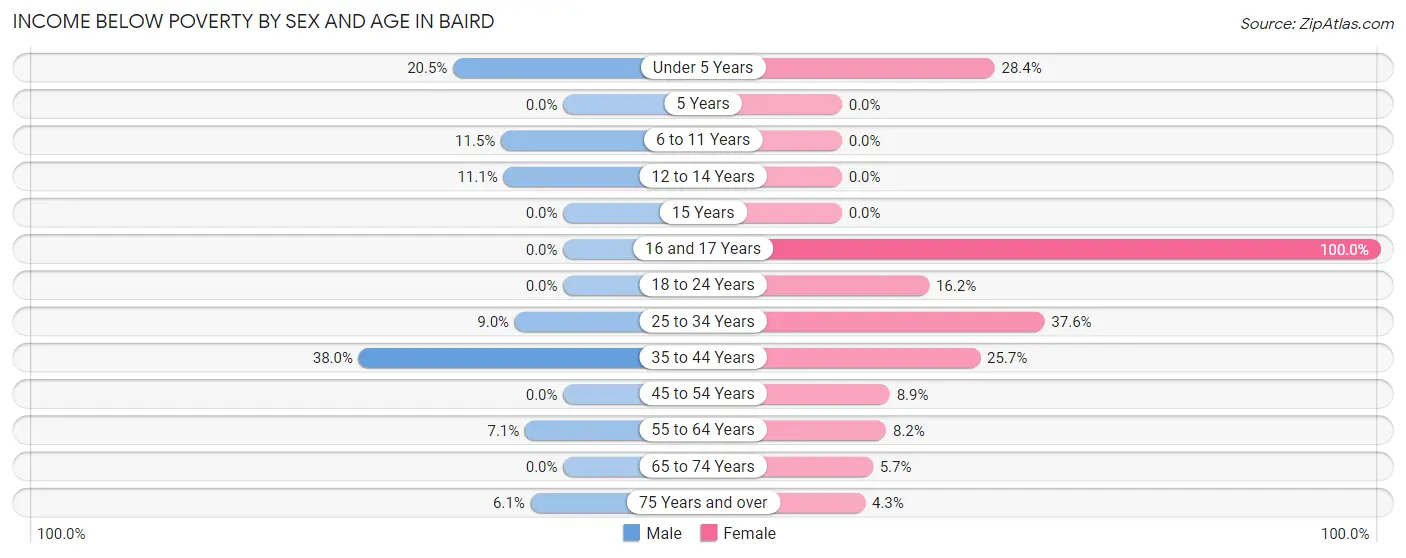
| Age Bracket | Male | Female |
| Under 5 Years | 9 (20.4%) | 19 (28.4%) |
| 5 Years | 0 (0.0%) | 0 (0.0%) |
| 6 to 11 Years | 6 (11.5%) | 0 (0.0%) |
| 12 to 14 Years | 7 (11.1%) | 0 (0.0%) |
| 15 Years | 0 (0.0%) | 0 (0.0%) |
| 16 and 17 Years | 0 (0.0%) | 3 (100.0%) |
| 18 to 24 Years | 0 (0.0%) | 11 (16.2%) |
| 25 to 34 Years | 8 (9.0%) | 41 (37.6%) |
| 35 to 44 Years | 30 (38.0%) | 29 (25.7%) |
| 45 to 54 Years | 0 (0.0%) | 8 (8.9%) |
| 55 to 64 Years | 11 (7.1%) | 11 (8.2%) |
| 65 to 74 Years | 0 (0.0%) | 7 (5.7%) |
| 75 Years and over | 4 (6.1%) | 4 (4.3%) |
| Total | 75 (9.2%) | 133 (15.1%) |
Income Above Poverty by Sex and Age in Baird
According to the poverty statistics in Baird, males aged 5 years and females aged 5 years are the age groups that are most secure financially, with 100.0% of males and 100.0% of females in these age groups living above the poverty line.
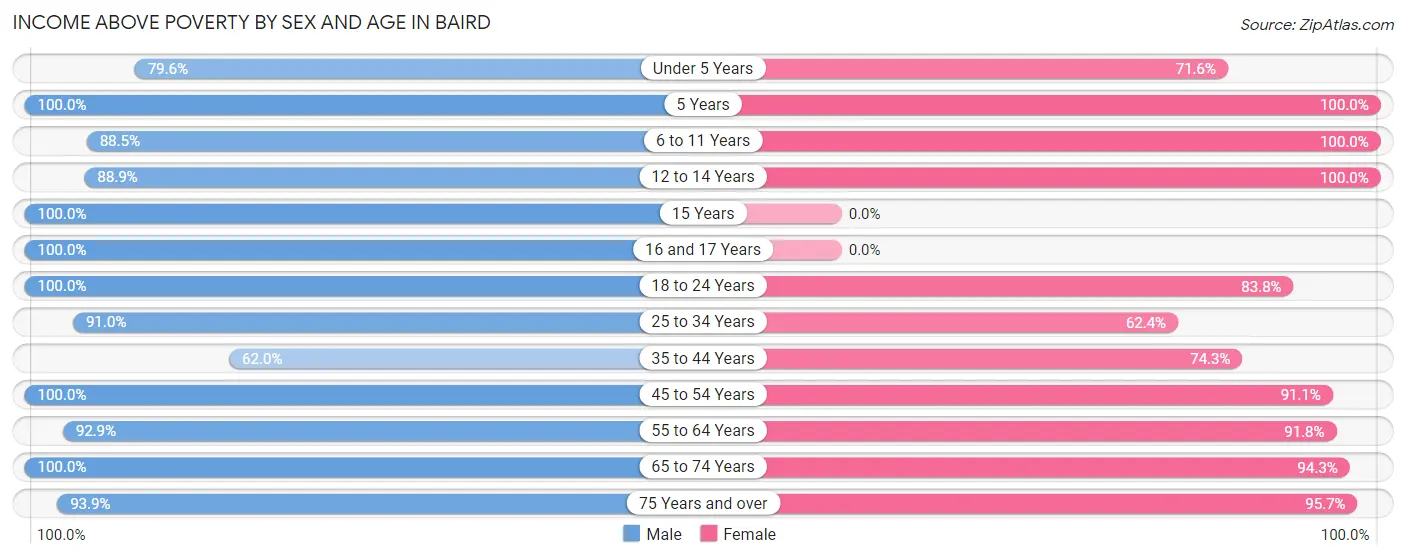
| Age Bracket | Male | Female |
| Under 5 Years | 35 (79.5%) | 48 (71.6%) |
| 5 Years | 24 (100.0%) | 12 (100.0%) |
| 6 to 11 Years | 46 (88.5%) | 31 (100.0%) |
| 12 to 14 Years | 56 (88.9%) | 36 (100.0%) |
| 15 Years | 12 (100.0%) | 0 (0.0%) |
| 16 and 17 Years | 14 (100.0%) | 0 (0.0%) |
| 18 to 24 Years | 18 (100.0%) | 57 (83.8%) |
| 25 to 34 Years | 81 (91.0%) | 68 (62.4%) |
| 35 to 44 Years | 49 (62.0%) | 84 (74.3%) |
| 45 to 54 Years | 78 (100.0%) | 82 (91.1%) |
| 55 to 64 Years | 144 (92.9%) | 123 (91.8%) |
| 65 to 74 Years | 118 (100.0%) | 115 (94.3%) |
| 75 Years and over | 62 (93.9%) | 89 (95.7%) |
| Total | 737 (90.8%) | 745 (84.9%) |
Income Below Poverty Among Married-Couple Families in Baird
The poverty statistics for married-couple families in Baird show that 1.7% or 5 of the total 302 families live below the poverty line. Families with 1 or 2 children have the highest poverty rate of 4.7%, comprising of 5 families. On the other hand, families with no children have the lowest poverty rate of 0.0%, which includes 0 families.
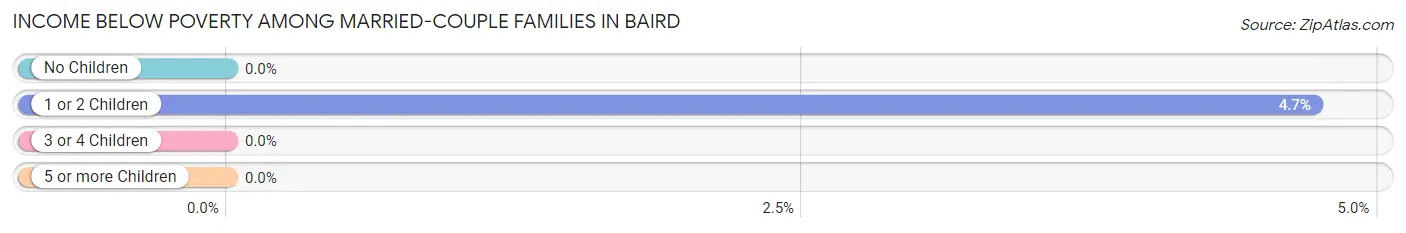
| Children | Above Poverty | Below Poverty |
| No Children | 191 (100.0%) | 0 (0.0%) |
| 1 or 2 Children | 101 (95.3%) | 5 (4.7%) |
| 3 or 4 Children | 0 (0.0%) | 0 (0.0%) |
| 5 or more Children | 5 (100.0%) | 0 (0.0%) |
| Total | 297 (98.3%) | 5 (1.7%) |
Income Below Poverty Among Single-Parent Households in Baird
According to the poverty data in Baird, 13.8% or 4 single-father households and 27.6% or 21 single-mother households are living below the poverty line. Among single-father households, those with 1 or 2 children have the highest poverty rate, with 4 households (23.5%) experiencing poverty. Likewise, among single-mother households, those with 3 or 4 children have the highest poverty rate, with 8 households (100.0%) falling below the poverty line.
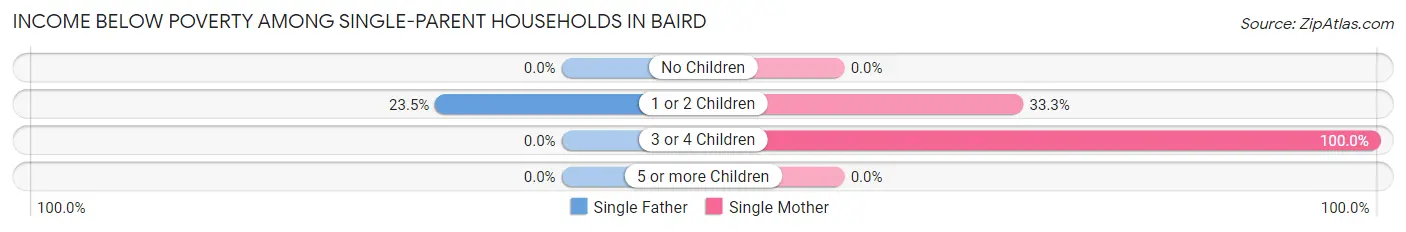
| Children | Single Father | Single Mother |
| No Children | 0 (0.0%) | 0 (0.0%) |
| 1 or 2 Children | 4 (23.5%) | 13 (33.3%) |
| 3 or 4 Children | 0 (0.0%) | 8 (100.0%) |
| 5 or more Children | 0 (0.0%) | 0 (0.0%) |
| Total | 4 (13.8%) | 21 (27.6%) |
Income Below Poverty Among Married-Couple vs Single-Parent Households in Baird
The poverty data for Baird shows that 5 of the married-couple family households (1.7%) and 25 of the single-parent households (23.8%) are living below the poverty level. Within the married-couple family households, those with 1 or 2 children have the highest poverty rate, with 5 households (4.7%) falling below the poverty line. Among the single-parent households, those with 3 or 4 children have the highest poverty rate, with 8 household (100.0%) living below poverty.
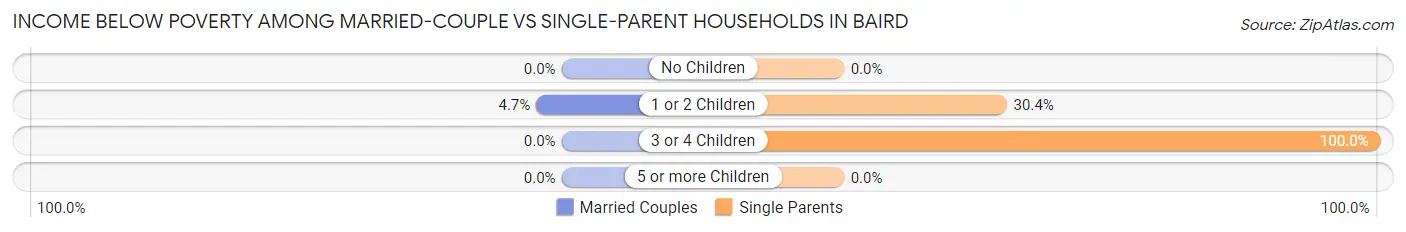
| Children | Married-Couple Families | Single-Parent Households |
| No Children | 0 (0.0%) | 0 (0.0%) |
| 1 or 2 Children | 5 (4.7%) | 17 (30.4%) |
| 3 or 4 Children | 0 (0.0%) | 8 (100.0%) |
| 5 or more Children | 0 (0.0%) | 0 (0.0%) |
| Total | 5 (1.7%) | 25 (23.8%) |
Race in Baird
The most populous races in Baird are White / Caucasian (1,572 | 90.6%), Hispanic or Latino (183 | 10.5%), and Two or more Races (96 | 5.5%).
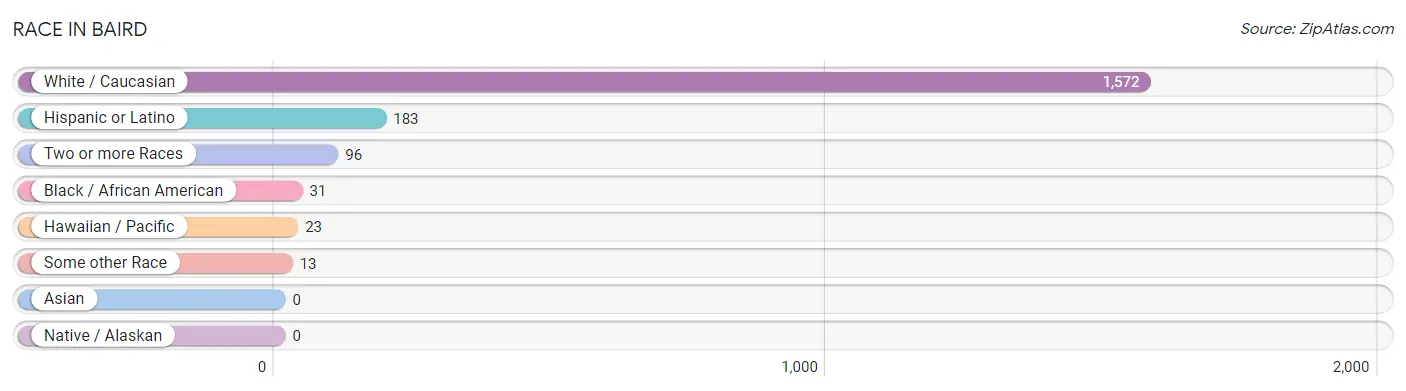
| Race | # Population | % Population |
| Asian | 0 | 0.0% |
| Black / African American | 31 | 1.8% |
| Hawaiian / Pacific | 23 | 1.3% |
| Hispanic or Latino | 183 | 10.5% |
| Native / Alaskan | 0 | 0.0% |
| White / Caucasian | 1,572 | 90.6% |
| Two or more Races | 96 | 5.5% |
| Some other Race | 13 | 0.7% |
| Total | 1,735 | 100.0% |
Ancestry in Baird
The most populous ancestries reported in Baird are European (273 | 15.7%), Irish (200 | 11.5%), English (162 | 9.3%), German (150 | 8.6%), and Mexican (140 | 8.1%), together accounting for 53.3% of all Baird residents.
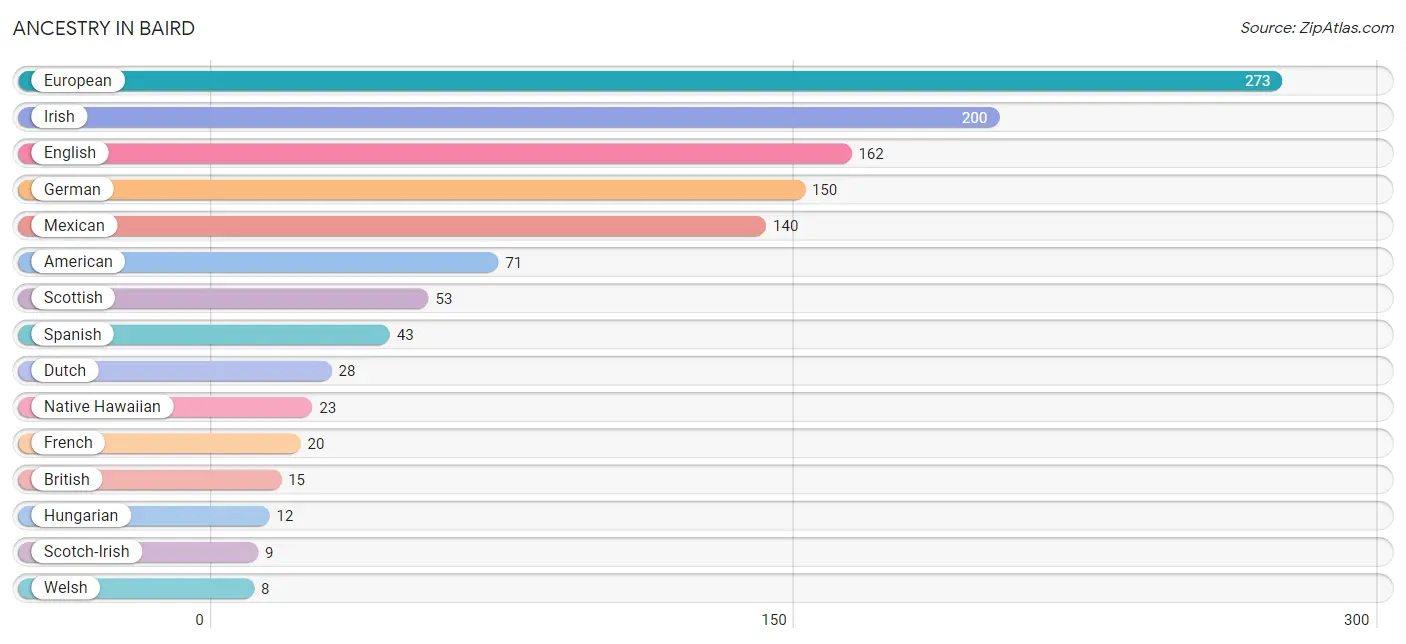
| Ancestry | # Population | % Population |
| American | 71 | 4.1% |
| Blackfeet | 2 | 0.1% |
| British | 15 | 0.9% |
| Czech | 5 | 0.3% |
| Danish | 3 | 0.2% |
| Dutch | 28 | 1.6% |
| Eastern European | 5 | 0.3% |
| English | 162 | 9.3% |
| European | 273 | 15.7% |
| French | 20 | 1.1% |
| German | 150 | 8.6% |
| Hungarian | 12 | 0.7% |
| Irish | 200 | 11.5% |
| Mexican | 140 | 8.1% |
| Native Hawaiian | 23 | 1.3% |
| Scotch-Irish | 9 | 0.5% |
| Scottish | 53 | 3.0% |
| Spanish | 43 | 2.5% |
| Welsh | 8 | 0.5% | View All 19 Rows |
Immigrants in Baird
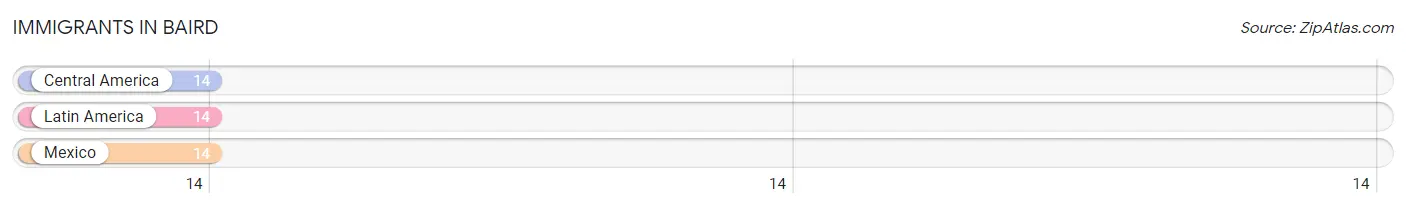
The most numerous immigrant groups reported in Baird came from Central America (14 | 0.8%), Latin America (14 | 0.8%), and Mexico (14 | 0.8%), together accounting for 2.4% of all Baird residents.
| Immigration Origin | # Population | % Population |
| Central America | 14 | 0.8% |
| Latin America | 14 | 0.8% |
| Mexico | 14 | 0.8% | View All 3 Rows |
Sex and Age in Baird
Sex and Age in Baird
The most populous age groups in Baird are 60 to 64 Years (105 | 12.8%) for men and 60 to 64 Years (76 | 8.3%) for women.
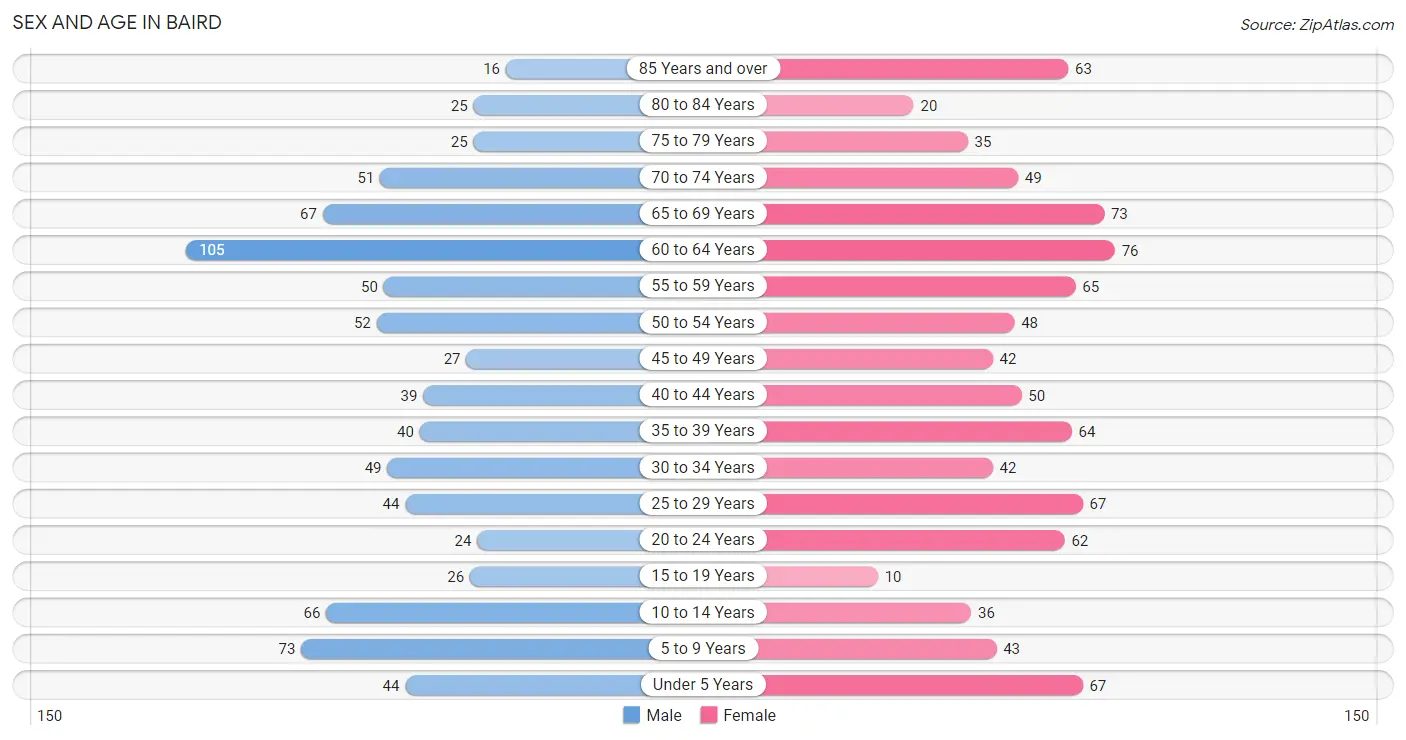
| Age Bracket | Male | Female |
| Under 5 Years | 44 (5.3%) | 67 (7.3%) |
| 5 to 9 Years | 73 (8.9%) | 43 (4.7%) |
| 10 to 14 Years | 66 (8.0%) | 36 (4.0%) |
| 15 to 19 Years | 26 (3.2%) | 10 (1.1%) |
| 20 to 24 Years | 24 (2.9%) | 62 (6.8%) |
| 25 to 29 Years | 44 (5.3%) | 67 (7.3%) |
| 30 to 34 Years | 49 (5.9%) | 42 (4.6%) |
| 35 to 39 Years | 40 (4.9%) | 64 (7.0%) |
| 40 to 44 Years | 39 (4.7%) | 50 (5.5%) |
| 45 to 49 Years | 27 (3.3%) | 42 (4.6%) |
| 50 to 54 Years | 52 (6.3%) | 48 (5.3%) |
| 55 to 59 Years | 50 (6.1%) | 65 (7.1%) |
| 60 to 64 Years | 105 (12.8%) | 76 (8.3%) |
| 65 to 69 Years | 67 (8.1%) | 73 (8.0%) |
| 70 to 74 Years | 51 (6.2%) | 49 (5.4%) |
| 75 to 79 Years | 25 (3.0%) | 35 (3.8%) |
| 80 to 84 Years | 25 (3.0%) | 20 (2.2%) |
| 85 Years and over | 16 (1.9%) | 63 (6.9%) |
| Total | 823 (100.0%) | 912 (100.0%) |
Families and Households in Baird
Median Family Size in Baird
The median family size in Baird is 3.40 persons per family, with single female/mother families (76 | 18.7%) accounting for the largest median family size of 3.76 persons per family. On the other hand, single male/father families (29 | 7.1%) represent the smallest median family size with 3.17 persons per family.
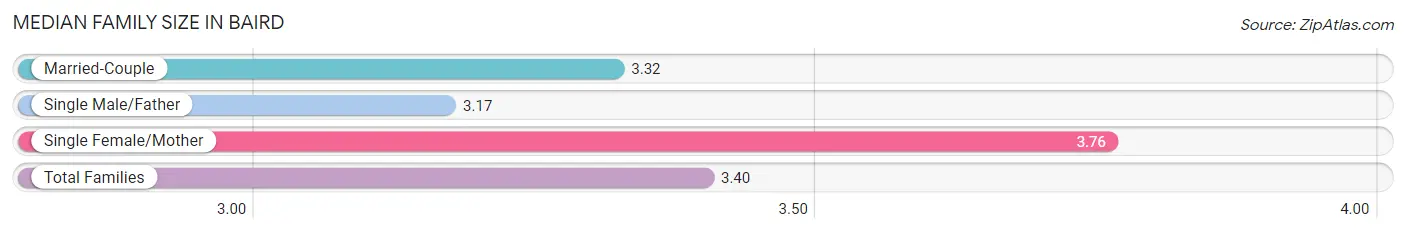
| Family Type | # Families | Family Size |
| Married-Couple | 302 (74.2%) | 3.32 |
| Single Male/Father | 29 (7.1%) | 3.17 |
| Single Female/Mother | 76 (18.7%) | 3.76 |
| Total Families | 407 (100.0%) | 3.40 |
Median Household Size in Baird
The median household size in Baird is 2.64 persons per household, with single female/mother households (76 | 11.9%) accounting for the largest median household size of 4.08 persons per household. non-family households (232 | 36.3%) represent the smallest median household size with 1.16 persons per household.
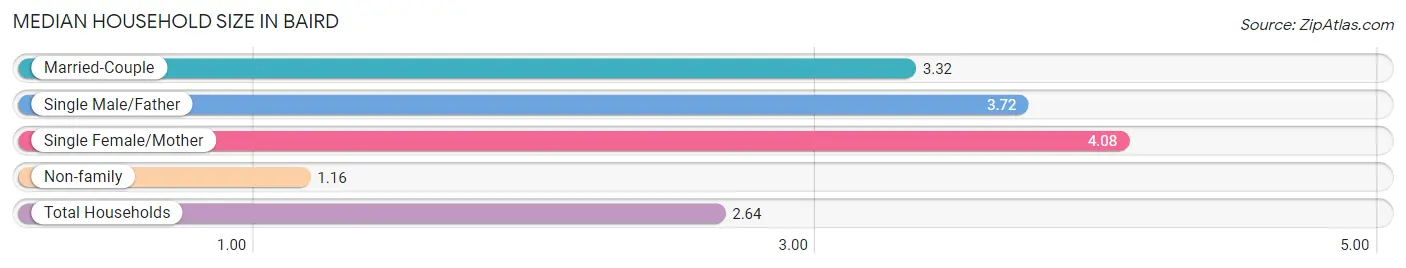
| Household Type | # Households | Household Size |
| Married-Couple | 302 (47.3%) | 3.32 |
| Single Male/Father | 29 (4.5%) | 3.72 |
| Single Female/Mother | 76 (11.9%) | 4.08 |
| Non-family | 232 (36.3%) | 1.16 |
| Total Households | 639 (100.0%) | 2.64 |
Household Size by Marriage Status in Baird
Out of a total of 639 households in Baird, 407 (63.7%) are family households, while 232 (36.3%) are nonfamily households. The most numerous type of family households are 2-person households, comprising 196, and the most common type of nonfamily households are 1-person households, comprising 194.
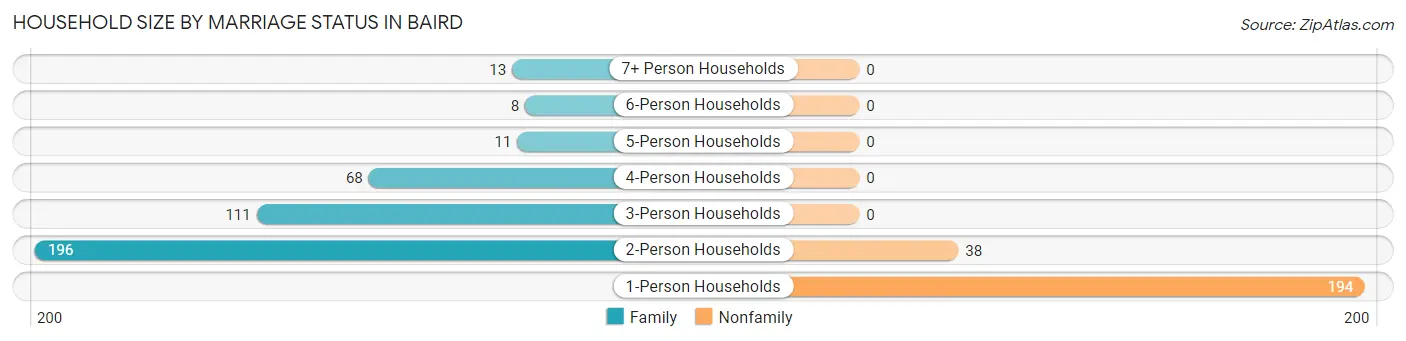
| Household Size | Family Households | Nonfamily Households |
| 1-Person Households | - | 194 (30.4%) |
| 2-Person Households | 196 (30.7%) | 38 (5.9%) |
| 3-Person Households | 111 (17.4%) | 0 (0.0%) |
| 4-Person Households | 68 (10.6%) | 0 (0.0%) |
| 5-Person Households | 11 (1.7%) | 0 (0.0%) |
| 6-Person Households | 8 (1.3%) | 0 (0.0%) |
| 7+ Person Households | 13 (2.0%) | 0 (0.0%) |
| Total | 407 (63.7%) | 232 (36.3%) |
Female Fertility in Baird
Fertility by Age in Baird
Average fertility rate in Baird is 72.0 births per 1,000 women. Women in the age bracket of 20 to 34 years have the highest fertility rate with 140.0 births per 1,000 women. Women in the age bracket of 20 to 34 years acount for 96.0% of all women with births.
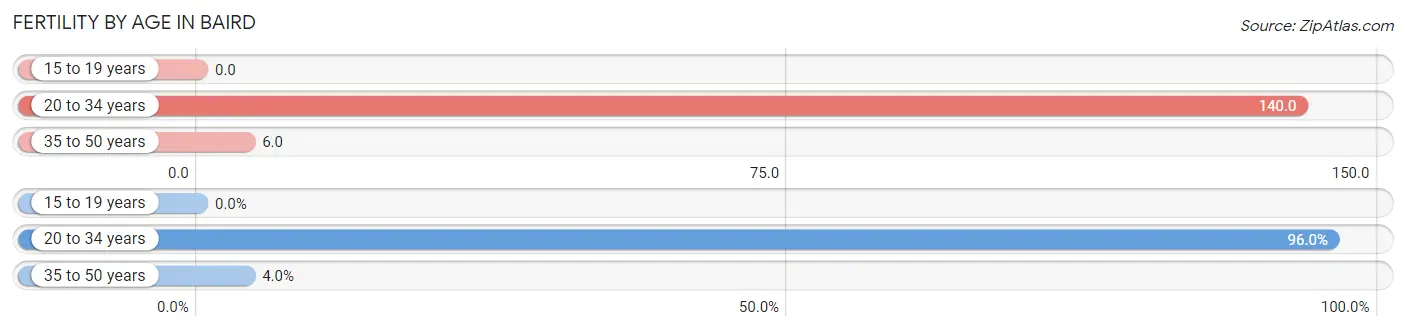
| Age Bracket | Women with Births | Births / 1,000 Women |
| 15 to 19 years | 0 (0.0%) | 0.0 |
| 20 to 34 years | 24 (96.0%) | 140.0 |
| 35 to 50 years | 1 (4.0%) | 6.0 |
| Total | 25 (100.0%) | 72.0 |
Fertility by Age by Marriage Status in Baird
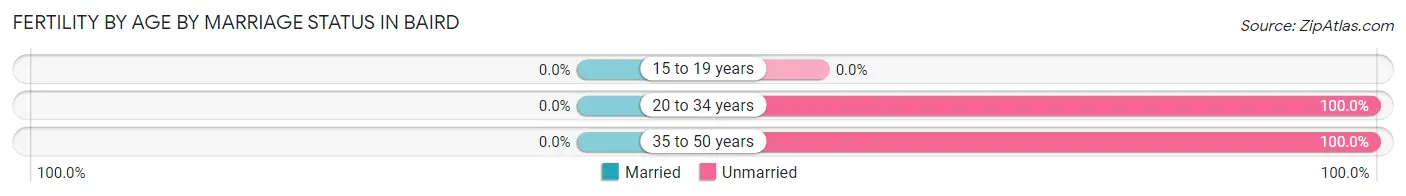
| Age Bracket | Married | Unmarried |
| 15 to 19 years | 0 (0.0%) | 0 (0.0%) |
| 20 to 34 years | 0 (0.0%) | 24 (100.0%) |
| 35 to 50 years | 0 (0.0%) | 1 (100.0%) |
| Total | 0 (0.0%) | 25 (100.0%) |
Fertility by Education in Baird
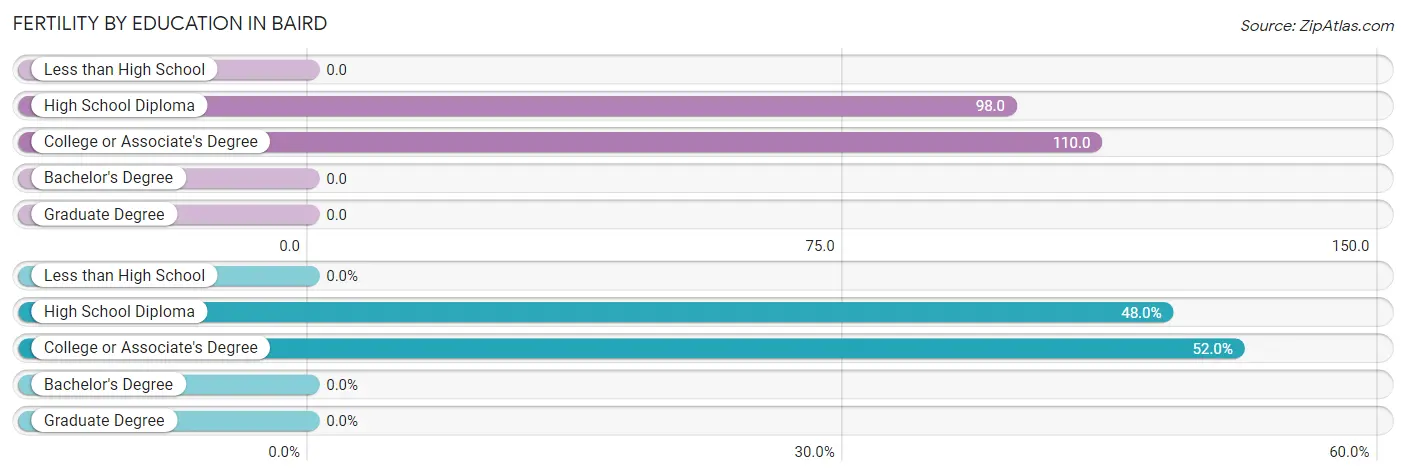
| Educational Attainment | Women with Births | Births / 1,000 Women |
| Less than High School | 0 (0.0%) | 0.0 |
| High School Diploma | 12 (48.0%) | 98.0 |
| College or Associate's Degree | 13 (52.0%) | 110.0 |
| Bachelor's Degree | 0 (0.0%) | 0.0 |
| Graduate Degree | 0 (0.0%) | 0.0 |
| Total | 25 (100.0%) | 72.0 |
Fertility by Education by Marriage Status in Baird
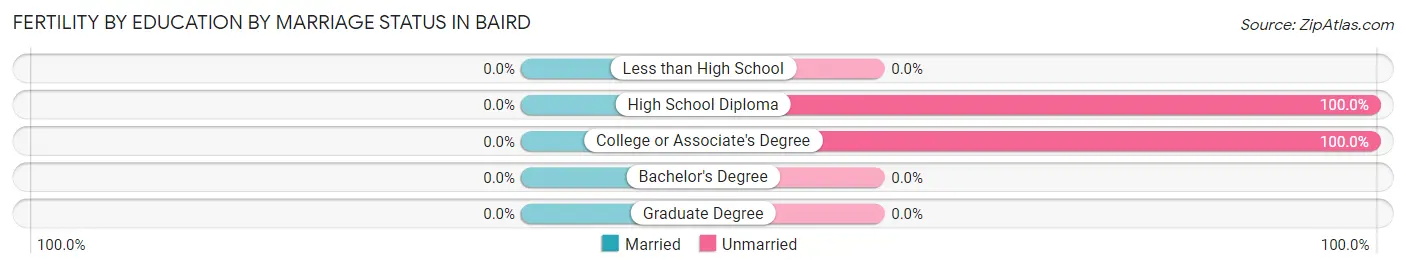
| Educational Attainment | Married | Unmarried |
| Less than High School | 0 (0.0%) | 0 (0.0%) |
| High School Diploma | 0 (0.0%) | 12 (100.0%) |
| College or Associate's Degree | 0 (0.0%) | 13 (100.0%) |
| Bachelor's Degree | 0 (0.0%) | 0 (0.0%) |
| Graduate Degree | 0 (0.0%) | 0 (0.0%) |
| Total | 0 (0.0%) | 25 (100.0%) |
Employment Characteristics in Baird
Employment by Class of Employer in Baird
Among the 790 employed individuals in Baird, private company employees (410 | 51.9%), self-employed (not incorporated) (125 | 15.8%), and local government employees (115 | 14.6%) make up the most common classes of employment.
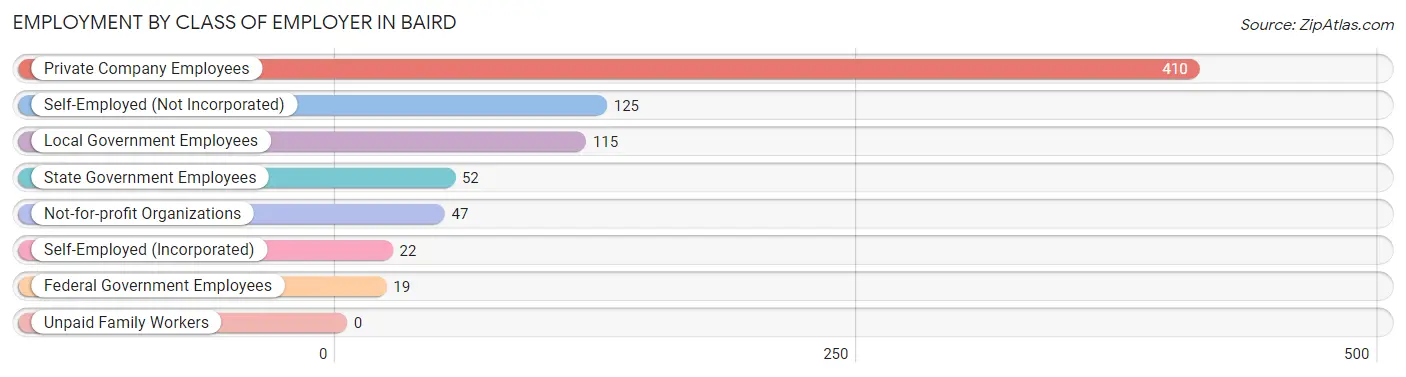
| Employer Class | # Employees | % Employees |
| Private Company Employees | 410 | 51.9% |
| Self-Employed (Incorporated) | 22 | 2.8% |
| Self-Employed (Not Incorporated) | 125 | 15.8% |
| Not-for-profit Organizations | 47 | 5.9% |
| Local Government Employees | 115 | 14.6% |
| State Government Employees | 52 | 6.6% |
| Federal Government Employees | 19 | 2.4% |
| Unpaid Family Workers | 0 | 0.0% |
| Total | 790 | 100.0% |
Employment Status by Age in Baird
According to the labor force statistics for Baird, out of the total population over 16 years of age (1,394), 61.6% or 859 individuals are in the labor force, with 6.9% or 59 of them unemployed. The age group with the highest labor force participation rate is 30 to 34 years, with 97.8% or 89 individuals in the labor force. Within the labor force, the 25 to 29 years age range has the highest percentage of unemployed individuals, with 40.0% or 32 of them being unemployed.
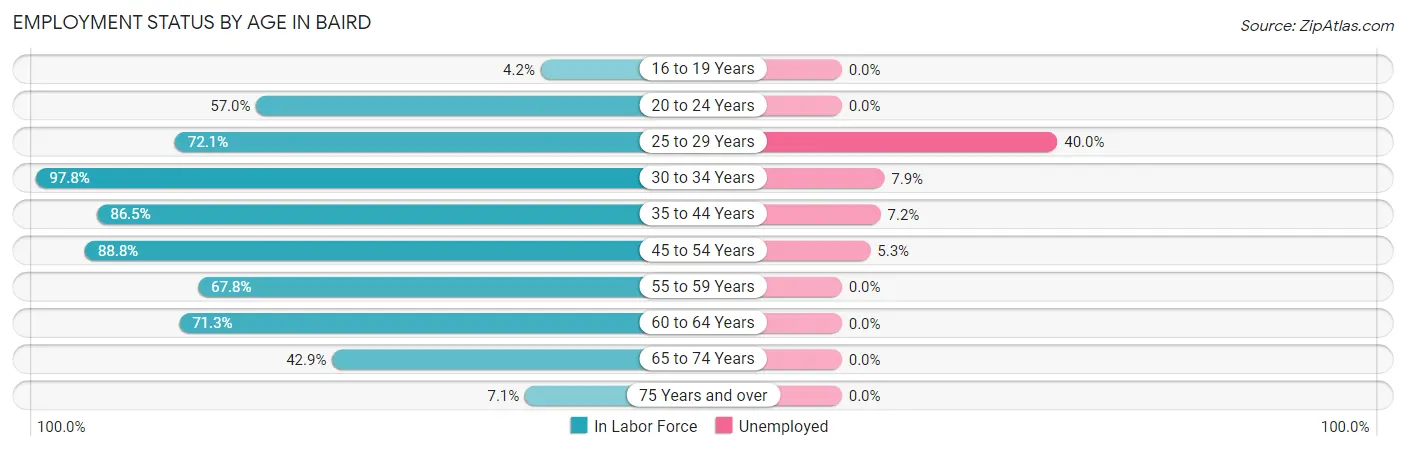
| Age Bracket | In Labor Force | Unemployed |
| 16 to 19 Years | 1 (4.2%) | 0 (0.0%) |
| 20 to 24 Years | 49 (57.0%) | 0 (0.0%) |
| 25 to 29 Years | 80 (72.1%) | 32 (40.0%) |
| 30 to 34 Years | 89 (97.8%) | 7 (7.9%) |
| 35 to 44 Years | 167 (86.5%) | 12 (7.2%) |
| 45 to 54 Years | 150 (88.8%) | 8 (5.3%) |
| 55 to 59 Years | 78 (67.8%) | 0 (0.0%) |
| 60 to 64 Years | 129 (71.3%) | 0 (0.0%) |
| 65 to 74 Years | 103 (42.9%) | 0 (0.0%) |
| 75 Years and over | 13 (7.1%) | 0 (0.0%) |
| Total | 859 (61.6%) | 59 (6.9%) |
Employment Status by Educational Attainment in Baird
According to labor force statistics for Baird, 80.6% of individuals (693) out of the total population between 25 and 64 years of age (860) are in the labor force, with 8.5% or 59 of them being unemployed. The group with the highest labor force participation rate are those with the educational attainment of college / associate degree, with 90.8% or 266 individuals in the labor force. Within the labor force, individuals with less than high school education have the highest percentage of unemployment, with 20.9% or 18 of them being unemployed.
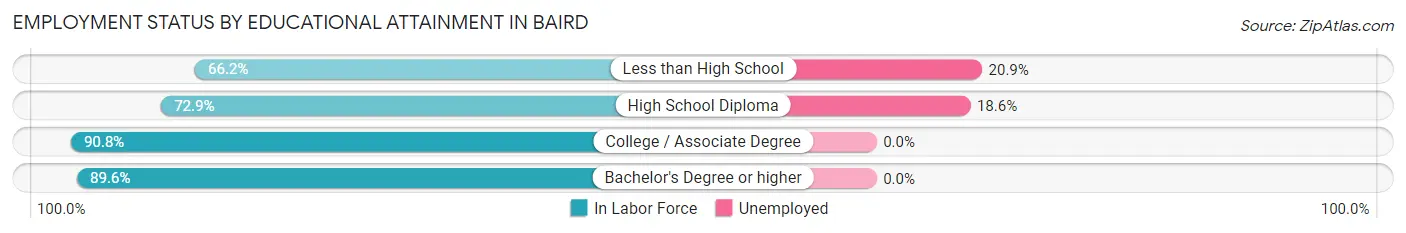
| Educational Attainment | In Labor Force | Unemployed |
| Less than High School | 86 (66.2%) | 27 (20.9%) |
| High School Diploma | 221 (72.9%) | 56 (18.6%) |
| College / Associate Degree | 266 (90.8%) | 0 (0.0%) |
| Bachelor's Degree or higher | 120 (89.6%) | 0 (0.0%) |
| Total | 693 (80.6%) | 73 (8.5%) |
Employment Occupations by Sex in Baird
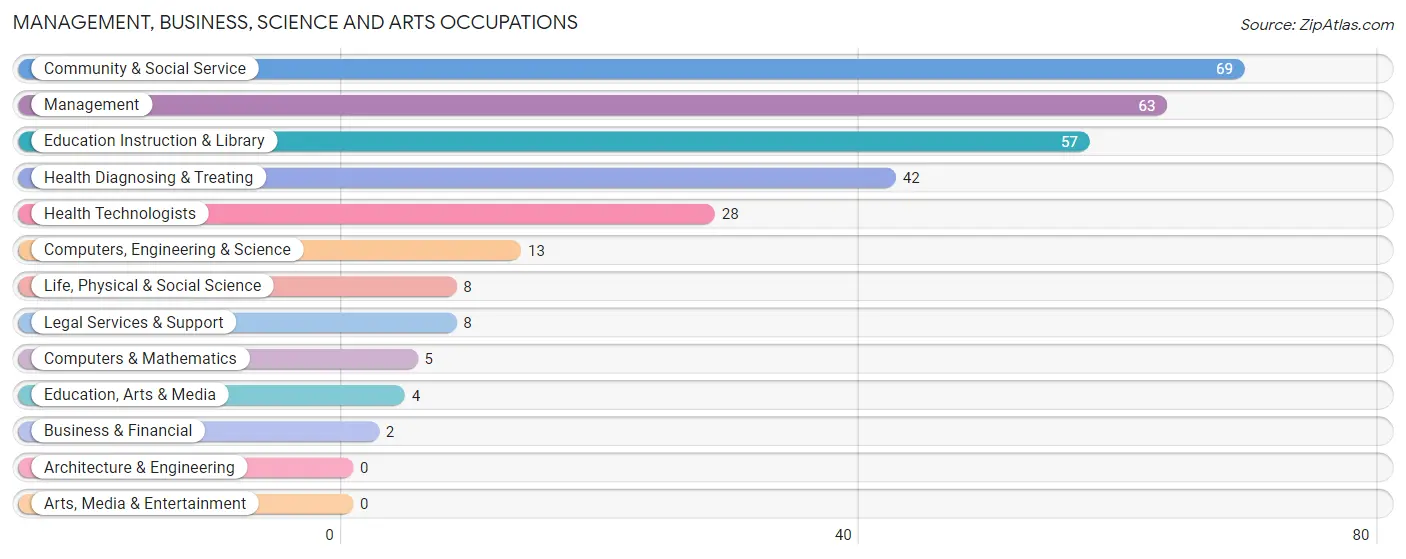
Management, Business, Science and Arts Occupations
The most common Management, Business, Science and Arts occupations in Baird are Community & Social Service (69 | 8.6%), Management (63 | 7.9%), Education Instruction & Library (57 | 7.1%), Health Diagnosing & Treating (42 | 5.2%), and Health Technologists (28 | 3.5%).
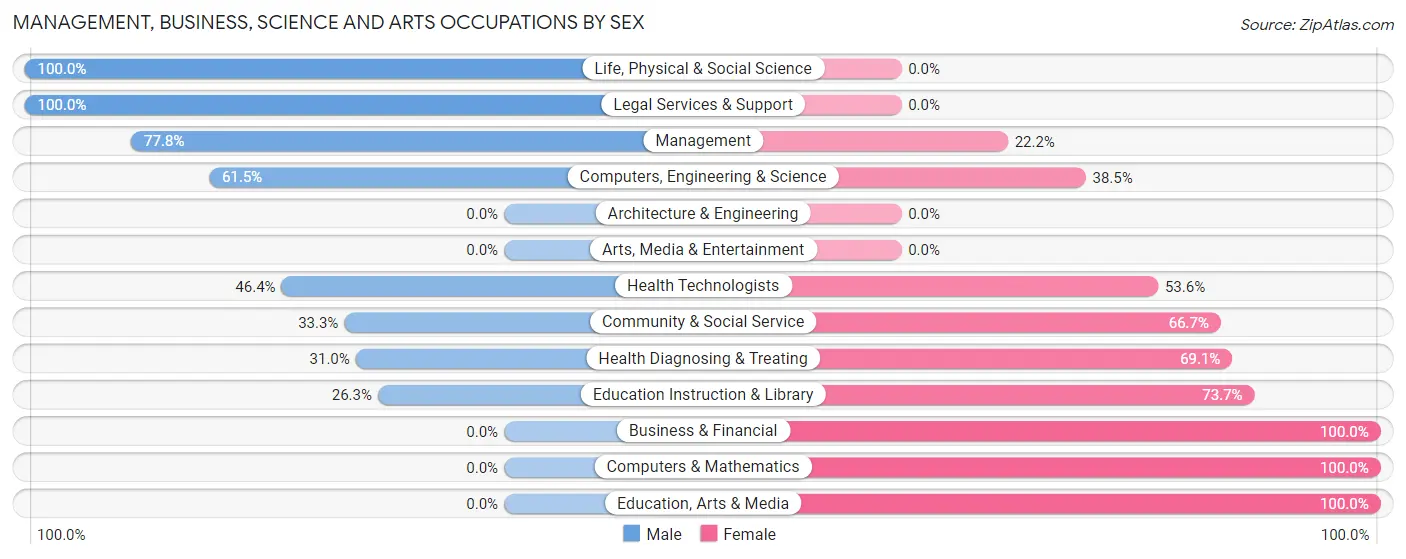
Management, Business, Science and Arts Occupations by Sex
Within the Management, Business, Science and Arts occupations in Baird, the most male-oriented occupations are Life, Physical & Social Science (100.0%), Legal Services & Support (100.0%), and Management (77.8%), while the most female-oriented occupations are Business & Financial (100.0%), Computers & Mathematics (100.0%), and Education, Arts & Media (100.0%).
| Occupation | Male | Female |
| Management | 49 (77.8%) | 14 (22.2%) |
| Business & Financial | 0 (0.0%) | 2 (100.0%) |
| Computers, Engineering & Science | 8 (61.5%) | 5 (38.5%) |
| Computers & Mathematics | 0 (0.0%) | 5 (100.0%) |
| Architecture & Engineering | 0 (0.0%) | 0 (0.0%) |
| Life, Physical & Social Science | 8 (100.0%) | 0 (0.0%) |
| Community & Social Service | 23 (33.3%) | 46 (66.7%) |
| Education, Arts & Media | 0 (0.0%) | 4 (100.0%) |
| Legal Services & Support | 8 (100.0%) | 0 (0.0%) |
| Education Instruction & Library | 15 (26.3%) | 42 (73.7%) |
| Arts, Media & Entertainment | 0 (0.0%) | 0 (0.0%) |
| Health Diagnosing & Treating | 13 (30.9%) | 29 (69.1%) |
| Health Technologists | 13 (46.4%) | 15 (53.6%) |
| Total (Category) | 93 (49.2%) | 96 (50.8%) |
| Total (Overall) | 388 (48.5%) | 412 (51.5%) |
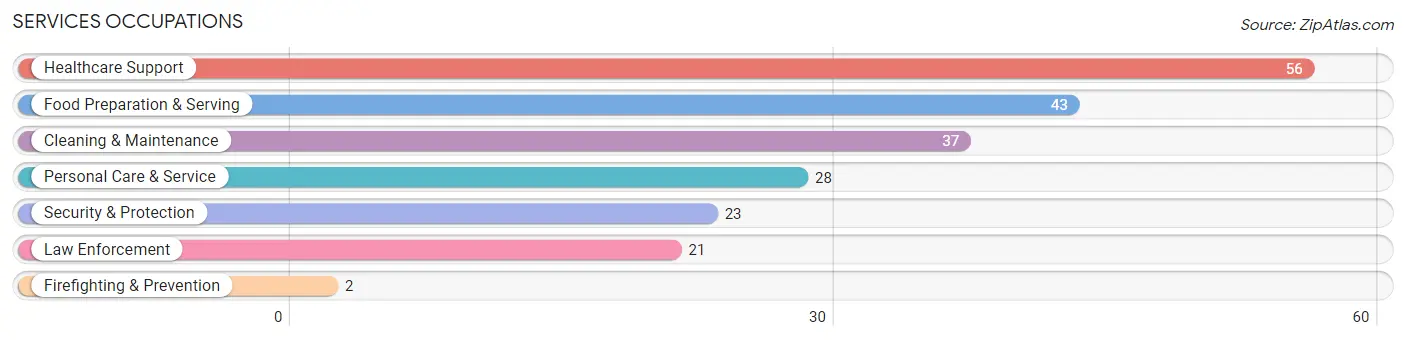
Services Occupations
The most common Services occupations in Baird are Healthcare Support (56 | 7.0%), Food Preparation & Serving (43 | 5.4%), Cleaning & Maintenance (37 | 4.6%), Personal Care & Service (28 | 3.5%), and Security & Protection (23 | 2.9%).
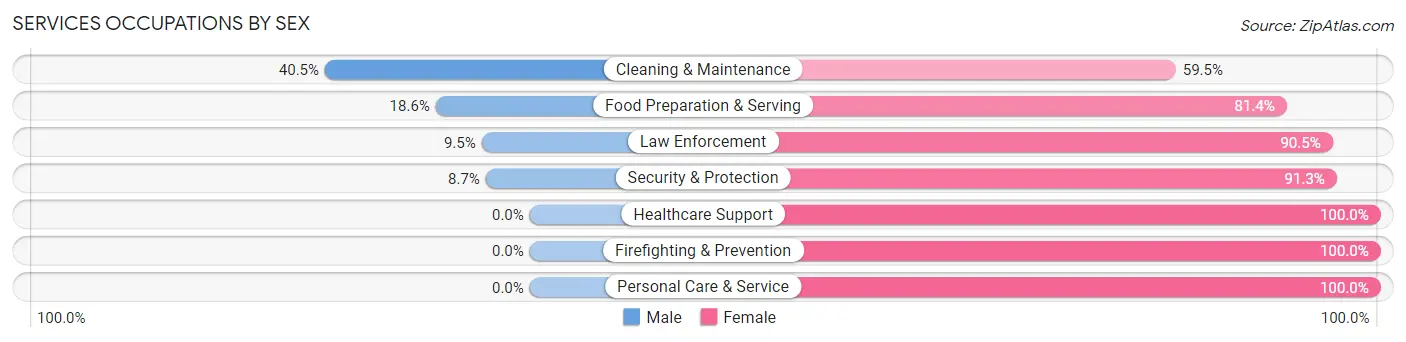
Services Occupations by Sex
Within the Services occupations in Baird, the most male-oriented occupations are Cleaning & Maintenance (40.5%), Food Preparation & Serving (18.6%), and Law Enforcement (9.5%), while the most female-oriented occupations are Healthcare Support (100.0%), Firefighting & Prevention (100.0%), and Personal Care & Service (100.0%).
| Occupation | Male | Female |
| Healthcare Support | 0 (0.0%) | 56 (100.0%) |
| Security & Protection | 2 (8.7%) | 21 (91.3%) |
| Firefighting & Prevention | 0 (0.0%) | 2 (100.0%) |
| Law Enforcement | 2 (9.5%) | 19 (90.5%) |
| Food Preparation & Serving | 8 (18.6%) | 35 (81.4%) |
| Cleaning & Maintenance | 15 (40.5%) | 22 (59.5%) |
| Personal Care & Service | 0 (0.0%) | 28 (100.0%) |
| Total (Category) | 25 (13.4%) | 162 (86.6%) |
| Total (Overall) | 388 (48.5%) | 412 (51.5%) |
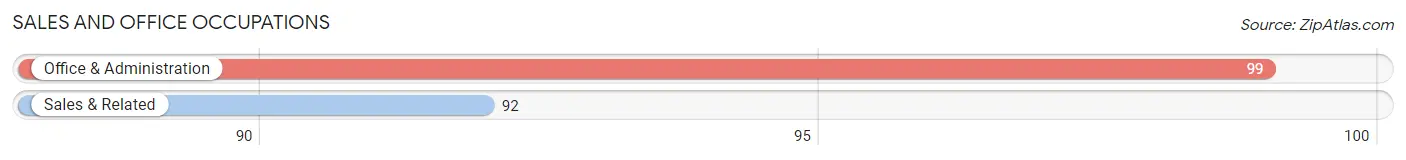
Sales and Office Occupations
The most common Sales and Office occupations in Baird are Office & Administration (99 | 12.4%), and Sales & Related (92 | 11.5%).
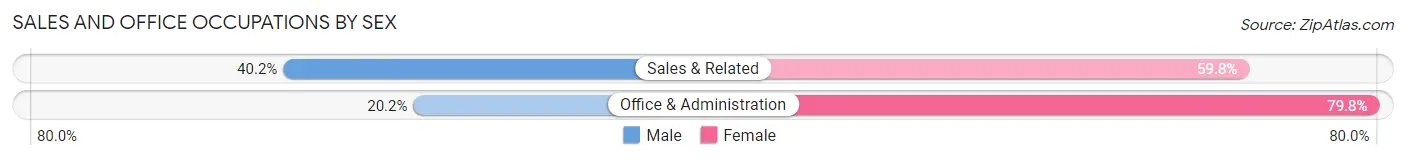
Sales and Office Occupations by Sex
| Occupation | Male | Female |
| Sales & Related | 37 (40.2%) | 55 (59.8%) |
| Office & Administration | 20 (20.2%) | 79 (79.8%) |
| Total (Category) | 57 (29.8%) | 134 (70.2%) |
| Total (Overall) | 388 (48.5%) | 412 (51.5%) |
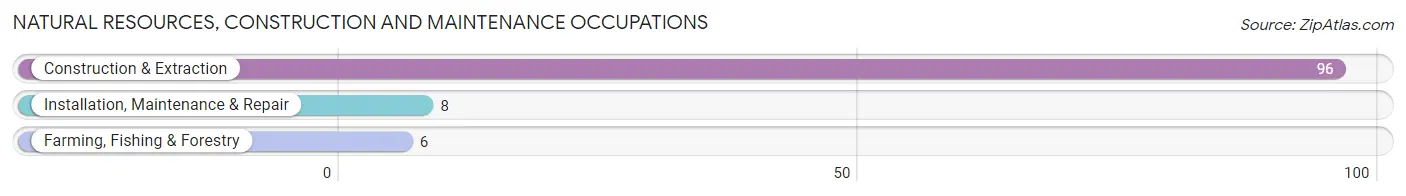
Natural Resources, Construction and Maintenance Occupations
The most common Natural Resources, Construction and Maintenance occupations in Baird are Construction & Extraction (96 | 12.0%), Installation, Maintenance & Repair (8 | 1.0%), and Farming, Fishing & Forestry (6 | 0.7%).
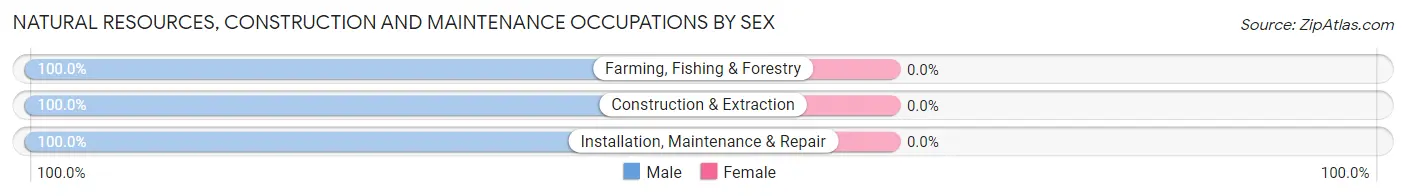
Natural Resources, Construction and Maintenance Occupations by Sex
| Occupation | Male | Female |
| Farming, Fishing & Forestry | 6 (100.0%) | 0 (0.0%) |
| Construction & Extraction | 96 (100.0%) | 0 (0.0%) |
| Installation, Maintenance & Repair | 8 (100.0%) | 0 (0.0%) |
| Total (Category) | 110 (100.0%) | 0 (0.0%) |
| Total (Overall) | 388 (48.5%) | 412 (51.5%) |
Production, Transportation and Moving Occupations
The most common Production, Transportation and Moving occupations in Baird are Transportation (68 | 8.5%), Material Moving (46 | 5.8%), and Production (9 | 1.1%).
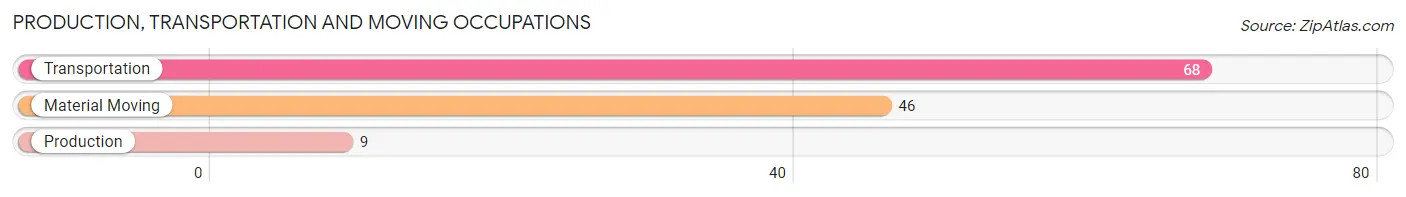
Production, Transportation and Moving Occupations by Sex
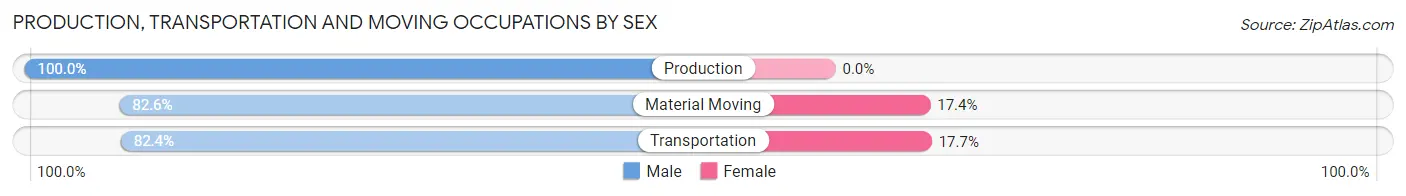
| Occupation | Male | Female |
| Production | 9 (100.0%) | 0 (0.0%) |
| Transportation | 56 (82.4%) | 12 (17.6%) |
| Material Moving | 38 (82.6%) | 8 (17.4%) |
| Total (Category) | 103 (83.7%) | 20 (16.3%) |
| Total (Overall) | 388 (48.5%) | 412 (51.5%) |
Employment Industries by Sex in Baird
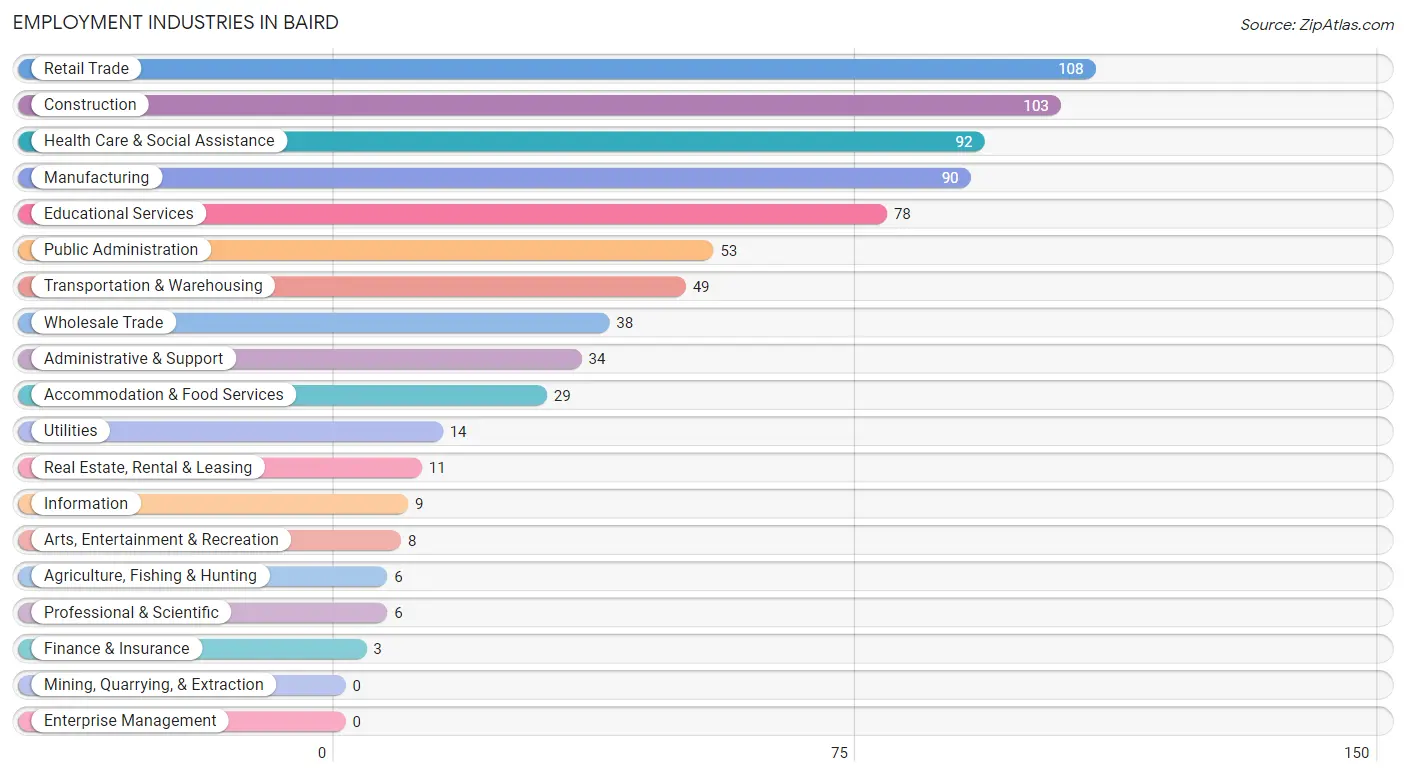
Employment Industries in Baird
The major employment industries in Baird include Retail Trade (108 | 13.5%), Construction (103 | 12.9%), Health Care & Social Assistance (92 | 11.5%), Manufacturing (90 | 11.3%), and Educational Services (78 | 9.8%).
Employment Industries by Sex in Baird
The Baird industries that see more men than women are Agriculture, Fishing & Hunting (100.0%), Construction (100.0%), and Transportation & Warehousing (100.0%), whereas the industries that tend to have a higher number of women are Information (100.0%), Finance & Insurance (100.0%), and Professional & Scientific (100.0%).
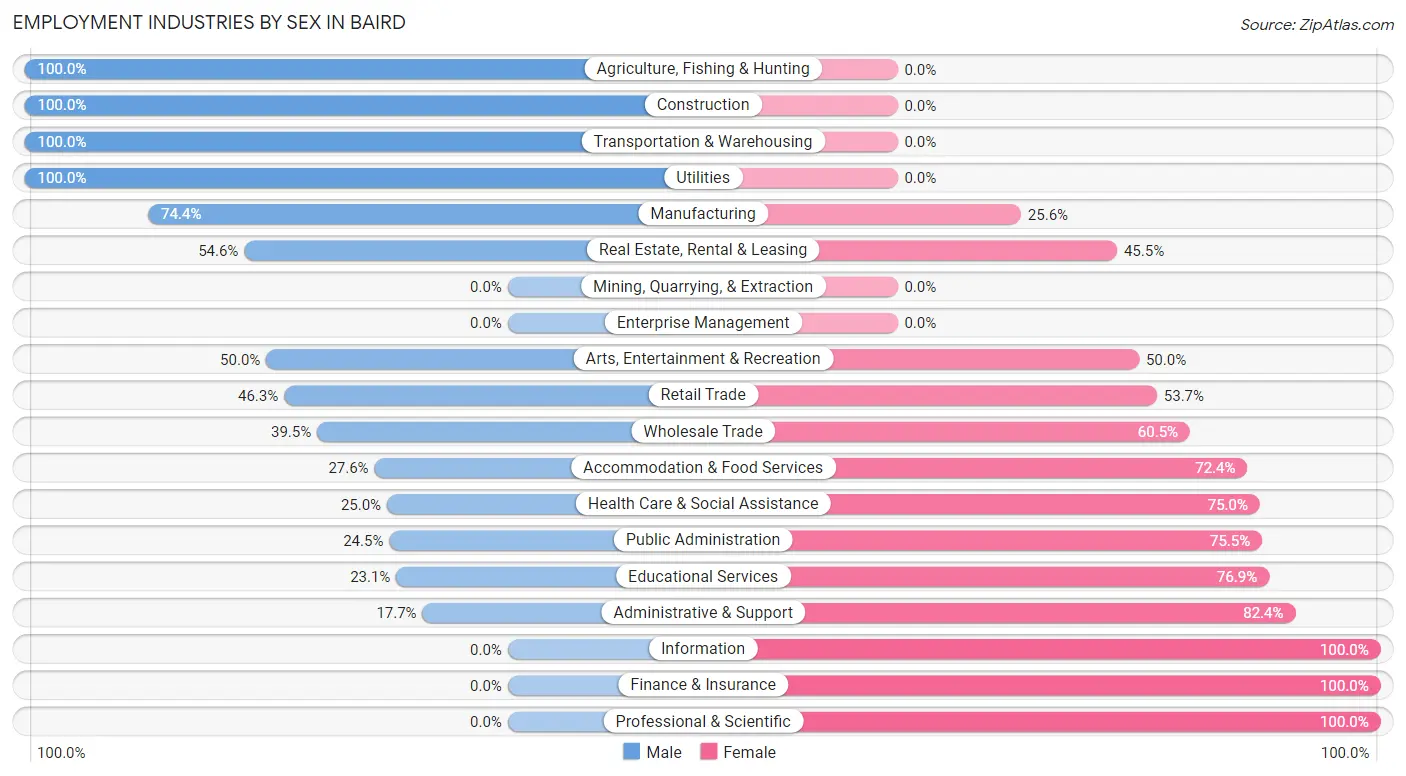
| Industry | Male | Female |
| Agriculture, Fishing & Hunting | 6 (100.0%) | 0 (0.0%) |
| Mining, Quarrying, & Extraction | 0 (0.0%) | 0 (0.0%) |
| Construction | 103 (100.0%) | 0 (0.0%) |
| Manufacturing | 67 (74.4%) | 23 (25.6%) |
| Wholesale Trade | 15 (39.5%) | 23 (60.5%) |
| Retail Trade | 50 (46.3%) | 58 (53.7%) |
| Transportation & Warehousing | 49 (100.0%) | 0 (0.0%) |
| Utilities | 14 (100.0%) | 0 (0.0%) |
| Information | 0 (0.0%) | 9 (100.0%) |
| Finance & Insurance | 0 (0.0%) | 3 (100.0%) |
| Real Estate, Rental & Leasing | 6 (54.5%) | 5 (45.5%) |
| Professional & Scientific | 0 (0.0%) | 6 (100.0%) |
| Enterprise Management | 0 (0.0%) | 0 (0.0%) |
| Administrative & Support | 6 (17.6%) | 28 (82.4%) |
| Educational Services | 18 (23.1%) | 60 (76.9%) |
| Health Care & Social Assistance | 23 (25.0%) | 69 (75.0%) |
| Arts, Entertainment & Recreation | 4 (50.0%) | 4 (50.0%) |
| Accommodation & Food Services | 8 (27.6%) | 21 (72.4%) |
| Public Administration | 13 (24.5%) | 40 (75.5%) |
| Total | 388 (48.5%) | 412 (51.5%) |
Education in Baird
School Enrollment in Baird
The most common levels of schooling among the 320 students in Baird are high school (78 | 24.4%), elementary school (75 | 23.4%), and nursery / preschool (60 | 18.8%).
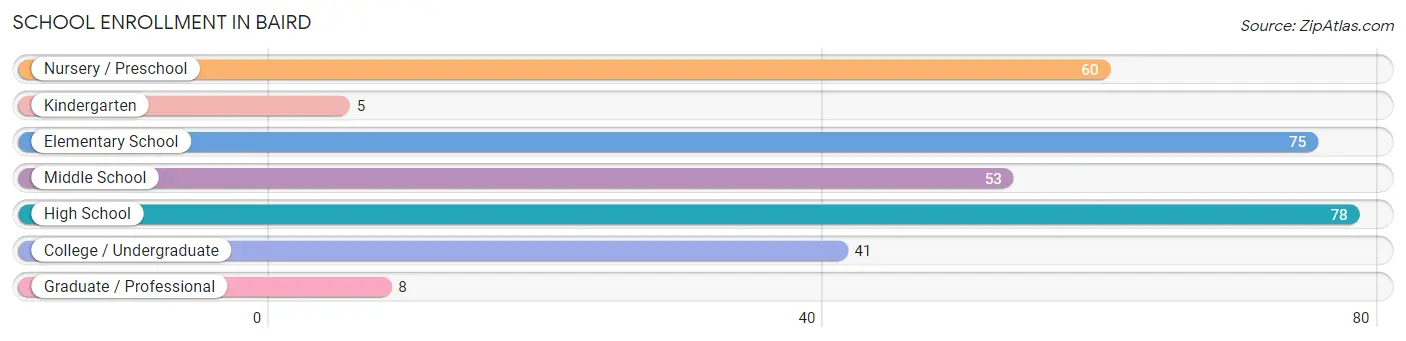
| School Level | # Students | % Students |
| Nursery / Preschool | 60 | 18.8% |
| Kindergarten | 5 | 1.6% |
| Elementary School | 75 | 23.4% |
| Middle School | 53 | 16.6% |
| High School | 78 | 24.4% |
| College / Undergraduate | 41 | 12.8% |
| Graduate / Professional | 8 | 2.5% |
| Total | 320 | 100.0% |
School Enrollment by Age by Funding Source in Baird
Out of a total of 320 students who are enrolled in schools in Baird, 13 (4.1%) attend a private institution, while the remaining 307 (95.9%) are enrolled in public schools. The age group of 15 to 17 year olds has the highest likelihood of being enrolled in private schools, with 10 (34.5% in the age bracket) enrolled. Conversely, the age group of 3 to 4 year olds has the lowest likelihood of being enrolled in a private school, with 34 (100.0% in the age bracket) attending a public institution.
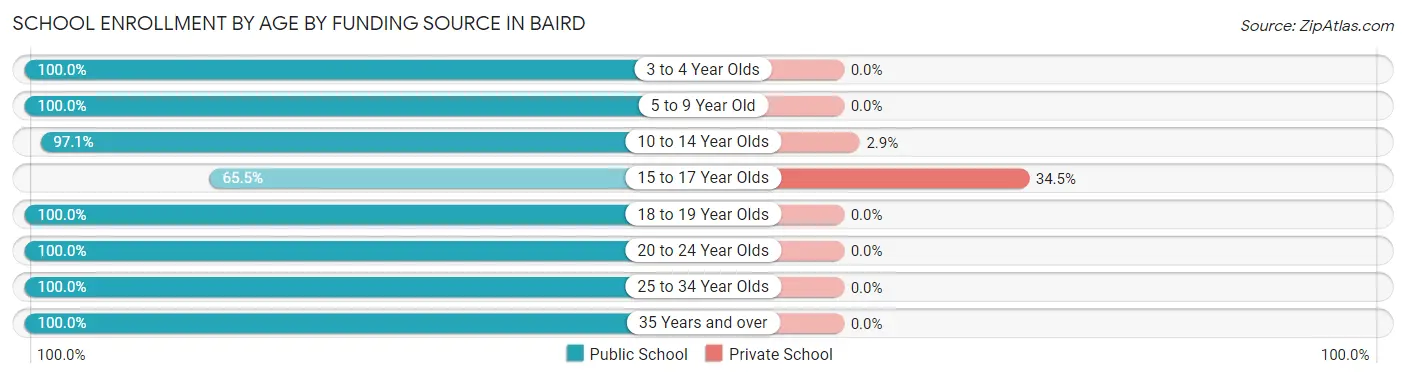
| Age Bracket | Public School | Private School |
| 3 to 4 Year Olds | 34 (100.0%) | 0 (0.0%) |
| 5 to 9 Year Old | 106 (100.0%) | 0 (0.0%) |
| 10 to 14 Year Olds | 99 (97.1%) | 3 (2.9%) |
| 15 to 17 Year Olds | 19 (65.5%) | 10 (34.5%) |
| 18 to 19 Year Olds | 6 (100.0%) | 0 (0.0%) |
| 20 to 24 Year Olds | 30 (100.0%) | 0 (0.0%) |
| 25 to 34 Year Olds | 5 (100.0%) | 0 (0.0%) |
| 35 Years and over | 8 (100.0%) | 0 (0.0%) |
| Total | 307 (95.9%) | 13 (4.1%) |
Educational Attainment by Field of Study in Baird
Education (73 | 38.6%), business (41 | 21.7%), liberal arts & history (24 | 12.7%), science & technology (23 | 12.2%), and arts & humanities (16 | 8.5%) are the most common fields of study among 189 individuals in Baird who have obtained a bachelor's degree or higher.
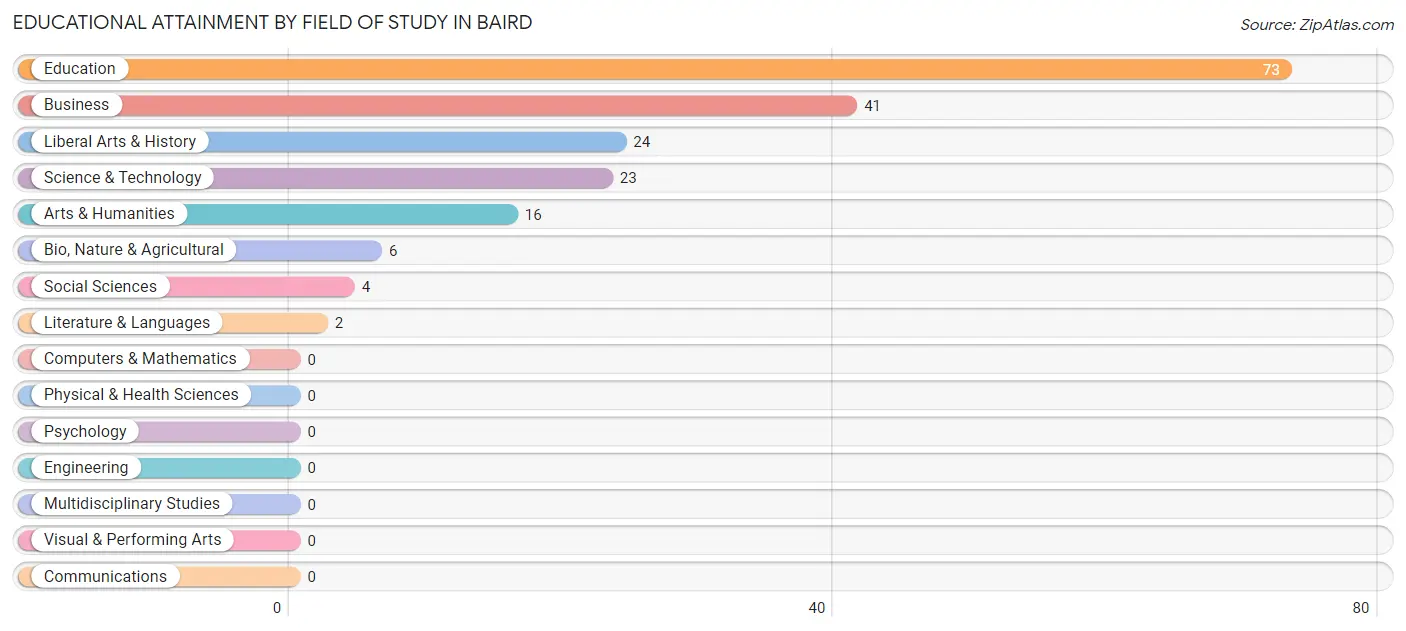
| Field of Study | # Graduates | % Graduates |
| Computers & Mathematics | 0 | 0.0% |
| Bio, Nature & Agricultural | 6 | 3.2% |
| Physical & Health Sciences | 0 | 0.0% |
| Psychology | 0 | 0.0% |
| Social Sciences | 4 | 2.1% |
| Engineering | 0 | 0.0% |
| Multidisciplinary Studies | 0 | 0.0% |
| Science & Technology | 23 | 12.2% |
| Business | 41 | 21.7% |
| Education | 73 | 38.6% |
| Literature & Languages | 2 | 1.1% |
| Liberal Arts & History | 24 | 12.7% |
| Visual & Performing Arts | 0 | 0.0% |
| Communications | 0 | 0.0% |
| Arts & Humanities | 16 | 8.5% |
| Total | 189 | 100.0% |
Transportation & Commute in Baird
Vehicle Availability by Sex in Baird
The most prevalent vehicle ownership categories in Baird are males with 2 vehicles (182, accounting for 47.9%) and females with 2 vehicles (148, making up 44.4%).
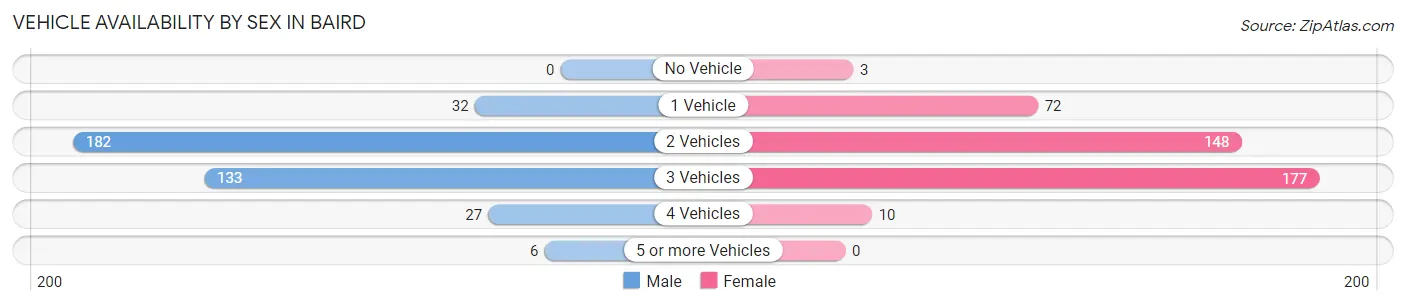
| Vehicles Available | Male | Female |
| No Vehicle | 0 (0.0%) | 3 (0.7%) |
| 1 Vehicle | 32 (8.4%) | 72 (17.6%) |
| 2 Vehicles | 182 (47.9%) | 148 (36.1%) |
| 3 Vehicles | 133 (35.0%) | 177 (43.2%) |
| 4 Vehicles | 27 (7.1%) | 10 (2.4%) |
| 5 or more Vehicles | 6 (1.6%) | 0 (0.0%) |
| Total | 380 (100.0%) | 410 (100.0%) |
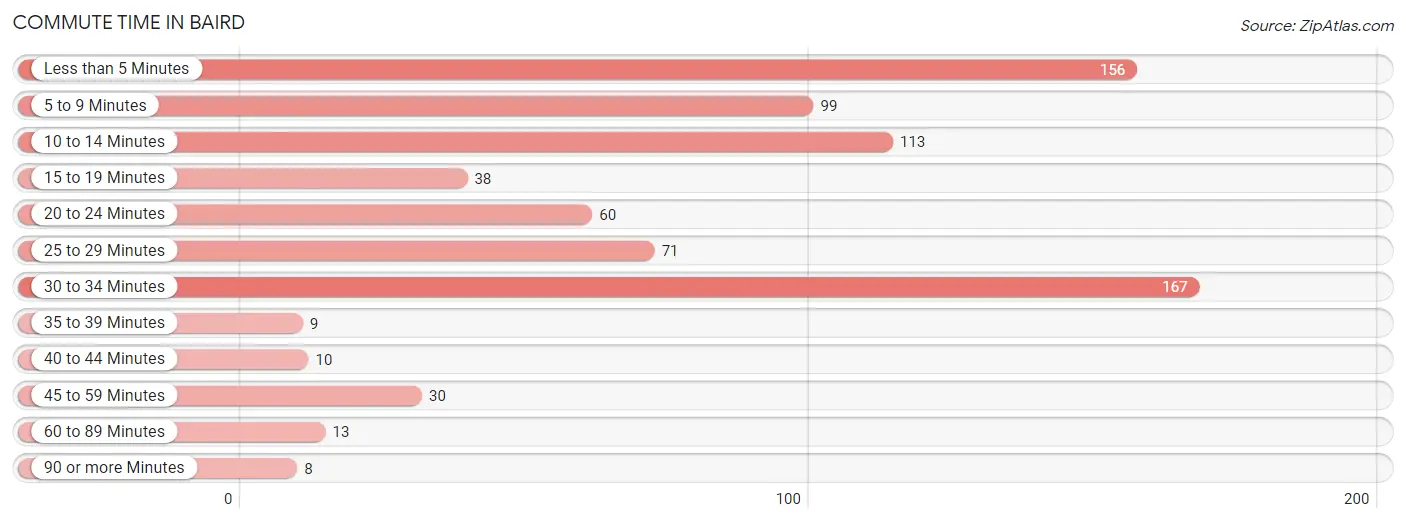
Commute Time in Baird
The most frequently occuring commute durations in Baird are 30 to 34 minutes (167 commuters, 21.6%), less than 5 minutes (156 commuters, 20.2%), and 10 to 14 minutes (113 commuters, 14.6%).
| Commute Time | # Commuters | % Commuters |
| Less than 5 Minutes | 156 | 20.2% |
| 5 to 9 Minutes | 99 | 12.8% |
| 10 to 14 Minutes | 113 | 14.6% |
| 15 to 19 Minutes | 38 | 4.9% |
| 20 to 24 Minutes | 60 | 7.7% |
| 25 to 29 Minutes | 71 | 9.2% |
| 30 to 34 Minutes | 167 | 21.6% |
| 35 to 39 Minutes | 9 | 1.2% |
| 40 to 44 Minutes | 10 | 1.3% |
| 45 to 59 Minutes | 30 | 3.9% |
| 60 to 89 Minutes | 13 | 1.7% |
| 90 or more Minutes | 8 | 1.0% |
Commute Time by Sex in Baird
The most common commute times in Baird are 10 to 14 minutes (109 commuters, 28.7%) for males and less than 5 minutes (115 commuters, 29.2%) for females.
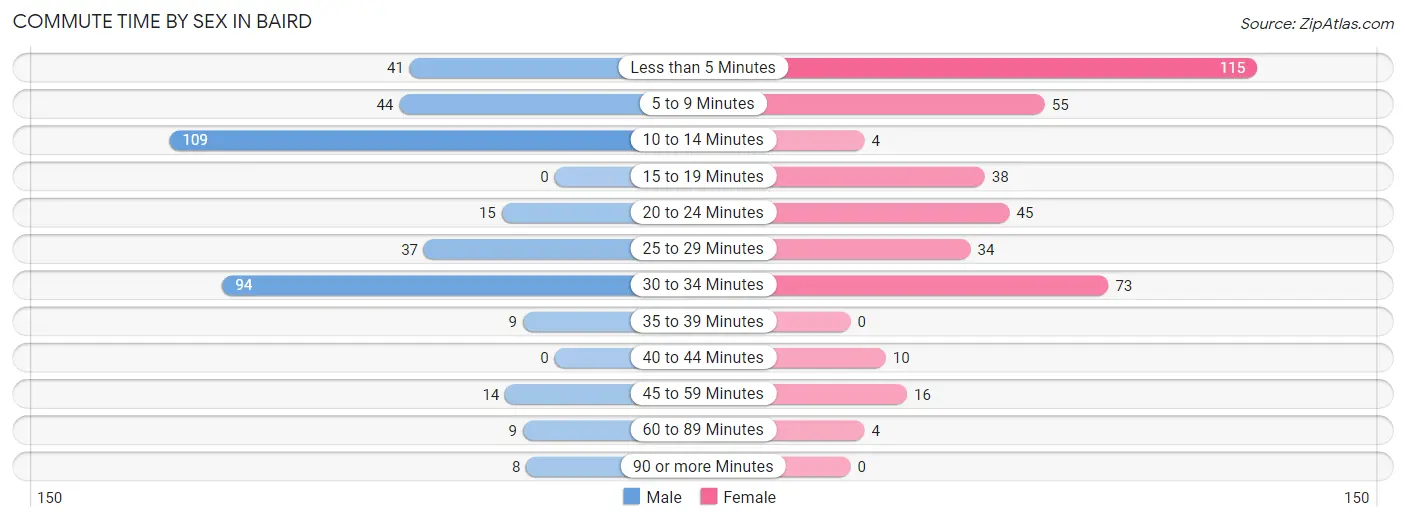
| Commute Time | Male | Female |
| Less than 5 Minutes | 41 (10.8%) | 115 (29.2%) |
| 5 to 9 Minutes | 44 (11.6%) | 55 (14.0%) |
| 10 to 14 Minutes | 109 (28.7%) | 4 (1.0%) |
| 15 to 19 Minutes | 0 (0.0%) | 38 (9.6%) |
| 20 to 24 Minutes | 15 (4.0%) | 45 (11.4%) |
| 25 to 29 Minutes | 37 (9.7%) | 34 (8.6%) |
| 30 to 34 Minutes | 94 (24.7%) | 73 (18.5%) |
| 35 to 39 Minutes | 9 (2.4%) | 0 (0.0%) |
| 40 to 44 Minutes | 0 (0.0%) | 10 (2.5%) |
| 45 to 59 Minutes | 14 (3.7%) | 16 (4.1%) |
| 60 to 89 Minutes | 9 (2.4%) | 4 (1.0%) |
| 90 or more Minutes | 8 (2.1%) | 0 (0.0%) |
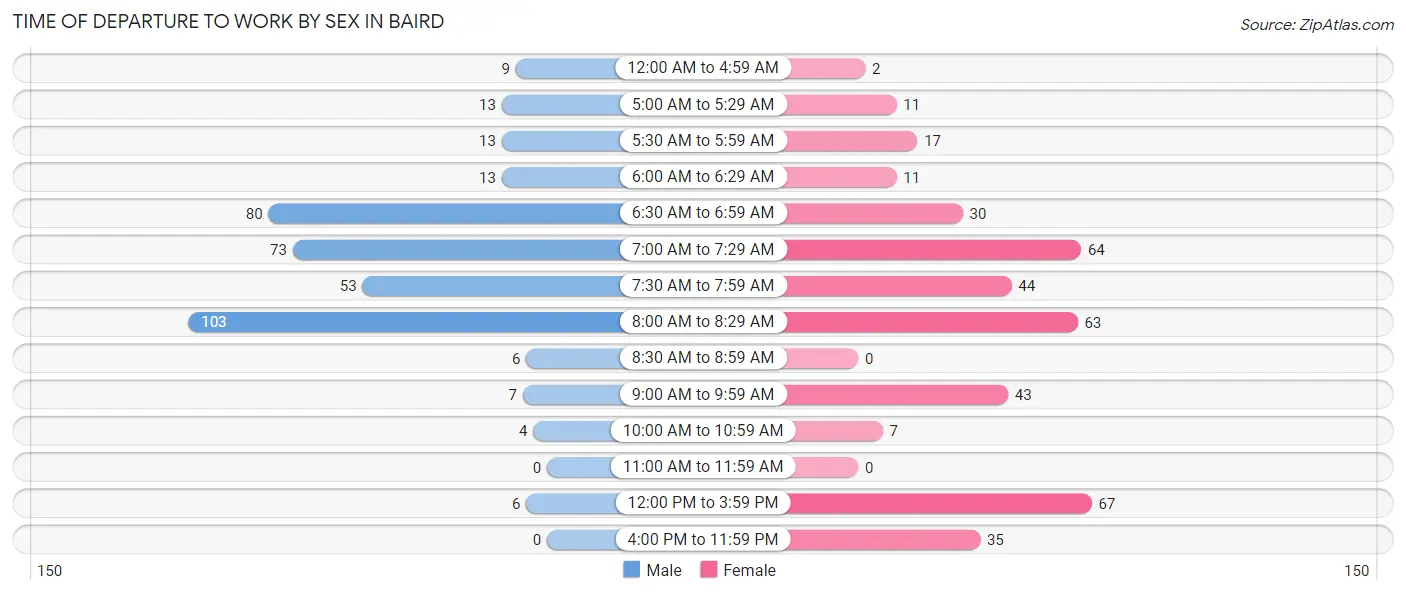
Time of Departure to Work by Sex in Baird
The most frequent times of departure to work in Baird are 8:00 AM to 8:29 AM (103, 27.1%) for males and 12:00 PM to 3:59 PM (67, 17.0%) for females.
| Time of Departure | Male | Female |
| 12:00 AM to 4:59 AM | 9 (2.4%) | 2 (0.5%) |
| 5:00 AM to 5:29 AM | 13 (3.4%) | 11 (2.8%) |
| 5:30 AM to 5:59 AM | 13 (3.4%) | 17 (4.3%) |
| 6:00 AM to 6:29 AM | 13 (3.4%) | 11 (2.8%) |
| 6:30 AM to 6:59 AM | 80 (21.0%) | 30 (7.6%) |
| 7:00 AM to 7:29 AM | 73 (19.2%) | 64 (16.2%) |
| 7:30 AM to 7:59 AM | 53 (14.0%) | 44 (11.2%) |
| 8:00 AM to 8:29 AM | 103 (27.1%) | 63 (16.0%) |
| 8:30 AM to 8:59 AM | 6 (1.6%) | 0 (0.0%) |
| 9:00 AM to 9:59 AM | 7 (1.8%) | 43 (10.9%) |
| 10:00 AM to 10:59 AM | 4 (1.1%) | 7 (1.8%) |
| 11:00 AM to 11:59 AM | 0 (0.0%) | 0 (0.0%) |
| 12:00 PM to 3:59 PM | 6 (1.6%) | 67 (17.0%) |
| 4:00 PM to 11:59 PM | 0 (0.0%) | 35 (8.9%) |
| Total | 380 (100.0%) | 394 (100.0%) |
Housing Occupancy in Baird
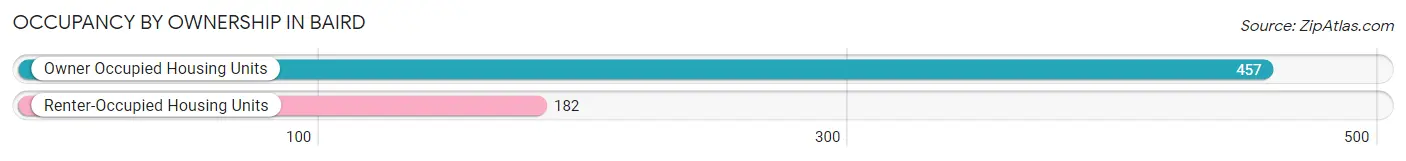
Occupancy by Ownership in Baird
Of the total 639 dwellings in Baird, owner-occupied units account for 457 (71.5%), while renter-occupied units make up 182 (28.5%).
| Occupancy | # Housing Units | % Housing Units |
| Owner Occupied Housing Units | 457 | 71.5% |
| Renter-Occupied Housing Units | 182 | 28.5% |
| Total Occupied Housing Units | 639 | 100.0% |
Occupancy by Household Size in Baird
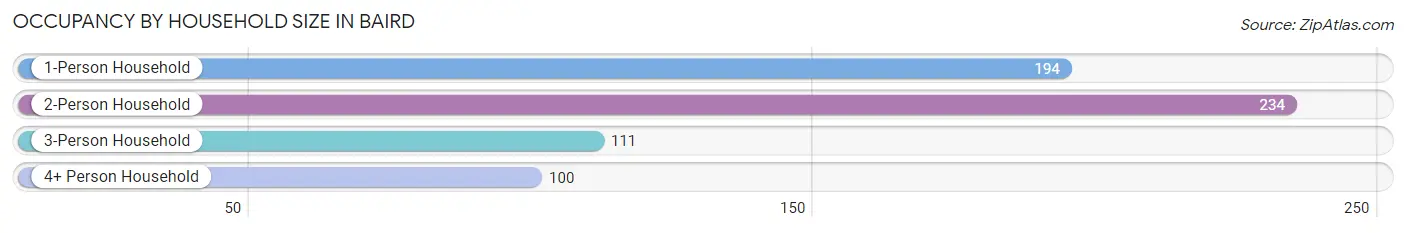
| Household Size | # Housing Units | % Housing Units |
| 1-Person Household | 194 | 30.4% |
| 2-Person Household | 234 | 36.6% |
| 3-Person Household | 111 | 17.4% |
| 4+ Person Household | 100 | 15.7% |
| Total Housing Units | 639 | 100.0% |
Occupancy by Ownership by Household Size in Baird
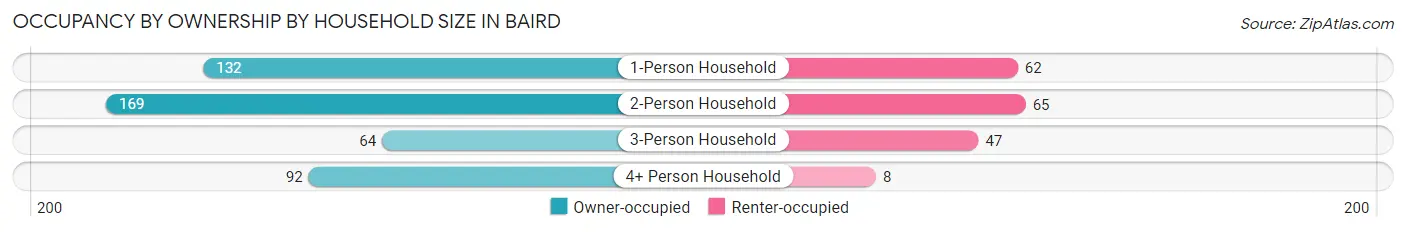
| Household Size | Owner-occupied | Renter-occupied |
| 1-Person Household | 132 (68.0%) | 62 (32.0%) |
| 2-Person Household | 169 (72.2%) | 65 (27.8%) |
| 3-Person Household | 64 (57.7%) | 47 (42.3%) |
| 4+ Person Household | 92 (92.0%) | 8 (8.0%) |
| Total Housing Units | 457 (71.5%) | 182 (28.5%) |
Occupancy by Educational Attainment in Baird
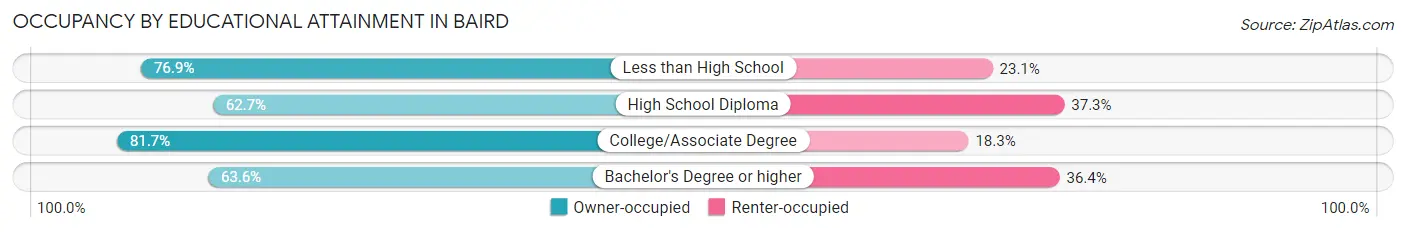
| Household Size | Owner-occupied | Renter-occupied |
| Less than High School | 60 (76.9%) | 18 (23.1%) |
| High School Diploma | 163 (62.7%) | 97 (37.3%) |
| College/Associate Degree | 192 (81.7%) | 43 (18.3%) |
| Bachelor's Degree or higher | 42 (63.6%) | 24 (36.4%) |
Occupancy by Age of Householder in Baird
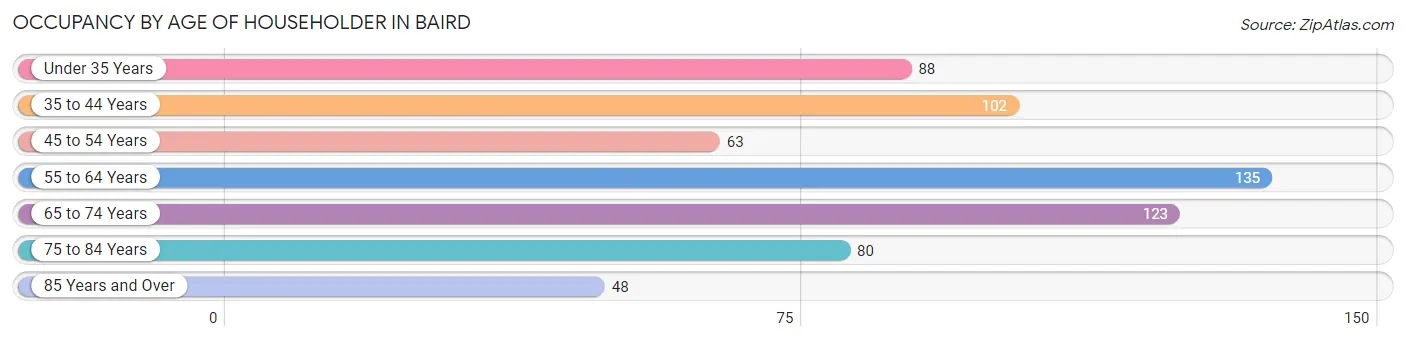
| Age Bracket | # Households | % Households |
| Under 35 Years | 88 | 13.8% |
| 35 to 44 Years | 102 | 16.0% |
| 45 to 54 Years | 63 | 9.9% |
| 55 to 64 Years | 135 | 21.1% |
| 65 to 74 Years | 123 | 19.3% |
| 75 to 84 Years | 80 | 12.5% |
| 85 Years and Over | 48 | 7.5% |
| Total | 639 | 100.0% |
Housing Finances in Baird
Median Income by Occupancy in Baird
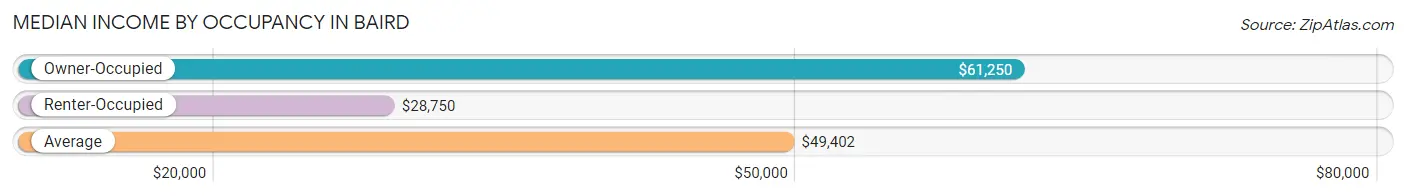
| Occupancy Type | # Households | Median Income |
| Owner-Occupied | 457 (71.5%) | $61,250 |
| Renter-Occupied | 182 (28.5%) | $28,750 |
| Average | 639 (100.0%) | $49,402 |
Occupancy by Householder Income Bracket in Baird
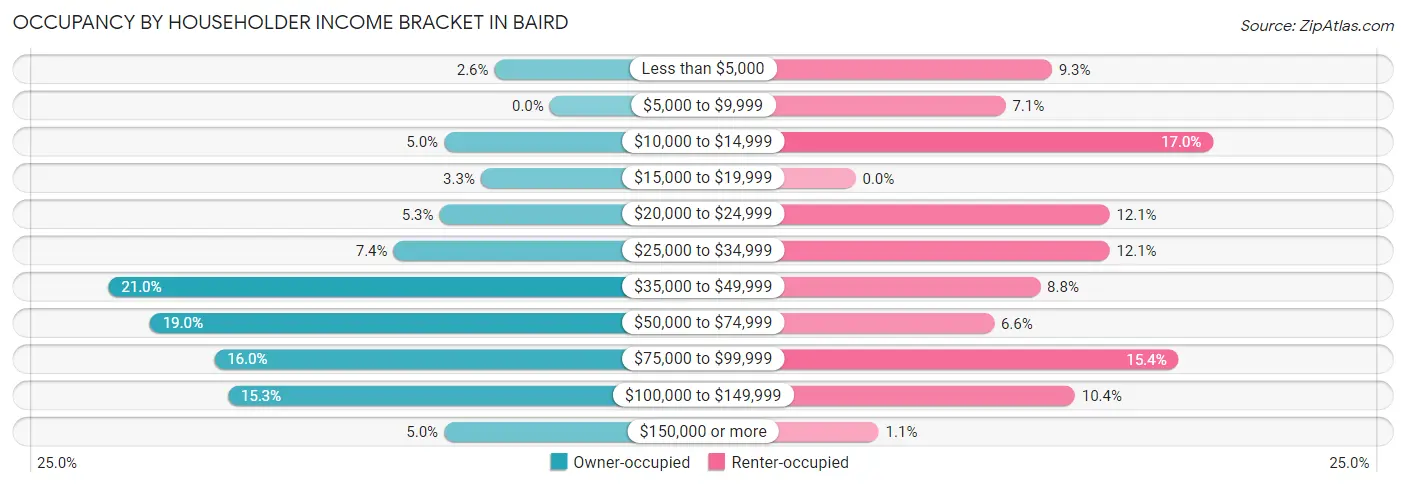
| Income Bracket | Owner-occupied | Renter-occupied |
| Less than $5,000 | 12 (2.6%) | 17 (9.3%) |
| $5,000 to $9,999 | 0 (0.0%) | 13 (7.1%) |
| $10,000 to $14,999 | 23 (5.0%) | 31 (17.0%) |
| $15,000 to $19,999 | 15 (3.3%) | 0 (0.0%) |
| $20,000 to $24,999 | 24 (5.2%) | 22 (12.1%) |
| $25,000 to $34,999 | 34 (7.4%) | 22 (12.1%) |
| $35,000 to $49,999 | 96 (21.0%) | 16 (8.8%) |
| $50,000 to $74,999 | 87 (19.0%) | 12 (6.6%) |
| $75,000 to $99,999 | 73 (16.0%) | 28 (15.4%) |
| $100,000 to $149,999 | 70 (15.3%) | 19 (10.4%) |
| $150,000 or more | 23 (5.0%) | 2 (1.1%) |
| Total | 457 (100.0%) | 182 (100.0%) |
Monthly Housing Cost Tiers in Baird
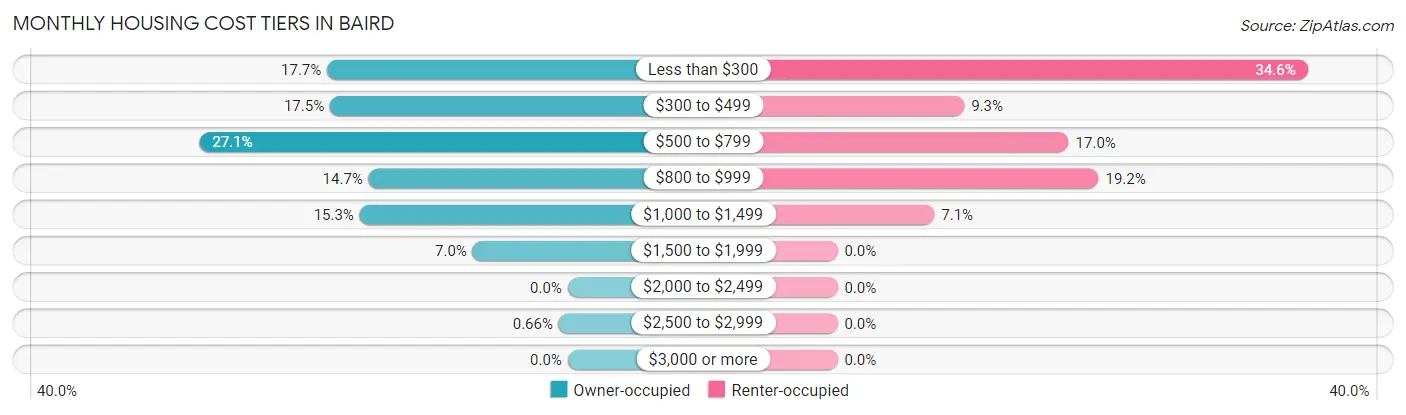
| Monthly Cost | Owner-occupied | Renter-occupied |
| Less than $300 | 81 (17.7%) | 63 (34.6%) |
| $300 to $499 | 80 (17.5%) | 17 (9.3%) |
| $500 to $799 | 124 (27.1%) | 31 (17.0%) |
| $800 to $999 | 67 (14.7%) | 35 (19.2%) |
| $1,000 to $1,499 | 70 (15.3%) | 13 (7.1%) |
| $1,500 to $1,999 | 32 (7.0%) | 0 (0.0%) |
| $2,000 to $2,499 | 0 (0.0%) | 0 (0.0%) |
| $2,500 to $2,999 | 3 (0.7%) | 0 (0.0%) |
| $3,000 or more | 0 (0.0%) | 0 (0.0%) |
| Total | 457 (100.0%) | 182 (100.0%) |
Physical Housing Characteristics in Baird
Housing Structures in Baird
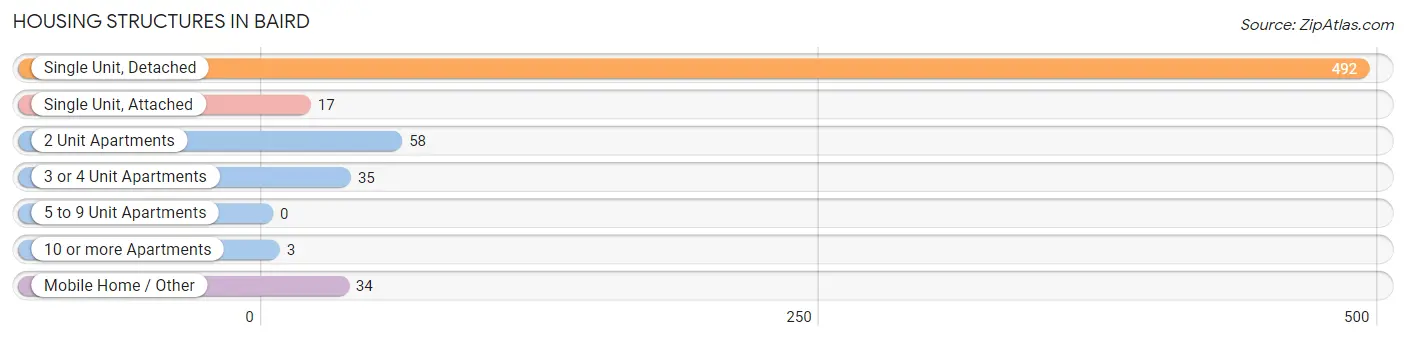
| Structure Type | # Housing Units | % Housing Units |
| Single Unit, Detached | 492 | 77.0% |
| Single Unit, Attached | 17 | 2.7% |
| 2 Unit Apartments | 58 | 9.1% |
| 3 or 4 Unit Apartments | 35 | 5.5% |
| 5 to 9 Unit Apartments | 0 | 0.0% |
| 10 or more Apartments | 3 | 0.5% |
| Mobile Home / Other | 34 | 5.3% |
| Total | 639 | 100.0% |
Housing Structures by Occupancy in Baird
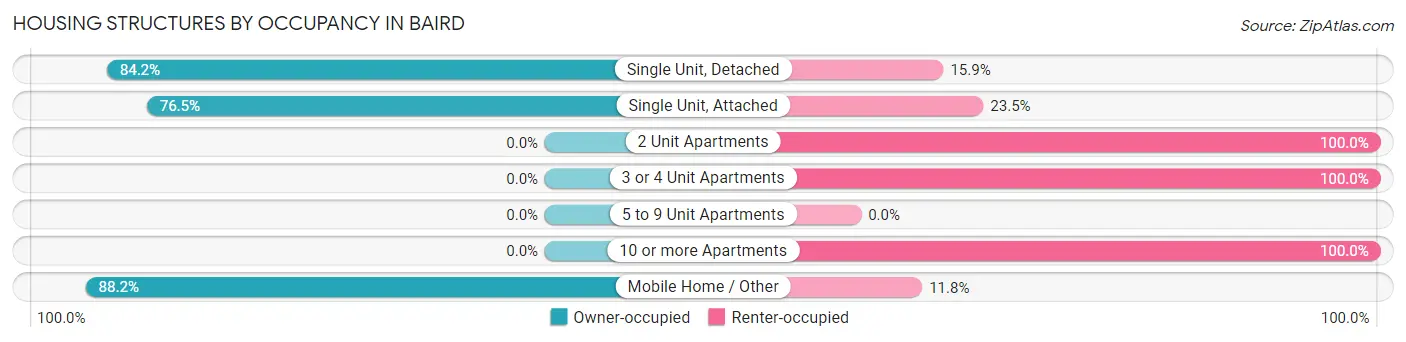
| Structure Type | Owner-occupied | Renter-occupied |
| Single Unit, Detached | 414 (84.2%) | 78 (15.9%) |
| Single Unit, Attached | 13 (76.5%) | 4 (23.5%) |
| 2 Unit Apartments | 0 (0.0%) | 58 (100.0%) |
| 3 or 4 Unit Apartments | 0 (0.0%) | 35 (100.0%) |
| 5 to 9 Unit Apartments | 0 (0.0%) | 0 (0.0%) |
| 10 or more Apartments | 0 (0.0%) | 3 (100.0%) |
| Mobile Home / Other | 30 (88.2%) | 4 (11.8%) |
| Total | 457 (71.5%) | 182 (28.5%) |
Housing Structures by Number of Rooms in Baird
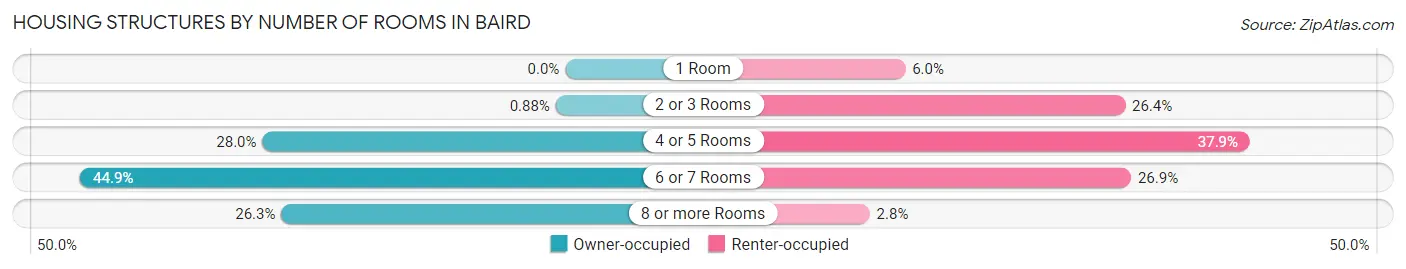
| Number of Rooms | Owner-occupied | Renter-occupied |
| 1 Room | 0 (0.0%) | 11 (6.0%) |
| 2 or 3 Rooms | 4 (0.9%) | 48 (26.4%) |
| 4 or 5 Rooms | 128 (28.0%) | 69 (37.9%) |
| 6 or 7 Rooms | 205 (44.9%) | 49 (26.9%) |
| 8 or more Rooms | 120 (26.3%) | 5 (2.8%) |
| Total | 457 (100.0%) | 182 (100.0%) |
Housing Structure by Heating Type in Baird
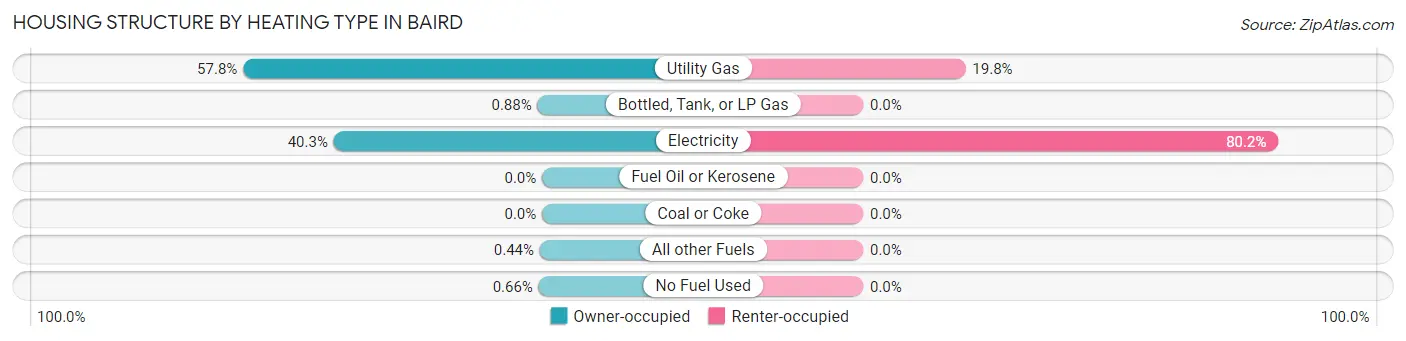
| Heating Type | Owner-occupied | Renter-occupied |
| Utility Gas | 264 (57.8%) | 36 (19.8%) |
| Bottled, Tank, or LP Gas | 4 (0.9%) | 0 (0.0%) |
| Electricity | 184 (40.3%) | 146 (80.2%) |
| Fuel Oil or Kerosene | 0 (0.0%) | 0 (0.0%) |
| Coal or Coke | 0 (0.0%) | 0 (0.0%) |
| All other Fuels | 2 (0.4%) | 0 (0.0%) |
| No Fuel Used | 3 (0.7%) | 0 (0.0%) |
| Total | 457 (100.0%) | 182 (100.0%) |
Household Vehicle Usage in Baird
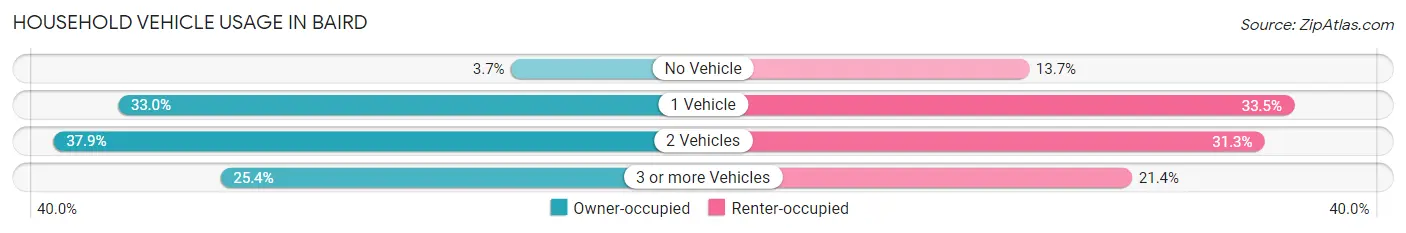
| Vehicles per Household | Owner-occupied | Renter-occupied |
| No Vehicle | 17 (3.7%) | 25 (13.7%) |
| 1 Vehicle | 151 (33.0%) | 61 (33.5%) |
| 2 Vehicles | 173 (37.9%) | 57 (31.3%) |
| 3 or more Vehicles | 116 (25.4%) | 39 (21.4%) |
| Total | 457 (100.0%) | 182 (100.0%) |
Real Estate & Mortgages in Baird
Real Estate and Mortgage Overview in Baird
| Characteristic | Without Mortgage | With Mortgage |
| Housing Units | 277 | 180 |
| Median Property Value | $66,600 | $81,600 |
| Median Household Income | $46,406 | $11 |
| Monthly Housing Costs | $450 | $0 |
| Real Estate Taxes | $529 | $0 |
Property Value by Mortgage Status in Baird
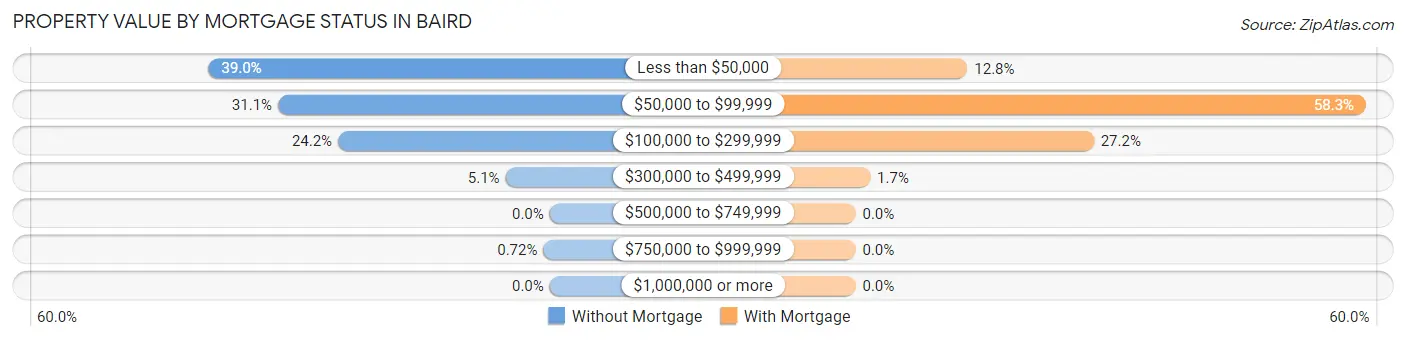
| Property Value | Without Mortgage | With Mortgage |
| Less than $50,000 | 108 (39.0%) | 23 (12.8%) |
| $50,000 to $99,999 | 86 (31.0%) | 105 (58.3%) |
| $100,000 to $299,999 | 67 (24.2%) | 49 (27.2%) |
| $300,000 to $499,999 | 14 (5.1%) | 3 (1.7%) |
| $500,000 to $749,999 | 0 (0.0%) | 0 (0.0%) |
| $750,000 to $999,999 | 2 (0.7%) | 0 (0.0%) |
| $1,000,000 or more | 0 (0.0%) | 0 (0.0%) |
| Total | 277 (100.0%) | 180 (100.0%) |
Household Income by Mortgage Status in Baird
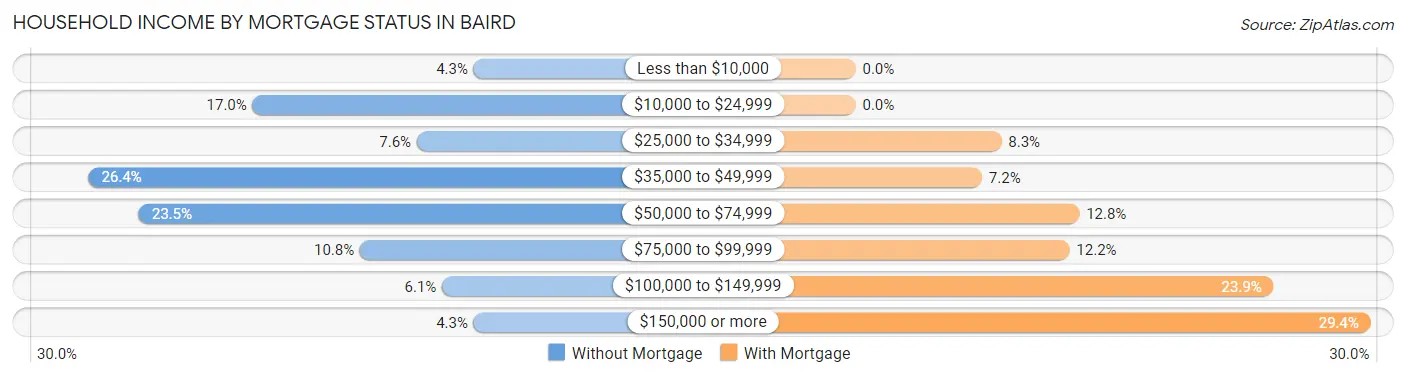
| Household Income | Without Mortgage | With Mortgage |
| Less than $10,000 | 12 (4.3%) | 0 (0.0%) |
| $10,000 to $24,999 | 47 (17.0%) | 0 (0.0%) |
| $25,000 to $34,999 | 21 (7.6%) | 15 (8.3%) |
| $35,000 to $49,999 | 73 (26.4%) | 13 (7.2%) |
| $50,000 to $74,999 | 65 (23.5%) | 23 (12.8%) |
| $75,000 to $99,999 | 30 (10.8%) | 22 (12.2%) |
| $100,000 to $149,999 | 17 (6.1%) | 43 (23.9%) |
| $150,000 or more | 12 (4.3%) | 53 (29.4%) |
| Total | 277 (100.0%) | 180 (100.0%) |
Property Value to Household Income Ratio in Baird
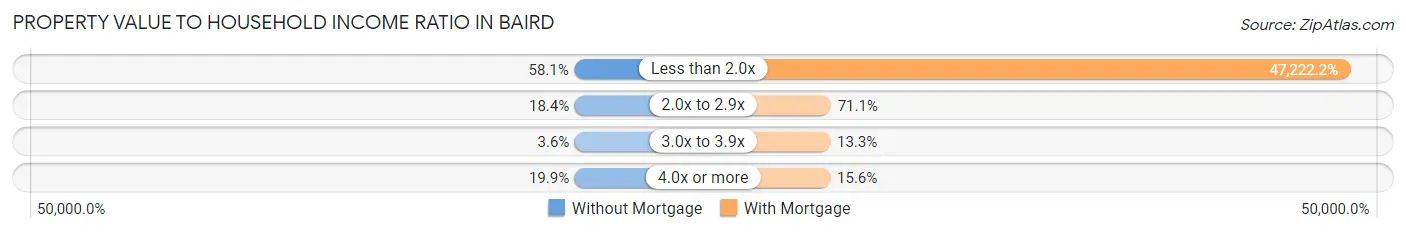
| Value-to-Income Ratio | Without Mortgage | With Mortgage |
| Less than 2.0x | 161 (58.1%) | 85,000 (47,222.2%) |
| 2.0x to 2.9x | 51 (18.4%) | 128 (71.1%) |
| 3.0x to 3.9x | 10 (3.6%) | 24 (13.3%) |
| 4.0x or more | 55 (19.9%) | 28 (15.6%) |
| Total | 277 (100.0%) | 180 (100.0%) |
Real Estate Taxes by Mortgage Status in Baird
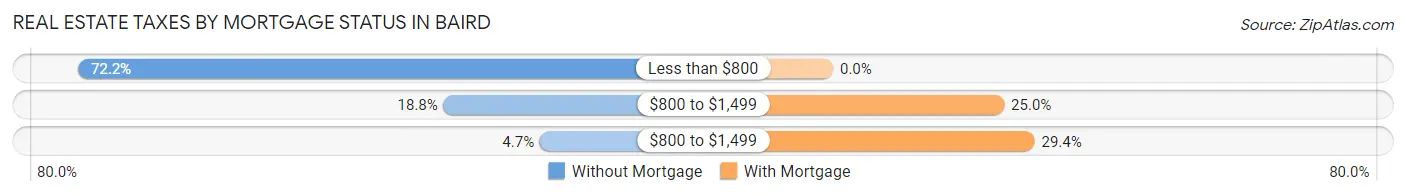
| Property Taxes | Without Mortgage | With Mortgage |
| Less than $800 | 200 (72.2%) | 0 (0.0%) |
| $800 to $1,499 | 52 (18.8%) | 45 (25.0%) |
| $800 to $1,499 | 13 (4.7%) | 53 (29.4%) |
| Total | 277 (100.0%) | 180 (100.0%) |
Health & Disability in Baird
Health Insurance Coverage by Age in Baird
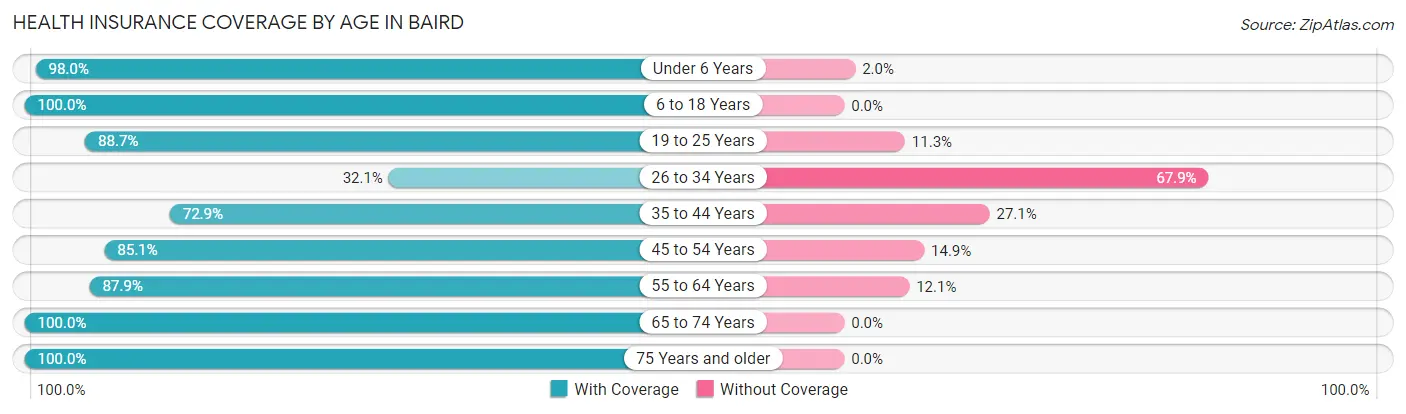
| Age Bracket | With Coverage | Without Coverage |
| Under 6 Years | 144 (98.0%) | 3 (2.0%) |
| 6 to 18 Years | 218 (100.0%) | 0 (0.0%) |
| 19 to 25 Years | 102 (88.7%) | 13 (11.3%) |
| 26 to 34 Years | 52 (32.1%) | 110 (67.9%) |
| 35 to 44 Years | 140 (72.9%) | 52 (27.1%) |
| 45 to 54 Years | 143 (85.1%) | 25 (14.9%) |
| 55 to 64 Years | 254 (87.9%) | 35 (12.1%) |
| 65 to 74 Years | 240 (100.0%) | 0 (0.0%) |
| 75 Years and older | 159 (100.0%) | 0 (0.0%) |
| Total | 1,452 (85.9%) | 238 (14.1%) |
Health Insurance Coverage by Citizenship Status in Baird
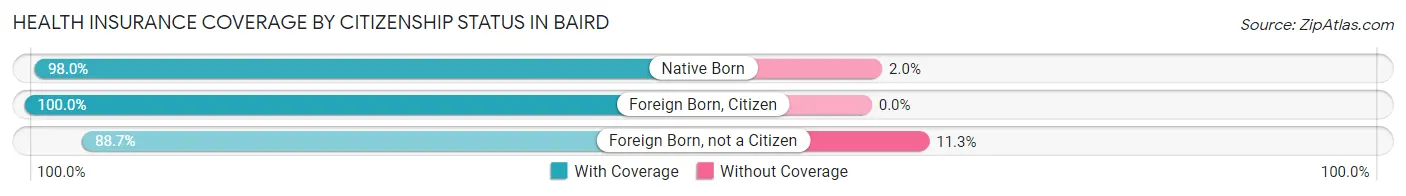
| Citizenship Status | With Coverage | Without Coverage |
| Native Born | 144 (98.0%) | 3 (2.0%) |
| Foreign Born, Citizen | 218 (100.0%) | 0 (0.0%) |
| Foreign Born, not a Citizen | 102 (88.7%) | 13 (11.3%) |
Health Insurance Coverage by Household Income in Baird
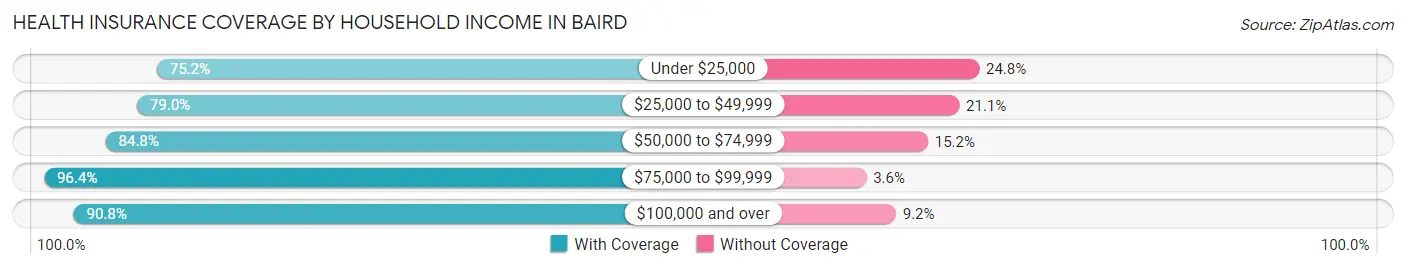
| Household Income | With Coverage | Without Coverage |
| Under $25,000 | 161 (75.2%) | 53 (24.8%) |
| $25,000 to $49,999 | 330 (78.9%) | 88 (21.0%) |
| $50,000 to $74,999 | 257 (84.8%) | 46 (15.2%) |
| $75,000 to $99,999 | 318 (96.4%) | 12 (3.6%) |
| $100,000 and over | 386 (90.8%) | 39 (9.2%) |
Public vs Private Health Insurance Coverage by Age in Baird
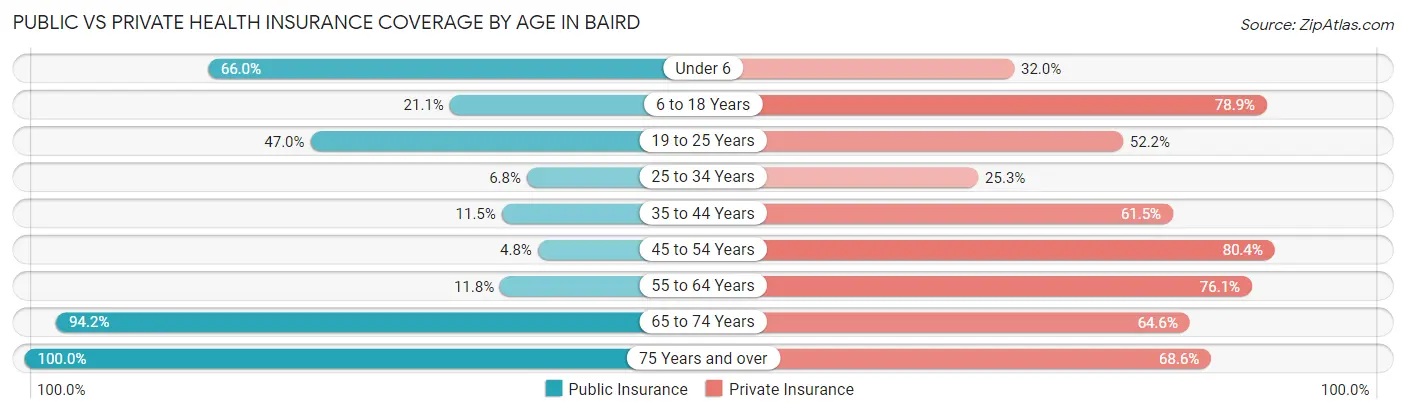
| Age Bracket | Public Insurance | Private Insurance |
| Under 6 | 97 (66.0%) | 47 (32.0%) |
| 6 to 18 Years | 46 (21.1%) | 172 (78.9%) |
| 19 to 25 Years | 54 (47.0%) | 60 (52.2%) |
| 25 to 34 Years | 11 (6.8%) | 41 (25.3%) |
| 35 to 44 Years | 22 (11.5%) | 118 (61.5%) |
| 45 to 54 Years | 8 (4.8%) | 135 (80.4%) |
| 55 to 64 Years | 34 (11.8%) | 220 (76.1%) |
| 65 to 74 Years | 226 (94.2%) | 155 (64.6%) |
| 75 Years and over | 159 (100.0%) | 109 (68.5%) |
| Total | 657 (38.9%) | 1,057 (62.5%) |
Disability Status by Sex by Age in Baird
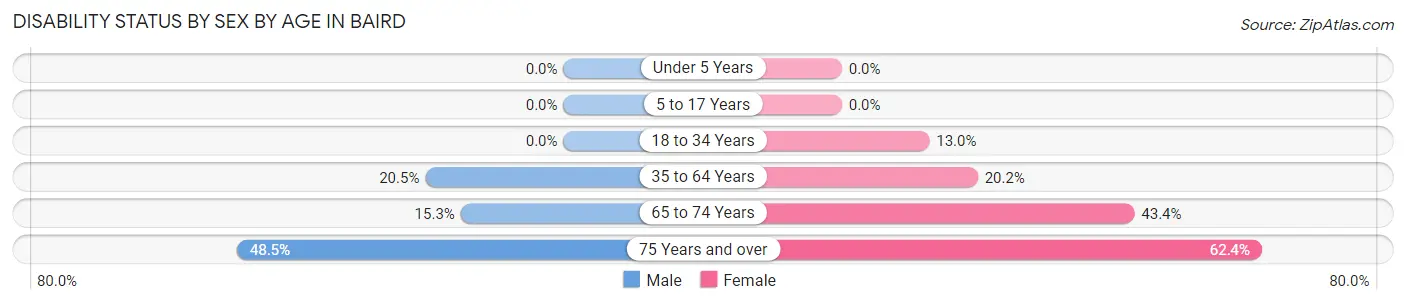
| Age Bracket | Male | Female |
| Under 5 Years | 0 (0.0%) | 0 (0.0%) |
| 5 to 17 Years | 0 (0.0%) | 0 (0.0%) |
| 18 to 34 Years | 0 (0.0%) | 23 (13.0%) |
| 35 to 64 Years | 64 (20.5%) | 68 (20.2%) |
| 65 to 74 Years | 18 (15.2%) | 53 (43.4%) |
| 75 Years and over | 32 (48.5%) | 58 (62.4%) |
Disability Class by Sex by Age in Baird
Disability Class: Hearing Difficulty
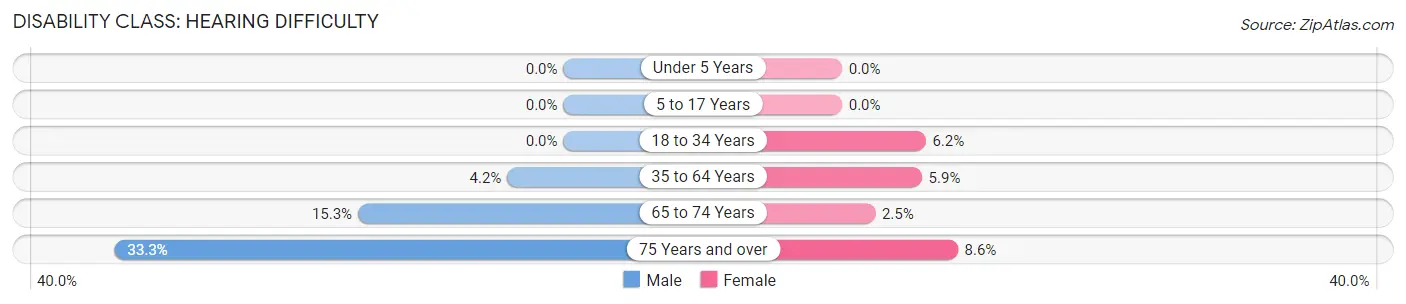
| Age Bracket | Male | Female |
| Under 5 Years | 0 (0.0%) | 0 (0.0%) |
| 5 to 17 Years | 0 (0.0%) | 0 (0.0%) |
| 18 to 34 Years | 0 (0.0%) | 11 (6.2%) |
| 35 to 64 Years | 13 (4.2%) | 20 (5.9%) |
| 65 to 74 Years | 18 (15.2%) | 3 (2.5%) |
| 75 Years and over | 22 (33.3%) | 8 (8.6%) |
Disability Class: Vision Difficulty
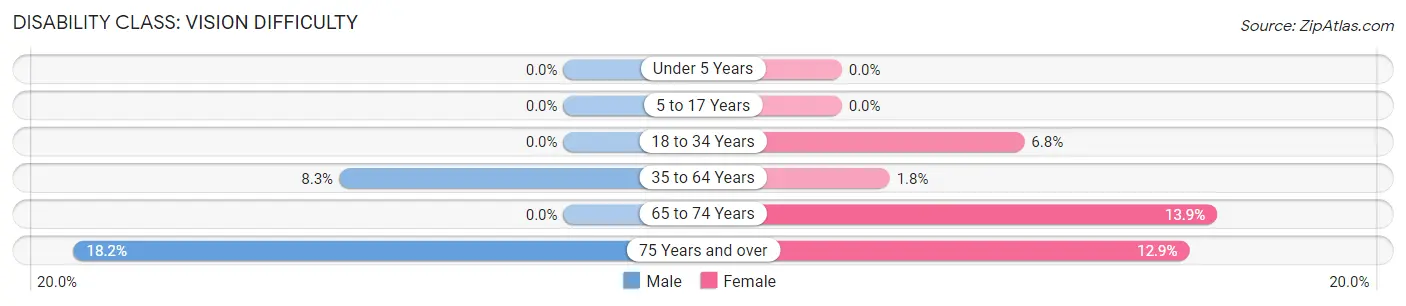
| Age Bracket | Male | Female |
| Under 5 Years | 0 (0.0%) | 0 (0.0%) |
| 5 to 17 Years | 0 (0.0%) | 0 (0.0%) |
| 18 to 34 Years | 0 (0.0%) | 12 (6.8%) |
| 35 to 64 Years | 26 (8.3%) | 6 (1.8%) |
| 65 to 74 Years | 0 (0.0%) | 17 (13.9%) |
| 75 Years and over | 12 (18.2%) | 12 (12.9%) |
Disability Class: Cognitive Difficulty
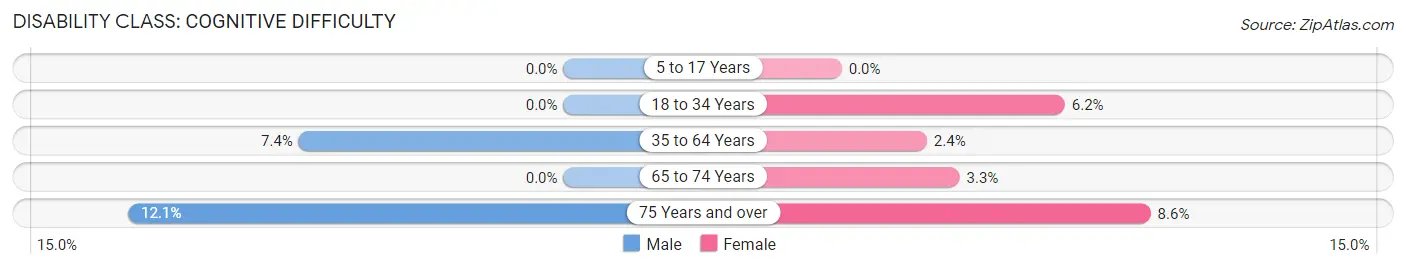
| Age Bracket | Male | Female |
| 5 to 17 Years | 0 (0.0%) | 0 (0.0%) |
| 18 to 34 Years | 0 (0.0%) | 11 (6.2%) |
| 35 to 64 Years | 23 (7.4%) | 8 (2.4%) |
| 65 to 74 Years | 0 (0.0%) | 4 (3.3%) |
| 75 Years and over | 8 (12.1%) | 8 (8.6%) |
Disability Class: Ambulatory Difficulty
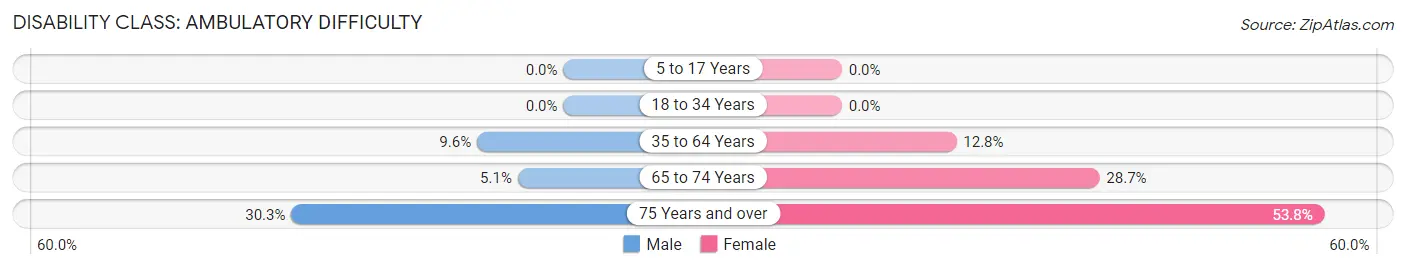
| Age Bracket | Male | Female |
| 5 to 17 Years | 0 (0.0%) | 0 (0.0%) |
| 18 to 34 Years | 0 (0.0%) | 0 (0.0%) |
| 35 to 64 Years | 30 (9.6%) | 43 (12.8%) |
| 65 to 74 Years | 6 (5.1%) | 35 (28.7%) |
| 75 Years and over | 20 (30.3%) | 50 (53.8%) |
Disability Class: Self-Care Difficulty
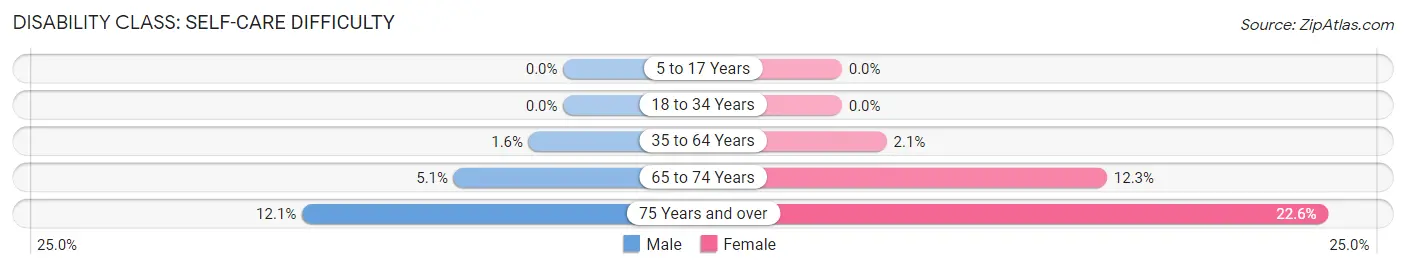
| Age Bracket | Male | Female |
| 5 to 17 Years | 0 (0.0%) | 0 (0.0%) |
| 18 to 34 Years | 0 (0.0%) | 0 (0.0%) |
| 35 to 64 Years | 5 (1.6%) | 7 (2.1%) |
| 65 to 74 Years | 6 (5.1%) | 15 (12.3%) |
| 75 Years and over | 8 (12.1%) | 21 (22.6%) |
Technology Access in Baird
Computing Device Access in Baird
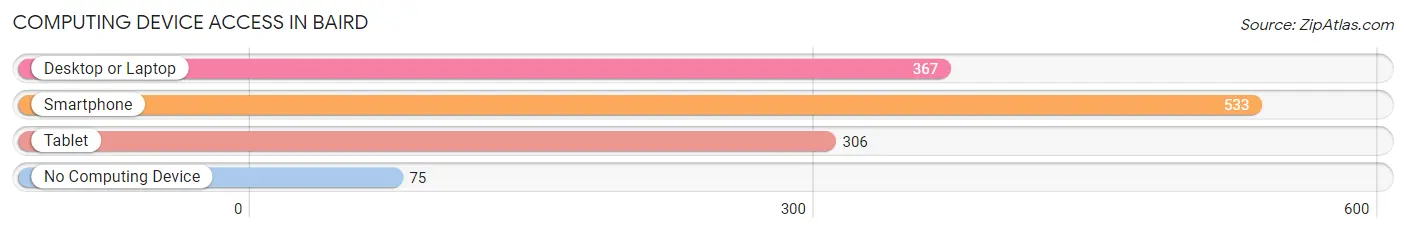
| Device Type | # Households | % Households |
| Desktop or Laptop | 367 | 57.4% |
| Smartphone | 533 | 83.4% |
| Tablet | 306 | 47.9% |
| No Computing Device | 75 | 11.7% |
| Total | 639 | 100.0% |
Internet Access in Baird
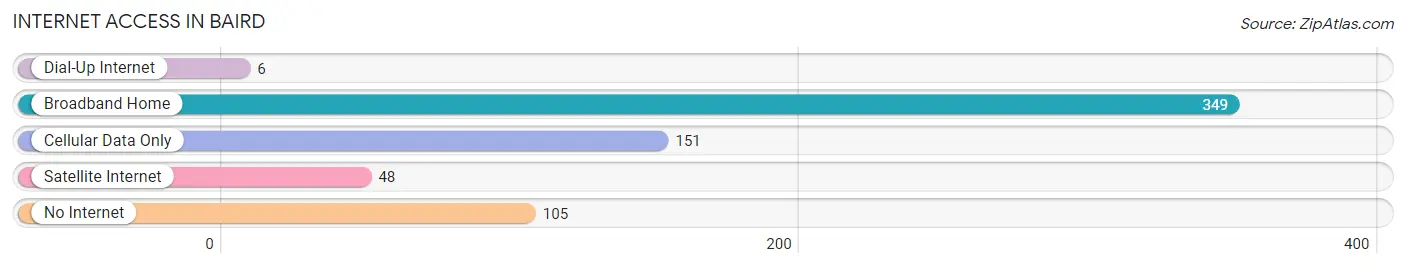
| Internet Type | # Households | % Households |
| Dial-Up Internet | 6 | 0.9% |
| Broadband Home | 349 | 54.6% |
| Cellular Data Only | 151 | 23.6% |
| Satellite Internet | 48 | 7.5% |
| No Internet | 105 | 16.4% |
| Total | 639 | 100.0% |
Baird Summary
Baird, Texas is a small town located in Callahan County, Texas. It is situated in the western part of the state, about 100 miles west of Abilene. The town was founded in 1876 by William Baird, a rancher and businessman from Scotland. The population of Baird was 1,817 in the 2010 census.
History
Baird was founded in 1876 by William Baird, a rancher and businessman from Scotland. He purchased land in the area and established a ranch. The town was named after him. In 1881, the Texas and Pacific Railway was built through the area, and Baird became a stop on the line. This allowed the town to grow and become an important trading center for the surrounding area.
In the early 1900s, Baird was a thriving community with a population of over 1,000. It had several stores, a bank, a hotel, a school, and a post office. The town was also home to a number of churches, including the First Baptist Church, which was founded in 1883.
In the 1920s, the town began to decline as the railroad industry declined. The population dropped to just over 500 by the 1940s. However, the town began to rebound in the 1950s and 1960s, as the oil and gas industry began to boom in the area. The population of Baird has remained relatively stable since then, with a population of 1,817 in the 2010 census.
Geography
Baird is located in western Callahan County, Texas. It is situated at the intersection of U.S. Highway 183 and State Highway 36. The town is about 100 miles west of Abilene and about 150 miles east of Lubbock.
The terrain around Baird is mostly flat, with some rolling hills. The town is located in the High Plains region of Texas, and the climate is semi-arid. The average annual temperature is around 65 degrees Fahrenheit, and the average annual precipitation is around 20 inches.
Economy
The economy of Baird is largely based on agriculture and oil and gas production. The town is home to several large farms, which produce a variety of crops, including cotton, corn, wheat, and sorghum. The oil and gas industry is also an important part of the local economy, with several oil and gas companies operating in the area.
In addition to agriculture and oil and gas production, Baird is also home to several small businesses, including restaurants, retail stores, and service providers. The town is also home to a number of manufacturing companies, including a furniture factory and a metal fabrication plant.
Demographics
The population of Baird was 1,817 in the 2010 census. The racial makeup of the town was 94.3% White, 0.7% African American, 0.3% Native American, 0.2% Asian, 0.1% Pacific Islander, 2.7% from other races, and 1.7% from two or more races. Hispanic or Latino of any race were 5.3% of the population.
The median household income in Baird was $37,917 in 2019, and the median home value was $90,000. The town has a poverty rate of 17.3%, and the unemployment rate was 3.7% in 2019. The town is served by the Baird Independent School District, which has one elementary school, one middle school, and one high school.
Common Questions
What is Per Capita Income in Baird?
Per Capita income in Baird is $27,022.
What is the Median Family Income in Baird?
Median Family Income in Baird is $66,250.
What is the Median Household income in Baird?
Median Household Income in Baird is $49,402.
What is Income or Wage Gap in Baird?
Income or Wage Gap in Baird is 69.3%.
Women in Baird earn 30.7 cents for every dollar earned by a man.
What is Inequality or Gini Index in Baird?
Inequality or Gini Index in Baird is 0.41.
What is the Total Population of Baird?
Total Population of Baird is 1,735.
What is the Total Male Population of Baird?
Total Male Population of Baird is 823.
What is the Total Female Population of Baird?
Total Female Population of Baird is 912.
What is the Ratio of Males per 100 Females in Baird?
There are 90.24 Males per 100 Females in Baird.
What is the Ratio of Females per 100 Males in Baird?
There are 110.81 Females per 100 Males in Baird.
What is the Median Population Age in Baird?
Median Population Age in Baird is 45.6 Years.
What is the Average Family Size in Baird
Average Family Size in Baird is 3.4 People.
What is the Average Household Size in Baird
Average Household Size in Baird is 2.6 People.
How Large is the Labor Force in Baird?
There are 859 People in the Labor Forcein in Baird.
What is the Percentage of People in the Labor Force in Baird?
61.6% of People are in the Labor Force in Baird.
What is the Unemployment Rate in Baird?
Unemployment Rate in Baird is 6.9%.