Avinger, TX Map & Demographics
Avinger Map
Avinger Overview
$19,108
PER CAPITA INCOME
$63,929
AVG FAMILY INCOME
$29,038
AVG HOUSEHOLD INCOME
0.46
INEQUALITY / GINI INDEX
470
TOTAL POPULATION
241
MALE POPULATION
229
FEMALE POPULATION
105.24
MALES / 100 FEMALES
95.02
FEMALES / 100 MALES
41.8
MEDIAN AGE
4.1
AVG FAMILY SIZE
2.7
AVG HOUSEHOLD SIZE
168
LABOR FORCE [ PEOPLE ]
42.5%
PERCENT IN LABOR FORCE
13.1%
UNEMPLOYMENT RATE
Avinger Zip Codes
Avinger Area Codes
Income in Avinger
Income Overview in Avinger
Per Capita Income in Avinger is $19,108, while median incomes of families and households are $63,929 and $29,038 respectively.
| Characteristic | Number | Measure |
| Per Capita Income | 470 | $19,108 |
| Median Family Income | 82 | $63,929 |
| Mean Family Income | 82 | $62,532 |
| Median Household Income | 176 | $29,038 |
| Mean Household Income | 176 | $44,735 |
| Income Deficit | 82 | $0 |
| Wage / Income Gap (%) | 470 | 0.00% |
| Wage / Income Gap ($) | 470 | 100.00¢ per $1 |
| Gini / Inequality Index | 470 | 0.46 |
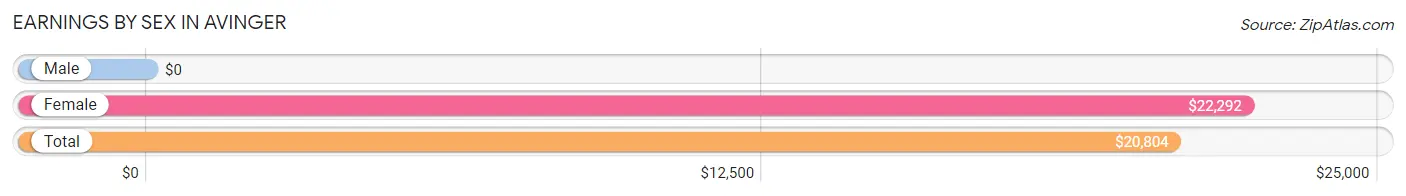
Earnings by Sex in Avinger
| Sex | Number | Average Earnings |
| Male | 80 (53.0%) | $0 |
| Female | 71 (47.0%) | $22,292 |
| Total | 151 (100.0%) | $20,804 |
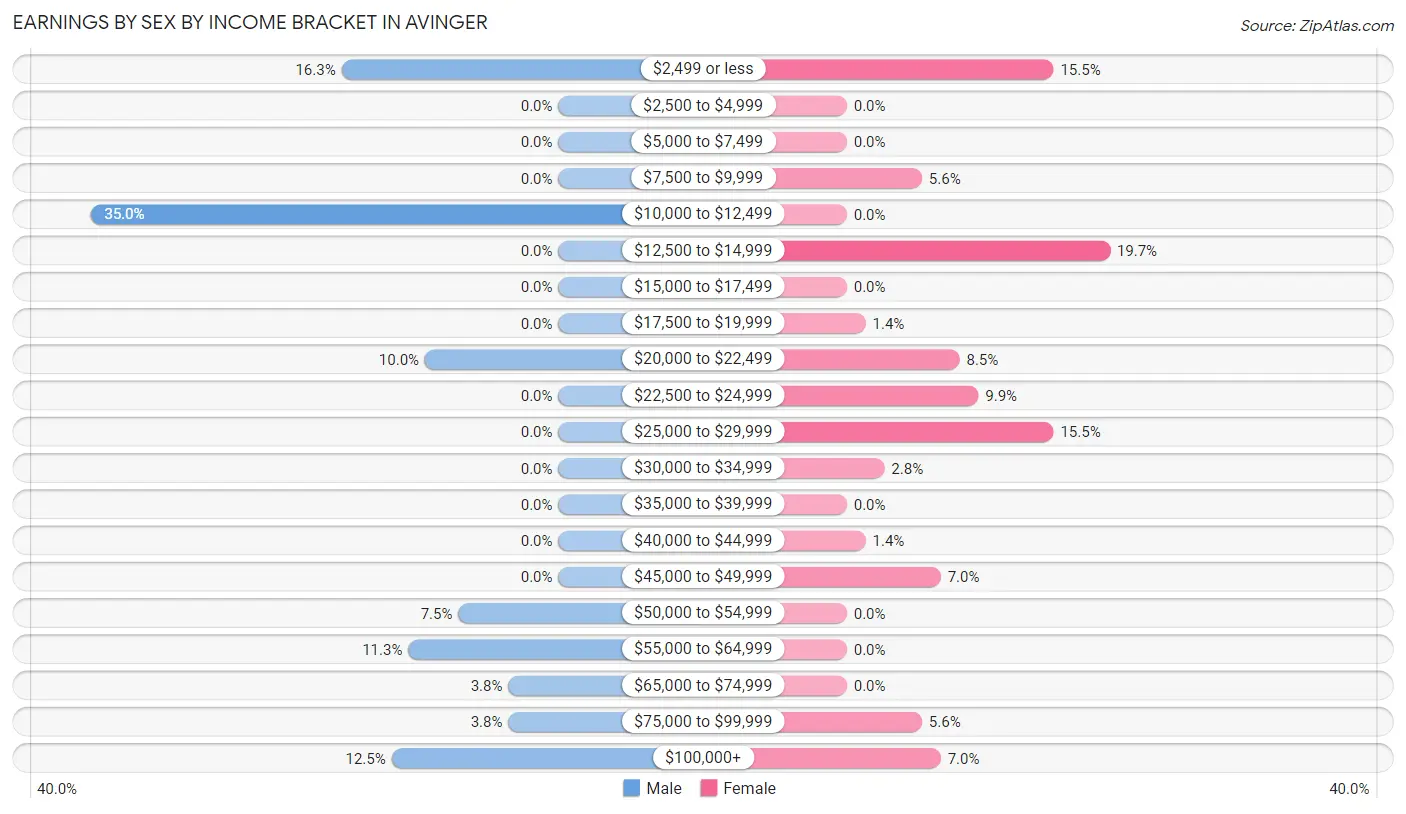
Earnings by Sex by Income Bracket in Avinger
The most common earnings brackets in Avinger are $10,000 to $12,499 for men (28 | 35.0%) and $12,500 to $14,999 for women (14 | 19.7%).
| Income | Male | Female |
| $2,499 or less | 13 (16.3%) | 11 (15.5%) |
| $2,500 to $4,999 | 0 (0.0%) | 0 (0.0%) |
| $5,000 to $7,499 | 0 (0.0%) | 0 (0.0%) |
| $7,500 to $9,999 | 0 (0.0%) | 4 (5.6%) |
| $10,000 to $12,499 | 28 (35.0%) | 0 (0.0%) |
| $12,500 to $14,999 | 0 (0.0%) | 14 (19.7%) |
| $15,000 to $17,499 | 0 (0.0%) | 0 (0.0%) |
| $17,500 to $19,999 | 0 (0.0%) | 1 (1.4%) |
| $20,000 to $22,499 | 8 (10.0%) | 6 (8.5%) |
| $22,500 to $24,999 | 0 (0.0%) | 7 (9.9%) |
| $25,000 to $29,999 | 0 (0.0%) | 11 (15.5%) |
| $30,000 to $34,999 | 0 (0.0%) | 2 (2.8%) |
| $35,000 to $39,999 | 0 (0.0%) | 0 (0.0%) |
| $40,000 to $44,999 | 0 (0.0%) | 1 (1.4%) |
| $45,000 to $49,999 | 0 (0.0%) | 5 (7.0%) |
| $50,000 to $54,999 | 6 (7.5%) | 0 (0.0%) |
| $55,000 to $64,999 | 9 (11.3%) | 0 (0.0%) |
| $65,000 to $74,999 | 3 (3.7%) | 0 (0.0%) |
| $75,000 to $99,999 | 3 (3.7%) | 4 (5.6%) |
| $100,000+ | 10 (12.5%) | 5 (7.0%) |
| Total | 80 (100.0%) | 71 (100.0%) |
Earnings by Sex by Educational Attainment in Avinger
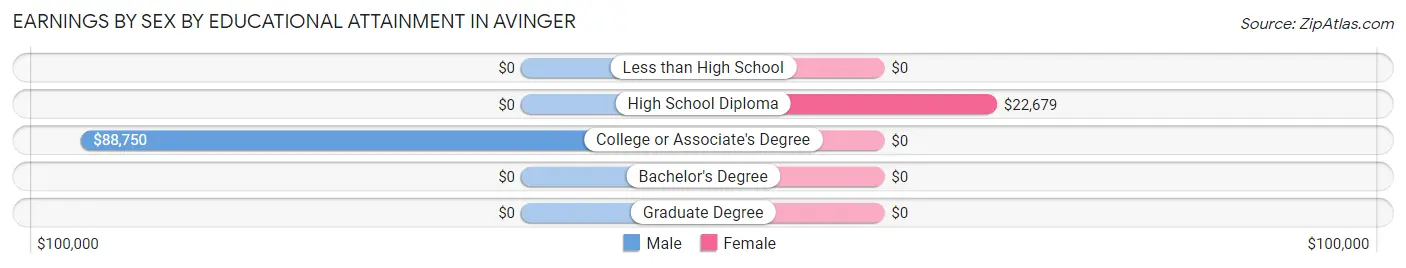
| Educational Attainment | Male Income | Female Income |
| Less than High School | - | - |
| High School Diploma | - | - |
| College or Associate's Degree | $88,750 | $0 |
| Bachelor's Degree | - | - |
| Graduate Degree | - | - |
| Total | - | - |
Family Income in Avinger
Family Income Brackets in Avinger
According to the Avinger family income data, there are 28 families falling into the $75,000 to $99,999 income range, which is the most common income bracket and makes up 34.2% of all families.
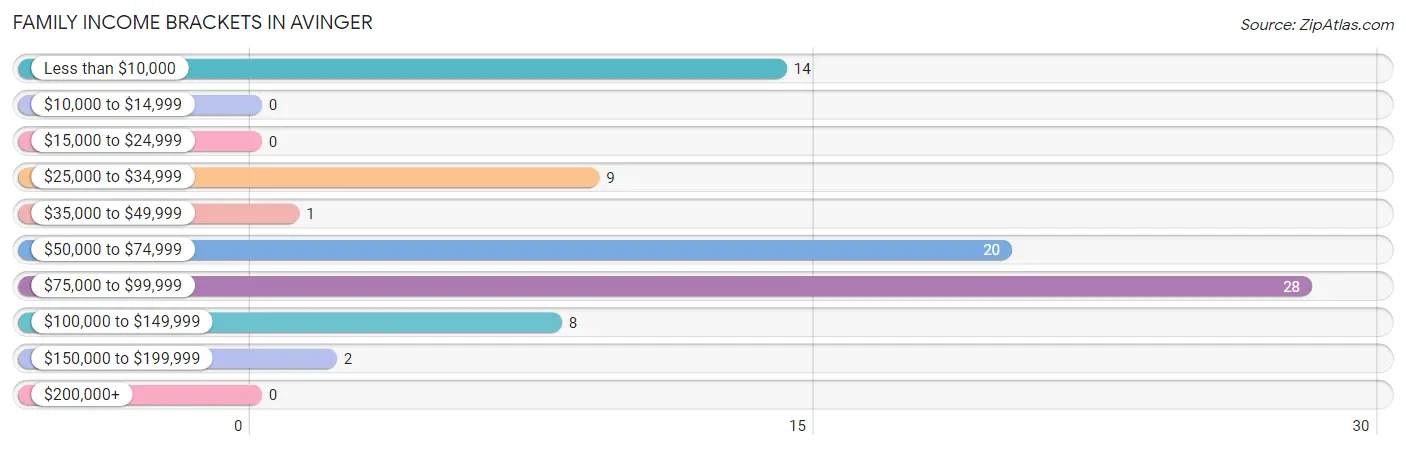
| Income Bracket | # Families | % Families |
| Less than $10,000 | 14 | 17.1% |
| $10,000 to $14,999 | 0 | 0.0% |
| $15,000 to $24,999 | 0 | 0.0% |
| $25,000 to $34,999 | 9 | 11.0% |
| $35,000 to $49,999 | 1 | 1.2% |
| $50,000 to $74,999 | 20 | 24.4% |
| $75,000 to $99,999 | 28 | 34.1% |
| $100,000 to $149,999 | 8 | 9.8% |
| $150,000 to $199,999 | 2 | 2.4% |
| $200,000+ | 0 | 0.0% |
Family Income by Famaliy Size in Avinger
4-person families (14 | 17.1%) account for the highest median family income in Avinger with $83,438 per family, while 2-person families (28 | 34.2%) have the highest median income of $27,812 per family member.
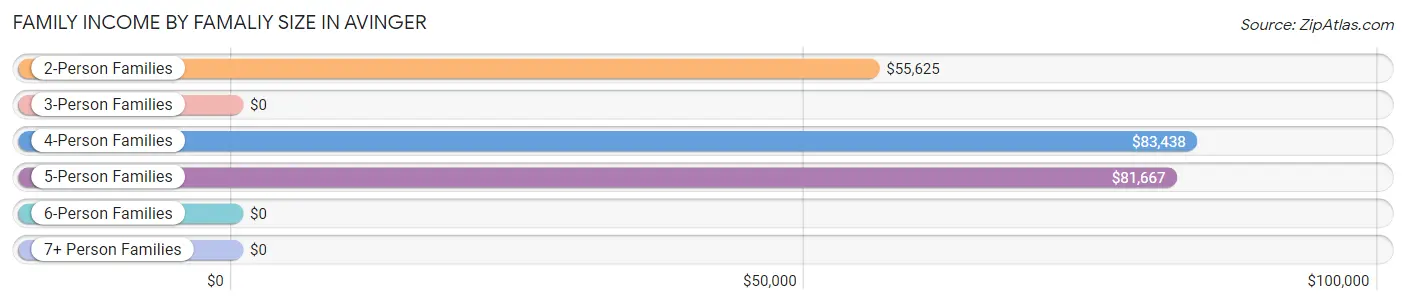
| Income Bracket | # Families | Median Income |
| 2-Person Families | 28 (34.2%) | $55,625 |
| 3-Person Families | 27 (32.9%) | $0 |
| 4-Person Families | 14 (17.1%) | $83,438 |
| 5-Person Families | 6 (7.3%) | $81,667 |
| 6-Person Families | 7 (8.5%) | $0 |
| 7+ Person Families | 0 (0.0%) | $0 |
| Total | 82 (100.0%) | $63,929 |
Family Income by Number of Earners in Avinger
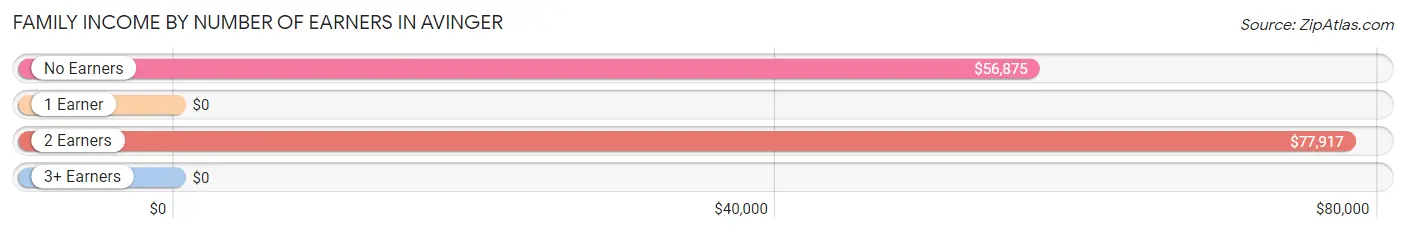
| Number of Earners | # Families | Median Income |
| No Earners | 24 (29.3%) | $56,875 |
| 1 Earner | 29 (35.4%) | $0 |
| 2 Earners | 27 (32.9%) | $77,917 |
| 3+ Earners | 2 (2.4%) | $0 |
| Total | 82 (100.0%) | $63,929 |
Household Income in Avinger
Household Income Brackets in Avinger
With 38 households falling in the category, the $10,000 to $14,999 income range is the most frequent in Avinger, accounting for 21.6% of all households. In contrast, only 2 households (1.1%) fall into the $150,000 to $199,999 income bracket, making it the least populous group.
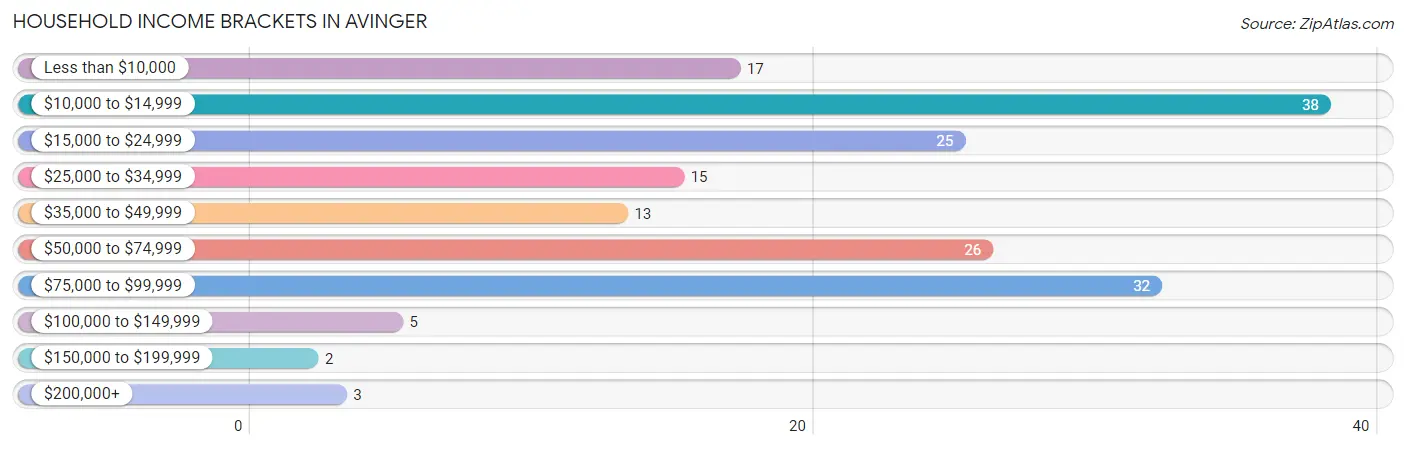
| Income Bracket | # Households | % Households |
| Less than $10,000 | 17 | 9.7% |
| $10,000 to $14,999 | 38 | 21.6% |
| $15,000 to $24,999 | 25 | 14.2% |
| $25,000 to $34,999 | 15 | 8.5% |
| $35,000 to $49,999 | 13 | 7.4% |
| $50,000 to $74,999 | 26 | 14.8% |
| $75,000 to $99,999 | 32 | 18.2% |
| $100,000 to $149,999 | 5 | 2.8% |
| $150,000 to $199,999 | 2 | 1.1% |
| $200,000+ | 3 | 1.7% |
Household Income by Householder Age in Avinger
The median household income in Avinger is $29,038, with the highest median household income of $40,938 found in the 65+ years age bracket for the primary householder. A total of 68 households (38.6%) fall into this category. Meanwhile, the 15 to 24 years age bracket for the primary householder has the lowest median household income of $0, with 7 households (4.0%) in this group.
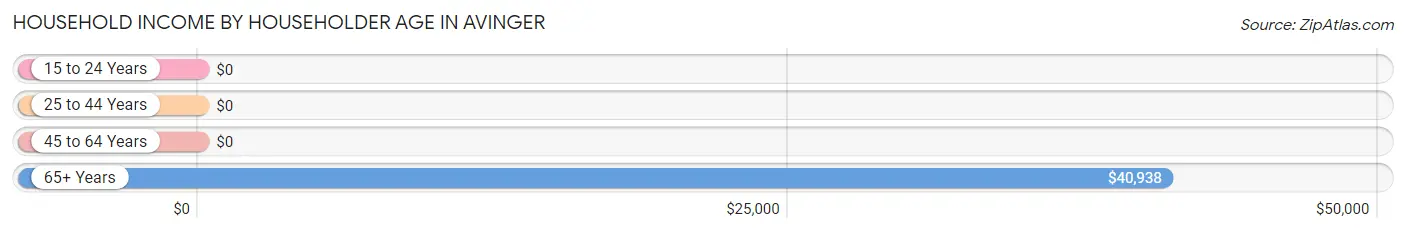
| Income Bracket | # Households | Median Income |
| 15 to 24 Years | 7 (4.0%) | $0 |
| 25 to 44 Years | 25 (14.2%) | $0 |
| 45 to 64 Years | 76 (43.2%) | $0 |
| 65+ Years | 68 (38.6%) | $40,938 |
| Total | 176 (100.0%) | $29,038 |
Poverty in Avinger
Income Below Poverty by Sex and Age in Avinger
With 29.8% poverty level for males and 23.1% for females among the residents of Avinger, 25 to 34 year old males and 16 and 17 year old females are the most vulnerable to poverty, with 5 males (62.5%) and 5 females (100.0%) in their respective age groups living below the poverty level.
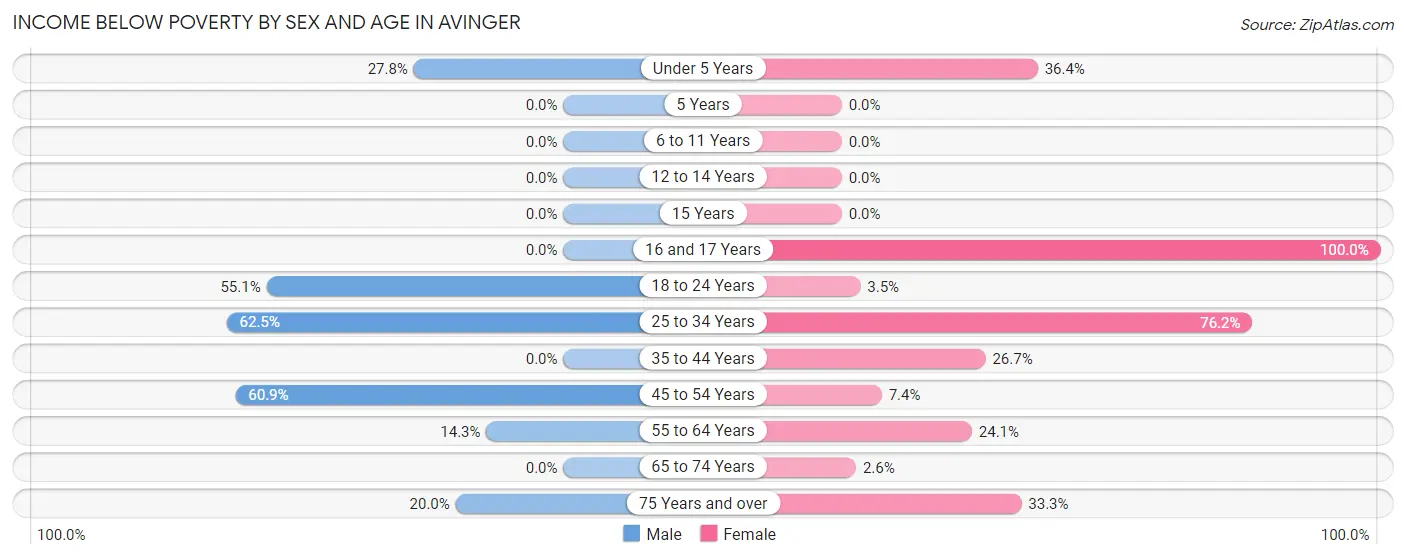
| Age Bracket | Male | Female |
| Under 5 Years | 5 (27.8%) | 8 (36.4%) |
| 5 Years | 0 (0.0%) | 0 (0.0%) |
| 6 to 11 Years | 0 (0.0%) | 0 (0.0%) |
| 12 to 14 Years | 0 (0.0%) | 0 (0.0%) |
| 15 Years | 0 (0.0%) | 0 (0.0%) |
| 16 and 17 Years | 0 (0.0%) | 5 (100.0%) |
| 18 to 24 Years | 27 (55.1%) | 1 (3.5%) |
| 25 to 34 Years | 5 (62.5%) | 16 (76.2%) |
| 35 to 44 Years | 0 (0.0%) | 8 (26.7%) |
| 45 to 54 Years | 28 (60.9%) | 2 (7.4%) |
| 55 to 64 Years | 4 (14.3%) | 7 (24.1%) |
| 65 to 74 Years | 0 (0.0%) | 1 (2.6%) |
| 75 Years and over | 2 (20.0%) | 5 (33.3%) |
| Total | 71 (29.8%) | 53 (23.1%) |
Income Above Poverty by Sex and Age in Avinger
According to the poverty statistics in Avinger, males aged 5 years and females aged 6 to 11 years are the age groups that are most secure financially, with 100.0% of males and 100.0% of females in these age groups living above the poverty line.
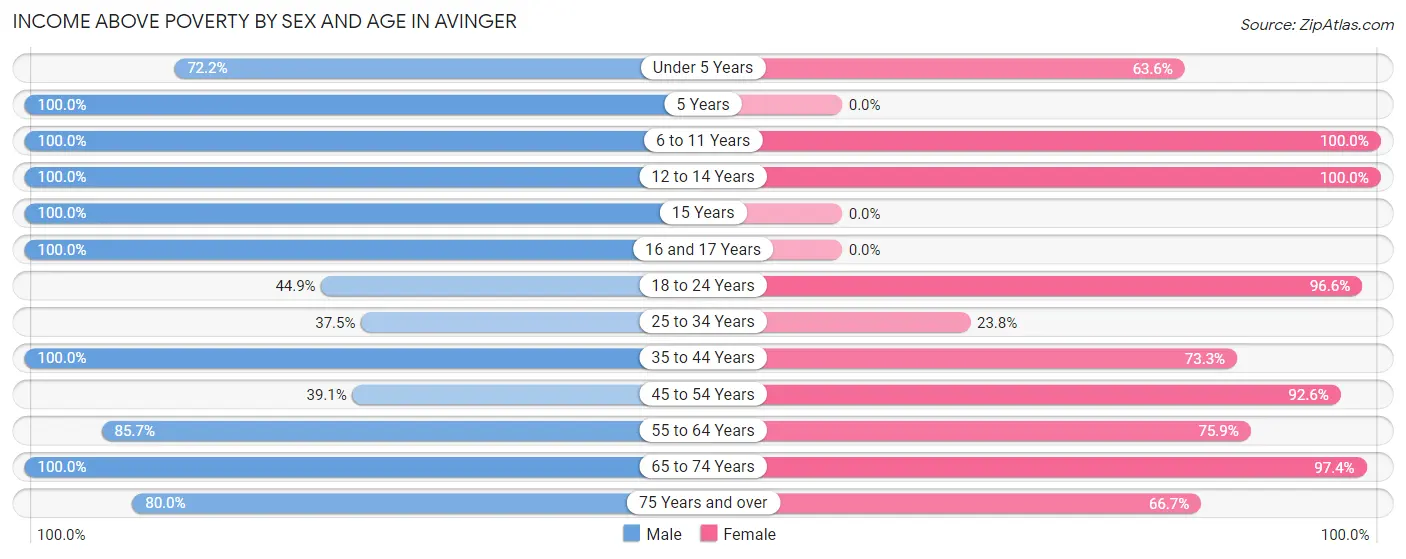
| Age Bracket | Male | Female |
| Under 5 Years | 13 (72.2%) | 14 (63.6%) |
| 5 Years | 2 (100.0%) | 0 (0.0%) |
| 6 to 11 Years | 10 (100.0%) | 3 (100.0%) |
| 12 to 14 Years | 2 (100.0%) | 10 (100.0%) |
| 15 Years | 5 (100.0%) | 0 (0.0%) |
| 16 and 17 Years | 16 (100.0%) | 0 (0.0%) |
| 18 to 24 Years | 22 (44.9%) | 28 (96.6%) |
| 25 to 34 Years | 3 (37.5%) | 5 (23.8%) |
| 35 to 44 Years | 11 (100.0%) | 22 (73.3%) |
| 45 to 54 Years | 18 (39.1%) | 25 (92.6%) |
| 55 to 64 Years | 24 (85.7%) | 22 (75.9%) |
| 65 to 74 Years | 33 (100.0%) | 37 (97.4%) |
| 75 Years and over | 8 (80.0%) | 10 (66.7%) |
| Total | 167 (70.2%) | 176 (76.9%) |
Income Below Poverty Among Married-Couple Families in Avinger
The poverty statistics for married-couple families in Avinger show that 13.5% or 7 of the total 52 families live below the poverty line. Families with 1 or 2 children have the highest poverty rate of 53.8%, comprising of 7 families. On the other hand, families with no children have the lowest poverty rate of 0.0%, which includes 0 families.
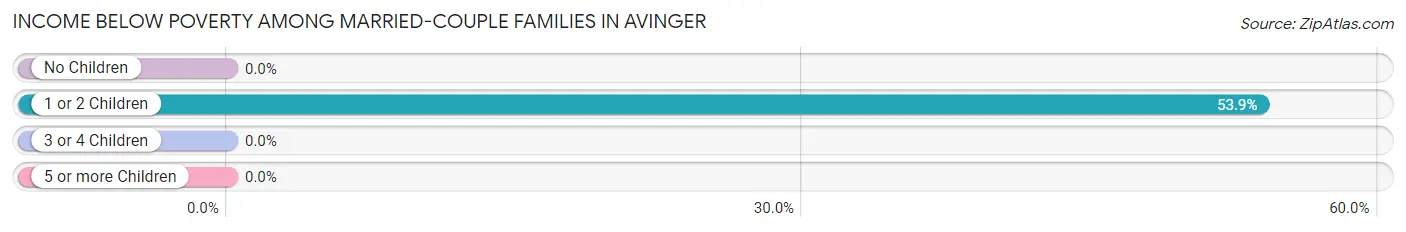
| Children | Above Poverty | Below Poverty |
| No Children | 27 (100.0%) | 0 (0.0%) |
| 1 or 2 Children | 6 (46.2%) | 7 (53.8%) |
| 3 or 4 Children | 12 (100.0%) | 0 (0.0%) |
| 5 or more Children | 0 (0.0%) | 0 (0.0%) |
| Total | 45 (86.5%) | 7 (13.5%) |
Income Below Poverty Among Single-Parent Households in Avinger
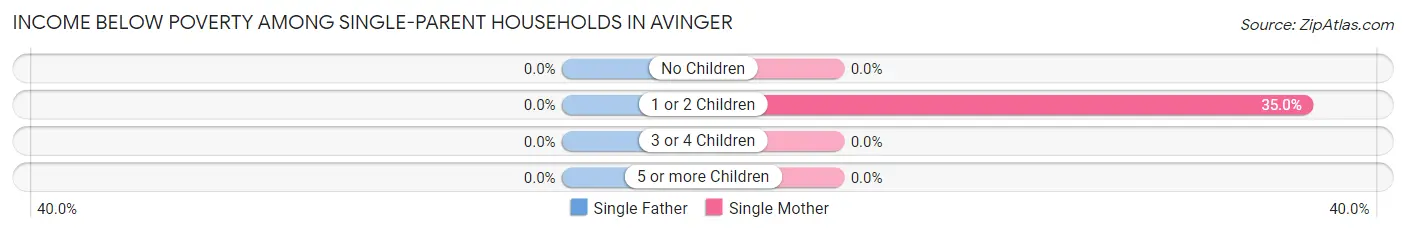
| Children | Single Father | Single Mother |
| No Children | 0 (0.0%) | 0 (0.0%) |
| 1 or 2 Children | 0 (0.0%) | 7 (35.0%) |
| 3 or 4 Children | 0 (0.0%) | 0 (0.0%) |
| 5 or more Children | 0 (0.0%) | 0 (0.0%) |
| Total | 0 (0.0%) | 7 (23.3%) |
Income Below Poverty Among Married-Couple vs Single-Parent Households in Avinger
The poverty data for Avinger shows that 7 of the married-couple family households (13.5%) and 7 of the single-parent households (23.3%) are living below the poverty level. Within the married-couple family households, those with 1 or 2 children have the highest poverty rate, with 7 households (53.8%) falling below the poverty line. Among the single-parent households, those with 1 or 2 children have the highest poverty rate, with 7 household (35.0%) living below poverty.
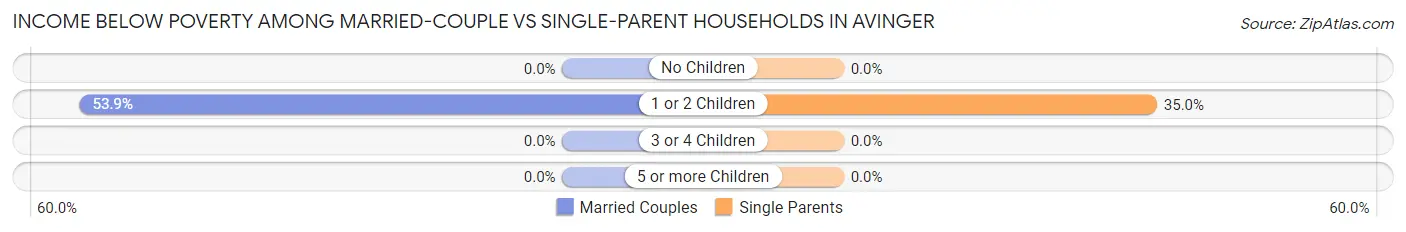
| Children | Married-Couple Families | Single-Parent Households |
| No Children | 0 (0.0%) | 0 (0.0%) |
| 1 or 2 Children | 7 (53.8%) | 7 (35.0%) |
| 3 or 4 Children | 0 (0.0%) | 0 (0.0%) |
| 5 or more Children | 0 (0.0%) | 0 (0.0%) |
| Total | 7 (13.5%) | 7 (23.3%) |
Race in Avinger
The most populous races in Avinger are White / Caucasian (287 | 61.1%), Black / African American (151 | 32.1%), and Hispanic or Latino (24 | 5.1%).
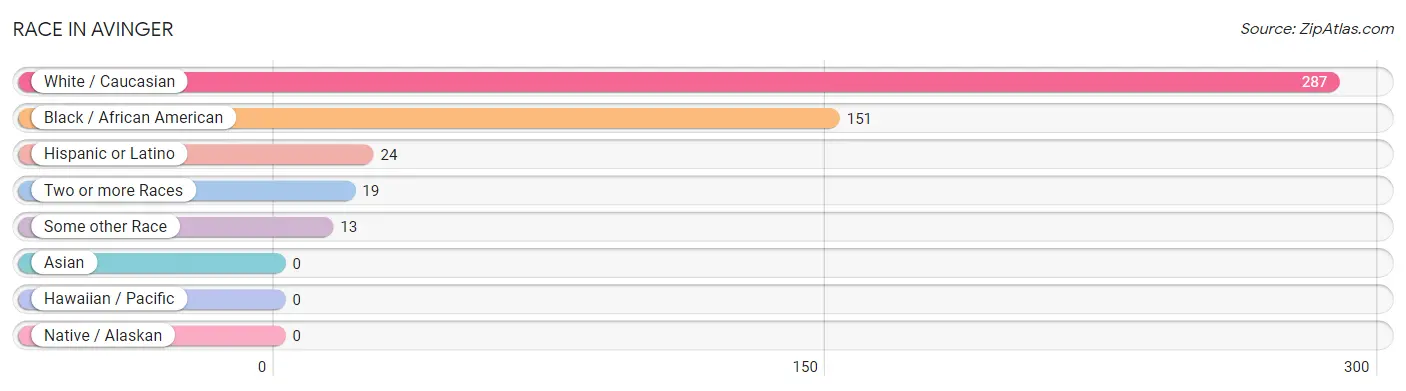
| Race | # Population | % Population |
| Asian | 0 | 0.0% |
| Black / African American | 151 | 32.1% |
| Hawaiian / Pacific | 0 | 0.0% |
| Hispanic or Latino | 24 | 5.1% |
| Native / Alaskan | 0 | 0.0% |
| White / Caucasian | 287 | 61.1% |
| Two or more Races | 19 | 4.0% |
| Some other Race | 13 | 2.8% |
| Total | 470 | 100.0% |
Ancestry in Avinger
The most populous ancestries reported in Avinger are American (282 | 60.0%), English (32 | 6.8%), Mexican (23 | 4.9%), Irish (17 | 3.6%), and Scottish (9 | 1.9%), together accounting for 77.2% of all Avinger residents.
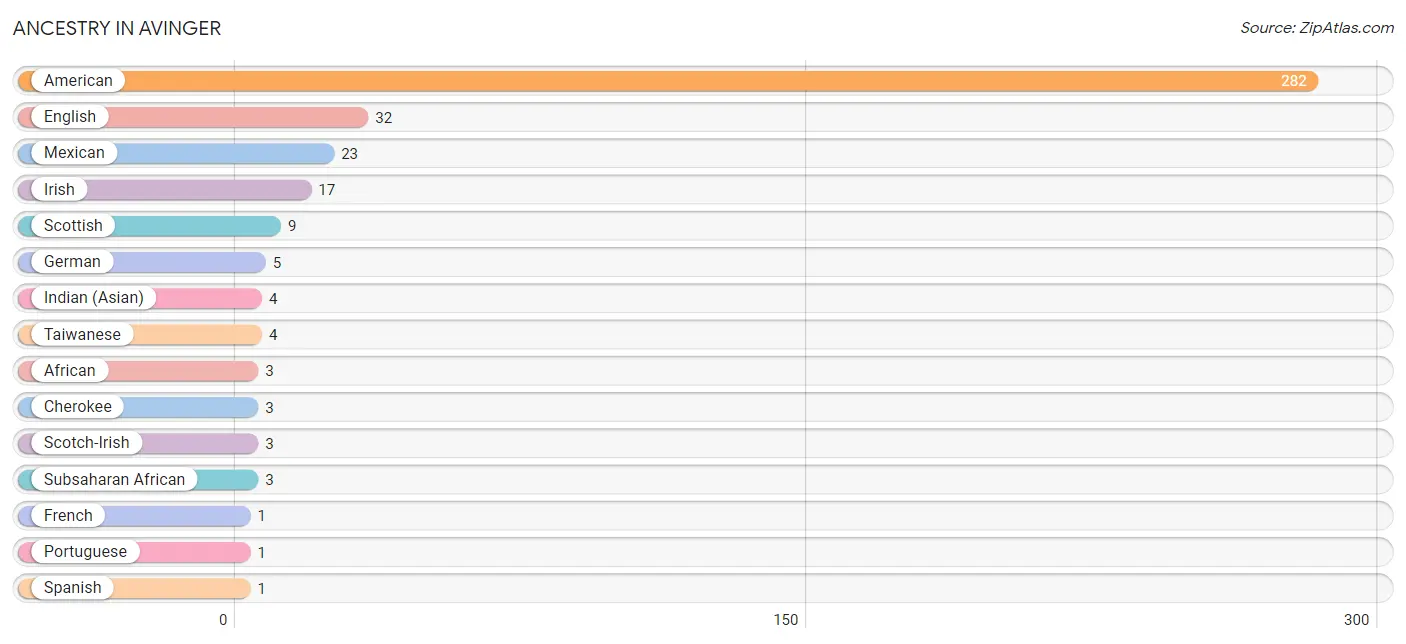
| Ancestry | # Population | % Population |
| African | 3 | 0.6% |
| American | 282 | 60.0% |
| Cherokee | 3 | 0.6% |
| English | 32 | 6.8% |
| French | 1 | 0.2% |
| German | 5 | 1.1% |
| Indian (Asian) | 4 | 0.9% |
| Irish | 17 | 3.6% |
| Mexican | 23 | 4.9% |
| Portuguese | 1 | 0.2% |
| Scotch-Irish | 3 | 0.6% |
| Scottish | 9 | 1.9% |
| Spanish | 1 | 0.2% |
| Subsaharan African | 3 | 0.6% |
| Taiwanese | 4 | 0.9% | View All 15 Rows |
Immigrants in Avinger
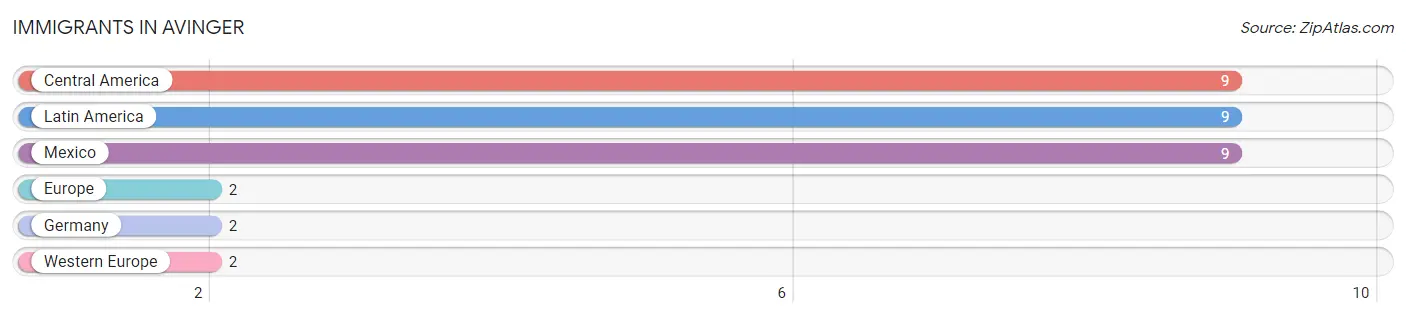
The most numerous immigrant groups reported in Avinger came from Central America (9 | 1.9%), Latin America (9 | 1.9%), Mexico (9 | 1.9%), Europe (2 | 0.4%), and Germany (2 | 0.4%), together accounting for 6.6% of all Avinger residents.
| Immigration Origin | # Population | % Population |
| Central America | 9 | 1.9% |
| Europe | 2 | 0.4% |
| Germany | 2 | 0.4% |
| Latin America | 9 | 1.9% |
| Mexico | 9 | 1.9% |
| Western Europe | 2 | 0.4% | View All 6 Rows |
Sex and Age in Avinger
Sex and Age in Avinger
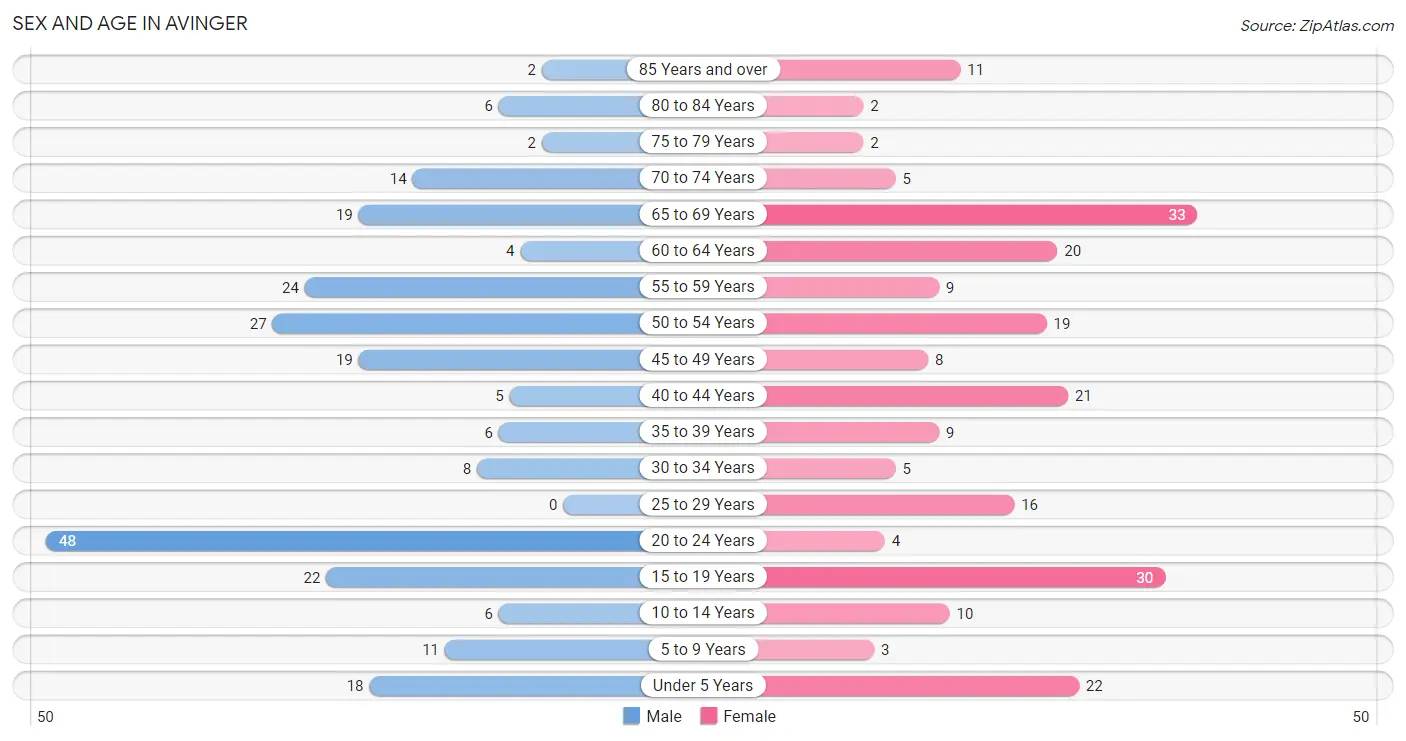
The most populous age groups in Avinger are 20 to 24 Years (48 | 19.9%) for men and 65 to 69 Years (33 | 14.4%) for women.
| Age Bracket | Male | Female |
| Under 5 Years | 18 (7.5%) | 22 (9.6%) |
| 5 to 9 Years | 11 (4.6%) | 3 (1.3%) |
| 10 to 14 Years | 6 (2.5%) | 10 (4.4%) |
| 15 to 19 Years | 22 (9.1%) | 30 (13.1%) |
| 20 to 24 Years | 48 (19.9%) | 4 (1.8%) |
| 25 to 29 Years | 0 (0.0%) | 16 (7.0%) |
| 30 to 34 Years | 8 (3.3%) | 5 (2.2%) |
| 35 to 39 Years | 6 (2.5%) | 9 (3.9%) |
| 40 to 44 Years | 5 (2.1%) | 21 (9.2%) |
| 45 to 49 Years | 19 (7.9%) | 8 (3.5%) |
| 50 to 54 Years | 27 (11.2%) | 19 (8.3%) |
| 55 to 59 Years | 24 (10.0%) | 9 (3.9%) |
| 60 to 64 Years | 4 (1.7%) | 20 (8.7%) |
| 65 to 69 Years | 19 (7.9%) | 33 (14.4%) |
| 70 to 74 Years | 14 (5.8%) | 5 (2.2%) |
| 75 to 79 Years | 2 (0.8%) | 2 (0.9%) |
| 80 to 84 Years | 6 (2.5%) | 2 (0.9%) |
| 85 Years and over | 2 (0.8%) | 11 (4.8%) |
| Total | 241 (100.0%) | 229 (100.0%) |
Families and Households in Avinger
Median Family Size in Avinger
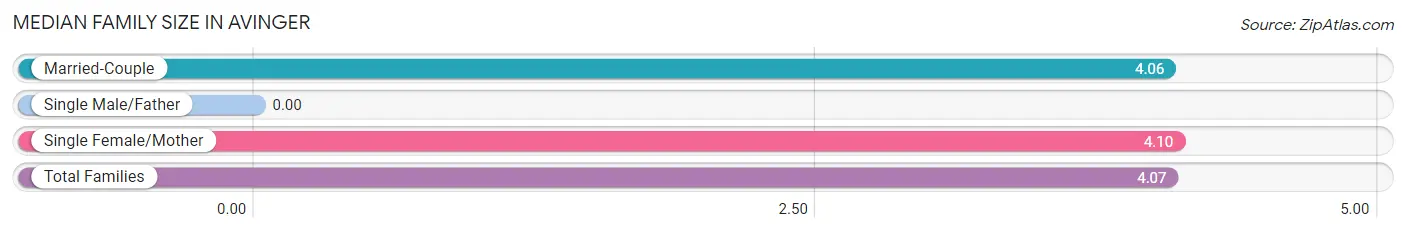
| Family Type | # Families | Family Size |
| Married-Couple | 52 (63.4%) | 4.06 |
| Single Male/Father | 0 (0.0%) | - |
| Single Female/Mother | 30 (36.6%) | 4.10 |
| Total Families | 82 (100.0%) | 4.07 |
Median Household Size in Avinger
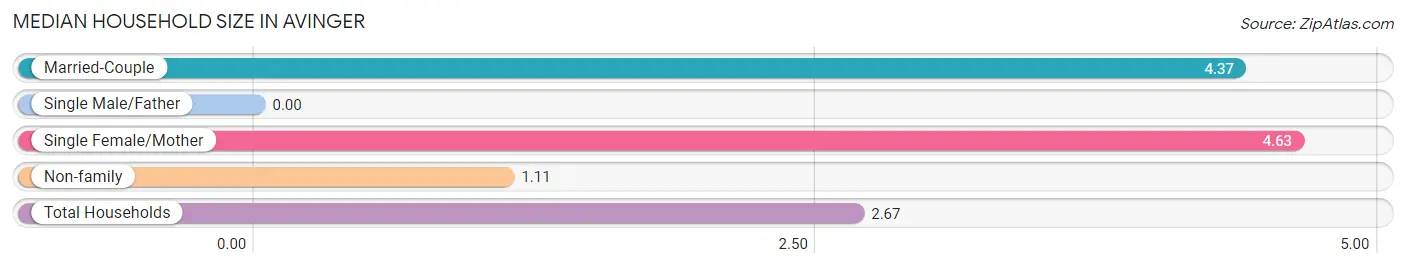
| Household Type | # Households | Household Size |
| Married-Couple | 52 (29.5%) | 4.37 |
| Single Male/Father | 0 (0.0%) | - |
| Single Female/Mother | 30 (17.1%) | 4.63 |
| Non-family | 94 (53.4%) | 1.11 |
| Total Households | 176 (100.0%) | 2.67 |
Household Size by Marriage Status in Avinger
Out of a total of 176 households in Avinger, 82 (46.6%) are family households, while 94 (53.4%) are nonfamily households. The most numerous type of family households are 2-person households, comprising 28, and the most common type of nonfamily households are 1-person households, comprising 87.
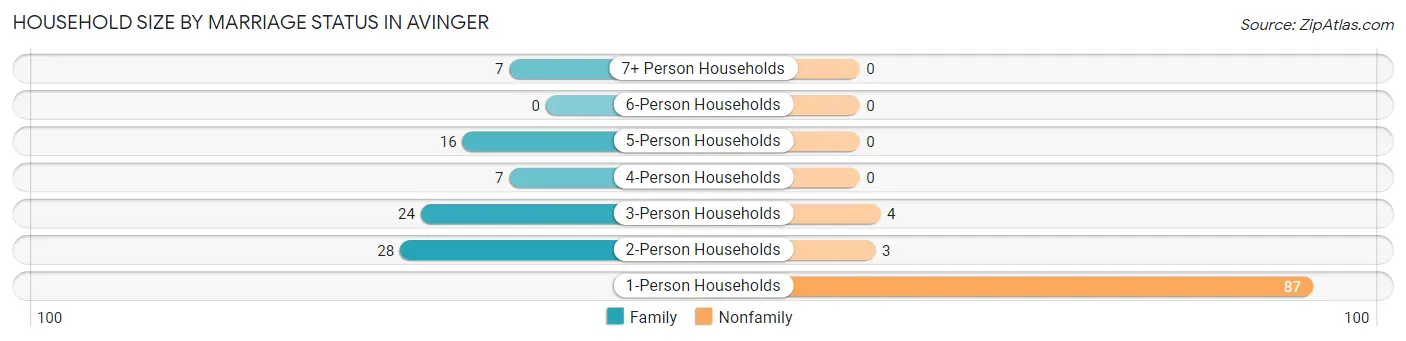
| Household Size | Family Households | Nonfamily Households |
| 1-Person Households | - | 87 (49.4%) |
| 2-Person Households | 28 (15.9%) | 3 (1.7%) |
| 3-Person Households | 24 (13.6%) | 4 (2.3%) |
| 4-Person Households | 7 (4.0%) | 0 (0.0%) |
| 5-Person Households | 16 (9.1%) | 0 (0.0%) |
| 6-Person Households | 0 (0.0%) | 0 (0.0%) |
| 7+ Person Households | 7 (4.0%) | 0 (0.0%) |
| Total | 82 (46.6%) | 94 (53.4%) |
Female Fertility in Avinger
Fertility by Age in Avinger
Average fertility rate in Avinger is 50.0 births per 1,000 women. Women in the age bracket of 35 to 50 years have the highest fertility rate with 111.0 births per 1,000 women. Women in the age bracket of 35 to 50 years acount for 100.0% of all women with births.
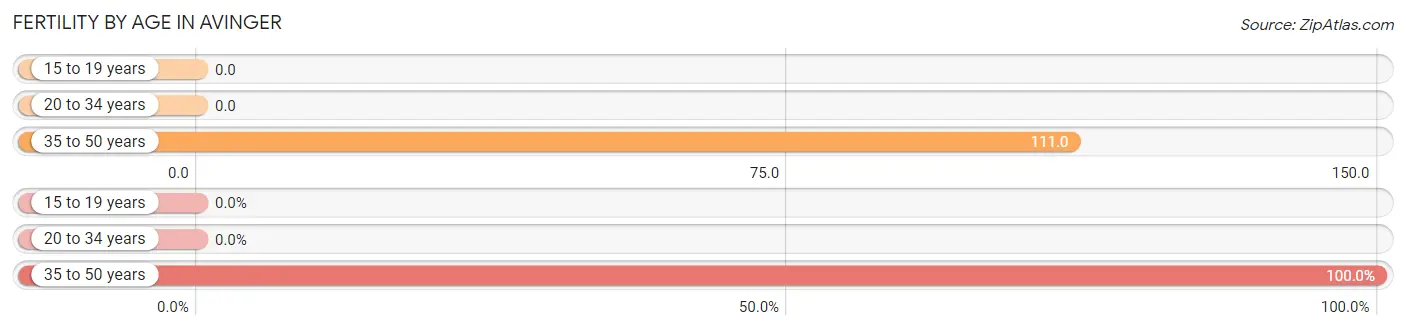
| Age Bracket | Women with Births | Births / 1,000 Women |
| 15 to 19 years | 0 (0.0%) | 0.0 |
| 20 to 34 years | 0 (0.0%) | 0.0 |
| 35 to 50 years | 5 (100.0%) | 111.0 |
| Total | 5 (100.0%) | 50.0 |
Fertility by Age by Marriage Status in Avinger
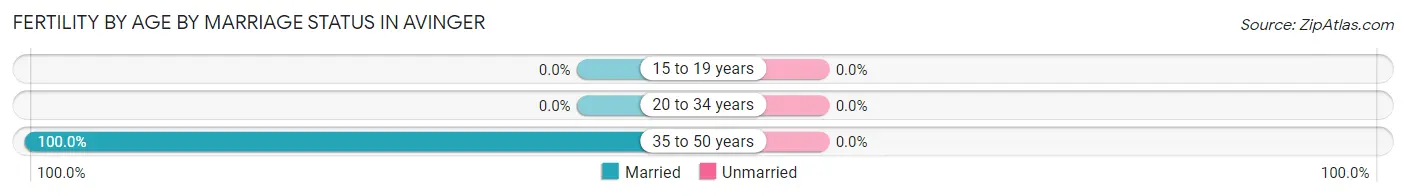
| Age Bracket | Married | Unmarried |
| 15 to 19 years | 0 (0.0%) | 0 (0.0%) |
| 20 to 34 years | 0 (0.0%) | 0 (0.0%) |
| 35 to 50 years | 5 (100.0%) | 0 (0.0%) |
| Total | 5 (100.0%) | 0 (0.0%) |
Fertility by Education in Avinger
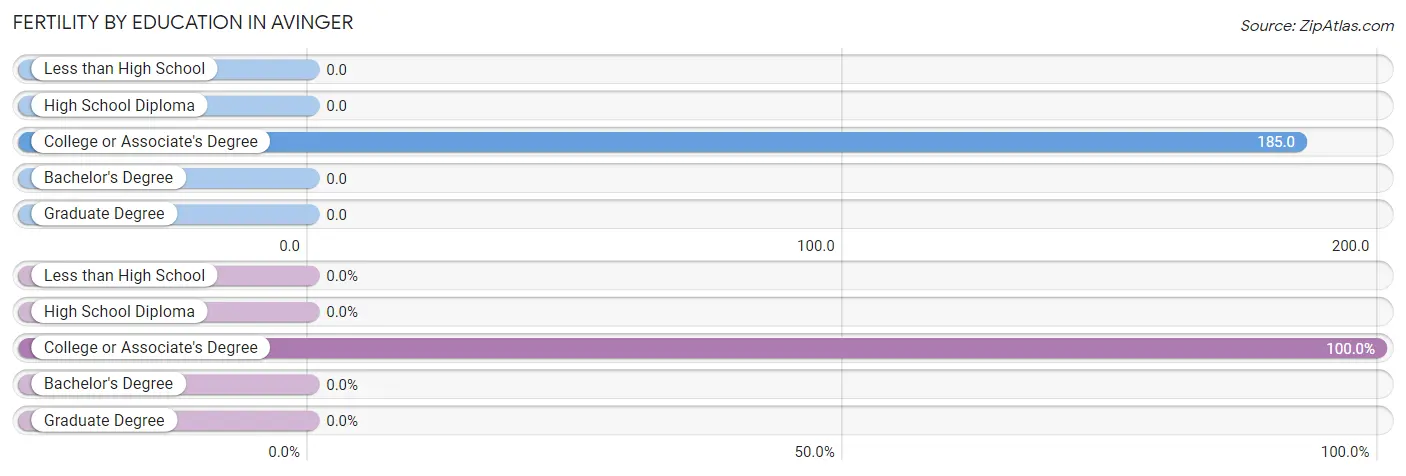
| Educational Attainment | Women with Births | Births / 1,000 Women |
| Less than High School | 0 (0.0%) | 0.0 |
| High School Diploma | 0 (0.0%) | 0.0 |
| College or Associate's Degree | 5 (100.0%) | 185.0 |
| Bachelor's Degree | 0 (0.0%) | 0.0 |
| Graduate Degree | 0 (0.0%) | 0.0 |
| Total | 5 (100.0%) | 50.0 |
Fertility by Education by Marriage Status in Avinger
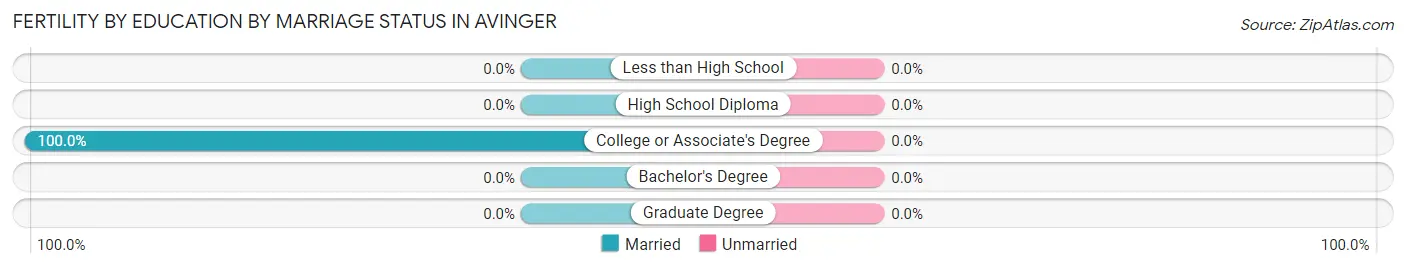
| Educational Attainment | Married | Unmarried |
| Less than High School | 0 (0.0%) | 0 (0.0%) |
| High School Diploma | 0 (0.0%) | 0 (0.0%) |
| College or Associate's Degree | 5 (100.0%) | 0 (0.0%) |
| Bachelor's Degree | 0 (0.0%) | 0 (0.0%) |
| Graduate Degree | 0 (0.0%) | 0 (0.0%) |
| Total | 5 (100.0%) | 0 (0.0%) |
Employment Characteristics in Avinger
Employment by Class of Employer in Avinger
Among the 146 employed individuals in Avinger, private company employees (107 | 73.3%), self-employed (not incorporated) (15 | 10.3%), and not-for-profit organizations (15 | 10.3%) make up the most common classes of employment.
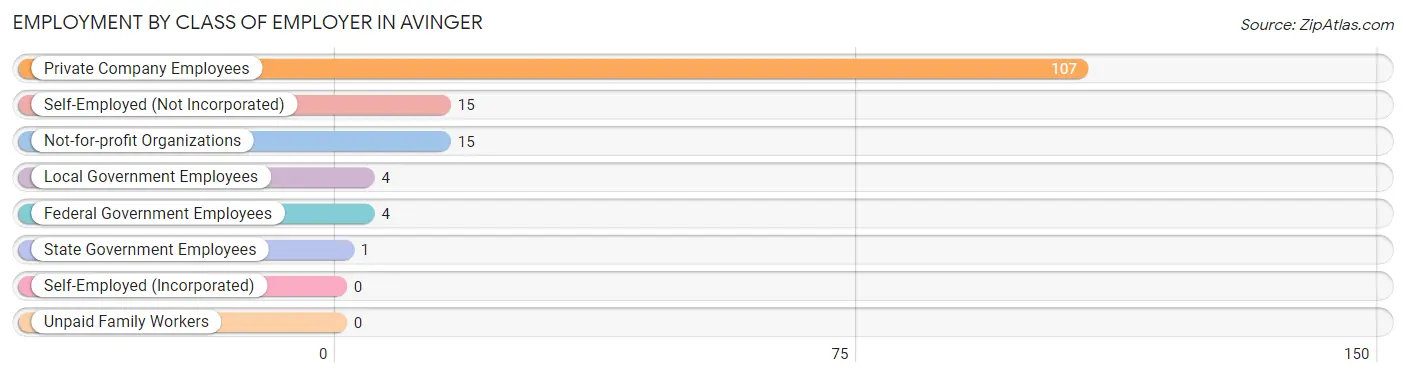
| Employer Class | # Employees | % Employees |
| Private Company Employees | 107 | 73.3% |
| Self-Employed (Incorporated) | 0 | 0.0% |
| Self-Employed (Not Incorporated) | 15 | 10.3% |
| Not-for-profit Organizations | 15 | 10.3% |
| Local Government Employees | 4 | 2.7% |
| State Government Employees | 1 | 0.7% |
| Federal Government Employees | 4 | 2.7% |
| Unpaid Family Workers | 0 | 0.0% |
| Total | 146 | 100.0% |
Employment Status by Age in Avinger
According to the labor force statistics for Avinger, out of the total population over 16 years of age (395), 42.5% or 168 individuals are in the labor force, with 13.1% or 22 of them unemployed. The age group with the highest labor force participation rate is 45 to 54 years, with 100.0% or 73 individuals in the labor force. Within the labor force, the 25 to 29 years age range has the highest percentage of unemployed individuals, with 100.0% or 7 of them being unemployed.
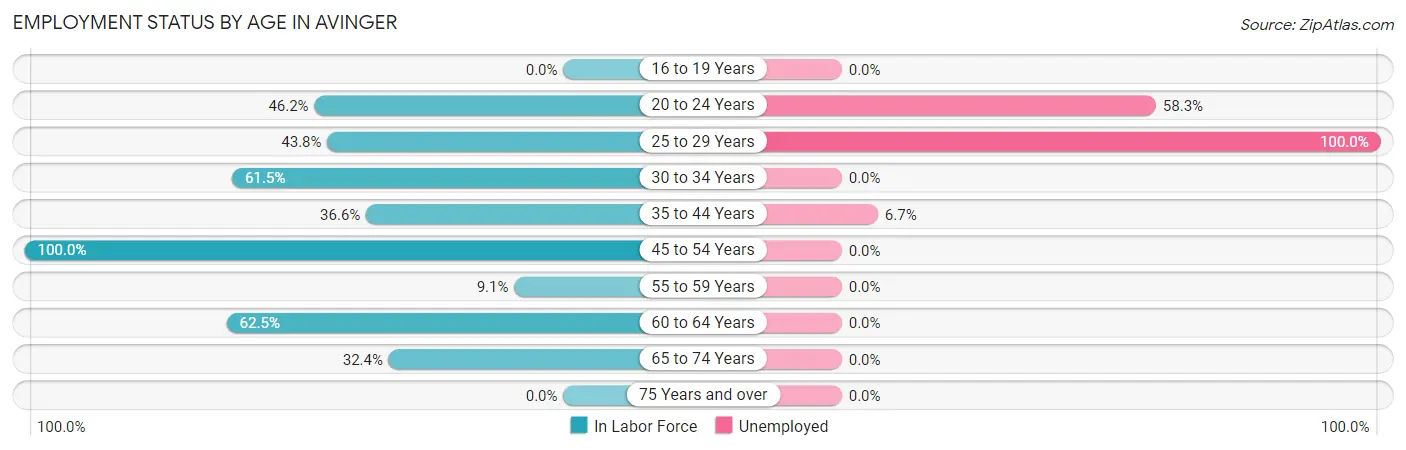
| Age Bracket | In Labor Force | Unemployed |
| 16 to 19 Years | 0 (0.0%) | 0 (0.0%) |
| 20 to 24 Years | 24 (46.2%) | 14 (58.3%) |
| 25 to 29 Years | 7 (43.8%) | 7 (100.0%) |
| 30 to 34 Years | 8 (61.5%) | 0 (0.0%) |
| 35 to 44 Years | 15 (36.6%) | 1 (6.7%) |
| 45 to 54 Years | 73 (100.0%) | 0 (0.0%) |
| 55 to 59 Years | 3 (9.1%) | 0 (0.0%) |
| 60 to 64 Years | 15 (62.5%) | 0 (0.0%) |
| 65 to 74 Years | 23 (32.4%) | 0 (0.0%) |
| 75 Years and over | 0 (0.0%) | 0 (0.0%) |
| Total | 168 (42.5%) | 22 (13.1%) |
Employment Status by Educational Attainment in Avinger
According to labor force statistics for Avinger, 60.5% of individuals (121) out of the total population between 25 and 64 years of age (200) are in the labor force, with 6.6% or 8 of them being unemployed. The group with the highest labor force participation rate are those with the educational attainment of less than high school, with 66.7% or 4 individuals in the labor force. Within the labor force, individuals with high school diploma education have the highest percentage of unemployment, with 7.4% or 7 of them being unemployed.
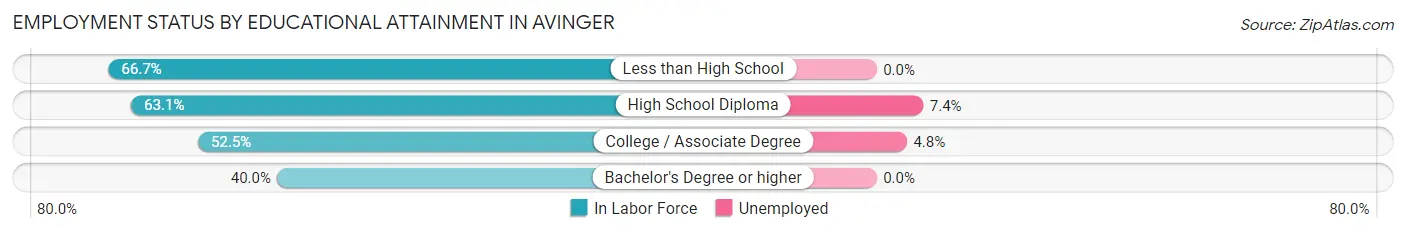
| Educational Attainment | In Labor Force | Unemployed |
| Less than High School | 4 (66.7%) | 0 (0.0%) |
| High School Diploma | 94 (63.1%) | 11 (7.4%) |
| College / Associate Degree | 21 (52.5%) | 2 (4.8%) |
| Bachelor's Degree or higher | 2 (40.0%) | 0 (0.0%) |
| Total | 121 (60.5%) | 13 (6.6%) |
Employment Occupations by Sex in Avinger
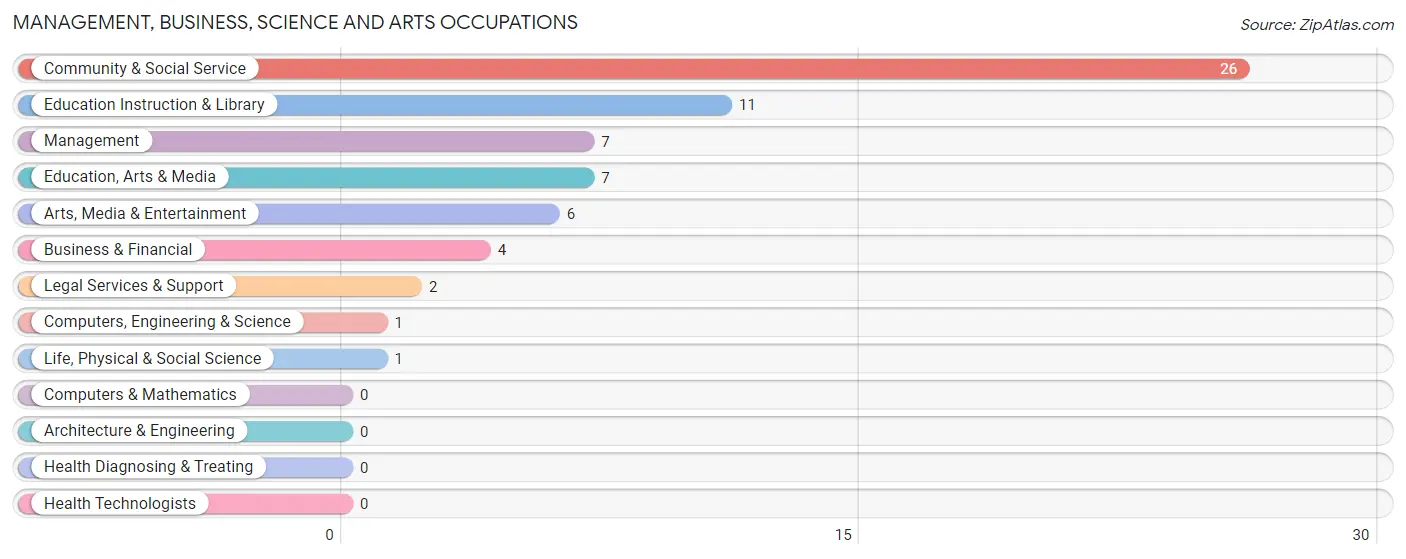
Management, Business, Science and Arts Occupations
The most common Management, Business, Science and Arts occupations in Avinger are Community & Social Service (26 | 17.8%), Education Instruction & Library (11 | 7.5%), Management (7 | 4.8%), Education, Arts & Media (7 | 4.8%), and Arts, Media & Entertainment (6 | 4.1%).
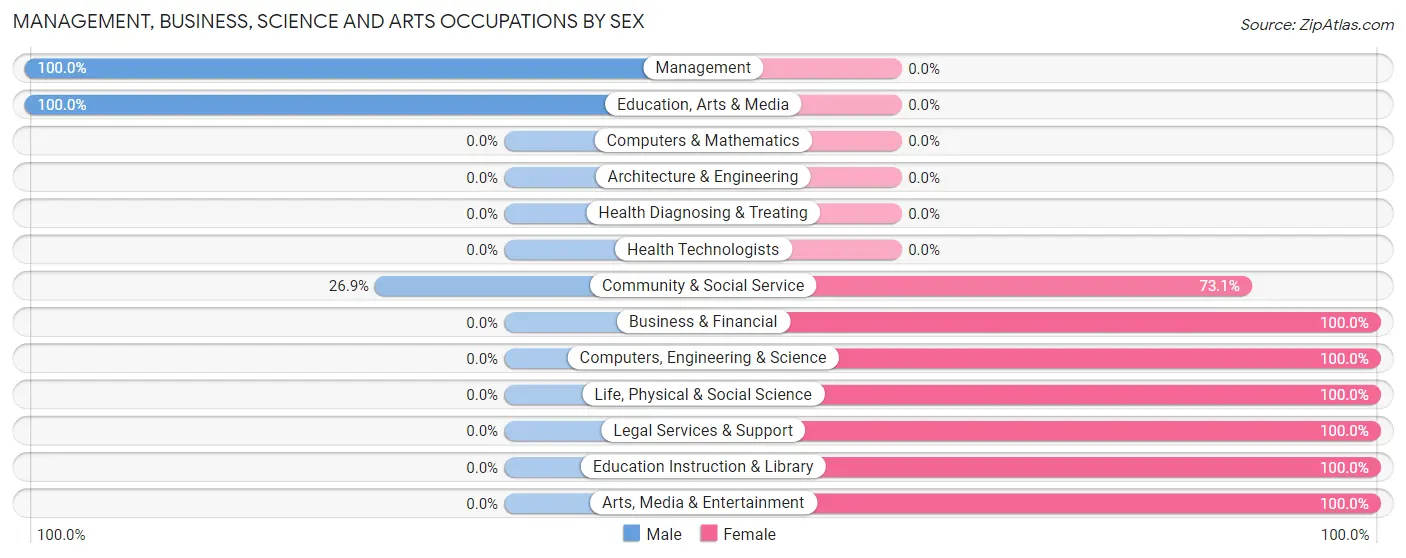
Management, Business, Science and Arts Occupations by Sex
Within the Management, Business, Science and Arts occupations in Avinger, the most male-oriented occupations are Management (100.0%), Education, Arts & Media (100.0%), and Community & Social Service (26.9%), while the most female-oriented occupations are Business & Financial (100.0%), Computers, Engineering & Science (100.0%), and Life, Physical & Social Science (100.0%).
| Occupation | Male | Female |
| Management | 7 (100.0%) | 0 (0.0%) |
| Business & Financial | 0 (0.0%) | 4 (100.0%) |
| Computers, Engineering & Science | 0 (0.0%) | 1 (100.0%) |
| Computers & Mathematics | 0 (0.0%) | 0 (0.0%) |
| Architecture & Engineering | 0 (0.0%) | 0 (0.0%) |
| Life, Physical & Social Science | 0 (0.0%) | 1 (100.0%) |
| Community & Social Service | 7 (26.9%) | 19 (73.1%) |
| Education, Arts & Media | 7 (100.0%) | 0 (0.0%) |
| Legal Services & Support | 0 (0.0%) | 2 (100.0%) |
| Education Instruction & Library | 0 (0.0%) | 11 (100.0%) |
| Arts, Media & Entertainment | 0 (0.0%) | 6 (100.0%) |
| Health Diagnosing & Treating | 0 (0.0%) | 0 (0.0%) |
| Health Technologists | 0 (0.0%) | 0 (0.0%) |
| Total (Category) | 14 (36.8%) | 24 (63.2%) |
| Total (Overall) | 79 (54.1%) | 67 (45.9%) |
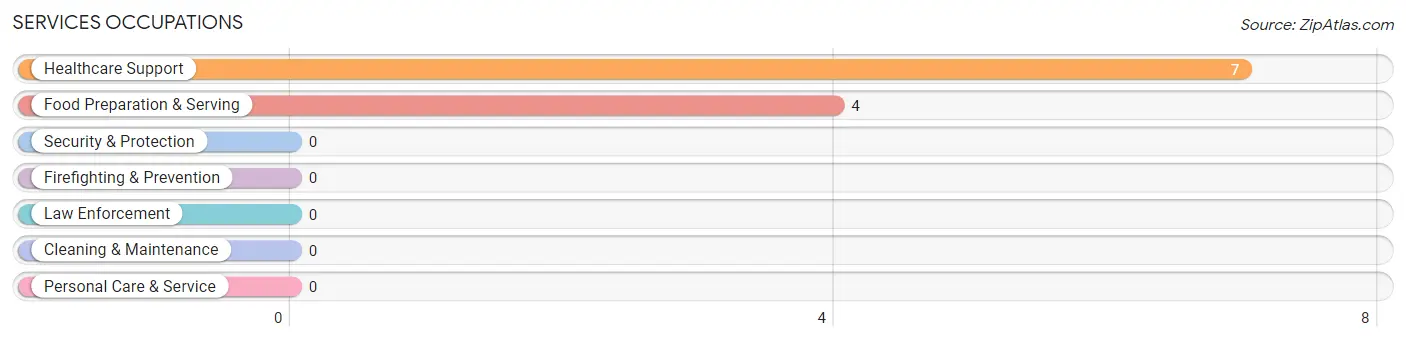
Services Occupations
The most common Services occupations in Avinger are Healthcare Support (7 | 4.8%), and Food Preparation & Serving (4 | 2.7%).
Services Occupations by Sex
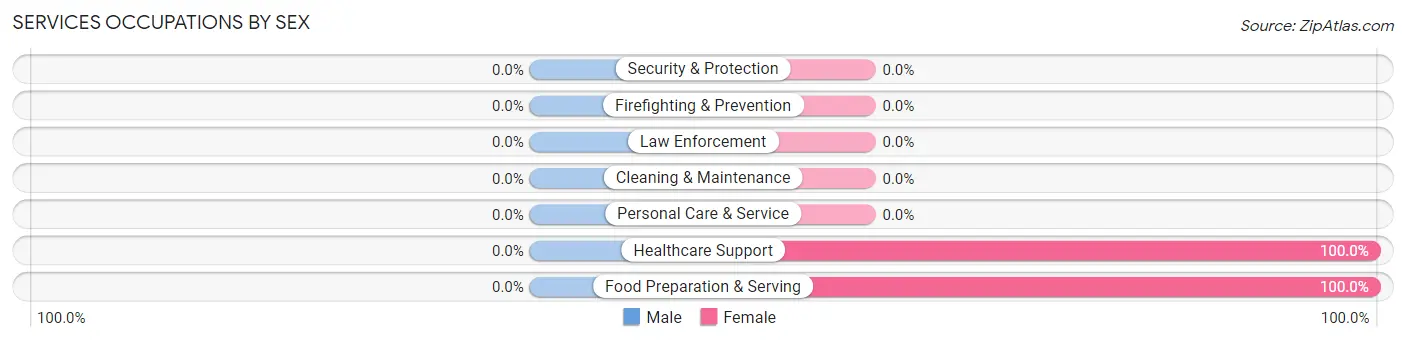
| Occupation | Male | Female |
| Healthcare Support | 0 (0.0%) | 7 (100.0%) |
| Security & Protection | 0 (0.0%) | 0 (0.0%) |
| Firefighting & Prevention | 0 (0.0%) | 0 (0.0%) |
| Law Enforcement | 0 (0.0%) | 0 (0.0%) |
| Food Preparation & Serving | 0 (0.0%) | 4 (100.0%) |
| Cleaning & Maintenance | 0 (0.0%) | 0 (0.0%) |
| Personal Care & Service | 0 (0.0%) | 0 (0.0%) |
| Total (Category) | 0 (0.0%) | 11 (100.0%) |
| Total (Overall) | 79 (54.1%) | 67 (45.9%) |
Sales and Office Occupations
The most common Sales and Office occupations in Avinger are Sales & Related (22 | 15.1%), and Office & Administration (16 | 11.0%).
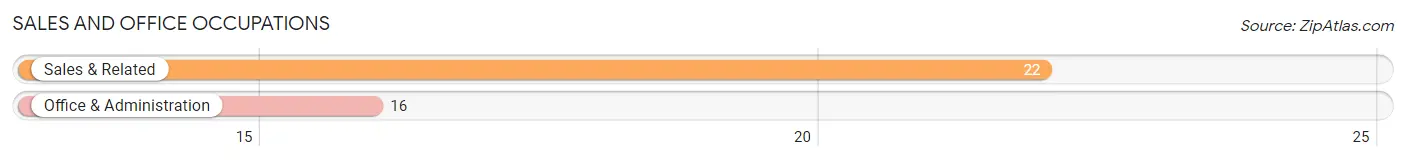
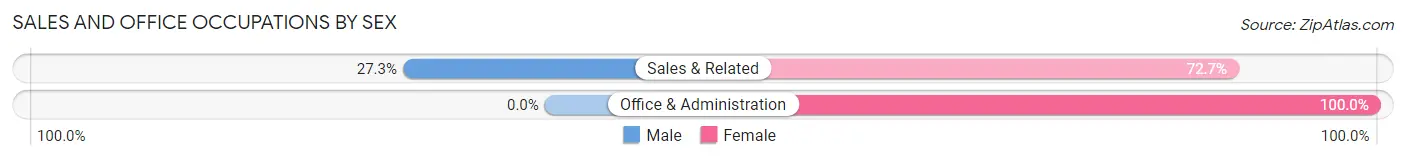
Sales and Office Occupations by Sex
| Occupation | Male | Female |
| Sales & Related | 6 (27.3%) | 16 (72.7%) |
| Office & Administration | 0 (0.0%) | 16 (100.0%) |
| Total (Category) | 6 (15.8%) | 32 (84.2%) |
| Total (Overall) | 79 (54.1%) | 67 (45.9%) |
Natural Resources, Construction and Maintenance Occupations
The most common Natural Resources, Construction and Maintenance occupations in Avinger are Construction & Extraction (10 | 6.9%), and Farming, Fishing & Forestry (5 | 3.4%).
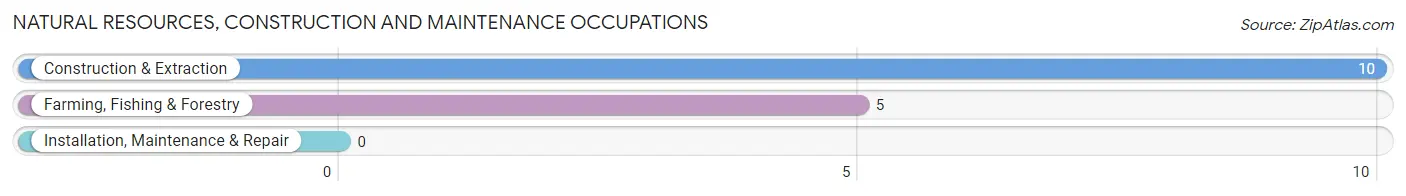
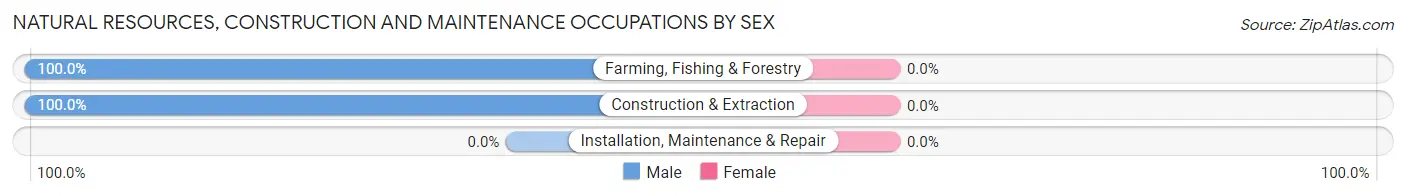
Natural Resources, Construction and Maintenance Occupations by Sex
| Occupation | Male | Female |
| Farming, Fishing & Forestry | 5 (100.0%) | 0 (0.0%) |
| Construction & Extraction | 10 (100.0%) | 0 (0.0%) |
| Installation, Maintenance & Repair | 0 (0.0%) | 0 (0.0%) |
| Total (Category) | 15 (100.0%) | 0 (0.0%) |
| Total (Overall) | 79 (54.1%) | 67 (45.9%) |
Production, Transportation and Moving Occupations
The most common Production, Transportation and Moving occupations in Avinger are Material Moving (29 | 19.9%), Transportation (9 | 6.2%), and Production (6 | 4.1%).
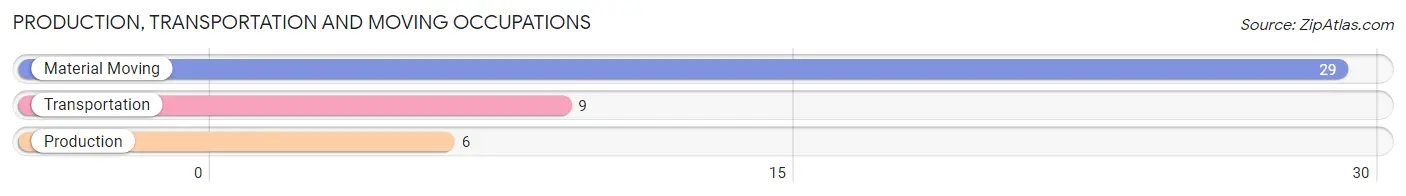
Production, Transportation and Moving Occupations by Sex
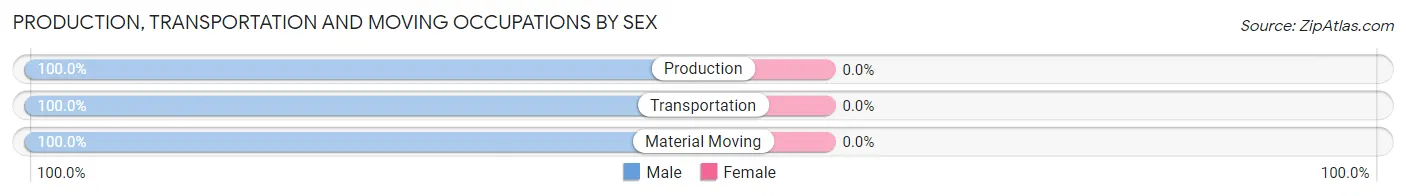
| Occupation | Male | Female |
| Production | 6 (100.0%) | 0 (0.0%) |
| Transportation | 9 (100.0%) | 0 (0.0%) |
| Material Moving | 29 (100.0%) | 0 (0.0%) |
| Total (Category) | 44 (100.0%) | 0 (0.0%) |
| Total (Overall) | 79 (54.1%) | 67 (45.9%) |
Employment Industries by Sex in Avinger
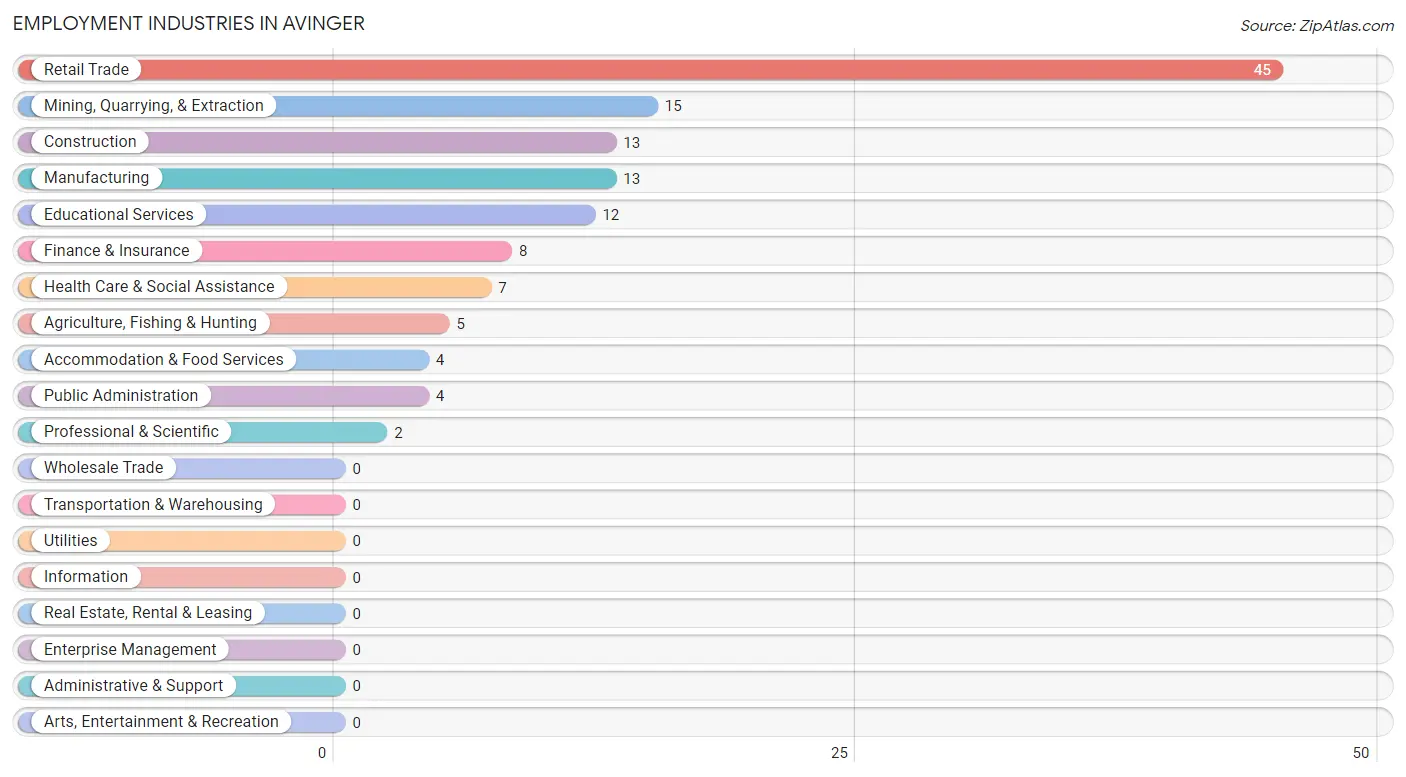
Employment Industries in Avinger
The major employment industries in Avinger include Retail Trade (45 | 30.8%), Mining, Quarrying, & Extraction (15 | 10.3%), Construction (13 | 8.9%), Manufacturing (13 | 8.9%), and Educational Services (12 | 8.2%).
Employment Industries by Sex in Avinger
The Avinger industries that see more men than women are Agriculture, Fishing & Hunting (100.0%), Mining, Quarrying, & Extraction (100.0%), and Construction (100.0%), whereas the industries that tend to have a higher number of women are Professional & Scientific (100.0%), Educational Services (100.0%), and Health Care & Social Assistance (100.0%).
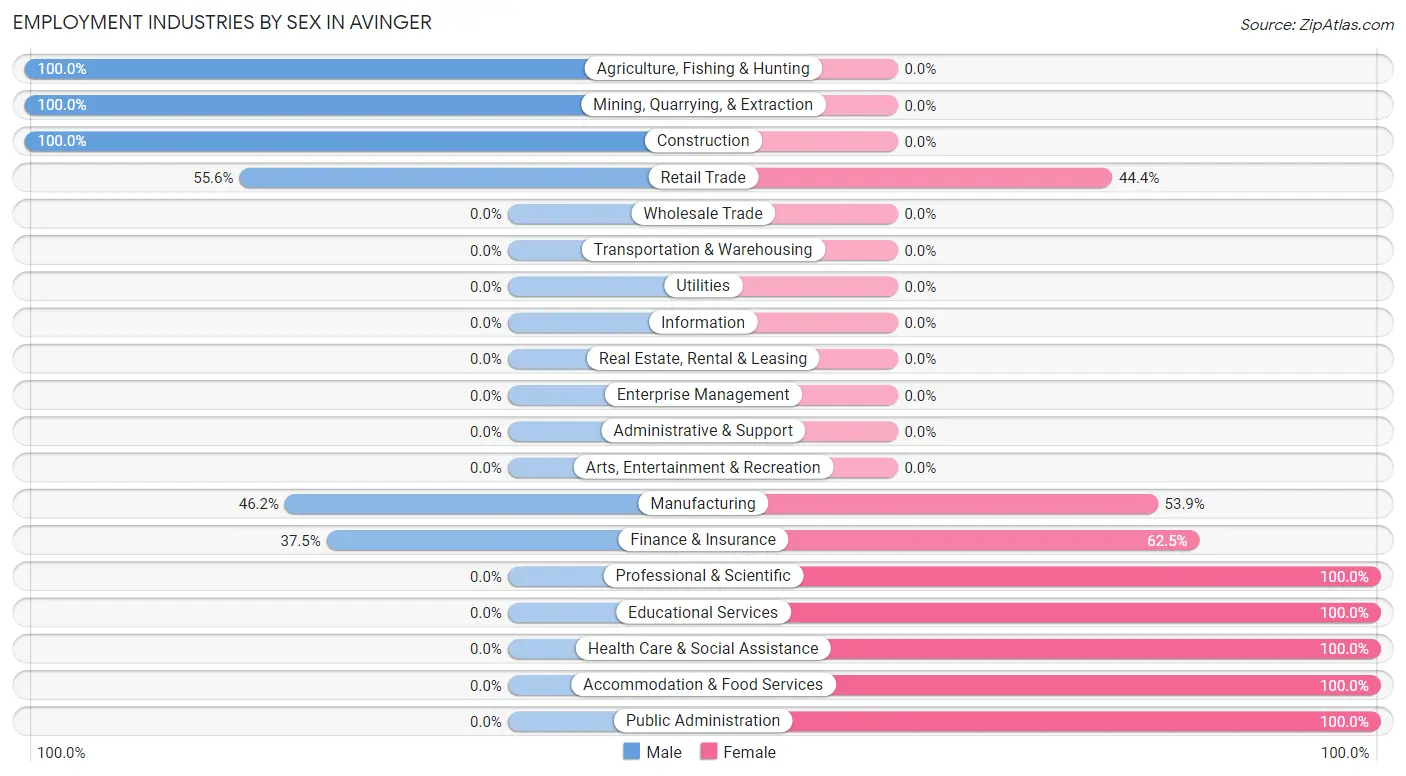
| Industry | Male | Female |
| Agriculture, Fishing & Hunting | 5 (100.0%) | 0 (0.0%) |
| Mining, Quarrying, & Extraction | 15 (100.0%) | 0 (0.0%) |
| Construction | 13 (100.0%) | 0 (0.0%) |
| Manufacturing | 6 (46.2%) | 7 (53.8%) |
| Wholesale Trade | 0 (0.0%) | 0 (0.0%) |
| Retail Trade | 25 (55.6%) | 20 (44.4%) |
| Transportation & Warehousing | 0 (0.0%) | 0 (0.0%) |
| Utilities | 0 (0.0%) | 0 (0.0%) |
| Information | 0 (0.0%) | 0 (0.0%) |
| Finance & Insurance | 3 (37.5%) | 5 (62.5%) |
| Real Estate, Rental & Leasing | 0 (0.0%) | 0 (0.0%) |
| Professional & Scientific | 0 (0.0%) | 2 (100.0%) |
| Enterprise Management | 0 (0.0%) | 0 (0.0%) |
| Administrative & Support | 0 (0.0%) | 0 (0.0%) |
| Educational Services | 0 (0.0%) | 12 (100.0%) |
| Health Care & Social Assistance | 0 (0.0%) | 7 (100.0%) |
| Arts, Entertainment & Recreation | 0 (0.0%) | 0 (0.0%) |
| Accommodation & Food Services | 0 (0.0%) | 4 (100.0%) |
| Public Administration | 0 (0.0%) | 4 (100.0%) |
| Total | 79 (54.1%) | 67 (45.9%) |
Education in Avinger
School Enrollment in Avinger
The most common levels of schooling among the 93 students in Avinger are high school (49 | 52.7%), middle school (13 | 14.0%), and college / undergraduate (13 | 14.0%).
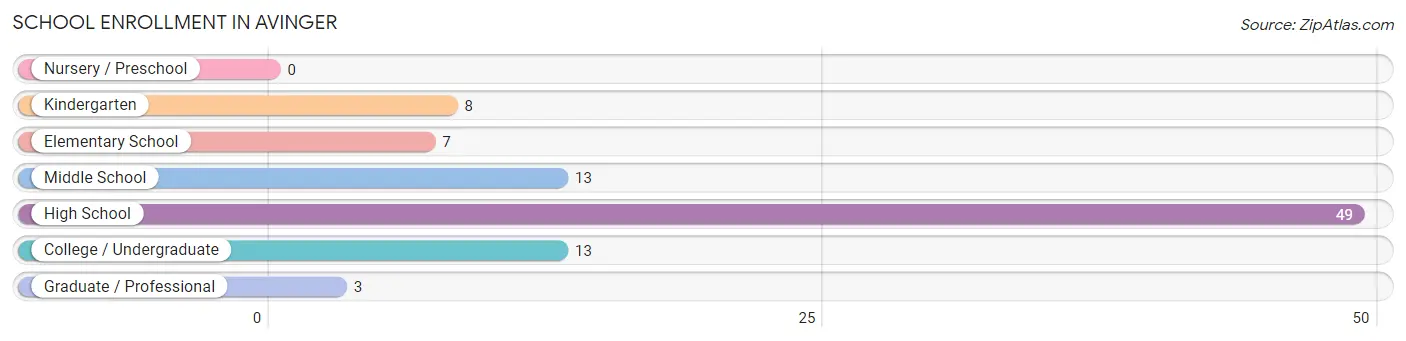
| School Level | # Students | % Students |
| Nursery / Preschool | 0 | 0.0% |
| Kindergarten | 8 | 8.6% |
| Elementary School | 7 | 7.5% |
| Middle School | 13 | 14.0% |
| High School | 49 | 52.7% |
| College / Undergraduate | 13 | 14.0% |
| Graduate / Professional | 3 | 3.2% |
| Total | 93 | 100.0% |
School Enrollment by Age by Funding Source in Avinger
Out of a total of 93 students who are enrolled in schools in Avinger, 1 (1.1%) attend a private institution, while the remaining 92 (98.9%) are enrolled in public schools. The age group of 18 to 19 year olds has the highest likelihood of being enrolled in private schools, with 1 (3.8% in the age bracket) enrolled. Conversely, the age group of 5 to 9 year old has the lowest likelihood of being enrolled in a private school, with 14 (100.0% in the age bracket) attending a public institution.
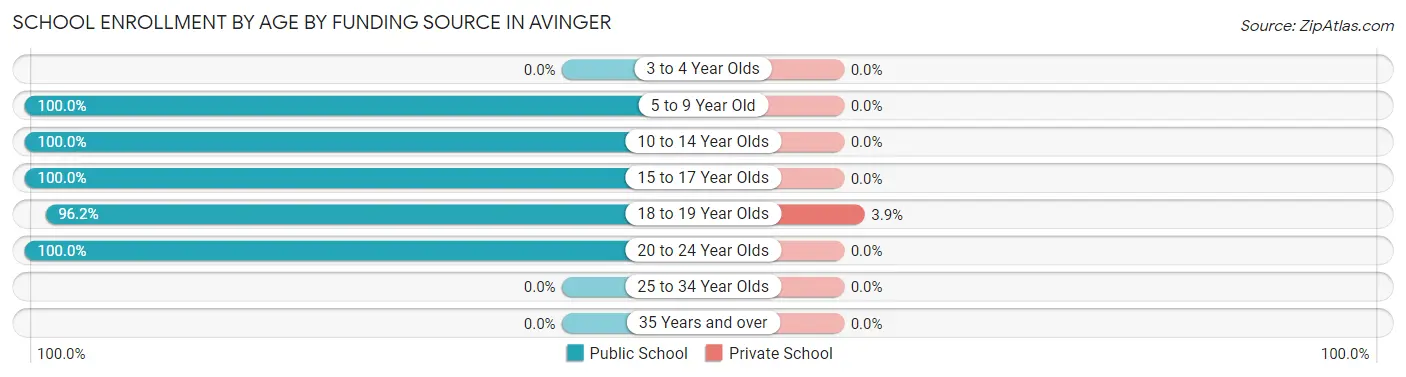
| Age Bracket | Public School | Private School |
| 3 to 4 Year Olds | 0 (0.0%) | 0 (0.0%) |
| 5 to 9 Year Old | 14 (100.0%) | 0 (0.0%) |
| 10 to 14 Year Olds | 9 (100.0%) | 0 (0.0%) |
| 15 to 17 Year Olds | 26 (100.0%) | 0 (0.0%) |
| 18 to 19 Year Olds | 25 (96.2%) | 1 (3.8%) |
| 20 to 24 Year Olds | 18 (100.0%) | 0 (0.0%) |
| 25 to 34 Year Olds | 0 (0.0%) | 0 (0.0%) |
| 35 Years and over | 0 (0.0%) | 0 (0.0%) |
| Total | 92 (98.9%) | 1 (1.1%) |
Educational Attainment by Field of Study in Avinger
Education (14 | 46.7%), business (4 | 13.3%), physical & health sciences (3 | 10.0%), literature & languages (3 | 10.0%), and social sciences (2 | 6.7%) are the most common fields of study among 30 individuals in Avinger who have obtained a bachelor's degree or higher.
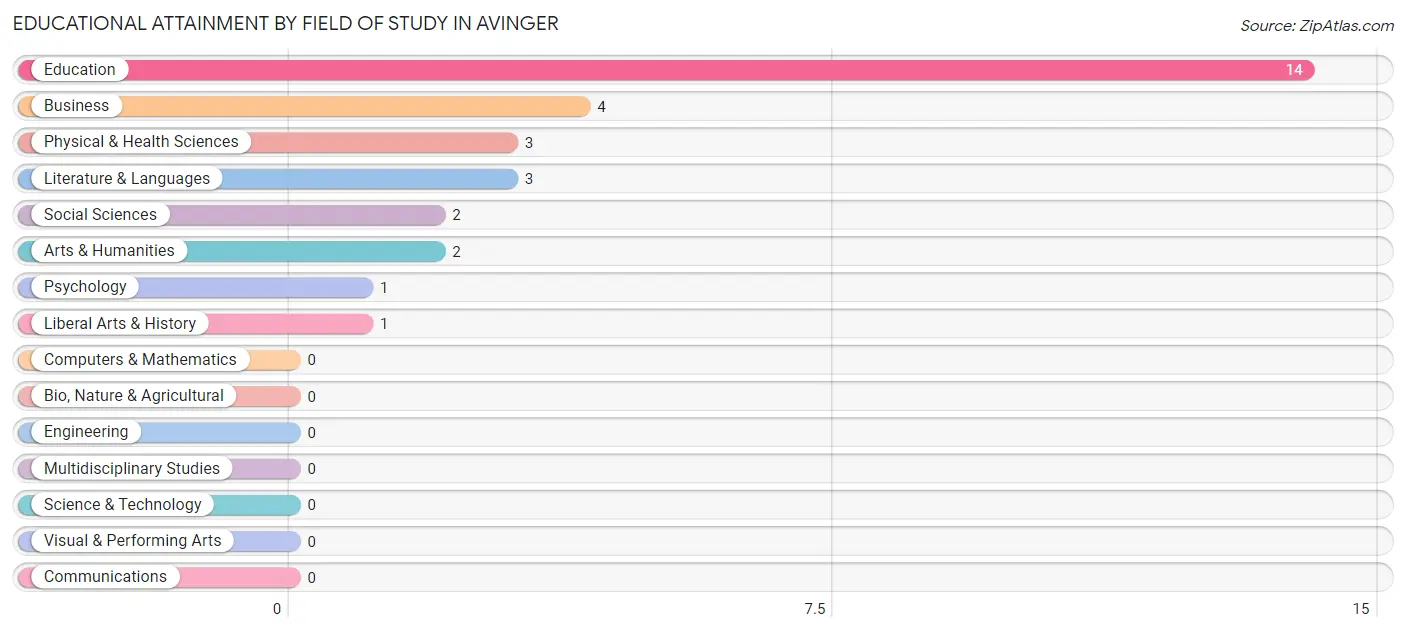
| Field of Study | # Graduates | % Graduates |
| Computers & Mathematics | 0 | 0.0% |
| Bio, Nature & Agricultural | 0 | 0.0% |
| Physical & Health Sciences | 3 | 10.0% |
| Psychology | 1 | 3.3% |
| Social Sciences | 2 | 6.7% |
| Engineering | 0 | 0.0% |
| Multidisciplinary Studies | 0 | 0.0% |
| Science & Technology | 0 | 0.0% |
| Business | 4 | 13.3% |
| Education | 14 | 46.7% |
| Literature & Languages | 3 | 10.0% |
| Liberal Arts & History | 1 | 3.3% |
| Visual & Performing Arts | 0 | 0.0% |
| Communications | 0 | 0.0% |
| Arts & Humanities | 2 | 6.7% |
| Total | 30 | 100.0% |
Transportation & Commute in Avinger
Vehicle Availability by Sex in Avinger
The most prevalent vehicle ownership categories in Avinger are males with 3 vehicles (27, accounting for 34.2%) and females with 3 vehicles (24, making up 40.3%).
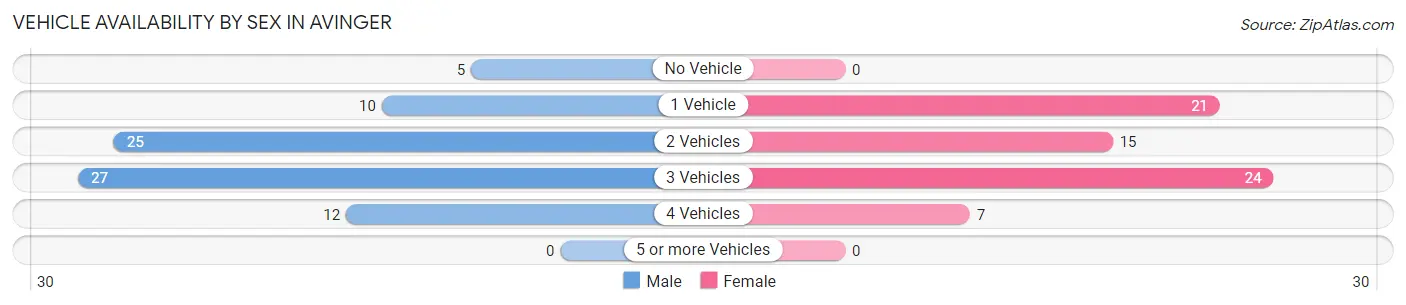
| Vehicles Available | Male | Female |
| No Vehicle | 5 (6.3%) | 0 (0.0%) |
| 1 Vehicle | 10 (12.7%) | 21 (31.3%) |
| 2 Vehicles | 25 (31.7%) | 15 (22.4%) |
| 3 Vehicles | 27 (34.2%) | 24 (35.8%) |
| 4 Vehicles | 12 (15.2%) | 7 (10.4%) |
| 5 or more Vehicles | 0 (0.0%) | 0 (0.0%) |
| Total | 79 (100.0%) | 67 (100.0%) |
Commute Time in Avinger
The most frequently occuring commute durations in Avinger are 60 to 89 minutes (28 commuters, 19.7%), 20 to 24 minutes (21 commuters, 14.8%), and less than 5 minutes (19 commuters, 13.4%).
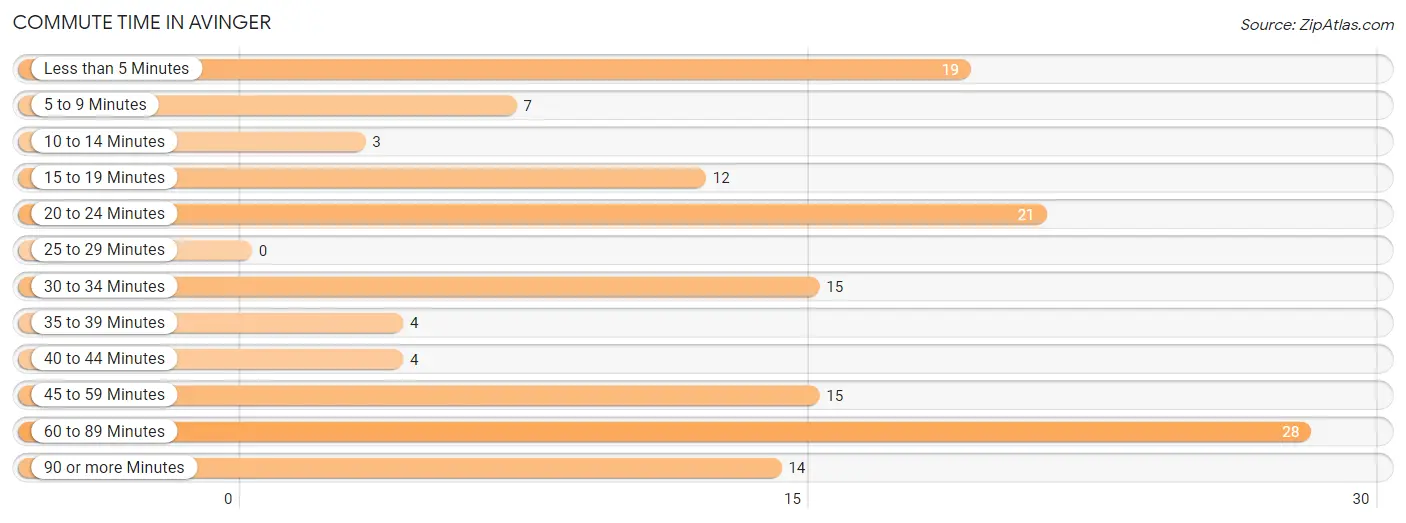
| Commute Time | # Commuters | % Commuters |
| Less than 5 Minutes | 19 | 13.4% |
| 5 to 9 Minutes | 7 | 4.9% |
| 10 to 14 Minutes | 3 | 2.1% |
| 15 to 19 Minutes | 12 | 8.5% |
| 20 to 24 Minutes | 21 | 14.8% |
| 25 to 29 Minutes | 0 | 0.0% |
| 30 to 34 Minutes | 15 | 10.6% |
| 35 to 39 Minutes | 4 | 2.8% |
| 40 to 44 Minutes | 4 | 2.8% |
| 45 to 59 Minutes | 15 | 10.6% |
| 60 to 89 Minutes | 28 | 19.7% |
| 90 or more Minutes | 14 | 9.9% |
Commute Time by Sex in Avinger
The most common commute times in Avinger are 60 to 89 minutes (28 commuters, 35.4%) for males and 20 to 24 minutes (21 commuters, 33.3%) for females.
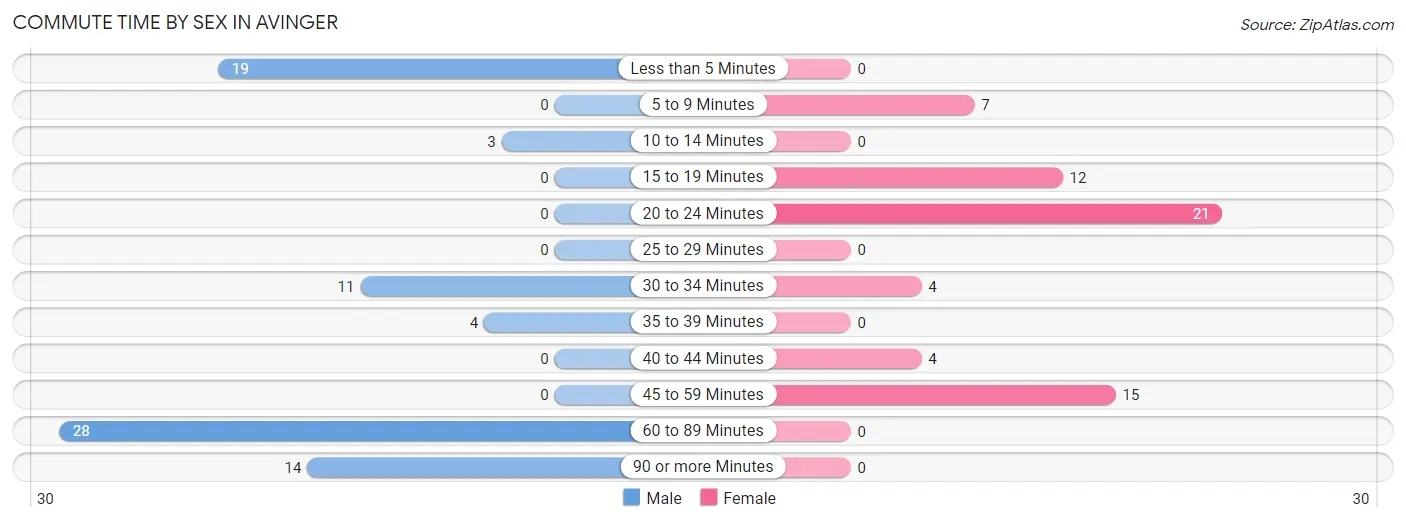
| Commute Time | Male | Female |
| Less than 5 Minutes | 19 (24.0%) | 0 (0.0%) |
| 5 to 9 Minutes | 0 (0.0%) | 7 (11.1%) |
| 10 to 14 Minutes | 3 (3.8%) | 0 (0.0%) |
| 15 to 19 Minutes | 0 (0.0%) | 12 (19.1%) |
| 20 to 24 Minutes | 0 (0.0%) | 21 (33.3%) |
| 25 to 29 Minutes | 0 (0.0%) | 0 (0.0%) |
| 30 to 34 Minutes | 11 (13.9%) | 4 (6.4%) |
| 35 to 39 Minutes | 4 (5.1%) | 0 (0.0%) |
| 40 to 44 Minutes | 0 (0.0%) | 4 (6.4%) |
| 45 to 59 Minutes | 0 (0.0%) | 15 (23.8%) |
| 60 to 89 Minutes | 28 (35.4%) | 0 (0.0%) |
| 90 or more Minutes | 14 (17.7%) | 0 (0.0%) |
Time of Departure to Work by Sex in Avinger
The most frequent times of departure to work in Avinger are 12:00 AM to 4:59 AM (24, 30.4%) for males and 7:00 AM to 7:29 AM (15, 23.8%) for females.
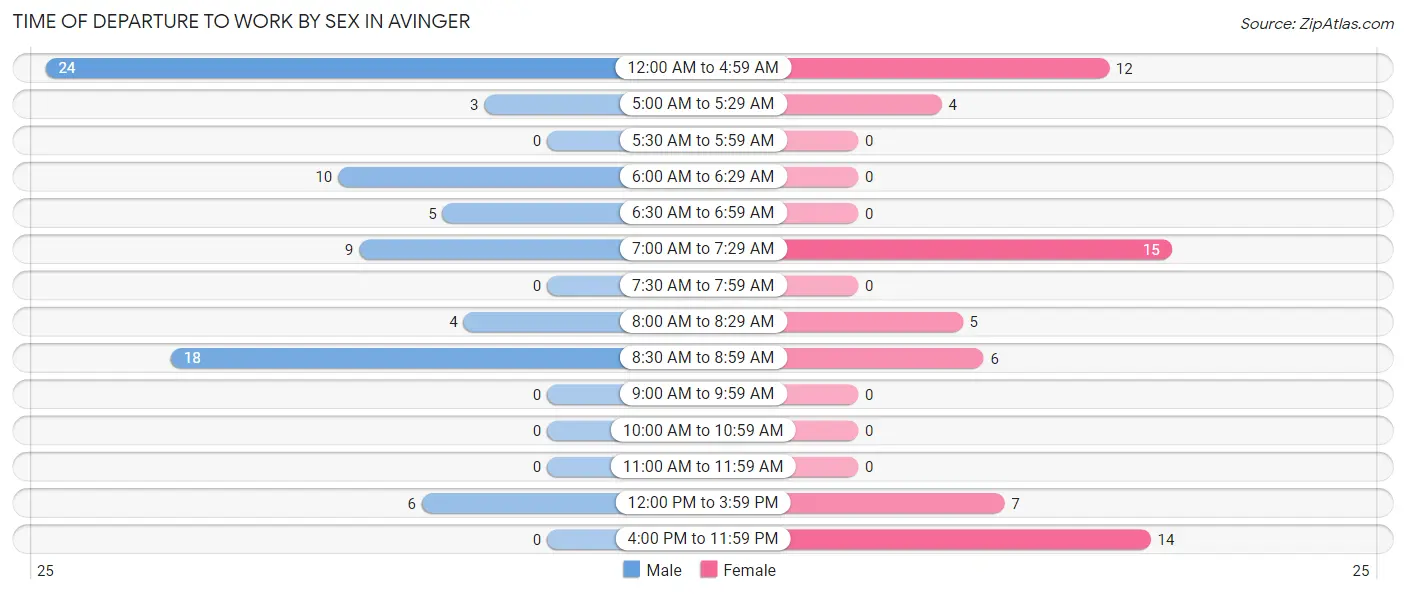
| Time of Departure | Male | Female |
| 12:00 AM to 4:59 AM | 24 (30.4%) | 12 (19.1%) |
| 5:00 AM to 5:29 AM | 3 (3.8%) | 4 (6.4%) |
| 5:30 AM to 5:59 AM | 0 (0.0%) | 0 (0.0%) |
| 6:00 AM to 6:29 AM | 10 (12.7%) | 0 (0.0%) |
| 6:30 AM to 6:59 AM | 5 (6.3%) | 0 (0.0%) |
| 7:00 AM to 7:29 AM | 9 (11.4%) | 15 (23.8%) |
| 7:30 AM to 7:59 AM | 0 (0.0%) | 0 (0.0%) |
| 8:00 AM to 8:29 AM | 4 (5.1%) | 5 (7.9%) |
| 8:30 AM to 8:59 AM | 18 (22.8%) | 6 (9.5%) |
| 9:00 AM to 9:59 AM | 0 (0.0%) | 0 (0.0%) |
| 10:00 AM to 10:59 AM | 0 (0.0%) | 0 (0.0%) |
| 11:00 AM to 11:59 AM | 0 (0.0%) | 0 (0.0%) |
| 12:00 PM to 3:59 PM | 6 (7.6%) | 7 (11.1%) |
| 4:00 PM to 11:59 PM | 0 (0.0%) | 14 (22.2%) |
| Total | 79 (100.0%) | 63 (100.0%) |
Housing Occupancy in Avinger
Occupancy by Ownership in Avinger
Of the total 176 dwellings in Avinger, owner-occupied units account for 127 (72.2%), while renter-occupied units make up 49 (27.8%).
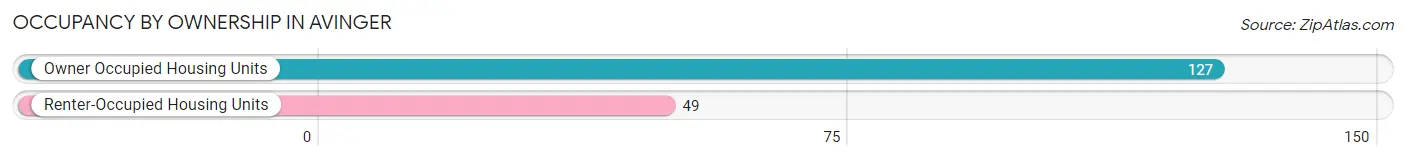
| Occupancy | # Housing Units | % Housing Units |
| Owner Occupied Housing Units | 127 | 72.2% |
| Renter-Occupied Housing Units | 49 | 27.8% |
| Total Occupied Housing Units | 176 | 100.0% |
Occupancy by Household Size in Avinger
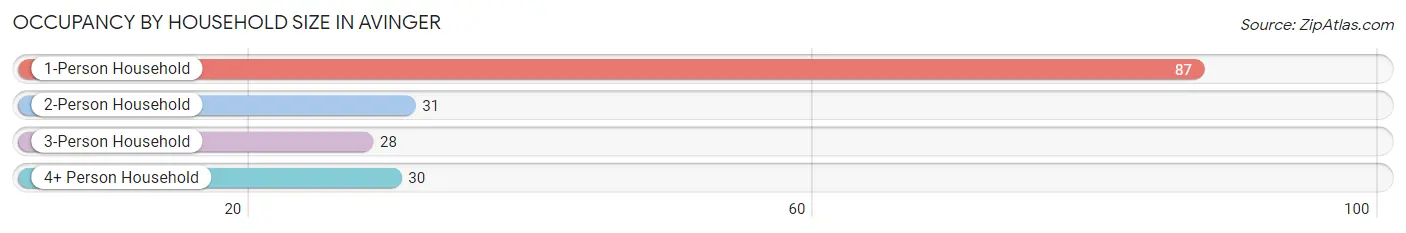
| Household Size | # Housing Units | % Housing Units |
| 1-Person Household | 87 | 49.4% |
| 2-Person Household | 31 | 17.6% |
| 3-Person Household | 28 | 15.9% |
| 4+ Person Household | 30 | 17.1% |
| Total Housing Units | 176 | 100.0% |
Occupancy by Ownership by Household Size in Avinger
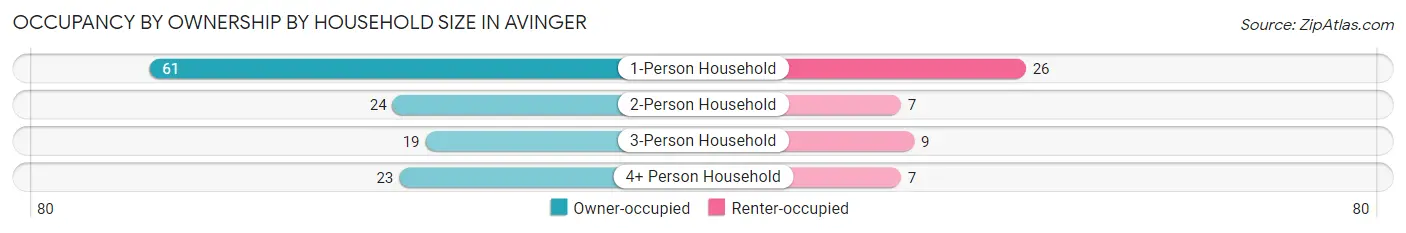
| Household Size | Owner-occupied | Renter-occupied |
| 1-Person Household | 61 (70.1%) | 26 (29.9%) |
| 2-Person Household | 24 (77.4%) | 7 (22.6%) |
| 3-Person Household | 19 (67.9%) | 9 (32.1%) |
| 4+ Person Household | 23 (76.7%) | 7 (23.3%) |
| Total Housing Units | 127 (72.2%) | 49 (27.8%) |
Occupancy by Educational Attainment in Avinger
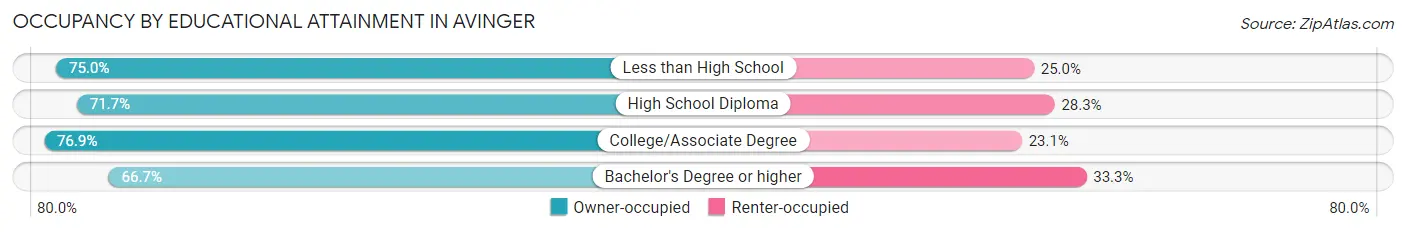
| Household Size | Owner-occupied | Renter-occupied |
| Less than High School | 6 (75.0%) | 2 (25.0%) |
| High School Diploma | 71 (71.7%) | 28 (28.3%) |
| College/Associate Degree | 30 (76.9%) | 9 (23.1%) |
| Bachelor's Degree or higher | 20 (66.7%) | 10 (33.3%) |
Occupancy by Age of Householder in Avinger
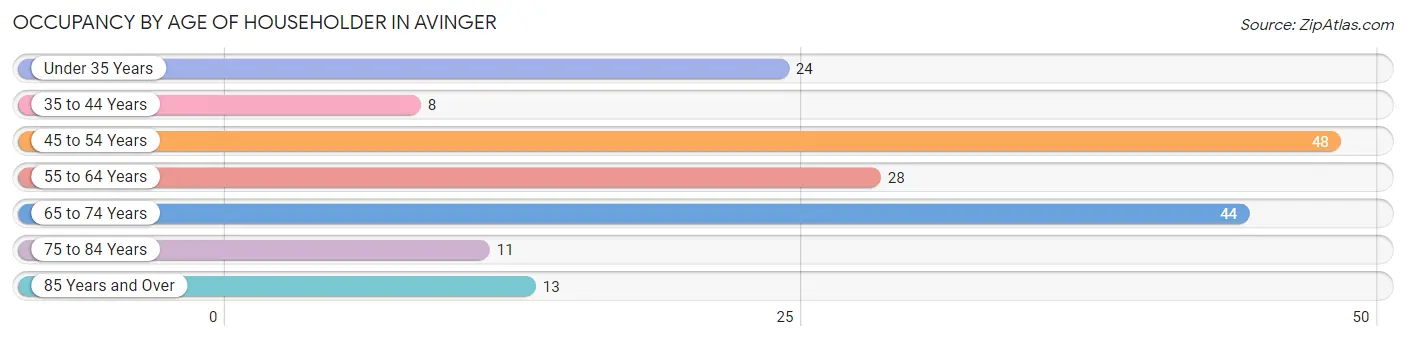
| Age Bracket | # Households | % Households |
| Under 35 Years | 24 | 13.6% |
| 35 to 44 Years | 8 | 4.5% |
| 45 to 54 Years | 48 | 27.3% |
| 55 to 64 Years | 28 | 15.9% |
| 65 to 74 Years | 44 | 25.0% |
| 75 to 84 Years | 11 | 6.2% |
| 85 Years and Over | 13 | 7.4% |
| Total | 176 | 100.0% |
Housing Finances in Avinger
Median Income by Occupancy in Avinger
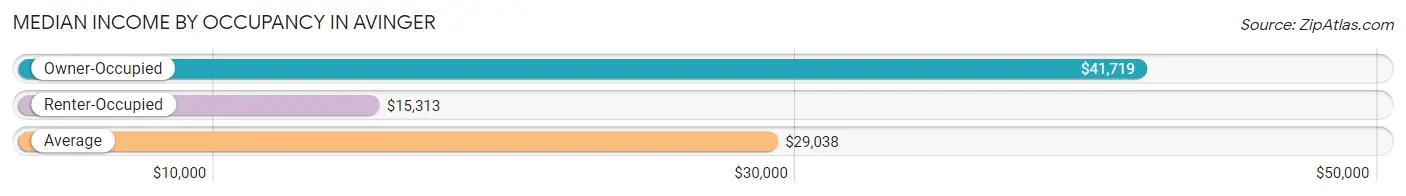
| Occupancy Type | # Households | Median Income |
| Owner-Occupied | 127 (72.2%) | $41,719 |
| Renter-Occupied | 49 (27.8%) | $15,313 |
| Average | 176 (100.0%) | $29,038 |
Occupancy by Householder Income Bracket in Avinger
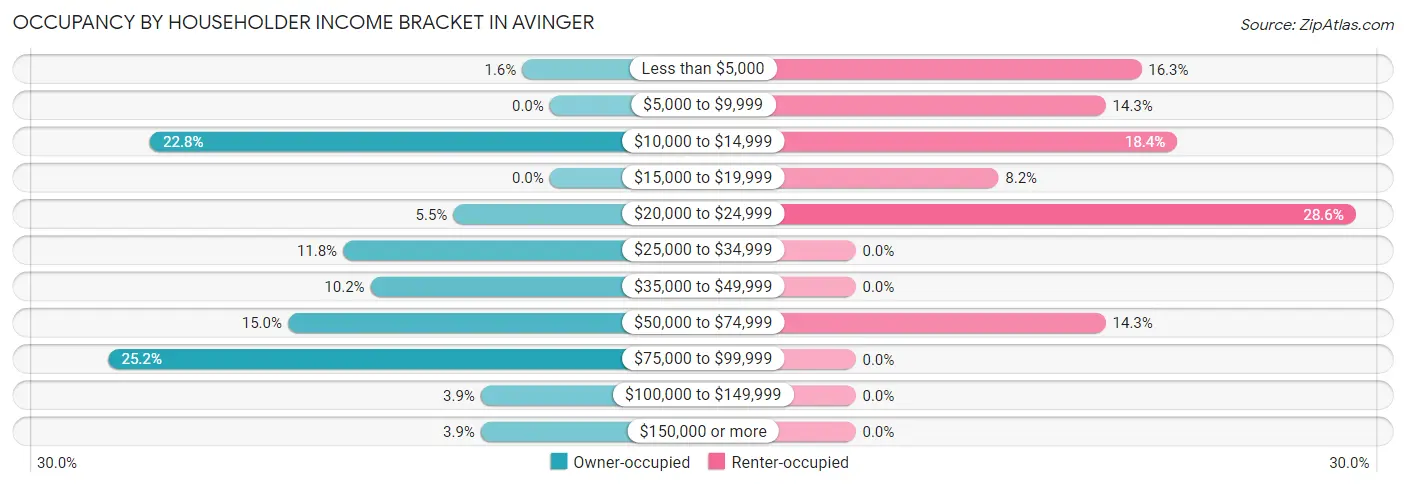
| Income Bracket | Owner-occupied | Renter-occupied |
| Less than $5,000 | 2 (1.6%) | 8 (16.3%) |
| $5,000 to $9,999 | 0 (0.0%) | 7 (14.3%) |
| $10,000 to $14,999 | 29 (22.8%) | 9 (18.4%) |
| $15,000 to $19,999 | 0 (0.0%) | 4 (8.2%) |
| $20,000 to $24,999 | 7 (5.5%) | 14 (28.6%) |
| $25,000 to $34,999 | 15 (11.8%) | 0 (0.0%) |
| $35,000 to $49,999 | 13 (10.2%) | 0 (0.0%) |
| $50,000 to $74,999 | 19 (15.0%) | 7 (14.3%) |
| $75,000 to $99,999 | 32 (25.2%) | 0 (0.0%) |
| $100,000 to $149,999 | 5 (3.9%) | 0 (0.0%) |
| $150,000 or more | 5 (3.9%) | 0 (0.0%) |
| Total | 127 (100.0%) | 49 (100.0%) |
Monthly Housing Cost Tiers in Avinger
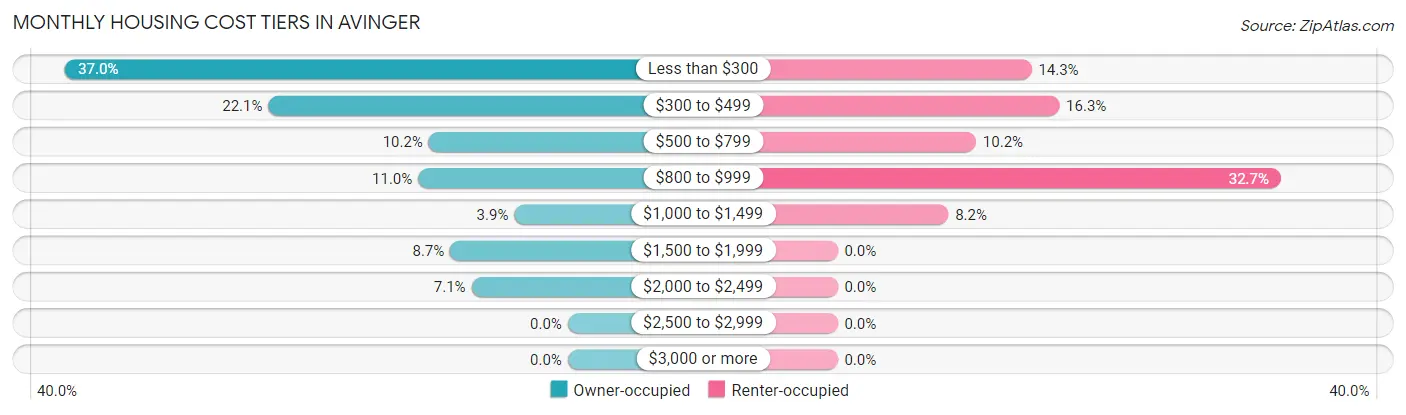
| Monthly Cost | Owner-occupied | Renter-occupied |
| Less than $300 | 47 (37.0%) | 7 (14.3%) |
| $300 to $499 | 28 (22.1%) | 8 (16.3%) |
| $500 to $799 | 13 (10.2%) | 5 (10.2%) |
| $800 to $999 | 14 (11.0%) | 16 (32.7%) |
| $1,000 to $1,499 | 5 (3.9%) | 4 (8.2%) |
| $1,500 to $1,999 | 11 (8.7%) | 0 (0.0%) |
| $2,000 to $2,499 | 9 (7.1%) | 0 (0.0%) |
| $2,500 to $2,999 | 0 (0.0%) | 0 (0.0%) |
| $3,000 or more | 0 (0.0%) | 0 (0.0%) |
| Total | 127 (100.0%) | 49 (100.0%) |
Physical Housing Characteristics in Avinger
Housing Structures in Avinger
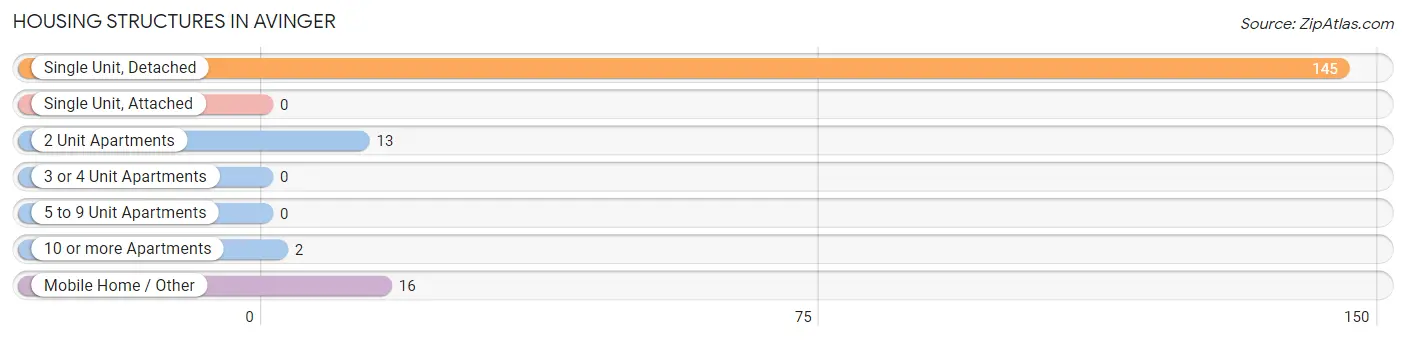
| Structure Type | # Housing Units | % Housing Units |
| Single Unit, Detached | 145 | 82.4% |
| Single Unit, Attached | 0 | 0.0% |
| 2 Unit Apartments | 13 | 7.4% |
| 3 or 4 Unit Apartments | 0 | 0.0% |
| 5 to 9 Unit Apartments | 0 | 0.0% |
| 10 or more Apartments | 2 | 1.1% |
| Mobile Home / Other | 16 | 9.1% |
| Total | 176 | 100.0% |
Housing Structures by Occupancy in Avinger
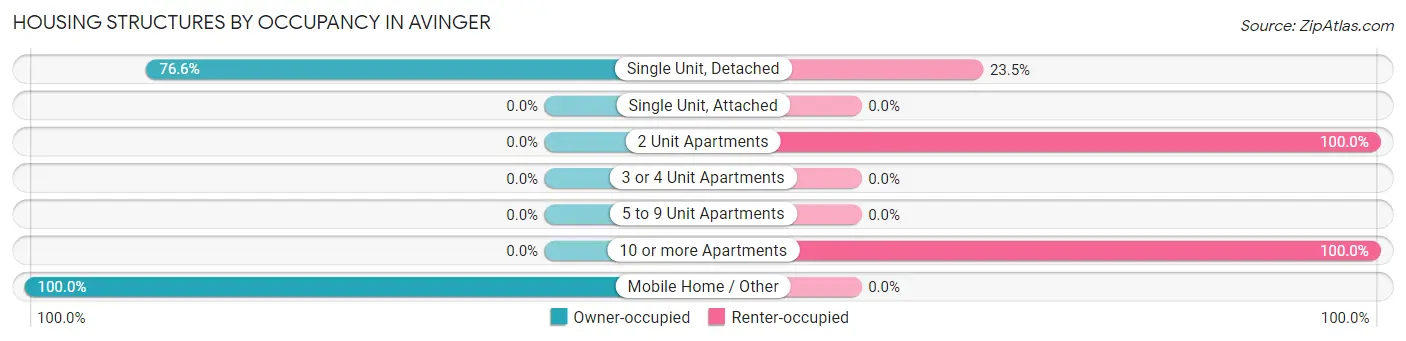
| Structure Type | Owner-occupied | Renter-occupied |
| Single Unit, Detached | 111 (76.5%) | 34 (23.4%) |
| Single Unit, Attached | 0 (0.0%) | 0 (0.0%) |
| 2 Unit Apartments | 0 (0.0%) | 13 (100.0%) |
| 3 or 4 Unit Apartments | 0 (0.0%) | 0 (0.0%) |
| 5 to 9 Unit Apartments | 0 (0.0%) | 0 (0.0%) |
| 10 or more Apartments | 0 (0.0%) | 2 (100.0%) |
| Mobile Home / Other | 16 (100.0%) | 0 (0.0%) |
| Total | 127 (72.2%) | 49 (27.8%) |
Housing Structures by Number of Rooms in Avinger
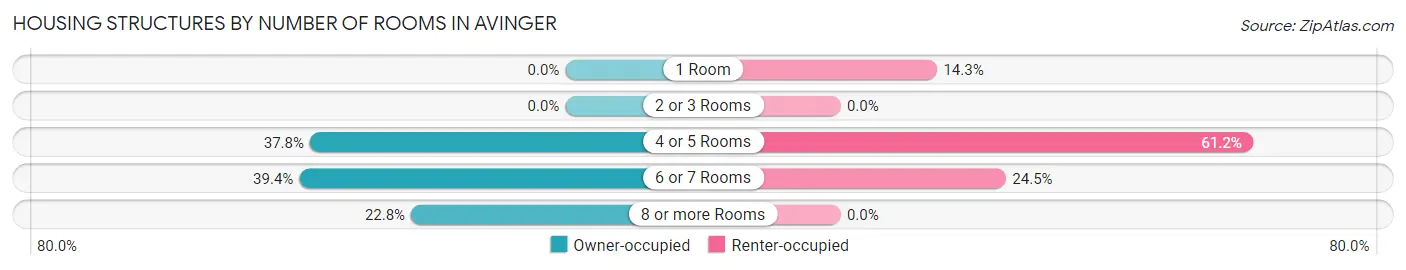
| Number of Rooms | Owner-occupied | Renter-occupied |
| 1 Room | 0 (0.0%) | 7 (14.3%) |
| 2 or 3 Rooms | 0 (0.0%) | 0 (0.0%) |
| 4 or 5 Rooms | 48 (37.8%) | 30 (61.2%) |
| 6 or 7 Rooms | 50 (39.4%) | 12 (24.5%) |
| 8 or more Rooms | 29 (22.8%) | 0 (0.0%) |
| Total | 127 (100.0%) | 49 (100.0%) |
Housing Structure by Heating Type in Avinger
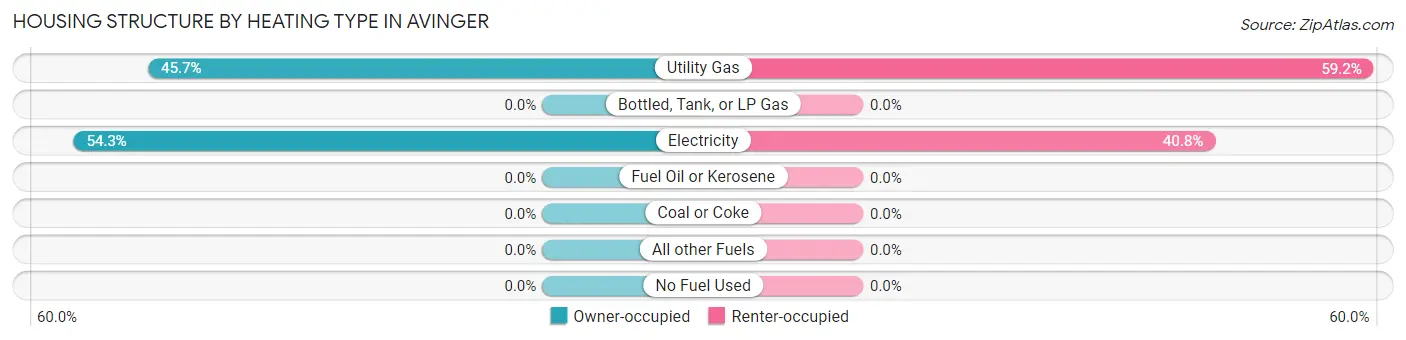
| Heating Type | Owner-occupied | Renter-occupied |
| Utility Gas | 58 (45.7%) | 29 (59.2%) |
| Bottled, Tank, or LP Gas | 0 (0.0%) | 0 (0.0%) |
| Electricity | 69 (54.3%) | 20 (40.8%) |
| Fuel Oil or Kerosene | 0 (0.0%) | 0 (0.0%) |
| Coal or Coke | 0 (0.0%) | 0 (0.0%) |
| All other Fuels | 0 (0.0%) | 0 (0.0%) |
| No Fuel Used | 0 (0.0%) | 0 (0.0%) |
| Total | 127 (100.0%) | 49 (100.0%) |
Household Vehicle Usage in Avinger
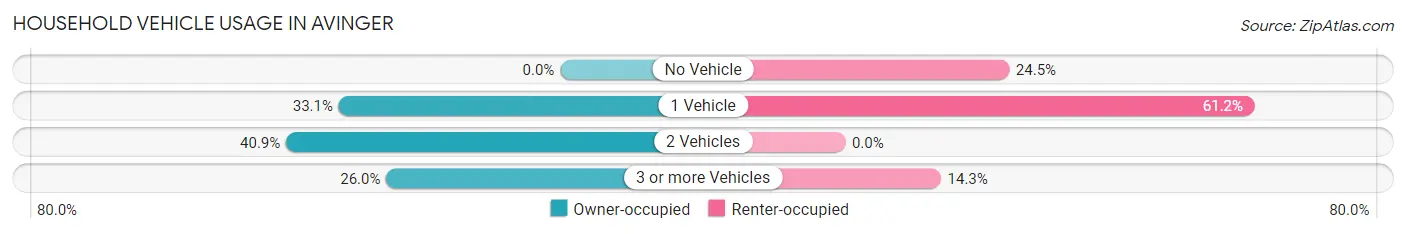
| Vehicles per Household | Owner-occupied | Renter-occupied |
| No Vehicle | 0 (0.0%) | 12 (24.5%) |
| 1 Vehicle | 42 (33.1%) | 30 (61.2%) |
| 2 Vehicles | 52 (40.9%) | 0 (0.0%) |
| 3 or more Vehicles | 33 (26.0%) | 7 (14.3%) |
| Total | 127 (100.0%) | 49 (100.0%) |
Real Estate & Mortgages in Avinger
Real Estate and Mortgage Overview in Avinger
| Characteristic | Without Mortgage | With Mortgage |
| Housing Units | 91 | 36 |
| Median Property Value | $72,800 | $155,000 |
| Median Household Income | $29,327 | $2 |
| Monthly Housing Costs | $294 | $0 |
| Real Estate Taxes | $725 | $2 |
Property Value by Mortgage Status in Avinger
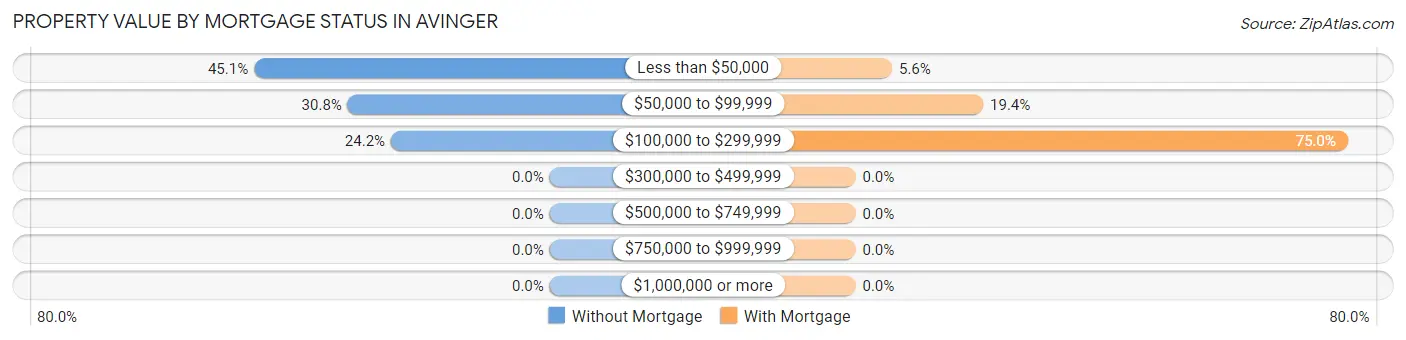
| Property Value | Without Mortgage | With Mortgage |
| Less than $50,000 | 41 (45.1%) | 2 (5.6%) |
| $50,000 to $99,999 | 28 (30.8%) | 7 (19.4%) |
| $100,000 to $299,999 | 22 (24.2%) | 27 (75.0%) |
| $300,000 to $499,999 | 0 (0.0%) | 0 (0.0%) |
| $500,000 to $749,999 | 0 (0.0%) | 0 (0.0%) |
| $750,000 to $999,999 | 0 (0.0%) | 0 (0.0%) |
| $1,000,000 or more | 0 (0.0%) | 0 (0.0%) |
| Total | 91 (100.0%) | 36 (100.0%) |
Household Income by Mortgage Status in Avinger
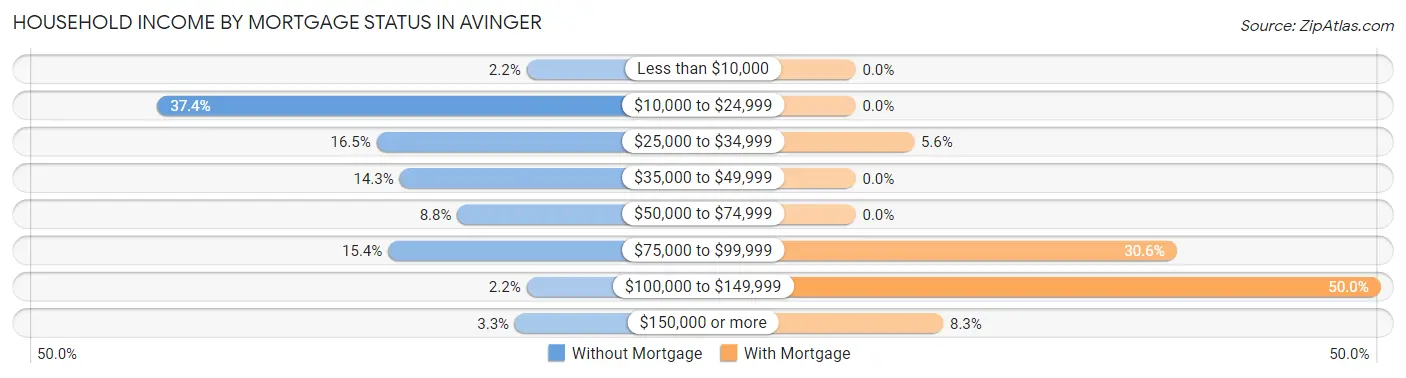
| Household Income | Without Mortgage | With Mortgage |
| Less than $10,000 | 2 (2.2%) | 0 (0.0%) |
| $10,000 to $24,999 | 34 (37.4%) | 0 (0.0%) |
| $25,000 to $34,999 | 15 (16.5%) | 2 (5.6%) |
| $35,000 to $49,999 | 13 (14.3%) | 0 (0.0%) |
| $50,000 to $74,999 | 8 (8.8%) | 0 (0.0%) |
| $75,000 to $99,999 | 14 (15.4%) | 11 (30.6%) |
| $100,000 to $149,999 | 2 (2.2%) | 18 (50.0%) |
| $150,000 or more | 3 (3.3%) | 3 (8.3%) |
| Total | 91 (100.0%) | 36 (100.0%) |
Property Value to Household Income Ratio in Avinger
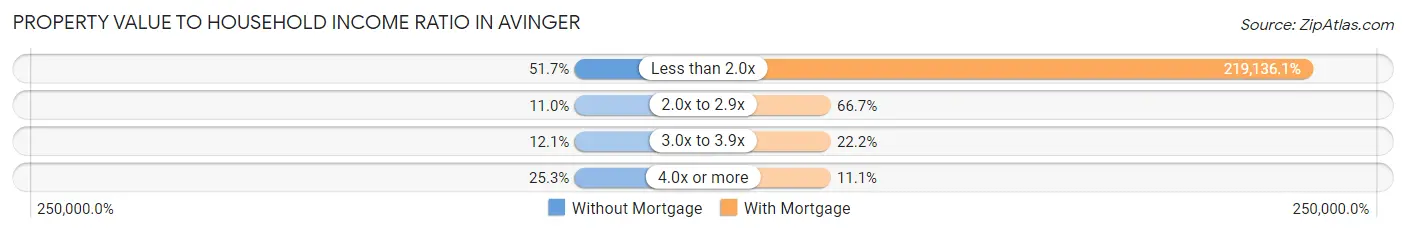
| Value-to-Income Ratio | Without Mortgage | With Mortgage |
| Less than 2.0x | 47 (51.6%) | 78,889 (219,136.1%) |
| 2.0x to 2.9x | 10 (11.0%) | 24 (66.7%) |
| 3.0x to 3.9x | 11 (12.1%) | 8 (22.2%) |
| 4.0x or more | 23 (25.3%) | 4 (11.1%) |
| Total | 91 (100.0%) | 36 (100.0%) |
Real Estate Taxes by Mortgage Status in Avinger
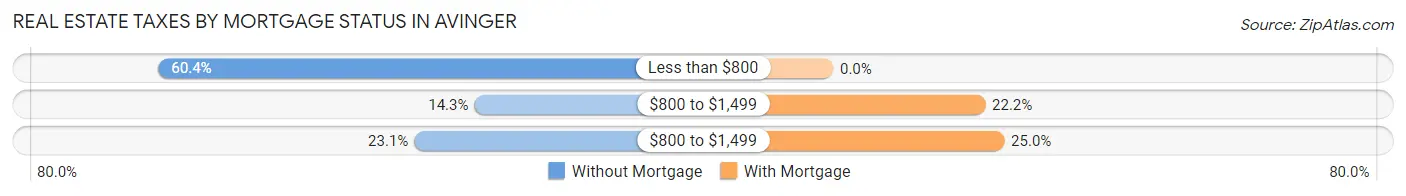
| Property Taxes | Without Mortgage | With Mortgage |
| Less than $800 | 55 (60.4%) | 0 (0.0%) |
| $800 to $1,499 | 13 (14.3%) | 8 (22.2%) |
| $800 to $1,499 | 21 (23.1%) | 9 (25.0%) |
| Total | 91 (100.0%) | 36 (100.0%) |
Health & Disability in Avinger
Health Insurance Coverage by Age in Avinger
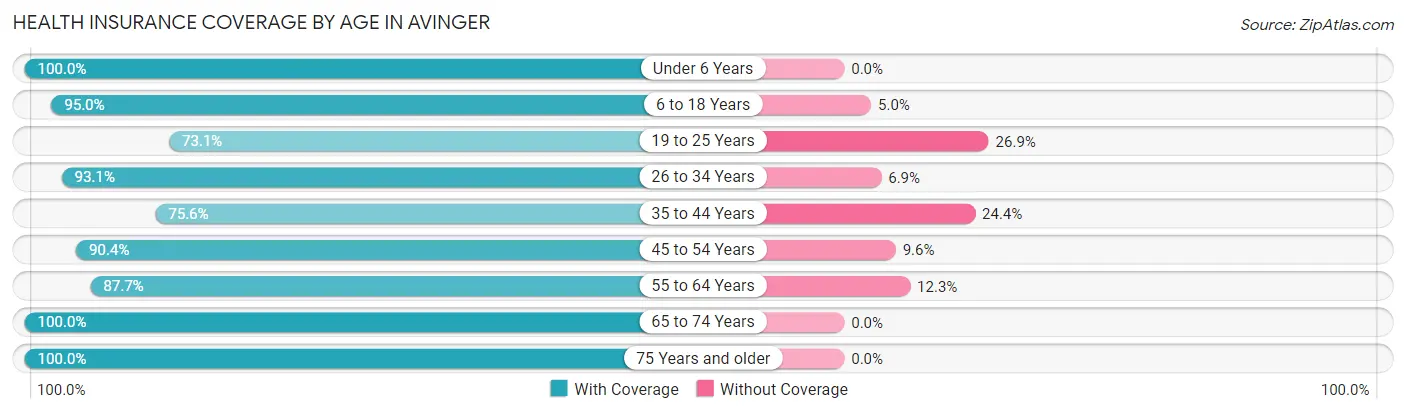
| Age Bracket | With Coverage | Without Coverage |
| Under 6 Years | 42 (100.0%) | 0 (0.0%) |
| 6 to 18 Years | 76 (95.0%) | 4 (5.0%) |
| 19 to 25 Years | 38 (73.1%) | 14 (26.9%) |
| 26 to 34 Years | 27 (93.1%) | 2 (6.9%) |
| 35 to 44 Years | 31 (75.6%) | 10 (24.4%) |
| 45 to 54 Years | 66 (90.4%) | 7 (9.6%) |
| 55 to 64 Years | 50 (87.7%) | 7 (12.3%) |
| 65 to 74 Years | 71 (100.0%) | 0 (0.0%) |
| 75 Years and older | 25 (100.0%) | 0 (0.0%) |
| Total | 426 (90.6%) | 44 (9.4%) |
Health Insurance Coverage by Citizenship Status in Avinger
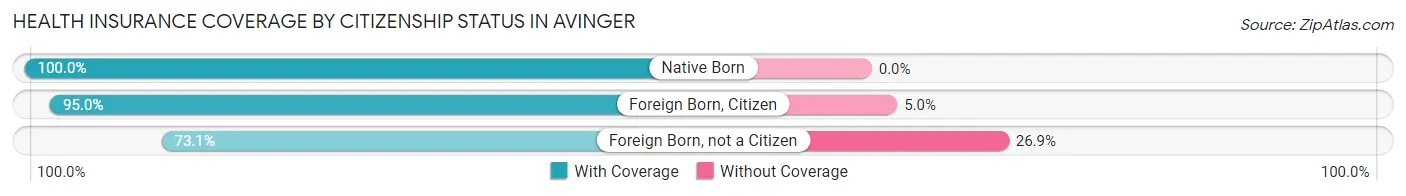
| Citizenship Status | With Coverage | Without Coverage |
| Native Born | 42 (100.0%) | 0 (0.0%) |
| Foreign Born, Citizen | 76 (95.0%) | 4 (5.0%) |
| Foreign Born, not a Citizen | 38 (73.1%) | 14 (26.9%) |
Health Insurance Coverage by Household Income in Avinger
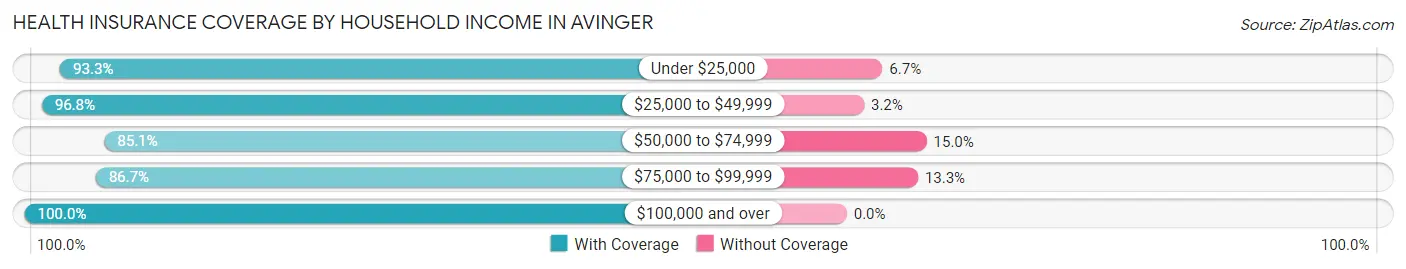
| Household Income | With Coverage | Without Coverage |
| Under $25,000 | 112 (93.3%) | 8 (6.7%) |
| $25,000 to $49,999 | 60 (96.8%) | 2 (3.2%) |
| $50,000 to $74,999 | 91 (85.1%) | 16 (14.9%) |
| $75,000 to $99,999 | 117 (86.7%) | 18 (13.3%) |
| $100,000 and over | 46 (100.0%) | 0 (0.0%) |
Public vs Private Health Insurance Coverage by Age in Avinger
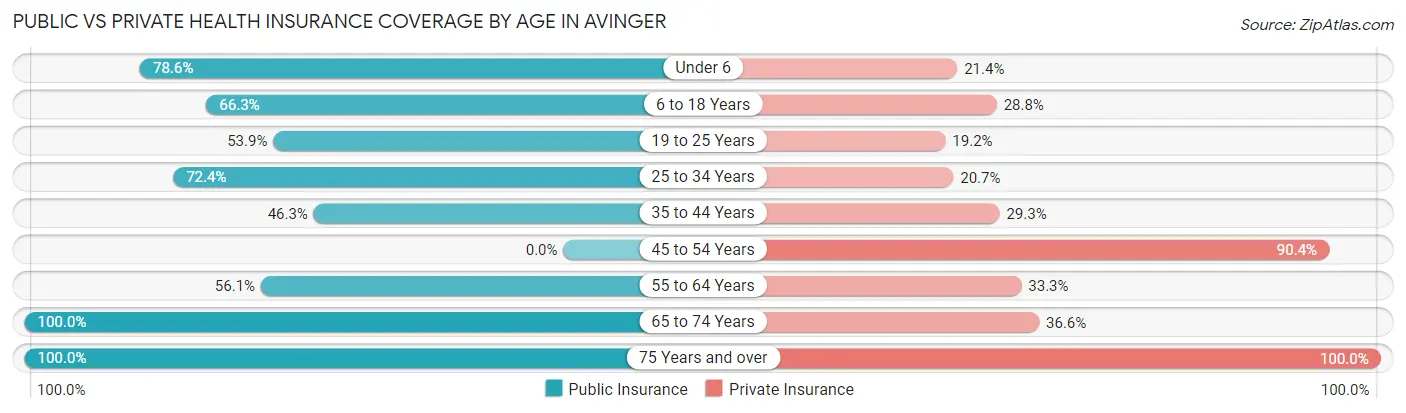
| Age Bracket | Public Insurance | Private Insurance |
| Under 6 | 33 (78.6%) | 9 (21.4%) |
| 6 to 18 Years | 53 (66.2%) | 23 (28.7%) |
| 19 to 25 Years | 28 (53.8%) | 10 (19.2%) |
| 25 to 34 Years | 21 (72.4%) | 6 (20.7%) |
| 35 to 44 Years | 19 (46.3%) | 12 (29.3%) |
| 45 to 54 Years | 0 (0.0%) | 66 (90.4%) |
| 55 to 64 Years | 32 (56.1%) | 19 (33.3%) |
| 65 to 74 Years | 71 (100.0%) | 26 (36.6%) |
| 75 Years and over | 25 (100.0%) | 25 (100.0%) |
| Total | 282 (60.0%) | 196 (41.7%) |
Disability Status by Sex by Age in Avinger
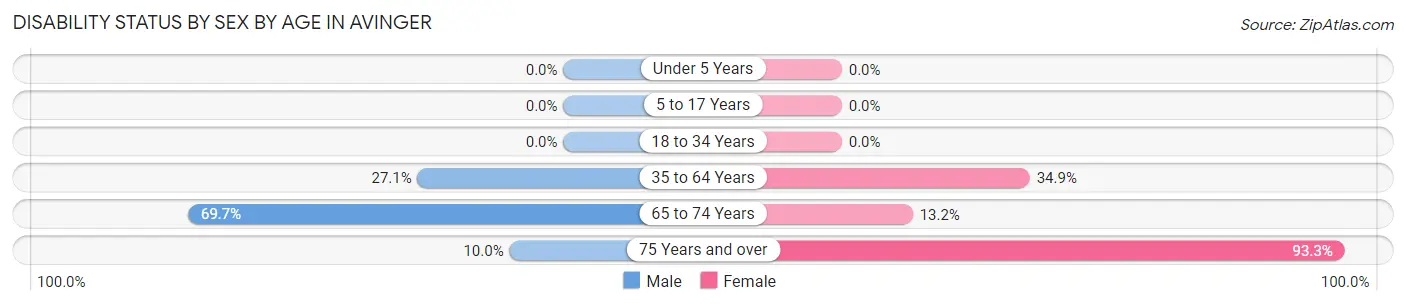
| Age Bracket | Male | Female |
| Under 5 Years | 0 (0.0%) | 0 (0.0%) |
| 5 to 17 Years | 0 (0.0%) | 0 (0.0%) |
| 18 to 34 Years | 0 (0.0%) | 0 (0.0%) |
| 35 to 64 Years | 23 (27.1%) | 30 (34.9%) |
| 65 to 74 Years | 23 (69.7%) | 5 (13.2%) |
| 75 Years and over | 1 (10.0%) | 14 (93.3%) |
Disability Class by Sex by Age in Avinger
Disability Class: Hearing Difficulty
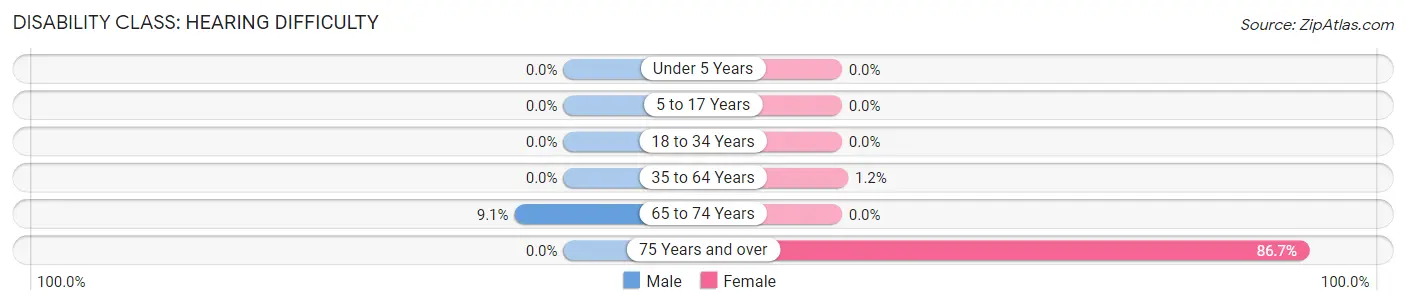
| Age Bracket | Male | Female |
| Under 5 Years | 0 (0.0%) | 0 (0.0%) |
| 5 to 17 Years | 0 (0.0%) | 0 (0.0%) |
| 18 to 34 Years | 0 (0.0%) | 0 (0.0%) |
| 35 to 64 Years | 0 (0.0%) | 1 (1.2%) |
| 65 to 74 Years | 3 (9.1%) | 0 (0.0%) |
| 75 Years and over | 0 (0.0%) | 13 (86.7%) |
Disability Class: Vision Difficulty
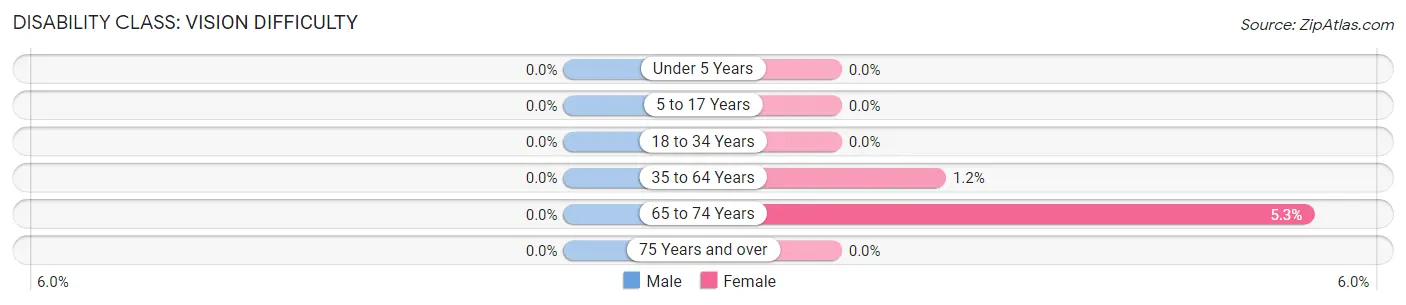
| Age Bracket | Male | Female |
| Under 5 Years | 0 (0.0%) | 0 (0.0%) |
| 5 to 17 Years | 0 (0.0%) | 0 (0.0%) |
| 18 to 34 Years | 0 (0.0%) | 0 (0.0%) |
| 35 to 64 Years | 0 (0.0%) | 1 (1.2%) |
| 65 to 74 Years | 0 (0.0%) | 2 (5.3%) |
| 75 Years and over | 0 (0.0%) | 0 (0.0%) |
Disability Class: Cognitive Difficulty
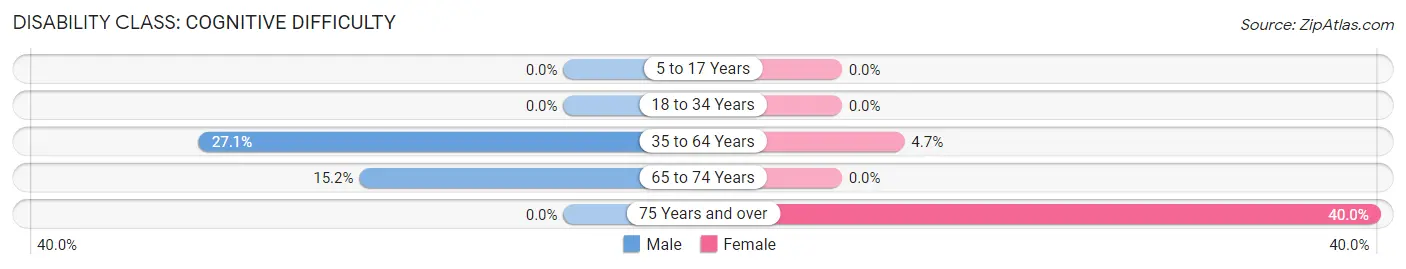
| Age Bracket | Male | Female |
| 5 to 17 Years | 0 (0.0%) | 0 (0.0%) |
| 18 to 34 Years | 0 (0.0%) | 0 (0.0%) |
| 35 to 64 Years | 23 (27.1%) | 4 (4.6%) |
| 65 to 74 Years | 5 (15.1%) | 0 (0.0%) |
| 75 Years and over | 0 (0.0%) | 6 (40.0%) |
Disability Class: Ambulatory Difficulty
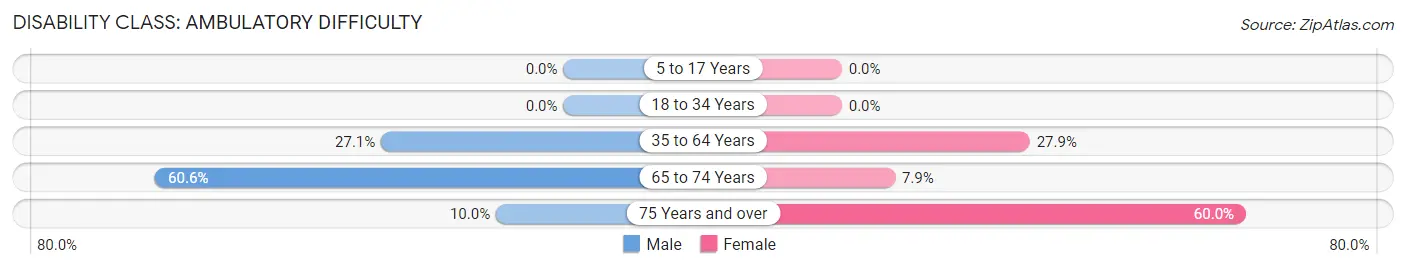
| Age Bracket | Male | Female |
| 5 to 17 Years | 0 (0.0%) | 0 (0.0%) |
| 18 to 34 Years | 0 (0.0%) | 0 (0.0%) |
| 35 to 64 Years | 23 (27.1%) | 24 (27.9%) |
| 65 to 74 Years | 20 (60.6%) | 3 (7.9%) |
| 75 Years and over | 1 (10.0%) | 9 (60.0%) |
Disability Class: Self-Care Difficulty
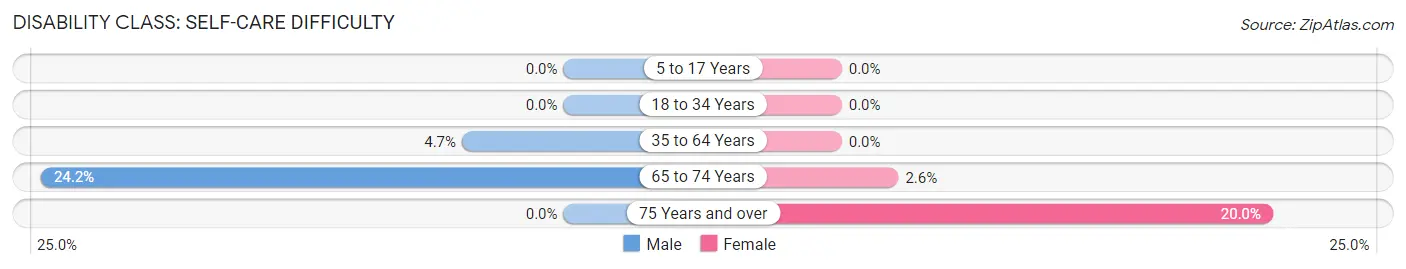
| Age Bracket | Male | Female |
| 5 to 17 Years | 0 (0.0%) | 0 (0.0%) |
| 18 to 34 Years | 0 (0.0%) | 0 (0.0%) |
| 35 to 64 Years | 4 (4.7%) | 0 (0.0%) |
| 65 to 74 Years | 8 (24.2%) | 1 (2.6%) |
| 75 Years and over | 0 (0.0%) | 3 (20.0%) |
Technology Access in Avinger
Computing Device Access in Avinger
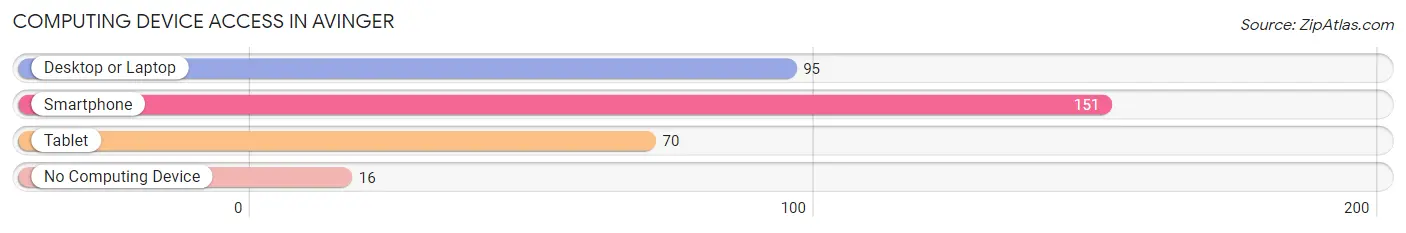
| Device Type | # Households | % Households |
| Desktop or Laptop | 95 | 54.0% |
| Smartphone | 151 | 85.8% |
| Tablet | 70 | 39.8% |
| No Computing Device | 16 | 9.1% |
| Total | 176 | 100.0% |
Internet Access in Avinger
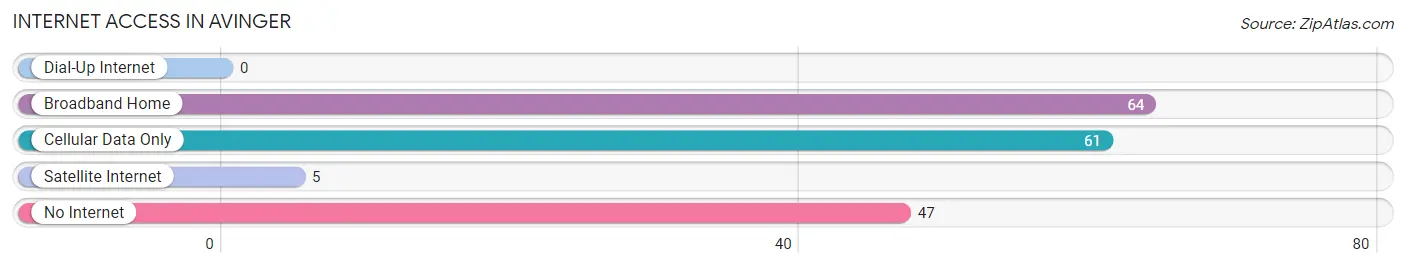
| Internet Type | # Households | % Households |
| Dial-Up Internet | 0 | 0.0% |
| Broadband Home | 64 | 36.4% |
| Cellular Data Only | 61 | 34.7% |
| Satellite Internet | 5 | 2.8% |
| No Internet | 47 | 26.7% |
| Total | 176 | 100.0% |
Avinger Summary
Avinger, Texas is a small town located in Cass County, Texas. It is situated on the banks of the Sulphur River, approximately 20 miles east of the city of Texarkana. The town was founded in 1873 and has a population of approximately 1,000 people.
History
Avinger was founded in 1873 by a group of settlers from Arkansas. The town was named after the Avinger family, who were among the first settlers. The town was originally a farming community, but soon developed into a small trading center. The town was incorporated in 1876 and the first post office was established in 1877.
In the early 1900s, the town began to grow and prosper. The population increased from around 500 in 1900 to over 1,000 by 1910. The town was home to several businesses, including a cotton gin, a sawmill, a gristmill, and a blacksmith shop.
In the 1920s, the town experienced a period of decline. The Great Depression caused many businesses to close and the population decreased to around 500. The town was able to recover in the 1940s and 1950s, and the population increased to around 1,000 by 1960.
Geography
Avinger is located in Cass County, Texas, approximately 20 miles east of the city of Texarkana. The town is situated on the banks of the Sulphur River. The terrain is mostly flat, with some rolling hills in the area. The climate is humid subtropical, with hot summers and mild winters.
Economy
The economy of Avinger is largely based on agriculture. The town is home to several farms, which produce cotton, soybeans, corn, and other crops. The town also has a few small businesses, including a grocery store, a hardware store, and a few restaurants.
Demographics
As of the 2010 census, the population of Avinger was 1,000. The racial makeup of the town was 97.2% White, 0.7% African American, 0.3% Native American, 0.2% Asian, 0.1% Pacific Islander, and 1.5% from other races. The median household income was $31,250 and the median family income was $37,500.
Conclusion
Avinger, Texas is a small town located in Cass County, Texas. It was founded in 1873 and has a population of approximately 1,000 people. The town is situated on the banks of the Sulphur River and is home to several farms and small businesses. The economy of Avinger is largely based on agriculture and the town has a diverse population.
Common Questions
What is Per Capita Income in Avinger?
Per Capita income in Avinger is $19,108.
What is the Median Family Income in Avinger?
Median Family Income in Avinger is $63,929.
What is the Median Household income in Avinger?
Median Household Income in Avinger is $29,038.
What is Inequality or Gini Index in Avinger?
Inequality or Gini Index in Avinger is 0.46.
What is the Total Population of Avinger?
Total Population of Avinger is 470.
What is the Total Male Population of Avinger?
Total Male Population of Avinger is 241.
What is the Total Female Population of Avinger?
Total Female Population of Avinger is 229.
What is the Ratio of Males per 100 Females in Avinger?
There are 105.24 Males per 100 Females in Avinger.
What is the Ratio of Females per 100 Males in Avinger?
There are 95.02 Females per 100 Males in Avinger.
What is the Median Population Age in Avinger?
Median Population Age in Avinger is 41.8 Years.
What is the Average Family Size in Avinger
Average Family Size in Avinger is 4.1 People.
What is the Average Household Size in Avinger
Average Household Size in Avinger is 2.7 People.
How Large is the Labor Force in Avinger?
There are 168 People in the Labor Forcein in Avinger.
What is the Percentage of People in the Labor Force in Avinger?
42.5% of People are in the Labor Force in Avinger.
What is the Unemployment Rate in Avinger?
Unemployment Rate in Avinger is 13.1%.