Anson, TX Map & Demographics
Anson Map
Anson Overview
$24,144
PER CAPITA INCOME
$65,263
AVG FAMILY INCOME
$43,576
AVG HOUSEHOLD INCOME
33.9%
WAGE / INCOME GAP [ % ]
66.1¢/ $1
WAGE / INCOME GAP [ $ ]
0.44
INEQUALITY / GINI INDEX
2,000
TOTAL POPULATION
969
MALE POPULATION
1,031
FEMALE POPULATION
93.99
MALES / 100 FEMALES
106.40
FEMALES / 100 MALES
41.0
MEDIAN AGE
2.9
AVG FAMILY SIZE
2.1
AVG HOUSEHOLD SIZE
868
LABOR FORCE [ PEOPLE ]
54.0%
PERCENT IN LABOR FORCE
2.5%
UNEMPLOYMENT RATE
Anson Zip Codes
Anson Area Codes
Income in Anson
Income Overview in Anson
Per Capita Income in Anson is $24,144, while median incomes of families and households are $65,263 and $43,576 respectively.
| Characteristic | Number | Measure |
| Per Capita Income | 2,000 | $24,144 |
| Median Family Income | 504 | $65,263 |
| Mean Family Income | 504 | $81,620 |
| Median Household Income | 869 | $43,576 |
| Mean Household Income | 869 | $60,547 |
| Income Deficit | 504 | $0 |
| Wage / Income Gap (%) | 2,000 | 33.89% |
| Wage / Income Gap ($) | 2,000 | 66.11¢ per $1 |
| Gini / Inequality Index | 2,000 | 0.44 |
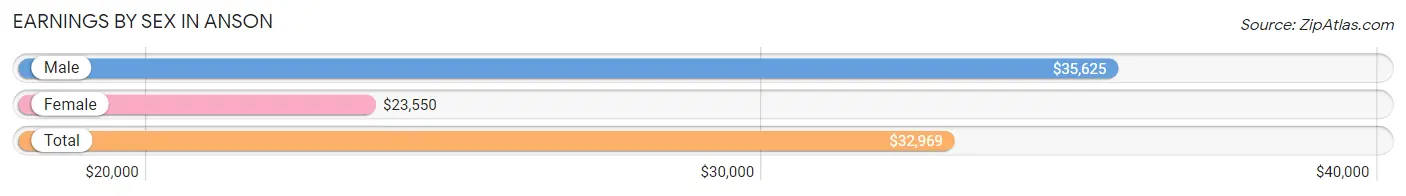
Earnings by Sex in Anson
Average Earnings in Anson are $32,969, $35,625 for men and $23,550 for women, a difference of 33.9%.
| Sex | Number | Average Earnings |
| Male | 462 (50.7%) | $35,625 |
| Female | 449 (49.3%) | $23,550 |
| Total | 911 (100.0%) | $32,969 |
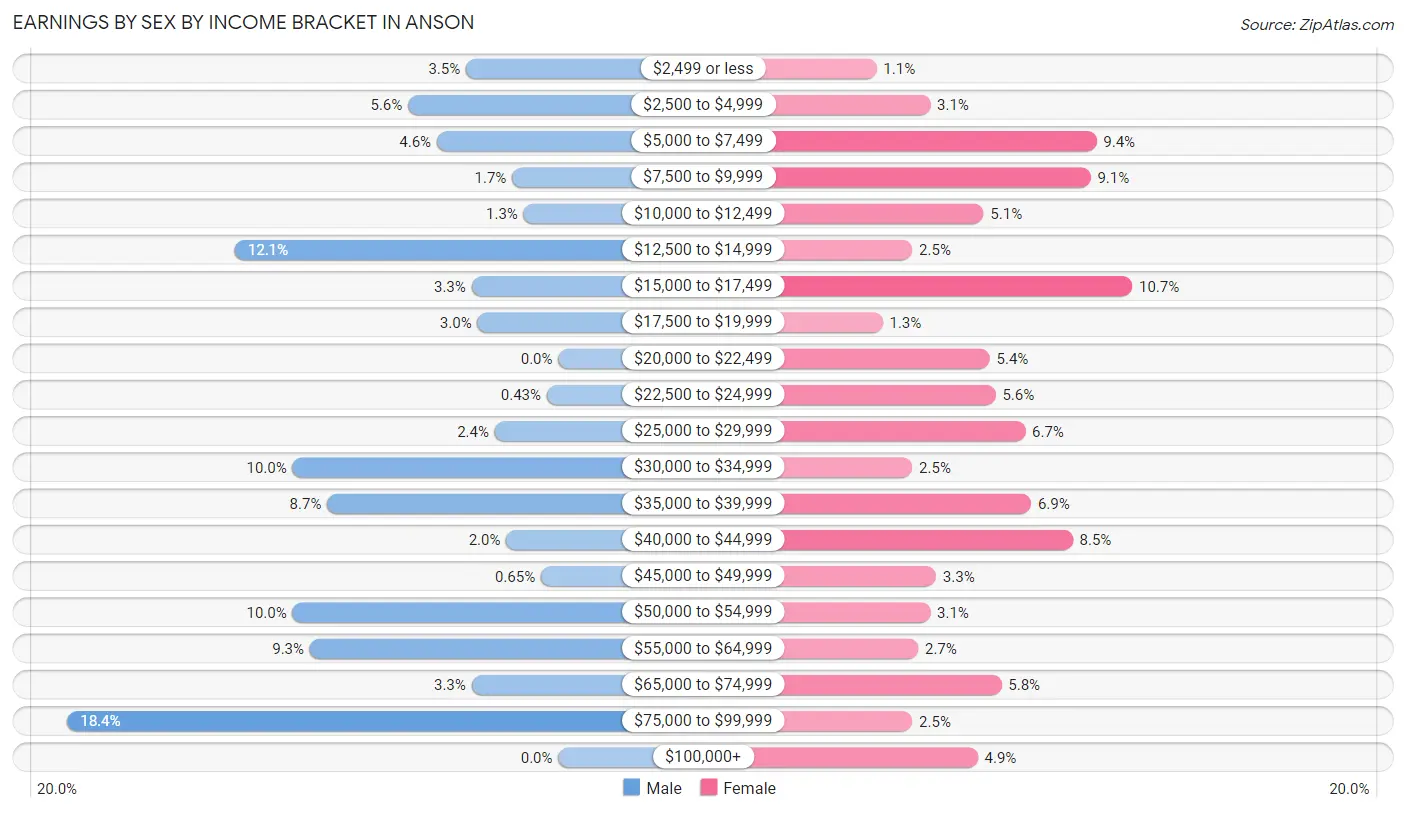
Earnings by Sex by Income Bracket in Anson
The most common earnings brackets in Anson are $75,000 to $99,999 for men (85 | 18.4%) and $15,000 to $17,499 for women (48 | 10.7%).
| Income | Male | Female |
| $2,499 or less | 16 (3.5%) | 5 (1.1%) |
| $2,500 to $4,999 | 26 (5.6%) | 14 (3.1%) |
| $5,000 to $7,499 | 21 (4.5%) | 42 (9.3%) |
| $7,500 to $9,999 | 8 (1.7%) | 41 (9.1%) |
| $10,000 to $12,499 | 6 (1.3%) | 23 (5.1%) |
| $12,500 to $14,999 | 56 (12.1%) | 11 (2.5%) |
| $15,000 to $17,499 | 15 (3.3%) | 48 (10.7%) |
| $17,500 to $19,999 | 14 (3.0%) | 6 (1.3%) |
| $20,000 to $22,499 | 0 (0.0%) | 24 (5.3%) |
| $22,500 to $24,999 | 2 (0.4%) | 25 (5.6%) |
| $25,000 to $29,999 | 11 (2.4%) | 30 (6.7%) |
| $30,000 to $34,999 | 46 (10.0%) | 11 (2.5%) |
| $35,000 to $39,999 | 40 (8.7%) | 31 (6.9%) |
| $40,000 to $44,999 | 9 (1.9%) | 38 (8.5%) |
| $45,000 to $49,999 | 3 (0.6%) | 15 (3.3%) |
| $50,000 to $54,999 | 46 (10.0%) | 14 (3.1%) |
| $55,000 to $64,999 | 43 (9.3%) | 12 (2.7%) |
| $65,000 to $74,999 | 15 (3.3%) | 26 (5.8%) |
| $75,000 to $99,999 | 85 (18.4%) | 11 (2.5%) |
| $100,000+ | 0 (0.0%) | 22 (4.9%) |
| Total | 462 (100.0%) | 449 (100.0%) |
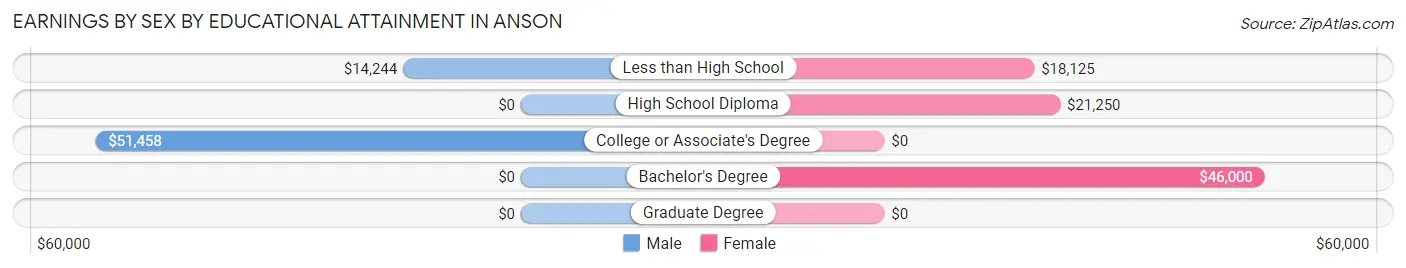
Earnings by Sex by Educational Attainment in Anson
Average earnings in Anson are $41,389 for men and $25,052 for women, a difference of 39.5%. Men with an educational attainment of college or associate's degree enjoy the highest average annual earnings of $51,458, while those with less than high school education earn the least with $14,244. Women with an educational attainment of bachelor's degree earn the most with the average annual earnings of $46,000, while those with less than high school education have the smallest earnings of $18,125.
| Educational Attainment | Male Income | Female Income |
| Less than High School | $14,244 | $18,125 |
| High School Diploma | - | - |
| College or Associate's Degree | $51,458 | $0 |
| Bachelor's Degree | - | - |
| Graduate Degree | - | - |
| Total | $41,389 | $25,052 |
Family Income in Anson
Family Income Brackets in Anson
According to the Anson family income data, there are 139 families falling into the $50,000 to $74,999 income range, which is the most common income bracket and makes up 27.6% of all families. Conversely, the less than $10,000 income bracket is the least frequent group with only 7 families (1.4%) belonging to this category.
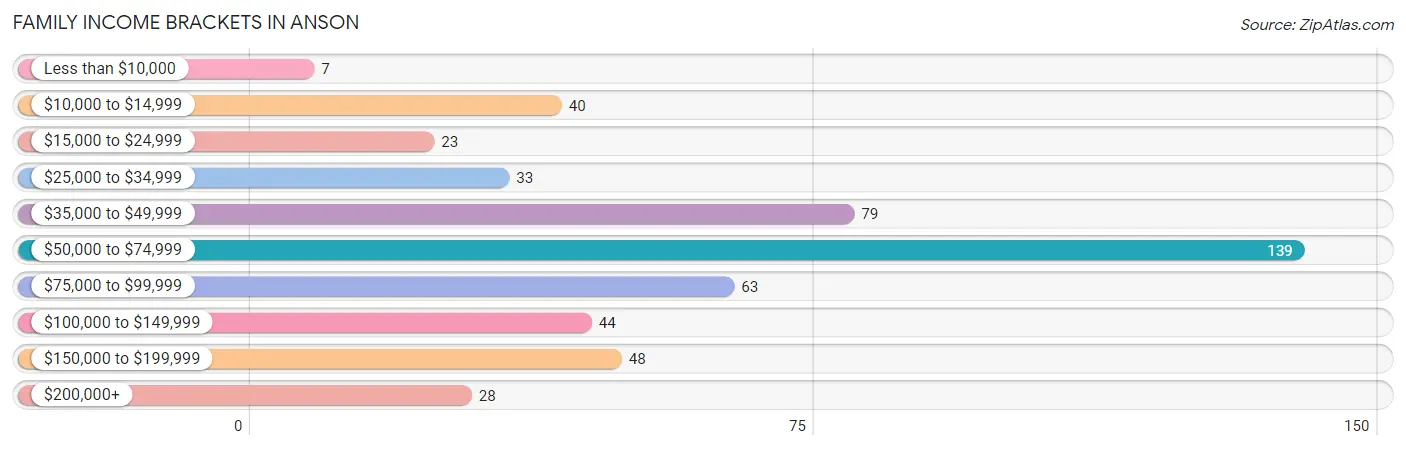
| Income Bracket | # Families | % Families |
| Less than $10,000 | 7 | 1.4% |
| $10,000 to $14,999 | 40 | 7.9% |
| $15,000 to $24,999 | 23 | 4.6% |
| $25,000 to $34,999 | 33 | 6.5% |
| $35,000 to $49,999 | 79 | 15.7% |
| $50,000 to $74,999 | 139 | 27.6% |
| $75,000 to $99,999 | 63 | 12.5% |
| $100,000 to $149,999 | 44 | 8.7% |
| $150,000 to $199,999 | 48 | 9.5% |
| $200,000+ | 28 | 5.6% |
Family Income by Famaliy Size in Anson
5-person families (73 | 14.5%) account for the highest median family income in Anson with $138,542 per family, while 2-person families (173 | 34.3%) have the highest median income of $31,458 per family member.
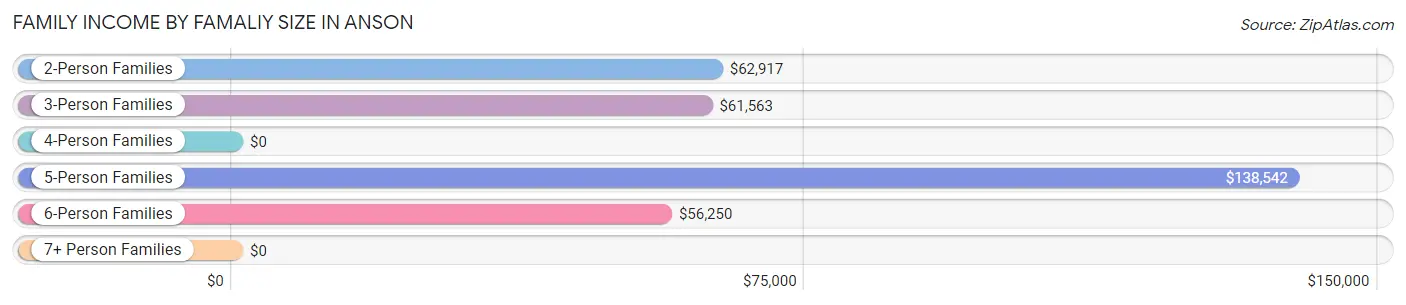
| Income Bracket | # Families | Median Income |
| 2-Person Families | 173 (34.3%) | $62,917 |
| 3-Person Families | 136 (27.0%) | $61,563 |
| 4-Person Families | 66 (13.1%) | $0 |
| 5-Person Families | 73 (14.5%) | $138,542 |
| 6-Person Families | 36 (7.1%) | $56,250 |
| 7+ Person Families | 20 (4.0%) | $0 |
| Total | 504 (100.0%) | $65,263 |
Family Income by Number of Earners in Anson
The median family income in Anson is $65,263, with families comprising 3+ earners (147) having the highest median family income of $139,375, while families with 1 earner (172) have the lowest median family income of $44,750, accounting for 29.2% and 34.1% of families, respectively.
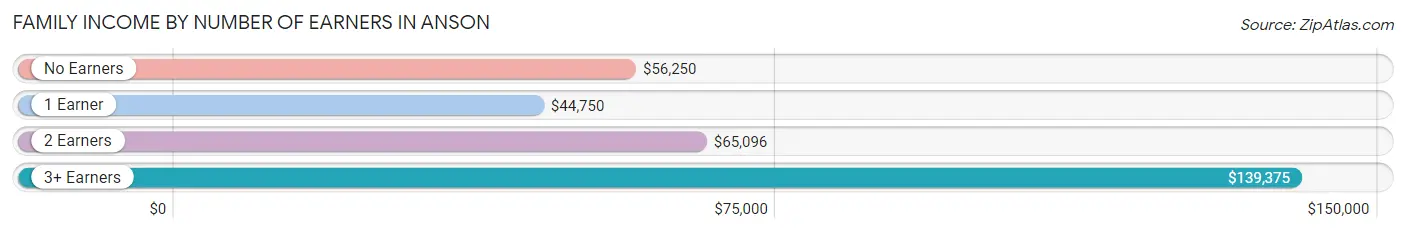
| Number of Earners | # Families | Median Income |
| No Earners | 102 (20.2%) | $56,250 |
| 1 Earner | 172 (34.1%) | $44,750 |
| 2 Earners | 83 (16.5%) | $65,096 |
| 3+ Earners | 147 (29.2%) | $139,375 |
| Total | 504 (100.0%) | $65,263 |
Household Income in Anson
Household Income Brackets in Anson
With 182 households falling in the category, the $50,000 to $74,999 income range is the most frequent in Anson, accounting for 20.9% of all households. In contrast, only 28 households (3.2%) fall into the $200,000+ income bracket, making it the least populous group.
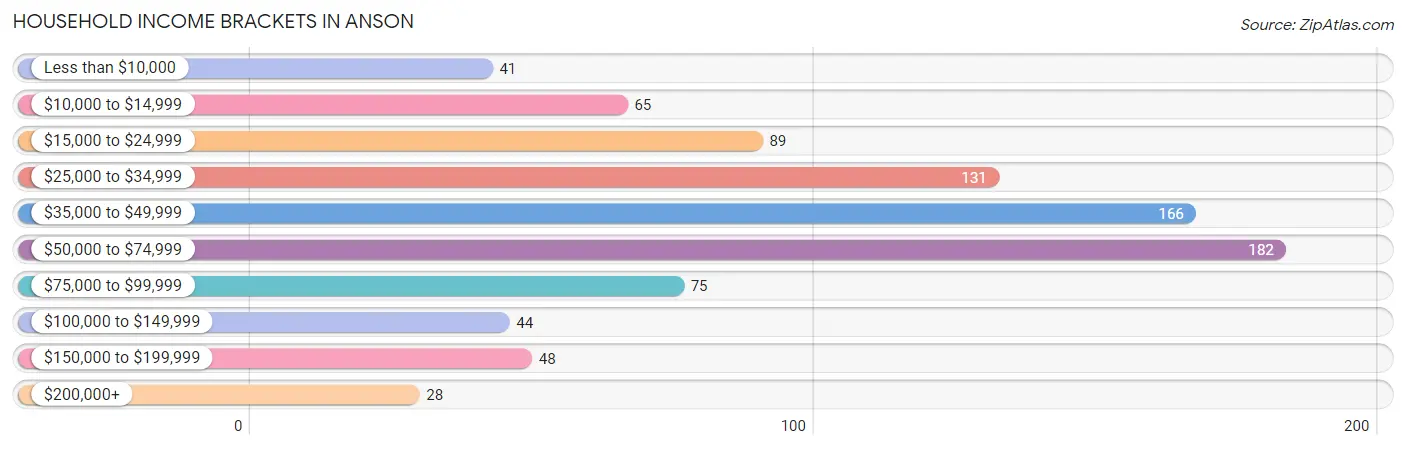
| Income Bracket | # Households | % Households |
| Less than $10,000 | 41 | 4.7% |
| $10,000 to $14,999 | 65 | 7.5% |
| $15,000 to $24,999 | 89 | 10.2% |
| $25,000 to $34,999 | 131 | 15.1% |
| $35,000 to $49,999 | 166 | 19.1% |
| $50,000 to $74,999 | 182 | 20.9% |
| $75,000 to $99,999 | 75 | 8.6% |
| $100,000 to $149,999 | 44 | 5.1% |
| $150,000 to $199,999 | 48 | 5.5% |
| $200,000+ | 28 | 3.2% |
Household Income by Householder Age in Anson
The median household income in Anson is $43,576, with the highest median household income of $60,568 found in the 45 to 64 years age bracket for the primary householder. A total of 305 households (35.1%) fall into this category. Meanwhile, the 65+ years age bracket for the primary householder has the lowest median household income of $36,250, with 300 households (34.5%) in this group.
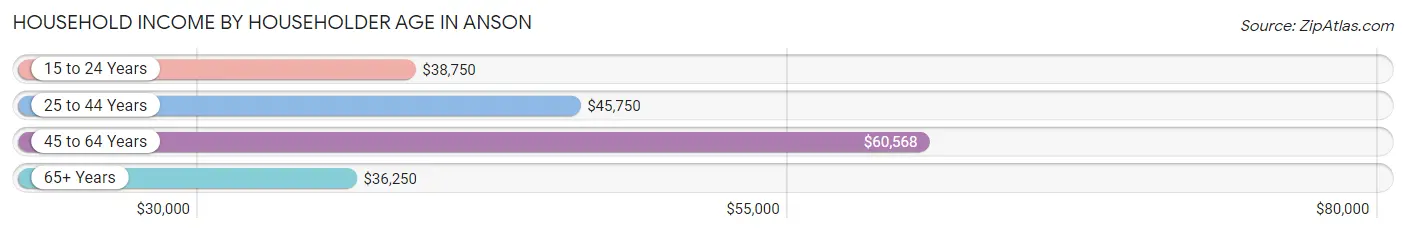
| Income Bracket | # Households | Median Income |
| 15 to 24 Years | 53 (6.1%) | $38,750 |
| 25 to 44 Years | 211 (24.3%) | $45,750 |
| 45 to 64 Years | 305 (35.1%) | $60,568 |
| 65+ Years | 300 (34.5%) | $36,250 |
| Total | 869 (100.0%) | $43,576 |
Poverty in Anson
Income Below Poverty by Sex and Age in Anson
With 14.0% poverty level for males and 18.2% for females among the residents of Anson, 35 to 44 year old males and 35 to 44 year old females are the most vulnerable to poverty, with 29 males (44.6%) and 45 females (54.9%) in their respective age groups living below the poverty level.
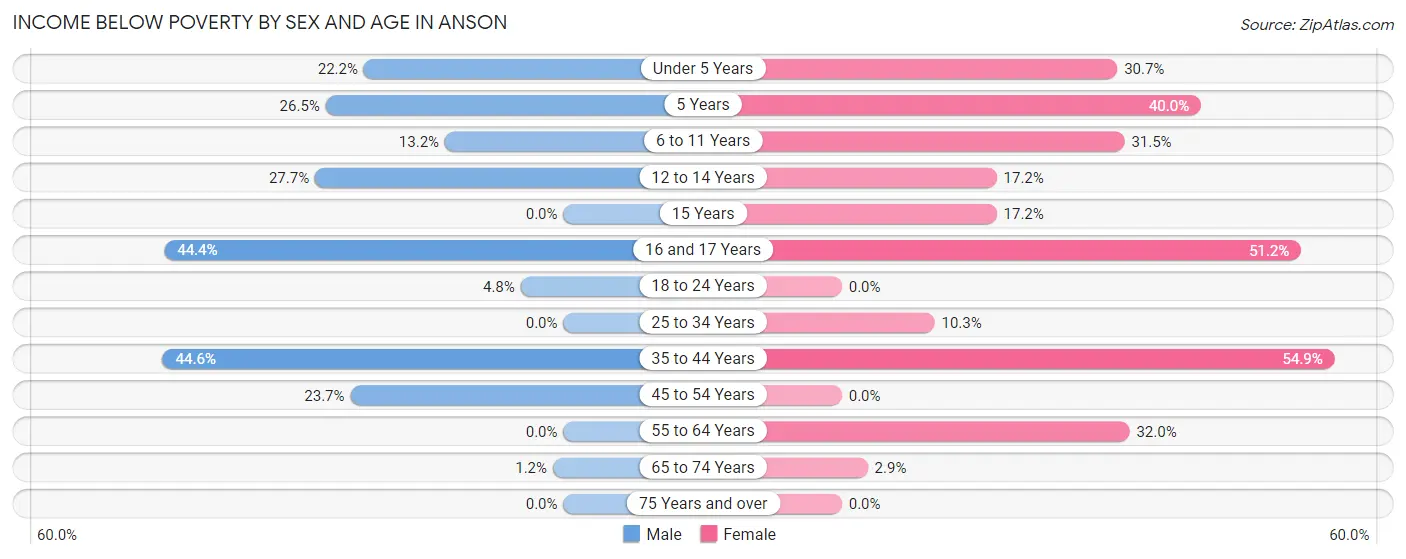
| Age Bracket | Male | Female |
| Under 5 Years | 4 (22.2%) | 23 (30.7%) |
| 5 Years | 9 (26.5%) | 6 (40.0%) |
| 6 to 11 Years | 12 (13.2%) | 17 (31.5%) |
| 12 to 14 Years | 13 (27.7%) | 5 (17.2%) |
| 15 Years | 0 (0.0%) | 5 (17.2%) |
| 16 and 17 Years | 12 (44.4%) | 22 (51.2%) |
| 18 to 24 Years | 4 (4.8%) | 0 (0.0%) |
| 25 to 34 Years | 0 (0.0%) | 19 (10.3%) |
| 35 to 44 Years | 29 (44.6%) | 45 (54.9%) |
| 45 to 54 Years | 37 (23.7%) | 0 (0.0%) |
| 55 to 64 Years | 0 (0.0%) | 33 (32.0%) |
| 65 to 74 Years | 2 (1.2%) | 4 (2.9%) |
| 75 Years and over | 0 (0.0%) | 0 (0.0%) |
| Total | 122 (14.0%) | 179 (18.2%) |
Income Above Poverty by Sex and Age in Anson
According to the poverty statistics in Anson, males aged 25 to 34 years and females aged 18 to 24 years are the age groups that are most secure financially, with 100.0% of males and 100.0% of females in these age groups living above the poverty line.
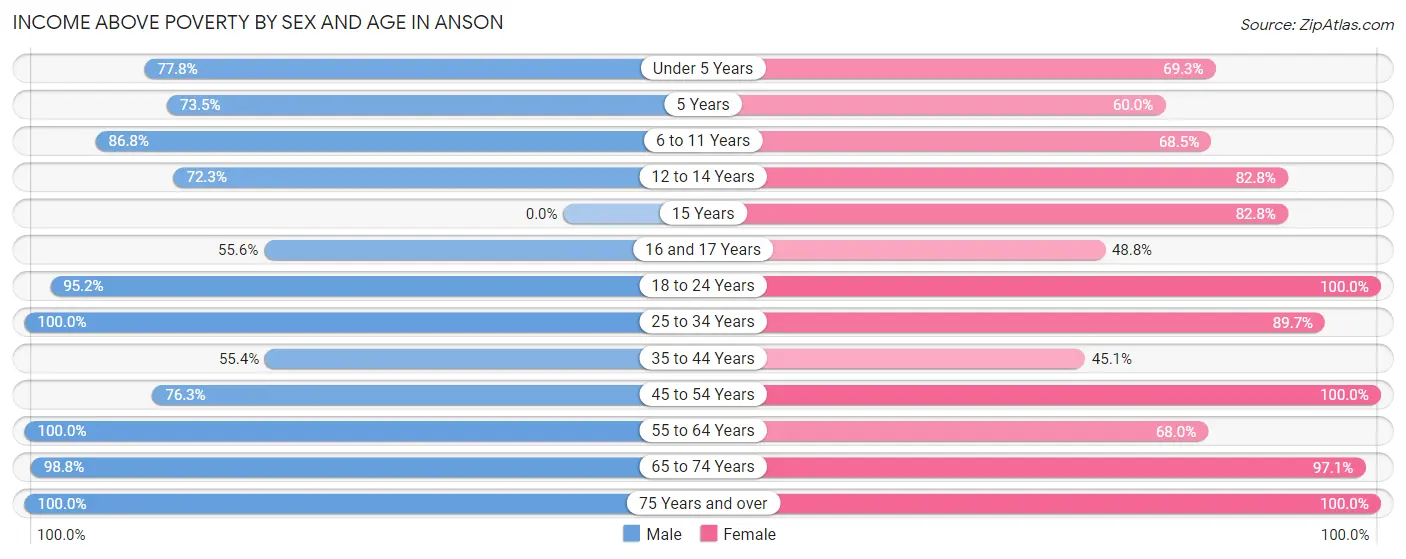
| Age Bracket | Male | Female |
| Under 5 Years | 14 (77.8%) | 52 (69.3%) |
| 5 Years | 25 (73.5%) | 9 (60.0%) |
| 6 to 11 Years | 79 (86.8%) | 37 (68.5%) |
| 12 to 14 Years | 34 (72.3%) | 24 (82.8%) |
| 15 Years | 0 (0.0%) | 24 (82.8%) |
| 16 and 17 Years | 15 (55.6%) | 21 (48.8%) |
| 18 to 24 Years | 80 (95.2%) | 50 (100.0%) |
| 25 to 34 Years | 43 (100.0%) | 165 (89.7%) |
| 35 to 44 Years | 36 (55.4%) | 37 (45.1%) |
| 45 to 54 Years | 119 (76.3%) | 125 (100.0%) |
| 55 to 64 Years | 90 (100.0%) | 70 (68.0%) |
| 65 to 74 Years | 169 (98.8%) | 135 (97.1%) |
| 75 Years and over | 46 (100.0%) | 55 (100.0%) |
| Total | 750 (86.0%) | 804 (81.8%) |
Income Below Poverty Among Married-Couple Families in Anson
The poverty statistics for married-couple families in Anson show that 6.6% or 27 of the total 409 families live below the poverty line. Families with 1 or 2 children have the highest poverty rate of 17.3%, comprising of 23 families. On the other hand, families with no children have the lowest poverty rate of 0.0%, which includes 0 families.
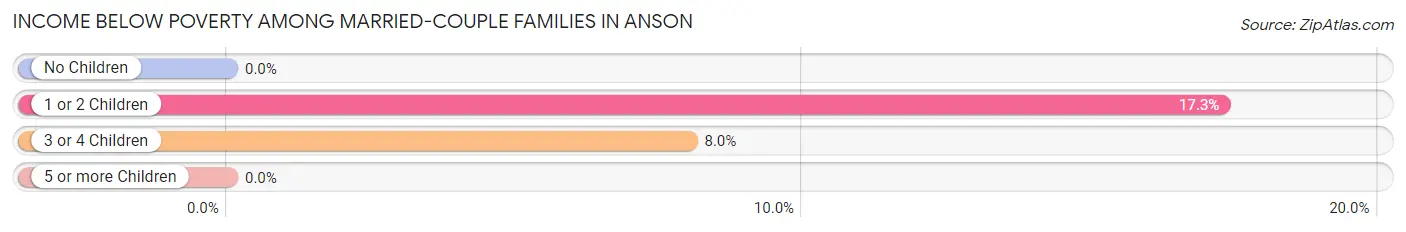
| Children | Above Poverty | Below Poverty |
| No Children | 206 (100.0%) | 0 (0.0%) |
| 1 or 2 Children | 110 (82.7%) | 23 (17.3%) |
| 3 or 4 Children | 46 (92.0%) | 4 (8.0%) |
| 5 or more Children | 20 (100.0%) | 0 (0.0%) |
| Total | 382 (93.4%) | 27 (6.6%) |
Income Below Poverty Among Single-Parent Households in Anson
According to the poverty data in Anson, 58.8% or 10 single-father households and 30.8% or 24 single-mother households are living below the poverty line. Among single-father households, those with 3 or 4 children have the highest poverty rate, with 4 households (100.0%) experiencing poverty. Likewise, among single-mother households, those with 5 or more children have the highest poverty rate, with 7 households (100.0%) falling below the poverty line.
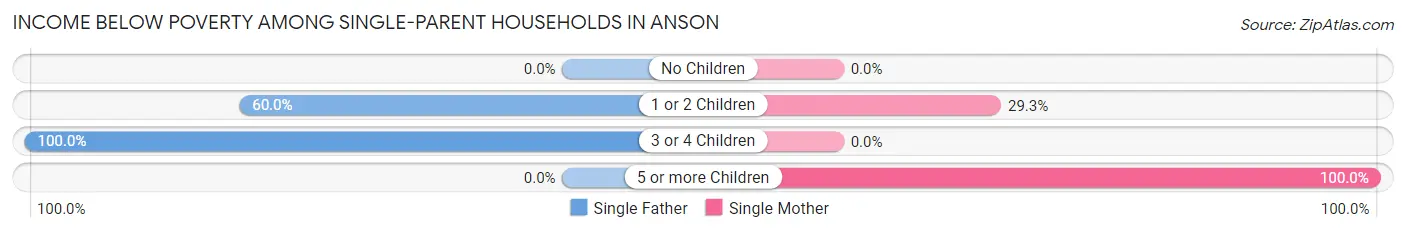
| Children | Single Father | Single Mother |
| No Children | 0 (0.0%) | 0 (0.0%) |
| 1 or 2 Children | 6 (60.0%) | 17 (29.3%) |
| 3 or 4 Children | 4 (100.0%) | 0 (0.0%) |
| 5 or more Children | 0 (0.0%) | 7 (100.0%) |
| Total | 10 (58.8%) | 24 (30.8%) |
Income Below Poverty Among Married-Couple vs Single-Parent Households in Anson
The poverty data for Anson shows that 27 of the married-couple family households (6.6%) and 34 of the single-parent households (35.8%) are living below the poverty level. Within the married-couple family households, those with 1 or 2 children have the highest poverty rate, with 23 households (17.3%) falling below the poverty line. Among the single-parent households, those with 3 or 4 children have the highest poverty rate, with 4 household (100.0%) living below poverty.
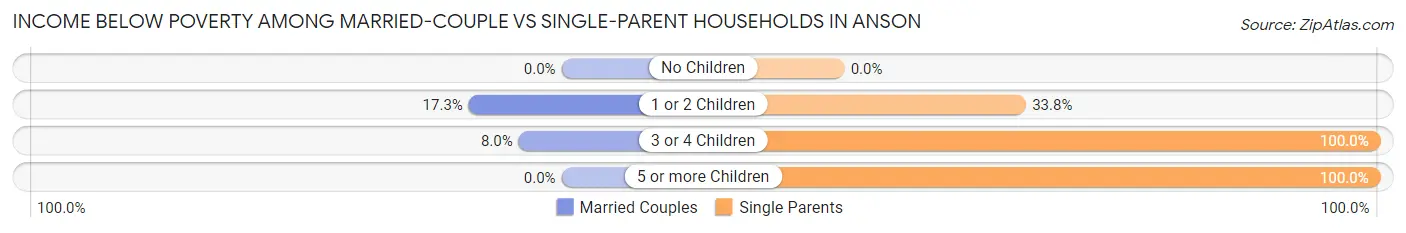
| Children | Married-Couple Families | Single-Parent Households |
| No Children | 0 (0.0%) | 0 (0.0%) |
| 1 or 2 Children | 23 (17.3%) | 23 (33.8%) |
| 3 or 4 Children | 4 (8.0%) | 4 (100.0%) |
| 5 or more Children | 0 (0.0%) | 7 (100.0%) |
| Total | 27 (6.6%) | 34 (35.8%) |
Race in Anson
The most populous races in Anson are White / Caucasian (1,527 | 76.3%), Hispanic or Latino (685 | 34.3%), and Two or more Races (242 | 12.1%).
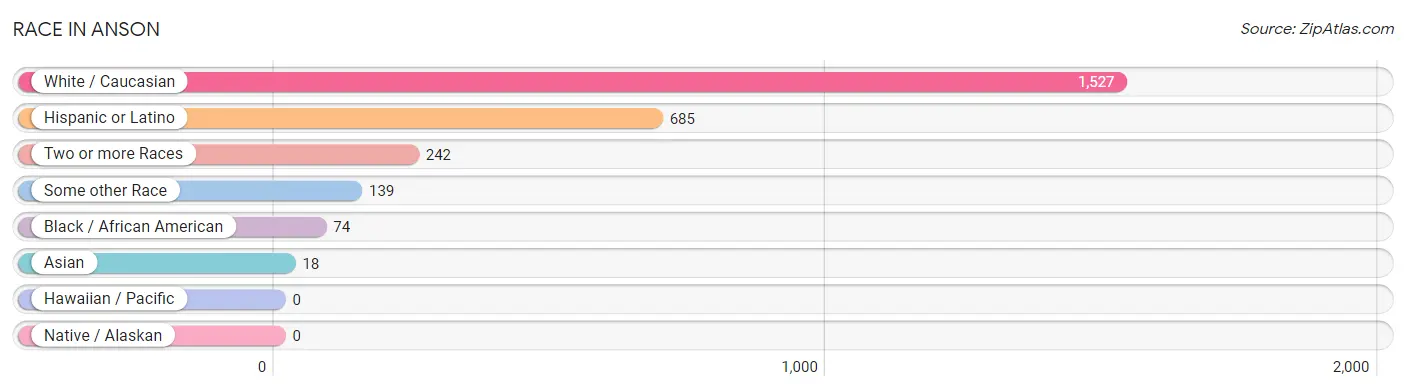
| Race | # Population | % Population |
| Asian | 18 | 0.9% |
| Black / African American | 74 | 3.7% |
| Hawaiian / Pacific | 0 | 0.0% |
| Hispanic or Latino | 685 | 34.3% |
| Native / Alaskan | 0 | 0.0% |
| White / Caucasian | 1,527 | 76.3% |
| Two or more Races | 242 | 12.1% |
| Some other Race | 139 | 7.0% |
| Total | 2,000 | 100.0% |
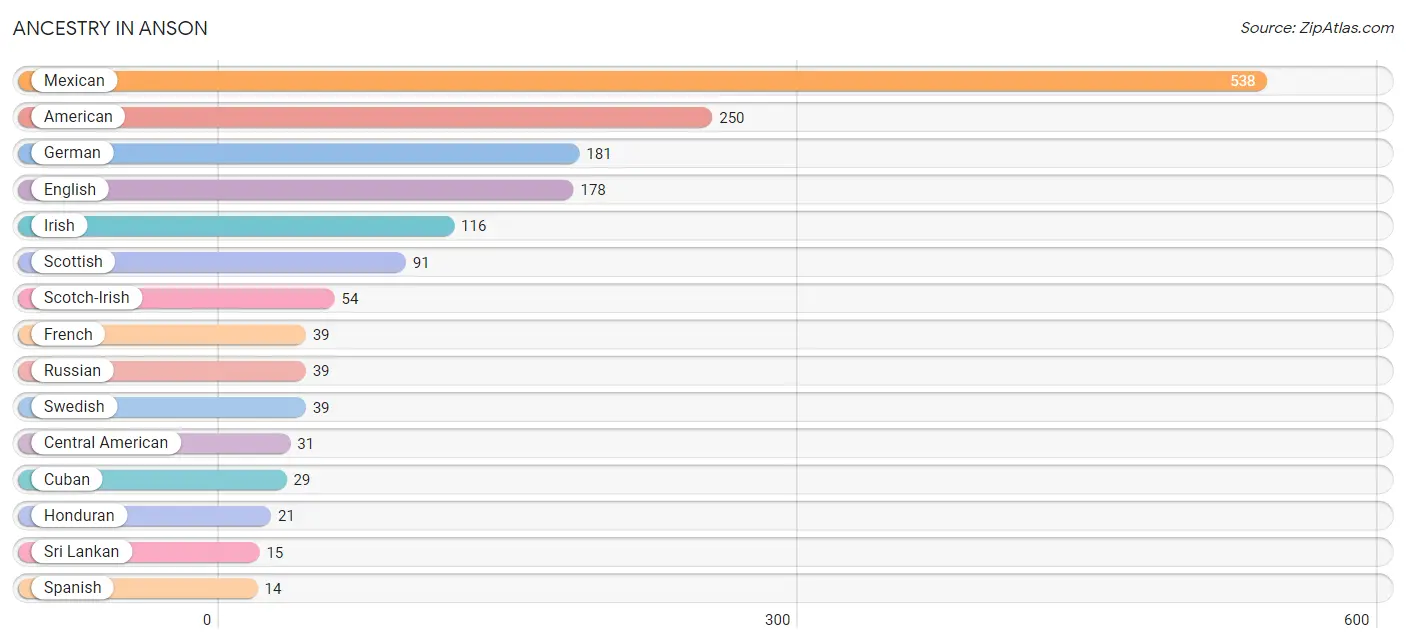
Ancestry in Anson
The most populous ancestries reported in Anson are Mexican (538 | 26.9%), American (250 | 12.5%), German (181 | 9.0%), English (178 | 8.9%), and Irish (116 | 5.8%), together accounting for 63.2% of all Anson residents.
| Ancestry | # Population | % Population |
| American | 250 | 12.5% |
| Apache | 1 | 0.1% |
| Arab | 8 | 0.4% |
| Argentinean | 2 | 0.1% |
| British | 9 | 0.4% |
| Central American | 31 | 1.5% |
| Cherokee | 2 | 0.1% |
| Cuban | 29 | 1.5% |
| Czech | 13 | 0.6% |
| Delaware | 2 | 0.1% |
| Dutch | 5 | 0.3% |
| Dutch West Indian | 5 | 0.3% |
| English | 178 | 8.9% |
| French | 39 | 1.9% |
| German | 181 | 9.0% |
| Guatemalan | 6 | 0.3% |
| Honduran | 21 | 1.1% |
| Irish | 116 | 5.8% |
| Jamaican | 3 | 0.2% |
| Lebanese | 8 | 0.4% |
| Macedonian | 1 | 0.1% |
| Mexican | 538 | 26.9% |
| Nigerian | 3 | 0.2% |
| Puerto Rican | 9 | 0.4% |
| Russian | 39 | 1.9% |
| Salvadoran | 4 | 0.2% |
| Scotch-Irish | 54 | 2.7% |
| Scottish | 91 | 4.5% |
| South American | 5 | 0.3% |
| Spaniard | 6 | 0.3% |
| Spanish | 14 | 0.7% |
| Sri Lankan | 15 | 0.7% |
| Subsaharan African | 3 | 0.2% |
| Swedish | 39 | 1.9% |
| Swiss | 1 | 0.1% |
| Thai | 3 | 0.2% |
| Venezuelan | 3 | 0.2% | View All 37 Rows |
Immigrants in Anson
The most numerous immigrant groups reported in Anson came from Latin America (90 | 4.5%), Central America (84 | 4.2%), Mexico (55 | 2.8%), Honduras (21 | 1.1%), and Asia (14 | 0.7%), together accounting for 13.2% of all Anson residents.
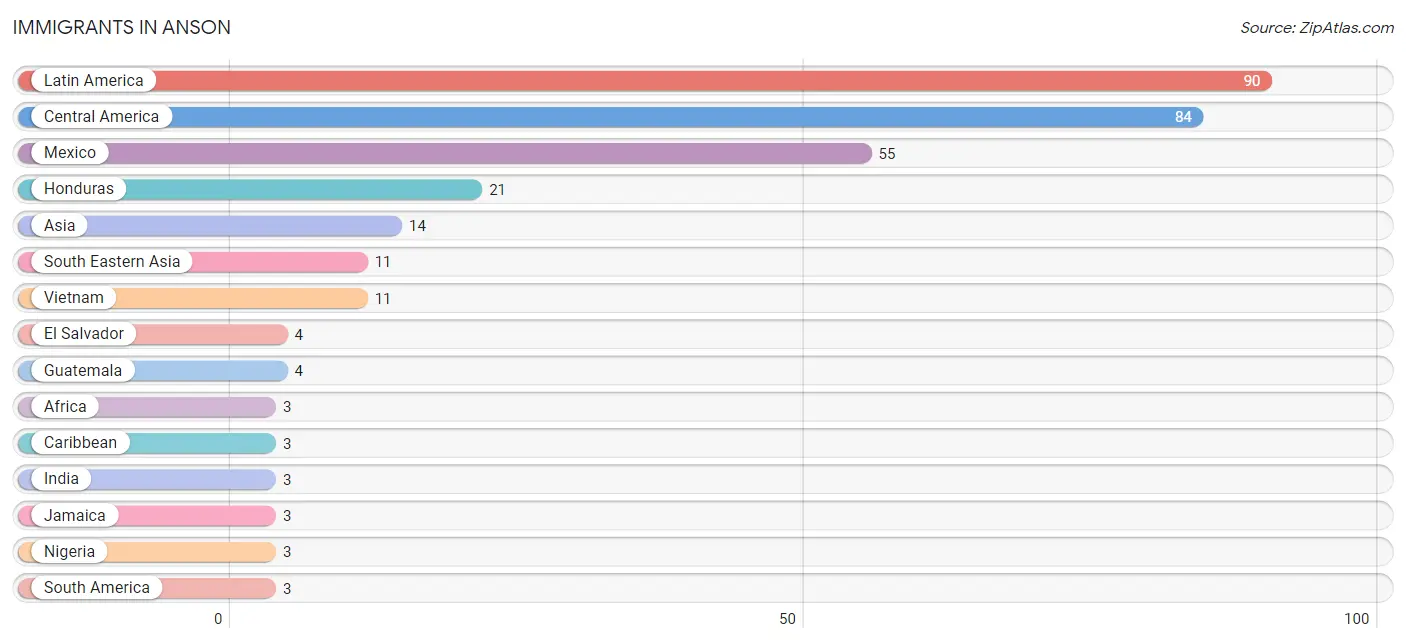
| Immigration Origin | # Population | % Population |
| Africa | 3 | 0.2% |
| Asia | 14 | 0.7% |
| Caribbean | 3 | 0.2% |
| Central America | 84 | 4.2% |
| El Salvador | 4 | 0.2% |
| Guatemala | 4 | 0.2% |
| Honduras | 21 | 1.1% |
| India | 3 | 0.2% |
| Jamaica | 3 | 0.2% |
| Latin America | 90 | 4.5% |
| Mexico | 55 | 2.8% |
| Nigeria | 3 | 0.2% |
| South America | 3 | 0.2% |
| South Central Asia | 3 | 0.2% |
| South Eastern Asia | 11 | 0.5% |
| Venezuela | 3 | 0.2% |
| Vietnam | 11 | 0.5% |
| Western Africa | 3 | 0.2% | View All 18 Rows |
Sex and Age in Anson
Sex and Age in Anson
The most populous age groups in Anson are 65 to 69 Years (132 | 13.6%) for men and 25 to 29 Years (124 | 12.0%) for women.
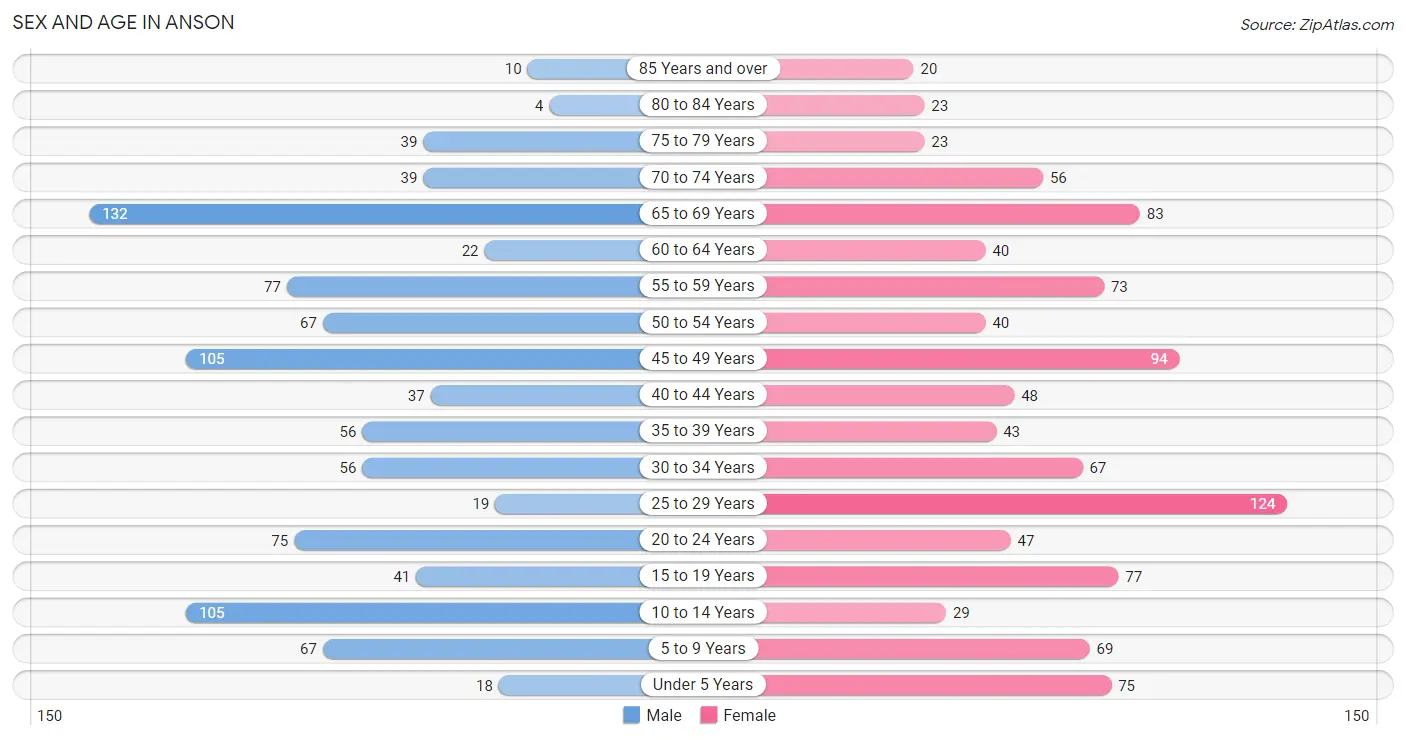
| Age Bracket | Male | Female |
| Under 5 Years | 18 (1.9%) | 75 (7.3%) |
| 5 to 9 Years | 67 (6.9%) | 69 (6.7%) |
| 10 to 14 Years | 105 (10.8%) | 29 (2.8%) |
| 15 to 19 Years | 41 (4.2%) | 77 (7.5%) |
| 20 to 24 Years | 75 (7.7%) | 47 (4.6%) |
| 25 to 29 Years | 19 (2.0%) | 124 (12.0%) |
| 30 to 34 Years | 56 (5.8%) | 67 (6.5%) |
| 35 to 39 Years | 56 (5.8%) | 43 (4.2%) |
| 40 to 44 Years | 37 (3.8%) | 48 (4.7%) |
| 45 to 49 Years | 105 (10.8%) | 94 (9.1%) |
| 50 to 54 Years | 67 (6.9%) | 40 (3.9%) |
| 55 to 59 Years | 77 (8.0%) | 73 (7.1%) |
| 60 to 64 Years | 22 (2.3%) | 40 (3.9%) |
| 65 to 69 Years | 132 (13.6%) | 83 (8.1%) |
| 70 to 74 Years | 39 (4.0%) | 56 (5.4%) |
| 75 to 79 Years | 39 (4.0%) | 23 (2.2%) |
| 80 to 84 Years | 4 (0.4%) | 23 (2.2%) |
| 85 Years and over | 10 (1.0%) | 20 (1.9%) |
| Total | 969 (100.0%) | 1,031 (100.0%) |
Families and Households in Anson
Median Family Size in Anson
The median family size in Anson is 2.86 persons per family, with single male/father families (17 | 3.4%) accounting for the largest median family size of 3.06 persons per family. On the other hand, single female/mother families (78 | 15.5%) represent the smallest median family size with 2.45 persons per family.
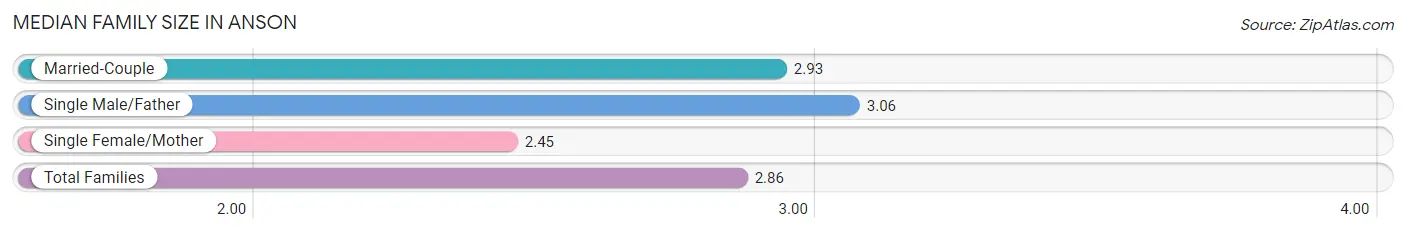
| Family Type | # Families | Family Size |
| Married-Couple | 409 (81.1%) | 2.93 |
| Single Male/Father | 17 (3.4%) | 3.06 |
| Single Female/Mother | 78 (15.5%) | 2.45 |
| Total Families | 504 (100.0%) | 2.86 |
Median Household Size in Anson
The median household size in Anson is 2.13 persons per household, with single male/father households (17 | 2.0%) accounting for the largest median household size of 4.41 persons per household. non-family households (365 | 42.0%) represent the smallest median household size with 1.04 persons per household.
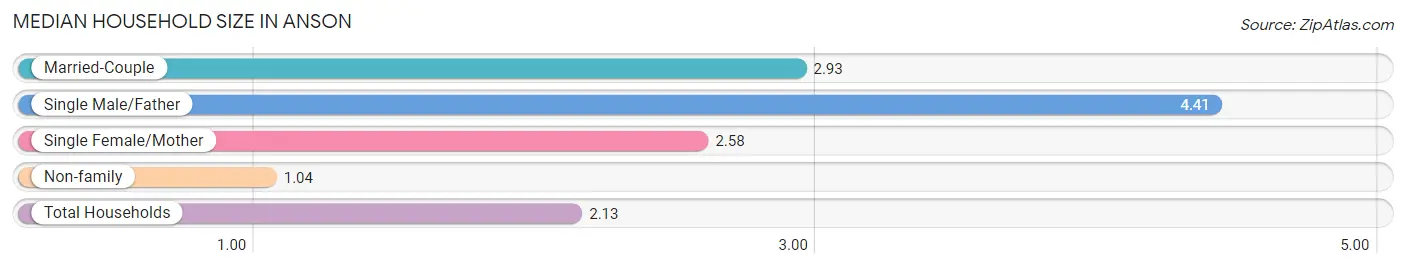
| Household Type | # Households | Household Size |
| Married-Couple | 409 (47.1%) | 2.93 |
| Single Male/Father | 17 (2.0%) | 4.41 |
| Single Female/Mother | 78 (9.0%) | 2.58 |
| Non-family | 365 (42.0%) | 1.04 |
| Total Households | 869 (100.0%) | 2.13 |
Household Size by Marriage Status in Anson
Out of a total of 869 households in Anson, 504 (58.0%) are family households, while 365 (42.0%) are nonfamily households. The most numerous type of family households are 2-person households, comprising 161, and the most common type of nonfamily households are 1-person households, comprising 351.
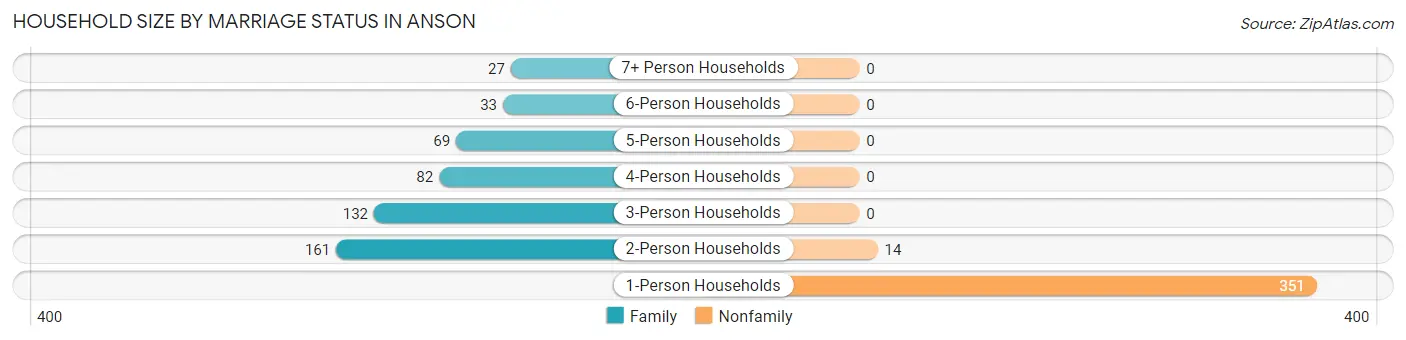
| Household Size | Family Households | Nonfamily Households |
| 1-Person Households | - | 351 (40.4%) |
| 2-Person Households | 161 (18.5%) | 14 (1.6%) |
| 3-Person Households | 132 (15.2%) | 0 (0.0%) |
| 4-Person Households | 82 (9.4%) | 0 (0.0%) |
| 5-Person Households | 69 (7.9%) | 0 (0.0%) |
| 6-Person Households | 33 (3.8%) | 0 (0.0%) |
| 7+ Person Households | 27 (3.1%) | 0 (0.0%) |
| Total | 504 (58.0%) | 365 (42.0%) |
Female Fertility in Anson
Fertility by Age in Anson
Average fertility rate in Anson is 33.0 births per 1,000 women. Women in the age bracket of 15 to 19 years have the highest fertility rate with 91.0 births per 1,000 women. Women in the age bracket of 15 to 19 years acount for 41.2% of all women with births.
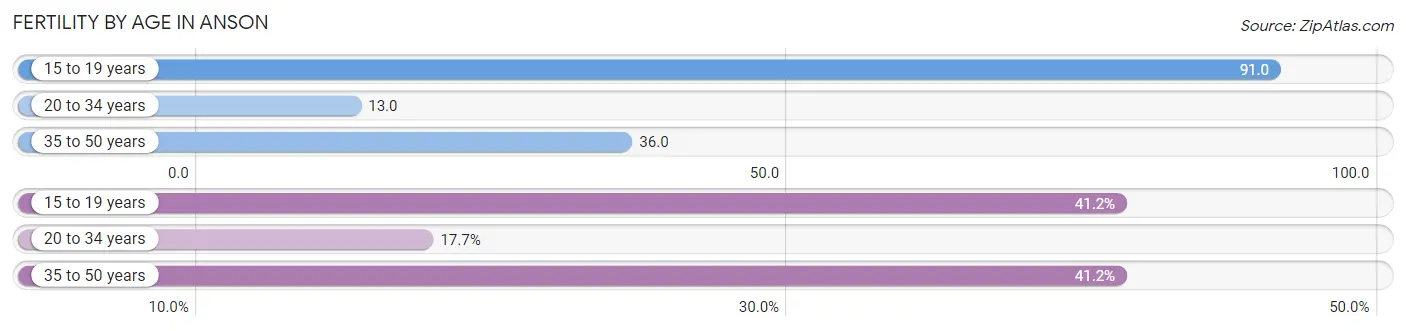
| Age Bracket | Women with Births | Births / 1,000 Women |
| 15 to 19 years | 7 (41.2%) | 91.0 |
| 20 to 34 years | 3 (17.6%) | 13.0 |
| 35 to 50 years | 7 (41.2%) | 36.0 |
| Total | 17 (100.0%) | 33.0 |
Fertility by Age by Marriage Status in Anson
58.8% of women with births (17) in Anson are married. The highest percentage of unmarried women with births falls into 15 to 19 years age bracket with 100.0% of them unmarried at the time of birth, while the lowest percentage of unmarried women with births belong to 20 to 34 years age bracket with 0.0% of them unmarried.
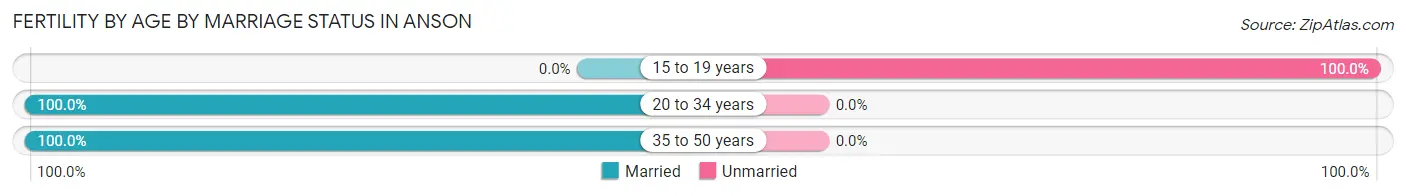
| Age Bracket | Married | Unmarried |
| 15 to 19 years | 0 (0.0%) | 7 (100.0%) |
| 20 to 34 years | 3 (100.0%) | 0 (0.0%) |
| 35 to 50 years | 7 (100.0%) | 0 (0.0%) |
| Total | 10 (58.8%) | 7 (41.2%) |
Fertility by Education in Anson
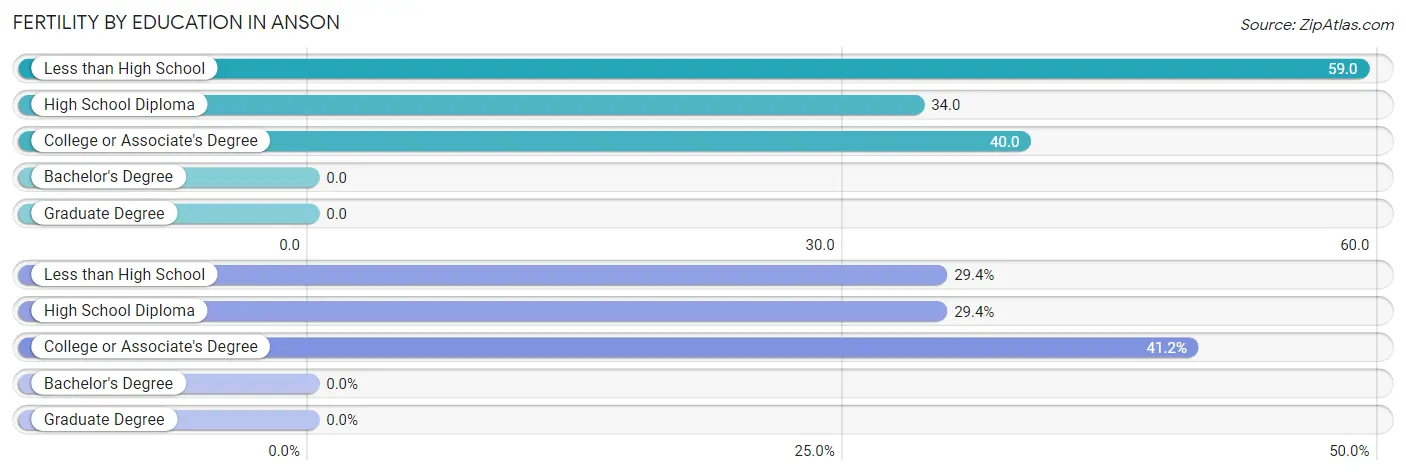
| Educational Attainment | Women with Births | Births / 1,000 Women |
| Less than High School | 5 (29.4%) | 59.0 |
| High School Diploma | 5 (29.4%) | 34.0 |
| College or Associate's Degree | 7 (41.2%) | 40.0 |
| Bachelor's Degree | 0 (0.0%) | 0.0 |
| Graduate Degree | 0 (0.0%) | 0.0 |
| Total | 17 (100.0%) | 33.0 |
Fertility by Education by Marriage Status in Anson
41.2% of women with births in Anson are unmarried. Women with the educational attainment of college or associate's degree are most likely to be married with 100.0% of them married at childbirth, while women with the educational attainment of less than high school are least likely to be married with 100.0% of them unmarried at childbirth.
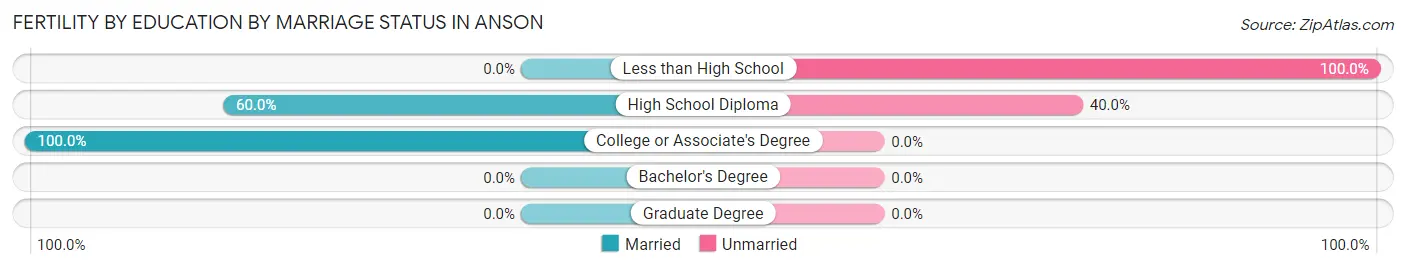
| Educational Attainment | Married | Unmarried |
| Less than High School | 0 (0.0%) | 5 (100.0%) |
| High School Diploma | 3 (60.0%) | 2 (40.0%) |
| College or Associate's Degree | 7 (100.0%) | 0 (0.0%) |
| Bachelor's Degree | 0 (0.0%) | 0 (0.0%) |
| Graduate Degree | 0 (0.0%) | 0 (0.0%) |
| Total | 10 (58.8%) | 7 (41.2%) |
Employment Characteristics in Anson
Employment by Class of Employer in Anson
Among the 841 employed individuals in Anson, private company employees (486 | 57.8%), state government employees (143 | 17.0%), and local government employees (92 | 10.9%) make up the most common classes of employment.
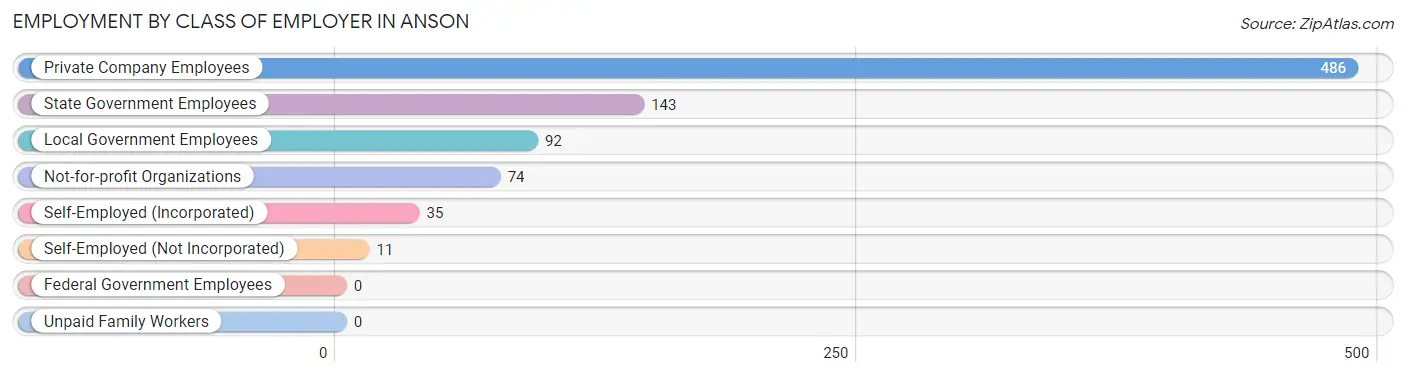
| Employer Class | # Employees | % Employees |
| Private Company Employees | 486 | 57.8% |
| Self-Employed (Incorporated) | 35 | 4.2% |
| Self-Employed (Not Incorporated) | 11 | 1.3% |
| Not-for-profit Organizations | 74 | 8.8% |
| Local Government Employees | 92 | 10.9% |
| State Government Employees | 143 | 17.0% |
| Federal Government Employees | 0 | 0.0% |
| Unpaid Family Workers | 0 | 0.0% |
| Total | 841 | 100.0% |
Employment Status by Age in Anson
According to the labor force statistics for Anson, out of the total population over 16 years of age (1,608), 54.0% or 868 individuals are in the labor force, with 2.5% or 22 of them unemployed. The age group with the highest labor force participation rate is 20 to 24 years, with 82.8% or 101 individuals in the labor force. Within the labor force, the 20 to 24 years age range has the highest percentage of unemployed individuals, with 6.9% or 7 of them being unemployed.
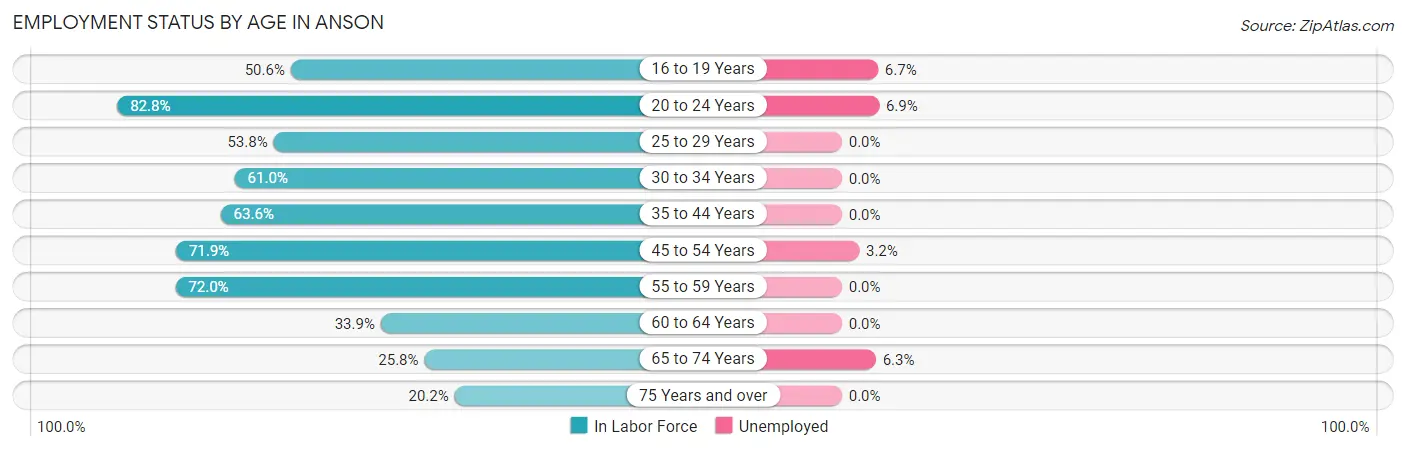
| Age Bracket | In Labor Force | Unemployed |
| 16 to 19 Years | 45 (50.6%) | 3 (6.7%) |
| 20 to 24 Years | 101 (82.8%) | 7 (6.9%) |
| 25 to 29 Years | 77 (53.8%) | 0 (0.0%) |
| 30 to 34 Years | 75 (61.0%) | 0 (0.0%) |
| 35 to 44 Years | 117 (63.6%) | 0 (0.0%) |
| 45 to 54 Years | 220 (71.9%) | 7 (3.2%) |
| 55 to 59 Years | 108 (72.0%) | 0 (0.0%) |
| 60 to 64 Years | 21 (33.9%) | 0 (0.0%) |
| 65 to 74 Years | 80 (25.8%) | 5 (6.3%) |
| 75 Years and over | 24 (20.2%) | 0 (0.0%) |
| Total | 868 (54.0%) | 22 (2.5%) |
Employment Status by Educational Attainment in Anson
According to labor force statistics for Anson, 63.8% of individuals (618) out of the total population between 25 and 64 years of age (968) are in the labor force, with 1.1% or 7 of them being unemployed. The group with the highest labor force participation rate are those with the educational attainment of bachelor's degree or higher, with 89.5% or 145 individuals in the labor force. Within the labor force, individuals with college / associate degree education have the highest percentage of unemployment, with 2.5% or 7 of them being unemployed.
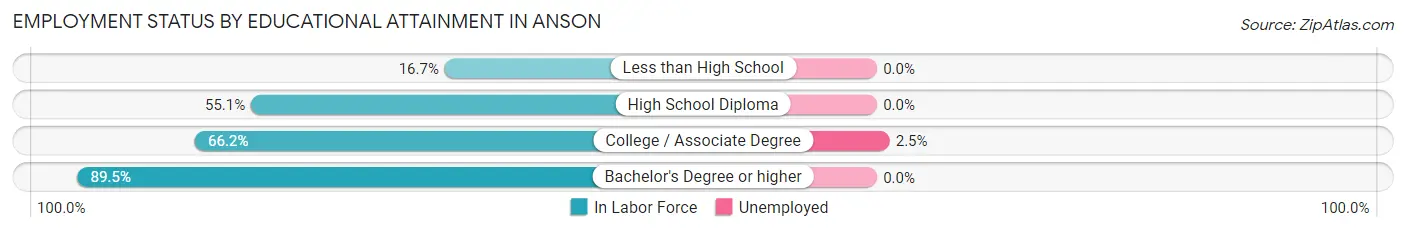
| Educational Attainment | In Labor Force | Unemployed |
| Less than High School | 8 (16.7%) | 0 (0.0%) |
| High School Diploma | 183 (55.1%) | 0 (0.0%) |
| College / Associate Degree | 282 (66.2%) | 11 (2.5%) |
| Bachelor's Degree or higher | 145 (89.5%) | 0 (0.0%) |
| Total | 618 (63.8%) | 11 (1.1%) |
Employment Occupations by Sex in Anson
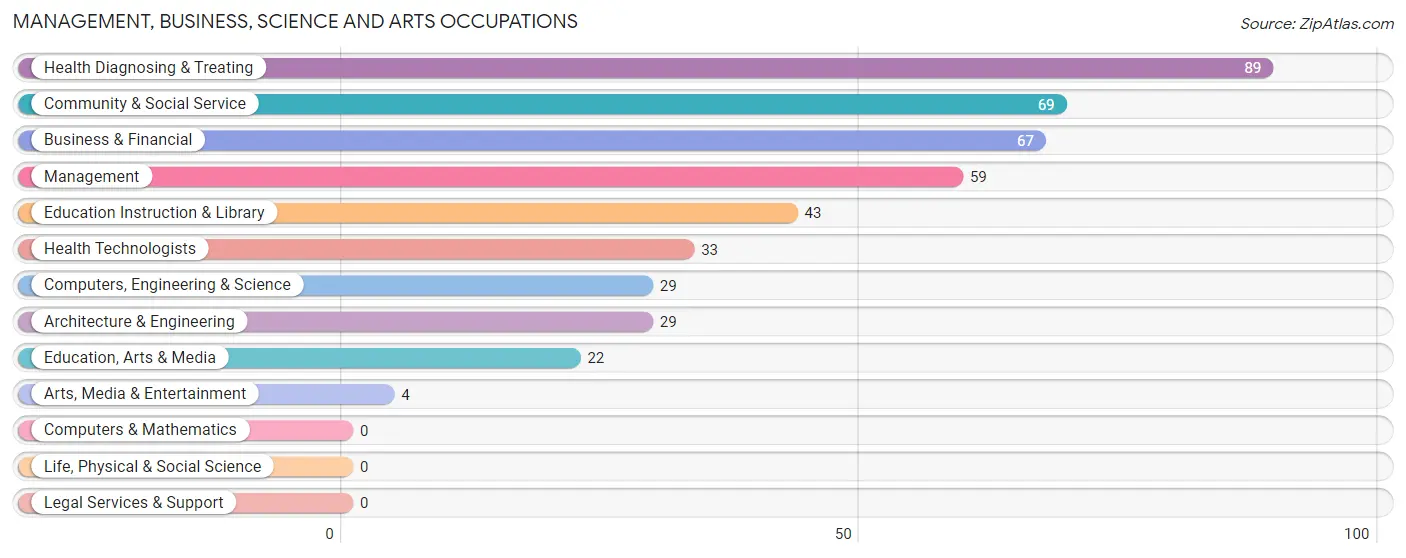
Management, Business, Science and Arts Occupations
The most common Management, Business, Science and Arts occupations in Anson are Health Diagnosing & Treating (89 | 10.5%), Community & Social Service (69 | 8.2%), Business & Financial (67 | 7.9%), Management (59 | 7.0%), and Education Instruction & Library (43 | 5.1%).
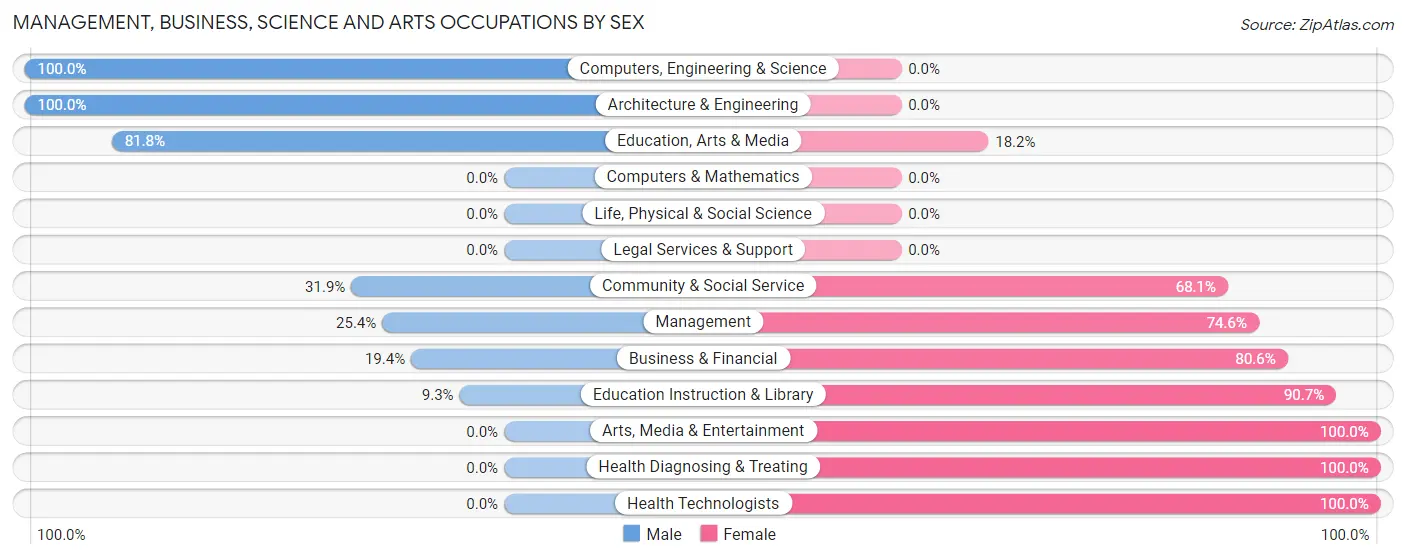
Management, Business, Science and Arts Occupations by Sex
Within the Management, Business, Science and Arts occupations in Anson, the most male-oriented occupations are Computers, Engineering & Science (100.0%), Architecture & Engineering (100.0%), and Education, Arts & Media (81.8%), while the most female-oriented occupations are Arts, Media & Entertainment (100.0%), Health Diagnosing & Treating (100.0%), and Health Technologists (100.0%).
| Occupation | Male | Female |
| Management | 15 (25.4%) | 44 (74.6%) |
| Business & Financial | 13 (19.4%) | 54 (80.6%) |
| Computers, Engineering & Science | 29 (100.0%) | 0 (0.0%) |
| Computers & Mathematics | 0 (0.0%) | 0 (0.0%) |
| Architecture & Engineering | 29 (100.0%) | 0 (0.0%) |
| Life, Physical & Social Science | 0 (0.0%) | 0 (0.0%) |
| Community & Social Service | 22 (31.9%) | 47 (68.1%) |
| Education, Arts & Media | 18 (81.8%) | 4 (18.2%) |
| Legal Services & Support | 0 (0.0%) | 0 (0.0%) |
| Education Instruction & Library | 4 (9.3%) | 39 (90.7%) |
| Arts, Media & Entertainment | 0 (0.0%) | 4 (100.0%) |
| Health Diagnosing & Treating | 0 (0.0%) | 89 (100.0%) |
| Health Technologists | 0 (0.0%) | 33 (100.0%) |
| Total (Category) | 79 (25.2%) | 234 (74.8%) |
| Total (Overall) | 433 (51.2%) | 413 (48.8%) |
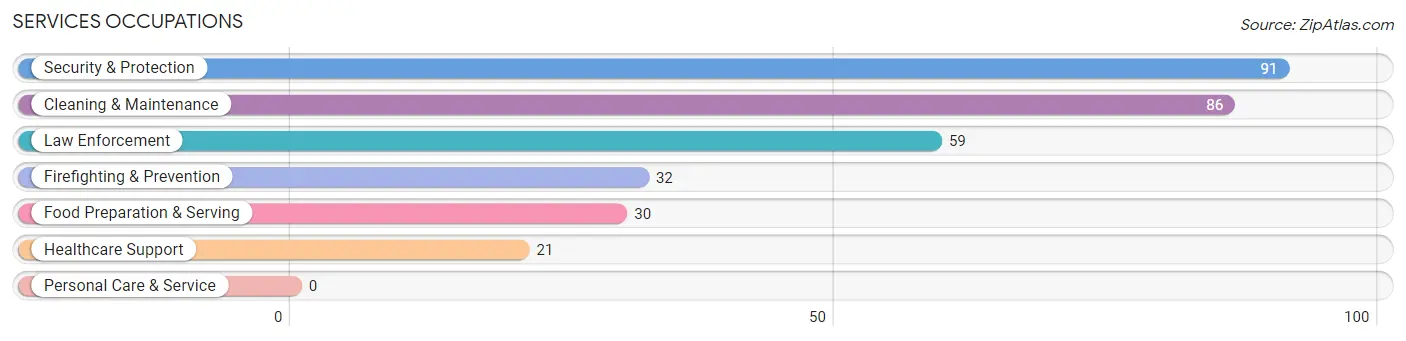
Services Occupations
The most common Services occupations in Anson are Security & Protection (91 | 10.8%), Cleaning & Maintenance (86 | 10.2%), Law Enforcement (59 | 7.0%), Firefighting & Prevention (32 | 3.8%), and Food Preparation & Serving (30 | 3.5%).
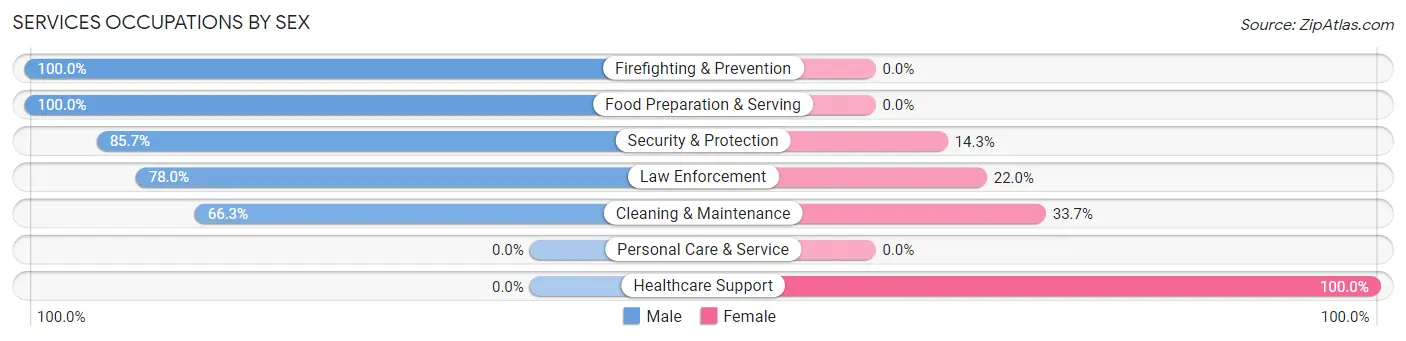
Services Occupations by Sex
Within the Services occupations in Anson, the most male-oriented occupations are Firefighting & Prevention (100.0%), Food Preparation & Serving (100.0%), and Security & Protection (85.7%), while the most female-oriented occupations are Healthcare Support (100.0%), Cleaning & Maintenance (33.7%), and Law Enforcement (22.0%).
| Occupation | Male | Female |
| Healthcare Support | 0 (0.0%) | 21 (100.0%) |
| Security & Protection | 78 (85.7%) | 13 (14.3%) |
| Firefighting & Prevention | 32 (100.0%) | 0 (0.0%) |
| Law Enforcement | 46 (78.0%) | 13 (22.0%) |
| Food Preparation & Serving | 30 (100.0%) | 0 (0.0%) |
| Cleaning & Maintenance | 57 (66.3%) | 29 (33.7%) |
| Personal Care & Service | 0 (0.0%) | 0 (0.0%) |
| Total (Category) | 165 (72.4%) | 63 (27.6%) |
| Total (Overall) | 433 (51.2%) | 413 (48.8%) |
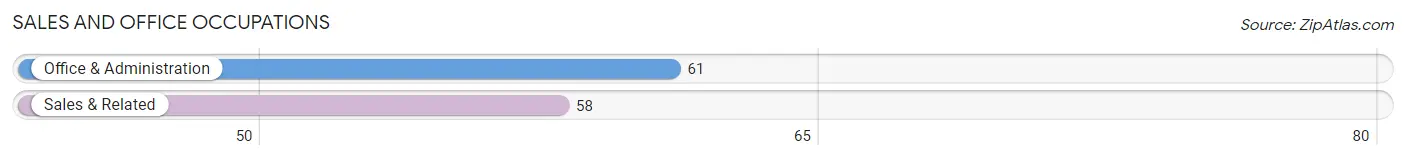
Sales and Office Occupations
The most common Sales and Office occupations in Anson are Office & Administration (61 | 7.2%), and Sales & Related (58 | 6.9%).
Sales and Office Occupations by Sex
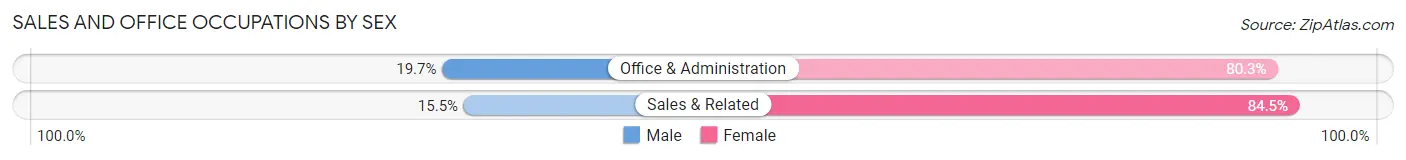
| Occupation | Male | Female |
| Sales & Related | 9 (15.5%) | 49 (84.5%) |
| Office & Administration | 12 (19.7%) | 49 (80.3%) |
| Total (Category) | 21 (17.6%) | 98 (82.4%) |
| Total (Overall) | 433 (51.2%) | 413 (48.8%) |
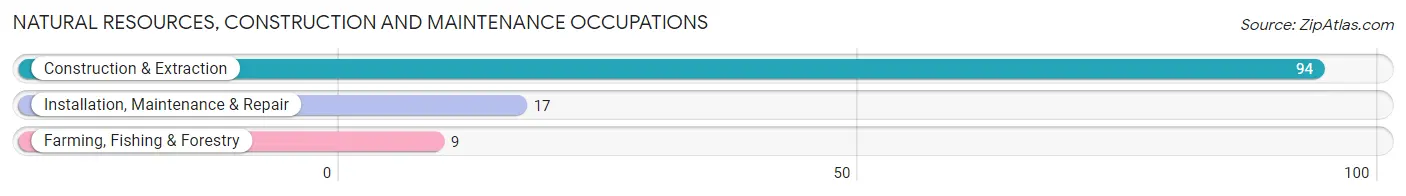
Natural Resources, Construction and Maintenance Occupations
The most common Natural Resources, Construction and Maintenance occupations in Anson are Construction & Extraction (94 | 11.1%), Installation, Maintenance & Repair (17 | 2.0%), and Farming, Fishing & Forestry (9 | 1.1%).
Natural Resources, Construction and Maintenance Occupations by Sex
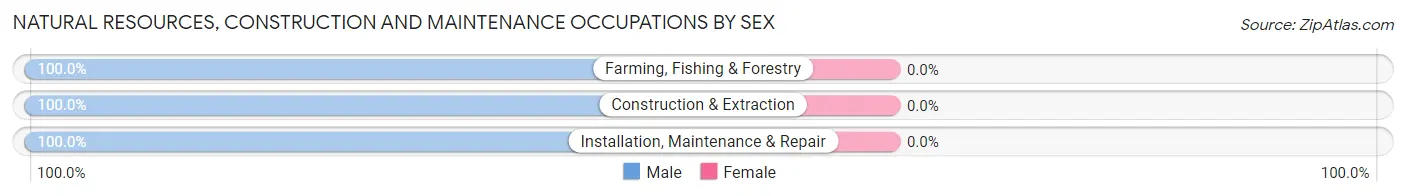
| Occupation | Male | Female |
| Farming, Fishing & Forestry | 9 (100.0%) | 0 (0.0%) |
| Construction & Extraction | 94 (100.0%) | 0 (0.0%) |
| Installation, Maintenance & Repair | 17 (100.0%) | 0 (0.0%) |
| Total (Category) | 120 (100.0%) | 0 (0.0%) |
| Total (Overall) | 433 (51.2%) | 413 (48.8%) |
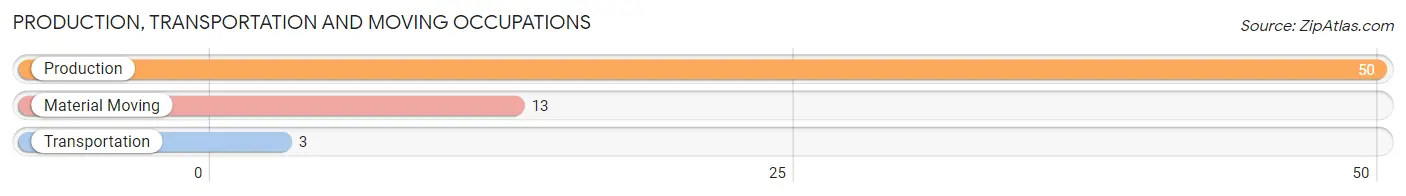
Production, Transportation and Moving Occupations
The most common Production, Transportation and Moving occupations in Anson are Production (50 | 5.9%), Material Moving (13 | 1.5%), and Transportation (3 | 0.4%).
Production, Transportation and Moving Occupations by Sex
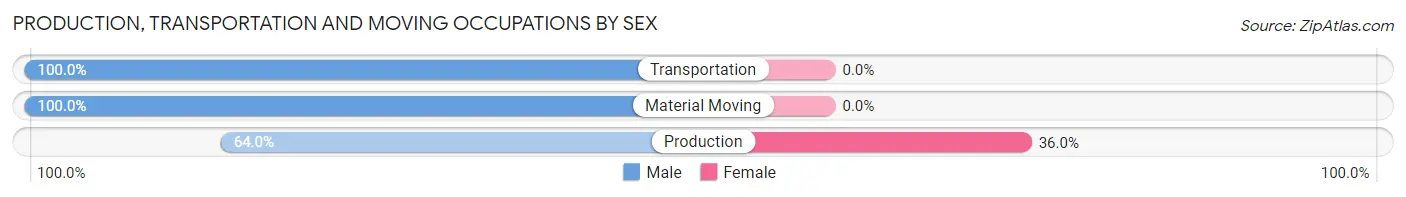
| Occupation | Male | Female |
| Production | 32 (64.0%) | 18 (36.0%) |
| Transportation | 3 (100.0%) | 0 (0.0%) |
| Material Moving | 13 (100.0%) | 0 (0.0%) |
| Total (Category) | 48 (72.7%) | 18 (27.3%) |
| Total (Overall) | 433 (51.2%) | 413 (48.8%) |
Employment Industries by Sex in Anson
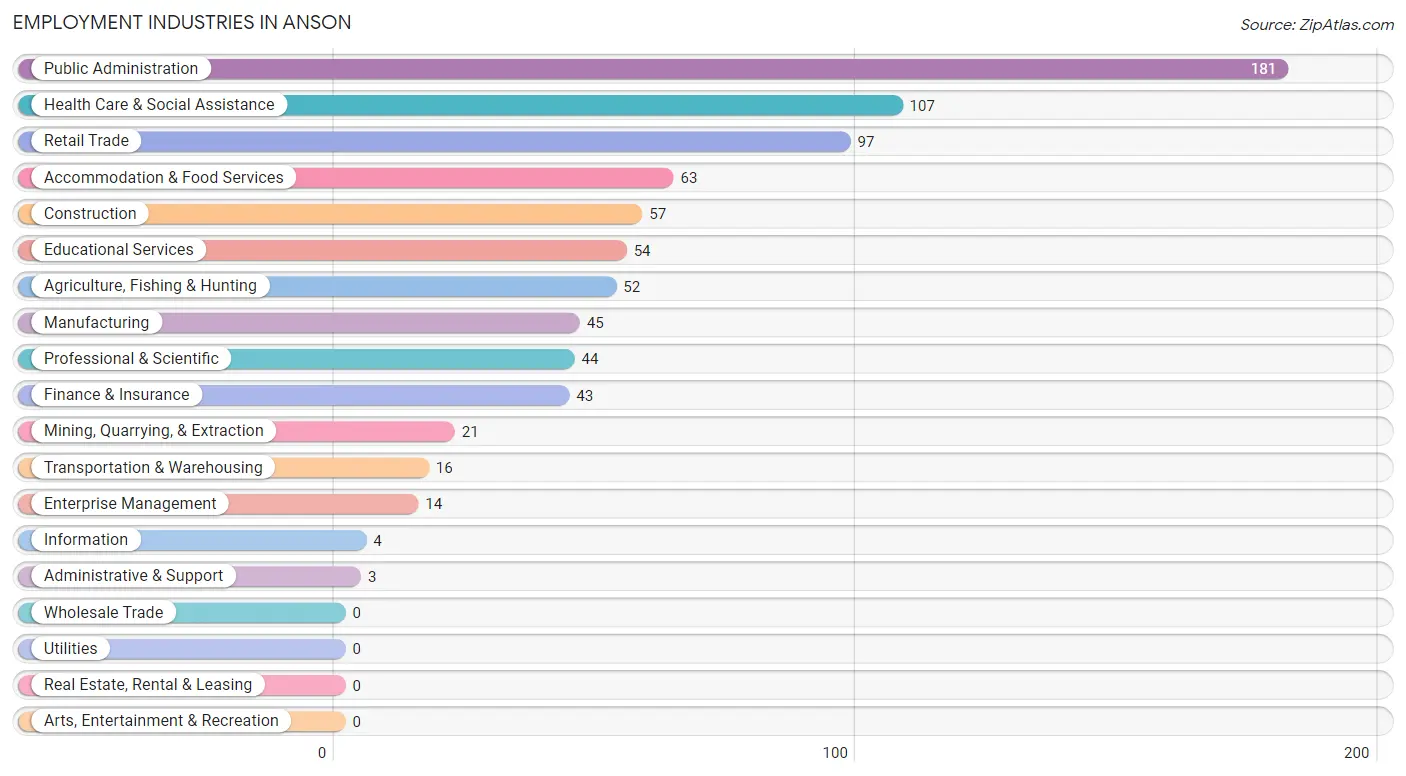
Employment Industries in Anson
The major employment industries in Anson include Public Administration (181 | 21.4%), Health Care & Social Assistance (107 | 12.7%), Retail Trade (97 | 11.5%), Accommodation & Food Services (63 | 7.4%), and Construction (57 | 6.7%).
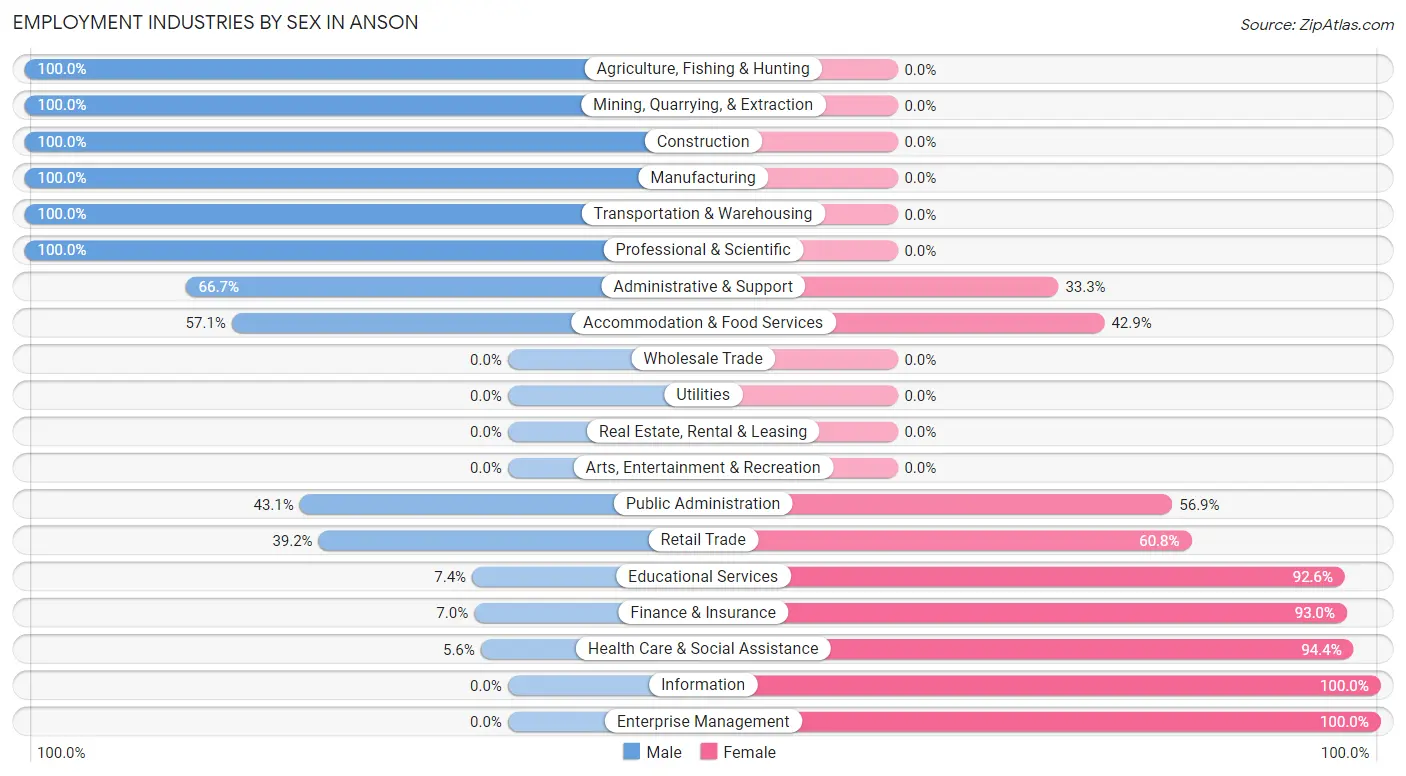
Employment Industries by Sex in Anson
The Anson industries that see more men than women are Agriculture, Fishing & Hunting (100.0%), Mining, Quarrying, & Extraction (100.0%), and Construction (100.0%), whereas the industries that tend to have a higher number of women are Information (100.0%), Enterprise Management (100.0%), and Health Care & Social Assistance (94.4%).
| Industry | Male | Female |
| Agriculture, Fishing & Hunting | 52 (100.0%) | 0 (0.0%) |
| Mining, Quarrying, & Extraction | 21 (100.0%) | 0 (0.0%) |
| Construction | 57 (100.0%) | 0 (0.0%) |
| Manufacturing | 45 (100.0%) | 0 (0.0%) |
| Wholesale Trade | 0 (0.0%) | 0 (0.0%) |
| Retail Trade | 38 (39.2%) | 59 (60.8%) |
| Transportation & Warehousing | 16 (100.0%) | 0 (0.0%) |
| Utilities | 0 (0.0%) | 0 (0.0%) |
| Information | 0 (0.0%) | 4 (100.0%) |
| Finance & Insurance | 3 (7.0%) | 40 (93.0%) |
| Real Estate, Rental & Leasing | 0 (0.0%) | 0 (0.0%) |
| Professional & Scientific | 44 (100.0%) | 0 (0.0%) |
| Enterprise Management | 0 (0.0%) | 14 (100.0%) |
| Administrative & Support | 2 (66.7%) | 1 (33.3%) |
| Educational Services | 4 (7.4%) | 50 (92.6%) |
| Health Care & Social Assistance | 6 (5.6%) | 101 (94.4%) |
| Arts, Entertainment & Recreation | 0 (0.0%) | 0 (0.0%) |
| Accommodation & Food Services | 36 (57.1%) | 27 (42.9%) |
| Public Administration | 78 (43.1%) | 103 (56.9%) |
| Total | 433 (51.2%) | 413 (48.8%) |
Education in Anson
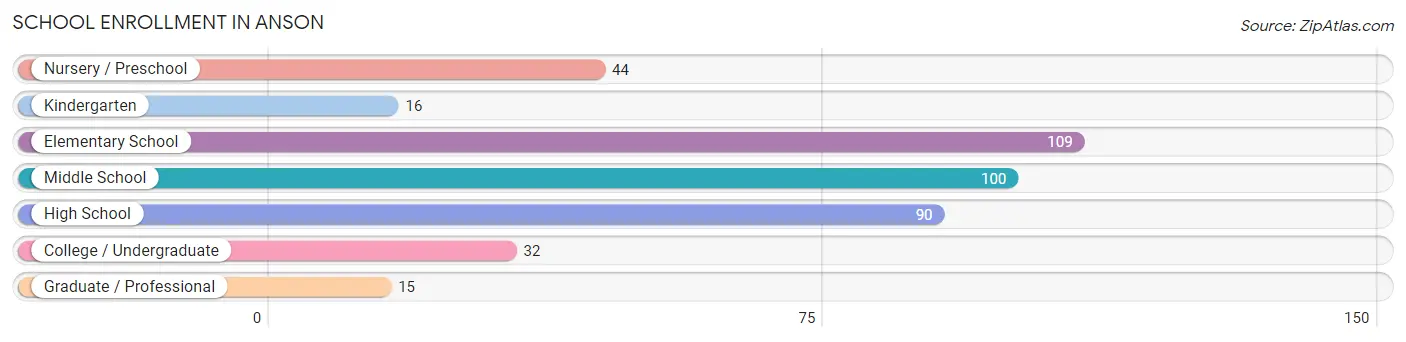
School Enrollment in Anson
The most common levels of schooling among the 406 students in Anson are elementary school (109 | 26.9%), middle school (100 | 24.6%), and high school (90 | 22.2%).
| School Level | # Students | % Students |
| Nursery / Preschool | 44 | 10.8% |
| Kindergarten | 16 | 3.9% |
| Elementary School | 109 | 26.9% |
| Middle School | 100 | 24.6% |
| High School | 90 | 22.2% |
| College / Undergraduate | 32 | 7.9% |
| Graduate / Professional | 15 | 3.7% |
| Total | 406 | 100.0% |
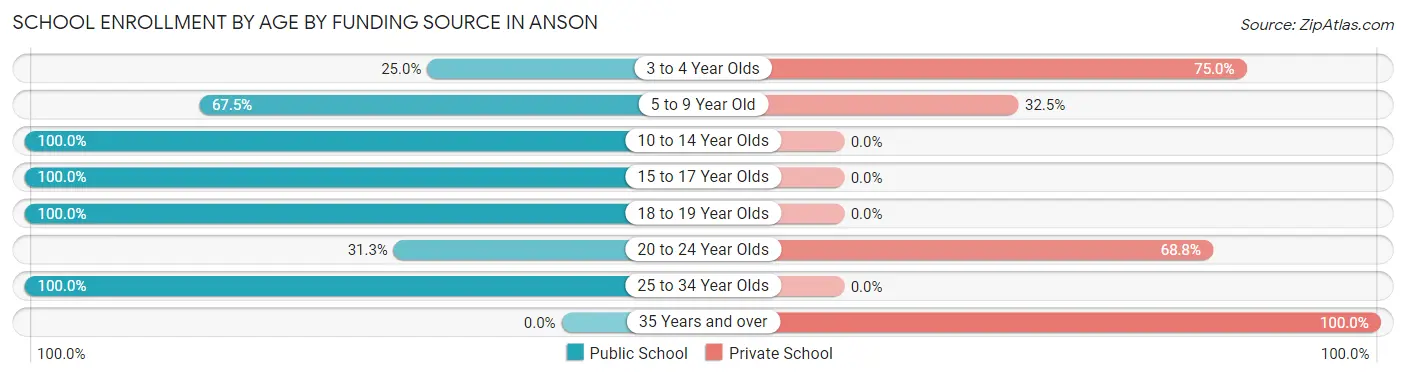
School Enrollment by Age by Funding Source in Anson
Out of a total of 406 students who are enrolled in schools in Anson, 90 (22.2%) attend a private institution, while the remaining 316 (77.8%) are enrolled in public schools. The age group of 35 years and over has the highest likelihood of being enrolled in private schools, with 26 (100.0% in the age bracket) enrolled. Conversely, the age group of 10 to 14 year olds has the lowest likelihood of being enrolled in a private school, with 120 (100.0% in the age bracket) attending a public institution.
| Age Bracket | Public School | Private School |
| 3 to 4 Year Olds | 5 (25.0%) | 15 (75.0%) |
| 5 to 9 Year Old | 79 (67.5%) | 38 (32.5%) |
| 10 to 14 Year Olds | 120 (100.0%) | 0 (0.0%) |
| 15 to 17 Year Olds | 99 (100.0%) | 0 (0.0%) |
| 18 to 19 Year Olds | 7 (100.0%) | 0 (0.0%) |
| 20 to 24 Year Olds | 5 (31.2%) | 11 (68.8%) |
| 25 to 34 Year Olds | 1 (100.0%) | 0 (0.0%) |
| 35 Years and over | 0 (0.0%) | 26 (100.0%) |
| Total | 316 (77.8%) | 90 (22.2%) |
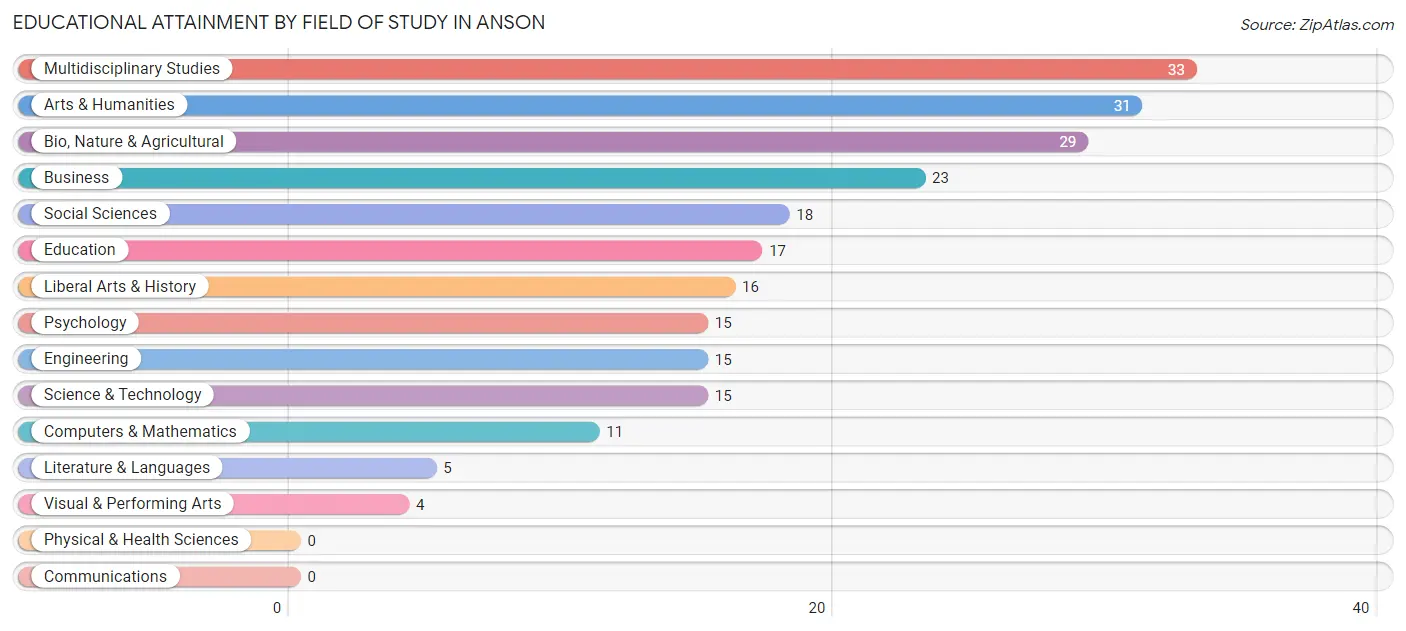
Educational Attainment by Field of Study in Anson
Multidisciplinary studies (33 | 14.2%), arts & humanities (31 | 13.4%), bio, nature & agricultural (29 | 12.5%), business (23 | 9.9%), and social sciences (18 | 7.8%) are the most common fields of study among 232 individuals in Anson who have obtained a bachelor's degree or higher.
| Field of Study | # Graduates | % Graduates |
| Computers & Mathematics | 11 | 4.7% |
| Bio, Nature & Agricultural | 29 | 12.5% |
| Physical & Health Sciences | 0 | 0.0% |
| Psychology | 15 | 6.5% |
| Social Sciences | 18 | 7.8% |
| Engineering | 15 | 6.5% |
| Multidisciplinary Studies | 33 | 14.2% |
| Science & Technology | 15 | 6.5% |
| Business | 23 | 9.9% |
| Education | 17 | 7.3% |
| Literature & Languages | 5 | 2.2% |
| Liberal Arts & History | 16 | 6.9% |
| Visual & Performing Arts | 4 | 1.7% |
| Communications | 0 | 0.0% |
| Arts & Humanities | 31 | 13.4% |
| Total | 232 | 100.0% |
Transportation & Commute in Anson
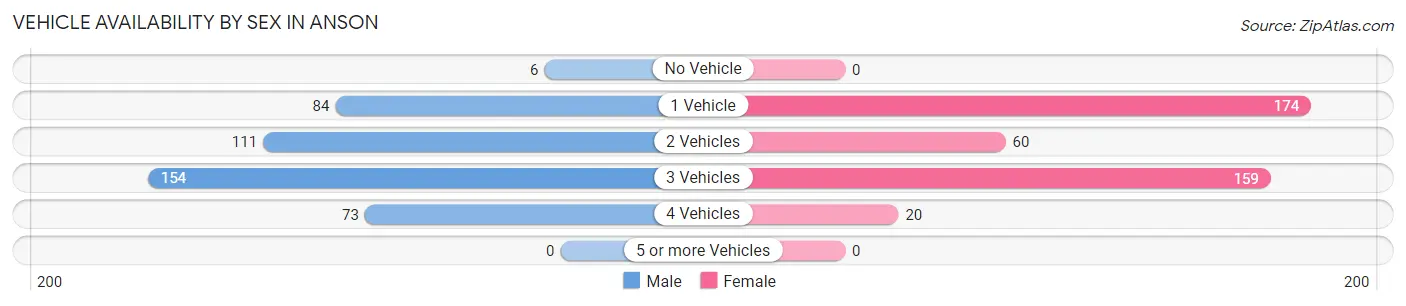
Vehicle Availability by Sex in Anson
The most prevalent vehicle ownership categories in Anson are males with 3 vehicles (154, accounting for 36.0%) and females with 3 vehicles (159, making up 37.3%).
| Vehicles Available | Male | Female |
| No Vehicle | 6 (1.4%) | 0 (0.0%) |
| 1 Vehicle | 84 (19.6%) | 174 (42.1%) |
| 2 Vehicles | 111 (25.9%) | 60 (14.5%) |
| 3 Vehicles | 154 (36.0%) | 159 (38.5%) |
| 4 Vehicles | 73 (17.1%) | 20 (4.8%) |
| 5 or more Vehicles | 0 (0.0%) | 0 (0.0%) |
| Total | 428 (100.0%) | 413 (100.0%) |
Commute Time in Anson
The most frequently occuring commute durations in Anson are 30 to 34 minutes (184 commuters, 22.3%), less than 5 minutes (123 commuters, 14.9%), and 5 to 9 minutes (107 commuters, 12.9%).
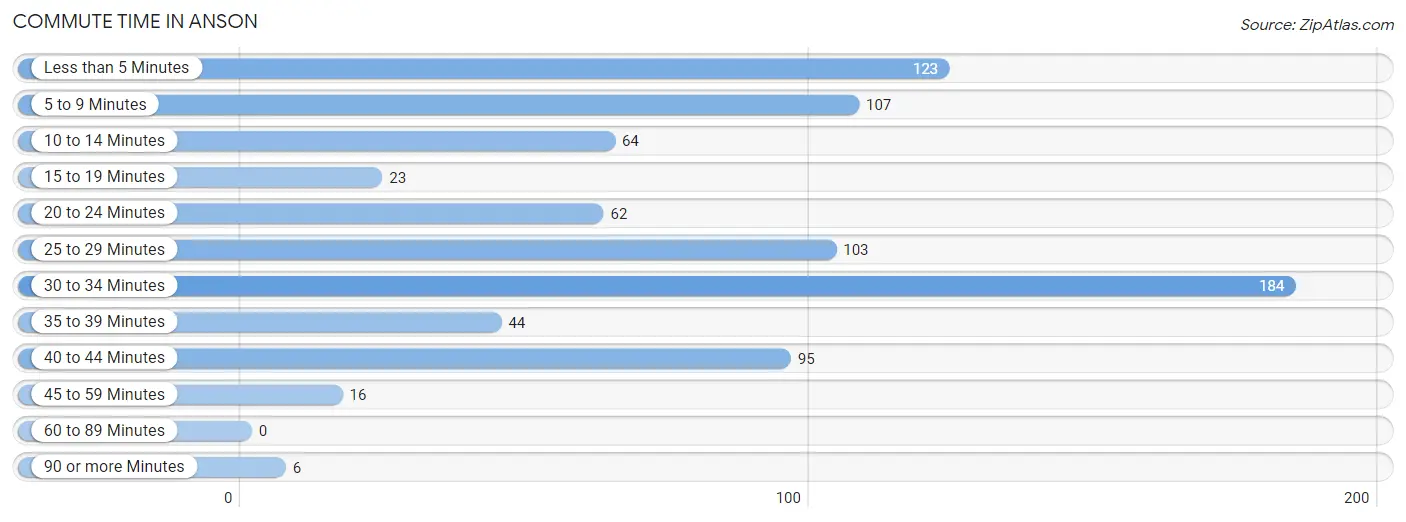
| Commute Time | # Commuters | % Commuters |
| Less than 5 Minutes | 123 | 14.9% |
| 5 to 9 Minutes | 107 | 12.9% |
| 10 to 14 Minutes | 64 | 7.7% |
| 15 to 19 Minutes | 23 | 2.8% |
| 20 to 24 Minutes | 62 | 7.5% |
| 25 to 29 Minutes | 103 | 12.4% |
| 30 to 34 Minutes | 184 | 22.3% |
| 35 to 39 Minutes | 44 | 5.3% |
| 40 to 44 Minutes | 95 | 11.5% |
| 45 to 59 Minutes | 16 | 1.9% |
| 60 to 89 Minutes | 0 | 0.0% |
| 90 or more Minutes | 6 | 0.7% |
Commute Time by Sex in Anson
The most common commute times in Anson are less than 5 minutes (64 commuters, 15.1%) for males and 30 to 34 minutes (127 commuters, 31.6%) for females.
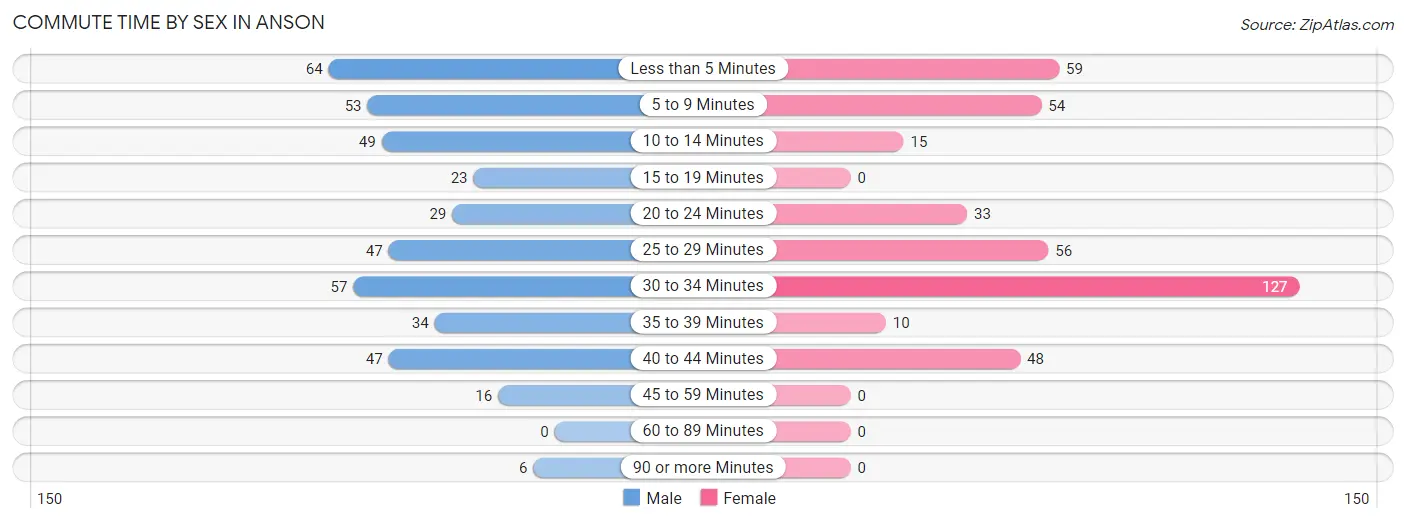
| Commute Time | Male | Female |
| Less than 5 Minutes | 64 (15.1%) | 59 (14.7%) |
| 5 to 9 Minutes | 53 (12.5%) | 54 (13.4%) |
| 10 to 14 Minutes | 49 (11.5%) | 15 (3.7%) |
| 15 to 19 Minutes | 23 (5.4%) | 0 (0.0%) |
| 20 to 24 Minutes | 29 (6.8%) | 33 (8.2%) |
| 25 to 29 Minutes | 47 (11.1%) | 56 (13.9%) |
| 30 to 34 Minutes | 57 (13.4%) | 127 (31.6%) |
| 35 to 39 Minutes | 34 (8.0%) | 10 (2.5%) |
| 40 to 44 Minutes | 47 (11.1%) | 48 (11.9%) |
| 45 to 59 Minutes | 16 (3.8%) | 0 (0.0%) |
| 60 to 89 Minutes | 0 (0.0%) | 0 (0.0%) |
| 90 or more Minutes | 6 (1.4%) | 0 (0.0%) |
Time of Departure to Work by Sex in Anson
The most frequent times of departure to work in Anson are 7:00 AM to 7:29 AM (94, 22.1%) for males and 6:30 AM to 6:59 AM (87, 21.6%) for females.
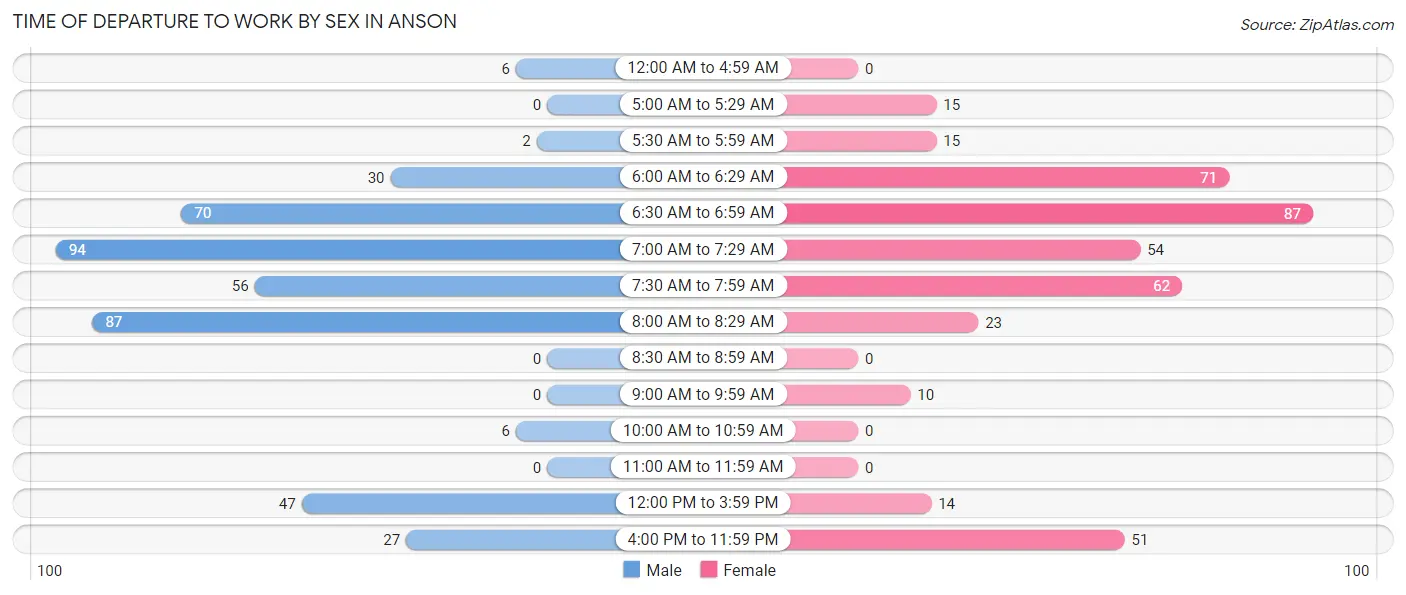
| Time of Departure | Male | Female |
| 12:00 AM to 4:59 AM | 6 (1.4%) | 0 (0.0%) |
| 5:00 AM to 5:29 AM | 0 (0.0%) | 15 (3.7%) |
| 5:30 AM to 5:59 AM | 2 (0.5%) | 15 (3.7%) |
| 6:00 AM to 6:29 AM | 30 (7.1%) | 71 (17.7%) |
| 6:30 AM to 6:59 AM | 70 (16.5%) | 87 (21.6%) |
| 7:00 AM to 7:29 AM | 94 (22.1%) | 54 (13.4%) |
| 7:30 AM to 7:59 AM | 56 (13.2%) | 62 (15.4%) |
| 8:00 AM to 8:29 AM | 87 (20.5%) | 23 (5.7%) |
| 8:30 AM to 8:59 AM | 0 (0.0%) | 0 (0.0%) |
| 9:00 AM to 9:59 AM | 0 (0.0%) | 10 (2.5%) |
| 10:00 AM to 10:59 AM | 6 (1.4%) | 0 (0.0%) |
| 11:00 AM to 11:59 AM | 0 (0.0%) | 0 (0.0%) |
| 12:00 PM to 3:59 PM | 47 (11.1%) | 14 (3.5%) |
| 4:00 PM to 11:59 PM | 27 (6.4%) | 51 (12.7%) |
| Total | 425 (100.0%) | 402 (100.0%) |
Housing Occupancy in Anson
Occupancy by Ownership in Anson
Of the total 869 dwellings in Anson, owner-occupied units account for 660 (75.9%), while renter-occupied units make up 209 (24.0%).
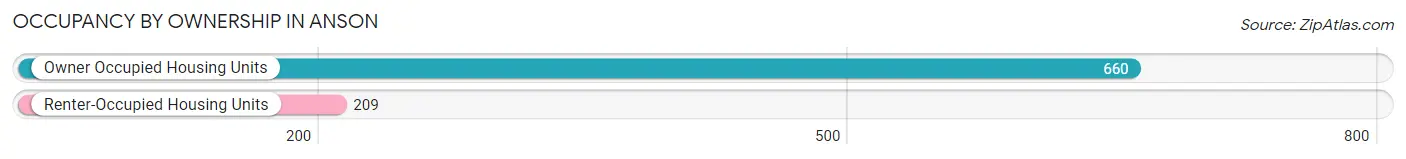
| Occupancy | # Housing Units | % Housing Units |
| Owner Occupied Housing Units | 660 | 75.9% |
| Renter-Occupied Housing Units | 209 | 24.0% |
| Total Occupied Housing Units | 869 | 100.0% |
Occupancy by Household Size in Anson
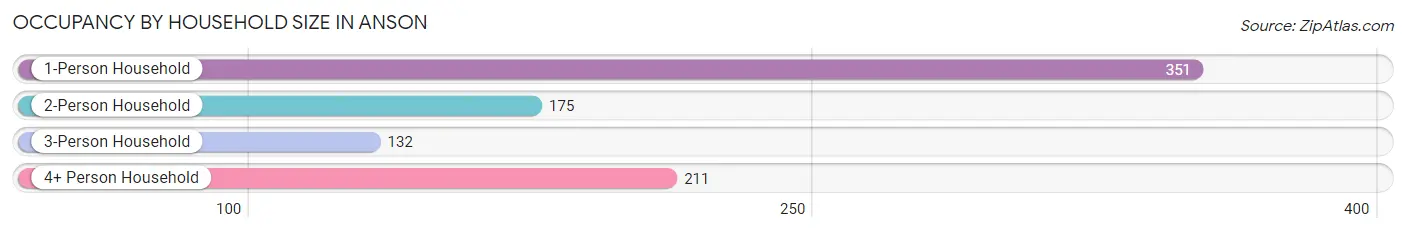
| Household Size | # Housing Units | % Housing Units |
| 1-Person Household | 351 | 40.4% |
| 2-Person Household | 175 | 20.1% |
| 3-Person Household | 132 | 15.2% |
| 4+ Person Household | 211 | 24.3% |
| Total Housing Units | 869 | 100.0% |
Occupancy by Ownership by Household Size in Anson
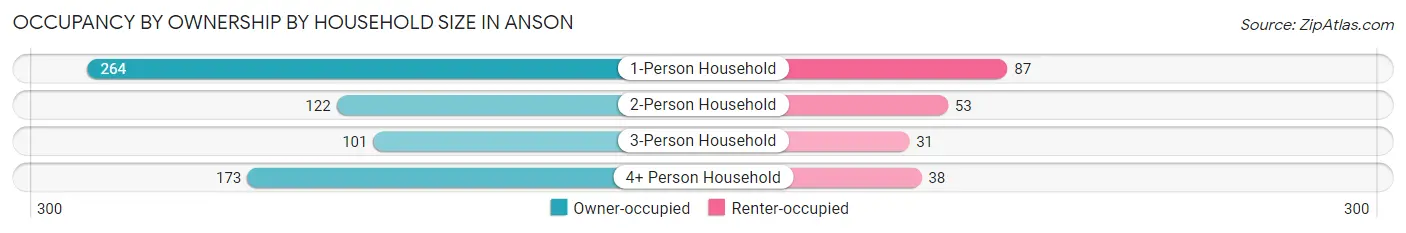
| Household Size | Owner-occupied | Renter-occupied |
| 1-Person Household | 264 (75.2%) | 87 (24.8%) |
| 2-Person Household | 122 (69.7%) | 53 (30.3%) |
| 3-Person Household | 101 (76.5%) | 31 (23.5%) |
| 4+ Person Household | 173 (82.0%) | 38 (18.0%) |
| Total Housing Units | 660 (75.9%) | 209 (24.0%) |
Occupancy by Educational Attainment in Anson
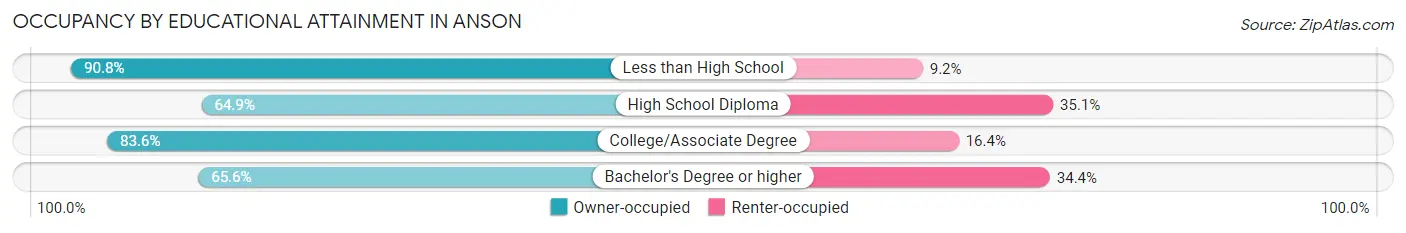
| Household Size | Owner-occupied | Renter-occupied |
| Less than High School | 108 (90.8%) | 11 (9.2%) |
| High School Diploma | 148 (64.9%) | 80 (35.1%) |
| College/Associate Degree | 286 (83.6%) | 56 (16.4%) |
| Bachelor's Degree or higher | 118 (65.6%) | 62 (34.4%) |
Occupancy by Age of Householder in Anson
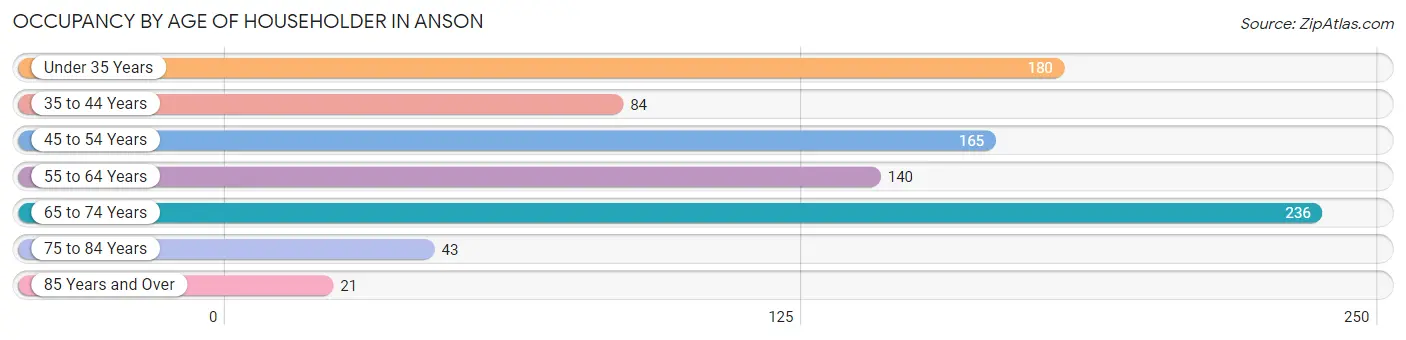
| Age Bracket | # Households | % Households |
| Under 35 Years | 180 | 20.7% |
| 35 to 44 Years | 84 | 9.7% |
| 45 to 54 Years | 165 | 19.0% |
| 55 to 64 Years | 140 | 16.1% |
| 65 to 74 Years | 236 | 27.2% |
| 75 to 84 Years | 43 | 5.0% |
| 85 Years and Over | 21 | 2.4% |
| Total | 869 | 100.0% |
Housing Finances in Anson
Median Income by Occupancy in Anson
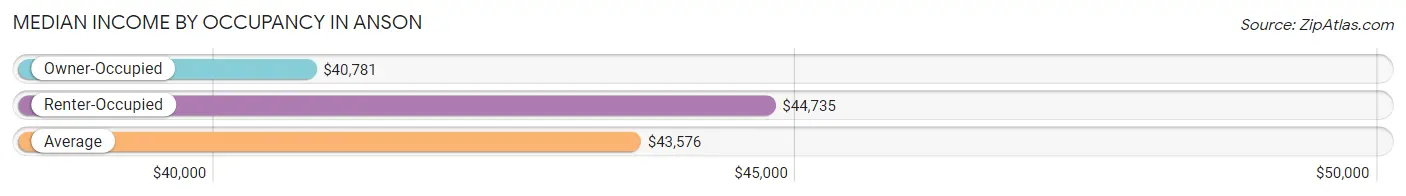
| Occupancy Type | # Households | Median Income |
| Owner-Occupied | 660 (75.9%) | $40,781 |
| Renter-Occupied | 209 (24.0%) | $44,735 |
| Average | 869 (100.0%) | $43,576 |
Occupancy by Householder Income Bracket in Anson
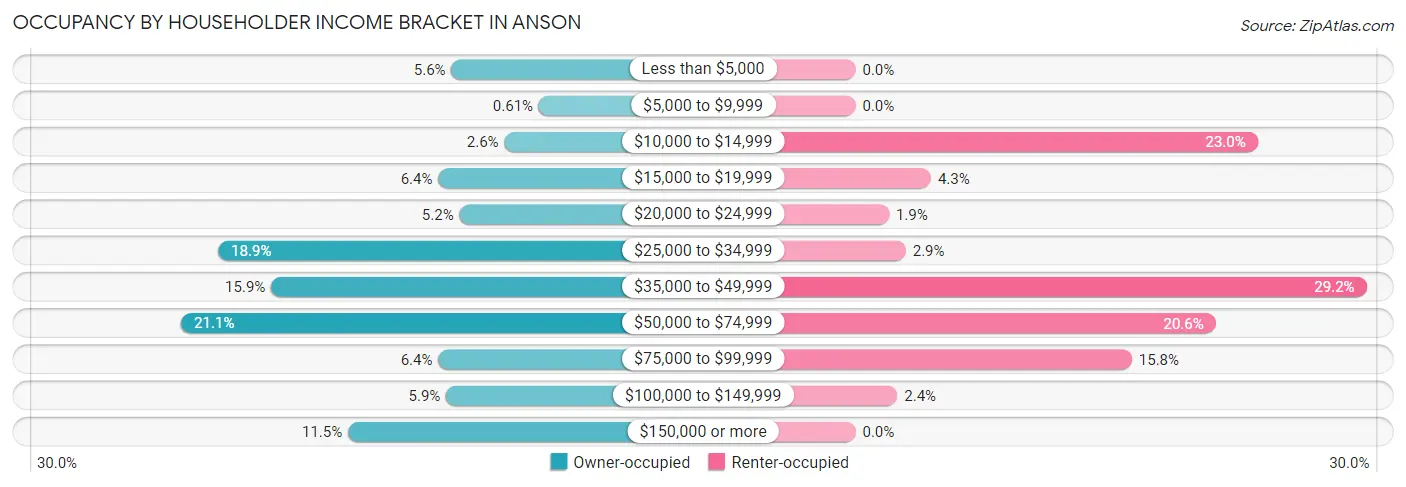
| Income Bracket | Owner-occupied | Renter-occupied |
| Less than $5,000 | 37 (5.6%) | 0 (0.0%) |
| $5,000 to $9,999 | 4 (0.6%) | 0 (0.0%) |
| $10,000 to $14,999 | 17 (2.6%) | 48 (23.0%) |
| $15,000 to $19,999 | 42 (6.4%) | 9 (4.3%) |
| $20,000 to $24,999 | 34 (5.1%) | 4 (1.9%) |
| $25,000 to $34,999 | 125 (18.9%) | 6 (2.9%) |
| $35,000 to $49,999 | 105 (15.9%) | 61 (29.2%) |
| $50,000 to $74,999 | 139 (21.1%) | 43 (20.6%) |
| $75,000 to $99,999 | 42 (6.4%) | 33 (15.8%) |
| $100,000 to $149,999 | 39 (5.9%) | 5 (2.4%) |
| $150,000 or more | 76 (11.5%) | 0 (0.0%) |
| Total | 660 (100.0%) | 209 (100.0%) |
Monthly Housing Cost Tiers in Anson
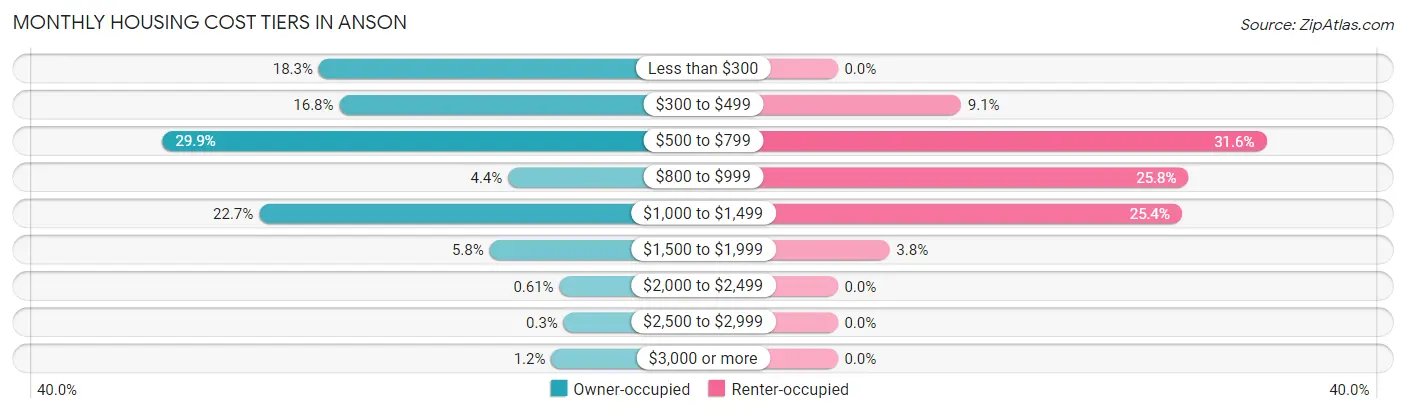
| Monthly Cost | Owner-occupied | Renter-occupied |
| Less than $300 | 121 (18.3%) | 0 (0.0%) |
| $300 to $499 | 111 (16.8%) | 19 (9.1%) |
| $500 to $799 | 197 (29.8%) | 66 (31.6%) |
| $800 to $999 | 29 (4.4%) | 54 (25.8%) |
| $1,000 to $1,499 | 150 (22.7%) | 53 (25.4%) |
| $1,500 to $1,999 | 38 (5.8%) | 8 (3.8%) |
| $2,000 to $2,499 | 4 (0.6%) | 0 (0.0%) |
| $2,500 to $2,999 | 2 (0.3%) | 0 (0.0%) |
| $3,000 or more | 8 (1.2%) | 0 (0.0%) |
| Total | 660 (100.0%) | 209 (100.0%) |
Physical Housing Characteristics in Anson
Housing Structures in Anson
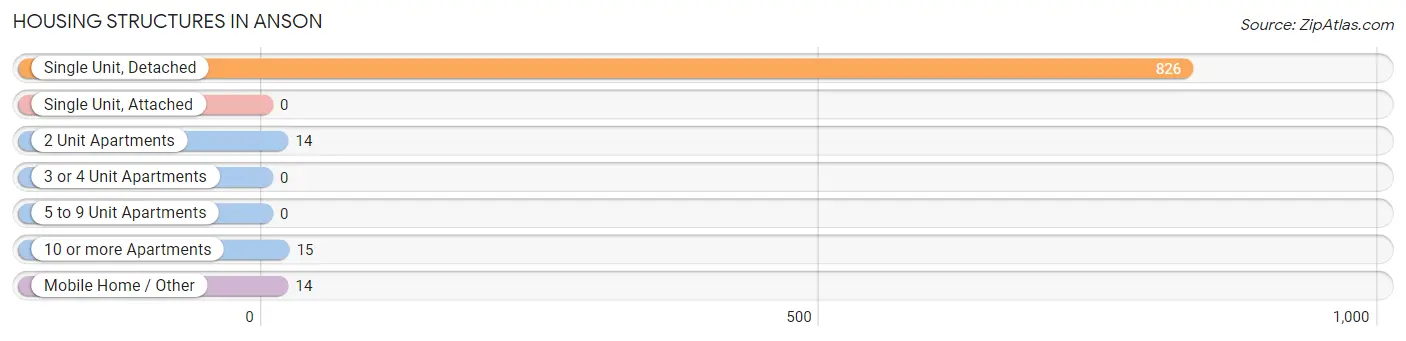
| Structure Type | # Housing Units | % Housing Units |
| Single Unit, Detached | 826 | 95.1% |
| Single Unit, Attached | 0 | 0.0% |
| 2 Unit Apartments | 14 | 1.6% |
| 3 or 4 Unit Apartments | 0 | 0.0% |
| 5 to 9 Unit Apartments | 0 | 0.0% |
| 10 or more Apartments | 15 | 1.7% |
| Mobile Home / Other | 14 | 1.6% |
| Total | 869 | 100.0% |
Housing Structures by Occupancy in Anson
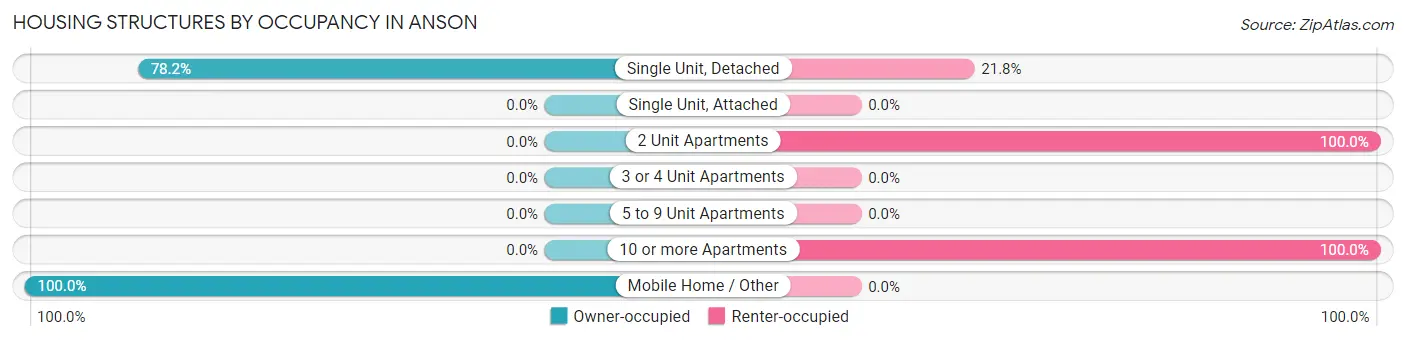
| Structure Type | Owner-occupied | Renter-occupied |
| Single Unit, Detached | 646 (78.2%) | 180 (21.8%) |
| Single Unit, Attached | 0 (0.0%) | 0 (0.0%) |
| 2 Unit Apartments | 0 (0.0%) | 14 (100.0%) |
| 3 or 4 Unit Apartments | 0 (0.0%) | 0 (0.0%) |
| 5 to 9 Unit Apartments | 0 (0.0%) | 0 (0.0%) |
| 10 or more Apartments | 0 (0.0%) | 15 (100.0%) |
| Mobile Home / Other | 14 (100.0%) | 0 (0.0%) |
| Total | 660 (75.9%) | 209 (24.0%) |
Housing Structures by Number of Rooms in Anson
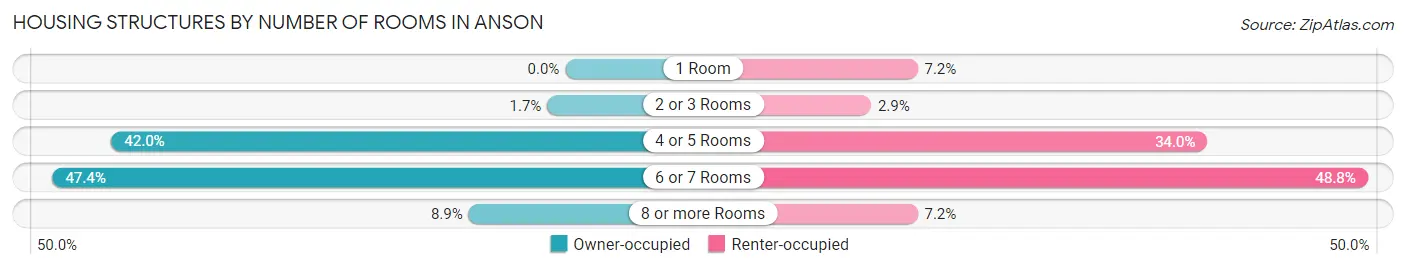
| Number of Rooms | Owner-occupied | Renter-occupied |
| 1 Room | 0 (0.0%) | 15 (7.2%) |
| 2 or 3 Rooms | 11 (1.7%) | 6 (2.9%) |
| 4 or 5 Rooms | 277 (42.0%) | 71 (34.0%) |
| 6 or 7 Rooms | 313 (47.4%) | 102 (48.8%) |
| 8 or more Rooms | 59 (8.9%) | 15 (7.2%) |
| Total | 660 (100.0%) | 209 (100.0%) |
Housing Structure by Heating Type in Anson
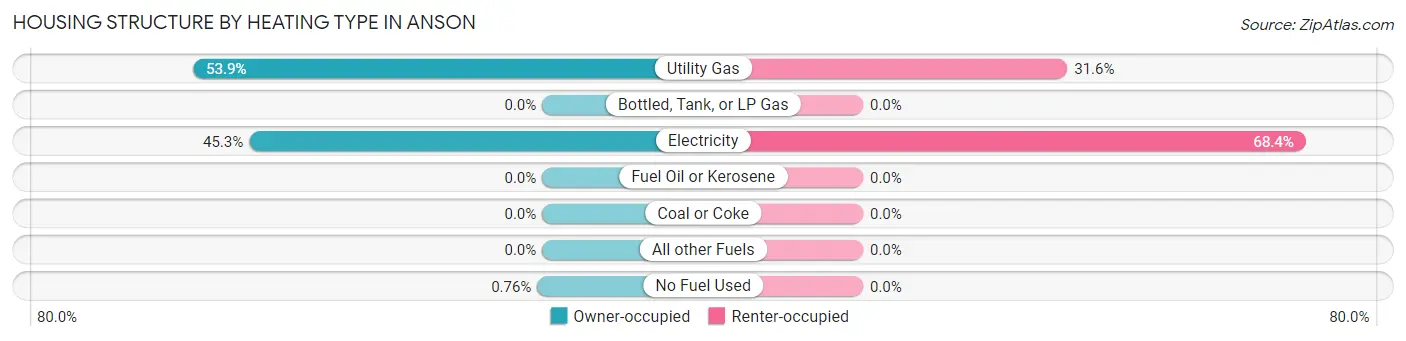
| Heating Type | Owner-occupied | Renter-occupied |
| Utility Gas | 356 (53.9%) | 66 (31.6%) |
| Bottled, Tank, or LP Gas | 0 (0.0%) | 0 (0.0%) |
| Electricity | 299 (45.3%) | 143 (68.4%) |
| Fuel Oil or Kerosene | 0 (0.0%) | 0 (0.0%) |
| Coal or Coke | 0 (0.0%) | 0 (0.0%) |
| All other Fuels | 0 (0.0%) | 0 (0.0%) |
| No Fuel Used | 5 (0.8%) | 0 (0.0%) |
| Total | 660 (100.0%) | 209 (100.0%) |
Household Vehicle Usage in Anson
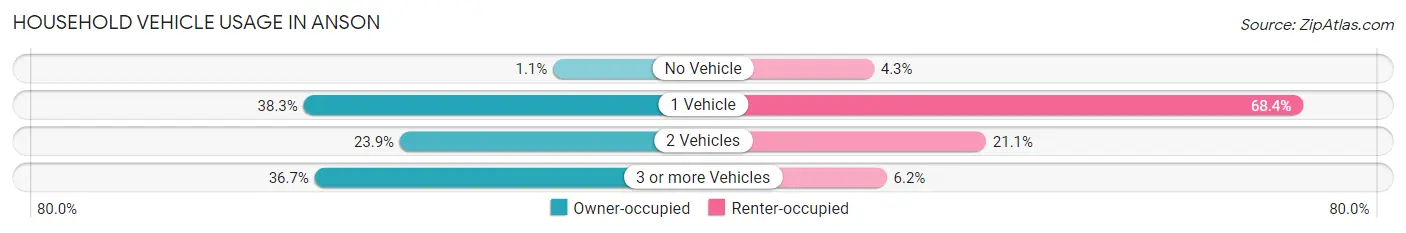
| Vehicles per Household | Owner-occupied | Renter-occupied |
| No Vehicle | 7 (1.1%) | 9 (4.3%) |
| 1 Vehicle | 253 (38.3%) | 143 (68.4%) |
| 2 Vehicles | 158 (23.9%) | 44 (21.0%) |
| 3 or more Vehicles | 242 (36.7%) | 13 (6.2%) |
| Total | 660 (100.0%) | 209 (100.0%) |
Real Estate & Mortgages in Anson
Real Estate and Mortgage Overview in Anson
| Characteristic | Without Mortgage | With Mortgage |
| Housing Units | 375 | 285 |
| Median Property Value | $49,900 | $62,000 |
| Median Household Income | $30,250 | $59 |
| Monthly Housing Costs | $387 | $8 |
| Real Estate Taxes | $1,193 | $17 |
Property Value by Mortgage Status in Anson
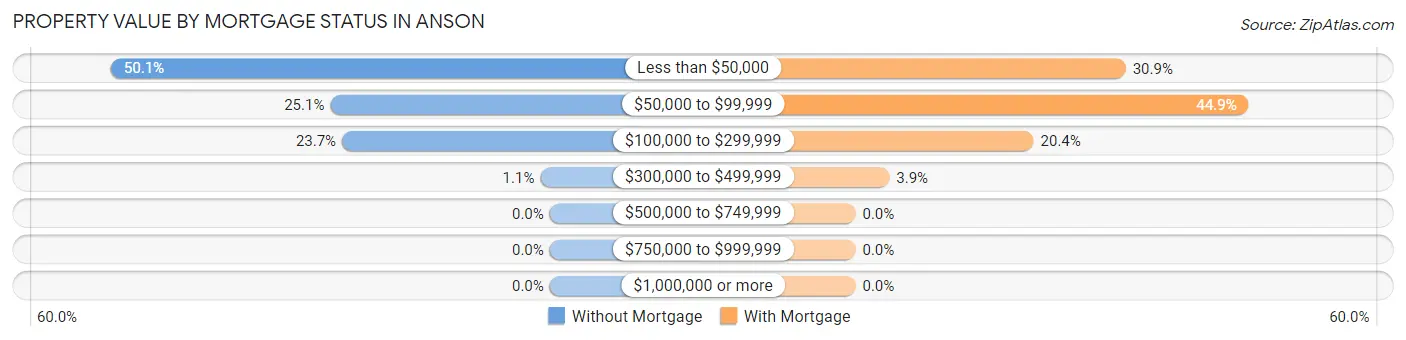
| Property Value | Without Mortgage | With Mortgage |
| Less than $50,000 | 188 (50.1%) | 88 (30.9%) |
| $50,000 to $99,999 | 94 (25.1%) | 128 (44.9%) |
| $100,000 to $299,999 | 89 (23.7%) | 58 (20.3%) |
| $300,000 to $499,999 | 4 (1.1%) | 11 (3.9%) |
| $500,000 to $749,999 | 0 (0.0%) | 0 (0.0%) |
| $750,000 to $999,999 | 0 (0.0%) | 0 (0.0%) |
| $1,000,000 or more | 0 (0.0%) | 0 (0.0%) |
| Total | 375 (100.0%) | 285 (100.0%) |
Household Income by Mortgage Status in Anson
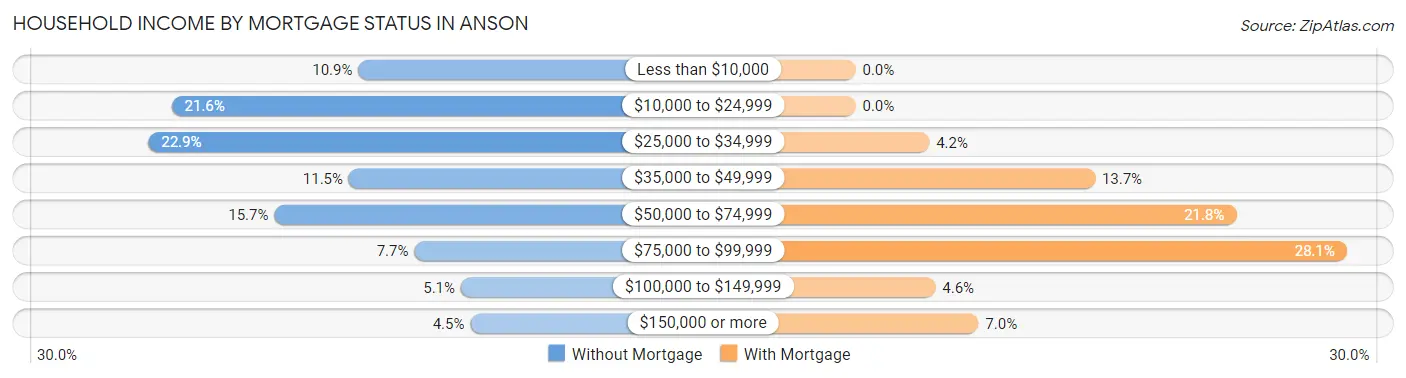
| Household Income | Without Mortgage | With Mortgage |
| Less than $10,000 | 41 (10.9%) | 0 (0.0%) |
| $10,000 to $24,999 | 81 (21.6%) | 0 (0.0%) |
| $25,000 to $34,999 | 86 (22.9%) | 12 (4.2%) |
| $35,000 to $49,999 | 43 (11.5%) | 39 (13.7%) |
| $50,000 to $74,999 | 59 (15.7%) | 62 (21.7%) |
| $75,000 to $99,999 | 29 (7.7%) | 80 (28.1%) |
| $100,000 to $149,999 | 19 (5.1%) | 13 (4.6%) |
| $150,000 or more | 17 (4.5%) | 20 (7.0%) |
| Total | 375 (100.0%) | 285 (100.0%) |
Property Value to Household Income Ratio in Anson
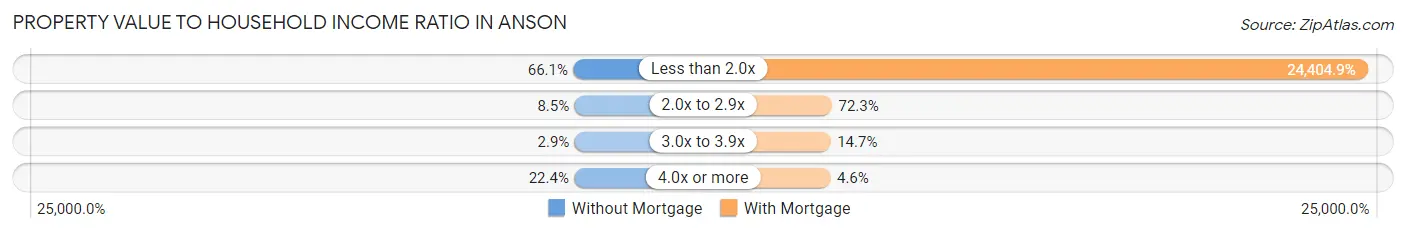
| Value-to-Income Ratio | Without Mortgage | With Mortgage |
| Less than 2.0x | 248 (66.1%) | 69,554 (24,404.9%) |
| 2.0x to 2.9x | 32 (8.5%) | 206 (72.3%) |
| 3.0x to 3.9x | 11 (2.9%) | 42 (14.7%) |
| 4.0x or more | 84 (22.4%) | 13 (4.6%) |
| Total | 375 (100.0%) | 285 (100.0%) |
Real Estate Taxes by Mortgage Status in Anson
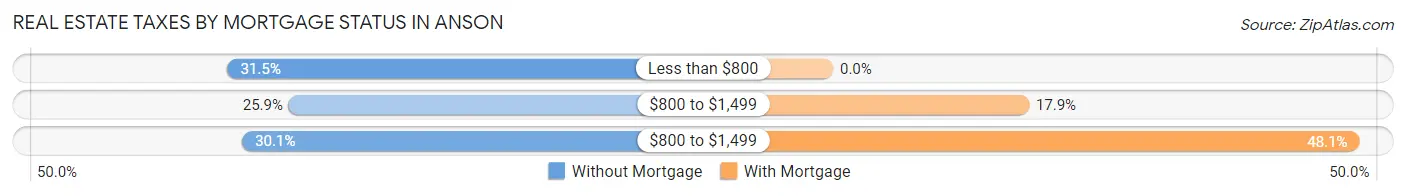
| Property Taxes | Without Mortgage | With Mortgage |
| Less than $800 | 118 (31.5%) | 0 (0.0%) |
| $800 to $1,499 | 97 (25.9%) | 51 (17.9%) |
| $800 to $1,499 | 113 (30.1%) | 137 (48.1%) |
| Total | 375 (100.0%) | 285 (100.0%) |
Health & Disability in Anson
Health Insurance Coverage by Age in Anson
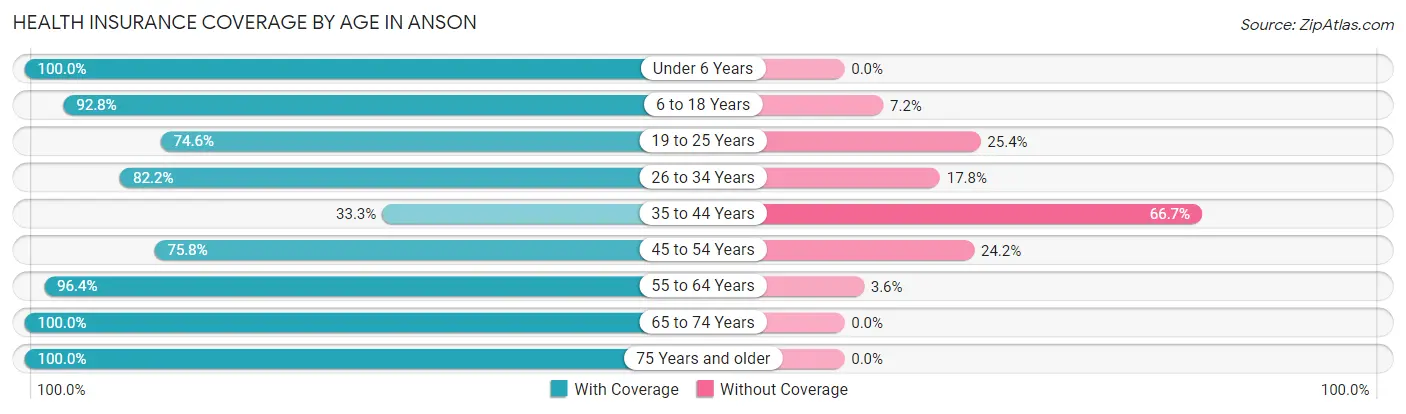
| Age Bracket | With Coverage | Without Coverage |
| Under 6 Years | 142 (100.0%) | 0 (0.0%) |
| 6 to 18 Years | 308 (92.8%) | 24 (7.2%) |
| 19 to 25 Years | 97 (74.6%) | 33 (25.4%) |
| 26 to 34 Years | 180 (82.2%) | 39 (17.8%) |
| 35 to 44 Years | 49 (33.3%) | 98 (66.7%) |
| 45 to 54 Years | 213 (75.8%) | 68 (24.2%) |
| 55 to 64 Years | 186 (96.4%) | 7 (3.6%) |
| 65 to 74 Years | 310 (100.0%) | 0 (0.0%) |
| 75 Years and older | 101 (100.0%) | 0 (0.0%) |
| Total | 1,586 (85.5%) | 269 (14.5%) |
Health Insurance Coverage by Citizenship Status in Anson
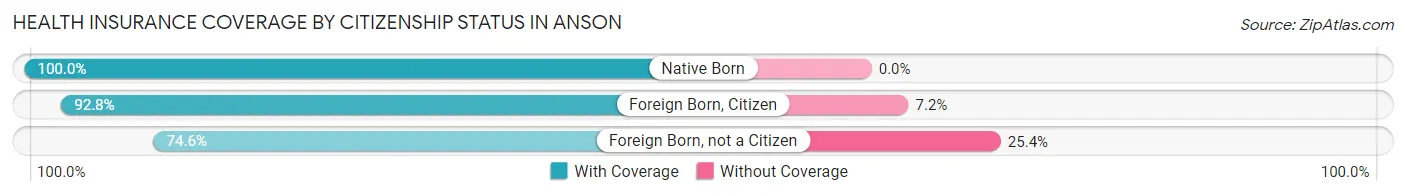
| Citizenship Status | With Coverage | Without Coverage |
| Native Born | 142 (100.0%) | 0 (0.0%) |
| Foreign Born, Citizen | 308 (92.8%) | 24 (7.2%) |
| Foreign Born, not a Citizen | 97 (74.6%) | 33 (25.4%) |
Health Insurance Coverage by Household Income in Anson
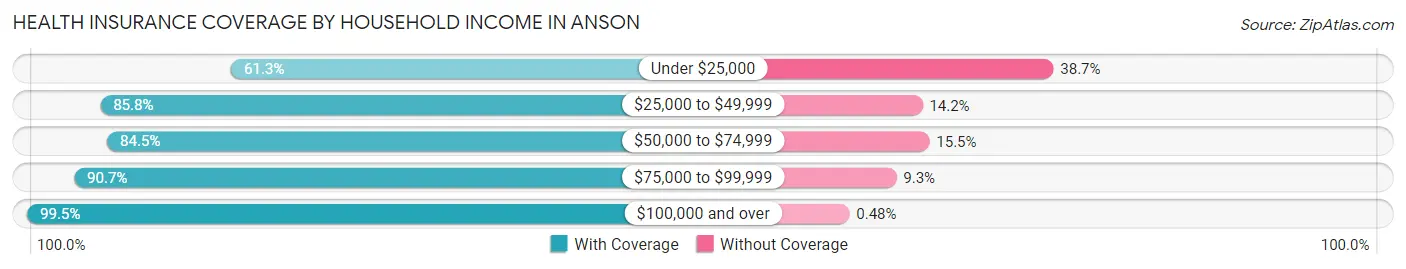
| Household Income | With Coverage | Without Coverage |
| Under $25,000 | 179 (61.3%) | 113 (38.7%) |
| $25,000 to $49,999 | 424 (85.8%) | 70 (14.2%) |
| $50,000 to $74,999 | 317 (84.5%) | 58 (15.5%) |
| $75,000 to $99,999 | 254 (90.7%) | 26 (9.3%) |
| $100,000 and over | 412 (99.5%) | 2 (0.5%) |
Public vs Private Health Insurance Coverage by Age in Anson
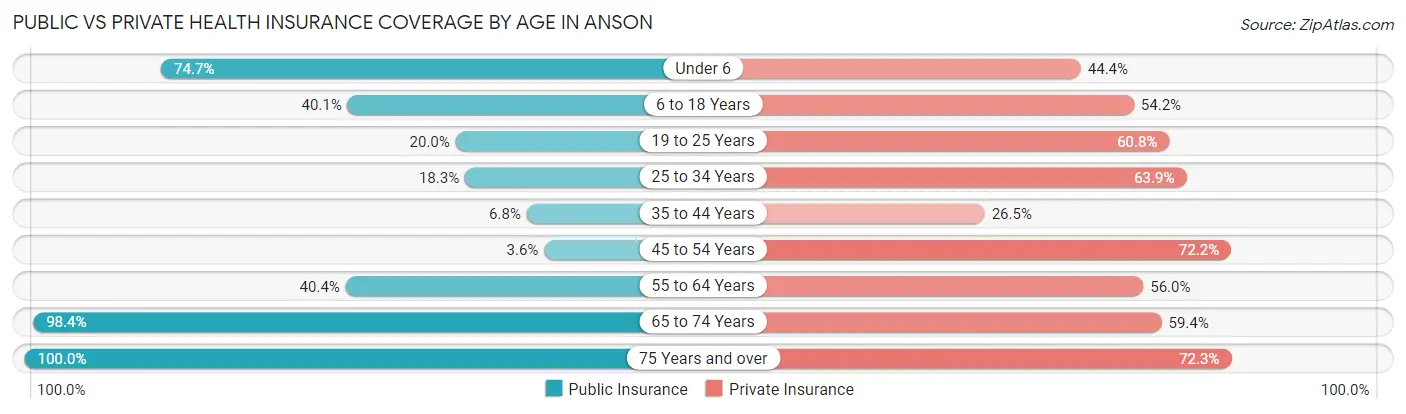
| Age Bracket | Public Insurance | Private Insurance |
| Under 6 | 106 (74.7%) | 63 (44.4%) |
| 6 to 18 Years | 133 (40.1%) | 180 (54.2%) |
| 19 to 25 Years | 26 (20.0%) | 79 (60.8%) |
| 25 to 34 Years | 40 (18.3%) | 140 (63.9%) |
| 35 to 44 Years | 10 (6.8%) | 39 (26.5%) |
| 45 to 54 Years | 10 (3.6%) | 203 (72.2%) |
| 55 to 64 Years | 78 (40.4%) | 108 (56.0%) |
| 65 to 74 Years | 305 (98.4%) | 184 (59.4%) |
| 75 Years and over | 101 (100.0%) | 73 (72.3%) |
| Total | 809 (43.6%) | 1,069 (57.6%) |
Disability Status by Sex by Age in Anson
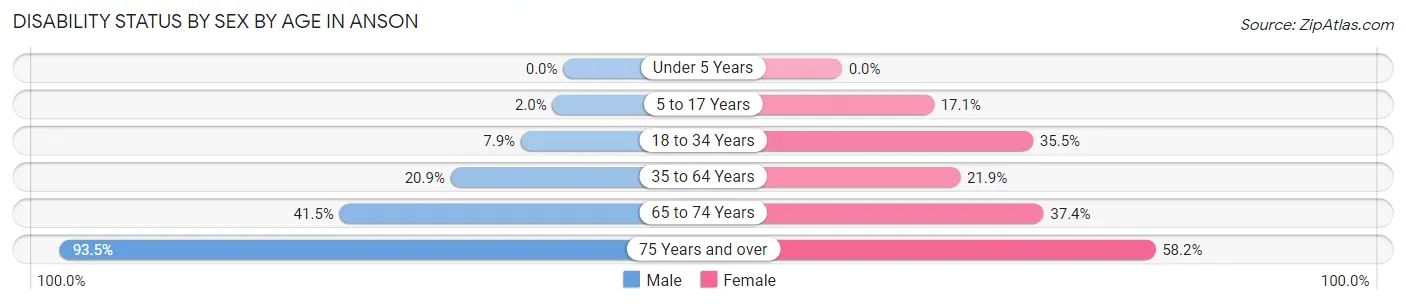
| Age Bracket | Male | Female |
| Under 5 Years | 0 (0.0%) | 0 (0.0%) |
| 5 to 17 Years | 4 (2.0%) | 29 (17.1%) |
| 18 to 34 Years | 10 (7.9%) | 83 (35.5%) |
| 35 to 64 Years | 65 (20.9%) | 68 (21.9%) |
| 65 to 74 Years | 71 (41.5%) | 52 (37.4%) |
| 75 Years and over | 43 (93.5%) | 32 (58.2%) |
Disability Class by Sex by Age in Anson
Disability Class: Hearing Difficulty
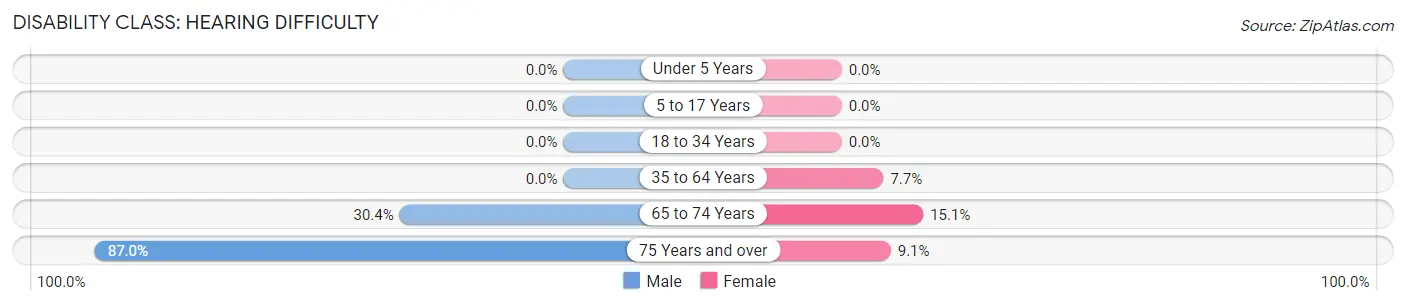
| Age Bracket | Male | Female |
| Under 5 Years | 0 (0.0%) | 0 (0.0%) |
| 5 to 17 Years | 0 (0.0%) | 0 (0.0%) |
| 18 to 34 Years | 0 (0.0%) | 0 (0.0%) |
| 35 to 64 Years | 0 (0.0%) | 24 (7.7%) |
| 65 to 74 Years | 52 (30.4%) | 21 (15.1%) |
| 75 Years and over | 40 (87.0%) | 5 (9.1%) |
Disability Class: Vision Difficulty
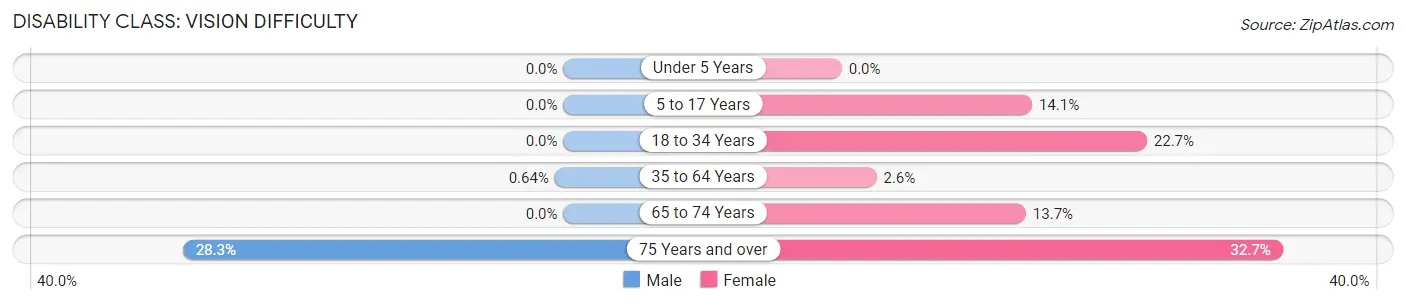
| Age Bracket | Male | Female |
| Under 5 Years | 0 (0.0%) | 0 (0.0%) |
| 5 to 17 Years | 0 (0.0%) | 24 (14.1%) |
| 18 to 34 Years | 0 (0.0%) | 53 (22.7%) |
| 35 to 64 Years | 2 (0.6%) | 8 (2.6%) |
| 65 to 74 Years | 0 (0.0%) | 19 (13.7%) |
| 75 Years and over | 13 (28.3%) | 18 (32.7%) |
Disability Class: Cognitive Difficulty
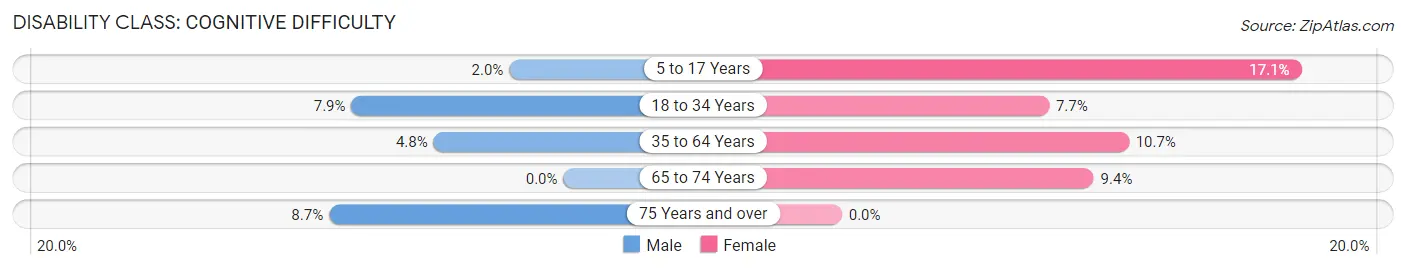
| Age Bracket | Male | Female |
| 5 to 17 Years | 4 (2.0%) | 29 (17.1%) |
| 18 to 34 Years | 10 (7.9%) | 18 (7.7%) |
| 35 to 64 Years | 15 (4.8%) | 33 (10.6%) |
| 65 to 74 Years | 0 (0.0%) | 13 (9.3%) |
| 75 Years and over | 4 (8.7%) | 0 (0.0%) |
Disability Class: Ambulatory Difficulty
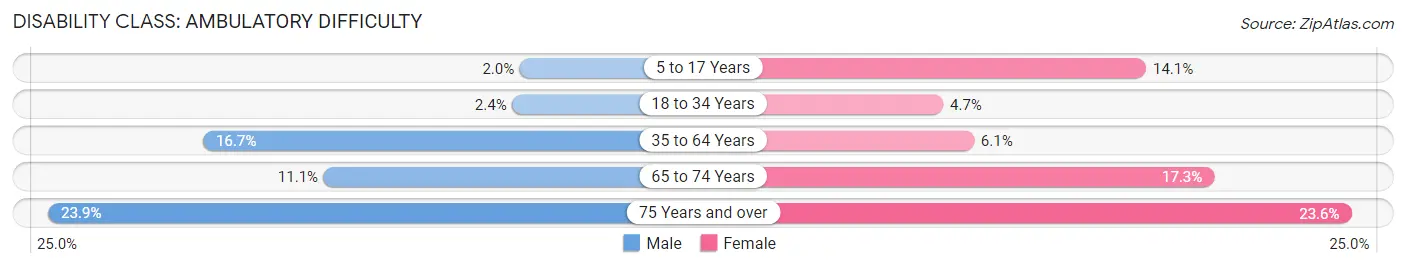
| Age Bracket | Male | Female |
| 5 to 17 Years | 4 (2.0%) | 24 (14.1%) |
| 18 to 34 Years | 3 (2.4%) | 11 (4.7%) |
| 35 to 64 Years | 52 (16.7%) | 19 (6.1%) |
| 65 to 74 Years | 19 (11.1%) | 24 (17.3%) |
| 75 Years and over | 11 (23.9%) | 13 (23.6%) |
Disability Class: Self-Care Difficulty
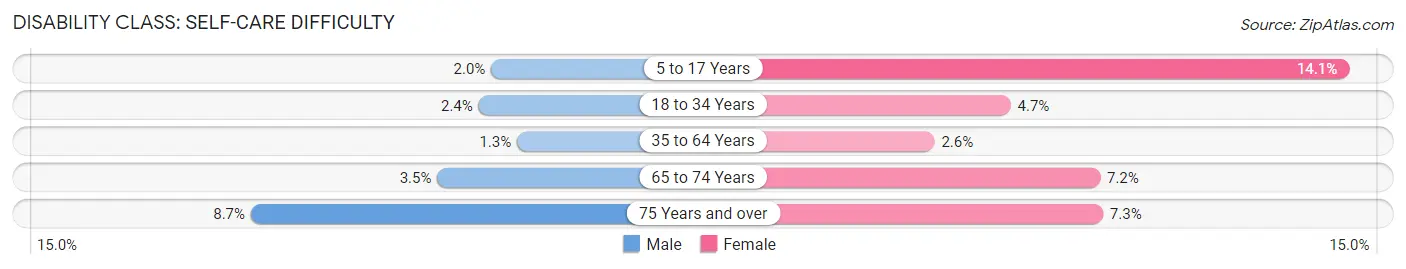
| Age Bracket | Male | Female |
| 5 to 17 Years | 4 (2.0%) | 24 (14.1%) |
| 18 to 34 Years | 3 (2.4%) | 11 (4.7%) |
| 35 to 64 Years | 4 (1.3%) | 8 (2.6%) |
| 65 to 74 Years | 6 (3.5%) | 10 (7.2%) |
| 75 Years and over | 4 (8.7%) | 4 (7.3%) |
Technology Access in Anson
Computing Device Access in Anson
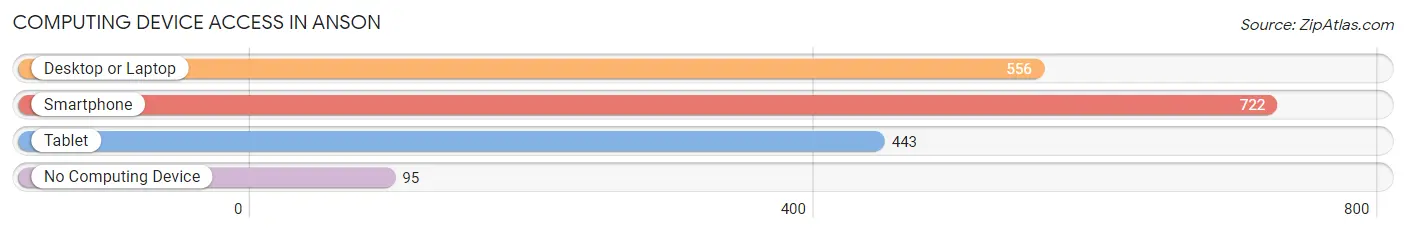
| Device Type | # Households | % Households |
| Desktop or Laptop | 556 | 64.0% |
| Smartphone | 722 | 83.1% |
| Tablet | 443 | 51.0% |
| No Computing Device | 95 | 10.9% |
| Total | 869 | 100.0% |
Internet Access in Anson
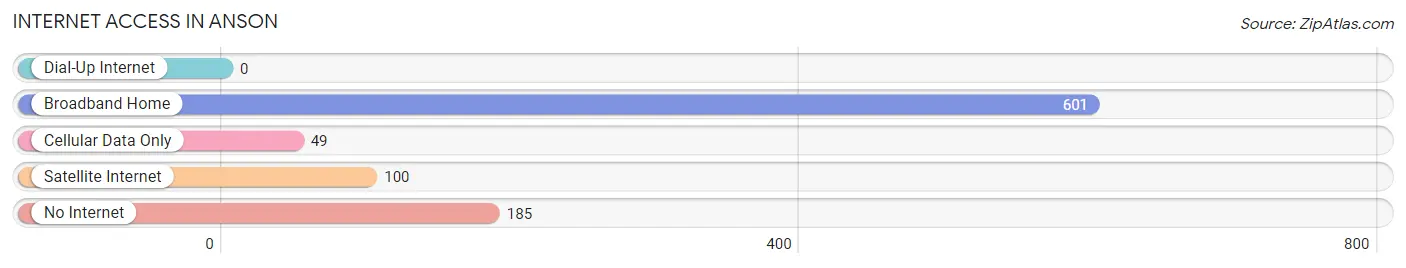
| Internet Type | # Households | % Households |
| Dial-Up Internet | 0 | 0.0% |
| Broadband Home | 601 | 69.2% |
| Cellular Data Only | 49 | 5.6% |
| Satellite Internet | 100 | 11.5% |
| No Internet | 185 | 21.3% |
| Total | 869 | 100.0% |
Anson Summary
Anson, Texas is a small town located in Jones County, Texas, United States. It is situated approximately 90 miles west of Fort Worth and is the county seat of Jones County. The population of Anson was 2,845 at the 2010 census.
History
Anson was founded in 1882 by the Texas and Pacific Railway. The town was named after Anson Jones, the last president of the Republic of Texas. The town was incorporated in 1883 and quickly became a center of commerce for the surrounding area. The town was home to a variety of businesses, including a cotton gin, a bank, a hotel, and a newspaper.
In the early 1900s, Anson was a thriving agricultural center. Cotton was the primary crop grown in the area, and the town was home to several cotton gins. The town also had a variety of other businesses, including a bank, a hotel, and a newspaper.
In the 1920s, Anson experienced a period of growth and prosperity. The town was home to several businesses, including a movie theater, a drug store, and a variety of other stores. The town also had a variety of churches, including Baptist, Methodist, and Presbyterian.
In the 1930s, the Great Depression hit Anson hard. Many businesses closed and the population declined. The town was able to survive, however, and by the 1940s, the population had begun to increase again.
Geography
Anson is located in Jones County, Texas, approximately 90 miles west of Fort Worth. The town is situated at the intersection of U.S. Highway 83 and State Highway 6. The town is located in a flat, open area of the Texas plains. The terrain is mostly flat, with some rolling hills in the area. The climate is semi-arid, with hot summers and mild winters.
Economy
The economy of Anson is largely based on agriculture. Cotton is the primary crop grown in the area, and the town is home to several cotton gins. The town also has a variety of other businesses, including a bank, a hotel, and a newspaper.
Demographics
As of the 2010 census, the population of Anson was 2,845. The racial makeup of the town was 79.3% White, 16.2% Hispanic or Latino, 1.2% African American, 0.7% Native American, 0.2% Asian, and 2.6% from other races. The median household income was $30,938, and the median family income was $37,813. The per capita income was $15,945.
Conclusion
Anson, Texas is a small town located in Jones County, Texas, United States. It is situated approximately 90 miles west of Fort Worth and is the county seat of Jones County. The population of Anson was 2,845 at the 2010 census. The town was founded in 1882 by the Texas and Pacific Railway and was named after Anson Jones, the last president of the Republic of Texas. The economy of Anson is largely based on agriculture, with cotton being the primary crop grown in the area. The town also has a variety of other businesses, including a bank, a hotel, and a newspaper. The racial makeup of the town was 79.3% White, 16.2% Hispanic or Latino, 1.2% African American, 0.7% Native American, 0.2% Asian, and 2.6% from other races. The median household income was $30,938, and the median family income was $37,813. The per capita income was $15,945. Anson is a small town with a rich history and a bright future.
Common Questions
What is Per Capita Income in Anson?
Per Capita income in Anson is $24,144.
What is the Median Family Income in Anson?
Median Family Income in Anson is $65,263.
What is the Median Household income in Anson?
Median Household Income in Anson is $43,576.
What is Income or Wage Gap in Anson?
Income or Wage Gap in Anson is 33.9%.
Women in Anson earn 66.1 cents for every dollar earned by a man.
What is Inequality or Gini Index in Anson?
Inequality or Gini Index in Anson is 0.44.
What is the Total Population of Anson?
Total Population of Anson is 2,000.
What is the Total Male Population of Anson?
Total Male Population of Anson is 969.
What is the Total Female Population of Anson?
Total Female Population of Anson is 1,031.
What is the Ratio of Males per 100 Females in Anson?
There are 93.99 Males per 100 Females in Anson.
What is the Ratio of Females per 100 Males in Anson?
There are 106.40 Females per 100 Males in Anson.
What is the Median Population Age in Anson?
Median Population Age in Anson is 41.0 Years.
What is the Average Family Size in Anson
Average Family Size in Anson is 2.9 People.
What is the Average Household Size in Anson
Average Household Size in Anson is 2.1 People.
How Large is the Labor Force in Anson?
There are 868 People in the Labor Forcein in Anson.
What is the Percentage of People in the Labor Force in Anson?
54.0% of People are in the Labor Force in Anson.
What is the Unemployment Rate in Anson?
Unemployment Rate in Anson is 2.5%.